DOCUMENT RESUME ED 402 204 SE 059 566 AUTHOR Wilson, Karla G. TITLE Ozone: Does It Affect Me? INSTITUTION University City School District, St. Louis, MO.; Washington Univ., St. Louis, Mo. SPONS AGENCY National Inst. of Environmental Health Sciences (NIH), Washington, DC. PUB DATE 96 CONTRACT NIEHS-R25-ES0-6940 NOTE 180p. PUB TYPE Guides Classroom Use Teaching Guides (For Teacher) (052) EDRS PRICE MF01/PC08 Plus Postage. DESCRIPTORS Air Pollution; Chemical Reactions; Chemistry; *Conservation (Environment); Cooperative Learning; Environmental Education; Evaluation; Science Activities; *Science Experiments; Science Process Skills; Scientific Concepts; *Scientific Methodology; Secondary Education; Units of Study IDENTIFIERS Environmental Awareness; Learning Cycle Teaching Method; *Ozone; *Ozone Depletion ABSTRACT This curriculum unit on the ozone is intended for high school students and contains sections on environmental science and chemistry. It has been structured according to a learning cycle model and contains numerous activities, some of which are in a cooperative learning format. Skills emphasized include laboratory procedures, experimental design, data analysis, accessing information, critical thinking, systems modeling, and communicating results. The environmental science unit contains the following topics: location of ozone in the atmosphere; sources of ozone; effects of ozone pollution; and helping to reduce ozone pollution. The chemistry unit includes the following topics: chemical reactions that lead to ozone pollution and smog; identifying solutes and solvents in a homogeneous mixture; measurements of concentrations of very dilute solutions; absorption of ultraviolet light by stratospheric ozone; chemical reactions that lead to ozone depletion; and ways that reaction rates are influenced. The units also contain multiple choice tests, attitude surveys, and essay questions. (JRH) *********************************************************************** Reproductions supplied by EDRS are the best that can be made from the original document. ***********************************************************************

Welcome message from author
This document is posted to help you gain knowledge. Please leave a comment to let me know what you think about it! Share it to your friends and learn new things together.
Transcript
DOCUMENT RESUME
ED 402 204 SE 059 566
AUTHOR Wilson, Karla G.TITLE Ozone: Does It Affect Me?INSTITUTION University City School District, St. Louis, MO.;
Washington Univ., St. Louis, Mo.SPONS AGENCY National Inst. of Environmental Health Sciences
(NIH), Washington, DC.PUB DATE 96CONTRACT NIEHS-R25-ES0-6940NOTE 180p.
PUB TYPE Guides Classroom Use Teaching Guides (ForTeacher) (052)
EDRS PRICE MF01/PC08 Plus Postage.DESCRIPTORS Air Pollution; Chemical Reactions; Chemistry;
*Conservation (Environment); Cooperative Learning;Environmental Education; Evaluation; ScienceActivities; *Science Experiments; Science ProcessSkills; Scientific Concepts; *Scientific Methodology;Secondary Education; Units of Study
IDENTIFIERS Environmental Awareness; Learning Cycle TeachingMethod; *Ozone; *Ozone Depletion
ABSTRACTThis curriculum unit on the ozone is intended for
high school students and contains sections on environmental scienceand chemistry. It has been structured according to a learning cyclemodel and contains numerous activities, some of which are in acooperative learning format. Skills emphasized include laboratoryprocedures, experimental design, data analysis, accessinginformation, critical thinking, systems modeling, and communicatingresults. The environmental science unit contains the followingtopics: location of ozone in the atmosphere; sources of ozone;effects of ozone pollution; and helping to reduce ozone pollution.The chemistry unit includes the following topics: chemical reactionsthat lead to ozone pollution and smog; identifying solutes andsolvents in a homogeneous mixture; measurements of concentrations ofvery dilute solutions; absorption of ultraviolet light bystratospheric ozone; chemical reactions that lead to ozone depletion;and ways that reaction rates are influenced. The units also containmultiple choice tests, attitude surveys, and essay questions.(JRH)
***********************************************************************
Reproductions supplied by EDRS are the best that can be madefrom the original document.
***********************************************************************
MENTAL SCIEN-C
'r-
PERMISSION TO REPRODUCE ANDDISSEMINATE THIS MATERIAL
HAS BEEN GRANT D BY
VV
TO THE EDUCATIONAL RESOURCESINFORMATION CENTER (ERIC)
U.S. DEPARTMENT OF EDUCATIONOffice ot Educational Research and Improvement
IuctiUCATIONAL RESOURCES INFORMATIONCENTER (ERIC)
This document has been reproduced aswed from the person or organizationoriginating it.
0 Minor changes have been made to improvereproduction Quality.
Points of view or opinions stated in this docu-ment do not necessarily represent officialOERI position or policy.
Ozone: Does It Affect Me? was created through the collaborative efforts of Washington University and University City HighSchool. It is supported, in part, by funds from the National Institute of Environmental Health Sciences (NIEHS), grant # R25 ESO
ga. 6940."NV The activities described in this curriculum unit are intended for high school students under direct supervision of adults. The spon-NWsoring agencies cannot be responsible for any accidents or injuries that may result from the conduct of the activities without proper
supervision, from not specifically following directions, or from ignoring cautions contained in the text.Copyright 0 1996, Karla Goodman Wilson, St. Louis, MO. No part of this publication may be reproduced without expressedwritten permission. Contact Karla Goodman Wilson, Washington University, #1 Brookings Dr. Campus Box 1229, St. Louis, MO63130 [email protected]
2BEST COPY AVAILABLE
Contributors
Written and Edited by:
Karla Goodman WilsonCurriculum SpecialistWashington University
High School Field Testing:
Julie ErtmannBiology TeacherUnversity City High School
Beverly FrazierEnvironmental Science TeacherUnversity City High School
Mary JohnsonEnvironmental Science TeacherUnversity City High School
Daniel LaneChemistry TeacherUnversity City High School
Kristin SobotkaChemistry TeacherUnversity City High School
Lucy WynnScience Department ChairmanUnversity City High School
3
Layout and Design:
Toni Beth ReissSystems AnalystWashington University
Principal investigator:
Sarah C. R. Elgin, Ph.D.Professor of BiologyWashington University
Technical Advisors:
Cynthia J. Moore, Ph.D.Science Outreach CoordinatorWashington University
Jay Turner, Ph.D.Assistant Professor of EngineeringWashington University
John-Stephen Taylor, Ph.D.Associate Professor of ChemistryWashington University
Table of Contents
ENVIRONMENTAL SCIENCERubric 7Pre and Post Tests 11Investigating Ozone 17Air Pollution 23Atmospheric Layers 25The Atmosphere 35Ozone Survey 37How Do You Contribute to Ozone Pollution? 49Sources of Ozone-Related Pollution 59Concept Mapping 61Effects On Materials 65Fraying Fabrics 71In the News 77Slide Show 81
CHEMISTRYRubric 93Pre and Post Tests 97Smog In A Flask 105Graphing Ozone Levels 109Ozone And Smog 119Photochemical Smog 121Solutions 129Out Of Sight, Out Of Mind 135Article Analysis 141St. Louis Ozone Task Force 143Snowmass Showdown 157Analysis Of Ozone Depletion Data 183Kinetics Grid Questions 195
4
OzoneDoes It Affect Me?
ENVIRONMENTAL SCIENCE UNIT
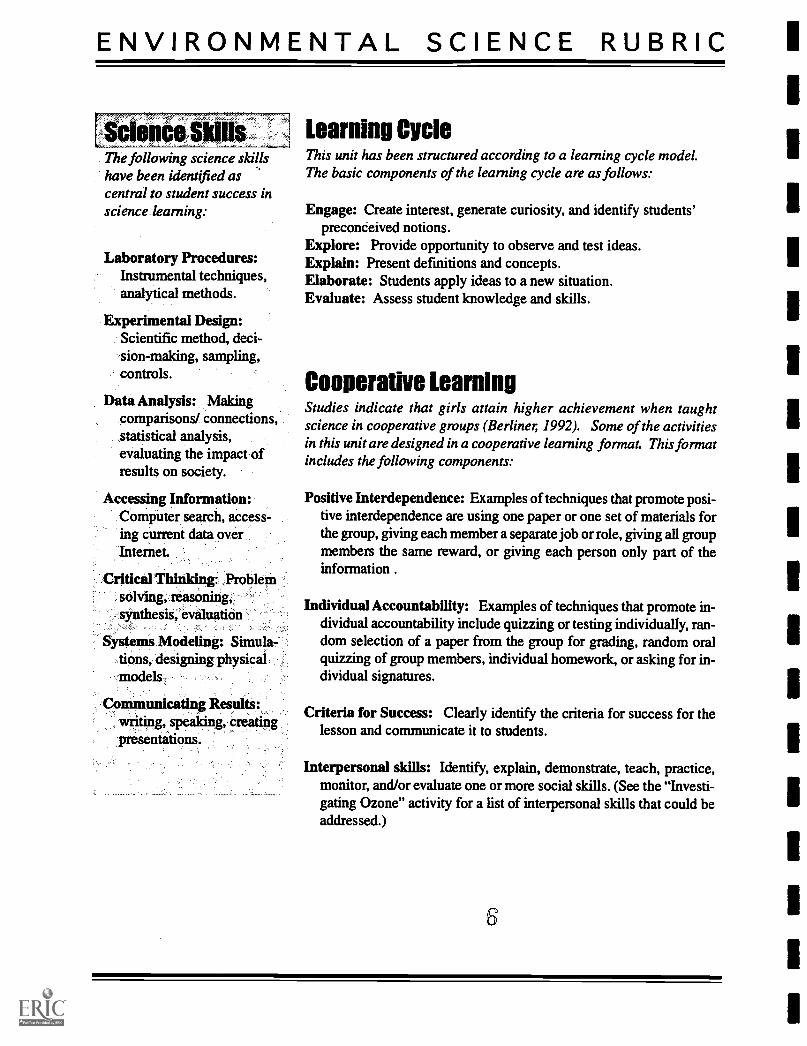
ENVIRONMENTAL SCIENCE RUBRIC
.: F-77777.7'76-,, .e_nce.., .,.:$11111.sil:
The following science skillshave been identified ascentral to student success inscience learning:
Laboratory Procedures:Instrumental techniques,analytical methods.
Experimental Design:Scientific method, deci-sion-making, sampling,controls.
Data Analysis: Makingcomparisons/ connections,statistical analysis,evaluating the impact ofresults on society.
Accessing Information:Computer search, access-ing current data over.Internet.
Critical Thinking: ,Problemsolving, reasoning,synthesis, evaluation
Systems. Modeling: Simula-tions, designing physicalmodels
Communicating Results:writing, speaking, creatingpresentations.
Learning CycleThis unit has been structured according to a learning cycle model.The basic components of the learning cycle are as follows:
Engage: Create interest, generate curiosity, and identify students'preconceived notions.
Explore: Provide opportunity to observe and test ideas.Explain: Present defmitions and concepts.Elaborate: Students apply ideas to a new situation.Evaluate: Assess student knowledge and skills.
Cooperative LearningStudies indicate that girls attain higher achievement when taughtscience in cooperative groups (Berliner, 1992). Some of the activitiesin this unit are designed in a cooperative learning format This formatincludes the following components:
Positive Interdependence: Examples of techniques that promote posi-tive interdependence are using one paper or one set of materials forthe group, giving each member a separate job or role, giving all groupmembers the same reward, or giving each person only part of theinformation .
Individual Accountability: Examples of techniques that promote in-dividual accountability include quizzing or testing individually, ran-dom selection of a paper from the group for grading, random oralquizzing of group members, individual homework, or asking for in-dividual signatures.
Criteria for Success: Clearly identify the criteria for success for thelesson and communicate it to students.
Interpersonal skills: Identify, explain, demonstrate, teach, practice,monitor, and/or evaluate one or more social skills (See the "Investi-gating Ozone" activity for a list of interpersonal skills that could beaddressed.)
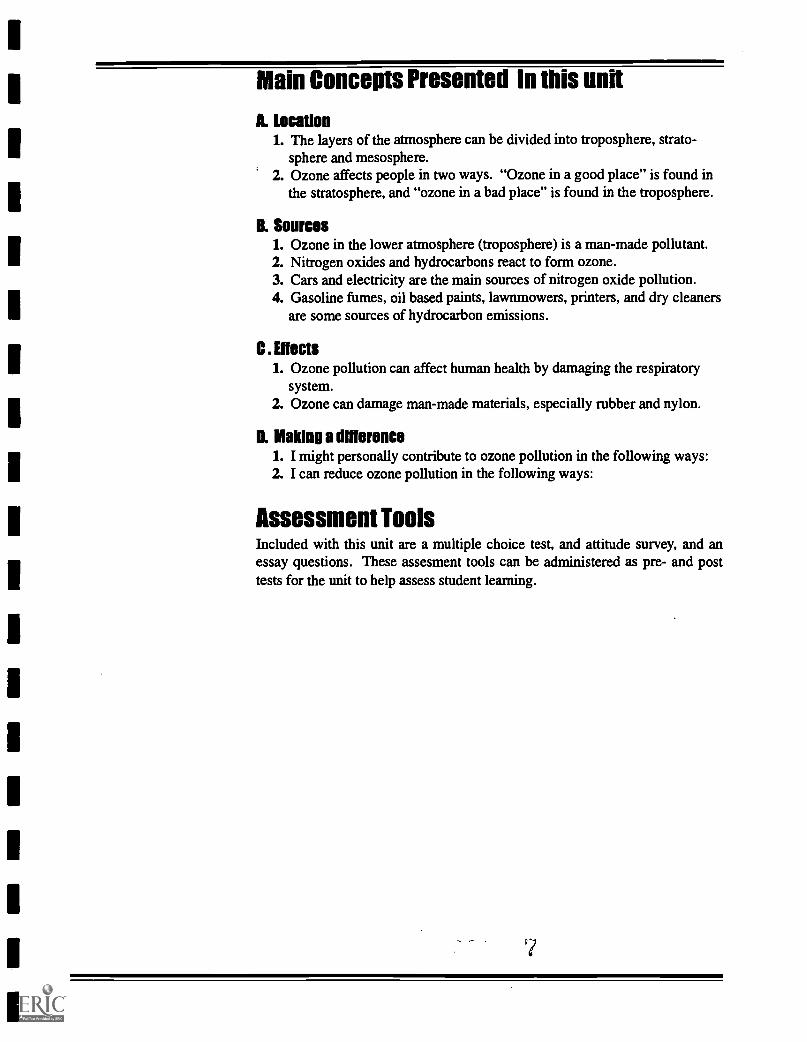
Main Concepts Presented In this unit
L Location1. The layers of the atmosphere can be divided into troposphere, strato-
sphere and mesosphere.2. Ozone affects people in two ways. "Ozone in a good place" is found in
the stratosphere, and "ozone in a bad place" is found in the troposphere.
B. Sources1. Ozone in the lower atmosphere (troposphere) is a man-made pollutant.2. Nitrogen oxides and hydrocarbons react to form ozone.3. Cars and electricity are the main sources of nitrogen oxide pollution.4. Gasoline fumes, oil based paints, lawnmowers, printers, and dry cleaners
are some sources of hydrocarbon emissions.
C . Effects1. Ozone pollution can affect human health by damaging the respiratory
system.2. Ozone can damage man-made materials, especially rubber and nylon.
B. Making a difference1. I might personally contribute to ozone pollution in the following ways:2. I can reduce ozone pollution in the following ways:
Assessment ToolsIncluded with this unit are a multiple choice test, and attitude survey, and anessay questions. These assesment tools can be administered as pre- and posttests for the unit to help assess student learning.
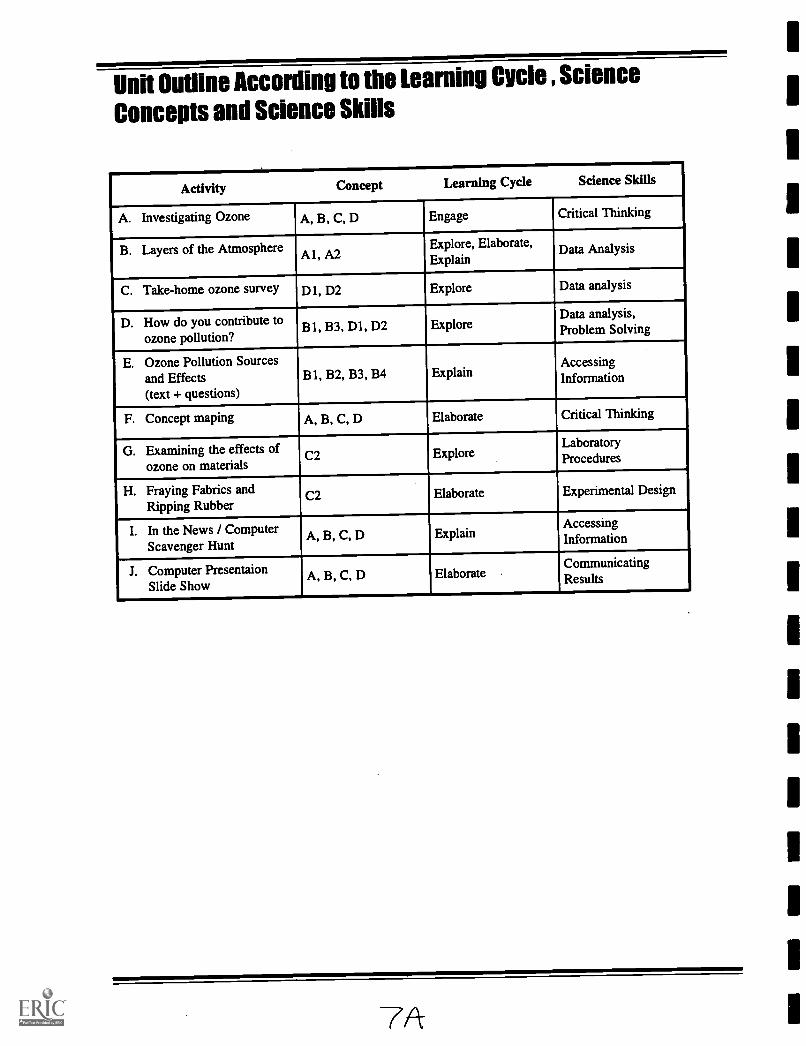
Unit Outline According to the Learning Cycle , Science
Concepts and Science Skills
Activity Concept Learning Cycle Science Skills
A. Investigating Ozone A, B, C, D Engage Critical Thinking
B. Layers of the Atmosphere Al, A2Explore, Elaborate,Explain
Data Analysis
C. Take-home ozone survey D1, D2 Explore Data analysis
D. How do you contribute toozone pollution?
Bl, B3, Dl, D2 ExploreData analysis,Problem Solving
E. Ozone Pollution Sourcesand Effects(text + questions)
Bl, B2, B3, B4 ExplainAccessingInformation
F. Concept maping A, B, C, D Elaborate Critical Thinking
G. Examining the effects ofozone on materials
C2 Ex loreLaboratoryProcedures
H. Fraying Fabrics andRipping Rubber
C2 Elaborate Experimental Design
I. In the News / ComputerScavenger Hunt
ExplainAccessingInformation
J. Computer PresentaionSlide Show
A, B, C, D ElaborateCommunicatingResults
IIIIIII1
IIIIIII1
II
Multiple ChoiceQuestions
Name:
Date:
Period:
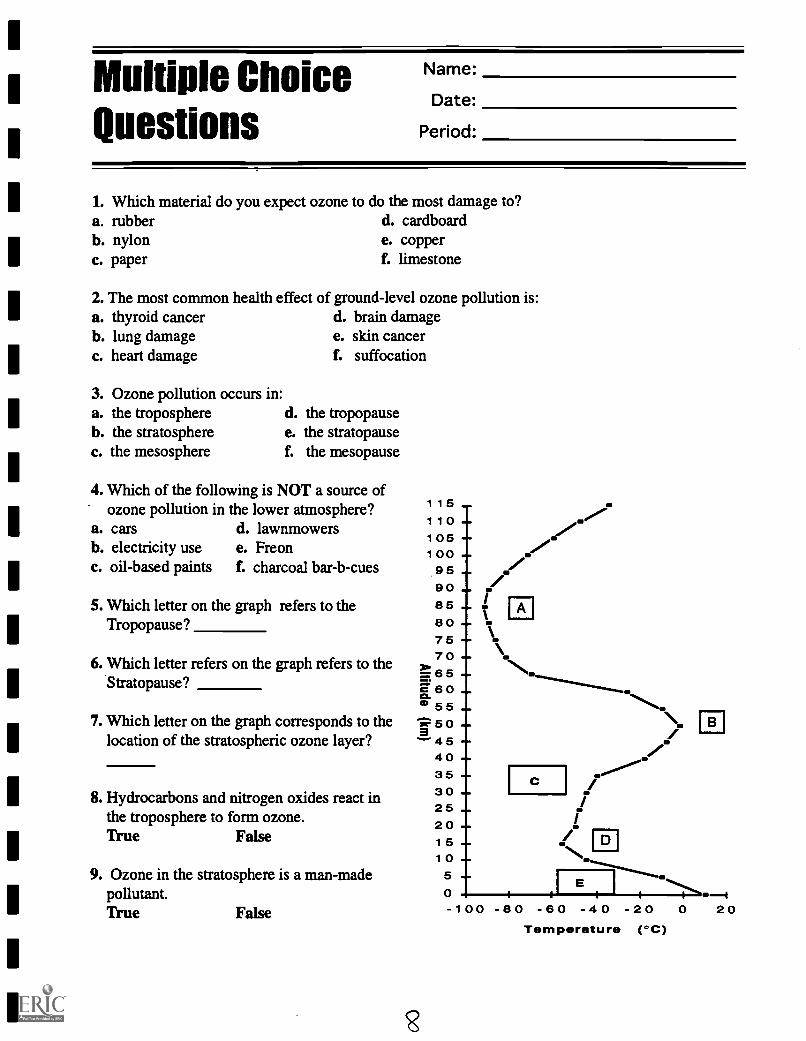
1. Which material do you expect ozone to do the most damage to?a. rubber d. cardboardb. nylon e. copperc. paper f. limestone
2. The most common health effect of ground-level ozone pollution is:d. brain damagee. skin cancerf. suffocation
a. thyroid cancerb. lung damagec. heart damage
3. Ozone pollution occurs in:a. the troposphereb. the stratospherec. the mesosphere
d. the tropopausee. the stratopausef. the mesopause
4. Which of the following is NOT a source ofozone pollution in the lower atmosphere?
a. carsb. electricity usec. oil-based paints
d. lawnmowerse. Freonf. charcoal bar-b-cues
5. Which letter on the graph refers to theTropopause?
6. Which letter refers on the graph refers to theStratopause?
7. Which letter on the graph corresponds to thelocation of the stratospheric ozone layer?
8. Hydrocarbons and nitrogen oxides react inthe troposphere to form ozone.True False
9. Ozone in the stratosphere is a man-madepollutant.True False
115110105100
959085807570
...T. 65
a6055
Tr- 50"2' 45
403530252015 .-10
50 I II El I ........1.%441-100 -80 -60 -40 -20 0 20
IIN.
D
Temperature (°C)
Multiple ChoiceAnswers
Name:
Date:
Period:
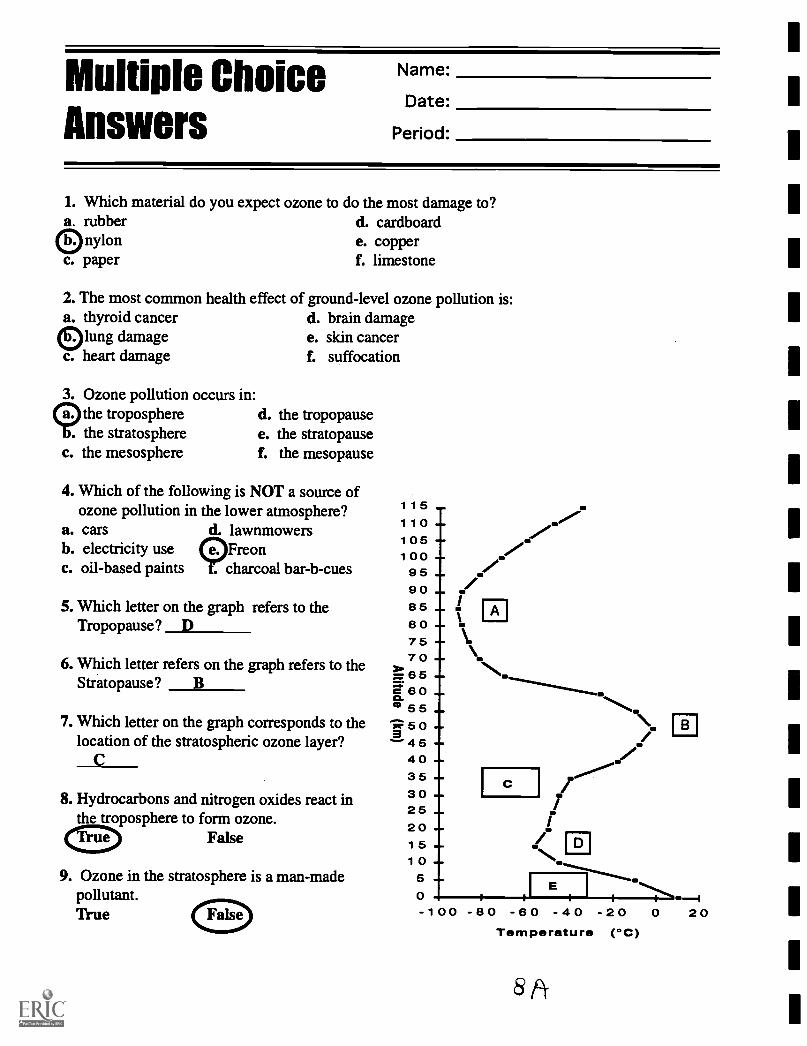
1. Which material do you expect ozone to do the most damage to?a. rubber d. cardboard
0 nylon e. copperc. paper f. limestone
2. The most common health effect of ground-level ozone pollution is:a. thyroid cancer d. brain damage
®lung damage e. skin cancerc. heart damage f. suffocation
3. Ozone pollution occurs in:
9the tropospherethe stratosphere
c. the mesosphere
d. the tropopausee. the stratopausef. the mesopause
4. Which of the following is NOT a source ofozone pollution in the lower atmosphere?
a. cars d. lawnmowersb. electricity use e. Freonc. oil-based paints . charcoal bar-b-cues
5. Which letter on the graph refers to theTropopause? D
6. Which letter refers on the graph refers to theStratopause? B
7. Which letter on the graph corresponds to thelocation of the stratospheric ozone layer?
8. Hydrocarbons and nitrogen oxides react inthe troposphere to form ozone.
False
9. Ozone in the stratosphere is a man-madepollutant.True
115 .-110105 -100
95908580757065
a-60ea.
55
350-4540 .-353025201510
50-100
C
D
-80 -60 -40 -20 0 20Temperature (°C)
8A-
IName:
1 Essay Date:
I Question Period:
I Discuss the sources and effects of ozone pollution.IHow is ozone pollution different from ozone depletion?
I
I
I
I
I
I
I
I
I
I
I
I
I
AttitudeSurvey
Name:
Date:
Period:
1. I like studying about the environment.strongly agree mildly agree neutral mildly disagree strongly disagree
1 2 3 4 5
2. I can help my family better understand environmental issues.strongly agree mildly agree neutral mildly disagree strongly disagree
1 2 3 4 5
3. I don't contribute to air pollution.strongly agree mildly agree neutral mildly disagree strongly disagree
1 2 3 4 5
4. I am interested in studying about environmental issues.strongly agree mildly agree neutral mildly disagree strongly disagree
1 2 3 4 5
5. I talk about what we are learning in class with my family.strongly agree mildly agree neutral mildly disagree strongly disagree
1 2 3 4 5
6. I talk about what we are learning in class with my friends.strongly agree mildly agree neutral mildly disagree strongly disagree
1 2 3 4 5
7. The information that I am learning in class will be useful to me in the future.strongly agree mildly agree neutral mildly disagree strongly disagree
1 2 3 4 5
8. I can think of ways to help solve air pollution problems.strongly agree mildly agree neutral mildly disagree strongly disagree
1 2 3 4 5
ENVIRONMENTAL SCIENCE UNIT
Investigating Ozone
You will express precon-ceived notions regardingthe subject of ozone.
You will be invited to ex-press your curiosity by re-cording questions youhave about ozone.
You will improve in yourability to carry out an as-signed interpersonal skill.
Atom cards, laminated andcut apart; one per student
One Investigating Ozoneworksheet per team.
Poster board or butcherpaper
Markers
Name:
Date:
Period:
Instructions:1. After finding your teammates for this assignment, put your names
in the spaces provided on the "Investigating Ozone" worksheet.
2. Take turns recording answers to the question "What do you knowabout ozone?" Student #1 writes down one answer, tells the teammembers what s/he has written, and then passes the sheet tostudent #2, who writes down a different answer, and so on.
3. When time is called, move on to the question, "What questions doyou have about ozone?" using the same procedure. Team mem-bers can ask for help from other team members in generating ideasfor questions, but they must take turns recording the questions onthe worksheet.
4. Your team should generate at least five different responses toquestion #1 and at least 5 different responses to question #2.
5. Turn in the completed worksheet.
COPYRIGHT © 1996 17
ENVIRONMENTAL SCIENCE UNIT
Investigating Ozone TEACHER BACKGROUND
Students will express preconceived notions regard-ing the subject of ozone.
Students will be invited toexpress their curiosity byrecording questions theyhave about ozone.
Students will improve intheir ability to carry out anassigned interpersonalskill.
Atom cards, laminated andcut apart °never student
One Investigating Ozoneworksheet per team.
Poster board or butcherpaper
Markers
Critical Thinking
1. Select an interpersonal skill that you would like your students towork on improving. (See a list of interpersonal skills on the nextpage.) Tell your students that you want them to monitor how welltheir group performs the assigned skill, such as "Staying on task",during the course of the activity.
2. Assign students to groups of three, using the atom cards asfollows:
A. Explain that ozone is made of microscopic molecules.Each ozone molecule consists of three oxygen atomsattached to each other.
B. Explain that each student represents an oxygen atom.C. Distribute one card per student.D. Tell the students they are to find the other atoms belonging
to the molecule they represent, and form a team with thoseindividuals. If your class cannot be evenly divided intogroups of three, create one or two teams of oxygen mol-ecules using two oxygen atom cards.
3. Distribute one worksheet per team. If you prefer to save onXeroxing costs, you can have each student initial his/her ownanswer on a sheet of notebook paper.
4. At the end of the activity, ask each team to rate themselves on howwell they feel they performed the assigned interpersonal skill.Collect the worksheets.
5. Follow up by summarizing questions and knowledge. Draw anozone molecule on the board and discuss. As an extension of thisactivity, have each team place their questions on poster board orbutcher paper on the walls. At the end of the unit, ask the studentsto select a question and answer it.
COPYRIGHT ©1996 19I 2-
OZONE: DOES IT AFFECT ME?
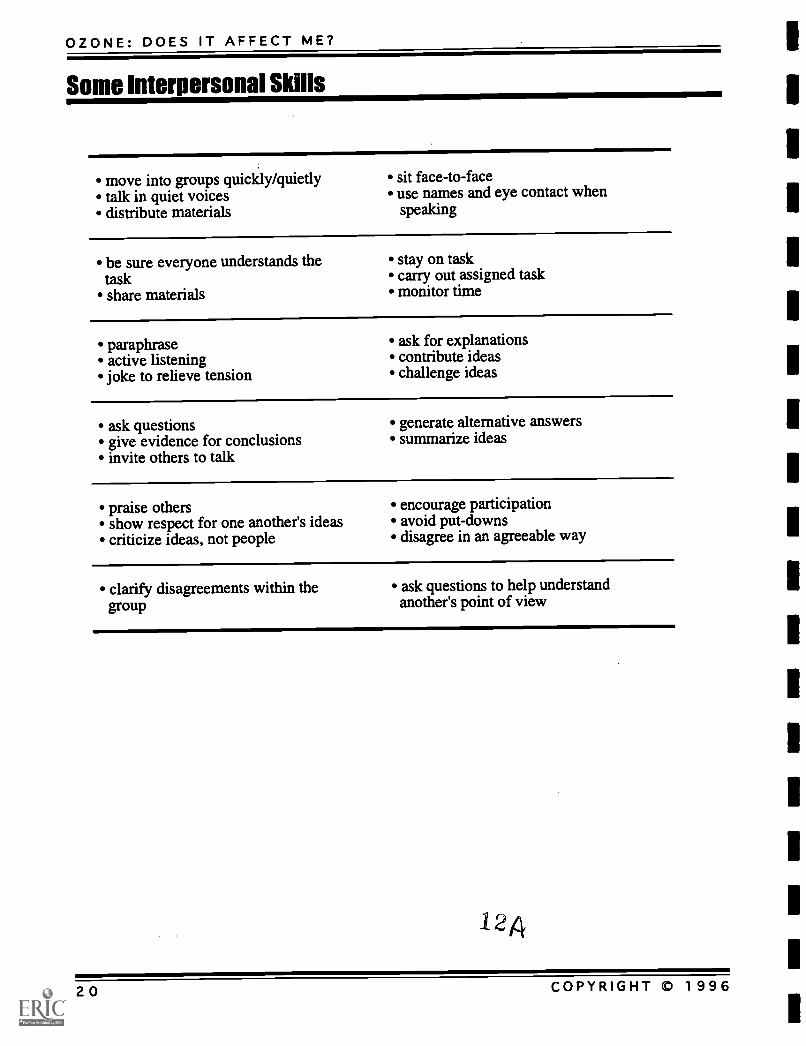
Some Interpersonal Skills
move into groups quickly/quietly sit face-to-facetalk in quiet voices use names and eye contact whendistribute materials speaking
be sure everyone understands the stay on tasktask carry out assigned taskshare materials monitor time
paraphraseactive listeningjoke to relieve tension
ask for explanationscontribute ideaschallenge ideas
ask questionsgive evidence for conclusionsinvite others to talk
generate alternative answerssummarize ideas
praise othersshow respect for one another's ideascriticize ideas, not people
encourage participationavoid put-downsdisagree in an agreeable way
clarify disagreements within the ask questions to help understandgroup another's point of view
124
20 COPYRIGHT © 1996
ENVIRONMENTAL SCIENCE UNIT
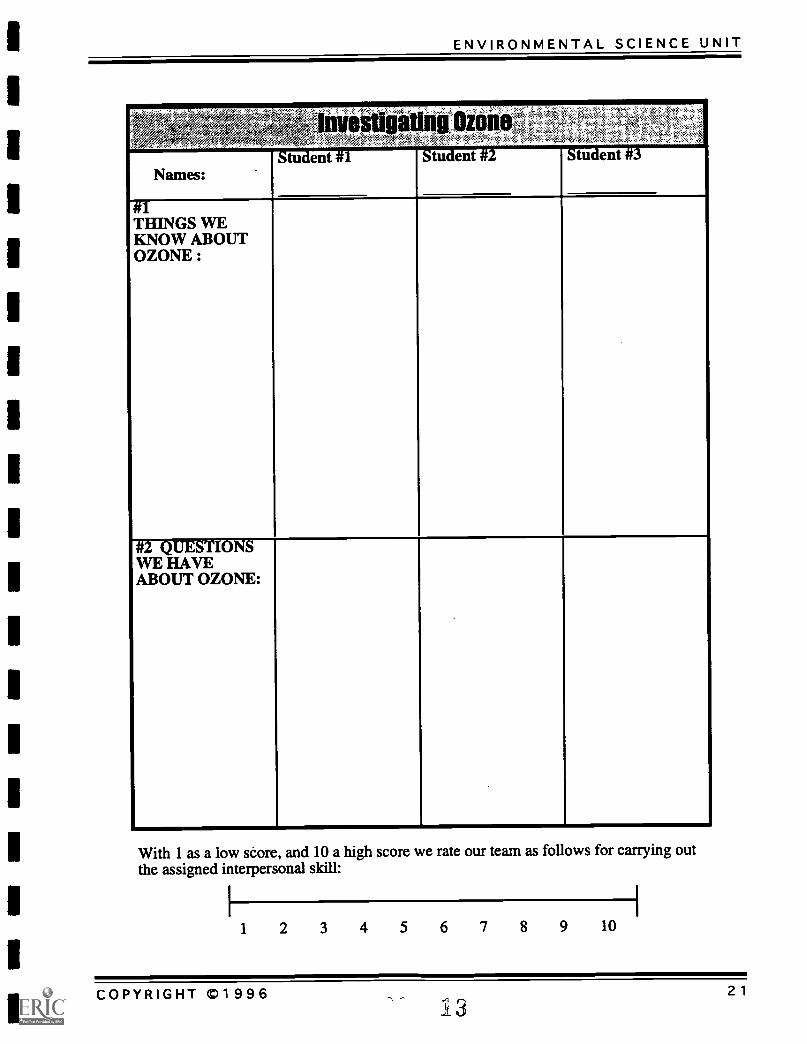
Names:
nVOst gallop NonStudent #1 Student IFZ
#1THINGS WEKNOW ABOUTOZONE:
#2 QUESTIONSWE HAVEABOUT OZONE:
With 1 as a low score, and 10 a high score we rate our team as follows for carrying outthe assigned interpersonal skill:
2 3 4 5 6 7 8 9 10
COPYRIGHT ©1996 2113
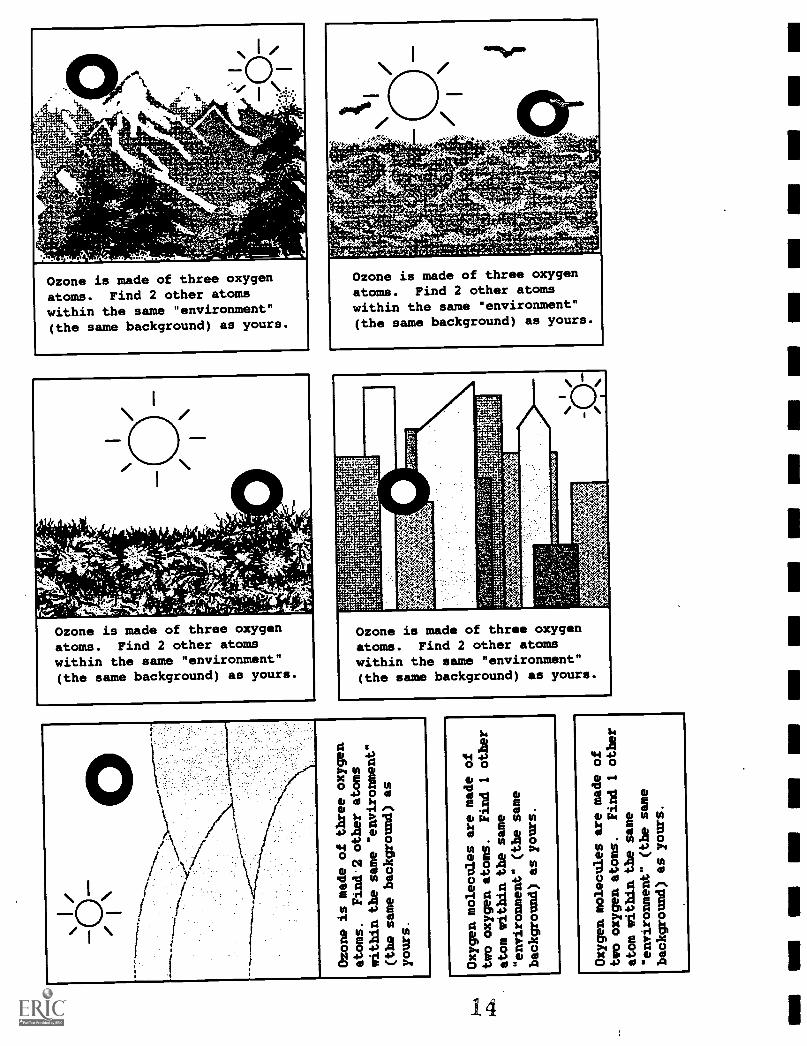
Ozone is made of three oxygen
atoms. Find 2 other atomswithin the same "environment"(the same background) as yours.
Ozone is made of three oxygenatoms. Find 2 other atomswithin the same "environment"(the same background) as yours.
Ozone is made of three oxygen
atoms. Find 2 other atomswithin the same "environment"(the same background) as yours.
Ozone is made of three oxygenatoms. Find 2 other atomswithin the same "environment"(the same background) as yours.
4
Win 6OE a
O RM4) 0 0
6 0 kvi
A Q14
44 Xi 6 P4.) 8 0
114 0E NE'6 0
.ad M 0R
E 64
(AP4 XI 0
r1 0-
0 0 44
4 m
N E4 4) 00 0 IP
14
.21
ENVIRONMENTAL SCIENCE UNIT
Air Pollution
A pollutant causes injury toplant, animal, or human life.
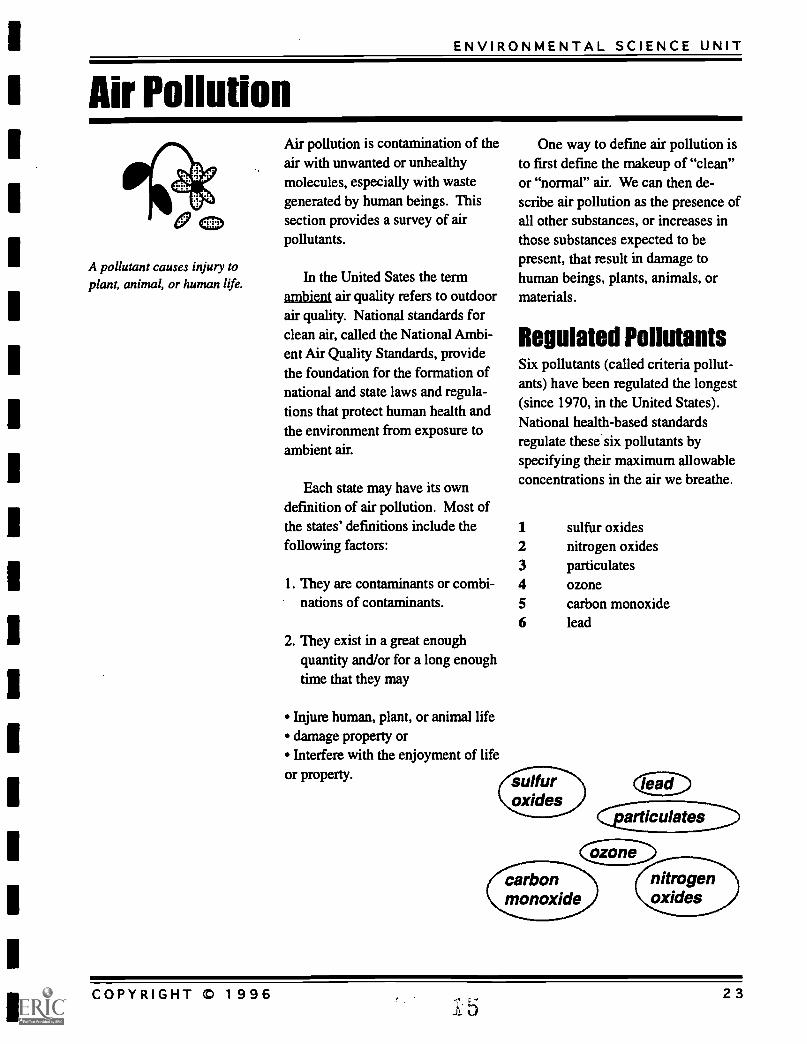
Air pollution is contamination of theair with unwanted or unhealthymolecules, especially with wastegenerated by human beings. Thissection provides a survey of airpollutants.
In the United Sates the termambient air quality refers to outdoorair quality. National standards forclean air, called the National Ambi-ent Air Quality Standards, providethe foundation for the formation ofnational and state laws and regula-tions that protect human health andthe environment from exposure toambient air.
Each state may have its owndefinition of air pollution. Most ofthe states' definitions include thefollowing factors:
1. They are contaminants or combi-nations of contaminants.
2. They exist in a great enoughquantity and/or for a long enoughtime that they may
Injure human, plant, or animal lifedamage property orInterfere with the enjoyment of life
or property.
One way to define air pollution isto first define the makeup of "clean"or "normal" air. We can then de-scribe air pollution as the presence ofall other substances, or increases inthose substances expected to bepresent, that result in damage tohuman beings, plants, animals, ormaterials.
Regulated PollutantsSix pollutants (called criteria pollut-ants) have been regulated the longest(since 1970, in the United States).National health-based standardsregulate these six pollutants byspecifying their maximum allowableconcentrations in the air we breathe.
1 sulfur oxides2 nitrogen oxides3 particulates4 ozone5 carbon monoxide6 lead
nitrogenoxides
COPYRIGHT © 1996 235
OZONE: DOES IT AFFECT MET
Reference:Air and Waste ManagementAssociation. 1991.Environmental Resource Guide :Air Quality. Pittsburgh:Tennessee Valley Authority,Environmental EducationSection.
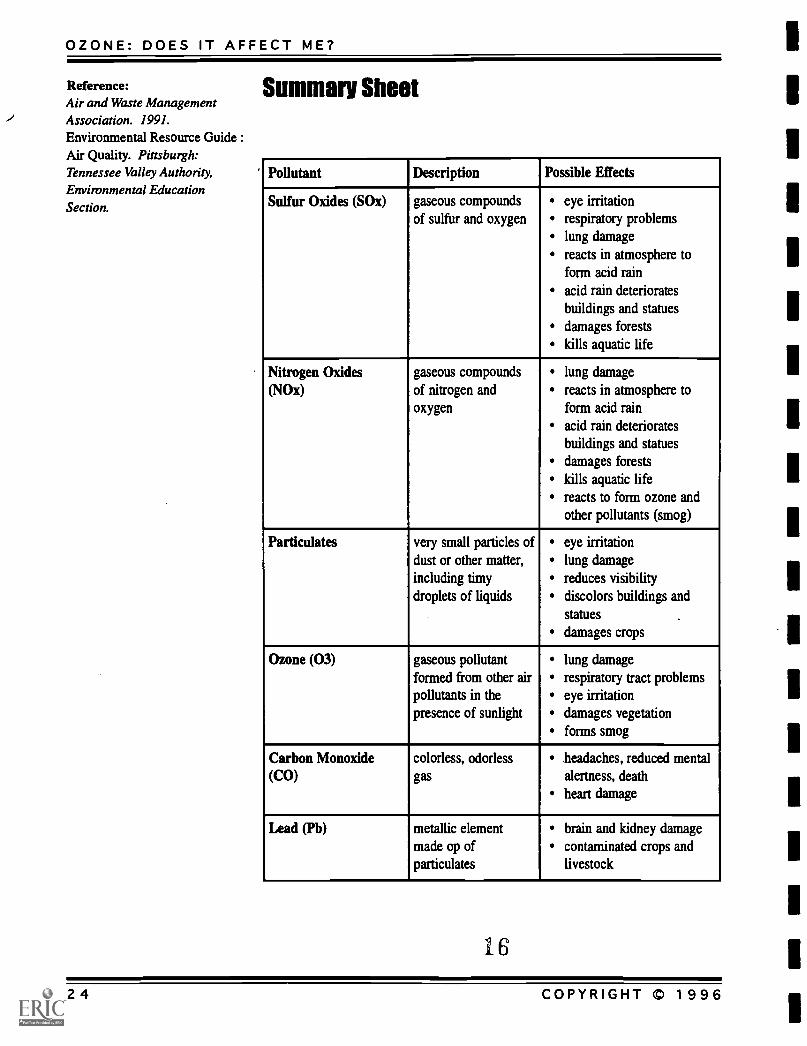
Summary Sheet
Pollutant Description Possible Effects
Sulfur Oxides (SOx) gaseous compoundsof sulfur and oxygen
eye irritationrespiratory problemslung damagereacts in atmosphere toform acid rainacid rain deterioratesbuildings and statuesdamages forestskills aquatic life
Nitrogen Oxides(NOx)
gaseous compoundsof nitrogen andoxygen
lung damagereacts in atmosphere toform acid rainacid rain deterioratesbuildings and statuesdamages forestskills aquatic lifereacts to form ozone andother pollutants (smog)
Particulates very small particles ofdust or other matter,including timydroplets of liquids
eye irritationlung damagereduces visibilitydiscolors buildings andstatues .
damages crops
Ozone (03) gaseous pollutantformed from other airpollutants in thepresence of sunlight
lung damagerespiratory tract problemseye irritationdamages vegetationforms smog
Carbon Monoxide(CO)
colorless, odorlessgas
headaches, reduced mentalalertness, deathheart damage
Lead (Pb) metallic elementmade op ofparticulates
brain and kidney damagecontaminated crops andlivestock
16
24 COPYRIGHT © 1996
1
1
ENVIRONMENTAL SCIENCE UNIT
Atmospheric Layers
4,
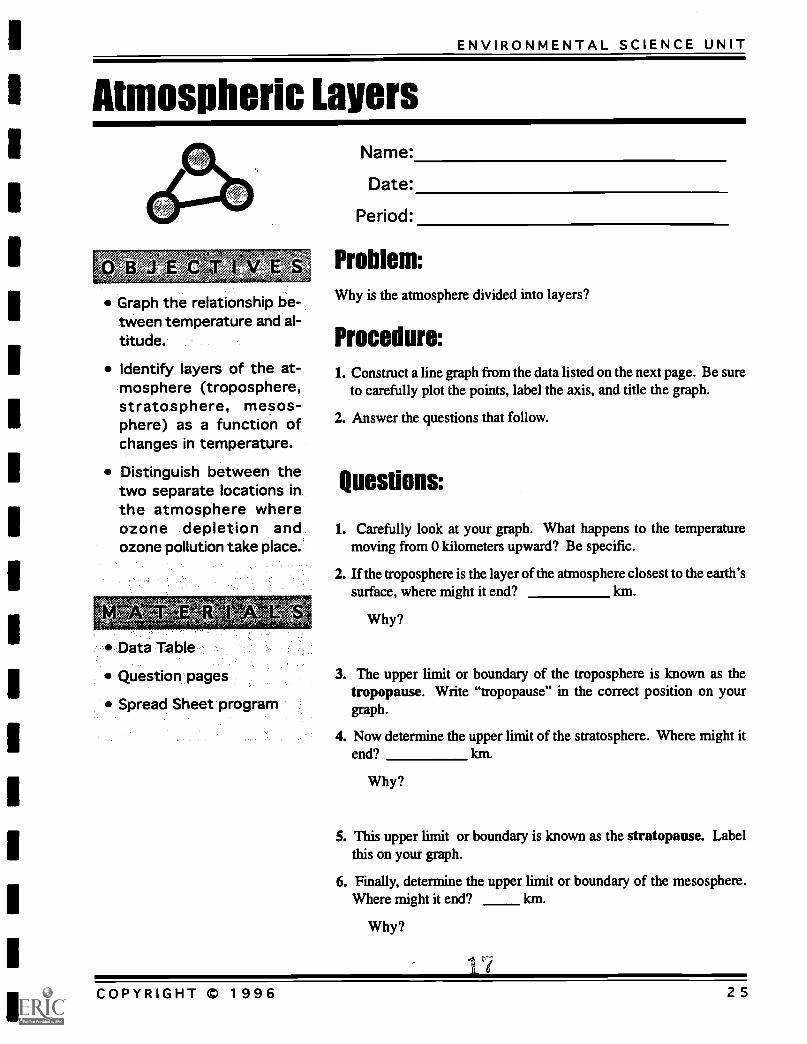
Graph the relationship be-tween temperature and al-titude.
Identify layers of the at-mosphere (troposphere,stratosphere, mesos-phere) as a function ofchanges in temperature.
Distinguish between thetwo separate locations inthe atmosphere whereozone depletion andozone pollution take place.
Data Table
Question pages
Spread Sheet program
Name:
Date:
Period:
Problem:Why is the atmosphere divided into layers?
Procedure:1. Construct a line graph from the data listed on the next page. Be sure
to carefully plot the points, label the axis, and title the graph.
2. Answer the questions that follow.
Questions:
1. Carefully look at your graph. What happens to the temperaturemoving from 0 kilometers upward? Be specific.
2. If the troposphere is the layer of the atmosphere closest to the earth'ssurface, where might it end? km.
Why?
3. The upper limit or boundary of the troposphere is known as thetropopause. Write "tropopause" in the correct position on yourgraph.
4. Now determine the upper limit of the stratosphere. Where might itend? km.
Why?
5. This upper limit or boundary is known as the stratopause. Labelthis on your graph.
6. Finally, determine the upper limit or boundary of the mesosphere.Where might it end? km.
Why?
COPYRIGHT © 1996 25
OZONE: WILL IT AFFECT ME?
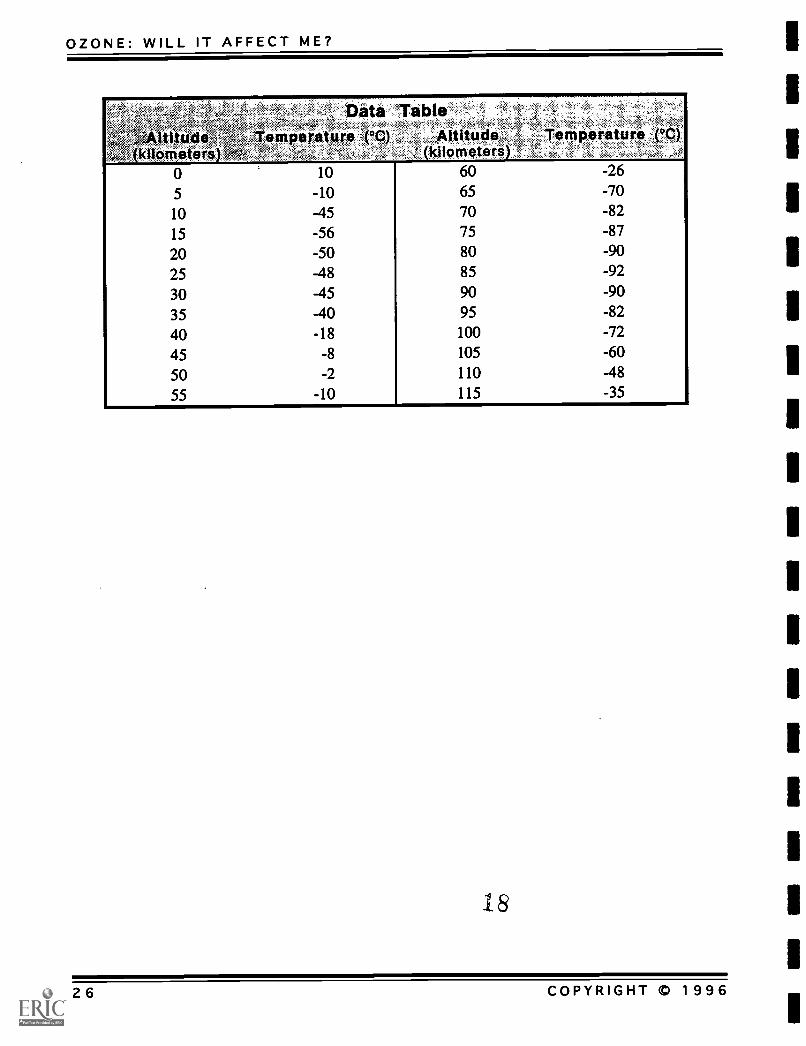
Data 'Table6440 emperature, (*P. )
(kilometers)Tpmperaure'eC)
Id I om eters) (kilometeri)0 10 60 -26
5 -10 65 -70
10 -45 70 -82
15 -56 75 -87
20 -50 80 -90
25 -48 85 -92
30 -45 90 -90
35 -40 95 -82
40 -18 100 -72
45 -8 105 -60
50 -2 110 -48
55 -10 115 -35
18
26 COPYRIGHT CD 1996
ENVIRONMENTAL SCIENCE UNIT
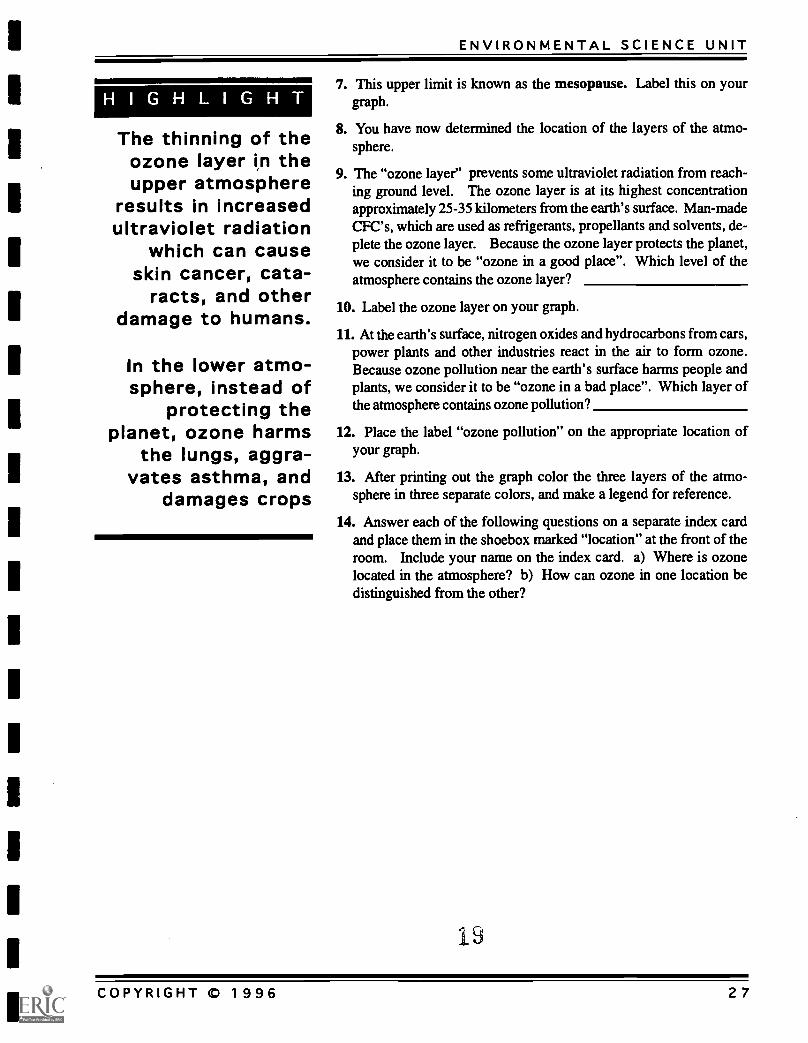
The thinning of theozone layer in theupper atmosphere
results in increasedultraviolet radiation
which can causeskin cancer, cata-
racts, and otherdamage to humans.
In the lower atmo-sphere, instead of
protecting theplanet, ozone harms
the lungs, aggra-vates asthma, and
damages crops
7. This upper limit is known as the mesopause. Label this on yourgraph.
8. You have now determined the location of the layers of the atmo-sphere.
9. The "ozone layer" prevents some ultraviolet radiation from reach-ing ground level. The ozone layer is at its highest concentrationapproximately 25-35 kilometers from the earth's surface. Man-madeCFC's, which are used as refrigerants, propellants and solvents, de-plete the ozone layer. Because the ozone layer protects the planet,we consider it to be "ozone in a good place". Which level of theatmosphere contains the ozone layer?
10. Label the ozone layer on your graph.
11. At the earth's surface, nitrogen oxides and hydrocarbons from cars,power plants and other industries react in the air to form ozone.Because ozone pollution near the earth's surface harms people andplants, we consider it to be "ozone in a bad place". Which layer ofthe atmosphere contains ozone pollution?
12. Place the label "ozone pollution" on the appropriate location ofyour graph.
13. After printing out the graph color the three layers of the atmo-sphere in three separate colors, and make a legend for reference.
14. Answer each of the following questions on a separate index cardand place them in the shoebox marked "location" at the front of theroom. Include your name on the index card. a) Where is ozonelocated in the atmosphere? b) How can ozone in one location bedistinguished from the other?
19
COPYRIGHT m 1996 27
ENVIRONMENTAL SCIENCE UNIT
Atmospheric Layers TEACHER BACKGROUND
B,
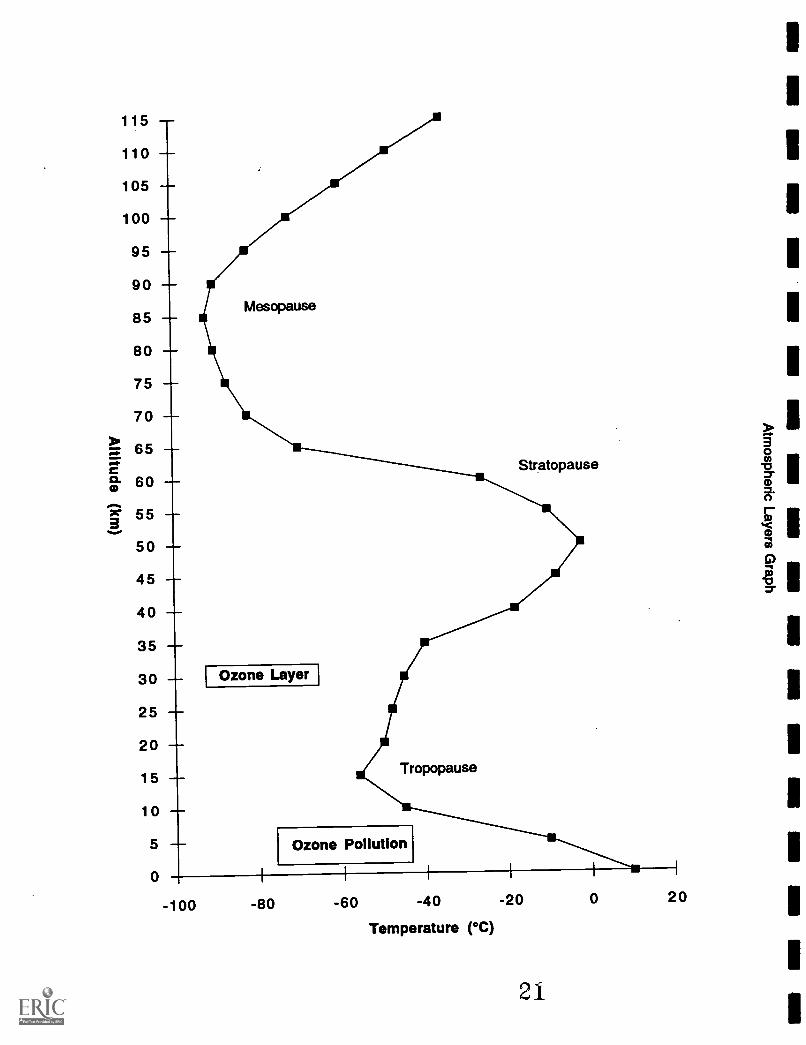
Students will graph 'therelationship between tem-perature and altitude.
Students will identify lay-ers of the atmosphere(troposphere, strato-sphere, mesosphere) as afunction of changes in,temperature.
Students will distinguishthat ozone depletion andozone pollution take placein two separate locationsIn the atmosphere..
Data Table
fe Graph
Spreadsheet program
I
Data Analysis
In this exercise, students can draw the graph by hand, or they cancreate the graph on a computer using a spreadsheet program, such
as Microsoft Works, Claris Works, or Excel. Included in this unitare generic graphing instructions for Claris Works. Graphing guide-lines for other spreadsheet programs will be similar.
Have the students enter both columns of points into a spread-sheet. When they would like to plot the points into a chart, makesure they use the first column of points as the "X-Values" in an X-
Y chart.
The best type of chart to use for this plot is a simple line graph.This will allow the students to see the change in temperature fromone layer to the next.
If you have the students switch the positions of their x and yaxes, so that the altitude axis is vertical (see graphing instructions),the graph will create a better visual model for comparing with theactual atmosphere.
Now when students look at the graph, they should clearly beable to see the different layers associated with the atmosphere.
20COPYRIGHT m 1996
BEST COPY AVAILABLE
29
115 --r-
110
105
100
95
90
85Mesopause
80
75
70
65
60Stratopause
55
50
45
40
35
30 Ozone Layer
25
20
15Tropopause
10
5 Ozone Pollution
0 1
-100 -80 -60 -40
Temperature (°C)
-20
21
0 20 1
1
I Generic Graphing Instructions ForI Claris Works
Start up Claris Works (oliok tke Claris Works icon)Choose Spread Sheet
1Copy your data table to the spreadsheetHigh light your dataUnder the Options menu choose Make Chart.
Do Not Click Okay until you have gone through every category!
Click on GalleryClick on the type of graph you would like
Click on AxisLabel your Y axis according to the data found in column BClick on X axis
I Series
Label your X axis according to the data found in column A
Click on Labels
1Type your titleUnclick the X next to legend to get rid of the legend.
Click on GeneralClick on ColumnsClick on First Column
Now click Okay
Save Your GraphmliUnder the File menu choose Save
lYPe a name for your documentClick Save
COPYRIGHT © 1996 31
OZONE: DOES IT AFFECT ME?
Use the following to customize your graph
Any of your original choices can be changed by following the steps above.For additional formatting refer to the instructions below.
Does your X axis need to be longer than your Y axis? If so...Under the File menu choose Page SetupClick on the picture of the sideways person
Double click on your graph to bring up the chart options screen.
To switch the positions of the X and Y axesClick on GalleryClick in the box to the left of the word Horizontal.
To change the ranges of your axesClick on AxisClick on the axis you would like to changeEnter a minimum valueEnter a maximum valueEnter a step size. (This will determine how the axis labels are broken
down. For example you could have a mark every 10 unitsor every 20 units)
To label your dataClick on SeriesClick on the box to the left of Label Data
To change the placement of your legend or titleClick on LabelsIf you want a horizontal legend
Click on the box next to the word HorizontalClick on the diagram to the right to chang the placement of
your title (top) or your legend (bottom)
23
32 COPYRIGHT 0 1996
ENVIRONMENTAL SCIENCE UNIT
Before printing
Under the View menu choose Show ToolsChange all colors to pastels (except line graphs)
Click on the color box in the legend you want to change (A whitecircle will appear in the box.)
In the tools box (over to the left) click and hold on the upper mostrainbow box
Drag to the Pastel color of your choiceRepeat for every series in your legend
If you have labeled your dataUnder the Format menu click and hold Text ColorDrag to black
Correctly place your graph on the pageGet rid of cells and cell labels
Click on a cell in your spreadsheetUnder the Options menu choose DisplayClick on all of the X's so that there aren't any leftClick Okay
Resize the graphUnder the View menu choose Page ViewClick inside your graph and drag it so that the graphs upper
left hand corner is in the same place as the pageborder's upper left hand corner
Click on the box at the lower right hand corner of your graphand drag it so it is in the same place as the pageborder's lower right hand corner
Remember- you can continue to move it around until youlet go of the mouse button!
Add your nameIn the tools box (over to the left) click on the A toolClick on an appropriate place on your graphType your nameClick anywhere on your finished graph
Save your graph again!
Under the File menu choose PrintClick Print
24
COPYRIGHT © 1996 33
ENVIRONMENTAL SCIENCE UNIT
The Atmosphere
HIGHLIGHTOzone in the
troposphere isincreasing.
Ozone in thestratosphere is
decreasing.
Air is everywhere. We can feel itmove, we breathe it, and we live init. We cannot live without it. Whatis air? Air consists of a mixture ofdifferent gases. We call the gasesthat surround the earth the atmo-sphere.
Composition of theAtmosphereThere are two major components ofunpolluted air at ground level.
Nitrogen makes up about 78percent of the atmosphere.
Oxygen makes up about 21percent.
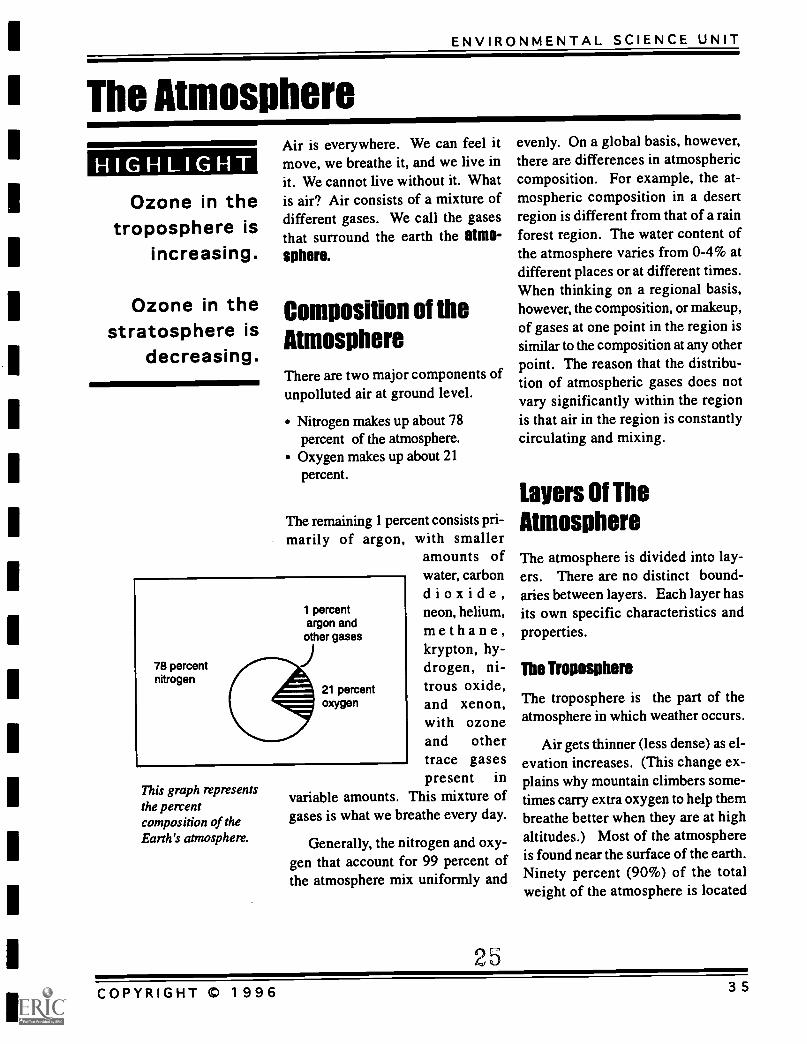
The remaining 1 percent consists pri-marily of argon, with smaller
amounts ofwater, carbondioxide,neon, helium,methane,krypton, hy-drogen, ni-trous oxide,and xenon,with ozoneand othertrace gasespresent in
variable amounts. This mixture ofgases is what we breathe every day.
Generally, the nitrogen and oxy-gen that account for 99 percent ofthe atmosphere mix uniformly and
78 percentnitrogen
1 percentargon and
other gases
21 percentoxygen
This graph representsthe percentcomposition of theEarth's atmosphere.
25
evenly. On a global basis, however,there are differences in atmosphericcomposition. For example, the at-mospheric composition in a desertregion is different from that of a rainforest region. The water content ofthe atmosphere varies from 0-4% atdifferent places or at different times.When thinking on a regional basis,however, the composition, or makeup,of gases at one point in the region issimilar to the composition at any otherpoint. The reason that the distribu-tion of atmospheric gases does notvary significantly within the regionis that air in the region is constantlycirculating and mixing.
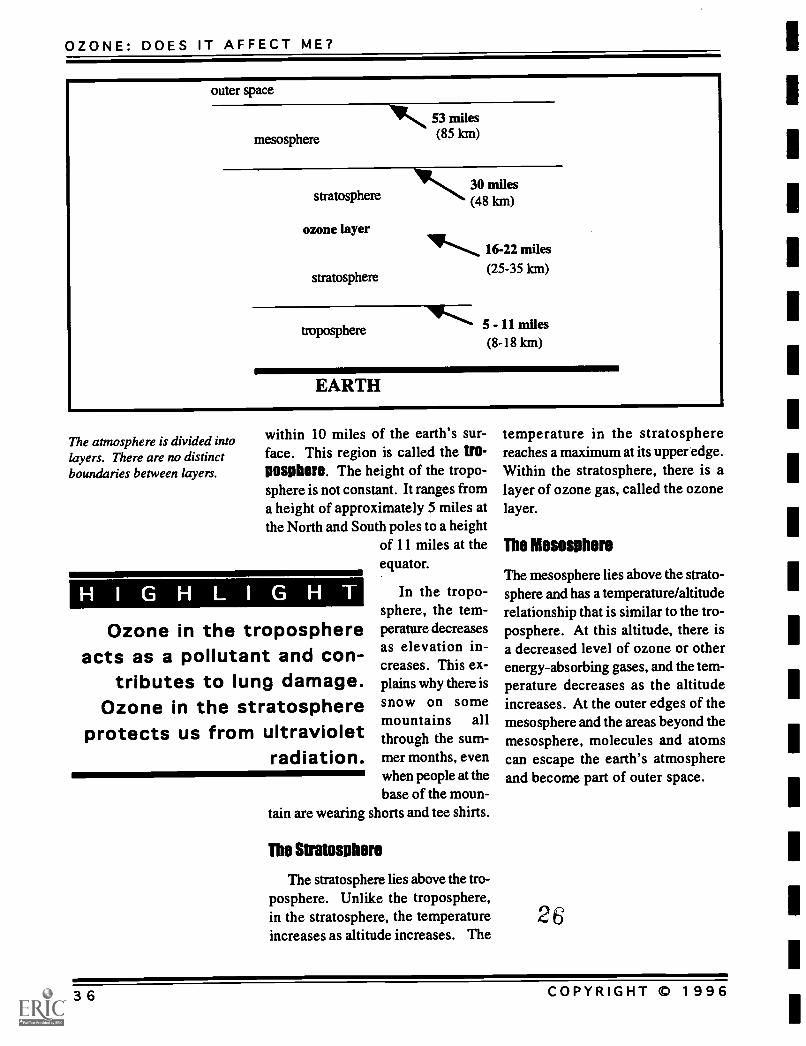
Layers Of TheAtmosphereThe atmosphere is divided into lay-ers. There are no distinct bound-aries between layers. Each layer hasits own specific characteristics andproperties.
The Troposphere
The troposphere is the part of theatmosphere in which weather occurs.
Air gets thinner (less dense) as el-evation increases. (This change ex-plains why mountain climbers some-times carry extra oxygen to help thembreathe better when they are at highaltitudes.) Most of the atmosphereis found near the surface of the earth.Ninety percent (90%) of the totalweight of the atmosphere is located
COPYRIGHT ID 1996 35
OZONE: DOES IT AFFECT ME?
outer space
mesosphere
1/1 53 miles(85 km)
stratosphere
ozone layer
stratosphere
30 miles(48 km)
11"..., 16-22 miles(25-35 km)
..***troposphere 5- 11 miles(8-18 km)
EARTH
The atmosphere is divided intolayers. There are no distinctboundaries between layers.
within 10 miles of the earth's sur-face. This region is called the tro-posphere. The height of the tropo-sphere is not constant. It ranges froma height of approximately 5 miles atthe North and South poles to a height
of 11 miles at theequator.
In the tropo-sphere, the tem-perature decreasesas elevation in-creases. This ex-plains why there issnow on somemountains allthrough the sum-mer months, evenwhen people at thebase of the moun-
tain are wearing shorts and tee shirts.
Ozone in the troposphereacts as a pollutant and con-
tributes to lung damage.Ozone in the stratosphere
protects us from ultravioletradiation.
The Stratosphere
The stratosphere lies above the tro-posphere. Unlike the troposphere,in the stratosphere, the temperatureincreases as altitude increases. The
temperature in the stratospherereaches a maximum at its upper edge.Within the stratosphere, there is alayer of ozone gas, called the ozonelayer.
The Mesosphere
The mesosphere lies above the strato-sphere and has a temperature/altituderelationship that is similar to the tro-posphere. At this altitude, there isa decreased level of ozone or otherenergy-absorbing gases, and the tem-perature decreases as the altitudeincreases. At the outer edges of themesosphere and the areas beyond themesosphere, molecules and atomscan escape the earth's atmosphereand become part of outer space.
26
36 COPYRIGHT © 1996
I Ozone Survey
1
1
1
1
1
1
ENVIRONMENTAL SCIENCE UNIT
s
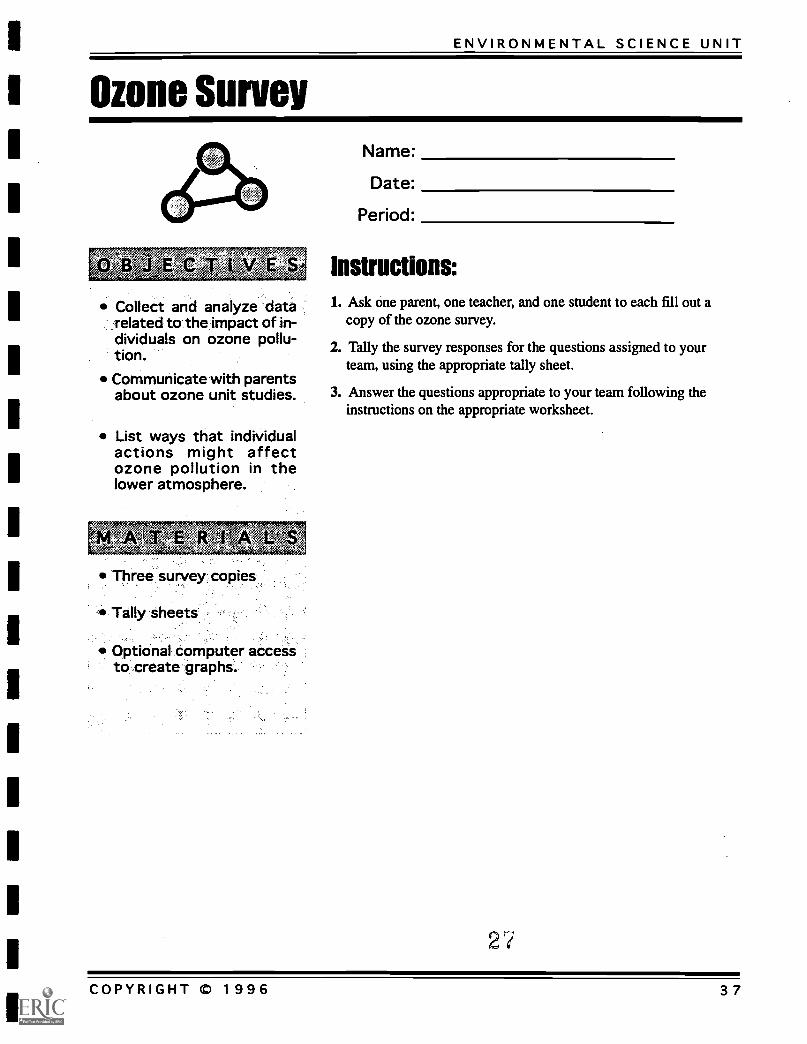
Collect and analyze datarelated to the impact of in-dividuals on ozone pollu-tion.Communicate with parentsabout ozone unit studies.
List ways that individualactions might affectozone pollution in thelower atmosphere.
Optional computer accessto create graphs.
Name:
Date:
Period:
Instructions:1. Ask one parent, one teacher, and one student to each fill out a
copy of the ozone survey.
2. Tally the survey responses for the questions assigned to yourteam, using the appropriate tally sheet.
3. Answer the questions appropriate to your team following theinstructions on the appropriate worksheet.
27
COPYRIGHT 1996 37
OZONE: DOES IT AFFECT ME?
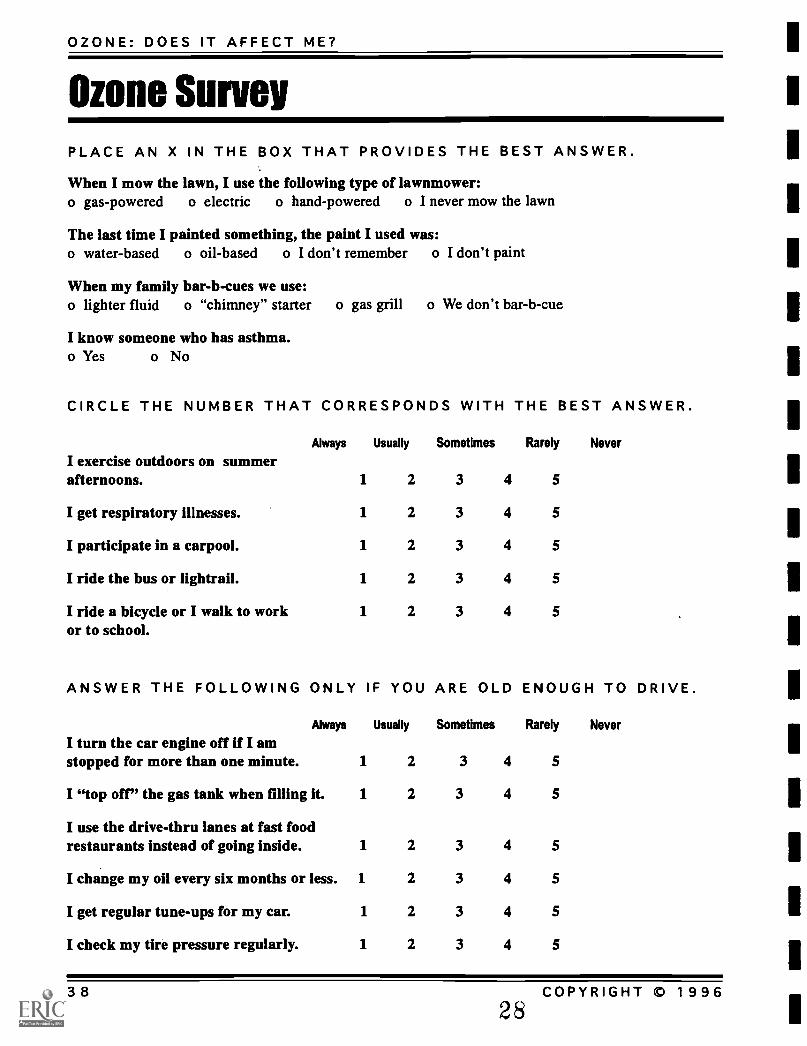
Ozone SurveyPLACE AN X IN THE BOX THAT PROVIDES THE BEST ANSWER.
When I mow the lawn, I use the following type of lawnmower:o gas-powered o electric o hand-powered o I never mow the lawn
The last time I painted something, the paint I used was:o water-based o oil-based o I don't remember o I don't paint
When my family bar-b-cues we use:o lighter fluid o "chimney" starter o gas grill o We don't bar-b-cue
I know someone who has asthma.o Yes o No
CIRCLE THE NUMBER THAT CORRESPONDS WITH THE BEST ANSWER.
I exercise outdoors on summerAlways Usually Sometimes Rarely Never
afternoons. 1 2 3 4 5
I get respiratory illnesses. 1 2 3 4 5
I participate in a carpool. 1 2 3 4 5
I ride the bus or lightrail. 1 2 3 4 5
I ride a bicycle or I walk to workor to school.
1 2 3 4 5
ANSWER THE FOLLOWING ONLY IF YOU ARE OLD ENOUGH TO DRIVE.
Always
I turn the car engine off if I amUsually Sometimes Rarely Never
stopped for more than one minute. 1 2 3 4 5
I "top off" the gas tank when filling it. 1 2 3 4 5
I use the drive-thru lanes at fast foodrestaurants instead of going inside. 1 2 3 4 5
I change my oil every six months or less. 1 2 3 4 5
I get regular tune-ups for my car. 1 2 3 4 5
I check my tire pressure regularly. 1 2 3 4 5
38 COPYRIGHT 0 199628
I
III
IIIIIIIIII1
IIII
ENVIRONMENTAL SCIENCE UNIT
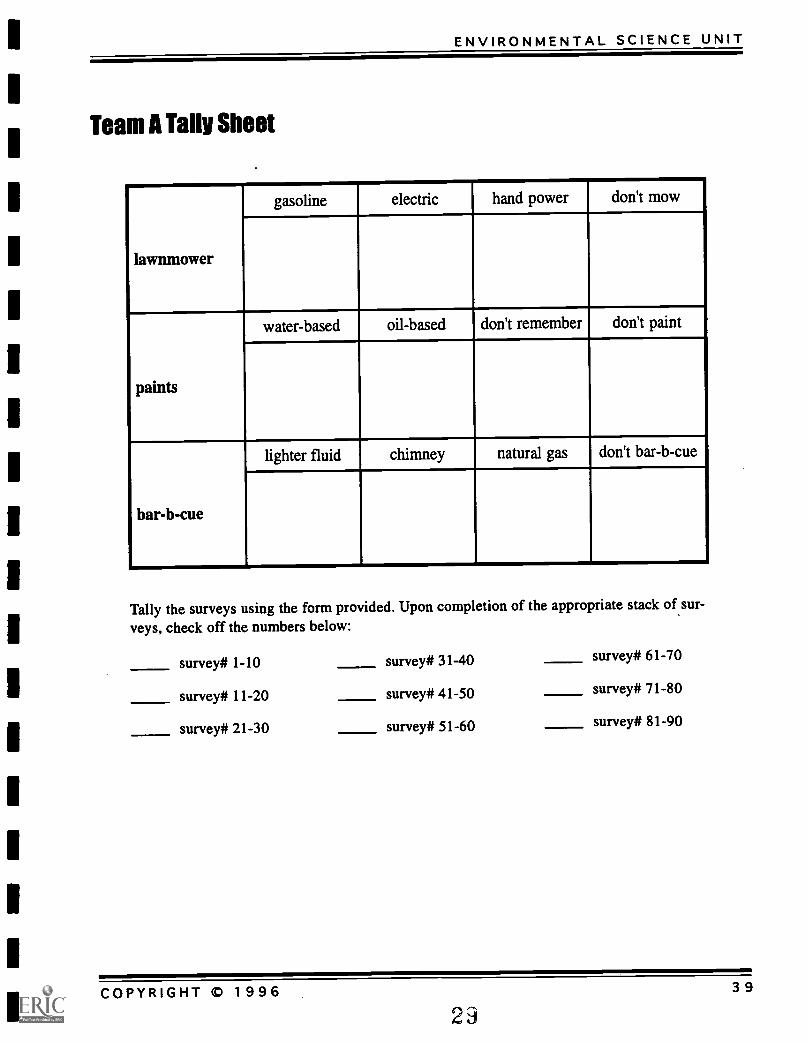
Team A Tally Sheet
lawnmower
gasoline electric hand power don't mow
paints
water-based oil-based don't remember don't paint
bar-b-cue
lighter fluid chimney natural gas don't bar-b-cue
Tally the surveys using the form provided. Upon completion of the appropriate stack of sur-
veys, check off the numbers below:
survey# 1-10
survey# 11-20
survey# 21-30
survey# 31-40
survey# 41-50
survey# 51-60
survey# 61-70
survey# 71-80
survey# 81-90
COPYRIGHT ID 1996 3 9
2
OZONE: DOES IT AFFECT ME?
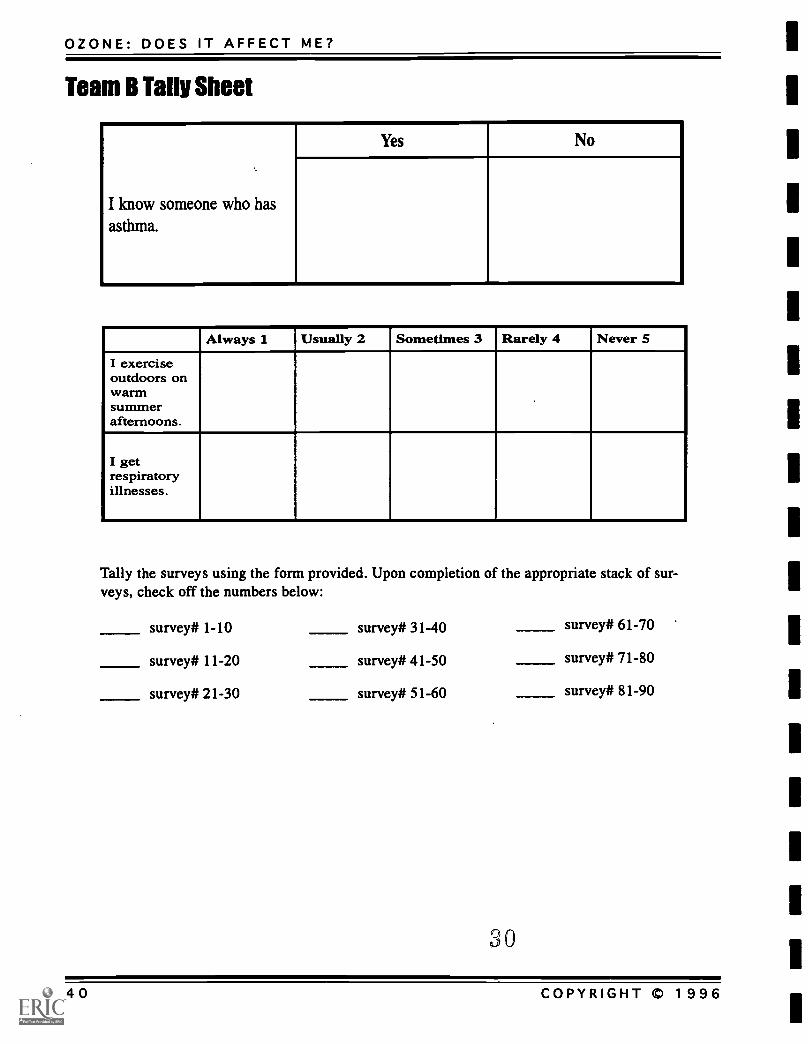
Team B Tally Sheet
I know someone who hasasthma.
Yes No
Always 1 Usually 2 Sometimes 3 Rarely 4 Never 5
I exerciseoutdoors onwarmsummerafternoons.
I getrespiratoryillnesses.
Tally the surveys using the form provided. Upon completion of the appropriate stack of sur-veys, check off the numbers below:
survey# 1-10 survey# 31-40
survey# 11-20 survey# 41-50
survey# 21-30 survey# 51-60
0
survey# 61-70
survey# 71-80
survey# 81-90
40 COPYRIGHT m 1996
1
1
1
ENVIRONMENTAL SCIENCE UNIT
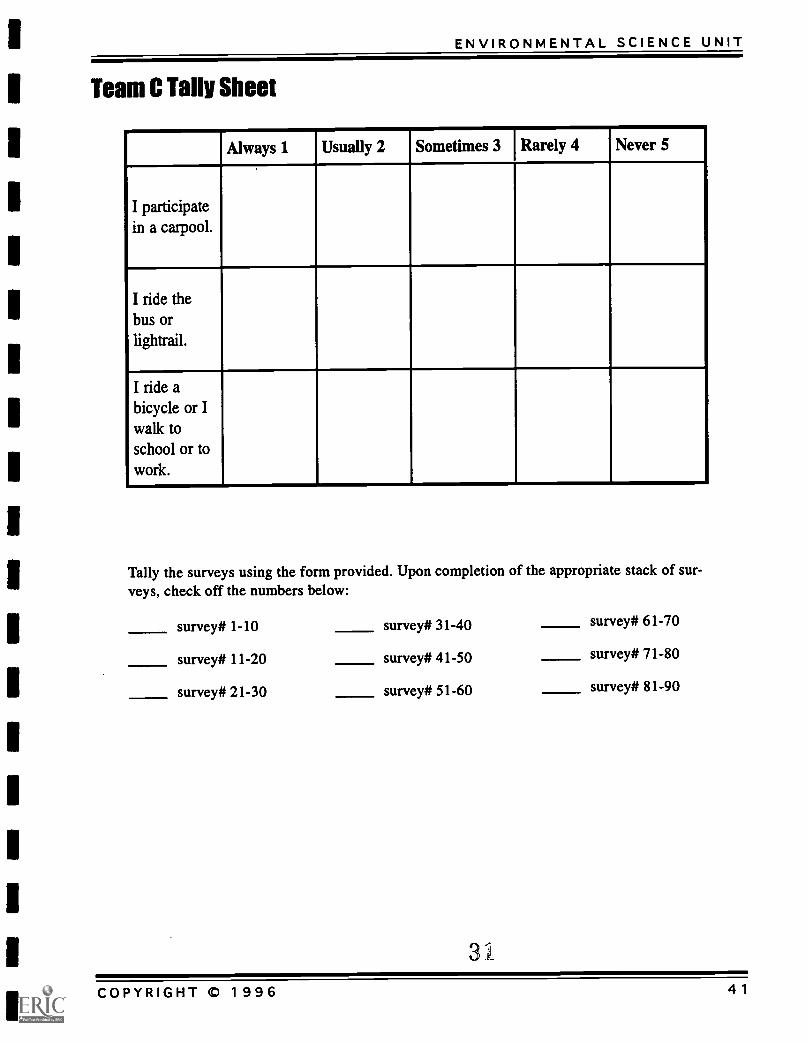
Team C Tally Sheet
Always 1 Usually 2 Sometimes 3 Rarely 4 Never 5
I participatein a carpool.
I ride thebus orlightrail.
I ride abicycle or Iwalk toschool or towork.
Tally the surveys using the form provided. Upon completion of the appropriate stack of sur-veys, check off the numbers below:
survey# 1-10
survey# 11-20
survey# 21-30
survey# 31-40
survey# 41-50
survey# 51-60
1
3i
survey# 61-70
survey# 71-80
survey# 81-90
COPYRIGHT © 1996 41
OZONE: DOES IT AFFECT ME?
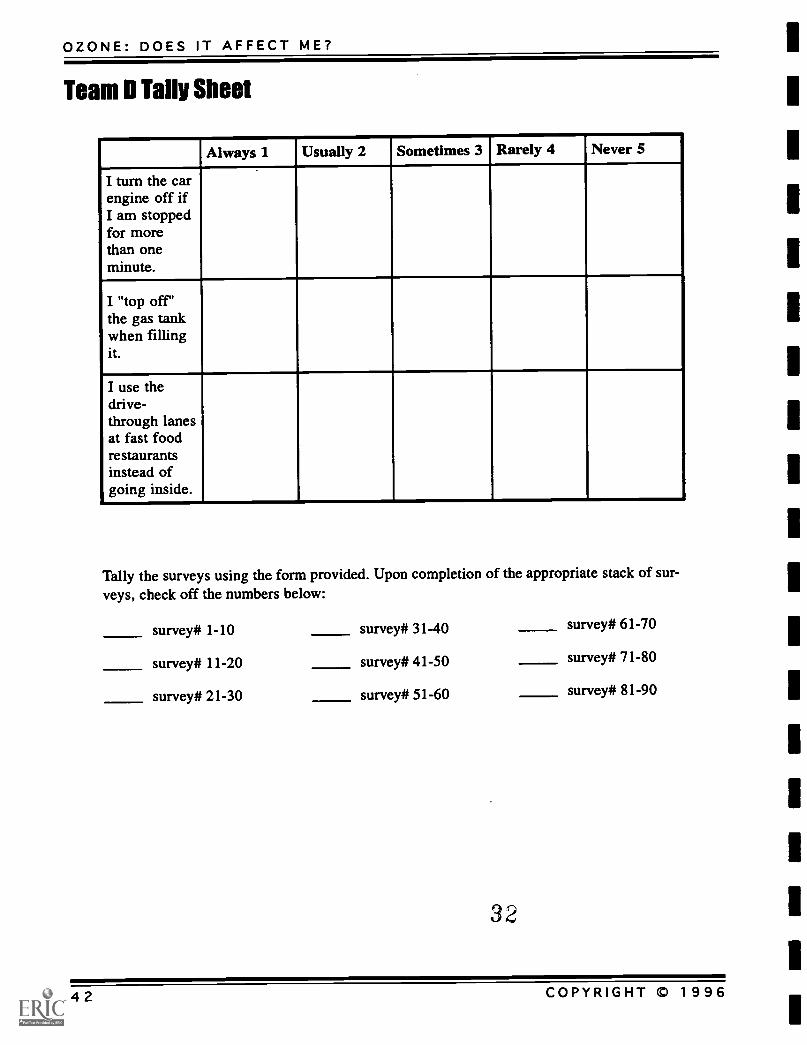
Team D Tally Sheet
Always 1 Usually 2 Sometimes 3 Rarely 4 Never 5
I turn the carengine off ifI am stoppedfor morethan oneminute.
I "top off'the gas tankwhen fillingit.
I use thedrive-through lanesat fast foodrestaurantsinstead ofgoing inside.
Tally the surveys using the form provided. Upon completion of the appropriate stack of sur-
veys, check off the numbers below:
survey# 1-10 survey# 31-40
survey# 11-20 survey# 41-50
survey# 21-30 survey# 51-60
32
survey# 61-70
survey# 71-80
survey# 81-90
42 COPYRIGHT © 1996
1
1
ENVIRONMENTAL SCIENCE UNIT
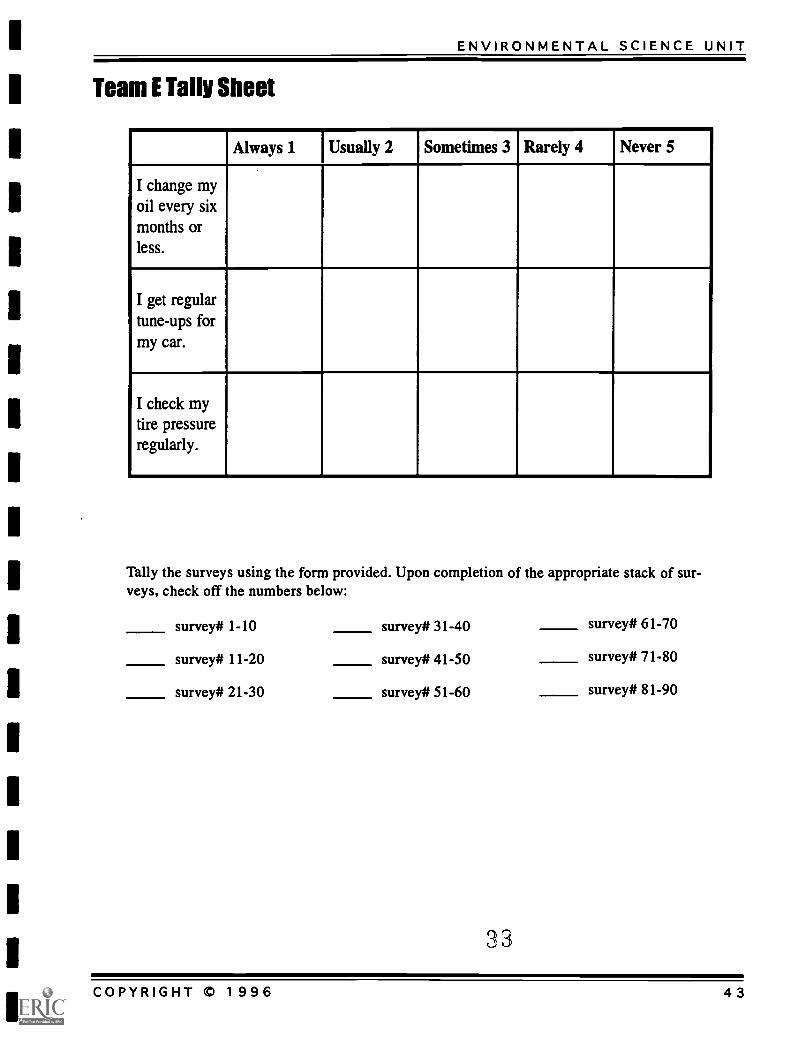
Team E Tally Sheet
Always 1 Usually 2 Sometimes 3 Rarely 4 Never 5
I change myoil every sixmonths orless.
I get regulartune-ups formy car.
I check mytire pressureregularly.
Tally the surveys using the form provided. Upon completion of the appropriate stack of sur-veys, check off the numbers below:
survey# 1-10 survey# 31-40 survey# 61-70
survey# 11-20 survey# 41-50 survey# 71-80
survey# 21-30 survey# 51-60 survey# 81-90
33
COPYRIGHT C 1996 43
OZONE: DOES IT AFFECT ME?
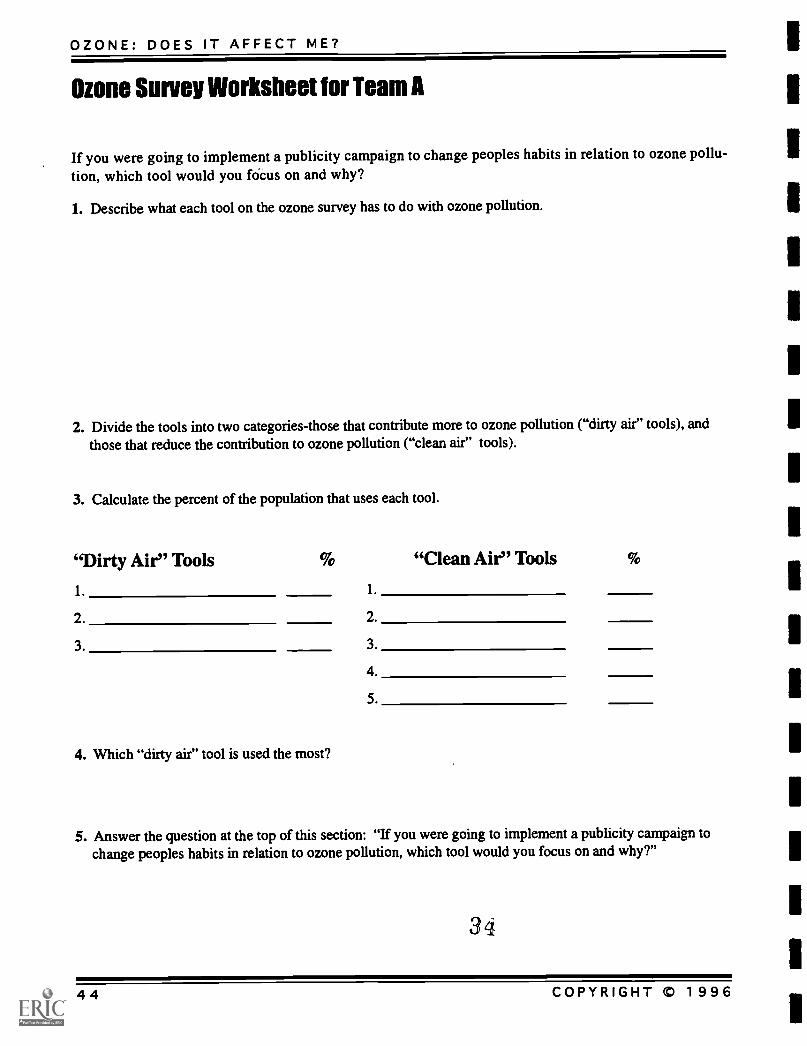
Ozone Survey Worksheet for Team A
If you were going to implement a publicity campaign to change peoples habits in relation to ozone pollu-tion, which tool would you fOcus on and why?
1. Describe what each tool on the ozone survey has to do with ozone pollution.
2. Divide the tools into two categories-those that contribute more to ozone pollution ("dirty air" tools), andthose that reduce the contribution to ozone pollution ("clean air" tools).
3. Calculate the percent of the population that uses each tool.
"Dirty Air" Tools
1
"Clean Air" Tools
1.
2. 2.
3. 3.
4. Which "dirty air" tool is used the most?
4.
5.
5. Answer the question at the top of this section: "If you were going to implement a publicity campaign tochange peoples habits in relation to ozone pollution, which tool would you focus on and why?"
34
44 COPYRIGHT 0 1996
ENVIRONMENTAL SCIENCE UNIT
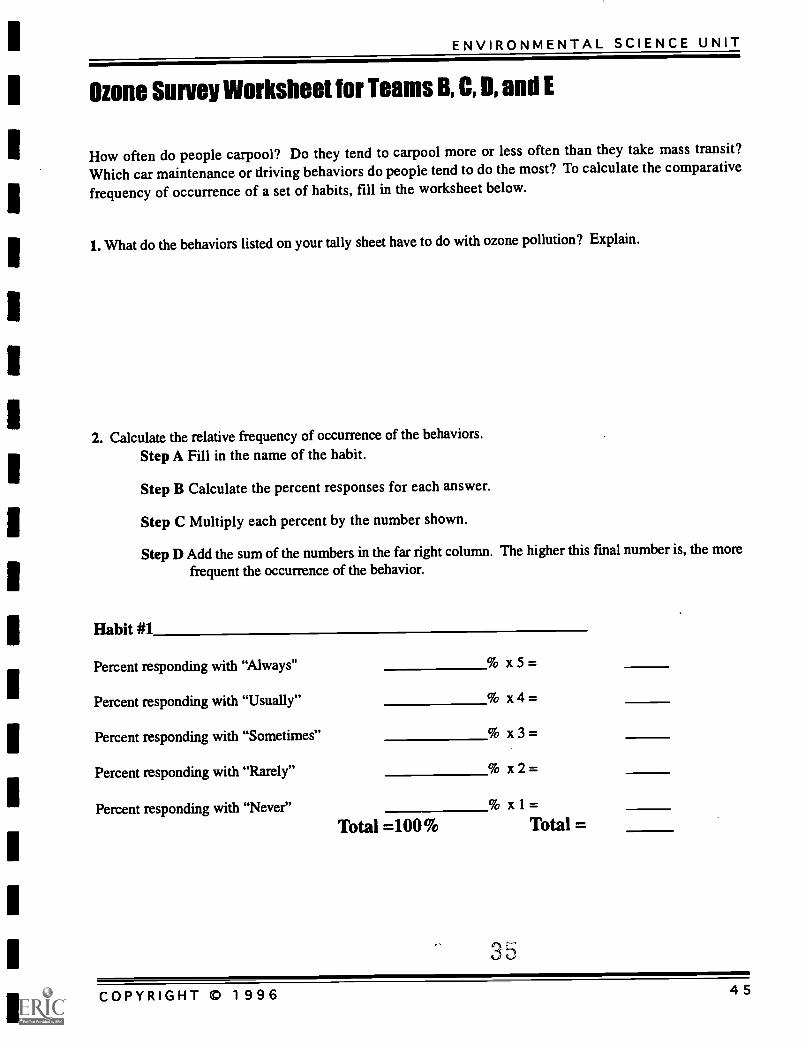
Ozone Survey Worksheet for Teams B, C, 11, and E
How often do people carpool? Do they tend to carpool more or less often than they take mass transit?
Which car maintenance or driving behaviors do people tend to do the most? To calculate the comparativefrequency of occurrence of a set of habits, fill in the worksheet below.
1. What do the behaviors listed on your tally sheet have to do with ozone pollution? Explain.
2. Calculate the relative frequency of occurrence of the behaviors.
Step A Fill in the name of the habit.
Step B Calculate the percent responses for each answer.
Step C Multiply each percent by the number shown.
Step D Add the sum of the numbers in the far right column. The higher this final number is, the more
frequent the occurrence of the behavior.
Habit #1
Percent responding with "Always" % x 5 =
Percent responding with "Usually" % x 4 =
Percent responding with "Sometimes" % x 3 =
Percent responding with "Rarely" % x 2 =
Percent responding with "Never" % x 1 =
Total =100% Total =
35
COPYRIGHT m 1996 45
OZONE: DOES IT AFFECT ME?
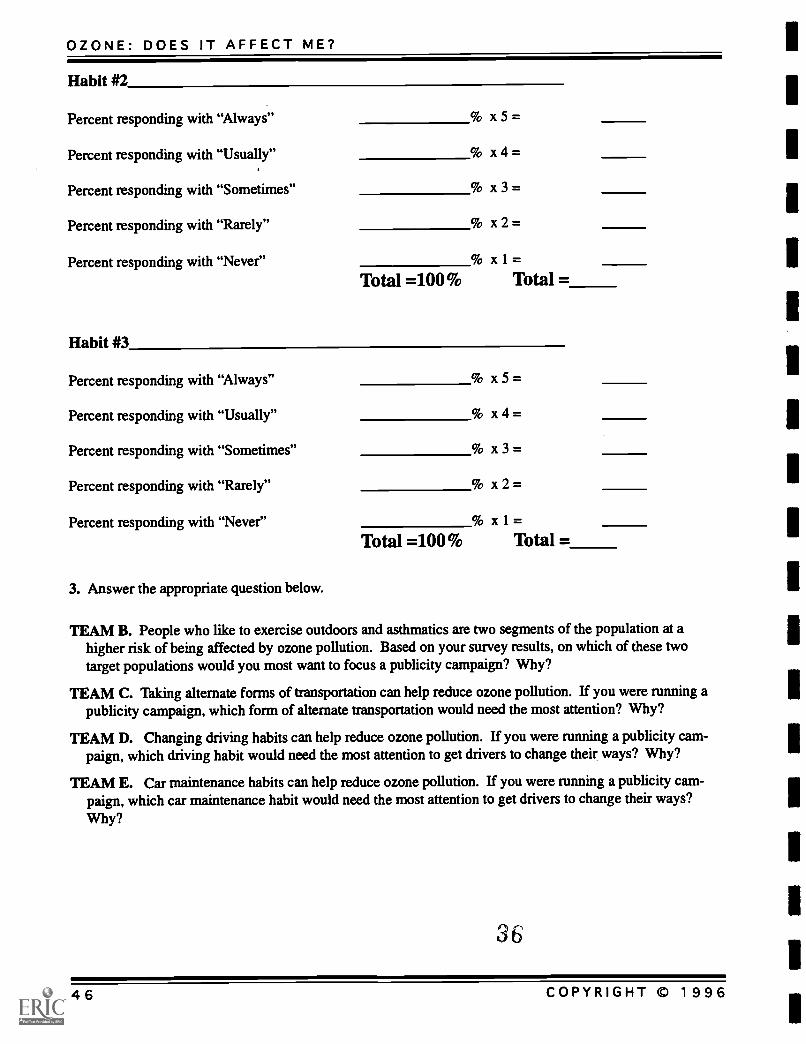
Habit #2
Percent responding with "Always" % x 5 =
Percent responding with "Usually" % x 4 =
Percent responding with "Sometimes" % x 3 =
Percent responding with "Rarely" % x 2 =
Percent responding with "Never" % x 1=Total =100% Total =
Habit #3
Percent responding with "Always"
Percent responding with "Usually"
Percent responding with "Sometimes"
Percent responding with "Rarely"
Percent responding with "Never"
3. Answer the appropriate question below.
% x5=
% x4=
% x3=
% x2=
% x 1 =Total =100% Total =
TEAM B. People who like to exercise outdoors and asthmatics are two segments of the population at ahigher risk of being affected by ozone pollution. Based on your survey results, on which of these twotarget populations would you most want to focus a publicity campaign? Why?
TEAM C. Taking alternate forms of transportation can help reduce ozone pollution. If you were running apublicity campaign, which form of alternate transportation would need the most attention? Why?
TEAM D. Changing driving habits can help reduce ozone pollution. If you were running a publicity cam-paign, which driving habit would need the most attention to get drivers to change their ways? Why?
TEAM E. Car maintenance habits can help reduce ozone pollution. If you were running a publicity cam-paign, which car maintenance habit would need the most attention to get drivers to change their ways?Why?
.6
46 COPYRIGHT © 1996
ENVIRONMENTAL SCIENCE UNIT
Ozone Survey TEACHER BACKGROUND
Students will collect andanalyze data related tothe impact of individualson ozone pollution.
Parents will increase theirawareness of their per-sonal impact on ozonepollution, and of the unittheir son or daughter isstudying.
Students will list waysthat their personalactions might affectozone pollution in thelower atmosphere.
;At
ozone survey sheets'index cards
computer spreadsheet,program (optional)
Data Analysis
Procedure1. Have students fill out the ozone survey, then send home the letter
and survey for parents to fill out.
2. When the surveys have been collected, number the surveys thendivide the students into teams of two or three. Give each team oneof the following problems to solve, and the corresponding tally
sheet and worksheet.
A. If you were going to implement a publicity campaign tochange peoples habits, which tool would you focus on and why?
B. People who like to exercise outdoors and asthmatics are twosegments of the population at a higher risk of being affected by
ozone pollution. Based on your survey results, on which of these
two target populations would you most want to focus a publicity
campaign? Why?
C. Taking alternate forms of transportation can help reduce ozonepollution. If you were running a publicity campaign, which formof alternate transportation would need the most attention?
D. Changing driving habits can help reduce ozone pollution. Ifyou were running a publicity campaign, which driving habit wouldneed the most attention to get drivers to change their ways?
E. Car maintenance habits can help reduce ozone pollution. Ifyou were running a publicity campaign, which car maintenancehabit would need the most attention to get drivers to change their
ways?
3. As a culminating exercise, have students fill out index cards withtheir ideas or ideas from the survey about sources of and solutionsto ozone pollution, add their names to the cards, and place the
cards in the "Sources" and "Solutions" shoe boxes.
COPYRIGHT OD 1996
BEST COPY AVAILABLE
47
OZONE: DOES IT AFFECT ME?
4. As an optional extension of this exercise, have students create pie
graphs by hand or with a computer to create a visual display of
the relative frequency of each behavior. A further extension can
be to have students create posters based on their analysis of the
surveys, and post them around the school.
5. A sample letter to parents to send home with students along with
the surveys given below.
Letter to Parents
Dear Parent or Guardian:
The enclosed survey is part of a unit on ozone that we will bestudying in Environmental Science class this semester. The
ozone unit will include an emphasis on laboratory work andusing computers to analyze data and communicate results.
Please fill out the survey and return it to your son or daughter
to bring back to school. There are no "right" answers. Just fillit out as accurately as possible. The students will be respon-sible for tallying and analyzing the results of the survey.
Please do not put your name on the survey.
Thank you very much for your participation and assistance inhelping to make this project a success.
Sincerely,
3848 COPYRIGHT © 1996
ENVIRONMENTAL SCIENCE UNIT
Now Do You Contribute to Ozone Pollution?
Analyze data related toyour personal contributionto air pollution from elec-tricity consumption
Use critical thinking skillsto create a plan for reduc-ing the contribution ofautomobiles to ozone pol-lution.
handoutsyour homecalculator
Name:
Date:
Period:
Instructions:Electricity
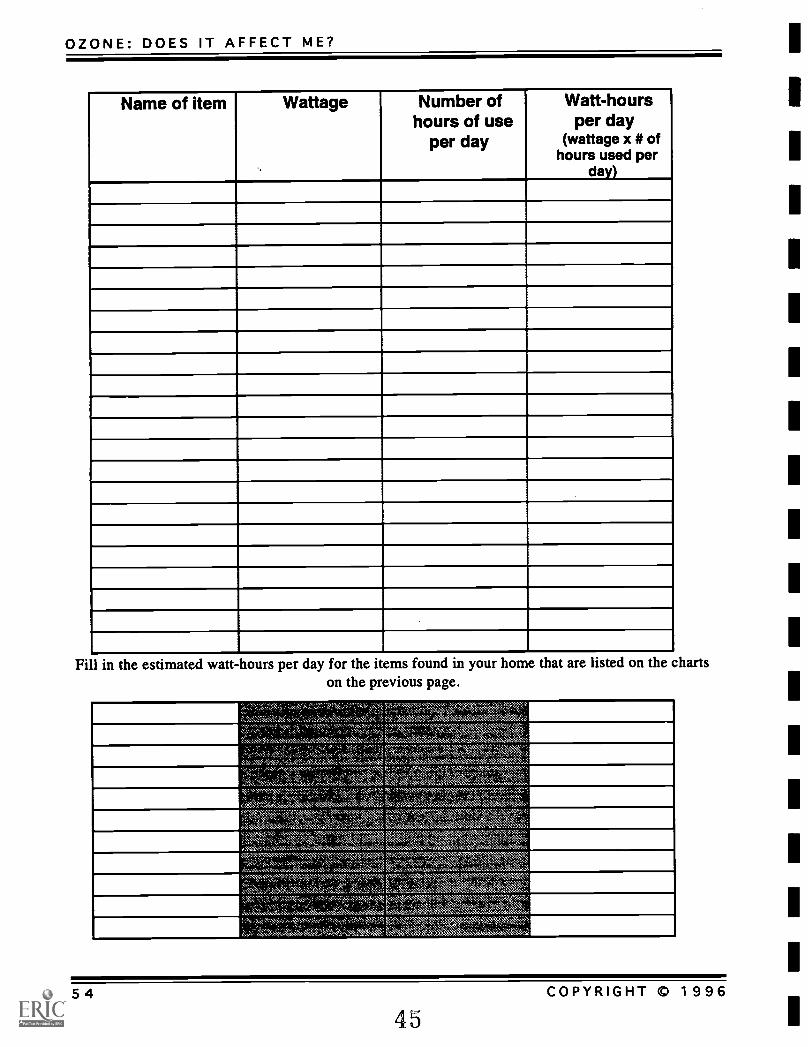
1. Conduct a survey of your home. Going room by room, make a
list of all the items that use electricity.
2. Record the wattage of each appliance. The wattage refers to the
amount of power that the appliance uses. The wattage is usuallylisted somewhere on the back of, or underneath, the appliance. Ifthe wattage is not listed, the voltage and amperes should be. To
calculate wattage, multiply the voltage by the amperes:
volts x amps = watts
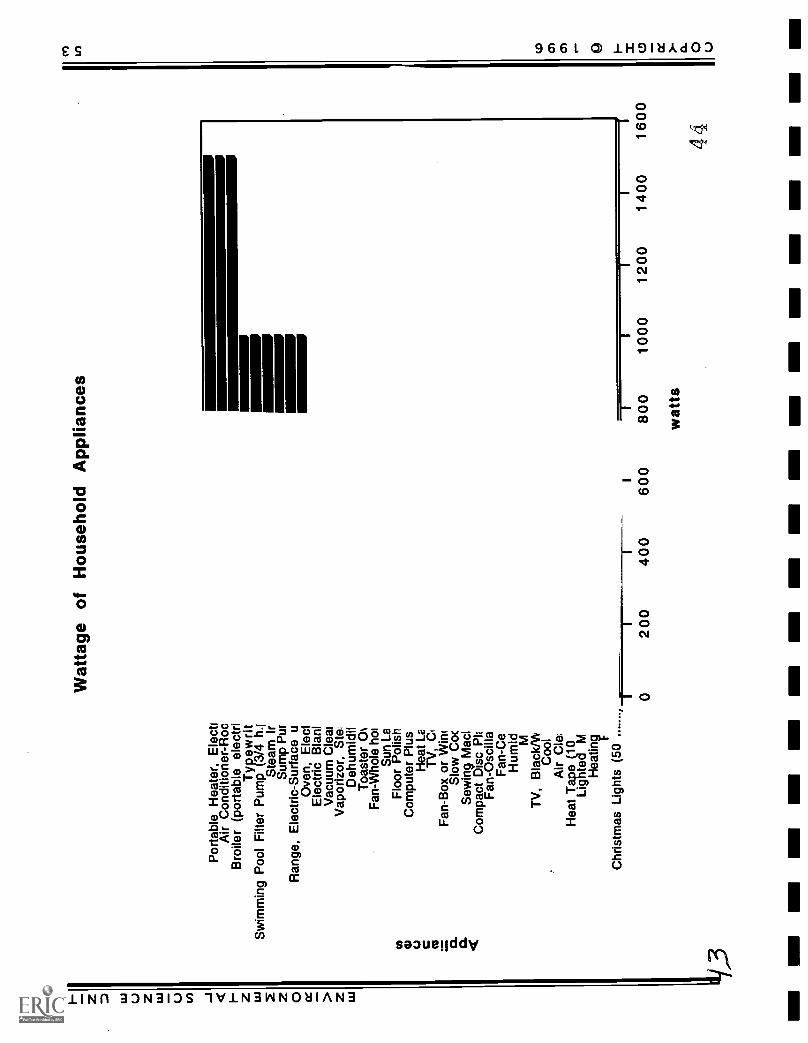
Or, refer to the graph with the title "Wattage of Common House-hold Appliances".
You will need to look at each light bulb in your house to determinethe wattage. Most light bulbs are 40-100 watts. Add up the totalwatts used for lighting in each room.
3. Record how much time each electric appliance or light bulb isused during a 24 hour period.
4. Calculate the watt-hours for each electric appliance or light bulbby multiplying the number of watts times the number of hoursused.
5. Add up the total number of watt-hours per day for all the electricappliances in your home.
6. A kilowatt-hour equals 1000 watt-hours. How many kilowatt-hours are used in your home per day?
39COPYRIGHT C 1996 49
OZONE: DOES IT AFFECT ME?
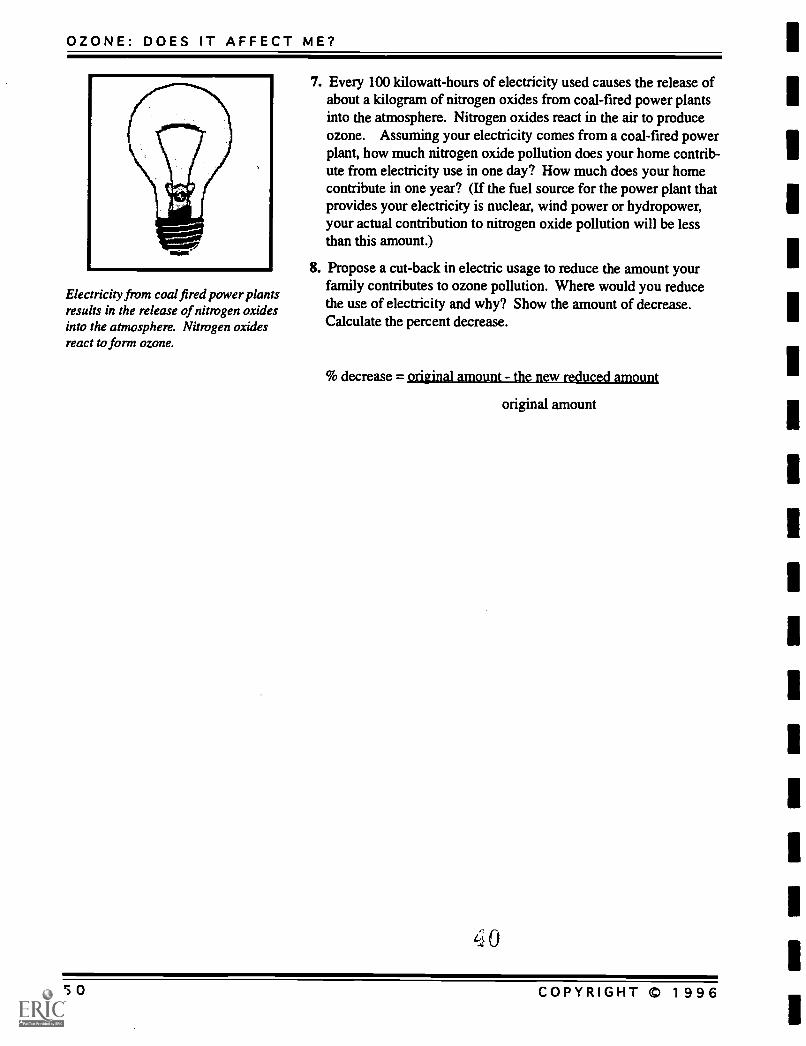
Electricity from coal fired power plantsresults in the release of nitrogen oxidesinto the atmosphere. Nitrogen oxidesreact to form ozone.
7. Every 100 kilowatt-hours of electricity used causes the release ofabout a kilogram of nitrogen oxides from coal-fired power plantsinto the atmosphere. Nitrogen oxides react in the air to produceozone. Assuming your electricity comes from a coal-fired powerplant, how much nitrogen oxide pollution does your home contrib-ute from electricity use in one day? How much does your homecontribute in one year? (If the fuel source for the power plant thatprovides your electricity is nuclear, wind power or hydropower,your actual contribution to nitrogen oxide pollution will be lessthan this amount.)
8. Propose a cut-back in electric usage to reduce the amount yourfamily contributes to ozone pollution. Where would you reducethe use of electricity and why? Show the amount of decrease.Calculate the percent decrease.
% decrease = original amount - the new reduced amount
original amount
4 0
50 COPYRIGHT © 1996
ENVIRONMENTAL SCIENCE UNIT
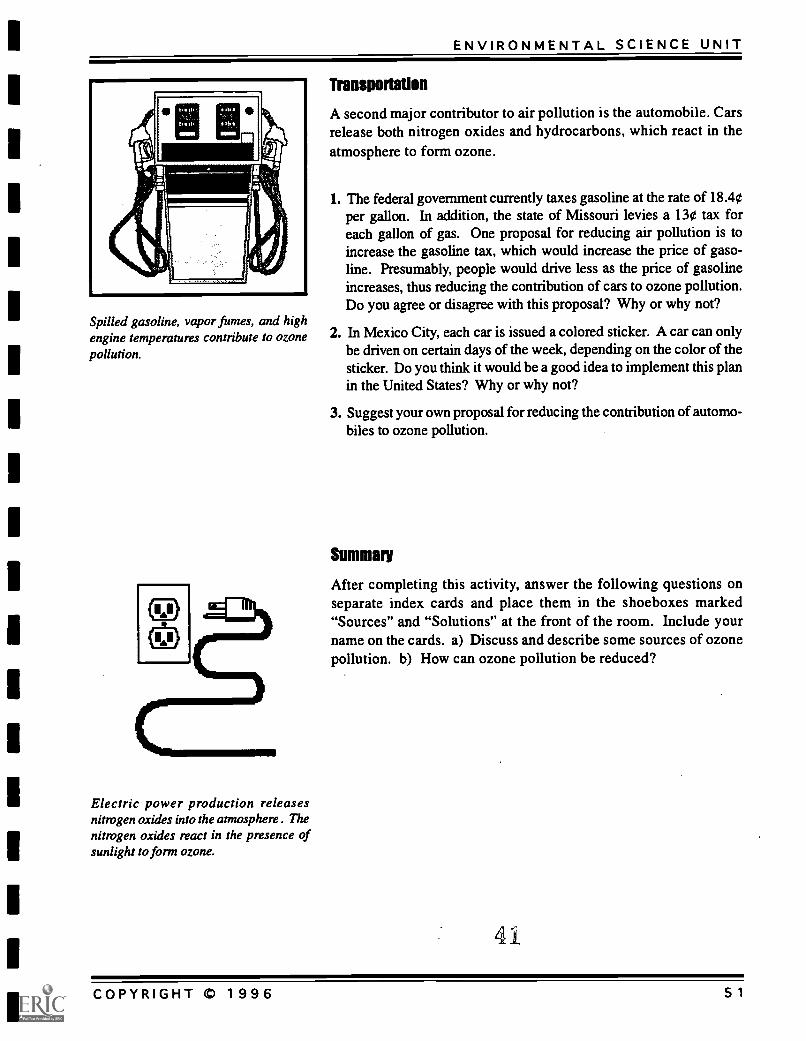
Spilled gasoline, vapor fumes, and highengine temperatures contribute to ozonepollution.
sat
Electric power production releasesnitrogen oxides into the atmosphere . Thenitrogen oxides react in the presence ofsunlight to form ozone.
Transportation
A second major contributor to air pollution is the automobile. Carsrelease both nitrogen oxides and hydrocarbons, which react in theatmosphere to form ozone.
1. The federal government currently taxes gasoline at the rate of 18.40per gallon. In addition, the state of Missouri levies a 130 tax foreach gallon of gas. One proposal for reducing air pollution is toincrease the gasoline tax, which would increase the price of gaso-line. Presumably, people would drive less as the price of gasolineincreases, thus reducing the contribution of cars to ozone pollution.Do you agree or disagree with this proposal? Why or why not?
2. In Mexico City, each car is issued a colored sticker. A car can onlybe driven on certain days of the week, depending on the color of thesticker. Do you think it would be a good idea to implement this planin the United States? Why or why not?
3. Suggest your own proposal for reducing the contribution of automo-biles to ozone pollution.
Summary
After completing this activity, answer the following questions onseparate index cards and place them in the shoeboxes marked"Sources" and "Solutions" at the front of the room. Include yourname on the cards. a) Discuss and describe some sources of ozonepollution. b) How can ozone pollution be reduced?
41
COPYRIGHT 0 1996 51
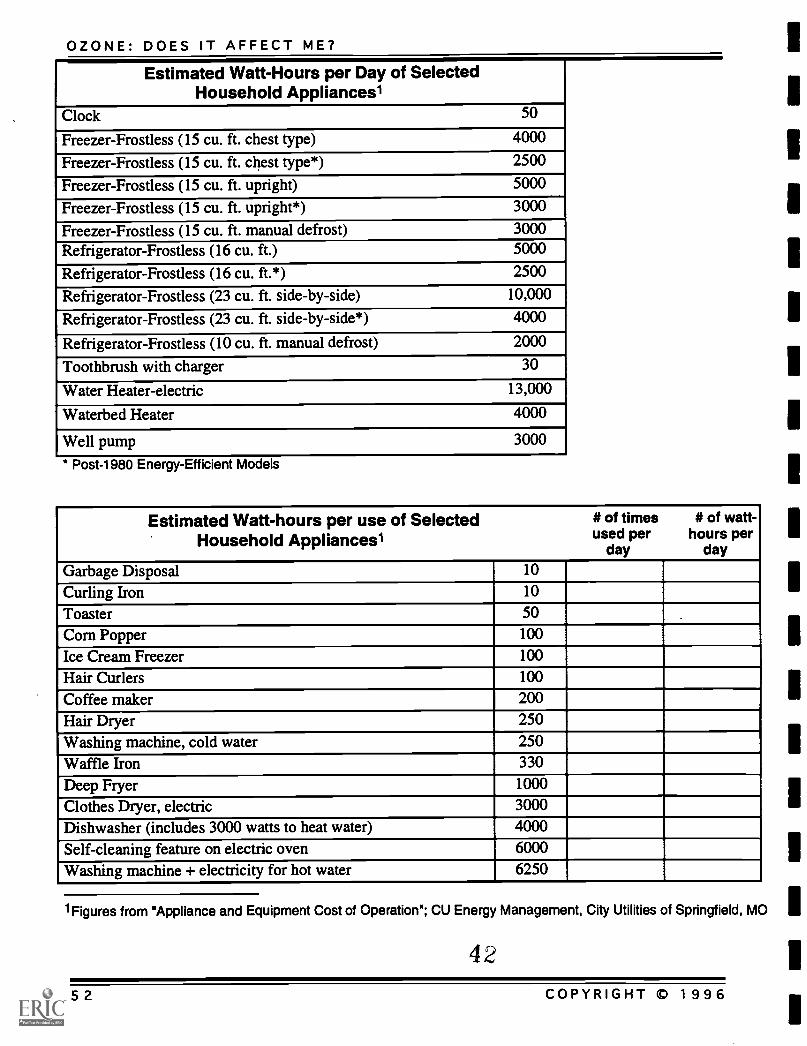
OZONE: DOES IT AFFECT ME?_Estimated Watt-Hours per Day of Selected
Household Appliances1Clock 50
Freezer-Frostless (15 cu. ft. chest type) 4000
Freezer-Frostless (15 cu. ft. chest type*) 2500
Freezer-Frostless (15 cu. ft. upright) 5000
Freezer-Frostless (15 cu. ft. upright*) 3000
Freezer-Frostless (15 cu. ft. manual defrost) 3000Refrigerator-Frostless (16 cu. ft.) 5000
Refrigerator-Frostless (16 cu. ft.*) 2500
Refrigerator-Frostless (23 cu. ft. side-by-side) 10,000
Refrigerator-Frostless (23 cu. ft. side-by-side*) 4000
Refrigerator-Frostless (10 cu. ft. manual defrost) 2000
Toothbrush with charger 30
Water Heater-electric 13,000
Waterbed Heater 4000
Well pump 3000
* Post-1980 Energy-Efficient Models
Estimated Watt-hours per use of Selected # of times # of watt-
Household Appliances1 used per hours perday day
Garbage Disposal 10
Curling Iron 10
Toaster 50
Corn Popper 100
Ice Cream Freezer 100
Hair Curlers 100
Coffee maker 200
Hair Dryer 250Washing machine, cold water 250
Waffle Iron 330
Deep Fryer 1000
Clothes Dryer, electric 3000
Dishwasher (includes 3000 watts to heat water) 4000Self-cleaning feature on electric oven 6000Washing machine + electricity for hot water 6250
1Figures from "Appliance and Equipment Cost of Operation"; CU Energy Management, City Utilities of Springfield, MO
42
52 COPYRIGHT 0 1996
1
1
1
z U z U tn -JP
orta
ble
Hea
ter,
Ele
cti
Air
Con
ditio
ner-
Roc
Bro
iler
(por
tabl
e el
ectr
iT
ypew
ritS
wim
min
g P
ool F
ilter
Pum
p (3
/4S
team
IrS
ump
Pur
OR
ange
, Ele
ctric
-Sur
face
ucc
Ove
n, E
lect
Ele
ctric
Bla
nlV
acuu
m C
lem
zV
apor
izor
, Ste
,D
ehum
idit
Toa
ster
01
Fan
-Who
le h
oiS
un L
aF
loor
Pol
ish
Com
pute
r P
lus
Hea
t LE
TV
, CI
Fan
-Box
or
Win
(a.
Slo
w C
o(Q
.S
ewin
g M
acl
Com
pact
Dis
c P
hF
an-O
scill
aF
an-C
eH
umid M
TV
, Bla
ckP
AC
ool
Air
Cie
.H
eat T
a(1
0Li
ghte
d M
Hea
ting
Chr
istm
as L
ight
s (5
0.,
Wat
tage
of H
ouse
hold
App
lianc
es
rI
II
II
II
020
040
060
080
010
0012
0014
0016
00
wat
ts
44
ca cr)
rn 0 I c.9
cc >- a. 0 U
=I N
MI M
N M
N M
EI
MN
IMIM
II O
M M
I 1 N
M IM
M
I
I I
I I. I- I 10 I
I I
I c»
,
ENVIRONMENTAL SCIENCE UNIT
Now Do YouContribute to OzonePollution TEACHER BACKGROUND
VAE
Students will analyze datarelated to their personalcontribution to air pollu-tion from electricity con-sumption.
Students will use criticalthinking skills to create aplan for reducing the con-tribution of automobiles toozone, pollution.
'handouts`',student's 'home
calculator
Data Analysis',Problem Solving
This activity can be completed as a homework assignment, or as a
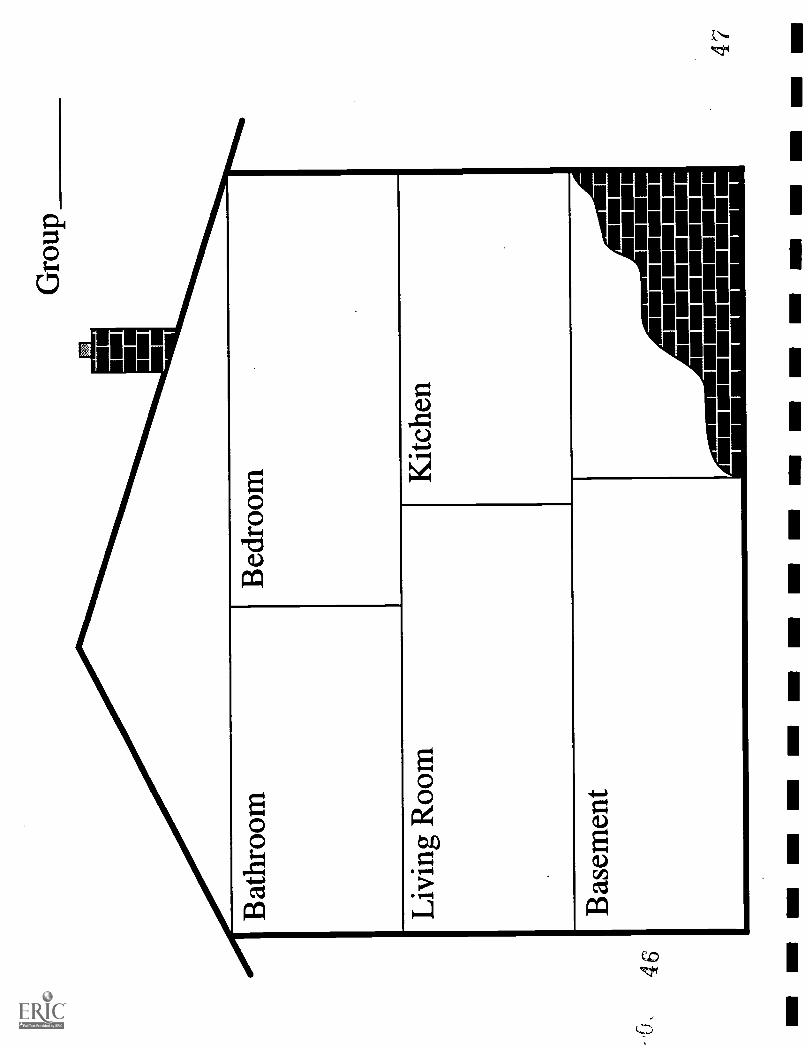
class activity. If done as a class activity, the class can create a"composite home" with each small group identifying the approxi-
mate number and type of appliances located in their assigned room.The rooms can then be assembled into a composite home, and the
calculations run accordingly.
COPYRIGHT C 1996 57
48
ENVIRONMENTAL SCIENCE UNIT
Sources of Ozone-Related Pollution
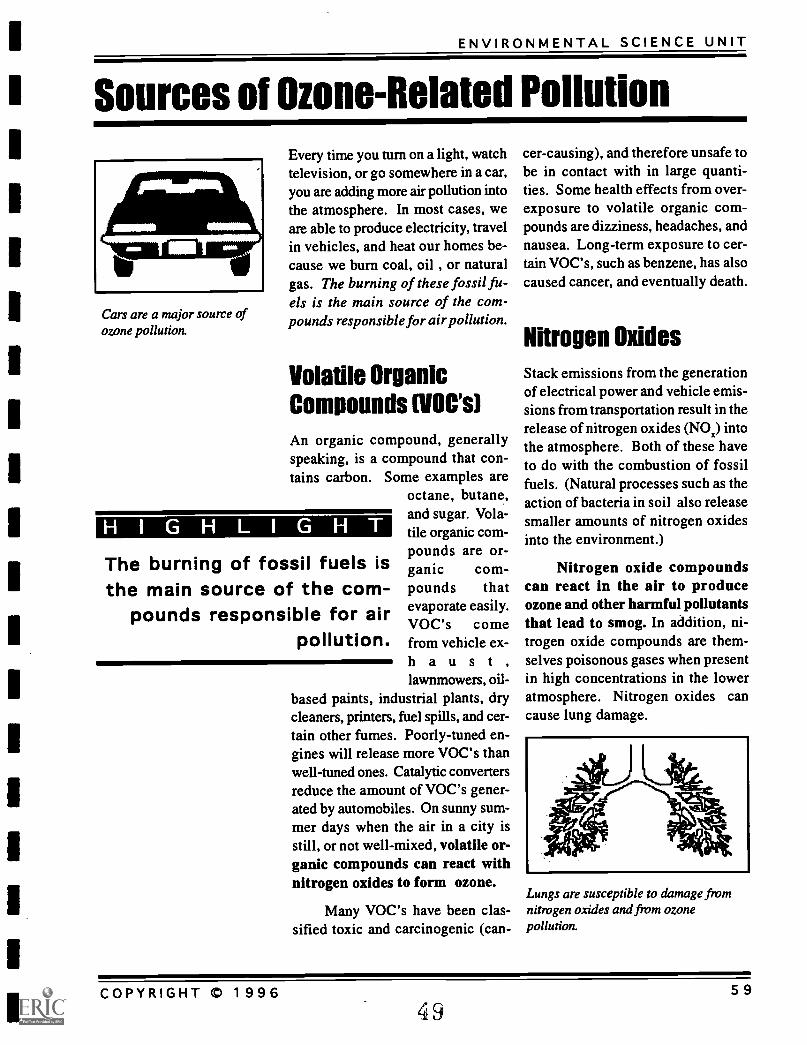
Cars are a major source ofozone pollution.
Every time you turn on a light, watchtelevision, or go somewhere in a car,you are adding more air pollution intothe atmosphere. In most cases, weare able to produce electricity, travelin vehicles, and heat our homes be-cause we burn coal, oil , or naturalgas. The burning of these fossil fu-els is the main source of the com-pounds responsible for air pollution.
Volatile OrganicCompounds (NC's)An organic compound, generallyspeaking, is a compound that con-tains carbon. Some examples are
octane, butane,and sugar. Vola-tile organic com-pounds are or-ganic com-pounds thatevaporate easily.VOC's comefrom vehicle ex-haust,lawnmowers, oil-
based paints, industrial plants, drycleaners, printers, fuel spills, and cer-tain other fumes. Poorly-tuned en-gines will release more VOC's thanwell-tuned ones. Catalytic convertersreduce the amount of VOC's gener-ated by automobiles. On sunny sum-mer days when the air in a city isstill, or not well-mixed, volatile or-ganic compounds can react withnitrogen oxides to form ozone.
Many VOC's have been clas-sified toxic and carcinogenic (can-
Thethe
burning of fossil fuels ismain source of the com-
pounds responsible for airpollution.
cer-causing), and therefore unsafe tobe in contact with in large quanti-ties. Some health effects from over-exposure to volatile organic com-pounds are dizziness, headaches, andnausea. Long-term exposure to cer-tain VOC's, such as benzene, has alsocaused cancer, and eventually death.
Nitrogen OxidesStack emissions from the generationof electrical power and vehicle emis-sions from transportation result in therelease of nitrogen oxides (N0x) intothe atmosphere. Both of these haveto do with the combustion of fossilfuels. (Natural processes such as theaction of bacteria in soil also releasesmaller amounts of nitrogen oxidesinto the environment.)
Nitrogen oxide compoundscan react in the air to produceozone and other harmful pollutantsthat lead to smog. In addition, ni-trogen oxide compounds are them-selves poisonous gases when presentin high concentrations in the loweratmosphere. Nitrogen oxides cancause lung damage.
Lungs are susceptible to damage fromnitrogen oxides and from ozonepollution.
COPYRIGHT 0 199649
59
OZONE: DOES IT AFFECT ME?
'1977 data from: Wark, Kand C. E Warner. 1981. AirPollution -Its Origin andControl, 2nd ed. New York:Harper and Row.
1987 data from: Godish, T1991. Air Quality, 2nd ed.Chelsea, MI: Lewis.
Do gases havemass?
Yes they do.Different gaseshave differentmasses. Some
are heavier thanothers
Before
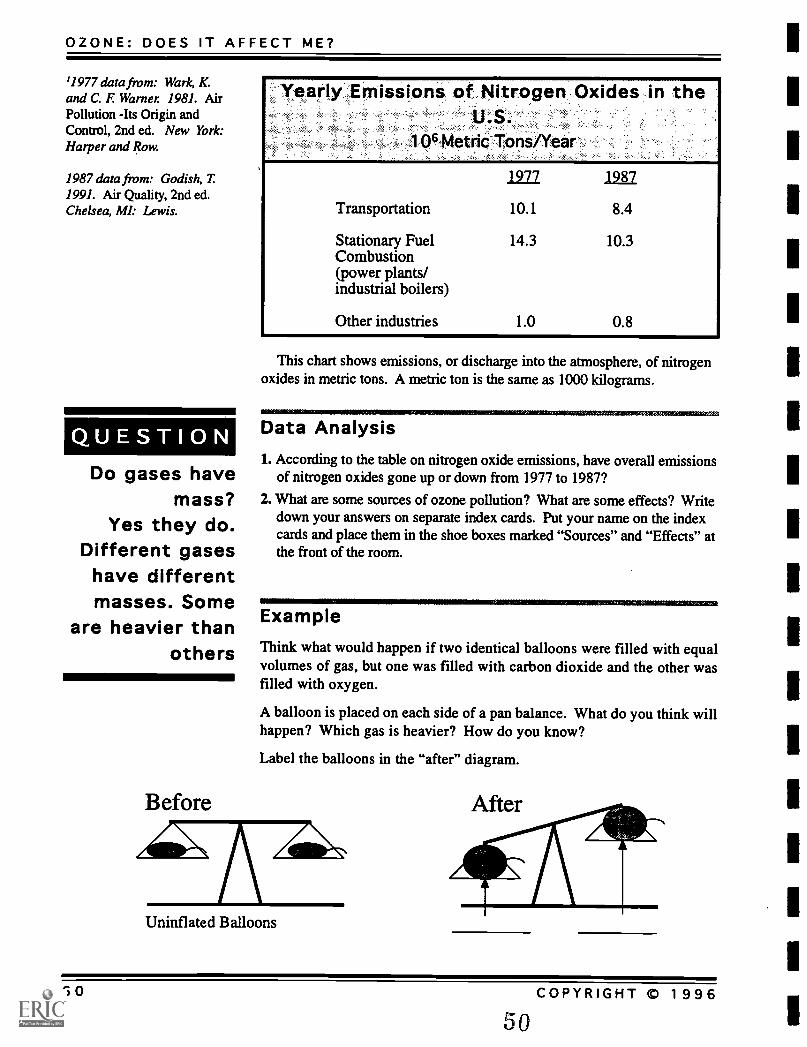
Yearly Emissions of Nitrogen Oxides in theU.S.
106 Metric Tons/Year
Transportation
Stationary FuelCombustion(power plants/industrial boilers)
Other industries
1977
10.1
14.3
1987
8.4
10.3
1.0 0.8
This chart shows emissions, or discharge into the atmosphere, of nitrogenoxides in metric tons. A metric ton is the same as 1000 kilograms.
Data Analysis1. According to the table on nitrogen oxide emissions, have overall emissions
of nitrogen oxides gone up or down from 1977 to 1987?
2. What are some sources of ozone pollution? What are some effects? Writedown your answers on separate index cards. Put your name on the indexcards and place them in the shoe boxes marked "Sources" and "Effects" atthe front of the room.
Example
Think what would happen if two identical balloons were filled with equalvolumes of gas, but one was filled with carbon dioxide and the other wasfilled with oxygen.
A balloon is placed on each side of a pan balance. What do you think willhappen? Which gas is heavier? How do you know?
Label the balloons in the "after" diagram.
Uninflated Balloons
60 COPYRIGHT m 1996
50
ENVIRONMENTAL SCIENCE UNIT
Concept Mapping
Demonstrate an under-standing of the relation-ships between conceptsrelated to ozone.
Ozone Concept MapWorksheet
Name:
Date:
Period:
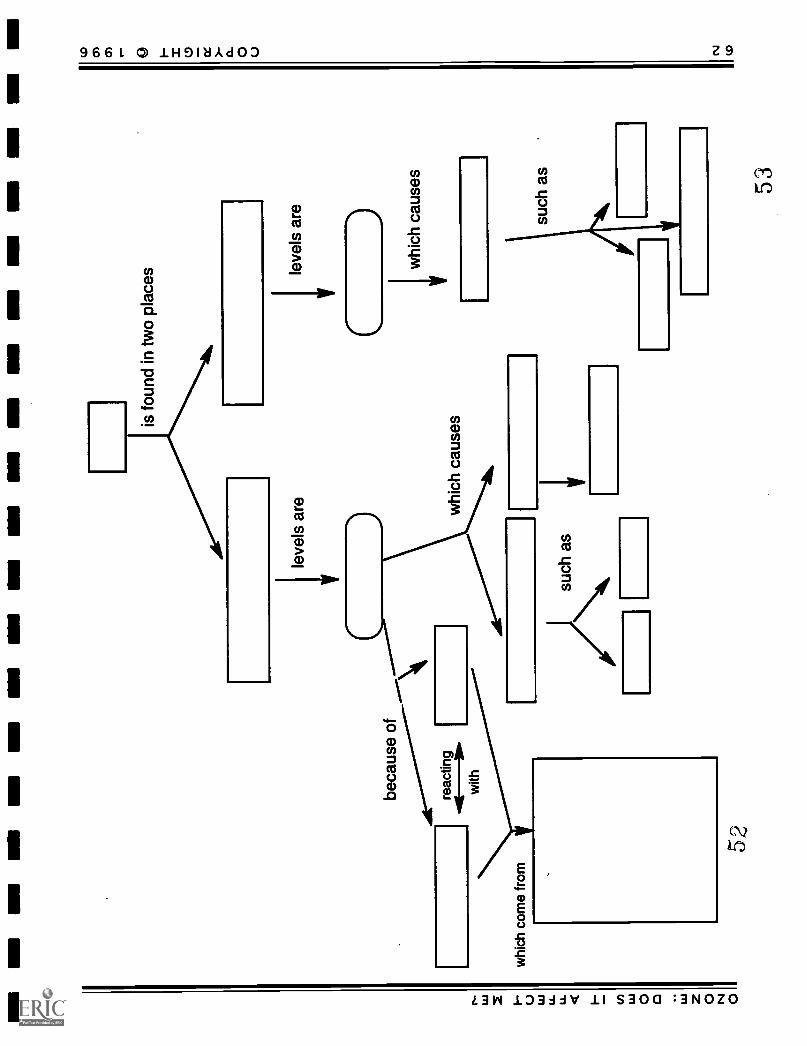
InstructionsPlace the words below in the appropriate place in the ozone concept
map worksheet.
carscataractsdamage to materialsdecreasingdry cleanerselectricityfuel spilshealth effectshealth effectsimmune deficiencyincreasingindustrial plants
lawnmowerslung damagenitrogen oxidesnylonoil-based paintsozonerubberskin cancerstratospheric ozonetropospheric ozoneVOC's
COPYRIGHT OD 1996 5161
NM
OM
EM
II=
MN
MN
MI M
IN M
NI=
=I
NM
C.- W X I- U W U.
U. < 4 W 0 0 W Z 0 N 0
beca
use
of
is fo
und
in tw
o pl
aces
leve
ls a
re
reac
ting
I---
30-
with
whi
ch c
ome
from
52
such
as
N
...
I
whi
ch c
ause
s
leve
ls a
re
C)
whi
ch c
ause
s
such
as
53
N CO
ENVIRONMENTAL SCIENCE UNIT
Concept Mapping TEACHER BACKGROUND
Demonstrate an under-standing of the relation-ships between conceptsrelated to ozone.
Ozone Concept MapWorksheet
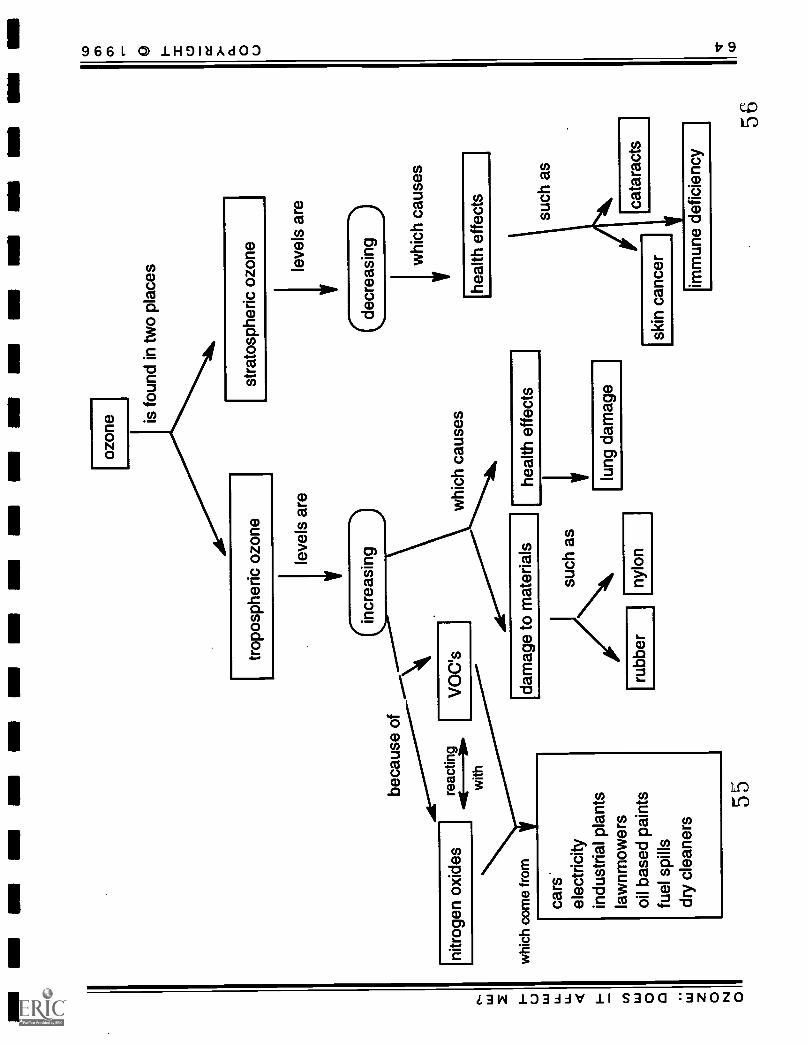
On the following page is the correctly filled in concept map.
54
COPYRIGHT C 1996 63
MO
IMI O
MIN
MI I
n O
MM
I MN
NM
NM
INN
ui X I- U im LL U- < t.- tr)
W 0 0 .. iu z 0 N 0
nitr
ogen
oxi
des
beca
use
of
ozon
e is fo
und
in tw
o pl
aces
trop
osph
eric
ozo
ne
leve
ls a
re
reac
ting
IIE-3
0-w
ith
whi
ch c
ome
from
cars
'el
ectr
icity
indu
stria
l pla
nts
law
nmow
ers
oil b
ased
pai
nts
fuel
spi
llsdr
y cl
eane
rs
55
VO
C's
whi
ch c
ause
s
dam
age
to m
ater
ials
)suc
h as
Nru
bber
nylo
n
stra
tosp
heric
ozo
ne
heal
th e
ffect
s
lung
dam
age
leve
ls a
re
(dec
reas
ing
)w
hich
cau
ses
heal
th e
ffect
s
skin
can
cer
cata
ract
s
56T
r w
ENVIRONMENTAL SCIENCE UNIT
Effects On Materials
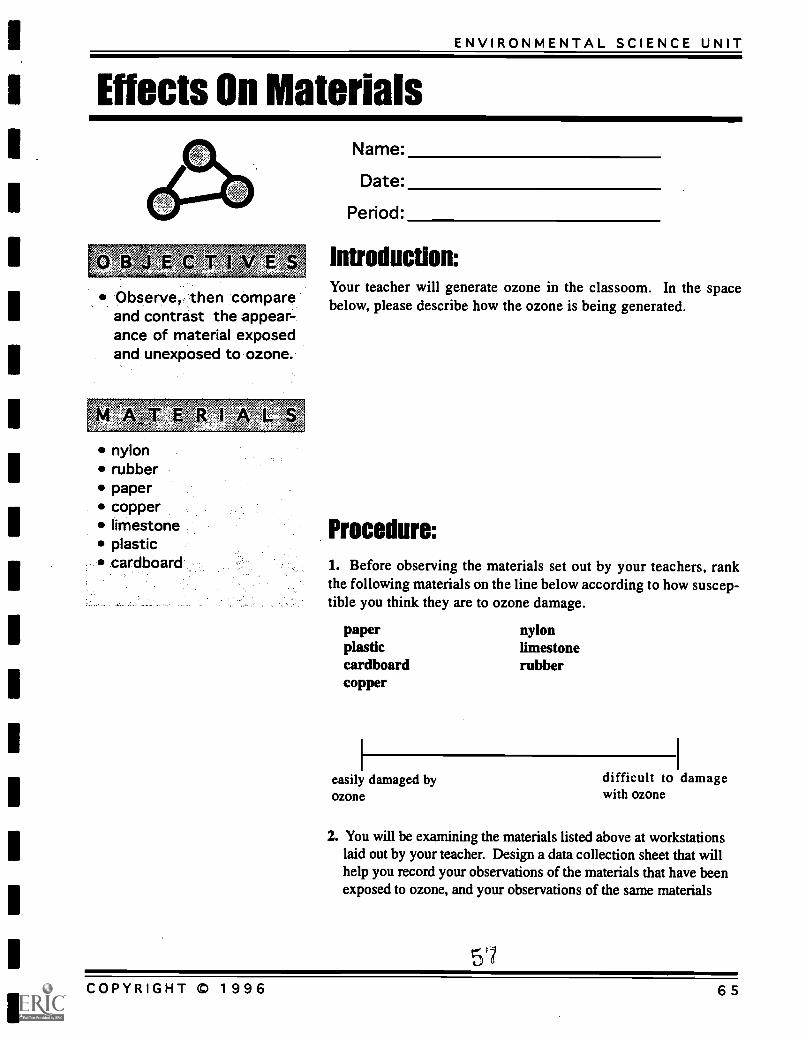
Observe, then compareand contrast the appear-ance of material exposedand unexposed to ozone.
nylonrubberpapercopperlimestone Procedure:plasticcardboard 1. Before observing the materials set out by your teachers, rank
the following materials on the line below according to how suscep-tible you think they are to ozone damage.
paper nylonplastic limestonecardboard rubbercopper
Name:
Date:
Period:
Introduction:Your teacher will generate ozone in the classoom. In the spacebelow, please describe how the ozone is being generated.
easily damaged byozone
difficult to damagewith ozone
2. You will be examining the materials listed above at workstationslaid out by your teacher. Design a data collection sheet that willhelp you record your observations of the materials that have beenexposed to ozone, and your observations of the same materials
COPYRIGHT 1996 65
OZONE: DOES IT AFFECT ME?
that have not been exposed to ozone.
3. Examine the materials laid out at stations by your teacher. Com-pare and contrast the items exposed to ozone and unexposed toozone. Do you notice any differences?
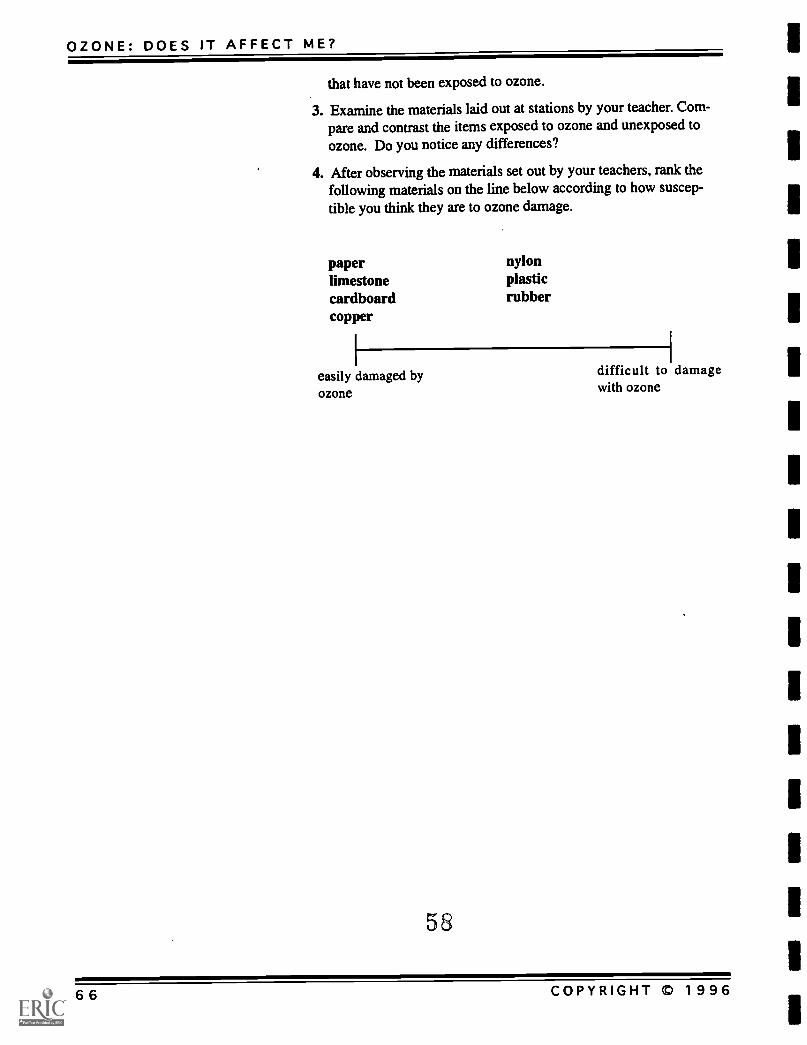
4. After observing the materials set out by your teachers, rank thefollowing materials on the line below according to how suscep-tible you think they are to ozone damage.
paper nylonlimestone plasticcardboard rubbercopper
easily damaged byozone
58
difficult to damagewith ozone
66 COPYRIGHT C 1996
I
I
II
I
I
I1
I
I
I1
I
I
I
I
I
I
I
ENVIRONMENTAL SCIENCE UNIT
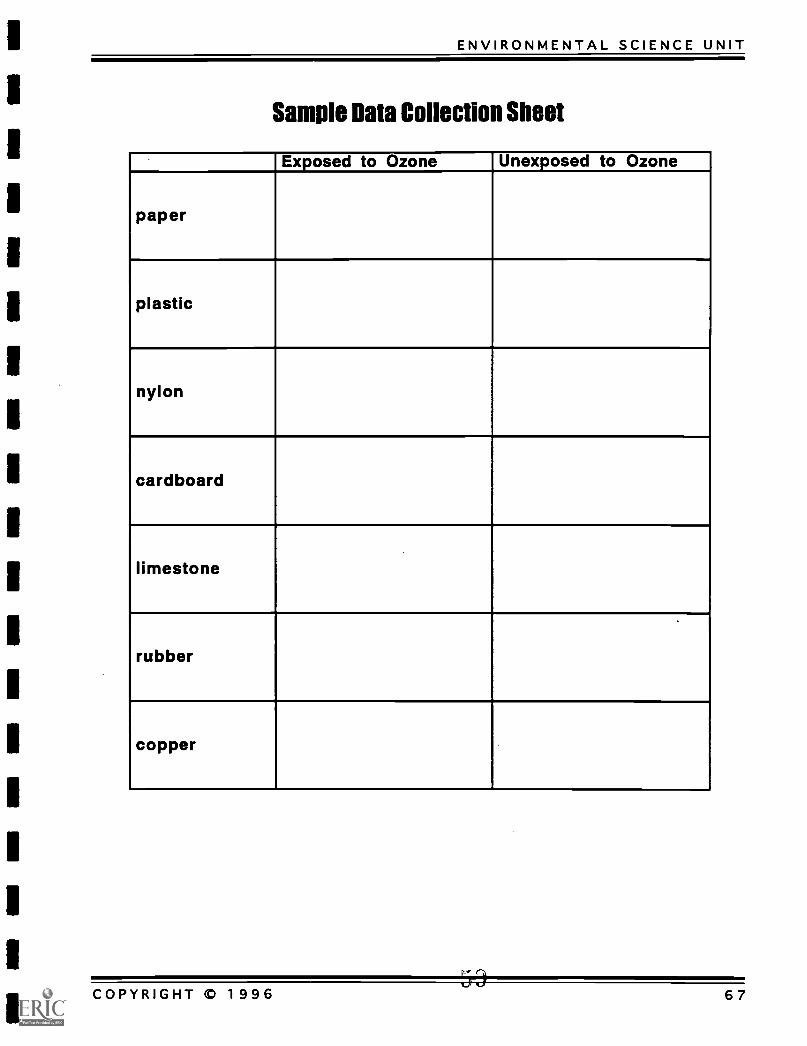
Sample Data Collection Sheet
Exposed to Ozone Unexposed to Ozone
paper
plastic
nylon
cardboard
limestone
rubber
copper
ro
COPYRIGHT 0 1996 67
ENVIRONMENTAL SCIENCE UNIT
Effects On Materials TEACHER BACKGROUND
Students, will observe, then .compare and contrast theappearance of material ex-posed and unexposed toozone.
1000 ml Erlenmeyer flaskTesla Coilwire with alligator clips oneach endcopper wireAluminum Foildissecting scopeslabelsnylonrubberpapercopperlimestoneplasticcardboard
Experimental Design.
Notes and Expected Outcomes:
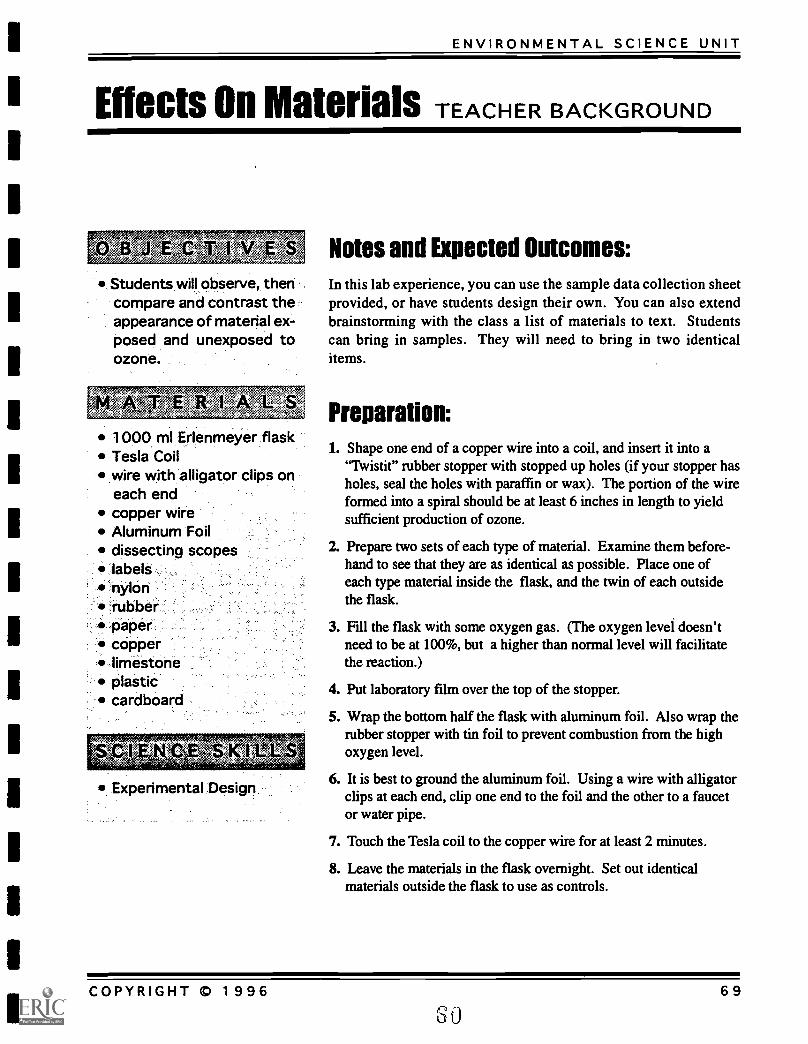
In this lab experience, you can use the sample data collection sheetprovided, or have students design their own. You can also extendbrainstorming with the class a list of materials to text. Studentscan bring in samples. They will need to bring in two identicalitems.
Preparation:1. Shape one end of a copper wire into a coil, and insert it into a
wAvistit" rubber stopper with stopped up holes (if your stopper hasholes, seal the holes with paraffin or wax). The portion of the wireformed into a spiral should be at least 6 inches in length to yieldsufficient production of ozone.
2. Prepare two sets of each type of material. Examine them before-hand to see that they are as identical as possible. Place one ofeach type material inside the flask, and the twin of each outsidethe flask.
3. Fill the flask with some oxygen gas. (The oxygen level doesn'tneed to be at 100%, but a higher than normal level will facilitatethe reaction.)
4. Put laboratory film over the top of the stopper.
5. Wrap the bottom half the flask with aluminum foil. Also wrap therubber stopper with tin foil to prevent combustion from the highoxygen level.
6. It is best to ground the aluminum foil. Using a wire with alligatorclips at each end, clip one end to the foil and the other to a faucetor water pipe.
7. Touch the Tesla coil to the copper wire for at least 2 minutes.
8. Leave the materials in the flask overnight. Set out identicalmaterials outside the flask to use as controls.
COPYRIGHT © 1996 69
80
OZONE: DOES IT AFFECT ME?
Reference:Chan, Alan, Adele Gomez, Patricia Noel,& Ron Ulrich. 1991. Chemistry in theEnvironment Woodrow Wilson NationalFellowship Foundation
A
Goggles should be used forall laboratory work. Glovesmay 'be recommended.
Care should be taken toproperly dispose of allchemicals used in this ac-tivity.
Gases generated should bereleased with care (undera fume hood if possible).
There is an electrical haz-ard due to high voltage.Keep the Tesla coil un-plugged until ready for useand unplug immediatelyWhen finished.
Keep the flask containingozone'at arm's length, andavoid breathing the gas.
Inhaling small` quantities ofozone can irritate thelungs.
Asa basis for compari-son, the ozone NationalAmbient Air Quality Stan-dard is 0.12 ppm (by vol-ume)-for a one-hour timeperiod.
To avoid the risk of anexplosion= do not addany substances to ozoneother than those de-scribed here.
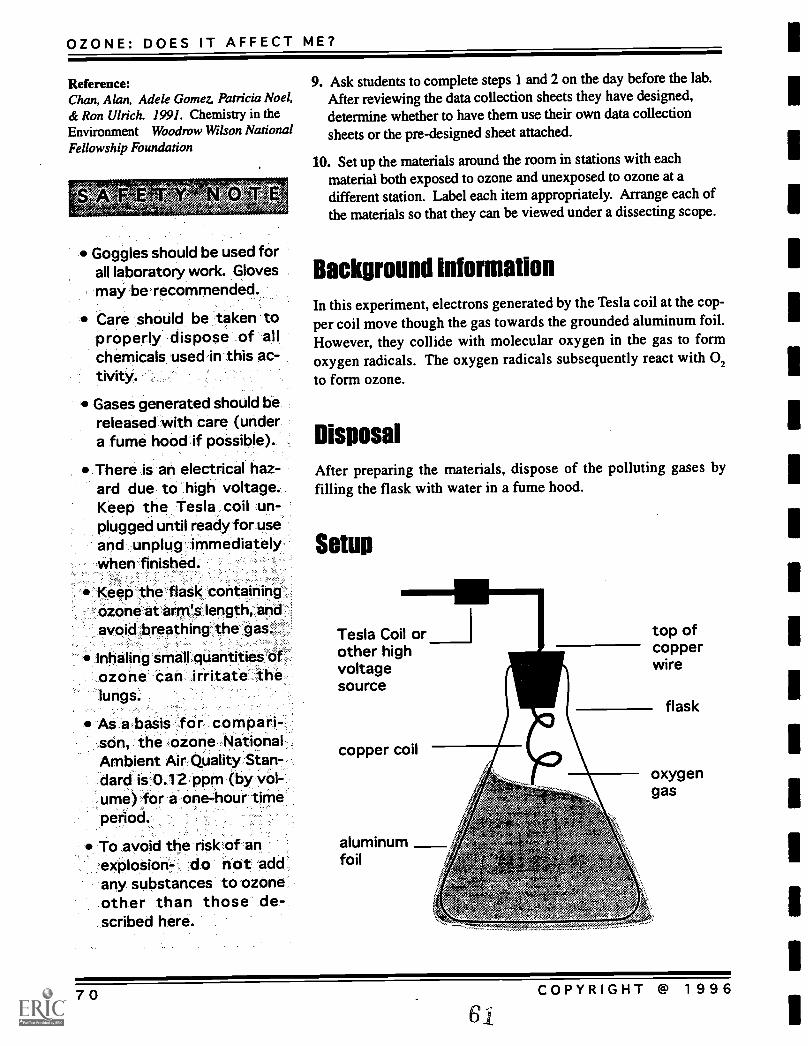
9. Ask students to complete steps 1 and 2 on the day before the lab.After reviewing the data collection sheets they have designed,determine whether to have them use their own data collectionsheets or the pre-designed sheet attached.
10. Set up the materials around the room in stations with eachmaterial both exposed to ozone and unexposed to ozone at adifferent station. Label each item appropriately. Arrange each ofthe materials so that they can be viewed under a dissecting scope.
Background informationIn this experiment, electrons generated by the Tesla coil at the cop-per coil move though the gas towards the grounded aluminum foil.However, they collide with molecular oxygen in the gas to formoxygen radicals. The oxygen radicals subsequently react with 02
to form ozone.
DisposalAfter preparing the materials, dispose of the polluting gases byfilling the flask with water in a fume hood.
Setup
Tesla Coil or I top ofother high coppervoltage wiresource
copper coil
aluminumfoil
flask
oxygengas
70 COPYRIGHT @ 1996
61
ENVIRONMENTAL SCIENCE UNIT
Fraying Fabrics
Students will:
Plan strategy for represen-tative sampling of air.
Observe the effects of airpollutants on a specificmaterial: nylon.
Design a controlled experi-ment.
Observe qualitatively andquantitatively.
Modify their: eXperimentaldesigns ,based on experi-ence.
Interpret their results.
Demonstrate understand-ing of reasonable error.
scissorsplastic slide mounts (3 ormore per person)gluethread or fishing linemasking tapenylon stocking pieces3 x 5 index cardsmagnifying glass or microscope
Name:
Date:
Period:
Introduction:The effects of ozone and other air pollutants on health, vegetation,and materials can be serious. In this activity you will make some
observations about the longer-term effects of air pollutants on ma-
terials.
InstructionsYour task is to design a properly controlled experiment to study the
effects of ozone and other air pollutants on rubber (as in rubberband) and on a synthetic fabric, nylon (as in stockings) over a three-
week period.
At the end of that period you will collect your samples, bring
them in, and observe then under a dissecting scope in addition to
your once-a-week observations for three weeks. Be sure to takecareful initial observations (and record them also) so that your fi-nal observations can be compared. Remember that materials under
stress are more likely to show the effects of pollutants:
Your report sheet should show your initial experimental plan,including your control, with both the nylon and rubber band mounted
on the slides, and detailed description of each site chosen for eachslide. In addition you should include your observations and other
data, microscopic observations (even drawings), and your explana-
tion of your conclusions. You will also be graded on the creativity
of your choice of sites.
COPYRIGHT OD 1996 71
6 2
OZONE: DOES IT AFFECT ME?
Questions1. What areas of the city are most likely to be exposed to ozone
pollution?
2. Where will you place your samples?
3. How can you help prevent vandalism from unduly affecting yourexperiment?
4. How will you know that the effects you observe are the result ofpollutants, and that your samples would not get that way over athree week period without being exposed to pollutants?
5. The control is a. sample that is not exposed to ozone pollution, sothat changes in the control sample can be compared to changes inthe samples exposed to ozone pollution. Where will you placeyour control?
6. How will you prepare your samples? Material under stress ismore likely to show damage by air pollutants. How can youmaximize the effects of ozone and other air pollutants on thematerial?
8. What qualities of the materials can you observe before, during,and at the end of the experiment?
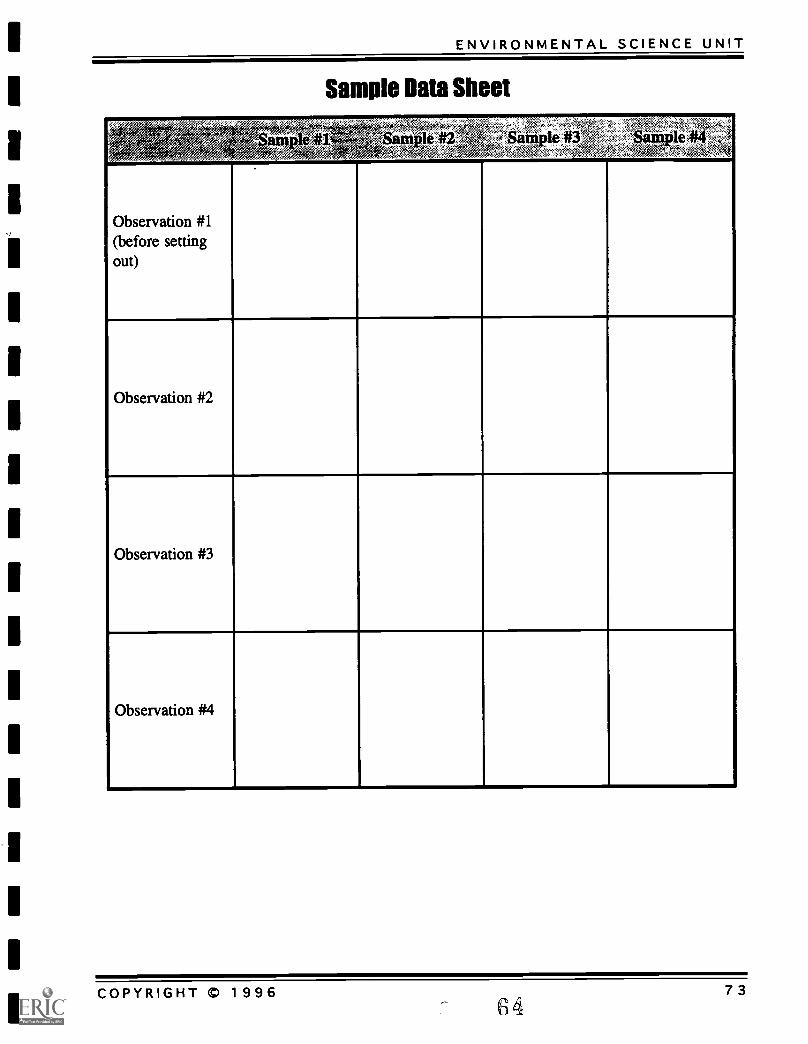
9. You will need to design a data collection sheet to record your data.What should that data collection sheet look like?
72 COPYRIGHT 0 199663
I
I
I
I
I
I
I
I
I
I
I
I
I
I
I
I
I
I
I
ENVIRONMENTAL SCIENCE UNIT
Sample Data Sheet
Observation #1(before settingout)
.
Observation #2
Observation #3
Observation #4
COPYRIGHT C 1996 _ 6 473
OZONE: DOES IT AFFECT ME?
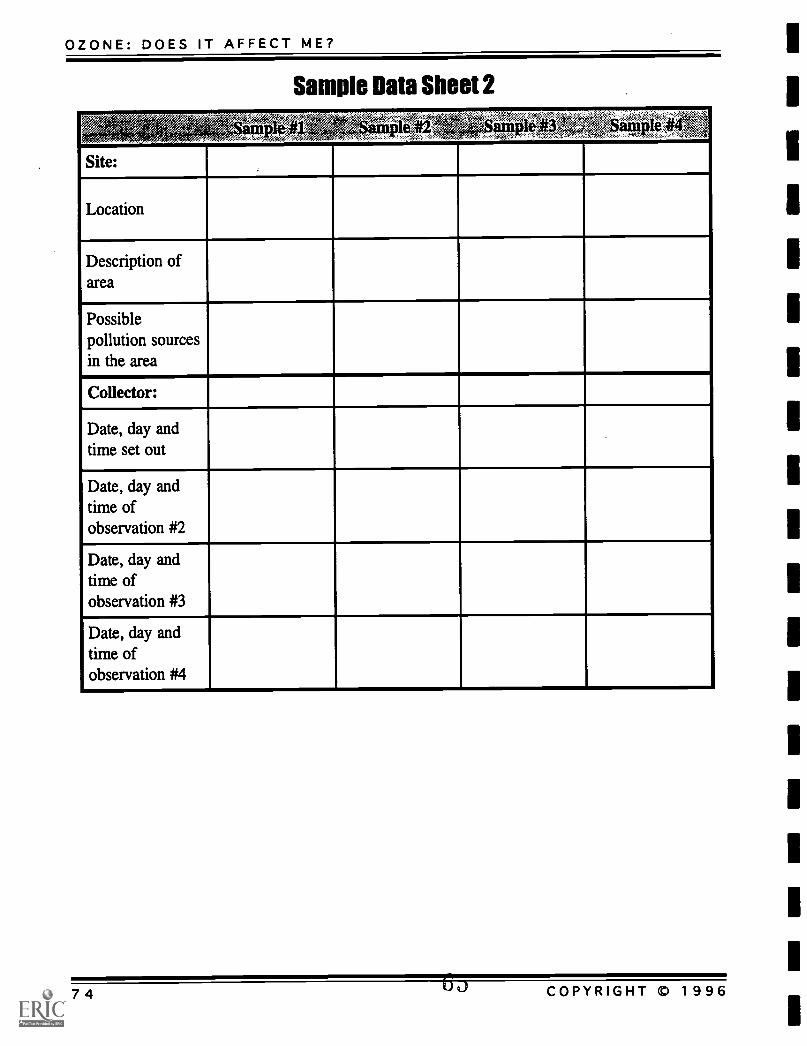
Site:
Sample Data Sheet 2
ample' 4v4
Location
Description ofarea
Possiblepollution sourcesin the area
Collector:
Date, day andtime set out
Date, day andtime ofobservation #2
Date, day andtime ofobservation #3
Date, day andtime ofobservation #4
74 b COPYRIGHT 0 1996
ENVIRONMENTAL SCIENCE UNIT
Fraying Fabrics TEACHER BACKGROUND
0Students will
Plan strategy for represen-tative sampling of air.
Observe the effects of airpollutants on a specificmaterial: nylon.
Design a controlled experi-ment.
Observe qualitatively andquantitatively.
Modify their experimentaldesigns =based on experi-ence.
Interpret their results.
Demonstrate understand-ing of reasonable error.
Experimental Design
Notes and expected outcomesMost students will develop a plan in which they stretch the nylonand rubber bands over slide mounts and glue the cover to the slidemount in place. If the materials are placed loosely rather thantautly on the slide mount, the effects of air pollutants will be lessnoticeable. The nylon and rubber should be examined carefully,and careful notes taken as to the initial color, odor, texture, andelasticity of the sample. Each sample should be examined for anyirregularities in the weave or threads. Labeling is important to avoida large percentage of the samples being lost during the observationperiod. "Please do not disturb. Air pollution experiment in progress.Thank you!" is an effective label. Placing more than one samplein the same general area will also help protect from vandalism ifone is disturbed. Whatever the number of samples prepared, onesample should be set aside in a clean, dark, dry location as thecontrol. The other samples should be hung or mounted in locationswhere exposure to air pollutants is maximized but exposure to ex-treme heat is minimized. As a class project, students could coordi-nate their choices so that a wider range of locations are examined.
The observing area can be increased if larger pieces of stockingare stretched and glued on wooden embroidery hoops. Some stu-dents may wish to extend the time of observation so that effects aremore noticeable, particularly if samples have been located in a rela-tively clean environment. Other loosely woven fabric may be used.
Small group brainstorming followed by class discussion of theanswers to the question at the bottom of the student page would bean excellent way to guide students unfamiliar with how to designan experiment.
If students are not experienced at designing a format for record-ing their data, you can ask them to create one and turn it in as aseparate assignment. Once they have given it their best effort, youcan either choose to allow them to use what they have designed, orhand out the sample data collection sheet for them to use.
COPYRIGHT 1996 75
86
OZONE: DOES IT AFFECT ME?
-4) scissorsplastic slide mounts (3 ormore per person
, gluethread or fishing linemasking tapenylon stocking pieces3x5 index cardsmagnifying ,glass or microscope.
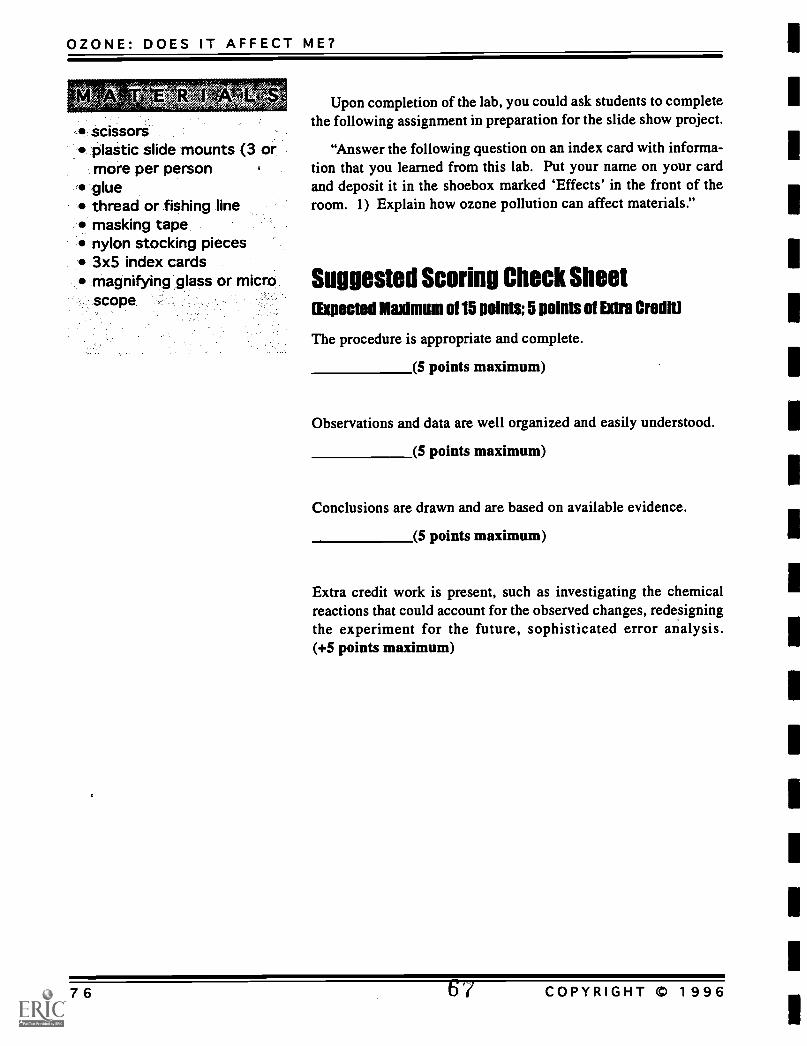
Upon completion of the lab, you could ask students to completethe following assignment in preparation for the slide show project.
"Answer the following question on an index card with informa-tion that you learned from this lab. Put your name on your cardand deposit it in the shoebox marked 'Effects' in the front of theroom. 1) Explain how ozone pollution can affect materials."
Suggested Scoring Check Sheet[Expected Maximum of 15 points; 5 points of Extra Credit)
The procedure is appropriate and complete.
(5 points maximum)
Observations and data are well organized and easily understood.
(5 points maximum)
Conclusions are drawn and are based on available evidence.
(5 points maximum)
Extra credit work is present, such as investigating the chemicalreactions that could account for the observed changes, redesigningthe experiment for the future, sophisticated error analysis.(+5 points maximum)
76 COPYRIGHT 0 1996
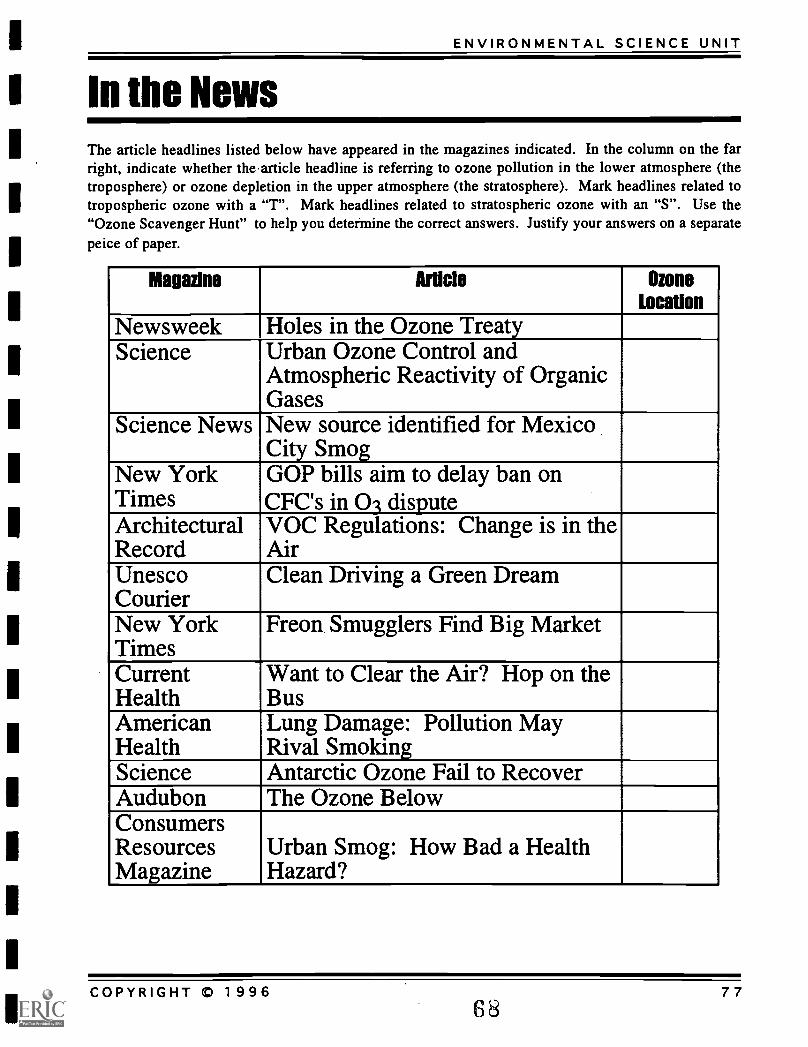
ENVIRONMENTAL SCIENCE UNIT
I In the NewsThe article headlines listed below have appeared in the magazines indicated. In the column on the farright, indicate whether the article headline is referring to ozone pollution in the lower atmosphere (thetroposphere) or ozone depletion in the upper atmosphere (the stratosphere). Mark headlines related totropospheric ozone with a "r'. Mark headlines related to stratospheric ozone with an "S". Use the"Ozone Scavenger Hunt" to help you determine the correct answers. Justify your answers on a separatepeice of paper.
Magazine Article Ozone
Location
Newsweek Holes in the Ozone TreatyScience Urban Ozone Control and
Atmospheric Reactivity of OrganicGases
Science News New source identified for MexicoCity Smog
New YorkTimes
GOP bills aim to delay ban onCFC's in 01 dispute
ArchitecturalRecord
VOC Regulations: Change is in theAir
UnescoCourier
Clean Driving a Green Dream
New YorkTimes
Freon. Smugglers Find Big Market
CurrentHealth
Want to Clear the Air? Hop on theBus
AmericanHealth
Lung Damage: Pollution MayRival Smoking
Science Antarctic Ozone Fail to RecoverAudubon The Ozone BelowConsumersResourcesMagazine
Urban Smog: How Bad a HealthHazard?
COPYRIGHT 11::) 1996 7768
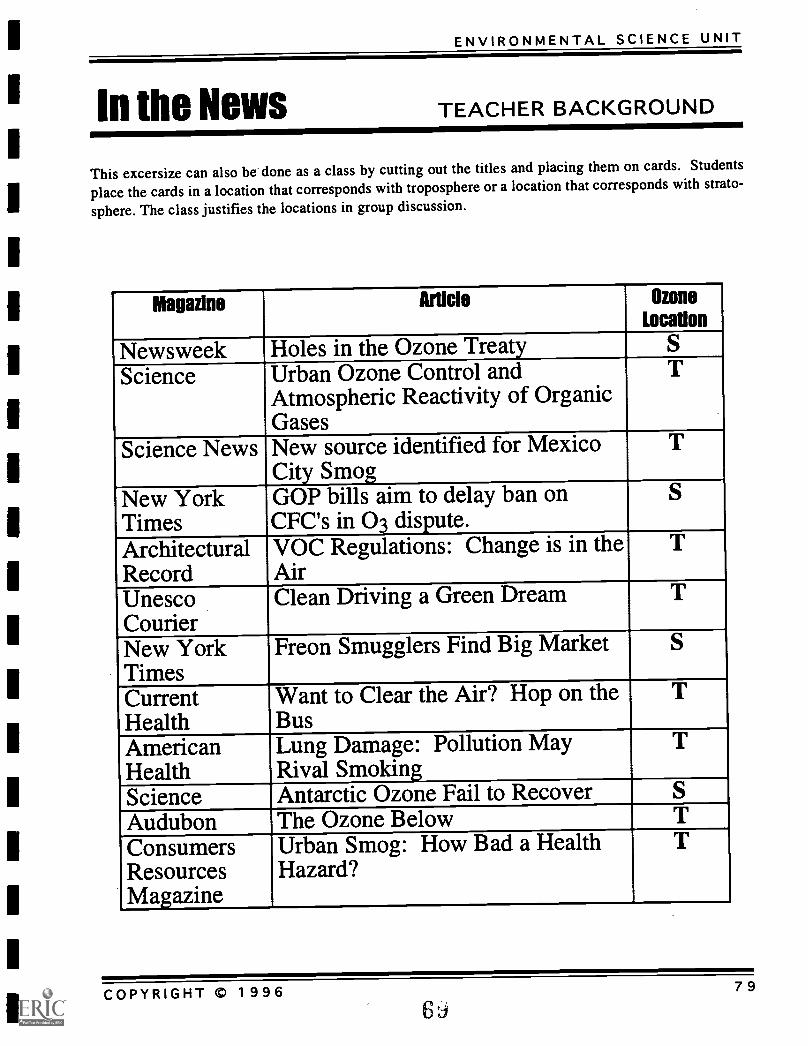
ENVIRONMENTAL SCIENCE UNIT
In the News TEACHER BACKGROUND
This excersize can also be done as a class by cutting out the titles and placing them on cards. Students
place the cards in a location that corresponds with troposphere or a location that corresponds with strato-
sphere. The class justifies the locations in group discussion.
Magazine Article Ozone
Location
Newsweek Holes in the Ozone Treaty S
Science Urban Ozone Control andAtmospheric Reactivity of OrganicGases
T
Science News New source identified for MexicoCity Smog
T
New YorkTimes
GOP bills aim to delay ban onCFC's in 03 dispute.
S
ArchitecturalRecord
VOC Regulations: Change is in theAir
T
UnescoCourier
Clean Driving a Green Dream T
New YorkTimes
Freon Smugglers Find Big Market S
CurrentHealth
Want to Clear the Air? Hop on theBus
T
AmericanHealth
Lung Damage: Pollution MayRival Smoking
T
Science Antarctic Ozone Fail to Recover S
Audubon The Ozone Below TConsumersResourcesMagazine
Urban Smog: How Bad a HealthHazard?
T
COPYRIGHT © 1996 796'J
I Slide Show
1
1
ENVIRONMENTAL SCIENCE UNIT
Conduct research andcommunicate the resultsof studies on ozone pollu-tion through the produc-tion of a computer slideshow.
A
Computers
Slide show program, suchas Microsoft Works 4.0
"Ozone Hunt" web pageson the computer, orpoint to:http://biodec.wustl.edu/EnvSci/Ozone/ozone.html
Name:
Date:
Period:
Instructions:1. Each team of students is assigned or selects one of the following
topics:
Location of ozone in the atmosphere:Where is ozone located in the atmosphere? How can ozone in onelocation be distinguished from the other?
Sources of ozone pollution:Discuss and describe the sources of ozone pollution.
Effects of ozone pollution:Explain how ozone pollution can affect people, plants and things.
Solutions to ozone pollution:How can ozone pollution be reduced?
2. Collect information on index cards from previous ozone activities,and by vewing the "Ozone Scavenger Hunt".
3. Organize an outline of your subtopic, using information gathered.
4. Divide your outline and set of index cards into three components,one for each member of the team. Submit your proposed outlineand divisions.
5. Each individual will design at least one slide to communicate hisor her assigned information to a younger audience.
6. The first draft slides will be assembled together into a class show.Slides are viewed and critiqued by the class as a whole.
7. Make revisions/improvements on your slide or slides based onclassroom critique.
8. View slides produced from all the classes, and select the best onesto include in the final product.
COPYRIGHT 0 1996 81
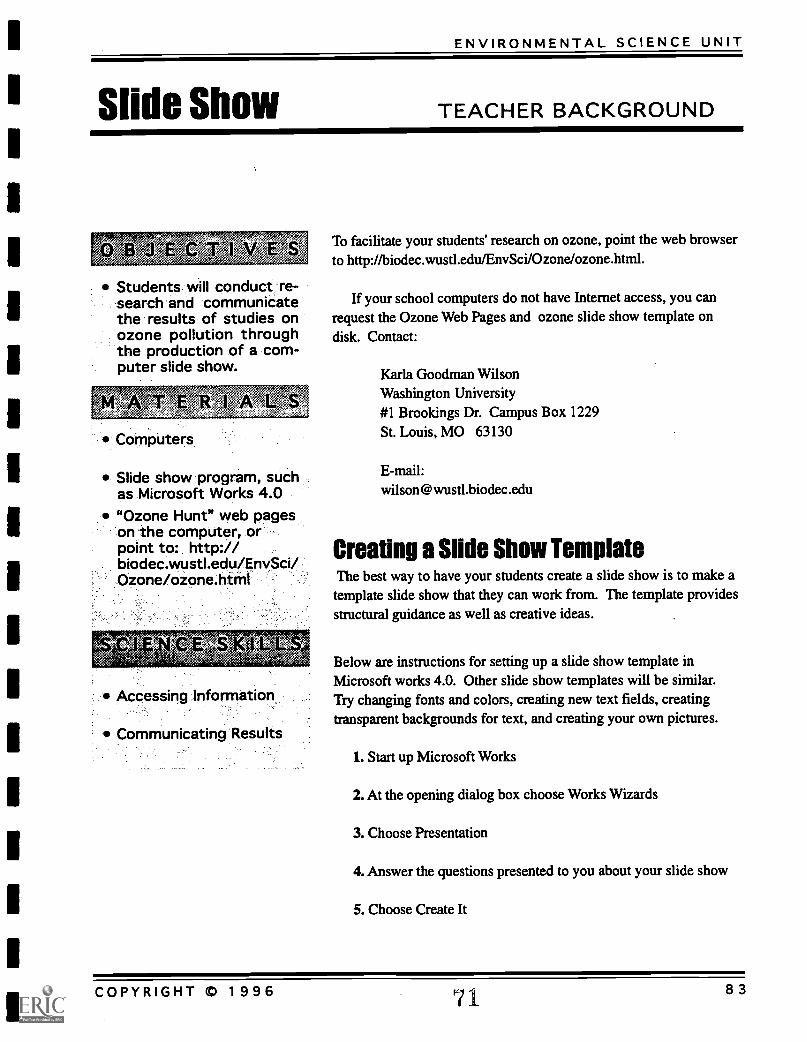
ENVIRONMENTAL SCIENCE UNIT
Slide Show
*,E .g4:-1"-4
TEACHER BACKGROUND
Students will conduct re-search and communicatethe results of studies onozone pollution throughthe production of a com-puter slide show.
Slide show program, suchas Microsoft Works 4.0"Ozone Hunt" web pageson the computer, orpoint to: http://biodec.wustl.edu/EnvSci/Ozone/ozone.html
Accessing Information
Communicating Results
To facilitate your students' research on ozone, point the web browserto http://biodec.wustLedu/EnvSci/Ozone/ozone.html.
If your school computers do not have Internet access, you canrequest the Ozone Web Pages and ozone slide show template ondisk. Contact:
Karla Goodman WilsonWashington University#1 Brookings Dr. Campus Box 1229St. Louis, MO 63130
E-mail:[email protected]
Creating a Slide Show TemplateThe best way to have your students create a slide show is to make atemplate slide show that they can work from. The template providesstructural guidance as well as creative ideas.
Below are instructions for setting up a slide show template inMicrosoft works 4.0. Other slide show templates will be similar.Try changing fonts and colors, creating new text fields, creatingtransparent backgrounds for text, and creating your own pictures.
1. Start up Microsoft Works
2. At the opening dialog box choose Works Wizards
3. Choose Presentation
4. Answer the questions presented to you about your slide show
S. Choose Create It
COPYRIGHT © 1996 83
OZONE: DOES IT AFFECT ME?
6. When it's done it tells you to read the Presentation Tips document.If you click on Print, it will print it out for you. Or you can chooseDone and it will simply open the document on top of your newslide show so you can read it and then close it.
7. Go through the slides marking each one up to be a template foryour students. Add more slides as necessary.
8. Save frequently!
9. When you are finished, save it normally, then choose Save As fromthe file menu. Change the file format to Stationary. Then give it adifferent name (you could simply append student or template tothe previous name.) Save it to your students folder in the docu-ments folder.
Following is a highly structured slide show template created by oneteacher. You can choose to make your template more or less struc-tured as desired.
84 COPYRIGHT m 199672
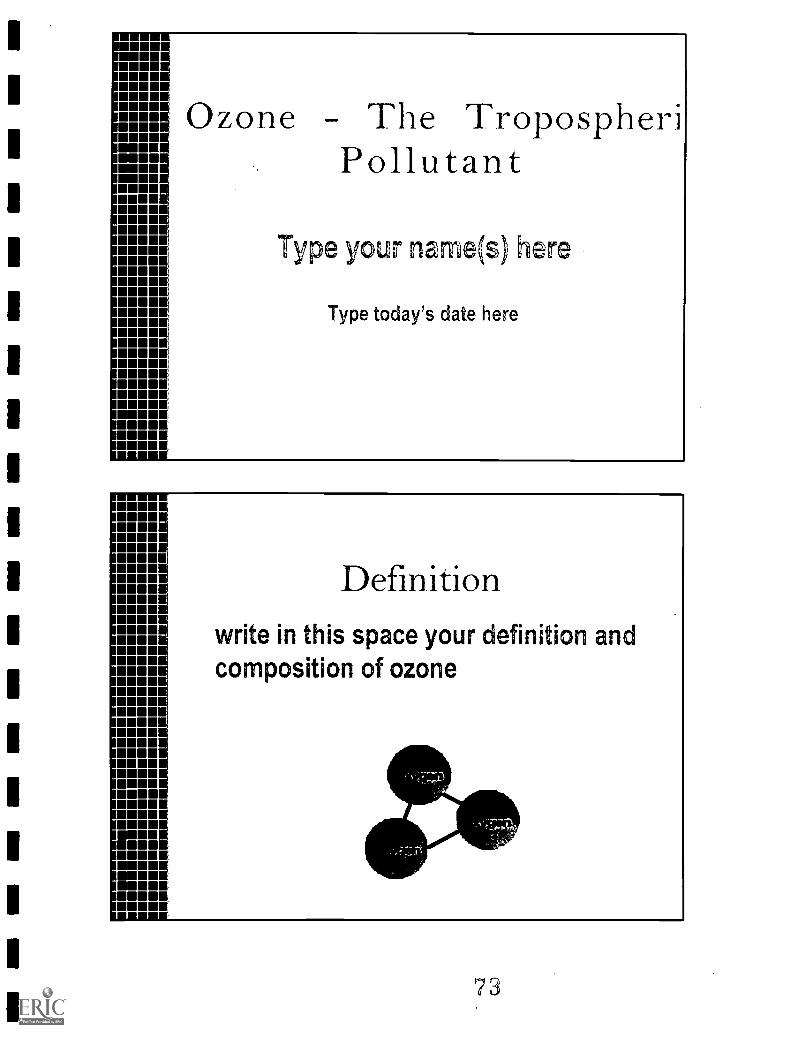
1
1
Ozone The TropospheriPollutant
Type your name(s) here
Type today's date here
uou,U MW
116/161 1mopumomN omismmumU lmo
E lmunmum
mugmom
minEMIMEMM.mi
Definitionwrite in this space your definition andcomposition of ozone
73
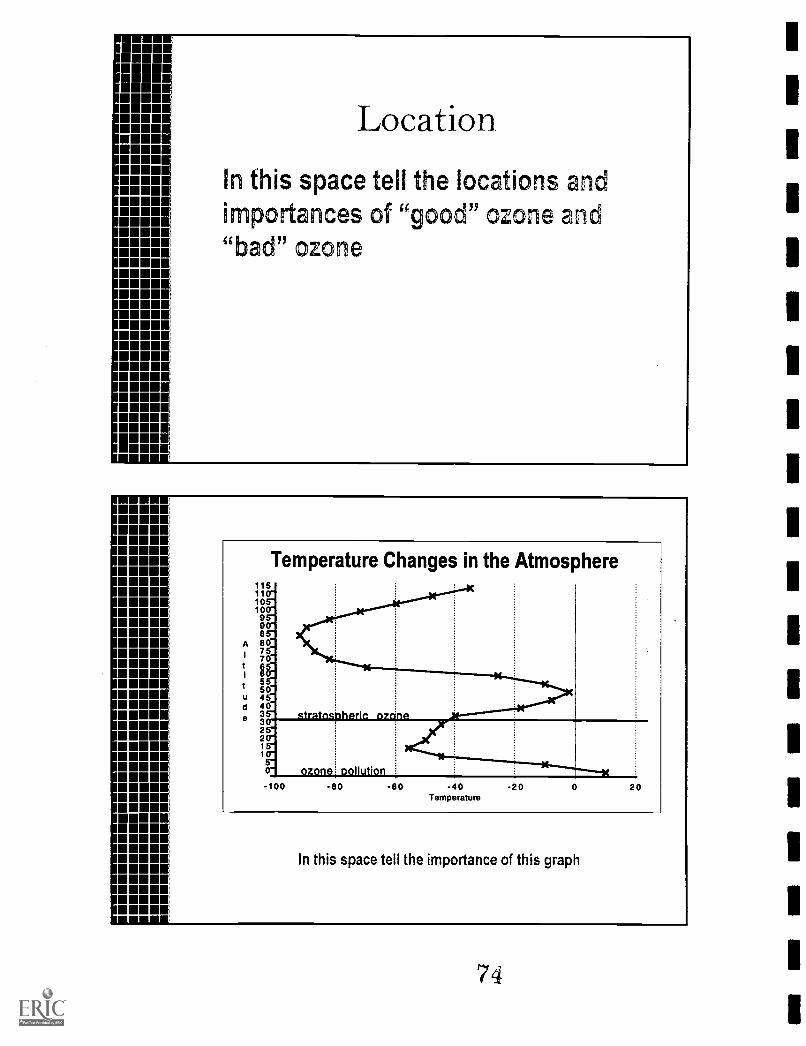
Location
In this space tell the locations andimportances of "good" ozone and"bad" ozone
Temperature Changes in the Atmosphere115110-105"100"95-90"85'
A 80-75-
i 70-
55-50-
u 45-d
35-3U25'20"1 5-1 r0-
stratospheric
-100
ozone ,nolktion-80 -80 -40
Temperature-20 0 20
In this space tell the importance of this graph
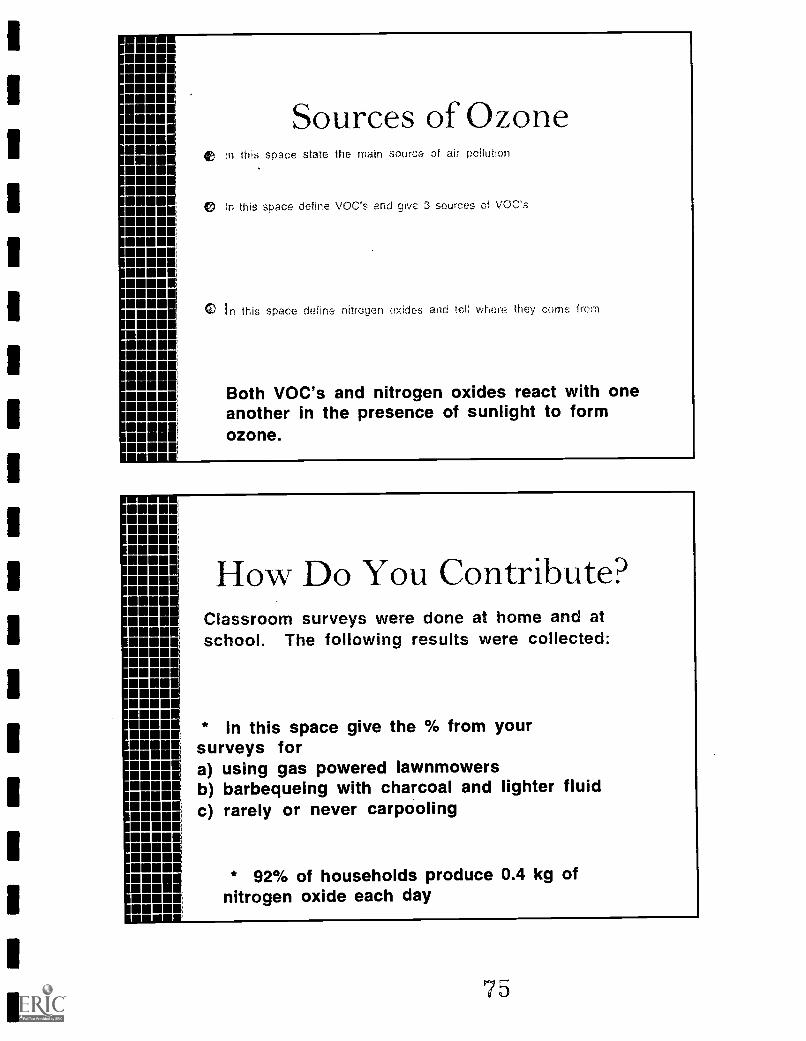
1
NomN UMMUMMUME MIMEN Sources of Ozone
e In this space state the main source of air pollution
N UM (ft in this space define V0C's e.nd give 3 sources of VOC,'sMEES11111111M
K M"NM. 0UM* I n this space define nitrogen oxides and te.: where they come from
1111MUMMUM
mut Both VOC's and nitrogen oxides react with onem1 another in the presence of sunlight to form
MUM ozone.MOM
E.111MMIMS
MIME How Do You Contribute?MM.ME Classroom surveys were done at home and atMEWI school. The following results were collected:mum
IMON NWMIN * In this space give the % from your
surveys forE rn a) using gas powered lawnmowers
b barbequeing with charcoal and lighter fluidmom c) rarely or never carpooling
MN MIMOIRMOM * 92% of households produce 0.4 kg ofE nitrogen oxide each day
75
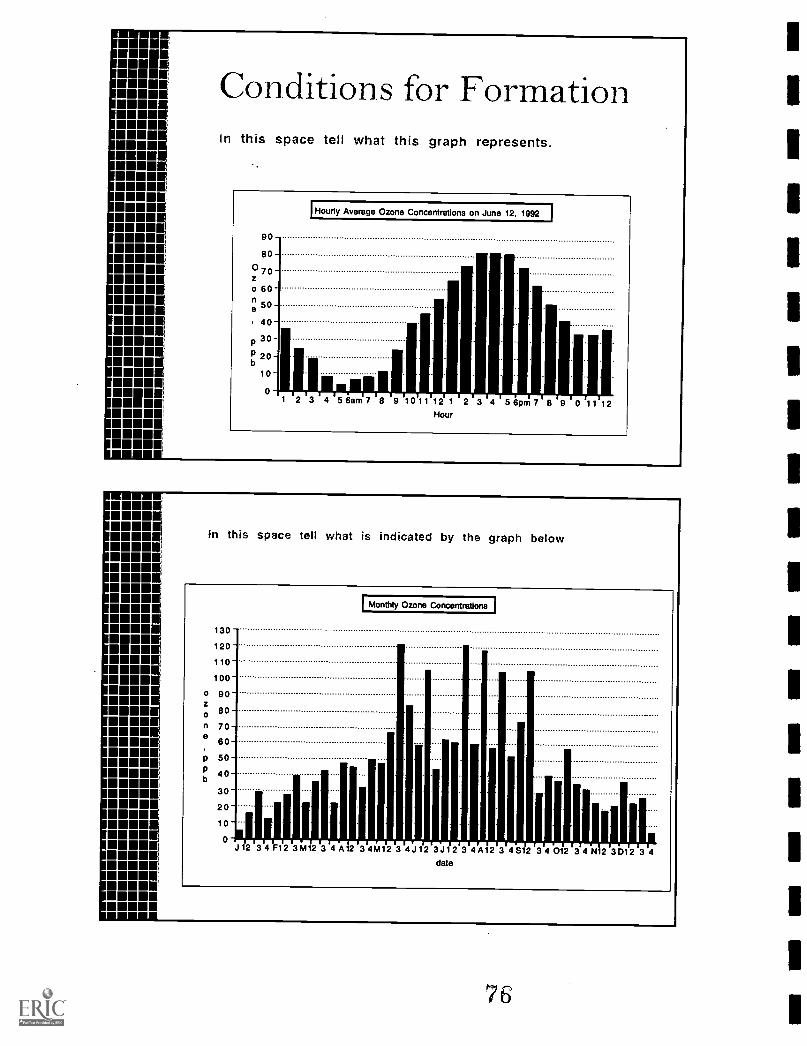
Conditions for FormationIn this space tell what this graph represents.
!Hourly Average Ozone Concentrations on June 12, 1992 I
In this space tell what is indicated by the graph below
0
n
e
ppb
130-
120-
110
100
90-80
70
60
50 -
40-
30
20 -
10-
0
IMonthly Ozone Concentrations I
11111J12 34 F12 3M12 3 4Al2 34M12 3 4J12 3J12 3 4Al2 3 4S12 34 012 34 N12 3D12 3 4date
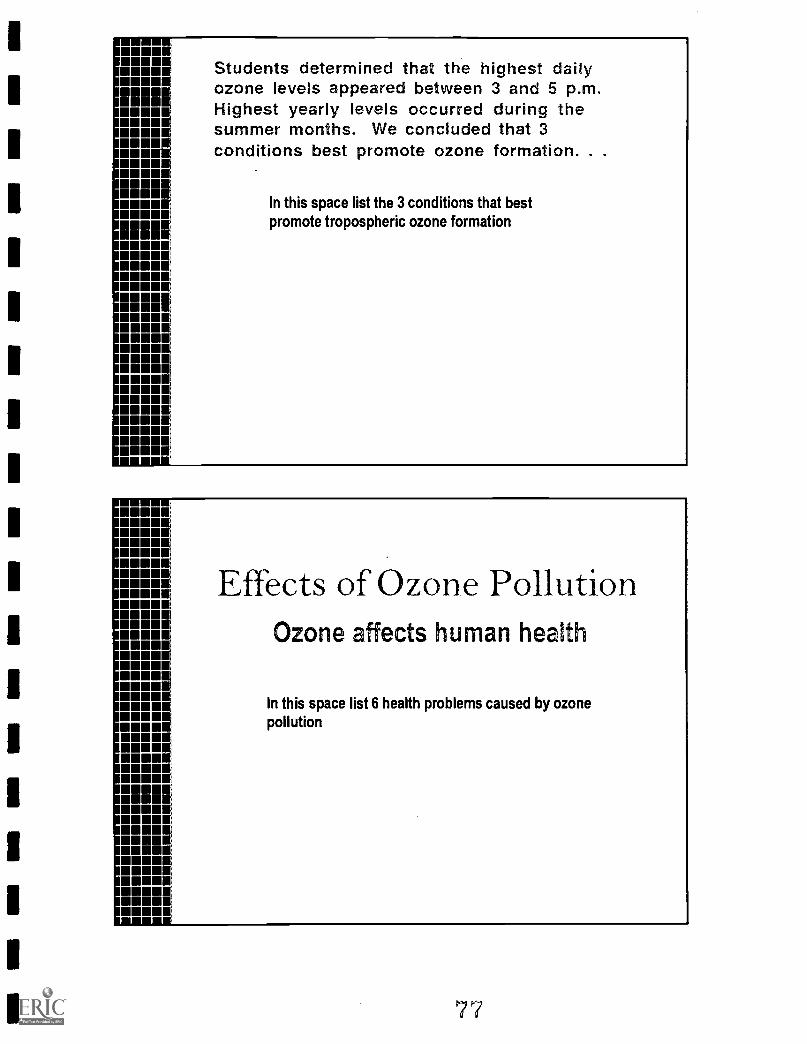
1
1
um.Emumow Students determined that the highest dailyMEMO ozone levels appeared between 3 and 5 p.m.E RNE Highest yearly levels occurred during theN ENEN ENE summer months. We concluded that 3N ENE conditions best promote ozone formation. .
RMURUH In this space list the 3 conditions that bestN EENENEERE promote tropospheric ozone formationNEEmum,mom
RIMERRRU MWMEWERM.1MII
W NW.MUMSMUM
EER111 1
um,W ORM
UMW11111111101
RIM1
EM
MIME.*RmumR
MIMEEW IRERMOWNMIMEMUM
RMEM.MIMEOI Osm.mumSMUM'
MRE msmummut
Effects of Ozone PollutionOzone affects human health
In this space list 6 health problems caused by ozonepollution
77
M11111.
MEEKMEMMEEKMIMES c Ozone affects pCants, trees and crops11E MUMOE.MIMEO In this space name 2 effects of
ozone on plants and trees
MIMES0111MEWMI*MENUMINIMMEEKMIME 0 Ozone affects materials and fabricsmowuminmop In this space name the effectsMIMES ozone has on cotton, rubber, andmoNEW. nylon
EEMEW
MEEMMUMMEM
mumEMMUM11 1111111101ME
MIMI
1111111111MIMEMIME
MENUMIME IMMMEMIMEEEttmomE moimonN omIMM.MENEMN MI11111111110MIMEOMEMEEMIMEMEWMENMIMEMIME
miuml
What Can You Do ?In this space list 5 things that you can do to lessenthe amount of ozone pollution
78
OzoneDoes It Affect Me?
CHEMISTRY UNIT
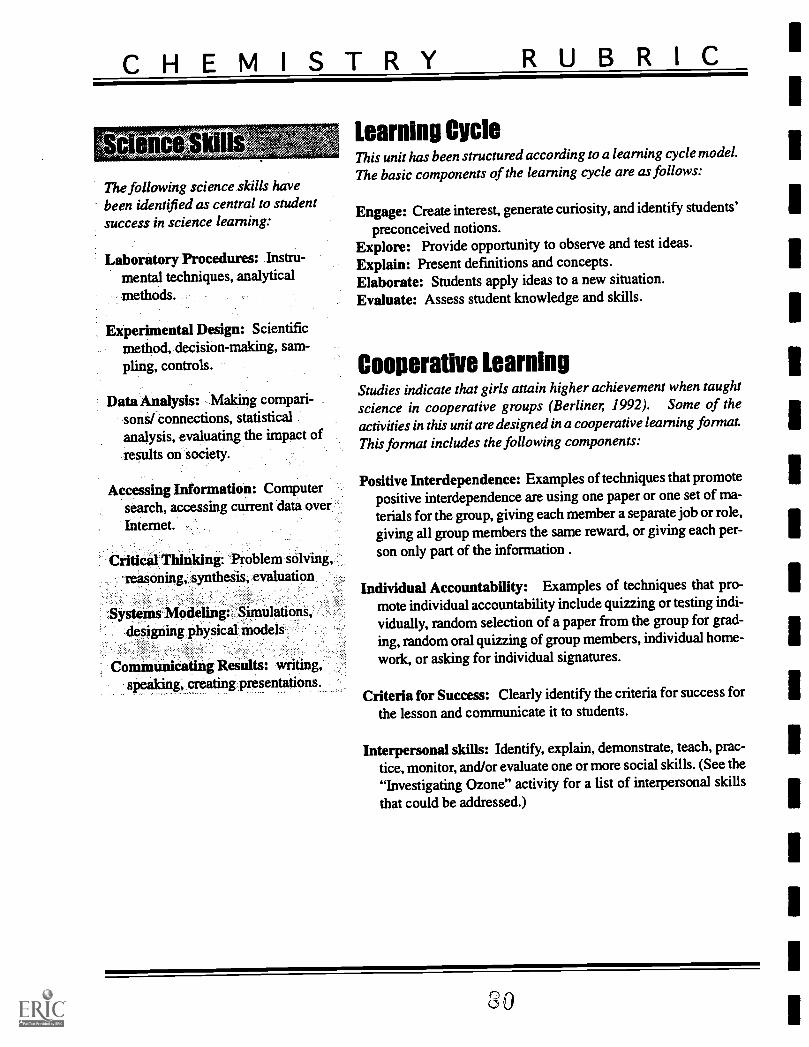
CHEMISTRY RUBRIC
clan Skills
The following science skills havebeen identified as central to studentsuccess in science learning:
Laboratory Procedures: Instru-mental techniques, analyticalmethods.
Experimental Design: Scientificmethod, decision-making, sam-pling, controls.
Data Analysis: Making compari-sons/ connections, statisticalanalysis, evaluating the impact ofresults on' society.
Accessing Information: Computersearch, accessing current data over.Internet.
Critical Thinking: Problem solving,'reasoning, synthesis, evaluation
Systems Modeling: Simulations,designing physical, models
Communicating Results: writing,speaking, creating presentations.
Learning CycleThis unit has been structured according to a learningcycle model.
The basic components of the learning cycle are as follows:
Engage: Create interest, generate curiosity, and identify students'
preconceived notions.Explore: Provide opportunity to observe and test ideas.
Explain: Present definitions and concepts.Elaborate: Students apply ideas to a new situation.Evaluate: Assess student knowledge and skills.
Cooperative LearningStudies indicate that girls attain higher achievement when taught
science in cooperative groups (Berliner, 1992). Some of theactivities in this unit are designed in a cooperative learning format.This format includes the following components:
Positive Interdependence: Examples of techniques that promotepositive interdependence are using one paper or one set of ma-terials for the group, giving each member a separate job or role,giving all group members the same reward, or giving each per-son only part of the information .
Individual Accountability: Examples of techniques that pro-mote individual accountability include quizzing or testing indi-vidually, random selection of a paper from the group for grad-ing, random oral quizzing of group members, individual home-
work, or asking for individual signatures.
Criteria for Success: Clearly identify the criteria for successfor
the lesson and communicate it to students.
Interpersonal skills: Identify, explain, demonstrate, teach, prac-tice, monitor, and/or evaluate one or more social skills. (See the"Investigating Ozone" activity for a list of interpersonal skills
that could be addressed.)
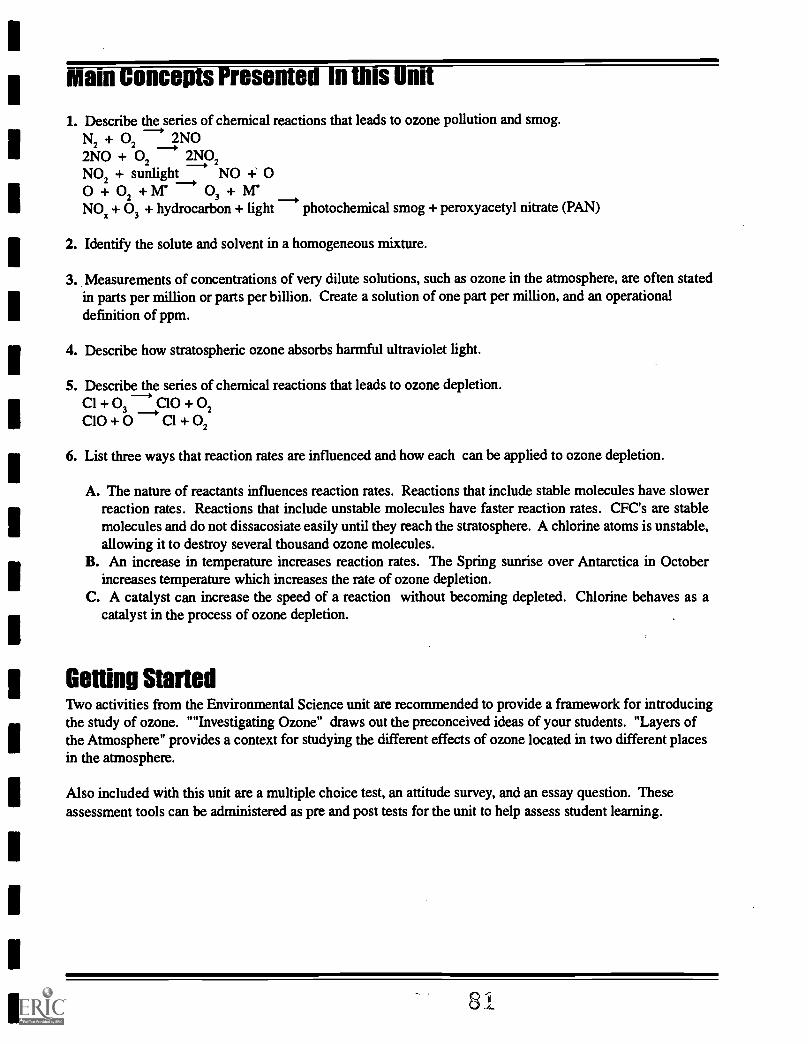
Main Concepts Presented In this Unit
1. Describe the series of chemical reactions that leads to ozone pollution and smog.N2 + 02 2N02NO + 02 2NO2NO2 + sunlight NO +
s
00 + 02 + Ivl* 03 + MNO. + 03 + hydrocarbon + light photochemical smog + peroxyacetyl nitrate (PAN)
2. Identify the solute and solvent in a homogeneous mixture.
3. Measurements of concentrations of very dilute solutions, such as ozone in the atmosphere, are often statedin parts per million or parts per billion. Create a solution of one part per million, and an operationaldefinition of ppm.
4. Describe how stratospheric ozone absorbs harmful ultraviolet light.
5. Describe the series of chemical reactions that leads to ozone depletion.CI + 03 C10 + 02C10 + 0 Cl + 02
6. List three ways that reaction rates are influenced and how each can be applied to ozone depletion.
A. The nature of reactants influences reaction rates. Reactions that include stable molecules have slowerreaction rates. Reactions that include unstable molecules have faster reaction rates. CFC's are stablemolecules and do not dissacosiate easily until they reach the stratosphere. A chlorine atoms is unstable,allowing it to destroy several thousand ozone molecules.
B. An increase in temperature increases reaction rates. The Spring sunrise over Antarctica in Octoberincreases temperature which increases the rate of ozone depletion.
C. A catalyst can increase the speed of a reaction without becoming depleted. Chlorine behaves as acatalyst in the process of ozone depletion.
Getting StartedTwo activities from the Environmental Science unit are recommended to provide a framework for introducingthe study of ozone. "Investigating Ozone" draws out the preconceived ideas of your students. "Layers ofthe Atmosphere" provides a context for studying the different effects of ozone located in two different placesin the atmosphere.
Also included with this unit are a multiple choice test, an attitude survey, and an essay question. Theseassessment tools can be administered as pre and post tests for the unit to help assess student learning.
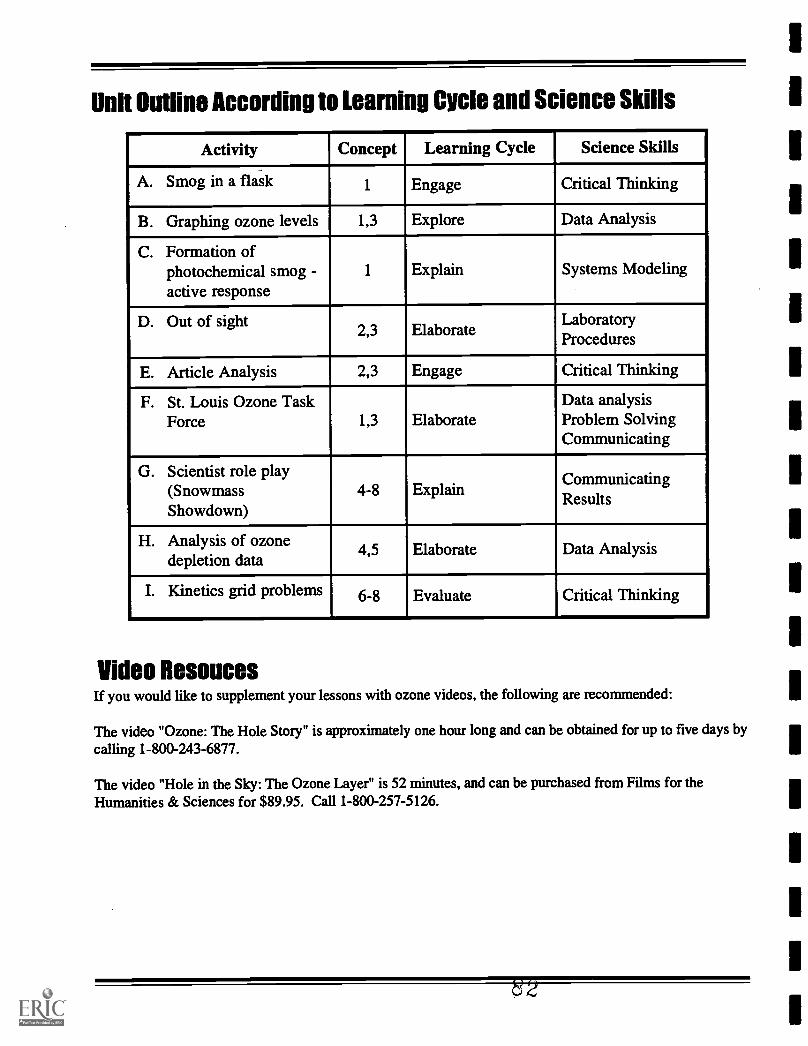
Unit Outline According to Learning Cycle and Science Skills
Activity Concept Learning Cycle Science Skills
A. Smog in a flask 1 Engage Critical Thinking
B. Graphing ozone levels 1,3 Explore Data Analysis
C. Formation ofphotochemical smog -active response
1 Explain Systems Modeling
D. Out of sight2,3 Elaborate
LaboratoryProcedures
E. Article Analysis 2,3 Engage Critical Thinking
F. St. Louis Ozone TaskForce 1,3 Elaborate
Data analysisProblem SolvingCommunicating
G. Scientist role play(SnowmassShowdown)
4-8 ExplainCommunicatingResults
H. Analysis of ozonedepletion data
4,5 Elaborate Data Analysis
I. Kinetics grid problems 6-8 Evaluate Critical Thinking
Video ResoucesIf you would like to supplement your lessons with ozone videos, the following are recommended:
The video "Ozone: The Hole Story" is approximately one hour long and can be obtained for up to five days bycalling 1-800-243-6877.
The video "Hole in the Sky: The Ozone Layer" is 52 minutes, and can be purchased from Films for theHumanities & Sciences for $89.95. Call 1-800-257-5126.
1
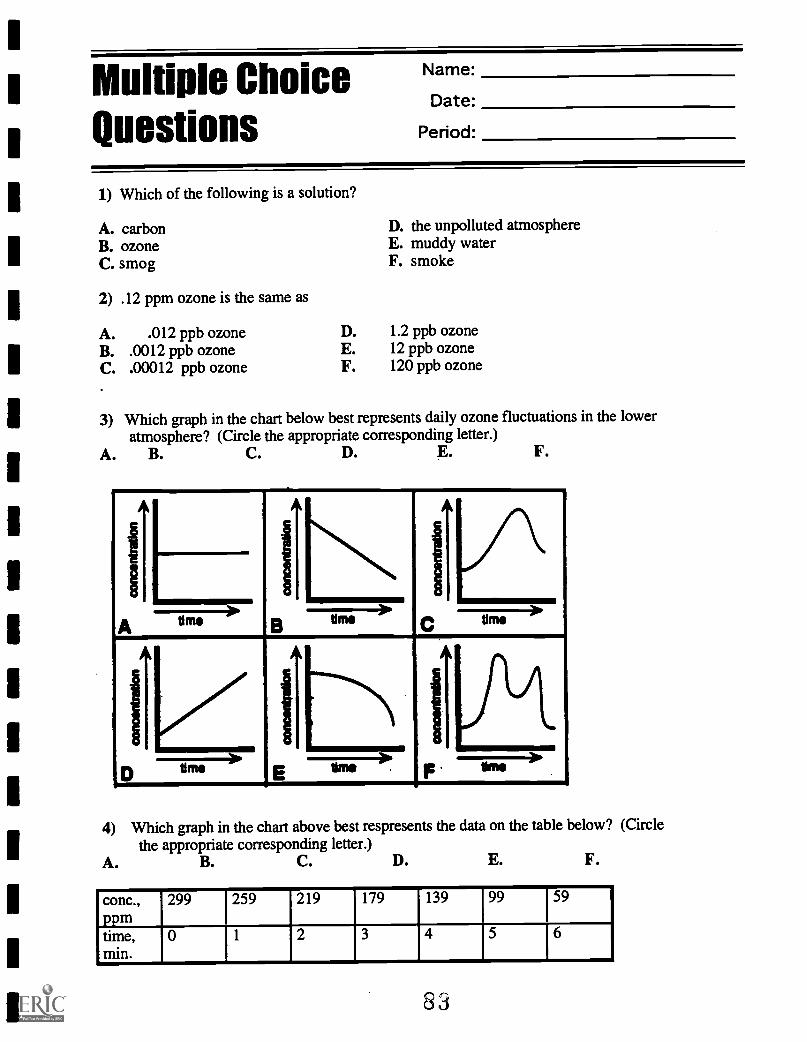
Multiple ChoiceQuestions
Name:
Date:
Period:
1) Which of the following is a solution?
A. carbonB. ozoneC. smog
2) .12 ppm ozone is the same as
A. .012 ppb ozoneB. .0012 ppb ozoneC. .00012 ppb ozone
D. the unpolluted atmosphereE. muddy waterF. smoke
D. 1.2 ppb ozoneE. 12 ppb ozoneF. 120 ppb ozone
3) Which graph in the chart below best represents daily ozone fluctuations in the loweratmosphere? (Circle the appropriate corresponding letter.)
A. B. C. D. E. F.
III1 11,
1i
B MOA g" C UM
1)D time .
4) Which graph in the chart above best respresents the data on the table below? (Circlethe appropriate corresponding letter.)
A. B. C. D. E. F.
conc., 299 259 219 179 139 99 59ppmtime, 0 1 2 3 4 5 6min.
83
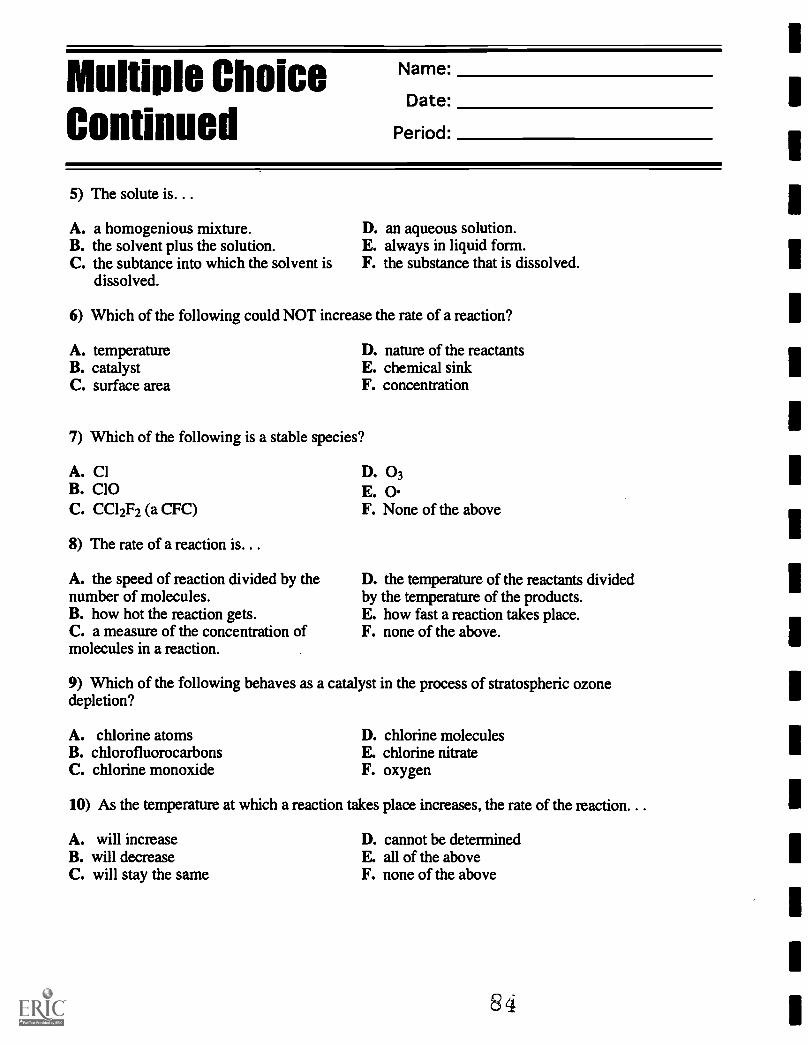
Multiple ChoiceContinued
Name:
Date:
Period:
5) The solute is.. .
A. a homogenious mixture.B. the solvent plus the solution.C. the subtance into which the solvent is
dissolved.
D. an aqueous solution.E. always in liquid form.F. the substance that is dissolved.
6) Which of the following could NOT increase the rate of a reaction?
A. temperatureB. catalystC. surface area
D. nature of the reactantsE. chemical sinkF. concentration
7) Which of the following is a stable species?
A. ClB. C10C. CC12F2 (a CFC)
8) The rate of a reaction is.. .
A. the speed of reaction divided by thenumber of molecules.B. how hot the reaction gets.C. a measure of the concentration ofmolecules in a reaction.
D. 03E. 0F. None of the above
D. the temperature of the reactants dividedby the temperature of the products.E. how fast a reaction takes place.F. none of the above.
9) Which of the following behaves as a catalyst in the process of stratospheric ozonedepletion?
A. chlorine atomsB. chlorofluorocarbonsC. chlorine monoxide
D. chlorine moleculesE. chlorine nitrateF. oxygen
10) As the temperature at which a reaction takes place increases, the rate of the reaction. .
A. will increaseB. will decreaseC. will stay the same
D. cannot be determinedE. all of the aboveF. none of the above
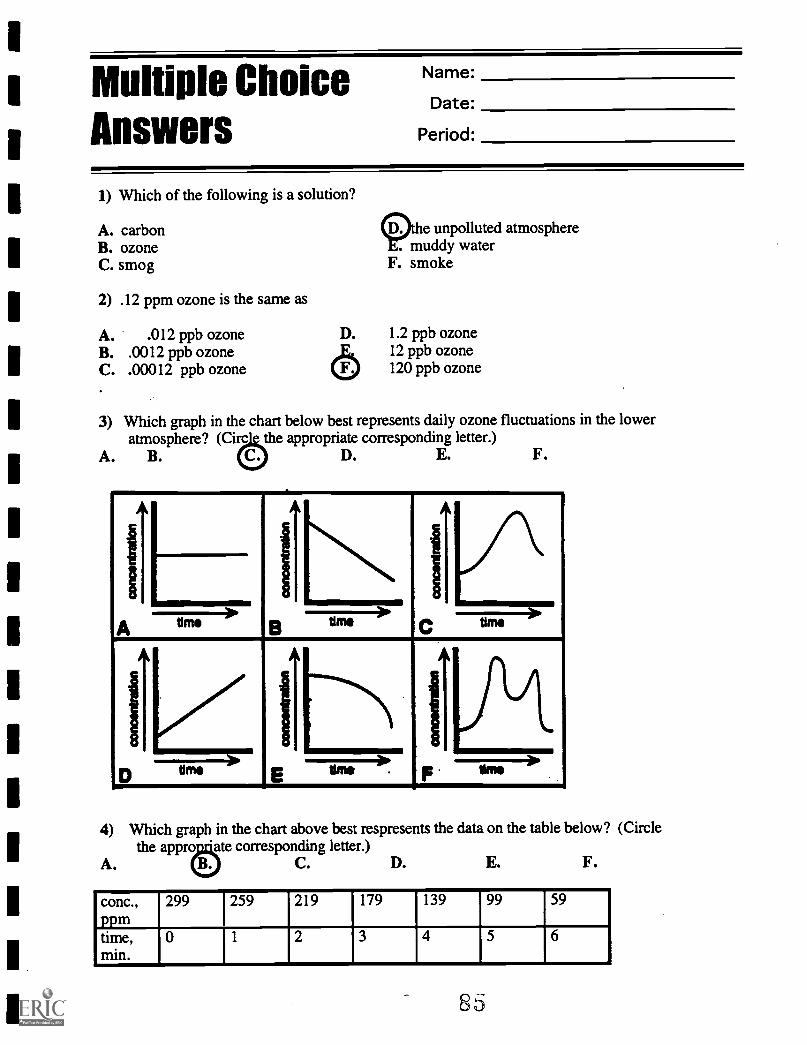
Multiple ChoiceAnswers
Name:
Date:
Period:
1) Which of the following is a solution?
A. carbonB. ozoneC. smog
2) .12 ppm ozone is the same as
A. .012 ppb ozoneB. .0012 ppb ozoneC. .00012 ppb ozone
e unpolluted atmosphere. muddy water
F. smoke
D. 1.2 ppb ozone12 ppb ozone
F. 120 ppb ozone
3) Which graph in the chart below best represents daily ozone fluctuations in the loweratmosphere? (Circ the appropriate corresponding letter.)
A. B. C. D. E. F.
k
11 SISNss,s,
111
,
1 .........p. a.......4,A time B time C
.........time
. .
time E time .
4) Which graph in the chart above best respresents the data on the table below? (Circle
A.the ate corresponding letter.)
C. D. E. F.
conc., 299 259 219 179 139 99 59ppmtime, 0 1 2 3 4 5 6min.
Multiple ChoiceAnswers [cont.)
Name:
Date:
Period:
5) The solute is.. .
A. a homogenious mixture.B. the solvent plus the solution.C. the subtance into which the solvent is
dissolved.
D. an aqueous solution.E. always in liquid form.ii he substance that is dissolved.
6) Which of the following could NOT increase the rate of a reaction?
A. temperatureB. catalystC. surface area O.
nature of the reactantschemical sinkconcentration
7) Which of the following is a stable species?
A. ClB. C10OCC12F2 (a CFC)
8) The rate of a reaction is.. .
A. the speed of reaction divided by thenumber of molecules.B. how hot the reaction gets.C. a measure of the concentration ofmolecules in a reaction.
D. 03E. 0F. None of the above
D. the temperature of the reactants dividedthe temperature of the products.
ow fast a reaction takes place.none of the above.
9) Which of the following behaves as a catalyst in the process of stratospheric ozonedepletion?
A chlorine atomschlorofluorocarbons
C. chlorine monoxide
D. chlorine moleculesE. chlorine nitrateF. oxygen
10) As the temperature at which a reaction takes place increases, the rate of the reaction.. .
will increaseA.will decrease
C. will stay the same
D. cannot be determinedE. all of the aboveF. none of the above
86
II
1 EssayName:
Date:
1 Question Period:
I Discuss the chemistry of ozone in the atmosphere. Include in your answer as many chemical pathways as you
can think of for the formation, reactions and destruction of ozone. Discuss how the concentration of ozone in the
atmosphere may affect human activity.
I
I
I
I
I
I
I
I
I
I
I
I
AttitudeSurvey
Name:
Date:
Period:
1. I like studying about the environment.strongly agree mildly agree neutral mildly disagree strongly disagree
1 2 3 4 5
2. I can help my family better understand environmental issues.strongly agree mildly agree neutral mildly disagree strongly disagree
1 2 3 4 5
3. Understanding chemistry is necessary for understanding environmental issues.strongly agree mildly agree neutral mildly disagree strongly disagree
1 2 3 4 5
4. I believe that I can apply what I have learned in chemistry class to other situations.strongly agree mildly agree neutral mildly disagree strongly disagree
1 2 3 4 5
5. This class has gotten me curious about environmental problems.strongly agree mildly agree neutral mildly disagree strongly disagree
1 2 3 4 5
6. I am interested in studying about environmental issues.strongly agree mildly agree neutral mildly disagree strongly disagree
1 2 3 4 5
7. I talk about what we are learning in chemistry with my family.strongly agree mildly agree neutral mildly disagree strongly disagree
1 2 3 4 5
8. The chemistry of ozone is a complex issue.strongly agree mildly agree neutral mildly disagree strongly disagree
1 2 3 4 5
9. I talk about what we are learning in chemistry with my friends.strongly agree mildly agree neutral mildly disagree strongly disagree
1 2 3 4 5
10. The information that I am learning in class will be useful to me in the future.strongly agree mildly agree neutral mildly disagree strongly disagree
1 2 3 4 5
Part 1Tropospheric Ozone
89
CHEMISTRY UNIT
Smog In A Flask
Observe the results of theinteraction of ozone andorganic compounds.
1 000m1 Erlenmeyer flaskTesla Coilwire with alligator clips oneach endcopper wireAluminum Foildissecting scopes
- lemon peel
Names:
Date:
Period:
Answer the following questions together with your partner:
1. What do you predict will occur when your teacher generatesozone and adds a lemon peel?
2. When your teacher performs the demonstration, record yourobservations.
3. Explain what you have observed.
4. The following was an actual e-mail message received. Howwould you respond to Don? If air pollution alerts are because ofthe "brown stuff' and ozone is clear, why should we be concernedabout ozone?
Hi, I kinda feel that ozone is getting a bumb rap. I
sort of agree with the upper atmosphere side, ozoneshields the UV from us. But the lower one I reallyquestion. If you go outside after a real strong thun-der storm it smells fresh and clean. That's ozone atwork. Now as for the California SIG alerts due toozone??? The stuff there is oily and brown, but ozoneis clear?
Just my observations. Don
COPYRIGHT 0 1996 10590
CHEMISTRY UNIT
Smog In A Flask TEACHER BACKGROUND
JE Tj Procedure
Students will observe theresults of the interactionof ozone and organic com-pounds.
1000m1 Erlenmeyer flaskTesla Coilwire with alligator clips oneach endcopper wireAluminum Foildissecting scopeslemon peel
1. Shape one end of a copper wire into a coil, and insert it into a "ltvistit"rubber stopper with stopped up holes (if your stopper has holes, seal
the holes with paraffin or wax). The portion of the wire formed into
a spiral should be at least 6 inches in length to yield sufficient pro-
duction of ozone.
2. Fill the flask with some oxygen gas. (The oxygen level doesn'tneed to be at 100%, but a higher than normal level will facilitate the
reaction. The demo will also work with air but the effect will be less
dramatic.)
3. Put laboratory film over the top of the stopper.
4. Wrap the bottom half of the flask with aluminum foil. Also wrapthe rubber stopper with tin foil to prevent combustion from the high
oxygen level.
5. It is best to ground the aluminum foil. Using a wire with alligatorclips at each end, clip one end to the foil and the other to a faucet orwater pipe.
6. Touch the Tesla coil to the copper wire for about 2 minutes.
7. To generate smog, peel a twist of lemon, squeeze or rub it sharply,
remove the stopper, drop in the lemon peel and replace the stopper.A whitish gas should form. Point out to your students that underatmospheric conditions, when NO gases are present, the smog will
appear brown.
COPYRIGHT 1996 1079i
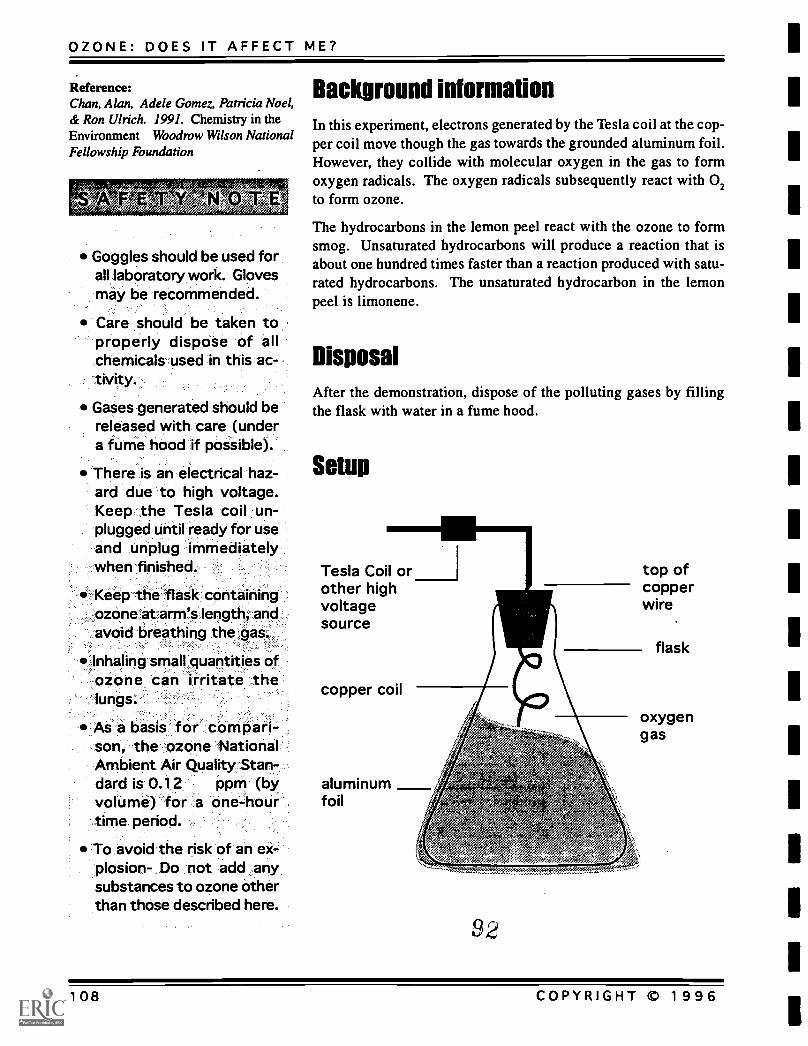
OZONE: DOES IT AFFECT ME?
Reference:Chan, Alan, Adele Gomez, Patricia Noel,& Ron Ulrich. 1991. Chemistry in theEnvironment Woodrow Wilson NationalFellowship Foundation
N AltrE
Goggles should be used forall laboratory work. Glovesmay be recommended.
Care should be taken toproperly dispose of allchemicals used in this ac-tivity.
Gases generated should bereleased with care (undera fume hood if possible).
There is an electrical haz-ard due to high voltage.Keep the Tesla coil un-plugged until ready for useand unplug immediatelywhen finished.
Keep the flask containing-ozone at arm's length, andavoid breathing the gas.
Inhaling small quantities ofozone can irritate lhelungs.
M a basis for compari-son, the ozone NationalAmbient. Air Quality Stan-dard is 0.12, ppm (byvolume) for a one-hourtime period.
To avoid the risk of an ex-plosion- Do not add anysubstances to ozone otherthan those described here.
Background informationIn this experiment, electrons generated by the Tesla coil at the cop-per coil move though the gas towards the grounded aluminum foil.However, they collide with molecular oxygen in the gas to formoxygen radicals. The oxygen radicals subsequently react with 02to form ozone.
The hydrocarbons in the lemon peel react with the ozone to formsmog. Unsaturated hydrocarbons will produce a reaction that isabout one hundred times faster than a reaction produced with satu-rated hydrocarbons. The unsaturated hydrocarbon in the lemonpeel is limonene.
DisposalAfter the demonstration, dispose of the polluting gases by fillingthe flask with water in a fume hood.
Setup
Tesla Coil orother highvoltagesource
copper coil
aluminumfoil
top ofcopperwire
92
108 COPYRIGHT © 1996
CHEMISTRY UNIT
Graphing Ozone Levels
Students will graph andanalyze data regardingconcentrations of ground-level ozone.
Data TableGraph Paper and PencilComputerSpreadsheet
`Program
Name:
Date:
Period:
Below are tables of data on the concentration of ozone in the loweratmosphere in the town of Biuone, New York. Hourly data is presentedin the first table for June 11 and 12, 1992. The second table presentsthe maximum of each day's twenty-four readings (of hourly-averagedozone data) for the days indicated.
Together with your partner, decide how you will graph the data given.Is this data best displayed in a bar, line, or pie graph? Why? If youselect a bar or line graph, what will you put on the x-axis? What will
you put on the y-axis? Give your graph a title.
Study the graphs you have made to answer the following questions:
1. What season do ozone levels tend to be the highest? On a typicalday, in what part of the day do ozone levels tend to be highest?
2. What season and part of the day do ozone levels tend to be thelowest?
3. What might some factors be that contribute to increased concentra-tions of ozone?
4. Can you identify any other patterns by studying the graphs?
93
COPYRIGHT © 1996 109
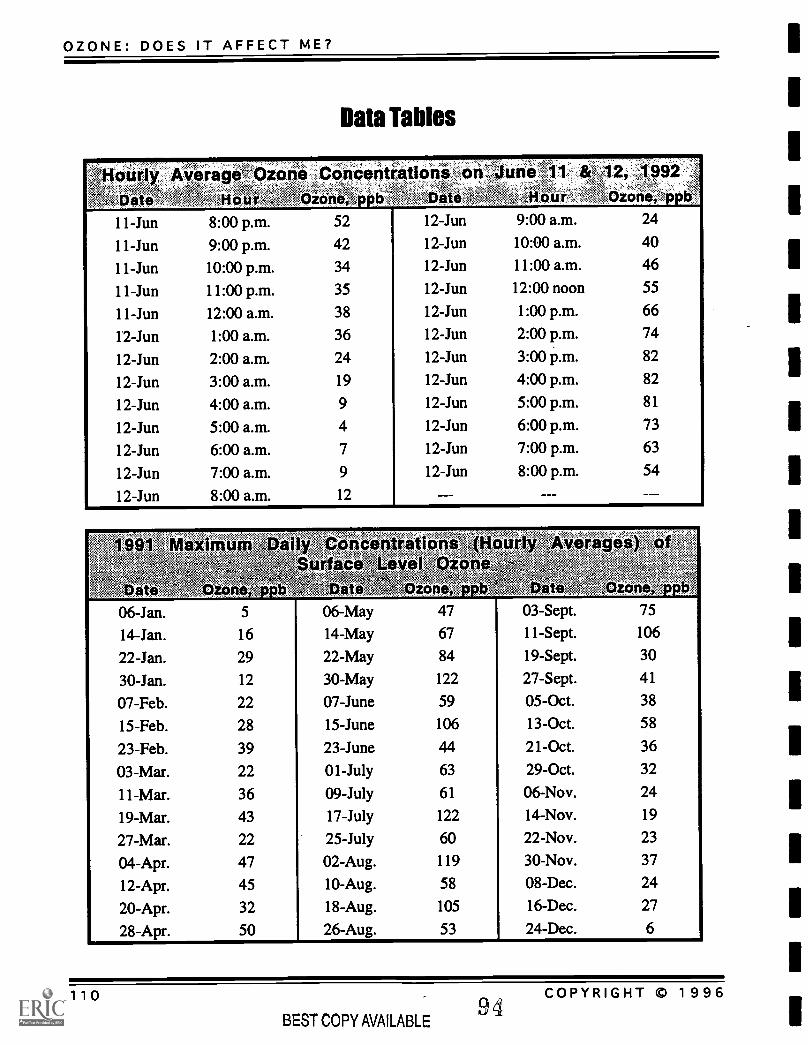
OZONE: DOES IT AFFECT ME?
Data Tables
HourIy pi:i:^junit,Ozone, pp
11-Jun 8:00 p.m. 52 12-Jun 9:00 a.m. 24
11-Jun 9:00 p.m. 42 12-Jun 10:00 a.m. 40
11-Jun 10:00 p.m. 34 12-Jun 11:00 a.m. 46
11-Jun 11:00 p.m. 35 12-Jun 12:00 noon 55
11-Jun 12:00 a.m. 38 12-Jun 1:00 p.m. 66
12-Jun 1:00 a.m. 36 12-Jun 2:00 p.m. 74
12-Jun 2:00 a.m. 24 12-Jun 3:00 p.m. 82
12-Jun 3:00 a.m. 19 12-Jun 4:00 p.m. 82
12-Jun 4:00 a.m. 9 12-Jun 5:00 p.m. 81
12-Jun 5:00 a.m. 4 12-Jun 6:00 p.m. 73
12-Jun 6:00 a.m. 7 12-Jun 7:00 p.m. 63
12-Jun 7:00 a.m. 9 12-Jun 8:00 p.m. 54
12-Jun 8:00 a.m. 12
1 991 MaxtOisii ,;(Hourly Aver lges) .ofSurface Level
1:1 amef
ate , Ozone, c-Ozone; -,p0b, zone,,ppb
06-Jan. 5 06-May 47 03-Sept. 75
14-Jan. 16 14-May 67 11-Sept. 106
22-Jan. 29 22-May 84 19-Sept. 30
30-Jan. 12 30-May 122 27-Sept. 41
07-Feb. 22 07-June 59 05-Oct. 38
15-Feb. 28 15-June 106 13-Oct. 58
23-Feb. 39 23-June 44 21-Oct. 36
03-Mar. 22 01-July 63 29-Oct. 32
11-Mar. 36 09-July 61 06-Nov. 24
19-Mar. 43 17-July 122 14-Nov. 19
27-Mar. 22 25-July 60 22-Nov. 23
04-Apr. 47 02-Aug. 119 30-Nov. 37
12-Apr. 45 10-Aug. 58 08-Dec. 24
20-Apr. 32 18-Aug. 105 16-Dec. 27
28-Apr. 50 26-Aug. 53 24-Dec. 6
110
BEST COPY AVAILABLE9 4
COPYRIGHT © 1996
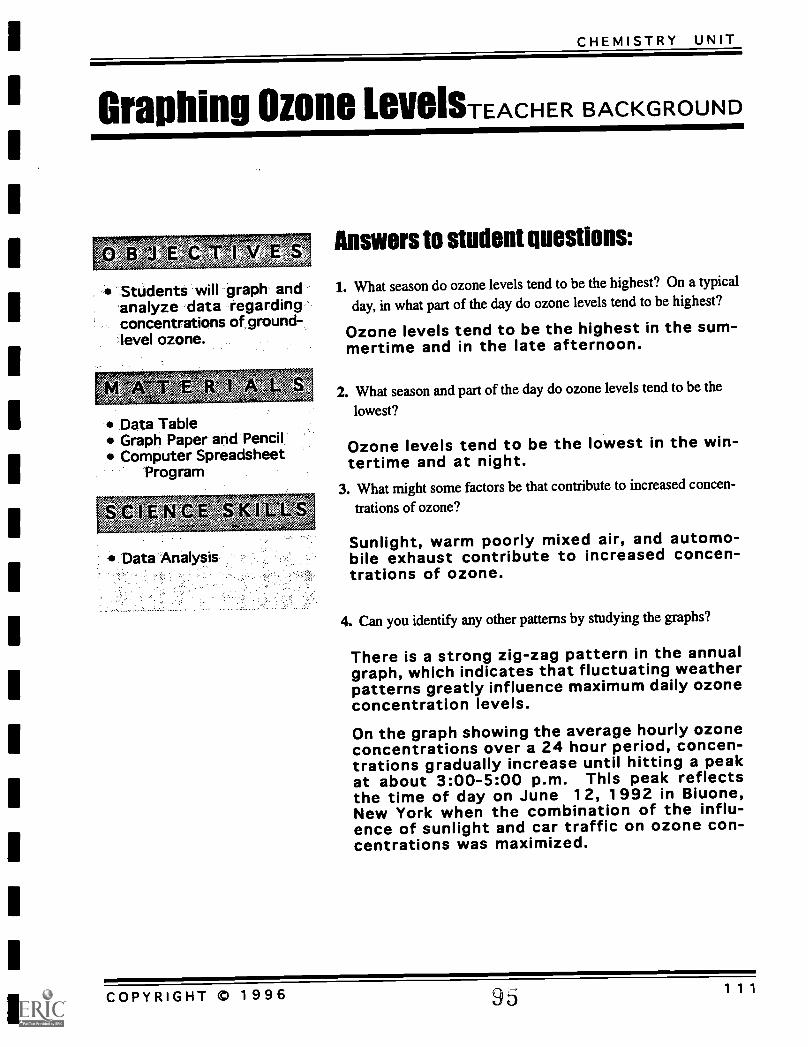
CHEMISTRY UNIT
Graphing Ozone LevelsTEAcHER BACKGROUND
Students will graph andanalyze data regardingconcentrations of ground-level ozone.
A
Data TableGraph Paper and PencilComputer Spreadsheet
Program
Answers to student questions:
1. What season do ozone levels tend to be the highest? On a typical
day, in what part of the day do ozone levels tend to be highest?
Ozone levels tend to be the highest in the sum-mertime and in the late afternoon.
2. What season and part of the day do ozone levels tend to be the
lowest?
Ozone levels tend to be the lowest in the win-tertime and at night.
3. What might some factors be that contribute to increased concen-
trations of ozone?
Sunlight, warm poorly mixed air, and automo-bile exhaust contribute to increased concen-trations of ozone.
4. Can you identify any other patterns by studying the graphs?
There is a strong zig-zag pattern in the annualgraph, which indicates that fluctuating weatherpatterns greatly influence maximum daily ozoneconcentration levels.
On the graph showing the average hourly ozoneconcentrations over a 24 hour period, concen-trations gradually increase until hitting a peakat about 3:00-5:00 p.m. This peak reflectsthe time of day on June 12, 1992 in Biuone,New York when the combination of the influ-ence of sunlight and car traffic on ozone con-centrations was maximized.
COPYRIGHT © 1996 95 1 1 1
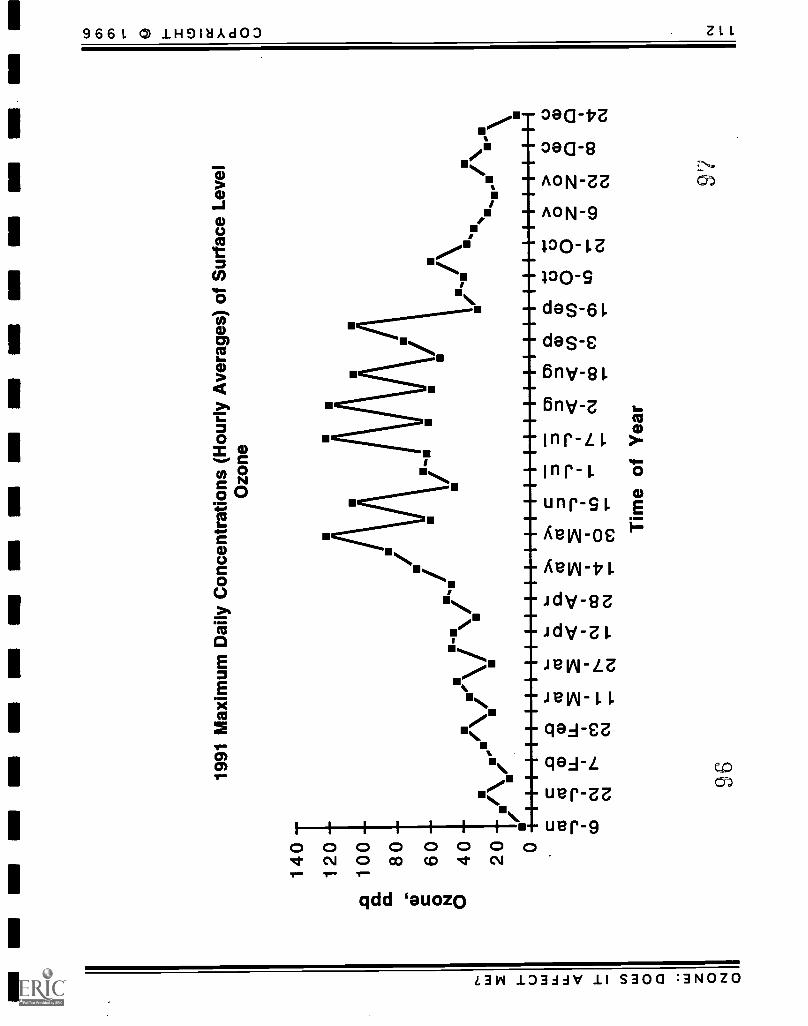
OZONE: DOES IT AFFECT ME?
Cc)
Ozone, ppb
IV 416 0) 03 0000 0
6-Jan
22-Jan MEMO
7-Feb
23-Feb
11 -Mar: 27-Mar.:
12-Apr 28-Apr
14-May- 30-May
15-Jun
1 -Jul : 17-Jul:
2-Aug
18-Aug = 3-Sep
19 -Sep
5 -Oct
21 -Oct 21-Oct-..-
6-Nov - - 22 -Nov
8-Dec
24-Dec
=IMMO
0 IV 0 0 0
112 COPYRIGHT 0 1996
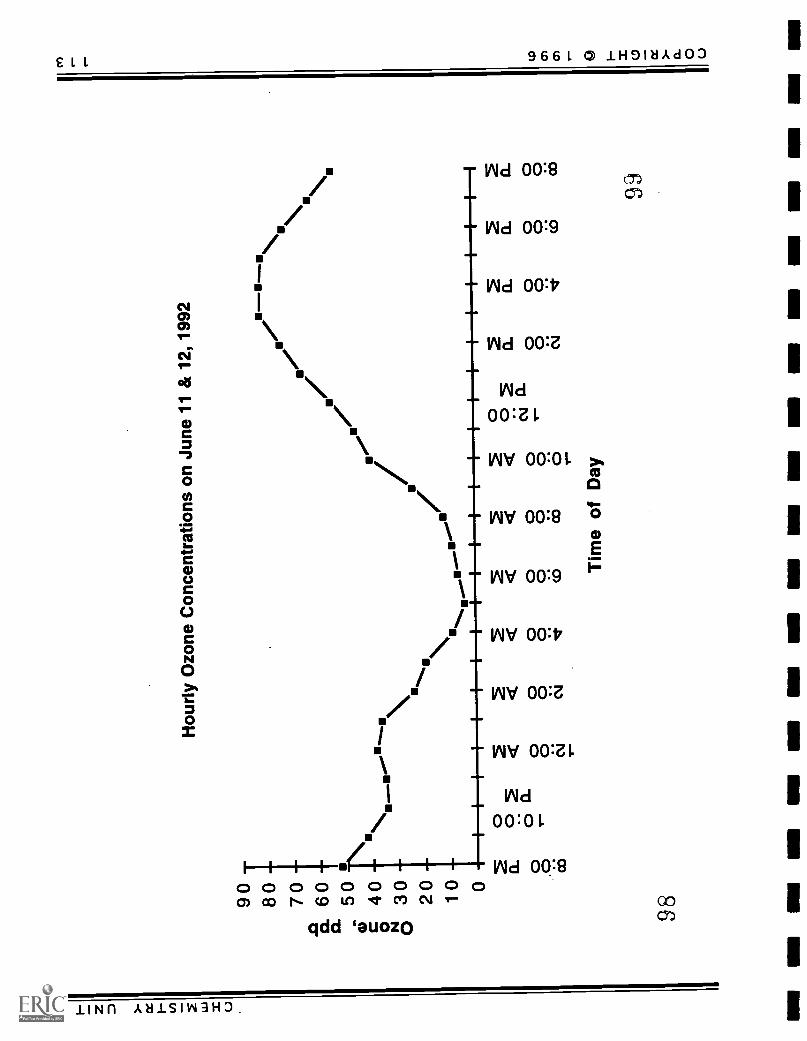
1
1
1
1
1
CHEMISTRY UNIT
00
Ozone, ppb
IV CO 41. CP CO -1 Co CO 0000000000 8:00 PM 4 1 +
10:00 PM
- 12:00 AM I
2:00 AM : _
4:00 AM - 6:00 AM - 8:00 AM-
10:00 AM - N,
12:00 PM
2:00 PM-
4:00 PM
6:00 PM - 8:00 PM -
COPYRIGHT 0 1996 113
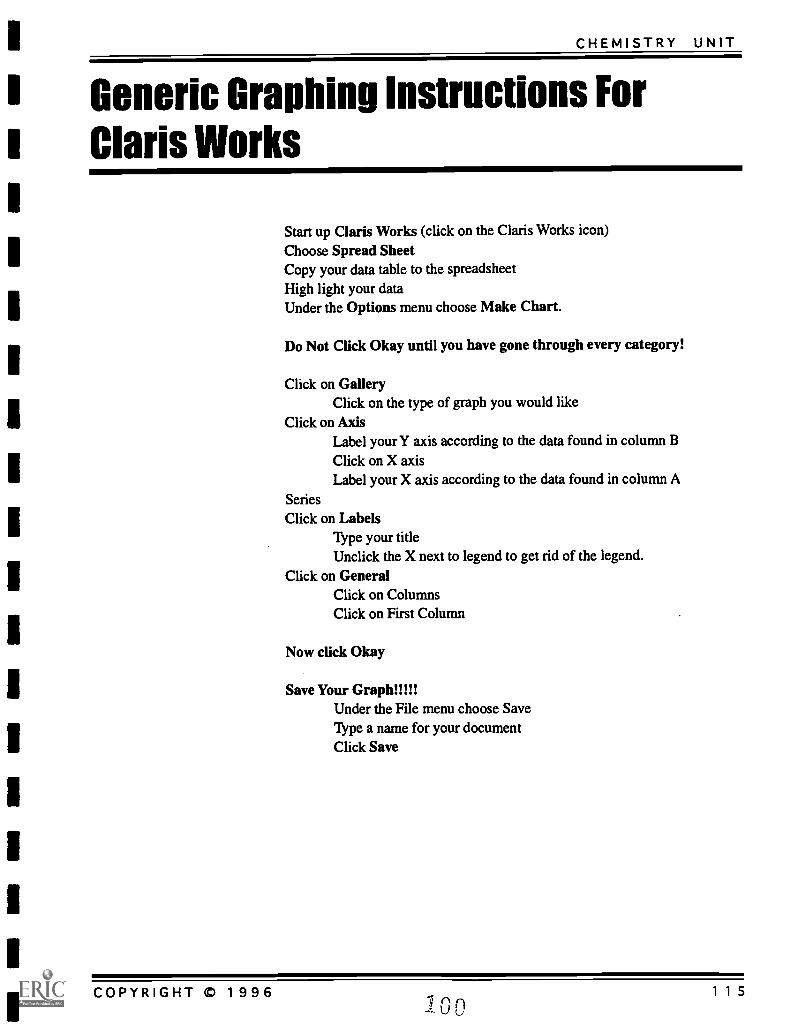
CHEMISTRY UNIT
Generic Graphing Instructions ForClaris Works
Start up Claris Works (click on the Claris Works icon)Choose Spread SheetCopy your data table to the spreadsheetHigh light your dataUnder the Options menu choose Make Chart.
Do Not Click Okay until you have gone through every category!
Click on GalleryClick on the type of graph you would like
Click on AxisLabel your Y axis according to the data foundClick on X axisLabel your X axis according to the data found
in column B
in column ASeriesClick on Labels
Type your titleUnclick the X next to legend to get rid of the legend.
Click on GeneralClick on ColumnsClick on First Column
Now click Okay
Save Your Graph' I !ItUnder the File menu choose SaveType a name for your documentClick Save
COPYRIGHT 0 1996 115100
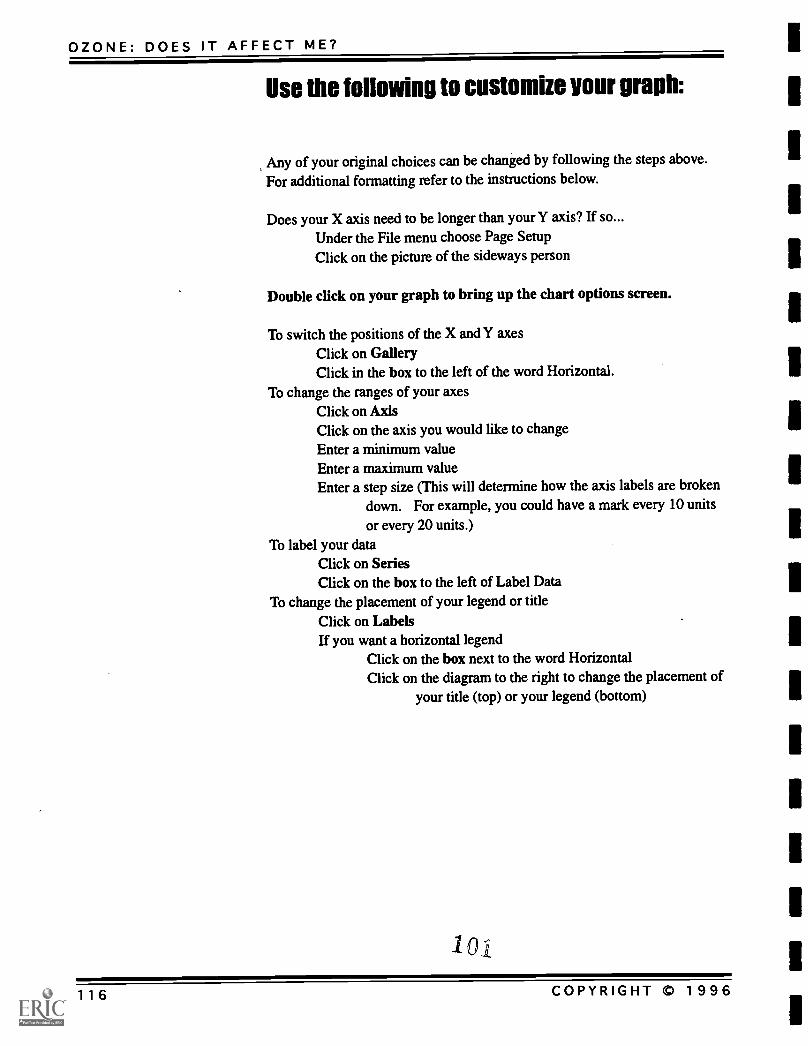
OZONE: DOES IT AFFECT ME?
Use the following to customize your graph:
Any of your original choices can be changed by following the steps above.For additional formatting refer to the instructions below.
Does your X axis need to be longer than your Y axis? If so...Under the File menu choose Page SetupClick on the picture of the sideways person
Double click on your graph to bring up the chart options screen.
To switch the positions of the X and Y axesClick on GalleryClick in the box to the left of the word Horizontal.
To change the ranges of your axesClick on AxisClick on the axis you would like to changeEnter a minimum valueEnter a maximum valueEnter a step size (This will determine how the axis labels are broken
down. For example, you could have a mark every 10 unitsor every 20 units.)
To label your dataClick on SeriesClick on the box to the left of Label Data
To change the placement of your legend or titleClick on LabelsIf you want a horizontal legend
Click on the box next to the word HorizontalClick on the diagram to the right to change the placement of
your title (top) or your legend (bottom)
101
116 COPYRIGHT 0 1996
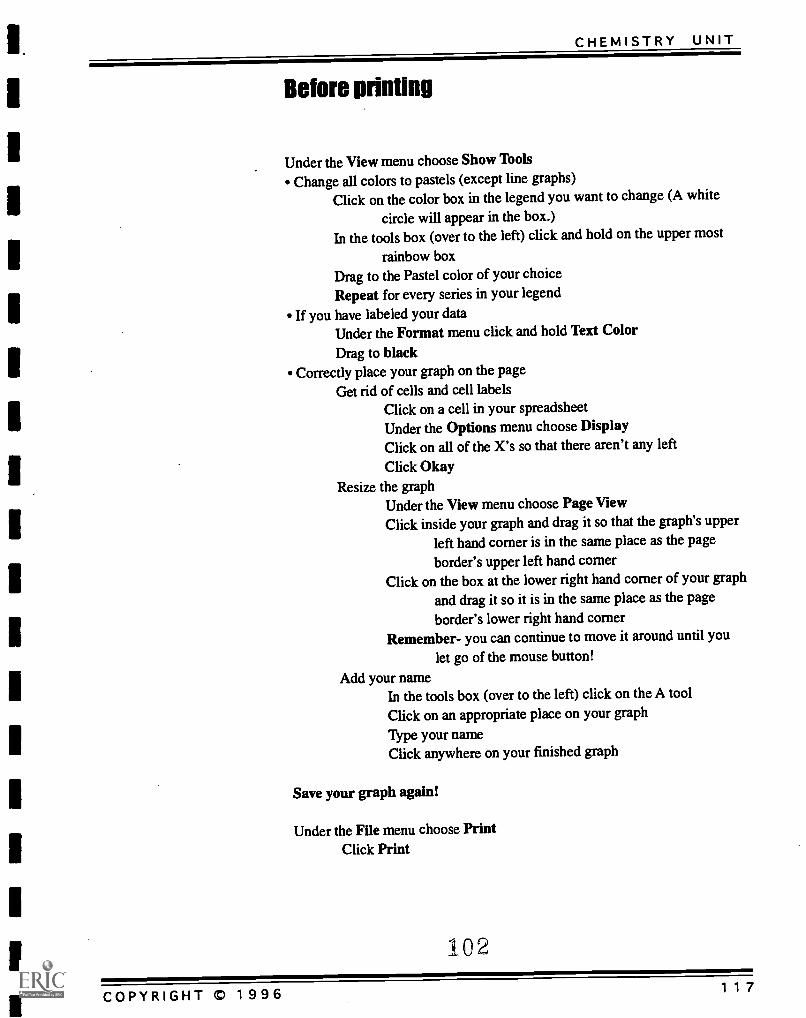
CHEMISTRY UNIT
Before printing
Under the View menu choose Show ToolsChange all colors to pastels (except line graphs)
Click on the color box in the legend you want to change (A white
circle will appear in the box.)In the tools box (over to the left) click and hold on the upper most
rainbow boxDrag to the Pastel color of your choiceRepeat for every series in your legend
If you have labeled your dataUnder the Format menu click and hold Text Color
Drag to blackCorrectly place your graph on the page
Get rid of cells and cell labelsClick on a cell in your spreadsheetUnder the Options menu choose DisplayClick on all of the X's so that there aren't any left
Click OkayResize the graph
Under the View menu choose Page ViewClick inside your graph and drag it so that the graph's upper
left hand corner is in the same place as the pageborder's upper left hand corner
Click on the box at the lower right hand corner of your graph
and drag it so it is in the same place as the pageborder's lower right hand corner
Remember- you can continue to move it around until youlet go of the mouse button!
Add your nameIn the tools box (over to the left) click on theA tool
Click on an appropriate place on your graphType your nameClick anywhere on your finished graph
Save your graph again!
Under the File menu choose PrintClick Print
102
COPYRIGHT © 1996 117
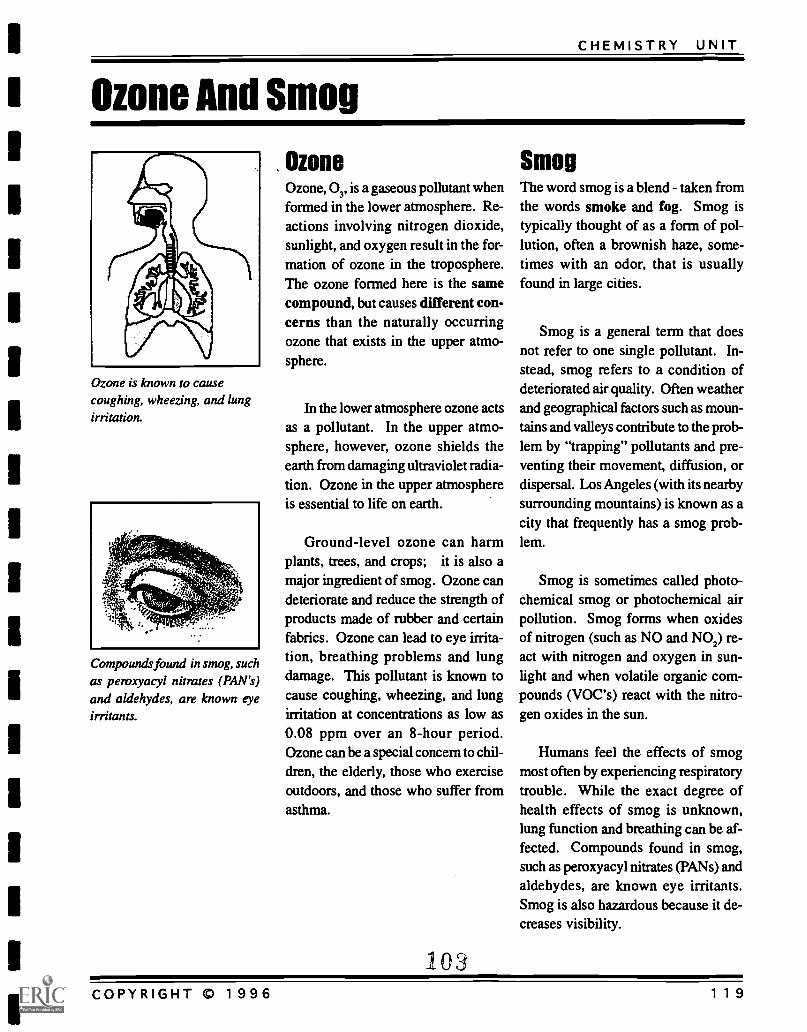
CHEMISTRY UNIT
Ozone And Smog
Ozone is known to cause
coughing, wheezing, and lungirritation.
Compounds found in smog, such
as peroxyacyl nitrates (PAN'S)and aldehydes, are known eyeirritants.
OzoneOzone, 03, is a gaseous pollutant whenformed in the lower atmosphere. Re-actions involving nitrogen dioxide,sunlight, and oxygen result in the for-mation of ozone in the troposphere.The ozone formed here is the samecompound, but causes different con-cerns than the naturally occurringozone that exists in the upper atmo-sphere.
In the lower atmosphere ozone actsas a pollutant. In the upper atmo-sphere, however, ozone shields theearth from damaging ultraviolet radia-tion. Ozone in the upper atmosphereis essential to life on earth.
Ground-level ozone can harmplants, trees, and crops; it is also amajor ingredient of smog. Ozone candeteriorate and reduce the strength ofproducts made of rubber and certainfabrics. Ozone can lead to eye irrita-tion, breathing problems and lungdamage. This pollutant is known tocause coughing, wheezing, and lungirritation at concentrations as low as0.08 ppm over an 8-hour period.Ozone can be a special concern to chil-dren, the elderly, those who exerciseoutdoors, and those who suffer fromasthma.
103
SmogThe word smog is a blend - taken fromthe words smoke and fog. Smog istypically thought of as a form of pol-lution, often a brownish haze, some-times with an odor, that is usuallyfound in large cities.
Smog is a general term that doesnot refer to one single pollutant. In-stead, smog refers to a condition ofdeteriorated air quality. Often weatherand geographical factors such as moun-tains and valleys contribute to the prob-lem by "trapping" pollutants and pre-venting their movement, diffusion, ordispersal. Los Angeles (with its nearbysurrounding mountains) is known as acity that frequently has a smog prob-lem.
Smog is sometimes called photo-chemical smog or photochemical airpollution. Smog forms when oxidesof nitrogen (such as NO and NO2) re-act with nitrogen and oxygen in sun-light and when volatile organic com-pounds (VOC's) react with the nitro-gen oxides in the sun.
Humans feel the effects of smogmost often by experiencing respiratorytrouble. While the exact degree ofhealth effects of smog is unknown,lung function and breathing can be af-fected. Compounds found in smog,such as peroxyacyl nitrates (PANs) andaldehydes, are known eye irritants.Smog is also hazardous because it de-creases visibility.
COPYRIGHT © 1996 119
CHEMISTRY UNIT
Photochemical Smog
Identify and describechemical reactions leadingto the formation ofground-level ozone andphotochemical smog.
Name:
Date:
Period:
NOTE: These notes are to be filled in as
your teacher gives a lecture on"Photochemical Smog."
The unpolluted atmosphere is mainly composed of two elements:
and
THEN CAME THE AUTOMOBILE . . . 1116111130
The type of reaction that occurs in an automobile engine is a
reaction.
In the car engine there are conditions of:
and
These conditions lead to the thermal NOx reaction. Write this
reaction:
104
COPYRIGHT 0 1996 121
OZONE: DOES IT AFFECT ME?
The product of the thermal NOz reaction is nitrogen monoxide,(Write the formula for nitrogen monoxide)
Nitrogen monoxide is generated by the above chemistry in combus-tion processes such as automobiles and power plants. It can subse-quently react with oxygen in air to form nitrogen dioxide. This is areddish-brown gas which is visible to the human eye at high concen-trations (above about 1 ppm). The reaction for the oxidation ofnitrogen monoxide to nitrogen dioxide by oxygen is:
(Make sure the reaction is balanced.)
The product of this reaction can then be decomposed by light ofabout 390 nanometers wavelength to form these products:
NO2 + sunlight ->
Unstable molecules react easily, while unstable molecules do notreact easily. Which of these products is very reactive and unstable?
Write the equation for the formation of ozone:
What does M* refer to in the equation you just wrote?
105
122 COPYRIGHT 0 1996
CHEMISTRY UNIT
What role does the l'vl* play?
Describe the formation of photochemical smog from ozone.
.Some examples of where volatile organic compounds (VOC's) comefrom are:
or
COPYRIGHT m 1996 123
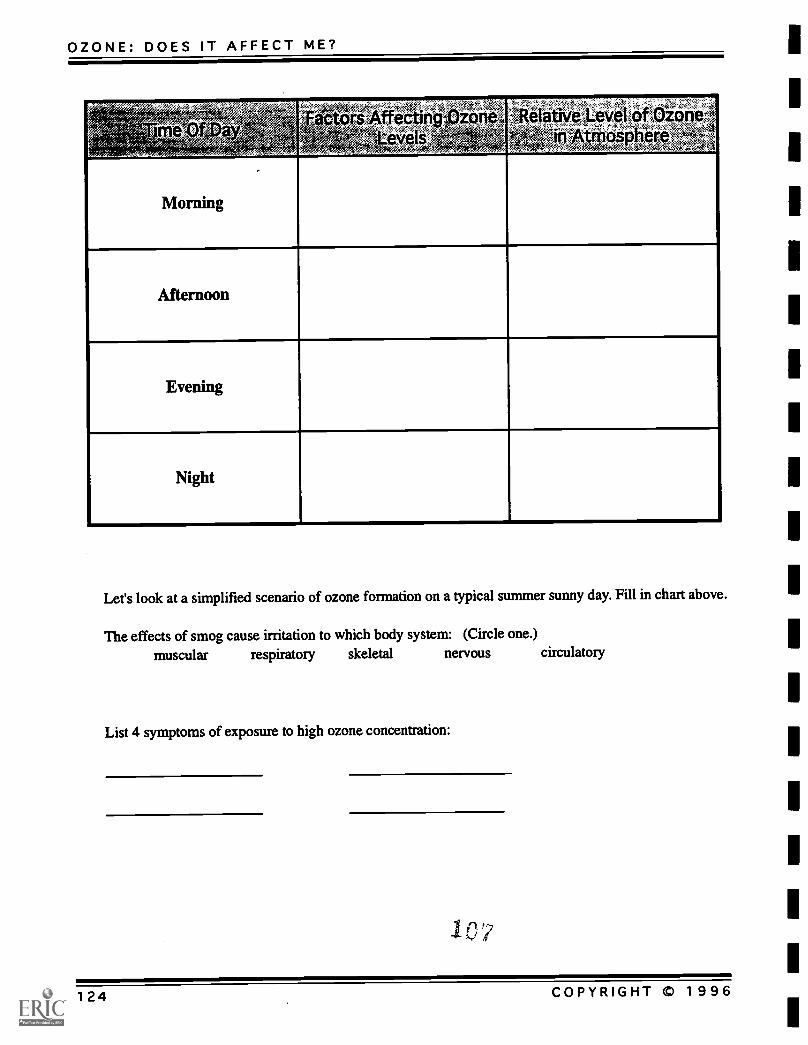
OZONE: DOES IT AFFECT ME?
Morning
c Am 4f ecpnir*zone,, Olathe, 0100, zone
.04
Afternoon
Evening
Night
Lees look at a simplified scenario of ozone formation on a typical summer sunny day. Fill in chart above.
The effects of smog cause irritation to which body system: (Circle one.)
muscular respiratory skeletal nervous circulatory
List 4 symptoms of exposure to high ozone concentration:
124 COPYRIGHT © 1996
CHEMISTRY UNIT
Formation Of Smog TEACHER BACKGROUND
`ttst-T/1 , S:(4/-
Students will identify anddescribe chemical reac-tions leading to the forma-tion of ground-level ozoneand photochemical smog.
AnswersThe unpolluted atmosphere is mainly composed of two elements.
nitrogen and oxygen
THEN CAME THE AUTOMOBILE ....adiallepThe type of reaction that occurs in an automobile engine is a
combustion reaction.
In the car engine there are conditions of:
high temperature and high pressure
These conditions lead to the thermal NO. reaction. Write thisreaction:
-> 2NO
The product of the thermal NO. reaction is nitrogen monoxide,NO . (Write the formula for nitrogen monoxide)
108COPYRIGHT CD 1996 125
OZONE: DOES IT AFFECT ME?
Nitrogen monoxide is generated by the above chemistry in combus-tion processes such as automobiles and power plants. It can subse-quently react with oxygen in air to form nitrogen dioxide. This is areddish-brown gas which is visible to the human eye at high concen-trations (above about 1 ppm). The reaction for the oxidation ofnitrogen monoxide to nitrogen dioxide by oxygen is:
(Make sure the reaction is balanced.)
The product of this reaction can then be decomposed by light ofabout 390 nanometers wavelength to form these products:
NO2 + sunlight -> + Q .
Unstable molecules react easily, while unstable molecules do notreact easily. Which of these products is very reactive and unstable?
Write the equation for the formation of ozone:
0 +
What does M' refer to in the equation you just wrote?
The Ms represents another molecule.
What role does the M* play?
It absorbs excess energy.
103
126 COPYRIGHT © 1996
CHEMISTRY UNIT
Once ozone is formed, it can react to form photochemical smog:
NO. + 03 + VOC + light > photochemical smog + peroxyacetyl
nitrate (PAN)
Some examples of where volatile organic compounds (VOC's) come
from are: escaped gasoline vapor, unburned or partially burned
fuel, slry cleaners, or pri tern.
I 0
COPYRIGHT © 1996 127
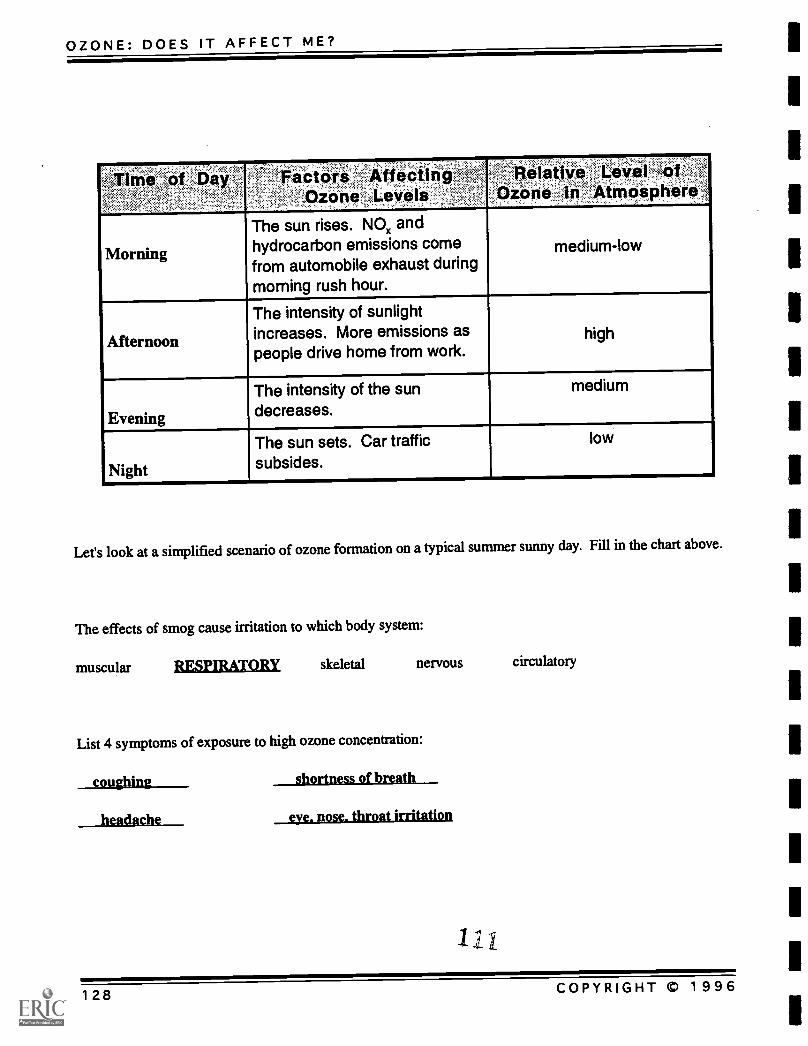
OZONE: DOES IT AFFECT MET
Time' -of Dili-, , , .
,-FictoiS ' Affeailifg, ,
Ozone :Levels -:::::silefative Level of.:ozone in .Atmosphere
Morning
The sun rises. NO andhydrocarbon emissions comefrom automobile exhaust duringmorning rush hour.
medium-low
Afternoon
The intensity of sunlightincreases. More emissions aspeople drive home from work.
high
Evening
The intensity of the sundecreases.
medium
Night
The sun sets. Car trafficsubsides.
low
Let's look at a simplified scenario of ozone formation on a typical summer sunny day. Fill in thechart above.
The effects of smog cause irritation to which body system:
muscular RESPIRATORY skeletal nervous circulatory
List 4 symptoms of exposure to high ozone concentration:
coughing shortness of breath
headache eye. nose. throat irritation
1
111
128 COPYRIGHT m 1996
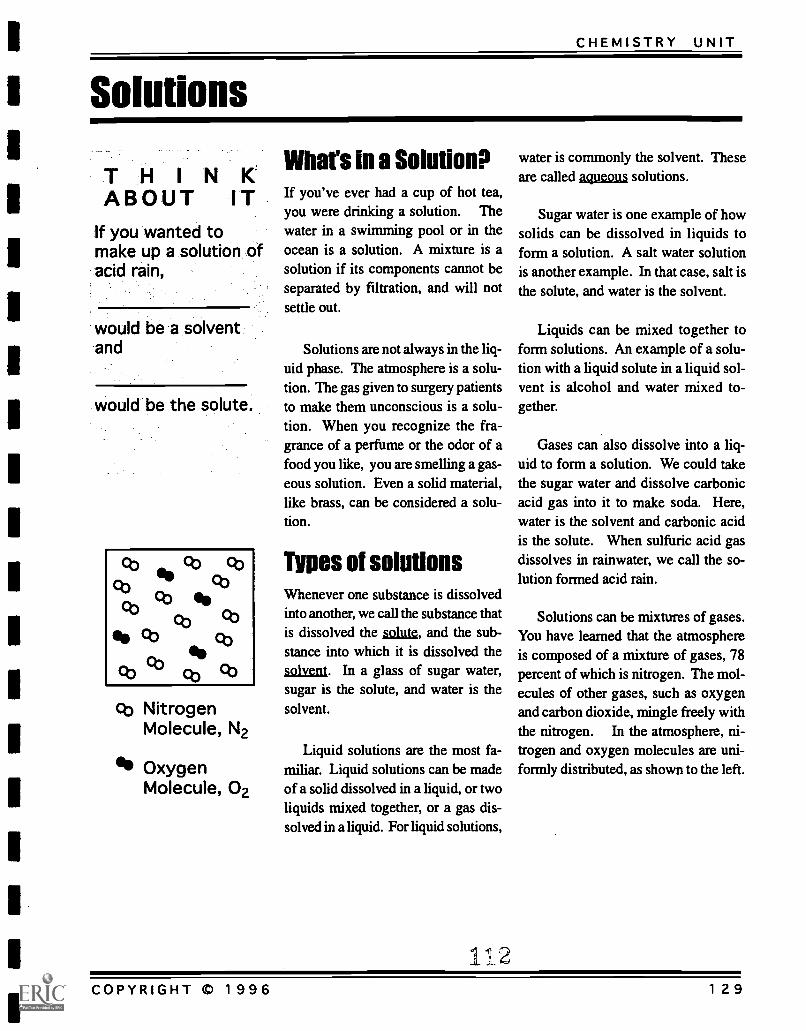
CHEMISTRY UNIT
Solutions
THINK'ABOUT IT
If you wanted tomake up a solution ofacid rain,
would be a solventand
would be the solute.
cb NitrogenMolecule, N2
44 OxygenMolecule, 02
What's in a SolutionPIf you've ever had a cup of hot tea,you were drinking a solution. Thewater in a swimming pool or in theocean is a solution. A mixture is asolution if its components cannot beseparated by filtration, and will notsettle out.
Solutions are not always in the liq-uid phase. The atmosphere is a solu-tion. The gas given to surgery patientsto make them unconscious is a solu-tion. When you recognize the fra-grance of a perfume or the odor of afood you like, you are smelling a gas-eous solution. Even a solid material,like brass, can be considered a solu-tion.
Types of solutionsWhenever one substance is dissolvedinto another, we call the substance thatis dissolved the solute, and the sub-stance into which it is dissolved thesolvent. In a glass of sugar water,sugar is the solute, and water is thesolvent.
Liquid solutions are the most fa-miliar. Liquid solutions can be madeof a solid dissolved in a liquid, or twoliquids mixed together, or a gas dis-solved in a liquid. For liquid solutions,
112
water is commonly the solvent. Theseare called aqueous solutions.
Sugar water is one example of howsolids can be dissolved in liquids toform a solution. A salt water solutionis another example. In that case, salt isthe solute, and water is the solvent.
Liquids can be mixed together toform solutions. An example of a solu-tion with a liquid solute in a liquid sol-vent is alcohol and water mixed to-gether.
Gases can also dissolve into a liq-uid to form a solution. We could takethe sugar water and dissolve carbonicacid gas into it to make soda. Here,water is the solvent and carbonic acidis the solute. When sulfuric acid gasdissolves in rainwater, we call the so-lution formed acid rain.
Solutions can be mixtures of gases.You have learned that the atmosphereis composed of a mixture of gases, 78percent of which is nitrogen. The mol-ecules of other gases, such as oxygenand carbon dioxide, mingle freely withthe nitrogen. In the atmosphere, ni-trogen and oxygen molecules are uni-formly distributed, as shown to the left.
COPYRIGHT 0 1996 129
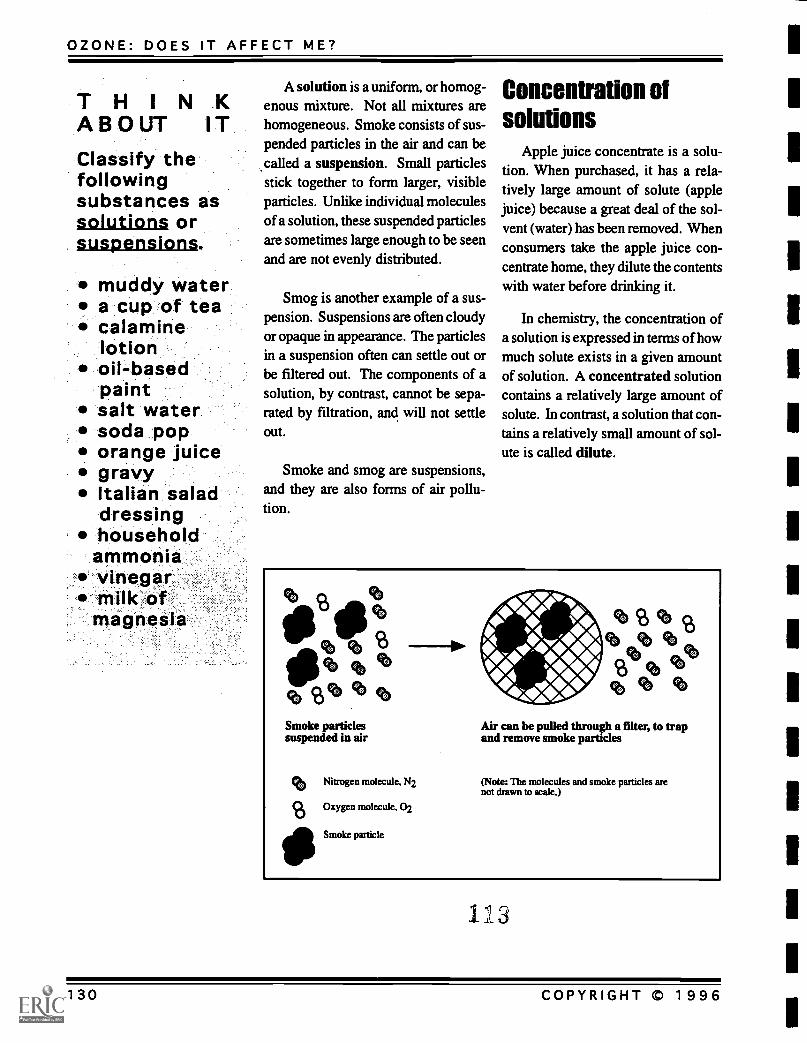
OZONE: DOES IT AFFECT ME?
THINKABOUT IT.Classify thefollowingsubstances assolutions orsuspensions.
muddy watera cup of teacalaminelotionoil-basedpaintsalt watersoda poporange juicegravyItalian saladdressinghouseholdammoniavinegarmilk ofmagnesia
A solution is a uniform, or homog-enous mixture. Not all mixtures arehomogeneous. Smoke consists of sus-pended particles in the air and can becalled a suspension. Small particlesstick together to form larger, visibleparticles. Unlike individual moleculesof a solution, these suspended particlesare sometimes large enough to be seenand are not evenly distributed.
Smog is another example of a sus-pension. Suspensions are often cloudyor opaque in appearance. The particlesin a suspension often can settle out orbe filtered out. The components of asolution, by contrast, cannot be sepa-rated by filtration, and will not settleout.
Smoke and smog are suspensions,and they are also forms of air pollu-tion.
Concentration ofsolutions
Apple juice concentrate is a solu-tion. When purchased, it has a rela-tively large amount of solute (applejuice) because a great deal of the sol-vent (water) has been removed. Whenconsumers take the apple juice con-centrate home, they dilute the contentswith water before drinking it.
In chemistry, the concentration ofa solution is expressed in terms of howmuch solute exists in a given amountof solution. A concentrated solutioncontains a relatively large amount ofsolute. In contrast, a solution that con-tains a relatively small amount of sol-ute is called dilute.
Smoke particlessuspended in air
(lb Nitrogen molecule, N2
(2)Oxygen molecule, 02
illSmoke particle
Air can be pulled through a filter, to trapand remove smoke particles
(Note: The molecules and smoke particles arenot drawn to scale.)
13
130 COPYRIGHT 0 1996
CHEMISTRY UNIT
EXAMPLEQuestion:
A solution is 12percent ammoniaby volume.Express thisconcentration inparts perhundred, pph.
Answer
12 % is the sameas 12 pph, so theconcentration is12 pph.
Cola syrup from a soda machine isanother example of a concentrated so-lution. When soda water is added, thesolution is diluted. The terms "con-centrated" and "dilute", however, arenot exact expressions. There are sev-eral ways of measuring the concentra-tion of solutions so that their exact levelof concentration is known. One wayof measuring concentrations of solu-tions is to refer to the percent concen-tration.
Solutions related to atmosphericchemistry are often dilute solutions.The amount of ozone in the atmospherecompared to other gases, for example,is small. Dilute solutions are oftenmeasured in terms of parts per mil-lion.
Relationships between percents (bymass or volume) and parts per millionwill be discussed below.
1 . Theatmosphereconsists of 78%nitrogen, 21%oxygen, and 1%other gases.What is thecomposition ofthe atmospherein terms of partsper hundred?
VVhat is theconcentration in partsper hundred of a brand-of syrup that contains7% pure maple syrup?
3. A soda is 21 partsper hundred sugar.What is the percentconcentration of sugarin the soda?
Concentrations as aPercent by Volume
Sometimes concentrations are ex-pressed as percent by volume. Thevolume of the solute can be divided bythe total volume of the solution to de-termine the percent concentration ofthe solution. For example, rubbing al-cohol in the medicine cabinet may bea 5% solution of alcohol. This meansthat if there are 100 milliliters of solu-tion in the bottle, 5 milliliters are purealcohol. The remaining 95 millilitersare pure water. Five milliliters of purealcohol (the solute) divided by 100milliliters of solution equals a 5% so-lution of rubbing alcohol.
Another way of expressing percentis "parts per hundred" So we can saythat the bottle of rubbing alcohol is a5% solution, or it is a 5 parts per hun-dred solution of rubbing alcohol.
COPYRIGHT 1 996 1 3 1
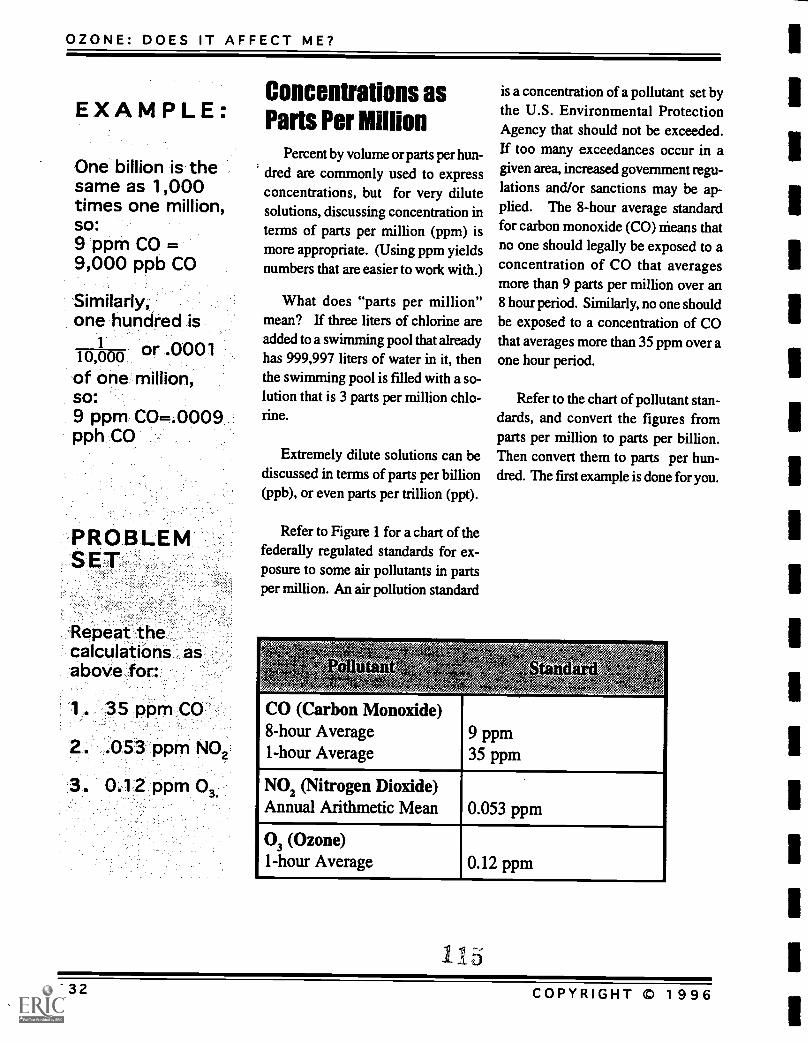
OZONE: DOES IT AFFECT ME?
EXAMPLE:
One billion is thesame as 1,000times one million,so:9 ppm CO =9,000 ppb CO
Similarly,one hundred is
1 or .000110,000of one million,so:9 ppm CO= .0009.pph CO
PROBLEMSET
Repeat thecalculations asabove for:
.053 ppm NO2
3. 0.12 ppm 03.
Concentrations asParts Per Million
Percent by volume or parts per hun-dred are commonly used to expressconcentrations, but for very dilutesolutions, discussing concentration interms of parts per million (ppm) ismore appropriate. (Using ppm yieldsnumbers that are easier to work with.)
What does "parts per million"mean? If three liters of chlorine areadded to a swimming pool that alreadyhas 999,997 liters of water in it, thenthe swimming pool is filled with a so-lution that is 3 parts per million chlo-rine.
Extremely dilute solutions can bediscussed in terms of parts per billion(ppb), or even parts per trillion (ppt).
Refer to Figure 1 for a chart of thefederally regulated standards for ex-posure to some air pollutants in partsper million. An air pollution standard
is a concentration of a pollutant set bythe U.S. Environmental ProtectionAgency that should not be exceeded.If too many exceedances occur in agiven area, increased government regu-lations and/or sanctions may be ap-plied. The 8-hour average standardfor carbon monoxide (CO) means thatno one should legally be exposed to aconcentration of CO that averagesmore than 9 parts per million over an8 hour period. Similarly, no one shouldbe exposed to a concentration of COthat averages more than 35 ppm over aone hour period.
Refer to the chart of pollutant stan-dards, and convert the figures fromparts per million to parts per billion.Then convert them to parts per hun-dred. The first example is done for you.
CO (Carbon Monoxide)8-hour Average1-hour Average
9 ppm35 ppm
NO2 (Nitrogen Dioxide)Annual Arithmetic Mean 0.053 ppm
03 (Ozone)1-hour Average 0.12 ppm
1i132 COPYRIGHT © 1996
CHEMISTRY UNIT
Solutions TEACHER BACKGROUND
Answer Key to Solutions Problem Sets
Think about it
If you wanted to make up a solution of acid rain, rainwater wouldbe a solvent and sulfuric acid would be the solute.
Think about it
Classify the following substances as solutions or suspensions.
muddy water (sus)a cup of tea (sol)calamine lotion (sus)oil-based paint (sus)salt water (sol)soda pop (sol)orange juice (sus)gravy (sus)Italian salad dressing (sus)household ammonia (sol)vinegar (sol)milk of magnesia (sus)
(continued on next page)
COPYRIGHT © 1996 133
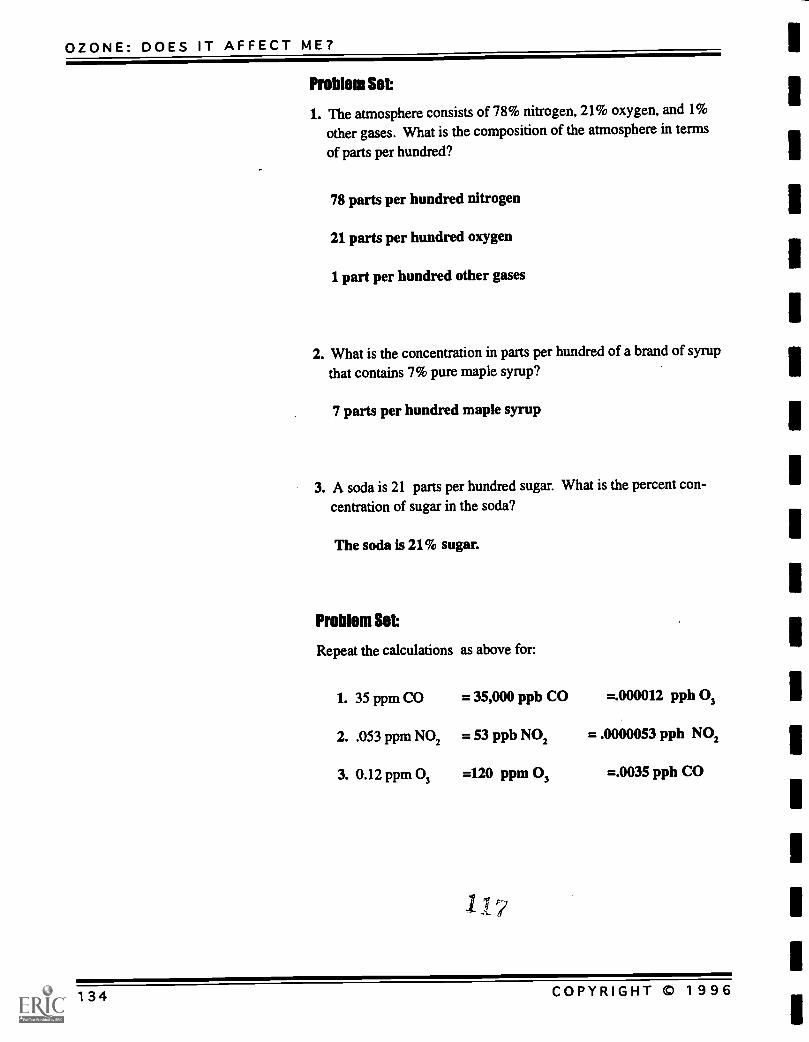
OZONE: DOES IT AFFECT ME?
Problem Set
1. The atmosphere consists of 78% nitrogen, 21% oxygen, and 1%
other gases. What is the composition of the atmosphere in terms
of parts per hundred?
78 parts per hundred nitrogen
21 parts per hundred oxygen
1 part per hundred other gases
2. What is the concentration in parts per hundred of a brand of syrupthat contains 7% pure maple syrup?
7 parts per hundred maple syrup
3. A soda is 21 parts per hundred sugar. What is the percent con-centration of sugar in the soda?
The soda is 21% sugar.
Problem Set
Repeat the calculations as above for:
1. 35 ppm CO = 35,000 ppb CO =.000012 pph 03
2. .053 ppm NO2 = 53 ppb NO2 = .0000053 pph NO2
3. 0.12 ppm 03 =120 ppm 03 =.0035 pph CO
7
134 COPYRIGHT m 1996
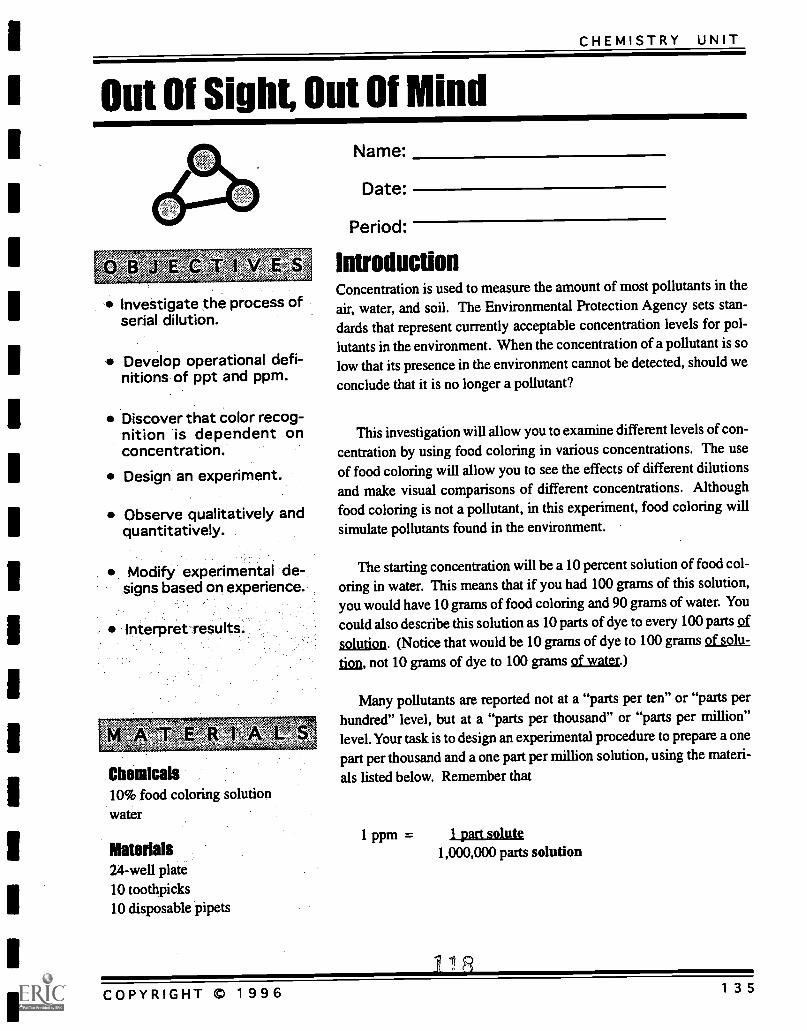
CHEMISTRY UNIT
Out Of Sight Out Of Mind
Investigate the process ofserial dilution.
Develop operational defi-nitions of ppt and ppm.
Discover that color recog-nition is dependent onconcentration.
Design an experiment.
Observe qualitatively andquantitatively.
Modify experimental de-signs based on experience.
Chemicals10% food coloring solutionwater
Materials24-well plate10 toothpicks10 disposable pipets
Name:
Date:
Period:
IntroductionConcentration is used to measure the amount of most pollutants in the
air, water, and soil. The Environmental Protection Agency sets stan-dards that represent currently acceptable concentration levels for pol-
lutants in the environment. When the concentration of a pollutant is so
low that its presence in the environment cannot be detected, should we
conclude that it is no longer a pollutant?
This investigation will allow you to examine different levels of con-
centration by using food coloring in various concentrations. The use
of food coloring will allow you to see the effects of different dilutions
and make visual comparisons of different concentrations. Although
food coloring is not a pollutant, in this experiment, food coloring will
simulate pollutants found in the environment.
The starting concentration will be a 10 percent solution of food col-oring in water. This means that if you had 100 grams of this solution,
you would have 10 grams of food coloring and 90 grams of water. You
could also describe this solution as 10 parts of dye to every 100 partsslf
5olution. (Notice that would be 10 grams of dye to 100 grams of solu-tion, not 10 grams of dye to 100 grams of water.)
Many pollutants are reported not at a "parts per ten" or "parts perhundred" level, but at a "parts per thousand" or "parts per million"level. Your task is to design an experimental procedure to prepare a onepart per thousand and a one part per million solution, using the materi-
als listed below. Remember that
1 ppm = 1 p. solute1,000,000 parts solution
1 17
COPYRIGHT © 1996 1 3 5
OZONE: DOES IT AFFECT ME?
Make a Data Table for recording the concentration and careful obser-vations of the color for every solution you make in each step of the
procedure.
Your lab report should include the following
A. Describe the PURPOSE of the experiment- What was your task?
B. Under the heading PROCEDURE, outline the steps you carriedout.
C. Display a copy of your DATA TABLE and observations.
D. Report on the RESULTS. Evaluate the results of your procedure,explain how your conclusions are based on your observations, anduse your results to comment on the question posed in the first para-
graph:
"When the concentration of a pollutant is so low that its presence in theenvironment can no longer be detected, should we conclude that it isno longer a pollutant?"
115
136 COPYRIGHT © 1996
CHEMISTRY UNIT
Questions to get you started1. A 10% solution is the same as how many parts per hundred? This
concentration is the same as how many parts per ten?
2. In this lab, what is the solute? What is the solvent? What does thesolution consist of?
3. Draw a model of one drop of 10% solution of food coloring. Howmany equal parts should you divide the drop into? How many partsshould you color in to represent the amount of pure food coloringpresent in the drop?
4. Try combining any number of drops of solute and solvent in the firstwell. Draw models of your drops as in question # 3 Express thenew concentration of the solution you have created in parts perCheck with your teacher to see if you have expressed the concentra-tion correctly.
5. Now what?
More questions to concentrate on1. How many wells did you use to get a 1 part per million concentra-
tion of food coloring in water? To how many wells would you needto extend this experiment to get a one part per billion concentration?How about a one part per trillion concentration?
2. One gallon of chlorine in the Heman Park swimming pool is thesame as one part per million. One pinch of salt on 10 tons of potatochips would be the equivalent of 1 part per billion. So would oneinch out of a 16,000 mile journey, which is approximately the sameas chartering a direct round trip flight from St. Louis, MO to Calcutta,India. One part per trillion is approximately equal to a six inch stepon the way to the sun. Invent your own comparative example ofparts per million, billion or trillion.
COPYRIGHT © 1996 137
CHEMISTRY UNIT
Out Of SightOut Of Mind TEACHER BACKGROUND
Students will:
Investigate the process ofserial dilution.
Develop operational defi-nitions of ppt and ppm.
Discover that color recog-nition is dependent onconcentration.
Design an experiment.
Observe qualitatively andquantitatively.
Modify experimental designs based on experience.
Interpret results.
Chemicals10% food coloring solutionwater
Materials24-well plate10 toothpicks10 disposable pipets
- 2
_SCIEN C E SKILL
Laboratory Procedures
Students spend one day in the lab designing a procedure and data table,and carrying out the experiment. Students turn in a lab report thatincludes a write-up of the procedure.
Notes and expected outcomesMost students will develop a plan in which they use consistent dropsize and serial dilution to prepare the desired solutions. Their proce-dures should clearly identify the number of drops of 10% food color-ing solution and water used. If one drop of 10% solution in mixed with9 drops of water, then a "one part per hundred" solution will be pre-pared. Taking one drop of that solution, after careful mixing, and dilu-tion with 9 drops of water will create a "one part per thousand" mix-ture, and so on. The color will be detected by students at differentlevels, but certainly no color can be detected by the eye at the "one partper million" level. This does not mean that no food coloring is present,
it just means the level is too low to be detected visually.
Suggested scoring check sheetRented Maximum of 15 points; 5 points of Extra Credill
The procedure is appropriate and complete. (5 points maximum)
Observations and data are well-organized and easily understood.(5 points maximum)
Conclusions are drawn and are based on available evidence.
(5 points maximum)
Extra credit work is present, such as a good discussion of the limits ofdetection, redesigning the experiment for the future, and/or sophisti-
cated error analysis. (+5 points maximum)
COPYRIGHT © 1996 139
121
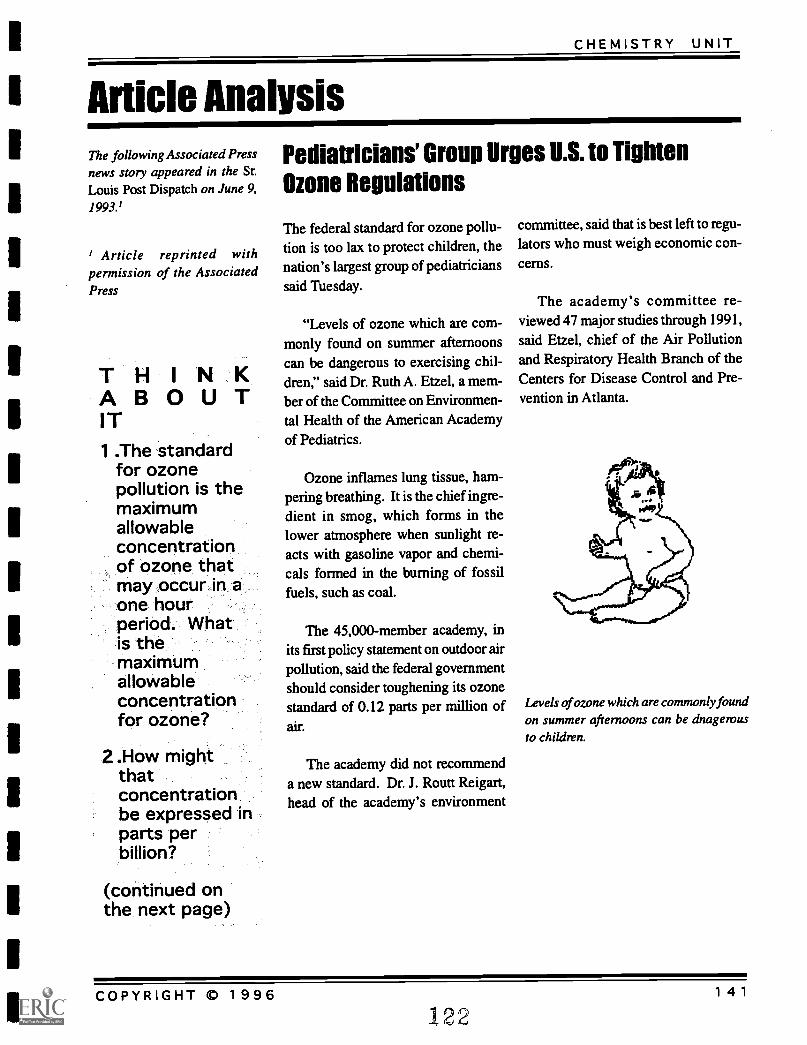
CHEMISTRY UNIT
Article AnalysisThe following Associated Pressnews story appeared in the Sr.Louis Post Dispatch on June 9,1993.'
Article reprinted withpermission of the AssociatedPress
THINKABOUTIT1 The standard
for ozonepollution is themaximumallowableconcentrationof ozone thatmay occur, in aone hourperiod. Whatis themaximumallowableconcentrationfor ozone?
2 .How mightthatconcentrationbe expressed inparts perbillion?
(continued onthe next page)
Pediatricians' Group Urges U.S. to Tighten
Ozone Regulations
The federal standard for ozone pollu-tion is too lax to protect children, thenation's largest group of pediatricianssaid Tuesday.
"Levels of ozone which are com-monly found on summer afternoonscan be dangerous to exercising chil-dren," said Dr. Ruth A. Etzel, a mem-ber of the Committee on Environmen-tal Health of the American Academyof Pediatrics.
Ozone inflames lung tissue, ham-pering breathing. It is the chief ingre-dient in smog, which forms in thelower atmosphere when sunlight re-acts with gasoline vapor and chemi-cals formed in the burning of fossilfuels, such as coal.
The 45,000-member academy, inits first policy statement on outdoor airpollution, said the federal governmentshould consider toughening its ozonestandard of 0.12 parts per million ofair.
The academy did not recommenda new standard. Dr. J. Routt Reigart,head of the academy's environment
committee, said that is best left to regu-lators who must weigh economic con-cerns.
The academy's committee re-viewed 47 major studies through 1991,said Etzel, chief of the Air Pollutionand Respiratory Health Branch of theCenters for Disease Control and Pre-vention in Atlanta.
Levels of ozone which are commonly foundon summer afternoons can be dangerousto children.
COPYRIGHT m 1996 141
122
OZONE: DOES IT AFFECT ME?
3. Theinformation inthe exercise"GraphingOzone Data"(see pg. 103)is taken fromactual recordsof ozoneconcentrationsin Buione, N.Y.This data isrepresentative,however, oftrends found inmost countiesof the UnitedStates. Do theozone levels inBuione everexceed federalstandards? Ifnot, how closedoes thehighest readingcome toapproachingthe standard?If so, when isthe standardexceeded?
4. Do you agreewith thepediatricians'recommendationin theprecedingarticle? Whyor why not?What furtherinformationwould help youin making thisdecision?
The academy's recommendation,along with suggestions for better pol-
lution prevention and medical advice
for children, is published in the June
issue of the journal of Pediatrics, re-
leased Tuesday.
Lung inflammation occurs in any-
one exposed to ozone, but asthmat-
icsone in 20 youngstersmay have
their lung problems worsened for life
by exposure to substances that trigger
attacks, Reigart said in a telephone in-
terview.
"There's been this enormous up-surge of asthma and asthma-relateddeaths in this country, and ozone is one
of the reasons," said Reigart, an asso-ciate professor of pediatrics at the
Medical University of South Carolina
in Charleston.
12,3
The Environmental ProtectionAgency, which sets air-pollution stan-dards for the federal government, in
March refused to tighten the rules onozone, despite a suit filed by health
groups.
In order to meet a deadline set by a
U.S. District Court in New York toupdate air-quality standards, the EPA
reissued the standard it set in 1978,
saying studies through 1989 did notwarrant a change.
The agency promised to review re-
cent research, acknowledging that
some of it suggests tougher standards
may be warranted.
It is not known when the review
will be done, said the EPA's John H.
Haines, who is in charge of develop-ing new standards.
142COPYRIGHT © 1996
CHEMISTRY UNIT
SL Louis Ozone Task Force
Students will
Analyze ozone pollutiondata
Create 'a solution for theproblem of ozone pollution
Effectively communicateresults
Raw data on ozone pollu-lion -for:one year, one setper teaM or individual
Access to computers, ipossible
Instruction sheets
Name:
Date:
Period:
An ozone community task force has been assembled to attempt toreduce ozone pollution in the St. Louis area. St. Louis has exceededthe current standard of .12 ppm ozone concentration several timeseach summer. If the number of days that the concentration of ozoneis exceeded in St. Louis is not lowered by November, 1996, St.Louis's non-attainment status may be revised from "moderate" to"serious". Significant government regulation and/or withdrawal ofgovernment funds could follow.
Your team is made up of the following professions representing thecommunity:
1. City Planner, Politician, or Corporate CEO.
2. Engineer, Inventor, Research Scientist, or Architect
3. Educator, Writer, or Journalist
Your task is to answer the questions below, determine when ozonepollution is a problem and why, and develop a suggested solution tothe problem, based on the data at hand as well as the expertise yourprofession has to offer. Your task force will report the results to CityHall in group and individual written depositions.
1. Each member of the team should select which profession theywould like to represent, now. Each team member must represent adifferent profession.
2. Give your task force a name.
124COPYRIGHT © 1996 143
OZONE: DOES IT AFFECT ME?
3. The following steps are to be completed as a group. You may
divide up the work in any way you choose, or work on it alltogether. Your group will receive a score for time spent on taskduring meeting time as observed by the Mayor. This score willcount towards 33% of the overall score your group receives in its
report. Any work not completed in class must be done after
school. No extensions will be given.
A. Determine from the data available the time of day and yearwhen ozone levels tend to be the highest in St. Louis. Supportyour answers with a chart or graph.
B. The current standard for ozone is .12 ppm over a one hourperiod. A standard is a level of pollution set by the EPA whichshould not be exceeded. If the level exceeds .12 ppm over a onehour period three or more times per year, then St. Louis is inviolation of the standard.
Health studies have shown that ozone levels canadversely affect health, especially in children, at levels aslow as .08 ppm over a six hour period. As a result ofthese studies, the EPA standard may change from .12ppm over a one hour period to .08 ppm over a six hourperiod. What kind of impact might this change have inSt. Louis on the number of exceedances of the ozonestandard per year? Will the number of exceedancesincrease, decrease, or stay the same? Support youranswer with a chart or graph.
C. Use information from the Ozone Scavenger Hunt, the data youhave collected, and what you have learned previously to discussfactors that may contribute to the ozone pollution problem in St.Louis.
D. Develop a task force report. Include in the report your re-sponses to A, B, and C above. All members of the team will
144 COPYRIGHT m 1996
CHEMISTRY UNIT
receive the same score from city hall for the task force report.
4. The following assignment is to be completed individually. Makea suggestion for how ozone pollution levels can be reduced in St.
Louis, based on the studies of your task force, and the expertiseyour profession has to offer. Inventors invent things, educatorseducate, politicians pass legislation, city planners design howcities function, etc. Recommendations will receive individualscores from City Hall. Your report should include the following:
A. List your name, your task force name, and the name of yourprofession.
B. From the point of view of a representative of your profession,should the ozone standard be changed? Why or why not?
C. Explain your proposal to reduce ozone levels in St. Louis thatutilizes the expertise of your profession.
12
COPYRIGHT 0 1996 145
CHEMISTRY UNIT
SL Louis Task Force TEACHER BACKGROUND
Students will
Analyze ozone pollutiondata
'Create a solution for theproblem of ozonepollution
Effectively communicateresultS
Raw data on ozonepollution for one year,one set per team orindividual
Access to computers,possible
Instruction sheets
Data AnalysisProblem SolvingCommunicating Results
Notes and Expected OutcomesThis activity is based on St. Louis data. To revise this activity toapply to your local area, use the form letter at the end of these teacherpages to ask the USEPA for data on ozone levels where you live.
Cooperative LearningThis activity contains the essential components of a cooperativelearning exercise, as outlined below.
Positive interdependenceStudents prepare and submit one written analysis of the ozone prob-lem per group. A single grade is given for the group report. Otherpossibilities include providing one computer per group, or giving eachindividual in the group different data subsets.
Individual AccountabilityEach of the three students must come up with a plan to reduce emis-sions, each from a different point of view:
1. City Planner, Politician, or Corporate CEO.
2. Engineer, Inventor, Research Scientist or Architect
3. Educator, Writer, or Journalist
Students write individual reports, for which they receive individualgrades.
Criteria for SuccessClearly identify the criteria for success for the lesson and communi-cate it to students. The materials state that "Your task is to answer thequestions below, determine the main factors contributing to ozonepollution, and develop a suggested solution to the problem, based onthe data at hand as well the expertise your profession has to offer.Your task force will report the results to City Hall in group andindividual written depositions."
COPYRIGHT 0 1996
9',/BEST COPY AVAILABLE
1 4 7
DATE: 11/03/95
AMP350
EPA AEROMETRIC INFORMATION RETRIEVAL
SYSTEM (AIRS)
PAGE
13
AIR QUALITY SUBSYSTEM
RAW DATA REPORT
1-HOUR LISTING
(44201) OZONE
CAS NUMBER: 10028156
STATE (29): MISSOURI
APR 1994
SITE-ID: 29-189-0006
POC:
1MICR (070): METROPOLITAN ST. LOUIS
LATITUDE:
38:36:49 N
COUNTY (189):
ST LOUIS CO
URBAN-AREA (0000):NOT IN AN URBAN AREA
LONGITUDE: 90:29:45 V
CITY (00000):
NOT IN A CITY
LAND USE (1): RESIDENTIAL
UTM ZONE: 15
SITE ADDRESS:
305 WEIDMAN ROAD (QUEENY)
LOCATION SETTING (3): RURAL
UTM- NORTHING: 4276698
SUPPORT AGENCY (002): ST LOUIS COUNTY
HEALTH DEPARTMENT AIR PO
UTM-EASTING:
718034
SITE COMMENTS:
ILLINOIS GRID 406 E 708 N
ELEVATION -MSL:
175 N
MONITOR COMMENTS: 11
PROBE HEIGHT:
4 M
MONITOR TYPE (2): SLAMS
MINIMUM DETECTABLE:
.005
INTERVAL: 1
UNITS (007): PPM
REPORTING ORGANIZATION (002): ST LOUIS
COUNTY HEALTH DEPARTM
COLLECTION AND ANALYSIS METHOD (014):
INSTRUMENTAL ULTRA VIOLET
DAY/HOUR
0000 0100 0200 0300 0400 0500 0600 0700
0800 0900 1000 1100 1200 1300 1400
1500 1600 1700 1800 1900 2000 2100 2200
2300 OBS MAX
MN
MN
NM
MN
NM
=I M
I MN
NM
I= N
M M
NIII
IIM
N
DATE: 11/03/95
EPA AERONETRIC INFORMATION RETRIEVAL SYSTEM (AIRS)
PAGE
14
ANP350
AIR QUALITY SUBSYSTEM
RAW DATA REPORT
1-HOUR LISTING
(44201) OZONE
CAS NUMBER: 10028156
STATE (29): MISSOURI
NAY 1994
-
SITE-ID: 29-189-0006
POC: 1
AQCR (070): METROPOLITAN ST. LOUIS
LATITUDE:
38:36:49 N
COUNTY (189):
ST LOUIS CO
URBAN-AREA (0000):NOT IN AN URBAN AREA
LONGITUDE: 90:29:45 V
CITY (00000):
NOT IN A CITY
LAND USE (1): RESIDENTIAL
UTM ZONE: 15
SITE ADDRESS:
305 WEIDMAN ROAD (QUEENY)
-LOCATION SETTING (3): RURAL
UTM-NORTHING: 4276698
SUPPORT AGENCY (002): ST LOUIS COUNTY HEALTH DEPARTMENT AIR PO
UTN-EASTING:
718034
SITE COMMENTS:
ILLINOIS GRID 406 E 708 N
ELEVATION-MSL:
175 N
MONITOR COMMENTS: 11
PROBE HEIGHT:
4 N
MONITOR TYPE (2): SLAMS
MINIMUM DETECTABLE:
.005
INTERVAL: 1
UNITS (007): PPM
REPORTING ORGANIZATION (002): ST LOUIS COUNTY HEALTH DEPARTN
COLLECTION AND ANALYSIS METHOD (014): INSTRUMENTAL ULTRA VIOLET
DAY /HOUR
0000 0100 0200 0300 0400 0500 0600 0700 0800 0900 1000 1100 1200 1300 1400 1500 1600
1700 1800 1900 2000 2100 2200 2300 OBS MAX
DATE: 11/03/95
AMP350
(44201) OZONE
EPA AERONETRIC INFORMATION RETRIEVAL SYSTEM (AIRS)
PAGE
15
AIR QUALITY SUBSYSTEM
RAW DATA REPORT
1-HOUR LISTING
STATE (29): MISSOURI
JUN 1994
SITE-ID: 29-189-0006
POC:
1MICR (070): METROPOLITAN ST. LOUIS
LATITUDE:
38:36:49 N
COUNTY (189):
ST LOUIS CO
URBAN-AREA (0000):NOT IN AN URBAN AREA
LONGITUDE: 90:29:45 V
CITY (00000):
NOT IN A CITY
LAND USE (1): RESIDENTIAL
UTM ZONE: 15
SITE ADDRESS:
305 WEIDMAN ROAD (QUEENY)
LOCATION SETTING (3): RURAL
UTN-NORTHING: 4276698
SUPPORT AGENCY (002): ST LOUIS COUNTY HEALTH DEPARTMENT AIR PO
UTN-EASTING:
718034
SITE COMMENTS:
ILLINOIS GRID 406 E 708 N
ELEVATION-MSL:
175 M
MONITOR COMMENTS: 11
PROBE HEIGHT:
4 M
MONITOR TYPE (2): SLAMS
MINIMUM DETECTABLE:
.005
INTERVAL:
1
UNITS (007): PPM
REPORTING ORGANIZATION (002): ST LOUIS COUNTY HEALTH DEPARTM
COLLECTION AND ANALYSIS METHOD (014): INSTRUMENTAL ULTRA VIOLET
DAY/HOUR
0000 0100 0200 0300 0400 0500 0600 0700 0800 0900 1000 1100 1200 1300 1400 1500 1600 1700 1800 1900 2000 2100 2200 2300 OBS
MAX
1111
1111
1111
1111
1111
1111
1111
1111
1111
.1111
1111
1111
1111
1111
1111
1111
1111
lomo
EPA AEROMETRIC INFORMATION RETRIEVAL SYSTEM
(AIRS)
PAGE
16
AIR QUALITY SUBSYSTEM
RAY DATA: REPORT
1-HOUR LISTING
STATE 129): MISSOURI
JUL 1994
)ATE: 11/03/95
INP350
(44201) OZONE
SITE -ID: 29-189-0006
POC:
1AQCR (070): METROPOLITAN ST. LOUIS
:OUNTY (189):
ST LOUIS CO
URBAN-AREA (0000):NOT IN AN URBAN AREA
:ITT (00000):
NOT IN A CITY
LAND USE (1): RESIDENTIAL
SITE ADDRESS:
305 VEIDMAN ROAD (OUEENY)
LOCATION SETTING (3): RURAL
SUPPORT AGENCY (002): ST LOUIS COUNTY HEALTH DEPARTMENTAIR VO
SITE COMMENTS:
ILLINOIS GRID 406 E 708 N
ioNITOR COMMENTS: 11
IONITOR TYPE (2): SLAMS
CAS NUMBER: 10028156
LATITUDE:
38:36:49 N
LONGITUDE: 90:29:45 V
UTH ZONE: 15
UTM - NORTHING: 4276698
UTM-EASTING:
718034
ELEVATION-HSI:
175 M
PROBE HEIGHT:
4 N
MINIMUM DETECTABLE:
.005
INTERVAL: 1
JNITS (007): PPM
REPORTING ORGANIZATION (002): ST LOUIS
COUNTY HEALTH DEPARTN
:OLLECTION AND ANALYSIS METHOD (014): INSTRUMENTAL ULTRA
VIOLET
)AY/HOUR
0000 0100 0200 0300 0400 0500 0600 0700 0800 0900 1000
1100 1200 1300 1400 1500 1600 1700 1800
1900 2000 2100 2200 2300 OBS MAX
7-701g7OUB-71,02-70110-7002-701M-7005-7032-7030-7559-707Y-7073-7033-7033-7033-703;7037-7M-70;870;2703;702t-7012-7011-2Z-7173-
.059 .057 .055 .047 .048 .035 .042 .037
.033 .030 .024 .026 .018 24 .059
.064 .068 .078 .076 .062 .069 .078 .078
.078 .054 .031 .025 .022 24 .078
.048 .050 .051 .048 .048 .048 .045 .042
.037 .032 .031 .041 .044 24 .051
.060 .058 .057 .054 .053 .050 .051 .042
.030 .017 .017 .012 .018 24 .070
.058 .051 .047 .043 .043 .042 .042 .039
.031 .027 .012 .014 .030 24 .059
.049 .057 .050 .023 .013 .004 .004 .014
.008 .026 .024 .024 .027 24 .057
.053 .050 .047 .042 .039 .039 .039 .038
.030 .016 .018 .016 .017 24 .055
.049 .049 .050 .050 .049 .045 .044 .041
.030 .031 .019 .005 .005 24 .050
.049 .055 .060 .060 .061 .062 .057 .045
.046 .046 .028 .014 .006 24 .062
.073 .081 .070 .080 .082 .076 .083 .072
.078 .051 .027 .017 .009 24 .083
.092 .090 .092 .086 .078 .082 .077 .068
.062 .046 .038 .045 .047 24 .092
.069 .076 .076 .076 .067 .060 .057 .045
.041 .042 .039 .040 .040 24 .076
.056 .059 .068 .066 .052 .043 .042 .037
.031 .027 .039 .039 .046 24 .068
.065 .074 .082 .081 .079 .079 .073 .062
.047 .029 .012 .011 .006 24 .082
.056 .041 .023 .023 .042 .046 .039 .036
.034 .024 .013 .010 .004 24 .074
.061 .062 .066 .055 .048 .049 .046 .043
.039 .035 .030 .030 .027 24 .066
.071 .073 .073 .079 .090 .083 .085 .070
.057 .035 .019 .019 .012 24 .090
.060 .063 .057 .058 .060 .061 .057 .051
.036 .030 .026 .042 .050 24 .063
.063 .077 .076 .068 .064 .063 .057 .042
.022 .021 .020 .021 .014 24 .077
.047 .044 .037 .050 .054 .054 .051 .043
.037 .035 .042 .044 .038 24 .054
.046 .046 .048 .046 .046 .046 .045 .033
.028 .026 .023 .017 .019 24 .048
.054 .054 .052 .045 .047 .045 .045 .042
.047 .026 .008 .005 .000 24 .054
.044 .061 .047 .040 .049 .047 .046 .041
.034 .028 .020 .020 .021 24 .061
.058 .053 .052 .054 .056 .055 .052 .046
.043 .022 .013 .004 .006 24 .058
.024 .026 .020 .021 .015 .014 .013 .019 .015
.012 .007 .009 .012 24 .026
.038 .033 .038 .039 .043 .033 .033 .034
.023 .012 .003 .001 .002 24 .043
.037 .046 .052 .053 .051 .047 .046 .041
.040 .027 .018 .002 .000 24 .053
.051 .057 .057 .059 .062 .059 .058 .055 .043
.018 .010 .001 .000 24 .062
.053 .053 .040 .043 .046 .045 .045 .040 .044
.040 .033 .026 .022 24 .053
.060 .059 .057 .058 .060 .058 .059 .060 .050
.044 .031 .027 .022 24 .060
31
31
31
31
31
31
31
31
31
31
31
31
31
.092 .090 .092 .086 .090 .083 .085 .078 .078
.054 .042 .045 .050
.056 .058 .056 .054 .054 .051 .050 .045 .039
.030 .023 .020 .019
MONTHLY OBSERVATIONS
744
MONTHLY MEAN
.034
MONTHLY MAXIMUM .092
2.008
.007
.014
.026
.022
.022
.021
.032
.043
.049
.056
3.018
.023
.027
.020
.017
.022
.020
.019
.022
.039
.053
4.017
.015
.012
.012
.011
.016
.028
.042
.044
.046
.046
5.046
.046
.044
.040
.038
.033
.035
.042
.051
.066
.070
6.015
.009
.012
.022
.034
.025
.024
.030
.036
.048
.059
7.027
.035
.031
.027
.024
.019
.011
.022
.036
.038
.038
8.020
.010
.008
.009
.020
.037
.016
.016
.033
.039
.055
9.015
.009
.004
.002
.003
.004
.011
.027
.034
.042
.043
10
.002
.004
.013
.009
.006
.005
.014
.024
.034
.038
.045
11
.002
.000
.000
.000
.002
.002
.001
.005
.025
.052
.066
12
.007
.010
.008
.014
.023
.017
.031
.029
.032
.065
.085
13
.029
.027
.024
.010
.001
.001
.002
.020
.035
.052
.063
14
.031
.022
.030
.032
.024
.020
.020
.015
.023
.040
.061
15
.046
.039
.032
.026
.027
.025
.012
.024
.030
.041
.053
16
.016
.013
.011
.011
.008
.006
.010
.018
.036
.061
.074
17
.005
.008
.012
.010
.006
.005
.014
.038
.052
.061
.062
18
.013
.005
.006
.008
.010
.002
.003
.009
.023
.050
.062
19
.008
.006
.007
.012
.011
.010
.008
.026
.039
.048
.055
20
.052
.051
.049
.044
.039
.034
.033
.035
.041
.051
.061
21
.022
.018
.016
.018
.021
.025
.016
.016
.022
.030
.036
22
.030
.024
.017
.019
.018
.010
.019
.027
.034
.041
.046
23
.018
.018
.023
.019
.012
.006
.015
.028
.034
.043
.052
24
.001
.000
.000
.000
.001
.001
.006
.013
.031
.042
.049
25
.018
.010
.007
.014
.005
.002
.009
.018
.029
.042
.052
26
.000
.001
.006
.013
.013
.008
.003
.003
.011
.018
.020
27
.012
.014
.014
.014
.015
.011
.009
.009
.019
.028
.034
28
.006
.008
.007
.006
.005
.003
.003
.008
.019
.031
.039
29
.000
.000
.000
.000
.000
.000
.001
.006
.024
.038
.048
30
.000
.000
.000
.005
.000
.000
.000
.009
.029
.040
.046
31
.022
.016
.021
.015
.015
.018
.015
.030
.050
.056
.058
NO.
31
31
31
31
31
31
31
31
31
31
31
MAX
.052
.051
.049
.044
.039
.037
.035
.042
.052
.066
.085
MEAN.017
.015
.015
.015
.014
.013
.014
.022
.033
.045
.053
13e2
BE
ST
CO
PY
AV
AIL
AB
LE
135
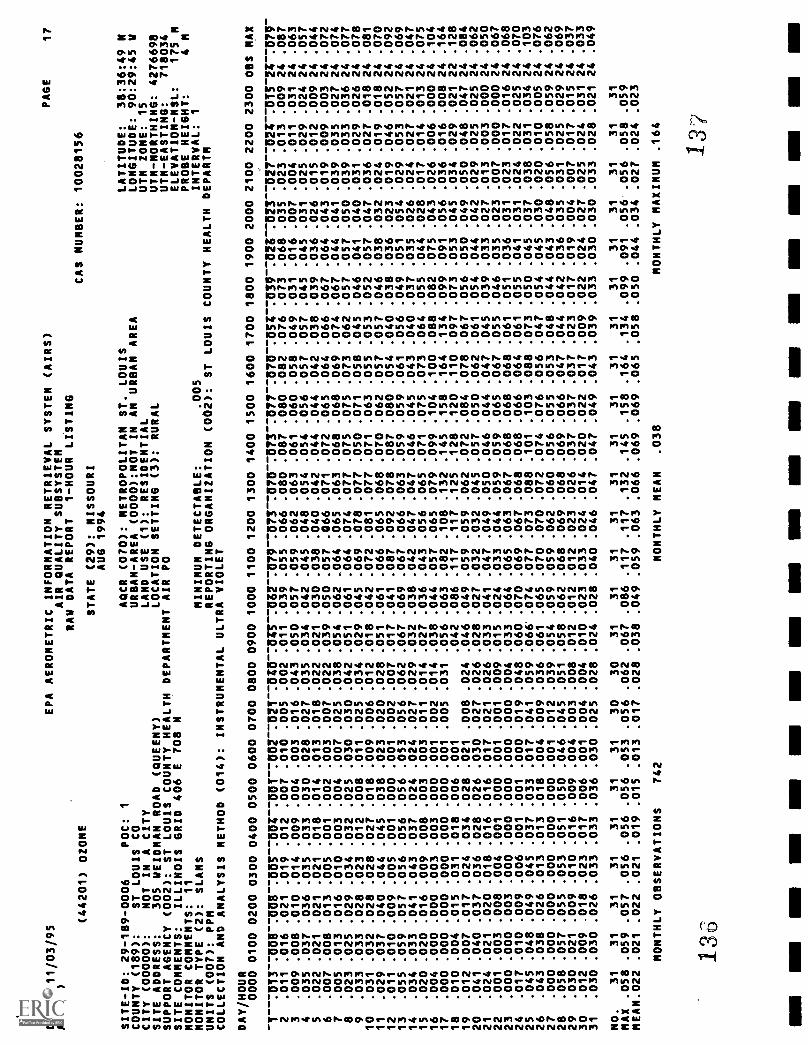
DATE: 11/03/95
AMP350
EPA AEROMETRIC INFORMATION RETRIEVAL SYSTEM (AIRS)
PAGE
17
AIR QUALITY SUBSYSTEM
RAW DATA REPORT
1-HOUR LISTING
(44201) OZONE
CAS NUMBER: 10028156
STATE (29): MISSOURI
AUG 1994
SITE-ID: 29-189-0006
POC:
1MICR (070): METROPOLITAN ST. LOUIS
LATITUDE:
38:36:49 N
COUNTY (189):
ST LOUIS CO
URBAN-AREA (0000):NOT IN AN URBAN AREA
LONGITUDE: 90:29:45 V
CITY (00000):
NOT IN A CITY
LAND USE (1): RESIDENTIAL
UTM ZONE: 15
SITE ADDRESS:
305 WEIDMAN ROAD (QUEENY)
LOCATION SETTING (3): RURAL
UTM-NORTHING: 4276698
SUPPORT AGENCY (002): ST LOUIS COUNTY HEALTH DEPARTMENT AIR PO
UTM - EASTING:
718034
SITE COMMENTS:
ILLINOIS GRID 406 E 708 N
ELEVATION -MSL:
175
MONITOR COMMENTS: 11
PROBE HEIGHT:
4 pi
MONITOR TYPE (2): SLAMS
MINIMUM DETECTABLE:
.005
INTERVAL: 1
UNITS (007): PPM
REPORTING ORGANIZATION (002): ST LOUIS COUNTY HEALTH
DEPARTM
COLLECTION AND ANALYSIS METHOD (014): INSTRUMENTAL ULTRA VIOLET
DAY/HOUR
0000 0100 0200 0300 0400 0500 0600 0700 0800 0900 1000 1100 1200 1300 1400
1500 1600 1700 1800 1900 2000 2100 2200 2300 OBS MAX
7-70T3-71,08-70138-7UUS-7UOV7OUT-7002-702T-70;071M-7032-7079-71773-7070-7573-7077-7070-70N-71139-702;7023-7027-702;7015-2;7079-
2.011
.016
.021
.019
.012
.007
.010
.005
.002
.011
.039
3.009
.008
.010
.014
.009
.004
.003
.016
.043
.050
.057
4.035
.037
.036
.035
.033
.030
.028
.027
.035
.034
.042
5.022
.021
.021
.021
.018
.014
.013
.018
.022
.021
.030
6.007
.008
.013
.005
.001
.002
.003
.007
.022
.039
.050
7.005
.013
.016
.010
.003
.004
.007
.025
.038
.054
.062
8.023
.025
.029
.034
.032
.025
.030
.030
.042
.051
.061
9.033
.033
.028
.023
.012
.008
.011
.025
.034
.029
.045
10
.031
.032
.028
.028
.027
.018
.009
.006
.012
.018
.042
11
.029
.037
.040
.044
.045
.038
.023
.020
.028
.051
.061
12
.011
.010
.009
.005
.001
.000
.001
.002
.007
.017
.041
13
.055
.059
.057
.056
.056
.056
.053
.056
.062
.067
.069
14
.034
.033
.041
.043
.037
.024
.024
.027
.029
.032
.038
15
.020
.020
.016
.009
.008
.003
.003
.011
.014
.027
.036
16
.004
.000
.000
.003
.003
.000
.001
.002
.014
.038
.044
17
.000
.000
.000
.000
.000
.000
.001
.005
.031
.056
.063
18
.010
.004
.015
.031
.018
.006
.001
.042
.086
19
.012
.007
.017
.024
.034
.028
.021
.008
.024
.046
.049
20
.041
.040
.037
.036
.028
.026
.030
.027
.026
.028
.027
21
.024
.021
.020
.018
.016
.016
.017
.021
.026
.033
.041
22
.001
.003
.008
.004
.001
.000
.001
.001
.009
.015
.024
23
.000
.000
.003
.000
.000
.000
.000
.000
.004
.033
.064
24
.017
.010
.009
.006
.001
.001
.000
.019
.048
.060
.070
25
.045
.048
.049
.045
.037
.033
.017
.041
.059
.066'.074
26
.043
.038
.026
.013
.013
.018
.004
.009
.036
.061
.065
27
.000
.000
.000
.000
.000
.000
.001
.012
.039
.054
.059
28
.058
.057
.055
.053
.051
.050
.046
.045
.051
.058
.062
29
.030
.021
.009
.010
.016
.009
.004
.003
.008
.012
.012
30
.012
.009
.018
.023
.017
.006
.001
.004
.004
.010
.023
31
.030
.030
.026
.033
.033
.036
.030
.025
.028
.024
.028
NO.
31
31
31
31
31
31
31
30
30
31
31
MAX
.058
.059
.057
.056
.056
.056
.053
.056
.062
.067
.086
MEAN.022
.021
.022
.021
.019
.015
.013
.017
.028
.038
.049
.055 .066 .080 .087 .080 .082 .076 .073 .068 .035 .023 .013 .009 24 .087
.059 .062 .063 .061 .060 .058 .049 .031 .016 .007 .004 .011 .031 24
.063
.045 .048 .054 .054 .056 .057 .057 .045 .045 .031 .025 .029 .024 24
.057
.038 .040 .042 .044 .044 .042 .038 .039 .036 .026 .015 .012 .009
24 .044
.057 .066 .071 .072 .065 .064 .066 .067 .064 .043 .019 .009 .003 24 .072
.064 .065 .063 .068 .068 .069 .074 .067 .044 .041 .039 .035 .027 24 .074
.064 .074 .077 .075 .075 .073 .062 .057 .057 .050 .039 .033 .036
24 .077
.069 .078 .077 .050 .071 .058 .045 .046 .041 .040 .031 .029 .026
24 .078
.072 .081 .077 .071 .063 .055 .053 .052 .057 .047 .036 .027 .018 24
.081
.066 .065 .068 .070 .062 .057 .057 .046 .038 .032 .024 .019 .018 24 .070
.087 .092 .078 .087 .080 .054 .040 .038 .036 .023 .019 .046 .052 24
.092
.067 .066 .063 .059 .059 .061 .056 .049 .051 .054 .029 .053 .057 24 .069
.042 .047 .047 .046 .045 .043 .040 .037 .035 .026 .024 .027 .021 24
.047
.043 .056 .065 .071 .075 .073 .064 .055 .044 .028 .017 .014 .013 24
.075
.057 .065 .079 .099 .104 .100 .088 .082 .075 .043 .026 .006 .000 24
.104
.082 .108 .132 .145 .158 .164 .134 .099 .091 .056 .036 .016 .008 24
.164
.117 .117 .125 .128 .120 .110 .097 .073 .053 .045 .034 .029 .021 22
.128
.059 .059 .062 .072 .084 .078 .067 .056 .050 .049 .050 .048 .047 24
.084
.032 .032 .045 .057 .050 .062 .061 .054 .044 .042 .029 .025 .025 24
.062
.047 .049 .050 .046 .044 .047 .045 .039 .033 .027 .013 .003
.000 24 .050
.033 .044 .059 .059 .065 .067 .055 .046 .035 .023 .007 .000 .000 24
.067
.065 .063 .067 .068 .068 .068 .061 .051 .036 .031 .023 .017 .016 24
.068
.069 .067 .068 .068 .066 .064 .061 .055 .041 .031 .024 .022 .025 24
.070
.077 .073 .088 .101 .103 .088 .073 .050 .045 .037 .038 .031 .034 24
.103
.070 .070 .072 .074 .076 .056 .047 .054 .045 .030 .020 .010 .005 24
.076
.059 .062 .060 .056 .055 .053 .048 .044 .043 .048 .056 .058 .059 24
.062
.068 .069 .068 .069 .066 .047 .044 .042 .036 .035 .031 .025 .029 24
.069
.012 .023 .026 .037 .037 .037 .023 .017 .019 .004 .007 .017 .015 24
.037
.033 .024 .014 .020 .022 .017 .009 .022 .024 .027 .025 .024 .031 24
.033
.040 .046 .047 .047 .049 .043 .039 .033 .030 .030 .033 .028 .021 24
.049
31
31
31
31
31
31
31
31
31
31
31
31
31
.117 .117 .132 .145 .158 .164 .134 .099 .091 .056 .056 .058 .059
.059 .063 .066 .069 .069 .065 .058 .050 .044 .034 .027 .024 .023
MONTHLY OBSERVATIONS
742
MONTHLY MEAN
.038
MONTHLY MAXIMUM .164
136'
13
NM
MN
MN
MO
- M
INIM
= IO
N IM
=I
MN
I= M
N M
O M
I
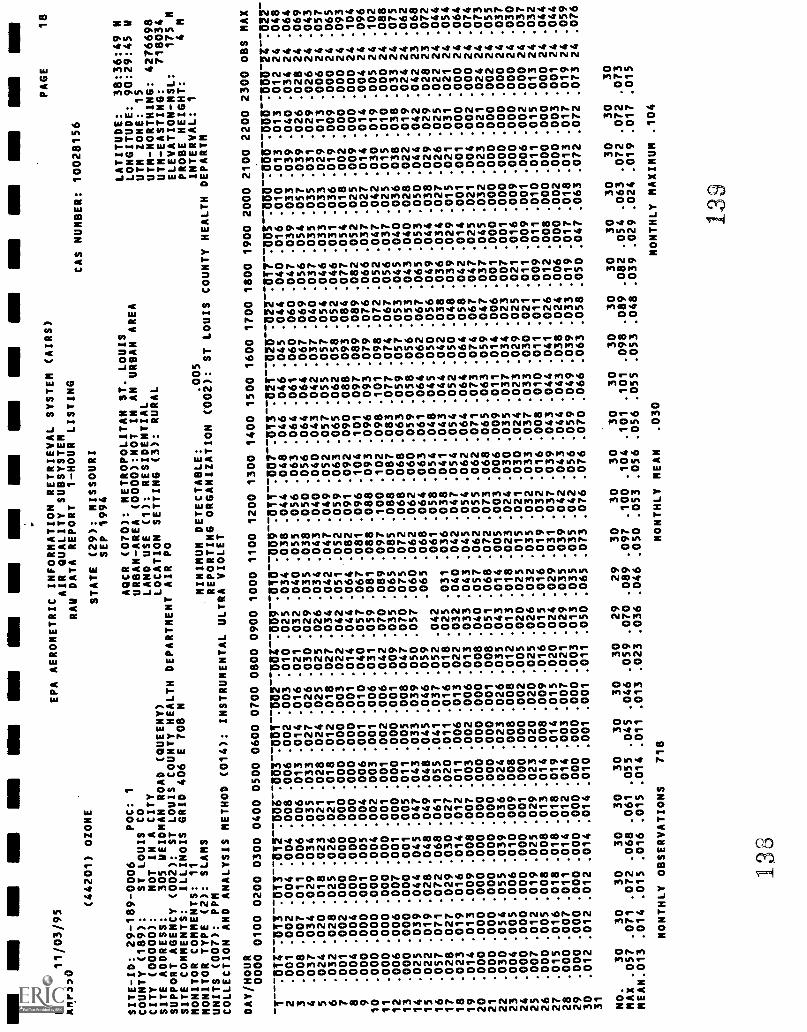
MO
MI I
= I=
INN
MI
MI
IMM
INE
DATE: 11/03/95
AMP350
EPA AEROMETRIC INFORMATION RETRIEVAL
SYSTEM (AIRS)
PAGE
18
AIR QUALITY SUBSYSTEM
RAW DATA REPORT
1-HOUR LISTING
(44201) OZONE
CAS NUMBER: 10028156
STATE (29): MISSOURI
SEP 1994
SITE-ID: 29-189-0006
POC:
1AQCR (070): METROPOLITAN ST. LOUIS
LATITUDE:
38:36:49 N
COUNTY (189):
ST LOUIS CO
URBAN-AREA (0000):NOT IN AN URBAN AREA
LONGITUDE: 90:29:45 W
CITY (00000):
NOT IN A CITY
LAND USE (1): RESIDENTIAL
UTM ZONE: 15
SITE ADDRESS:
305 WEIDMAN ROAD (QUEENY)
LOCATION SETTING (3): RURAL
UTM-NORTHING: 4276698
SUPPORT AGENCY (002): ST LOUIS COUNTY HEALTH
DEPARTMENT AIR PO
UTN-EASTING:
718034
SITE COMMENTS:
ILLINOIS GRID 406 E 708 N
ELEVATION-MSL:
175 N
MONITOR COMMENTS: 11
PROBE HEIGHT:
4 N
MONITOR TYPE (2): SLAMS
MINIMUM DETECTABLE:
.005
INTERVAL: 1
UNITS (007): PPM
REPORTING ORGANIZATION (002): ST LOUIS
COUNTY HEALTH DEPARTM
COLLECTION AND ANALYSIS METHOD (014): INSTRUMENTAL
ULTRA VIOLET
DAY/HOUR
0000 0100 0200 0300 0400 0500 0600 0700 0800
0900 1000 1100 1200 1300 1400 1500
1600 1700 1800 1900 2000 21002200 2300 OBS MAX
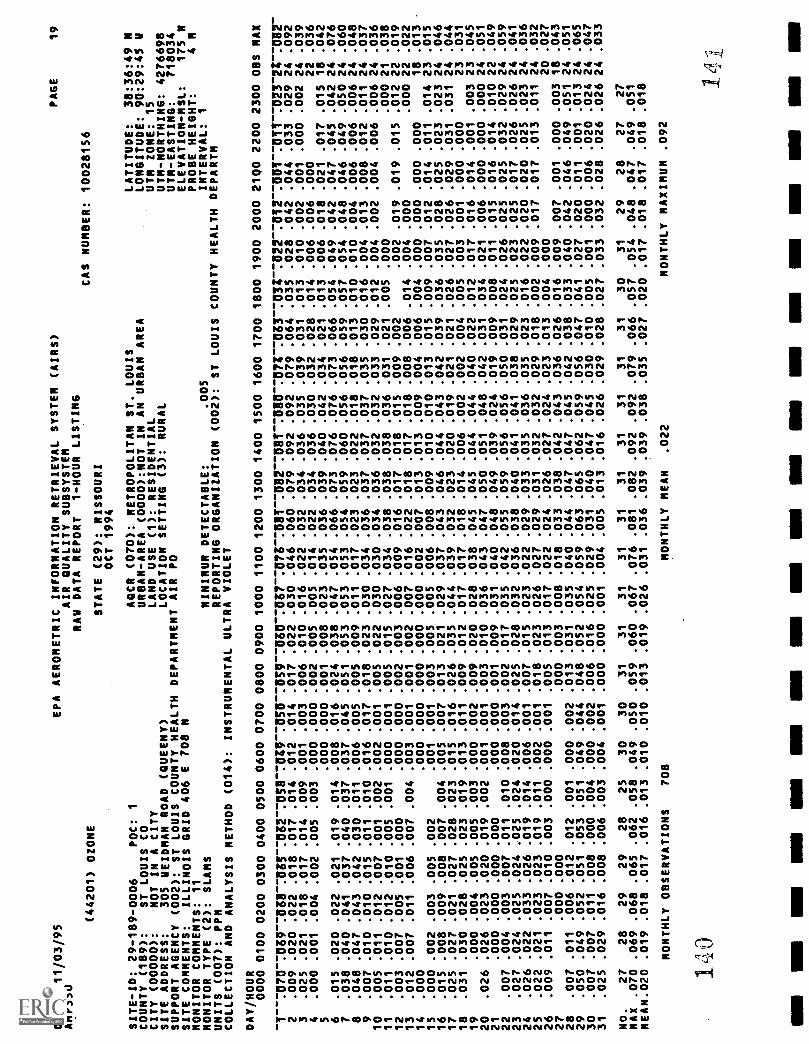
DATE: 11/03/95
AMP350
(44201) OZONE
EPA AEROMETRIC INFORMATION RETRIEVAL SYSTEM (AIRS)
AIR QUALITY SUBSYSTEM
RAW DATA REPORT
1-HOUR LISTING
STATE (29): MISSOURI
OCT 1994
SITE-ID: 29-189-0006
POC:
1AQCR (070): METROPOLITAN ST. LOUIS
COUNTY (189):
ST LOUIS CO
URBAN-AREA (0000):NOT IN AN URBAN AREA
CITY (00000):
NOT IN A CITY
LAND USE (1): RESIDENTIAL
SITE ADDRESS:
305 WEIDMAN ROAD (QUEENY)
LOCATION SETTING (3): RURAL
SUPPORT AGENCY (002): ST LOUIS COUNTY HEALTH DEPARTMENT AIR PO
SITE COMMENTS:
ILLINOIS GRID 406 E 708 N
MONITOR COMMENTS: 11
MONITOR TYPE (2): SLAMS
PAGE
19
CAS NUMBER: 10028156
LATITUDE:
38:36:49 N
LONGITUDE: 90:29:45 V
UTM ZONE: 15
UTM-NORTHING: 4276698
UTM-EASTING:
718034
ELEVATION-NSL:
175 M
PROBE HEIGHT:
4 M
MINIMUM DETECTABLE:
.005
INTERVAL: 1
UNITS (007): PPM
REPORTING ORGANIZATION (002): ST LOUIS COUNTY HEALTH
DEPART!,
COLLECTION AND ANALYSIS METHOD (014): INSTRUMENTAL ULTRA VIOLET
DAY/HOUR
0000 0100 0200 0300 0400 0500 0600 0700 0800 0900 1000 1100 1200
1300 1400 1500 1600 1700 1800 1900 2000 21Q0 2200 2300 OBS MAX
Stratospheric Ozone
CHEMISTRY UNIT
Snowmass Showdown'
Reference:Nance, John J. 1991. What Goes Up:The Global Assault on our Atmosphere,1st ed. New York: W. Morrow.
Students will apply infor-mation about reactionrates to the issue of ozonedepletion.
Students will defend a po-sition regarding strato-spheric ozone depletion.
Students will reenact thehistorical Progression ofozone depletion discover-ies.
golt
Scientist biographies
NASA color transparenciesof the ozone hole
Overhead projector
Name:
Date:
Period:
The Polar Ozone Workshop was a 5 day scientific gathering that tookplace May 9-13, 1988 in Snowmass Village, Colorado. Over 200 sci-entists and several media representatives attended. The event pro-vided a rare opportunity for almost every scientist with expertise re-lated to the ozone crisis to meet with each other and hash out differingpoints of view. The event was a spirited one, with plenty of disagree-ment between scientists, as they sought to solve the riddle of ozonedepletion. Is it happening? What's causing it? How is it happening?What will happen in the future? What should be done about it?
Your class will assemble a mock reenactment of the conference.
Presenters
Joe Farman
Don Heath
Sherry Rowland
Mario Molina Susan Soloman
Bob Watson
Jim Anderson
The responsibility of the presenters will be to read the description re-garding their personality and prepare a 5-10 minute oral presentation,following the instructions given at the end of each description.
ReportersThe responsibility of the reporters is to write articles reporting on thescientists' presentations. The articles should answer the questions who,what, where, when, and why. They should explain the underlying sci-entific principles involved, and how those scientific principles relate toozone depletion. Finally, the articles should be written with the appro-priate audience in mind.
Newsweek reporters should write for the general public.
National Enquirer reporters should write for bored supermarketshoppers.
COPYRIGHT © 1 9 9 6 1 5 7
/I
OZONE: DOES IT AFFECT ME?
Scientific American reporters should write for the scientific commu-nity.
Wall Street Journal reporters should write for the business commu-nity.
Report on Joe FarmanMake sure your readers understand what a "rate" and a "reactionrate" are, and what they have to do with ozone.
Report on Don HeathMake sure your readers understand the significance of the satellitedata presented by Don Heath as well as the effects of ozone depletionon human health.
Report on Sherry RowlandMake sure your readers understand how the nature of the reactantscan affect the rate of a reaction and what that has to do with theRowland-Molina Theory.
Report on Marto MolinaMake sure your readers understand what a chemical "sink" is, andwhat that has to do with ozone depletion. Discuss the pros and consof an immediate ban on CFC's and chlorine containing substitutes.
Report on Bob WatsonMake sure your readers understand the effects of temperature andconcentration on reaction rates, and the relationship of each toanswering the question of what caused the Antarctic ozone hole.
Report on Jim AndersonMake sure your readers understand what a catalyst is, and its impor-tance in relation to ozone depletion.
Report on Susan SolomonMake sure your readers understand how heterogeneous catalysts andthe amount of exposed surface area can affect the rate of a chemicalreaction. Explain why ozone depletion occurs so much more rapidlyin Antarctica than elsewhere on the planet. Could what happened inAntarctica potentially happen somewhere else? Why or why not?
158 COPYRIGHT © 1996
CHEMISTRY UNIT
Snowmass ShowdownTEAcHER BACKGROUND
Students will apply infor-mation about reactionrates to the issue of ozonedepletion.
Students will defend a po-sition regarding strato-spheric ozone depletion.
Students will reenact thehistorical progression ofozone depletion discover-ies.
Scientist biographies
NASA color transparenciesof the ozone hole
Overhead projector
To receive a color. photographentitled "Nimbus-7 TOMS Images:The 12 Octobers" point your webbrowser to: http://jwodcy.gsfc.nasa.gov/octagif Or,contact NASA's EducationDistribution Center at 1 (202) 453-1287. Ask for card #HqL-308. Youwill need to make your own colortransparency from the color photoso that the student role-playing DonHeath can effectively display it tothe class.
Communicating Results
Assign seven students the roles of the various scientists. Give eachstudent a copy of the write-up that corresponds to the presentationthey will make. Some of the presenters will also need copies of theBIOS of certain scientists that precede them at the conference, asbackground information. Refer to the text to identify which scien-tists need this.
It is recommended that all the students not be given a copy of allthe scientist descriptions. This will force the students to rely on theirability to digest the information as it is presented by their peers.
Assign the remaining students the role of reporter from thepublication of your or their choice.
Student learning can be assessed according to the quality of thescientist presentations, and the quality of the articles written by thereporters.
If time allows, you may want to assemble the best student articlesinto a "newspaper", to be distributed on subsequent days of theconference. This provides an additional avenue for reinforcing theconcepts presented, and also adds to the role-play atmosphere.
COPYRIGHT © 1996 14b 159
1
I Joe Farman
1
CHEMISTRY UNIT
Your scientific career began in 1957when you joined the British AntarcticSurvey, and you have been studyingthe Antarctic atmosphere ever since.Year in and year out you make the pil-grimage to cold and lonely scientificoutposts, where you collect and ana-lyze atmospheric data. You are alwayson the go, and your craggy face re-flects the icy wilderness you havecome to know so well.
In 1981, you began to notice ex-traordinarily low levels of strato-spheric ozone. The figures were solow you could scarcely believe them.Were your measurements accurate?Where your findings correct? Youweren't sure.
Your British team was not the onlygroup studying ozone levels in Ant-arctica at the time. The Americans andthe Japanese had sent teams South aswell. You wondered quizzically whythey hadn't observed and reportedsimilar discoveries.
Should you publish what you hadfound out, or not? If your findingswere correct, the implications could becatastrophic. Surely you had an obli-gation to say something. On the otherhand, if your data was wrong, you
146
could create a global panic over noth-ing. Since no one else had as yet pub-lished anything remotely similar, youwould also have to withstand poten-tially withering reviews from other sci-entists who would scurry to refute orcorroborate your conclusions. In ad-dition, you could risk losing your fund-ing, which was already difficult tocome by.
You decided not to report your find-
ings.
For three more years the data con-tinued to repeat itself, however, andyou could finally question the impli-cations no longer. Your report appearedin the May 16, 1985 edition of Naturemagazine, where you described a 40%decrease of stratospheric ozone overAntarctica in one month. In specu-lating as to the cause of such a drasticdecline, you discussed the possibilitythat chlorofluorocarbons (CFC's) inthe atmosphere might have somethingto do with it.
A swift and angry response from acollection of British chemical compa-nies resulted in the loss of funding thatwould have allowed your team to ex-pand its study.
COPYRIGHT 1 9 9 6 1 6 1
OZONE: DOES IT AFFECT ME?
IN YOURREPORT ATSNOWMASS,YOUSHOULD:
1.Share your findingsand their potentialimplications.
2. Make a graph fordisplay that con-trasts Molina'spredictions of ozoneloss with your ob-servations ofAntarctica's ozoneloss.
3.Explain what a"rate" and a "reac-tion rate" are.
4.Pose the question toyour audience, Whyis the process slow,in theory, but ex-traordinarily rapid inAntarctica?
***it is not necessaryto discuss all theinformation presentedhere. Just answer thequestions well, usingyour own words.***
In 1973, Sherry Rowland andMario Molina had developed a theorypredicting the loss of Stratosphericozone. Their theory implicates chlo-rofluorocarbons (CFC's). Accordingto the Rowland-Molina theory, how-ever, it takes years to break downozone. In 1974, Mario Molina pre-dicted a 5-7% ozone loss by 1995. InAntarctica, by contrast, ozone disap-peared 40% in just one month.
1 7
You concur with the Rowland-Molina theory that outlines a series ofchemical reactions resulting in ozonedestruction. The rate of reaction isclearly more rapid in Antarctica, how-ever, than it is according to theory. Areaction rate has to do with how fast areaction takes place. (See text, "Ratesof Chemical Reactions, below"). Whyis the process so much more rapid inAntarctica than it is in theory?
162 COPYRIGHT 0 1996
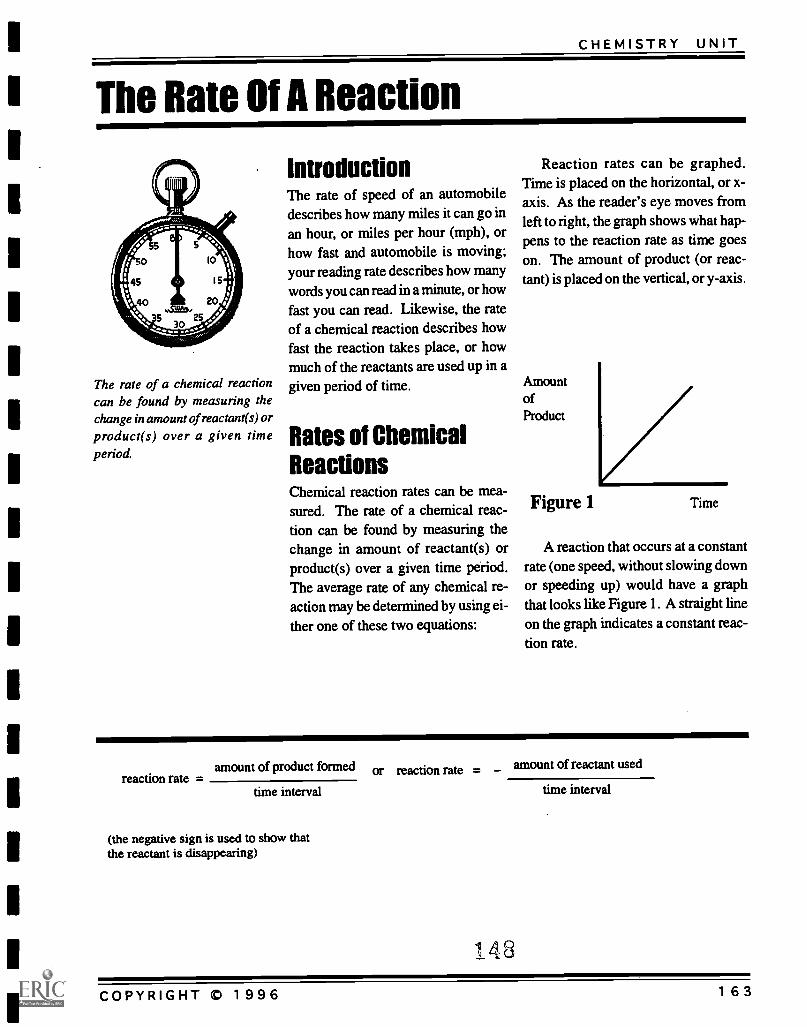
CHEMISTRY UNIT
The Rate Of A Reaction
The rate of a chemical reactioncan be found by measuring thechange in amount of reactant(s) orproduct(s) over a given timeperiod.
IntroductionThe rate of speed of an automobiledescribes how many miles it can go inan hour, or miles per hour (mph), orhow fast and automobile is moving;your reading rate describes how manywords you can read in a minute, or how
fast you can read. Likewise, the rateof a chemical reaction describes howfast the reaction takes place, or howmuch of the reactants are used up in agiven period of time.
Rates of ChemicalReactionsChemical reaction rates can be mea-sured. The rate of a chemical reac-tion can be found by measuring thechange in amount of reactant(s) orproduct(s) over a given time period.The average rate of any chemical re-action may be determined by using ei-ther one of these two equations:
Reaction rates can be graphed.Time is placed on the horizontal, or x-axis. As the reader's eye moves fromleft to right, the graph shows what hap-pens to the reaction rate as time goeson. The amount of product (or reac-tant) is placed on the vertical, or y-axis.
AmountofProduct
Figure 1 Time
A reaction that occurs at a constantrate (one speed, without slowing downor speeding up) would have a graphthat looks like Figure 1. A straight lineon the graph indicates a constant reac-tion rate.
amount of product formed or reaction rate amount of reactant used=reaction rate =
time interval
(the negative sign is used to show thatthe reactant is disappearing)
148
time interval
COPYRIGHT 1996 163
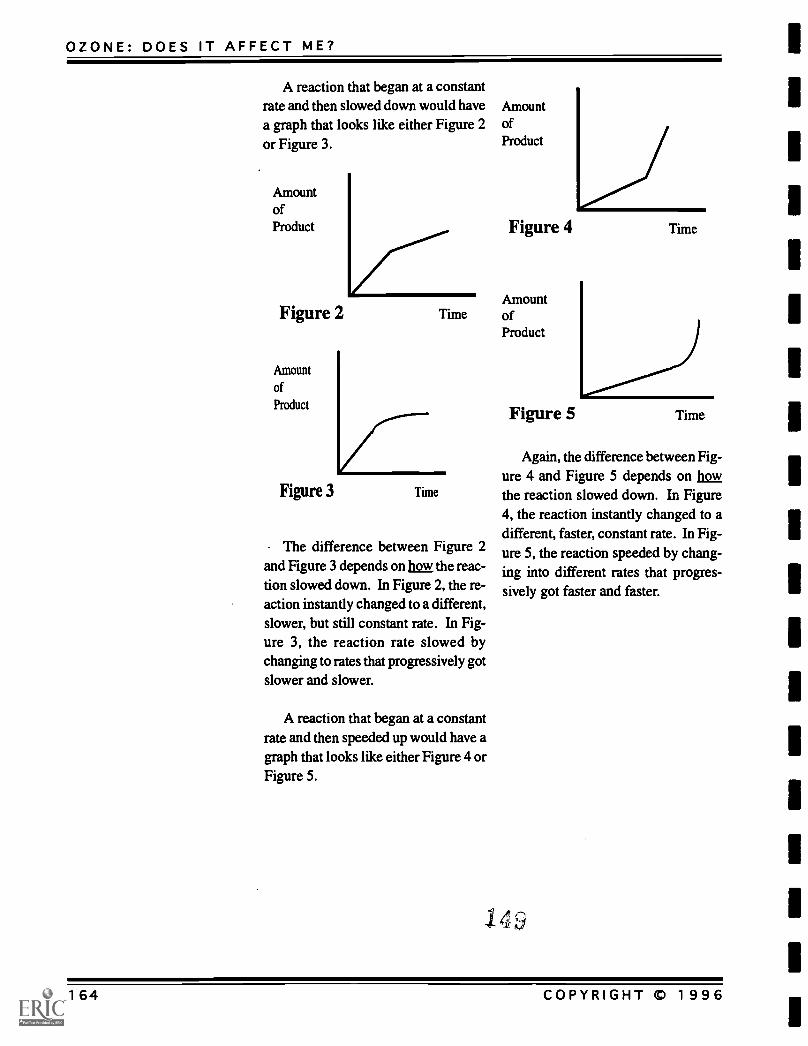
OZONE: DOES IT AFFECT ME?
A reaction that began at a constantrate and then slowed down would havea graph that looks like either Figure 2or Figure 3.
AmountofProduct
Figure 2 Time
Amount
ofProduct
Figure 3 Time
The difference between Figure 2and Figure 3 depends on ligH the reac-tion slowed down. In Figure 2, the re-action instantly changed to a different,slower, but still constant rate. In Fig-ure 3, the reaction rate slowed bychanging to rates that progressively gotslower and slower.
A reaction that began at a constantrate and then speeded up would have agraph that looks like either Figure 4 orFigure 5.
AmountofProduct
Figure 4 Time
AmountofProduct
Figure 5 Time
Again, the difference between Fig-ure 4 and Figure 5 depends on howthe reaction slowed down. In Figure4, the reaction instantly changed to adifferent, faster, constant rate. In Fig-ure 5, the reaction speeded by chang-ing into different rates that progres-sively got faster and faster.
164 COPYRIGHT OD 1996
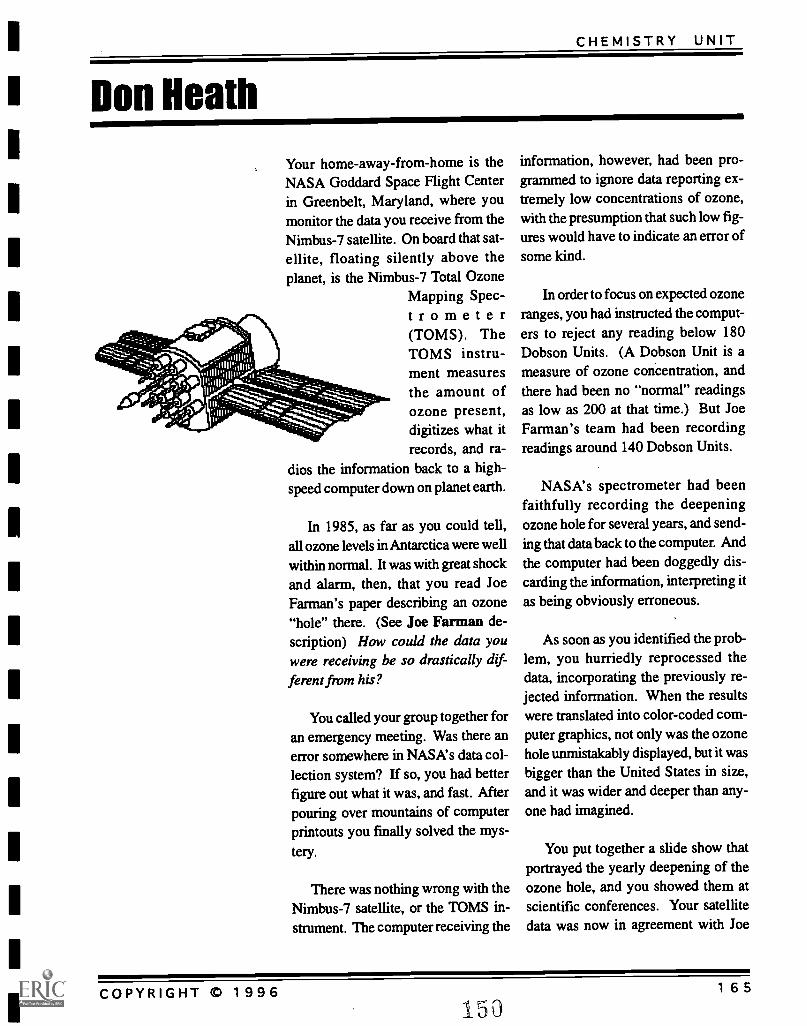
CHEMISTRY UNIT
Don Heath
Your home-away-from-home is theNASA Goddard Space Flight Centerin Greenbelt, Maryland, where youmonitor the data you receive from theNimbus-7 satellite. On board that sat-ellite, floating silently above theplanet, is the Nimbus-7 Total Ozone
Mapping Spec-trometer(TOMS). TheTOMS instru-ment measuresthe amount ofozone present,digitizes what itrecords, and ra-
dios the information back to a high-speed computer down on planet earth.
In 1985, as far as you could tell,all ozone levels in Antarctica were well
within normal. It was with great shockand alarm, then, that you read JoeFarman's paper describing an ozone"hole" there. (See Joe Farman de-scription) How could the data youwere receiving be so drastically dif-ferent from his?
You called your group together foran emergency meeting. Was there anerror somewhere in NASA's data col-lection system? If so, you had betterfigure out what it was, and fast. Afterpouring over mountains of computerprintouts you finally solved the mys-
tery.
There was nothing wrong with theNimbus-7 satellite, or the TOMS in-strument. The computer receiving the
information, however, had been pro-grammed to ignore data reporting ex-tremely low concentrations of ozone,with the presumption that such low fig-ures would have to indicate an error ofsome kind.
In order to focus on expected ozoneranges, you had instructed the comput-ers to reject any reading below 180Dobson Units. (A Dobson Unit is ameasure of ozone concentration, andthere had been no "normal" readingsas low as 200 at that time.) But JoeFarman's team had been recordingreadings around 140 Dobson Units.
NASA's spectrometer had beenfaithfully recording the deepeningozone hole for several years, and send-ing that data back to the computer. Andthe computer had been doggedly dis-carding the information, interpreting itas being obviously erroneous.
As soon as you identified the prob-lem, you hurriedly reprocessed thedata, incorporating the previously re-jected information. When the resultswere translated into color-coded com-puter graphics, not only was the ozonehole unmistakably displayed, but it wasbigger than the United States in size,and it was wider and deeper than any-one had imagined.
You put together a slide show thatportrayed the yearly deepening of theozone hole, and you showed them atscientific conferences. Your satellitedata was now in agreement with Joe
COPYRIGHT © 1 9 9 6 1 6 5
150
OZONE: DOES IT AFFECT ME?
IN YOURREPORT ATSNOWMASSYOUSHOULD:
1. Display and inter-pret the color trans-parencies of yourAntarctic satellitedata.
2. Report your satel-lite data on world-wide ozone loss andcompare it withwhat was predicted.(See Joe Farmandescription.)
3. Discuss the effectsof ozone depletion.
4. Ask your audience:Could the processoccurring in Antarc-tica happen overmid- latitudes? Overthe Arctic? Whatare the irnplica-tions?
*** It is not necessaryto discuss all theinformation presentedhere. Just answer the squestions well, usingyour' own words.***
Farman's findings. The existence ofthe hole had been confirmed.
The questions that now needed tobe answered were: If ozone loss couldbe so rapid in Antarctica, could it hap-pen over the mid-latitudes? Was it al-
ready happening over the Arctic, where
(unlike Antarctica) human populationsexist below? The answers to thesequestions were critical, because theycould impact the entire world. Thepotential effects of ozone depletion areserious. (See text, "Impacts of OzoneDepletion")
In 1987, you concluded by analyz-ing your satellite data that there hadapparently been a world-wide 4 per-cent drop in total ozone. You reportedyour conclusion with the understand-
ing that this was not an indisputablepiece of information. Possiblesources of error included the fact thatthe instruments could be out of cali-bration. The following year, however,your measurements were examined in
comparison with ground-based read-ings from around the world. The fourpercent figure was not only confirmed,but revised upwards to a probable 6percent total ozone loss.
166BEST COPY AVAILABLE
COPYRIGHT m 1996
CHEMISTRY UNIT
Health Risks ofOver-exposure to the Sun,
1.ReferenceEnvironmental Protection Agency.Health Effects of overexposure tothe sun. (Online) Available http://www. e pa. gov/ozon e/uv index/uvhealth.html, March 5, 1996.
Most people are now aware that toomuch sun has been linked to skin can-
cer, but few know the degree of riskposed by overexposure, and fewer are
aware that the risks go beyond skin
cancer. Recent medical research hasshown that overexposure to the sun'sultraviolet (UV) radiation can contrib-
ute to serious health problems.
This fact sheet provides a quickoverview of the major problems linked
to UV exposure: skin cancer (mela-
noma and non-melanoma), other skinproblems, cataracts, and immune sys-
tem suppression. Understanding theserisks and taking a few sensible precau-tions will help you to enjoy the sunwhile lowering your chances of sun-related health problems later in life.
MelanomaMelanoma, the most serious form ofskin cancer, is also one of the fastestgrowing types of cancer in the U.S.Many dermatologists believe theremay be a link between childhood sun-
burns and malignant melanoma laterin life. Melanoma cases in the U.S.have almost doubled in the past twodecades, with at least 32,000 new
152
cases and 6,900 deaths estimated for1994 alone. The rise in melanomacases and deaths in America is ex-pected to continue.
Non-Melanoma SkinCancersUnlike melanoma, non-melanoma skincancers are rarely fatal. Nevertheless,they should not be taken lightly. Un-treated, they can spread, causing moreserious health problems. An estimated900,000 Americans developed non-melanoma skin cancers in 1994, while1,200 died from the disease.
Actinic KeratosesThese sun-induced skin growths occur
on body areas exposed to the sun. Theface, hands, forearms, and the "V" ofthe neck are especially susceptible tothis type of blemish. They are pre-ma-lignant, but if left untreated, actinickeratoses can become malignant. Lookfor raised, reddish, rough-texturedgrowths.
COPYRIGHT © 1 9 9 6 1 6 7
OZONE: DOES IT AFFECT ME?
Cataracts and OtherEye DamageCataracts are a form of eye damage, aJoss of transparency in the lens whichclouds vision. Left untreated, cataractscan rob people of vision. Research hasshown that UV radiation increases thelikelihood of certain cataracts. Al-though curable with modem eye sur-gery, cataracts diminish the eyesight ofmillions of Americans, and necessitatemillions of dollars of eye surgery eachyear. Other kinds of eye damage in-clude: pterygium (tissue growth on thewhite of the eye that can block vision),skin cancer around the eyes, and de-generation of the macula (the part ofthe retina near the center, where visualperception is most acute). All of theseproblems could be lessened withproper eye protection from UV radia-tion.
155
Immune SuppressionScientists have found that sunburn canalter the distribution and function ofdisease-fighting white blood cells inhumans for up to 24 hours after expo-sure to the sun. Repeated exposure toUV radiation may cause more long-lasting damage to the body's immunesystem. Mild sunburns can directlysuppress the immune functions of hu-man skin where the sunburn occurred,even in people with dark skin.
168 COPYRIGHT 0 1996
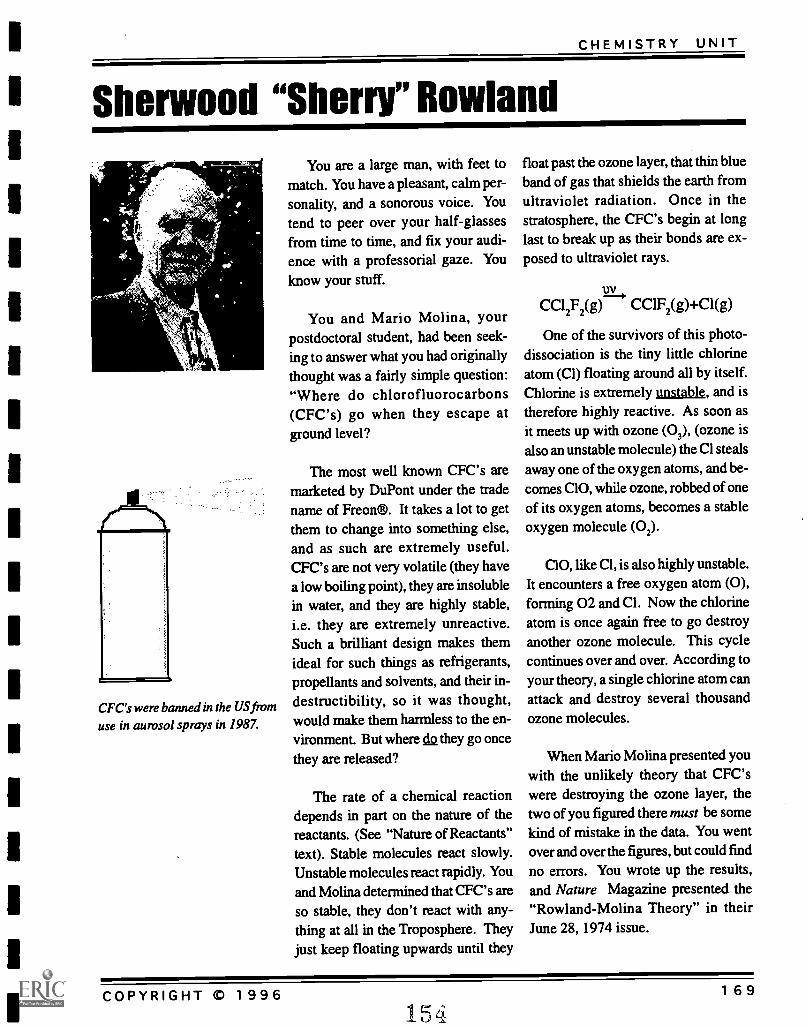
CHEMISTRY UNIT
Sherwood "Sherry" Rowland
- Alumia.moneriard
-F?
CFC's were banned in the US fivm
use in aurosol sprays in 1987.
You are a large man, with feet tomatch. You have a pleasant, calm per-sonality, and a sonorous voice. Youtend to peer over your half-glassesfrom time to time, and fix your audi-ence with a professorial gaze. Youknow your stuff.
You and Mario Molina, yourpostdoctoral student, had been seek-ing to answer what you had originallythought was a fairly simple question:"Where do chlorofluorocarbons(CFC's) go when they escape atground level?
The most well known CFC's aremarketed by DuPont under the tradename of Freon®. It takes a lot to getthem to change into something else,and as such are extremely useful.CFC's are not very volatile (they havea low boiling point), they are insolublein water, and they are highly stable,i.e. they are extremely unreactive.Such a brilliant design makes themideal for such things as refrigerants,propellants and solvents, and their in-destructibility, so it was thought,would make them harmless to the en-vironment. But where k they go oncethey are released?
The rate of a chemical reactiondepends in part on the nature of thereactants. (See "Nature of Reactants"text). Stable molecules react slowly.Unstable molecules react rapidly. Youand Molina determined that CFC's areso stable, they don't react with any-thing at all in the Troposphere. Theyjust keep floating upwards until they
float past the ozone layer, that thin blueband of gas that shields the earth fromultraviolet radiation. Once in thestratosphere, the CFC's begin at longlast to break up as their bonds are ex-posed to ultraviolet rays.
u2,CC12F2(g) CCIF2(g) +Cl(g)
One of the survivors of this photo-dissociation is the tiny little chlorineatom (Cl) floating around all by itself.Chlorine is extremely unstable, and istherefore highly reactive. As soon asit meets up with ozone (03), (ozone isalso an unstable molecule) the Cl stealsaway one of the oxygen atoms, and be-comes C10, while ozone, robbed of oneof its oxygen atoms, becomes a stableoxygen molecule (02).
CIO, like Cl, is also highly unstable.It encounters a free oxygen atom (0),forming 02 and Cl. Now the chlorineatom is once again free to go destroyanother ozone molecule. This cyclecontinues over and over. According toyour theory, a single chlorine atom canattack and destroy several thousandozone molecules.
When Mario Molina presented youwith the unlikely theory that CFC'swere destroying the ozone layer, thetwo of you figured there must be somekind of mistake in the data. You wentover and over the figures, but could findno errors. You wrote up the results,and Nature Magazine presented the"Rowland-Molina Theory" in theirJune 28, 1974 issue.
COPYRIGHT © 1996 169154
OZONE: DOES IT AFFECT ME?
IN YOURREPORT AT.SNOVVMASSYOUSHOULD:
1. Create a visualdisplay outlining theseries of chemicalreactions put forthby the Rowland-Molina Theory.
2. Explain theRowland-MolinaTheory.
3. Explain how thenature of the reac-tants (whether thereactants are reac-tive or stable), canaffect the rate of areaction, usingexamples from thescenario you havedescribed.
4. Ask your audience:"How long would ittake for this pro-cess to take place.What eventuallyhappens to thechlorine atom?What would preventit` from continuingto destroy ozoneuntil the ozone iscompletely gone?
*** It is not necessarYto discuss all theinformation presentedhere. Just answer thequestions vvell, usingyour own words.***
Concerned about the serious globalimplications of your theory, youbrought the matter into the publicarena, willingly interacting with thepress, politicians, and the public. Yourdecision to take such a visible stanceearned you black marks in industrialand academic
Collision theory describes the modelthat is used to explain the rates ofchemical reactions. According to thistheory, rates of chemical reactions de-pend on collisions between reactingparticles. Any change that affects the
circles. Over the next ten years,you were suspiciously regarded as anadvocate, rather than as an objectivescientist. No industry groups invitedyou to speak, and rarely was your pres-ence requested at other universities,despite your prestigious accomplish-ments.
With the discovery of the ozonehole in Antarctica, however, the em-pirical "proof" of your theory beganto emerge. As time wore on, yourstance was more than vindicated, andyou became a sought after figure inthe lecture circuit.
170 COPYRIGHT 0 1996
CHEMISTRY UNIT
A Theory to Explain Reaction Rates
Collision theory describes the modelthat is used to explain the rates ofchemical reactions. According to thistheory, rates of chemical reactionsdepend on collisions between reactingparticles. Any change that affects thecollisions will also affect the rate ofreaction.
Factors that InfluenceReaction RatesSeveral different factors play an im-portant role in influencing reactionrates. Sometimes one of these factorsacts alone and sometimes several fac-tors act at the same time.
Nature of ReactantsSometimes the rate of a reaction is in-fluenced directly by the nature of thespecific reactants that are involved.Consider two metals, potassium andcalcium. The reaction of potassiumand water is much quicker and moreintense than the reaction of calciumand water. The difference in reactionrates is because of differences in thenature (or makeup) of the reactants.
156
An increase in temperature or concen-tration would not change the rate in asignificant way, because the very na-ture of the two metals is the most im-portant reason to explain the differencein reaction rates.
The reaction of calcium in coldwater is slower than the reaction ofpotassium in cold water. If the waterfor the calcium reaction is heated, thecalcium reaction will occur somewhatfaster, but will still be significantlyslower than the potassium reaction incold water. Because calcium and po-tassium, by their very nature, react atdifferent rates in water (the potassiumreaction is sudden and intense, whilethe calcium reaction is slow), increas-ing the temperature or concentrationwill not have a major effect on the rela-tive reaction rates of these two metals.
COPYRIGHT © 1996 171
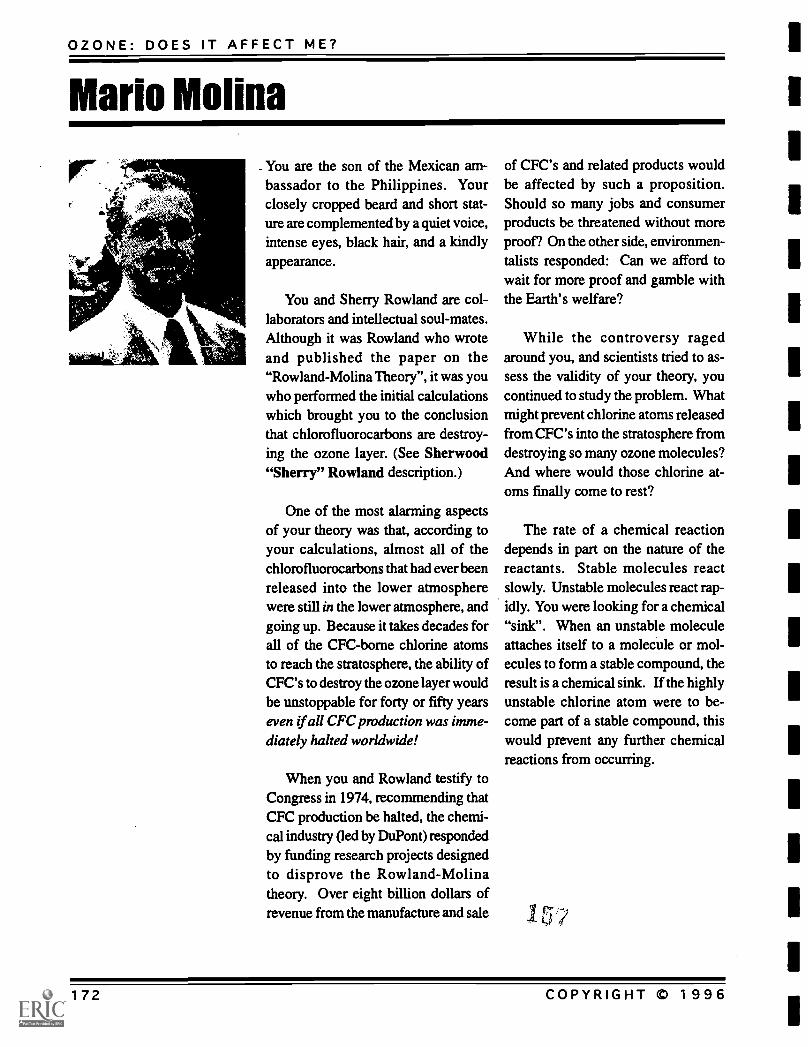
OZONE: DOES IT AFFECT ME?
Mario Molina
You are the son of the Mexican am-bassador to the Philippines. Yourclosely cropped beard and short stat-ure are complemented by a quiet voice,intense eyes, black hair, and a kindlyappearance.
You and Sherry Rowland are col-laborators and intellectual soul-mates.Although it was Rowland who wroteand published the paper on the"Rowland-Molina Theory", it was youwho performed the initial calculationswhich brought you to the conclusionthat chlorofluorocarbons are destroy-ing the ozone layer. (See Sherwood"Sherry" Rowland description.)
One of the most alarming aspectsof your theory was that, according toyour calculations, almost all of thechlorofluorocarbons that had ever beenreleased into the lower atmospherewere still in the lower atmosphere, andgoing up. Because it takes decades forall of the CFC-borne chlorine atomsto reach the stratosphere, the ability ofCFC's to destroy the ozone layer wouldbe unstoppable for forty or fifty yearseven if all CFC production was imme-diately halted worldwide!
When you and Rowland testify toCongress in 1974, recommending thatCFC production be halted, the chemi-cal industry (led by DuPont) respondedby funding research projects designedto disprove the Rowland-Molinatheory. Over eight billion dollars ofrevenue from the manufacture and sale
of CFC's and related products wouldbe affected by such a proposition.Should so many jobs and consumerproducts be threatened without moreproof? On the other side, environmen-talists responded: Can we afford towait for more proof and gamble withthe Earth's welfare?
While the controversy ragedaround you, and scientists tried to as-sess the validity of your theory, youcontinued to study the problem. Whatmight prevent chlorine atoms releasedfrom CFC's into the stratosphere fromdestroying so many ozone molecules?And where would those chlorine at-oms finally come to rest?
The rate of a chemical reactiondepends in part on the nature of thereactants. Stable molecules reactslowly. Unstable molecules react rap-idly. You were looking for a chemical"sink". When an unstable moleculeattaches itself to a molecule or mol-ecules to form a stable compound, theresult is a chemical sink. If the highlyunstable chlorine atom were to be-come part of a stable compound, thiswould prevent any further chemicalreactions from occurring.
172 COPYRIGHT © 1996
CHEMISTRY UNIT
IN YOURREPORT ATSNOWMASSYOUSHOULD:
1. Explain chlorinenitrate as a chemi-cal sink for chlorine,and the relationshipof a chemical "sink"to reaction rates.
2. Discuss the prosand cons of animmediate ban onCFC's and chlorinecontaining substi-tutes. Elicit opin-ions from youraudience.
*** It is not necessaryto present all theinformation presentedhere. Just answer thequestions well, using'your own words.***
In 1976, you found such a sink in chlo-
rine nitrate (CIONO2). Chlorine ni-
trate is formed when chlorine monox-
ide reacts with nitrogen dioxide. Ni-
trogen dioxide occurs naturally in the
stratosphere in small amounts.
At first you hadn't paid much at-
tention to chlorine nitrate, thinking its
lifetime would be too short to limit the
chlorine's destructive attraction to
ozone, but after pouring over some
obscure chemical abstracts written in
German you began to consider other-
wise. With a series of lab experiments
you confirmed your new hypothesis
that the chlorine nitrate compound was
stable enough to hold significantlylarge numbers of chlorine atoms.
C10(g) + NO2(g)+CIONO2(g)
158
Although you were aware that yourconclusions might blow your original
theory out of the water, being thehighly professional, objective scientist
that you were, you dutifully reported
your findings. Industry responded byspreading the word that the Rowland-Molina theory had been disproved.Scientists rushed back to their labs,
slaving over computers and calculators
to rework their conclusions. Andpolicy makers furrowed their brows
and scratched their heads in confusion,
trying to decide how to- or whether to-
act on the data given.
The Rowland-Molina Theoryhadn't been disproved. It had onlybeen revised. Within a few months,scientists concluded that the chlorinenitrate sink would have a mild effect
on projected predictions of ozone loss.
In September of 1987, the Montreal
Protocol was signed, where the world's
nations agreed to phase out CFC pro-duction. Today, 150 countries have
signed the treaty. Beginning January 1,
1996, only recycled and stockpiledCFCs are available for use in industri-
alized countries.
COPYRIGHT © 1996173
OZONE: DOES IT AFFECT ME?
Bob Watson
.You have a scraggly beard and wild,undisciplined black hair. You are anenthusiastic and energetic publicspeaker with a British accent. You arealso the head of NASA's StratosphericResearch programs, and a highly re-spected scientist.
It came to be your responsibilityto marshal the forces that would an-swer the pivotal questions; "Whatcaused the ozone hole in Antarctica?"and "Was it natural or man-made?"
Once the ozone hole was detectedand confirmed, several competingtheories developed in an attempt toanswer those questions. One theoryattributed the loss of ozone to sunspotsand flares. Another theory held thatchanging patterns of air circulationaround the South Pole were transport-ing ozone-poor air into the region andgiving the false appearance of ozoneloss. Both these theories pointed tonatural causes for the hole.
Only one theory, the theory thatozone loss stemmed from chemicalreactions involving chlorine, indicatedman-made sources, and implicatedCFC's as the culprit.
You organized a land-based expe-dition to Antarctica in 1986, and an air-borne expedition in 1987, in search ofhard evidence. The challenge was toget the actual observations with suffi-cient quality so that no one could seri-ously question the raw findings. Yourexpedition planning sessions re-
sembled a war room before a majormilitary assault. You brought togethersome of the country's brightest mindsand you spared no expense in an at-tempt to solve this scientific problemthat potentially threatened mankind.
You knew that if the hole was natu-ral, the scientific community mightlook a little silly for launching such afrenetic campaign. If it was man-made, on the other hand, it could be athreat to its makers. The stakes werehigh, and you couldn't afford to makemistakes.
The timing for each expedition hadto be in the Spring, which in the South-ern hemisphere begins in September.This is when the sun begins to rise inAntarctica, after months of darkness.One month later, the ozone hole makesits yearly appearance. According tothe "chemical" theory for the ozonehole, chlorine atoms were locked upin the darkness in stable, unreactivemolecules. When the sun rose eachSeptember, ultraviolet radiation brokethe bonds holding the chlorine atomscaptive, and freed them to react withother molecules.
In addition, the rate of a chemicalreaction increases as temperature in-creases. (See "Temperature" text).The free chlorine atoms would growincreasingly excited with the risingsun, speeding up their moleculardance, and increasing the rate at whichthey collide into, react with, and de-stroy ozone.
159174 COPYRIGHT C 1996
CHEMISTRY UNIT
IN YOURREPORT ATSNOWMASSYOUSHOULD:
1. Outline the compet-ing theories regard-ing the cause of theAntarctic ozonehole and the impli-cations of each.
2. Discuss the effectsof temperature andconcentration onreaction rates, andthe relationship ofeach to answeringthe question ofwhat caused the.Antarctic ozonehole.
3. Ask your audience:Do you think theAntarctic ozonehole is natural orman-made? Why?
-***, it is not necesaryto present all the
, -information, presentedhere. Just answerquestions well, usingyourown words.**".
The concentration of the reactants alsoaffects the rate of reaction, however.(See "Concentration" text). Rates ofreaction in the gas phase must takeplace slowly, because molecules arefar apart. In the liquid phase, on theother hand, reactions are much morerapid, because the molecules are al-ready rubbing against each other anddon't require random collisions to re-act. The difference between the twois as great as comparing the numberof possible automobile accidents on alonely country road to those that mightoccur during downtown rush hour.According to observations, moleculeswere reacting as fast as cars mightcollide in a snarled traffic jam. TheStratosphere is in a gaseous state, how-ever; the collisions should have beenoccurring at a much more leisurelyrate, since gas molecules are few andfar between. What could the reasonbe for such a discrepancy?
160
The teams that you sent down to thefrigid South would be measuring lev-els of C10 in the atmosphere. Highlevels of C10 would tend to validatethe "chemical" theory for the ozonehole, and point to destruction fromman-made sources. No matter howenergetic a sun dance the chlorine didwhen sunlight returned to the Antarc-tic sky, however, it couldn't possiblygobble ozone at the observed rates be-cause of temperature increases alone.Another part of the chemical theory,developed by Susan Solomon and oth-ers, would serve to explain the extraor-dinarily rapid rate of ozone destruction.
COPYRIGHT 0 1996 175
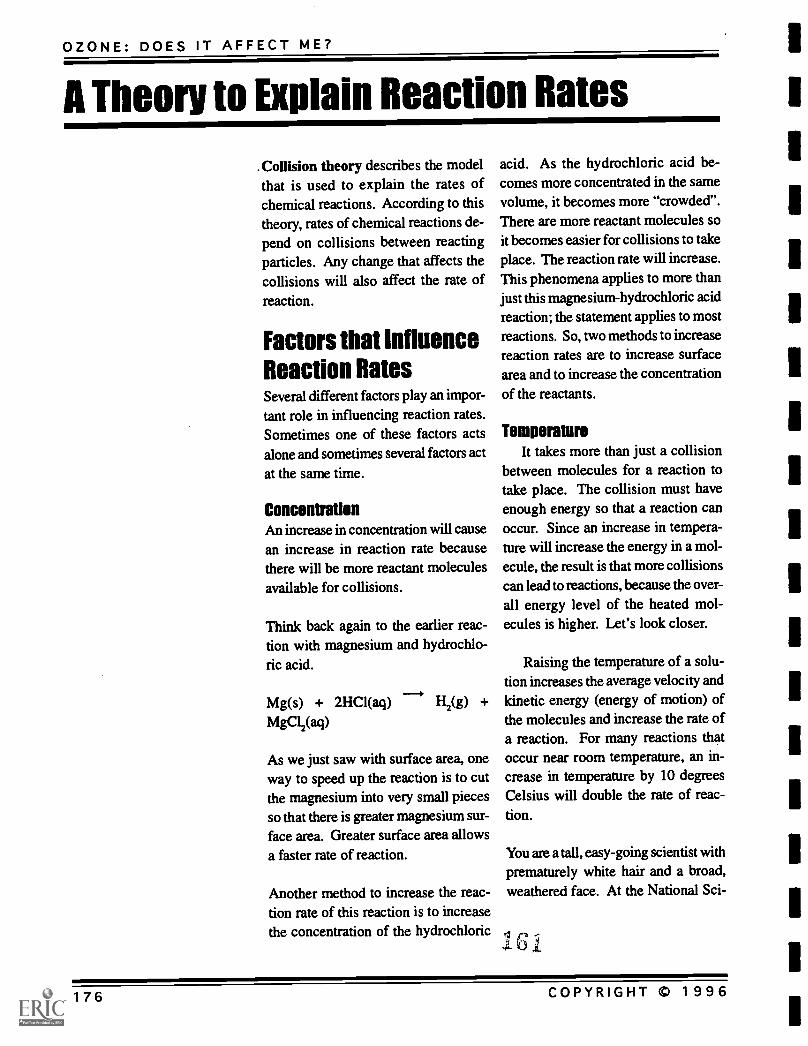
OZONE: DOES IT AFFECT ME?
A Theory to Explain Reaction Rates
. Collision theory describes the modelthat is used to explain the rates ofchemical reactions. According to thistheory, rates of chemical reactions de-pend on collisions between reactingparticles. Any change that affects thecollisions will also affect the rate ofreaction.
Factors that InfluenceReaction RatesSeveral different factors play an impor-
tant role in influencing reaction rates.Sometimes one of these factors actsalone and sometimes several factors act
at the same time.
ConcentrationAn increase in concentration will causean increase in reaction rate becausethere will be more reactant moleculesavailable for collisions.
Think back again to the earlier reac-tion with magnesium and hydrochlo-ric acid.
Mg(s) + 2HC1(aq) H2(g) +MgC12(aq)
As we just saw with surface area, oneway to speed up the reaction is to cutthe magnesium into very small piecesso that there is greater magnesium sur-face area. Greater surface area allowsa faster rate of reaction.
Another method to increase the reac-tion rate of this reaction is to increasethe concentration of the hydrochloric
acid. As the hydrochloric acid be-comes more concentrated in the samevolume, it becomes more "crowded".There are more reactant molecules soit becomes easier for collisions to takeplace. The reaction rate will increase.This phenomena applies to more thanjust this magnesium-hydrochloric acidreaction; the statement applies to mostreactions. So, two methods to increasereaction rates are to increase surfacearea and to increase the concentrationof the reactants.
TemperatureIt takes more than just a collision
between molecules for a reaction totake place. The collision must haveenough energy so that a reaction canoccur. Since an increase in tempera-ture will increase the energy in a mol-ecule, the result is that more collisionscan lead to reactions, because the over-all energy level of the heated mol-ecules is higher. Let's look closer.
Raising the temperature of a solu-tion increases the average velocity andkinetic energy (energy of motion) ofthe molecules and increase the rate ofa reaction. For many reactions thatoccur near room temperature, an in-crease in temperature by 10 degreesCelsius will double the rate of reac-tion.
You are a tall, easy-going scientist withprematurely white hair and a broad,weathered face. At the National Sci-
176 COPYRIGHT C 1996
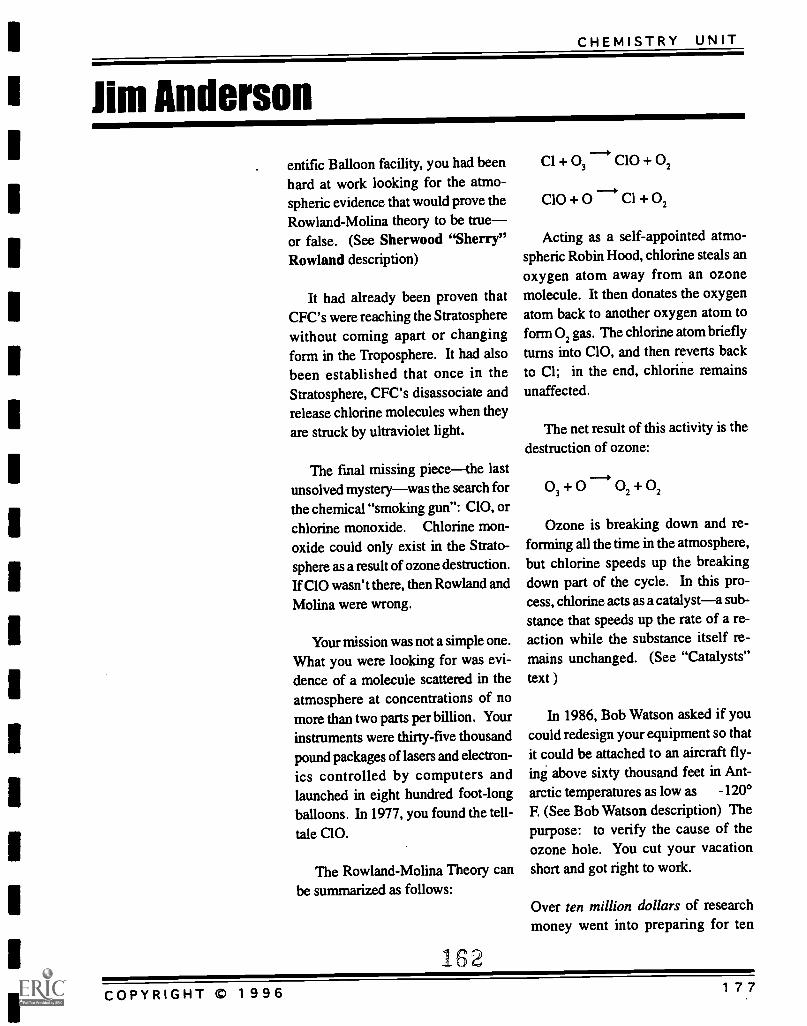
CHEMISTRY UNIT
Jim Anderson
entific Balloon facility, you had beenhard at work looking for the atmo-spheric evidence that would prove theRowland-Molina theory to be trueor false. (See Sherwood "Sherry"Rowland description)
It had already been proven thatCFC's were reaching the Stratospherewithout coming apart or changingform in the Troposphere. It had alsobeen established that once in theStratosphere, CFC's disassociate andrelease chlorine molecules when theyare struck by ultraviolet light.
The final missing piecethe lastunsolved mysterywas the search forthe chemical "smoking gun": C10, orchlorine monoxide. Chlorine mon-oxide could only exist in the Strato-sphere as a result of ozone destruction.If C10 wasn't there, then Rowland andMolina were wrong.
Your mission was not a simple one.
What you were looking for was evi-dence of a molecule scattered in theatmosphere at concentrations of nomore than two parts per billion. Your
instruments were thirty-five thousandpound packages of lasers and electron-ics controlled by computers andlaunched in eight hundred foot-longballoons. In 1977, you found the tell-
tale C10.
The Rowland-Molina Theory canbe summarized as follows:
162
Cl + 03 C10 + 02
C10+0C1+02
Acting as a self-appointed atmo-spheric Robin Hood, chlorine steals anoxygen atom away from an ozonemolecule. It then donates the oxygenatom back to another oxygen atom toform 02 gas. The chlorine atom brieflyturns into C10, and then reverts backto Cl; in the end, chlorine remainsunaffected.
The net result of this activity is thedestruction of ozone:
034-0+02+02
Ozone is breaking down and re-forming all the time in the atmosphere,but chlorine speeds up the breakingdown part of the cycle. In this pro-cess, chlorine acts as a catalysta sub-stance that speeds up the rate of a re-action while the substance itself re-mains unchanged. (See "Catalysts"text )
In 1986, Bob Watson asked if youcould redesign your equipment so thatit could be attached to an aircraft fly-ing above sixty thousand feet in Ant-arctic temperatures as low as -120°
F. (See Bob Watson description) Thepurpose: to verify the cause of theozone hole. You cut your vacationshort and got right to work.
Over ten million dollars of researchmoney went into preparing for ten
COPYRIGHT © 1996 177
OZONE: DOES IT AFFECT ME?
IN YOURREPORT ATSNOWMASS,YOUSHOULD:
1. Explain what acatalyst is, chemi-cally speaking.
2. Explain the catalyticnature of the de-struction of ozoneby chlorine.
3. Facilitate a discus-sion with youraudience: Does thedata that you col-lected prove thatCFC's caused theozone destruction inAntarctica? Why orwhy not?
*** It is not necessaryto present gall theinformation presentedhere.. Just answer; thequestions well, usingyour own words.***
flights of the ER-2, a modified versionof the Lockheed U-2 spy plane. Youcouldn't afford to fail. On the firstflight, however, one of your worstnightmares came true. As the planeflew towards Antarctica, the tempera-ture dropped, and something openedup in one of the circuits or connectorsor wires.
You had less than 16 hours beforethe next flight out, to solve the prob-lem. Staying up all night, you and yourteam wrote a computer diagnostic pro-gram designed to test the circuits oneby one if the instrument failed again,thereby recording which one of theconnectors was opening. On the sec-ond flight, the instrument failed again,but the diagnostic worked. When theplane came back from its mission, youwere able to identify and fix the faultywiring.
The morning of the third flight youheld your breath as you watched theplane take off once again from PuntasArenas, Chile, headed for Antarctica.This was the make-or-break attempt.You couldn't keep sending out pilotsday after day with equipment thatdidn't work.
That evening you dumped the datafrom the returning plane into a com-puter. The instrument had worked, andthe data was significant. Your equip-ment recorded C10 concentrations fivehundred times higher than readingstaken elsewhere on the planet. Nota-bly, as the concentration of C10 wentup, the concentration of ozone wentdown.
By the end of the expedition, yourteam concluded that: 1) The ozonehole had reappeared and was evendeeper than the year before. 2) Morethan half the ozone had been destroyedover an area of roughly 12.5 millionsquare miles, and 3) chlorine was thecause.
163
178 COPYRIGHT m 1996
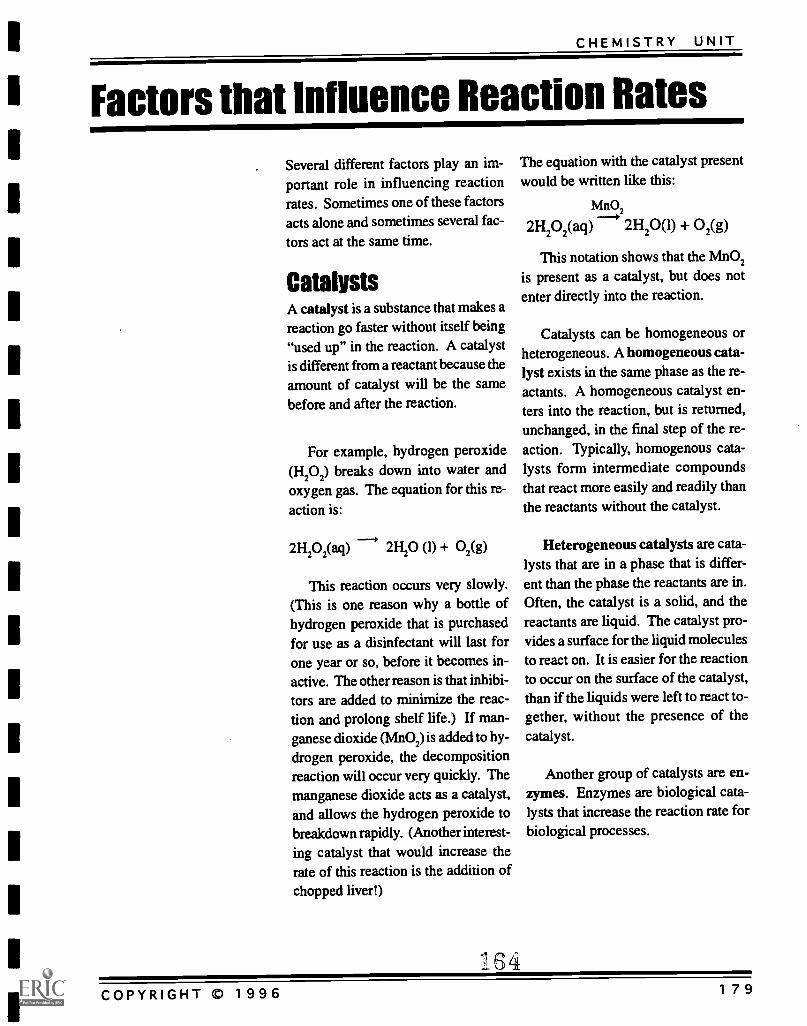
CHEMISTRY UNIT
Factors that Influence Reaction Rates
Several different factors play an im-portant role in influencing reactionrates. Sometimes one of these factorsacts alone and sometimes several fac-tors act at the same time.
CatalystsA catalyst is a substance that makes areaction go faster without itself being"used up" in the reaction. A catalystis different from a reactant because theamount of catalyst will be the samebefore and after the reaction.
For example, hydrogen peroxide(H202) breaks down into water andoxygen gas. The equation for this re-action is:
2H202(aq) 2H20 (1) + 02(g)
This reaction occurs very slowly.(This is one reason why a bottle ofhydrogen peroxide that is purchasedfor use as a disinfectant will last forone year or so, before it becomes in-active. The other reason is that inhibi-tors are added to minimize the reac-tion and prolong shelf life.) If man-ganese dioxide (Mn02) is added to hy-
drogen peroxide, the decompositionreaction will occur very quickly. Themanganese dioxide acts as a catalyst,and allows the hydrogen peroxide tobreakdown rapidly. (Another interest-ing catalyst that would increase therate of this reaction is the addition ofchopped liver!)
164
The equation with the catalyst presentwould be written like this:
Mn02
2H202(aq) 2H20(1) + 02(g)
This notation shows that the Mn02is present as a catalyst, but does notenter directly into the reaction.
Catalysts can be homogeneous orheterogeneous. A homogeneous cata-lyst exists in the same phase as the re-actants. A homogeneous catalyst en-ters into the reaction, but is returned,unchanged, in the final step of the re-action. Typically, homogenous cata-lysts form intermediate compoundsthat react more easily and readily thanthe reactants without the catalyst.
Heterogeneous catalysts are cata-lysts that are in a phase that is differ-ent than the phase the reactants are in.Often, the catalyst is a solid, and thereactants are liquid. The catalyst pro-vides a surface for the liquid moleculesto react on. It is easier for the reactionto occur on the surface of the catalyst,than if the liquids were left to react to-gether, without the presence of thecatalyst.
Another group of catalysts are en-zymes. Enzymes are biological cata-lysts that increase the reaction rate forbiological processes.
COPYRIGHT © 1996 1 7 9
OZONE: DOES IT AFFECT ME?
Susan Solomon
While still a chemistry student at theIllinois Institute of Technology, youbecame hooked on atmospheric chem-istry, and you became fascinated withusing computer modeling to investigatechanges in the atmosphere. But younever dreamed that your chosen careerpath would send you to the frozenwasteland of the coldest place on earth.
The odyssey began when you wereasked to review Joe Farman's articlefor publication in Nature Magazine.(See Joe Farman description) Youbecame heavily involved in trying toanswer the question, "Why was theozone depletion in Antarctica occur-ring so much more rapidly than else-where on the planet?" Gradually, youstarted to develop a theory. You pub-lished some of your ideas in NatureMagazine, June 19, 1986.
You were becoming increasinglyconvinced that a key to the answer in-volved the Polar Stratospheric Clouds(PSC's), formations of ice crystals andfrozen nitric acid found for the mostpart only in Antartica, where tempera-tures can fall below -80° C. These tinyfrozen particles hang some fifteen totwenty kilometers above Antarcticaexactly the same altitude the winterAntarctic ozone layer.
Meanwhile, also in the very samenarrow zone of the earth's atmosphere,UV bombarded CFC's were releasingfree chlorine into the Stratosphere.Much of this chlorine would get lockedsafely away in stable, gaseous chlorine
nitrate (CIONO2) or hydrogen chloride(HCI) molecules. (See Mario Molinadescription)
Ordinarily, chlorine nitrate gas andhydrogen chloride gas do not reactwith each other in the atmosphere. InAntarctica, however, you theorize thatPSC's play the role of a catalyst (See"Catalysts" text) The PSC's could pro-vide a surface on which the moleculesof CIONO2 and HC1 would be able toreact, in which case the following re-action would take place:
C1ONO2(g) + HCI(g)
PSC sC12(g) + HNO3(s)
As a result of the reaction, the chlo-rine is released from the stable molecu-
lar "sinks", and forms the more vul-nerable C124). When the sun begins toreturn in September after a dark Ant-arctic winter, ultraviolet radiationbreaks the bonds of Clz and an armyof free Cl radicals suddenly begin de-stroying the ozone.
The PSC's are tiny and abundant.Therefore they have a great deal ofexposed surface area. The amount ofavailable surface area affects the rateof the reaction. (See "Surface Area"text) If PSC's were to exist in the formof a few large chunks of ice, for ex-ample, the amount of exposed surfacearea would be less and the rate of thereaction would be slower.
But all of this was only a theory
180 COPYRIGHT C 19961 5
CHEMISTRY UNIT
IN YOURREPORT ATSNOWMASS,YOUSHOULD:
1. Explain how a cata-lyst can increasethe rate of a chemi-cal reaction.
2. Explain how theamount of exposedsurface area canincrease the rate ofa chemical reaction.
3. Explain why ozonedepletion occurs somuch more rapidlyin Antarctica thanelsewhere on theplanet.
4. Facilitate a discus-sion with your.audience: Couldwhat happened inAntarctica poten-tially happen some-where else? Why orwhy not?
*** It is not necessaryto present all theinformation presented.here. Just answer thequestions well, usingyour own words.***
until it could be proved with somehard, solid data. And you were the onewho volunteered to lead the expedi-tion to Antarctica to collect it.
You and your team of scientists setup camp at McMurdo Sound air forcebase in the dead of the Polar winter,August of 1986. You cut a hole in theroof so that moonlight could reach theAtmospheric Trace Molecule Spec-trometer, which needed to be kept atroom temperature. You and the mem-bers of your team had to take turns sit-ting outside on the frozen roof in 20minute shifts, holding a mirror thatwould guide moonbeams down the
hole. When the beams of light hit thespectrometer, the instrument wouldbreak it into a spectrum of dark andlight bands, which could be analyzedby a computer for the presence of cer-tain molecules. You were looking forchlorine dioxide (0C10), the appear-ance of which would indicate that thechlorine molecule was the ozone de-stroying culprit.
The data you collected, at the ex-pense of numbingly cold fingers andtoes, supported the chemical theory forozone depletion. It appeared that theozone hole was indeed a man-made,not a natural phenomenon.
COPYRIGHT m 1996 181
OZONE: DOES IT AFFECT ME?
Factors that Influence Reaction Rates
Assume you areto generatehydrogen gasfrom magnesiumand hydrochloricacid.. Assumethat you havemore thanenoughhydrochloric acid.Which form ofreactant wouldyou use so thatthe reaction goesas fast aspossible?
One 25-grampiece ofmagnesiuM?
Twenty-five -1-gram =pieces ofmagnesium?
Several different factors play animportant role in influencing reaction
rates. Sometimes one of thesefactors acts alone and sometimesseveral factors act at the same time.
Surface AreaAn increase in surface area causes areaction to proceed faster because there
is more direct contact (collisions) be-
tween reacting molecules if there ismore surface area. Let's look closer at
this factor.
The amount of surface area affectsthe rate of reaction. In the reaction
given earlier, solid magnesium is ex-posed to hydrochloric acid to producehydrogen gas and magnesium chloride.
Mg(s) + 2HC1 (aq) H2(g) +
MgCl(aq)
The reaction rate will increase if the
amount of surface area of magnesiumis increased since there are morecolli-
sion sites. If the surface area is in-creased by cutting the magnesium into
small pieces, more magnesium will be
in contact with the acid, and the reac-tion will proceed faster.
Assume you are to generate hydro-
gen gas from magnesium and hydro-
chloric acid. Assume that you havemore than enough hydrochloric acid.Which form of reactant would you useso that the reaction goes as fast as pos-
sible? One 25-gram piece of magne-sium? or Twenty-five 1-gram piecesof magnesium?
Using smaller pieces of magne-sium will give a faster reaction ratethan using a single, larger piece. Con-
sidering the two choices for magne-sium, do you think the amount of hy-drogen gas produced is the same?
Yes, it will be. In each case, theamount of magnesium that will react
with the acid is the same. (It is onlythe form of the magnesium, large orsmall pieces, that is different.) In each
case the amount of hydrogen gas that
is produced is the same. When manysmall pieces of magnesium are used,the time it takes to react all of the mag-nesium with the acid will be shorterthan if one larger piece of magnesium
is used.
Another common example of achemical reaction is oxidation of iron,known as rusting. Rusting of an ironbar will occur slower than rusting of
an equal amount of iron filings (orshavings). The filings have more sur-face area exposed to air, so the reac-tion can proceed faster.
182 1U/COPYRIGHT 0 1996
CHEMISTRY UNIT
Analysis Of Ozone Depletion Data
Analyze data.
Describe the formationand destruction of ozone
Compare and contrastozone data
Name:
Date:
Period:
Examine the graphs and graphics located in the "ozone graphics" fileon your computer, and answer the questions below. All of the
graphs and the questions have to do with stratospheric ozone deple-
tion.
I. Graphics
A. Location makes a difference
1. What effect does ozone have when it is located in the strato-sphere?
2. What effect does ozone have when it is located in the tropo-sphere?
B. Model of ozone cycle
1. Write the series of equations for the natural production of ozonein the stratosphere. (Each line of the diagram represents a differ-ent equation.)
COPYRIGHT © 199663
1831
OZO.NE: DOES IT AFFECT ME?
2. Write the series of equations for the "Chapman Process" for thedestruction of ozone in the stratosphere.
II. Continental
A. Continental ozone levels
1. Examine the three images in the "Continental-Ozone-Levels"folder. In general, do ozone levels tend to be greater towards theequator or towards the poles? (Click on the scoll down bar toreveal the color-coded key. A Dobson Unit is a measure of ozoneconcentration. The greater the Dobson unit, the more ozone thereis in the atmosphere in that location. Five hundred Dobson unitsindicates a high presence of ozone. Two hundred Dobson unitsindicates a low presence of ozone.)
B. 1926-93 Ozone levels over Arosa, Switzerland.This graph represents ozone measurements taken from the ground inArosa, Switzerland, and compares that data to measurements takenform a satellite called TOMS.
1. Notice how the ozone levels fluctuate. What is the highestnumber of Dobson units reached, and in what year does thatreading occur?
2. What is the lowest number of Dobson units reached, and in whatyear does that reading occur?
3. Is there a significant downward trend of ozone levels in Arosa?
184 COPYRIGHT 0 199616 j
CHEMISTRY UNIT
C. 1964-93 Ozone Levels In Tallahassee, Florida
1. How often does ozone reach a peak concentration and then godown again?
2. What might the up and down cycling of ozone concentrationshave to do with?
3. Is there a significant downward trend of ozone levels over Talla-hassee?
4. Compare the average peak ozone levels over Tallahassee, Florida,to those over Arosa, Switzerland.
S. What ideas do you have to explain the differences between theozone levels on the two graphs of Arosa and Tallahasee? (Checkout the location of the two cities on the world map.)
III. AntarcticaA. September 19115 AntarctIca
1. Is there evidence in this image for an ozone "hole" in Antarctica?Why, or why not?
2. In what area is the concentration of ozone the greatest?
COPYRIGHT 0 1996 185170
OZONE: DOES IT AFFECT ME?
B. Antarctica Ozone Hole Size
1. In what year did the size of the ozone hole equal the area of thecontinent of Antarctica?
2. Has size of the ozone hole ever gotten as large as the area of thecontinent of North America?
3. When was the last time that the recorded size of the ozone holewas smaller than the year before?
4. What does this graph measure?
5. Overall, is the ozone hole getting smaller each year?
C. Antarctica Spring Ozone Minima
1. Both this graph and the Antarctica Ozone Hole Size graph aremeasuring something about the ozone hole in Antarctica, but theyare not measuring the same thing. What does this graph measure?Refer to your answer to question B4. How are the measurementsdifferent? Contrast the two graphs, and explain what the differentmeasurements are.
2. In what year did the concentration of ozone reach the lowest?
186 COPYRIGHT C 1996
.171
CHEMISTRY UNIT
3. Is the yearly minimum level of ozone above Antarctica from1978-1994 increasing, decreasing, or staying about the same?
4. In what month of the year is the concentration of ozone mostlikely to reach its minimum level?
D. September 1991-92 Antarctica
1. The scales refer to concentration of CIO (on the left) and ozone(on the right). The white hole over the south pole indicates a lackof data in that area. (In other words, ignore the white space.) Isthere a relationship between the gas C10 and ozone in the atmo-sphere? If so, what is that relationship? If not, why do you saythere isn't?
IV. Arctic Ozone Levels
1. In your opinion, is there or is there not a growing ozone "hole" inthe Northern Hemisphere? Why or why not?
COPYRIGHT m 1996 187172
CHEMISTRY UNIT
Analysis Of OzoneDepletion Data TEACHER BACKGROUND
4344%,C
Students will
Analyze data.
Describe the formation anddestruction of ozone
Compare and contrastozone data
Data analysis
PreparationThe graphs and graphics in this activity can be found on the WorldWide Web at the addresses indicated. You will need to
1. download the graphics
2. convert the graphics from "gif' to "pict" format
3. load the folder of graphics onto the computers at your school
Examine the graphs and graphics located in the "ozone graphics" fileon your computer, and answer the questions below. All of the
graphs and the questions have to do with stratospheric ozone deple-tion.
I. GraphicsA. Location makes a difference(http://spso.gsfc.nasa.gov/NASA_FACTS/ozone/ozone.html)
1. What effect does ozone have when it is located in the strato-sphere?
It protects us from the sun's harmful radiation.
2. What effect does ozone have when it is located in the tropo-sphere?
It can damage lung tissue and plants.
B. Model of ozone cycle(http://spso.gsfc.nasa.gov/NASA_FACTS/ozone/ozone.html)
COPYRIGHT © 1996 189173
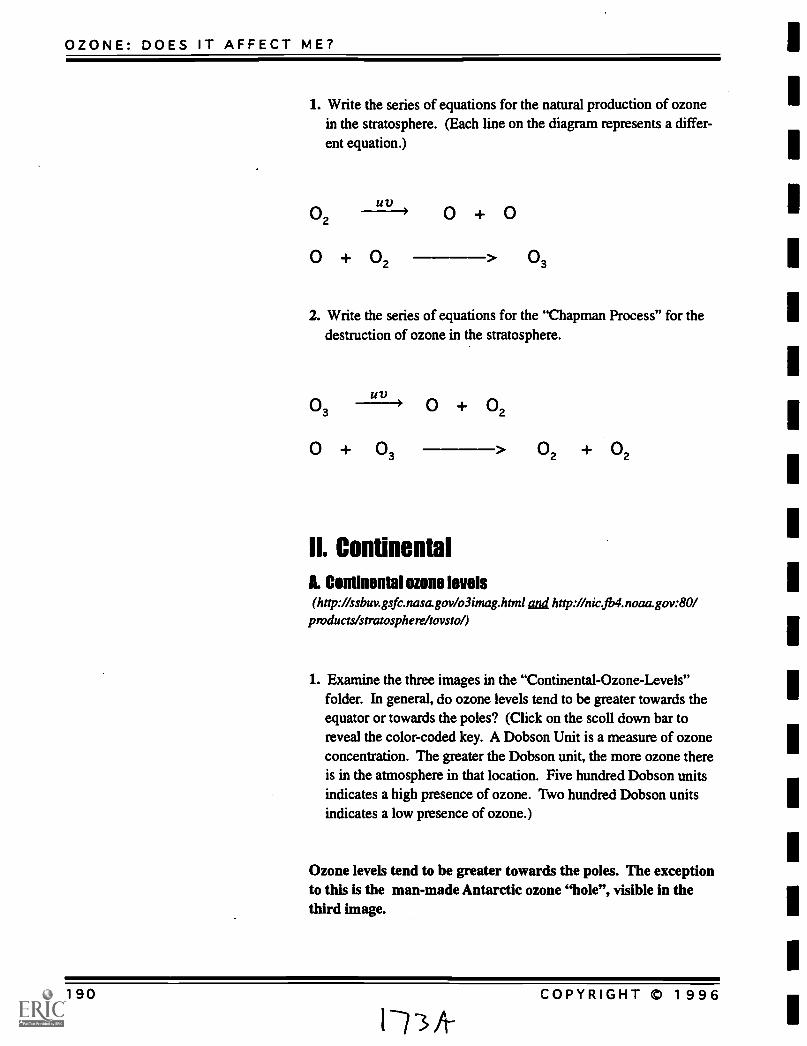
OZONE: DOES IT AFFECT ME?
1. Write the series of equations for the natural production of ozonein the stratosphere. (Each line on the diagram represents a differ-ent equation.)
02uu---.)
0 + 02
0 + 0> 03
2. Write the series of equations for the "Chapman Process" for thedestruction of ozone in the stratosphere.
03u V
--> 0 + 02
0 + 03
II. Continental
> 02 +
A. Continental ozone levels( http:/ /ssbuvgsfc.nasa.gov /o3imag.htnzl and http://nic.fb4.noaa.gov: 80/
products/stratosphere/tovsto/)
1. Examine the three images in the "Continental-Ozone-Levels"folder. In general, do ozone levels tend to be greater towards theequator or towards the poles? (Click on the scoll down bar toreveal the color-coded key. A Dobson Unit is a measure of ozoneconcentration. The greater the Dobson unit, the more ozone thereis in the atmosphere in that location. Five hundred Dobson unitsindicates a high presence of ozone. Two hundred Dobson unitsindicates a low presence of ozone.)
Ozone levels tend to be greater towards the poles. The exceptionto this is the man-made Antarctic ozone "hole", visible in thethird image.
190 COPYRIGHT 0 1996
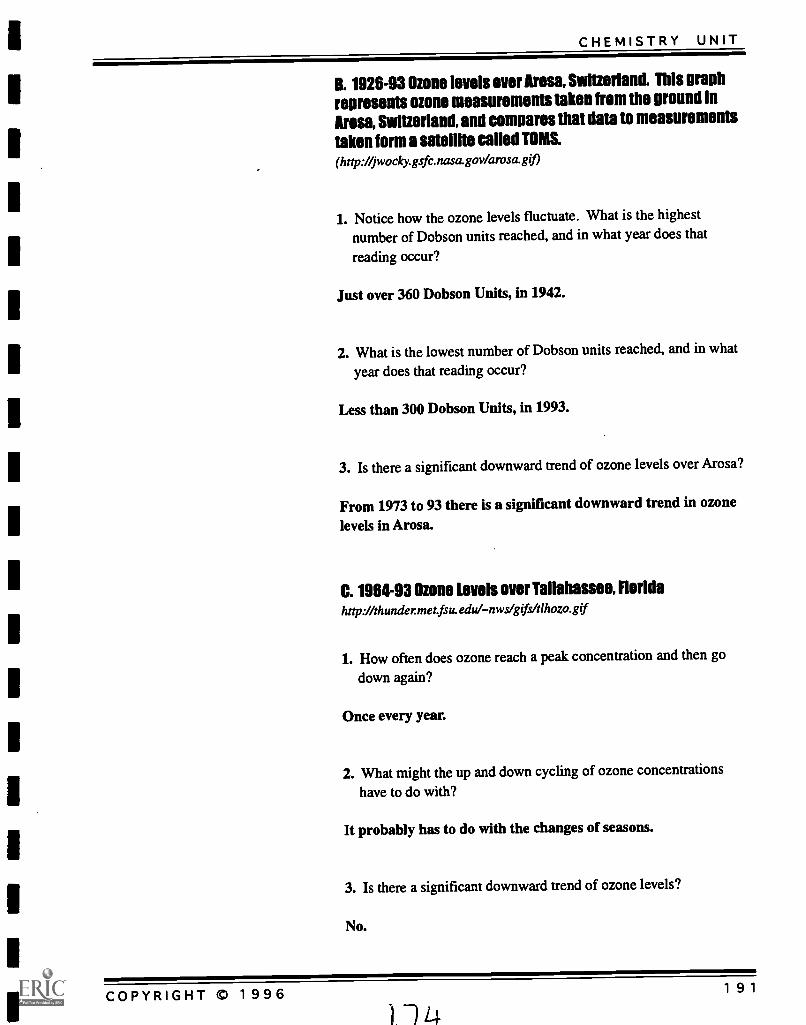
CHEMISTRY UNIT
B. 1926-93 Ozone levels over Arose, Switzerland. This graph
represents ozone measurements taken from the ground in
Arose, Switzerland, and compares that data to measurements
taken form a satellite called TOMS.(http://jwocky.gsfc.nasagov/arosa.gif)
1. Notice how the ozone levels fluctuate. What is the highest
number of Dobson units reached, and in what year does that
reading occur?
Just over 360 Dobson Units, in 1942.
2. What is the lowest number of Dobson units reached, and in what
year does that reading occur?
Less than 300 Dobson Units, in 1993.
3. Is there a significant downward trend of ozone levels over Arosa?
From 1973 to 93 there is a significant downward trend in ozone
levels in Arosa.
C. 1964-93 Ozone Levels over Tallahassee,Floridahttp://thundermet.fsu.edul-nws/gifsfilhozo.gif
1. How often does ozone reach a peak concentration and then go
down again?
Once every year.
2. What might the up and down cycling of ozone concentrations
have to do with?
It probably has to do with the changes of seasons.
3. Is there a significant downward trend of ozone levels?
No.
COPYRIGHT 0 1996 191
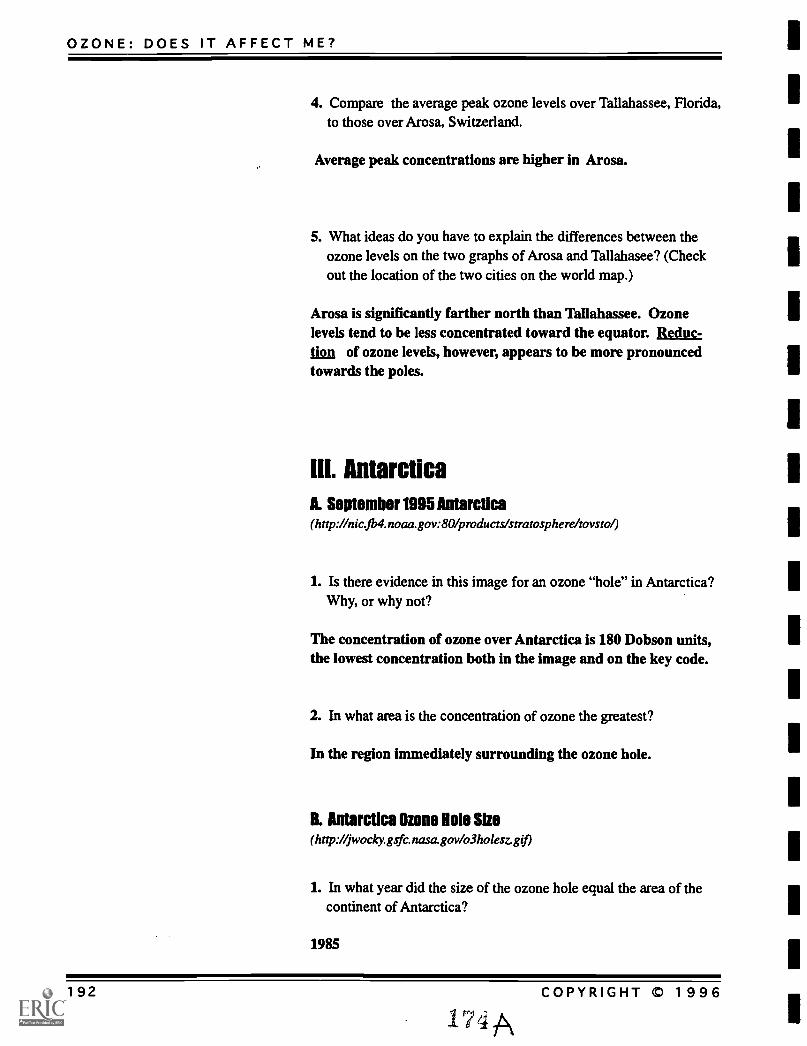
OZONE: DOES IT AFFECT ME?
4. Compare the average peak ozone levels over Tallahassee, Florida,to those over Arosa, Switzerland.
Average peak concentrations are higher in Arosa.
5. What ideas do you have to explain the differences between theozone levels on the two graphs of Arosa and Tallahasee? (Checkout the location of the two cities on the world map.)
Arosa is significantly farther north than Tallahassee. Ozonelevels tend to be less concentrated toward the equator. Iteduc-film of ozone levels, however, appears to be more pronouncedtowards the poles.
III. AntarcticaA. September 1995 Antarctica(http://nic.fb4.noaa.gov:80/products/stratosphere/tovsto/)
1. Is there evidence in this image for an ozone "hole" in Antarctica?Why, or why not?
The concentration of ozone over Antarctica is 180 Dobson units,the lowest concentration both in the image and on the key code.
2. In what area is the concentration of ozone the greatest?
In the region immediately surrounding the ozone hole.
B. Antarctica Ozone Hole Size(http://jwocky.gsfc.nasa.gov/o3holesz.gif)
1. In what year did the size of the ozone hole equal the area of thecontinent of Antarctica?
1985
192 COPYRIGHT 0 1996
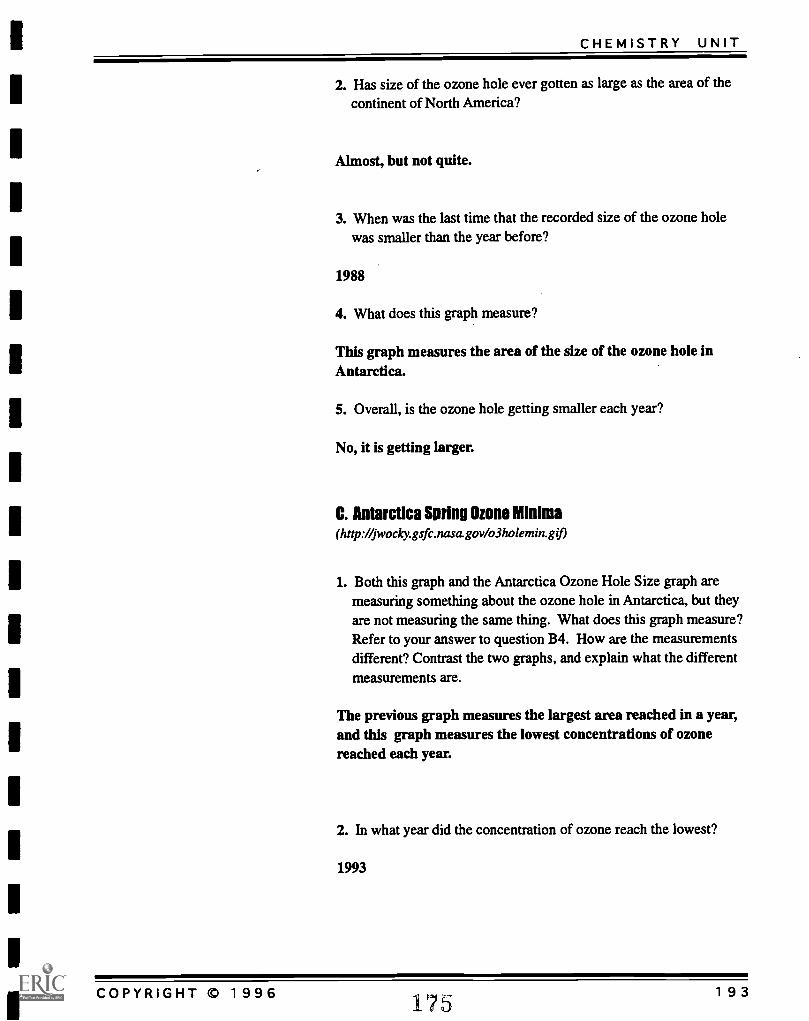
CHEMISTRY UNIT
2. Has size of the ozone hole ever gotten as large as the area of thecontinent of North America?
Almost, but not quite.
3. When was the last time that the recorded size of the ozone holewas smaller than the year before?
1988
4. What does this graph measure?
This graph measures the area of the size of the ozone hole inAntarctica.
5. Overall, is the ozone hole getting smaller each year?
No, it is getting larger.
C. Antarctica Spring Ozone Minima(http://jwocky.gsfc.nasa.gov/o3holemin.gif)
1. Both this graph and the Antarctica Ozone Hole Size graph aremeasuring something about the ozone hole in Antarctica, but theyare not measuring the same thing. What does this graph measure?Refer to your answer to question B4. How are the measurementsdifferent? Contrast the two graphs, and explain what the differentmeasurements are.
The previous graph measures the largest area reached in a year,and this graph measures the lowest concentrations of ozonereached each year.
2. In what year did the concentration of ozone reach the lowest?
1993
COPYRIGHT 0 1 9 9 6 1 9 3175
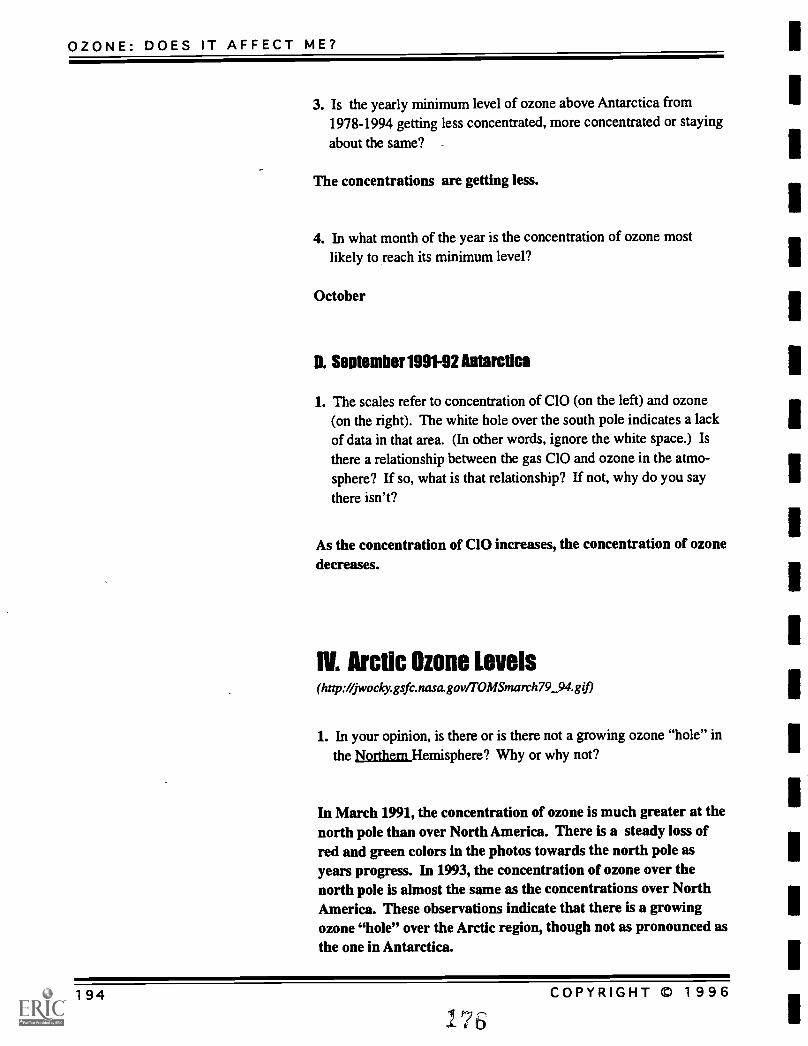
OZONE: DOES IT AFFECT ME?
3. Is the yearly minimum level of ozone above Antarctica from1978-1994 getting less concentrated, more concentrated or stayingabout the same?
The concentrations are getting less.
4. In what month of the year is the concentration of ozone mostlikely to reach its minimum level?
October
D. September 1991-92 Antarctica
1. The scales refer to concentration of C10 (on the left) and ozone(on the right). The white hole over the south pole indicates a lackof data in that area. (In other words, ignore the white space.) Isthere a relationship between the gas C10 and ozone in the atmo-sphere? If so, what is that relationship? If not, why do you saythere isn't?
As the concentration of C10 increases, the concentration of ozonedecreases.
IV. Arctic Ozone Levels(http://jwocky.gsfc.nasagov/TOMSmarch79_94.g0
1. In your opinion, is there or is there not a growing ozone "hole" inthe Northern Hemisphere? Why or why not?
In March 1991, the concentration of ozone is much greater at thenorth pole than over North America. There is a steady loss ofred and green colors in the photos towards the north pole asyears progress. In 1993, the concentration of ozone over thenorth pole is almost the same as the concentrations over NorthAmerica. These observations indicate that there is a growingozone "hole" over the Arctic region, though not as pronounced asthe one in Antarctica.
194 COPYRIGHT © 1996
1 76
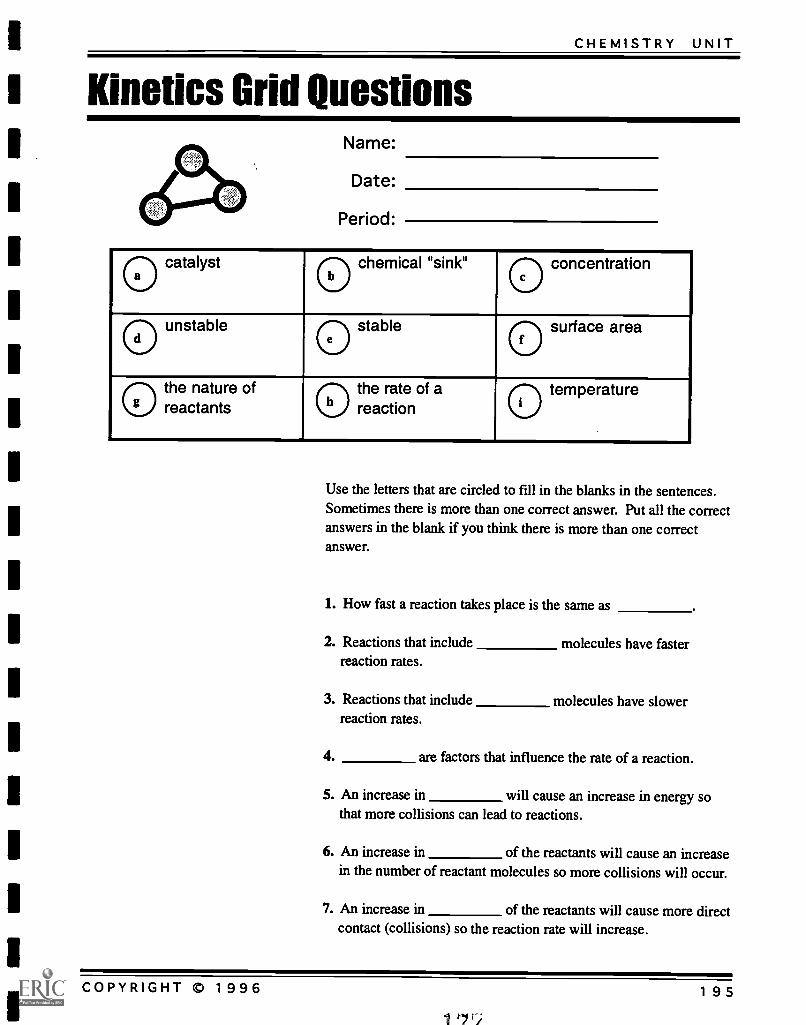
CHEMISTRY UNIT
1 Kinetics Grid Questions
1
Name:
Date:
Period:
catalyst chemical "sink" concentration
0 unstable stable surface area
the nature ofreactants
the rate of areaction
temperature
Use the letters that are circled to fill in the blanks in the sentences.Sometimes there is more than one correct answer. Put all the correctanswers in the blank if you think there is more than one correctanswer.
1. How fast a reaction takes place is the same as
2. Reactions that include molecules have fasterreaction rates.
3. Reactions that include molecules have slowerreaction rates.
4. are factors that influence the rate of a reaction.
5. An increase in will cause an increase in energy sothat more collisions can lead to reactions.
6. An increase in of the reactants will cause an increasein the number of reactant molecules so more collisions will occur.
7. An increase in of the reactants will cause more directcontact (collisions) so the reaction rate will increase.
COPYRIGHT © 1996 195
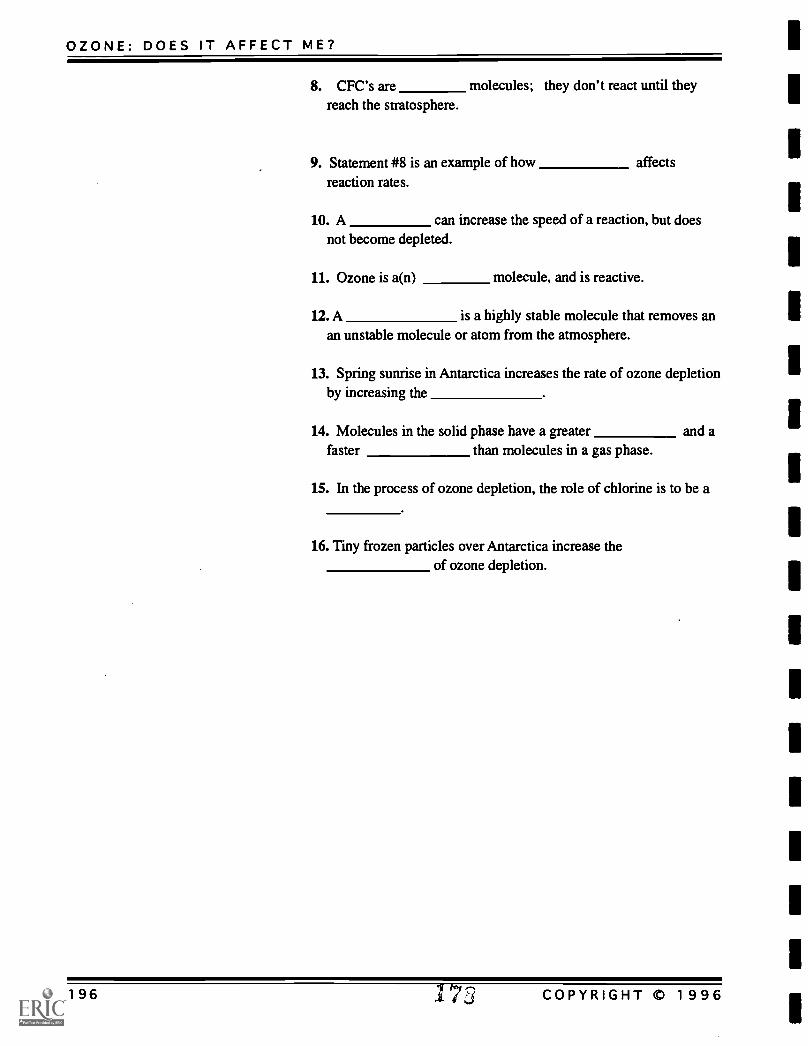
OZONE: DOES IT AFFECT ME?
8. CFC's are molecules; they don't react until theyreach the stratosphere.
9. Statement #8 is an example of how affectsreaction rates.
10. A can increase the speed of a reaction, but doesnot become depleted.
11. Ozone is a(n) molecule, and is reactive.
12. A is a highly stable molecule that removes anan unstable molecule or atom from the atmosphere.
13. Spring sunrise in Antarctica increases the rate of ozone depletionby increasing the
14. Molecules in the solid phase have a greater and afaster than molecules in a gas phase.
15. In the process of ozone depletion, the role of chlorine is to be a
16. Tiny frozen particles over Antarctica increase theof ozone depletion.
196 173 COPYRIGHT 0 1996
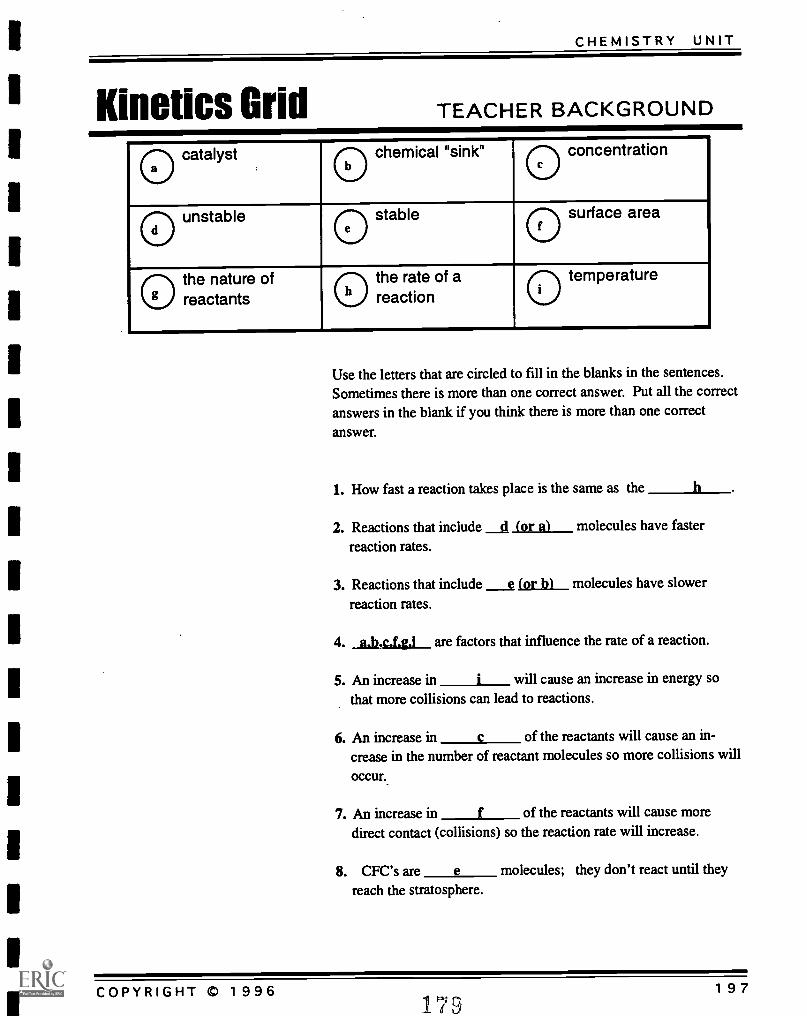
1
1
CHEMISTRY UNIT
Kinetics Grid TEACHER BACKGROUND
catalyst chemical "sink" concentration
unstable stable surface area
the nature ofreactants
the rate of areaction
temperature
Use the letters that are circled to fill in the blanks in the sentences.Sometimes there is more than one correct answer. Put all the correctanswers in the blank if you think there is more than one correctanswer.
1. How fast a reaction takes place is the same as the
2. Reactions that include d a) molecules have faster
reaction rates.
3. Reactions that include e (or b) molecules have slower
reaction rates.
4. a,ba4j are factors that influence the rate of a reaction.
5. An increase in i will cause an increase in energy sothat more collisions can lead to reactions.
6. An increase in c of the reactants will cause an in-crease in the number of reactant molecules so more collisions will
occur.-
7. An increase in f of the reactants will cause moredirect contact (collisions) so the reaction rate will increase.
8. CFC's are a molecules; they don't react until theyreach the stratosphere.
COPYRIGHT 0 19961 75
197
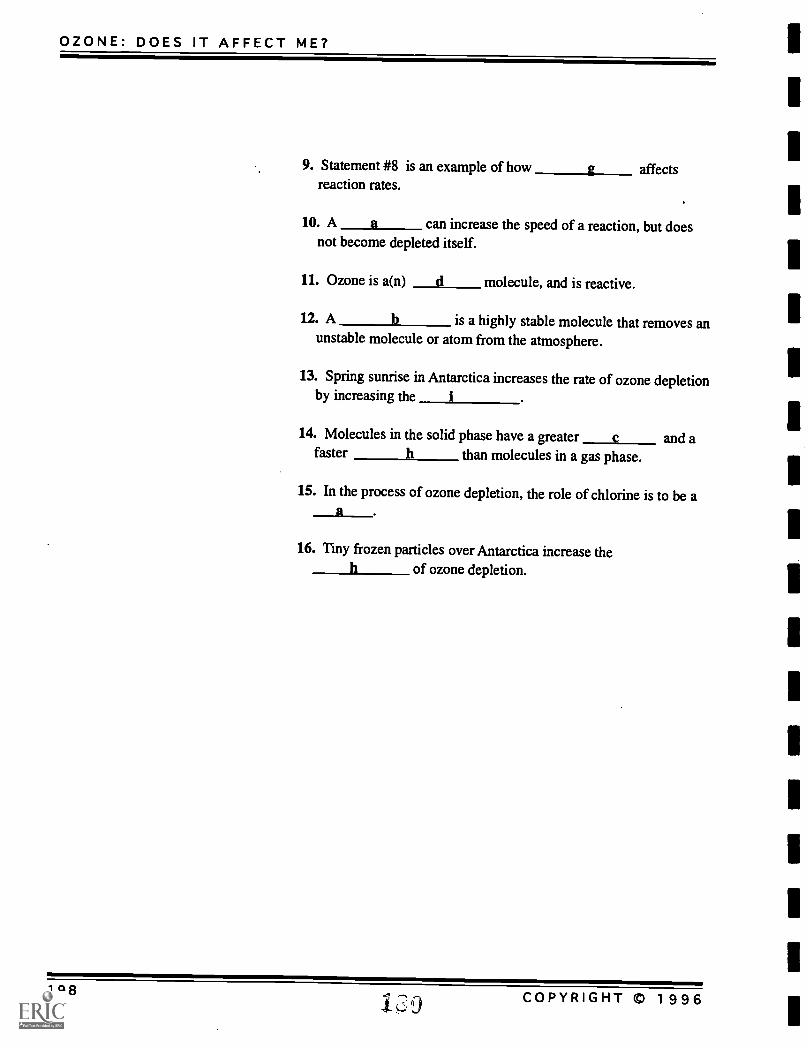
OZONE: DOES IT AFFECT ME?
9. Statement #8 is an example of howreaction rates.
g affects
10. A a can increase the speed of a reaction, but doesnot become depleted itself.
11. Ozone is a(n) d molecule, and is reactive.
12. A b is a highly stable molecule that removes anunstable molecule or atom from the atmosphere.
13. Spring sunrise in Antarctica increases the rate of ozone depletionby increasing the
14. Molecules in the solid phase have a greater c and afaster h than molecules in a gas phase.
15. In the process of ozone depletion, the role ofchlorine is to be a
16. Tiny frozen particles over Antarctica increase theh of ozone depletion.
1981.20 COPYRIGHT 0 1996
U.S. Department of EducationOffice of Educational Research and Improvement (OERI)
Educational Resources Information Center (ERIC)
REPRODUCTION RELEASE
I. DOCUMENT IDENTIFICATION:
(Specific Document)
-.Ct737)5[, IP
ERIC
Title:z)cw A kk,..ir 114,0.
Author(s): Karl G._ G.Corporate Source:
Ur\'..rer;A- . I. HLSU
Publication Date:
II. REPRODUCTION RELEASE:
In order to disseminate as widely as possible timely and significant materials of interest to the educational community,documents announcedin the monthly abstract journal of the ERIC system, Resources in Education (RIE), are usually made available to users in microfiche, reproducedpaper copy, and electronic/optical meda, and sold through the ERIC Document Reproduction Service (ERRS) or other ERIC vendors. Credit Isgiven to the source of each document, and, if reproduction release is granted, one of the following notices is affixed to the document
If permission is granted to reproduce and disseminate the identified document, please CHECK ONE of the following two options and sign atthe bottom of the page.
Check hereFor Level 1 Release:Permitting reproduction inmicrofiche (4' x 6' film) orother ERIC archival media(e.g., electronic or optical)and paper copy.
The sample sticker shown below will beaffixed to all Level 1 documents
PERMISSION TO REPRODUCE ANDDISSEMINATE THIS MATERIAL
HAS BEEN GRANTED BY
TO THE EDUCATIONAL RESOURCESINFORMATION CENTER (ERIC)
Level 1
The sample sticker shown below will beaffixed to all Level 2 documents
PERMISSION TO REPRODUCE ANDDISSEMINATE THIS
MATERIAL IN OTHER THAN PAPERCOPY HAS BEEN GRANTED BY
\0\qtP
TO THE EDUCATIONAL RESOURCESINFORMATION CENTER (ERIC)
Level 2
Documents will be processed as indicated provided reproduction quality permits. If permissionto reproduce is granted, but neither box is checked, documents will be processed at Level 1.
ICheck here
For Level 2 Release:Permitting reprodUction inmicrofiche (4' x 6' film) orother ERIC archival media(e.g., electronic or optical),but not in paper copy.
'I hereby grant to the Educational Resources Information Center (ERIC) nonexclusive permission to reproduce and disseminatethis document as indicated above. Reproduction from the ERIC microfiche or electronic/optical media bypersons other thanERIC employees and its system contractors requires permission from the copyright holder. Exception is made for non-profitreproduction by libraries and other service agencies to satisfy information needs of educators in response to discrete inquiries.'
Sign Signat
here-4please
0:
L C.Organzalorress:
04\\,...t1s,\-\
r'°'\'-'s 122.°\
Isk-0
Printed Name/Posiion/Tite:
F4r1cL L3,1%,),--. .
4) 91S- 4,32,4 o (314)93c1mall Address:
w )0r\ .,.)Date:
Share your 9deas With Colleagues Around the World
Submit your publications to the world's largest education-related database,and let Et Zge work for you.
The Educational Resources Information Center (ERIC) is an international resource funded by the U.S.Department of Education. The ERIC database contains over 820,000 records of conference papers, journalarticles, books, reports and non-print materials of interest to educators at all levels. Your publications canbe among those indexed and described in the database.
Why submit materials to ERge?
Visibility. Items included in the ERIC database are announced to educators around the world throughover 2,000 organizations receiving the abstract journal Resources in Education (NE); through access toERIC on CD-ROM at most academic libraries and many local Libraries; and through online searches ofthe database via the Internet or through commercial vendors.
Dissemination. If a reproduction release is provided to the ERIC system, documents included in thedatabase are reproduced on microfiche and distributed to over 900 information centers worldwide. Thisallows users to review materials on microfiche readers before purchasing paper copies or originals.
Retrievability. This is probably the most important service ERIC can provide to authors ineducation. The bibliographic descriptions developed by the ERIC system are retrievable by electronicsearching of the database. Thousands of users worldwide regularly search the ERIC database to findmaterials specifically suitable to a particular research agenda, topic, grade level, curriculum, oreducational setting. Users who find materials by searching the ERIC database have particular needs andwill likely consider obtaining and, using items described in the output obtained from a structured searchof the database.
Always "In Print". ERIC maintains a master microfiche from which copies can be made on an"on-demand" basis. This means that documents archived by the ERIC system are constantly availableand never go "out of print". Persons requesting material from the original source can always be referredto ERIC, relieving the original producer of an ongoing distribution burden when the stocks of printedcopies are exhausted.
So, how do g submit materials?
Complete and submit the enclosed Reproduction Release form. You have three options whencompleting this form: If you wish to allow ERIC to make microfiche and paper copies of printmaterials, check the box on the left side of the page and provide the signature and contact informationrequested. If you want ERIC to provide only microfiche copies of print materials, check the box on theright side of the page and provide the requested signature and contact information. If you aresubmitting non-print items or wish ERIC to only describe and announce your materials, withoutproviding reproductions of any type, complete the back page of the form.
Submit the completed release along with two copies of the document being submitted. There must bea separate release form for each item submitted. Mail all materials to the attention of Niqui Beckrum atthe address indicated.
3or further information, contact... Niqui BeckrumDatabase CoordinatorERIC/CS MEE1929 Kenny RoadColumbus, OH 43210-1080
1-800-276-0462(614) 292-6717(614) 292-0263 (Fax)becicrum.1®osu.edu (e-mail)
Related Documents