UNIVERSITI PUTRA MALAYSIA URBAN RESIDENTIAL DEMAND FOR WATER IN SUBANG JAYA, SELANGOR: A CROSS·SECTIONAL ANALYSIS REMEE DASS ANNANIAH FEP 1999 4

Welcome message from author
This document is posted to help you gain knowledge. Please leave a comment to let me know what you think about it! Share it to your friends and learn new things together.
Transcript
UNIVERSITI PUTRA MALAYSIA
URBAN RESIDENTIAL DEMAND FOR WATER IN SUBANG JAYA, SELANGOR:
A CROSS·SECTIONAL ANALYSIS
REMEE DASS ANNANIAH
FEP 1999 4

URBAN RESIDENTIAL DEMAND FOR WATER IN SUBANG JAYA, SELANGOR:
A CROSS·SECTIONAL ANALYSIS
REMEE DASS ANNANIAH
MASTER OF SCIENCE UNIVERSITI PUTRA MALAYSIA
1999
URBAN RESIDENTIAL DEMAND FOR WATER IN SUBANG JAYA, SELANGOR:
A CROSS-SECTIONAL ANALYSIS
By
REMEE DASS ANNANIAH
A Thesis submitted in Partial Fulfilment of the Requirements of Master of Science in The Faculty of Economics and Management,
Universiti Putra Malaysia
May, 1999
ACKNOWLEDGEMENTS
I am greatly indebted to my project supervIsor Associate Professor Dr K.
Kuperan Viswanathan for his very constructive comments and valuable guidance
throughout my study. Much appreciation also goes to Professor Dr Nik Mustapha Raja
Abdullah and Associate Professor Dr Zubaidi Baharumshah for their readership and
conscientious comments.
I would like to thank all my lecturers at The Faculty of Economics and
Management, Universiti Putra Malaysia for their help and guidance throughout my
study.
Special thanks also go to the Directors of the Petaling Water Department in
Selangor for providing the water consumption figures from their archieves. I also
extend my sincere gratitude to my friends and colleagues who have helped me
throughout this study. I would also like to thank Puan Norizan for typing several
versions of the additions and corrections cheerfully.
Finally, I would like to thank my father and my mother for their inspiring and
thought provoking counsel.
ii

TABLE OF CONTENTS
Page
ACKNOWLEDGEMENTS . . . . . . . . . . . . . . . . . . . . . . . . . . . . . . . . . . . . . . . . . . . . . . . . . . . . . . . . . . . . . . . . . . . . . . . . . . . . . . . . . . ii LIST OF TABLES . . . . . . . . . . . . . . . . . . . . . . . . . . . . . . . . . . . . . . . . . . . . . . . . . . . . . . . . . . . . . . . . . . . . . . . . . . . . . . . . . . . . . . . . . . . v LIST OF FIGURES . . . . . . . . . . . . . . . . . . . . . . . . . . . . . . . . . . . . . . . . . . . . . . . . . . . . . . . . . . . . . . . . . . . . . . . . . . . vi LIST OF ABBREVIATION . . . . . . . . . . . . . . . . . . . . . . . . . . . . . . . . . . . . . . . . . . . . . . . . . . . . . . . . . . . . . . . . vii ABSTRACT . . . . . . . . . . . . . . . . . . . . . . . . . . . . . . . . . . . . . . . . . . . . . . . . . . . . . . . . . . . . . . . . . . . . . . . . . . . . . . . . . . viii ABSTRAK . . . . . . . . . . . . . . . . . . . . . . . . . . . . . . . . . . . . . . . . . . . . . . . . . . . . . . . . . . . . . . . . . . . . . . . . . . . . . . . . . . . . . . xi
CHAPTER
I INTRODUCTION General Introduction . . . . . . . . . . . . . . . . . . . . . . . . . . . . . . . . . . . . . . . .. . ...... .................... 1 Demand for Water ................................................... ...... . ..... .................. ... 2 Water Demand in Malaysia ......... ............... . ... ......... ...... .................... . ...... 3 Water Resource Development and Management.. ......... .................. . . . .... .4 The Problem Statement ... .. .. ... .......... ... . ........ .... .. ......... ...... .... . . .. . .... ..... .... . 8 The Objectives of Study. . . . . . . . . . . . . . . . . . . . . . . . . . . . . . . . . . . . . . . . . . . . . . . ... . . . .. 9
II LITERATURE REVIEW Introduction . . ......... ............ ..... ..... ..... .. ...... ........... ...... ............... .. . ..... . . . . . 1 1
The Theory of Consumer Behaviour .................. ....... ................... . . . . ...... 12 Derivation of Consumer Demand Curve .................................... . . . ......... 15 Water Conservation through Pricing . ........... ........ .... .................... . . ........ 1 8 Past Literatiure on Residential Water Demand ................ . .. ... . .......... . .... 22 Domestic Water Demand .... . ................. ......................... ............ . . . . . . . . ... 27 Sprinkling Demand ..................... .. . . ............. . ........ ... . ............ . . . . ..... . . . . . . 28 Pricing Structure .. . ..... ... . ................... . . ......................... ......... ...... . .... ..... 30
Average Price ........... .. ....... .. ..... .............. .... ... . . . ... .......... ... . . . . . ....... ... 3 1 Marginal Price ................ . .. ... ....... ..... .. . ... .... . ...... ....... . . .. . . . ..... .. . . . ... .... 31 Inframarginal Price .. . . . . . . . . .. . . .... . . . . . .. . .................. . ......... .... ...... .... . . .... 32
Price Elasticity Estimates in a Single Step-Up Rate Structure .. . . . . . . . . . .. 33 Price Elasticity Estimates in a Multiple Step-up Rate Structure ..... . ..... 35 The � factor in Block Rate Pricing ............................ ........... . .... .. . . . . . . . .. 38 Income ..................................... ........................................ . . ....... . . . .. . . . ..... 40 Demographic and Socio-Economic factors ... ........................... . . . . . . . ..... .4 1 Technological Factors ............ ..... ......... ................................... . . ... . . . . .... 45 Climatic Factors . ............... ........ .............. . .............. ........ . . ....... . . . . ... . . ..... 46 Dynamic Models of Residential Water Demand . . .............. .. . ..... . . . ... . .. . .47 Price and Income Elasticities of Residential Water Demand . . . . . . . . . . .... .49
111
III METHODOLOGY OF STUDY Page
Introduction. . . . . . . . . . . . . . . . . . . . . . . . . . . . . . . . . . . . .. . . . . . .. . . . . . . . . . .. . . . .. . . . . . . . . . . . .. . . . . . . . . . . . .. . . . . . . . 54 The Study Area .... . ......... .. ........ . ... . . ...... . ............ .. ...... ....... . . ...... .. .... .. ... .... . . . 54 The Questionnaire .. . . . . . . . . . ...... . ....... ... ..... ... ....... . ........ .. . ...... ...... ......... . . .... . 55 Conducting the Survey . . .. . ........ .............. ......... ................ ... . ... .. . . ....... . . . ... .. 55 Variable Measurement and the Framework of Analysis . ........... ........ . . . ..... 56 The Dependent Variable . . . ............ ......... . . . ........ .... , . ...... .... ..... . .. ............ ...... 57 The Independent Variables ...... . ...... ............. ....... . ...... . ... . .... . .... . . . .. .... . . ..... ... 58 Price ..................................... ............................................................ . . ......... 58
Average Price (AP) ............ ...... ... ...... ......... .... ............. ...... .. . . .... .... ..... 59 Marginal Price (MP) .. . . ....... .......... .. . . . .......... ... . ..... .... ........... . . . ... .. ... ... 59 Inframarginal Price (D) .... .. . . . ...... . . . . ...... . ........ ........ ..... .. ..... . . . .. . . ...... 59
Income (I) ............. . . ............ ........... .......... . .... .. . ........... . ... .......... .. . ..... . . . . . . .... 63 Household size (HS) ..... ... .. ........... . ..... ...... ..... ..... .. .... . .................... . , . . . ..... 63 Sprinkling Frequency SF). . . . .. . . . . .... . . . . . . . .. . . . . . .. . . . . .. . .. . . .... . . ..... . . . . . . .... ... . 64 Visitors Staying Frequency (VS) . ...... . ........ . ....... ..... .... .. ...... .. .. . . . . .. . . . .. .. .. . 64 Other Variables ... . .. ............. . . .. ... ...... ...... ... . . ........ . .. . . . . . . . . . . . . . . . . . . . .. .. . ....... 65
The Regression Models .... ............................ ... ........ ...... .. ... ... .. . . . . . .. . .... . . .... . 65 The P Factor in FIP Specification ....... . ........ . . . . ................. . ....... . . . . . . . . . . . . .. . 68 Socio-cultural Variables in the Regression ModeL ... . ... ... ...... . . . . . . . . ......... 71 Estimation of Demand Elasticities of Different Income Groups ... . . . . . . . . 72
IV RESULTS AND DISCUSSION Introduction . . .... . . . .... ..... ......... ..... . ....... . ............. ... . ..... .. ..... ....... .... . . . .. . . . , . . . 75 Characteristics of Sample . . .. . . . . . . . . . . . . . . . . . . . . . . . . . . . . . . . . '" . . . . . . ...... ..... 75 Cross-sectional Regression Results Using AP and FIP specifications . . . ... 76 Demand Elasticity Estimates of Explanatory Variables . . . ............... . . . .. .. . . 78 Shin's Price Perception Specification .............. ... . .. .... . ........ . . . . ....... . . . . . . , . . . . 80 Socio-cultural Variables in the Regression ModeL .... .............. . . . . . ...... . ... 80 Demand Elasticities of Different Income Groups .. . . .... ... .. . . . . . . . . . . . . . . . .... 8 1
V SUMMARY AND CONCLUSION Introduction . . . . . . .. .. . ..... . . .. ...... . .. ... . . .... .......... .. . .... .. ........ ......... .. ..... ... . . . . . .... . 85
The Major Findings of the study . ............. .. ..... .. . ... ...... . . . ............ .. . . . '" .. , . . . 85 Limitations of Study ........ ......... . ....... .. .... .............. .... . ...... ..... . ...... . . . ... . . . . .. 88 Water Resources Management Policy Implications .... . ....... ... ....... . . ... . . . . . 89 Conclusion ........ ............... .... . .... . ... . ........ . ......... .... . . .... .. . . .. ............. . . . ... . . . .... 90
BIBLOGRAPHY ............. .. . .... . . ..... .. ....... .... ... . ..... . . . . . . .......... .... . ...... .. . . . . . . . . . . . . .. . . . . . 92
APPENDICES ... . . .. . . ...... ... . ............ .. . ..... . .. ...... . . ......... . . . . ....... . .... . ... ..... ... . . . . . . . . . . . . . . . . . 96
VITA . . . . . . . . . . . . . . . . . . . . . . . . . . . . . . . . . . . . . . .. . . . .. . . . . . . . . . . . . . . . . . . .. . . . . . . . . . . . . . . . . . . . . . . . . . . . 1 67
IV
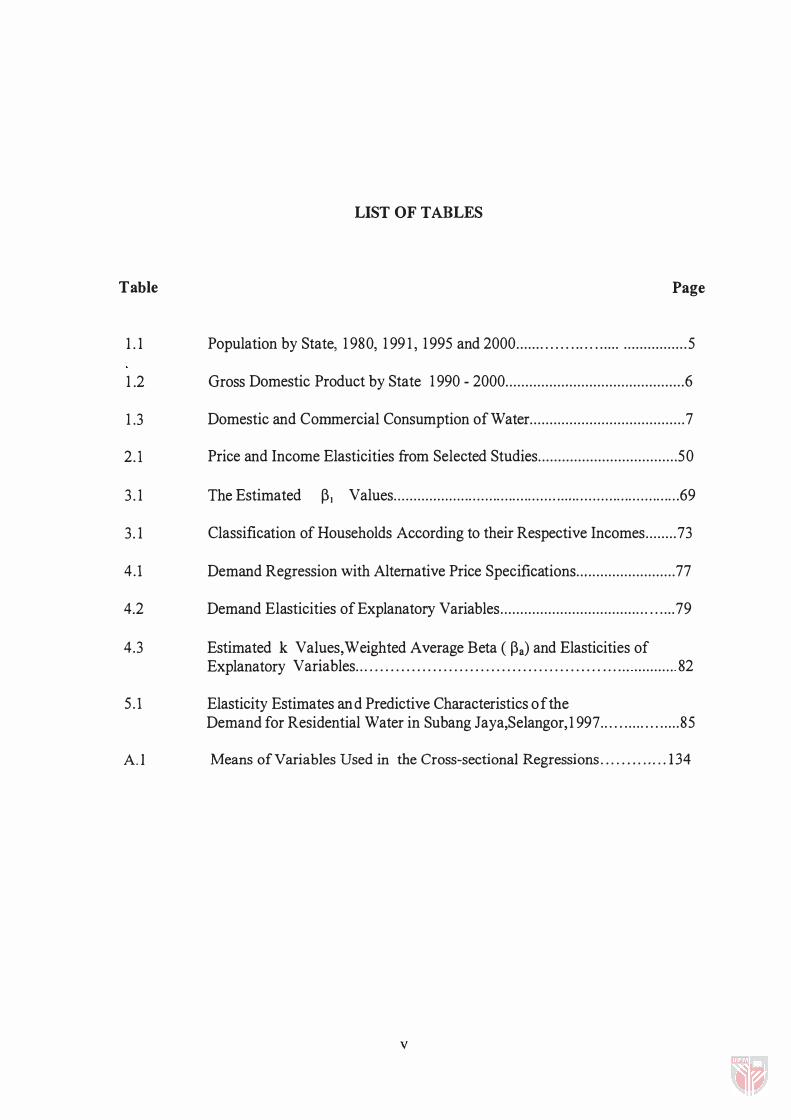
LIST OF TABLES
Table Page
1 . 1 Population by State, 1 980, 1 99 1 , 1 995 and 2000 . . . . . . . . . . . . . . . . . . . . . . . . . . . . . . . . . . . . . . . 5
1 .2 Gross Domestic Product by State 1 990 - 2000 . . . . . . . . . . . . . . . . . . . . . . . . . . . . . . . . . . . . . . . . . . . . . 6
1 .3 Domestic and Commercial Consumption of Water . . . . . . . . . . . . . . . . . . . . . . . . . . . . . . . . . . . . . . . 7
2.l Price and Income Elasticities from Selected Studies . . . . . . . . . . . . . . . . . . . . . . . . . . . . . . . . . . . 50
3. 1 The Estimated �1 Values ... ............... .... ................... . . . ..... ....................... 69
3. 1 Classification of Households According to their Respective Incomes . . . . . . . . 73
4.1 Demand Regression with Alternative Price Specifications . . .. . . . . . . . . . . . . . . . . . . . . . 77
4.2 Demand Elasticities of Explanatory Variables . . . . . . . . . . . . . . . . . . . . . . . . . . . . . . . . . . . . . . . . . . . 79
4.3 Estimated k Values,Weighted Average Beta ( �a) and Elasticities of Explanatory Variables . . . . . . . . . . . . . . . . . . . . . . . . . . . . . . . . . . . . . . . . . . . . . . . . . . . '" . . . . . . . . '" 82
5 . 1 Elasticity Estimates and Predictive Characteristics of the Demand for Residential Water in Subang Jaya,Seiangor, 1 997 . . . . . . . . . . . . . . . . . . 85
A.l Means of Variables Used in the Cross-sectional Regressions . . . . . . . . . . . . . 134
v
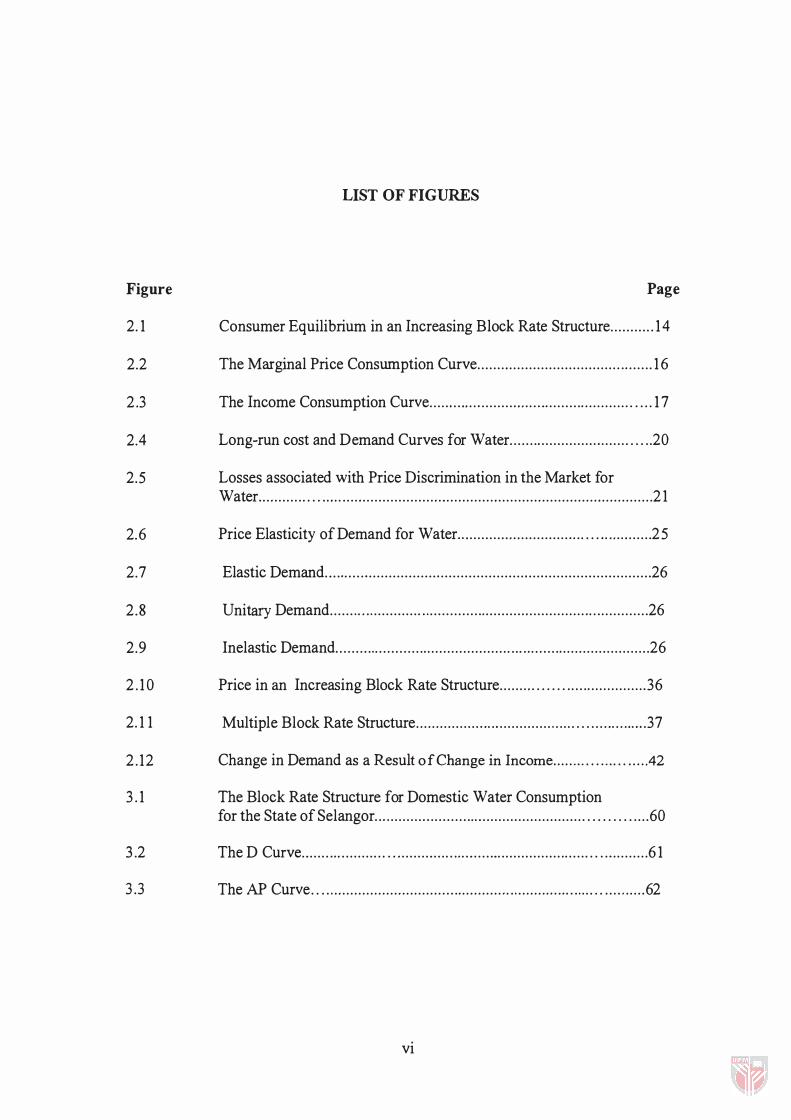
LIST OF FIGURES
Figure Page
2. 1 Consumer Equilibrium in an Increasing Block Rate Structure .......... . 14
2.2 The Marginal Price Consumption Curve ...................................... ..... . 16
2.3 The Income Consumption Curve ............ .................. ......... ........... . . . . . 1 7
2.4 Long-run cost and Demand Curves for Water ........ .............. ........ . . . .. 20
2.5 Losses associated with Price Discrimination in the Market for Water. ........... . . . ..... .............................................................................. 2 1
2.6 Price Elasticity of Demand for Water. . .......................... .... . . . . . . . ......... 25
2.7 Elastic Demand .......... , . . . . . . . . . . . . . . . . . . . . . . . . . . . . . . . . . . . . . . . . . . . . . . . . . . . . . . . . . . . . . . . . . . . . . . . 26
2 .8 Unitary Demand ...... ..... ............ . . .............. ......................... ................ 26
2.9 Inelastic Demand ....................... .......................... ........ ...................... 26
2 . 10 Price in an Increasing Block Rate Structure ......... . . . . . . ...... ............. .36
2. 1 1 Multiple Block Rate Structure ................ .................. . ..... . . . ........... . . .37
2 . 12 Change in Demand as a Result of Change in Income ..... . . . . . . . . .. . . .... .42
3 . 1 The Block Rate Structure for Domestic Water Consumption for the State of Selangor ............. . ....................................... . . . . . . . . . .... 60
3 .2 The D Curve ..................... . . ......................................... ....... . . . . . ......... 6 1
3 .3 The AP Curve . . . . . ................................ .......... . . . . ........ . .. . . . . . ... . . .... . ..... 62
vi

LIST OF ABBREVIATIONS
AP Average Price
D Inframarginal pricelDifference
FIP Full Information Price
HS Household size
I Income
ICC Income Consumption Curve
K Price Perception Parameter
LRAC Long-run average cost
LRMC Long-run marginal cost
M3 Cubic Metre
MC Marginal Cost
MP Marginal Price
MPC Marginal Price Consumption Curve
MU Marginal Utility
OLS Ordinary Least Square
P Price
Q Quantity
S Supply
SF Sprinkling Frequency
TR Total Revenue
VS Visitors' Staying Frequency
Vll
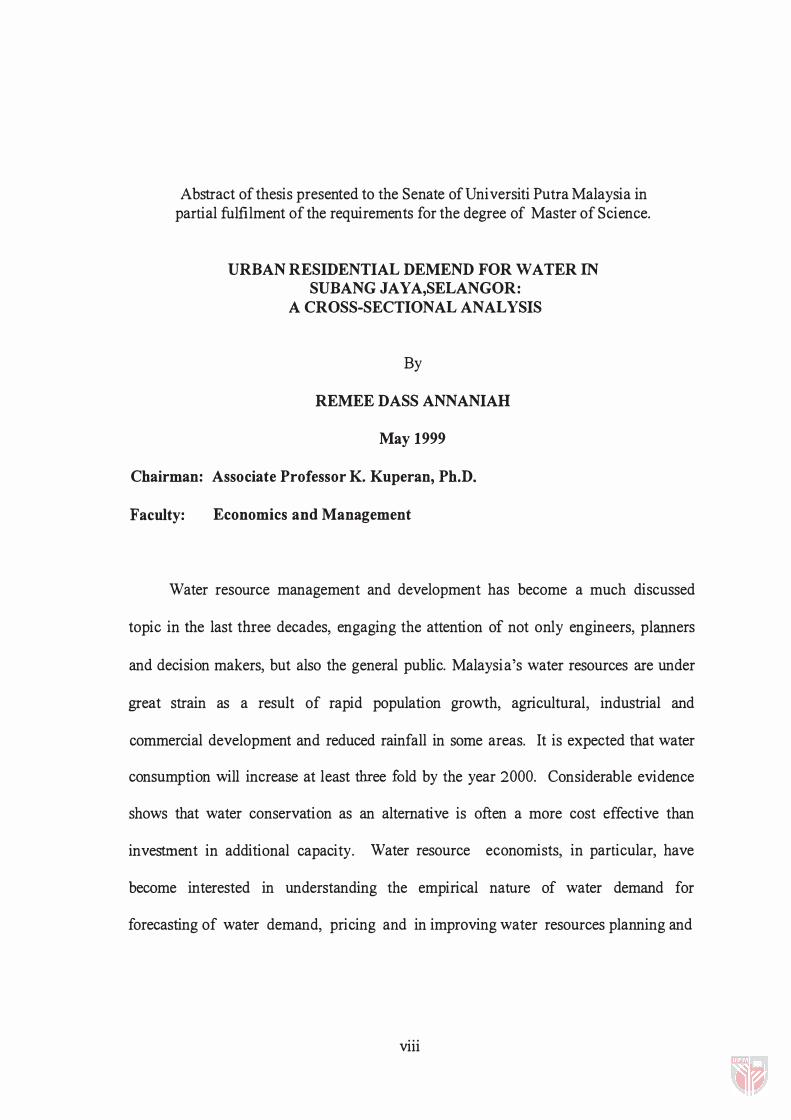
Abstract of thesis presented to the Senate of Universiti Putra Malaysia in partial fulfilment of the requirements for the degree of Master of Science.
URBAN RESIDENTIAL DEMEND FOR WATER IN SUBANG JAYA,SELANGOR:
A CROSS-SECTIONAL ANALYSIS
By
REMEE DASS ANNANIAH
May 1999
Chairman: Associate Professor K. Kuperan, Ph.D.
Faculty: Economics and Management
Water resource management and development has become a much discussed
topic in the last three decades, engaging the attention of not only engineers, planners
and decision makers, but also the general public. Malaysia's water resources are under
great strain as a result of rapid population growth, agricultural, industrial and
commercial development and reduced rainfall in some areas. It is expected that water
consumption will increase at least three fold by the year 2000. Considerable evidence
shows that water conservation as an alternative is often a more cost effective than
investment in additional capacity. Water resource economists, in particular, have
become interested in understanding the empirical nature of water demand for
forecasting of water demand, pricing and in improving water resources planning and
viii

management. Recent controversies have been on the appropriate price specification and
the estimation of elasticities under block rate pricing. Many economists have come
forward with many challenging models and have justified their choice with empirical
evidence. In this study, price elasticity of demand for residential water is estimated for
consumers in Subang Jaya, Selangor.
The AP and FIP specification regression models using both linear and semilog
functional forms are run for a cross-sectional sample of 1 73 households. The results
showed that the price, income and household size elasticities are in the range of -0.56
to -0.97, 0 . 12 to 0.29 and 0.37 to 0.99 respectively. Compared to AP, the FIP
specification which incorporates MP and D, was found to be a better choice for the
price variable in the residential water demand models. In all cases except price, the AP
model overestimated the change in consumption of water when there is a change in one
of the explanatory variables (income, household size). Social, cultural and religious
practices were not found to affect the consumption patterns of three different ethnic
groups in Subang Jaya. This only shows that many city dwellers have adopted life style
common for all ethnic groups living in Malaysia. Price, income and household size
elasticities estimated for 5 different income groups using PIP specification were in the
range of - 1. 1 8 to 1 .98, negligible, and 0.48 to 1 . 1 1 respectively. The price elasticities
obtained for some of the income groups however were inconsistent and had positive
signs. Results of Shin's Price Perception Model showed that consumers were not
IX

responsive to either average price or marginal price in all cases except the very high
income group responsiveness declines with increases in the income level of households.
Results of this study showed that elasticities of explanatory variables can be used
as an effective policy instrument by water utilities in the planning and allocation of
water supplies. Water conserved through pricing and management policies would be
more cost effective than financing storage capacity expansion. Future research work
should look at the exact relationship between price change and storage capacity
reduction. In particular, the price elasticity estimates and supply management by using
appropriate pricing policy for urban consumers, would help policymakers to manage
water resource efficiently.
x

Abstrak tesis yang dikemukan kepada Senat Universiti Putra Malaysia sebagai memenuhi sebahagian dari keperluan untuk ijazah Master Sains
PERMINT AAN AIR OLEH PENDUDUK DI KA W ASAN SUBANG JAY A, SELANGOR :
SATU KAJlAN KERATAN RENTAS
Oleh
REMEE DASS ANNANIAH
Mei, 1999
Pengerusi: Profesor Madya K. Kuperan, Ph.D.
Fakulti: Ekonomi dan Pen gurus an
Pengurusan dan perkembangan bekalan air telah menjadi suatu topik yang hangat
dibincangkan sejak tiga dekad kebelakangan ini. Ia telah menarik perhatian bukan
sahaja di kalangan jurutera-jurutera dan ahli perancang, tetapi juga masyarakat
Malaysia pada umumnya. Bekalan air di negara ini telah berkurangan akibat dari
pertumbuhan penduduk yang pesat, bertambahan kegunaannya di sektor pertanian
industri dan perdagangan. Adalah dijangkakan bahawa pengunaan air akan bertambah
sekurang-kurangnya 3 kali ganda pada tahun 2000. Banyak bukti yang menunjukkan
bahawa pemulihan air adalah suatu altematif yang kos efektif daripada mengadakan
tambahan air simpanan. Ahli-ahli ekonomi dalam bidang bekalan air semakin berminat
dalam pengajian empirikal permintaan air untuk peramalan permintaan air, penilaian
Xl

harga dan juga untuk membaiki pengurusan dan perancangan bekalan air. Sejak
kebelakangan ini, controversi telah berlaku pada spesifikasi harga dan perjangkaan
keanjalannya dibawah kadar biok harga. Banyak ahli ekonomi telah mengemukakan
model-model harga mereka dengan bukti-bukti empirikalnya sekali gus.
Dalam kajian ini, keanajalan harga, pendapatan dan saiz keluarga untuk
serumah telah diperolehi di kawasan Subang Jaya, Selangor dengan menggunakan
beberapa spesifikasi harga dalam model-model permintaan. Fungsi linear dan semilog
yang digunakan dalam model regressi AP (Harga Purata) dan PIP (Harga Marginal dan
Inframarginal) telah dijalankan untuk rentasan 1 73 sampel perumahan. Hasilnya telah
menunjukkan bahawa harga, pendapatan dan saiz keanjalan perumahan adalah masing
masing berada didalam jangkauan -0.56 ke -0.97, 0 . 12 ke 0.29 dan 0 .37 ke 0 .99.
Berbanding kepada spesifikasi AP dan PIP, spesifikasi FIP yang mengandungi MP
(Harga Marginal) dan D (Harga Inframarginal) telah didapati lebih sesuai untuk
angkubah model permintaan air perumahan. Dalam semua kes, purata model harga
telah berlebih anggar penggunaan air hila angkuhah pendapatan atau saiz perumahan
digunakan. Faktor sosial, budaya dan agama didapati tidak mempengaruhi penggunaan
air untuk tiga kumpulan etnik di kawasan bandar Subang Jaya. Ini menunjukkan
bahawa penduduk bandar telah menerima ciri-ciri corak budaya hidup yang sarna di
antara bangsa-bangsa Malaysia. Keanjalan harga dan saiz rumahtangga untuk lima
kumpulan pendapatan adalah berada dalam jangkauan -1 . 1 8 ke 1 .98 dan 0.48 ke 1 . 1 1 .
Keanjalan pendapatan adalah didapati hampir ke sifar dan dengan itu boleh diabaikan.
xii

Untuk setengah kumpulan pendapatan, keanjalan pendapatan didapati tidak konsisten
dan mempunyai nilai positif. Keputusan dari model persepsi harga Shin menunjukkan
pengguna tidak bertindak-balas dengan AP atau MP dalam semua kes kecuali kumpulan
yang berpendapatannya sangat tinggi. lni menunjukkan keputusan yang tidak konsisten
kerana responsifnya berkurangan dengan perningkatan dalam pendapatan.
Keanjalan harga, pendapatan dan lain-lain angkubah dari kajian ini dapat
digunakan sebagai alat polisi yang berkesan dalam pengagihan dan perancangan
penawaran air. Penjimatan air dengan pengurusan yang cekap dan dengan polisi harga
mengikut kadar tambahan blok (increasing block pricing) adalah lebih efektif daripada
perkembangan keupayaan simpanan. Penyelidikan selanjutnya mengenai hubungan
perubahan harga dan perubahan keupayaan simpanan adalah berguna untuk polisi
pembekalan air.
Xlll

CHAPTER I
INTRODUCTION
General Introduction
In the last three decades, water resource management and development has
become a much discussed topic not only in Malaysia but also throughout the world.
This has attracted the attention of engineers, planners, decision makers and the general
public. The World Water Council pointed out that the demand for fresh-water doubles
every 20 years. In 1 950, only 12 countries, with 20 milion people faced water
shortages. By 1 990, the problem afflicted 26 countries with 300 million people, and by
2050 it is projected that 65 countries, with 7 billion people, or 60% of the world's
population will be affected. Some political analysts have already predicted that the next
world war may be fought over competing claims for water resources shared among
countries.
Industrialisation, urbanisation, tourism and commercial agriculture are among the
biggest users and competitors for water. Since these activities and processes have
continued to expand, greater stress has been put on the availability and quality of water.
1

2
Awareness of scarcity and pollution has gIven nse to proposed market based
solutions, including raising the price to discourage wastage of water.
Demand for Water
Total water demand is an aggregate of the demands originating from domestic,
commercial, industrial and agricultural sectors of an economy. Domestic users of water
include that for personal consumption and for household uses, such as lawn watering
and car washing. Nearly 60% of per capita distribution of water in the last two decades
can be attributed to higher incomes, better standards of living and technological changes
associated with domestic uses. Sprinkling demands have created instantaneous and
hourly peaks four to eight times than that of the average demand.
Commercial demand for water includes water requirements of stores, offices,
theatres, hotels, motels, garages, restaurants and other business services which duplicate
domestic functions, such as drinking, sanitary waste, disposal and air conditioning.
Industries can be grouped into light and heavy users of water. Light industries
duplicate the water-use patterns of commercial establishments and homes. Heavy
industries, on the other hand, require substantial amounts of public potable water in
their products or in their processing methods.
3
In the agricultural sector, water demand is very much related to irrigation. The
rate of increase in irrigation water demand in Malaysia over the next decades is
expected to slow down. Consequently, the percentage contributed by the agricultural
sector to Malaysia's Gross National Product (GNP) will slowly decline as
industrialisation proceeds.
Water Demand in Malaysia
Population growth, agricultural and industrial development are placing strong
demands on Malaysia's water resources. Water stress has already occurred in a number
of places in the states of Perak and Kedah where water was abundant before. The trend
will worsen as the country's present population of 1 8 million doubles in the next 20
years. The rationing of water supply to houseowners in parts of Selangor introduced in
April 1998 is a testimony to the impending shortage of supply in meeting demand of the
urban consumers. An expanding programme of water resource development need to be
undertaken to keep pace with the socio-economic development of the country. Per capita
water availability of 24.6 m 3 of water in 1 990 will be halved by 2020 unless major
schemes for expanding capacity are undertaken. In addition, land and industrial
development and urbanisation will reduce the quantity and quality of available water
resource.
The demand for water is a function of both population and Gross Domestic
Product (GDP) growth. The population of Malaysia is about 1 8 million and is projected
4
to be 23 million in 2000, growing at an average rate of 2.3% per annum (Table 1 . 1 ).
The urban population in the country is expected to increase from 45.5% in 1 990 to
53.3% in 2000. Based on the growth in population and GDP (Table 1 .2), domestic and
commercial demand for water is expected to increase from 2. 1 billion cubic metres in
1 995 to 2.2 billion cubic metres in 2000 (Table 1 .3 ). This is a moderate estimate of
demand for domestic and commercial water as population is only one of the factors
affecting demand.
Water Resource Development and Management
The main objective of water resource development and management in Malaysia
is to provide for the increasing domestic, industrial and irrigation dem:ands for water.
Providing for these demands will contribute to national and regional development,
improvement of environmental quality and social well being. Water resource
development and management in Malaysia is currently undertaken by various Federal
and State departments or agencies.
By adopting an integrated or resource orientated management, optimum use of
water can be achieved. Water resource development is a decreasing cost industry
subject to economies of scale and therefore is subsidized by federal and state
governments. This will necessitate the formulation and implementation of national
water policy which is cons�stent with the overall national policies and programmes. The
national electricity company, the national telephone company and the national postal
services were privatised within the last seven years. Efforts are on the way to privatise
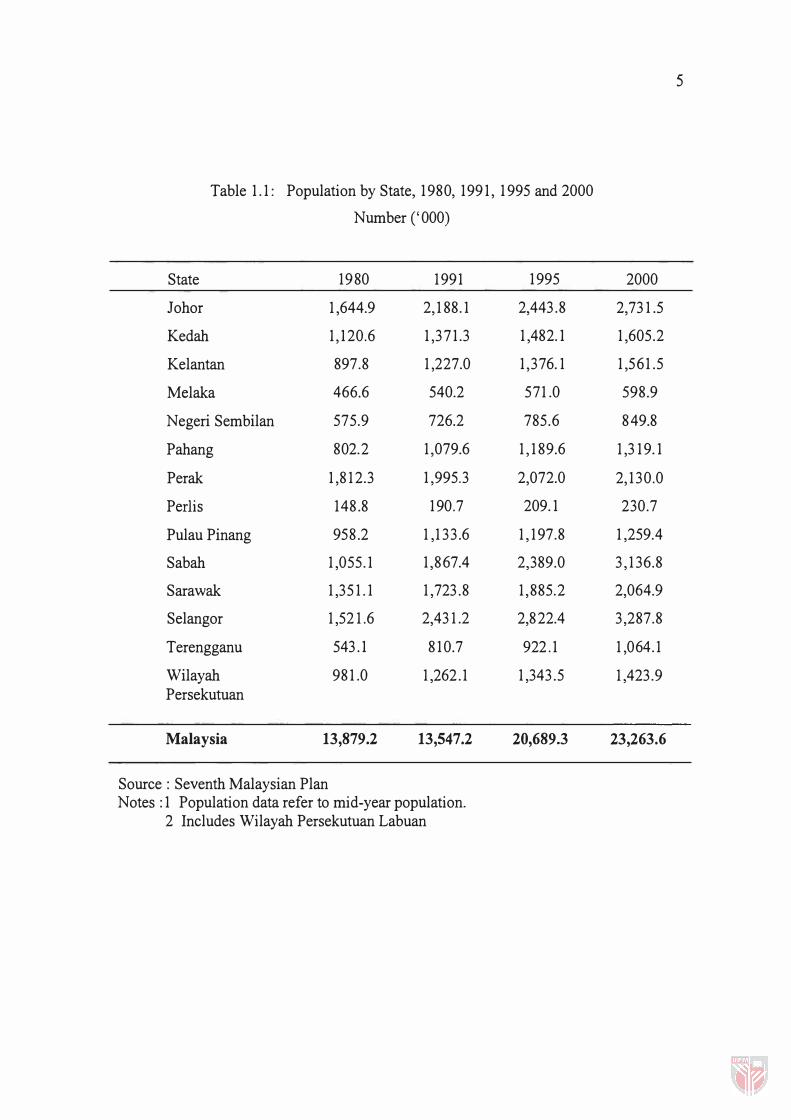
Table 1 . 1 : Population by State, 1 980, 199 1 , 1 995 and 2000
Number ('000)
State 1980 1 991 1 995
lohor 1 ,644.9 2, 1 88. 1 2,443 .8
Kedah 1 , 1 20.6 1 ,37 1 .3 1 ,482. 1
Kelantan 897.8 1 ,227.0 1 ,376. 1
Melaka 466.6 540.2 571 .0
Negeri Sembilan 575.9 726.2 785.6
Pahang 802.2 1 ,079.6 1 , 1 89.6
Perak 1 ,81 2.3 1 ,995.3 2,072.0
Pedis 148.8 1 90.7 209. 1
Pulau Pinang 958.2 1 ,1 33 .6 1 , 1 97.8
Sabah 1 ,055. 1 1 ,867.4 2,389.0
Sarawak 1 ,35 1 . 1 1 ,723 .8 1 ,885.2
Selangor 1 ,52 1 .6 2,43 1 .2 2,822.4
Terengganu 543 . 1 81 0.7 922 . 1
Wilayah 981 .0 1 ,262 . 1 1 ,343 .5 Persekutuan
Malaysia 13,879.2 13,547.2 20,689.3
Source: Seventh Malaysian Plan Notes: 1 Population data refer to mid-year population.
2 Includes Wilayah Persekutuan Labuan
5
2000
2,73 1 .5
1 ,605.2
1 ,561 .5
598.9
849.8
1 ,3 1 9. 1
2, 1 30.0
230.7
1 ,259.4
3 , 1 36.8
2,064.9
3 ,287.8
1 ,064. 1
1 ,423 .9
23,263.6

Table 1.2: Gross Domestic Product by State, 1990 - 2000 (in 1978 prices)
GDP at Purchasers' Value Average Annual
(RM million) Growth Rate (%)
1990 1995 2000 6MP 7MP
Johor 8,576 13,818 21,390 10.0 9.1
Kedah 3,511 5,618 8,705 9.9 9.2
Kelantan 2,025 2,736 3,765 6.2 6.6
Melaka 1,960 3,106 4,751 9.6 8.9
Negeri Sembilan 2,646 4,031 6,216 8.8 9.0
Pahang 3,823 5,484 8,003 7.5 7.9
Perak 6,927 9,961 14,776 7.5 8.2
Perlis 544 787 1,160 7.7 8.1
Pulau Pinang 5,789 9,330 13,686 10.0 8.0
Sabah 6,550 8,496 11,669 5.0 6.6
Sarawak 6,550 8,778 12,287 6.0 7.0
Selangor 14,639 24,518 36,473 10.9 8.3
Terengganu 5,471 8,055 11,927 8.0 8.2
Wilayah 10,219 15,598 21,827 8.8 7.0 Persekutuan Kuala LumEur
Malaysia 79,329 120,316 176,635 8.7 8.0
Source: Seventh Malaysia Plan (7MP) Note: Includes Wilayah Persekutuan Labuan
6
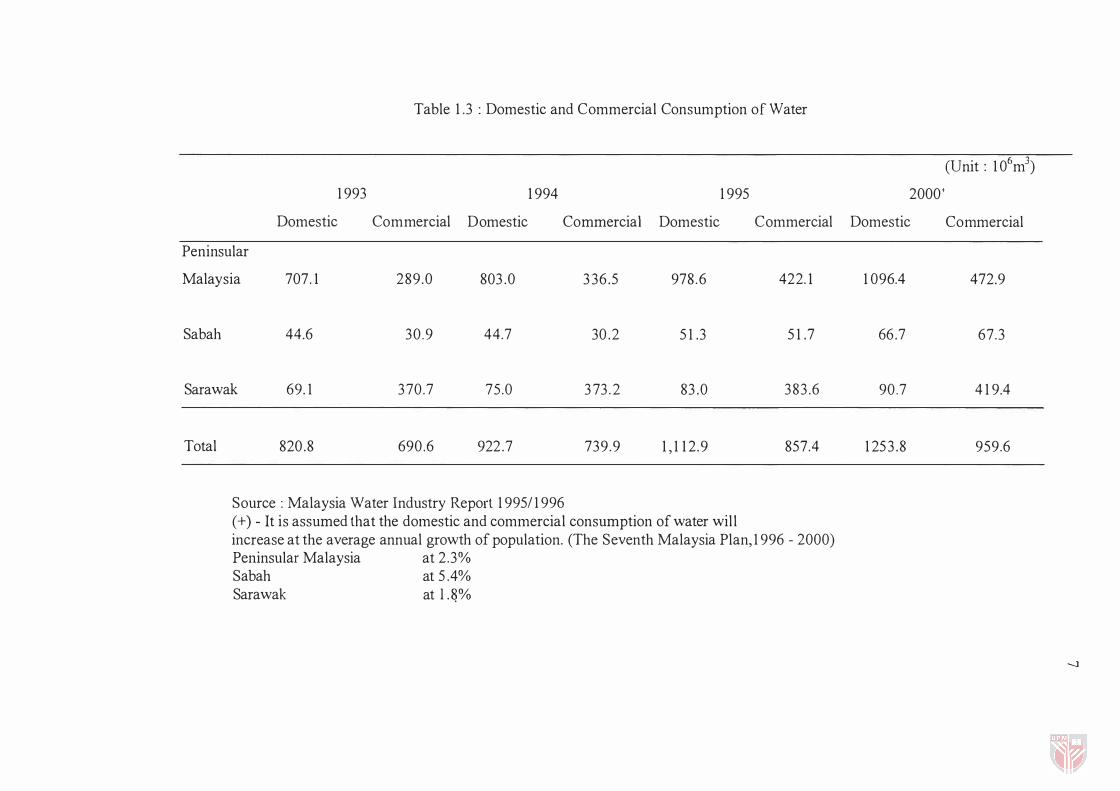
Table 1.3 : Domestic and Commercial Consumption of Water
1993 1994 1995
Domestic Commercial Domestic Commercial Domestic Commercial
Peninsular
Malaysia 707.1 289.0 803 .0 3 36.5 978 .6 422.1
Sabah 44.6 30.9 44.7 30.2 51.3 51.7
Sarawak 69.1 370.7 75 .0 3 73 .2 83.0 383.6
Total 820.8 690.6 922.7 739.9 1,112.9 857.4
Source: Malaysia Water Industry Report 1995/1996 (+) - It is assumed that the domestic and commercial consumption of water will increase at the average annual growth of population. (The Seventh Malaysia Plan, 1996 - 2000) Peninsular Malaysia at 2.3% Sabah at 5 .4% Sarawak at l .�%
(Unit: 106m3)
2000+
Domestic Commercial
1096.4 472.9
66.7 67.3
90.7 419.4
1253.8 959.6
-..J
8
the water departments and agencies in line with the government drive to privatise many
state bodies to become financially independent and to operate more efficiently. After a
brief water crisis in early 1998, the National Water Resources Council was formed to
enable better co-operation between the State governments and the Federal government
on issues of water allocation between states, water tariffs and water supply
developments.
The Problem Statement
The World Water Council has pointed out that the demand for water will continue
to increase in line with the growth of world population. It projected that at least 65
countries will be affected by water shortage by the middle of next century. In Malaysia,
population growth, agricultural, commercial and industrial development are creating
strong demands for water. The Klang Valley, for example, experienced water shortage
in April, 1 998 showing that water supply could not meet the increasing demand by
consumers. This led to the setting up of National Water Council (NCW) which would
act as a regulatory body to manage interstate transfers of water and to manage and
develop water resources effectively.
To overcome water shortage problem, water utility managers could either increase
water storage capacities and treatment facilities or implement effective pricing policies
and conservation measures. The choice of investing in additonal capacity depends on
the availability of valuable financial resources and capital. For a developing country

9
such as Malaysia, investing in water resource projects could drain valuable capital
which could otherwise be invested in more productive sectors of the economy that
could yield higher returns in a short term.
Effective pricing policies not only generate income for the water utilities but also in
itself act as a water conservation measure. Knowledge of demand elasticities helps
utility managers to formulate effective pricing policies for different income and
consumer groups. In this study, different price specifications will be used to estimate
price elasticities for consumers facing a block rate pricing structure. Further discussions
on the price specifications are given in Chapter two and three.
The Objectives of Study
Price is an important explanatory variable in many water demand studies. Indeed,
in almost all studies cited in the literature, price is the only variable that is inversely
related to the demand for water which is useful for management in allocating water for
competing uses. In this study, cross-sectional regressions are used to determine the
demand for residential water. Emphasis is given to the price and income elasticities.
Knowledge of these elasticities and other relevant variable elasticities is helpful to the
water utility managers and other governing bodies of water utilities in forecasting the
change in consumption in water when there is a change in one of the explanatory
10
variables. Effective demand management policies, (effective pncmg, conservation
measures) can be implemented with the knowledge of differing consumer responses to
water demand.
The objectives of this study are as follows:
(1) to study the impact of price, (e.g. average price (AP), marginal price
(MP) and inframarginal price (D) ), income and other variables on the
demand for urban residential water.
(2) to evaluate consumer responsiveness to AP or MP using Shin's(1985)
price perception model.
(3) to determine the price and income elasticities and other relevant variable
elasticities of demand for urban residential water using linear and semi
log functional forms for the entire sample and for the different income
groups.
(4) to examine the impact of socio-cultural factors on household water
consumption among the ethnic groups of Malaysia.
Related Documents