Universality and criticality of a second-order granular solid-liquid-like phase transition Gustavo Castillo, 1, 2 Nicol´ as Mujica, 1, * and Rodrigo Soto 1 1 Departamento de F´ ısica, Facultad de Ciencias F´ ısicas y Matem´aticas, Universidad de Chile, Avenida Blanco Encalada 2008, Santiago, Chile 2 Laboratoire de Physique Statistique, Ecole Normale Sup´ erieure, UMR CNRS 8550, 24 Rue Lhomond, 75005 Paris, France (Dated: January 22, 2015) We experimentally study the critical properties of the non-equilibrium solid-liquid-like transition that takes place in vibrated granular matter. The critical dynamics is characterized by the coupling of the density field with the bond-orientational order parameter Q4, which measures the degree of local crystallization. Two setups are compared, which present the transition at different critical accelerations as a a result of modifying the energy dissipation parameters. In both setups five independent critical exponents are measured, associated to different properties of Q4: the correlation length, relaxation time, vanishing wavenumber limit (static susceptibility), the hydrodynamic regime of the pair correlation function, and the amplitude of the order parameter. The respective critical exponents agree in both setups and are given by ν ⊥ = 1, ν k = 2, γ = 1, η ≈ 0.6 - 0.67, and β =1/2, whereas the dynamical critical exponent is z = ν k /ν ⊥ = 2. The agreement on five exponents is an exigent test for the universality of the transition. Thus, while dissipation is strictly necessary to form the crystal, the path the system undergoes towards the phase separation is part of a well defined universality class. In fact, the local order shows critical properties while density does not. Being the later conserved, the appropriate model that couples both is model C in the Hohenberg and Halperin classification. The measured exponents are in accord with the non-equilibrium extension to model C if we assume that α, the exponent associated in equilibrium to the specific heat divergence but with no counterpart in this non-equilibrium experiment, vanishes. PACS numbers: 64.60.Ht, 64.70.qj 05.40.-a, 45.70.-n, I. INTRODUCTION Thermodynamics and equilibrium statistical mechan- ics have shown an extraordinary success in describing phase transitions. It has been possible to classify them, predict their properties, and understand the critical phe- nomena. Also, they provide a framework that can be used to build efficient numerical tools as the Monte Carlo simulations or to design and analyze experiments, for example exploiting the concept of universality classes. From a theoretical viewpoint the critical phase transi- tions were classified in universality classes in terms of symmetry and conservation properties [1, 2]. In several order-disorder phase transitions the dynam- ics of the transition needs the interplay of two or more order parameters [3–9]. One particularly interesting case is the so called model C in the Hohenberg and Halperin classification, where a non-conserved critical or- der parameter couples to the conserved noncritical den- sity [1, 9, 10]. Examples where this model can be ap- plied are varied, comprising liquid-liquid phase transi- tions [5, 7, 8, 11], binary alloys [6], and anisotropic mag- nets [12]. In out of equilibrium conditions there is no such sys- tematic framework that can be used to analyze or classify phase transitions. There are, nevertheless, some notori- ous examples of prototype models that have been shown * Corresponding author: nmujica@dfi.uchile.cl to be quite general, allowing other systems to be com- pared with them. Some of these are, for example, the directed percolation process, the Kardar-Parisi-Zhang model for surface growth and the Swift-Hohenberg model [13–17]. The critical phenomena methodology in equilib- rium has been extended to these cases, where again we find critical exponents, universality classes, and scaling functions, with the dynamic renormalization group as a useful approach. But, still much understanding is needed to reach a state of knowledge comparable to the equilib- rium case. Granular matter, due to the strong dissipation present at the particle interactions and the corresponding need for continuous energy injection to sustain dynamic states, is an excellent candidate for studying out of equilibrium phase transitions. Important progress has been made along this direction [18–27], but a wider view in the con- text of dynamical phase transitions is still lacking. Re- cently, we presented an experimental study of a granular liquid-solid-like phase transition in a vibrated quasi-two- dimensional granular system [28]. There, we showed that the transition is characterized not only by the density field but also by a bond-orientational order parameter, which is described by the model C. To our understand- ing, this is the first non-equilibrium realization of this class of phase transition. In this manuscript we extend the results found previ- ously by focusing now on the universality of the transi- tion. That is, we aim to verify if by varying some ex- perimental parameters, the same critical exponents are found. We remark that in Ref. [28] five independent arXiv:1501.05002v1 [cond-mat.stat-mech] 20 Jan 2015

Welcome message from author
This document is posted to help you gain knowledge. Please leave a comment to let me know what you think about it! Share it to your friends and learn new things together.
Transcript
Universality and criticality of a second-order granular solid-liquid-like phase transition
Gustavo Castillo,1, 2 Nicolas Mujica,1, ∗ and Rodrigo Soto1
1Departamento de Fısica, Facultad de Ciencias Fısicas y Matematicas,Universidad de Chile, Avenida Blanco Encalada 2008, Santiago, Chile
2Laboratoire de Physique Statistique, Ecole Normale Superieure,UMR CNRS 8550, 24 Rue Lhomond, 75005 Paris, France
(Dated: January 22, 2015)
We experimentally study the critical properties of the non-equilibrium solid-liquid-like transitionthat takes place in vibrated granular matter. The critical dynamics is characterized by the couplingof the density field with the bond-orientational order parameter Q4, which measures the degree oflocal crystallization. Two setups are compared, which present the transition at different criticalaccelerations as a a result of modifying the energy dissipation parameters. In both setups fiveindependent critical exponents are measured, associated to different properties of Q4: the correlationlength, relaxation time, vanishing wavenumber limit (static susceptibility), the hydrodynamic regimeof the pair correlation function, and the amplitude of the order parameter. The respective criticalexponents agree in both setups and are given by ν⊥ = 1, ν‖ = 2, γ = 1, η ≈ 0.6−0.67, and β = 1/2,whereas the dynamical critical exponent is z = ν‖/ν⊥ = 2. The agreement on five exponents is anexigent test for the universality of the transition. Thus, while dissipation is strictly necessary to formthe crystal, the path the system undergoes towards the phase separation is part of a well defineduniversality class. In fact, the local order shows critical properties while density does not. Being thelater conserved, the appropriate model that couples both is model C in the Hohenberg and Halperinclassification. The measured exponents are in accord with the non-equilibrium extension to modelC if we assume that α, the exponent associated in equilibrium to the specific heat divergence butwith no counterpart in this non-equilibrium experiment, vanishes.
PACS numbers: 64.60.Ht, 64.70.qj 05.40.-a, 45.70.-n,
I. INTRODUCTION
Thermodynamics and equilibrium statistical mechan-ics have shown an extraordinary success in describingphase transitions. It has been possible to classify them,predict their properties, and understand the critical phe-nomena. Also, they provide a framework that can beused to build efficient numerical tools as the Monte Carlosimulations or to design and analyze experiments, forexample exploiting the concept of universality classes.From a theoretical viewpoint the critical phase transi-tions were classified in universality classes in terms ofsymmetry and conservation properties [1, 2].
In several order-disorder phase transitions the dynam-ics of the transition needs the interplay of two or moreorder parameters [3–9]. One particularly interestingcase is the so called model C in the Hohenberg andHalperin classification, where a non-conserved critical or-der parameter couples to the conserved noncritical den-sity [1, 9, 10]. Examples where this model can be ap-plied are varied, comprising liquid-liquid phase transi-tions [5, 7, 8, 11], binary alloys [6], and anisotropic mag-nets [12].
In out of equilibrium conditions there is no such sys-tematic framework that can be used to analyze or classifyphase transitions. There are, nevertheless, some notori-ous examples of prototype models that have been shown
∗ Corresponding author: [email protected]
to be quite general, allowing other systems to be com-pared with them. Some of these are, for example, thedirected percolation process, the Kardar-Parisi-Zhangmodel for surface growth and the Swift-Hohenberg model[13–17]. The critical phenomena methodology in equilib-rium has been extended to these cases, where again wefind critical exponents, universality classes, and scalingfunctions, with the dynamic renormalization group as auseful approach. But, still much understanding is neededto reach a state of knowledge comparable to the equilib-rium case.
Granular matter, due to the strong dissipation presentat the particle interactions and the corresponding needfor continuous energy injection to sustain dynamic states,is an excellent candidate for studying out of equilibriumphase transitions. Important progress has been madealong this direction [18–27], but a wider view in the con-text of dynamical phase transitions is still lacking. Re-cently, we presented an experimental study of a granularliquid-solid-like phase transition in a vibrated quasi-two-dimensional granular system [28]. There, we showed thatthe transition is characterized not only by the densityfield but also by a bond-orientational order parameter,which is described by the model C. To our understand-ing, this is the first non-equilibrium realization of thisclass of phase transition.
In this manuscript we extend the results found previ-ously by focusing now on the universality of the transi-tion. That is, we aim to verify if by varying some ex-perimental parameters, the same critical exponents arefound. We remark that in Ref. [28] five independent
arX
iv:1
501.
0500
2v1
[co
nd-m
at.s
tat-
mec
h] 2
0 Ja
n 20
15
2
critical exponents were found which, therefore, put anexigent test the universality condition.
The article is organized as follows. Section II describesthe liquid-solid-like transition that takes place in con-fined quasi two dimensional granular systems. In Sec.III the experimental setup and procedures are explained,describing the two configurations that are used to test theuniversality of the critical exponents. The experimentalresults and the determination of the critical accelerationsand exponents are presented in Sec. IV. Finally, conclu-sions are given in Sec. V.
II. THE LIQUID-SOLID-LIKE TRANSITION INQUASI TWO DIMENSIONAL GRANULAR
SYSTEMS
Granular matter is ubiquitous in our daily life, stilla fully understanding of its dynamical behavior has re-mained rather elusive for several years [29, 30]. Dry gran-ular matter is a collection of athermal macroscopic par-ticles that interact mainly through hard core-like dissi-pative collisions, and depending on external conditionssuch as pressure or packing fraction it may behave as asolid, a liquid or even a gas.
Energy injection is needed to compensate the energydissipated in grain-grain and grain-wall collisions. Vibra-tions are an efficient method to perform this task in a dis-tributed and controlled way, being possible to reach sta-ble states. Among the different possibilities to performthe vibrations, the quasi-two dimensional (Q2D) geom-etry has gained attention because it allows the granularsystem to be followed in detail at the individual grainscale together with the collective dynamics. In Q2D sys-tems, grains are placed in shallow box, with a heightthat is between one and two particle diameters, while itis large in the horizontal directions. The box is verticallyvibrated with maximal accelerations larger than gravitysuch that grains acquire vertical energy that is trans-ferred via collisions to the horizontal degrees of freedom.In the reduced two-dimensional dynamics, the system re-sembles a liquid but with the important difference thatthe collisions are not conservative.
For fixed density and vibration frequency, by increas-ing the maximum acceleration the system presents aphase transition where grains cluster in solid-like regionswith crystalline order [18, 25]. The instability is origi-nated in the development of an effective negative com-pressibility [26, 31] and the transient dynamics is gov-erned by waves [26]. Once the system is segregatedthe solid-like cluster show fluctuations in the interfacethat are well described by the capillary theory, allowingus to extract an effective surface tension that has non-equilibrium origin [32].
In our previous work we studied experimentally thesolid-liquid-like phase transition in the vibrated Q2D ge-ometry. Depending on the filling fraction and height ofthe cell, the transition was either discontinuous or contin-
!(b)
(4)
(2)
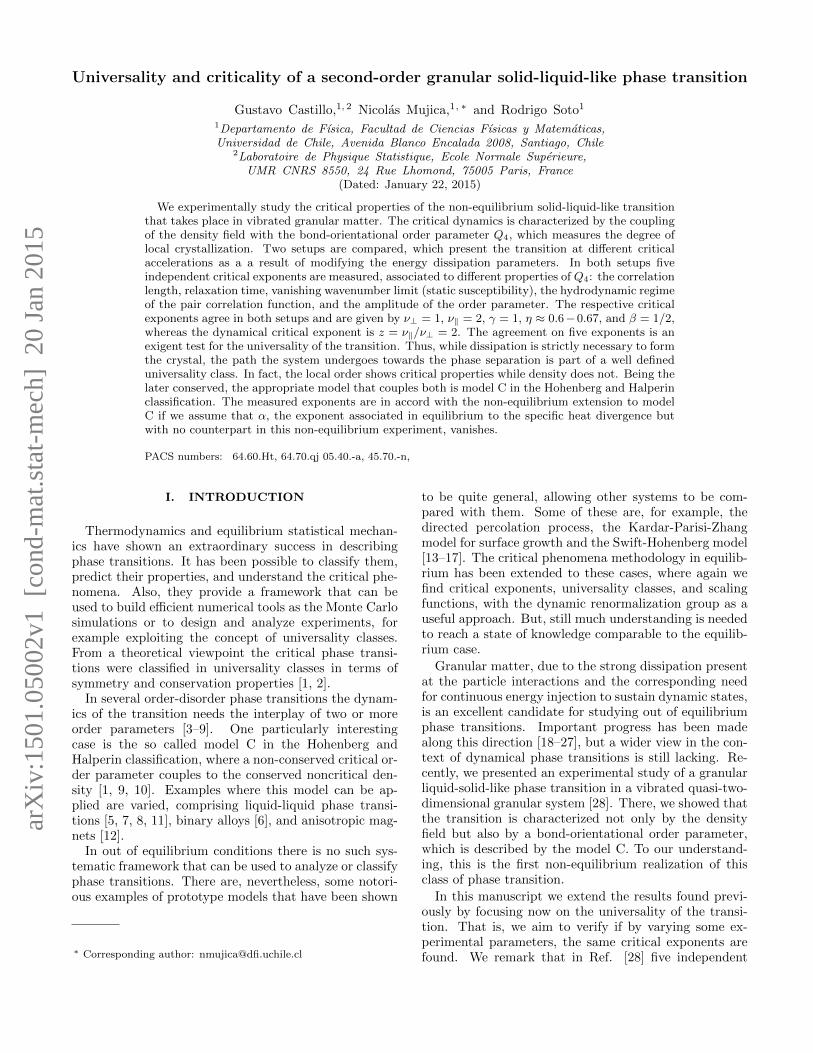
FIG. 1. Schematic of the experimental setup. (a) Top view ofthe quasi-2D cell, with Lx = Ly = 100d. (b) Side view of thesetup. The vertical height in the cell is Lz = 1.94d ± 0.02d.The cell is illuminated from below with a 2D array of lightemitting diodes, which light is diffused with a white acrylicsheet placed between the array and the cell. (1) camera, (2)quasi-2D cell, (3) electromechanical shaker, (4) accelerometer.
uous. In the later case critical phenomena develop, withstatic and dynamical properties that show power law be-havior in terms of the distance to the critical acceleration[28].
III. EXPERIMENTAL SETUP ANDPROCEDURES
In this paper we extend the analysis of the previouslypublished study [28]. Two sets of experiments are usedto test the universality hypothesis. They differ in thedissipation coefficients, which will be labeled experimentsA and B, with larger and lower dissipation respectively.
The granular system is composed of N ∼ 104 stainlesssteel spherical particles of mass m = 4.45 × 10⁻³ g, andd = 1 mm diameter. The Q2D box has lateral dimensionsLx = Ly ≡ L = 100d. The box consists of two 10 mmthick glass plates separated by a square metallic frame.Each inner glass surface has an indium tin oxide (ITO)coating, which dissipates electrostatic charges generatedby collisions of particles with the walls. The box is fixedto a base by four posts placed at each corner of the cell.The base supports an array of high intensity light emit-ting diodes. A piezoelectric accelerometer is fixed to thebase, allowing the measurement of the imposed forcingacceleration with a resolution of 0.01g. The main advan-tage of this setup is that particles are illuminated frombelow. They are then visualized as dark disks on a whitebackground. This allows to detect particles in dense clus-ters, even when particles are partially mounted on top ofeach other. A scheme of the setup is shown in Fig. 1. A

3
FIG. 2. A typical raw image of the complete system, for typeB experiment and Γ = 4.05± 0.01. Particles are visualized asblack disks on a white background.
typical image of the system is shown in Fig. 2.
The whole setup is forced sinusoidally with an elec-tromechanical shaker, with vertical displacement z(t) =A sin(ωt). Top view images are obtained with a cameraat 10 fps. The images acquired have a typical resolu-tion of 1020 × 1020 pix2, thus we obtain particles of 10pix diameter approximately. Particle positions are de-termined at sub-pixel accuracy. Results have been ob-tained by fixing the particle number N , cell height Lzand driving frequency f = ω/2π = 1/T = 80 Hz. Thedimensionless acceleration Γ = Aω2/g is varied in therange 1− 6. In this present work we focus on the config-uration C2 of reference [28], namely Lz = 1.94d ± 0.02dand N = 11504, which implies the filling fraction to beφ = Nπd2/4L2 = 0.904. This filling fraction value ispossible because the system is Q2D, which allows to ac-commodate more particles than for a pure 2D system.
As was demonstrated in [28], under this particularconfiguration the system undergoes a second-order typephase transition. The aim of this paper is to present amore detailed study of the transition itself. Addition-ally, we are particularly interested if there is universalityin this granular out-of-equilibrium phase transition. Inorder to study the universal behavior of the critical expo-nents, we change the dissipation parameters of the systemby changing both the bottom and top lids. We use twopairs of ITO (indium tin oxide) coated glass plates. In theexperiments of type A the coating is 25 nm thick, whereasfor type B experiments it is 750 nm thick. It has beenshown that ITO films mechanical, fracture, morphologi-
cal and electric properties depend on fabrication detailssuch as thickness, annealing, substrate, feed gas, amongothers [33]. So, it is expected that the dissipation param-eters, namely inelastic and friction coefficients, should bedifferent for the two sets of ITO coated glass plates. Aswill be shown below, our results indeed demonstrate thatthe dissipation is stronger for the thinner ITO coatedglass plates (type A experiments).
The ITO coating works very well for many hours ofexperimental runs. Eventually, it does however get dam-aged by particle collisions. The precise time of repro-ducible runs is probably function of the ITO coatingthickness. This is supported by the thickness dependenceof the crack onset strain in ITO thin films, which is lowerfor thicker coatings [33]. All data presented in this papercorrespond to reproducible runs for which no importantdamage was noticeable. In fact, a surface damaged ITOcoating is manifested in important changes of the mea-sured quantities – such as the density and order structurefactors – with respect to those obtained for a new pair ofITO coated glass plates. We conjecture that the damageoccurs because of erosion of the ITO coating, which inturn affects particle interactions by an increase of elec-trostatic forces and contamination of the system by dustformed from the ITO coating. In order to insure repro-ducibility, glass plates were changed periodically duringthe time duration of all the experimental runs, and allparts of the experiments are cleaned in an ultrasonic bathbefore mounting the experimental cell again, includingthe particles.
Two important issues are the top and bottom platesflatness and homogeneity of Lz through the experimentalcell. With the cell empty of particles the height is mea-sured at nine different positions on a regular spaced gridwith an optical microscope (see supplementary materialof [28]). Within experimental errors the vertical heightis homogeneous, Lz = 1.94d ± 0.02d. However, the ho-mogeneity of Lz does not insure that the glass platesare both flat. Because of the mechanical constrains andstresses exerted on the plates, some small residual curva-ture could exist.
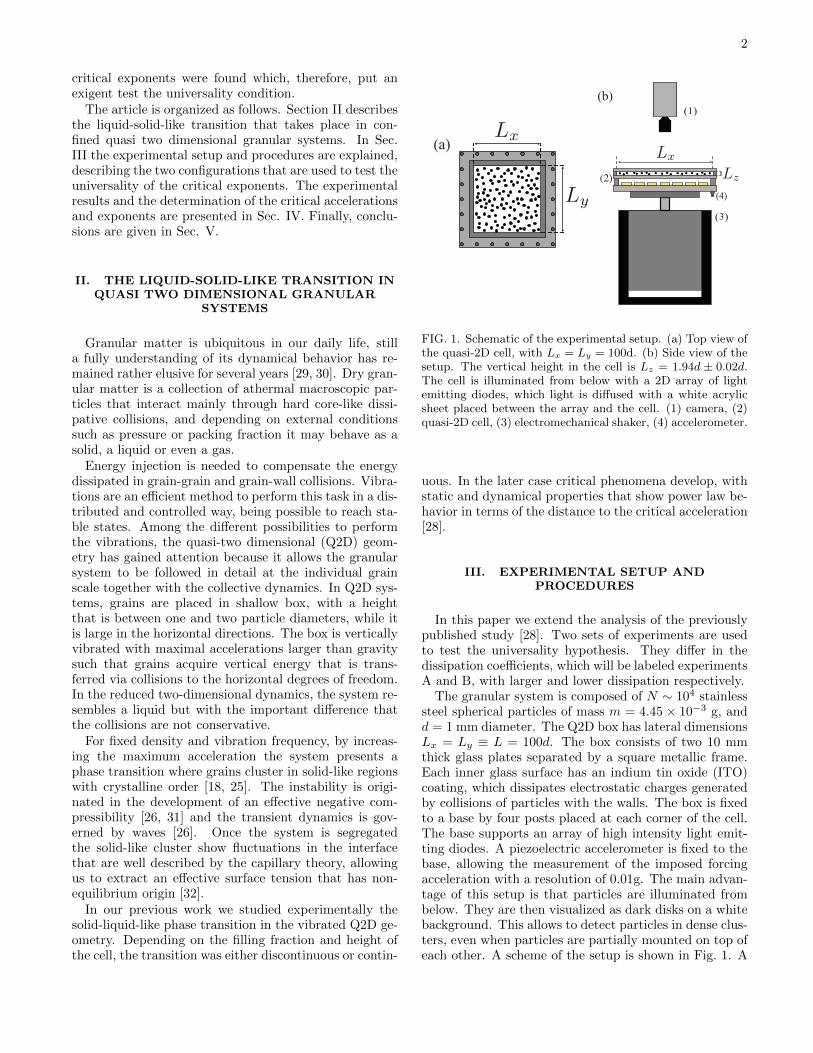
In Fig. 3(a) we show an average of 3270 images forΓ = 2.05, well below the solid-liquid transition (for typeB experiments, Γc ≈ 4.5). Only a small part of the setupis shown, of size 15d× 15d. Viewed from above it corre-sponds to the left side wall at almost half of the cell. Itis clear that near the side wall particles tend to form lay-ers of thickness ∼ d, within which particles barely movecompared with the rest of the system. This layering,observed at all side walls, is induced by the extra dissi-pation given by the side wall collisions, similar to whathas been shown in sheared granular matter [23]. How-ever, for a distance & 5d from a side wall, the systemis nearly homogeneous. The inset of Fig. 3(a) shows anaverage intensity plot as a function of the position (timeand y averaged), showing the layers close to the edge andthen saturating at a constant value. Also, by means of atime average coarse-graining procedure we can compute
4
0 1 2 3 4 5 6 7 860
80
100
120
140
160
180
x/dIntensity
0 1 2 3 4 5 6 7 8
0.5
1
1.5
2
2.5
b)
x/d
ρi=N
i/N
0
10 20 30 40 50 60 70 80 900.95
0.97
0.99
1.01
c)
x/d
ρi=N
i/N
0
FIG. 3. (a) Average image obtained from 3270 raw images. Only a section of the setup near a wall is shown (of size 15d×15d).Regions in dark grey (low intensity) results from more particles in these zones. The vertical stripes at the left account forlayers of particles that move less and spend more time near the wall because of the extra dissipation at the side wall. Theinset shows the intensity of this image as a function of position, showing that for x & 5d the system is almost homogeneous.(b) Time averaged coarse-grained particle density obtained directly from particle detection as a function of x, with d/4 as binwidth. It also shows oscillations due to side wall layering and confirms the homogeneity for x & 5d at this scale. (c) The samecoarse-grained density at a different scale, showing that the density at the center is about 2% higher than close to the edges.Here the bin width is d/2. For both (b) and (c) Ni is the average number of particles detected in a vertical bin spanningy = [0, 100d] and xi = [(i− 1)wb, iwb), where wb = d/4 or d/2 is the bin width. N0 is defined as the number of particles thatwould fit into a bin with an homogeneous density ρo = N/L2.
the density of particles as a function of distance from awall. This is shown in Figs. 3(b) and 3(c). Close to thewall we notice the same particle layering and an apparenthomogenization for x & 5d (Fig. 3(b)). The asymptoticlimit is slightly less than expected to compensate for theparticle excess at the side walls. At a larger scale, asshown in Fig. 3(c), we observe that there is a smalldensity gradient that leads to an excess of particles atthe cell’s center compared to the edges: density is about2% higher at the center that near the side walls. Thiscan be the result of three effects, which are probably allpresent. Firstly, even though the cell’s height is homoge-neous within experimental errors, there might be a smallresidual concavity, which makes the particles to accumu-late near the center. A second factor could be that thevertical acceleration may not be constant throughout thecell. In other words, there could be some “flapping” ofthe system. Indeed, we have measured the acceleration ofthe cell at different positions and we find that it is about0.2% higher near the borders that at the center. Finally,the presence of dissipative side walls could induce suchlarge scale inhomogeneity.
Another important issue is the mechanical leveling ofthe whole setup (for details, see supplementary materialof Ref. [28]). The cell’s horizontality, and thus the sys-tem’s isotropy, can be checked by two ways: First, it
is verified through the static structure factor S(~k) (de-fined below) and the average density Fourier components
〈ρ(~k, t)〉 (for now we can say that S(~k) is a measure ofdensity fluctuations in Fourier space). When these quan-tities are plotted versus kx and ky there is no preferential
direction. For example, S(kx, ky) shows the characteris-tic symmetric circular annular shape at kd = 2π, where
k = |~k|. A second verification is given by the even sym-metry of the coarse-grained density with respect to thecell center line, as can be observed from the data pre-sented in Fig. 3(c), which is indeed symmetric with re-spect to x/d = 50.
The particle detection is done by using a modifiedopen source Matlab code which uses a least-square al-gorithm [34]. Our modified version in C++ & CUDAallows faster computation for large number of particles[35, 36]. The algorithm allows to detect both layers ofparticles in a dense solid cluster, where the top layer par-ticles are placed in the valleys that the bottom particlesform. Typical experimental runs consist of at least 30video acquisitions, one for each A, of about 3300 imageseach. Therefore, the complete number of images to ana-lyze for a single experimental run is about 105.
Finally, for fixed geometry, particle density and vibra-tion frequency we perform vibration amplitude ramps,from Γ & 1 in the liquid phase, increasing A goingthrough the solid-liquid transition that is reached atΓ = Γc. In order to check that the transition is continu-ous, for some runs we also perform decreasing amplituderamps starting above Γc.
5
0 10 20 30 40
0
0.5
1
1.5
d)
kd
S(k)
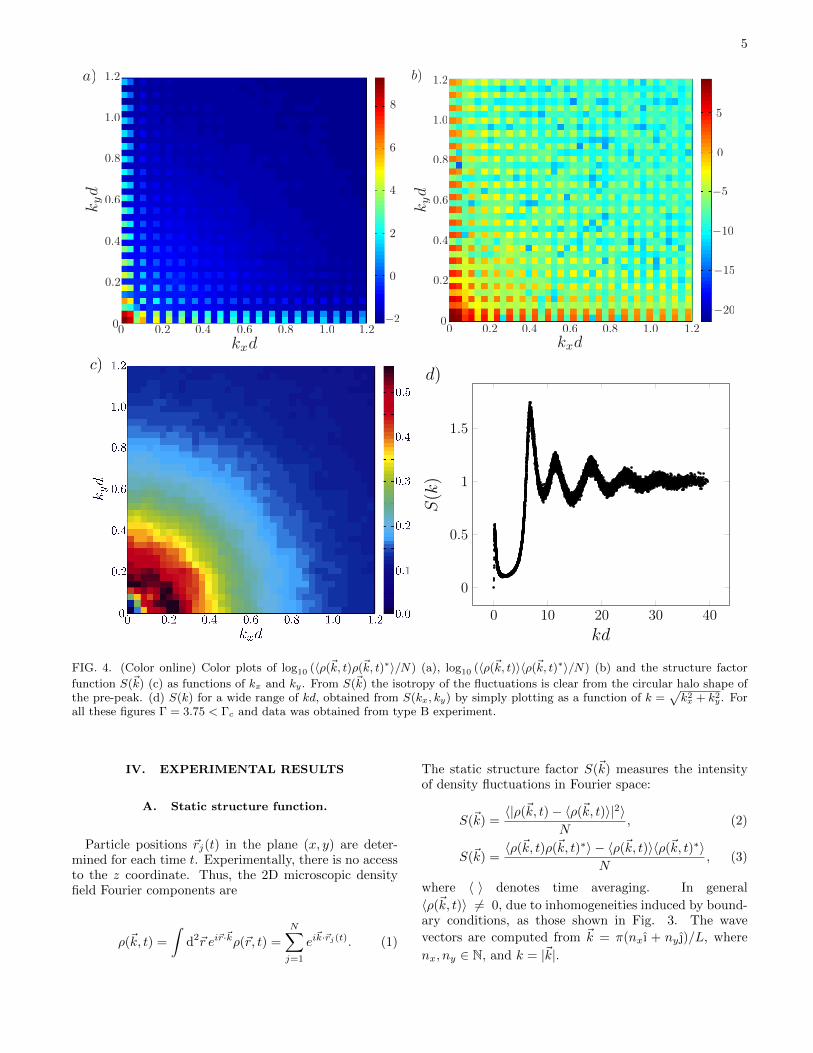
FIG. 4. (Color online) Color plots of log10 (〈ρ(~k, t)ρ(~k, t)∗〉/N) (a), log10 (〈ρ(~k, t)〉〈ρ(~k, t)∗〉/N) (b) and the structure factor
function S(~k) (c) as functions of kx and ky. From S(~k) the isotropy of the fluctuations is clear from the circular halo shape ofthe pre-peak. (d) S(k) for a wide range of kd, obtained from S(kx, ky) by simply plotting as a function of k =
√k2x + k2y. For
all these figures Γ = 3.75 < Γc and data was obtained from type B experiment.
IV. EXPERIMENTAL RESULTS
A. Static structure function.
Particle positions ~rj(t) in the plane (x, y) are deter-mined for each time t. Experimentally, there is no accessto the z coordinate. Thus, the 2D microscopic densityfield Fourier components are
ρ(~k, t) =
∫d2~r ei~r·
~kρ(~r, t) =
N∑j=1
ei~k·~rj(t). (1)
The static structure factor S(~k) measures the intensityof density fluctuations in Fourier space:
S(~k) =〈|ρ(~k, t)− 〈ρ(~k, t)〉|2〉
N, (2)
S(~k) =〈ρ(~k, t)ρ(~k, t)∗〉 − 〈ρ(~k, t)〉〈ρ(~k, t)∗〉
N, (3)
where 〈 〉 denotes time averaging. In general
〈ρ(~k, t)〉 6= 0, due to inhomogeneities induced by bound-ary conditions, as those shown in Fig. 3. The wave
vectors are computed from ~k = π(nx ı + ny )/L, where
nx, ny ∈ N, and k = |~k|.
6
0 0.2 0.4 0.6 0.8 1 1.2 1.40
0.2
0.4
0.6
Γ
a)
kd
S(k)
1.5 2 2.5 3 3.5 4 4.5 5 5.5 6 6.50
0.2
0.4
0.6
0.8
1
1.2b)
Γ
Smax
AB
1.5 2 2.5 3 3.5 4 4.5 5 5.5 6 6.55
10
15
20
25
30
35c)
Γ
ξ/d
AB
2 3 4 5 6 7 8 9 10
0.1
0.2
0.3
0.4
0.5
0.6
0.7
0.8
0.9
×10−2
d)
(ξ/d)−1
λd
AB
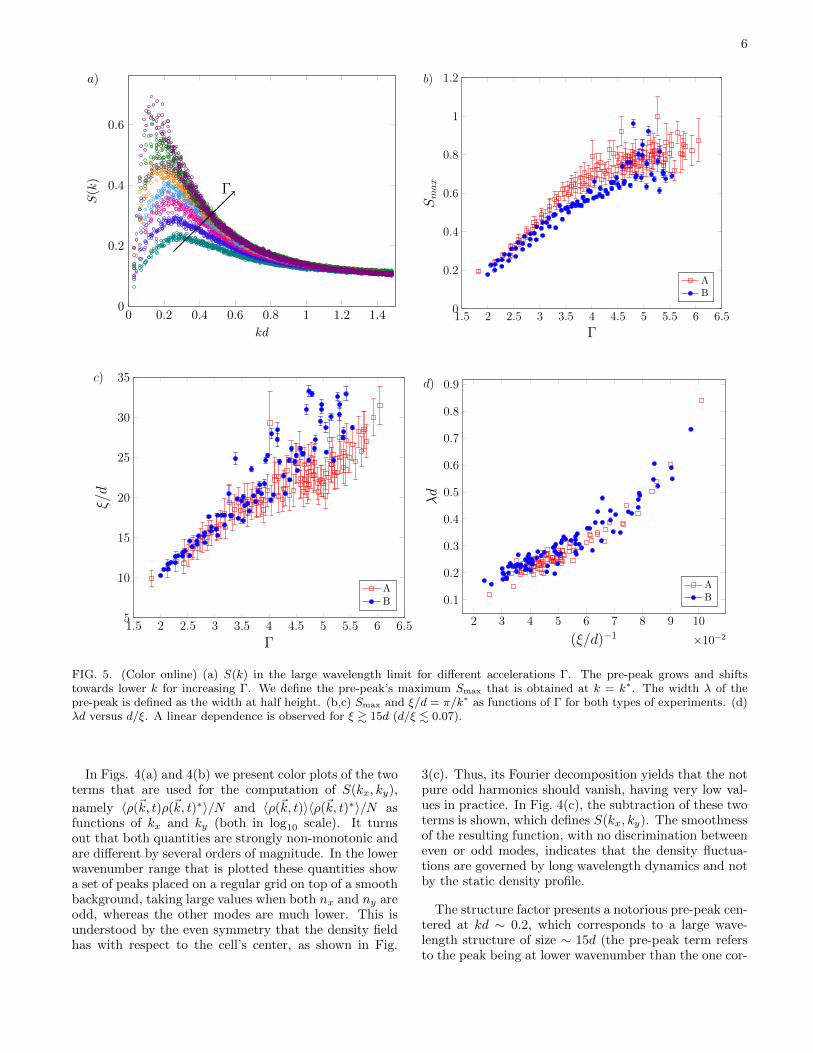
FIG. 5. (Color online) (a) S(k) in the large wavelength limit for different accelerations Γ. The pre-peak grows and shiftstowards lower k for increasing Γ. We define the pre-peak’s maximum Smax that is obtained at k = k∗. The width λ of thepre-peak is defined as the width at half height. (b,c) Smax and ξ/d = π/k∗ as functions of Γ for both types of experiments. (d)λd versus d/ξ. A linear dependence is observed for ξ & 15d (d/ξ . 0.07).
In Figs. 4(a) and 4(b) we present color plots of the twoterms that are used for the computation of S(kx, ky),
namely 〈ρ(~k, t)ρ(~k, t)∗〉/N and 〈ρ(~k, t)〉〈ρ(~k, t)∗〉/N asfunctions of kx and ky (both in log10 scale). It turnsout that both quantities are strongly non-monotonic andare different by several orders of magnitude. In the lowerwavenumber range that is plotted these quantities showa set of peaks placed on a regular grid on top of a smoothbackground, taking large values when both nx and ny areodd, whereas the other modes are much lower. This isunderstood by the even symmetry that the density fieldhas with respect to the cell’s center, as shown in Fig.
3(c). Thus, its Fourier decomposition yields that the notpure odd harmonics should vanish, having very low val-ues in practice. In Fig. 4(c), the subtraction of these twoterms is shown, which defines S(kx, ky). The smoothnessof the resulting function, with no discrimination betweeneven or odd modes, indicates that the density fluctua-tions are governed by long wavelength dynamics and notby the static density profile.
The structure factor presents a notorious pre-peak cen-tered at kd ∼ 0.2, which corresponds to a large wave-length structure of size ∼ 15d (the pre-peak term refersto the peak being at lower wavenumber than the one cor-

7
responding to the first coordination shell at kd = 2π, seebelow). The associated density fluctuations are indeedvisible by simple visual inspection (see Fig. 2). Fig. 4(d)shows S(k) for a wider range of kd, up to kd ∼ 40. Ithas the usual form expected for liquids with short rangeorder, presenting a maximum at kd = 2π related tothe first coordination shell as well as the pre-peak dis-cussed before. This pre-peak can be located in the rangekd = 0.1− 0.3 depending on the exact value of Γ. Simi-lar density fluctuations have been observed in amorphousmaterials [37, 38], which have been consistently related tothe existence of medium-range-crystalline-order. Thesedensity fluctuations have also been related to the pres-ence of a pre-peak in the structure factor. In fact, in theamorphous literature the pre-peak is known as the FirstSharp Diffraction Peak (FSDP) because it appears at lowk and is obtained from X-ray diffraction measurements.
Fig. 5(a) presents S(k) for small wavenumbers at dif-ferent accelerations Γ below Γc. From this figure it isclear how the pre-peak evolves as the system is driventowards the transition by increasing its acceleration to-wards Γc: its height increases and its position shifts tolower k. This implies that density fluctuations becomelarger in size and stronger as Γ increases. We character-ize the pre-peak by its maximum value Smax ≡ S(k∗),and the associated characteristic length scale ξ = π/k∗,where k∗ is the position of the pre-peak. These quanti-ties are plotted in Figs. 5(b) and 5(c) as functions of Γfor increasing amplitude ramps and for both experimenttypes A and B. Although the data points are scatteredand that they do not really overlap, specially at higher Γ,both quantities show similar trends for each experimen-tal type. Both Smax and ξ/d increase as the transitionis approached, although the former seems to saturate atlarger Γ. We observe no great differences between thetwo ITO coatings, being their final values (near the tran-sition) very similar, Smax ≈ 0.6− 0.1 and ξ/d ≈ 20− 35.We also present in Fig. 5(d) the width of the pre-peak, λ,defined as its width at half Smax. This quantity is a mea-sure of the dispersion around the characteristic length ξ.The collapse and scatter of the data are improved withrespect to the other quantities, with no dependence onthe different dissipation parameters.
By observing visually the persistence of the solid clus-ters we conclude that for the A type experiment, thetransition is located at Γc ∼ 5.1, whereas for type Bit is found to be Γc ∼ 4.5. Given that we are dealingwith a continuous phase transition these are just approx-imated values. However, neither Smax nor ξ show evidentchanges at these values.
As a conclusion to this first part we can say that den-sity fluctuations do not show critical behavior, but theyare needed to create regions of high order. This is alsoevident from visual inspection; higher density patches areindeed more ordered, as can be verified in Fig. 2. Den-sity is a conserved field. Its fluctuations are however lim-ited by the system’s vertical geometrical constrain andthe fact that the particles are in practice hard spheres.
d
d/p
2
FIG. 6. Schematic representation of two square interlacedlayers for which particles are closed packed. The center ofparticles in the bottom (top) layer are shown with solid (open)black circles. The 2D projected square lattice has a unit celllength d/
√2.
In what follows, medium range order will be analyzedwith an appropriate bond-orientational order parameter,which does indeed present critical behavior.
B. Bond-orientational order parameter.
In the vicinity of the transition, fluctuations of highdensity present the same square symmetry as the solidphase. In the quasi-2D geometry the solid phase con-sists of two square interlaced layers instead of the hexag-onal layer that is characteristic of 2D systems [25]. Thelocal order can be characterized through a 4-fold bond-orientational order parameter. This is still valid in quasi-2D geometry because the interlaced two-layer square lat-tices (with unit cell length d in each plane) result alsoin a square lattice when projected in 2D, with unit celllength d/
√2 when the grains are close packed, as shown
in Fig. 6. The 4-fold bond-orientational order parameterper particle is defined
Qj4 =1
Nj
Nj∑s=1
e4iαjs , (4)
where Nj is the number of nearest neighbors of particlej and αjs is the angle between the neighbor s of parti-cle j and the x axis. For a particle in a square lattice,|Qj4| = 1 and the complex phase measures the square lat-tice orientation respect to the x axis. For details on thecomputation of Qj4 we refer the reader to the supplemen-tary information of Ref. [28].
Representative maps of |Qj4| are shown in Fig. 7 forthree accelerations, Γ < Γc, Γ ≈ Γc and Γ > Γc. Inthis case the maps are obtained from images for exper-iment type A (Γc ∼ 5.1). Below the transition the or-dered patches, or crystallites, are first small, more or less
8
!"# !"$ !"% !"& !"' !"( !")!"#
!"$
!"%
!"&
!"'
!"(
!")
*+,*
-+, -
./0
1
123%2141!"!1 1!"$23%2141!"$1 1!"'23%2141!"'1 1!")23%2141!")1 1!"523%2141!"51 16"!
!"# !"$ !"% !"& !"' !"( !")!"#
!"$
!"%
!"&
!"'
!"(
!")
*+,*
-+, -
./0
1
123%2141!"!1 1!"$23%2141!"$1 1!"'23%2141!"'1 1!")23%2141!")1 1!"523%2141!"51 16"!
!"# !"$ !"% !"& !"' !"( !")!"#
!"$
!"%
!"&
!"'
!"(
!")
*+,*
-+, -
./0
1
123%2141!"!1 1!"$23%2141!"$1 1!"'23%2141!"'1 1!")23%2141!")1 1!"523%2141!"51 16"!
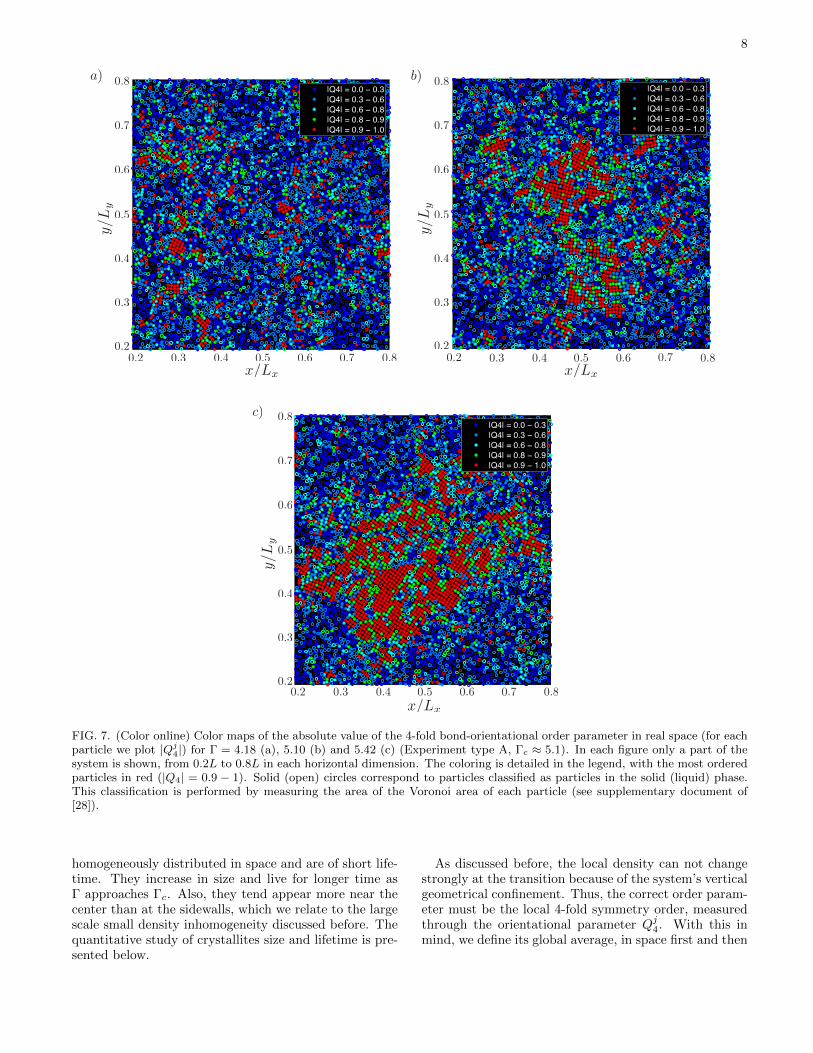
FIG. 7. (Color online) Color maps of the absolute value of the 4-fold bond-orientational order parameter in real space (for eachparticle we plot |Qj4|) for Γ = 4.18 (a), 5.10 (b) and 5.42 (c) (Experiment type A, Γc ≈ 5.1). In each figure only a part of thesystem is shown, from 0.2L to 0.8L in each horizontal dimension. The coloring is detailed in the legend, with the most orderedparticles in red (|Q4| = 0.9 − 1). Solid (open) circles correspond to particles classified as particles in the solid (liquid) phase.This classification is performed by measuring the area of the Voronoi area of each particle (see supplementary document of[28]).
homogeneously distributed in space and are of short life-time. They increase in size and live for longer time asΓ approaches Γc. Also, they tend appear more near thecenter than at the sidewalls, which we relate to the largescale small density inhomogeneity discussed before. Thequantitative study of crystallites size and lifetime is pre-sented below.
As discussed before, the local density can not changestrongly at the transition because of the system’s verticalgeometrical confinement. Thus, the correct order param-eter must be the local 4-fold symmetry order, measuredthrough the orientational parameter Qj4. With this inmind, we define its global average, in space first and then
9
2 2.5 3 3.5 4 4.5 5 5.5 60.38
0.4
0.42
0.44
0.46
0.48
0.5
Γ
〈|Q4|〉
A (increasing Γ ramp)
B (increasing Γ ramp)
B (decreasing Γ ramp)
0.001 0.01 0.1
0.003
0.01
0.03
b)
ε
∆Q
4
AB
FIG. 8. (Color online) (a) Global average of 4-fold orientational order parameter 〈|Q4|〉 versus Γ for the two ITO coatings:Experiment type A (thin ITO) with increasing Γ ramps (�) and experiment type B (thick ITO) with increasing (◦) anddecreasing (•) Γ ramps. Continuous lines show the linear trend fit for 2.5 < Γ < Γc and the supercritical deviation for Γ > Γc.The adjusted critical accelerations are Γc = 5.12± 0.01 (type A) and Γc = 4.48± 0.03 (type B). (b) ∆Q4 = 〈|Q4|〉 −QL4 versusε = (Γ − Γc)/Γc in log-log scale for each ITO coating thickness (type A: �; type B ◦ for both increasing and decreasing Γramps), where QL4 = aΓ + b is obtained from the linear trend below Γc. For the thin ITO coating, a = 0.011 ± 0.001 andb = 0.380± 0.002. For the thick ITO coating, a = 0.016± 0.001 and b = 0.359± 0.002. In sake of clarity just one representativeerror bar is shown for each case. The straight lines are power laws with exponents equal to 0.4 (dash-dotted), 1/2 (continuous)and 0.6 (dashed), shown as guides to the eye.
in time,
〈|Q4|〉 =
⟨1
N
N∑j=1
|Qj4|⟩, (5)
which measures the fraction of particles in the orderedphase.
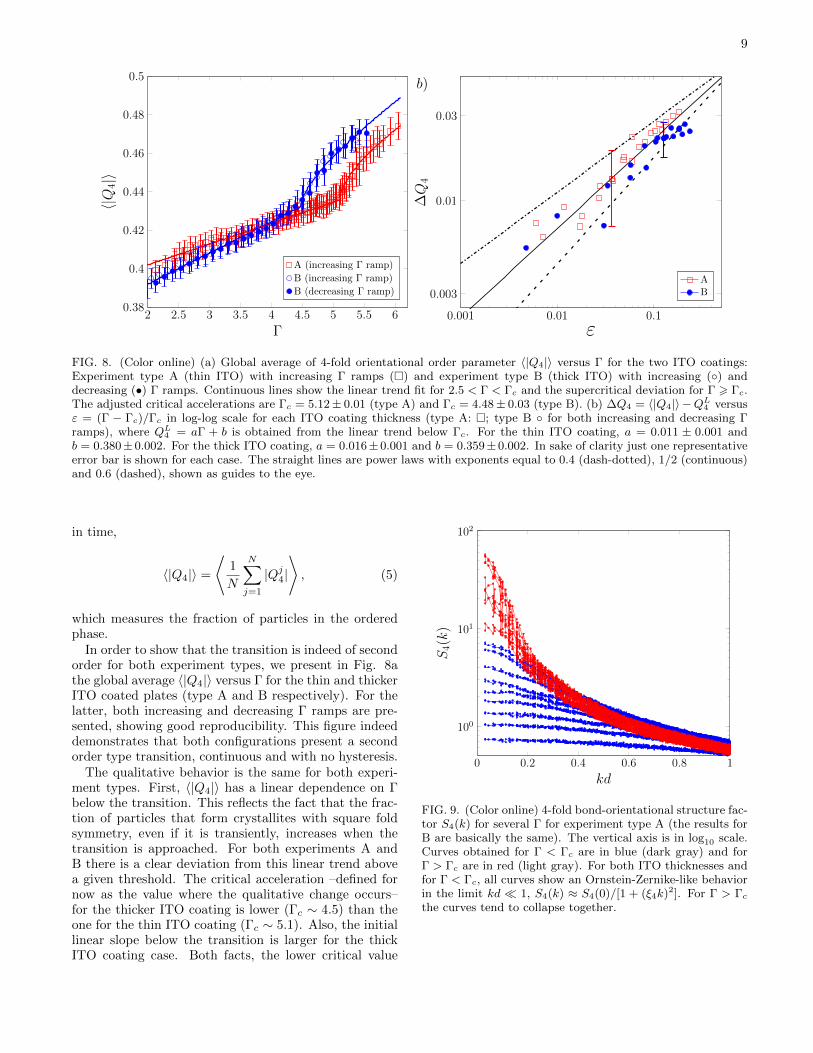
In order to show that the transition is indeed of secondorder for both experiment types, we present in Fig. 8athe global average 〈|Q4|〉 versus Γ for the thin and thickerITO coated plates (type A and B respectively). For thelatter, both increasing and decreasing Γ ramps are pre-sented, showing good reproducibility. This figure indeeddemonstrates that both configurations present a secondorder type transition, continuous and with no hysteresis.
The qualitative behavior is the same for both experi-ment types. First, 〈|Q4|〉 has a linear dependence on Γbelow the transition. This reflects the fact that the frac-tion of particles that form crystallites with square foldsymmetry, even if it is transiently, increases when thetransition is approached. For both experiments A andB there is a clear deviation from this linear trend abovea given threshold. The critical acceleration –defined fornow as the value where the qualitative change occurs–for the thicker ITO coating is lower (Γc ∼ 4.5) than theone for the thin ITO coating (Γc ∼ 5.1). Also, the initiallinear slope below the transition is larger for the thickITO coating case. Both facts, the lower critical value
0 0.2 0.4 0.6 0.8 1
100
101
102
kd
S4(k)
FIG. 9. (Color online) 4-fold bond-orientational structure fac-tor S4(k) for several Γ for experiment type A (the results forB are basically the same). The vertical axis is in log10 scale.Curves obtained for Γ < Γc are in blue (dark gray) and forΓ > Γc are in red (light gray). For both ITO thicknesses andfor Γ < Γc, all curves show an Ornstein-Zernike-like behaviorin the limit kd � 1, S4(k) ≈ S4(0)/[1 + (ξ4k)2]. For Γ > Γcthe curves tend to collapse together.
10
10−2 10−1 100
100
101
a)
ε
S4(0)
AB
10−2 10−1 100
100
101b)
ε
ξ 4/d
AB
FIG. 10. (Color online) S4(0) (a) and ξ4/d (b) versus ε for experiments type A (�) and type B (◦). Continuous lines are criticalpower laws, with exponents γ = ν⊥ = 1 for S4(0) and ξ4, shown as guides to the eye. The fitted critical accelerations for S4(0)and ξ4/d are: Γc = 5.09± 0.07 and Γc = 5.24± 0.08 respectively for experiment type A; Γc = 4.43± 0.06 and Γc = 4.58± 0.06respectively for experiment type B. More details are provided in Table I.
and larger slope for the thicker ITO coating, are con-sistent with a lower effective dissipation at the top andbottom walls. Indeed, in this case the transition occursat a lower amplitude, thus at lower energy injection anddissipation rates, and transient crystals form and growmore easily as Γ increases. In this figure, the continuouslines correspond to fits of a linear dependence for Γ < Γcand a supercritical deviation for Γ > Γc (details in thefigure caption).
The deviation from the linear trend observed for Γ <Γc is defined as ∆Q4 = 〈|Q4|〉 − QL4 , where QL4 is de-fined as the extrapolation of the linear trend over thecomplete range of Γ. Fig. 8(b) presents ∆Q4 versusε = (Γ − Γc)/Γc in log-log scale for each ITO coatingthickness. The continuous line shows the supercriticallaw ∆Q4 ∝
√Γ− Γc as a guide to the eye.
The results of Fig. 8(a) are fitted to the supercriticallaw ∆Q4 = c
√Γ− Γc. The adjusted parameters are c =
0.029±0.002 (type A) and c = 0.024±0.002 (type B). Weconjecture that the different adjusted c values also reflectthe difference of dissipation parameters that control theparticle-wall collisions.
Next, in order to characterize quantitatively the or-dered patches shown in Fig. 7, in particular their typicallength and time scales, we analyze the orientational orderparameter in momentum space. Its Fourier componentsare
Q4(~k, t) =
N∑j=1
Qj4ei~k·~rj(t). (6)
Then, local order can also be analyzed through its fluc-tuations in Fourier space by means of the 4-fold bond-
orientational structure factor
S4(~k) =〈|Q4(~k, t)− 〈Q4(~k, t)〉|2〉
N. (7)
This structure factor is shown in Fig. 9 for several ac-celerations and for experiment type A. Results for exper-iments type B are basically the same and are not shown.For both experiment types and for Γ < Γc, S4(k) showsan Ornstein-Zernike-like behavior in the limit kd� 1,
S4(k) ≈ S4(0)
1 + (ξ4k)2, (8)
where ξ4 and S4(0) are the 4-fold bond-orientational cor-relation length and static susceptibility respectively.
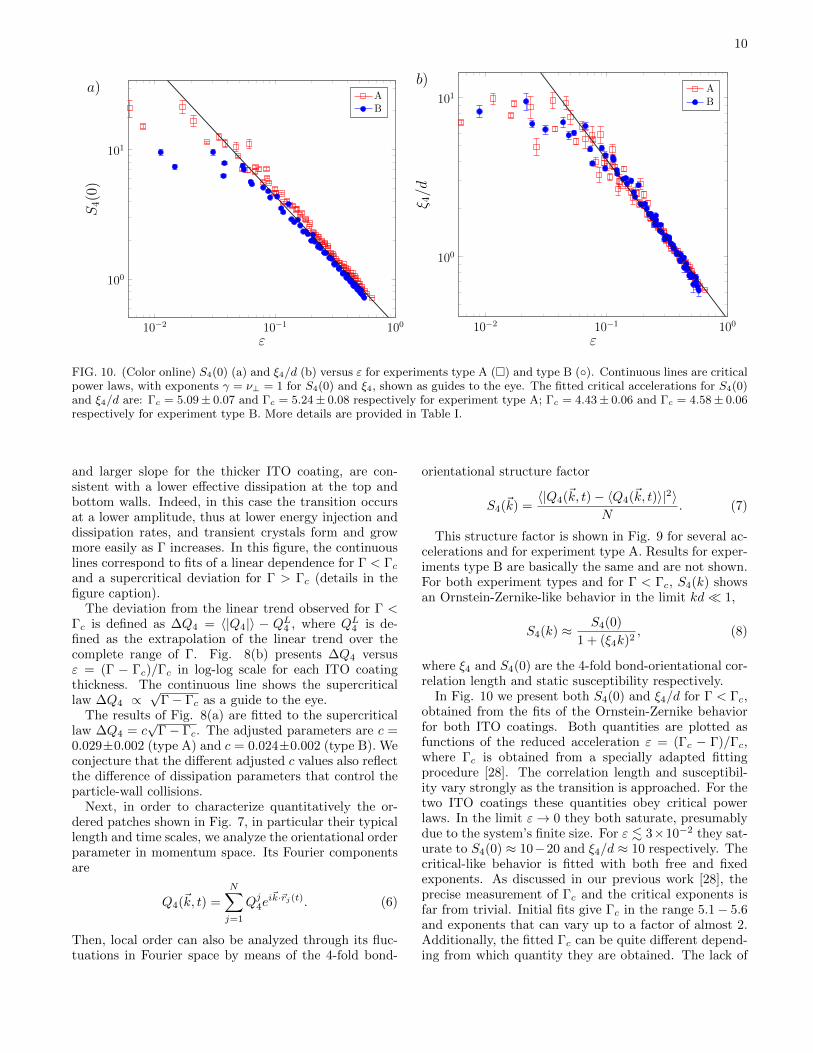
In Fig. 10 we present both S4(0) and ξ4/d for Γ < Γc,obtained from the fits of the Ornstein-Zernike behaviorfor both ITO coatings. Both quantities are plotted asfunctions of the reduced acceleration ε = (Γc − Γ)/Γc,where Γc is obtained from a specially adapted fittingprocedure [28]. The correlation length and susceptibil-ity vary strongly as the transition is approached. For thetwo ITO coatings these quantities obey critical powerlaws. In the limit ε→ 0 they both saturate, presumablydue to the system’s finite size. For ε . 3×10⁻² they sat-urate to S4(0) ≈ 10−20 and ξ4/d ≈ 10 respectively. Thecritical-like behavior is fitted with both free and fixedexponents. As discussed in our previous work [28], theprecise measurement of Γc and the critical exponents isfar from trivial. Initial fits give Γc in the range 5.1− 5.6and exponents that can vary up to a factor of almost 2.Additionally, the fitted Γc can be quite different depend-ing from which quantity they are obtained. The lack of
11
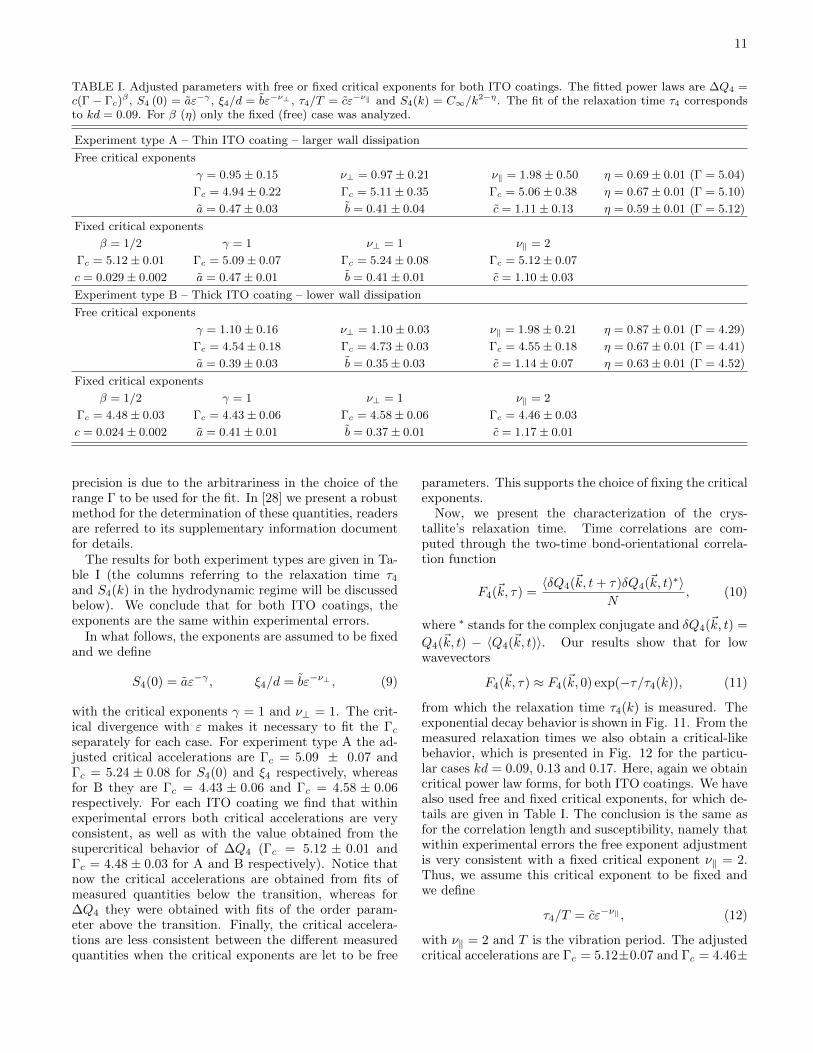
TABLE I. Adjusted parameters with free or fixed critical exponents for both ITO coatings. The fitted power laws are ∆Q4 =c(Γ − Γc)
β , S4 (0) = aε−γ , ξ4/d = bε−ν⊥ , τ4/T = cε−ν‖ and S4(k) = C∞/k2−η. The fit of the relaxation time τ4 corresponds
to kd = 0.09. For β (η) only the fixed (free) case was analyzed.
Experiment type A – Thin ITO coating – larger wall dissipation
Free critical exponents
γ = 0.95± 0.15 ν⊥ = 0.97± 0.21 ν‖ = 1.98± 0.50 η = 0.69± 0.01 (Γ = 5.04)
Γc = 4.94± 0.22 Γc = 5.11± 0.35 Γc = 5.06± 0.38 η = 0.67± 0.01 (Γ = 5.10)
a = 0.47± 0.03 b = 0.41± 0.04 c = 1.11± 0.13 η = 0.59± 0.01 (Γ = 5.12)
Fixed critical exponents
β = 1/2 γ = 1 ν⊥ = 1 ν‖ = 2
Γc = 5.12± 0.01 Γc = 5.09± 0.07 Γc = 5.24± 0.08 Γc = 5.12± 0.07
c = 0.029± 0.002 a = 0.47± 0.01 b = 0.41± 0.01 c = 1.10± 0.03
Experiment type B – Thick ITO coating – lower wall dissipation
Free critical exponents
γ = 1.10± 0.16 ν⊥ = 1.10± 0.03 ν‖ = 1.98± 0.21 η = 0.87± 0.01 (Γ = 4.29)
Γc = 4.54± 0.18 Γc = 4.73± 0.03 Γc = 4.55± 0.18 η = 0.67± 0.01 (Γ = 4.41)
a = 0.39± 0.03 b = 0.35± 0.03 c = 1.14± 0.07 η = 0.63± 0.01 (Γ = 4.52)
Fixed critical exponents
β = 1/2 γ = 1 ν⊥ = 1 ν‖ = 2
Γc = 4.48± 0.03 Γc = 4.43± 0.06 Γc = 4.58± 0.06 Γc = 4.46± 0.03
c = 0.024± 0.002 a = 0.41± 0.01 b = 0.37± 0.01 c = 1.17± 0.01
precision is due to the arbitrariness in the choice of therange Γ to be used for the fit. In [28] we present a robustmethod for the determination of these quantities, readersare referred to its supplementary information documentfor details.
The results for both experiment types are given in Ta-ble I (the columns referring to the relaxation time τ4and S4(k) in the hydrodynamic regime will be discussedbelow). We conclude that for both ITO coatings, theexponents are the same within experimental errors.
In what follows, the exponents are assumed to be fixedand we define
S4(0) = aε−γ , ξ4/d = bε−ν⊥ , (9)
with the critical exponents γ = 1 and ν⊥ = 1. The crit-ical divergence with ε makes it necessary to fit the Γcseparately for each case. For experiment type A the ad-justed critical accelerations are Γc = 5.09 ± 0.07 andΓc = 5.24 ± 0.08 for S4(0) and ξ4 respectively, whereasfor B they are Γc = 4.43 ± 0.06 and Γc = 4.58 ± 0.06respectively. For each ITO coating we find that withinexperimental errors both critical accelerations are veryconsistent, as well as with the value obtained from thesupercritical behavior of ∆Q4 (Γc = 5.12 ± 0.01 andΓc = 4.48 ± 0.03 for A and B respectively). Notice thatnow the critical accelerations are obtained from fits ofmeasured quantities below the transition, whereas for∆Q4 they were obtained with fits of the order param-eter above the transition. Finally, the critical accelera-tions are less consistent between the different measuredquantities when the critical exponents are let to be free
parameters. This supports the choice of fixing the criticalexponents.
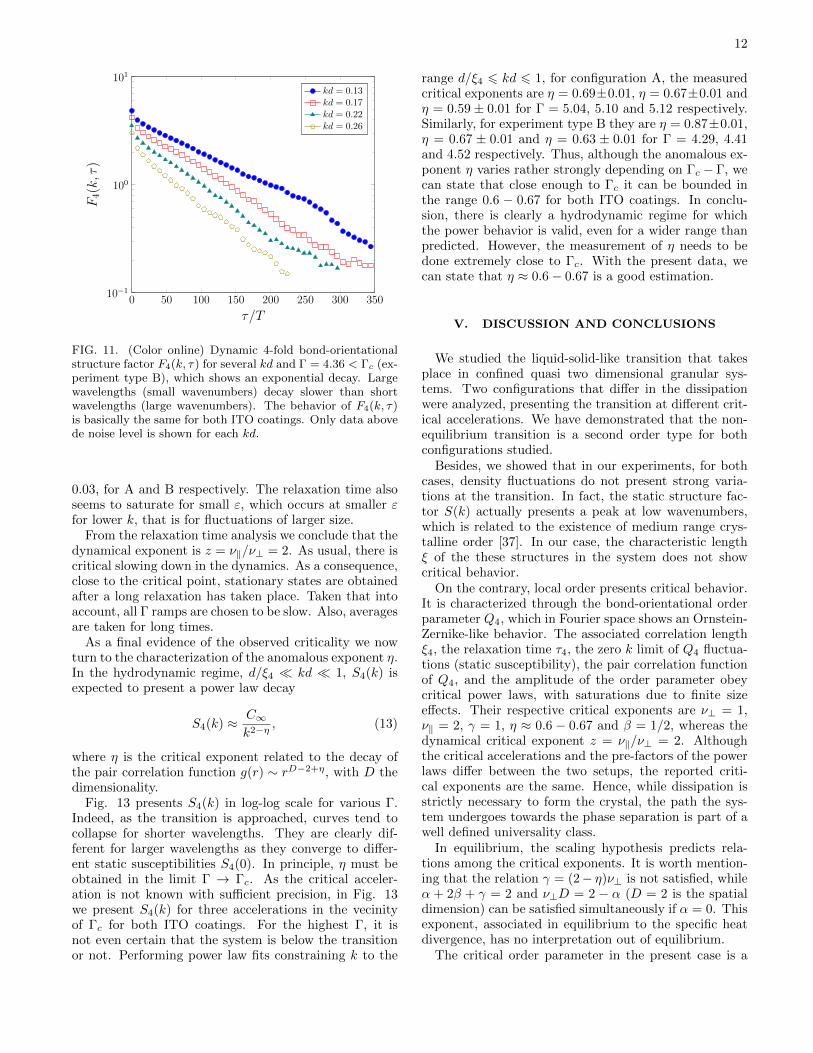
Now, we present the characterization of the crys-tallite’s relaxation time. Time correlations are com-puted through the two-time bond-orientational correla-tion function
F4(~k, τ) =〈δQ4(~k, t+ τ)δQ4(~k, t)∗〉
N, (10)
where ∗ stands for the complex conjugate and δQ4(~k, t) =
Q4(~k, t) − 〈Q4(~k, t)〉. Our results show that for lowwavevectors
F4(~k, τ) ≈ F4(~k, 0) exp(−τ/τ4(k)), (11)
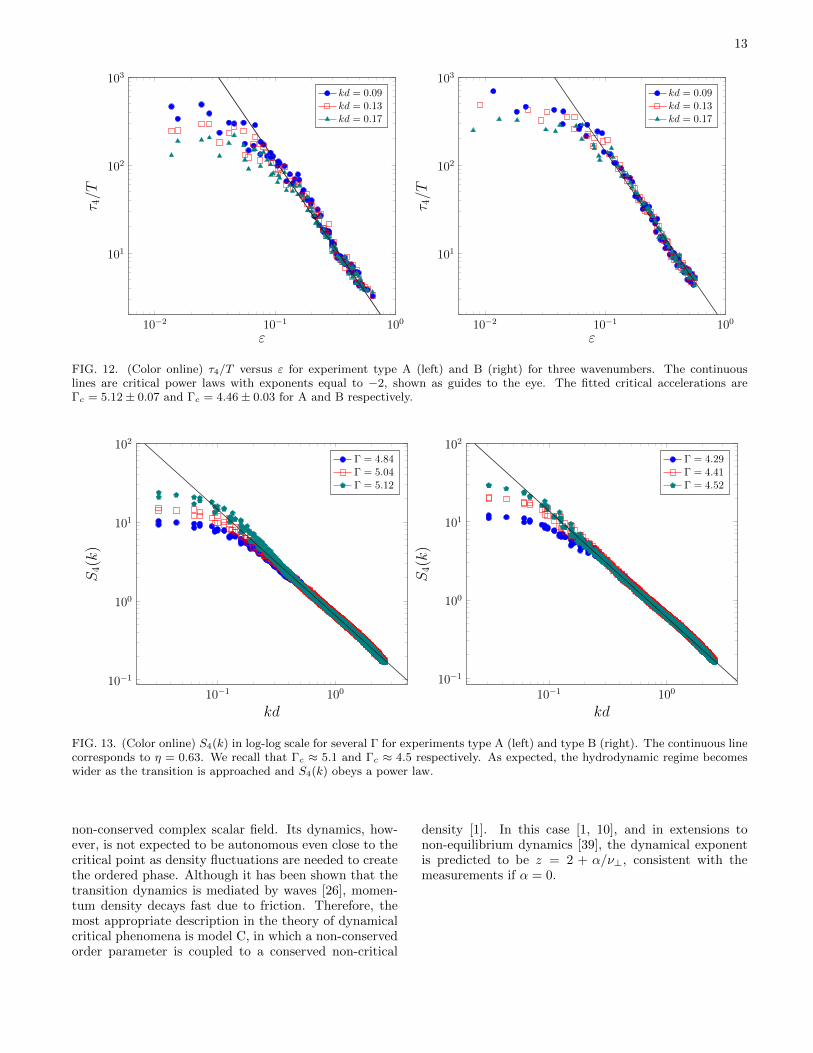
from which the relaxation time τ4(k) is measured. Theexponential decay behavior is shown in Fig. 11. From themeasured relaxation times we also obtain a critical-likebehavior, which is presented in Fig. 12 for the particu-lar cases kd = 0.09, 0.13 and 0.17. Here, again we obtaincritical power law forms, for both ITO coatings. We havealso used free and fixed critical exponents, for which de-tails are given in Table I. The conclusion is the same asfor the correlation length and susceptibility, namely thatwithin experimental errors the free exponent adjustmentis very consistent with a fixed critical exponent ν‖ = 2.Thus, we assume this critical exponent to be fixed andwe define
τ4/T = cε−ν‖ , (12)
with ν‖ = 2 and T is the vibration period. The adjustedcritical accelerations are Γc = 5.12±0.07 and Γc = 4.46±
12
0 50 100 150 200 250 300 35010−1
100
101
τ/T
F4(k,τ)
kd = 0.13kd = 0.17kd = 0.22kd = 0.26
FIG. 11. (Color online) Dynamic 4-fold bond-orientationalstructure factor F4(k, τ) for several kd and Γ = 4.36 < Γc (ex-periment type B), which shows an exponential decay. Largewavelengths (small wavenumbers) decay slower than shortwavelengths (large wavenumbers). The behavior of F4(k, τ)is basically the same for both ITO coatings. Only data abovede noise level is shown for each kd.
0.03, for A and B respectively. The relaxation time alsoseems to saturate for small ε, which occurs at smaller εfor lower k, that is for fluctuations of larger size.
From the relaxation time analysis we conclude that thedynamical exponent is z = ν‖/ν⊥ = 2. As usual, there iscritical slowing down in the dynamics. As a consequence,close to the critical point, stationary states are obtainedafter a long relaxation has taken place. Taken that intoaccount, all Γ ramps are chosen to be slow. Also, averagesare taken for long times.
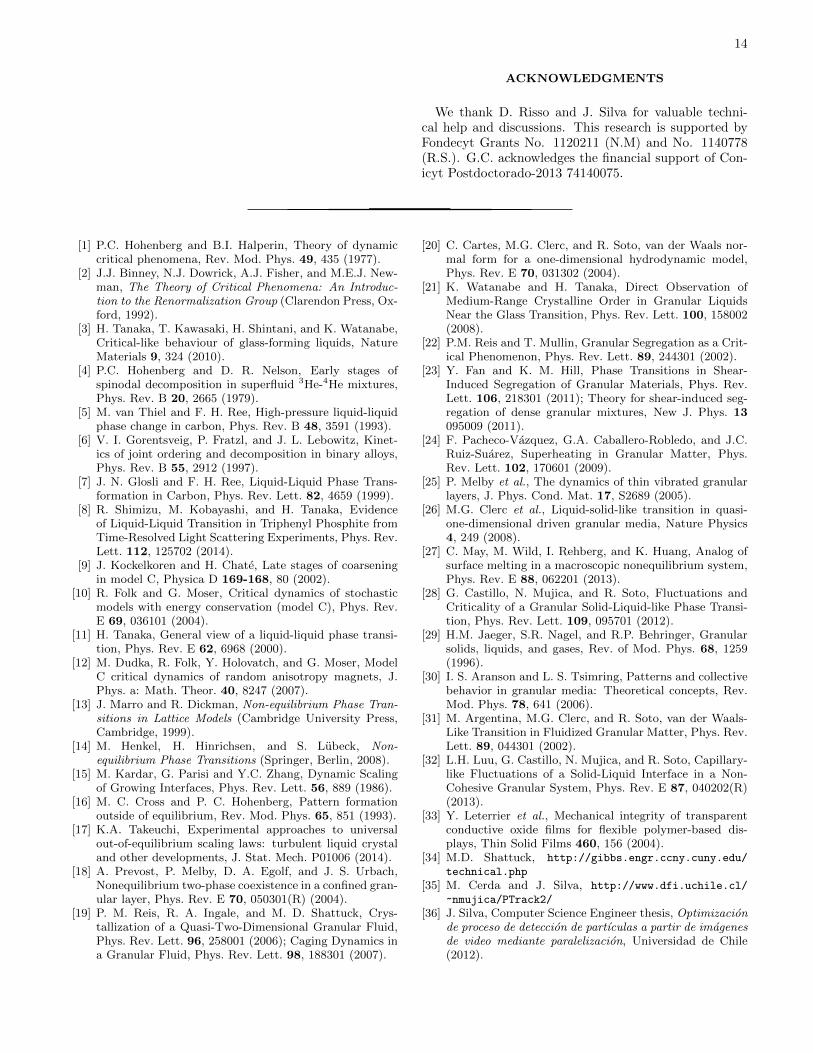
As a final evidence of the observed criticality we nowturn to the characterization of the anomalous exponent η.In the hydrodynamic regime, d/ξ4 � kd � 1, S4(k) isexpected to present a power law decay
S4(k) ≈ C∞k2−η
, (13)
where η is the critical exponent related to the decay ofthe pair correlation function g(r) ∼ rD−2+η, with D thedimensionality.
Fig. 13 presents S4(k) in log-log scale for various Γ.Indeed, as the transition is approached, curves tend tocollapse for shorter wavelengths. They are clearly dif-ferent for larger wavelengths as they converge to differ-ent static susceptibilities S4(0). In principle, η must beobtained in the limit Γ → Γc. As the critical acceler-ation is not known with sufficient precision, in Fig. 13we present S4(k) for three accelerations in the vecinityof Γc for both ITO coatings. For the highest Γ, it isnot even certain that the system is below the transitionor not. Performing power law fits constraining k to the
range d/ξ4 6 kd 6 1, for configuration A, the measuredcritical exponents are η = 0.69±0.01, η = 0.67±0.01 andη = 0.59 ± 0.01 for Γ = 5.04, 5.10 and 5.12 respectively.Similarly, for experiment type B they are η = 0.87±0.01,η = 0.67 ± 0.01 and η = 0.63 ± 0.01 for Γ = 4.29, 4.41and 4.52 respectively. Thus, although the anomalous ex-ponent η varies rather strongly depending on Γc − Γ, wecan state that close enough to Γc it can be bounded inthe range 0.6 − 0.67 for both ITO coatings. In conclu-sion, there is clearly a hydrodynamic regime for whichthe power behavior is valid, even for a wider range thanpredicted. However, the measurement of η needs to bedone extremely close to Γc. With the present data, wecan state that η ≈ 0.6− 0.67 is a good estimation.
V. DISCUSSION AND CONCLUSIONS
We studied the liquid-solid-like transition that takesplace in confined quasi two dimensional granular sys-tems. Two configurations that differ in the dissipationwere analyzed, presenting the transition at different crit-ical accelerations. We have demonstrated that the non-equilibrium transition is a second order type for bothconfigurations studied.
Besides, we showed that in our experiments, for bothcases, density fluctuations do not present strong varia-tions at the transition. In fact, the static structure fac-tor S(k) actually presents a peak at low wavenumbers,which is related to the existence of medium range crys-talline order [37]. In our case, the characteristic lengthξ of the these structures in the system does not showcritical behavior.
On the contrary, local order presents critical behavior.It is characterized through the bond-orientational orderparameter Q4, which in Fourier space shows an Ornstein-Zernike-like behavior. The associated correlation lengthξ4, the relaxation time τ4, the zero k limit of Q4 fluctua-tions (static susceptibility), the pair correlation functionof Q4, and the amplitude of the order parameter obeycritical power laws, with saturations due to finite sizeeffects. Their respective critical exponents are ν⊥ = 1,ν‖ = 2, γ = 1, η ≈ 0.6 − 0.67 and β = 1/2, whereas thedynamical critical exponent z = ν‖/ν⊥ = 2. Althoughthe critical accelerations and the pre-factors of the powerlaws differ between the two setups, the reported criti-cal exponents are the same. Hence, while dissipation isstrictly necessary to form the crystal, the path the sys-tem undergoes towards the phase separation is part of awell defined universality class.
In equilibrium, the scaling hypothesis predicts rela-tions among the critical exponents. It is worth mention-ing that the relation γ = (2− η)ν⊥ is not satisfied, whileα + 2β + γ = 2 and ν⊥D = 2 − α (D = 2 is the spatialdimension) can be satisfied simultaneously if α = 0. Thisexponent, associated in equilibrium to the specific heatdivergence, has no interpretation out of equilibrium.
The critical order parameter in the present case is a
13
10−2 10−1 100
101
102
103
ε
τ 4/T
kd = 0.09kd = 0.13kd = 0.17
10−2 10−1 100
101
102
103
ε
τ 4/T
kd = 0.09kd = 0.13kd = 0.17
FIG. 12. (Color online) τ4/T versus ε for experiment type A (left) and B (right) for three wavenumbers. The continuouslines are critical power laws with exponents equal to −2, shown as guides to the eye. The fitted critical accelerations areΓc = 5.12± 0.07 and Γc = 4.46± 0.03 for A and B respectively.
10−1 10010−1
100
101
102
kd
S4(k)
Γ = 4.84Γ = 5.04Γ = 5.12
10−1 10010−1
100
101
102
kd
S4(k)
Γ = 4.29Γ = 4.41Γ = 4.52
FIG. 13. (Color online) S4(k) in log-log scale for several Γ for experiments type A (left) and type B (right). The continuous linecorresponds to η = 0.63. We recall that Γc ≈ 5.1 and Γc ≈ 4.5 respectively. As expected, the hydrodynamic regime becomeswider as the transition is approached and S4(k) obeys a power law.
non-conserved complex scalar field. Its dynamics, how-ever, is not expected to be autonomous even close to thecritical point as density fluctuations are needed to createthe ordered phase. Although it has been shown that thetransition dynamics is mediated by waves [26], momen-tum density decays fast due to friction. Therefore, themost appropriate description in the theory of dynamicalcritical phenomena is model C, in which a non-conservedorder parameter is coupled to a conserved non-critical
density [1]. In this case [1, 10], and in extensions tonon-equilibrium dynamics [39], the dynamical exponentis predicted to be z = 2 + α/ν⊥, consistent with themeasurements if α = 0.
14
ACKNOWLEDGMENTS
We thank D. Risso and J. Silva for valuable techni-cal help and discussions. This research is supported byFondecyt Grants No. 1120211 (N.M) and No. 1140778(R.S.). G.C. acknowledges the financial support of Con-icyt Postdoctorado-2013 74140075.
[1] P.C. Hohenberg and B.I. Halperin, Theory of dynamiccritical phenomena, Rev. Mod. Phys. 49, 435 (1977).
[2] J.J. Binney, N.J. Dowrick, A.J. Fisher, and M.E.J. New-man, The Theory of Critical Phenomena: An Introduc-tion to the Renormalization Group (Clarendon Press, Ox-ford, 1992).
[3] H. Tanaka, T. Kawasaki, H. Shintani, and K. Watanabe,Critical-like behaviour of glass-forming liquids, NatureMaterials 9, 324 (2010).
[4] P.C. Hohenberg and D. R. Nelson, Early stages ofspinodal decomposition in superfluid 3He-4He mixtures,Phys. Rev. B 20, 2665 (1979).
[5] M. van Thiel and F. H. Ree, High-pressure liquid-liquidphase change in carbon, Phys. Rev. B 48, 3591 (1993).
[6] V. I. Gorentsveig, P. Fratzl, and J. L. Lebowitz, Kinet-ics of joint ordering and decomposition in binary alloys,Phys. Rev. B 55, 2912 (1997).
[7] J. N. Glosli and F. H. Ree, Liquid-Liquid Phase Trans-formation in Carbon, Phys. Rev. Lett. 82, 4659 (1999).
[8] R. Shimizu, M. Kobayashi, and H. Tanaka, Evidenceof Liquid-Liquid Transition in Triphenyl Phosphite fromTime-Resolved Light Scattering Experiments, Phys. Rev.Lett. 112, 125702 (2014).
[9] J. Kockelkoren and H. Chate, Late stages of coarseningin model C, Physica D 169-168, 80 (2002).
[10] R. Folk and G. Moser, Critical dynamics of stochasticmodels with energy conservation (model C), Phys. Rev.E 69, 036101 (2004).
[11] H. Tanaka, General view of a liquid-liquid phase transi-tion, Phys. Rev. E 62, 6968 (2000).
[12] M. Dudka, R. Folk, Y. Holovatch, and G. Moser, ModelC critical dynamics of random anisotropy magnets, J.Phys. a: Math. Theor. 40, 8247 (2007).
[13] J. Marro and R. Dickman, Non-equilibrium Phase Tran-sitions in Lattice Models (Cambridge University Press,Cambridge, 1999).
[14] M. Henkel, H. Hinrichsen, and S. Lubeck, Non-equilibrium Phase Transitions (Springer, Berlin, 2008).
[15] M. Kardar, G. Parisi and Y.C. Zhang, Dynamic Scalingof Growing Interfaces, Phys. Rev. Lett. 56, 889 (1986).
[16] M. C. Cross and P. C. Hohenberg, Pattern formationoutside of equilibrium, Rev. Mod. Phys. 65, 851 (1993).
[17] K.A. Takeuchi, Experimental approaches to universalout-of-equilibrium scaling laws: turbulent liquid crystaland other developments, J. Stat. Mech. P01006 (2014).
[18] A. Prevost, P. Melby, D. A. Egolf, and J. S. Urbach,Nonequilibrium two-phase coexistence in a confined gran-ular layer, Phys. Rev. E 70, 050301(R) (2004).
[19] P. M. Reis, R. A. Ingale, and M. D. Shattuck, Crys-tallization of a Quasi-Two-Dimensional Granular Fluid,Phys. Rev. Lett. 96, 258001 (2006); Caging Dynamics ina Granular Fluid, Phys. Rev. Lett. 98, 188301 (2007).
[20] C. Cartes, M.G. Clerc, and R. Soto, van der Waals nor-mal form for a one-dimensional hydrodynamic model,Phys. Rev. E 70, 031302 (2004).
[21] K. Watanabe and H. Tanaka, Direct Observation ofMedium-Range Crystalline Order in Granular LiquidsNear the Glass Transition, Phys. Rev. Lett. 100, 158002(2008).
[22] P.M. Reis and T. Mullin, Granular Segregation as a Crit-ical Phenomenon, Phys. Rev. Lett. 89, 244301 (2002).
[23] Y. Fan and K. M. Hill, Phase Transitions in Shear-Induced Segregation of Granular Materials, Phys. Rev.Lett. 106, 218301 (2011); Theory for shear-induced seg-regation of dense granular mixtures, New J. Phys. 13095009 (2011).
[24] F. Pacheco-Vazquez, G.A. Caballero-Robledo, and J.C.Ruiz-Suarez, Superheating in Granular Matter, Phys.Rev. Lett. 102, 170601 (2009).
[25] P. Melby et al., The dynamics of thin vibrated granularlayers, J. Phys. Cond. Mat. 17, S2689 (2005).
[26] M.G. Clerc et al., Liquid-solid-like transition in quasi-one-dimensional driven granular media, Nature Physics4, 249 (2008).
[27] C. May, M. Wild, I. Rehberg, and K. Huang, Analog ofsurface melting in a macroscopic nonequilibrium system,Phys. Rev. E 88, 062201 (2013).
[28] G. Castillo, N. Mujica, and R. Soto, Fluctuations andCriticality of a Granular Solid-Liquid-like Phase Transi-tion, Phys. Rev. Lett. 109, 095701 (2012).
[29] H.M. Jaeger, S.R. Nagel, and R.P. Behringer, Granularsolids, liquids, and gases, Rev. of Mod. Phys. 68, 1259(1996).
[30] I. S. Aranson and L. S. Tsimring, Patterns and collectivebehavior in granular media: Theoretical concepts, Rev.Mod. Phys. 78, 641 (2006).
[31] M. Argentina, M.G. Clerc, and R. Soto, van der Waals-Like Transition in Fluidized Granular Matter, Phys. Rev.Lett. 89, 044301 (2002).
[32] L.H. Luu, G. Castillo, N. Mujica, and R. Soto, Capillary-like Fluctuations of a Solid-Liquid Interface in a Non-Cohesive Granular System, Phys. Rev. E 87, 040202(R)(2013).
[33] Y. Leterrier et al., Mechanical integrity of transparentconductive oxide films for flexible polymer-based dis-plays, Thin Solid Films 460, 156 (2004).
[34] M.D. Shattuck, http://gibbs.engr.ccny.cuny.edu/
technical.php
[35] M. Cerda and J. Silva, http://www.dfi.uchile.cl/
~nmujica/PTrack2/
[36] J. Silva, Computer Science Engineer thesis, Optimizacionde proceso de deteccion de partıculas a partir de imagenesde video mediante paralelizacion, Universidad de Chile(2012).

15
[37] S.R. Elliott, Medium-range structural order in covalentamorphous solids, Nature 354, 445 (1991).
[38] H. Tanaka, Two-order-parameter model of the liquidglasstransition. II. Structural relaxation and dynamic hetero-
geneity, J. of Non-Crystalline Solids 351, 3385 (2005).[39] V.K. Akkineni and U.C. Tauber, Nonequilibrium critical
dynamics of the relaxational models C and D, Phys. Rev.E 69, 036113 (2004).
Related Documents