United Utilities Group PLC Annual Report and Financial Statements for the year ended 31 March 2018

Welcome message from author
This document is posted to help you gain knowledge. Please leave a comment to let me know what you think about it! Share it to your friends and learn new things together.
Transcript
United Utilities Group PLCAnnual Report and Financial Statements for the year ended 31 March 2018
UN
ITED
UT
ILITIES G
RO
UP PLC
AN
NU
AL R
EPO
RT
AN
D FIN
AN
CIA
L STA
TEM
ENT
S FO
R T
HE Y
EAR
END
ED 31 M
AR
CH
2018
United Utilities 2018.indd 3 6/1/2018 2:05:21 PM

Front cover: Working with and for our stakeholders.
United Utilities 2018.indd 4 6/1/2018 2:05:22 PM
06
United Utilities Group PLC Annual Report and Financial Statements for the year ended 31 March 2018
Look out for
You can read more in our online Annual Report at unitedutilities.com/corporate where we maintain a wide range of information of interest to institutional and private investors including:
› Latest news and press releases; › Reports and publications; and › Corporate responsibility content.
Read more content within our Annual Report
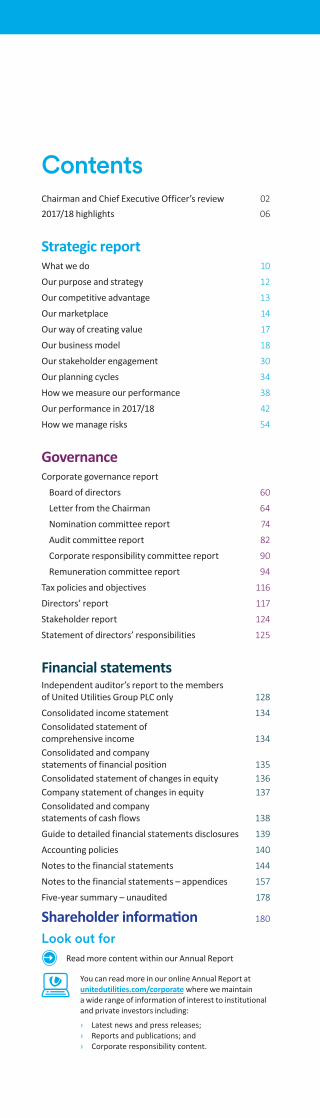
ContentsChairman and Chief Executive Officer’s review 022017/18 highlights 06
Strategic report
What we do 10
Our purpose and strategy 12
Our competitive advantage 13
Our marketplace 14
Our way of creating value 17
Our business model 18
Our stakeholder engagement 30
Our planning cycles 34
How we measure our performance 38
Our performance in 2017/18 42
How we manage risks 54
Governance
Corporate governance report Board of directors 60
Letter from the Chairman 64
Nomination committee report 74
Audit committee report 82
Corporate responsibility committee report 90
Remuneration committee report 94
Tax policies and objectives 116
Directors’ report 117
Stakeholder report 124
Statement of directors’ responsibilities 125
Financial statements Independent auditor’s report to the members of United Utilities Group PLC only 128
Consolidated income statement 134Consolidated statement of comprehensive income 134Consolidated and company statements of financial position 135Consolidated statement of changes in equity 136Company statement of changes in equity 137Consolidated and company statements of cash flows 138
Guide to detailed financial statements disclosures 139
Accounting policies 140
Notes to the financial statements 144
Notes to the financial statements – appendices 157
Five-year summary – unaudited 178
Shareholder information 180
United Utilities 2018.indd 5 6/1/2018 2:05:22 PM
06
United Utilities Group PLC Annual Report and Financial Statements for the year ended 31 March 2018
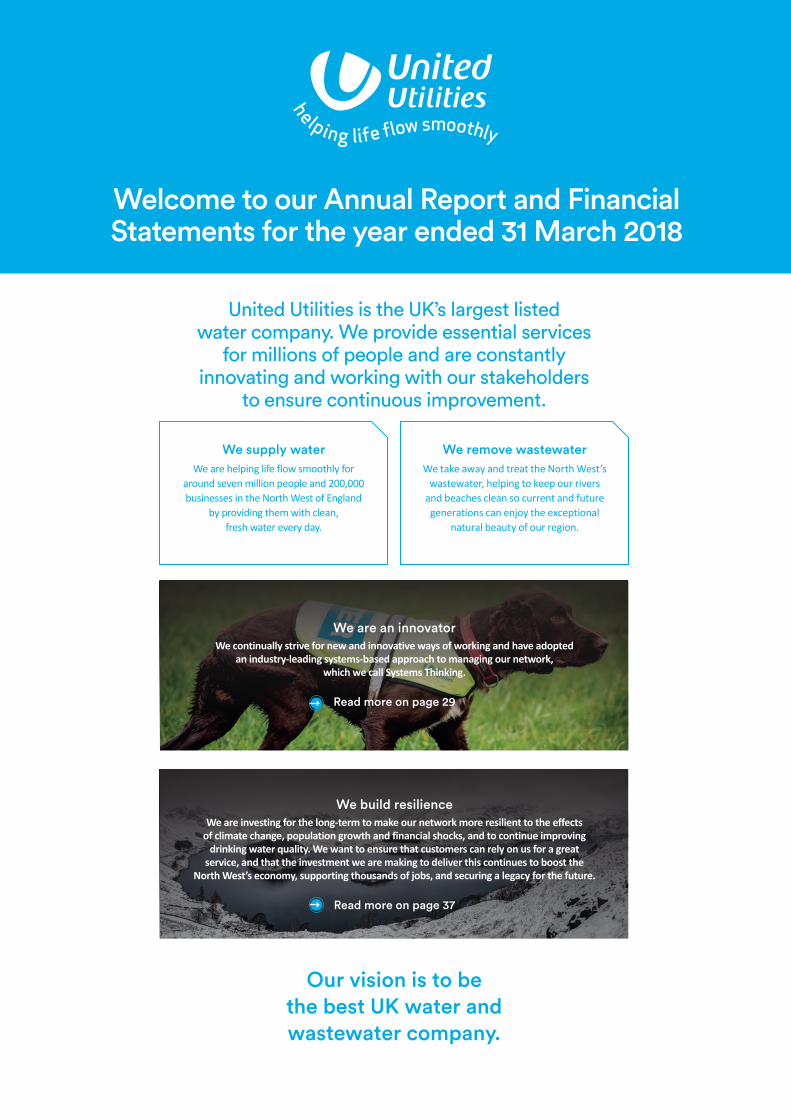
Welcome to our Annual Report and Financial Statements for the year ended 31 March 2018
United Utilities is the UK’s largest listed water company. We provide essential services
for millions of people and are constantly innovating and working with our stakeholders
to ensure continuous improvement.
Our vision is to be the best UK water and wastewater company.
We are an innovatorWe continually strive for new and innovative ways of working and have adopted
an industry-leading systems-based approach to managing our network, which we call Systems Thinking.
Read more on page 29
We remove wastewaterWe take away and treat the North West’s
wastewater, helping to keep our rivers and beaches clean so current and future generations can enjoy the exceptional
natural beauty of our region.
We supply waterWe are helping life flow smoothly for
around seven million people and 200,000 businesses in the North West of England
by providing them with clean, fresh water every day.
We build resilienceWe are investing for the long-term to make our network more resilient to the effects
of climate change, population growth and financial shocks, and to continue improving drinking water quality. We want to ensure that customers can rely on us for a great
service, and that the investment we are making to deliver this continues to boost the North West’s economy, supporting thousands of jobs, and securing a legacy for the future.
Read more on page 37
United Utilities 2018.indd 6 6/1/2018 2:05:25 PM
Job Number 1 June 2018 2:04 PM Proof 3 Job Number 1 June 2018 2:04 PM Proof 3
01
Stock Code: UU. unitedutilities.com/corporate
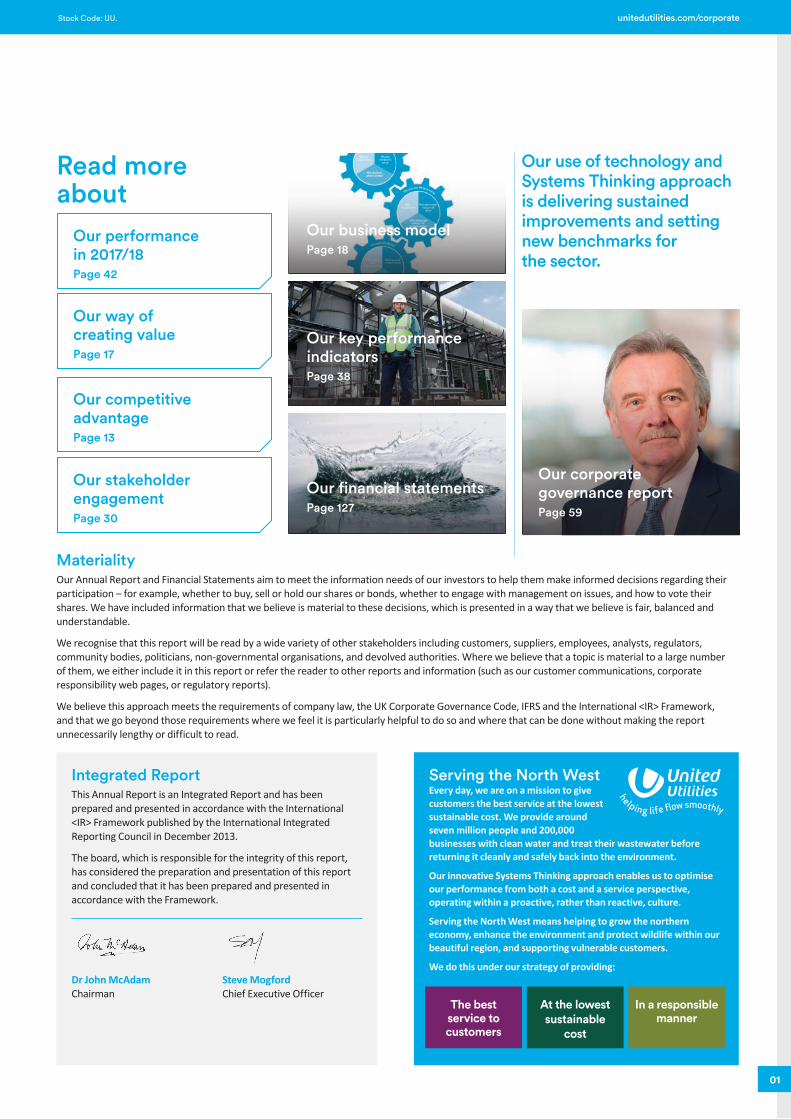
Integrated ReportThis Annual Report is an Integrated Report and has been prepared and presented in accordance with the International <IR> Framework published by the International Integrated Reporting Council in December 2013.
The board, which is responsible for the integrity of this report, has considered the preparation and presentation of this report and concluded that it has been prepared and presented in accordance with the Framework.
Dr John McAdam Chairman
Steve Mogford Chief Executive Officer
Serving the North WestEvery day, we are on a mission to give customers the best service at the lowest sustainable cost. We provide around seven million people and 200,000 businesses with clean water and treat their wastewater before returning it cleanly and safely back into the environment.
Our innovative Systems Thinking approach enables us to optimise our performance from both a cost and a service perspective, operating within a proactive, rather than reactive, culture.
Serving the North West means helping to grow the northern economy, enhance the environment and protect wildlife within our beautiful region, and supporting vulnerable customers.
We do this under our strategy of providing:
MaterialityOur Annual Report and Financial Statements aim to meet the information needs of our investors to help them make informed decisions regarding their participation – for example, whether to buy, sell or hold our shares or bonds, whether to engage with management on issues, and how to vote their shares. We have included information that we believe is material to these decisions, which is presented in a way that we believe is fair, balanced and understandable.
We recognise that this report will be read by a wide variety of other stakeholders including customers, suppliers, employees, analysts, regulators, community bodies, politicians, non-governmental organisations, and devolved authorities. Where we believe that a topic is material to a large number of them, we either include it in this report or refer the reader to other reports and information (such as our customer communications, corporate responsibility web pages, or regulatory reports).
We believe this approach meets the requirements of company law, the UK Corporate Governance Code, IFRS and the International <IR> Framework, and that we go beyond those requirements where we feel it is particularly helpful to do so and where that can be done without making the report unnecessarily lengthy or difficult to read.
Our business modelPage 18
Our stakeholder engagementPage 30
Our competitive advantagePage 13
Our way of creating valuePage 17
Our performance in 2017/18Page 42
Our key performance indicatorsPage 38
Our financial statementsPage 127
Our corporate governance reportPage 59
Our use of technology and Systems Thinking approach is delivering sustained improvements and setting new benchmarks for the sector.
Read more about
The best service to customers
At the lowest sustainable
cost
In a responsible manner
United Utilities 2018.indd 1 6/1/2018 2:05:31 PM
Job Number 4 June 2018 12:20 PM Proof 3 Job Number 4 June 2018 12:20 PM Proof 3
02
United Utilities Group PLC Annual Report and Financial Statements for the year ended 31 March 2018
Chairman and Chief Executive Officer’s review
Industry-leading customer satisfaction across a range of metrics
Confident of delivering totex outperformance of £100 million against 2015–20 allowance
Sharing anticipated net outperformance through £250 million additional investment in resilience
Reported operating profit up 5 per cent at £636 million and underlying operating profit up 4 per cent at £645 million
Total dividend of 39.73 pence, in line with our growth policy for this regulatory period
Our approach to innovation and Systems Thinking is radically changing the way we operate, and leading the way for the industry. It has helped us to deliver sustainably better service, greater resilience and improved efficiency, contributing to outperformance that we are sharing with customers.
OverviewOur strategy has, for many years now, focused on putting customers first in everything we do.
The improvement in customer satisfaction that we have delivered as a result of this positions us as a leader in the sector, recognised across a range of metrics, and our approach to vulnerability and affordability is setting new benchmarks for the industry.
Our industry faces many challenges, ranging from recent increased political scrutiny and preparations for the next regulatory review, to planning for long-term resilience needs to cope with a changing climate and growing population. We intend to rise to all of these challenges, building on the trust our customers place in us to provide an outstanding service, invest wisely to deliver additional benefits, and offer exceptional value for money.
We are using advanced technology and innovations from around the world and across different sectors to accelerate our implementation of Systems Thinking. This is delivering sustainable improvements in service, resilience and efficiency, and is contributing to outperformance in the current regulatory period. The enhanced capability that Systems Thinking has delivered gives us confidence heading into the next regulatory period and beyond.
We are sharing our anticipated net outperformance with customers by investing in projects that were not part of our original regulatory settlement for this regulatory period but that will help deliver long-term resilience for the benefit of customers and the environment, and ease the burden of future customer bills to help improve affordability.
This philosophy is central to our strategy and will help deliver long term value for customers, the environment and shareholders.
Customer focusOur customers are benefiting from sustained improvements in service, efficiency and greater resilience, and this is demonstrated by the continuous improvements we have made in our customer satisfaction scores.
This year, we achieved our best ever scores against Ofwat’s qualitative Service Incentive Mechanism (SIM), and we were delighted to be positioned first in the industry in the final wave of the year, and to be in an upper quartile position for the year overall.
Our best practice in customer satisfaction has received external recognition through several awards, many of which look beyond the water sector. We achieved an upper quartile performance in the UK Customer Satisfaction Index, which covers all industries, and we are the leading listed company for the Consumer Council for Water’s assessment of household complaint numbers.
The North West suffers from high levels of extreme deprivation. Helping vulnerable customers is a high priority for us. We are supporting more than 50,000 customers through our Priority Services scheme, which provides dedicated support for those customers who are experiencing short or long-term personal challenges in their lives, such as physical or mental health difficulties, as well as those struggling financially.
We have far surpassed our target for the number of customers we would help through our financial assistance schemes in this regulatory period. In January, we hosted the first ever North West Affordability summit, engaging with many of our stakeholders including customers and building on our already leading position on affordability and vulnerability.
Notwithstanding our benchmark debt management processes and wide range of schemes to help customers struggling to pay, the high levels of income deprivation in our region mean that bad debt and cash collection will remain a principal challenge for us.
We have made significant inroads in this area, reducing household bad debt even further to 2.3 per cent in 2017/18, from 2.5 per cent in 2016/17.
United Utilities 2018.indd 2 04/06/2018 12:21:34

Job Number 1 June 2018 2:04 PM Proof 3 Job Number 1 June 2018 2:04 PM Proof 3
Stock Code: UU. unitedutilities.com/corporate
03
Financial performanceGroup revenue was £32 million higher than last year, at £1,736 million, reflecting our allowed regulatory revenue changes partly offset by the accounting impact of our non-household retail joint venture, Water Plus, which completed on 1 June 2016.
Reported operating profit was up £31 million, at £636 million, reflecting the underlying movements as well as reduced profits last year due to costs associated with preparing the business for open competition in the non-household retail sector and other restructuring costs.
Underlying operating profit was up £22 million, at £645 million, reflecting the increase in revenue and lower operating costs, partly offset by an increase in depreciation and amortisation.
Reported profit before tax was down £10 million, at £432 million, reflecting the underlying movements as well as fair value movements and other adjusting items as outlined in the underlying profit reconciliation table on pages 52 and 53.
Underlying profit before tax was down £19 million, at £370 million, as the increase in underlying operating profit was more than offset by a £40 million increase in the underlying net finance expense. The increase in the underlying net finance expense is mainly due to the impact of higher RPI inflation on our index-linked debt.
Reported earnings per share was 52.0 pence, which is higher than the underlying figure, mainly reflecting the net effect of fair value gains on debt and derivative instruments, capitalised borrowing costs, and interest on swaps and debt under fair value option, all of which are excluded from the underlying profit figure.
Underlying earnings per share was 44.7 pence, more than covering the dividend.
The board has proposed a final dividend of 26.49 pence per ordinary share, taking the total dividend for 2017/18 to 39.73 pence. This is an increase of 2.2 per cent, in line with our policy for this 2015–20 regulatory period of targeting an annual growth rate of at least RPI inflation through to 2020.
We have a robust capital structure, with gearing of 61 per cent as at 31 March 2018 (measured as group net debt to ‘shadow’ regulatory capital value, which adjusts for actual capital spend to date), sitting comfortably within our policy target range of 55 per cent to 65 per cent. This supports a solid investment grade credit rating. Our regulated company, United Utilities Water Limited, has long-term credit ratings of A3 from Moody’s, on stable outlook, and A- from Standard & Poor’s, on stable outlook.
This helps us retain efficient access to the debt capital markets throughout the economic cycle, and we have a low cost of debt already locked-in that places us in a strong position to substantially outperform our industry allowed cost of debt for the 2015–20 regulatory period.
Our pension scheme asset-liability matching approach continues to prove its effectiveness, providing us with stability in times of turbulent market conditions. We had an IAS 19 surplus of £344 million at 31 March 2018.
During the year, our Water Plus joint venture with Severn Trent has, along with the wider market, experienced an increase in its working capital arising from data and billing issues following market opening. As a consequence, loans owed to the group by Water Plus have increased by £17 million to £136 million.
Pictured: Steve Mogford, Chief Executive Officer, and Dr John McAdam, Chairman
United Utilities 2018.indd 3 6/1/2018 2:05:33 PM
Job Number 1 June 2018 2:04 PM Proof 3 Job Number 1 June 2018 2:04 PM Proof 3
04
United Utilities Group PLC Annual Report and Financial Statements for the year ended 31 March 2018
Creating value for our communityWe are a highly visible service provider in the North West and do our best to be a good neighbour and add value by investing in the communities where we live and operate.
We have a long-standing partnership that helps to regenerate neighbourhoods impacted by our work, for example our work to improve our mains and sewers. As part of this initiative, we have supported a range of local environmental projects around our Davyhulme wastewater treatment works in Greater Manchester, including the creation of a community orchard.
We work with schools across our region, with workshops encouraging a focus on the importance of saving water, not flushing the wrong things down the toilet, practical tips for the home and garden, and protecting and enhancing our beaches and bathing waters.
Our employees love getting involved in local communities through volunteering, fundraising, and charitable giving. We support and encourage this, offering paid volunteering leave, matching charitable fundraising efforts, and through our payroll giving scheme.
Whether it’s walking the hills, spotting wildlife, swimming or sailing, locals and tourists would agree that the North West is a nature lover’s delight. We work to continually maintain and enhance the environment in our region, and we encourage the public to access our land and regional bathing waters for relaxation and recreation, and to enjoy them safely.
Operational performanceInnovation and our Systems Thinking approach are radically changing the way we operate.
We have driven efficiency into the delivery of our 2015–20 investment programme through changing our delivery model, and are creating value through greater use of innovation and advanced technology alongside our substantial capital investment programme.
As well as customer service, operational and environmental benefits, this strategy has optimised performance under our outcome delivery incentives (ODIs) and delivered efficiency savings, contributing to regulatory outperformance beyond the significant savings that were already included in our business plan.
We are particularly proud that we have delivered these efficiencies whilst maintaining highly effective capital delivery, as reflected in our Time: Cost: Quality index (TCQi) score which remains high at over 90 per cent.
Total net regulatory capital expenditure in the year, including £147 million of infrastructure renewals expenditure, was £816 million. This brings our cumulative net regulatory capital expenditure for the first three years of this five-year period to around £2.4 billion, reflecting the planned acceleration that we have implemented in order to optimise our operational performance and reap the benefits of enhancements earlier in the regulatory period.
Performance against our regulatory contractThe low cost of debt we have already locked-in places us in a strong position to substantially outperform compared with the allowed cost of debt under industry price limits.
We are also confident in delivering outperformance of £100 million compared with our totex allowance for the 2015–20 regulatory period. This is in addition to £400 million of savings that we had already committed to deliver over the period to meet our final determination.
Our ODIs get increasingly challenging as we progress through this regulatory period, and we received a net £7.0 million penalty for 2017/18. Our wastewater ODI performance remains strong, but we recognise that against our water measures there are still areas in which we can improve and we are committed to achieving this. Our water metrics over the first three years of this regulatory period have been impacted by a number of big bursts on our network. We have been successful in minimising the impact of these events on customers, and we are working hard to improve performance in this area.
Our cumulative net ODI performance for the first three years of the period remains positive at a net £2.2 million reward, and we are on track to deliver a good performance against one of our ODIs that will only impact the final year of this regulatory period, 2019/20, in relation to our West Cumbria pipeline project. Read more about this project on page 33.
Our performance in the first three years of this regulatory period exceeds our initial expectations and we now expect, in the absence of any unforeseen events over the remainder of the 2015–20 period, to end the period with a cumulative net reward on ODIs.
We are sharing our anticipated net outperformance by reinvesting to improve resilience for the benefit of customers. We have increased the additional investment that we are making available in this regulatory period from £100 million to £250 million. This is in line with the approach we took in the 2010–15 regulatory period.
This takes our total 2015–20 net regulatory capital expenditure programme to around £3.8 billion. In addition, we expect to invest up to £100 million in non-regulated projects, subject to acceptable returns. In the first three years of the 2015–20 period we have invested £59 million in non-regulated projects, primarily in solar power.
Preparing for the long termWe are advanced in our plans for PR19, informed by extensive engagement with customers regarding their needs and priorities. We are on track to submit our PR19 business plan in September 2018 and we are confident that it will deliver against Ofwat’s four key themes – great customer service, affordable bills, innovation and resilience. These are not new for us in the way that we run our business and have been areas of focus for some time. Indeed, in many of these areas we are a leader in the industry and already have plans in place to build on this in the 2020–25 regulatory period and beyond.
We have recently finished consulting with customers and other stakeholders on our new 25-year Water Resources Management Plan, balancing investment with affordability in our long-term planning for the 2020–45 period.
Strong corporate responsibility credentialsWe operate in a manner that aims to deliver the highest levels of corporate governance and our board continues to provide sound and prudent governance, consistent with the principles of the UK Corporate Governance Code.
In July 2017, we were delighted to retain Industry Leading Company status, as measured through the Environment Agency’s annual assessment – the only listed company to do so. We achieved frontier performance for the sector with the lowest number of pollution incidents, alongside our best-in-sector level of self-reporting.
Our drinking water quality has improved again and is the best it has ever been, and we are leading the industry in our approach to resilience.
We retained our World Class rating in the Dow Jones Sustainability Index for the tenth consecutive year, a very good achievement in light of the ever-evolving standards.
We have consistently met, or outperformed, our regulatory leakage targets and our performance to date keeps us on track to meet our 2015–20 regulatory targets.
Chairman and Chief Executive Officer’s reviewcontinued
United Utilities 2018.indd 4 6/1/2018 2:05:34 PM
Job Number 1 June 2018 2:04 PM Proof 3 Job Number 1 June 2018 2:04 PM Proof 3
05
Stock Code: UU. unitedutilities.com/corporate
By 2020, we aim to reduce our carbon footprint by 50 per cent compared with a 2005/06 baseline and we are on track to do so. Our carbon footprint has reduced by one-third since 2005/06, helped by a 4 per cent reduction in electricity use. In addition, we generated more renewable energy than ever before, 12 per cent higher than the previous year. This illustrates good progress in our energy strategy to use less and generate more renewable energy.
Our employeesThe commitment and dedication of our people is critical to the sustained improvements we have delivered in operational performance and customer service.
Employee engagement of 79 per cent this year, as measured through our annual Employee Voice survey, is higher than the UK norm. We are immensely grateful for the contribution our people make to the company’s performance.
We have been successful in attracting and retaining people, having regenerated our graduate and apprentice schemes in 2010 and continuing to expand them to help provide an optimal balance of skills and experience within the business.
In the first year of our apprentice scheme in 2010 we took on six apprentices, and have built this intake to 42 in 2017, taking our total programme to 118 currently employed. We are accredited by four awarding bodies and named as one of the top 100 apprenticeship employers.
We have 55 people currently on our graduate scheme, across a range of different disciplines, including finance, engineering, commercial and project management. We encourage diversity among the new generation we are bringing into this industry and 40 per cent of our current graduates are female.
We are committed to helping local schools and have trained Science, Technology, Engineering and Mathematics (STEM) ambassadors. We frequently attend careers events across our region and have good links with local universities.
Last year we launched a partnership with Teach First, a charity that strives to end educational inequality by placing and training graduates to teach in low income communities. This helps with our desire to be more active with schoolchildren in communities that are hard to reach within our region, helping them to improve their employability skills, raising awareness of future career opportunities, and offering our employees development opportunities in coaching and mentoring.
We work with our supply chain partners to give young people not in education, employment or training (NEETs) the chance to realise their potential, and gain hands on experience and basic skills training in a real workplace environment, bringing social and economic benefit to the region.
Our employee accident frequency rate for 2017/18 was 0.101 accidents per 100,000 hours, compared with a rate of 0.196 in 2016/17. Our contractor accident frequency rate in 2017/18 was 0.092 compared to 0.087 in 2016/17. As part of our health and safety improvement programme, we continue to make improvements to our corporate health, safety and wellbeing management system and through local initiatives. For example, in the last 12 months we have deployed around 600 devices to high-risk lone workers to increase their level of personal protection.
We have been awarded the workplace wellbeing charter, continue to retain Occupational Health and Safety Assessment Series (OHSAS) 18001 accreditation, and have achieved the Gold Health and Safety Award from the Royal Society for the Prevention of Accidents (RoSPA) for the sixth consecutive year.
We aim to ensure that all our colleagues go home safe and well and we firmly believe that nothing we do is worth getting hurt for.
OutlookSystems Thinking and the implementation of innovative technology has put us in a strong position as we look ahead to the next regulatory review.
Our leading operational performance is supported by a robust financing position. We are outperforming the regulatory contract for the 2015–20 period, allowing us to fund additional investment for the benefit of customers, and we have plans in place to improve yet further, giving us confidence heading into the 2020–25 regulatory period and beyond.
We have achieved industry-leading environmental and water quality performance scores, and we are making a substantial contribution to the North West. Our £3.8 billion investment programme is helping to enhance the environment that provides a home for wildlife, areas for recreation for our community, and a major pull for tourism in our region.
Our work supports thousands of jobs, both directly and indirectly through our supply chain, which helps underpin the success of the North West economy through employment and training opportunities.
We are planning and preparing for the next price review and for long-term challenges through our new 25-year Water Resources Management Plan. Through this, we will ensure that we remain resilient in the face of increasingly extreme weather and prepare to support a growing population in the North West.
Last, but by no means least, we want to give a big thank you to our employees, customers and wider stakeholders for their continued support.
Dr John McAdam Chairman
Steve Mogford Chief Executive Officer
The strategic report on pages 10 to 57 was approved at a meeting of the board on 23 May 2018 and signed off on its behalf by Steve Mogford, Chief Executive Officer.
United Utilities 2018.indd 5 6/1/2018 2:05:34 PM
Job Number 1 June 2018 2:04 PM Proof 3 Job Number 1 June 2018 2:04 PM Proof 3
06
United Utilities Group PLC Annual Report and Financial Statements for the year ended 31 March 2018
2017/18 highlightsOperational highlights
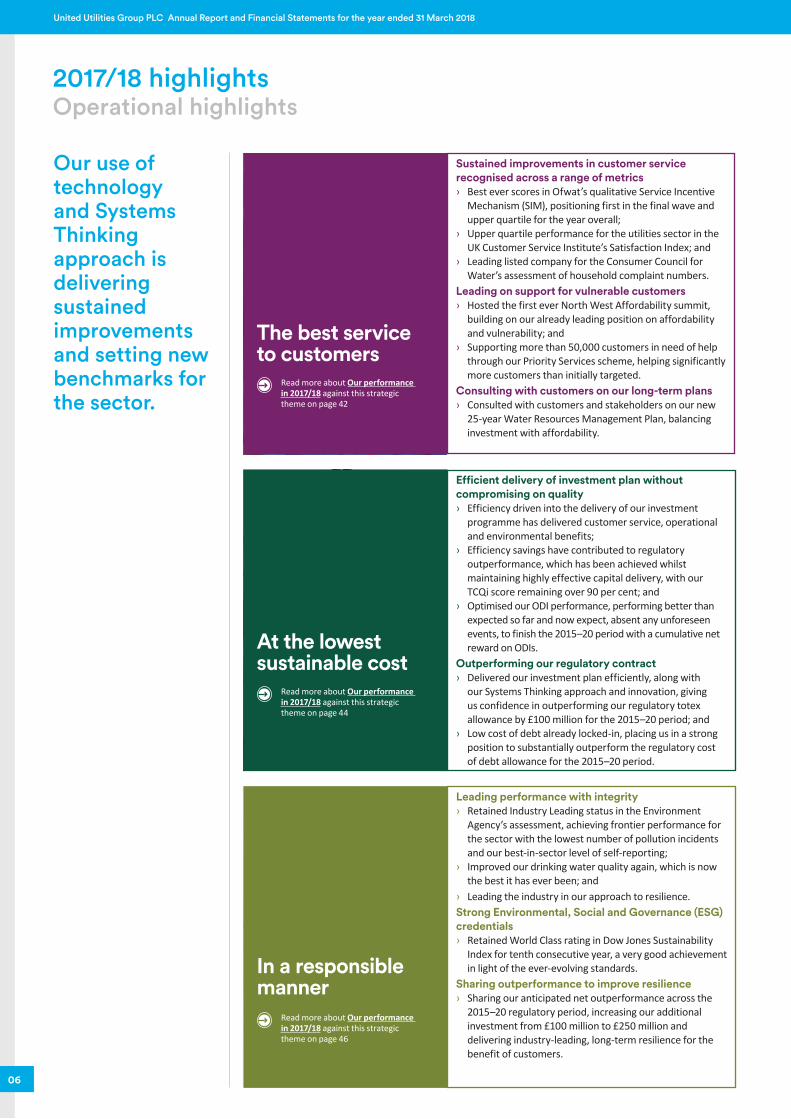
Sustained improvements in customer service recognised across a range of metrics › Best ever scores in Ofwat’s qualitative Service Incentive
Mechanism (SIM), positioning first in the final wave and upper quartile for the year overall;
› Upper quartile performance for the utilities sector in the UK Customer Service Institute’s Satisfaction Index; and
› Leading listed company for the Consumer Council for Water’s assessment of household complaint numbers.
Leading on support for vulnerable customers › Hosted the first ever North West Affordability summit,
building on our already leading position on affordability and vulnerability; and
› Supporting more than 50,000 customers in need of help through our Priority Services scheme, helping significantly more customers than initially targeted.
Consulting with customers on our long-term plans › Consulted with customers and stakeholders on our new
25-year Water Resources Management Plan, balancing investment with affordability.
Our use of technology and Systems Thinking approach is delivering sustained improvements and setting new benchmarks for the sector.
Read more about Our performance in 2017/18 against this strategic theme on page 42
The best service to customers
Read more about Our performance in 2017/18 against this strategic theme on page 44
At the lowest sustainable cost
Efficient delivery of investment plan without compromising on quality › Efficiency driven into the delivery of our investment
programme has delivered customer service, operational and environmental benefits;
› Efficiency savings have contributed to regulatory outperformance, which has been achieved whilst maintaining highly effective capital delivery, with our TCQi score remaining over 90 per cent; and
› Optimised our ODI performance, performing better than expected so far and now expect, absent any unforeseen events, to finish the 2015–20 period with a cumulative net reward on ODIs.
Outperforming our regulatory contract › Delivered our investment plan efficiently, along with
our Systems Thinking approach and innovation, giving us confidence in outperforming our regulatory totex allowance by £100 million for the 2015–20 period; and
› Low cost of debt already locked-in, placing us in a strong position to substantially outperform the regulatory cost of debt allowance for the 2015–20 period.
Leading performance with integrity › Retained Industry Leading status in the Environment
Agency’s assessment, achieving frontier performance for the sector with the lowest number of pollution incidents and our best-in-sector level of self-reporting;
› Improved our drinking water quality again, which is now the best it has ever been; and
› Leading the industry in our approach to resilience.Strong Environmental, Social and Governance (ESG) credentials › Retained World Class rating in Dow Jones Sustainability
Index for tenth consecutive year, a very good achievement in light of the ever-evolving standards.
Sharing outperformance to improve resilience › Sharing our anticipated net outperformance across the
2015–20 regulatory period, increasing our additional investment from £100 million to £250 million and delivering industry-leading, long-term resilience for the benefit of customers.
In a responsible manner
Read more about Our performance in 2017/18 against this strategic theme on page 46
United Utilities 2018.indd 6 6/1/2018 2:05:40 PM
Job Number 1 June 2018 2:04 PM Proof 3 Job Number 1 June 2018 2:04 PM Proof 3
07
Stock Code: UU. unitedutilities.com/corporate
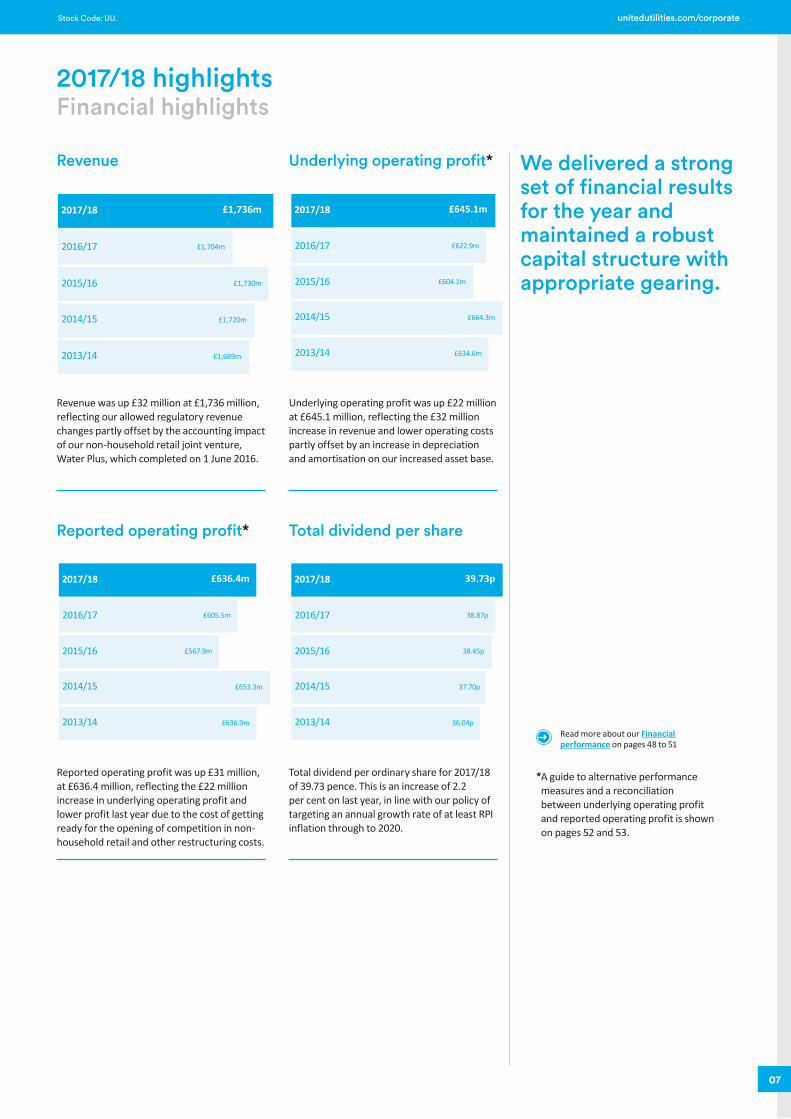
2017/18 highlightsFinancial highlights
Revenue
Reported operating profit*
Underlying operating profit*
Total dividend per share
Revenue was up £32 million at £1,736 million, reflecting our allowed regulatory revenue changes partly offset by the accounting impact of our non-household retail joint venture, Water Plus, which completed on 1 June 2016.
Reported operating profit was up £31 million, at £636.4 million, reflecting the £22 million increase in underlying operating profit and lower profit last year due to the cost of getting ready for the opening of competition in non-household retail and other restructuring costs.
Underlying operating profit was up £22 million at £645.1 million, reflecting the £32 million increase in revenue and lower operating costs partly offset by an increase in depreciation and amortisation on our increased asset base.
Total dividend per ordinary share for 2017/18 of 39.73 pence. This is an increase of 2.2 per cent on last year, in line with our policy of targeting an annual growth rate of at least RPI inflation through to 2020.
2017/18 £1,736m
2016/17 £1,704m
2015/16
2014/15
£1,730m
£1,720m
2013/14 £1,689m
2017/18 £636.4m
2016/17 £605.5m
2015/16
2014/15
£567.9m
£653.3m
2013/14 £636.9m
2017/18 £645.1m
2016/17 £622.9m
2015/16
2014/15
£604.1m
£664.3m
2013/14 £634.6m
2017/18 39.73p
2016/17 38.87p
2015/16
2014/15
38.45p
37.70p
2013/14 36.04p
* A guide to alternative performance measures and a reconciliation between underlying operating profit and reported operating profit is shown on pages 52 and 53.
Read more about our Financial performance on pages 48 to 51
We delivered a strong set of financial results for the year and maintained a robust capital structure with appropriate gearing.
United Utilities 2018.indd 7 6/1/2018 2:05:41 PM

Job Number 1 June 2018 2:04 PM Proof 3
08
United Utilities Group PLC Annual Report and Financial Statements for the year ended 31 March 2018
Job Number 1 June 2018 2:04 PM Proof NumberJob Number 1 June 2018 2:04 PM Proof NumberJob Number 1 June 2018 2:04 PM Proof Number Job Number 1 June 2018 2:04 PM Proof NumberJob Number 1 June 2018 2:04 PM Proof Number Job Number 1 June 2018 2:04 PM Proof NumberJob Number 1 June 2018 2:04 PM Proof Number Job Number 1 June 2018 2:04 PM Proof NumberJob Number 1 June 2018 2:04 PM Proof Number Job Number 1 June 2018 2:04 PM Proof NumberUnited Utilities 2018.indd 8 6/1/2018 2:05:53 PM
Job Number 1 June 2018 2:04 PM Proof 3
Stock Code: UU. unitedutilities.com/corporate
Job Number 1 June 2018 2:04 PM Proof NumberJob Number 1 June 2018 2:04 PM Proof NumberJob Number 1 June 2018 2:04 PM Proof Number Job Number 1 June 2018 2:04 PM Proof NumberJob Number 1 June 2018 2:04 PM Proof Number Job Number 1 June 2018 2:04 PM Proof NumberJob Number 1 June 2018 2:04 PM Proof Number Job Number 1 June 2018 2:04 PM Proof NumberJob Number 1 June 2018 2:04 PM Proof Number Job Number 1 June 2018 2:04 PM Proof Number
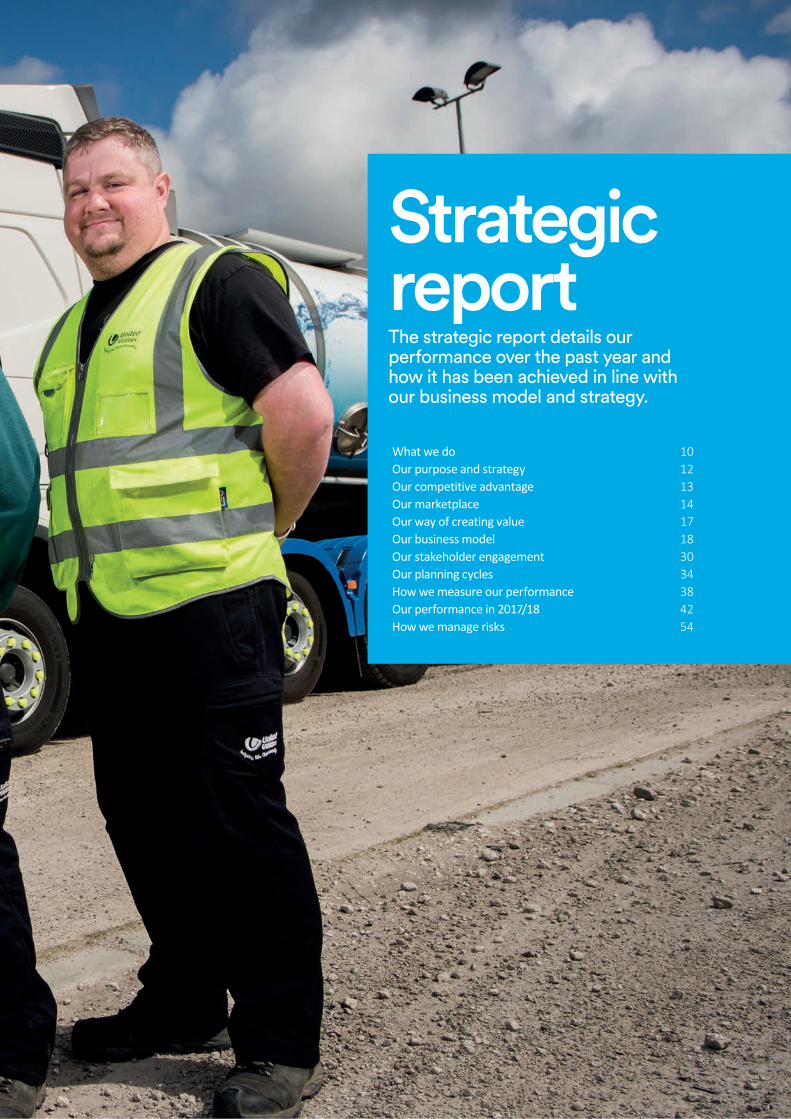
Strategic reportThe strategic report details our performance over the past year and how it has been achieved in line with our business model and strategy.
What we do 10Our purpose and strategy 12Our competitive advantage 13Our marketplace 14Our way of creating value 17Our business model 18Our stakeholder engagement 30Our planning cycles 34How we measure our performance 38Our performance in 2017/18 42How we manage risks 54
United Utilities 2018.indd 9 6/1/2018 2:05:54 PM
Job Number 1 June 2018 2:04 PM Proof 3 Job Number 1 June 2018 2:04 PM Proof 3
10
United Utilities Group PLC Annual Report and Financial Statements for the year ended 31 March 2018
BlackpoolPreston
Lancaster
Kendal
Workington
Whitehaven
Burnley
Crewe
Stockport
BlackburnBolton
Liverpool Manchester
Warrington
Chester
Carlisle
Barrow-in Furness
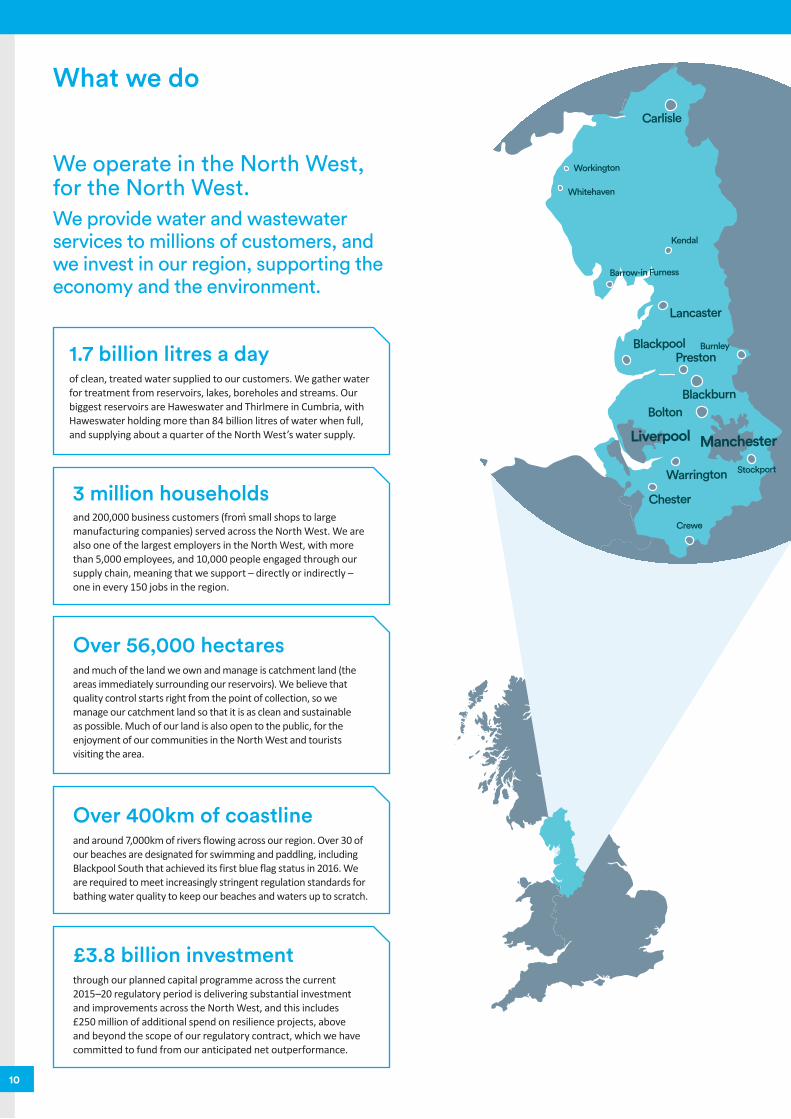
1.7 billion litres a dayof clean, treated water supplied to our customers. We gather water for treatment from reservoirs, lakes, boreholes and streams. Our biggest reservoirs are Haweswater and Thirlmere in Cumbria, with Haweswater holding more than 84 billion litres of water when full, and supplying about a quarter of the North West’s water supply.
3 million householdsand 200,000 business customers (from small shops to large manufacturing companies) served across the North West. We are also one of the largest employers in the North West, with more than 5,000 employees, and 10,000 people engaged through our supply chain, meaning that we support – directly or indirectly – one in every 150 jobs in the region.
Over 56,000 hectaresand much of the land we own and manage is catchment land (the areas immediately surrounding our reservoirs). We believe that quality control starts right from the point of collection, so we manage our catchment land so that it is as clean and sustainable as possible. Much of our land is also open to the public, for the enjoyment of our communities in the North West and tourists visiting the area.
Over 400km of coastlineand around 7,000km of rivers flowing across our region. Over 30 of our beaches are designated for swimming and paddling, including Blackpool South that achieved its first blue flag status in 2016. We are required to meet increasingly stringent regulation standards for bathing water quality to keep our beaches and waters up to scratch.
£3.8 billion investmentthrough our planned capital programme across the current 2015–20 regulatory period is delivering substantial investment and improvements across the North West, and this includes £250 million of additional spend on resilience projects, above and beyond the scope of our regulatory contract, which we have committed to fund from our anticipated net outperformance.
What we do
We operate in the North West, for the North West.We provide water and wastewater services to millions of customers, and we invest in our region, supporting the economy and the environment.
United Utilities 2018.indd 10 6/1/2018 2:06:10 PM

Job Number 1 June 2018 2:04 PM Proof 3 Job Number 1 June 2018 2:04 PM Proof 3
Stock Code: UU. unitedutilities.com/corporate
BlackpoolPreston
Lancaster
Kendal
Workington
Whitehaven
Burnley
Crewe
Stockport
BlackburnBolton
Liverpool Manchester
Warrington
Chester
Carlisle
Barrow-in Furness
We
trea
t
We return
clean waterWe collectwater
We treat
water
wat
er
We
dist
ribut
e
the waterCustomers use
wastewater
We remove
from bioresources
We create energy
was
tew
ater
We return clean water safely to
the environment, allowing the
sustainable cycle to begin again
We collect water and store
it in our 166 reservoirs
We treat wastewater in our 568 wastewater
treatment works to meet stringent environmental
standards
We treat water in our 88 water
treatment works and then protect
it in covered reservoirs
We treat over 180,000 tonnes of sewage sludge a
year in our 37 facili�es to
generate clean, renewable energy
We distribute 1.7 billion litres of water a day to customers’
taps using over 42,000km of water pipes
We collect wastewater and transport it using over 77,000km of wastewater
pipes to be cleaned
Customers enjoy a clean, reliable supply
of water 24 hours a day
Our Water Cycle
United Utilities 2018.indd 11 6/1/2018 2:06:18 PM
Job Number 1 June 2018 2:04 PM Proof 3 Job Number 1 June 2018 2:04 PM Proof 3
12
United Utilities Group PLC Annual Report and Financial Statements for the year ended 31 March 2018
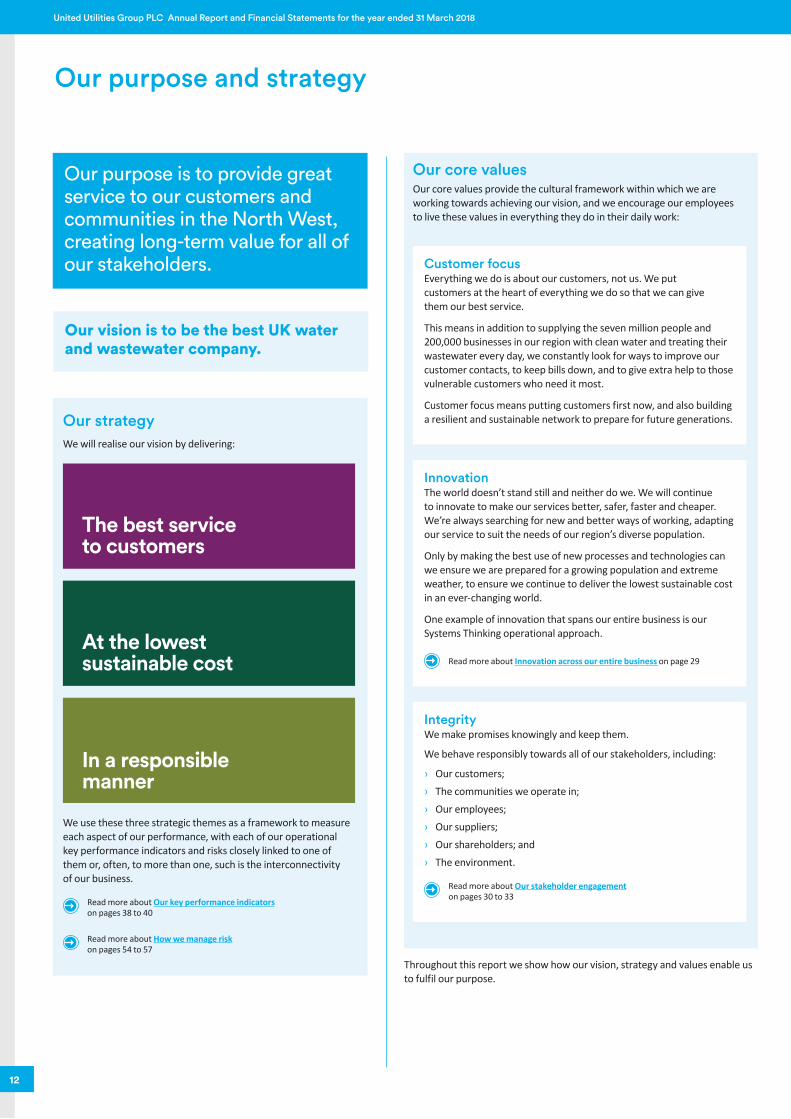
Our vision is to be the best UK water and wastewater company.
Our purpose is to provide great service to our customers and communities in the North West, creating long-term value for all of our stakeholders.
Our purpose and strategy
Our strategyWe will realise our vision by delivering:
In a responsible manner
At the lowest sustainable cost
The best service to customers
We use these three strategic themes as a framework to measure each aspect of our performance, with each of our operational key performance indicators and risks closely linked to one of them or, often, to more than one, such is the interconnectivity of our business.
Read more about Our key performance indicators on pages 38 to 40
Read more about How we manage risk on pages 54 to 57
Our core valuesOur core values provide the cultural framework within which we are working towards achieving our vision, and we encourage our employees to live these values in everything they do in their daily work:
Throughout this report we show how our vision, strategy and values enable us to fulfil our purpose.
Customer focusEverything we do is about our customers, not us. We put customers at the heart of everything we do so that we can give them our best service.
This means in addition to supplying the seven million people and 200,000 businesses in our region with clean water and treating their wastewater every day, we constantly look for ways to improve our customer contacts, to keep bills down, and to give extra help to those vulnerable customers who need it most.
Customer focus means putting customers first now, and also building a resilient and sustainable network to prepare for future generations.
InnovationThe world doesn’t stand still and neither do we. We will continue to innovate to make our services better, safer, faster and cheaper. We’re always searching for new and better ways of working, adapting our service to suit the needs of our region’s diverse population.
Only by making the best use of new processes and technologies can we ensure we are prepared for a growing population and extreme weather, to ensure we continue to deliver the lowest sustainable cost in an ever-changing world.
One example of innovation that spans our entire business is our Systems Thinking operational approach.
Read more about Innovation across our entire business on page 29
IntegrityWe make promises knowingly and keep them.
We behave responsibly towards all of our stakeholders, including:
› Our customers; › The communities we operate in; › Our employees; › Our suppliers; › Our shareholders; and › The environment.
Read more about Our stakeholder engagement on pages 30 to 33
United Utilities 2018.indd 12 6/1/2018 2:06:18 PM
Job Number 1 June 2018 2:04 PM Proof 3 Job Number 1 June 2018 2:04 PM Proof 3
13
Stra
tegi
c re
port
Stock Code: UU. unitedutilities.com/corporate
How we offer value
Our competitive advantage
Throughout this report we show how our vision, strategy and values enable us to fulfil our purpose.
Wholesale revenue and asset base linked to RPI inflation to at least 2020
Planning for the long-term, protecting and delivering essential services
Significant improvements in customer service and operational performance, with more to come
Sustainable dividend policy, targeting a growth rate of at least RPI inflation per annum to at least 2020
Clarity on allowed returns through to 2020, with a track record of regulatory outperformance
Robust capital structure with a stable A3 credit rating
Customer and environmental benefits delivered through substantial capital investment, driving long-term RCV growth
Deeply integrated with the environment, with external recognition for our responsible business approach
How we differentiate ourselves from our competitors within the water industry
Systems Thinking approach to how we operate improves efficiency and resilience
We have adopted an innovative systems-based approach to our regional water system and wastewater drainage areas, which we call Systems Thinking. This enables us to build a better understanding by examining the linkages and interactions between each of the components in our system. Rather than operating each treatment works in isolation, our field engineers are linked via our Integrated Control Centre (ICC), the data hub where we plan, monitor and control our water and wastewater infrastructure. It’s one integrated system across the North West, and we can process enormous amounts of data received in real time from the telemetry backbone across our network, as well as factoring in other source data such as weather forecasts.
By operating our network in this way we are able to optimise cost and service performance, as well as moving away from a reactive mindset to address problems proactively, before they actually affect customers. This helps us to improve the reliability of our assets in order to reduce unplanned service interruptions. It also helps us to improve our use of data, at local asset level and centrally, to optimise performance and allocate resources to production teams with full accountability for asset and system performance.
This approach was built into our business plan in order to help us deliver both operational improvements and cost savings across the 2015–20 regulatory period, and is part of our long-term strategy to continue delivering operational benefits in future regulatory periods. As a result of this Systems Thinking approach, we are improving the resilience of our assets and network. This enables us to keep providing a reliable service to customers long into the future.
Prudent financial risk management delivers long-term predictability and resilience to financial shocks
Effective financial risk management delivers long-term predictability and resilience to financial shocks. Our clearly articulated policies, covering a variety of market risks, help us reduce our exposure to the economic and regulatory environment, providing more predictable returns to investors. They underpin our target to maintain debt to regulatory capital gearing (RCV) within a range of 55 to 65 per cent, supporting a solid A3 rating with Moody’s for United Utilities Water Limited and efficient access to the debt capital markets across the economic cycle.
Inflation exposure is managed by having around 50 per cent of our debt in index-linked form, which offers good value relative to nominal debt and acts as a partial hedge of the impact of inflation on our RCV and revenues. Most of our index-linked debt is RPI-linked, reflecting the regulatory model to March 2020, but thereafter the regulatory model will transition towards CPIH. In the absence of a CPIH debt capital market we will, subject to cost and availability, gradually transition towards a greater proportion of CPI-linked debt, being the best available proxy for CPIH.
Interest rate exposure on our remaining nominal debt is managed by fixing the underlying interest cost out to ten years, on a reducing balance basis. We have previously supplemented this by substantively fixing interest rates for each forthcoming regulatory period at the time of the price control determination, but this is no longer necessary as Ofwat is using debt indexation on the assumed portion of new debt from 2020. Our approach to interest rate management enables us to manage uncertainty in the approach to setting the cost of debt at each price review and our approach to debt financing, with a continuous assessment of various funding opportunities, enables us to consistently lock in long-term debt at good relative value.
We adopt an asset-liability matching policy for our defined benefit pension schemes by investing in assets such as corporate bonds and gilts along with the use of interest rate swaps, which perform in line with the liabilities so as to hedge against changes in swap and gilt yields. This therefore reduces the volatility of the required funding level. The schemes have also hedged inflation exposure, partly through RPI swaps and partly through an inflation funding mechanism, whereby company contributions are flexed for movements in RPI inflation, providing a natural hedge against any inflationary uplift on the RCV. It is anticipated that further progressive de-risking measures will continue to be implemented in relation to the pension schemes as part of a long-term ‘self-sufficiency’ strategy.
United Utilities 2018.indd 13 6/1/2018 2:06:19 PM
Job Number 1 June 2018 2:04 PM Proof 3 Job Number 1 June 2018 2:04 PM Proof 3
14
United Utilities Group PLC Annual Report and Financial Statements for the year ended 31 March 2018
Our marketplace
Our industry and marketEvery day, over 50 million household and non-household customers receive water and wastewater services in England and Wales. There are ten licensed water and wastewater companies, which are split regionally based on river catchment areas, and these make up around 95 per cent of the industry, with the remainder being made up of licensed companies which provide water-only services and tend to be smaller in size.
United Utilities Water Limited (UUW) is the second largest based on the size of our asset base, as measured by Regulatory Capital Value (RCV). We are licensed to provide water and wastewater services to a population of approximately seven million people in the North West, and we provide services to approximately three million households, which generates around two-thirds of our total revenue, and approximately 200,000 businesses, ranging in size from large manufacturing companies to small shops.
The privatisation of the industry has delivered a significant contribution to improvements in public health as a result of over £130 billion that has been invested in maintaining and improving assets and services since 1989. It has led to improvements in the quality of services, significantly higher environmental standards, and superior quality drinking water, all at a fair cost to customers that has been estimated to be lower than would be the case if the water sector was still owned by the UK Government, with prices that have declined in real terms over the current and last regulatory periods.
The advancement of technology and innovation makes way for even more improvements in the future, as investment continues to be made in improving the service we provide for the long-term.
Our competitive environmentThe other water companies in England and Wales are naturally our main competitors, and we benchmark our performance on a comparative basis with these peers.
In line with our vision to be the best UK water and wastewater company, we also benchmark our customer service performance against other leading service providers in our region.
In addition, as a publicly listed FTSE 100 company, the other UK and worldwide utilities are competitors from an investment perspective.
Our political and regulatory environmentAs each company in the water sector operates as a regional monopoly for the majority of its services, we are subject to regulation in terms of price and performance.
At privatisation, in order to protect the interests of both customers and the environment, three separate bodies were set up to regulate the activities of water and wastewater companies under the areas of economic, drinking water quality, and environmental regulation. This has since evolved further to fit with the substantial tightening of laws and regulations that we have seen since privatisation.
Over a long time frame the political and regulatory environment can change significantly. While to some extent these changes are outside of our direct control, we believe in the importance of maintaining good relationships. This enables us to engage positively in regulatory discussions, offering our industry knowledge in order to help influence future policy with the aim of achieving the best outcome for customers, shareholders and other stakeholders.
Environmental and quality regulation The water and wastewater industry in the UK is subject to substantial domestic and European Union (EU) regulation, placing significant statutory obligations on companies relating to, amongst other factors, the quality of drinking water supplied, wastewater treatment, and the impact of our activities on the environment.
Defra is the UK Government department responsible for water policy and regulations in England and Wales; it sets drinking water quality and environmental standards (many based on European law) which water companies must meet.
Read more online at gov.uk/government/organisations/department-for-environment-food-rural-affairs
The Environment Agency (EA) controls how much water can be drawn from the environment and the quality of water returned to rivers and the sea. The EA produces an assessment of water and wastewater companies’ annual performance, and we include this as one of our operational KPIs; see pages 38 and 39.
Read more online at gov.uk/government/organisations/environment-agency
The Drinking Water Inspectorate (DWI) is responsible for ensuring compliance with the drinking water quality regulations.
Read more online at dwi.gov.uk
Natural England is responsible for the protection of designated sites for nature conservation, for example Sites of Special Scientific Interest. Companies are required to manage these sites and to protect and enhance biodiversity.
Read more online at gov.uk/government/organisations/natural-england
The Consumer Council for Water (CCW) represents customers’ interests relating to price, service and value for money. It investigates customer complaints. Customers who remain dissatisfied can refer their complaint to be adjudicated by an independent service, WATRS (see below).
Read more online at ccwater.org.uk
The Water Redress Scheme (WATRS) is an independent service designed to adjudicate disputes that have not been resolved through the water company’s customer service teams or by referring the matter to the Consumer Council for Water.
Read more online at watrs.org
United Utilities 2018.indd 14 6/1/2018 2:06:19 PM
Job Number 1 June 2018 2:04 PM Proof 3 Job Number 1 June 2018 2:04 PM Proof 3
15
Stra
tegi
c re
port
Stock Code: UU. unitedutilities.com/corporate
Economic regulation
The Water Services Regulation Authority (Ofwat) is the economic regulator of the water and sewerage sectors in England and Wales, responsible for ensuring the companies provide customers with good-quality, efficient service at a fair price.
Read more online at: ofwat.gov.uk
The water industry plans and operates within five-year regulatory periods known as Asset Management Plan (AMP) periods.
Prior to the start of each regulatory period, Ofwat consults with stakeholders, including companies and sets out its price review methodology, which gives the framework for the forthcoming five-year regulatory period.
As part of the price review process, companies submit their business plans to Ofwat with a projection of the expenditure needed to enhance and maintain their assets over the period, in line with customer priorities, statutory requirements and the regulatory framework. Ofwat scrutinises and challenges these business plans, and ultimately sets the five-year price, service and incentive package – this is the regulatory contract that company performance is measured against over the regulatory period.
Each year all water companies are required to publish an annual performance report (APR). Our APRs, from the beginning of this regulatory period, can be found on our website, where our report for this financial year will also be made available: unitedutilities.com/corporate
This report covers the third year of the 2015–20 regulatory period (AMP6).
While we are working to perform within the current regulatory period, the industry and its stakeholders, including government and regulators, are constantly looking ahead and planning for the future. The 2014 Water Act paved the way for the extension of competition into certain parts of the wholesale business. The retail market was opened to competition for all non-household customers from 1 April 2017 and Ofwat proposed, in its Water 2020 consultation document in 2015, to open up the areas of water resources and bioresources treatment to future competition.
In December 2017, Ofwat published its final methodology for the price review (PR19) for the ‘AMP7’ regulatory period, which runs from April 2020 to March 2025. This methodology forms part of Water 2020, which is Ofwat’s overall vision for the water sector in England and Wales.
Ofwat has outlined four key themes in its final methodology for the 2020–25 regulatory period:
› Great customer service; › Affordable bills; › Resilience in the round; and › Innovation.
These are not new for us in the way that we run our business and have been areas of focus for us for some time. We have been actively engaged in the development of Ofwat’s approach to PR19, contributing across the full range of working groups and providing detailed proposals in key areas. We have been carrying out extensive customer research and engagement with stakeholders to determine our plans for AMP7. We will be submitting our business plan in September 2018.
Ofwat is introducing a number of changes for the 2020–25 regulatory period.
Price controls 2015–20 regulatory period (AMP6)
Ofwat moved away from one single price control and introduced four separate price controls:
› Wholesale water – the physical supply of water; › Wholesale wastewater – the removal and treatment of wastewater; › Household retail – customer-facing activities (principally customer
contact, billing, meter reading and cash collection) for households; and › Non-household retail – customer-facing activities for businesses (now
covered by our joint venture, Water Plus).
Separate retail price controls were introduced to encourage a more efficient service and to promote competition in non-household retail.
2020–25 regulatory period (AMP7)
Ofwat’s methodology for AMP7 sets out six separate binding controls:
› Water resources – the resources from which water is sourced; › Water network plus – water treatment and distribution; › Wastewater network plus – wastewater collection and treatment; › Bioresources – the treatment and sale of energy and nutrient-rich
bioresources from recycled organic waste; › Residential retail (the equivalent of household retail); and › Business retail (the equivalent of non-household retail).
This further separation is intended to promote future competition in water resources and bioresources. As we have transferred our non-household (business) retail business to our joint venture, Water Plus, we will not be covered by the business retail price control.
Operating and capital costs (totex)2015–20 regulatory period (AMP6)
In order to encourage companies to utilise the most efficient sustainable solutions, Ofwat changed the way companies’ operating and capital costs are assessed for AMP6, from separate capex and opex to a combined totex model that treats them both equally.
Ofwat developed wholesale cost assessment totex models as part of the last price review process, which were used to set the allowed costs for companies in AMP6.
Where companies outperform or underperform their totex allowance, this gain or pain is shared between investors and customers, ensuring both receive a share of the impact. We include our performance against our allowed totex expenditure as one of our operational KPIs.
Read more about our performance against our operational KPIs on pages 38 and 39
2020–25 regulatory period (AMP7)
Ofwat is developing new cost assessment totex models for AMP7, and we have taken a constructive approach in sharing cost driver analysis from third party experts with Ofwat and our peers in the industry through working groups and other available consultation channels.
Ofwat has introduced a new mechanism for AMP7 that uses cost sharing rates to incentivise companies to submit efficient business plans. Each company will have one cost sharing rate for outperformance and another rate for underperformance, with the rates determined by the ratio of a company’s business plan totex to Ofwat’s view of efficient totex as determined by its cost assessment models. Business plans that are deemed efficient versus the models used by Ofwat will get more favourable cost sharing rates, and vice versa.
United Utilities 2018.indd 15 6/1/2018 2:06:19 PM
Job Number 1 June 2018 2:04 PM Proof 3 Job Number 1 June 2018 2:04 PM Proof 3
16
United Utilities Group PLC Annual Report and Financial Statements for the year ended 31 March 2018
Performance commitments and incentives2015–20 regulatory period (AMP6)
In a move to a more outcomes-based approach, there was greater emphasis placed on customer engagement to set outcomes for AMP6. Companies’ performance is measured through performance commitments covering a wide range of measures assessing operational and environmental performance, with associated rewards or penalties (outcome delivery incentives, or ODIs). We include our performance against our ODIs in our operational KPIs.
Read more about our ODIs for the 2015–20 regulatory period on page 41
Following their introduction in AMP6 there was a wide variety of approaches towards definition, measurement, targets, rewards and penalty payments associated with performance commitment measurements and outcome delivery incentives. There is a cap of +/- 2 per cent of the return on regulated equity in place in AMP6. In part, this reflected a recognition that this was the first period in which these new performance incentives had been applied.
2020–25 regulatory period (AMP7)
Ofwat has set out a clear intention to introduce more powerful ODIs in AMP7, with a drive for companies’ returns to be more heavily dependent on their operational performance against stretching targets. It intends to achieve this by removing the cap that is currently in place and also through enhanced outperformance payment rates for significant outperformance and higher underperformance penalty rates for very poor performance.
Alongside the increased scope for outperformance and underperformance payments, company performance commitments and outcome delivery incentives are likely to be subject to significant revision in AMP7, including a set of 14 common performance commitments across the industry, with three of these having common upper quartile performance targets.
Customer satisfaction 2015–20 regulatory period (AMP6)
Ofwat’s Service Incentive Mechanism (SIM) assessment is used as a measure of customer satisfaction that rewards companies that perform particularly well on customer service relative to other water companies, and penalises companies that perform particularly poorly.
SIM is split into two components – quantitative SIM is based on the number of customer contacts, and qualitative SIM is based on the satisfaction of customers with the outcomes of those contacts. We include both of these SIM assessments as operational KPIs.
Read more about our performance against our operational KPIs on pages 38 and 39
2020–25 regulatory period (AMP7)
A new customer service metric, C-MeX, will replace SIM in AMP7, and will be piloted from 2018/19.
This will be based on two customer surveys, one from customers that have contacted the company, which should be similar to the qualitative SIM in the current period, and one from customers that have not contacted the company. The proposed incentive range will be higher than is currently available for SIM, demonstrating a greater emphasis on customer satisfaction and customer sentiment in AMP7.
In addition, Ofwat plans to introduce a new developer service measure, D-MeX, which will also be piloted from 2018/19.
Household retail2015–20 regulatory period (AMP6)
Allowed costs within the household retail price control are determined using a water industry average cost to serve approach in AMP6, rewarding companies that are able to achieve costs below the industry average.
Our household retail revenue allowance includes the assumed average cost to serve plus a margin that is intended to cover retail costs not covered through the average cost to serve, such as financing of new retail assets and the retailer’s working capital.
We include our performance against our household retail revenue allowance as one of our operational KPIs.
Read more about our performance against our operational KPIs on pages 38 and 39
2020–25 regulatory period (AMP7)
Ofwat intends to replace its previous average cost to serve approach with a cost assessment based on econometric models of household retail costs in AMP7. These costs will be benchmarked to an efficient baseline.
We support the decision to use econometric models. This more sophisticated approach has the potential to directly reflect key industry cost drivers such as dual and single billing, meter penetration and the impact of extreme deprivation when estimating of efficient levels for retail cost allowances.
Financing2015–20 regulatory period (AMP6)
Ofwat estimated a weighted average cost of capital for AMP6 (3.74 per cent, in real terms , based on RPI inflation) in order to provide debt and equity investors with a return that was considered to be commensurate with the level of risk that underpinned their investment.
In setting the cost of capital, Ofwat used a notional capital structure with 62.5 per cent gearing, calculated as net debt as a percentage of regulatory capital value.
We include our performance against Ofwat’s industry allowed cost of debt as one of our operational KPIs.
Read more about our performance against our operational KPIs on pages 38 and 39
2020–25 regulatory period (AMP7)
Ofwat has been clear that the estimated weighted average cost of capital will be lower in AMP7, recognising that requirements for overall returns are lower now than they have been historically, and reflecting its intention that a higher proportion of companies’ returns should come from operational outperformance.
In setting the cost of capital, Ofwat is using a notional capital structure with 60 per cent gearing – this is the midpoint of our target range of 55 to 65 per cent.
Ofwat will apply debt indexation to new debt in order to reduce the risk of forecast errors, and has confirmed that CPIH will be adopted for the indexation of future price controls.
Ofwat has set an indicative figure for its estimate of the cost of capital of 3.4 per cent in real terms (using CPIH as the price index), which is equivalent to 2.4 per cent if RPI had been used as the price index, as in earlier price reviews.
Our marketplace
United Utilities 2018.indd 16 6/1/2018 2:06:20 PM
Job Number 1 June 2018 2:04 PM Proof 3 Job Number 1 June 2018 2:04 PM Proof 3
17
Stra
tegi
c re
port
Stock Code: UU. unitedutilities.com/corporate
Our way of creating value
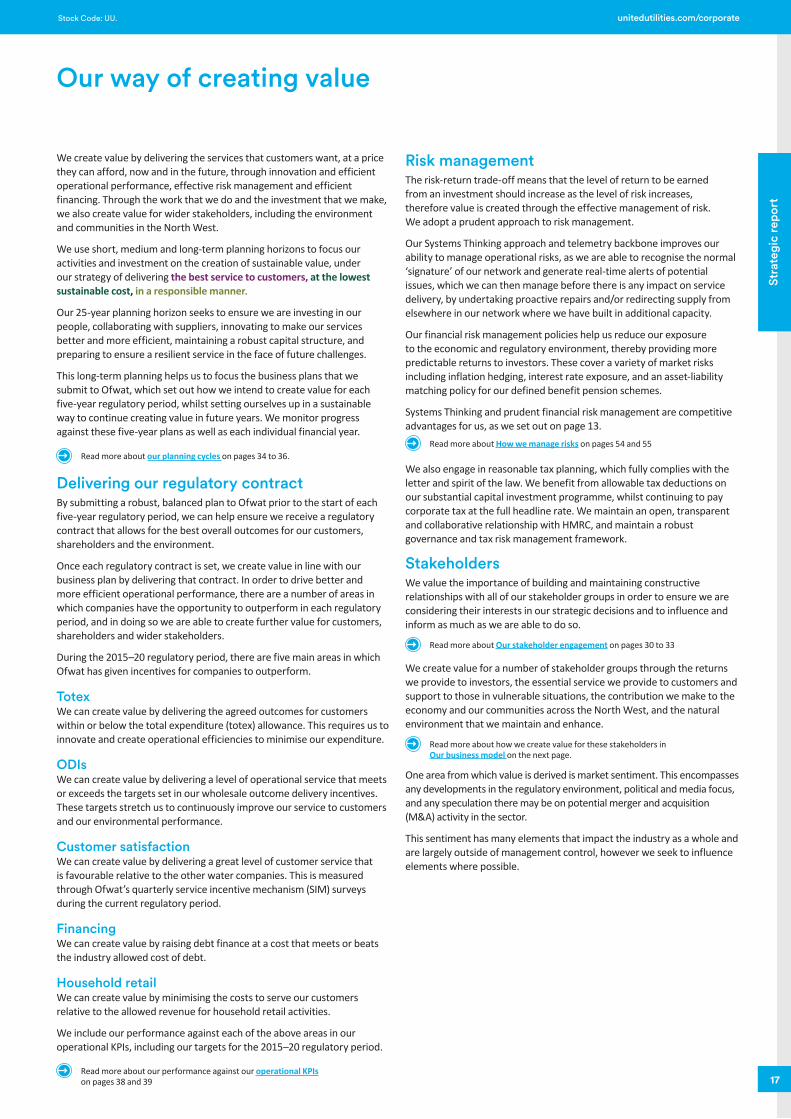
We create value by delivering the services that customers want, at a price they can afford, now and in the future, through innovation and efficient operational performance, effective risk management and efficient financing. Through the work that we do and the investment that we make, we also create value for wider stakeholders, including the environment and communities in the North West.
We use short, medium and long-term planning horizons to focus our activities and investment on the creation of sustainable value, under our strategy of delivering the best service to customers, at the lowest sustainable cost, in a responsible manner.
Our 25-year planning horizon seeks to ensure we are investing in our people, collaborating with suppliers, innovating to make our services better and more efficient, maintaining a robust capital structure, and preparing to ensure a resilient service in the face of future challenges.
This long-term planning helps us to focus the business plans that we submit to Ofwat, which set out how we intend to create value for each five-year regulatory period, whilst setting ourselves up in a sustainable way to continue creating value in future years. We monitor progress against these five-year plans as well as each individual financial year.
Read more about our planning cycles on pages 34 to 36.
Delivering our regulatory contractBy submitting a robust, balanced plan to Ofwat prior to the start of each five-year regulatory period, we can help ensure we receive a regulatory contract that allows for the best overall outcomes for our customers, shareholders and the environment.
Once each regulatory contract is set, we create value in line with our business plan by delivering that contract. In order to drive better and more efficient operational performance, there are a number of areas in which companies have the opportunity to outperform in each regulatory period, and in doing so we are able to create further value for customers, shareholders and wider stakeholders.
During the 2015–20 regulatory period, there are five main areas in which Ofwat has given incentives for companies to outperform.
TotexWe can create value by delivering the agreed outcomes for customers within or below the total expenditure (totex) allowance. This requires us to innovate and create operational efficiencies to minimise our expenditure.
ODIsWe can create value by delivering a level of operational service that meets or exceeds the targets set in our wholesale outcome delivery incentives. These targets stretch us to continuously improve our service to customers and our environmental performance.
Customer satisfactionWe can create value by delivering a great level of customer service that is favourable relative to the other water companies. This is measured through Ofwat’s quarterly service incentive mechanism (SIM) surveys during the current regulatory period.
FinancingWe can create value by raising debt finance at a cost that meets or beats the industry allowed cost of debt.
Household retailWe can create value by minimising the costs to serve our customers relative to the allowed revenue for household retail activities.
We include our performance against each of the above areas in our operational KPIs, including our targets for the 2015–20 regulatory period.
Read more about our performance against our operational KPIs on pages 38 and 39
Risk managementThe risk-return trade-off means that the level of return to be earned from an investment should increase as the level of risk increases, therefore value is created through the effective management of risk. We adopt a prudent approach to risk management.
Our Systems Thinking approach and telemetry backbone improves our ability to manage operational risks, as we are able to recognise the normal ‘signature’ of our network and generate real-time alerts of potential issues, which we can then manage before there is any impact on service delivery, by undertaking proactive repairs and/or redirecting supply from elsewhere in our network where we have built in additional capacity.
Our financial risk management policies help us reduce our exposure to the economic and regulatory environment, thereby providing more predictable returns to investors. These cover a variety of market risks including inflation hedging, interest rate exposure, and an asset-liability matching policy for our defined benefit pension schemes.
Systems Thinking and prudent financial risk management are competitive advantages for us, as we set out on page 13.
Read more about How we manage risks on pages 54 and 55
We also engage in reasonable tax planning, which fully complies with the letter and spirit of the law. We benefit from allowable tax deductions on our substantial capital investment programme, whilst continuing to pay corporate tax at the full headline rate. We maintain an open, transparent and collaborative relationship with HMRC, and maintain a robust governance and tax risk management framework.
StakeholdersWe value the importance of building and maintaining constructive relationships with all of our stakeholder groups in order to ensure we are considering their interests in our strategic decisions and to influence and inform as much as we are able to do so.
Read more about Our stakeholder engagement on pages 30 to 33
We create value for a number of stakeholder groups through the returns we provide to investors, the essential service we provide to customers and support to those in vulnerable situations, the contribution we make to the economy and our communities across the North West, and the natural environment that we maintain and enhance.
Read more about how we create value for these stakeholders in Our business model on the next page.
One area from which value is derived is market sentiment. This encompasses any developments in the regulatory environment, political and media focus, and any speculation there may be on potential merger and acquisition (M&A) activity in the sector.
This sentiment has many elements that impact the industry as a whole and are largely outside of management control, however we seek to influence elements where possible.
United Utilities 2018.indd 17 6/1/2018 2:06:20 PM
Job Number 1 June 2018 2:04 PM Proof 3
18
United Utilities Group PLC Annual Report and Financial Statements for the year ended 31 March 2018
Our business model
Our external drivers and relationships
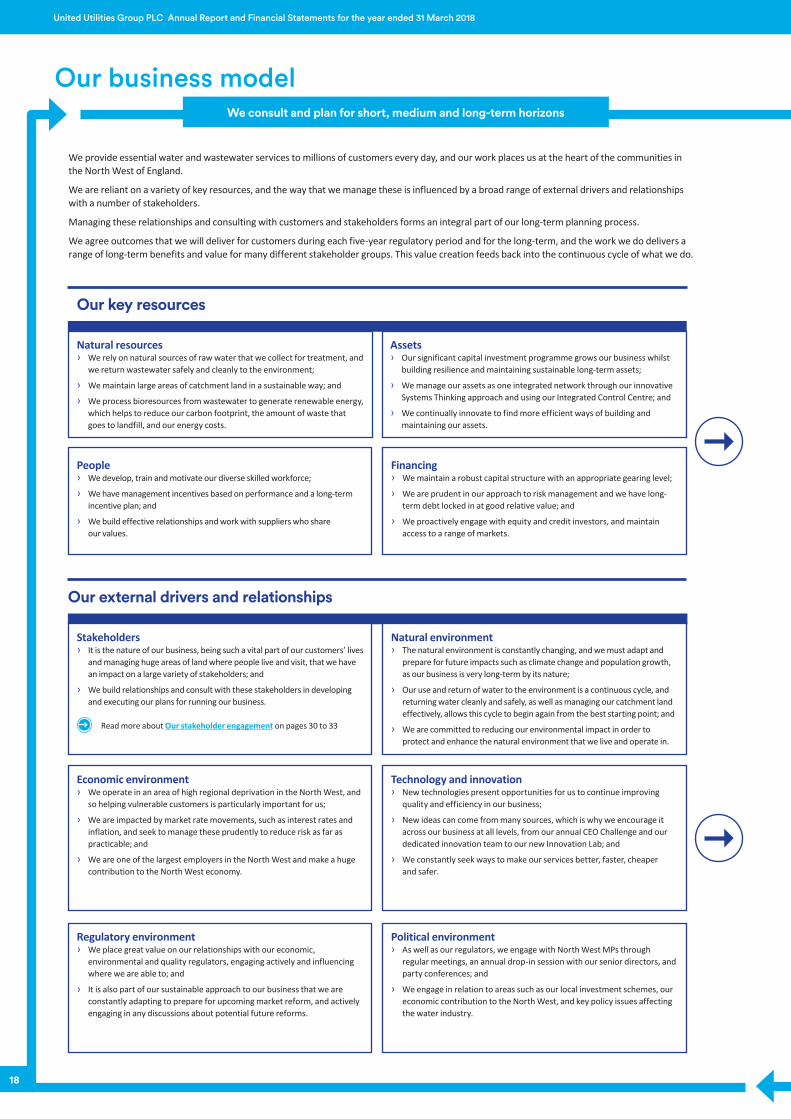
We provide essential water and wastewater services to millions of customers every day, and our work places us at the heart of the communities in the North West of England.
We are reliant on a variety of key resources, and the way that we manage these is influenced by a broad range of external drivers and relationships with a number of stakeholders.
Managing these relationships and consulting with customers and stakeholders forms an integral part of our long-term planning process.
We agree outcomes that we will deliver for customers during each five-year regulatory period and for the long-term, and the work we do delivers a range of long-term benefits and value for many different stakeholder groups. This value creation feeds back into the continuous cycle of what we do.
People › We develop, train and motivate our diverse skilled workforce;
› We have management incentives based on performance and a long-term incentive plan; and
› We build effective relationships and work with suppliers who share our values.
Financing › We maintain a robust capital structure with an appropriate gearing level;
› We are prudent in our approach to risk management and we have long-term debt locked in at good relative value; and
› We proactively engage with equity and credit investors, and maintain access to a range of markets.
Natural resources › We rely on natural sources of raw water that we collect for treatment, and
we return wastewater safely and cleanly to the environment;
› We maintain large areas of catchment land in a sustainable way; and
› We process bioresources from wastewater to generate renewable energy, which helps to reduce our carbon footprint, the amount of waste that goes to landfill, and our energy costs.
Assets › Our significant capital investment programme grows our business whilst
building resilience and maintaining sustainable long-term assets;
› We manage our assets as one integrated network through our innovative Systems Thinking approach and using our Integrated Control Centre; and
› We continually innovate to find more efficient ways of building and maintaining our assets.
Our key resources
Stakeholders › It is the nature of our business, being such a vital part of our customers’ lives
and managing huge areas of land where people live and visit, that we have an impact on a large variety of stakeholders; and
› We build relationships and consult with these stakeholders in developing and executing our plans for running our business.
Read more about Our stakeholder engagement on pages 30 to 33
Political environment › As well as our regulators, we engage with North West MPs through
regular meetings, an annual drop-in session with our senior directors, and party conferences; and
› We engage in relation to areas such as our local investment schemes, our economic contribution to the North West, and key policy issues affecting the water industry.
Regulatory environment › We place great value on our relationships with our economic,
environmental and quality regulators, engaging actively and influencing where we are able to; and
› It is also part of our sustainable approach to our business that we are constantly adapting to prepare for upcoming market reform, and actively engaging in any discussions about potential future reforms.
Natural environment › The natural environment is constantly changing, and we must adapt and
prepare for future impacts such as climate change and population growth, as our business is very long-term by its nature;
› Our use and return of water to the environment is a continuous cycle, and returning water cleanly and safely, as well as managing our catchment land effectively, allows this cycle to begin again from the best starting point; and
› We are committed to reducing our environmental impact in order to protect and enhance the natural environment that we live and operate in.
Technology and innovation › New technologies present opportunities for us to continue improving
quality and efficiency in our business;
› New ideas can come from many sources, which is why we encourage it across our business at all levels, from our annual CEO Challenge and our dedicated innovation team to our new Innovation Lab; and
› We constantly seek ways to make our services better, faster, cheaper and safer.
Economic environment › We operate in an area of high regional deprivation in the North West, and
so helping vulnerable customers is particularly important for us;
› We are impacted by market rate movements, such as interest rates and inflation, and seek to manage these prudently to reduce risk as far as practicable; and
› We are one of the largest employers in the North West and make a huge contribution to the North West economy.
We consult and plan for short, medium and long-term horizons
18
United Utilities 2018.indd 18 6/1/2018 2:06:20 PM
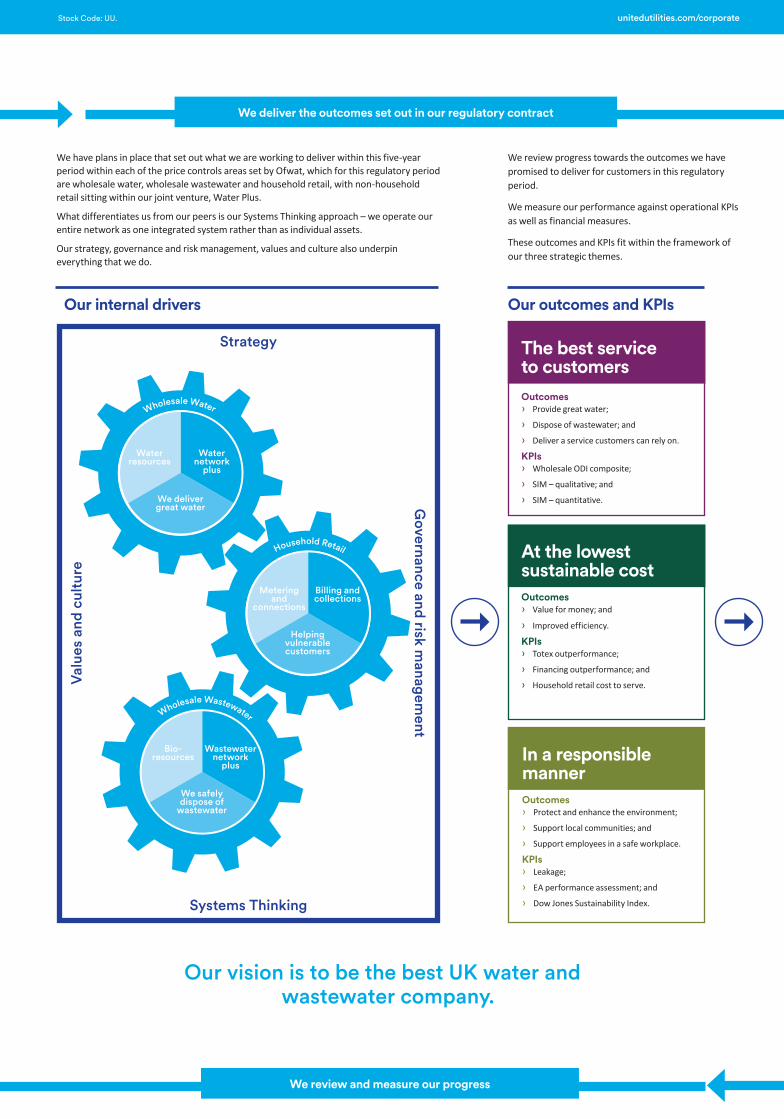
Job Number 1 June 2018 2:04 PM Proof 3 Job Number 1 June 2018 2:04 PM Proof 3
Stock Code: UU. Stock Code: UU.unitedutilities.com/corporate
We have plans in place that set out what we are working to deliver within this five-year period within each of the price controls areas set by Ofwat, which for this regulatory period are wholesale water, wholesale wastewater and household retail, with non-household retail sitting within our joint venture, Water Plus.
What differentiates us from our peers is our Systems Thinking approach – we operate our entire network as one integrated system rather than as individual assets.
Our strategy, governance and risk management, values and culture also underpin everything that we do.
The work we do delivers a wide range of benefits to a variety of stakeholder groups, creating long-term sustainable value for our shareholders, customers, people, the environment, and communities in our region. Responsible business runs through everything we do, as encapsulated by our business principles. Read more at unitedutilities.com/corporate/responsibility/our-approach
We review progress towards the outcomes we have promised to deliver for customers in this regulatory period.
We measure our performance against operational KPIs as well as financial measures.
These outcomes and KPIs fit within the framework of our three strategic themes.
Wholesale Water
We deliver great water
Water network
plus
Water resources
Wholesale Wastewater
We safely dispose of
wastewater
Wastewater network
plus
Bio- resources
Household Retail
Metering and
connections
Helping vulnerable customers
Billing and collections
The best service to customersOutcomes › Provide great water;
› Dispose of wastewater; and
› Deliver a service customers can rely on.
KPIs › Wholesale ODI composite;
› SIM – qualitative; and
› SIM – quantitative.
At the lowest sustainable costOutcomes › Value for money; and
› Improved efficiency.
KPIs › Totex outperformance;
› Financing outperformance; and
› Household retail cost to serve.
In a responsible mannerOutcomes › Protect and enhance the environment;
› Support local communities; and
› Support employees in a safe workplace.
KPIs › Leakage;
› EA performance assessment; and
› Dow Jones Sustainability Index.
Our vision is to be the best UK water and wastewater company.
For our shareholders › We manage risk prudently and provide an appropriate
return, investing in our assets for growth and sustainability, and providing income through dividends; and
› As many of our shareholders are pension funds and charities, the income that we provide is relied on by millions of people every year.
For our people › We focus on attracting, developing and retaining a
diverse workforce, and ensuring that we look after their health, safety and wellbeing; and
› We have more than 5,000 employees, and 10,000 people are engaged through our supply chain, meaning that we support, directly or indirectly, one in every 150 jobs in the region.
For the community › We invest in the North West’s infrastructure and generate jobs, skills and income
through our supply chain that supports the economy in our region;
› We build partnerships to develop employability skills and help people back to work. We also work with teachers and children to build awareness among the next generation; and
› We actively encourage employee volunteering programmes to help create better places, stronger communities, and accomplish more to address local issues together.
We deliver the outcomes set out in our regulatory contract
We review and measure our progress
Our internal drivers Our outcomes and KPIs
Governance and risk m
anagement
Val
ues
and
cult
ure
Strategy
Systems Thinking
United Utilities 2018.indd 19 6/1/2018 2:06:28 PM

Job Number 1 June 2018 2:04 PM Proof 3 Job Number 1 June 2018 2:04 PM Proof 3
Stock Code: UU. unitedutilities.com/corporate
The work we do delivers a wide range of benefits to a variety of stakeholder groups, creating long-term sustainable value for our shareholders, customers, people, the environment, and communities in our region. Responsible business runs through everything we do, as encapsulated by our business principles. Read more at unitedutilities.com/corporate/responsibility/our-approach
For our shareholders › We manage risk prudently and provide an appropriate
return, investing in our assets for growth and sustainability, and providing income through dividends; and
› As many of our shareholders are pension funds and charities, the income that we provide is relied on by millions of people every year.
For our customers › We focus on innovation and efficiency to provide a great
service and bills have declined in real terms since 2010; and
› We support over 100,000 vulnerable customers through a wide range of assistance schemes, including our sector-leading Priority Services scheme, in our region that struggles with high levels of extreme deprivation.
For our people › We focus on attracting, developing and retaining a
diverse workforce, and ensuring that we look after their health, safety and wellbeing; and
› We have more than 5,000 employees, and 10,000 people are engaged through our supply chain, meaning that we support, directly or indirectly, one in every 150 jobs in the region.
For the environment › We are rated Industry Leading by the Environment
Agency, and we strive to reduce our environmental impact and invest in innovative technology to tackle environmental challenges for future generations; and
› Maintaining and enhancing our reservoirs, catchment land and bathing waters provides a home for wildlife, areas for recreation, and a major pull for tourism.
For the community › We invest in the North West’s infrastructure and generate jobs, skills and income
through our supply chain that supports the economy in our region;
› We build partnerships to develop employability skills and help people back to work. We also work with teachers and children to build awareness among the next generation; and
› We actively encourage employee volunteering programmes to help create better places, stronger communities, and accomplish more to address local issues together.
We create value for a range of stakeholders
20
United Utilities 2018.indd 20 6/1/2018 2:06:40 PM
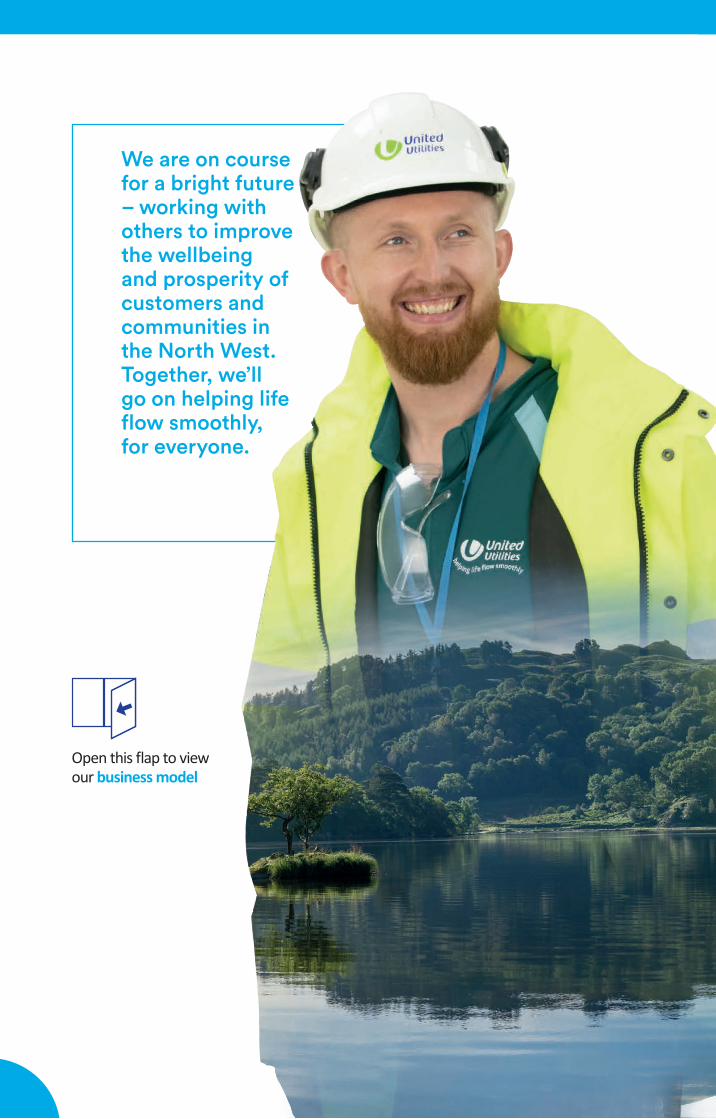
PB 22
United Utilities Group PLC Annual Report and Financial Statements for the year ended 31 March 2018
We are on course for a bright future – working with others to improve the wellbeing and prosperity of customers and communities in the North West. Together, we’ll go on helping life flow smoothly, for everyone.
Open this flap to view our business model
22
United Utilities 2018.indd 21 6/1/2018 2:06:44 PM
22
United Utilities Group PLC Annual Report and Financial Statements for the year ended 31 March 2018
Our business model continued
Key resources
Natural resources
How our natural resources help us to create valueWe hold abstraction licences that permit us to utilise the natural environment in the North West to create value for our business. Raw water is collected from our catchment land and stored in our reservoirs, or is taken directly from rivers and boreholes. This key resource is essential in order for us to continue providing water to our customers’ taps once we have treated it.
We own over 56,000 hectares of land, much of which is catchment land around our reservoirs. As well as providing a source for raw water collection, the way we manage this land helps to protect and improve the natural environment in the North West, enhancing recreational value for the community and providing economic benefits such as underpinning the region’s tourist industry.
Another value-generator can be found in the waste that we collect. Bioresources from wastewater can be processed to generate renewable energy. Our advanced digestion facility at our Davyhulme wastewater treatment works is one of the largest of its type, and we inject biogas from Davyhulme’s wastewater treatment into the national gas network. We recycle waste by supplying treated biosolids to agriculture, providing a valuable resource for farmers as high-quality fertiliser.
We have a responsibility to return water to the environment safely after extensive cleaning processes. Spills from our network can lead to pollution which, depending on the severity, can damage the natural environment and potentially lead to loss of reputation and/or financial penalties.
The best service to customers
Providing the best service to customers goes beyond the provision of water and wastewater services and looks at ways we can add further value. We help customers to save money on their bills through our water-saving initiatives, efforts to reduce leakage, and ‘what not to flush’ campaigns to prevent blockages.
At the lowest sustainable cost
The generation of renewable energy from bioresources helps to save power costs, and we seek to use the lowest cost sources where practicable and innovate to find the most cost-effective methods to treat water and wastewater.
Preparing our network to cope with the extreme weather and potential effects of a changing climate that we are both experiencing and predicting for the future can save repair and recovery costs as well as ensuring a more resilient service for our customers.
In a responsible manner
We continue to invest in the protection and, where appropriate, enhancement of the natural environment of the North West.
See page 31 for how we are contributing to the UN’s Sustainable Development Goal to ‘Ensure access to water and sanitation for all’.
Much of our catchment land is open to the public for use and enjoyment by our communities and the tourists that visit our region.
We consider the natural environment in the management, operation and maintenance of our sites, helping to support rare species and habitats. Wildlife is not only protected, but frequently improved, as a result of our interventions.
Our Sustainable Catchment Management Programme (SCaMP) has shown that we can manage our catchment land to protect and enhance water quality and to provide other benefits for the North West, such as an improving biodiversity.
Our approach to integrated catchments looks at working with others to improve the lakes, rivers and coastal waters where we return treated wastewater in the North West.
Rainfall in our region is greater than in other parts of the country, and therefore short, medium and long-term water supply is not as constrained. Nonetheless, it is in everyone’s interest to make the most of this precious resource. Reducing demand for water is important, and our efforts to encourage and support water efficiency are increasing. We encourage customers to save water, and are working with external partners to integrate our messaging further afield, as well as working to reduce leakage.
The use of bioresources provides an ongoing opportunity to reduce carbon emissions, helping in the global fight against climate change as well as saving money that can be used to add further value by investing in improving the resilience of our assets and/or by reducing bills for customers.
We can make an important contribution to protecting and enhancing the natural environment by using fewer natural resources and reducing our greenhouse gas emissions.
While providing water and wastewater services to the North West, we produce waste materials such as sludges, excavated materials and general office waste, which we are committed to managing in a sustainable way, with less than five per cent of our waste going to landfill.
We are looking at ways to lessen our use of raw materials to reduce our impact on the environment and make us more efficient, and we use recycled products where practicable.
We are working on plans to substantially increase our renewable energy production across this 2015–20 regulatory period, with the main contributor being solar opportunities. This will provide environmental benefits as well as adding value through energy cost savings.
How we manage our natural resourcesOur ISO accredited environment management system covers the whole business and our environmental policy is available on our website at: unitedutilities.com/corporate/responsibility/environment
This policy details our commitments to:
› Manage water resources sustainably and promote water efficiency;
› Improve the North West’s bathing waters through our work and that of others;
› Act to prevent pollution from our operations and inform our customers on the responsible disposal of waste to our sewers;
› Protect and enhance the natural environment and the services it provides;
› Manage our use of natural resources, reduce waste and put it to valuable uses;
› Consider the impacts of climate change on the services we deliver and adapt our business accordingly;
› Reduce our greenhouse gas emissions and generate more renewable energy;
› Aim to observe legal and regulatory requirements and appropriate industry codes of practice; and
› Integrate environmentally responsible behaviour into our operations.
Our regulatory framework shapes the way that we manage natural resources as we are governed by environmental regulators.
Read more about Our marketplace on pages 14 to 16
Protecting and enhancing the environment is one of the promises and key outcomes that we committed to deliver as part of our business plan for the current regulatory period, and features as one of our Business Principles, which can be accessed online at: unitedutilities.com/corporate/about-us/governance/business-principles
22
United Utilities 2018.indd 22 6/1/2018 2:06:45 PM
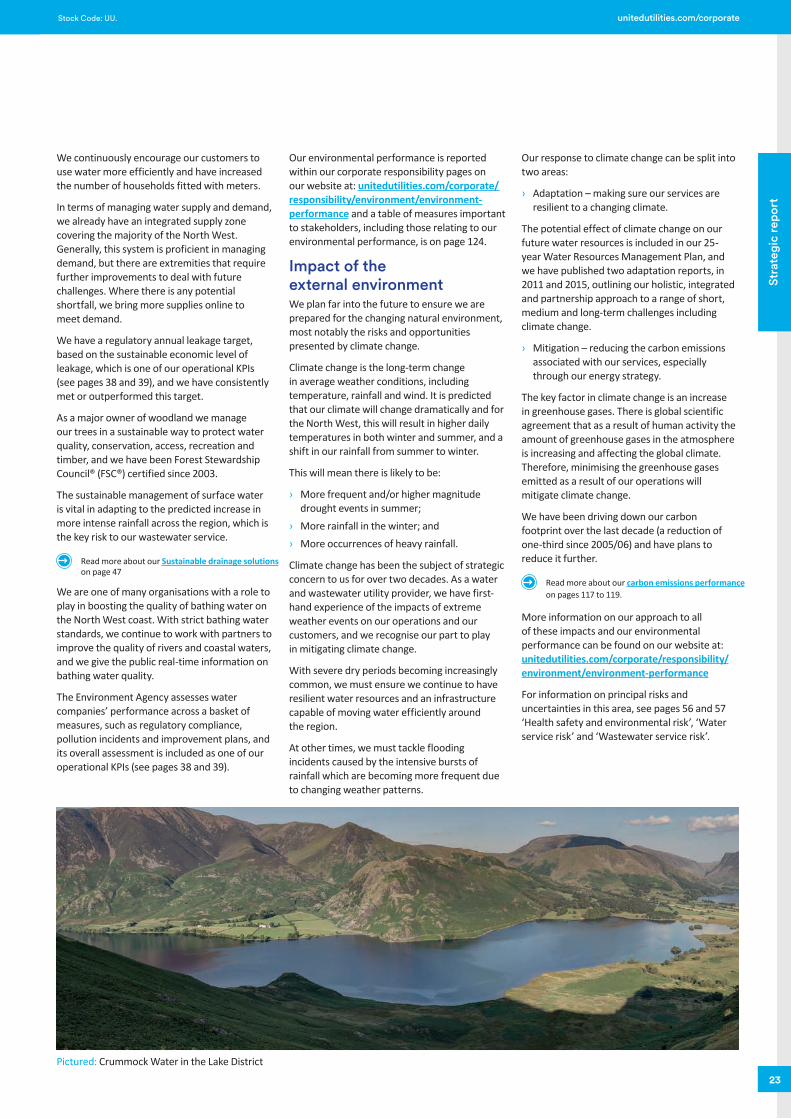
23
Stra
tegi
c re
port
Stock Code: UU. unitedutilities.com/corporate
We continuously encourage our customers to use water more efficiently and have increased the number of households fitted with meters.
In terms of managing water supply and demand, we already have an integrated supply zone covering the majority of the North West. Generally, this system is proficient in managing demand, but there are extremities that require further improvements to deal with future challenges. Where there is any potential shortfall, we bring more supplies online to meet demand.
We have a regulatory annual leakage target, based on the sustainable economic level of leakage, which is one of our operational KPIs (see pages 38 and 39), and we have consistently met or outperformed this target.
As a major owner of woodland we manage our trees in a sustainable way to protect water quality, conservation, access, recreation and timber, and we have been Forest Stewardship Council® (FSC®) certified since 2003.
The sustainable management of surface water is vital in adapting to the predicted increase in more intense rainfall across the region, which is the key risk to our wastewater service.
Read more about our Sustainable drainage solutions on page 47
We are one of many organisations with a role to play in boosting the quality of bathing water on the North West coast. With strict bathing water standards, we continue to work with partners to improve the quality of rivers and coastal waters, and we give the public real-time information on bathing water quality.
The Environment Agency assesses water companies’ performance across a basket of measures, such as regulatory compliance, pollution incidents and improvement plans, and its overall assessment is included as one of our operational KPIs (see pages 38 and 39).
Our environmental performance is reported within our corporate responsibility pages on our website at: unitedutilities.com/corporate/responsibility/environment/environment-performance and a table of measures important to stakeholders, including those relating to our environmental performance, is on page 124.
Impact of the external environmentWe plan far into the future to ensure we are prepared for the changing natural environment, most notably the risks and opportunities presented by climate change.
Climate change is the long-term change in average weather conditions, including temperature, rainfall and wind. It is predicted that our climate will change dramatically and for the North West, this will result in higher daily temperatures in both winter and summer, and a shift in our rainfall from summer to winter.
This will mean there is likely to be:
› More frequent and/or higher magnitude drought events in summer;
› More rainfall in the winter; and › More occurrences of heavy rainfall.
Climate change has been the subject of strategic concern to us for over two decades. As a water and wastewater utility provider, we have first-hand experience of the impacts of extreme weather events on our operations and our customers, and we recognise our part to play in mitigating climate change.
With severe dry periods becoming increasingly common, we must ensure we continue to have resilient water resources and an infrastructure capable of moving water efficiently around the region.
At other times, we must tackle flooding incidents caused by the intensive bursts of rainfall which are becoming more frequent due to changing weather patterns.
Our response to climate change can be split into two areas:
› Adaptation – making sure our services are resilient to a changing climate.
The potential effect of climate change on our future water resources is included in our 25-year Water Resources Management Plan, and we have published two adaptation reports, in 2011 and 2015, outlining our holistic, integrated and partnership approach to a range of short, medium and long-term challenges including climate change.
› Mitigation – reducing the carbon emissions associated with our services, especially through our energy strategy.
The key factor in climate change is an increase in greenhouse gases. There is global scientific agreement that as a result of human activity the amount of greenhouse gases in the atmosphere is increasing and affecting the global climate. Therefore, minimising the greenhouse gases emitted as a result of our operations will mitigate climate change.
We have been driving down our carbon footprint over the last decade (a reduction of one-third since 2005/06) and have plans to reduce it further.
Read more about our carbon emissions performance on pages 117 to 119.
More information on our approach to all of these impacts and our environmental performance can be found on our website at: unitedutilities.com/corporate/responsibility/environment/environment-performance
For information on principal risks and uncertainties in this area, see pages 56 and 57 ‘Health safety and environmental risk’, ‘Water service risk’ and ‘Wastewater service risk’.
Pictured: Crummock Water in the Lake District
United Utilities 2018.indd 23 6/1/2018 2:06:49 PM
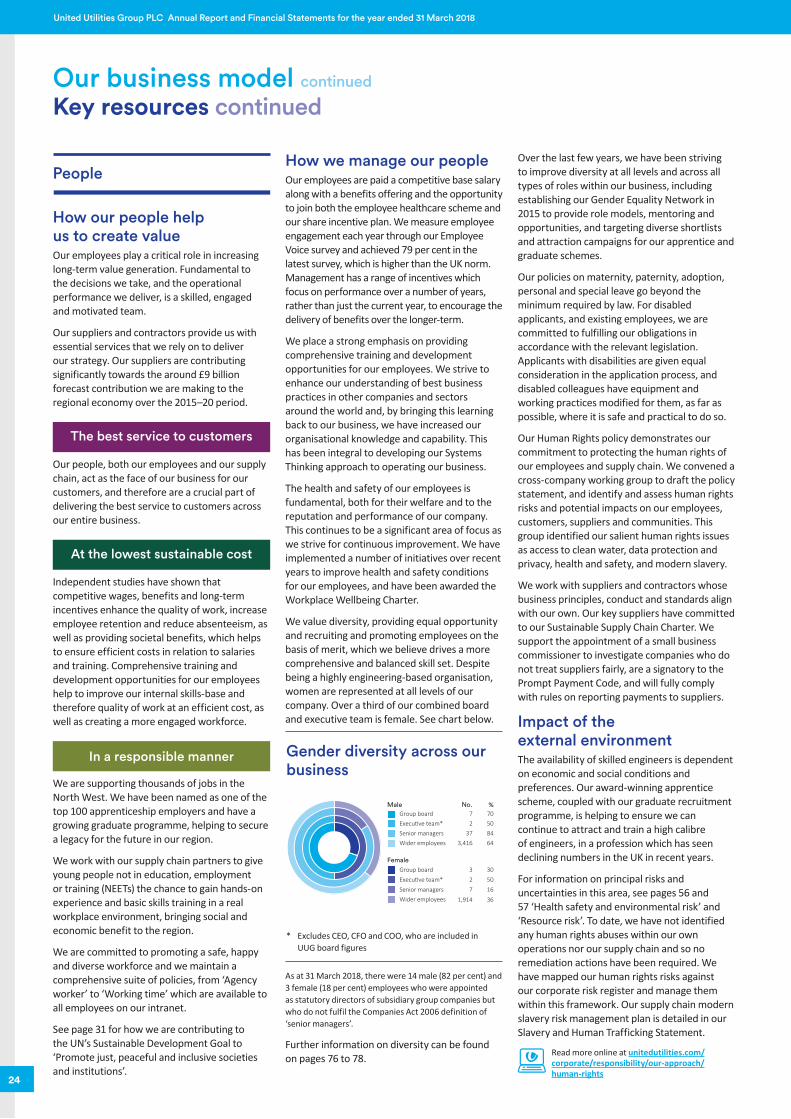
Job Number 1 June 2018 2:04 PM Proof 3 Job Number 1 June 2018 2:04 PM Proof 3
24
United Utilities Group PLC Annual Report and Financial Statements for the year ended 31 March 2018
People
How our people help us to create valueOur employees play a critical role in increasing long-term value generation. Fundamental to the decisions we take, and the operational performance we deliver, is a skilled, engaged and motivated team.
Our suppliers and contractors provide us with essential services that we rely on to deliver our strategy. Our suppliers are contributing significantly towards the around £9 billion forecast contribution we are making to the regional economy over the 2015–20 period.
The best service to customers
Our people, both our employees and our supply chain, act as the face of our business for our customers, and therefore are a crucial part of delivering the best service to customers across our entire business.
At the lowest sustainable cost
Independent studies have shown that competitive wages, benefits and long-term incentives enhance the quality of work, increase employee retention and reduce absenteeism, as well as providing societal benefits, which helps to ensure efficient costs in relation to salaries and training. Comprehensive training and development opportunities for our employees help to improve our internal skills-base and therefore quality of work at an efficient cost, as well as creating a more engaged workforce.
In a responsible manner
We are supporting thousands of jobs in the North West. We have been named as one of the top 100 apprenticeship employers and have a growing graduate programme, helping to secure a legacy for the future in our region.
We work with our supply chain partners to give young people not in education, employment or training (NEETs) the chance to gain hands-on experience and basic skills training in a real workplace environment, bringing social and economic benefit to the region.
We are committed to promoting a safe, happy and diverse workforce and we maintain a comprehensive suite of policies, from ‘Agency worker’ to ‘Working time’ which are available to all employees on our intranet.
See page 31 for how we are contributing to the UN’s Sustainable Development Goal to ‘Promote just, peaceful and inclusive societies and institutions’.
How we manage our peopleOur employees are paid a competitive base salary along with a benefits offering and the opportunity to join both the employee healthcare scheme and our share incentive plan. We measure employee engagement each year through our Employee Voice survey and achieved 79 per cent in the latest survey, which is higher than the UK norm. Management has a range of incentives which focus on performance over a number of years, rather than just the current year, to encourage the delivery of benefits over the longer-term.
We place a strong emphasis on providing comprehensive training and development opportunities for our employees. We strive to enhance our understanding of best business practices in other companies and sectors around the world and, by bringing this learning back to our business, we have increased our organisational knowledge and capability. This has been integral to developing our Systems Thinking approach to operating our business.
The health and safety of our employees is fundamental, both for their welfare and to the reputation and performance of our company. This continues to be a significant area of focus as we strive for continuous improvement. We have implemented a number of initiatives over recent years to improve health and safety conditions for our employees, and have been awarded the Workplace Wellbeing Charter.
We value diversity, providing equal opportunity and recruiting and promoting employees on the basis of merit, which we believe drives a more comprehensive and balanced skill set. Despite being a highly engineering-based organisation, women are represented at all levels of our company. Over a third of our combined board and executive team is female. See chart below.
Male No.
Female
Group board 7Execu�ve team* 2Senior managers 37Wider employees 3,416
Group board 3Execu�ve team* 2Senior managers 7Wider employees 1,914
%70508464
305016
36
* Excludes CEO, CFO and COO, who are included in UUG board figures
Gender diversity across our business
As at 31 March 2018, there were 14 male (82 per cent) and 3 female (18 per cent) employees who were appointed as statutory directors of subsidiary group companies but who do not fulfil the Companies Act 2006 definition of ‘senior managers’.
Further information on diversity can be found on pages 76 to 78.
Over the last few years, we have been striving to improve diversity at all levels and across all types of roles within our business, including establishing our Gender Equality Network in 2015 to provide role models, mentoring and opportunities, and targeting diverse shortlists and attraction campaigns for our apprentice and graduate schemes.
Our policies on maternity, paternity, adoption, personal and special leave go beyond the minimum required by law. For disabled applicants, and existing employees, we are committed to fulfilling our obligations in accordance with the relevant legislation. Applicants with disabilities are given equal consideration in the application process, and disabled colleagues have equipment and working practices modified for them, as far as possible, where it is safe and practical to do so.
Our Human Rights policy demonstrates our commitment to protecting the human rights of our employees and supply chain. We convened a cross-company working group to draft the policy statement, and identify and assess human rights risks and potential impacts on our employees, customers, suppliers and communities. This group identified our salient human rights issues as access to clean water, data protection and privacy, health and safety, and modern slavery.
We work with suppliers and contractors whose business principles, conduct and standards align with our own. Our key suppliers have committed to our Sustainable Supply Chain Charter. We support the appointment of a small business commissioner to investigate companies who do not treat suppliers fairly, are a signatory to the Prompt Payment Code, and will fully comply with rules on reporting payments to suppliers.
Impact of the external environmentThe availability of skilled engineers is dependent on economic and social conditions and preferences. Our award-winning apprentice scheme, coupled with our graduate recruitment programme, is helping to ensure we can continue to attract and train a high calibre of engineers, in a profession which has seen declining numbers in the UK in recent years.
For information on principal risks and uncertainties in this area, see pages 56 and 57 ‘Health safety and environmental risk’ and ‘Resource risk’. To date, we have not identified any human rights abuses within our own operations nor our supply chain and so no remediation actions have been required. We have mapped our human rights risks against our corporate risk register and manage them within this framework. Our supply chain modern slavery risk management plan is detailed in our Slavery and Human Trafficking Statement.
Read more online at unitedutilities.com/corporate/responsibility/our-approach/human-rights
Our business model continued
Key resources continued
Read more online at unitedutilities.com/corporate/responsibility/our-approach/human-rights
United Utilities 2018.indd 24 6/1/2018 2:06:50 PM
Job Number 1 June 2018 2:04 PM Proof 3 Job Number 1 June 2018 2:04 PM Proof 3
25
Stra
tegi
c re
port
Stock Code: UU. unitedutilities.com/corporate
Assets
How our assets help us to create valueMany of our assets are long-term in nature, for example our impounding reservoirs have a useful economic life of around 200 years. We earn a return, received through revenues, based on a regulatory measure of the value of our capital asset base, Regulatory Capital Value (RCV). This mechanism allows us to share the cost of building these long-term assets between the generations that will benefit from the use of those assets.
Our RCV is currently just over £11 billion, however the gross replacement cost of our fixed assets (including all our reservoirs, treatment works and pipes), i.e. the estimated amount it would cost for another company to build similar assets and networks, is around £90 billion. We expect to invest around £3.8 billion across 2015–20 and to continue with a substantial investment programme for the foreseeable future in order to meet more stringent environmental standards and to maintain and improve the current standards of our assets and services.
We manage our assets in a holistic way that seeks to minimise whole-life costs, which helps us to deliver efficient totex against our regulatory allowance.
The best service to customers
Since privatisation in 1989, total capital investment of over £15 billion has provided substantial benefits to our customers, including reduced supply interruptions and improved water quality.
At the lowest sustainable cost
By carefully reviewing our potential capital projects, and considering the most efficient long-term solutions in terms of the lowest whole-life cost, we can save future operating costs, help to reduce future customer bills, and work towards being able to operate in a more sustainable manner. Disciplined investment, along with RPI inflation, also grows our RCV, increasing future revenues.
In a responsible manner
Effective capital investment helps us to meet increasingly stringent environmental standards, which helps to improve the region’s environment and protect indigenous wildlife, as well as contributing to the North West’s economy through job creation, both within our company and through our supply chain.
How we manage our assetsWhen deciding on our investment strategy we need to be mindful of the impact on our customers’ bills and this is why, for example, we are spreading some of the environmental spend required by European legislation over the next 15 years.
It is important that we have the right systems and procedures in place in order to monitor and control the assets efficiently and effectively within our network. Embracing innovation in our asset configuration and work processes can help to make our future service better, faster and cheaper.
See page 31 for how we are contributing to the UN’s Sustainable Development Goal to ‘Build resilient infrastructure, promote sustainable industrialisation and foster innovation’.
We are committed to managing and operating our water, wastewater and energy assets to ensure we continue to provide a water and wastewater service that helps life flow smoothly for our customers, regulators and other stakeholders.
We have an asset management policy that is available to all employees on our intranet that details how we will operate, maintain and invest in our assets with the aim of delivering our customer promises and their associated outcomes, as agreed at the price review for the current regulatory period.
Impact of the external environmentWe anticipate an increase in the North West’s population of around 900,000 by 2045 (more than the population of a large city such as Liverpool).
We are planning to ensure that our services and supporting infrastructure are able to meet the needs of this growing population, which is also expected to include a higher proportion of older people. We must ensure we are able to meet increased demand on both our water and wastewater networks as the regional population is expected to increase.
We must build increased resilience into all of our assets in order to cope with the anticipated impacts of a changing climate. Our assets must be prepared to meet the changing and increasingly challenging environmental constraints that we have to comply with in regard to areas such as water abstraction (for example our West Cumbria pipeline project, see page 33), increasingly stringent wastewater treatment levels, and improvements to flood defences as a result of increasing extreme weather conditions.
There is need for a careful balance between preparing for future challenges and maintaining affordable bills by phasing the work and cost. We must strike a balance between the various interests of customers and our many regulators, as well as political and societal interest.
A phased, long-term approach to address all of these concerns ensures that the necessary work can be delivered without placing too much pressure on customer bills.
Technology and innovation presents an opportunity; for example the new wastewater treatment process, Nereda, has transformed this area, our use of robots in managing the water network has driven greater efficiency and improved customer service, and we are using drones to inspect assets with restricted access to improve health and safety as well as reduce time and costs.
Read more about Innovation across our entire business on page 29
We have been utilising technology within our energy self-generation, for example our Davyhulme sludge recycling centre employs a groundbreaking configuration of thermal hydrolysis to maximise energy generation from sludge; and we built Europe’s largest floating solar array system on our reservoir in Godley, Greater Manchester.
Advances in technology can be used to help deliver improvements in the quality and/or cost of our service. Embracing innovation, using modern technology or techniques, is at the heart of how we do business. Our Systems Thinking approach to operating our network is a key example of this.
Technological advances can give rise to greater risks as well as presenting opportunities. Cybercrime has been on the increase in recent years and, as the holder of customer information, is a threat we take very seriously.
For information on principal risks and uncertainties in this area, see pages 56 and 57 ‘Security risk’, ‘Water service risk’, ‘Wastewater service risk’, ‘Compliance risk’, and ‘Supply chain and programme delivery’.
United Utilities 2018.indd 25 6/1/2018 2:06:50 PM
Job Number 1 June 2018 2:04 PM Proof 3 Job Number 1 June 2018 2:04 PM Proof 3
26
United Utilities Group PLC Annual Report and Financial Statements for the year ended 31 March 2018
Financing
How our financing helps us to create valueWe aim to maintain a robust and sustainable capital structure, balancing both equity and debt, to achieve a strong investment grade credit rating, thus enabling efficient access to the debt capital markets across the economic cycle.
We adopt a prudent approach to managing financial risks, which helps to ensure financial resilience in the long-term. We have a long track record of aligning our financial risk management with the regulatory model through inflation and interest rate management policies, which helps us manage uncertainty in volatile market conditions and when faced with changes in Ofwat’s approach to setting the cost of debt at each price review.
The best service to customers
Customers benefit from reductions to bills and lower finance costs contribute to our ability to deliver this.
Customers also appreciate receiving the benefit of service improvements earlier rather than later, and the ability to efficiently finance our business helps enable us to deliver this.
At the lowest sustainable cost
Locking in long-term debt and swaps at good relative value can help keep our finance costs low and provides the potential to outperform the industry-allowed cost of debt.
The long-term average life of our debt portfolio, our strong and stable investment grade credit rating, robust hedging policies, and maintaining access to a broad range of sources of finance, all help to ensure that our ability to efficiently finance our business is sustainable, and to reduce our exposure to the risk of fluctuating market conditions and changes in the regulatory environment.
In a responsible manner
As a FTSE 100 listed company, we have open and transparent reporting around all of our equity and debt financing arrangements.
We do not utilise offshore financing vehicles, and we maintain an appropriate level of gearing, measured as net debt to Regulatory Capital Value (RCV), broadly in line with regulatory assumptions, which supports a robust and sustainable capital structure.
How we manage our financingWe have proactive programmes of engagement with equity and credit investors, which allows us to hear their views, which we then consider in our strategic planning, and also to update them on developments in our business.
As part of our planning process, we review key credit ratios to ensure these meet required thresholds in order to satisfy the board’s ratings targets. Performance against business plan credit ratios is regularly monitored, and we maintain close contact with the credit rating agencies to understand the methodology and any changes. Gearing is maintained within our target range of 55 per cent to 65 per cent, which broadly mirrors regulatory assumptions.
Issuing new debt is important as our capital investment is largely financed through a mix of debt and cash generated from our operations. We maintain access to a broad and diverse range of sources of finance, in a number of markets, across which we seek best relative value when issuing new debt. We manage relationships with a diverse range of banks, and we refresh our European Medium Term Note (EMTN) Programme annually to allow for efficient issuing of debt under pre-agreed contractual terms.
We aim to avoid a concentration of refinancing in any one year, and tend to fund long-term where possible, with the average life of our term debt being just under 20 years. We regularly review liquidity forecasts against our policy of having available resources to cover the next 15–24 months of projected cash flows. This helps ensure forward funding requirements are met.
We have clearly articulated financial risk management policies, covering credit, liquidity, interest rate, and currency risk, and we responded proactively to Ofwat’s intention to transition from RPI to CPIH inflation and to index the portion of new debt in calculating the cost of debt in the next regulatory period.
We have conducted an extensive review of our inflation and interest rate hedging policies and amended these to align with the new regulatory model and continue to maintain the most appropriate financial risk management. We will no longer substantively fix all of our nominal debt at the start of each regulatory period, but maintain a rolling 10-year fixing profile on nominal debt to mirror Ofwat’s assumed 70 per cent embedded and 30 per cent new debt split (with debt indexation on the new debt portion). We aim to retain around half of our net debt in index-linked form (where it is economic to do so), by issuing index-linked debt and/or swapping a portion of nominal debt. This is expected to remain mostly in RPI-linked form until CPI/CPIH debt and swaps become available in sufficient size at an economic cost.
We are the sector leader in CPI inflation-linked financing, having issued the first ever CPI-linked notes by a UK utility, and we have continued to build the CPI-linkage in our debt portfolio where good relative value opportunities can be found.
Read more about our financial risk management policies on pages 160 to 166, and about the competitive advantage this provides on page 13.
Impact of the external environmentChanges in economic conditions and financial markets, such as inflation and interest rates, can influence our ability to create value through financing. While these are outside of our direct control, we can mitigate some of the potential adverse impacts associated with market movements, such as on inflation and interest rates, through our financial hedging strategies. In this way we can create value by reducing the risks to which we are exposed.
Interest rates have remained below the long-term trend and we have benefited from this as we drew down, or raised, over £600 million of new debt in 2017/18. Comparatively low interest rates have been beneficial to our future cost of debt as we continue with our nominal interest rate hedging strategy.
RPI inflation has continued to rise during 2017/18, briefly reaching levels as high as 4.1 per cent, but returning to 3.3 per cent at March 2018, compared with 3.1 per cent at March 2017. However, it has been lower over recent years than levels it has reached in the last 10 years. The prices we charge our customers (which drive our revenue) and our regulatory capital value (RCV) are linked to RPI inflation for the current regulatory period, therefore lower RPI over recent years has meant slightly lower growth on these measures. However, as a result of our large quantity of index-linked debt, our finance costs decrease as inflation falls, providing a partial economic offset to revenue.
Our pension liabilities are linked to RPI inflation, and have been hedged by a combination of a market hedge and the inflation funding mechanism (IFM), whereby company contributions are flexed for movements in RPI. We expect the schemes to increase the market hedge for inflation in line with a progressive de-risking strategy, with a corresponding reduction in the IFM.
Market sentiment can also have an impact on our financing. While much of this can be outside of our direct control, there are ways in which we are able to help inform and influence public opinion.
For information on principal risks and uncertainties in this area, see pages 56 and 57 ‘Financial risk’.
Our business model continued
Key resources continued
United Utilities 2018.indd 26 6/1/2018 2:06:51 PM
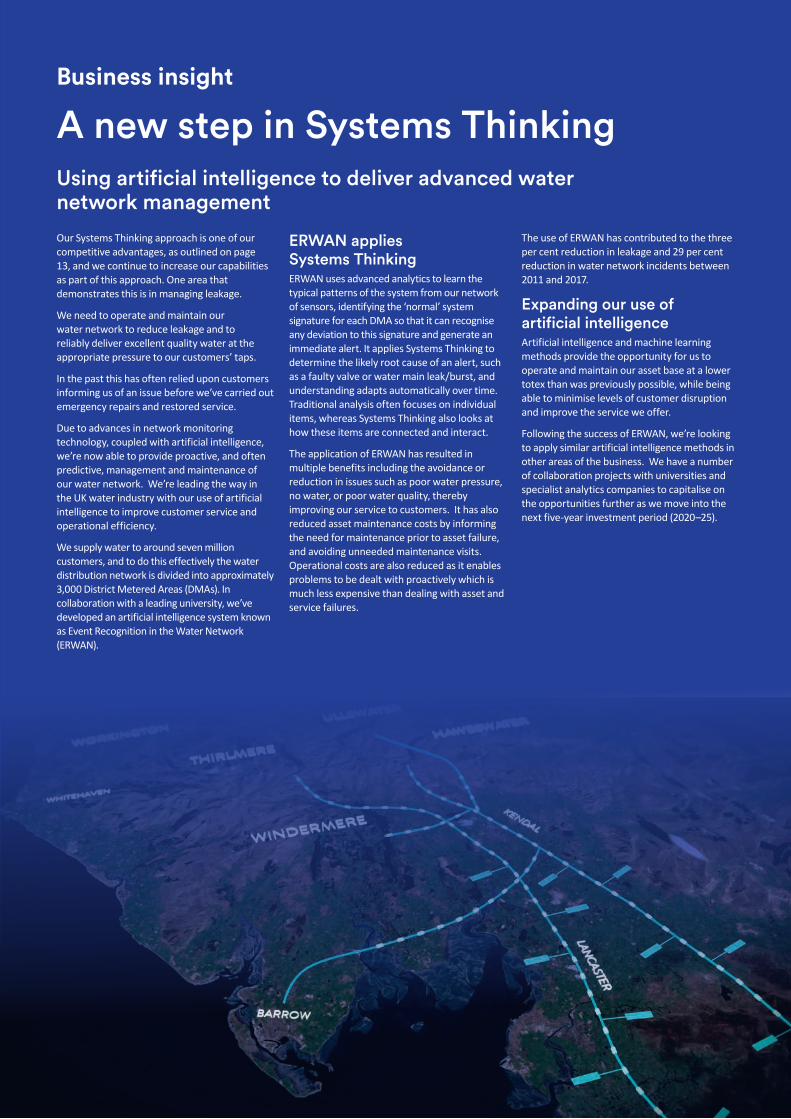
Job Number 1 June 2018 2:04 PM Proof 3 Job Number 1 June 2018 2:04 PM Proof 3
27
Stra
tegi
c re
port
Stock Code: UU. unitedutilities.com/corporate
Business insight
A new step in Systems ThinkingUsing artificial intelligence to deliver advanced water network management Our Systems Thinking approach is one of our competitive advantages, as outlined on page 13, and we continue to increase our capabilities as part of this approach. One area that demonstrates this is in managing leakage.
We need to operate and maintain our water network to reduce leakage and to reliably deliver excellent quality water at the appropriate pressure to our customers’ taps.
In the past this has often relied upon customers informing us of an issue before we’ve carried out emergency repairs and restored service.
Due to advances in network monitoring technology, coupled with artificial intelligence, we’re now able to provide proactive, and often predictive, management and maintenance of our water network. We’re leading the way in the UK water industry with our use of artificial intelligence to improve customer service and operational efficiency.
We supply water to around seven million customers, and to do this effectively the water distribution network is divided into approximately 3,000 District Metered Areas (DMAs). In collaboration with a leading university, we’ve developed an artificial intelligence system known as Event Recognition in the Water Network (ERWAN).
ERWAN applies Systems ThinkingERWAN uses advanced analytics to learn the typical patterns of the system from our network of sensors, identifying the ‘normal’ system signature for each DMA so that it can recognise any deviation to this signature and generate an immediate alert. It applies Systems Thinking to determine the likely root cause of an alert, such as a faulty valve or water main leak/burst, and understanding adapts automatically over time. Traditional analysis often focuses on individual items, whereas Systems Thinking also looks at how these items are connected and interact.
The application of ERWAN has resulted in multiple benefits including the avoidance or reduction in issues such as poor water pressure, no water, or poor water quality, thereby improving our service to customers. It has also reduced asset maintenance costs by informing the need for maintenance prior to asset failure, and avoiding unneeded maintenance visits. Operational costs are also reduced as it enables problems to be dealt with proactively which is much less expensive than dealing with asset and service failures.
The use of ERWAN has contributed to the three per cent reduction in leakage and 29 per cent reduction in water network incidents between 2011 and 2017.
Expanding our use of artificial intelligenceArtificial intelligence and machine learning methods provide the opportunity for us to operate and maintain our asset base at a lower totex than was previously possible, while being able to minimise levels of customer disruption and improve the service we offer.
Following the success of ERWAN, we’re looking to apply similar artificial intelligence methods in other areas of the business. We have a number of collaboration projects with universities and specialist analytics companies to capitalise on the opportunities further as we move into the next five-year investment period (2020–25).
United Utilities 2018.indd 27 6/1/2018 2:06:51 PM
Job Number 1 June 2018 2:04 PM Proof 3 Job Number 1 June 2018 2:04 PM Proof 3
28
United Utilities Group PLC Annual Report and Financial Statements for the year ended 31 March 2018
Governance
Good governance lies at the heart of all successful organisations. We firmly believe that it leads to better management decisions as well as helping to avoid exposure to potential risks and improving corporate resilience.
We strive to operate in a manner that reflects the highest standards of corporate governance, accountability and transparency. Our company structure and governance standards are designed to ensure that our board continues to observe sound and prudent governance in compliance with the principles of the UK Corporate Governance Code. Our audit committee has oversight of the policies and procedures in relation to anti-bribery and fraud.
Read more on page 89
We have an anti-bribery policy that all our employees must follow, and processes in place to monitor compliance with the policy. This policy is available to view online at unitedutilities.com/corporate/about-us/governance
We also operate an independently provided, confidential reporting telephone helpline and web portal for employees to raise matters of concern in relation to fraud, dishonesty, corruption, theft, security and bribery, and all claims are fully investigated.
Our employees and representatives of our suppliers must also comply with our sustainable supply chain charter, which explains that we will not tolerate corruption, bribery and anti-competitive actions and we expect our suppliers to comply with applicable laws and regulations and in particular never to offer or accept any undue payment or other consideration, directly or indirectly, for the purposes of inducing any person or entity to act contrary to their prescribed duties.
Prudent risk managementAs you would expect of the provider of an essential service, we adopt a prudent approach to managing risks to our business. That being said, accepting some level of risk is a normal consequence for a commercial organisation being run in a cost-effective way.
Given the complex legal and regulatory environment within which we operate, we are exposed to a range of risks.
An important risk to our business is ensuring that we get the constituent elements of our five-yearly business plans correct to ensure our financeability, as well as the outcomes we will deliver for customers, and that we provide sufficient information to Ofwat to ensure we receive a final determination that covers these, as we are bound by these plans for the following five-year period with limited opportunity to change them. Failure to meet the terms of our current 2015–20 regulatory contract is a risk.
We face risks in relation to potential future changes in legislation or regulation. This includes the anticipated changes for the 2020–25 regulatory period, as outlined on pages 15 to 16, and increased political scrutiny with discussion of the potential Renationalisation of the water industry, as well as potential changes further into the future.
We also face risks such as possible non-compliance with existing laws or regulations, and from environmental impacts such as climate change.
See pages 56 and 57 for more details on what we consider to be our principal risks and uncertainties.
Values and culture
We are committed to delivering our services in a responsible way and our approach to responsible business practice is outlined in our Business Principles document, which is available on our website at: unitedutilities.com/corporate/about-us/governance/business-principles. More information on the board’s approach to values and culture can be found on pages 72 to 73. Also see page 31 for how we are contributing to the UN’s Sustainable Development Goal to ‘Promote just, peaceful and inclusive societies and institutions’.
Our culture is embodied in our three core values of customer focus, integrity and innovation, and we operate with these at all levels of our business. These core values are interrelated – innovating to improve our services and acting with integrity in the way we conduct our activities helps us to continually improve customer service.
Customer focusWe have instilled a customer-centric approach right across our organisation, and this evolving culture has been a key driver of the major improvements in customer service we have been able to deliver.
Putting customers at the heart of what we do has also helped deliver benefits for shareholders and wider stakeholders.
IntegrityActing with integrity, both at board level and as a company, underpins our approach to responsible business and building trust.
We actively encourage our employees to express their opinions and ideas through various engagement and social channels, such as our annual ‘Employee Voice’ survey, through news articles on our intranet, and on our social media collaboration tool ‘Yammer’.
InnovationInnovation is a critical enabler in creating value, helping us to be ahead of our competitors, and we welcome ideas on how we can innovate across all levels of our business and from wider industries across the world.
Our employees are given the opportunity to develop and present their ideas to senior management, facilitating and encouraging an innovative environment. Utilising innovation from our suppliers is part of our supply chain approach, which provides another avenue to benefit from new ideas and technologies.
The business insight on the following page demonstrates a few of the ways that we innovate across the business.
Our business model continued
Internal environment
United Utilities 2018.indd 28 6/1/2018 2:06:53 PM
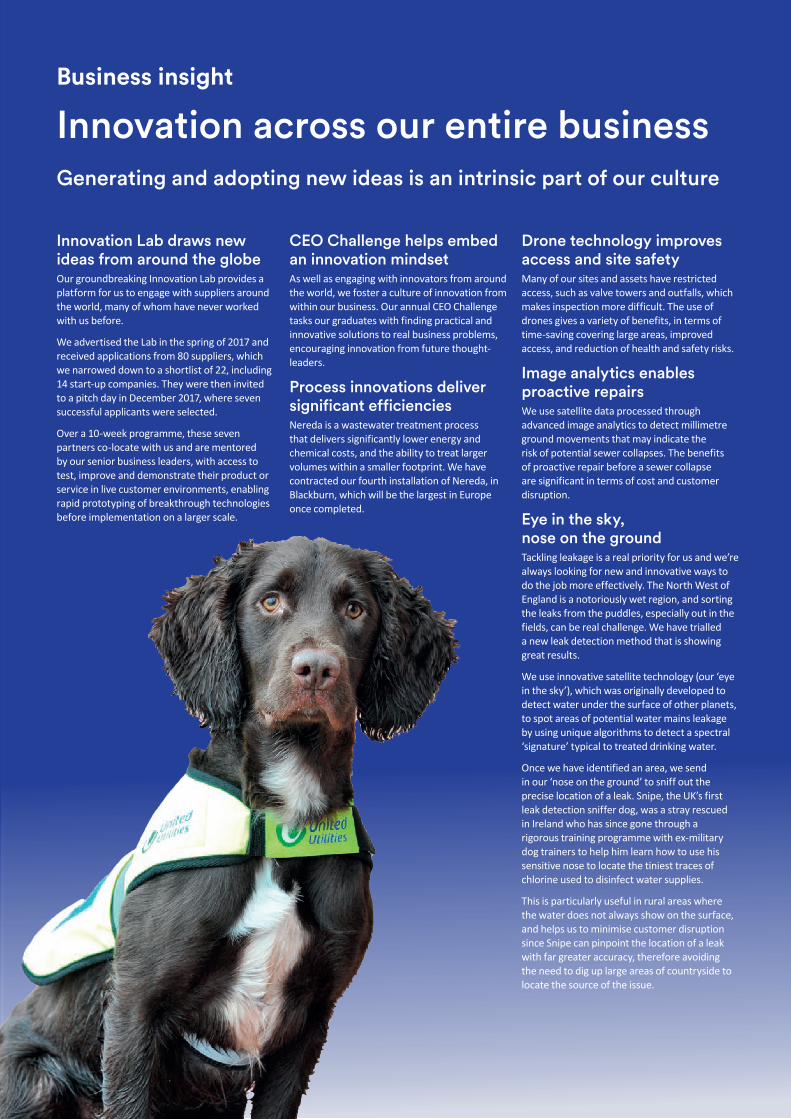
Job Number 1 June 2018 2:04 PM Proof 3 Job Number 1 June 2018 2:04 PM Proof 3
Business insight
Innovation across our entire businessGenerating and adopting new ideas is an intrinsic part of our culture
Innovation Lab draws new ideas from around the globeOur groundbreaking Innovation Lab provides a platform for us to engage with suppliers around the world, many of whom have never worked with us before.
We advertised the Lab in the spring of 2017 and received applications from 80 suppliers, which we narrowed down to a shortlist of 22, including 14 start-up companies. They were then invited to a pitch day in December 2017, where seven successful applicants were selected.
Over a 10-week programme, these seven partners co-locate with us and are mentored by our senior business leaders, with access to test, improve and demonstrate their product or service in live customer environments, enabling rapid prototyping of breakthrough technologies before implementation on a larger scale.
CEO Challenge helps embed an innovation mindsetAs well as engaging with innovators from around the world, we foster a culture of innovation from within our business. Our annual CEO Challenge tasks our graduates with finding practical and innovative solutions to real business problems, encouraging innovation from future thought-leaders.
Process innovations deliver significant efficienciesNereda is a wastewater treatment process that delivers significantly lower energy and chemical costs, and the ability to treat larger volumes within a smaller footprint. We have contracted our fourth installation of Nereda, in Blackburn, which will be the largest in Europe once completed.
Drone technology improves access and site safetyMany of our sites and assets have restricted access, such as valve towers and outfalls, which makes inspection more difficult. The use of drones gives a variety of benefits, in terms of time-saving covering large areas, improved access, and reduction of health and safety risks.
Image analytics enables proactive repairsWe use satellite data processed through advanced image analytics to detect millimetre ground movements that may indicate the risk of potential sewer collapses. The benefits of proactive repair before a sewer collapse are significant in terms of cost and customer disruption.
Eye in the sky, nose on the groundTackling leakage is a real priority for us and we’re always looking for new and innovative ways to do the job more effectively. The North West of England is a notoriously wet region, and sorting the leaks from the puddles, especially out in the fields, can be real challenge. We have trialled a new leak detection method that is showing great results.
We use innovative satellite technology (our ‘eye in the sky’), which was originally developed to detect water under the surface of other planets, to spot areas of potential water mains leakage by using unique algorithms to detect a spectral ‘signature’ typical to treated drinking water.
Once we have identified an area, we send in our ‘nose on the ground’ to sniff out the precise location of a leak. Snipe, the UK’s first leak detection sniffer dog, was a stray rescued in Ireland who has since gone through a rigorous training programme with ex-military dog trainers to help him learn how to use his sensitive nose to locate the tiniest traces of chlorine used to disinfect water supplies.
This is particularly useful in rural areas where the water does not always show on the surface, and helps us to minimise customer disruption since Snipe can pinpoint the location of a leak with far greater accuracy, therefore avoiding the need to dig up large areas of countryside to locate the source of the issue.
United Utilities 2018.indd 29 6/1/2018 2:06:55 PM
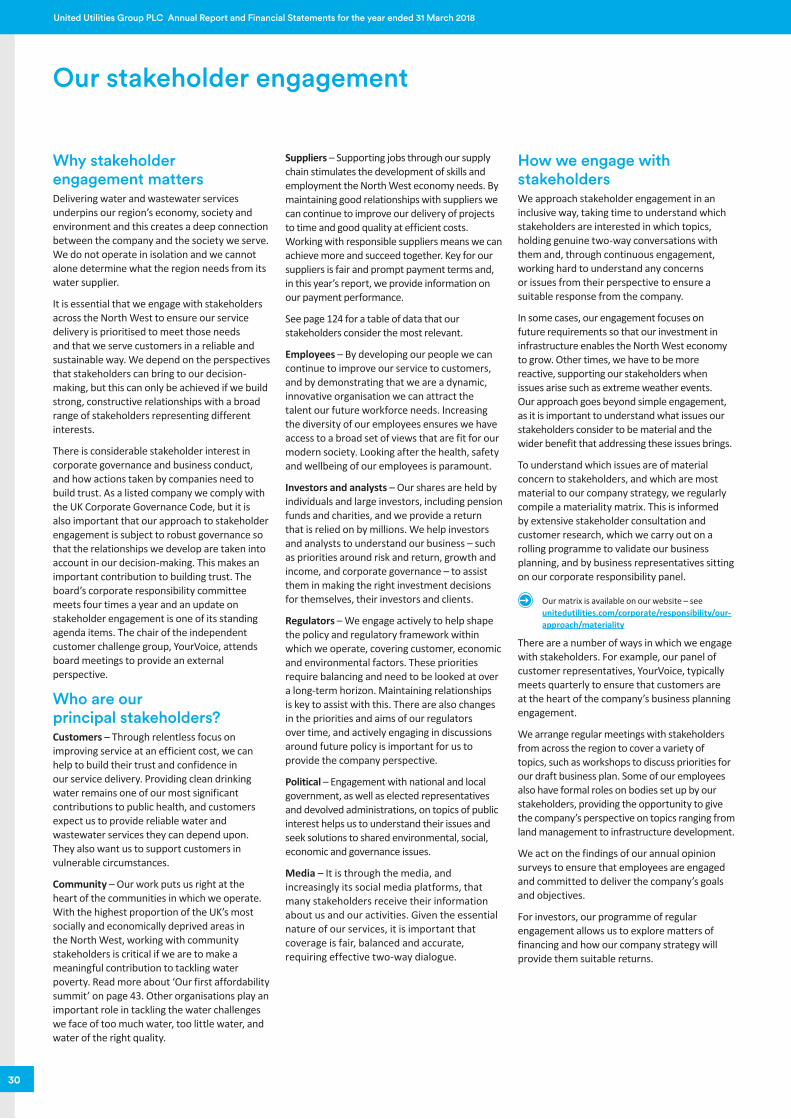
Job Number 1 June 2018 2:04 PM Proof 3 Job Number 1 June 2018 2:04 PM Proof 3
30
United Utilities Group PLC Annual Report and Financial Statements for the year ended 31 March 2018
Our stakeholder engagement
Why stakeholder engagement mattersDelivering water and wastewater services underpins our region’s economy, society and environment and this creates a deep connection between the company and the society we serve. We do not operate in isolation and we cannot alone determine what the region needs from its water supplier.
It is essential that we engage with stakeholders across the North West to ensure our service delivery is prioritised to meet those needs and that we serve customers in a reliable and sustainable way. We depend on the perspectives that stakeholders can bring to our decision-making, but this can only be achieved if we build strong, constructive relationships with a broad range of stakeholders representing different interests.
There is considerable stakeholder interest in corporate governance and business conduct, and how actions taken by companies need to build trust. As a listed company we comply with the UK Corporate Governance Code, but it is also important that our approach to stakeholder engagement is subject to robust governance so that the relationships we develop are taken into account in our decision-making. This makes an important contribution to building trust. The board’s corporate responsibility committee meets four times a year and an update on stakeholder engagement is one of its standing agenda items. The chair of the independent customer challenge group, YourVoice, attends board meetings to provide an external perspective.
Who are our principal stakeholders?Customers – Through relentless focus on improving service at an efficient cost, we can help to build their trust and confidence in our service delivery. Providing clean drinking water remains one of our most significant contributions to public health, and customers expect us to provide reliable water and wastewater services they can depend upon. They also want us to support customers in vulnerable circumstances.
Community – Our work puts us right at the heart of the communities in which we operate. With the highest proportion of the UK’s most socially and economically deprived areas in the North West, working with community stakeholders is critical if we are to make a meaningful contribution to tackling water poverty. Read more about ʻOur first affordability summitʼ on page 43. Other organisations play an important role in tackling the water challenges we face of too much water, too little water, and water of the right quality.
Suppliers – Supporting jobs through our supply chain stimulates the development of skills and employment the North West economy needs. By maintaining good relationships with suppliers we can continue to improve our delivery of projects to time and good quality at efficient costs. Working with responsible suppliers means we can achieve more and succeed together. Key for our suppliers is fair and prompt payment terms and, in this year’s report, we provide information on our payment performance.
See page 124 for a table of data that our stakeholders consider the most relevant.
Employees – By developing our people we can continue to improve our service to customers, and by demonstrating that we are a dynamic, innovative organisation we can attract the talent our future workforce needs. Increasing the diversity of our employees ensures we have access to a broad set of views that are fit for our modern society. Looking after the health, safety and wellbeing of our employees is paramount.
Investors and analysts – Our shares are held by individuals and large investors, including pension funds and charities, and we provide a return that is relied on by millions. We help investors and analysts to understand our business – such as priorities around risk and return, growth and income, and corporate governance – to assist them in making the right investment decisions for themselves, their investors and clients.
Regulators – We engage actively to help shape the policy and regulatory framework within which we operate, covering customer, economic and environmental factors. These priorities require balancing and need to be looked at over a long-term horizon. Maintaining relationships is key to assist with this. There are also changes in the priorities and aims of our regulators over time, and actively engaging in discussions around future policy is important for us to provide the company perspective.
Political – Engagement with national and local government, as well as elected representatives and devolved administrations, on topics of public interest helps us to understand their issues and seek solutions to shared environmental, social, economic and governance issues.
Media – It is through the media, and increasingly its social media platforms, that many stakeholders receive their information about us and our activities. Given the essential nature of our services, it is important that coverage is fair, balanced and accurate, requiring effective two-way dialogue.
How we engage with stakeholdersWe approach stakeholder engagement in an inclusive way, taking time to understand which stakeholders are interested in which topics, holding genuine two-way conversations with them and, through continuous engagement, working hard to understand any concerns or issues from their perspective to ensure a suitable response from the company.
In some cases, our engagement focuses on future requirements so that our investment in infrastructure enables the North West economy to grow. Other times, we have to be more reactive, supporting our stakeholders when issues arise such as extreme weather events. Our approach goes beyond simple engagement, as it is important to understand what issues our stakeholders consider to be material and the wider benefit that addressing these issues brings.
To understand which issues are of material concern to stakeholders, and which are most material to our company strategy, we regularly compile a materiality matrix. This is informed by extensive stakeholder consultation and customer research, which we carry out on a rolling programme to validate our business planning, and by business representatives sitting on our corporate responsibility panel.
Our matrix is available on our website – see unitedutilities.com/corporate/responsibility/our-approach/materiality
There are a number of ways in which we engage with stakeholders. For example, our panel of customer representatives, YourVoice, typically meets quarterly to ensure that customers are at the heart of the company’s business planning engagement.
We arrange regular meetings with stakeholders from across the region to cover a variety of topics, such as workshops to discuss priorities for our draft business plan. Some of our employees also have formal roles on bodies set up by our stakeholders, providing the opportunity to give the company’s perspective on topics ranging from land management to infrastructure development.
We act on the findings of our annual opinion surveys to ensure that employees are engaged and committed to deliver the company’s goals and objectives.
For investors, our programme of regular engagement allows us to explore matters of financing and how our company strategy will provide them suitable returns.
United Utilities 2018.indd 30 6/1/2018 2:06:55 PM
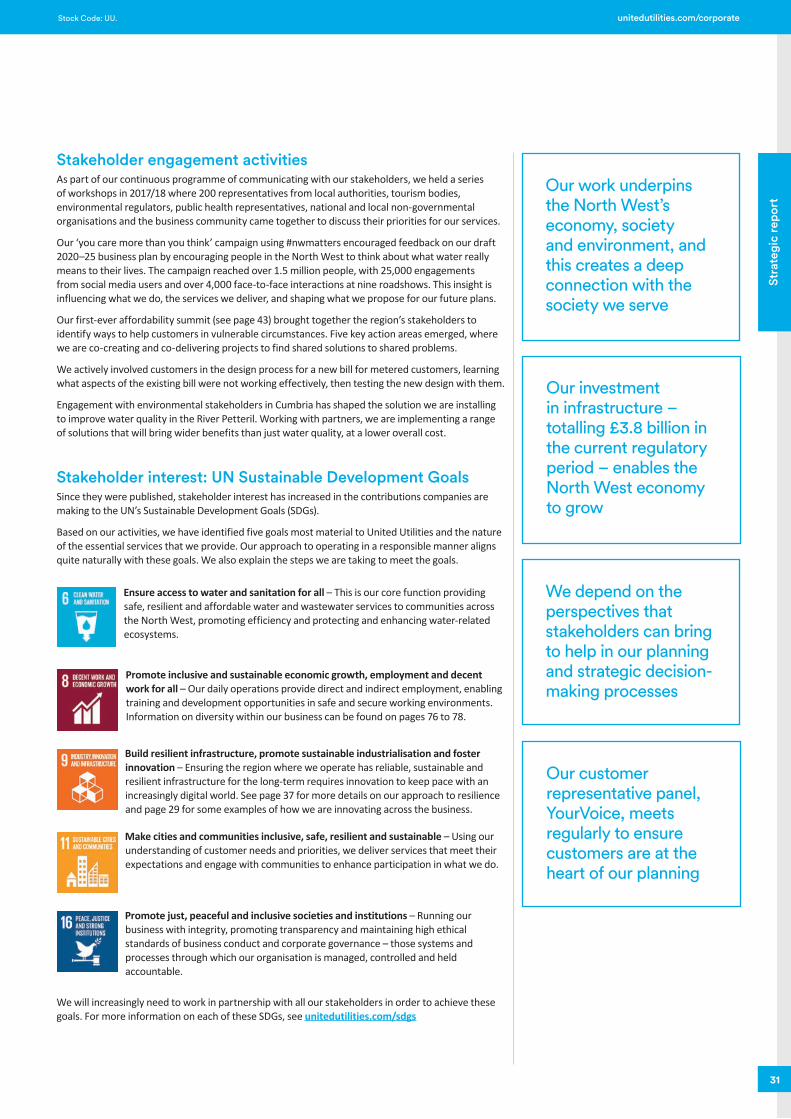
Job Number 1 June 2018 2:04 PM Proof 3 Job Number 1 June 2018 2:04 PM Proof 3
31
Stra
tegi
c re
port
Stock Code: UU. unitedutilities.com/corporate
Stakeholder interest: UN Sustainable Development GoalsSince they were published, stakeholder interest has increased in the contributions companies are making to the UN’s Sustainable Development Goals (SDGs).
Based on our activities, we have identified five goals most material to United Utilities and the nature of the essential services that we provide. Our approach to operating in a responsible manner aligns quite naturally with these goals. We also explain the steps we are taking to meet the goals.
Our work underpins the North West’s economy, society and environment, and this creates a deep connection with the society we serve
We depend on the perspectives that stakeholders can bring to help in our planning and strategic decision-making processes
Our investment in infrastructure – totalling £3.8 billion in the current regulatory period – enables the North West economy to grow
Our customer representative panel, YourVoice, meets regularly to ensure customers are at the heart of our planning
Ensure access to water and sanitation for all – This is our core function providing safe, resilient and affordable water and wastewater services to communities across the North West, promoting efficiency and protecting and enhancing water-related ecosystems.
Promote inclusive and sustainable economic growth, employment and decent work for all – Our daily operations provide direct and indirect employment, enabling training and development opportunities in safe and secure working environments. Information on diversity within our business can be found on pages 76 to 78.
Build resilient infrastructure, promote sustainable industrialisation and foster innovation – Ensuring the region where we operate has reliable, sustainable and resilient infrastructure for the long-term requires innovation to keep pace with an increasingly digital world. See page 37 for more details on our approach to resilience and page 29 for some examples of how we are innovating across the business.
Make cities and communities inclusive, safe, resilient and sustainable – Using our understanding of customer needs and priorities, we deliver services that meet their expectations and engage with communities to enhance participation in what we do.
Promote just, peaceful and inclusive societies and institutions – Running our business with integrity, promoting transparency and maintaining high ethical standards of business conduct and corporate governance – those systems and processes through which our organisation is managed, controlled and held accountable.
We will increasingly need to work in partnership with all our stakeholders in order to achieve these goals. For more information on each of these SDGs, see unitedutilities.com/sdgs
Stakeholder engagement activitiesAs part of our continuous programme of communicating with our stakeholders, we held a series of workshops in 2017/18 where 200 representatives from local authorities, tourism bodies, environmental regulators, public health representatives, national and local non-governmental organisations and the business community came together to discuss their priorities for our services.
Our ‘you care more than you think’ campaign using #nwmatters encouraged feedback on our draft 2020–25 business plan by encouraging people in the North West to think about what water really means to their lives. The campaign reached over 1.5 million people, with 25,000 engagements from social media users and over 4,000 face-to-face interactions at nine roadshows. This insight is influencing what we do, the services we deliver, and shaping what we propose for our future plans.
Our first-ever affordability summit (see page 43) brought together the region’s stakeholders to identify ways to help customers in vulnerable circumstances. Five key action areas emerged, where we are co-creating and co-delivering projects to find shared solutions to shared problems.
We actively involved customers in the design process for a new bill for metered customers, learning what aspects of the existing bill were not working effectively, then testing the new design with them.
Engagement with environmental stakeholders in Cumbria has shaped the solution we are installing to improve water quality in the River Petteril. Working with partners, we are implementing a range of solutions that will bring wider benefits than just water quality, at a lower overall cost.
United Utilities 2018.indd 31 6/1/2018 2:06:58 PM
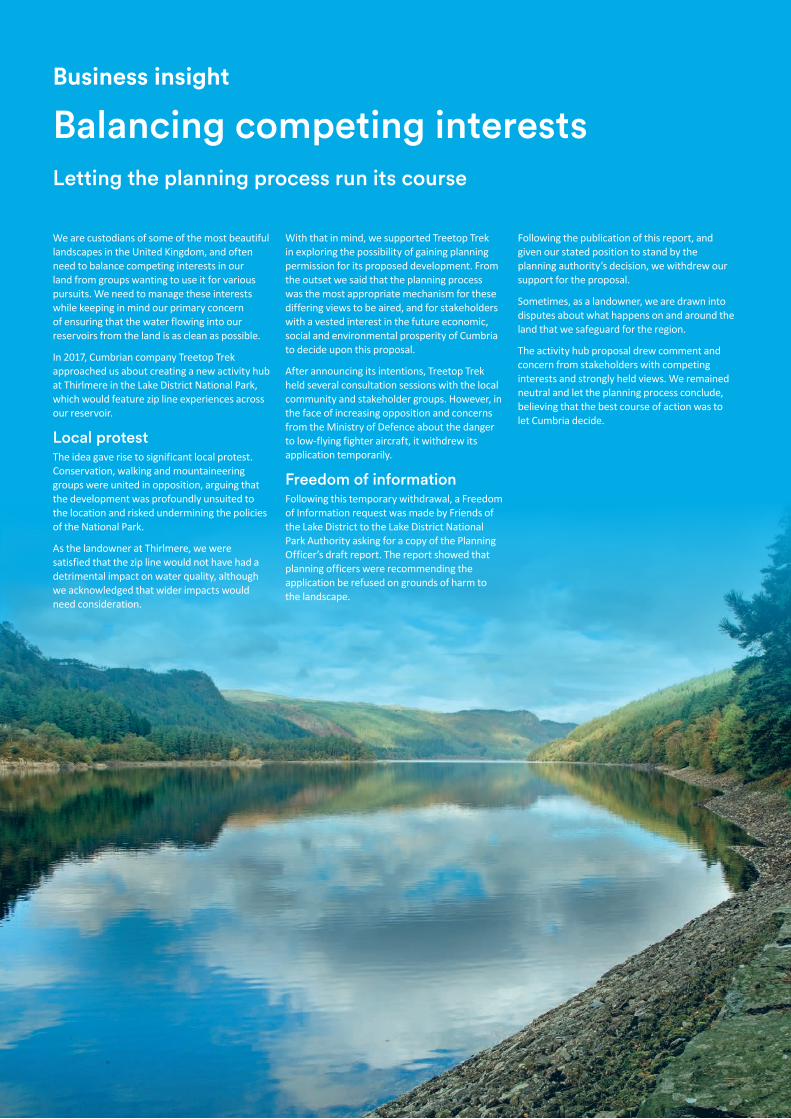
Job Number 1 June 2018 2:04 PM Proof 3 Job Number 1 June 2018 2:04 PM Proof 3
32
United Utilities Group PLC Annual Report and Financial Statements for the year ended 31 March 2018
Business insight
Balancing competing interests
We are custodians of some of the most beautiful landscapes in the United Kingdom, and often need to balance competing interests in our land from groups wanting to use it for various pursuits. We need to manage these interests while keeping in mind our primary concern of ensuring that the water flowing into our reservoirs from the land is as clean as possible.
In 2017, Cumbrian company Treetop Trek approached us about creating a new activity hub at Thirlmere in the Lake District National Park, which would feature zip line experiences across our reservoir.
Local protestThe idea gave rise to significant local protest. Conservation, walking and mountaineering groups were united in opposition, arguing that the development was profoundly unsuited to the location and risked undermining the policies of the National Park.
As the landowner at Thirlmere, we were satisfied that the zip line would not have had a detrimental impact on water quality, although we acknowledged that wider impacts would need consideration.
With that in mind, we supported Treetop Trek in exploring the possibility of gaining planning permission for its proposed development. From the outset we said that the planning process was the most appropriate mechanism for these differing views to be aired, and for stakeholders with a vested interest in the future economic, social and environmental prosperity of Cumbria to decide upon this proposal.
After announcing its intentions, Treetop Trek held several consultation sessions with the local community and stakeholder groups. However, in the face of increasing opposition and concerns from the Ministry of Defence about the danger to low-flying fighter aircraft, it withdrew its application temporarily.
Freedom of informationFollowing this temporary withdrawal, a Freedom of Information request was made by Friends of the Lake District to the Lake District National Park Authority asking for a copy of the Planning Officer’s draft report. The report showed that planning officers were recommending the application be refused on grounds of harm to the landscape.
Following the publication of this report, and given our stated position to stand by the planning authority’s decision, we withdrew our support for the proposal.
Sometimes, as a landowner, we are drawn into disputes about what happens on and around the land that we safeguard for the region.
The activity hub proposal drew comment and concern from stakeholders with competing interests and strongly held views. We remained neutral and let the planning process conclude, believing that the best course of action was to let Cumbria decide.
Letting the planning process run its course
United Utilities 2018.indd 32 6/1/2018 2:07:00 PM
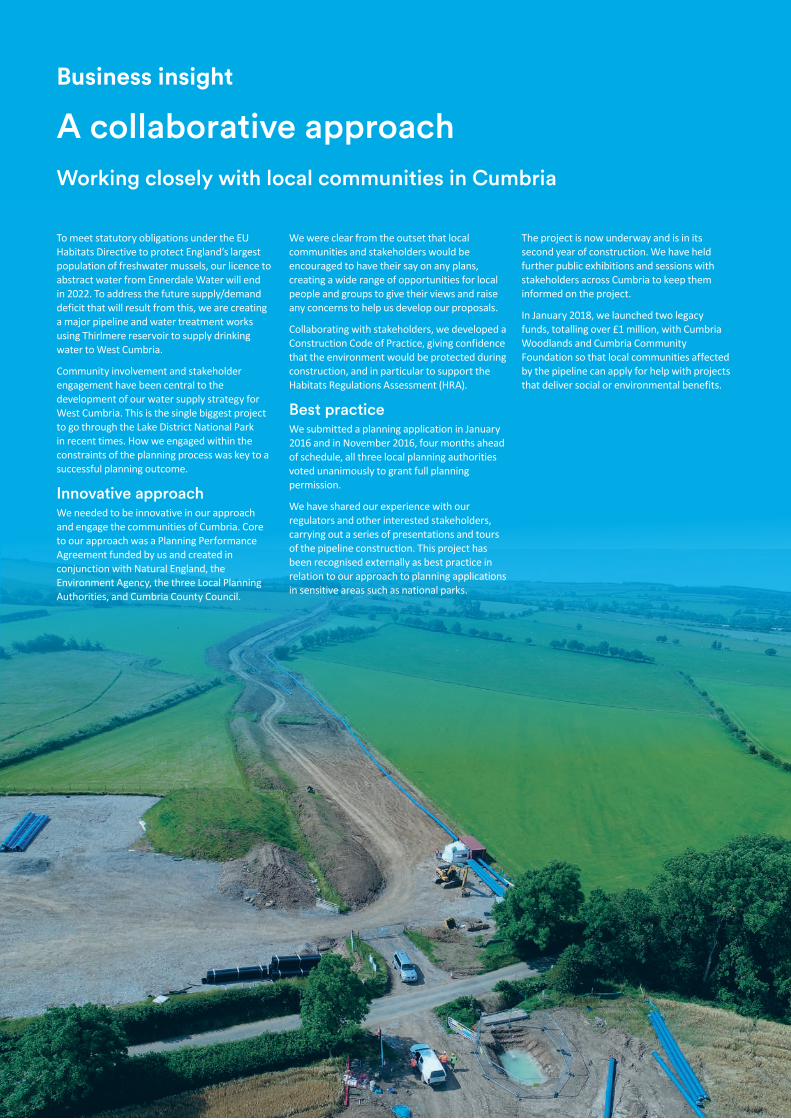
Job Number 1 June 2018 2:04 PM Proof 3 Job Number 1 June 2018 2:04 PM Proof 3
Stock Code: UU. unitedutilities.com/corporate
Business insight
A collaborative approach
To meet statutory obligations under the EU Habitats Directive to protect England’s largest population of freshwater mussels, our licence to abstract water from Ennerdale Water will end in 2022. To address the future supply/demand deficit that will result from this, we are creating a major pipeline and water treatment works using Thirlmere reservoir to supply drinking water to West Cumbria.
Community involvement and stakeholder engagement have been central to the development of our water supply strategy for West Cumbria. This is the single biggest project to go through the Lake District National Park in recent times. How we engaged within the constraints of the planning process was key to a successful planning outcome.
Innovative approachWe needed to be innovative in our approach and engage the communities of Cumbria. Core to our approach was a Planning Performance Agreement funded by us and created in conjunction with Natural England, the Environment Agency, the three Local Planning Authorities, and Cumbria County Council.
We were clear from the outset that local communities and stakeholders would be encouraged to have their say on any plans, creating a wide range of opportunities for local people and groups to give their views and raise any concerns to help us develop our proposals.
Collaborating with stakeholders, we developed a Construction Code of Practice, giving confidence that the environment would be protected during construction, and in particular to support the Habitats Regulations Assessment (HRA).
Best practiceWe submitted a planning application in January 2016 and in November 2016, four months ahead of schedule, all three local planning authorities voted unanimously to grant full planning permission.
We have shared our experience with our regulators and other interested stakeholders, carrying out a series of presentations and tours of the pipeline construction. This project has been recognised externally as best practice in relation to our approach to planning applications in sensitive areas such as national parks.
The project is now underway and is in its second year of construction. We have held further public exhibitions and sessions with stakeholders across Cumbria to keep them informed on the project.
In January 2018, we launched two legacy funds, totalling over £1 million, with Cumbria Woodlands and Cumbria Community Foundation so that local communities affected by the pipeline can apply for help with projects that deliver social or environmental benefits.
Working closely with local communities in Cumbria
United Utilities 2018.indd 33 6/1/2018 2:07:03 PM
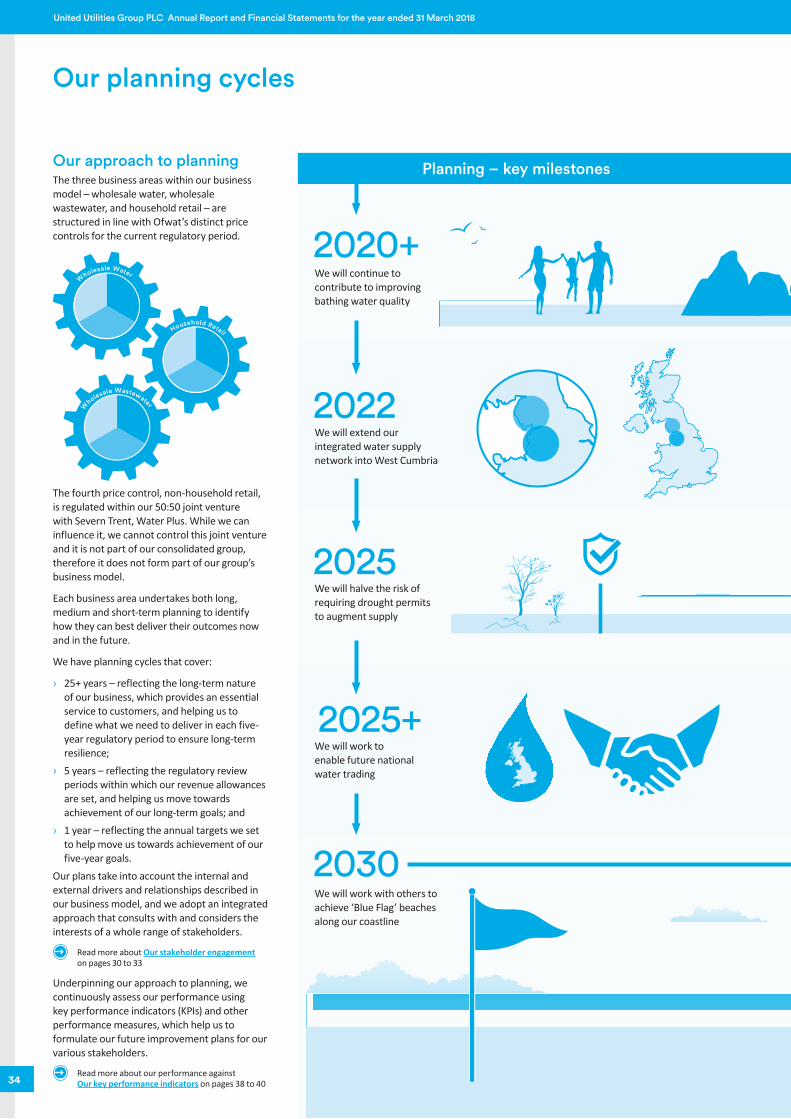
Job Number 1 June 2018 2:04 PM Proof 3 Job Number 1 June 2018 2:04 PM Proof 3
34
United Utilities Group PLC Annual Report and Financial Statements for the year ended 31 March 2018
Our planning cycles
Our approach to planningThe three business areas within our business model – wholesale water, wholesale wastewater, and household retail – are structured in line with Ofwat’s distinct price controls for the current regulatory period.
Wholesale Water
W
holesale Wastewater
Household Retail
The fourth price control, non-household retail, is regulated within our 50:50 joint venture with Severn Trent, Water Plus. While we can influence it, we cannot control this joint venture and it is not part of our consolidated group, therefore it does not form part of our group’s business model.
Each business area undertakes both long, medium and short-term planning to identify how they can best deliver their outcomes now and in the future.
We have planning cycles that cover:
› 25+ years – reflecting the long-term nature of our business, which provides an essential service to customers, and helping us to define what we need to deliver in each five-year regulatory period to ensure long-term resilience;
› 5 years – reflecting the regulatory review periods within which our revenue allowances are set, and helping us move towards achievement of our long-term goals; and
› 1 year – reflecting the annual targets we set to help move us towards achievement of our five-year goals.
Our plans take into account the internal and external drivers and relationships described in our business model, and we adopt an integrated approach that consults with and considers the interests of a whole range of stakeholders.
Read more about Our stakeholder engagement on pages 30 to 33
Underpinning our approach to planning, we continuously assess our performance using key performance indicators (KPIs) and other performance measures, which help us to formulate our future improvement plans for our various stakeholders.
Read more about our performance against Our key performance indicators on pages 38 to 40
Planning – key milestones
2022
2020+
2025+
2025
2030
We will continue to contribute to improving bathing water quality
We will extend our integrated water supply network into West Cumbria
We will work to enable future national water trading
We will halve the risk of requiring drought permits to augment supply
We will work with others to achieve ‘Blue Flag’ beaches along our coastline
United Utilities 2018.indd 34 6/1/2018 2:07:05 PM
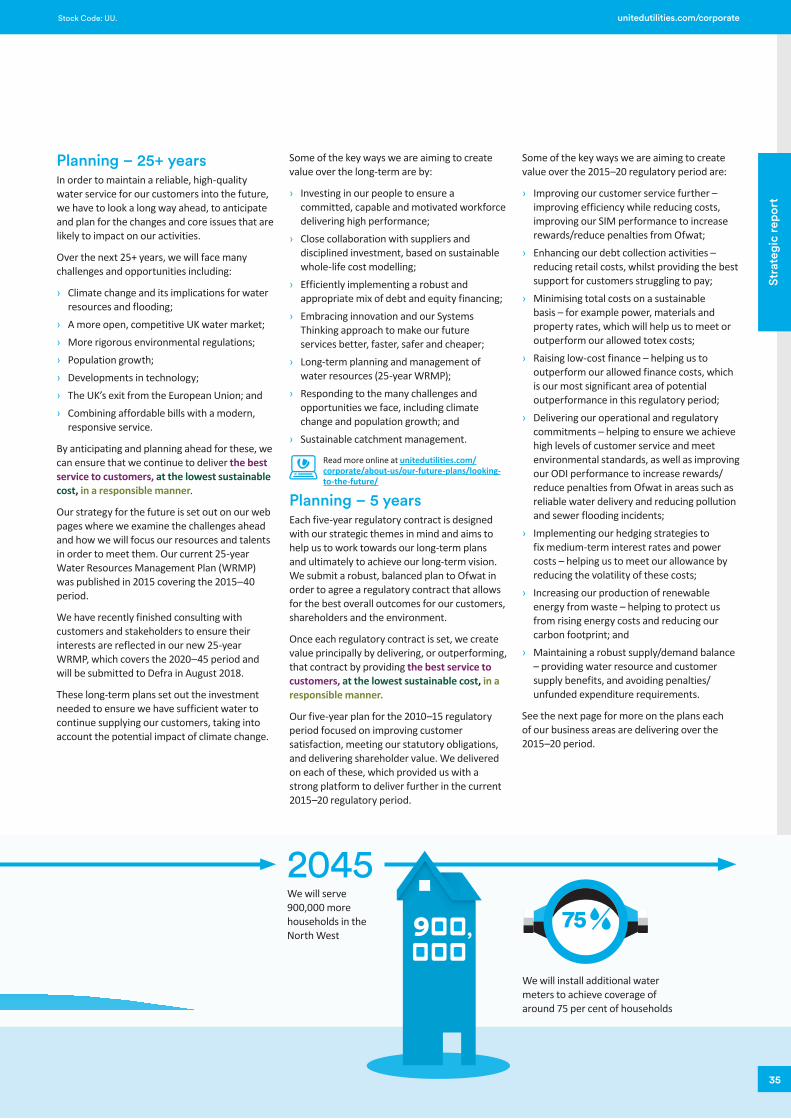
Job Number 1 June 2018 2:04 PM Proof 3 Job Number 1 June 2018 2:04 PM Proof 3
Stra
tegi
c re
port
Stock Code: UU. unitedutilities.com/corporate
Planning – 25+ yearsIn order to maintain a reliable, high-quality water service for our customers into the future, we have to look a long way ahead, to anticipate and plan for the changes and core issues that are likely to impact on our activities.
Over the next 25+ years, we will face many challenges and opportunities including:
› Climate change and its implications for water resources and flooding;
› A more open, competitive UK water market; › More rigorous environmental regulations; › Population growth; › Developments in technology; › The UK’s exit from the European Union; and › Combining affordable bills with a modern,
responsive service.
By anticipating and planning ahead for these, we can ensure that we continue to deliver the best service to customers, at the lowest sustainable cost, in a responsible manner.
Our strategy for the future is set out on our web pages where we examine the challenges ahead and how we will focus our resources and talents in order to meet them. Our current 25-year Water Resources Management Plan (WRMP) was published in 2015 covering the 2015–40 period.
We have recently finished consulting with customers and stakeholders to ensure their interests are reflected in our new 25-year WRMP, which covers the 2020–45 period and will be submitted to Defra in August 2018.
These long-term plans set out the investment needed to ensure we have sufficient water to continue supplying our customers, taking into account the potential impact of climate change.
Some of the key ways we are aiming to create value over the long-term are by:
› Investing in our people to ensure a committed, capable and motivated workforce delivering high performance;
› Close collaboration with suppliers and disciplined investment, based on sustainable whole-life cost modelling;
› Efficiently implementing a robust and appropriate mix of debt and equity financing;
› Embracing innovation and our Systems Thinking approach to make our future services better, faster, safer and cheaper;
› Long-term planning and management of water resources (25-year WRMP);
› Responding to the many challenges and opportunities we face, including climate change and population growth; and
› Sustainable catchment management.
Read more online at unitedutilities.com/corporate/about-us/our-future-plans/looking-to-the-future/
Planning – 5 yearsEach five-year regulatory contract is designed with our strategic themes in mind and aims to help us to work towards our long-term plans and ultimately to achieve our long-term vision. We submit a robust, balanced plan to Ofwat in order to agree a regulatory contract that allows for the best overall outcomes for our customers, shareholders and the environment.
Once each regulatory contract is set, we create value principally by delivering, or outperforming, that contract by providing the best service to customers, at the lowest sustainable cost, in a responsible manner.
Our five-year plan for the 2010–15 regulatory period focused on improving customer satisfaction, meeting our statutory obligations, and delivering shareholder value. We delivered on each of these, which provided us with a strong platform to deliver further in the current 2015–20 regulatory period.
Some of the key ways we are aiming to create value over the 2015–20 regulatory period are:
› Improving our customer service further – improving efficiency while reducing costs, improving our SIM performance to increase rewards/reduce penalties from Ofwat;
› Enhancing our debt collection activities – reducing retail costs, whilst providing the best support for customers struggling to pay;
› Minimising total costs on a sustainable basis – for example power, materials and property rates, which will help us to meet or outperform our allowed totex costs;
› Raising low-cost finance – helping us to outperform our allowed finance costs, which is our most significant area of potential outperformance in this regulatory period;
› Delivering our operational and regulatory commitments – helping to ensure we achieve high levels of customer service and meet environmental standards, as well as improving our ODI performance to increase rewards/ reduce penalties from Ofwat in areas such as reliable water delivery and reducing pollution and sewer flooding incidents;
› Implementing our hedging strategies to fix medium-term interest rates and power costs – helping us to meet our allowance by reducing the volatility of these costs;
› Increasing our production of renewable energy from waste – helping to protect us from rising energy costs and reducing our carbon footprint; and
› Maintaining a robust supply/demand balance – providing water resource and customer supply benefits, and avoiding penalties/ unfunded expenditure requirements.
See the next page for more on the plans each of our business areas are delivering over the 2015–20 period.
2045We will serve 900,000 more households in the North West
75
We will install additional water meters to achieve coverage of around 75 per cent of households
,
35
United Utilities 2018.indd 35 6/1/2018 2:07:06 PM
Job Number 1 June 2018 2:04 PM Proof 3 Job Number 1 June 2018 2:04 PM Proof 3
36
United Utilities Group PLC Annual Report and Financial Statements for the year ended 31 March 2018
Wholesale water › Maintain existing high levels of reliability in
the delivery of day-to-day water services, making better use of technology for remote monitoring and control of source-to-tap assets;
› Maintain existing high levels of water quality, as measured at customers’ taps and our water treatment works;
› Reduce the number of customer contacts regarding water quality;
› Maintain leakage at or below the sustainable economic level;
› Limit the impact on customers of increases in operating costs, such as chemicals and rates, by making cost savings elsewhere through continuous improvement in our operational efficiency; and
› Work to link 150,000 customers in West Cumbria to Thirlmere reservoir to ensure a long-term, reliable supply of drinking water and to support the sensitive ecology in that area.
Wholesale wastewater › Continue to improve the way we operate,
making better use of technology, automation and control to drive better customer service at reduced cost, and build on customer satisfaction improvements already delivered;
› Reduce the number of our customers’ properties exposed to sewer flooding, working in partnerships to deliver schemes cost-effectively and promote the use of more sustainable drainage systems;
› Improve bathing waters to meet tougher regulatory standards, and work with other organisations to support them in delivering improvements to our region’s beaches;
› Improve water quality in the North West’s rivers and lakes through investment in our treatment works and at overflows, and engage with others to explore innovative catchment management techniques to control diffuse pollution in our catchments;
› Increase production of renewable energy from waste to protect customers from rising energy costs and reduce our carbon footprint; and
› Constrain the costs of taking responsibility for all private sewers and private pumping stations across the region, through improvements to our operating model and efficient delivery of our programme.
Household retail › Continue to improve the customer experience
by being more proactive, anticipating problems before they materialise and improving our communication channels;
› Reduce the number of customer complaints further, and resolve them whenever we can, avoiding the need for complaints to be referred to the Consumer Council for Water;
› Reduce the debt burden on the company and its customers by engaging with those who are struggling to pay, helping them return to sustained payment behaviour. We are extending our options for assistance to hard-pressed customers, including the social tariff, and we remain committed to contributing to the United Utilities Trust Fund, ‘Restart’, which has proven effective in helping customers in difficulty return to regular payment; and
› Reduce the cost to serve our customers through systems and process improvements. This is particularly important under the current price control methodology which uses an industry average retail cost to serve to determine part of customer bills.
Adapting our plans to meet our customers’ evolving needsThe North West remains the most socially and economically deprived region in England, which is the principal driver of our higher than average cost to serve for household customers. This is currently recognised by Ofwat through an additional cost allowance for deprivation of £20 million per annum over the 2015–20 regulatory period.
A report from the Department for Communities and Local Government in 2015/16 reaffirmed that the North West has the most deprived regions in England, containing three of the top five local authority districts with the highest proportion of ‘highly deprived’ neighbourhoods (categorised as the most deprived 10 per cent).
Bad debt remains a risk, particularly with the continuing tightening of real disposable incomes and the impact of welfare reforms likely to intensify. Our debt management processes have been externally benchmarked as efficient and effective. We continue to refine and enhance them, whilst also helping customers back into making regular payments through the use of manageable payment plans.
We anticipate continued hardship for a number of communities and difficulties for some customers in paying their bills. We will remain committed to supporting these customers through a suite of payment assistance schemes and by looking at new ways to help, like the introduction of our social tariff in 2015, supporting elderly customers.
We are also adapting to the increasing use of social media and digital technology. We have recognised the increasing power of social media as communication channels for customers in doing business with us, and have invested in a new digital external communications capability and a number of website improvements that were built through consultation with our customers.
Planning – 1 yearBefore the start of each financial year, we develop a business plan for that year, which is approved by the board.
This sets our annual targets, which are designed to help deliver further improvements in service delivery and efficiency, and to help move us towards achievement of our five-year goals.
Our business plan covers a broad range of measures across our three strategic themes to deliver the best service to customers, at the lowest sustainable cost, in a responsible manner.
Our one-year targets help us to measure progress towards our five-year goals, which in turn help us work towards our long-term plans and, ultimately, our vision to be the best UK water and wastewater company.
This top-down approach helps us to ensure the long-term resilience and sustainability of our business through short and medium-term goals that we can monitor and measure our progress against.
Performance monitoringThe executive directors hold quarterly business review meetings with senior managers to monitor and assess our performance against these measures, helping to ensure that we are on track to deliver our targets.
Performance measurementAt the end of every financial year, our performance is assessed against these measures and this determines employees’ annual bonuses right through the organisation.
As well as annual targets, our directors are assessed against three-year performance, covering total shareholder return, sustainable dividends and customer service, through long-term incentive plans.
Details of the 2017/18 annual bonus and vested long-term incentive plans for our executive directors are shown on pages 96 to 103 within the remuneration report.
Our planning cycles continued
United Utilities 2018.indd 36 6/1/2018 2:07:06 PM
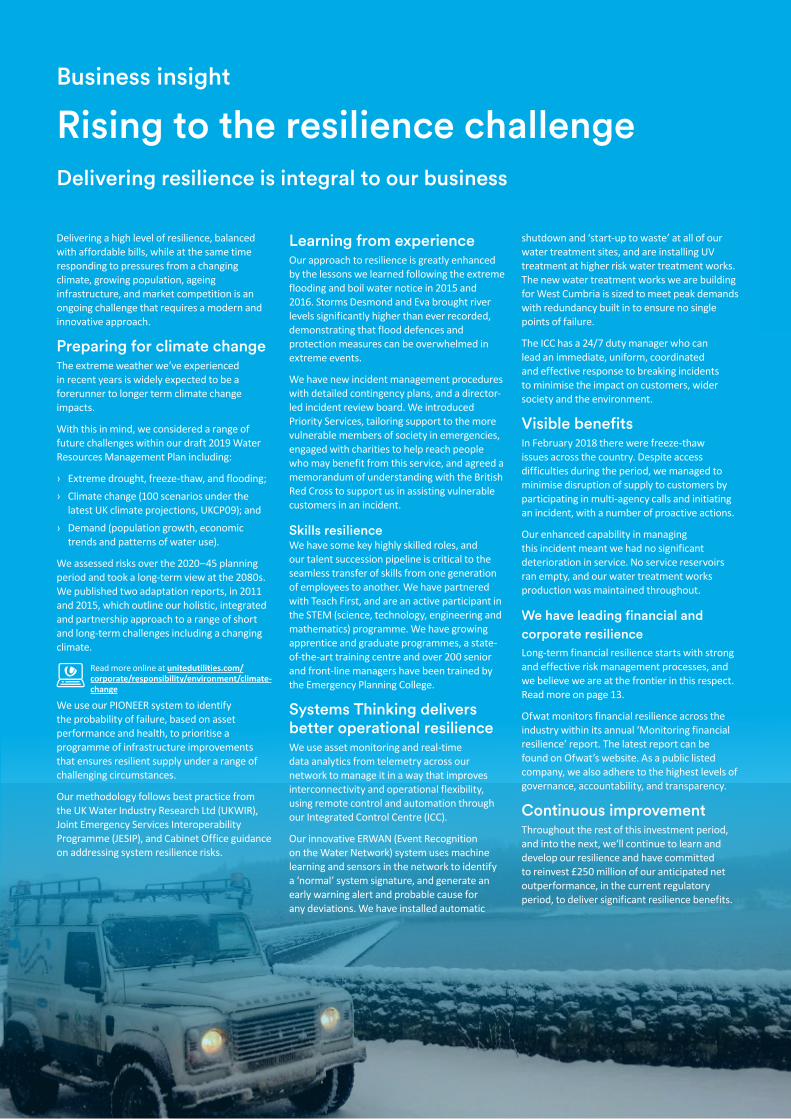
Job Number 1 June 2018 2:04 PM Proof 3 Job Number 1 June 2018 2:04 PM Proof 3
37
Stra
tegi
c re
port
Stock Code: UU. unitedutilities.com/corporate
Business insight
Rising to the resilience challenge
Delivering a high level of resilience, balanced with affordable bills, while at the same time responding to pressures from a changing climate, growing population, ageing infrastructure, and market competition is an ongoing challenge that requires a modern and innovative approach.
Preparing for climate changeThe extreme weather we’ve experienced in recent years is widely expected to be a forerunner to longer term climate change impacts.
With this in mind, we considered a range of future challenges within our draft 2019 Water Resources Management Plan including:
› Extreme drought, freeze-thaw, and flooding; › Climate change (100 scenarios under the
latest UK climate projections, UKCP09); and › Demand (population growth, economic
trends and patterns of water use).
We assessed risks over the 2020–45 planning period and took a long-term view at the 2080s. We published two adaptation reports, in 2011 and 2015, which outline our holistic, integrated and partnership approach to a range of short and long-term challenges including a changing climate.
Read more online at unitedutilities.com/corporate/responsibility/environment/climate-change
We use our PIONEER system to identify the probability of failure, based on asset performance and health, to prioritise a programme of infrastructure improvements that ensures resilient supply under a range of challenging circumstances.
Our methodology follows best practice from the UK Water Industry Research Ltd (UKWIR), Joint Emergency Services Interoperability Programme (JESIP), and Cabinet Office guidance on addressing system resilience risks.
Learning from experienceOur approach to resilience is greatly enhanced by the lessons we learned following the extreme flooding and boil water notice in 2015 and 2016. Storms Desmond and Eva brought river levels significantly higher than ever recorded, demonstrating that flood defences and protection measures can be overwhelmed in extreme events.
We have new incident management procedures with detailed contingency plans, and a director-led incident review board. We introduced Priority Services, tailoring support to the more vulnerable members of society in emergencies, engaged with charities to help reach people who may benefit from this service, and agreed a memorandum of understanding with the British Red Cross to support us in assisting vulnerable customers in an incident.
Skills resilienceWe have some key highly skilled roles, and our talent succession pipeline is critical to the seamless transfer of skills from one generation of employees to another. We have partnered with Teach First, and are an active participant in the STEM (science, technology, engineering and mathematics) programme. We have growing apprentice and graduate programmes, a state-of-the-art training centre and over 200 senior and front-line managers have been trained by the Emergency Planning College.
Systems Thinking delivers better operational resilienceWe use asset monitoring and real-time data analytics from telemetry across our network to manage it in a way that improves interconnectivity and operational flexibility, using remote control and automation through our Integrated Control Centre (ICC).
Our innovative ERWAN (Event Recognition on the Water Network) system uses machine learning and sensors in the network to identify a ‘normal’ system signature, and generate an early warning alert and probable cause for any deviations. We have installed automatic
shutdown and ‘start-up to waste’ at all of our water treatment sites, and are installing UV treatment at higher risk water treatment works. The new water treatment works we are building for West Cumbria is sized to meet peak demands with redundancy built in to ensure no single points of failure.
The ICC has a 24/7 duty manager who can lead an immediate, uniform, coordinated and effective response to breaking incidents to minimise the impact on customers, wider society and the environment.
Visible benefitsIn February 2018 there were freeze-thaw issues across the country. Despite access difficulties during the period, we managed to minimise disruption of supply to customers by participating in multi-agency calls and initiating an incident, with a number of proactive actions.
Our enhanced capability in managing this incident meant we had no significant deterioration in service. No service reservoirs ran empty, and our water treatment works production was maintained throughout.
We have leading financial and corporate resilienceLong-term financial resilience starts with strong and effective risk management processes, and we believe we are at the frontier in this respect. Read more on page 13.
Ofwat monitors financial resilience across the industry within its annual ‘Monitoring financial resilience’ report. The latest report can be found on Ofwat’s website. As a public listed company, we also adhere to the highest levels of governance, accountability, and transparency.
Continuous improvementThroughout the rest of this investment period, and into the next, we‘ll continue to learn and develop our resilience and have committed to reinvest £250 million of our anticipated net outperformance, in the current regulatory period, to deliver significant resilience benefits.
Delivering resilience is integral to our business
United Utilities 2018.indd 37 6/1/2018 2:07:06 PM
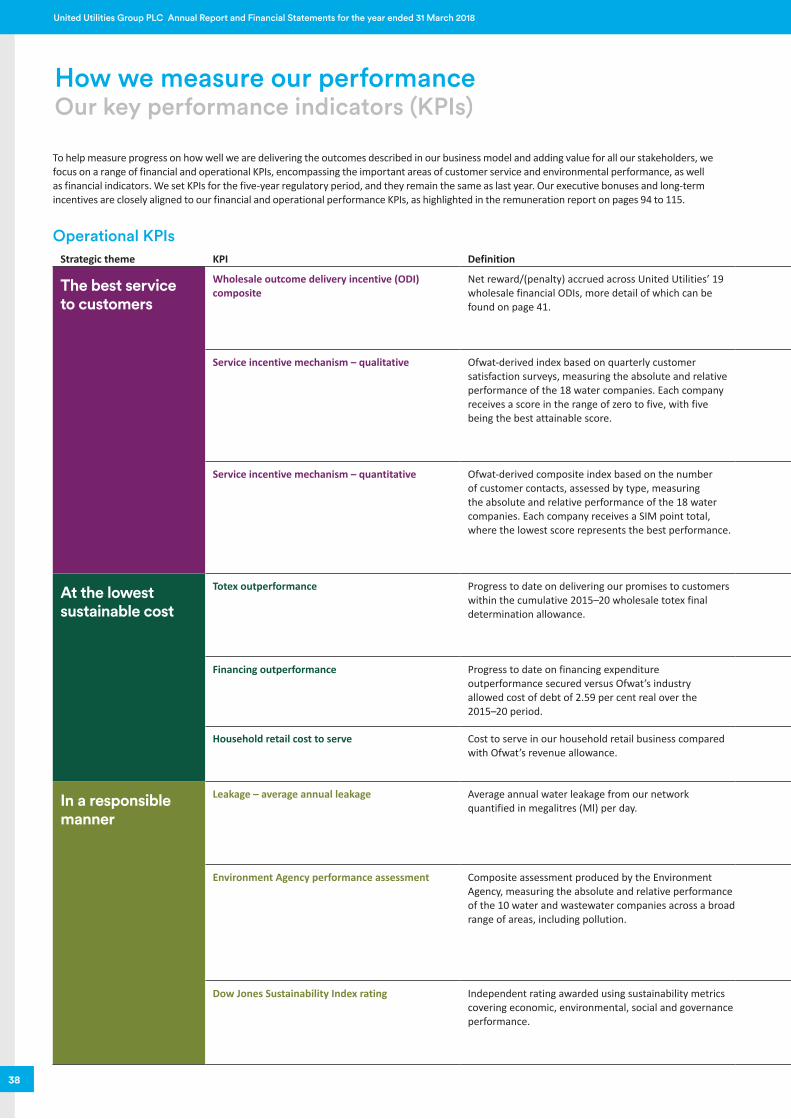
Job Number 1 June 2018 2:04 PM Proof 3 Job Number 1 June 2018 2:04 PM Proof 3
38
United Utilities Group PLC Annual Report and Financial Statements for the year ended 31 March 2018
How we measure our performanceOur key performance indicators (KPIs)
To help measure progress on how well we are delivering the outcomes described in our business model and adding value for all our stakeholders, we focus on a range of financial and operational KPIs, encompassing the important areas of customer service and environmental performance, as well as financial indicators. We set KPIs for the five-year regulatory period, and they remain the same as last year. Our executive bonuses and long-term incentives are closely aligned to our financial and operational performance KPIs, as highlighted in the remuneration report on pages 94 to 115.
Operational KPIsStrategic theme KPI Definition Target Performance Status Linked to bonus/LTP
The best service to customers
Wholesale outcome delivery incentive (ODI) composite
Net reward/(penalty) accrued across United Utilities’ 19 wholesale financial ODIs, more detail of which can be found on page 41.
End the 2015–20 regulatory period with a cumulative net ODI reward.
2017/18: £7.0 million net penalty(cumulative £2.2 million net reward)2016/17: £6.7 million net reward(cumulative £9.2 million net reward)2015/16: £2.5 million net reward
Bonus – directLTP – indirect
Service incentive mechanism – qualitative Ofwat-derived index based on quarterly customer satisfaction surveys, measuring the absolute and relative performance of the 18 water companies. Each company receives a score in the range of zero to five, with five being the best attainable score.
To move towards the upper quartile in the medium-term.
2016/17
2017/18
4.42
4.49
2015/16 4.27
Sector bestSector worst
4.242014/15
Bonus – directLTP – direct
Service incentive mechanism – quantitative Ofwat-derived composite index based on the number of customer contacts, assessed by type, measuring the absolute and relative performance of the 18 water companies. Each company receives a SIM point total, where the lowest score represents the best performance.
To move towards the upper quartile in the medium-term.
952015/16
772016/17
992014/15
712017/18
Sector best (see note 1)
Sector worst(see note 1)
Bonus – directLTP – direct
At the lowest sustainable cost
Totex outperformance Progress to date on delivering our promises to customers within the cumulative 2015–20 wholesale totex final determination allowance.
To outperform Ofwat’s final determination totex allowance by £100 million over the 2015–20 regulatory period.
2015–20: Confident of outperforming the final determination allowance by £100 million over the 2015–20 regulatory periodTotex was a new measure for the 2015–20 period, hence no prior years’ comparators
Bonus – indirectLTP – indirect
Financing outperformance Progress to date on financing expenditureoutperformance secured versus Ofwat’s industry allowed cost of debt of 2.59 per cent real over the 2015–20 period.
To beat Ofwat’s industry allowed cost of debt. 2015–20: On track to beat Ofwat allowance2010–15: Exceeded our £300 million target outperformance
LTP – indirect
Household retail cost to serve Cost to serve in our household retail business compared with Ofwat’s revenue allowance.
To minimise costs compared with Ofwat’s revenue allowance. 2017/18: £9 million outperformance2016/17: £14 million outperformance2015/16: £10 million outperformance
Bonus – indirectLTP – indirect
In a responsible manner
Leakage – average annual leakage Average annual water leakage from our network quantified in megalitres (Ml) per day.
To meet our regulatory leakage target of 462.65 Ml per day for each year in the 2015–20 regulatory period, as set by Ofwat.
2017/18: Met target2016/17: Met target2015/16: Met target2014/15: Met target2013/14: Met target
Bonus – indirect
Environment Agency performance assessment Composite assessment produced by the Environment Agency, measuring the absolute and relative performance of the 10 water and wastewater companies across a broad range of areas, including pollution.
To be a first quartile performer (i.e. at least 4th) on a consistent basis.
2016/17* Joint 1st
2nd2012/13
2nd2013/14
2nd2014/15
Joint 2nd2015/16
*2016/17 latest available assessment
Bonus – indirect
Dow Jones Sustainability Index rating Independent rating awarded using sustainability metrics covering economic, environmental, social and governance performance.
To retain ‘World Class’ rating each year. 2017/18: ‘World Class’2016/17: ‘World Class’2015/16: ‘World Class’2014/15: ‘World Class’2013/14: ‘World Class’
United Utilities 2018.indd 38 6/1/2018 2:07:07 PM
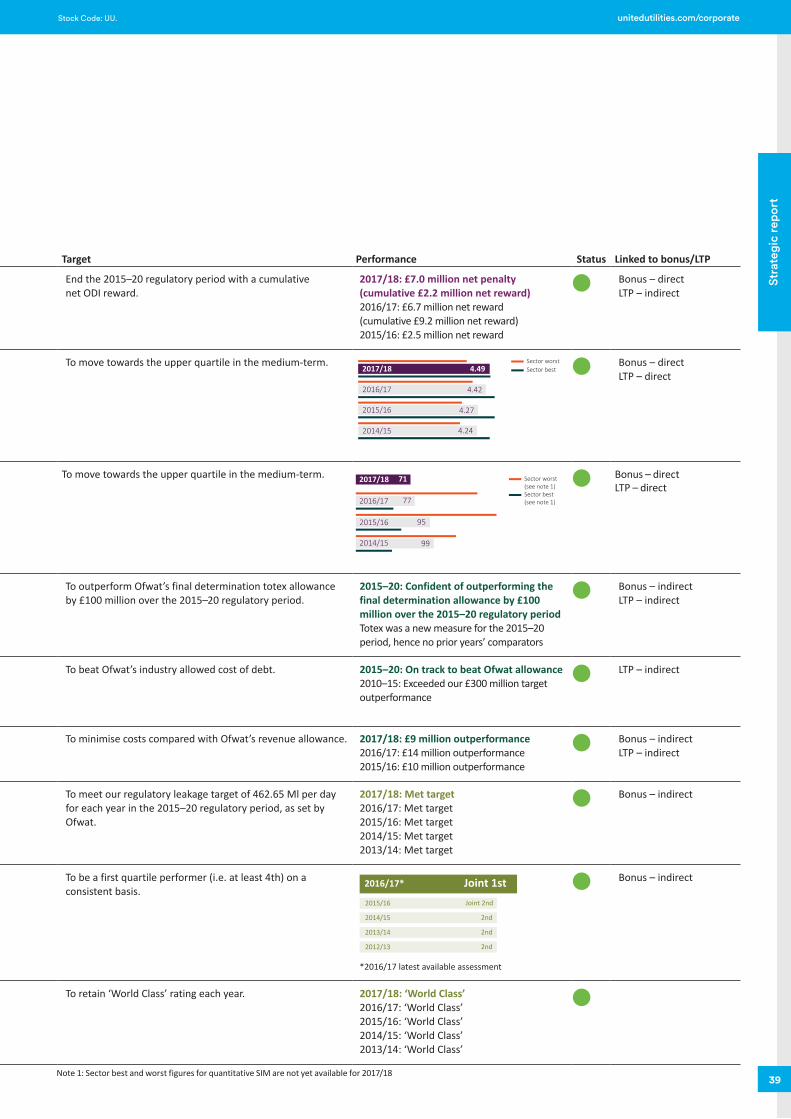
Job Number 1 June 2018 2:04 PM Proof 3 Job Number 1 June 2018 2:04 PM Proof 3
39
Stra
tegi
c re
port
Stock Code: UU. unitedutilities.com/corporate
Operational KPIsStrategic theme KPI Definition Target Performance Status Linked to bonus/LTP
The best service to customers
Wholesale outcome delivery incentive (ODI) composite
Net reward/(penalty) accrued across United Utilities’ 19 wholesale financial ODIs, more detail of which can be found on page 41.
End the 2015–20 regulatory period with a cumulative net ODI reward.
2017/18: £7.0 million net penalty(cumulative £2.2 million net reward)2016/17: £6.7 million net reward(cumulative £9.2 million net reward)2015/16: £2.5 million net reward
Bonus – directLTP – indirect
Service incentive mechanism – qualitative Ofwat-derived index based on quarterly customer satisfaction surveys, measuring the absolute and relative performance of the 18 water companies. Each company receives a score in the range of zero to five, with five being the best attainable score.
To move towards the upper quartile in the medium-term.
2016/17
2017/18
4.42
4.49
2015/16 4.27
Sector bestSector worst
4.242014/15
Bonus – directLTP – direct
Service incentive mechanism – quantitative Ofwat-derived composite index based on the number of customer contacts, assessed by type, measuring the absolute and relative performance of the 18 water companies. Each company receives a SIM point total, where the lowest score represents the best performance.
To move towards the upper quartile in the medium-term.
952015/16
772016/17
992014/15
712017/18
Sector best (see note 1)
Sector worst(see note 1)
Bonus – directLTP – direct
At the lowest sustainable cost
Totex outperformance Progress to date on delivering our promises to customers within the cumulative 2015–20 wholesale totex final determination allowance.
To outperform Ofwat’s final determination totex allowance by £100 million over the 2015–20 regulatory period.
2015–20: Confident of outperforming the final determination allowance by £100 million over the 2015–20 regulatory periodTotex was a new measure for the 2015–20 period, hence no prior years’ comparators
Bonus – indirectLTP – indirect
Financing outperformance Progress to date on financing expenditureoutperformance secured versus Ofwat’s industry allowed cost of debt of 2.59 per cent real over the 2015–20 period.
To beat Ofwat’s industry allowed cost of debt. 2015–20: On track to beat Ofwat allowance2010–15: Exceeded our £300 million target outperformance
LTP – indirect
Household retail cost to serve Cost to serve in our household retail business compared with Ofwat’s revenue allowance.
To minimise costs compared with Ofwat’s revenue allowance. 2017/18: £9 million outperformance2016/17: £14 million outperformance2015/16: £10 million outperformance
Bonus – indirectLTP – indirect
In a responsible manner
Leakage – average annual leakage Average annual water leakage from our network quantified in megalitres (Ml) per day.
To meet our regulatory leakage target of 462.65 Ml per day for each year in the 2015–20 regulatory period, as set by Ofwat.
2017/18: Met target2016/17: Met target2015/16: Met target2014/15: Met target2013/14: Met target
Bonus – indirect
Environment Agency performance assessment Composite assessment produced by the Environment Agency, measuring the absolute and relative performance of the 10 water and wastewater companies across a broad range of areas, including pollution.
To be a first quartile performer (i.e. at least 4th) on a consistent basis.
2016/17* Joint 1st
2nd2012/13
2nd2013/14
2nd2014/15
Joint 2nd2015/16
*2016/17 latest available assessment
Bonus – indirect
Dow Jones Sustainability Index rating Independent rating awarded using sustainability metrics covering economic, environmental, social and governance performance.
To retain ‘World Class’ rating each year. 2017/18: ‘World Class’2016/17: ‘World Class’2015/16: ‘World Class’2014/15: ‘World Class’2013/14: ‘World Class’
Note 1: Sector best and worst figures for quantitative SIM are not yet available for 2017/18
United Utilities 2018.indd 39 6/1/2018 2:07:07 PM
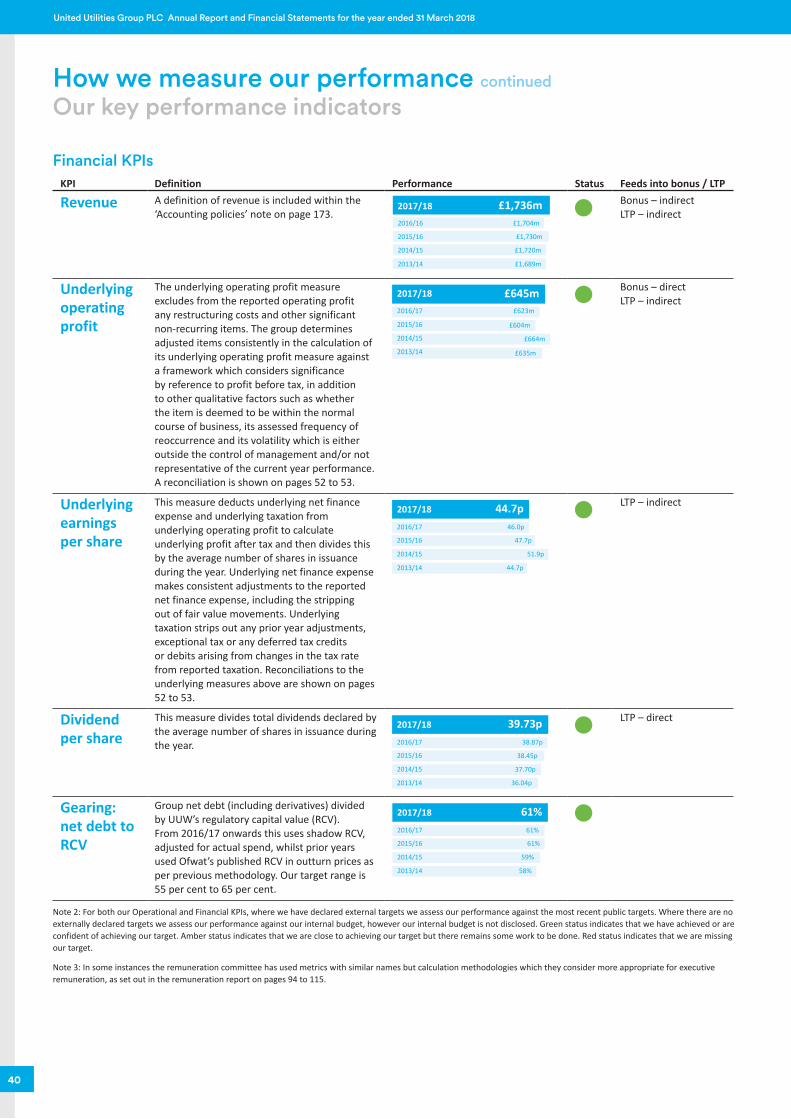
Job Number 1 June 2018 2:04 PM Proof 3 Job Number 1 June 2018 2:04 PM Proof 3
40
United Utilities Group PLC Annual Report and Financial Statements for the year ended 31 March 2018
How we measure our performance continued
Our key performance indicators
Financial KPIsKPI Definition Performance Status Feeds into bonus / LTP
Revenue A definition of revenue is included within the ‘Accounting policies’ note on page 173.
2017/18 £1,736m2016/16 £1,704m
2015/16 £1,730m
2014/15 £1,720m
2013/14 £1,689m
Bonus – indirectLTP – indirect
Underlying operating profit
The underlying operating profit measure excludes from the reported operating profit any restructuring costs and other significant non-recurring items. The group determines adjusted items consistently in the calculation of its underlying operating profit measure against a framework which considers significance by reference to profit before tax, in addition to other qualitative factors such as whether the item is deemed to be within the normal course of business, its assessed frequency of reoccurrence and its volatility which is either outside the control of management and/or not representative of the current year performance. A reconciliation is shown on pages 52 to 53.
2017/18
2016/17
2015/16
2014/15
2013/14
£623m
£604m
£664m
£635m
£645m Bonus – directLTP – indirect
Underlying earnings per share
This measure deducts underlying net finance expense and underlying taxation from underlying operating profit to calculate underlying profit after tax and then divides this by the average number of shares in issuance during the year. Underlying net finance expense makes consistent adjustments to the reported net finance expense, including the stripping out of fair value movements. Underlying taxation strips out any prior year adjustments, exceptional tax or any deferred tax credits or debits arising from changes in the tax rate from reported taxation. Reconciliations to the underlying measures above are shown on pages 52 to 53.
2017/18
2016/17
2015/16
2014/15
2013/14
44.7p46.0p
47.7p
51.9p
44.7p
LTP – indirect
Dividend per share
This measure divides total dividends declared by the average number of shares in issuance during the year.
2017/18
2016/17
2015/16
2014/15
2013/14
39.73p38.87p
38.45p
37.70p
36.04p
LTP – direct
Gearing: net debt to RCV
Group net debt (including derivatives) divided by UUW’s regulatory capital value (RCV). From 2016/17 onwards this uses shadow RCV, adjusted for actual spend, whilst prior years used Ofwat’s published RCV in outturn prices as per previous methodology. Our target range is 55 per cent to 65 per cent.
2017/18
2016/17
2015/16
2014/15
2013/14
61%
61%
61%
59%
58%
Note 2: For both our Operational and Financial KPIs, where we have declared external targets we assess our performance against the most recent public targets. Where there are no externally declared targets we assess our performance against our internal budget, however our internal budget is not disclosed. Green status indicates that we have achieved or are confident of achieving our target. Amber status indicates that we are close to achieving our target but there remains some work to be done. Red status indicates that we are missing our target.
Note 3: In some instances the remuneration committee has used metrics with similar names but calculation methodologies which they consider more appropriate for executive remuneration, as set out in the remuneration report on pages 94 to 115.
United Utilities 2018.indd 40 6/1/2018 2:07:09 PM
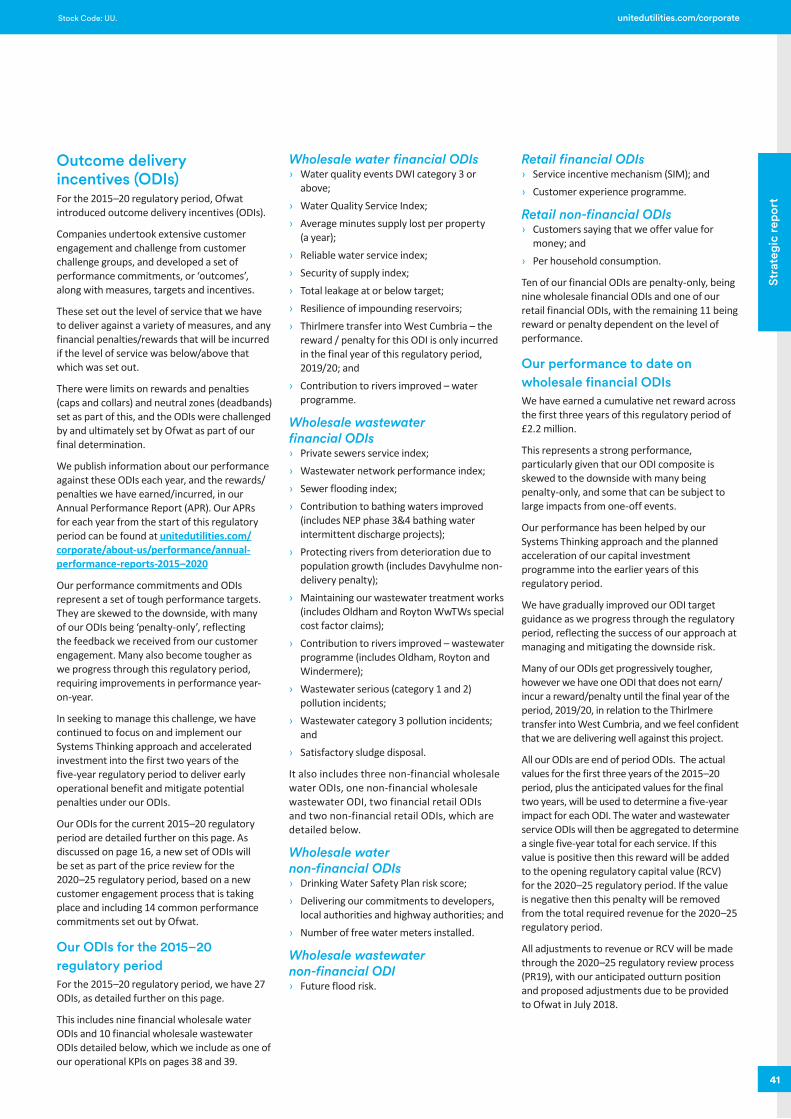
Job Number 1 June 2018 2:04 PM Proof 3 Job Number 1 June 2018 2:04 PM Proof 3
41
Stra
tegi
c re
port
Stock Code: UU. unitedutilities.com/corporate
Outcome delivery incentives (ODIs)For the 2015–20 regulatory period, Ofwat introduced outcome delivery incentives (ODIs).
Companies undertook extensive customer engagement and challenge from customer challenge groups, and developed a set of performance commitments, or ‘outcomes’, along with measures, targets and incentives.
These set out the level of service that we have to deliver against a variety of measures, and any financial penalties/rewards that will be incurred if the level of service was below/above that which was set out.
There were limits on rewards and penalties (caps and collars) and neutral zones (deadbands) set as part of this, and the ODIs were challenged by and ultimately set by Ofwat as part of our final determination.
We publish information about our performance against these ODIs each year, and the rewards/penalties we have earned/incurred, in our Annual Performance Report (APR). Our APRs for each year from the start of this regulatory period can be found at unitedutilities.com/corporate/about-us/performance/annual-performance-reports-2015–2020
Our performance commitments and ODIs represent a set of tough performance targets. They are skewed to the downside, with many of our ODIs being ‘penalty-only’, reflecting the feedback we received from our customer engagement. Many also become tougher as we progress through this regulatory period, requiring improvements in performance year-on-year.
In seeking to manage this challenge, we have continued to focus on and implement our Systems Thinking approach and accelerated investment into the first two years of the five-year regulatory period to deliver early operational benefit and mitigate potential penalties under our ODIs.
Our ODIs for the current 2015–20 regulatory period are detailed further on this page. As discussed on page 16, a new set of ODIs will be set as part of the price review for the 2020–25 regulatory period, based on a new customer engagement process that is taking place and including 14 common performance commitments set out by Ofwat.
Our ODIs for the 2015–20 regulatory periodFor the 2015–20 regulatory period, we have 27 ODIs, as detailed further on this page.
This includes nine financial wholesale water ODIs and 10 financial wholesale wastewater ODIs detailed below, which we include as one of our operational KPIs on pages 38 and 39.
Wholesale water financial ODIs › Water quality events DWI category 3 or
above; › Water Quality Service Index; › Average minutes supply lost per property
(a year); › Reliable water service index; › Security of supply index; › Total leakage at or below target; › Resilience of impounding reservoirs; › Thirlmere transfer into West Cumbria – the
reward / penalty for this ODI is only incurred in the final year of this regulatory period, 2019/20; and
› Contribution to rivers improved – water programme.
Wholesale wastewater financial ODIs › Private sewers service index; › Wastewater network performance index; › Sewer flooding index; › Contribution to bathing waters improved
(includes NEP phase 3&4 bathing water intermittent discharge projects);
› Protecting rivers from deterioration due to population growth (includes Davyhulme non-delivery penalty);
› Maintaining our wastewater treatment works (includes Oldham and Royton WwTWs special cost factor claims);
› Contribution to rivers improved – wastewater programme (includes Oldham, Royton and Windermere);
› Wastewater serious (category 1 and 2) pollution incidents;
› Wastewater category 3 pollution incidents; and
› Satisfactory sludge disposal.
It also includes three non-financial wholesale water ODIs, one non-financial wholesale wastewater ODI, two financial retail ODIs and two non-financial retail ODIs, which are detailed below.
Wholesale water non-financial ODIs › Drinking Water Safety Plan risk score; › Delivering our commitments to developers,
local authorities and highway authorities; and › Number of free water meters installed.
Wholesale wastewater non-financial ODI › Future flood risk.
Retail financial ODIs › Service incentive mechanism (SIM); and › Customer experience programme.
Retail non-financial ODIs › Customers saying that we offer value for
money; and › Per household consumption.
Ten of our financial ODIs are penalty-only, being nine wholesale financial ODIs and one of our retail financial ODIs, with the remaining 11 being reward or penalty dependent on the level of performance.
Our performance to date on wholesale financial ODIsWe have earned a cumulative net reward across the first three years of this regulatory period of £2.2 million.
This represents a strong performance, particularly given that our ODI composite is skewed to the downside with many being penalty-only, and some that can be subject to large impacts from one-off events.
Our performance has been helped by our Systems Thinking approach and the planned acceleration of our capital investment programme into the earlier years of this regulatory period.
We have gradually improved our ODI target guidance as we progress through the regulatory period, reflecting the success of our approach at managing and mitigating the downside risk.
Many of our ODIs get progressively tougher, however we have one ODI that does not earn/incur a reward/penalty until the final year of the period, 2019/20, in relation to the Thirlmere transfer into West Cumbria, and we feel confident that we are delivering well against this project.
All our ODIs are end of period ODIs. The actual values for the first three years of the 2015–20 period, plus the anticipated values for the final two years, will be used to determine a five-year impact for each ODI. The water and wastewater service ODIs will then be aggregated to determine a single five-year total for each service. If this value is positive then this reward will be added to the opening regulatory capital value (RCV) for the 2020–25 regulatory period. If the value is negative then this penalty will be removed from the total required revenue for the 2020–25 regulatory period.
All adjustments to revenue or RCV will be made through the 2020–25 regulatory review process (PR19), with our anticipated outturn position and proposed adjustments due to be provided to Ofwat in July 2018.
United Utilities 2018.indd 41 6/1/2018 2:07:09 PM
Job Number 1 June 2018 2:04 PM Proof 3 Job Number 1 June 2018 2:04 PM Proof 3
42
United Utilities Group PLC Annual Report and Financial Statements for the year ended 31 March 2018
Job Number 1 June 2018 2:04 PM Proof NumberJob Number 1 June 2018 2:04 PM Proof NumberJob Number 1 June 2018 2:04 PM Proof NumberJob Number 1 June 2018 2:04 PM Proof Number
Our performance in 2017/18Operational performance
The best service to customers
Customer service – sitting at the core of everything we do, our strong focus on customer service has helped us deliver substantial improvements in recent years, becoming the most improved company in the 2010–15 regulatory period with a reduction of around 75 per cent in the overall number of customer complaints.
This year, we have seen another step change in our customer satisfaction performance. We achieved our highest ever scores against Ofwat’s qualitative Service Incentive Mechanism (SIM) measure, finishing first in the final survey of the year and third for the year overall. This performance is mirrored in the number of complaints that we receive. These have reduced by over 34 per cent in two years and the number of repeat complaints have reduced by 63 per cent over the same period.
We have added to our already leading position on affordability and vulnerability. We are now supporting more than 50,000 customers in need of help through our Priority Services scheme, providing more targeted support for customers experiencing short or long-term personal or financial difficulties in their lives, with tailored assistance. In January we hosted the first ever North West Affordability summit, engaging with customers and key stakeholders with an interest in this topic.
We have an industry-leading digital capability informed by customers with more than 750,000 customers now registered for our online customer portal, My Account, and we have launched the sector’s first truly integrated mobile app allowing customers to complete a variety of interactions with us using their preferred channel.
Improving customer service will continue to be a key area of focus, and we have identified a range of opportunities to deliver further benefits for customers.
Leading North West service provider – we are consistently ranked third out of 10 leading organisations in the North West, through an independent brand tracker survey which is undertaken quarterly. This covers key attributes such as reputation, trustworthiness and customer service. We are behind only Marks & Spencer and John Lewis, and ahead of seven other major organisations covering utilities, telecoms, media and banking services.
Robust water supply – our customers benefit from our robust water supply and demand balance, along with high levels of water supply reliability. Our overall water quality continues to be good, and although our water quality service index has slightly deteriorated compared with the prior year, it remains above our historical average and we have plans in place to deliver improved performance going forward. We have consistently delivered a reliable water service, although we have experienced some water no-supply incidents in the 2015–20 regulatory period. Whilst this is disappointing, our Systems Thinking approach is helping us to respond to these events and avoid them in future.
Reducing sewer flooding – we have continued to invest heavily in schemes, projects and programmes of work designed to reduce the risk of flooding of our customers’ homes, including incidence-based targeting on areas more likely to experience flooding and defect identification through CCTV sewer surveys and other innovative technologies. Our plan for the 2015–20 regulatory period includes a target of reducing sewer flooding incidents by over 40 per cent, in line with customers’ affordability preferences, and we are making good progress. We have achieved our best-ever five-year performance on our repeat flooding and internal operational flooding measures. Our wastewater network will continue to benefit from significant investment going forward and we will continue to seek to work in collaboration with other external lead flood authorities and associated partners to address the widespread flooding events that hit our region, as we aim to help mitigate changing weather patterns likely to result from climate change.
Key performance indicators:
Outcome delivery incentives (ODIs) – we have 19 wholesale financial ODIs and as was supported by customers, the risk is skewed to the downside with only 10 providing the potential to earn a reward in the 2015–20 regulatory period.
Our performance for 2017/18 has resulted in a £7.0 million net penalty. Overall, performance was again good against our wastewater measures but we recognise that there are still areas in which we can improve against our water measures, and we are committed to achieving this.
We are pleased with our cumulative performance over the first three years of the current regulatory period resulting in a net reward of £2.2 million, exceeding our initial expectations. Whilst a number of our ODI measures are susceptible to one-off events and, on the whole, our ODI targets get tougher each year, our strong performance to date coupled with continued targeted investment alongside our Systems Thinking and innovative approach to the way we operate, gives us confidence that we will achieve a cumulative net ODI outcome over the 2015–20 regulatory period in positive reward territory.
Our main areas of reward to date have come through our performance in the areas of private sewers, pollution and leakage, with our main penalty being on reliable water service and water quality service.
Service incentive mechanism (SIM) – we have previously stated our target was to move towards the upper quartile in the medium term, and we are particularly pleased with the progress we have made this year, ending the year as a leading company in our peer group.
Qualitative: Ofwat has undertaken the four surveys for 2017/18 and United Utilities has improved its score to 4.49 points, compared with 4.42 points in 2016/17, putting us in third position for the year out of the 18 water companies, and also third position out of the 10 companies providing both water and wastewater services. We ended the year with our highest ever score of 4.61 in wave 4, which placed us in first position in this wave for the sector overall. In particular, customers scored us highly for our billing and wastewater services.
Quantitative: the quantitative assessment measures customer contacts and performance is assessed on both an absolute and relative basis. Whilst relative performance can only be assessed in full following the end of each financial year when the other companies publish their respective results, on absolute performance for 2017/18, our score of 71 points represents a marked improvement on our 2016/17 score of 77 points. For the first nine months of the year, of the companies that share data on quantitative SIM, we were first of the seven water and wastewater companies and fourth of the 11 water companies.
United Utilities 2018.indd 42 6/1/2018 2:07:10 PM
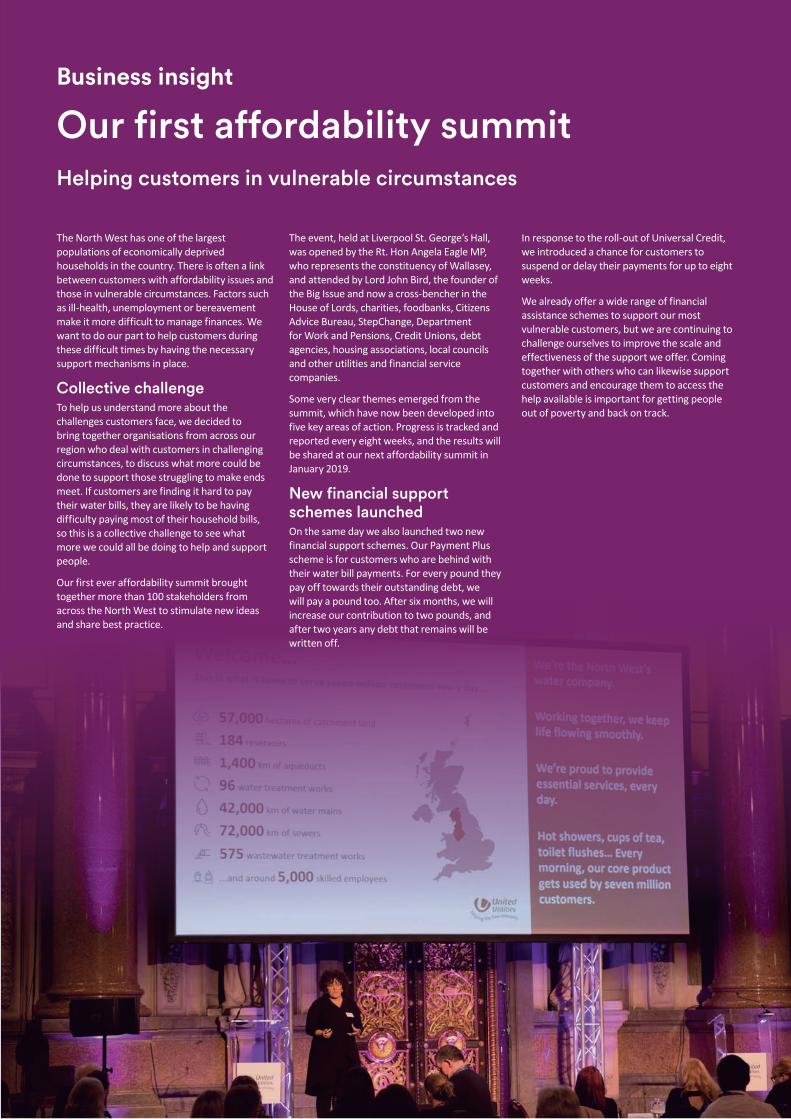
Job Number 1 June 2018 2:04 PM Proof 3 Job Number 1 June 2018 2:04 PM Proof 3
Stock Code: UU. unitedutilities.com/corporate
Job Number 1 June 2018 2:04 PM Proof NumberJob Number 1 June 2018 2:04 PM Proof NumberJob Number 1 June 2018 2:04 PM Proof NumberJob Number 1 June 2018 2:04 PM Proof Number
Business insight
Our first affordability summit
The North West has one of the largest populations of economically deprived households in the country. There is often a link between customers with affordability issues and those in vulnerable circumstances. Factors such as ill-health, unemployment or bereavement make it more difficult to manage finances. We want to do our part to help customers during these difficult times by having the necessary support mechanisms in place.
Collective challengeTo help us understand more about the challenges customers face, we decided to bring together organisations from across our region who deal with customers in challenging circumstances, to discuss what more could be done to support those struggling to make ends meet. If customers are finding it hard to pay their water bills, they are likely to be having difficulty paying most of their household bills, so this is a collective challenge to see what more we could all be doing to help and support people.
Our first ever affordability summit brought together more than 100 stakeholders from across the North West to stimulate new ideas and share best practice.
The event, held at Liverpool St. George’s Hall, was opened by the Rt. Hon Angela Eagle MP, who represents the constituency of Wallasey, and attended by Lord John Bird, the founder of the Big Issue and now a cross-bencher in the House of Lords, charities, foodbanks, Citizens Advice Bureau, StepChange, Department for Work and Pensions, Credit Unions, debt agencies, housing associations, local councils and other utilities and financial service companies.
Some very clear themes emerged from the summit, which have now been developed into five key areas of action. Progress is tracked and reported every eight weeks, and the results will be shared at our next affordability summit in January 2019.
New financial support schemes launchedOn the same day we also launched two new financial support schemes. Our Payment Plus scheme is for customers who are behind with their water bill payments. For every pound they pay off towards their outstanding debt, we will pay a pound too. After six months, we will increase our contribution to two pounds, and after two years any debt that remains will be written off.
In response to the roll-out of Universal Credit, we introduced a chance for customers to suspend or delay their payments for up to eight weeks.
We already offer a wide range of financial assistance schemes to support our most vulnerable customers, but we are continuing to challenge ourselves to improve the scale and effectiveness of the support we offer. Coming together with others who can likewise support customers and encourage them to access the help available is important for getting people out of poverty and back on track.
Helping customers in vulnerable circumstances
United Utilities 2018.indd 43 6/1/2018 2:07:11 PM
Job Number 1 June 2018 2:04 PM Proof 3 Job Number 1 June 2018 2:04 PM Proof 3
44
United Utilities Group PLC Annual Report and Financial Statements for the year ended 31 March 2018
Job Number 1 June 2018 2:04 PM Proof NumberJob Number 1 June 2018 2:04 PM Proof NumberJob Number 1 June 2018 2:04 PM Proof NumberJob Number 1 June 2018 2:04 PM Proof Number
Our performance in 2017/18 continued
Operational performance
At the lowest sustainable cost
Power and chemicals – our asset optimisation programme continues to provide the benefits of increased and more effective use of operational site management to optimise power and chemical use and the development of more combined heat and power assets to generate renewable energy. In addition to the electricity we generate from bioresources, we are developing other renewable energy facilities. This is primarily in the area of solar, where we have invested £53 million in the first three years of the 2015–20 regulatory period and contributing towards our expected investment of up to £100 million across the five-year period. We have also substantially locked-in our power commodity costs across 2015–20, providing greater cost certainty for the regulatory period.
Proactive network management – through our Systems Thinking approach we are more proactive in the management of our assets and networks. We have improved our predictive modelling and forecasting through better use of sensors in our network and better analysis of other data, such as weather forecasting, enabling us to address more asset and network problems before they affect customers. This reduces the level of reactive work and improves our performance and efficiency.
Debt collection – our region suffers from high levels of income deprivation and we offer wide-ranging schemes to help customers struggling to pay. We now have over 100,000 customers on affordability schemes, almost double the commitment we made at the start of AMP6. Notwithstanding our industry-leading debt management processes, deprivation remains the principal driver of our higher than average bad debt and cost to serve and we expect this to continue to be a challenging area for us.
Reflecting our ongoing focus on bad debt through initiatives such as our affordability schemes, our household bad debt expense has reduced to 2.3 per cent of regulated revenue from 2.5 per cent last year.
Pensions – United Utilities has taken progressive steps to de-risk its pension provision. The group had an IFRS retirement benefit surplus of £344 million as at 31 March 2018, compared with a surplus of £248 million as at 31 March 2017. Further details of the group’s pension provision are provided in the pensions section on pages 153 to 154.
From 1 April 2018, the majority of active members in the defined benefit sections of the group’s pension schemes transitioned to a hybrid section incorporating both defined benefit and defined contribution elements. The changes have had no impact on the financial statements for the year ended 31 March 2018 as they have only taken effect for pensionable service from 1 April 2018.
Capital delivery and regulatory commitments – we are strongly focused on delivering our commitments efficiently and on time, and have a robust commercial capital delivery framework in place. Across the 2015–20 regulatory period, we are working with a single engineering partner and four design and construction partners to deliver our regulatory capital investment programme of around £3.8 billion. We are involving our partners much earlier in project definition and packaging projects by type, geography and timing in order to deliver efficiencies. Projects are allocated on an incentive or competitive basis leading to our partners presenting a range of solutions, innovations and pricing.
We have accelerated our 2015–20 investment programme in order to improve services for customers and deliver early operational and environmental benefits. Regulatory capital investment in 2017/18, including £147 million of infrastructure renewals expenditure, was £816 million, including additional investment that we have committed to, sharing our overall regulatory outperformance with customers. This, combined with £1.6 billion invested in the first two years of the regulatory period, brings our total spend to around £2.4 billion of our planned £3.8 billion capital investment across the 2015–20 regulatory period.
We are also driving more effective and efficient delivery of our capital programme and applying a tougher measurement mechanism to our Time: Cost: Quality index (TCQi) score for this regulatory period. Despite this tougher approach, our TCQi score remains high at 93 per cent, representing very good performance.
Key performance indicators:
Total expenditure (totex) performance – our totex allowance for the 2015–20 regulatory period represented a significant challenge compared with the costs we originally submitted as part of our business plan. We have not only closed the gap to our allowance but we are now also confident of outperforming that allowance by £100 million. This has been achieved through a combination of driving efficiency into our capital programme and also through Systems Thinking.
Financing outperformance – the low cost of debt we have already locked-in places United Utilities in a strong position to deliver significant outperformance for the 2015–20 regulatory period compared with the industry allowed cost.
Household retail cost to serve – we continue to deliver against a challenging benchmark set for AMP6. Our target is to minimise our costs compared with our revenue allowance and we have delivered a good performance in 2017/18, outperforming this year’s revenue allowance by around £9 million. By 2020, we are forecasting a cost to serve in line with the regulatory cost allowance and we are hopeful that our cost plans will move us towards upper quartile performance in AMP7.
United Utilities 2018.indd 44 6/1/2018 2:07:11 PM

Job Number 1 June 2018 2:04 PM Proof 3 Job Number 1 June 2018 2:04 PM Proof 3
Stock Code: UU. unitedutilities.com/corporate
Job Number 1 June 2018 2:04 PM Proof NumberJob Number 1 June 2018 2:04 PM Proof NumberJob Number 1 June 2018 2:04 PM Proof NumberJob Number 1 June 2018 2:04 PM Proof Number
Business insight
Design for manufacture and assembly
The 2015–20 capital programme represented a significant opportunity for us. The traditional challenges around time and cost demanded disruptive solutions to confront the normal ways of working. Conventional on-site manufacturing can be noisy and disruptive for our customers and neighbours, and it can be expensive to remove the inherent safety risks that go with being on busy construction sites.
Designing and building off-site in a factory reduces the disruption for customers and lessens the on-site safety risk. Design for manufacture and assembly (DfMA) involves the digital design and prefabrication of a significant proportion of a project offsite. Working in a DfMA and Building Information Modelling (BIM) environment allows standard supply chain products to be embedded within the BIM model and then ordered and built within the supply chain. We have seen this with electrical kiosk design, procurement and assembly, where the risk for rework and on-site modifications was significantly reduced as a result of this new approach.
Strategic successHaving already made a significant return on investment, the DfMA initiative has been a strategic success. It started as an innovation project, but now it is the accepted way of working within our business and our supply chain.
As a result, we have already delivered over £5.2 million in direct construction cost savings, nearly 11,500 site days, as well as innumerable productivity and health and safety benefits.
The default programme approach to DfMA has driven a culture within our partners and their supply chain, which will benefit capital programmes in the future. We will see more and more standard products being developed by our supply chain, which will increase the proportion of our construction projects going forward that use DfMA.
Jackson’s Edge service reservoirWe appointed a construction company to replace an existing service reservoir that was over 100 years old with an expired asset life. The new asset consists of two reservoir compartments, the first of which was to be commissioned prior to commencing construction of the second, thereby allowing the existing asset to be demolished whilst maintaining supply.
Due to its proximity to residential properties, and in order to deliver the scheme as efficiently as possible, a DfMA approach was selected using a system of modular pre-cast wall panels. DFMA led to a significant reduction in the timescale of the overall programme (8-10 weeks) as well as a reduced number of people on site.
Further efficiencies were achieved through the use of BIM and the coordination of civil, structural and mechanical discipline models, helping to ensure the design was right first time. The project was completed in October 2016.
Delivering significant construction cost savings
©www.SuaveAirPhotos.co.uk
United Utilities 2018.indd 45 6/1/2018 2:07:12 PM
Job Number 1 June 2018 2:04 PM Proof 3 Job Number 1 June 2018 2:04 PM Proof 3
46
United Utilities Group PLC Annual Report and Financial Statements for the year ended 31 March 2018
Our performance in 2017/18 continued
Operational performance
In a responsible manner
Behaving responsibly is fundamental to the manner in which we undertake our business, and the group has for many years included corporate responsibility factors in its strategic decision making. Our environmental, social and governance performance across a broad front has received external recognition. Earlier in the 2017/18 financial year, United Utilities retained a World Class rating in the Dow Jones Sustainability Index for the tenth consecutive year, again achieving industry leading performance status in the multi-utility/water sector. Retaining ‘World Class’ status for this length of time is a significant achievement, particularly as the assessment standards continue to increase and evolve.
Leakage – we have continued our strong operational focus on leakage, alongside our network resilience improvements and a range of initiatives such as active pressure management, satellite technology and the UK’s first leakage sniffer dog specially trained to pinpoint the exact location of leaks. This has delivered good performance against our leakage targets in 2017/18. Encouraging our customers to save water through water efficiency programmes not only enables them to help preserve this precious resource but can also save money on their water bill.
Environmental performance – this is a high priority for United Utilities and we were delighted to have retained our Industry Leading Company status in the Environment Agency’s latest performance metrics, as described in the KPIs section below. This is a result of our approach to managing our assets in an integrated way and has resulted in reduced environmental incidents. We still don’t always get it right and this year we delivered the obligations under our first enforcement undertakings, investing in catchment schemes rather than accepting formal prosecutions.
Carbon footprint – by 2020, we aim to reduce our carbon footprint by 50 per cent compared with a 2005/06 baseline and we are on track to do so. This year our carbon footprint has reduced to 391,640 tonnes of carbon dioxide equivalent, a reduction of one-third since 2005/06, helped by a 4 per cent reduction in electricity use. In addition, we generated more renewable energy than ever before, at 167 gigawatt hours, up 12 per cent on the previous year. This illustrates good progress in the company’s energy strategy to use less and generate more renewable energy.
Employees – we continue to work hard to engage all of our employees in the transformation of the group’s performance. Employee engagement was at 79 per cent this year, higher than the UK norm. We remain focused on maintaining high levels of employee engagement.
We have been successful in attracting and retaining people and have continued to expand our apprentice and graduate programmes for 2017/18. We now have a total of 55 graduates and 118 apprentices across the business. Our investment in recruiting graduates and apprentices is already benefiting the company with 153 employees securing permanent roles across our business, having previously been on either the graduate or apprentice scheme.
Over the last year, we have continued our sustained focus on health, safety and wellbeing. In this period we retained our Gold award status with the Royal Society for the Prevention of Accidents and our status under the UK workplace wellbeing charter. Our employee accident frequency rate for 2017/18 reduced to 0.101 accidents per 100,000 hours, compared with a rate of 0.196 in 2016/17. For the same period, our contractor accident frequency rate increased slightly to 0.092 per 100,000 hours, compared with a rate of 0.087 in 2016/17. We recognise that there is always more to do, and health, safety and wellbeing will continue to be a significant area of focus as we strive for continuous improvement.
Communities – we continue to support partnerships, both financially and in terms of employee time through volunteering, with other organisations across the North West. Our approach to integrated catchments helps to tackle water quality issues in lakes, rivers and coastal waters across the North West, and our LoveMyBeach contribution includes employees volunteering to help to keep our region’s beaches tidy. We continue to support local communities through contributions and schemes such as providing debt advisory services and, our work with Youth Focus North West engages the region’s young people, and our future customers, with our business planning process.
Key performance indicators:
Leakage – Although leakage is included within our outcome delivery incentives, we intend to continue publishing our leakage position separately, with it being an important measure from a corporate responsibility perspective. In 2017/18 we have again met our regulatory leakage target of 463 megalitres per day.
Environmental performance – On the Environment Agency’s latest annual assessment, published in July 2017, we were awarded Industry Leading Company status across the range of operational metrics for the second year running and were one of only two companies to achieve this status. This aligns with our medium-term goal of being a first quartile company on a consistent basis.
Corporate responsibility – United Utilities has a strong focus on operating in a responsible manner and is the only UK water company to have a World Class rating as measured by the Dow Jones Sustainability Index. In 2017/18, United Utilities retained its World Class rating for the tenth consecutive year.
United Utilities 2018.indd 46 6/1/2018 2:07:13 PM

Job Number 4 June 2018 8:55 AM Proof 3 Job Number 4 June 2018 8:55 AM Proof 3
Stock Code: UU. unitedutilities.com/corporate
Business insight
Sustainable drainage solutions
Urban creep – the conversion of existing permeable areas – has increased significantly over the last ten years. According to the Royal Horticultural Society (RHS), the proportion of front gardens that are completely paved over in the North West increased from four per cent in 2005 to 21 per cent in 2015. Back gardens have also been built on, with new extensions and conservatories that may then be connected into surface water drains.
Surface water run-off from new developments and urban creep leads to higher peak flows in the sewer system. This leads to a higher risk of sewer flooding, and increasing frequency and duration of intermittent overflows to watercourses.
In order to protect customers and the environment, there is a need to reduce flooding and spills, and improve the resilience of the sewer network to cope with peak storm events. We need to do this in a more sustainable way than traditional interventions, such as storage tanks and upsized sewers, which is why we are taking a positive approach to sustainable drainage solutions (SuDS) for surface water management.
Slow the flow gardenWe are working with partners (City of Trees, RHS) to transform hard grey areas into living, planted places. So far we have initiated several key SuDS projects, including our show garden at RHS Tatton in 2017, which demonstrated how a front garden could be designed to contain sustainable drainage solutions instead of traditional hardstanding areas.
Our ‘Slow the Flow’ garden, designed by John Everiss Design Ltd and Francesca Murrell, received excellent feedback and won Best Show Garden at Tatton 2017. It has since been relocated to Moss Bank Park in Bolton, which is open to the general public, to help increase the numbers of customers that can be informed about sustainable surface water management.
Informing our customersThere are, on average, 75,000 visitors to Tatton flower show every year, with 63 per cent being from the North West (more than any other RHS show). The show receives television and radio coverage and is also widely promoted using social media.
This project therefore contributed significantly to educating and influencing customers on surface water management at a household level, particularly relevant for new developments and surface water run-off, and provides us with information on the cost and feasibility of this type of solution. It helped highlight to household customers the impact of urban creep on downstream flooding, and educate them on how they can play their part in reducing peak flow to combined sewer systems.
Reducing flooding and improving resilience
United Utilities 2018.indd 47 04/06/2018 09:33:29
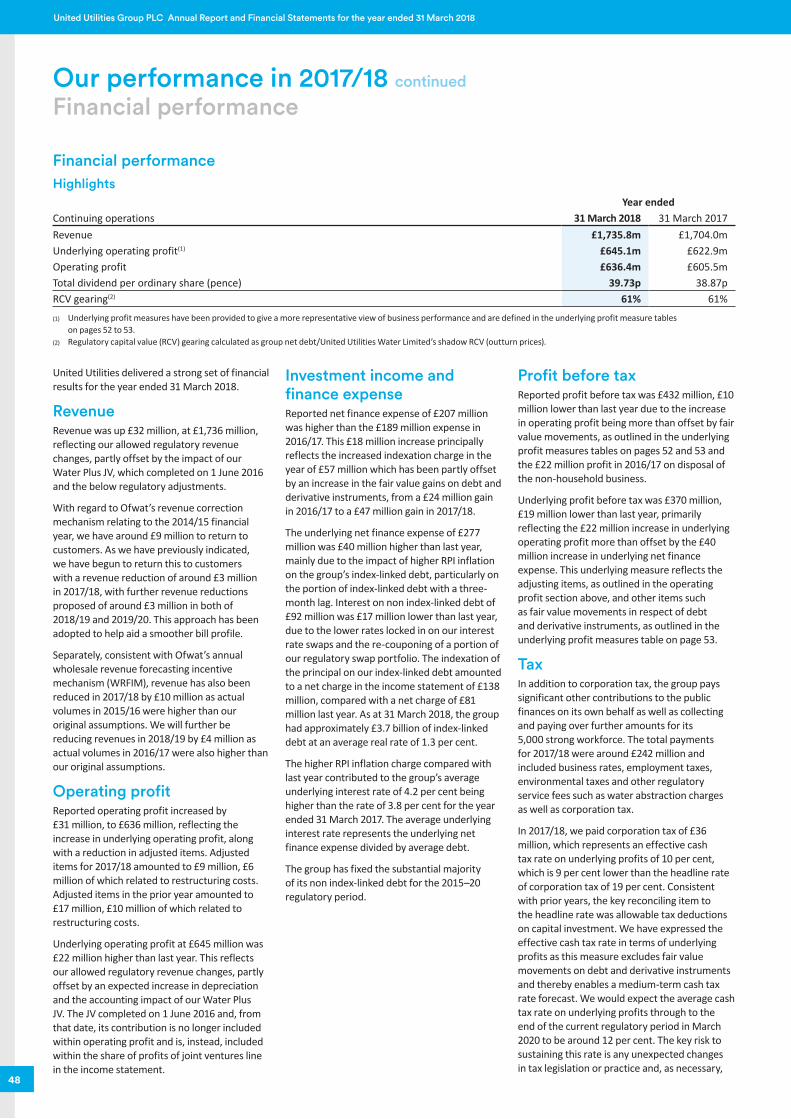
Job Number 1 June 2018 2:04 PM Proof 3 Job Number 1 June 2018 2:04 PM Proof 3
48
United Utilities Group PLC Annual Report and Financial Statements for the year ended 31 March 2018
Our performance in 2017/18 continued
Financial performance
Financial performanceHighlights
Year endedContinuing operations 31 March 2018 31 March 2017Revenue £1,735.8m £1,704.0mUnderlying operating profit(1) £645.1m £622.9mOperating profit £636.4m £605.5mTotal dividend per ordinary share (pence) 39.73p 38.87pRCV gearing(2) 61% 61%
(1) Underlying profit measures have been provided to give a more representative view of business performance and are defined in the underlying profit measure tables on pages 52 to 53.
(2) Regulatory capital value (RCV) gearing calculated as group net debt/United Utilities Water Limited’s shadow RCV (outturn prices).
United Utilities delivered a strong set of financial results for the year ended 31 March 2018.
RevenueRevenue was up £32 million, at £1,736 million, reflecting our allowed regulatory revenue changes, partly offset by the impact of our Water Plus JV, which completed on 1 June 2016 and the below regulatory adjustments.
With regard to Ofwat’s revenue correction mechanism relating to the 2014/15 financial year, we have around £9 million to return to customers. As we have previously indicated, we have begun to return this to customers with a revenue reduction of around £3 million in 2017/18, with further revenue reductions proposed of around £3 million in both of 2018/19 and 2019/20. This approach has been adopted to help aid a smoother bill profile.
Separately, consistent with Ofwat’s annual wholesale revenue forecasting incentive mechanism (WRFIM), revenue has also been reduced in 2017/18 by £10 million as actual volumes in 2015/16 were higher than our original assumptions. We will further be reducing revenues in 2018/19 by £4 million as actual volumes in 2016/17 were also higher than our original assumptions.
Operating profitReported operating profit increased by £31 million, to £636 million, reflecting the increase in underlying operating profit, along with a reduction in adjusted items. Adjusted items for 2017/18 amounted to £9 million, £6 million of which related to restructuring costs. Adjusted items in the prior year amounted to £17 million, £10 million of which related to restructuring costs.
Underlying operating profit at £645 million was £22 million higher than last year. This reflects our allowed regulatory revenue changes, partly offset by an expected increase in depreciation and the accounting impact of our Water Plus JV. The JV completed on 1 June 2016 and, from that date, its contribution is no longer included within operating profit and is, instead, included within the share of profits of joint ventures line in the income statement.
Investment income and finance expenseReported net finance expense of £207 million was higher than the £189 million expense in 2016/17. This £18 million increase principally reflects the increased indexation charge in the year of £57 million which has been partly offset by an increase in the fair value gains on debt and derivative instruments, from a £24 million gain in 2016/17 to a £47 million gain in 2017/18.
The underlying net finance expense of £277 million was £40 million higher than last year, mainly due to the impact of higher RPI inflation on the group’s index-linked debt, particularly on the portion of index-linked debt with a three-month lag. Interest on non index-linked debt of £92 million was £17 million lower than last year, due to the lower rates locked in on our interest rate swaps and the re-couponing of a portion of our regulatory swap portfolio. The indexation of the principal on our index-linked debt amounted to a net charge in the income statement of £138 million, compared with a net charge of £81 million last year. As at 31 March 2018, the group had approximately £3.7 billion of index-linked debt at an average real rate of 1.3 per cent.
The higher RPI inflation charge compared with last year contributed to the group’s average underlying interest rate of 4.2 per cent being higher than the rate of 3.8 per cent for the year ended 31 March 2017. The average underlying interest rate represents the underlying net finance expense divided by average debt.
The group has fixed the substantial majority of its non index-linked debt for the 2015–20 regulatory period.
Profit before taxReported profit before tax was £432 million, £10 million lower than last year due to the increase in operating profit being more than offset by fair value movements, as outlined in the underlying profit measures tables on pages 52 and 53 and the £22 million profit in 2016/17 on disposal of the non-household business.
Underlying profit before tax was £370 million, £19 million lower than last year, primarily reflecting the £22 million increase in underlying operating profit more than offset by the £40 million increase in underlying net finance expense. This underlying measure reflects the adjusting items, as outlined in the operating profit section above, and other items such as fair value movements in respect of debt and derivative instruments, as outlined in the underlying profit measures table on page 53.
TaxIn addition to corporation tax, the group pays significant other contributions to the public finances on its own behalf as well as collecting and paying over further amounts for its 5,000 strong workforce. The total payments for 2017/18 were around £242 million and included business rates, employment taxes, environmental taxes and other regulatory service fees such as water abstraction charges as well as corporation tax.
In 2017/18, we paid corporation tax of £36 million, which represents an effective cash tax rate on underlying profits of 10 per cent, which is 9 per cent lower than the headline rate of corporation tax of 19 per cent. Consistent with prior years, the key reconciling item to the headline rate was allowable tax deductions on capital investment. We have expressed the effective cash tax rate in terms of underlying profits as this measure excludes fair value movements on debt and derivative instruments and thereby enables a medium-term cash tax rate forecast. We would expect the average cash tax rate on underlying profits through to the end of the current regulatory period in March 2020 to be around 12 per cent. The key risk to sustaining this rate is any unexpected changes in tax legislation or practice and, as necessary,
United Utilities 2018.indd 48 6/1/2018 2:07:14 PM
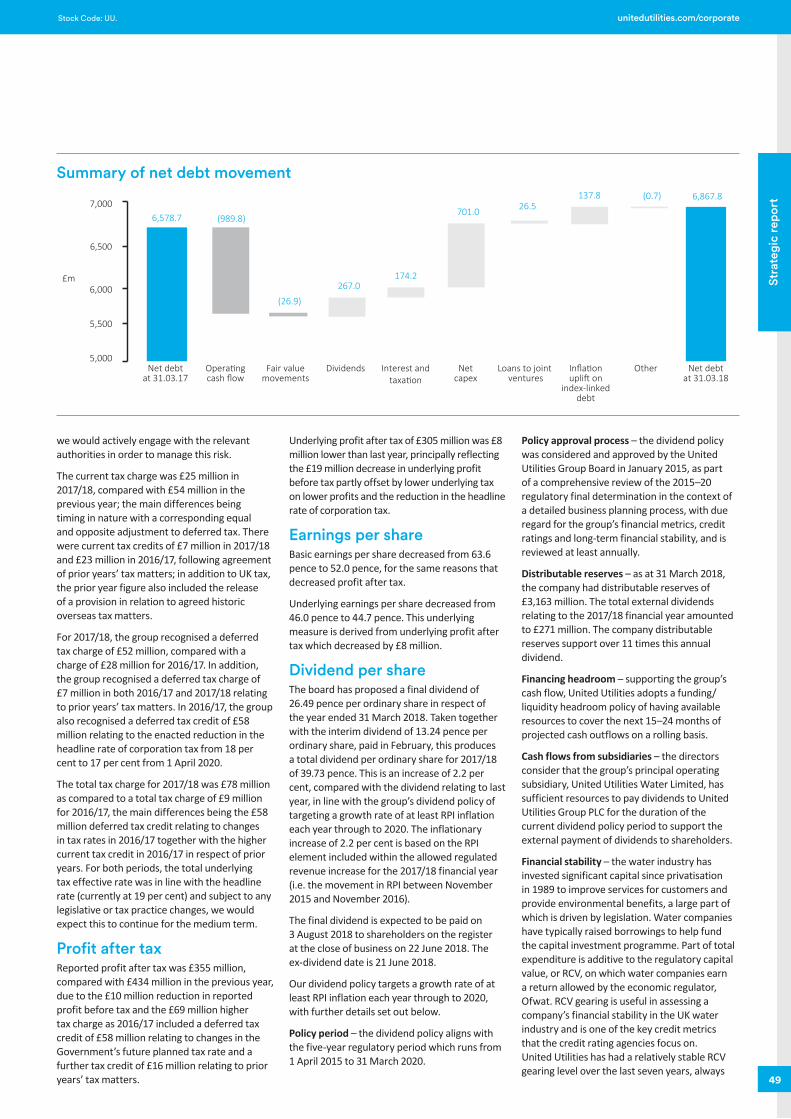
Job Number 1 June 2018 2:04 PM Proof 3 Job Number 1 June 2018 2:04 PM Proof 3
49
Stra
tegi
c re
port
Stock Code: UU. unitedutilities.com/corporate
we would actively engage with the relevant authorities in order to manage this risk.
The current tax charge was £25 million in 2017/18, compared with £54 million in the previous year; the main differences being timing in nature with a corresponding equal and opposite adjustment to deferred tax. There were current tax credits of £7 million in 2017/18 and £23 million in 2016/17, following agreement of prior years’ tax matters; in addition to UK tax, the prior year figure also included the release of a provision in relation to agreed historic overseas tax matters.
For 2017/18, the group recognised a deferred tax charge of £52 million, compared with a charge of £28 million for 2016/17. In addition, the group recognised a deferred tax charge of £7 million in both 2016/17 and 2017/18 relating to prior years’ tax matters. In 2016/17, the group also recognised a deferred tax credit of £58 million relating to the enacted reduction in the headline rate of corporation tax from 18 per cent to 17 per cent from 1 April 2020.
The total tax charge for 2017/18 was £78 million as compared to a total tax charge of £9 million for 2016/17, the main differences being the £58 million deferred tax credit relating to changes in tax rates in 2016/17 together with the higher current tax credit in 2016/17 in respect of prior years. For both periods, the total underlying tax effective rate was in line with the headline rate (currently at 19 per cent) and subject to any legislative or tax practice changes, we would expect this to continue for the medium term.
Profit after taxReported profit after tax was £355 million, compared with £434 million in the previous year, due to the £10 million reduction in reported profit before tax and the £69 million higher tax charge as 2016/17 included a deferred tax credit of £58 million relating to changes in the Government’s future planned tax rate and a further tax credit of £16 million relating to prior years’ tax matters.
Underlying profit after tax of £305 million was £8 million lower than last year, principally reflecting the £19 million decrease in underlying profit before tax partly offset by lower underlying tax on lower profits and the reduction in the headline rate of corporation tax.
Earnings per shareBasic earnings per share decreased from 63.6 pence to 52.0 pence, for the same reasons that decreased profit after tax.
Underlying earnings per share decreased from 46.0 pence to 44.7 pence. This underlying measure is derived from underlying profit after tax which decreased by £8 million.
Dividend per shareThe board has proposed a final dividend of 26.49 pence per ordinary share in respect of the year ended 31 March 2018. Taken together with the interim dividend of 13.24 pence per ordinary share, paid in February, this produces a total dividend per ordinary share for 2017/18 of 39.73 pence. This is an increase of 2.2 per cent, compared with the dividend relating to last year, in line with the group’s dividend policy of targeting a growth rate of at least RPI inflation each year through to 2020. The inflationary increase of 2.2 per cent is based on the RPI element included within the allowed regulated revenue increase for the 2017/18 financial year (i.e. the movement in RPI between November 2015 and November 2016).
The final dividend is expected to be paid on 3 August 2018 to shareholders on the register at the close of business on 22 June 2018. The ex-dividend date is 21 June 2018.
Our dividend policy targets a growth rate of at least RPI inflation each year through to 2020, with further details set out below.
Policy period – the dividend policy aligns with the five-year regulatory period which runs from 1 April 2015 to 31 March 2020.
Policy approval process – the dividend policy was considered and approved by the United Utilities Group Board in January 2015, as part of a comprehensive review of the 2015–20 regulatory final determination in the context of a detailed business planning process, with due regard for the group’s financial metrics, credit ratings and long-term financial stability, and is reviewed at least annually.
Distributable reserves – as at 31 March 2018, the company had distributable reserves of £3,163 million. The total external dividends relating to the 2017/18 financial year amounted to £271 million. The company distributable reserves support over 11 times this annual dividend.
Financing headroom – supporting the group’s cash flow, United Utilities adopts a funding/liquidity headroom policy of having available resources to cover the next 15–24 months of projected cash outflows on a rolling basis.
Cash flows from subsidiaries – the directors consider that the group’s principal operating subsidiary, United Utilities Water Limited, has sufficient resources to pay dividends to United Utilities Group PLC for the duration of the current dividend policy period to support the external payment of dividends to shareholders.
Financial stability – the water industry has invested significant capital since privatisation in 1989 to improve services for customers and provide environmental benefits, a large part of which is driven by legislation. Water companies have typically raised borrowings to help fund the capital investment programme. Part of total expenditure is additive to the regulatory capital value, or RCV, on which water companies earn a return allowed by the economic regulator, Ofwat. RCV gearing is useful in assessing a company’s financial stability in the UK water industry and is one of the key credit metrics that the credit rating agencies focus on. United Utilities has had a relatively stable RCV gearing level over the last seven years, always
Net debtat 31.03.17
7,000
6,500
6,000
5,500
£m
5,000Opera�ngcash flow
Dividends Interest andtaxa�on
Netcapex
Loans to joint ventures
Fair valuemovements
Infla�onupli� on
index-linkeddebt
Other Net debtat 31.03.18
6,867.8(0.7)137.826.5701.0
174.2267.0
(26.9)
(989.8)6,578.7
Summary of net debt movement
United Utilities 2018.indd 49 6/1/2018 2:07:14 PM
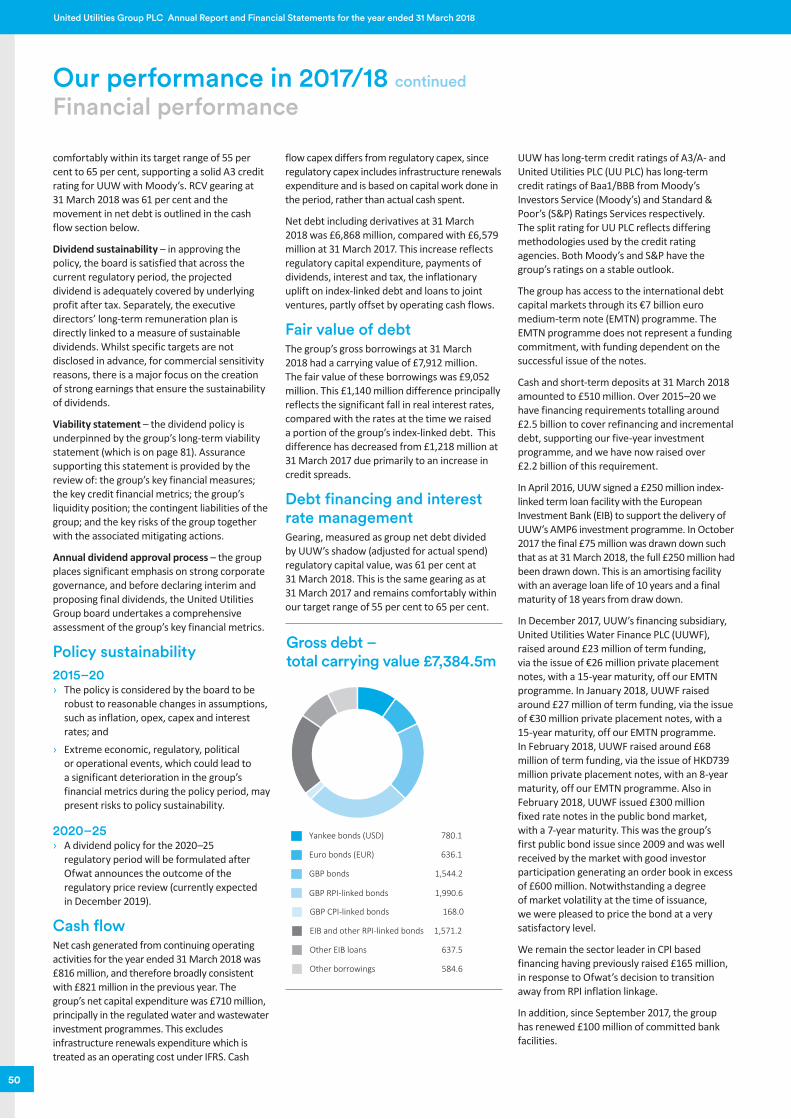
Job Number 1 June 2018 2:04 PM Proof 3 Job Number 1 June 2018 2:04 PM Proof 3
50
United Utilities Group PLC Annual Report and Financial Statements for the year ended 31 March 2018
Our performance in 2017/18 continued
Financial performance
comfortably within its target range of 55 per cent to 65 per cent, supporting a solid A3 credit rating for UUW with Moody’s. RCV gearing at 31 March 2018 was 61 per cent and the movement in net debt is outlined in the cash flow section below.
Dividend sustainability – in approving the policy, the board is satisfied that across the current regulatory period, the projected dividend is adequately covered by underlying profit after tax. Separately, the executive directors’ long-term remuneration plan is directly linked to a measure of sustainable dividends. Whilst specific targets are not disclosed in advance, for commercial sensitivity reasons, there is a major focus on the creation of strong earnings that ensure the sustainability of dividends.
Viability statement – the dividend policy is underpinned by the group’s long-term viability statement (which is on page 81). Assurance supporting this statement is provided by the review of: the group’s key financial measures; the key credit financial metrics; the group’s liquidity position; the contingent liabilities of the group; and the key risks of the group together with the associated mitigating actions.
Annual dividend approval process – the group places significant emphasis on strong corporate governance, and before declaring interim and proposing final dividends, the United Utilities Group board undertakes a comprehensive assessment of the group’s key financial metrics.
Policy sustainability2015–20 › The policy is considered by the board to be
robust to reasonable changes in assumptions, such as inflation, opex, capex and interest rates; and
› Extreme economic, regulatory, political or operational events, which could lead to a significant deterioration in the group’s financial metrics during the policy period, may present risks to policy sustainability.
2020–25 › A dividend policy for the 2020–25
regulatory period will be formulated after Ofwat announces the outcome of the regulatory price review (currently expected in December 2019).
Cash flow Net cash generated from continuing operating activities for the year ended 31 March 2018 was £816 million, and therefore broadly consistent with £821 million in the previous year. The group’s net capital expenditure was £710 million, principally in the regulated water and wastewater investment programmes. This excludes infrastructure renewals expenditure which is treated as an operating cost under IFRS. Cash
flow capex differs from regulatory capex, since regulatory capex includes infrastructure renewals expenditure and is based on capital work done in the period, rather than actual cash spent.
Net debt including derivatives at 31 March 2018 was £6,868 million, compared with £6,579 million at 31 March 2017. This increase reflects regulatory capital expenditure, payments of dividends, interest and tax, the inflationary uplift on index-linked debt and loans to joint ventures, partly offset by operating cash flows.
Fair value of debtThe group’s gross borrowings at 31 March 2018 had a carrying value of £7,912 million. The fair value of these borrowings was £9,052 million. This £1,140 million difference principally reflects the significant fall in real interest rates, compared with the rates at the time we raised a portion of the group’s index-linked debt. This difference has decreased from £1,218 million at 31 March 2017 due primarily to an increase in credit spreads.
Debt financing and interest rate managementGearing, measured as group net debt divided by UUW’s shadow (adjusted for actual spend) regulatory capital value, was 61 per cent at 31 March 2018. This is the same gearing as at 31 March 2017 and remains comfortably within our target range of 55 per cent to 65 per cent.
EIB and other RPI-linked bonds 1,571.2
GBP CPI-linked bonds 168.0
Other EIB loans 637.5
Other borrowings 584.6
Yankee bonds (USD) 780.1
Euro bonds (EUR) 636.1
GBP RPI-linked bonds 1,990.6
GBP bonds 1,544.2
Gross debt – total carrying value £7,384.5m
UUW has long-term credit ratings of A3/A- and United Utilities PLC (UU PLC) has long-term credit ratings of Baa1/BBB from Moody’s Investors Service (Moody’s) and Standard & Poor’s (S&P) Ratings Services respectively. The split rating for UU PLC reflects differing methodologies used by the credit rating agencies. Both Moody’s and S&P have the group’s ratings on a stable outlook.
The group has access to the international debt capital markets through its €7 billion euro medium-term note (EMTN) programme. The EMTN programme does not represent a funding commitment, with funding dependent on the successful issue of the notes.
Cash and short-term deposits at 31 March 2018 amounted to £510 million. Over 2015–20 we have financing requirements totalling around £2.5 billion to cover refinancing and incremental debt, supporting our five-year investment programme, and we have now raised over £2.2 billion of this requirement.
In April 2016, UUW signed a £250 million index-linked term loan facility with the European Investment Bank (EIB) to support the delivery of UUW’s AMP6 investment programme. In October 2017 the final £75 million was drawn down such that as at 31 March 2018, the full £250 million had been drawn down. This is an amortising facility with an average loan life of 10 years and a final maturity of 18 years from draw down.
In December 2017, UUW’s financing subsidiary, United Utilities Water Finance PLC (UUWF), raised around £23 million of term funding, via the issue of €26 million private placement notes, with a 15-year maturity, off our EMTN programme. In January 2018, UUWF raised around £27 million of term funding, via the issue of €30 million private placement notes, with a 15-year maturity, off our EMTN programme. In February 2018, UUWF raised around £68 million of term funding, via the issue of HKD739 million private placement notes, with an 8-year maturity, off our EMTN programme. Also in February 2018, UUWF issued £300 million fixed rate notes in the public bond market, with a 7-year maturity. This was the group’s first public bond issue since 2009 and was well received by the market with good investor participation generating an order book in excess of £600 million. Notwithstanding a degree of market volatility at the time of issuance, we were pleased to price the bond at a very satisfactory level.
We remain the sector leader in CPI based financing having previously raised £165 million, in response to Ofwat’s decision to transition away from RPI inflation linkage.
In addition, since September 2017, the group has renewed £100 million of committed bank facilities.
United Utilities 2018.indd 50 6/1/2018 2:07:15 PM
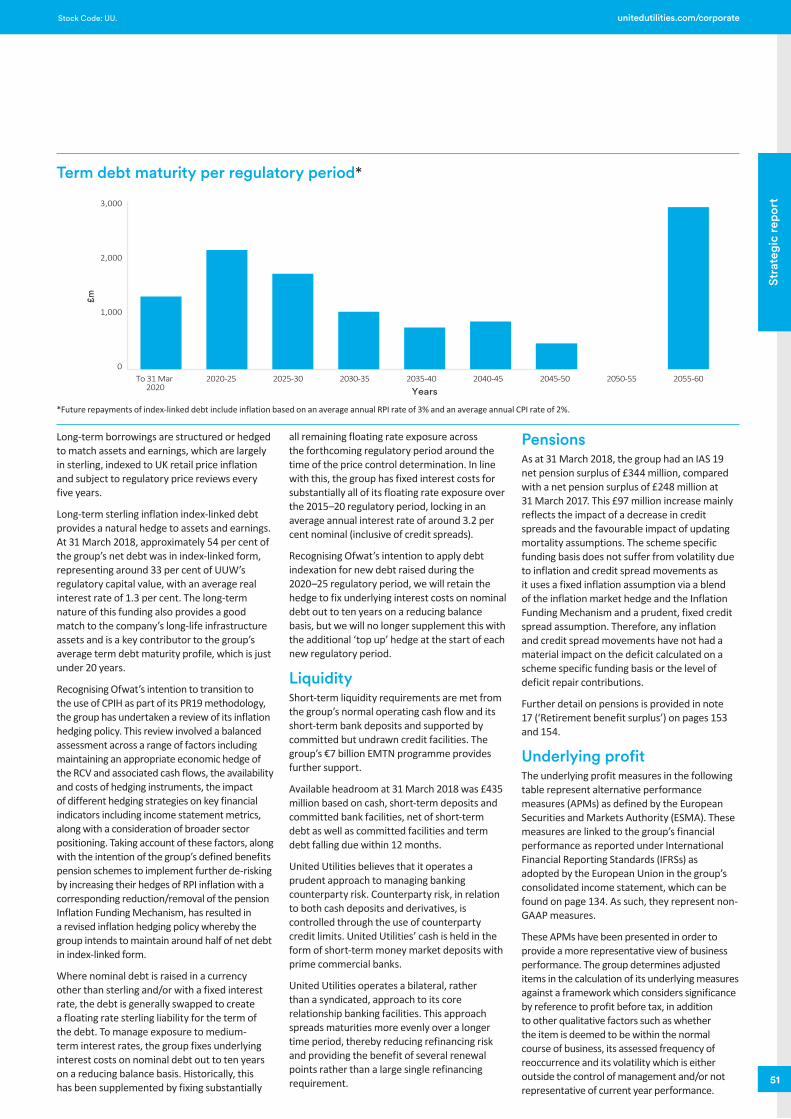
Job Number 1 June 2018 2:04 PM Proof 3 Job Number 1 June 2018 2:04 PM Proof 3
51
Stra
tegi
c re
port
Stock Code: UU. unitedutilities.com/corporate
Long-term borrowings are structured or hedged to match assets and earnings, which are largely in sterling, indexed to UK retail price inflation and subject to regulatory price reviews every five years.
Long-term sterling inflation index-linked debt provides a natural hedge to assets and earnings. At 31 March 2018, approximately 54 per cent of the group’s net debt was in index-linked form, representing around 33 per cent of UUW’s regulatory capital value, with an average real interest rate of 1.3 per cent. The long-term nature of this funding also provides a good match to the company’s long-life infrastructure assets and is a key contributor to the group’s average term debt maturity profile, which is just under 20 years.
Recognising Ofwat’s intention to transition to the use of CPIH as part of its PR19 methodology, the group has undertaken a review of its inflation hedging policy. This review involved a balanced assessment across a range of factors including maintaining an appropriate economic hedge of the RCV and associated cash flows, the availability and costs of hedging instruments, the impact of different hedging strategies on key financial indicators including income statement metrics, along with a consideration of broader sector positioning. Taking account of these factors, along with the intention of the group’s defined benefits pension schemes to implement further de-risking by increasing their hedges of RPI inflation with a corresponding reduction/removal of the pension Inflation Funding Mechanism, has resulted in a revised inflation hedging policy whereby the group intends to maintain around half of net debt in index-linked form.
Where nominal debt is raised in a currency other than sterling and/or with a fixed interest rate, the debt is generally swapped to create a floating rate sterling liability for the term of the debt. To manage exposure to medium-term interest rates, the group fixes underlying interest costs on nominal debt out to ten years on a reducing balance basis. Historically, this has been supplemented by fixing substantially
all remaining floating rate exposure across the forthcoming regulatory period around the time of the price control determination. In line with this, the group has fixed interest costs for substantially all of its floating rate exposure over the 2015–20 regulatory period, locking in an average annual interest rate of around 3.2 per cent nominal (inclusive of credit spreads).
Recognising Ofwat’s intention to apply debt indexation for new debt raised during the 2020–25 regulatory period, we will retain the hedge to fix underlying interest costs on nominal debt out to ten years on a reducing balance basis, but we will no longer supplement this with the additional ‘top up’ hedge at the start of each new regulatory period.
LiquidityShort-term liquidity requirements are met from the group’s normal operating cash flow and its short-term bank deposits and supported by committed but undrawn credit facilities. The group’s €7 billion EMTN programme provides further support.
Available headroom at 31 March 2018 was £435 million based on cash, short-term deposits and committed bank facilities, net of short-term debt as well as committed facilities and term debt falling due within 12 months.
United Utilities believes that it operates a prudent approach to managing banking counterparty risk. Counterparty risk, in relation to both cash deposits and derivatives, is controlled through the use of counterparty credit limits. United Utilities’ cash is held in the form of short-term money market deposits with prime commercial banks.
United Utilities operates a bilateral, rather than a syndicated, approach to its core relationship banking facilities. This approach spreads maturities more evenly over a longer time period, thereby reducing refinancing risk and providing the benefit of several renewal points rather than a large single refinancing requirement.
PensionsAs at 31 March 2018, the group had an IAS 19 net pension surplus of £344 million, compared with a net pension surplus of £248 million at 31 March 2017. This £97 million increase mainly reflects the impact of a decrease in credit spreads and the favourable impact of updating mortality assumptions. The scheme specific funding basis does not suffer from volatility due to inflation and credit spread movements as it uses a fixed inflation assumption via a blend of the inflation market hedge and the Inflation Funding Mechanism and a prudent, fixed credit spread assumption. Therefore, any inflation and credit spread movements have not had a material impact on the deficit calculated on a scheme specific funding basis or the level of deficit repair contributions.
Further detail on pensions is provided in note 17 (‘Retirement benefit surplus’) on pages 153 and 154.
Underlying profit The underlying profit measures in the following table represent alternative performance measures (APMs) as defined by the European Securities and Markets Authority (ESMA). These measures are linked to the group’s financial performance as reported under International Financial Reporting Standards (IFRSs) as adopted by the European Union in the group’s consolidated income statement, which can be found on page 134. As such, they represent non-GAAP measures.
These APMs have been presented in order to provide a more representative view of business performance. The group determines adjusted items in the calculation of its underlying measures against a framework which considers significance by reference to profit before tax, in addition to other qualitative factors such as whether the item is deemed to be within the normal course of business, its assessed frequency of reoccurrence and its volatility which is either outside the control of management and/or not representative of current year performance.
* Future repayments of index-linked debt include inflation based on an average annual RPI rate of 3% and an average annual CPI rate of 2%.
0
1,000
2,000
3,000
Years
£m
2020-25To 31 Mar 2020
2025-30 2030-35 2035-40 2040-45 2045-50 2050-55 2055-60
Term debt maturity per regulatory period*
United Utilities 2018.indd 51 6/1/2018 2:07:15 PM
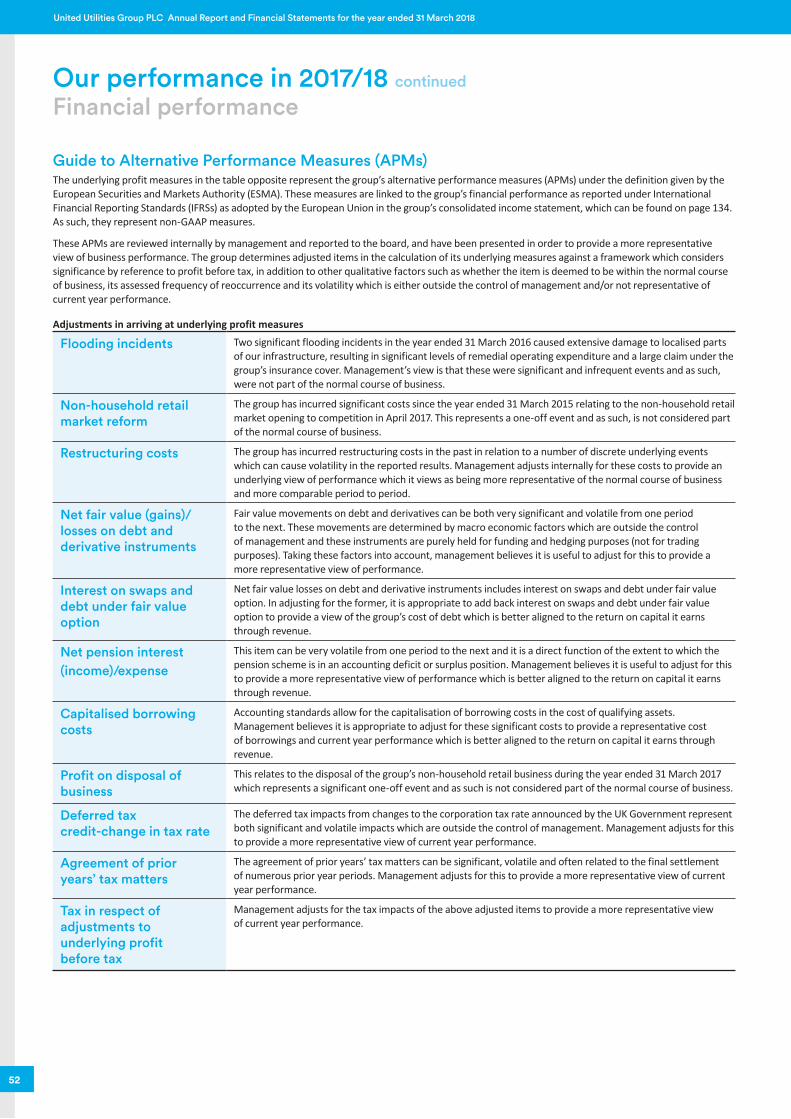
Job Number 1 June 2018 2:04 PM Proof 3 Job Number 1 June 2018 2:04 PM Proof 3
52
United Utilities Group PLC Annual Report and Financial Statements for the year ended 31 March 2018
Our performance in 2017/18 continued
Financial performance
Guide to Alternative Performance Measures (APMs)The underlying profit measures in the table opposite represent the group’s alternative performance measures (APMs) under the definition given by the European Securities and Markets Authority (ESMA). These measures are linked to the group’s financial performance as reported under International Financial Reporting Standards (IFRSs) as adopted by the European Union in the group’s consolidated income statement, which can be found on page 134. As such, they represent non-GAAP measures.
These APMs are reviewed internally by management and reported to the board, and have been presented in order to provide a more representative view of business performance. The group determines adjusted items in the calculation of its underlying measures against a framework which considers significance by reference to profit before tax, in addition to other qualitative factors such as whether the item is deemed to be within the normal course of business, its assessed frequency of reoccurrence and its volatility which is either outside the control of management and/or not representative of current year performance.
Adjustments in arriving at underlying profit measures
Flooding incidents Two significant flooding incidents in the year ended 31 March 2016 caused extensive damage to localised parts of our infrastructure, resulting in significant levels of remedial operating expenditure and a large claim under the group’s insurance cover. Management’s view is that these were significant and infrequent events and as such, were not part of the normal course of business.
Non-household retail market reform
The group has incurred significant costs since the year ended 31 March 2015 relating to the non-household retail market opening to competition in April 2017. This represents a one-off event and as such, is not considered part of the normal course of business.
Restructuring costs The group has incurred restructuring costs in the past in relation to a number of discrete underlying events which can cause volatility in the reported results. Management adjusts internally for these costs to provide an underlying view of performance which it views as being more representative of the normal course of business and more comparable period to period.
Net fair value (gains)/losses on debt and derivative instruments
Fair value movements on debt and derivatives can be both very significant and volatile from one period to the next. These movements are determined by macro economic factors which are outside the control of management and these instruments are purely held for funding and hedging purposes (not for trading purposes). Taking these factors into account, management believes it is useful to adjust for this to provide a more representative view of performance.
Interest on swaps and debt under fair value option
Net fair value losses on debt and derivative instruments includes interest on swaps and debt under fair value option. In adjusting for the former, it is appropriate to add back interest on swaps and debt under fair value option to provide a view of the group’s cost of debt which is better aligned to the return on capital it earns through revenue.
Net pension interest (income)/expense
This item can be very volatile from one period to the next and it is a direct function of the extent to which the pension scheme is in an accounting deficit or surplus position. Management believes it is useful to adjust for this to provide a more representative view of performance which is better aligned to the return on capital it earns through revenue.
Capitalised borrowing costs
Accounting standards allow for the capitalisation of borrowing costs in the cost of qualifying assets. Management believes it is appropriate to adjust for these significant costs to provide a representative cost of borrowings and current year performance which is better aligned to the return on capital it earns through revenue.
Profit on disposal of business
This relates to the disposal of the group’s non-household retail business during the year ended 31 March 2017 which represents a significant one-off event and as such is not considered part of the normal course of business.
Deferred tax credit-change in tax rate
The deferred tax impacts from changes to the corporation tax rate announced by the UK Government represent both significant and volatile impacts which are outside the control of management. Management adjusts for this to provide a more representative view of current year performance.
Agreement of prior years’ tax matters
The agreement of prior years’ tax matters can be significant, volatile and often related to the final settlement of numerous prior year periods. Management adjusts for this to provide a more representative view of current year performance.
Tax in respect of adjustments to underlying profit before tax
Management adjusts for the tax impacts of the above adjusted items to provide a more representative view of current year performance.
United Utilities 2018.indd 52 6/1/2018 2:07:15 PM
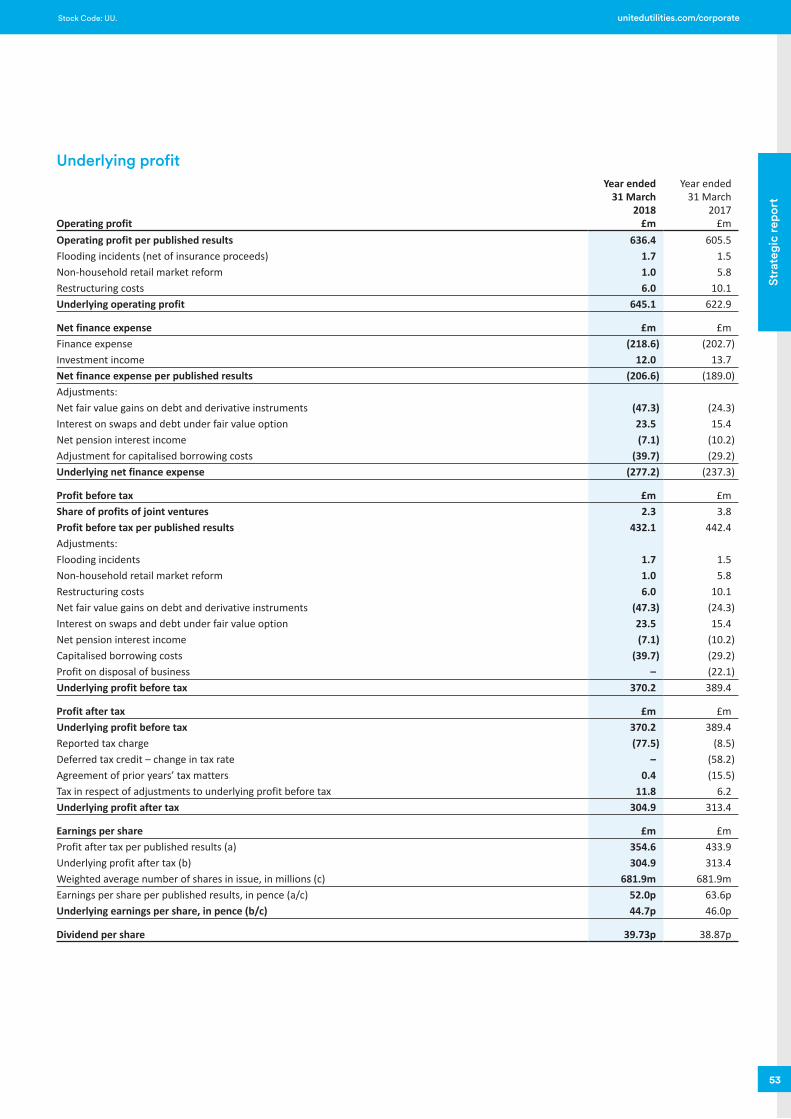
Job Number 1 June 2018 2:04 PM Proof 3 Job Number 1 June 2018 2:04 PM Proof 3
53
Stra
tegi
c re
port
Stock Code: UU. unitedutilities.com/corporate
Underlying profit
Operating profit
Year ended 31 March
2018 £m
Year ended 31 March
2017 £m
Operating profit per published results 636.4 605.5Flooding incidents (net of insurance proceeds) 1.7 1.5Non-household retail market reform 1.0 5.8Restructuring costs 6.0 10.1Underlying operating profit 645.1 622.9
Net finance expense £m £mFinance expense (218.6) (202.7)Investment income 12.0 13.7Net finance expense per published results (206.6) (189.0)Adjustments:Net fair value gains on debt and derivative instruments (47.3) (24.3)Interest on swaps and debt under fair value option 23.5 15.4Net pension interest income (7.1) (10.2)Adjustment for capitalised borrowing costs (39.7) (29.2)Underlying net finance expense (277.2) (237.3)
Profit before tax £m £mShare of profits of joint ventures 2.3 3.8Profit before tax per published results 432.1 442.4Adjustments:Flooding incidents 1.7 1.5Non-household retail market reform 1.0 5.8Restructuring costs 6.0 10.1Net fair value gains on debt and derivative instruments (47.3) (24.3)Interest on swaps and debt under fair value option 23.5 15.4Net pension interest income (7.1) (10.2)Capitalised borrowing costs (39.7) (29.2)Profit on disposal of business – (22.1)Underlying profit before tax 370.2 389.4
Profit after tax £m £mUnderlying profit before tax 370.2 389.4Reported tax charge (77.5) (8.5)Deferred tax credit – change in tax rate – (58.2)Agreement of prior years’ tax matters 0.4 (15.5)Tax in respect of adjustments to underlying profit before tax 11.8 6.2Underlying profit after tax 304.9 313.4
Earnings per share £m £mProfit after tax per published results (a) 354.6 433.9Underlying profit after tax (b) 304.9 313.4Weighted average number of shares in issue, in millions (c) 681.9m 681.9mEarnings per share per published results, in pence (a/c) 52.0p 63.6pUnderlying earnings per share, in pence (b/c) 44.7p 46.0p
Dividend per share 39.73p 38.87p
United Utilities 2018.indd 53 6/1/2018 2:07:15 PM
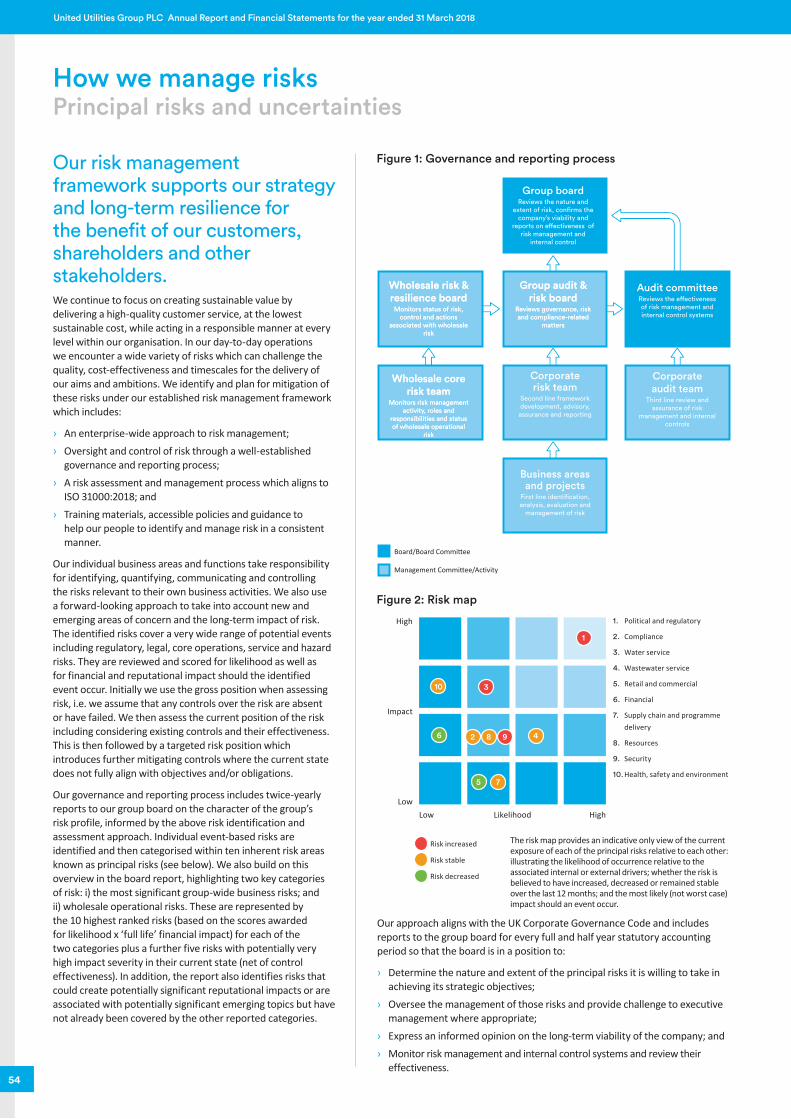
Job Number 1 June 2018 2:04 PM Proof 3 Job Number 1 June 2018 2:04 PM Proof 3
54
United Utilities Group PLC Annual Report and Financial Statements for the year ended 31 March 2018
How we manage risksPrincipal risks and uncertainties
Our risk management framework supports our strategy and long-term resilience for the benefit of our customers, shareholders and other stakeholders.We continue to focus on creating sustainable value by delivering a high-quality customer service, at the lowest sustainable cost, while acting in a responsible manner at every level within our organisation. In our day-to-day operations we encounter a wide variety of risks which can challenge the quality, cost-effectiveness and timescales for the delivery of our aims and ambitions. We identify and plan for mitigation of these risks under our established risk management framework which includes:
› An enterprise-wide approach to risk management; › Oversight and control of risk through a well-established
governance and reporting process; › A risk assessment and management process which aligns to
ISO 31000:2018; and › Training materials, accessible policies and guidance to
help our people to identify and manage risk in a consistent manner.
Our individual business areas and functions take responsibility for identifying, quantifying, communicating and controlling the risks relevant to their own business activities. We also use a forward-looking approach to take into account new and emerging areas of concern and the long-term impact of risk. The identified risks cover a very wide range of potential events including regulatory, legal, core operations, service and hazard risks. They are reviewed and scored for likelihood as well as for financial and reputational impact should the identified event occur. Initially we use the gross position when assessing risk, i.e. we assume that any controls over the risk are absent or have failed. We then assess the current position of the risk including considering existing controls and their effectiveness. This is then followed by a targeted risk position which introduces further mitigating controls where the current state does not fully align with objectives and/or obligations.
Our governance and reporting process includes twice-yearly reports to our group board on the character of the group’s risk profile, informed by the above risk identification and assessment approach. Individual event-based risks are identified and then categorised within ten inherent risk areas known as principal risks (see below). We also build on this overview in the board report, highlighting two key categories of risk: i) the most significant group-wide business risks; and ii) wholesale operational risks. These are represented by the 10 highest ranked risks (based on the scores awarded for likelihood x ‘full life’ financial impact) for each of the two categories plus a further five risks with potentially very high impact severity in their current state (net of control effectiveness). In addition, the report also identifies risks that could create potentially significant reputational impacts or are associated with potentially significant emerging topics but have not already been covered by the other reported categories.
Figure 1: Governance and reporting process
Figure 2: Risk map
Group boardReviews the nature and
extent of risk, con�rms the company’s viability and
reports on e�ectiveness of risk management and
internal control
Group audit & risk board
Reviews governance, risk and compliance-related
matters
Group audit & risk board
Reviews governance, risk and compliance-related
matters
Wholesale risk & resilience board
Monitors status of risk, control and actions
associated with wholesale risk
Wholesale risk & resilience board
Monitors status of risk, control and actions
associated with wholesale risk
Wholesale core risk team
Monitors risk management activity, roles and
responsibilities and status of wholesale operational
risk
Wholesale core risk team
Monitors risk management activity, roles and
responsibilities and status of wholesale operational
risk
Corporate risk team
Second line framework development, advisory, assurance and reporting
Business areas and projects
First line identi�cation, analysis, evaluation and
management of risk
Audit committeeReviews the e�ectiveness of risk management and internal control systems
Corporate audit team
Third line review and assurance of risk
management and internal controls
Board/Board Commi�ee
Management Commi�ee/Ac�vity
1
3 10
6 2 8
5 7
9 4
High
Impact
Low
1. Political and regulatory
2. Compliance
3. Water service
4. Wastewater service
5. Retail and commercial
6. Financial
7. Supply chain and programme delivery
8. Resources
9. Security
10. Health, safety and environment
Low Likelihood High
Risk increased
Risk stable
Risk decreased
Our approach aligns with the UK Corporate Governance Code and includes reports to the group board for every full and half year statutory accounting period so that the board is in a position to:
› Determine the nature and extent of the principal risks it is willing to take in achieving its strategic objectives;
› Oversee the management of those risks and provide challenge to executive management where appropriate;
› Express an informed opinion on the long-term viability of the company; and › Monitor risk management and internal control systems and review their
effectiveness.
The risk map provides an indicative only view of the current exposure of each of the principal risks relative to each other: illustrating the likelihood of occurrence relative to the associated internal or external drivers; whether the risk is believed to have increased, decreased or remained stable over the last 12 months; and the most likely (not worst case) impact should an event occur.
United Utilities 2018.indd 54 6/1/2018 2:07:16 PM
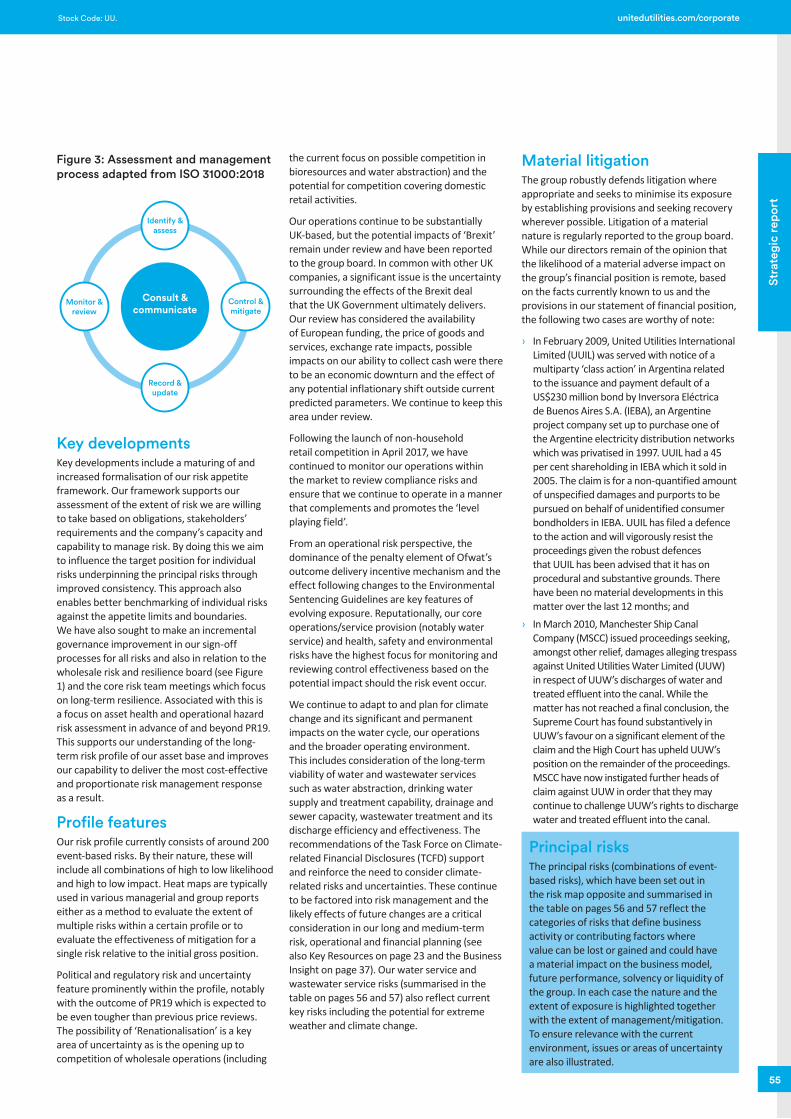
Job Number 1 June 2018 2:04 PM Proof 3 Job Number 1 June 2018 2:04 PM Proof 3
55
Stra
tegi
c re
port
Stock Code: UU. unitedutilities.com/corporate
Key developments Key developments include a maturing of and increased formalisation of our risk appetite framework. Our framework supports our assessment of the extent of risk we are willing to take based on obligations, stakeholders’ requirements and the company’s capacity and capability to manage risk. By doing this we aim to influence the target position for individual risks underpinning the principal risks through improved consistency. This approach also enables better benchmarking of individual risks against the appetite limits and boundaries. We have also sought to make an incremental governance improvement in our sign-off processes for all risks and also in relation to the wholesale risk and resilience board (see Figure 1) and the core risk team meetings which focus on long-term resilience. Associated with this is a focus on asset health and operational hazard risk assessment in advance of and beyond PR19. This supports our understanding of the long-term risk profile of our asset base and improves our capability to deliver the most cost-effective and proportionate risk management response as a result.
Profile featuresOur risk profile currently consists of around 200 event-based risks. By their nature, these will include all combinations of high to low likelihood and high to low impact. Heat maps are typically used in various managerial and group reports either as a method to evaluate the extent of multiple risks within a certain profile or to evaluate the effectiveness of mitigation for a single risk relative to the initial gross position.
Political and regulatory risk and uncertainty feature prominently within the profile, notably with the outcome of PR19 which is expected to be even tougher than previous price reviews. The possibility of ‘Renationalisation’ is a key area of uncertainty as is the opening up to competition of wholesale operations (including
Consult & communicate
Identify & assess
Control & mitigate
Monitor & review
Record & update
Figure 3: Assessment and management process adapted from ISO 31000:2018
the current focus on possible competition in bioresources and water abstraction) and the potential for competition covering domestic retail activities.
Our operations continue to be substantially UK-based, but the potential impacts of ‘Brexit’ remain under review and have been reported to the group board. In common with other UK companies, a significant issue is the uncertainty surrounding the effects of the Brexit deal that the UK Government ultimately delivers. Our review has considered the availability of European funding, the price of goods and services, exchange rate impacts, possible impacts on our ability to collect cash were there to be an economic downturn and the effect of any potential inflationary shift outside current predicted parameters. We continue to keep this area under review.
Following the launch of non-household retail competition in April 2017, we have continued to monitor our operations within the market to review compliance risks and ensure that we continue to operate in a manner that complements and promotes the ‘level playing field’.
From an operational risk perspective, the dominance of the penalty element of Ofwat’s outcome delivery incentive mechanism and the effect following changes to the Environmental Sentencing Guidelines are key features of evolving exposure. Reputationally, our core operations/service provision (notably water service) and health, safety and environmental risks have the highest focus for monitoring and reviewing control effectiveness based on the potential impact should the risk event occur.
We continue to adapt to and plan for climate change and its significant and permanent impacts on the water cycle, our operations and the broader operating environment. This includes consideration of the long-term viability of water and wastewater services such as water abstraction, drinking water supply and treatment capability, drainage and sewer capacity, wastewater treatment and its discharge efficiency and effectiveness. The recommendations of the Task Force on Climate-related Financial Disclosures (TCFD) support and reinforce the need to consider climate-related risks and uncertainties. These continue to be factored into risk management and the likely effects of future changes are a critical consideration in our long and medium-term risk, operational and financial planning (see also Key Resources on page 23 and the Business Insight on page 37). Our water service and wastewater service risks (summarised in the table on pages 56 and 57) also reflect current key risks including the potential for extreme weather and climate change.
Material litigation The group robustly defends litigation where appropriate and seeks to minimise its exposure by establishing provisions and seeking recovery wherever possible. Litigation of a material nature is regularly reported to the group board. While our directors remain of the opinion that the likelihood of a material adverse impact on the group’s financial position is remote, based on the facts currently known to us and the provisions in our statement of financial position, the following two cases are worthy of note:
› In February 2009, United Utilities International Limited (UUIL) was served with notice of a multiparty ‘class action’ in Argentina related to the issuance and payment default of a US$230 million bond by Inversora Eléctrica de Buenos Aires S.A. (IEBA), an Argentine project company set up to purchase one of the Argentine electricity distribution networks which was privatised in 1997. UUIL had a 45 per cent shareholding in IEBA which it sold in 2005. The claim is for a non-quantified amount of unspecified damages and purports to be pursued on behalf of unidentified consumer bondholders in IEBA. UUIL has filed a defence to the action and will vigorously resist the proceedings given the robust defences that UUIL has been advised that it has on procedural and substantive grounds. There have been no material developments in this matter over the last 12 months; and
› In March 2010, Manchester Ship Canal Company (MSCC) issued proceedings seeking, amongst other relief, damages alleging trespass against United Utilities Water Limited (UUW) in respect of UUW’s discharges of water and treated effluent into the canal. While the matter has not reached a final conclusion, the Supreme Court has found substantively in UUW’s favour on a significant element of the claim and the High Court has upheld UUW’s position on the remainder of the proceedings. MSCC have now instigated further heads of claim against UUW in order that they may continue to challenge UUW’s rights to discharge water and treated effluent into the canal.
Principal risks The principal risks (combinations of event-based risks), which have been set out in the risk map opposite and summarised in the table on pages 56 and 57 reflect the categories of risks that define business activity or contributing factors where value can be lost or gained and could have a material impact on the business model, future performance, solvency or liquidity of the group. In each case the nature and the extent of exposure is highlighted together with the extent of management/mitigation. To ensure relevance with the current environment, issues or areas of uncertainty are also illustrated.
United Utilities 2018.indd 55 6/1/2018 2:07:16 PM
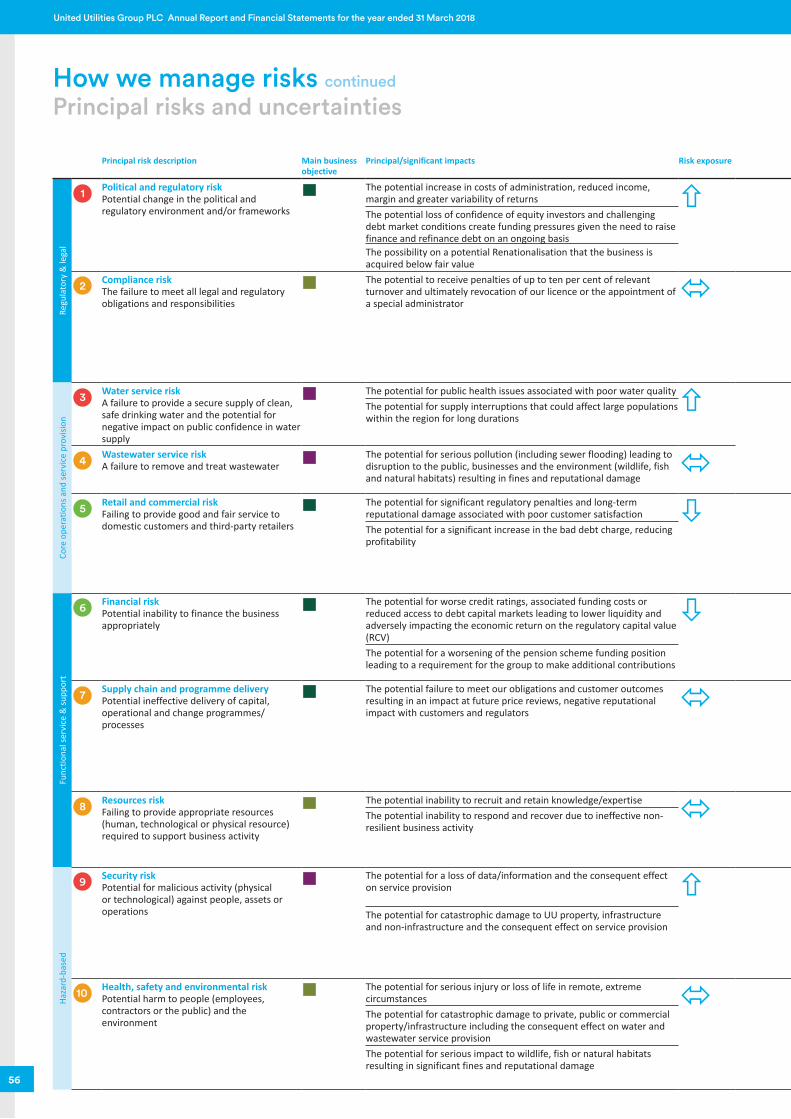
Job Number 1 June 2018 2:04 PM Proof 3 Job Number 1 June 2018 2:04 PM Proof 3
56
United Utilities Group PLC Annual Report and Financial Statements for the year ended 31 March 2018
Principal risk description Main business objective
Principal/significant impacts Risk exposure Management and mitigation Current key risks, issues and uncertainties
Regu
lato
ry &
lega
l
1 Political and regulatory riskPotential change in the political and regulatory environment and/or frameworks
The potential increase in costs of administration, reduced income, margin and greater variability of returns We engage in relevant government and regulatory consultations which may affect policy and
regulation in the sectors where we operate. We also consult with customers to understand their requirements and proactively consider all the opportunities and threats associated with any potential change; exploiting opportunities and mitigating risks where appropriate. We keep customers and the public informed. We also provide information to the government, regulators, customers and the public as appropriate to help them to make informed decisions.
› Potential Renationalisation of the water sector › Market reform including upstream competition and,
further ahead, the potential for the introduction of domestic competition
› Change from using the retail prices index to the consumer prices index for regulatory indexation
› Brexit
The potential loss of confidence of equity investors and challenging debt market conditions create funding pressures given the need to raise finance and refinance debt on an ongoing basisThe possibility on a potential Renationalisation that the business is acquired below fair value
2 Compliance riskThe failure to meet all legal and regulatory obligations and responsibilities
The potential to receive penalties of up to ten per cent of relevant turnover and ultimately revocation of our licence or the appointment of a special administrator
Legislative and regulatory developments are continually monitored as is the governance framework utilised by the group. Risk-based training of employees is undertaken and we participate in consultations to influence legislative and regulatory developments. Allowance for any material additional compliance costs in the regulated business is sought as part of the price determination process. The group also robustly defends litigation where appropriate and seeks to minimise its exposure by establishing provisions and seeking recovery wherever possible.
› Competition law and regulatory compliance while preparing for and operating within a changing competitive market
› Level playing field requirements in relation to the non-household retail market
› Current material litigation › Higher fine levels for environmental offences › Introduction of material pieces of legislation
e.g. the General Data Protection Regulation
Core
ope
ratio
ns a
nd se
rvic
e pr
ovisi
on
3 Water service riskA failure to provide a secure supply of clean, safe drinking water and the potential for negative impact on public confidence in water supply
The potential for public health issues associated with poor water quality Mitigation is provided through core business processes, including centralised planning and control, quality assurance procedures, risk assessments and rigorous sampling/testing regimes. Optimisation of operational and maintenance tasks together with targeted capital interventions help to ensure services to customers are maintained. Our 25-year Water Resources Management Plan defines our strategy to achieve a long-term, best-value and sustainable plan for water supplies in the North West including consideration of over 20 different climate change scenarios including a 2oC or lower global warming scenario (assessing systems resilience). We continue to develop innovative solutions and invest in resilience to further support the delivery of water and wastewater services in the long-term.
› Population growth › Extreme weather and climate change › Meeting infrastructure investment requirements › Expected change to the abstraction licensing regime › Catchment management › Raw water quality › Drinking water safety and security › Critical asset failure › Drought
The potential for supply interruptions that could affect large populations within the region for long durations
4 Wastewater service riskA failure to remove and treat wastewater
The potential for serious pollution (including sewer flooding) leading to disruption to the public, businesses and the environment (wildlife, fish and natural habitats) resulting in fines and reputational damage
5 Retail and commercial risk
Failing to provide good and fair service to domestic customers and third-party retailers
The potential for significant regulatory penalties and long-term reputational damage associated with poor customer satisfaction For Domestic Retail there are a wide range of initiatives and activities focused on improving customer
satisfaction, including proactive incident communication, complaints handling and use of appropriate tariffs. Bad debt risk is managed through the adoption of best practice collection techniques, segmentation of customers based on their credit risk profile and the use of data sharing to better understand customers’ circumstances to determine the most appropriate collection and support activities. Our wholesale business maintains processes, systems, data and organisational capacity and capability to deal fairly with market participants and the central market operator in the Business Retail market in order to generate and collect revenue.
› Socio-economic deprivation in the North West › Welfare reform and the impact on domestic bad debt › Competition in the water and wastewater market and
competitor positioning › Brexit › Non-household retail competition and the ability to
treat other participants equally
The potential for a significant increase in the bad debt charge, reducing profitability
Func
tiona
l ser
vice
& su
ppor
t
6 Financial riskPotential inability to finance the business appropriately
The potential for worse credit ratings, associated funding costs or reduced access to debt capital markets leading to lower liquidity and adversely impacting the economic return on the regulatory capital value (RCV)
Refinancing is long-term with staggered maturity dates to minimise the effect of short-term downturns. Counterparty credit exposure and settlement limits exist to reduce any potential future impacts. These are based on a number of factors, including the credit rating and the size of the asset base of the individual counterparty. The group also employs hedging strategies to manage the impact of market fluctuations for inflation, interest rates and energy prices. Sensitivity analysis is carried out as part of the business planning process, influencing the various financial limits employed. Continuous monitoring of the markets takes place including movements in credit default swap prices and movements in equity levels.
› Stability of financial institutions and the world economy
› Economic uncertainty › Inflation/deflation › Financial market conditions, interest rates and funding
costs › Brexit
The potential for a worsening of the pension scheme funding position leading to a requirement for the group to make additional contributions
7 Supply chain and programme deliveryPotential ineffective delivery of capital, operational and change programmes/processes
The potential failure to meet our obligations and customer outcomes resulting in an impact at future price reviews, negative reputational impact with customers and regulators
Supply chain management is utilised to deliver an end-to-end contract management service, including contract strategy, tendering and category management, which provides a risk-based approach and relationship management programmes for suppliers. We prioritise our investment programmes, projects and integrated business and asset plans. We have created better alignment and integration between our capital delivery partners and engineering service providers including alignment with our operating model. Our programme and project management capabilities are well established with strong governance and embedded processes to support delivery, manage risks and achieve business benefits. We utilise a time, cost and quality index (TCQi) as a key performance indicator and enhance our performance through a dedicated programme change office to deliver change in a structured and consistent way.
› Security of supply › Delivery of solutions › Technical quality and innovation › Brexit
8 Resources riskFailing to provide appropriate resources (human, technological or physical resource) required to support business activity
The potential inability to recruit and retain knowledge/expertise Developing our people with the right skills and knowledge, combined with delivering effective technology are important enablers to support the business to meet its objectives. Employees are kept informed regarding business strategy and progress through various communication channels. Training and personal development programmes exist for all employees in addition to talent management programmes and apprentice and graduate schemes. We focus on change programmes and innovative ways of working to deliver better, faster and more cost-effective operations.
› Delivering required employee engagement › Personal development and talent management › Technological innovation › Asset management
The potential inability to respond and recover due to ineffective non-resilient business activity
Haza
rd-b
ased
9 Security riskPotential for malicious activity (physical or technological) against people, assets or operations
The potential for a loss of data/information and the consequent effect on service provision Physical and technological security measures and awareness training combined with strong governance
and inspection regimes aim to protect infrastructure, assets and operational capability. Externally, we work closely with our industry peers, the Centre for the Protection of National Infrastructure (CPNI), the National Cyber Security Centre (NCSC) and Defra to shape the sector approach to security, particularly cyber security, and to understand how we can best deliver the appropriate levels of protection to our business. Ongoing system and network integration improves operational resilience and we maintain robust incident response, business continuity and disaster recovery procedures. We also maintain insurance cover for loss and liability and the licence of the regulated business also contains a ‘shipwreck’ clause that, if applicable, may offer a degree of recourse to Ofwat/customers in the event of a catastrophic incident.
› Cybercrime › Terrorism › Fraud › Ownership of Critical National Infrastructure and
National Infrastructure The potential for catastrophic damage to UU property, infrastructure and non-infrastructure and the consequent effect on service provision
10 Health, safety and environmental riskPotential harm to people (employees, contractors or the public) and the environment
The potential for serious injury or loss of life in remote, extreme circumstances Supported by strong governance and management systems certified to OHSAS 18001 we have developed
a strong health and safety culture where ‘nothing we do at United Utilities is worth getting hurt for’. We actively seek to improve health, safety and wellbeing across the group through targeted improvements and benchmarking against our peers. Also certified to ISO 14001, we seek to protect and improve the environment through the responsible delivery of our services. This includes helping to support rare species and habitats through targeted engagement and activity and commitment to reducing our carbon emissions by designing out waste from our operations, generating our own energy and looking at ways to reduce our use of raw materials. We also recognise the impact the environment can have on our service provision with extreme weather and climate change being integrated into our risk, planning and decision-making processes.
› Impounding reservoirs containing significant volumes of water
› Other critical asset failure › Process safety › Excavation, tunnelling and construction work › Working with chemicals › Fluvial and coastal flooding
The potential for catastrophic damage to private, public or commercial property/infrastructure including the consequent effect on water and wastewater service provisionThe potential for serious impact to wildlife, fish or natural habitats resulting in significant fines and reputational damage
How we manage risks continued
Principal risks and uncertainties
United Utilities 2018.indd 56 6/1/2018 2:07:17 PM
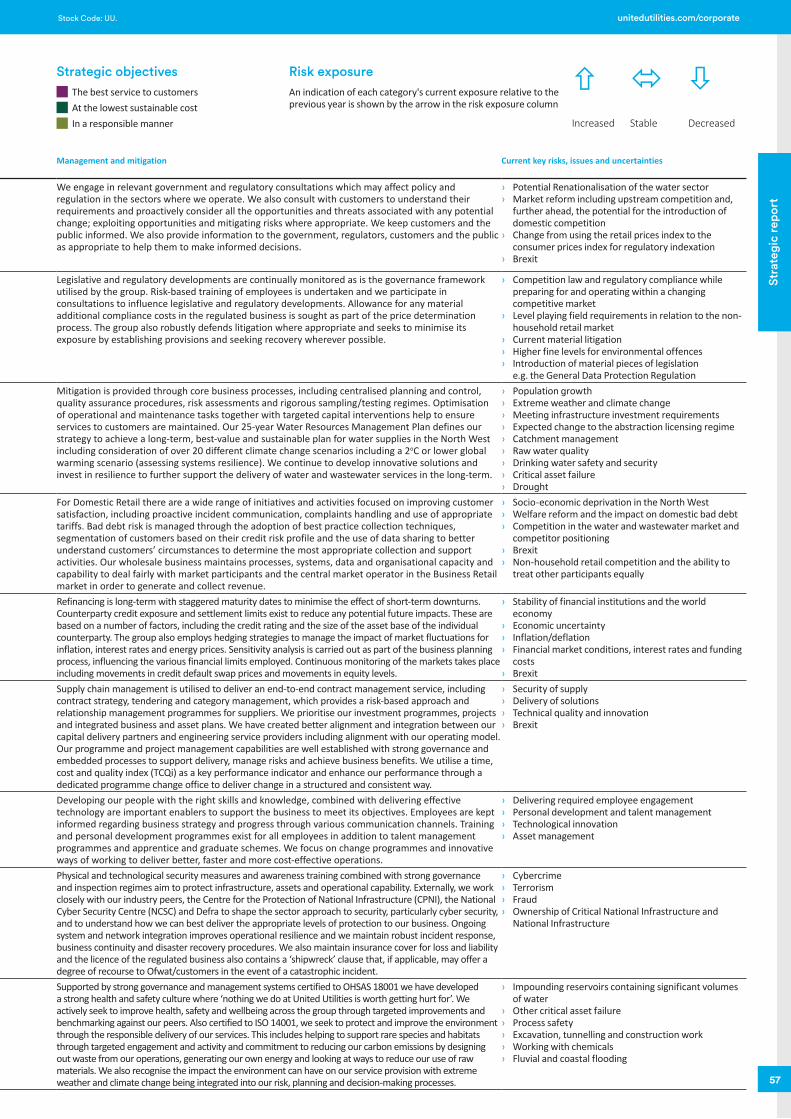
Job Number 1 June 2018 2:04 PM Proof 3 Job Number 1 June 2018 2:04 PM Proof 3
57
Stra
tegi
c re
port
Stock Code: UU. unitedutilities.com/corporate
Principal risk description Main business objective
Principal/significant impacts Risk exposure Management and mitigation Current key risks, issues and uncertainties
Regu
lato
ry &
lega
l
1 Political and regulatory riskPotential change in the political and regulatory environment and/or frameworks
The potential increase in costs of administration, reduced income, margin and greater variability of returns We engage in relevant government and regulatory consultations which may affect policy and
regulation in the sectors where we operate. We also consult with customers to understand their requirements and proactively consider all the opportunities and threats associated with any potential change; exploiting opportunities and mitigating risks where appropriate. We keep customers and the public informed. We also provide information to the government, regulators, customers and the public as appropriate to help them to make informed decisions.
› Potential Renationalisation of the water sector › Market reform including upstream competition and,
further ahead, the potential for the introduction of domestic competition
› Change from using the retail prices index to the consumer prices index for regulatory indexation
› Brexit
The potential loss of confidence of equity investors and challenging debt market conditions create funding pressures given the need to raise finance and refinance debt on an ongoing basisThe possibility on a potential Renationalisation that the business is acquired below fair value
2 Compliance riskThe failure to meet all legal and regulatory obligations and responsibilities
The potential to receive penalties of up to ten per cent of relevant turnover and ultimately revocation of our licence or the appointment of a special administrator
Legislative and regulatory developments are continually monitored as is the governance framework utilised by the group. Risk-based training of employees is undertaken and we participate in consultations to influence legislative and regulatory developments. Allowance for any material additional compliance costs in the regulated business is sought as part of the price determination process. The group also robustly defends litigation where appropriate and seeks to minimise its exposure by establishing provisions and seeking recovery wherever possible.
› Competition law and regulatory compliance while preparing for and operating within a changing competitive market
› Level playing field requirements in relation to the non-household retail market
› Current material litigation › Higher fine levels for environmental offences › Introduction of material pieces of legislation
e.g. the General Data Protection Regulation
Core
ope
ratio
ns a
nd se
rvic
e pr
ovisi
on
3 Water service riskA failure to provide a secure supply of clean, safe drinking water and the potential for negative impact on public confidence in water supply
The potential for public health issues associated with poor water quality Mitigation is provided through core business processes, including centralised planning and control, quality assurance procedures, risk assessments and rigorous sampling/testing regimes. Optimisation of operational and maintenance tasks together with targeted capital interventions help to ensure services to customers are maintained. Our 25-year Water Resources Management Plan defines our strategy to achieve a long-term, best-value and sustainable plan for water supplies in the North West including consideration of over 20 different climate change scenarios including a 2oC or lower global warming scenario (assessing systems resilience). We continue to develop innovative solutions and invest in resilience to further support the delivery of water and wastewater services in the long-term.
› Population growth › Extreme weather and climate change › Meeting infrastructure investment requirements › Expected change to the abstraction licensing regime › Catchment management › Raw water quality › Drinking water safety and security › Critical asset failure › Drought
The potential for supply interruptions that could affect large populations within the region for long durations
4 Wastewater service riskA failure to remove and treat wastewater
The potential for serious pollution (including sewer flooding) leading to disruption to the public, businesses and the environment (wildlife, fish and natural habitats) resulting in fines and reputational damage
5 Retail and commercial risk
Failing to provide good and fair service to domestic customers and third-party retailers
The potential for significant regulatory penalties and long-term reputational damage associated with poor customer satisfaction For Domestic Retail there are a wide range of initiatives and activities focused on improving customer
satisfaction, including proactive incident communication, complaints handling and use of appropriate tariffs. Bad debt risk is managed through the adoption of best practice collection techniques, segmentation of customers based on their credit risk profile and the use of data sharing to better understand customers’ circumstances to determine the most appropriate collection and support activities. Our wholesale business maintains processes, systems, data and organisational capacity and capability to deal fairly with market participants and the central market operator in the Business Retail market in order to generate and collect revenue.
› Socio-economic deprivation in the North West › Welfare reform and the impact on domestic bad debt › Competition in the water and wastewater market and
competitor positioning › Brexit › Non-household retail competition and the ability to
treat other participants equally
The potential for a significant increase in the bad debt charge, reducing profitability
Func
tiona
l ser
vice
& su
ppor
t
6 Financial riskPotential inability to finance the business appropriately
The potential for worse credit ratings, associated funding costs or reduced access to debt capital markets leading to lower liquidity and adversely impacting the economic return on the regulatory capital value (RCV)
Refinancing is long-term with staggered maturity dates to minimise the effect of short-term downturns. Counterparty credit exposure and settlement limits exist to reduce any potential future impacts. These are based on a number of factors, including the credit rating and the size of the asset base of the individual counterparty. The group also employs hedging strategies to manage the impact of market fluctuations for inflation, interest rates and energy prices. Sensitivity analysis is carried out as part of the business planning process, influencing the various financial limits employed. Continuous monitoring of the markets takes place including movements in credit default swap prices and movements in equity levels.
› Stability of financial institutions and the world economy
› Economic uncertainty › Inflation/deflation › Financial market conditions, interest rates and funding
costs › Brexit
The potential for a worsening of the pension scheme funding position leading to a requirement for the group to make additional contributions
7 Supply chain and programme deliveryPotential ineffective delivery of capital, operational and change programmes/processes
The potential failure to meet our obligations and customer outcomes resulting in an impact at future price reviews, negative reputational impact with customers and regulators
Supply chain management is utilised to deliver an end-to-end contract management service, including contract strategy, tendering and category management, which provides a risk-based approach and relationship management programmes for suppliers. We prioritise our investment programmes, projects and integrated business and asset plans. We have created better alignment and integration between our capital delivery partners and engineering service providers including alignment with our operating model. Our programme and project management capabilities are well established with strong governance and embedded processes to support delivery, manage risks and achieve business benefits. We utilise a time, cost and quality index (TCQi) as a key performance indicator and enhance our performance through a dedicated programme change office to deliver change in a structured and consistent way.
› Security of supply › Delivery of solutions › Technical quality and innovation › Brexit
8 Resources riskFailing to provide appropriate resources (human, technological or physical resource) required to support business activity
The potential inability to recruit and retain knowledge/expertise Developing our people with the right skills and knowledge, combined with delivering effective technology are important enablers to support the business to meet its objectives. Employees are kept informed regarding business strategy and progress through various communication channels. Training and personal development programmes exist for all employees in addition to talent management programmes and apprentice and graduate schemes. We focus on change programmes and innovative ways of working to deliver better, faster and more cost-effective operations.
› Delivering required employee engagement › Personal development and talent management › Technological innovation › Asset management
The potential inability to respond and recover due to ineffective non-resilient business activity
Haza
rd-b
ased
9 Security riskPotential for malicious activity (physical or technological) against people, assets or operations
The potential for a loss of data/information and the consequent effect on service provision Physical and technological security measures and awareness training combined with strong governance
and inspection regimes aim to protect infrastructure, assets and operational capability. Externally, we work closely with our industry peers, the Centre for the Protection of National Infrastructure (CPNI), the National Cyber Security Centre (NCSC) and Defra to shape the sector approach to security, particularly cyber security, and to understand how we can best deliver the appropriate levels of protection to our business. Ongoing system and network integration improves operational resilience and we maintain robust incident response, business continuity and disaster recovery procedures. We also maintain insurance cover for loss and liability and the licence of the regulated business also contains a ‘shipwreck’ clause that, if applicable, may offer a degree of recourse to Ofwat/customers in the event of a catastrophic incident.
› Cybercrime › Terrorism › Fraud › Ownership of Critical National Infrastructure and
National Infrastructure The potential for catastrophic damage to UU property, infrastructure and non-infrastructure and the consequent effect on service provision
10 Health, safety and environmental riskPotential harm to people (employees, contractors or the public) and the environment
The potential for serious injury or loss of life in remote, extreme circumstances Supported by strong governance and management systems certified to OHSAS 18001 we have developed
a strong health and safety culture where ‘nothing we do at United Utilities is worth getting hurt for’. We actively seek to improve health, safety and wellbeing across the group through targeted improvements and benchmarking against our peers. Also certified to ISO 14001, we seek to protect and improve the environment through the responsible delivery of our services. This includes helping to support rare species and habitats through targeted engagement and activity and commitment to reducing our carbon emissions by designing out waste from our operations, generating our own energy and looking at ways to reduce our use of raw materials. We also recognise the impact the environment can have on our service provision with extreme weather and climate change being integrated into our risk, planning and decision-making processes.
› Impounding reservoirs containing significant volumes of water
› Other critical asset failure › Process safety › Excavation, tunnelling and construction work › Working with chemicals › Fluvial and coastal flooding
The potential for catastrophic damage to private, public or commercial property/infrastructure including the consequent effect on water and wastewater service provisionThe potential for serious impact to wildlife, fish or natural habitats resulting in significant fines and reputational damage
Risk exposureAn indication of each category's current exposure relative to the previous year is shown by the arrow in the risk exposure column
Strategic objectives The best service to customers At the lowest sustainable cost In a responsible manner Increased Stable Decreased
United Utilities 2018.indd 57 6/1/2018 2:07:17 PM

Job Number 4 June 2018 8:56 AM Proof 3 Job Number 4 June 2018 8:56 AM Proof 3United Utilities Middle Section.indd 58 04/06/2018 13:05:11
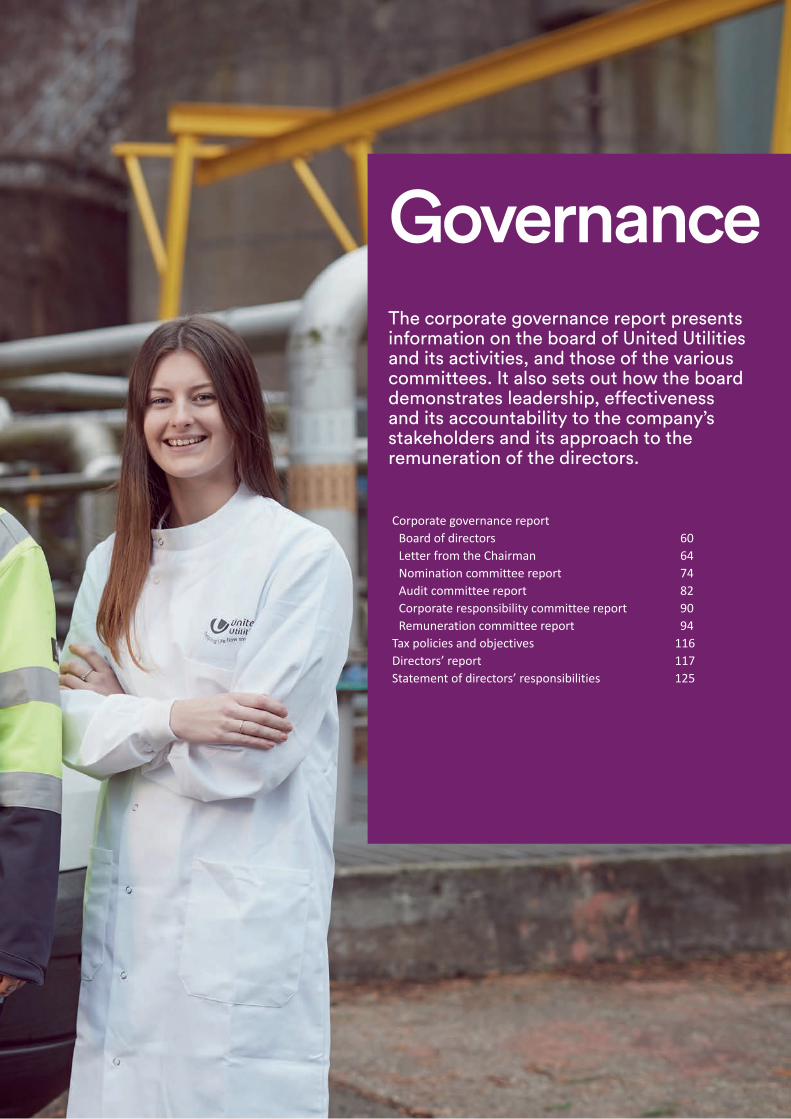
Job Number 4 June 2018 8:56 AM Proof 3 Job Number 4 June 2018 8:56 AM Proof 3
GovernanceThe corporate governance report presents information on the board of United Utilities and its activities, and those of the various committees. It also sets out how the board demonstrates leadership, effectiveness and its accountability to the company’s stakeholders and its approach to the remuneration of the directors.
Corporate governance report Board of directors 60 Letter from the Chairman 64 Nomination committee report 74 Audit committee report 82 Corporate responsibility committee report 90 Remuneration committee report 94Tax policies and objectives 116Directors’ report 117Statement of directors’ responsibilities 125
United Utilities Middle Section.indd 59 04/06/2018 13:05:12
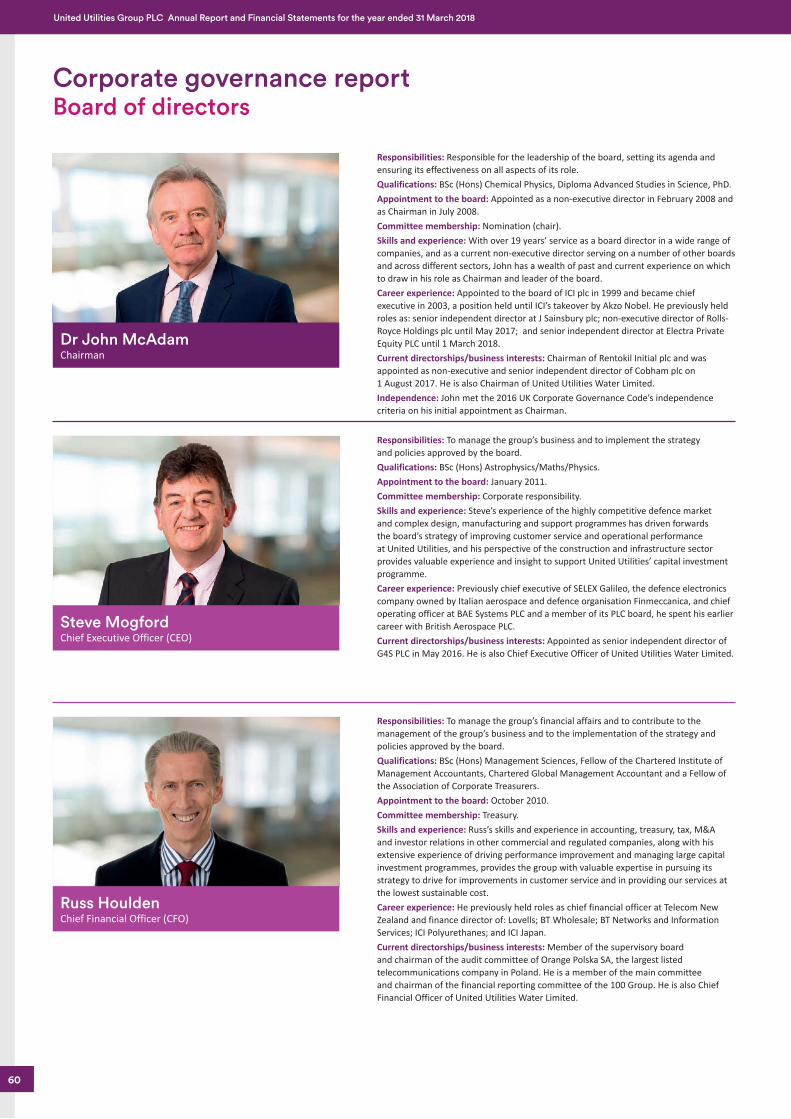
Job Number 4 June 2018 8:56 AM Proof 3 Job Number 4 June 2018 8:56 AM Proof 3
Dr John McAdam Chairman
Steve Mogford Chief Executive Officer (CEO)
Russ Houlden Chief Financial Officer (CFO)
Responsibilities: Responsible for the leadership of the board, setting its agenda and ensuring its effectiveness on all aspects of its role. Qualifications: BSc (Hons) Chemical Physics, Diploma Advanced Studies in Science, PhD. Appointment to the board: Appointed as a non-executive director in February 2008 and as Chairman in July 2008. Committee membership: Nomination (chair).Skills and experience: With over 19 years’ service as a board director in a wide range of companies, and as a current non-executive director serving on a number of other boards and across different sectors, John has a wealth of past and current experience on which to draw in his role as Chairman and leader of the board. Career experience: Appointed to the board of ICI plc in 1999 and became chief executive in 2003, a position held until ICI’s takeover by Akzo Nobel. He previously held roles as: senior independent director at J Sainsbury plc; non-executive director of Rolls-Royce Holdings plc until May 2017; and senior independent director at Electra Private Equity PLC until 1 March 2018.Current directorships/business interests: Chairman of Rentokil Initial plc and was appointed as non-executive and senior independent director of Cobham plc on 1 August 2017. He is also Chairman of United Utilities Water Limited. Independence: John met the 2016 UK Corporate Governance Code’s independence criteria on his initial appointment as Chairman.
Responsibilities: To manage the group’s business and to implement the strategy and policies approved by the board. Qualifications: BSc (Hons) Astrophysics/Maths/Physics. Appointment to the board: January 2011. Committee membership: Corporate responsibility.Skills and experience: Steve’s experience of the highly competitive defence market and complex design, manufacturing and support programmes has driven forwards the board’s strategy of improving customer service and operational performance at United Utilities, and his perspective of the construction and infrastructure sector provides valuable experience and insight to support United Utilities’ capital investment programme.Career experience: Previously chief executive of SELEX Galileo, the defence electronics company owned by Italian aerospace and defence organisation Finmeccanica, and chief operating officer at BAE Systems PLC and a member of its PLC board, he spent his earlier career with British Aerospace PLC. Current directorships/business interests: Appointed as senior independent director of G4S PLC in May 2016. He is also Chief Executive Officer of United Utilities Water Limited.
Responsibilities: To manage the group’s financial affairs and to contribute to the management of the group’s business and to the implementation of the strategy and policies approved by the board. Qualifications: BSc (Hons) Management Sciences, Fellow of the Chartered Institute of Management Accountants, Chartered Global Management Accountant and a Fellow of the Association of Corporate Treasurers. Appointment to the board: October 2010. Committee membership: Treasury.Skills and experience: Russ’s skills and experience in accounting, treasury, tax, M&A and investor relations in other commercial and regulated companies, along with his extensive experience of driving performance improvement and managing large capital investment programmes, provides the group with valuable expertise in pursuing its strategy to drive for improvements in customer service and in providing our services at the lowest sustainable cost.Career experience: He previously held roles as chief financial officer at Telecom New Zealand and finance director of: Lovells; BT Wholesale; BT Networks and Information Services; ICI Polyurethanes; and ICI Japan. Current directorships/business interests: Member of the supervisory board and chairman of the audit committee of Orange Polska SA, the largest listed telecommunications company in Poland. He is a member of the main committee and chairman of the financial reporting committee of the 100 Group. He is also Chief Financial Officer of United Utilities Water Limited.
Corporate governance reportBoard of directors
60
United Utilities Group PLC Annual Report and Financial Statements for the year ended 31 March 2018
United Utilities Middle Section.indd 60 04/06/2018 13:05:15
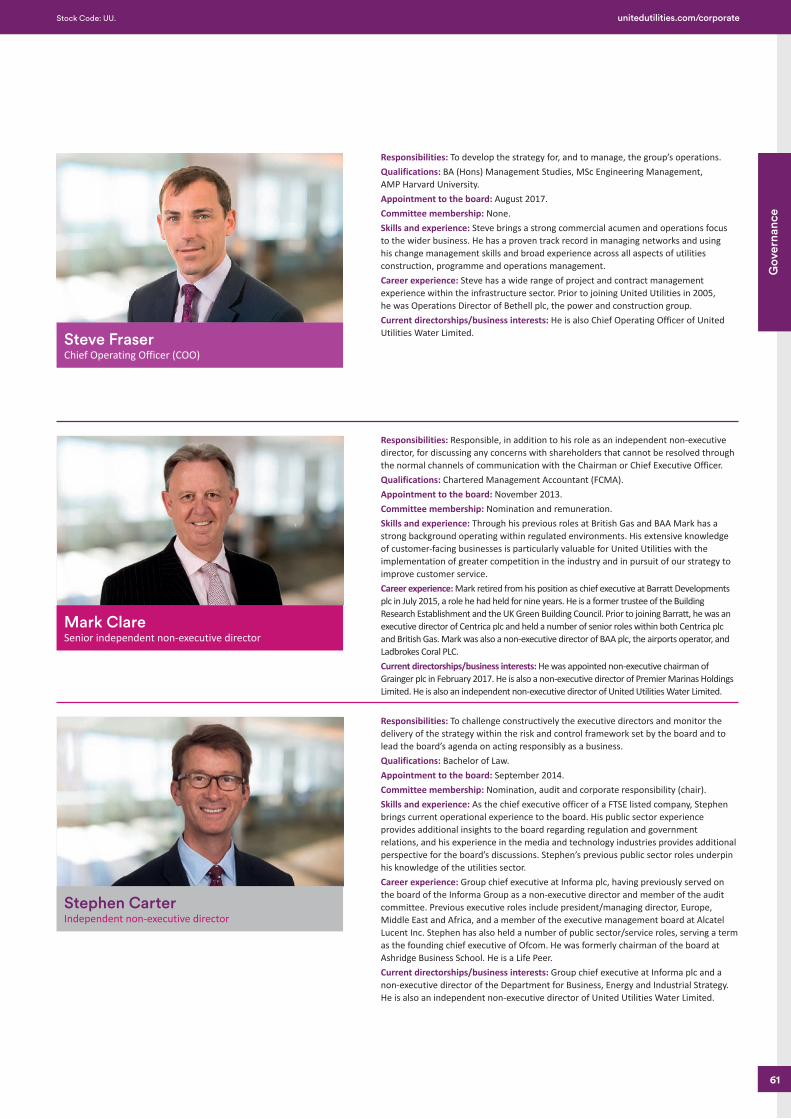
Job Number 4 June 2018 8:56 AM Proof 3 Job Number 4 June 2018 8:56 AM Proof 3
Steve Fraser Chief Operating Officer (COO)
Mark Clare Senior independent non-executive director
Stephen Carter Independent non-executive director
Responsibilities: To develop the strategy for, and to manage, the group’s operations. Qualifications: BA (Hons) Management Studies, MSc Engineering Management, AMP Harvard University. Appointment to the board: August 2017. Committee membership: None.Skills and experience: Steve brings a strong commercial acumen and operations focus to the wider business. He has a proven track record in managing networks and using his change management skills and broad experience across all aspects of utilities construction, programme and operations management. Career experience: Steve has a wide range of project and contract management experience within the infrastructure sector. Prior to joining United Utilities in 2005, he was Operations Director of Bethell plc, the power and construction group.Current directorships/business interests: He is also Chief Operating Officer of United Utilities Water Limited.
Responsibilities: Responsible, in addition to his role as an independent non-executive director, for discussing any concerns with shareholders that cannot be resolved through the normal channels of communication with the Chairman or Chief Executive Officer.Qualifications: Chartered Management Accountant (FCMA). Appointment to the board: November 2013. Committee membership: Nomination and remuneration. Skills and experience: Through his previous roles at British Gas and BAA Mark has a strong background operating within regulated environments. His extensive knowledge of customer-facing businesses is particularly valuable for United Utilities with the implementation of greater competition in the industry and in pursuit of our strategy to improve customer service. Career experience: Mark retired from his position as chief executive at Barratt Developments plc in July 2015, a role he had held for nine years. He is a former trustee of the Building Research Establishment and the UK Green Building Council. Prior to joining Barratt, he was an executive director of Centrica plc and held a number of senior roles within both Centrica plc and British Gas. Mark was also a non-executive director of BAA plc, the airports operator, and Ladbrokes Coral PLC. Current directorships/business interests: He was appointed non-executive chairman of Grainger plc in February 2017. He is also a non-executive director of Premier Marinas Holdings Limited. He is also an independent non-executive director of United Utilities Water Limited.
Responsibilities: To challenge constructively the executive directors and monitor the delivery of the strategy within the risk and control framework set by the board and to lead the board’s agenda on acting responsibly as a business. Qualifications: Bachelor of Law.Appointment to the board: September 2014.Committee membership: Nomination, audit and corporate responsibility (chair).Skills and experience: As the chief executive officer of a FTSE listed company, Stephen brings current operational experience to the board. His public sector experience provides additional insights to the board regarding regulation and government relations, and his experience in the media and technology industries provides additional perspective for the board’s discussions. Stephen’s previous public sector roles underpin his knowledge of the utilities sector.Career experience: Group chief executive at Informa plc, having previously served on the board of the Informa Group as a non-executive director and member of the audit committee. Previous executive roles include president/managing director, Europe, Middle East and Africa, and a member of the executive management board at Alcatel Lucent Inc. Stephen has also held a number of public sector/service roles, serving a term as the founding chief executive of Ofcom. He was formerly chairman of the board at Ashridge Business School. He is a Life Peer.Current directorships/business interests: Group chief executive at Informa plc and a non-executive director of the Department for Business, Energy and Industrial Strategy. He is also an independent non-executive director of United Utilities Water Limited.
61
Gov
erna
nce
Stock Code: UU. unitedutilities.com/corporate
United Utilities Middle Section.indd 61 04/06/2018 13:05:17

Job Number 4 June 2018 8:56 AM Proof 3 Job Number 4 June 2018 8:56 AM Proof 3
Alison Goligher Independent non-executive director
Brian May Independent non-executive director
Paulette RoweIndependent non-executive director
Responsibilities: To challenge constructively the executive directors and monitor the delivery of the strategy within the risk and control framework set by the board.Qualifications: BSc (Hons) Mathematical Physics, MEng Petroleum Engineering. Appointment to the board: August 2016. Committee membership: Nomination, audit (relinquished with effect from 1 July 2017), remuneration and corporate responsibility. Skills and experience: Alison has strong technical and capital project management skills, having been involved in large projects and the production side of Royal Dutch Shell’s business. This experience of engineering and industrial sectors provides the board with additional insight into delivering United Utilities’ capital investment programme.Career experience: From 2006 to 2015, Alison worked for Royal Dutch Shell, with her most recent executive role as Executive Vice President Upstream International Unconventionals. Prior to that she spent 17 years with Schlumberger, an international supplier of technology, integrated project management and information solutions to the oil and gas industry.Current directorships/business interests: Alison is a non-executive director of Meggitt PLC, was appointed as part-time executive chair of Silixa Ltd in August 2016, and sits on the board of Edinburgh Business School. She is also an independent non-executive director of United Utilities Water Limited.
Responsibilities: To challenge constructively the executive directors and monitor the delivery of the strategy within the risk and control framework set by the board and to lead the audit committee.Qualifications: BSc (Hons) Actuarial Science, Chartered Accountant FCA. Appointment to the board: September 2012. Committee membership: Nomination, audit (chair), treasury (chair) and remuneration (with effect from May 2017).Skills and experience: Brian joined Bunzl plc in 1993 as head of internal audit before becoming group treasurer, then finance director (Europe and Australasia), and is currently finance director. Brian’s background and the various finance roles that he has held are major assets to the board in chairing both the audit and the treasury committees. Brian has been chair of the audit committee for nearly five years and has considerable knowledge of the company and the specifics of the utilities sector.Career experience: Brian has been finance director at Bunzl plc since 2006 and prior to that held a number of senior finance roles within the company. Prior to joining Bunzl, Brian qualified as a chartered accountant with KPMG. Current directorships/business interests: Finance director at Bunzl plc. He is also an independent non-executive director of United Utilities Water Limited.
Responsibilities: To challenge constructively the executive directors and monitor the delivery of the strategy within the risk and control framework set by the board.Qualifications: Mechanical Engineering and Management. MBA. Appointment to the board: 1 July 2017. Committee membership: Nomination and audit.Skills and experience: Paulette has spent most of her career in the regulated finance industry providing the board with additional perspective and first-hand regulatory experience. Her experience of technology driven transformation will contribute to United Utilities’ customer experience programme and its Systems Thinking approach. Paulette’s experience of operating a commercial organisation within a regulated framework is directly relevant to the utilities sector.Career experience: Paulette is managing director, Barclaycard Payments Solutions at Barclays Bank. Prior to joining Barclays, she was strategy director at NBNK Investments plc and before which she was commercial and marketing director at Tesco Personal Finance. She spent seven years at the Royal Bank of Scotland, where her roles included chief executive, European Consumer Finance and managing director, NatWest Retail Banking. She has served on the board of the Prince’s Youth Business Trust and is a former trustee and chair of childrens’ charity The Mayor’s Fund for London.Current directorships/business interests: From 9 July 2018 Paulette will take up a new appointment on the EMEA Executive of Facebook Inc. She is also an independent non-executive director of United Utilities Water Limited.
Corporate governance reportBoard of directors
62
United Utilities Group PLC Annual Report and Financial Statements for the year ended 31 March 2018
United Utilities Middle Section.indd 62 04/06/2018 13:05:19
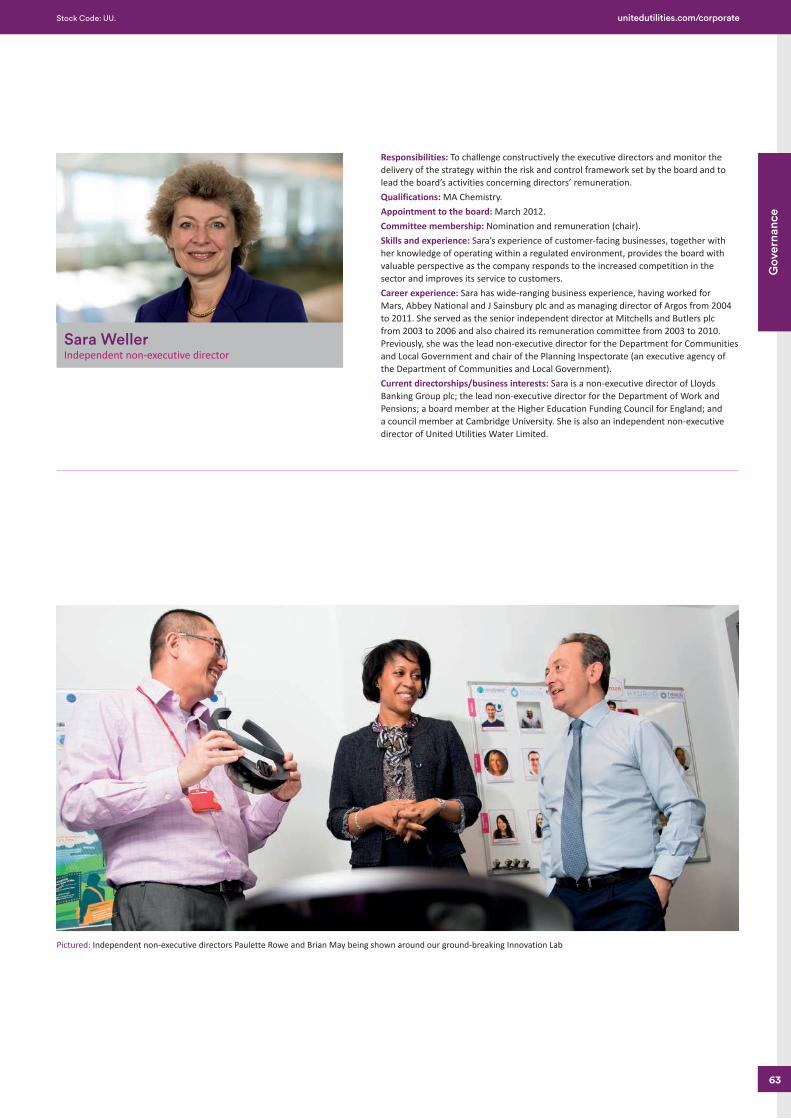
Job Number 4 June 2018 8:56 AM Proof 3 Job Number 4 June 2018 8:56 AM Proof 3
Sara Weller Independent non-executive director
Responsibilities: To challenge constructively the executive directors and monitor the delivery of the strategy within the risk and control framework set by the board and to lead the board’s activities concerning directors’ remuneration. Qualifications: MA Chemistry. Appointment to the board: March 2012. Committee membership: Nomination and remuneration (chair).Skills and experience: Sara’s experience of customer-facing businesses, together with her knowledge of operating within a regulated environment, provides the board with valuable perspective as the company responds to the increased competition in the sector and improves its service to customers.Career experience: Sara has wide-ranging business experience, having worked for Mars, Abbey National and J Sainsbury plc and as managing director of Argos from 2004 to 2011. She served as the senior independent director at Mitchells and Butlers plc from 2003 to 2006 and also chaired its remuneration committee from 2003 to 2010. Previously, she was the lead non-executive director for the Department for Communities and Local Government and chair of the Planning Inspectorate (an executive agency of the Department of Communities and Local Government).Current directorships/business interests: Sara is a non-executive director of Lloyds Banking Group plc; the lead non-executive director for the Department of Work and Pensions; a board member at the Higher Education Funding Council for England; and a council member at Cambridge University. She is also an independent non-executive director of United Utilities Water Limited.
Pictured: Independent non-executive directors Paulette Rowe and Brian May being shown around our ground-breaking Innovation Lab
63
Gov
erna
nce
Stock Code: UU. unitedutilities.com/corporate
United Utilities Middle Section.indd 63 04/06/2018 13:05:21
Job Number 4 June 2018 8:56 AM Proof 3 Job Number 4 June 2018 8:56 AM Proof 3
Corporate governance reportLetter from the Chairman
As a board, we must take long-term decisions to ensure our successors are able to operate the business efficiently for customers, and we need to build our assets to meet future demand and circumstances.
Dear ShareholderOur yearWe have seen strong performance contributing towards achieving our strategic targets during 2017/18. We were proud of our employees in achieving our best ever overall score during the year under Ofwat’s customer service index, known as the Service Incentive Mechanism (SIM), where we were placed in an upper quartile position of the 18 water and wastewater companies. SIM, along with other key performance indicators (see page 38), is regularly reviewed at board meetings. This has been a fantastic milestone to achieve as part of our strategic journey.
During the year, we have also had our challenges, including prosecutions for operational incidents, most notably relating to the 2015 Lancashire water quality incident at Franklaw water treatment works incurring a fine of £300,000. Access to our more remote assets during the severe weather in February 2018 proved difficult and we worked hard to minimise freeze-thaw issues disrupting customers’ supplies. Similarly, during the industrial action in relation to the changes to the defined benefit pension scheme, colleagues not on strike worked hard to ensure our services to customers were not affected.
Quick facts
› Dr John McAdam met the independence criteria as set out in the 2016 UK Corporate Governance Code (the Code) when he was appointed as Chairman;
› The Code requires that at least half of the board is made up of independent non-executive directors (the test excludes the Chairman). At United Utilities, six out of the remaining nine directors (excluding the Chairman) are independent non-executive directors;
› The company secretary attends all board and committee meetings and advises the Chairman on governance matters. The company secretariat team provides administrative support; and
› All directors are subject to annual election at the annual general meeting (AGM) held in July. Following the completion of the annual evaluation process all the non-executive directors were considered by the board to be independent and making a valuable and effective contribution to the board (see page 71). As a result, the board recommends that shareholders vote in favour of those standing for a further term at the forthcoming AGM, as they will be doing in respect of their individual shareholdings.
Quick linksThe details of the matters that the board has reserved for its own decision are set out in the ‘Schedule of matters reserved for the board’.
A copy can be found at unitedutilities.com/corporate-governance
A copy of the Financial Reporting Council’s 2016 UK Corporate Governance Code can be found at frc.org.uk
Our approachAs individual directors we are cognisant of our statutory duty to act in the way he/she considers, in good faith, would most likely be to promote the success of the company for the benefit of its members as a whole, as set out in s172 of the Companies Act 2006. Our role as the board is to set the strategy of the group and ensure that management operates the business in accordance with this strategy. Details of the strategy are set out in the strategic report (see page 12). We believe this approach will promote the group’s long-term success and our customers’ interests as well as create value for shareholders and have regard to our other stakeholders. The board’s intention is to hand over the business to our successors in a better and more sustainable position for the future. Within our region, our activities often have multiple touch points on individuals’ lives. United Utilities is a monopoly supplier of water and wastewater services to domestic households. Many of our customers are also our shareholders either directly or indirectly holding shares through pension scheme investments. Indeed, many of our employees are also both customers, shareholders and future pensioners and have an interest in the group’s long-term success. As directors we are mindful of our duties to exercise independent judgement and reasonable care, skill and diligence and there are times when difficult decisions must be taken. Last year, the board considered proposals in relation to the United Utilities defined benefit pension scheme and the related discussions with the trade unions. We listened to our employees and their representatives and were able to respond to some of their requests and address some of the aspects of the pension scheme that employees valued the most nothwithstanding the decision taken to proceed with changes to the defined benefit pension scheme with effect from 1 April 2018. This was one of those difficult decisions, where we had to act in the way we considered was most likely to promote the success of the company in the long-term. I am pleased to say that these issues have now been resolved.
Our governance structureWe held eight scheduled board meetings during the year; in addition, there were a number of other board meetings held which directors attended either in person or via telephone conferencing facilities. A diagram showing the interrelationships of the various board committees can be found on page 67 and reports from each of the committee chairs about their work can be found on the following pages. The diagram also describes some of the group’s principal management committees.
Our peopleAs reported in last year’s annual report, Paulette Rowe was appointed as an independent non-executive director on 1 July 2017. In addition to her experience of the regulated financial services industry, Paulette has long had an interest and involvement in the charitable sector, which brings a wider perspective to board discussions.
Furthermore, we are pleased to appoint Steve Fraser to the board as our Chief Operating Officer. Steve has been with the business in various operational roles since 2005. Most recently his role was managing director of our wholesale business and his appointment to the board reflects the value we place on his experience and in-depth knowledge of our business as we face the challenges of the next five-year asset management period.
Biographies for Paulette and Steve and those of the other board members can be found on pages 60 to 63 .
64
United Utilities Group PLC Annual Report and Financial Statements for the year ended 31 March 2018
United Utilities Middle Section.indd 64 04/06/2018 13:05:21
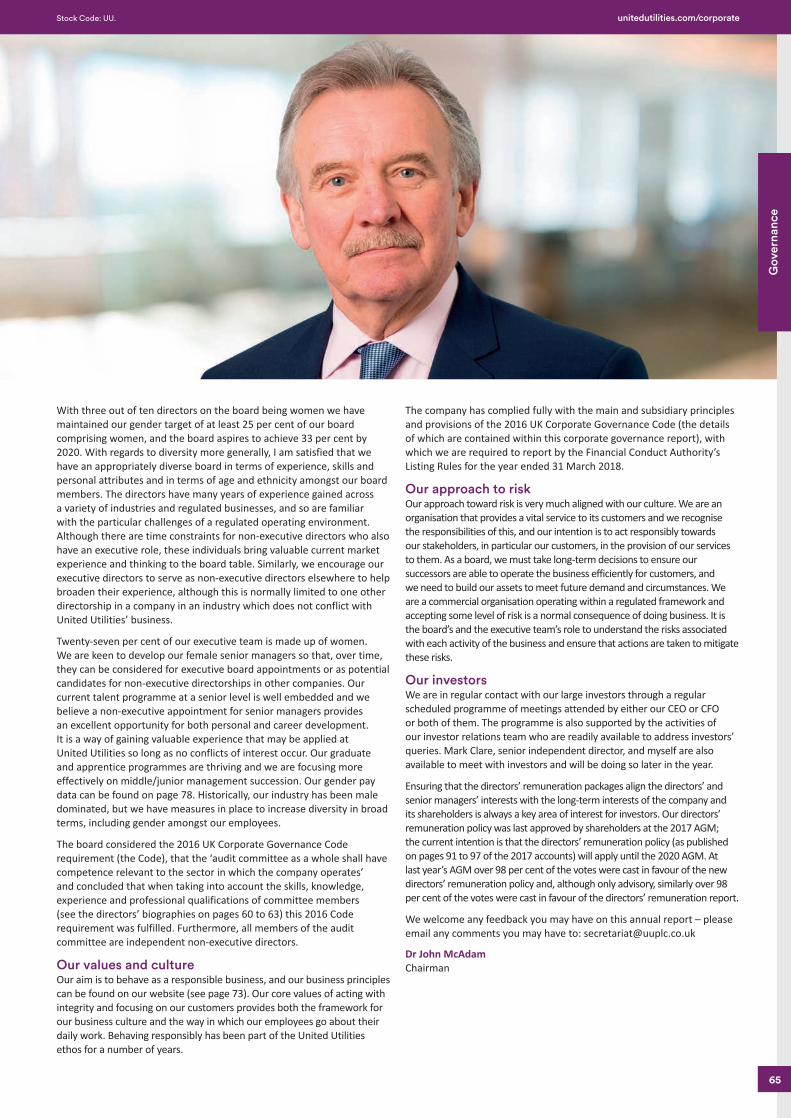
Job Number 4 June 2018 8:56 AM Proof 3 Job Number 4 June 2018 8:56 AM Proof 3
With three out of ten directors on the board being women we have maintained our gender target of at least 25 per cent of our board comprising women, and the board aspires to achieve 33 per cent by 2020. With regards to diversity more generally, I am satisfied that we have an appropriately diverse board in terms of experience, skills and personal attributes and in terms of age and ethnicity amongst our board members. The directors have many years of experience gained across a variety of industries and regulated businesses, and so are familiar with the particular challenges of a regulated operating environment. Although there are time constraints for non-executive directors who also have an executive role, these individuals bring valuable current market experience and thinking to the board table. Similarly, we encourage our executive directors to serve as non-executive directors elsewhere to help broaden their experience, although this is normally limited to one other directorship in a company in an industry which does not conflict with United Utilities’ business.
Twenty-seven per cent of our executive team is made up of women. We are keen to develop our female senior managers so that, over time, they can be considered for executive board appointments or as potential candidates for non-executive directorships in other companies. Our current talent programme at a senior level is well embedded and we believe a non-executive appointment for senior managers provides an excellent opportunity for both personal and career development. It is a way of gaining valuable experience that may be applied at United Utilities so long as no conflicts of interest occur. Our graduate and apprentice programmes are thriving and we are focusing more effectively on middle/junior management succession. Our gender pay data can be found on page 78. Historically, our industry has been male dominated, but we have measures in place to increase diversity in broad terms, including gender amongst our employees.
The board considered the 2016 UK Corporate Governance Code requirement (the Code), that the ‘audit committee as a whole shall have competence relevant to the sector in which the company operates’ and concluded that when taking into account the skills, knowledge, experience and professional qualifications of committee members (see the directors’ biographies on pages 60 to 63) this 2016 Code requirement was fulfilled. Furthermore, all members of the audit committee are independent non-executive directors.
Our values and cultureOur aim is to behave as a responsible business, and our business principles can be found on our website (see page 73). Our core values of acting with integrity and focusing on our customers provides both the framework for our business culture and the way in which our employees go about their daily work. Behaving responsibly has been part of the United Utilities ethos for a number of years.
The company has complied fully with the main and subsidiary principles and provisions of the 2016 UK Corporate Governance Code (the details of which are contained within this corporate governance report), with which we are required to report by the Financial Conduct Authority’s Listing Rules for the year ended 31 March 2018.
Our approach to riskOur approach toward risk is very much aligned with our culture. We are an organisation that provides a vital service to its customers and we recognise the responsibilities of this, and our intention is to act responsibly towards our stakeholders, in particular our customers, in the provision of our services to them. As a board, we must take long-term decisions to ensure our successors are able to operate the business efficiently for customers, and we need to build our assets to meet future demand and circumstances. We are a commercial organisation operating within a regulated framework and accepting some level of risk is a normal consequence of doing business. It is the board’s and the executive team’s role to understand the risks associated with each activity of the business and ensure that actions are taken to mitigate these risks.
Our investorsWe are in regular contact with our large investors through a regular scheduled programme of meetings attended by either our CEO or CFO or both of them. The programme is also supported by the activities of our investor relations team who are readily available to address investors’ queries. Mark Clare, senior independent director, and myself are also available to meet with investors and will be doing so later in the year.
Ensuring that the directors’ remuneration packages align the directors’ and senior managers’ interests with the long-term interests of the company and its shareholders is always a key area of interest for investors. Our directors’ remuneration policy was last approved by shareholders at the 2017 AGM; the current intention is that the directors’ remuneration policy (as published on pages 91 to 97 of the 2017 accounts) will apply until the 2020 AGM. At last year’s AGM over 98 per cent of the votes were cast in favour of the new directors’ remuneration policy and, although only advisory, similarly over 98 per cent of the votes were cast in favour of the directors’ remuneration report.
We welcome any feedback you may have on this annual report – please email any comments you may have to: [email protected]
Dr John McAdamChairman
65
Gov
erna
nce
Stock Code: UU. unitedutilities.com/corporate
United Utilities Middle Section.indd 65 04/06/2018 13:05:22
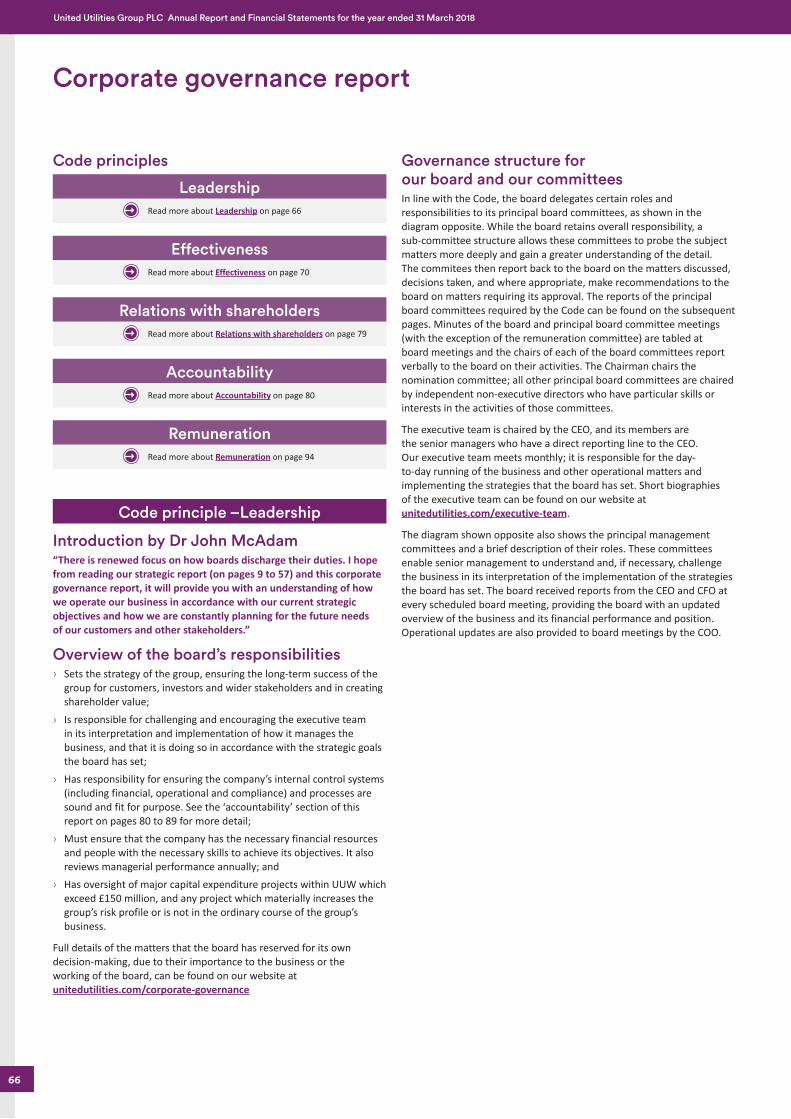
Job Number 4 June 2018 8:56 AM Proof 3 Job Number 4 June 2018 8:56 AM Proof 3
Corporate governance report
Code principles
LeadershipRead more about Leadership on page 66
EffectivenessRead more about Effectiveness on page 70
Relations with shareholdersRead more about Relations with shareholders on page 79
AccountabilityRead more about Accountability on page 80
RemunerationRead more about Remuneration on page 94
Code principle –Leadership
Introduction by Dr John McAdam“There is renewed focus on how boards discharge their duties. I hope from reading our strategic report (on pages 9 to 57) and this corporate governance report, it will provide you with an understanding of how we operate our business in accordance with our current strategic objectives and how we are constantly planning for the future needs of our customers and other stakeholders.”
Overview of the board’s responsibilities › Sets the strategy of the group, ensuring the long-term success of the
group for customers, investors and wider stakeholders and in creating shareholder value;
› Is responsible for challenging and encouraging the executive team in its interpretation and implementation of how it manages the business, and that it is doing so in accordance with the strategic goals the board has set;
› Has responsibility for ensuring the company’s internal control systems (including financial, operational and compliance) and processes are sound and fit for purpose. See the ‘accountability’ section of this report on pages 80 to 89 for more detail;
› Must ensure that the company has the necessary financial resources and people with the necessary skills to achieve its objectives. It also reviews managerial performance annually; and
› Has oversight of major capital expenditure projects within UUW which exceed £150 million, and any project which materially increases the group’s risk profile or is not in the ordinary course of the group’s business.
Full details of the matters that the board has reserved for its own decision-making, due to their importance to the business or the working of the board, can be found on our website at unitedutilities.com/corporate-governance
Governance structure for our board and our committees In line with the Code, the board delegates certain roles and responsibilities to its principal board committees, as shown in the diagram opposite. While the board retains overall responsibility, a sub-committee structure allows these committees to probe the subject matters more deeply and gain a greater understanding of the detail. The commitees then report back to the board on the matters discussed, decisions taken, and where appropriate, make recommendations to the board on matters requiring its approval. The reports of the principal board committees required by the Code can be found on the subsequent pages. Minutes of the board and principal board committee meetings (with the exception of the remuneration committee) are tabled at board meetings and the chairs of each of the board committees report verbally to the board on their activities. The Chairman chairs the nomination committee; all other principal board committees are chaired by independent non-executive directors who have particular skills or interests in the activities of those committees.
The executive team is chaired by the CEO, and its members are the senior managers who have a direct reporting line to the CEO. Our executive team meets monthly; it is responsible for the day-to-day running of the business and other operational matters and implementing the strategies that the board has set. Short biographies of the executive team can be found on our website at unitedutilities.com/executive-team.
The diagram shown opposite also shows the principal management committees and a brief description of their roles. These committees enable senior management to understand and, if necessary, challenge the business in its interpretation of the implementation of the strategies the board has set. The board received reports from the CEO and CFO at every scheduled board meeting, providing the board with an updated overview of the business and its financial performance and position. Operational updates are also provided to board meetings by the COO.
66
United Utilities Group PLC Annual Report and Financial Statements for the year ended 31 March 2018
United Utilities Middle Section.indd 66 04/06/2018 13:05:22
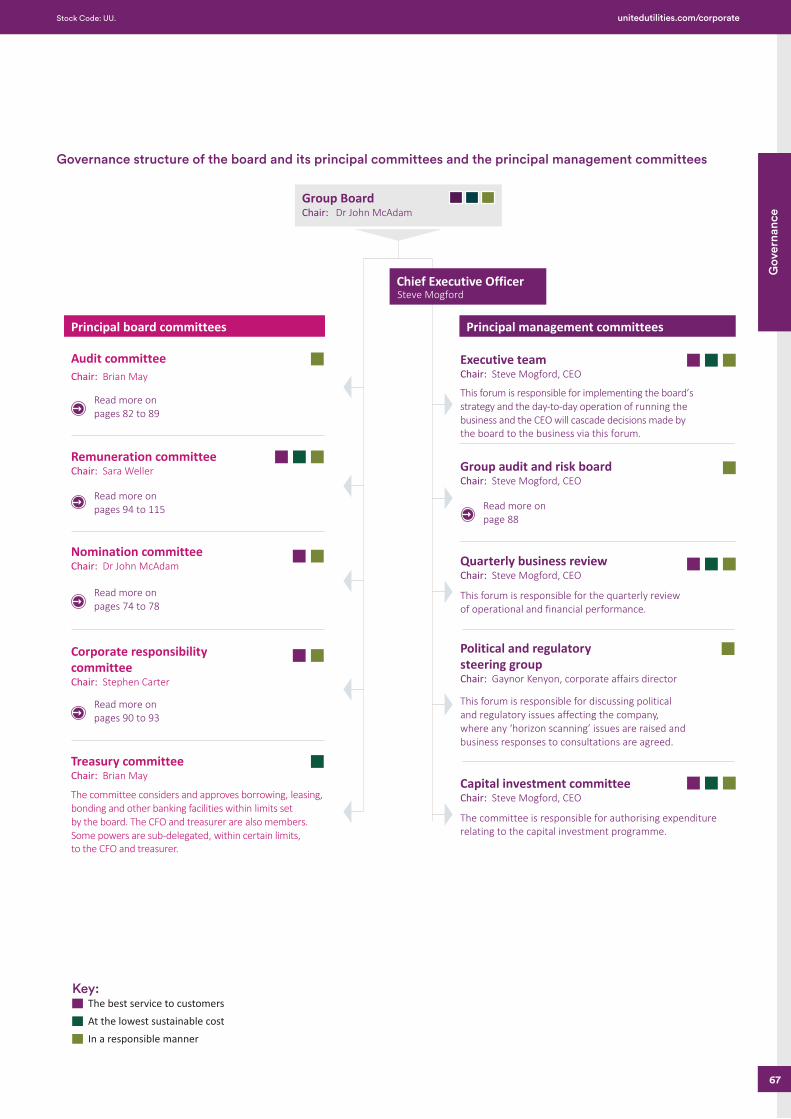
Job Number 4 June 2018 8:56 AM Proof 3 Job Number 4 June 2018 8:56 AM Proof 3
Audit committeeChair: Brian May
Remuneration committeeChair: Sara Weller
Nomination committeeChair: Dr John McAdam
Corporate responsibility committeeChair: Stephen Carter
Treasury committeeChair: Brian May
Executive teamChair: Steve Mogford, CEO
Group audit and risk boardChair: Steve Mogford, CEO
Quarterly business reviewChair: Steve Mogford, CEO
Principal board committees
Group BoardChair: Dr John McAdam
This forum is responsible for implementing the board’sstrategy and the day-to-day operation of running thebusiness and the CEO will cascade decisions made bythe board to the business via this forum.
This forum is responsible for the quarterly review of operational and financial performance.
Political and regulatory
steering groupChair: Gaynor Kenyon, corporate affairs director
This forum is responsible for discussing political and regulatory issues affecting the company, where any ‘horizon scanning’ issues are raised and business responses to consultations are agreed.
Read more on
pages 82 to 89
The committee considers and approves borrowing, leasing,bonding and other banking facilities within limits set by the board. The CFO and treasurer are also members. Some powers are sub-delegated, within certain limits,to the CFO and treasurer.
Principal management committees
Read more on
pages 94 to 115
Read more on
pages 74 to 78
Read more on
pages 90 to 93
Read more on
page 88
Capital investment committeeChair: Steve Mogford, CEO
The committee is responsible for authorising expenditure relating to the capital investment programme.
Chief Executive OfficerSteve Mogford
Key: The best service to customers
At the lowest sustainable cost
In a responsible manner
Governance structure of the board and its principal committees and the principal management committees
67
Gov
erna
nce
Stock Code: UU. unitedutilities.com/corporate
United Utilities Middle Section.indd 67 04/06/2018 13:05:22
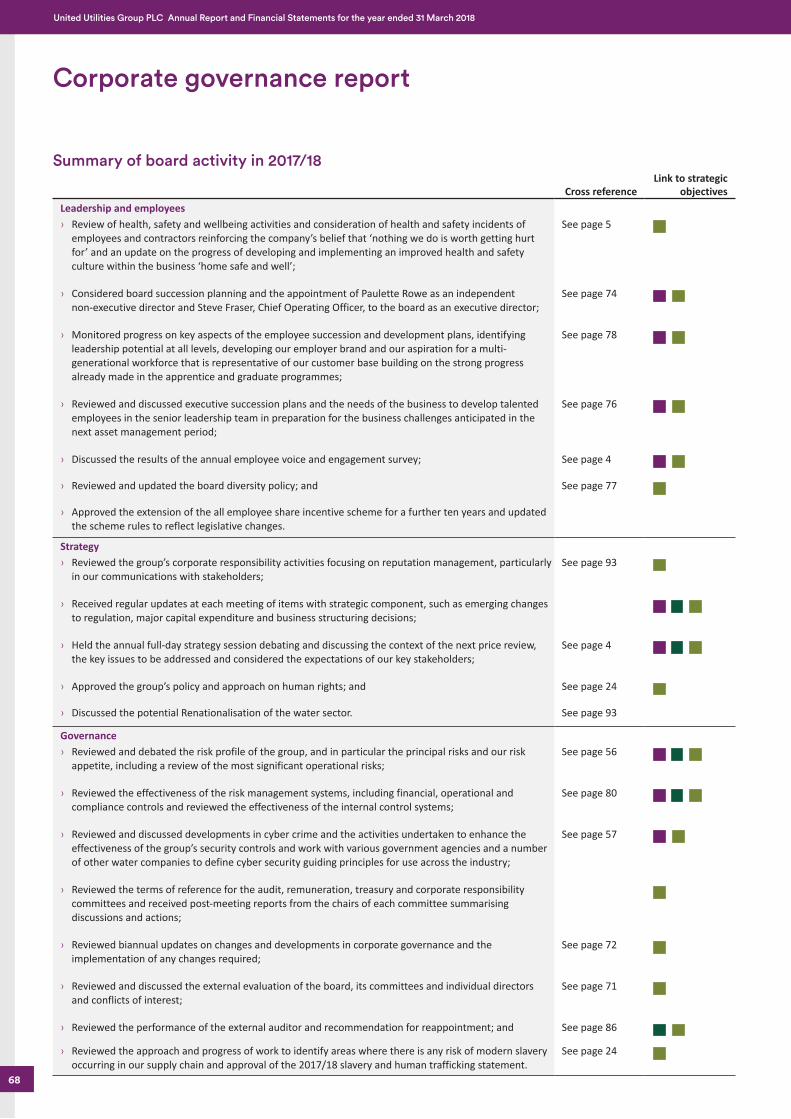
Job Number 4 June 2018 8:56 AM Proof 3 Job Number 4 June 2018 8:56 AM Proof 3
Corporate governance report
Summary of board activity in 2017/18
Cross referenceLink to strategic
objectivesLeadership and employees › Review of health, safety and wellbeing activities and consideration of health and safety incidents of
employees and contractors reinforcing the company’s belief that ‘nothing we do is worth getting hurt for’ and an update on the progress of developing and implementing an improved health and safety culture within the business ‘home safe and well’;
See page 5
› Considered board succession planning and the appointment of Paulette Rowe as an independent non-executive director and Steve Fraser, Chief Operating Officer, to the board as an executive director;
See page 74
› Monitored progress on key aspects of the employee succession and development plans, identifying leadership potential at all levels, developing our employer brand and our aspiration for a multi-generational workforce that is representative of our customer base building on the strong progress already made in the apprentice and graduate programmes;
See page 78
› Reviewed and discussed executive succession plans and the needs of the business to develop talented employees in the senior leadership team in preparation for the business challenges anticipated in the next asset management period;
See page 76
› Discussed the results of the annual employee voice and engagement survey; See page 4 › Reviewed and updated the board diversity policy; and See page 77
› Approved the extension of the all employee share incentive scheme for a further ten years and updated the scheme rules to reflect legislative changes.
Strategy › Reviewed the group’s corporate responsibility activities focusing on reputation management, particularly
in our communications with stakeholders;See page 93
› Received regular updates at each meeting of items with strategic component, such as emerging changes to regulation, major capital expenditure and business structuring decisions;
› Held the annual full-day strategy session debating and discussing the context of the next price review, the key issues to be addressed and considered the expectations of our key stakeholders;
See page 4
› Approved the group’s policy and approach on human rights; and See page 24
› Discussed the potential Renationalisation of the water sector. See page 93
Governance › Reviewed and debated the risk profile of the group, and in particular the principal risks and our risk
appetite, including a review of the most significant operational risks; See page 56
› Reviewed the effectiveness of the risk management systems, including financial, operational and compliance controls and reviewed the effectiveness of the internal control systems;
See page 80
› Reviewed and discussed developments in cyber crime and the activities undertaken to enhance the effectiveness of the group’s security controls and work with various government agencies and a number of other water companies to define cyber security guiding principles for use across the industry;
See page 57
› Reviewed the terms of reference for the audit, remuneration, treasury and corporate responsibility committees and received post-meeting reports from the chairs of each committee summarising discussions and actions;
› Reviewed biannual updates on changes and developments in corporate governance and the implementation of any changes required;
See page 72
› Reviewed and discussed the external evaluation of the board, its committees and individual directors and conflicts of interest;
See page 71
› Reviewed the performance of the external auditor and recommendation for reappointment; and See page 86 › Reviewed the approach and progress of work to identify areas where there is any risk of modern slavery
occurring in our supply chain and approval of the 2017/18 slavery and human trafficking statement.See page 24
68
United Utilities Group PLC Annual Report and Financial Statements for the year ended 31 March 2018
United Utilities Middle Section.indd 68 04/06/2018 13:05:23
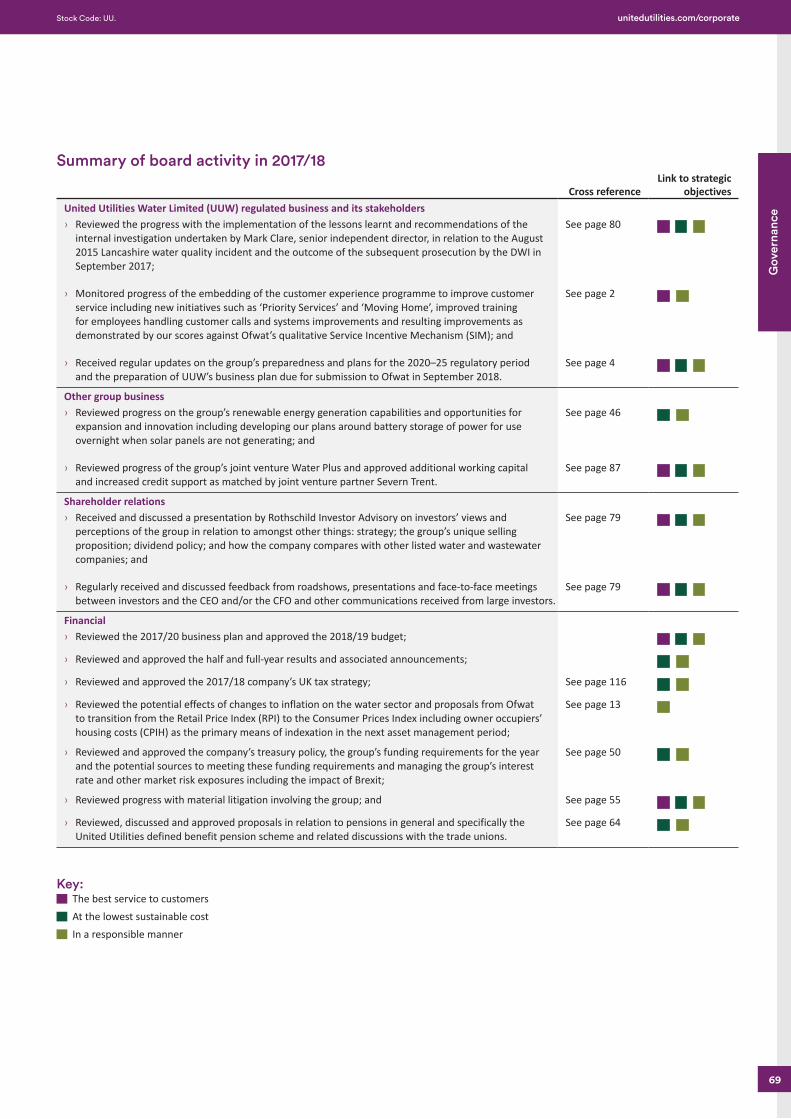
Job Number 4 June 2018 8:56 AM Proof 3 Job Number 4 June 2018 8:56 AM Proof 3
Key: The best service to customers
At the lowest sustainable cost
In a responsible manner
Summary of board activity in 2017/18
Cross referenceLink to strategic
objectivesUnited Utilities Water Limited (UUW) regulated business and its stakeholders › Reviewed the progress with the implementation of the lessons learnt and recommendations of the
internal investigation undertaken by Mark Clare, senior independent director, in relation to the August 2015 Lancashire water quality incident and the outcome of the subsequent prosecution by the DWI in September 2017;
See page 80
› Monitored progress of the embedding of the customer experience programme to improve customer service including new initiatives such as ‘Priority Services’ and ‘Moving Home’, improved training for employees handling customer calls and systems improvements and resulting improvements as demonstrated by our scores against Ofwat’s qualitative Service Incentive Mechanism (SIM); and
See page 2
› Received regular updates on the group’s preparedness and plans for the 2020–25 regulatory period and the preparation of UUW’s business plan due for submission to Ofwat in September 2018.
See page 4
Other group business › Reviewed progress on the group’s renewable energy generation capabilities and opportunities for
expansion and innovation including developing our plans around battery storage of power for use overnight when solar panels are not generating; and
See page 46
› Reviewed progress of the group’s joint venture Water Plus and approved additional working capital and increased credit support as matched by joint venture partner Severn Trent.
See page 87
Shareholder relations › Received and discussed a presentation by Rothschild Investor Advisory on investors’ views and
perceptions of the group in relation to amongst other things: strategy; the group’s unique selling proposition; dividend policy; and how the company compares with other listed water and wastewater companies; and
See page 79
› Regularly received and discussed feedback from roadshows, presentations and face-to-face meetings between investors and the CEO and/or the CFO and other communications received from large investors.
See page 79
Financial › Reviewed the 2017/20 business plan and approved the 2018/19 budget;
› Reviewed and approved the half and full-year results and associated announcements; › Reviewed and approved the 2017/18 company’s UK tax strategy; See page 116 › Reviewed the potential effects of changes to inflation on the water sector and proposals from Ofwat
to transition from the Retail Price Index (RPI) to the Consumer Prices Index including owner occupiers’ housing costs (CPIH) as the primary means of indexation in the next asset management period;
See page 13
› Reviewed and approved the company’s treasury policy, the group’s funding requirements for the year and the potential sources to meeting these funding requirements and managing the group’s interest rate and other market risk exposures including the impact of Brexit;
See page 50
› Reviewed progress with material litigation involving the group; and See page 55
› Reviewed, discussed and approved proposals in relation to pensions in general and specifically the United Utilities defined benefit pension scheme and related discussions with the trade unions.
See page 64
69
Gov
erna
nce
Stock Code: UU. unitedutilities.com/corporate
United Utilities Middle Section.indd 69 04/06/2018 13:05:23
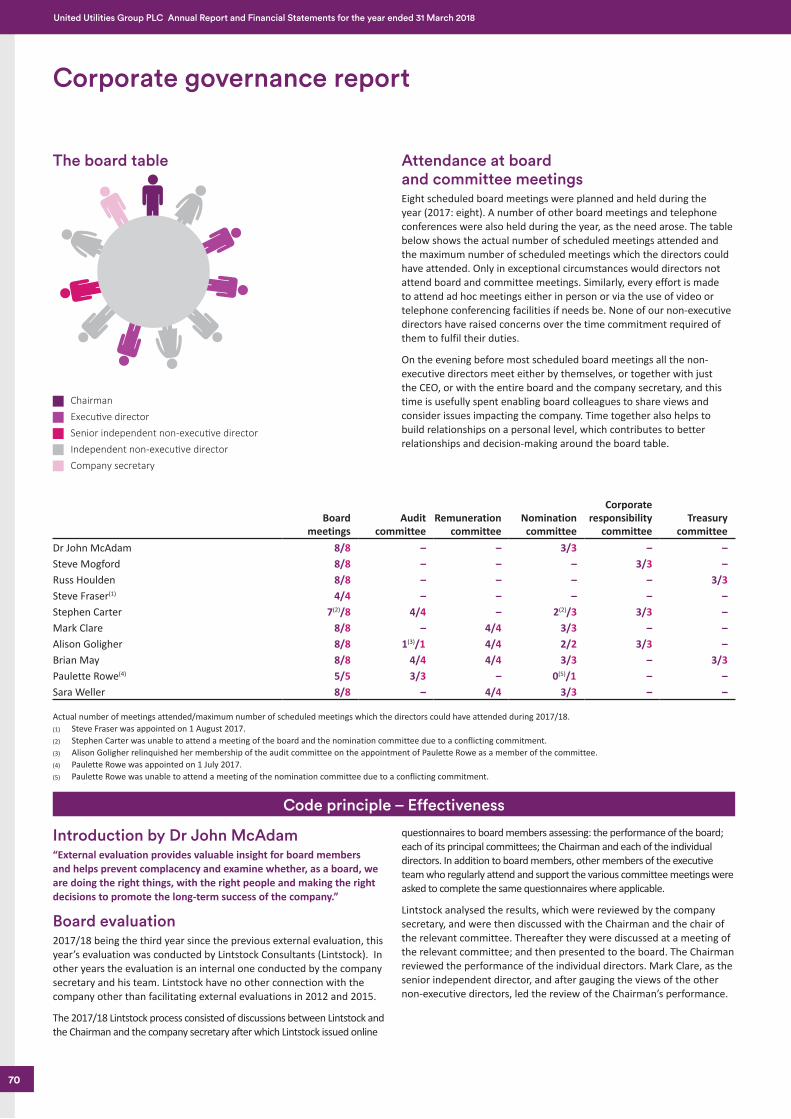
Job Number 4 June 2018 8:56 AM Proof 3 Job Number 4 June 2018 8:56 AM Proof 3
Corporate governance report
The board table
ChairmanExecu�ve directorSenior independent non-execu�ve directorIndependent non-execu�ve directorCompany secretary
Attendance at board and committee meetingsEight scheduled board meetings were planned and held during the year (2017: eight). A number of other board meetings and telephone conferences were also held during the year, as the need arose. The table below shows the actual number of scheduled meetings attended and the maximum number of scheduled meetings which the directors could have attended. Only in exceptional circumstances would directors not attend board and committee meetings. Similarly, every effort is made to attend ad hoc meetings either in person or via the use of video or telephone conferencing facilities if needs be. None of our non-executive directors have raised concerns over the time commitment required of them to fulfil their duties.
On the evening before most scheduled board meetings all the non-executive directors meet either by themselves, or together with just the CEO, or with the entire board and the company secretary, and this time is usefully spent enabling board colleagues to share views and consider issues impacting the company. Time together also helps to build relationships on a personal level, which contributes to better relationships and decision-making around the board table.
Boardmeetings
Auditcommittee
Remunerationcommittee
Nomination committee
Corporateresponsibility
committeeTreasury
committeeDr John McAdam 8/8 – – 3/3 – –Steve Mogford 8/8 – – – 3/3 –Russ Houlden 8/8 – – – – 3/3Steve Fraser(1) 4/4 – – – – –Stephen Carter 7(2)/8 4/4 – 2(2)/3 3/3 –Mark Clare 8/8 – 4/4 3/3 – –Alison Goligher 8/8 1(3)/1 4/4 2/2 3/3 –Brian May 8/8 4/4 4/4 3/3 – 3/3Paulette Rowe(4) 5/5 3/3 – 0(5)/1 – –Sara Weller 8/8 – 4/4 3/3 – –
Actual number of meetings attended/maximum number of scheduled meetings which the directors could have attended during 2017/18. (1) Steve Fraser was appointed on 1 August 2017.(2) Stephen Carter was unable to attend a meeting of the board and the nomination committee due to a conflicting commitment.(3) Alison Goligher relinquished her membership of the audit committee on the appointment of Paulette Rowe as a member of the committee.(4) Paulette Rowe was appointed on 1 July 2017.(5) Paulette Rowe was unable to attend a meeting of the nomination committee due to a conflicting commitment.
Code principle – Effectiveness
Introduction by Dr John McAdam“External evaluation provides valuable insight for board members and helps prevent complacency and examine whether, as a board, we are doing the right things, with the right people and making the right decisions to promote the long-term success of the company.”
Board evaluation2017/18 being the third year since the previous external evaluation, this year’s evaluation was conducted by Lintstock Consultants (Lintstock). In other years the evaluation is an internal one conducted by the company secretary and his team. Lintstock have no other connection with the company other than facilitating external evaluations in 2012 and 2015.
The 2017/18 Lintstock process consisted of discussions between Lintstock and the Chairman and the company secretary after which Lintstock issued online
questionnaires to board members assessing: the performance of the board; each of its principal committees; the Chairman and each of the individual directors. In addition to board members, other members of the executive team who regularly attend and support the various committee meetings were asked to complete the same questionnaires where applicable.
Lintstock analysed the results, which were reviewed by the company secretary, and were then discussed with the Chairman and the chair of the relevant committee. Thereafter they were discussed at a meeting of the relevant committee; and then presented to the board. The Chairman reviewed the performance of the individual directors. Mark Clare, as the senior independent director, and after gauging the views of the other non-executive directors, led the review of the Chairman’s performance.
70
United Utilities Group PLC Annual Report and Financial Statements for the year ended 31 March 2018
United Utilities Middle Section.indd 70 04/06/2018 13:05:23
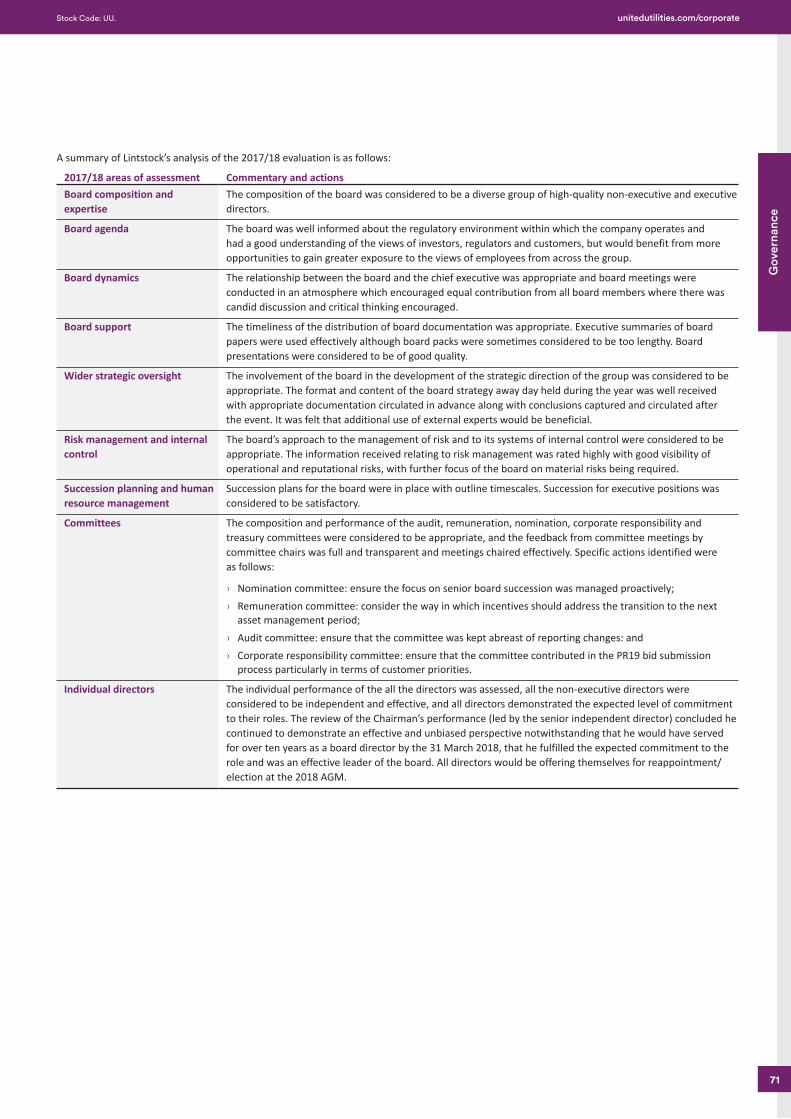
Job Number 4 June 2018 8:56 AM Proof 3 Job Number 4 June 2018 8:56 AM Proof 3
A summary of Lintstock’s analysis of the 2017/18 evaluation is as follows:
2017/18 areas of assessment Commentary and actionsBoard composition andexpertise
The composition of the board was considered to be a diverse group of high-quality non-executive and executive directors.
Board agenda The board was well informed about the regulatory environment within which the company operates and had a good understanding of the views of investors, regulators and customers, but would benefit from more opportunities to gain greater exposure to the views of employees from across the group.
Board dynamics The relationship between the board and the chief executive was appropriate and board meetings were conducted in an atmosphere which encouraged equal contribution from all board members where there was candid discussion and critical thinking encouraged.
Board support The timeliness of the distribution of board documentation was appropriate. Executive summaries of board papers were used effectively although board packs were sometimes considered to be too lengthy. Board presentations were considered to be of good quality.
Wider strategic oversight The involvement of the board in the development of the strategic direction of the group was considered to be appropriate. The format and content of the board strategy away day held during the year was well received with appropriate documentation circulated in advance along with conclusions captured and circulated after the event. It was felt that additional use of external experts would be beneficial.
Risk management and internal control
The board’s approach to the management of risk and to its systems of internal control were considered to be appropriate. The information received relating to risk management was rated highly with good visibility of operational and reputational risks, with further focus of the board on material risks being required.
Succession planning and human resource management
Succession plans for the board were in place with outline timescales. Succession for executive positions was considered to be satisfactory.
Committees The composition and performance of the audit, remuneration, nomination, corporate responsibility and treasury committees were considered to be appropriate, and the feedback from committee meetings by committee chairs was full and transparent and meetings chaired effectively. Specific actions identified were as follows:
› Nomination committee: ensure the focus on senior board succession was managed proactively; › Remuneration committee: consider the way in which incentives should address the transition to the next
asset management period; › Audit committee: ensure that the committee was kept abreast of reporting changes: and › Corporate responsibility committee: ensure that the committee contributed in the PR19 bid submission
process particularly in terms of customer priorities.
Individual directors The individual performance of the all the directors was assessed, all the non-executive directors were considered to be independent and effective, and all directors demonstrated the expected level of commitment to their roles. The review of the Chairman’s performance (led by the senior independent director) concluded he continued to demonstrate an effective and unbiased perspective notwithstanding that he would have served for over ten years as a board director by the 31 March 2018, that he fulfilled the expected commitment to the role and was an effective leader of the board. All directors would be offering themselves for reappointment/election at the 2018 AGM.
71
Gov
erna
nce
Stock Code: UU. unitedutilities.com/corporate
United Utilities Middle Section.indd 71 04/06/2018 13:05:23
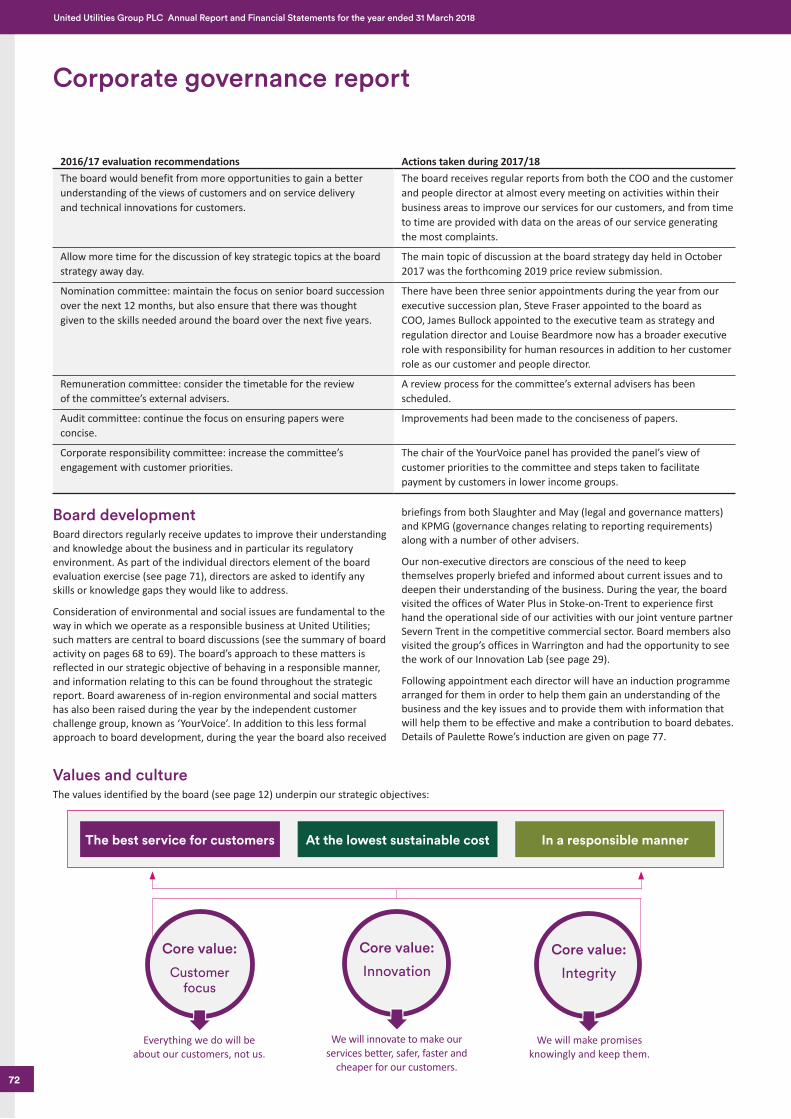
Job Number 4 June 2018 8:56 AM Proof 3 Job Number 4 June 2018 8:56 AM Proof 3
Corporate governance report
Values and cultureThe values identified by the board (see page 12) underpin our strategic objectives:
2016/17 evaluation recommendations Actions taken during 2017/18The board would benefit from more opportunities to gain a better understanding of the views of customers and on service delivery and technical innovations for customers.
The board receives regular reports from both the COO and the customer and people director at almost every meeting on activities within their business areas to improve our services for our customers, and from time to time are provided with data on the areas of our service generating the most complaints.
Allow more time for the discussion of key strategic topics at the board strategy away day.
The main topic of discussion at the board strategy day held in October 2017 was the forthcoming 2019 price review submission.
Nomination committee: maintain the focus on senior board succession over the next 12 months, but also ensure that there was thought given to the skills needed around the board over the next five years.
There have been three senior appointments during the year from our executive succession plan, Steve Fraser appointed to the board as COO, James Bullock appointed to the executive team as strategy and regulation director and Louise Beardmore now has a broader executive role with responsibility for human resources in addition to her customer role as our customer and people director.
Remuneration committee: consider the timetable for the review of the committee’s external advisers.
A review process for the committee’s external advisers has been scheduled.
Audit committee: continue the focus on ensuring papers were concise.
Improvements had been made to the conciseness of papers.
Corporate responsibility committee: increase the committee’s engagement with customer priorities.
The chair of the YourVoice panel has provided the panel’s view of customer priorities to the committee and steps taken to facilitate payment by customers in lower income groups.
Board developmentBoard directors regularly receive updates to improve their understanding and knowledge about the business and in particular its regulatory environment. As part of the individual directors element of the board evaluation exercise (see page 71), directors are asked to identify any skills or knowledge gaps they would like to address.
Consideration of environmental and social issues are fundamental to the way in which we operate as a responsible business at United Utilities; such matters are central to board discussions (see the summary of board activity on pages 68 to 69). The board’s approach to these matters is reflected in our strategic objective of behaving in a responsible manner, and information relating to this can be found throughout the strategic report. Board awareness of in-region environmental and social matters has also been raised during the year by the independent customer challenge group, known as ‘YourVoice’. In addition to this less formal approach to board development, during the year the board also received
briefings from both Slaughter and May (legal and governance matters) and KPMG (governance changes relating to reporting requirements) along with a number of other advisers.
Our non-executive directors are conscious of the need to keep themselves properly briefed and informed about current issues and to deepen their understanding of the business. During the year, the board visited the offices of Water Plus in Stoke-on-Trent to experience first hand the operational side of our activities with our joint venture partner Severn Trent in the competitive commercial sector. Board members also visited the group’s offices in Warrington and had the opportunity to see the work of our Innovation Lab (see page 29).
Following appointment each director will have an induction programme arranged for them in order to help them gain an understanding of the business and the key issues and to provide them with information that will help them to be effective and make a contribution to board debates. Details of Paulette Rowe’s induction are given on page 77.
The best service for customers At the lowest sustainable cost In a responsible manner
Everything we do will be about our customers, not us.
We will innovate to make our services better, safer, faster and
cheaper for our customers.
Core value:
Customer focus
We will make promises knowingly and keep them.
Core value:
Integrity
Core value:
Innovation
72
United Utilities Group PLC Annual Report and Financial Statements for the year ended 31 March 2018
United Utilities Middle Section.indd 72 04/06/2018 13:05:23
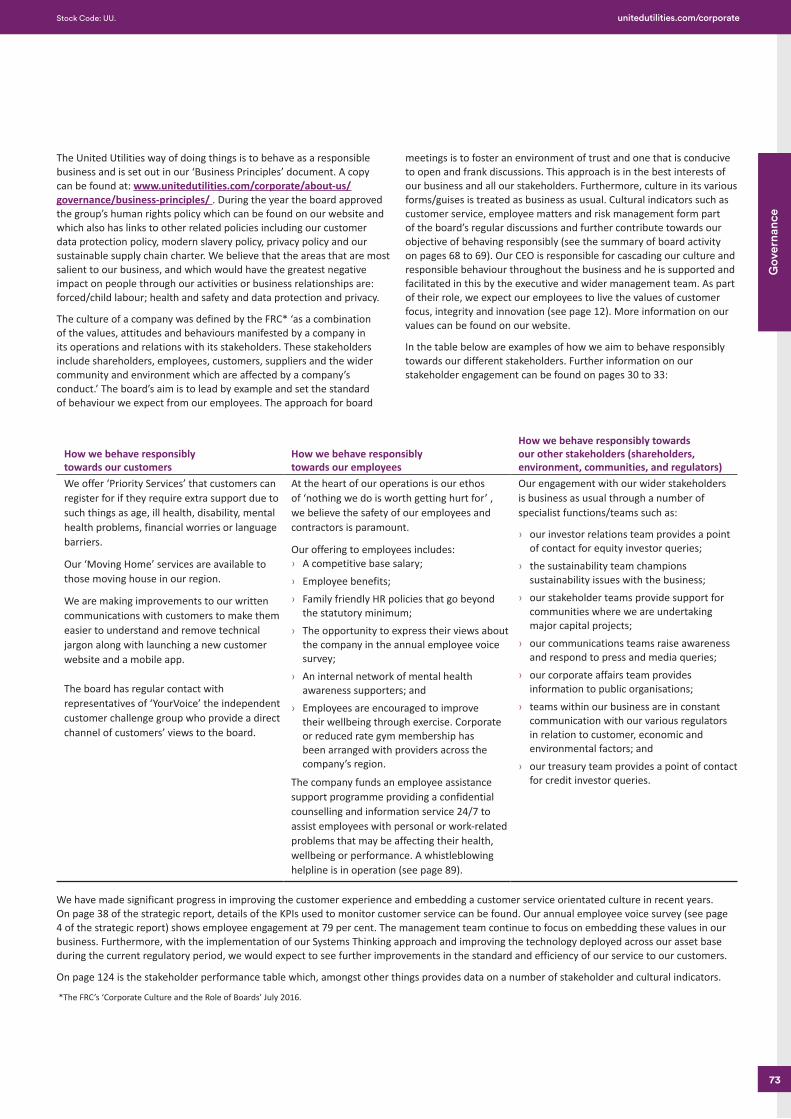
Job Number 4 June 2018 8:56 AM Proof 3 Job Number 4 June 2018 8:56 AM Proof 3
The United Utilities way of doing things is to behave as a responsible business and is set out in our ‘Business Principles’ document. A copy can be found at: www.unitedutilities.com/corporate/about-us/governance/business-principles/ . During the year the board approved the group’s human rights policy which can be found on our website and which also has links to other related policies including our customer data protection policy, modern slavery policy, privacy policy and our sustainable supply chain charter. We believe that the areas that are most salient to our business, and which would have the greatest negative impact on people through our activities or business relationships are: forced/child labour; health and safety and data protection and privacy.
The culture of a company was defined by the FRC* ‘as a combination of the values, attitudes and behaviours manifested by a company in its operations and relations with its stakeholders. These stakeholders include shareholders, employees, customers, suppliers and the wider community and environment which are affected by a company’s conduct.’ The board’s aim is to lead by example and set the standard of behaviour we expect from our employees. The approach for board
meetings is to foster an environment of trust and one that is conducive to open and frank discussions. This approach is in the best interests of our business and all our stakeholders. Furthermore, culture in its various forms/guises is treated as business as usual. Cultural indicators such as customer service, employee matters and risk management form part of the board’s regular discussions and further contribute towards our objective of behaving responsibly (see the summary of board activity on pages 68 to 69). Our CEO is responsible for cascading our culture and responsible behaviour throughout the business and he is supported and facilitated in this by the executive and wider management team. As part of their role, we expect our employees to live the values of customer focus, integrity and innovation (see page 12). More information on our values can be found on our website.
In the table below are examples of how we aim to behave responsibly towards our different stakeholders. Further information on our stakeholder engagement can be found on pages 30 to 33:
How we behave responsibly towards our customers
How we behave responsibly towards our employees
How we behave responsibly towards our other stakeholders (shareholders, environment, communities, and regulators)
We offer ‘Priority Services’ that customers can register for if they require extra support due to such things as age, ill health, disability, mental health problems, financial worries or language barriers.
Our ‘Moving Home’ services are available to those moving house in our region.
We are making improvements to our written communications with customers to make them easier to understand and remove technical jargon along with launching a new customer website and a mobile app.
The board has regular contact with representatives of ‘YourVoice’ the independent customer challenge group who provide a direct channel of customers’ views to the board.
At the heart of our operations is our ethos of ‘nothing we do is worth getting hurt for’ , we believe the safety of our employees and contractors is paramount.
Our offering to employees includes: › A competitive base salary; › Employee benefits; › Family friendly HR policies that go beyond
the statutory minimum; › The opportunity to express their views about
the company in the annual employee voice survey;
› An internal network of mental health awareness supporters; and
› Employees are encouraged to improve their wellbeing through exercise. Corporate or reduced rate gym membership has been arranged with providers across the company’s region.
The company funds an employee assistance support programme providing a confidential counselling and information service 24/7 to assist employees with personal or work-related problems that may be affecting their health, wellbeing or performance. A whistleblowing helpline is in operation (see page 89).
Our engagement with our wider stakeholders is business as usual through a number of specialist functions/teams such as:
› our investor relations team provides a point of contact for equity investor queries;
› the sustainability team champions sustainability issues with the business;
› our stakeholder teams provide support for communities where we are undertaking major capital projects;
› our communications teams raise awareness and respond to press and media queries;
› our corporate affairs team provides information to public organisations;
› teams within our business are in constant communication with our various regulators in relation to customer, economic and environmental factors; and
› our treasury team provides a point of contact for credit investor queries.
We have made significant progress in improving the customer experience and embedding a customer service orientated culture in recent years. On page 38 of the strategic report, details of the KPIs used to monitor customer service can be found. Our annual employee voice survey (see page 4 of the strategic report) shows employee engagement at 79 per cent. The management team continue to focus on embedding these values in our business. Furthermore, with the implementation of our Systems Thinking approach and improving the technology deployed across our asset base during the current regulatory period, we would expect to see further improvements in the standard and efficiency of our service to our customers.
On page 124 is the stakeholder performance table which, amongst other things provides data on a number of stakeholder and cultural indicators.
*The FRC’s ‘Corporate Culture and the Role of Boards’ July 2016.
73
Gov
erna
nce
Stock Code: UU. unitedutilities.com/corporate
United Utilities Middle Section.indd 73 04/06/2018 13:05:24
Job Number 4 June 2018 8:56 AM Proof 3 Job Number 4 June 2018 8:56 AM Proof 3
To ensure that board members and senior management have the appropriate balance of skills and experience to support the group’s strategic objectives.
Dear ShareholderWe have made considerable progress during the year in developing our board succession plans, and we have tried in this report to provide an informative explanation of our succession planning activities that will reassure our stakeholders that these matters are being properly addressed. In many ways, given the nature of the subject matter, it is a difficult topic to report publicly, and on a human level, people’s lives and circumstances can change, sometimes at short notice.
As a board that is relatively small in size, succession planning to ensure that board members and senior management have the appropriate balance of skills and experience to support the group’s strategic objectives is a matter that the board as a whole considers. We therefore have the benefit of the views and experience of all board members to contribute to the debate. During the year the board has reviewed the people and organisational capability plan and the progress being made to develop the skills and capabilities we need going forwards to support, amongst other things, our Systems Thinking and digitalisation. In our succession planning we aim to ensure both our board directors and
Quick facts
› All members of the committee are independent, thus exceeding the Code requirement that a ‘majority of members of the nomination committee should be independent non-executive directors’;
› The role of the committee is to make recommendations to the board on its composition, balance and membership and on refreshing the membership of the board committees;
› The company secretary attends all meetings of the committee; › The customer services and people director, who has
responsibility for human resources, regularly attends meetings and is responsible for engaging with executive search recruitment advisers; and
› The CEO is not a member of the committee, but from time to time is invited to attend. Neither the Chairman nor the CEO would participate in the recruitment of their own successor.
Quick linksTerms of reference – unitedutilities.com/corporate-governance
members of the executive team and other senior managers, who are potential successors to the executive team or board, are well equipped with the right skills and experience to address the challenges of our business and, where necessary, address any developmental needs. They also need to be in tune with the culture of the company.
In support of these board discussions, the nomination committee has responsibility for considering the detailed recruitment process for executive and non-executive board appointments and members of the executive team. All the non-executive directors are members of the nomination committee and participate in meetings and in the recruitment process for new board colleagues. The nomination committee would be supported in a board recruitment process by Louise Beardmore, customer services and people director, as part of her human resources responsibilities. The committee met three times during the year. The meetings discussed and developed our board and executive level succession plans, which address both contingency planning needs and requirements in the short to medium-term. These plans now include more granularity on timescales for key board positions. During the year, the committee finalised the appointment on 1 July 2017 of Paulette Rowe as an independent non-executive director. Paulette’s first-hand regulatory experience will provide additional perspective in this important area for the group, and her experience of technology driven business transformation will contribute to our operational activities, through the customer experience programme and our Systems Thinking approach. We welcome Paulette to the board in this her first non-executive role for a listed company.
The committee has for some time been monitoring the development of Steve Fraser towards a board appointment and it was concluded that he be recommended to the board for an executive appointment as Chief Operating Officer.
Historically, independent non-executive directors at United Utilities have served a term of between seven and nine years, a pattern which has facilitated the refreshing of the board in recent years on an annual basis, along with ensuring a high degree of continuity. Notwithstanding this, the specifics of each of the non-executive directors’ time of departure has been driven by their own personal circumstances. Serving beyond a nine-year term is identified in the Code as being one of the reasons which could affect a non-executive director’s independence. The 2016 Code excludes board chairmen from the nine-year rule.
Our board diversity policy (see page 77) is taken into account during every candidate selection process. Ultimately, we do strive to appoint the person we believe is best matched to the role in terms of what they have to offer the company and to make a positive contribution to the board conversation and board dynamics. Diversity of outlook and interest is essential to ensuring we have a variety of views to contribute to discussions. We have revised our target for gender diversity, which currently stands at 30 per cent, in our board diversity policy, which shall be to maintain at least 25 per cent, and aspire to 33 per cent female representation on our board by 2020.
Dr John McAdamChair of the nomination committee
Corporate governance reportNomination committee
Nomination committee members
Dr John McAdam (chair) Brian May
Stephen Carter Paulette Rowe
Mark Clare Sara Weller
Alison Goligher
74
United Utilities Group PLC Annual Report and Financial Statements for the year ended 31 March 2018
United Utilities Middle Section.indd 74 04/06/2018 13:05:25
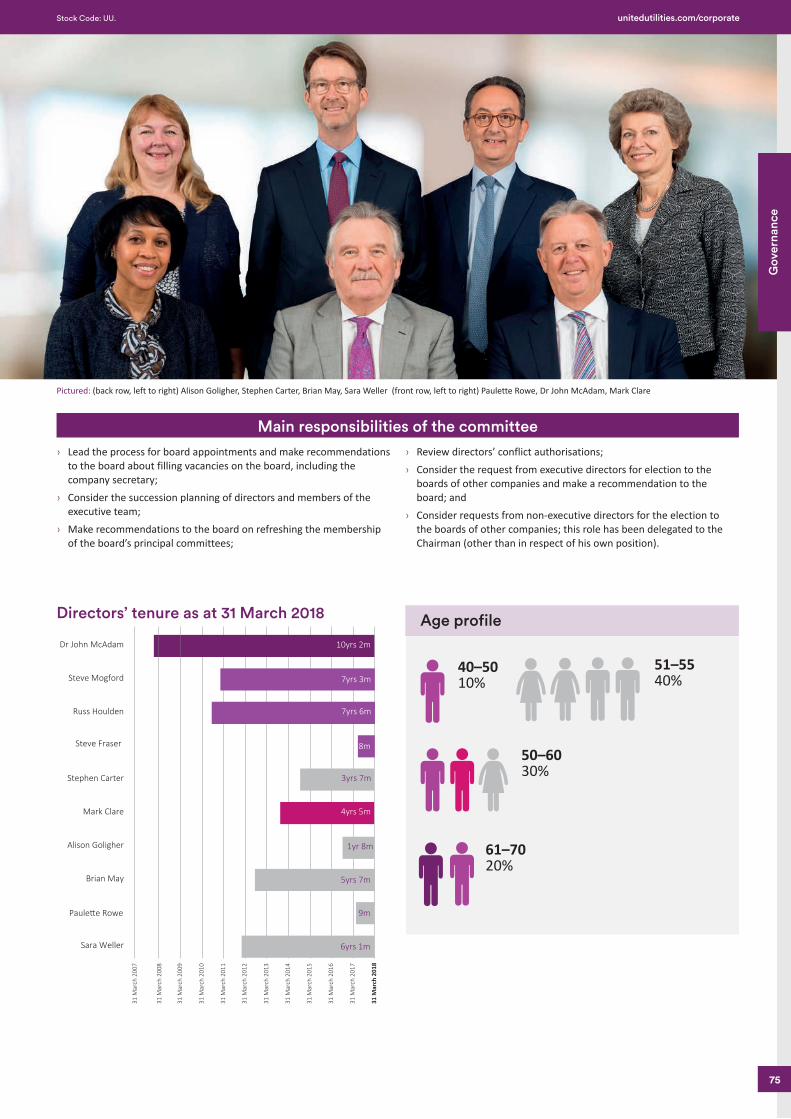
Job Number 4 June 2018 8:56 AM Proof 3 Job Number 4 June 2018 8:56 AM Proof 3
› Lead the process for board appointments and make recommendations to the board about filling vacancies on the board, including the company secretary;
› Consider the succession planning of directors and members of the executive team;
› Make recommendations to the board on refreshing the membership of the board’s principal committees;
› Review directors’ conflict authorisations; › Consider the request from executive directors for election to the
boards of other companies and make a recommendation to the board; and
› Consider requests from non-executive directors for the election to the boards of other companies; this role has been delegated to the Chairman (other than in respect of his own position).
Directors’ tenure as at 31 March 2018
Sara Weller
Brian May
Mark Clare
Stephen Carter
Alison Goligher
Russ Houlden
Steve Mogford
Dr John McAdam
31 M
arch
200
9
31 M
arch
200
8
31 M
arch
201
0
31 M
arch
201
1
31 M
arch
201
2
31 M
arch
201
3
31 M
arch
201
4
31 M
arch
201
5
31 M
arch
201
6
31 M
arch
201
7
31 M
arch
201
8
31 M
arch
200
7
6yrs 1m
5yrs 7m
4yrs 5m
3yrs 7m
Steve Fraser 8m
7yrs 6m
7yrs 3m
10yrs 2m
1yr 8m
Paule�e Rowe 9m
40–5010%
50–6030%
61–7020%
51–5540%
Age profile
Main responsibilities of the committee
Pictured: (back row, left to right) Alison Goligher, Stephen Carter, Brian May, Sara Weller (front row, left to right) Paulette Rowe, Dr John McAdam, Mark Clare
75
Gov
erna
nce
Stock Code: UU. unitedutilities.com/corporate
United Utilities Middle Section.indd 75 04/06/2018 13:05:27
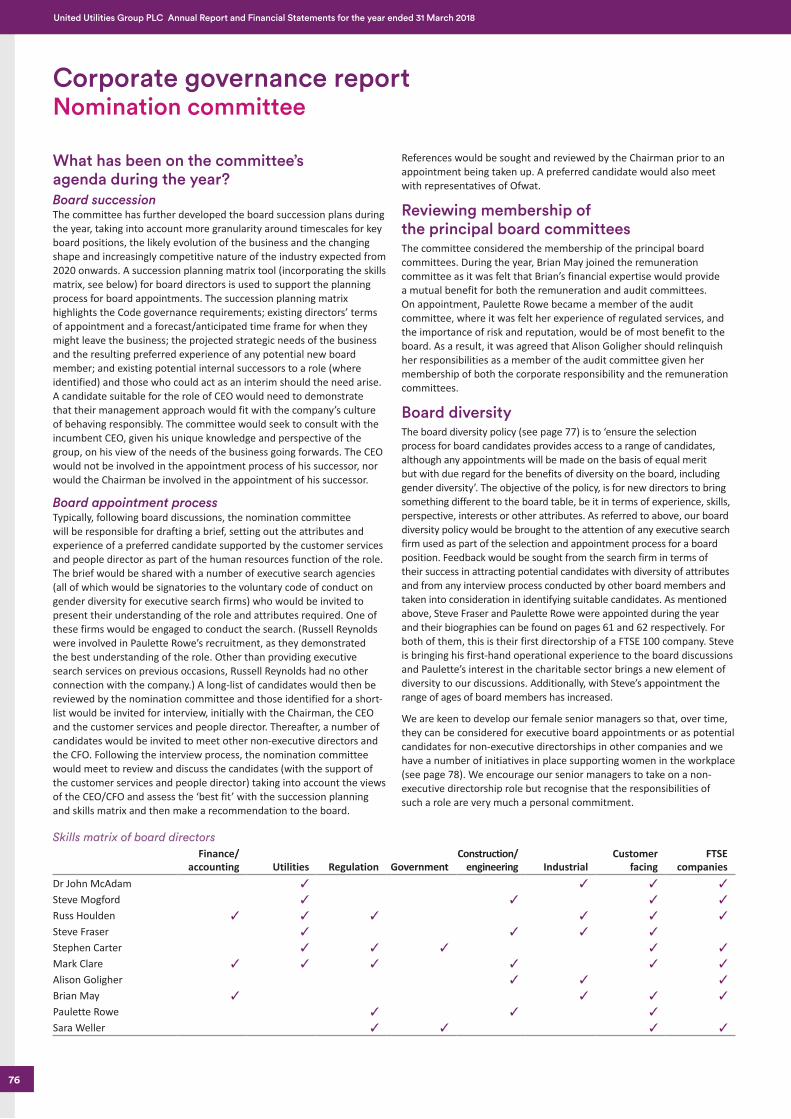
Job Number 4 June 2018 8:56 AM Proof 3 Job Number 4 June 2018 8:56 AM Proof 3
What has been on the committee’s agenda during the year?Board successionThe committee has further developed the board succession plans during the year, taking into account more granularity around timescales for key board positions, the likely evolution of the business and the changing shape and increasingly competitive nature of the industry expected from 2020 onwards. A succession planning matrix tool (incorporating the skills matrix, see below) for board directors is used to support the planning process for board appointments. The succession planning matrix highlights the Code governance requirements; existing directors’ terms of appointment and a forecast/anticipated time frame for when they might leave the business; the projected strategic needs of the business and the resulting preferred experience of any potential new board member; and existing potential internal successors to a role (where identified) and those who could act as an interim should the need arise. A candidate suitable for the role of CEO would need to demonstrate that their management approach would fit with the company’s culture of behaving responsibly. The committee would seek to consult with the incumbent CEO, given his unique knowledge and perspective of the group, on his view of the needs of the business going forwards. The CEO would not be involved in the appointment process of his successor, nor would the Chairman be involved in the appointment of his successor.
Board appointment processTypically, following board discussions, the nomination committee will be responsible for drafting a brief, setting out the attributes and experience of a preferred candidate supported by the customer services and people director as part of the human resources function of the role. The brief would be shared with a number of executive search agencies (all of which would be signatories to the voluntary code of conduct on gender diversity for executive search firms) who would be invited to present their understanding of the role and attributes required. One of these firms would be engaged to conduct the search. (Russell Reynolds were involved in Paulette Rowe’s recruitment, as they demonstrated the best understanding of the role. Other than providing executive search services on previous occasions, Russell Reynolds had no other connection with the company.) A long-list of candidates would then be reviewed by the nomination committee and those identified for a short-list would be invited for interview, initially with the Chairman, the CEO and the customer services and people director. Thereafter, a number of candidates would be invited to meet other non-executive directors and the CFO. Following the interview process, the nomination committee would meet to review and discuss the candidates (with the support of the customer services and people director) taking into account the views of the CEO/CFO and assess the ‘best fit’ with the succession planning and skills matrix and then make a recommendation to the board.
References would be sought and reviewed by the Chairman prior to an appointment being taken up. A preferred candidate would also meet with representatives of Ofwat.
Reviewing membership of the principal board committeesThe committee considered the membership of the principal board committees. During the year, Brian May joined the remuneration committee as it was felt that Brian’s financial expertise would provide a mutual benefit for both the remuneration and audit committees. On appointment, Paulette Rowe became a member of the audit committee, where it was felt her experience of regulated services, and the importance of risk and reputation, would be of most benefit to the board. As a result, it was agreed that Alison Goligher should relinquish her responsibilities as a member of the audit committee given her membership of both the corporate responsibility and the remuneration committees.
Board diversityThe board diversity policy (see page 77) is to ‘ensure the selection process for board candidates provides access to a range of candidates, although any appointments will be made on the basis of equal merit but with due regard for the benefits of diversity on the board, including gender diversity’. The objective of the policy, is for new directors to bring something different to the board table, be it in terms of experience, skills, perspective, interests or other attributes. As referred to above, our board diversity policy would be brought to the attention of any executive search firm used as part of the selection and appointment process for a board position. Feedback would be sought from the search firm in terms of their success in attracting potential candidates with diversity of attributes and from any interview process conducted by other board members and taken into consideration in identifying suitable candidates. As mentioned above, Steve Fraser and Paulette Rowe were appointed during the year and their biographies can be found on pages 61 and 62 respectively. For both of them, this is their first directorship of a FTSE 100 company. Steve is bringing his first-hand operational experience to the board discussions and Paulette’s interest in the charitable sector brings a new element of diversity to our discussions. Additionally, with Steve’s appointment the range of ages of board members has increased.
We are keen to develop our female senior managers so that, over time, they can be considered for executive board appointments or as potential candidates for non-executive directorships in other companies and we have a number of initiatives in place supporting women in the workplace (see page 78). We encourage our senior managers to take on a non-executive directorship role but recognise that the responsibilities of such a role are very much a personal commitment.
Skills matrix of board directorsFinance/
accounting Utilities Regulation GovernmentConstruction/
engineering IndustrialCustomer
facingFTSE
companiesDr John McAdam ✓ ✓ ✓ ✓
Steve Mogford ✓ ✓ ✓ ✓
Russ Houlden ✓ ✓ ✓ ✓ ✓ ✓
Steve Fraser ✓ ✓ ✓ ✓
Stephen Carter ✓ ✓ ✓ ✓ ✓
Mark Clare ✓ ✓ ✓ ✓ ✓ ✓
Alison Goligher ✓ ✓ ✓
Brian May ✓ ✓ ✓ ✓
Paulette Rowe ✓ ✓ ✓
Sara Weller ✓ ✓ ✓ ✓
Corporate governance reportNomination committee
76
United Utilities Group PLC Annual Report and Financial Statements for the year ended 31 March 2018
United Utilities Middle Section.indd 76 04/06/2018 13:05:27
Job Number 4 June 2018 8:56 AM Proof 3 Job Number 4 June 2018 8:56 AM Proof 3
Summary of board diversity policy
› Ensure the selection process for board candidates provides access to a range of candidates, although any appointments will be made on the basis of equal merit but with due regard for the benefits of diversity on the board, including gender diversity;
› Ensure that the policies adopted by the group will, over time, promote gender diversity among senior managers who will in turn aspire to a board position;
› In selecting candidates for board positions, only use the services of executive search firms who have signed up to the voluntary code of conduct for executive search firms as recommended by Lord Davies; and
› Adopt measurable objectives from time to time for achieving gender diversity at board level – which shall be to maintain at least 25 per cent, and aspire to 33 per cent female representation by 2020.
Conflicts of interest and time commitmentThe company’s articles of association contain provisions which permit unconflicted directors to authorise conflict situations. Each director is required to notify the Chairman of any potential conflict or potential new appointment or directorship, and the board reviews the position of each director annually. No changes were recorded which would impact the independence of any of the directors.
The board does not specify the precise time commitment it requires from its non-executive directors in taking on the role as they are expected to fulfil it and manage their diaries accordingly. The board is content that none of its directors are overcommitted and unable to fulfil their responsibilities as a board director for United Utilities and are not ‘overboarded’. Each individual’s circumstances are different, as is their ability to take on the responsibilities of a non-executive directorship role. Should a director be unable to attend meetings on a regular basis, not be preparing appropriately or not contributing to board discussions the Chairman would be responsible for discussing the matter with them and agreeing a course of action.
Induction of new non-executive directors An induction programme is devised for each new non-executive director. It would include one-to-one meetings with the Chairman and each of the existing non-executive directors. They will have one-to-one meetings with the CEO, CFO, managing director of the wholesale business and the company secretary along with other members of the executive team. They will also meet members of the operational teams and visit some of the key operational sites and capital projects to ensure they get a first-hand understanding of the water and wastewater business. New directors receive a briefing on the key duties of being a director of a regulated water company, including the role of the regulated company’s holding company. They will also meet with the strategy and regulation director and are required to meet with representatives of Ofwat.
Paulette Rowe: summary of induction
› Met with members of the executive team discussing our business and regulation;
› Visited the integrated control centre based in Warrington, meeting staff, and discussing the group’s monitoring and control of its water and wastewater network and assets which forms the ‘digital brain’ of our network;
› Met with the corporate affairs director and head of sustainability;
› Met with the customer services and people director to discuss the actions undertaken by the business to improve service to customers;
› Met with the director of human resources operations to discuss the group’s employee agenda;
› Discussed the wholesale operating model with the wastewater network director and the water and scientific services director; and
› Met with the chief scientist and visited the water and wastewater testing laboratories where regulatory and operational samples are analysed every day providing essential data.
Wider succession pipeline and talent managementFor a number of years, we have had a written succession plan for our executive directors and other members of the executive team, which now includes more granularity in terms of timescale. This plan identifies an interim internal successor to fill a role in the short-term should the need arise, and the longer-term development needs of potential successors to be able to fulfil a role on a more permanent basis. As with all our board appointments, we would always aim to appoint the best person to fulfil a role. It would be common, when recruiting for a senior role, for an external search to be conducted alongside an internal candidate recruitment process.
Any changes that are required to the profile of the management team to reflect the changing needs of the business are considered by the board in the executive succession plan. Succession and development initiatives for senior executives include executive mentoring and coaching and participating in an executive business school programme. Leadership development centres have been delivered to identify, and validate potential for future director and senior leader positions and developing a number of role-ready diverse candidates to provide the group with leadership capacity in an increasingly complex environment. The gender diversity across all talent groups is 30 per cent female and 70 per cent male; we continue to work to create balance as part of our ongoing diversity and inclusion plan (see page 78). There have been three senior appointments during the year from our executive succession plan, Steve Fraser appointed to COO, James Bullock appointed to strategy and regulation director and Louise Beardmore now has a broader role with responsibility for human resources in addition to her customer role.
During the year, board directors have a number of opportunities to meet with members of the executive team, both formally when senior managers are required to present at board meetings on matters related to their responsibilities, and on more informal occasions such as when they host site visits for board members. Board members also have the opportunity to meet members of the apprentice and graduate population and other employees identified as potential talent within the business.
77
Gov
erna
nce
Stock Code: UU. unitedutilities.com/corporate
United Utilities Middle Section.indd 77 04/06/2018 13:05:27
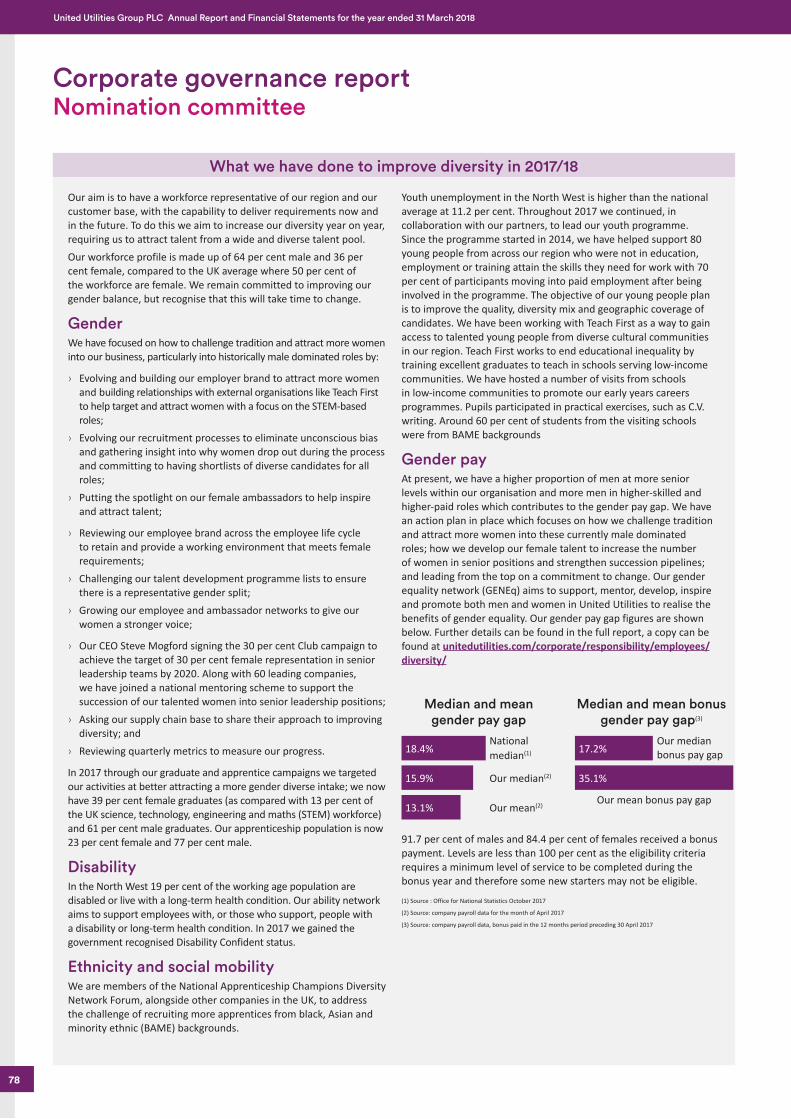
Job Number 4 June 2018 8:56 AM Proof 3 Job Number 4 June 2018 8:56 AM Proof 3
Corporate governance reportNomination committee
What we have done to improve diversity in 2017/18
Our aim is to have a workforce representative of our region and our customer base, with the capability to deliver requirements now and in the future. To do this we aim to increase our diversity year on year, requiring us to attract talent from a wide and diverse talent pool. Our workforce profile is made up of 64 per cent male and 36 per cent female, compared to the UK average where 50 per cent of the workforce are female. We remain committed to improving our gender balance, but recognise that this will take time to change.
GenderWe have focused on how to challenge tradition and attract more women into our business, particularly into historically male dominated roles by:
› Evolving and building our employer brand to attract more women and building relationships with external organisations like Teach First to help target and attract women with a focus on the STEM-based roles;
› Evolving our recruitment processes to eliminate unconscious bias and gathering insight into why women drop out during the process and committing to having shortlists of diverse candidates for all roles;
› Putting the spotlight on our female ambassadors to help inspire and attract talent;
› Reviewing our employee brand across the employee life cycle to retain and provide a working environment that meets female requirements;
› Challenging our talent development programme lists to ensure there is a representative gender split;
› Growing our employee and ambassador networks to give our women a stronger voice;
› Our CEO Steve Mogford signing the 30 per cent Club campaign to achieve the target of 30 per cent female representation in senior leadership teams by 2020. Along with 60 leading companies, we have joined a national mentoring scheme to support the succession of our talented women into senior leadership positions;
› Asking our supply chain base to share their approach to improving diversity; and
› Reviewing quarterly metrics to measure our progress.
In 2017 through our graduate and apprentice campaigns we targeted our activities at better attracting a more gender diverse intake; we now have 39 per cent female graduates (as compared with 13 per cent of the UK science, technology, engineering and maths (STEM) workforce) and 61 per cent male graduates. Our apprenticeship population is now 23 per cent female and 77 per cent male.
Disability In the North West 19 per cent of the working age population are disabled or live with a long-term health condition. Our ability network aims to support employees with, or those who support, people with a disability or long-term health condition. In 2017 we gained the government recognised Disability Confident status.
Ethnicity and social mobility We are members of the National Apprenticeship Champions Diversity Network Forum, alongside other companies in the UK, to address the challenge of recruiting more apprentices from black, Asian and minority ethnic (BAME) backgrounds.
Youth unemployment in the North West is higher than the national average at 11.2 per cent. Throughout 2017 we continued, in collaboration with our partners, to lead our youth programme. Since the programme started in 2014, we have helped support 80 young people from across our region who were not in education, employment or training attain the skills they need for work with 70 per cent of participants moving into paid employment after being involved in the programme. The objective of our young people plan is to improve the quality, diversity mix and geographic coverage of candidates. We have been working with Teach First as a way to gain access to talented young people from diverse cultural communities in our region. Teach First works to end educational inequality by training excellent graduates to teach in schools serving low-income communities. We have hosted a number of visits from schools in low-income communities to promote our early years careers programmes. Pupils participated in practical exercises, such as C.V. writing. Around 60 per cent of students from the visiting schools were from BAME backgrounds
Gender pay At present, we have a higher proportion of men at more senior levels within our organisation and more men in higher-skilled and higher-paid roles which contributes to the gender pay gap. We have an action plan in place which focuses on how we challenge tradition and attract more women into these currently male dominated roles; how we develop our female talent to increase the number of women in senior positions and strengthen succession pipelines; and leading from the top on a commitment to change. Our gender equality network (GENEq) aims to support, mentor, develop, inspire and promote both men and women in United Utilities to realise the benefits of gender equality. Our gender pay gap figures are shown below. Further details can be found in the full report, a copy can be found at unitedutilities.com/corporate/responsibility/employees/diversity/
National median(1)18.4% 17.2%
15.9% 35.1%
13.1%
Our median bonus pay gap
Our median(2)
Our mean bonus pay gapOur mean(2)
Median and mean gender pay gap
Median and mean bonus gender pay gap(3)
91.7 per cent of males and 84.4 per cent of females received a bonus payment. Levels are less than 100 per cent as the eligibility criteria requires a minimum level of service to be completed during the bonus year and therefore some new starters may not be eligible.
(1) Source : Office for National Statistics October 2017
(2) Source: company payroll data for the month of April 2017
(3) Source: company payroll data, bonus paid in the 12 months period preceding 30 April 2017
78
United Utilities Group PLC Annual Report and Financial Statements for the year ended 31 March 2018
United Utilities Middle Section.indd 78 04/06/2018 13:05:27
Job Number 4 June 2018 8:56 AM Proof 3 Job Number 4 June 2018 8:56 AM Proof 3
Introduction by Dr John McAdam“Both myself and Mark Clare, as senior independent director, welcome the opportunity to engage with investors. Face-to-face meetings are particularly useful in gaining a better understanding of investors’ views which would be shared with board colleagues. I am planning for a number of such meetings to be held later in the year. ”
The board as a whole accepts its responsibility for engaging with shareholders and is kept fully informed about information in the marketplace including:
› The investor relations adviser produces an annual survey of investors’ views and perceptions about United Utilities, the results of which are presented and discussed by the board;
› The board receives regular updates and feedback on investor meetings involving the CEO; CFO and/or investor relations team and reports from sector analysts to ensure that the board maintains an understanding of investors’ priorities; and
› The executive and non-executive directors are available to meet with major shareholders and institutional investors; this is also one of the specific roles of the senior independent director.
Institutional investorsWe are always keen to engage with our shareholders, hear their views and update them on developments in our business. As well as current investors, we engage actively with institutional investors who do not currently hold shares in United Utilities, as we are keen to ensure our business is well understood across the investment community, and to hear and discuss the views of all investors.
We have an active investor relations programme, which includes:
› A regular schedule of face-to-face meetings between the CEO and CFO and representatives from our major shareholders, supplemented with meetings hosted by our investor relations team;
› Presentations by the CEO and CFO to groups of institutional investors, both on an ad hoc basis and linked to our half and full-year results announcements;
› The programme covers a range of major global financial centres, typically including the UK, Europe, North America and the Asia Pacific region;
› Regular feedback is provided to the board on the views of our institutional investors following these meetings; and
› Close contact is also maintained between the investor relations team and a range of City analysts that conduct research on United Utilities.
In 2017/18, through our investor relations programme, we met or offered to meet with 57 per cent, by value, of the overall shareholder base, which represents 96 per cent of the targetable institutional shareholder base (when adjusting for shareholders who do not typically meet with companies, such as indexed funds).
Frequent areas of common interest arising in meetings with investors include operational and environmental performance, customer service, capital investment, efficiency initiatives, regulatory performance, regulatory changes and political risk. Investors are always keen to observe financial stability and are interested in the level of gearing versus regulatory assumptions; cost of finance; our debt portfolio and debt maturity profile; future financing requirements; and dividends. The performance against the final determination for the 2015–20 period is a key area of interest, and investors are also keen to understand how the company is performing relative to the price review allowances and targets each year, along with the potential implications of regulatory change and political risk. Furthermore, investors are keen to hear that we are progressing with our plans for the 2020–25 regulatory period and beyond.
Retail shareholdersDespite the privatisation process being over 25 years ago, we have retained a large number of individual shareholders with registered addresses in the North West of England – in fact over 50 per cent of registered shareholdings on the share register. We have historically always held our AGM in our region in Manchester, which enables our more local shareholders, many of whom are also our customers, to attend the meeting. We endeavour to hold the meeting at a venue which is both centrally located in the city (to enable shareholders to use public transport should they so wish) whilst being mindful of the costs.
There is a considerable amount of information on our website, including our online report which provides information on our key social and environmental impacts and performance during the year. Together with the annual and half-yearly results announcements, our annual report and financial statements are also available on our website; these are the principal ways in which we communicate with our retail shareholders. Our company secretariat and investor relations teams, along with our registrar, Equiniti, are also on hand to help our retail shareholders with any queries. Information for shareholders can also be found on the inside back cover of this document, with a number of useful website addresses.
Outcome of 2017 AGMAt the 2017 AGM votes were cast in relation to approximately 64 per cent of the issued share capital. All 23 resolutions were passed by the required majority. Votes were cast in favour of the reappointment of the board directors as follows:
Dr John McAdam 98.54% Russ Houlden 99.06% Steve Mogford 99.69% Brian May 99.45% Stephen Carter 99.68% Paulette Rowe 99.90% Mark Clare 99.74% Sara Weller 99.36% Alison Goligher 99.94%Steve Fraser will stand for election by shareholders for the first time at the 2018 AGM.
Code principle – Relations with shareholders
79
Gov
erna
nce
Stock Code: UU. unitedutilities.com/corporate
United Utilities Middle Section.indd 79 04/06/2018 13:05:27
Job Number 4 June 2018 8:56 AM Proof 3 Job Number 4 June 2018 8:56 AM Proof 3
Relations with other providers of capitalRunning a water and wastewater business, by its very nature, requires a long-term outlook. Our regulatory cycle is based on five-year periods, and we raise associated funding in order to build and improve our water and wastewater treatment works and associated network of pipes for each five-year cycle and beyond. We are heavily reliant on successfully acquiring long-term funding from banks and the debt capital markets to fund our capital investment programme and refinance upcoming debt maturities.
This requires long-term support from our credit investors who invest in the company by making term funding available in return for receiving interest on their investment and repayment of principal on maturity of the loans or bonds. We arrange term debt finance in the bond markets (with maturities typically ranging from seven years to up to 50 years at issue). Debt finance is raised via the group’s London listed multi-issuer Euro Medium Term Note Programme, which gives us access to the sterling and euro public bond markets and privately arranged note issues. Committed credit facilities are arranged with our relationship banks on a bilateral basis. Additionally, the European Investment Bank (EIB), which is the financing arm of the European Union (EU), is our single biggest lender, currently providing around £2 billion of debt and undrawn facilities to support our capital investment programmes (past and present). Following the 2016 referendum regarding the UK exiting the EU (Brexit), it is likely that the EIB will significantly curtail new lending into the UK once Brexit has been effected. We therefore expect that post-Brexit, further loans from the EIB will not be available and our existing loan portfolio with the EIB will enter into ‘run-off’ in line with the scheduled maturities of each loan. The group is therefore likely to access the debt capital markets on a more regular basis post Brexit. The group currently has gross borrowings of circa £7,912 million.
Given the importance of debt funding to our group, we have an active credit investor programme coordinated by our group treasury team, which provides a first point of contact for credit investors’ queries and maintains a dedicated area of the company’s website. One-to-one meetings are held with credit investors through a programme aimed at the major European fund managers known to invest in corporate bonds that may be existing holders of the group’s debt or potential holders. Regular mailings of company information are sent in order to keep credit investors informed of significant events. The treasury team has regular dialogue with the group’s relationship banks and the EIB and the credit rating agencies. More information can be found on our website at unitedutilities.com/corporate/investors/credit-investors.
Code principle – Accountability
Introduction by Dr John McAdam“ A series of briefing sessions were held with other industry executives and stakeholders to share lessons learnt from the Lancashire water quality incident of 2015.”
Board’s approach to risk management and internal control The board discharges its responsibility for determining the nature and extent of the risks that it is willing to take to achieve its strategic objectives through the risk appetite framework. Sitting alongside the risk management framework, risk appetite captures on an annual basis the board’s desire to take and manage risk relative to the company’s obligations, stakeholder interests and the capacity and capability of our key resources.
The board is also responsible for ensuring that the company’s risk management and internal control systems are effectively managed across the business and that they receive an appropriate level of scrutiny and board time. The group’s risks predominantly reflect those of all regulated water and wastewater companies. These generally relate to the failing of regulatory performance targets or failing to fulfil our obligations in any five-year planning cycle, potentially leading to the imposition of fines and penalties in addition to reputational damage.
All the actions relating to improvements to the risk management framework that were identified by the investigation undertaken by Mark Clare, senior independent director, following the Lancashire water quality incident in 2015 have been completed. A series of briefing sessions were held with other industry executives and stakeholders to share lessons learnt from the Lancashire water quality incident of 2015.
Review of the effectiveness of the risk management and internal control systemsDuring the year, the board reviewed the effectiveness of the risk management systems and internal control systems, including financial, operational and compliance controls. Taking into account the principal risks and uncertainties set out on pages 54 to 57, and the ongoing work of the audit committee in monitoring the risk management and internal control systems on behalf of the board (and to whom the committee provides regular updates, see pages 88 and 89), the board:
› Is satisfied that it has carried out a robust assessment of the principal risks facing the company, including those that would threaten its business model, future performance, solvency or liquidity; and
› Has reviewed the effectiveness of the risk management and internal control systems including all material financial, operational and compliance controls (including those relating to the financial reporting process) and no significant failings or weaknesses were identified. After review, it was concluded that through a combination of the work of the board, the audit committee and the UUW board (with specific responsibility for operational and compliance controls), the company’s risk management and internal controls were indeed effectively monitored throughout the year.
In the review of the effectiveness of risk management and internal controls systems the board also took into account the:
› Biannual review of significant risks (see page 54); › Reviewing the outcome of the biannual business unit risk assessment
process (see page 88); › Reviewing and assessing the activities and effectiveness of internal
audit (see page 88); › Reviewing management’s internal control self-assessment
(see page 89); › Reviewing reports from the group audit and risk board (see page 88); › Oversight of treasury matters (in particular the debt financing and
interest rate management (see page 50); and › Reviewing the business risk management framework and
management’s approach and tolerance towards risk with a particular focus on financial and operational risk (see page 88).
Going concern and long-term viability The board, following the review by the audit committee, concluded that it was appropriate to adopt the going concern basis of accounting (see page 140). Similarly, in accordance with the principles of the Code, the board concluded, following the recommendation from the audit committee, that it was appropriate to provide the long-term viability statement (see below). Assurance supporting these statements was provided by the review of: the group’s key financial measures and contingent liabilities; the key credit financial ratios; and the group’s
Corporate governance report
80
United Utilities Group PLC Annual Report and Financial Statements for the year ended 31 March 2018
United Utilities Middle Section.indd 80 04/06/2018 13:05:28
Job Number 4 June 2018 8:56 AM Proof 3 Job Number 4 June 2018 8:56 AM Proof 3
liquidity and ongoing ability to meet its financial covenants. As part of the assurance process, the board also took into account the principal risks and uncertainties facing the company, and the actions taken to mitigate those risks. These principal risks and uncertainties are detailed on pages 54 to 57, as are the risk management processes and structures used to monitor and manage them. Biannually, the board receives a report detailing management’s assessment of the most significant risks facing the company. The report gives an indication of the level of exposure, subject to the mitigating controls in place, for the risk profile of the group, while also highlighting the reputational and customer service impact. This provides the board with information in two categories: group-wide business risks; and wholesale operational risks. The board also receives information during the year from the treasury committee (to which the board has delegated matters of a treasury nature – see the structure diagram on page 67) including such matters as liquidity policy, the group’s capital funding requirements and interest rate management. Furthermore, the board believes that under the current regulatory and statutory framework a period of five years to assess the group’s long-term viability is appropriate, amongst other things, because of the underlying protection provided by Ofwat’s primary legal duty to ensure that water and wastewater companies are able to finance their functions.
Long-term viability statementThe directors have assessed the viability of the group, taking account of the group’s current position, the potential impact of the principal risks facing the business in severe but reasonable scenarios, and the effectiveness of any mitigating actions. This assessment has been performed in the context of the group’s prospects as considered over the longer-term. Based on this viability assessment, the directors have a reasonable expectation that the company will be able to continue in operation and meet its liabilities as they fall due over the five-year period to March 2023.
This viability statement is based on the fundamental assumption that the current regulatory and statutory framework does not substantively change, for example a change which facilitated the compulsory purchase of the shares or assets of either UUW or UUG for the Renationalisation of the water sector, throughout the viability assessment period.
The long-term planning detailed on page 35 assesses the group’s prospects and establishes its strategy over a 25-year time horizon consistent with its rolling 25-year licence and its published long-term strategy. This provides a framework for the group’s strategic planning process, and is key to achieving the group’s aim of providing the best service to customers at the lowest sustainable cost and in a responsible manner over the longer-term, underpinning our business model set out on pages 18 to 28. In order to achieve this aim and promote the long-term sustainability and resilience of the business, due consideration is given to the management of risks that could impact on the business model, future performance, solvency and liquidity of the group. An overview of our risk management approach that supports the group’s long-term planning and prospects, together with the principal risks and uncertainties facing the business, can be found on pages 54 to 57.
The viability statement for the five-year period to March 2023 has been assessed based upon the group’s medium-term business planning process, which sits within the overarching strategic planning process and considers:
› The group’s current liquidity position – which provides headroom to cover projected financing needs through until mid-2019;
› The group’s robust capital solvency position – with a debt to regulatory capital value (RCV) ratio of around 60 per cent, providing considerable headroom supporting access to medium-term liquidity as required; and
› The current regulatory framework within which the group operates – which provides a high degree of certainty over cashflows in the short to medium-term and broader regulatory protections in the longer-term.
The analysis underpinning this assessment has been through a robust internal review process, which has included scrutiny and challenge from the audit committee, and has been reviewed by the group’s external auditors, KPMG, as part of their normal audit procedures.
The group has a proven track record of being able to raise new forms of finance in most market conditions, and expects to continue to do so into the future. In addition, the board has considered the protections which exist from the regulatory and economic environment within which it operates. From an economic perspective, given the market structure of water and wastewater services, threats to the group’s viability from risks such as reduced market share, substitution of services and reduced demand are low compared to those faced by many other industries.
From a regulatory perspective the group currently benefits from a rolling 25-year licence and a regulatory regime in which regulators – including the economic regulator, Ofwat – are required to have regard to the principles of best regulatory practice. These include that regulation should be carried out in a way which is transparent, accountable, proportionate, consistent and targeted. Ofwat’s primary duties provide that it should protect consumers’ interests, by promoting effective competition wherever appropriate, secure that the company properly carries out its statutory functions, secure that the company can finance the proper carrying out of these functions – in particular through securing reasonable returns on capital, and secure that water and wastewater supply systems have long-term resilience and that the company takes steps to meet long-term demands for water supplies and wastewater services.
The business planning process is closely aligned with these principles, and, coupled with the group’s robust management of risks, gives confidence that current and future regulatory price controls will provide certainty around cash flows that will support the continuing viability and prospects of the group. For these reasons the board considers it appropriate to provide a medium-term viability statement of five years.
The directors have assessed the group’s viability in the context of its expected performance and past ability to deliver for customers, considering the principal risks as set out on pages 54 to 57 and its ability to absorb a number of severe but reasonable scenarios including those arising from operational and environmental risks, political and regulatory risks, the risk of critical asset failure and the potential for a restriction to the availability of financing resulting from a global capital markets crisis. The viability assessment has considered the potential impacts of these risks on the group’s business model, future performance, solvency and liquidity based on a number of stress-tested and sensitised scenarios in which the group is assumed to face a series of the top risks in terms of the most severe impact and likelihood of occurence over the course of the viability assessment period. As well as the protections which exist from the regulatory environment within which the group operates, a number of mitigating actions are available in the kind of severe scenarios considered, including the raising of new finance, capital programme deferral, the close-out of derivative asset positions, the restriction of dividend payments and access to additional equity. These actions provide the group with significant scope to improve its liquidity and capital position to further absorb such threats.
The directors also considered it appropriate to prepare the financial statements on the going concern basis, as explained in the basis of preparation paragraph in note 1 to the accounts (see page 140).
Read more about Our business model on pages 18 to 28
Read more about the Principal risks and uncertainties on pages 54 to 57
Read more online at www.unitedutilities.com/corporate/about-us/our-future-plans/our-long-term-strategy/
81
Gov
erna
nce
Stock Code: UU. unitedutilities.com/corporate
United Utilities Middle Section.indd 81 04/06/2018 13:05:28
Job Number 4 June 2018 8:56 AM Proof 3 Job Number 4 June 2018 8:56 AM Proof 3
The audit committee has a particular role acting independently from the executive to ensure that the interests of shareholders are properly protected in relation to financial reporting and internal control.
Dear ShareholderAll directors have a duty to act in a way that they consider, in good faith, would be most likely to promote the success of the company for the benefit of its members as a whole and have regard to other stakeholders as set out in s172 of the Companies Act 2006. The Disclosure and Transparency Rules set out the need for an audit committee and the responsibilities that the committee should fulfil.
In the ‘2016 Guidance on Audit Committees’, which accompanies the 2016 UK Corporate Governance Code against which we are reporting this year, the FRC articulated that whilst all directors have a duty to act in the interests of the company, the audit committee has a particular role, acting independently from the executive to ensure that the interests of shareholders are properly protected in relation to financial reporting and internal control. However, the board has overall responsibility for an organisation’s approach to risk management and internal control.
In my following report I have sought to provide shareholders with an understanding of the work that we have done to provide assurance on the integrity of the 2017/18 annual report and financial statements. In reviewing the group’s financial statements the committee reviews both the judgements made by management, whether management’s accounting policies are appropriate, and the external audit work undertaken by KPMG as set out in the audit plan. KPMG present their audit plan to the committee before the work starts, it includes the areas on which the audit will focus and the materiality thresholds. KPMG’s independent auditor’s report, setting out its opinions and conclusions, can be found on pages 128 to 133. Information on the committee’s overview of the group’s internal controls and risk management activities can be found on pages 88 to 89.
During the year the committee asked KPMG to perform an in-depth internal quality performance review of the 2016/17 audit as a consequence of the Financial Reporting Council’s Audit Quality Report (FRC’s AQR) of the 2015/16 audit. As reported in the 2016/17 audit committee report, we were satisfied that KPMG had taken appropriate action to enhance the quality of their audit process relating to the 2016/17 audit. The committee was satisfied with the findings of the in-depth internal quality performance review which were presented to it in September 2017 (see page 85).
Our 2018 long-term viability statement can be found on page 81; we continue to be of the opinion that a period of five years is appropriate to assess the group’s viability given the nature of the business and the regulatory investment and planning cycles; and the underlying protection afforded by Ofwat’s primary duties to protect consumers’ interests, by promoting effective competition wherever appropriate, secure that the company can finance the proper carrying out of these functions – in particular through securing reasonable returns on capital, and secure that water and wastewater supply systems have long-term resilience and that the company takes steps to meet long-term demands for water supplies and wastewater supplies. Further information on our long-term planning cycles can be found in our business model section in the strategic report on pages 18 to 28.
Quick facts
› Brian May has chaired the committee since July 2013. He is a serving finance director of a FTSE 100 company and chartered accountant and is considered by the board to have recent and relevant financial experience;
› All members of the committee are independent non-executive directors and the Board is satisfied that the committee as a whole has sectoral competence and its members have an appropriate level of experience of corporate financial matters;
› Other regular attendees at meetings include the Chairman, the CEO, the CFO, the company secretary, the head of audit and risk, the group controller, and representatives from the external auditor KPMG LLP (KPMG);
› The representatives from KPMG and the head of audit and risk are each afforded time with the committee and the company secretary to raise freely any concerns they may have without management being present; and
› The committee is authorised to seek outside legal or other independent professional advice as it sees fit, but has not done so during the year.
Quick linksTerms of reference – unitedutilities.com/corporate-governance
Corporate governance reportAudit committee
Audit committee members
Brian May (chair) Alison Goligher (relinquished 1 July 2017)
Stephen Carter Paulette Rowe (appointed 1 July 2017)
82
United Utilities Group PLC Annual Report and Financial Statements for the year ended 31 March 2018
United Utilities Middle Section.indd 82 04/06/2018 13:05:29
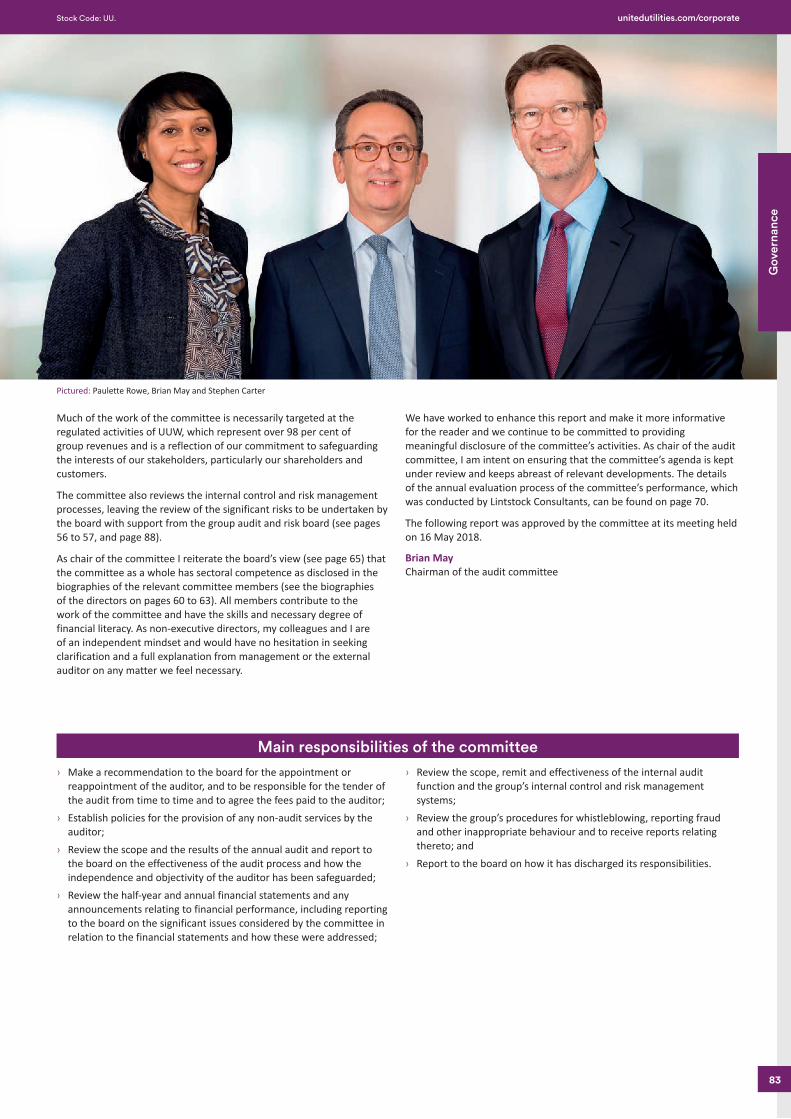
Job Number 4 June 2018 8:56 AM Proof 3 Job Number 4 June 2018 8:56 AM Proof 3
Much of the work of the committee is necessarily targeted at the regulated activities of UUW, which represent over 98 per cent of group revenues and is a reflection of our commitment to safeguarding the interests of our stakeholders, particularly our shareholders and customers.
The committee also reviews the internal control and risk management processes, leaving the review of the significant risks to be undertaken by the board with support from the group audit and risk board (see pages 56 to 57, and page 88).
As chair of the committee I reiterate the board’s view (see page 65) that the committee as a whole has sectoral competence as disclosed in the biographies of the relevant committee members (see the biographies of the directors on pages 60 to 63). All members contribute to the work of the committee and have the skills and necessary degree of financial literacy. As non-executive directors, my colleagues and I are of an independent mindset and would have no hesitation in seeking clarification and a full explanation from management or the external auditor on any matter we feel necessary.
We have worked to enhance this report and make it more informative for the reader and we continue to be committed to providing meaningful disclosure of the committee’s activities. As chair of the audit committee, I am intent on ensuring that the committee’s agenda is kept under review and keeps abreast of relevant developments. The details of the annual evaluation process of the committee’s performance, which was conducted by Lintstock Consultants, can be found on page 70.
The following report was approved by the committee at its meeting held on 16 May 2018.
Brian MayChairman of the audit committee
› Make a recommendation to the board for the appointment or reappointment of the auditor, and to be responsible for the tender of the audit from time to time and to agree the fees paid to the auditor;
› Establish policies for the provision of any non-audit services by the auditor;
› Review the scope and the results of the annual audit and report to the board on the effectiveness of the audit process and how the independence and objectivity of the auditor has been safeguarded;
› Review the half-year and annual financial statements and any announcements relating to financial performance, including reporting to the board on the significant issues considered by the committee in relation to the financial statements and how these were addressed;
› Review the scope, remit and effectiveness of the internal audit function and the group’s internal control and risk management systems;
› Review the group’s procedures for whistleblowing, reporting fraud and other inappropriate behaviour and to receive reports relating thereto; and
› Report to the board on how it has discharged its responsibilities.
Main responsibilities of the committee
Pictured: Paulette Rowe, Brian May and Stephen Carter
83
Gov
erna
nce
Stock Code: UU. unitedutilities.com/corporate
United Utilities Middle Section.indd 83 04/06/2018 13:05:34
Job Number 4 June 2018 8:56 AM Proof 3 Job Number 4 June 2018 8:56 AM Proof 3
What has been on the committee’s agenda during the year?The committee has an extensive agenda of items of business focusing on the audit, assurance and risk processes within the business which it deals with in conjunction with senior management, the auditor, the internal audit function and the financial reporting team. In doing so it ensures that high standards of financial governance in line with the regulatory framework as well as market practice for audit committees going forward are maintained. There were four scheduled meetings of the committee during the year. Items of business considered by the committee during the year are set out in the table below.
Cross reference− Considered the issues and findings brought to the committee’s attention by the internal audit team and satisfying itself that
management has resolved or is in the process of resolving any outstanding issues or concerns;See page 88
− Reviewed the reports from the financial reporting team on the financial statements, and considering matters such as the accounting judgements and policies being applied and how the statutory audit contributed to the integrity of the financial reporting;
See page 87
− Reviewed the regulatory reporting process relating to the annual performance report for UUW as required to be submitted to Ofwat and noted the differences between the regulatory and statutory accounts;
− Reviewed the company’s responses to changes to International Financial Reporting Standards (IFRS) in particular IFRS 9 financial instruments, IFRS 15 revenue from contracts with customers and IFRS 16 leases;
See page 141
− Reviewed the proposed audit strategy for the 2017/18 statutory audit, including the level of materiality applied by KPMG, audit reports from KPMG on the financial statements and the areas of particular focus for the 2017/18 audit and tasking management to resolve any issues relating to internal controls and risk management systems;
See page 128
− Reviewed the basis of preparation of the financial statements as a going concern (prior to making its recommendations to the board) as set out in the accounting policies;
See page 140
− Reviewed the long-term viability statement prior to making its recommendations to the board; See page 81 − Reviewed the results of the committee’s assessment of the effectiveness of the 2016/17 external audit and confirmation
of the independence of the auditor and made a recommendation to the board on the reappointment of KPMG at the forthcoming annual general meeting;
See page 85
− Reviewed the 2017/18 annual report and financial statements and provided a recommendation to the board that they complied with the Code principle to be ‘fair, balanced and understandable’;
See page 85
− Reviewed KPMG’s internal quality performance report in relation to its review of the 2016/17 audit; See page 83− Monitored the completion of actions relating to the risk management framework identified following the Lancashire water
quality incident;See page 89
− Reviewed the effectiveness of the risk management and internal control systems prior to making a recommendation to the board;
See page 88
− Reviewed the statutory audit fee for the year ended 31 March 2018; See page 86− Reviewed and approved the non-audit services and related fees provided by the statutory auditor for the year 2017/2018;
approval of a revised policy on non-audit services provided by the auditor for 2018/19 which is in accordance with the European Union Audit Directive and Audit Regulation which came into force in the UK from 17 June 2016;
See page 86
− Monitored incidents of whistleblowing and fraud reporting; See page 89− Biannual oversight and monitoring of the group’s compliance with the Bribery Act which the board then reviews annually; See page 89− Approved the strategic internal audit planning approach and reviewed reports on the work of the internal audit function
from the head of audit and risk;See page 89
− Reviewed the quality and effectiveness of internal audit and the effectiveness of the current co-source arrangements; and See page 88− Reviewed the committee’s terms of reference and the conclusions of the committee’s annual evaluation. The externally
facilitated evaluation was undertaken as part of the overall board evaluation. The review explored: time management and the composition of the committee; the committee’s processes and support; and the agenda and work of the committee. All elements of the workings of the committee reviewed were highly rated. It was concluded that the committee continued to be effective.
See page 70
Corporate governance reportAudit committee
84
United Utilities Group PLC Annual Report and Financial Statements for the year ended 31 March 2018
United Utilities Middle Section.indd 84 04/06/2018 13:05:34
Job Number 4 June 2018 8:56 AM Proof 3 Job Number 4 June 2018 8:56 AM Proof 3
How we assessed whether ‘the annual report and accounts, taken as a whole, is fair, balanced and understandable and provides the information necessary for shareholders to assess the company’s position and performance, business model and strategy’ The committee, further to the board’s request, has reviewed the annual report and financial statements with the intention of providing advice to the board on whether, as required by the Code, ‘the annual report and accounts, taken as a whole, is fair, balanced and understandable and provides the information necessary for shareholders to assess the company’s position and performance, business model and strategy’.
To make this assessment, the committee received copies of the annual report and financial statements to review during the drafting process to ensure that the key messages being followed in the annual report were aligned with the company’s position, performance and strategy being pursued and that the narrative sections of the annual report were consistent with the financial statements. The significant issues considered by the committee in relation to the financial statements were consistent with those identified by the external auditor in their report on pages 128 to 133.
The committee received regular updates on the calculation of underlying operating profit measures as one of the principal alternative performance measures (APMs). A guide to APMs can be found on pages 52 to 53. APMs are used in accordance with the ESMA guidelines and management highlight any impact on APMs as a result of changes to accounting methods/transactions.
The key performance indicators included in the strategic report (see pages 38 to 39) were, amongst others, those used by management and some of which reflect the regulatory measures to be monitored by either Ofwat, the DWI or the EA during the 2015–20 period.
In addition, the committee was satisfied that all the key events and issues which had been reported to the board in the CEO’s monthly report during the year, both good and bad, had been adequately referenced or reflected within the annual report.
How we assessed the effectiveness of the external audit processThe committee, on behalf of the board, is responsible for the relationship with the external auditor, and part of that role is to examine the effectiveness of the audit process. Audit quality is a key requirement of the external audit process.
We reported last year that the FRC had undertaken a review of KPMG’s audit of the company for the 2015/16 financial year, referred to as the FRC’s AQR, and it was confirmed that KPMG had taken appropriate action to enhance the quality of the audit process for the 2016/17 financial year.
The committee asked KPMG to undertake an in-depth internal quality performance review of the 2016/17 audit. The review was undertaken by a recently retired partner of KPMG who regularly undertakes quality control reviews of KPMG audits. The reviewer confirmed to the committee that the principal findings of the FRC’s AQR had been adequately addressed in the 2016/17 audit. KPMG work to their own audit quality framework, with a view to ensuring that their employees concentrate on the fundamental skills and behaviours required to deliver an appropriate and independent opinion. As a further commitment to improving audit quality, KPMG provided extra resource, to supplement the usual audit team ensuring additional oversight and review of the 2017/18 audit.
Prior to the statutory audit work starting, KPMG presented the strategy and scope of the audit for the forthcoming financial year, highlighting any areas which would be given special consideration. KPMG then report against this audit scope at subsequent committee meetings providing an opportunity for the committee to monitor progress. Private meetings are held at each committee meeting between the audit committee, the company secretary and representatives of the external auditor without management being present in order to encourage open and transparent feedback by both parties.
On completion of the audit process at the full-year, all members of the committee, as well as key members of the senior management team and those who regularly provide input into the audit committee or have regular contact with the auditor, were required to complete a feedback questionnaire seeking their views on how well KPMG performed the year-end audit.
Views of the respondents were sought in terms of:
› The robustness of the audit process and degree of challenge to matters of significant audit risk and areas of management subjectivity;
› The quality of the delivery of the audit; › The expertise of the audit team conducting the audit; › That the degree of professional scepticism applied by the auditor was
appropriate; › The appropriateness of the communication between the committee
and the auditor in terms of technical issues; › The quality of the service they gave; › Their views on the quality of the interaction between the audit
partner, the audit director and the company; and › Whether the statutory audit contributed to the group’s financial
reporting.
The feedback was collated and presented to the committee’s meeting in November 2017, at which the conclusions were discussed and any opportunities for improvement brought to the attention of the external auditor.
In summary, the committee concluded that the overall external audit process and services provided by KPMG were satisfactory and effective.
How we assessed the independence of our external auditor There are two aspects to auditor independence that the committee monitors to ensure that the external auditor remains independent of the company.
First, in assessing the independence of the auditor from the company the committee takes into account the information and assurances provided by the external auditor confirming that all its partners and staff involved with the audit are independent of any links to United Utilities. KPMG confirmed that all its partners and staff complied with their ethics and independence policies and procedures which are fully consistent with the FRC’s Revised Ethical Standard 2016 (FRC’s Ethical Standard) including that none of its employees working on our audit hold any shares in United Utilities Group PLC. KPMG is also required to provide written disclosure at the planning stage of the audit about any significant relationships and matters that may reasonably be thought to have an impact on its objectivity and independence and that of the lead partner and the audit team. The lead partner must change every five years and other senior audit staff rotate at regular intervals.
85
Gov
erna
nce
Stock Code: UU. unitedutilities.com/corporate
United Utilities Middle Section.indd 85 04/06/2018 13:05:34
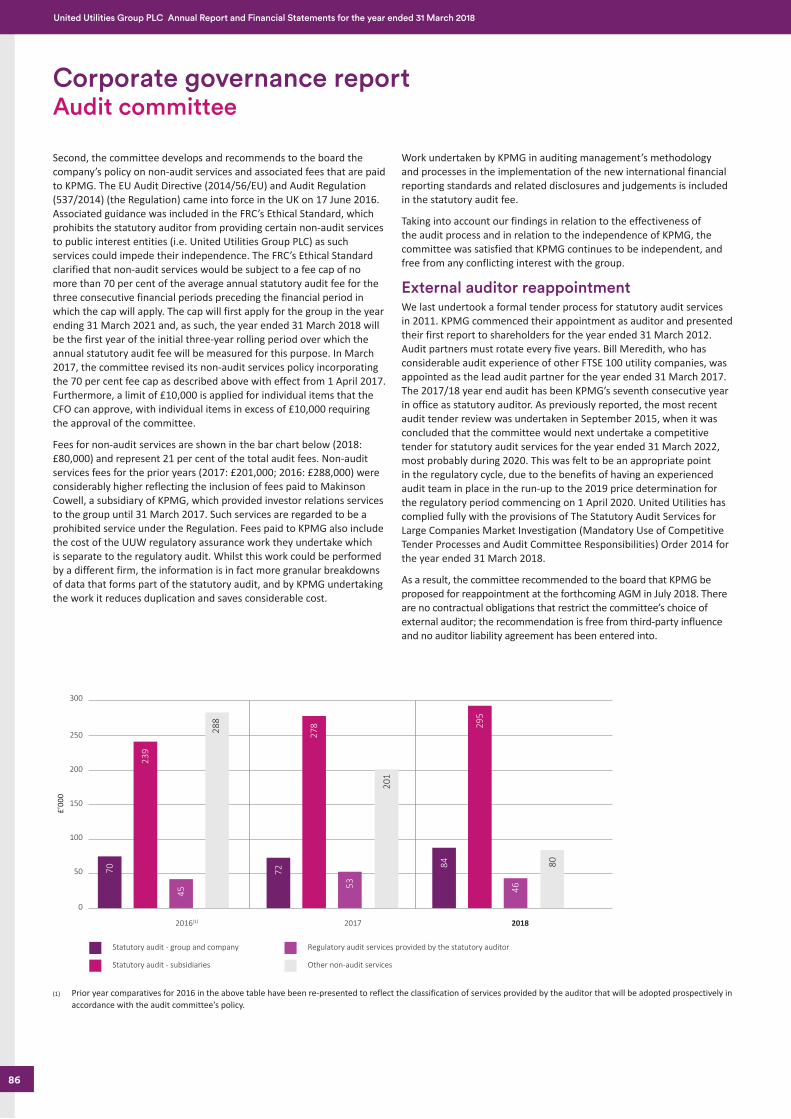
Job Number 4 June 2018 8:56 AM Proof 3 Job Number 4 June 2018 8:56 AM Proof 3
Second, the committee develops and recommends to the board the company’s policy on non-audit services and associated fees that are paid to KPMG. The EU Audit Directive (2014/56/EU) and Audit Regulation (537/2014) (the Regulation) came into force in the UK on 17 June 2016. Associated guidance was included in the FRC’s Ethical Standard, which prohibits the statutory auditor from providing certain non-audit services to public interest entities (i.e. United Utilities Group PLC) as such services could impede their independence. The FRC’s Ethical Standard clarified that non-audit services would be subject to a fee cap of no more than 70 per cent of the average annual statutory audit fee for the three consecutive financial periods preceding the financial period in which the cap will apply. The cap will first apply for the group in the year ending 31 March 2021 and, as such, the year ended 31 March 2018 will be the first year of the initial three-year rolling period over which the annual statutory audit fee will be measured for this purpose. In March 2017, the committee revised its non-audit services policy incorporating the 70 per cent fee cap as described above with effect from 1 April 2017. Furthermore, a limit of £10,000 is applied for individual items that the CFO can approve, with individual items in excess of £10,000 requiring the approval of the committee.
Fees for non-audit services are shown in the bar chart below (2018: £80,000) and represent 21 per cent of the total audit fees. Non-audit services fees for the prior years (2017: £201,000; 2016: £288,000) were considerably higher reflecting the inclusion of fees paid to Makinson Cowell, a subsidiary of KPMG, which provided investor relations services to the group until 31 March 2017. Such services are regarded to be a prohibited service under the Regulation. Fees paid to KPMG also include the cost of the UUW regulatory assurance work they undertake which is separate to the regulatory audit. Whilst this work could be performed by a different firm, the information is in fact more granular breakdowns of data that forms part of the statutory audit, and by KPMG undertaking the work it reduces duplication and saves considerable cost.
Work undertaken by KPMG in auditing management’s methodology and processes in the implementation of the new international financial reporting standards and related disclosures and judgements is included in the statutory audit fee.
Taking into account our findings in relation to the effectiveness of the audit process and in relation to the independence of KPMG, the committee was satisfied that KPMG continues to be independent, and free from any conflicting interest with the group.
External auditor reappointmentWe last undertook a formal tender process for statutory audit services in 2011. KPMG commenced their appointment as auditor and presented their first report to shareholders for the year ended 31 March 2012. Audit partners must rotate every five years. Bill Meredith, who has considerable audit experience of other FTSE 100 utility companies, was appointed as the lead audit partner for the year ended 31 March 2017. The 2017/18 year end audit has been KPMG’s seventh consecutive year in office as statutory auditor. As previously reported, the most recent audit tender review was undertaken in September 2015, when it was concluded that the committee would next undertake a competitive tender for statutory audit services for the year ended 31 March 2022, most probably during 2020. This was felt to be an appropriate point in the regulatory cycle, due to the benefits of having an experienced audit team in place in the run-up to the 2019 price determination for the regulatory period commencing on 1 April 2020. United Utilities has complied fully with the provisions of The Statutory Audit Services for Large Companies Market Investigation (Mandatory Use of Competitive Tender Processes and Audit Committee Responsibilities) Order 2014 for the year ended 31 March 2018.
As a result, the committee recommended to the board that KPMG be proposed for reappointment at the forthcoming AGM in July 2018. There are no contractual obligations that restrict the committee’s choice of external auditor; the recommendation is free from third-party influence and no auditor liability agreement has been entered into.
300
2016(1) 2017 2018
250
200
150
100
50
0
80
46
295
84
201
53
278
72
288
45
239
70
Statutory audit - group and company
Statutory audit - subsidiaries Other non-audit services
Regulatory audit services provided by the statutory auditor
£’00
0
(1) Prior year comparatives for 2016 in the above table have been re-presented to reflect the classification of services provided by the auditor that will be adopted prospectively in accordance with the audit committee's policy.
Corporate governance reportAudit committee
86
United Utilities Group PLC Annual Report and Financial Statements for the year ended 31 March 2018
United Utilities Middle Section.indd 86 04/06/2018 13:05:34
Job Number 4 June 2018 8:56 AM Proof 3 Job Number 4 June 2018 8:56 AM Proof 3
Significant issues considered by the committee in relation to the financial statements and how these were addressed In relation to the group’s financial statements, the committee reviewed the following principal areas of judgement (as noted in the accounting policies):
Capitalisation of fixed assetsFixed assets (see page 149) represent a subjective area, particularly in relation to costs permitted for capitalisation and depreciation policy.
› In considering the work performed by KPMG during the year in this area, the committee assessed the reasonableness of the group’s capitalisation policy and the basis on which expenditure is determined to relate to the enhancement or maintenance of assets. These were both deemed to be appropriate; and
› The committee also reviewed the recovery of the capital overhead rate which management has applied during the year and which the committee had approved in the year ended 31 March 2015 for the five-year regulatory period ending 31 March 2020. The committee concluded that the rate still remained appropriate.
Revenue recognition and allowance for doubtful receivablesDue to the nature of the group’s business, the extent to which revenue is recognised and doubtful customer debts are provided against is an area of considerable judgement and estimation.
› The committee reviewed the current levels of doubtful debt and credit note provisioning (see pages 151 and 152) for more detail). The committee challenged management over the appropriateness of the overall levels of provisioning following these reviews and was satisfied that the resulting net debtor balance was appropriate.
Retirement benefitsThe group’s defined benefit retirement schemes are an area of considerable judgement, the performance and position of which is sensitive to the assumptions made.
› The committee sought from management an understanding as to the factors which led to the increase in the IAS 19 net retirement benefit surplus during the period and noted that the scheme specific funding basis had not been impacted by this volatility. Management presented an explanatory note (see pages 167 and 168) in order to communicate most effectively what is a complex area for the benefit of the group’s stakeholders. The committee was satisfied with the explanations provided by management and following a review of the explanatory note approved its inclusion in the financial statements; and
› The committee reviewed the methodology and assumptions used in calculating the defined benefit scheme IAS 19 surplus (see pages 167 to 171 for more details). The group employs the services of an external actuary to perform these calculations and determine the appropriate assumptions to make. KPMG presented a report showing how the assumptions applied compared to their client base. After considering the above, the committee concluded that the approach taken and assumptions made were appropriate and fairly balanced in determining the net retirement benefit surplus.
Provisions and contingenciesThe group makes provisions for contractual and legal claims which, by their nature, are subjective and require management to arrive at a best estimate as to the probable outcomes and costs associated with each individual case.
› The committee received regular updates on new and existing claims being made against the group and the extent to which these have been provided for (see page 155 for details). The committee focused their attention on the more significant items and discussed the judgements made by management in arriving at appropriate provisions in relation to these matters; and
› Based upon the facts behind each provision and taking account of any relevant legal advice that may have been received as well as the past experience of management in making such provisions and challenging where necessary the views taken by management and through the assurance provided by KPMG who cover these as part of their audit, the committee concluded that the provisions management had made were appropriate.
Carrying value of loans to and investments in joint venturesThe group has interests relating to its joint ventures in the form of equity investments (see page 150) and loans receivable (see page 172), the recoverability of which are considered with reference to the estimated future cash flows of the joint ventures. Management tests whether any impairment exists in relation to the equity investments and loans receivable if adverse changes in conditions associated with the joint ventures suggest that this is appropriate. The committee scrutinised the impairment assessments performed by management during the year by reviewing the valuations that underpin the carrying values of these amounts and challenging the methodology and assumptions used. Following robust discussion on this issue, the committee confirmed that it was satisfied that the carrying values of these interests as at the reporting date were recoverable.
Derivative financial instrumentsThe group has a significant value of swap instruments, the valuation of which is based upon models which require certain judgements and assumptions to be made (see page 166). Management performs periodic checks to ensure that the model derived valuations agree back to third-party valuations and KPMG check a sample against their own valuation models. It was confirmed to the committee that such testing had been undertaken during the year and there were no significant issues identified.
Underlying operating profit adjustmentsDuring the year the committee considered and challenged management’s treatment of items as adjustments to underlying operating profit (see pages 52 and 53) and satisfied itself that those items being reported as adjustments met the requirements of the group’s policy.
In reading the above significant issues considered by the committee, shareholders might also wish to examine the auditor’s report and their assessment of risks of material misstatement on pages 128 to 130.
New accounting standardsThe group will adopt a number of new accounting standards in the coming years, with IFRS 9 ‘Financial Instruments’ and IFRS 15 ‘Revenue from Contracts with Customers’ becoming effective on 1 April 2018 and IFRS 16 ‘Leases’ coming into effect on 1 April 2019. The committee reviewed and approved the proposed judgements and disclosures associated with the implementation of these standards, with a particular focus on those relating to accounting for capital income under IFRS 15.
Read more about Our business model on pages 18 to 28
Read more about the Principal risks and uncertainties on pages 54 to 57
Read more online at www.unitedutilities.com/corporate/about-us/our-future-plans/our-long-term-strategy/
87
Gov
erna
nce
Stock Code: UU. unitedutilities.com/corporate
United Utilities Middle Section.indd 87 04/06/2018 13:05:34
Job Number 4 June 2018 8:56 AM Proof 3 Job Number 4 June 2018 8:56 AM Proof 3
The main features of the group’s internal controls and risk management systems are summarised below:a. Internal audit functionThe internal audit function is a key element of the group’s corporate governance framework. Its role is to provide independent and objective assurance, advice and insight on governance, risk management and internal control to the audit committee, the board and to senior management. It supports the organisation’s vision and objectives by evaluating and assessing the effectiveness of risk management systems, business policies and processes, systems and key internal controls. In addition to reviewing the effectiveness of these areas and reporting on aspects of the group’s compliance with them, internal audit makes recommendations to address any key issues and improve processes, and as such, provides an indication of the behaviours being exhibited by employees in the areas under review. Once any recommendations are agreed with management, the internal audit monitors their implementation and reports to the committee on progress made at every meeting.
A five-year strategic audit planning approach is applied. This facilitates an efficient deployment of internal audit resource in providing assurance coverage over time across the whole business, as well as greater variation in the nature, depth and breadth of audit activities. This strategic approach supports the annual audit plan, which is then endorsed by management, and which the committee also approves. The plan focuses the team’s work on those areas of greatest risk to the business. Building on the strategic planning approach, the development of the plan considers risk assessments, issues raised by management, areas of business and regulatory change, prior audit findings and the cyclical review programme. The purpose, scope and authority of internal audit is defined within its charter which is approved annually by the audit committee.
The in-house team is expanded as and when required with additional resource and skills sourced from external providers – primarily PwC at present. The committee keeps the relationship with PwC under review to ensure the independence of the internal audit function is maintained and there is a documented process to manage possible conflicts of interest with the co-sourced resource. In the course of its work, the internal audit function also liaises with the statutory auditor, discussing relevant aspects of their respective activities which ultimately supports the assurance provided to the audit committee and board. During the year, the committee reviewed the current operating model in particular the balance of in-house versus co-sourced resource and concluded that, while minor improvements were identified, the current approach was satisfactory.
b. Assessing the effectiveness of the internal audit functionThe effectiveness of the internal audit function’s work is continually monitored using a variety of inputs including the ongoing audit reports received, the audit committee’s interaction with the head of audit and risk, an annual review of the department’s internal quality assurance report, a quarterly summary dashboard providing a snapshot of the progress against the internal audit plan tabled at each committee meeting as well as any other periodic quality reporting requested.
An annual stakeholder survey in the form of a feedback questionnaire is circulated to committee members, senior management and other managers who have regular contact with the internal audit function, including representatives from the external auditor KPMG and the co-source audit provider PwC. The responses were anonymous to encourage open and honest feedback, and were consistently favourable as were previous surveys.
From time to time, the quality and effectiveness of the internal audit function is also assessed externally, and was most recently undertaken in 2015. Taking all these elements into account, the committee concluded that the internal audit function was effective and appropriate resources were available as required. An external assessment will next be undertaken in 2018/19.
Internal audit, led by the head of audit and risk, covers the group’s principal activities and reports to the committee and functionally to the CFO. The head of audit and risk attends all scheduled meetings of the audit committee, and has the opportunity to raise any matters with the members of the committee at these meetings without the presence of management. He is also in regular contact with the chair of the committee outside of the committee meetings.
c. Risk management systems The committee receives updates and reports from the head of audit and risk on key activities relating to the company’s risk management systems and processes at every meeting. These are then reported to the board, as appropriate. The group designs its risk management activities in order to manage rather than eliminate the risk of failure to achieve its strategic objectives.
The CFO has executive responsibility for risk management and is supported in this role by the head of audit and risk and the corporate risk manager and his team. The group audit and risk board (GARB) is a sub-committee of the executive team. The GARB meets quarterly and reviews the governance processes and the effectiveness and performance of these processes along with the identification of emerging trends and themes within and across the business. The work of the GARB then feeds into the information and assurance processes of the audit committee and into the board’s assessment of risk exposures and the strategies to manage these risks.
Supplementing the more detailed ongoing risk management activities within each business area, the bi-annual business unit risk assessment process (BURA) seeks to identify how well risk management is embedded across the different teams in the business. The BURA involves a high level review of the effectiveness of the controls that each business unit has in place to mitigate risks relating to activities in their business area, while also identifying new and emerging risks and generally to facilitate improvements in the way risks are managed. The outcome of the BURA process is communicated to the executive team and the board. This then forms the basis of the determination of the most significant risks that the company faces which are then reviewed by the board. The group utilises risk management software to underpin the company’s risk management process. The maturity of the risk management framework and its application across the business is assessed on an annual basis against a defined maturity model. This assessment provides an objective appraisal of the degree of maturity in how the risk management system is being applied and the quality of each risk in terms of quantification and management. The results of the maturity assessment are reported to the GARB, and actions agreed with business units.
Corporate governance reportAudit committee
88
United Utilities Group PLC Annual Report and Financial Statements for the year ended 31 March 2018
United Utilities Middle Section.indd 88 04/06/2018 13:05:35
Job Number 4 June 2018 8:56 AM Proof 3 Job Number 4 June 2018 8:56 AM Proof 3
An external assessment of the risk management process took place in 2015/16 as part of the internal investigation of the Lancashire water quality incident that occurred in August 2015. The committee was responsible for monitoring progress of the implementation of the actions identified to improve the risk management framework. It was confirmed to the committee that all relevant actions had been completed in November 2017. An internal audit confirmed the completion of the Lancashire water quality incident risk management actions and reaffirmed that the risk management framework was in line with good practice.
d. Internal controls The committee reviews the group’s internal control systems and receives updates on the findings of internal audit’s investigations at every meeting, prior to reporting any significant matters to the board. Internal control systems are part of our ‘business as usual’ activities and are documented in the company’s internal control manual which covers financial, operational and compliance controls and processes. Internal control systems are the responsibility of the CFO, with the support of the GARB, the financial control team and the internal audit team, although the head of audit and risk and his team are directly accountable to the audit committee.
Confirmation that the controls and processes are being adhered to throughout the business is the responsibility of managers, but is continually tested by the work of the internal audit team as part of its annual plan of work which the committee approves each year as well as aspects being tested by other internal assurance providers. Compliance with the internal control system is monitored annually by the completion of a self-assessment checklist by senior managers in consultation with their teams. The results are then reviewed and audited on a sample basis by the internal audit team and reported to the committee.
e. Whistleblowing, anti-fraud and anti-bribery The audit committee is responsible for reviewing the group’s arrangements for individuals to raise concerns and the arrangements for investigation of such matters and for the company’s procedures for detecting fraud and systems and controls for preventing other inappropriate behaviour. The group’s whistleblowing policy supports the culture within the group where genuine concerns may be reported and investigated without reprisals for whistleblowers.
The company operates an independently provided, confidential reporting telephone helpline and web portal for employees to raise matters of concern in relation to fraud, dishonesty, corruption, theft, security and bribery. Furthermore, employees are encouraged to raise any matters relating to health and safety and any activities of the business which have caused or may cause damage to the environment, such as pollution or other contamination. Alternatively, any matters of concern can also be raised with their manager, their human resources business partner or another senior manager. Employees can remain anonymous if they wish. All concerns are investigated fully, whether they are raised with a manager, or via the confidential helpline/web portal.
In the first instance of an incident being reported, a summary of the allegations are passed to the fraud and whistleblowing committee (consisting of the company secretary, customer services and people director, commercial director and head of internal audit and risk) to decide on the appropriate course of action and investigation and by whom.
The audit committee is kept fully appraised in regular updates on the progress of investigation of cases of whistleblowing and alleged fraud and the findings of any investigation and remedial actions. A number of employees have been selected and received specialist training in order to conduct investigations of cases of whistleblowing and alleged fraud.
The company has an anti-bribery policy to prevent bribery being committed on its behalf, which all employees must follow, and processes in place to monitor compliance with the policy. As part of the anti-bribery programme, employees are also required to comply with the group’s hospitality policy. The hospitality policy permits employees to accept proportionate and reasonable hospitality for legitimate business purposes only. Our employees and representatives of our suppliers must also comply with the group’s sustainable supply chain charter which explains that we will not tolerate corruption, bribery and unfair anti-competitive actions and we expect our suppliers to comply with applicable laws and regulations and in particular never to offer or accept any undue payment or other consideration, directly or indirectly, for the purposes of inducing any person or entity to act contrary to their prescribed duties.
As part of the internal control self-assessment checklist (part of the group’s internal control processes), senior managers in consultation with their teams are required to confirm, amongst other things, that they have complied with the group’s anti-bribery and hospitality policies. The anti-bribery programme is monitored and reviewed biannually by the committee.
The anti-bribery policy is available on the company’s website at unitedutilities.com/corporate/about-us/governance/
The sustainable supply chain charter is available at unitedutilities.com/corporate/responsibility/stakeholders/suppliers/
89
Gov
erna
nce
Stock Code: UU. unitedutilities.com/corporate
United Utilities Middle Section.indd 89 04/06/2018 13:05:35
Job Number 4 June 2018 8:56 AM Proof 3 Job Number 4 June 2018 8:56 AM Proof 3
The committee warmly welcomed the company’s first affordability summit which brought together the region’s affordability stakeholders to identify new ways to support customers and promote open discussion and collaboration.
Dear ShareholderI am pleased to report on the work of the corporate responsibility committee (CRC) in 2017/18.
The North West continues to face economic challenges. Over half of England’s most deprived neighbourhoods are in the region and it has higher than average numbers of people claiming Jobseekers’ Allowance and Universal Credit. The committee agreed the company’s support for lower income groups should be a regular topic of focus and each meeting is now presented with a dashboard highlighting progress in tackling this material social issue.
The CRC warmly welcomed the company’s first affordability summit which brought together the region’s affordability stakeholders to identify new ways to support customers and promote open discussion and collaboration. The company also published its first vulnerability and affordability report, laying out its framework for assisting customers in vulnerable circumstances, including what it is doing now and how it aims to continue to develop this through its own initiatives and by working with other specialist charities and organisations.
The publication of the government’s 25 year Natural Environment Plan was discussed by the committee and, in particular, the emphasis placed on natural capital. The company recognises the important role natural capital will play in future catchment management activity and the CRC supported the proposal to put this at the heart of an updated natural environment strategy.
With the company firmly focused on its price review plans, the committee reviewed specific topics such as resilience, as well as affordability. As well as debating the trade-off between reducing customer bills and investment in resilient services and, in particular securing long-term water supplies, the CRC also considered ‘resilience in the round’ covering corporate and financial resilience.
The management team updated the committee on its approach to customer research and stakeholder engagement. The committee welcomed efforts to build relationships with the newly elected metro mayors and a new partnership with Youth Focus, to bring the voice of future bill payers closer to the company’s planning.
In a year when the issue of gender pay has been widely reported, as a result of mandatory reporting requirements, the committee was updated on the steps taken to prepare and publish the report. It discussed issues arising and noted plans being implemented by the company including the establishment of a gender equality network, targeting diverse shortlists and attraction campaigns for apprentice and graduate recruitment and working with partners to influence younger women into careers within utilities. The CRC will return to the topic ahead of the publication of the second report.
In addition, the CRC considered a wide range of topics. These included environmental topics such as energy, social topics such as human rights and, in particular, several governance items such as the draft Corporate Governance Code, the Duty to Report, Integrated Reporting and board ESG training.
Quick facts
› The committee comprises three directors appointed by the board, two of whom are independent non-executive directors;
› The company secretary, corporate affairs director and customer services and people director attend all meetings of the committee;
› Senior operational managers attend the committee to report on the environmental and social impact of particular topics and initiatives; and
› The corporate responsibility committee has existed for over 10 years.
Quick linksTerms of reference – unitedutilities.com/corporate-governance
Corporate governance reportCorporate responsibility committee
Corporate responsibility committee members
Stephen Carter (chair) Alison Goligher
Steve Mogford
90
United Utilities Group PLC Annual Report and Financial Statements for the year ended 31 March 2018
United Utilities Middle Section.indd 90 04/06/2018 13:05:35
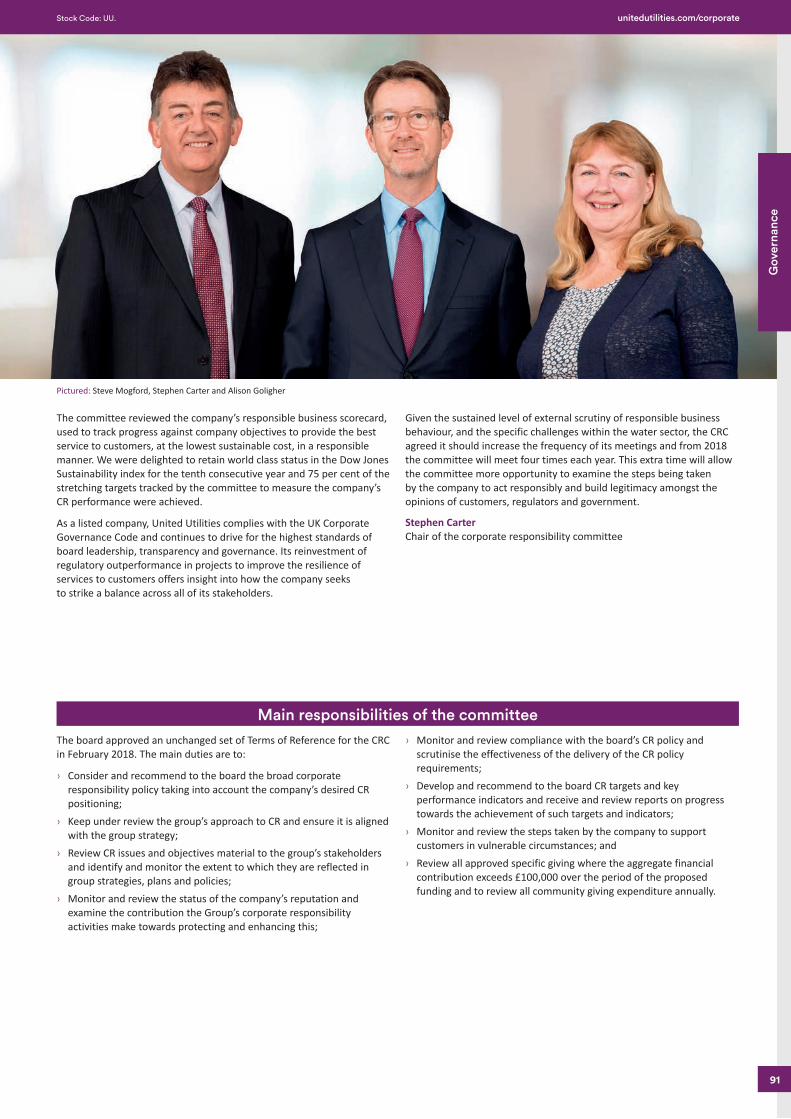
Job Number 4 June 2018 8:56 AM Proof 3 Job Number 4 June 2018 8:56 AM Proof 3
The committee reviewed the company’s responsible business scorecard, used to track progress against company objectives to provide the best service to customers, at the lowest sustainable cost, in a responsible manner. We were delighted to retain world class status in the Dow Jones Sustainability index for the tenth consecutive year and 75 per cent of the stretching targets tracked by the committee to measure the company’s CR performance were achieved.
As a listed company, United Utilities complies with the UK Corporate Governance Code and continues to drive for the highest standards of board leadership, transparency and governance. Its reinvestment of regulatory outperformance in projects to improve the resilience of services to customers offers insight into how the company seeks to strike a balance across all of its stakeholders.
Given the sustained level of external scrutiny of responsible business behaviour, and the specific challenges within the water sector, the CRC agreed it should increase the frequency of its meetings and from 2018 the committee will meet four times each year. This extra time will allow the committee more opportunity to examine the steps being taken by the company to act responsibly and build legitimacy amongst the opinions of customers, regulators and government.
Stephen Carter Chair of the corporate responsibility committee
The board approved an unchanged set of Terms of Reference for the CRC in February 2018. The main duties are to:
› Consider and recommend to the board the broad corporate responsibility policy taking into account the company’s desired CR positioning;
› Keep under review the group’s approach to CR and ensure it is aligned with the group strategy;
› Review CR issues and objectives material to the group’s stakeholders and identify and monitor the extent to which they are reflected in group strategies, plans and policies;
› Monitor and review the status of the company’s reputation and examine the contribution the Group’s corporate responsibility activities make towards protecting and enhancing this;
› Monitor and review compliance with the board’s CR policy and scrutinise the effectiveness of the delivery of the CR policy requirements;
› Develop and recommend to the board CR targets and key performance indicators and receive and review reports on progress towards the achievement of such targets and indicators;
› Monitor and review the steps taken by the company to support customers in vulnerable circumstances; and
› Review all approved specific giving where the aggregate financial contribution exceeds £100,000 over the period of the proposed funding and to review all community giving expenditure annually.
Main responsibilities of the committee
Pictured: Steve Mogford, Stephen Carter and Alison Goligher
91
Gov
erna
nce
Stock Code: UU. unitedutilities.com/corporate
United Utilities Middle Section.indd 91 04/06/2018 13:05:37
Job Number 4 June 2018 8:56 AM Proof 3 Job Number 4 June 2018 8:56 AM Proof 3
What has been on the committee’s agenda during the year?In carrying out its duties, the CRC has paid particular attention to the following:
› Affordability – The CRC considered the scale and effectiveness of the support offered to customers against a background of rising household costs, falling real term wages, economic uncertainty, and a decrease in the percentage of people of working age, given that the North West has half of England’s most deprived neighbourhoods. In addition, the Committee was updated on the creation of the independent Customer Advisory Panel, with membership drawn from across the affordability sector from organisations such as Mind, Citizens Advice and Age UK (see page 43).
› Lower income groups – The committee requested that the company’s approach to lower income groups become a topic of regular focus given the heightened interest in debt and affordability and those who find it a struggle to pay their water bill. Discussions focused around a dashboard to chart progress in supporting lower income groups covering support schemes, debt management, budgeting and new initiatives. The committee welcomed the improved performance against most of the measures.
Environmental › Resilience – The CRC noted how the company has already made
significant reductions to the risks to water supply resilience, having learnt from events such as the Lancashire water quality incident and the Cumbria floods, both in 2015. It explored the significance of resilience in PR19 planning and striking the appropriate balance between customer bills and resilient services, with the trade-off informed by customer research and engagement. The Committee heard how this extended to the Manchester-Pennine resilience scheme and securing long-term water supplies for parts of Cumbria, Lancashire and Greater Manchester. In addition, the notion of ‘resilience in the round’, which includes corporate and financial resilience, was discussed by the Committee which recognised that, as a listed company, we comply with the UK Corporate Governance Code and continue to drive for the highest standards of board leadership, transparency and governance.
› Natural environment strategy including natural capital – In the year the Government published its 25 year Natural Environment Plan, the Committee reflected on the important role the company plays in safeguarding the quality of the natural environment, now and into the future. It examined a proposed new strategy which, for the first time, includes recognition of the importance of natural capital thinking, a concept now shaping the external policy world and at the heart of Defra’s Pioneer projects. Two of these are in the North West and the company is heavily involved in both – the catchment pioneer in Cumbria and the urban pioneer in Greater Manchester – where closer collaboration with partners such as other major land owners and catchment stakeholders is essential to protect and enhance natural capital and the services it provides.
› Energy – The committee was provided with an update on the amount and cost of electricity consumed, progress on renewable energy generated and future opportunities. It noted the balanced approach adopted by the company towards energy management and how it has set and cascaded energy consumption targets throughout its Wholesale business. Further, the company reported how it had sought through supply contracts to minimise the total cost of electricity consumed, moving consumption outside of high cost energy time bands and alternative income streams by providing balancing services to Distribution Network Operators in return for a financial payment.
Social › Gender pay reporting – As a result of the requirement to report
gender pay data, the CRC was updated on the development of the company’s first report (see page 78), the issues arising and the steps taken to prepare and publish the report. The Committee heard how a Gender Equality Network was established in 2015 to provide role models, mentoring and opportunities and that working with partners like Teach First and the North West Women’s Network provides the opportunity to influence younger women into careers within utilities.
› Human Rights Policy – Recognising that human rights has gained greater prominence in recent years, with measures such as the Modern Slavery Act, and that companies are expected to have an active commitment to managing and respecting human rights, the CRC reviewed the company’s management of its human rights risks. It focused on the salient issues – those human rights that stand out because they are at risk of the greatest negative impact to people through company activity or business relationships – and the policies and commitments already in place to address these. It agreed that United Utilities’ risk to human rights infringements is low given that existing policies are extensive, that the company operates mainly in the UK, in a highly regulated environment and most of the issues are already measured as part of the company’s corporate risk assessment.
Governancea) Corporate governance
› Draft Corporate Governance Code – The CRC considered the draft UK Corporate Governance Code (due to apply from 1 January 2019) and the proposed changes relevant to the Committee’s responsibilities. In particular, the Committee discussed the role it should take on culture, diversity and stakeholder engagement and debated the proposal in relation to voice of the employee in the Boardroom.
› Duty to Report – The ‘Reporting on Payment Practices and Performance Regulations 2017’ come into effect in 2018 and the Committee was updated on the steps being taken by the company to be ready to report on or before 30 October 2018.
› Board ESG training – The committee noted a report on the question of ESG training for board members and comparisons with those organisations considered to have a comprehensive approach. The company’s current approach to disclosure allows a reader to conclude that the board regularly receives updates on topics related to ESG matters and that current disclosure compares favourably with others.
› Integrated Reporting – In preparing for the 2018 Annual Report, the Committee reviewed the steps being taken to further refine the report and it supported a stronger statement on the board’s responsibility for Integrated Reporting.
Corporate governance reportCorporate responsibility committee
92
United Utilities Group PLC Annual Report and Financial Statements for the year ended 31 March 2018
United Utilities Middle Section.indd 92 04/06/2018 13:05:37
Job Number 4 June 2018 8:56 AM Proof 3 Job Number 4 June 2018 8:56 AM Proof 3
b) Reputation and engagement › Reputation – This broad topic continued to be an area of focus for
the CRC, in particular building trust and confidence in the water sector and addressing questions of legitimacy. The CRC examined how the sector was responding to the debate on Renationalisation following the 2017 General Election. An assessment of the company’s key reputational risks remained a standing agenda item;
› Engagement – Linked to reputation, the committee discussed several papers on the company’s approach to stakeholder engagement, including work to develop relationships with the newly elected metro mayors and local enterprise partnerships. The CRC was updated on a new partnership with Youth Focus, to bring the voice of future bill payers into our business planning process;
› Participation in CR indices – The CRC debated the company’s future participation in CR indices and the importance of independent third-party assessment of our responsible business performance. It agreed there should be an updated approach, with participation in a targeted selection of investor led ratings, the use of a selection of benchmarks/standards and enhanced communication of the CR scorecard and external accolades that evidence responsible business improvement; and
› Measuring and reporting CR performance – The committee reviewed the company’s 2016/17 CR scorecard, noting that 75 per cent of the targets were achieved. Notable improvements included increasing the amount of waste put to beneficial use, employees feeling much better informed about the performance of the organisation as a whole, doubling community investment to £3.6 million and increasing volunteering hours due to regular volunteering at customer engagement roadshows promoting Priority Services.
Looking to the next year, the CRC will:
› Continue its focus on the interaction between CR, communications and reputation, including a look at the role of social media;
› Consider new, emerging and current issues and opportunities such as: what Brexit means for environmental and employment legislation; the company’s approach to plastics and air quality; an update on natural capital; what social value means for the company; and gender pay reporting;
› Return to issues previously discussed to examine progress such as the support given to customers on lower incomes; the company’s approach to talent and young people; progress on diversity and inclusion and human rights; and updates on sustainable supply chain, climate change, waste and community strategy, including charitable giving and donations;
› Discuss the Price Review process from a responsible business perspective in the lead up to the submission of plans in September 2018;
› Consider matters of governance such as the revised corporate governance code and the CRC’s terms of reference;
› Consider other matters such as Integrated Reporting in the 2018/19 Annual Report; and
› Review progress in delivering responsible business targets set out to 2020 and shape the next set of responsible business commitments from 2020 onwards.
93
Gov
erna
nce
Stock Code: UU. unitedutilities.com/corporate
United Utilities Middle Section.indd 93 04/06/2018 13:05:37
Job Number 4 June 2018 8:56 AM Proof 3 Job Number 4 June 2018 8:56 AM Proof 3
Our executive pay arrangements are aligned to our purpose, vision and strategy, thereby incentivising great customer service and the creation of long-term value for all of our stakeholders.
Dear ShareholderI am pleased to introduce the directors’ remuneration report for the year ended 31 March 2018. Our approach to remuneration is set out in our directors’ remuneration policy, which was approved by shareholders at our 2017 AGM and has been implemented this year. A summary of the policy is included in an appendix for reference (see pages 110 to 114).
Our executive pay arrangements are aligned to our purpose, vision and strategy, thereby incentivising great customer service and the creation of long-term value for all of our stakeholders. We aim to pay only what is required to recruit, retain and motivate the strong management team needed to achieve this ambition.
Executive directors’ salaries are appropriately positioned relative to the market, and normally increase in line with salaries for other employees. In light of this, Steve Mogford and Russ Houlden received a base salary increase of 2.5 per cent with effect from 1 September 2017, in line with the headline increase applied across the wider workforce. Salaries will next be reviewed in September 2018.
Our annual bonus structure focuses on key measures of performance and ensures that employees at all levels benefit from company success, whilst longer-term incentives closely align the interests of executive directors and other senior leaders with those of shareholders and customers.
Annual bonusEmployees throughout the company participate in the annual bonus scheme, alongside the executive directors, to ensure shared focus on the business plan at all levels. The bonus measures reflect the importance and challenge of the targets set by our regulators for the period 2015–20.
We have seen another good year of customer service, operational and financial performance in 2017/18, alongside commencement of the regulatory price review process for 2020–25.
The continued focus on providing the best service to customers has resulted in sustained improvements in customer satisfaction. This has been achieved through combining greater levels of investment to improve the resilience and reliability of water supplies, the increased use of technology to deliver better customer service, and by taking a leading approach to supporting vulnerable customers. This has been reflected in the company’s achievement of its best ever scores against Ofwat’s qualitative service incentive mechanism (SIM), reaching first position in the final wave of measurement in the year, and achieving an upper quartile position for the year overall.
Underlying operating profit was better than in 2016/17 and the efficient and effective delivery of the capital programme is reflected in our Time, Cost and Quality index (TCQi) score which remains high at 93.1 per cent.Performance against the outcome delivery incentives (ODIs) during the year was mixed, although cumulative ODI performance during the current regulatory period remains positive.
Quick facts
› The Code requires that ‘the board should establish a remuneration committee of at least three independent non-executive directors’;
› The role of the committee is to set remuneration terms for all executive directors, other senior executives and the Chairman; and
› By invitation of the committee, meetings are also attended by the Chairman, the CEO, the company secretary, the customer services and people director, the head of reward and pensions and the external adviser to the committee.
Quick linksTerms of reference – unitedutilities.com/corporate-governance
Code principle – Remuneration
Introduction by Dr John McAdam“Our remuneration policy has been designed to promote the long-term success of the company, with a significant proportion of senior executives’ pay being performance-related.”
Corporate governance reportAnnual statement from the remuneration committee chair
Index
Read more about At a glance summary: executive directors’ remuneration on pages 96 to 98
Read more about Annual report on remuneration on pages 99 to 109
Read more about Directors’ remuneration policy on pages 110 to 114
Remuneration committee members
Sara Weller (chair) Alison Goligher
Mark Clare Brian May
94
United Utilities Group PLC Annual Report and Financial Statements for the year ended 31 March 2018
United Utilities Middle Section.indd 94 04/06/2018 13:05:38
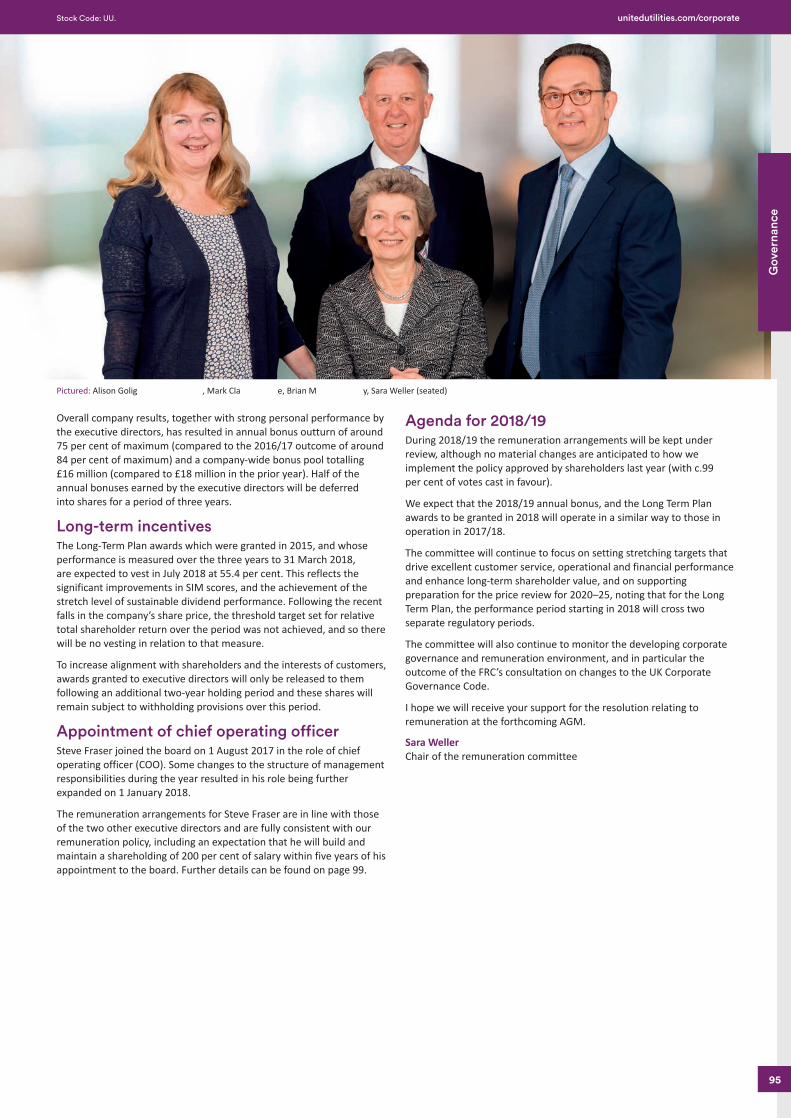
Job Number 4 June 2018 8:56 AM Proof 3 Job Number 4 June 2018 8:56 AM Proof 3
Overall company results, together with strong personal performance by the executive directors, has resulted in annual bonus outturn of around 75 per cent of maximum (compared to the 2016/17 outcome of around 84 per cent of maximum) and a company-wide bonus pool totalling £16 million (compared to £18 million in the prior year). Half of the annual bonuses earned by the executive directors will be deferred into shares for a period of three years.
Long-term incentivesThe Long-Term Plan awards which were granted in 2015, and whose performance is measured over the three years to 31 March 2018, are expected to vest in July 2018 at 55.4 per cent. This reflects the significant improvements in SIM scores, and the achievement of the stretch level of sustainable dividend performance. Following the recent falls in the company’s share price, the threshold target set for relative total shareholder return over the period was not achieved, and so there will be no vesting in relation to that measure.
To increase alignment with shareholders and the interests of customers, awards granted to executive directors will only be released to them following an additional two-year holding period and these shares will remain subject to withholding provisions over this period.
Appointment of chief operating officerSteve Fraser joined the board on 1 August 2017 in the role of chief operating officer (COO). Some changes to the structure of management responsibilities during the year resulted in his role being further expanded on 1 January 2018.
The remuneration arrangements for Steve Fraser are in line with those of the two other executive directors and are fully consistent with our remuneration policy, including an expectation that he will build and maintain a shareholding of 200 per cent of salary within five years of his appointment to the board. Further details can be found on page 99.
Agenda for 2018/19 During 2018/19 the remuneration arrangements will be kept under review, although no material changes are anticipated to how we implement the policy approved by shareholders last year (with c.99 per cent of votes cast in favour).
We expect that the 2018/19 annual bonus, and the Long Term Plan awards to be granted in 2018 will operate in a similar way to those in operation in 2017/18.
The committee will continue to focus on setting stretching targets that drive excellent customer service, operational and financial performance and enhance long-term shareholder value, and on supporting preparation for the price review for 2020–25, noting that for the Long Term Plan, the performance period starting in 2018 will cross two separate regulatory periods.
The committee will also continue to monitor the developing corporate governance and remuneration environment, and in particular the outcome of the FRC’s consultation on changes to the UK Corporate Governance Code.
I hope we will receive your support for the resolution relating to remuneration at the forthcoming AGM.
Sara WellerChair of the remuneration committee
Corporate governance reportAnnual statement from the remuneration committee chair
Pictured: Alison Goligher, Mark Clare, Brian May, Sara Weller (seated)
95
Gov
erna
nce
Stock Code: UU. unitedutilities.com/corporate
United Utilities Middle Section.indd 95 04/06/2018 13:05:40
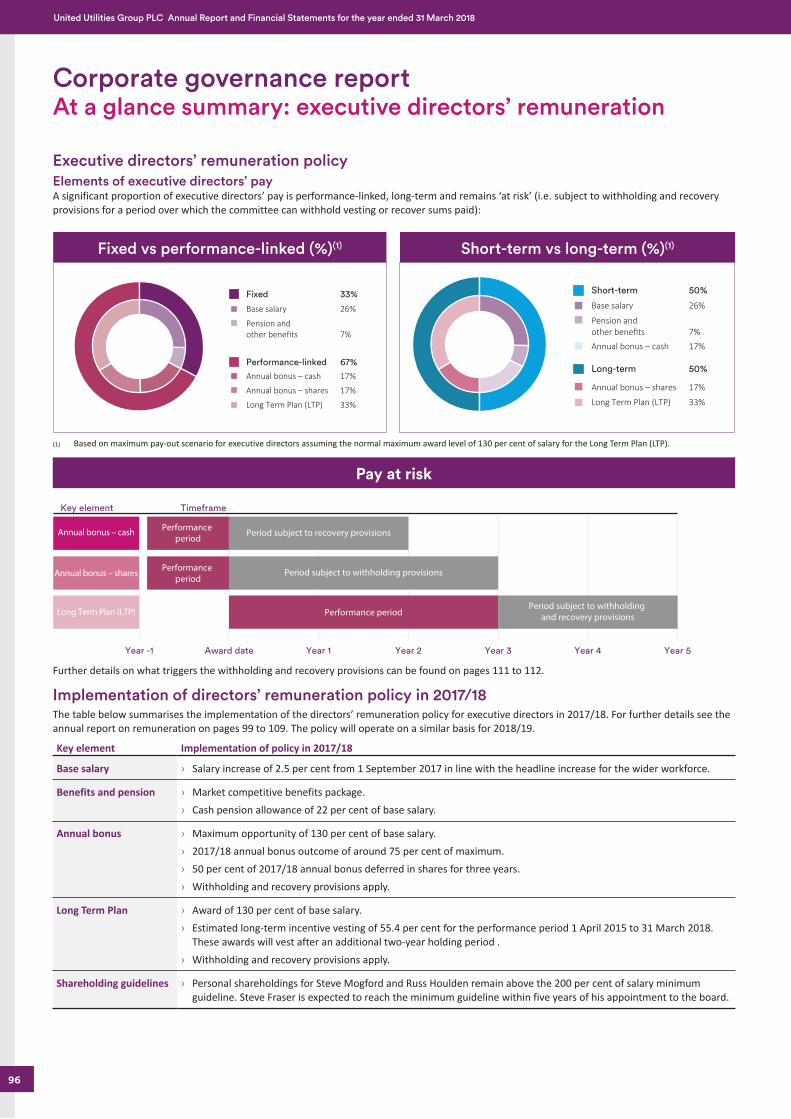
Job Number 4 June 2018 8:56 AM Proof 3 Job Number 4 June 2018 8:56 AM Proof 3
Executive directors’ remuneration policyElements of executive directors’ payA significant proportion of executive directors’ pay is performance-linked, long-term and remains ‘at risk’ (i.e. subject to withholding and recovery provisions for a period over which the committee can withhold vesting or recover sums paid):
Further details on what triggers the withholding and recovery provisions can be found on pages 111 to 112.
Implementation of directors’ remuneration policy in 2017/18The table below summarises the implementation of the directors’ remuneration policy for executive directors in 2017/18. For further details see the annual report on remuneration on pages 99 to 109. The policy will operate on a similar basis for 2018/19.
Key element Implementation of policy in 2017/18
Base salary › Salary increase of 2.5 per cent from 1 September 2017 in line with the headline increase for the wider workforce.
Benefits and pension › Market competitive benefits package. › Cash pension allowance of 22 per cent of base salary.
Annual bonus › Maximum opportunity of 130 per cent of base salary. › 2017/18 annual bonus outcome of around 75 per cent of maximum. › 50 per cent of 2017/18 annual bonus deferred in shares for three years. › Withholding and recovery provisions apply.
Long Term Plan › Award of 130 per cent of base salary. › Estimated long-term incentive vesting of 55.4 per cent for the performance period 1 April 2015 to 31 March 2018.
These awards will vest after an additional two-year holding period . › Withholding and recovery provisions apply.
Shareholding guidelines › Personal shareholdings for Steve Mogford and Russ Houlden remain above the 200 per cent of salary minimum guideline. Steve Fraser is expected to reach the minimum guideline within five years of his appointment to the board.
(1) Based on maximum pay-out scenario for executive directors assuming the normal maximum award level of 130 per cent of salary for the Long Term Plan (LTP).
Fixed vs performance-linked (%)(1) Short-term vs long-term (%)(1)
Performance-linked 67%
Fixed 33%
Base salary 26%
Pension and other benefits 7%
Annual bonus – cash 17%
Annual bonus – shares 17%
Long Term Plan (LTP) 33%
Long-term 50%
Short-term 50%
Base salary 26%
Pension and other benefits 7%
Annual bonus – shares 17%
Long Term Plan (LTP) 33%
Annual bonus – cash 17%
Annual bonus – cash
Annual bonus – shares
Long Term Plan (LTP)
Performance period
Performance period
Performance period
Year -1
Key element Timeframe
Year 1 Year 2 Year 3 Year 4 Year 5Award date
Period subject to recovery provisions
Period subject to withholding provisions
Period subject to withholding and recovery provisions
Pay at risk
Corporate governance reportAt a glance summary: executive directors’ remuneration
96
United Utilities Group PLC Annual Report and Financial Statements for the year ended 31 March 2018
United Utilities Middle Section.indd 96 04/06/2018 13:05:41
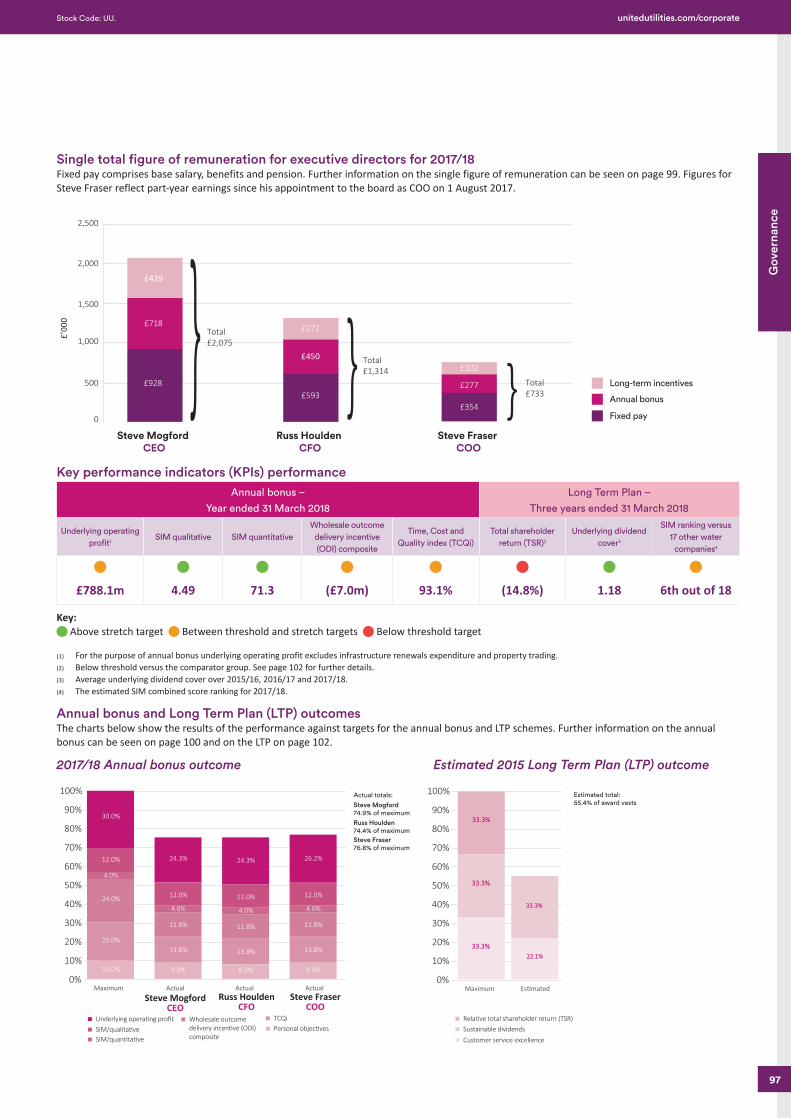
Job Number 4 June 2018 8:56 AM Proof 3 Job Number 4 June 2018 8:56 AM Proof 3
Single total figure of remuneration for executive directors for 2017/18Fixed pay comprises base salary, benefits and pension. Further information on the single figure of remuneration can be seen on page 99. Figures for Steve Fraser reflect part-year earnings since his appointment to the board as COO on 1 August 2017.
Key performance indicators (KPIs) performanceAnnual bonus –
Year ended 31 March 2018
Long Term Plan –
Three years ended 31 March 2018
Underlying operating profit1
SIM qualitative SIM quantitativeWholesale outcome
delivery incentive(ODI) composite
Time, Cost and Quality index (TCQi)
Total shareholder return (TSR)2
Underlying dividend cover3
SIM ranking versus 17 other water
companies4
£788.1m 4.49 71.3 (£7.0m) 93.1% (14.8%) 1.18 6th out of 18
Key: Above stretch target Between threshold and stretch targets Below threshold target
(1) For the purpose of annual bonus underlying operating profit excludes infrastructure renewals expenditure and property trading.(2) Below threshold versus the comparator group. See page 102 for further details.(3) Average underlying dividend cover over 2015/16, 2016/17 and 2017/18.(4) The estimated SIM combined score ranking for 2017/18.
Annual bonus and Long Term Plan (LTP) outcomesThe charts below show the results of the performance against targets for the annual bonus and LTP schemes. Further information on the annual bonus can be seen on page 100 and on the LTP on page 102.
2017/18 Annual bonus outcome Estimated 2015 Long Term Plan (LTP) outcome
0
500
Fixed pay
Annual bonus
Long-term incentives
1,000
1,500
2,000
2,500
Total £2,075
£928
£718
£429
Steve Mogford CEO
Russ Houlden CFO
£’00
0
Total £1,314
£593
£271
£450
Total£733
£354
£277
£102
Steve Fraser COO
} } }0 500 1,000 1,500 2,000 2,500
Total £’000£797
£405 £246£146
Steve Fraser COO
£’000
Total £’000£1,463
£’0000 500 1,000 1,500
£581 £492 £390
Lorem ipsum
0%
10%
20%
30%
40%
50%
60%
70%
80%
90%
100%
0%
10%
20%
30%
40%
50%
60%
70%
80%
90%
100%
Maximum Es�mated
Estimated total: 55.4% of award vests
33.3%
33.3%
33.3%
33.3%
Underlying opera�ng profitSIM/qualita�veSIM/quan�ta�ve
Wholesale outcome delivery incen�ve (ODI) composite
TCQi
Personal objec�vesRela�ve total shareholder return (TSR)Sustainable dividendsCustomer service excellence
Maximum Actual Actual Actual
Actual totals:
20.0%
24.0%
4.0%
12.0%
30.0%
10.0%
13.8%
11.8%
12.0%
24.3%
9.0%
4.0%
13.8%
11.8%
12.0%
24.3%
8.5%
4.0%
13.8%
11.8%
12.0%
26.2%
9.0%
4.0%
Steve Mogford 74.9% of maximumRuss Houlden 74.4% of maximumSteve Fraser 76.8% of maximum
22.1%
Steve MogfordCEO
Russ HouldenCFO
Steve FraserCOO
0%
10%
20%
30%
40%
50%
60%
70%
80%
90%
100%
0%
10%
20%
30%
40%
50%
60%
70%
80%
90%
100%
Maximum Es�mated
Estimated total: 55.4% of award vests
33.3%33.3%
33.3%33.3%
33.3%33.3%
33.3%33.3%
Underlying opera�ng profitSIM/qualita�veSIM/quan�ta�ve
Wholesale outcome delivery incen�ve (ODI) composite
TCQi
Personal objec�vesRela�ve total shareholder return (TSR)Sustainable dividendsCustomer service excellence
Maximum Actual Actual Actual
Actual totals:
20.0%
24.0%
4.0%
12.0%
30.0%
10.0%
13.8%
11.8%
12.0%
24.3%
9.0%
4.0%
13.8%
11.8%
12.0%
24.3%
8.5%
4.0%
13.8%
11.8%
12.0%
26.2%
9.0%
4.0%
Steve Mogford 74.9% of maximumRuss Houlden 74.4% of maximumSteve Fraser 76.8% of maximum
22.1%22.1%
Steve MogfordCEO
Russ HouldenCFO
Steve FraserCOO
97
Gov
erna
nce
Stock Code: UU. unitedutilities.com/corporate
United Utilities Middle Section.indd 97 04/06/2018 13:05:41
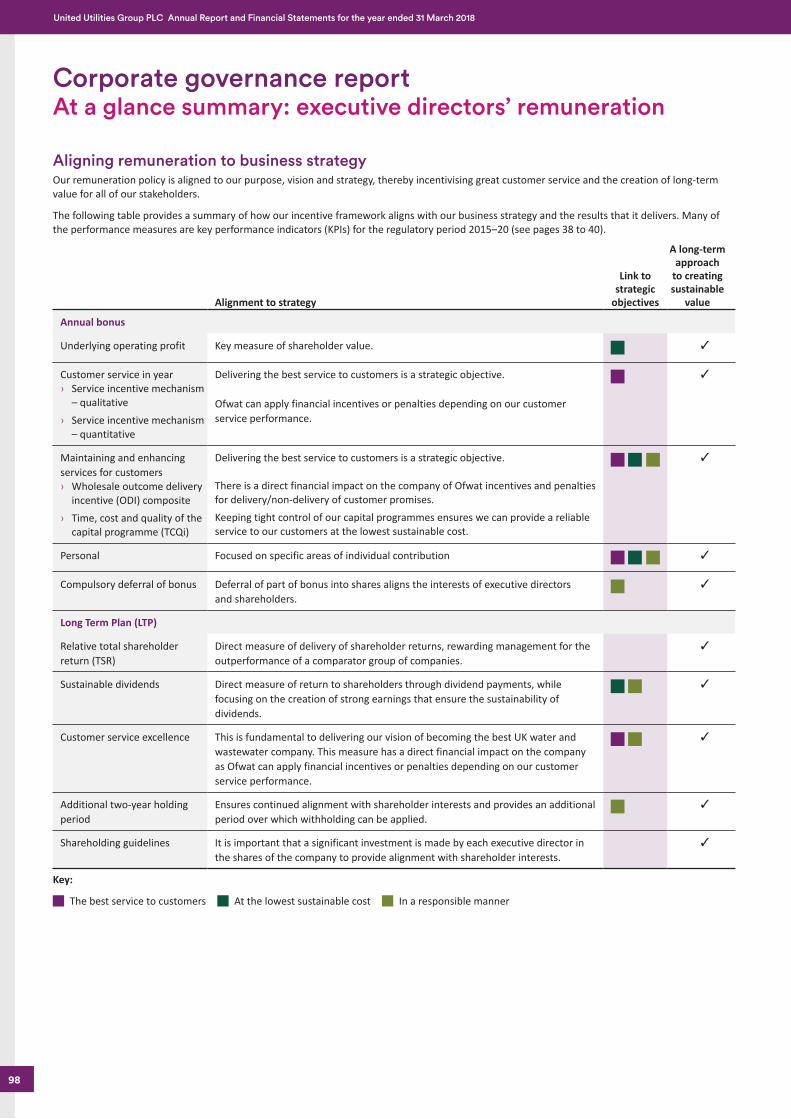
Job Number 4 June 2018 8:56 AM Proof 3 Job Number 4 June 2018 8:56 AM Proof 3
Aligning remuneration to business strategyOur remuneration policy is aligned to our purpose, vision and strategy, thereby incentivising great customer service and the creation of long-term value for all of our stakeholders.
The following table provides a summary of how our incentive framework aligns with our business strategy and the results that it delivers. Many of the performance measures are key performance indicators (KPIs) for the regulatory period 2015–20 (see pages 38 to 40).
Alignment to strategy
Link to strategic
objectives
A long-term approach
to creating sustainable
value
Annual bonus
Underlying operating profit Key measure of shareholder value. ✓
Customer service in year › Service incentive mechanism
– qualitative › Service incentive mechanism
– quantitative
Delivering the best service to customers is a strategic objective.
Ofwat can apply financial incentives or penalties depending on our customer service performance.
✓
Maintaining and enhancing services for customers › Wholesale outcome delivery
incentive (ODI) composite › Time, cost and quality of the
capital programme (TCQi)
Delivering the best service to customers is a strategic objective.
There is a direct financial impact on the company of Ofwat incentives and penalties for delivery/non-delivery of customer promises.Keeping tight control of our capital programmes ensures we can provide a reliable service to our customers at the lowest sustainable cost.
✓
Personal Focused on specific areas of individual contribution ✓
Compulsory deferral of bonus Deferral of part of bonus into shares aligns the interests of executive directors and shareholders.
✓
Long Term Plan (LTP)
Relative total shareholder return (TSR)
Direct measure of delivery of shareholder returns, rewarding management for the outperformance of a comparator group of companies.
✓
Sustainable dividends Direct measure of return to shareholders through dividend payments, while focusing on the creation of strong earnings that ensure the sustainability of dividends.
✓
Customer service excellence This is fundamental to delivering our vision of becoming the best UK water and wastewater company. This measure has a direct financial impact on the company as Ofwat can apply financial incentives or penalties depending on our customer service performance.
✓
Additional two-year holding period
Ensures continued alignment with shareholder interests and provides an additional period over which withholding can be applied.
✓
Shareholding guidelines It is important that a significant investment is made by each executive director in the shares of the company to provide alignment with shareholder interests.
✓
Key:
The best service to customers At the lowest sustainable cost In a responsible manner
Corporate governance reportAt a glance summary: executive directors’ remuneration
98
United Utilities Group PLC Annual Report and Financial Statements for the year ended 31 March 2018
United Utilities Middle Section.indd 98 04/06/2018 13:05:42
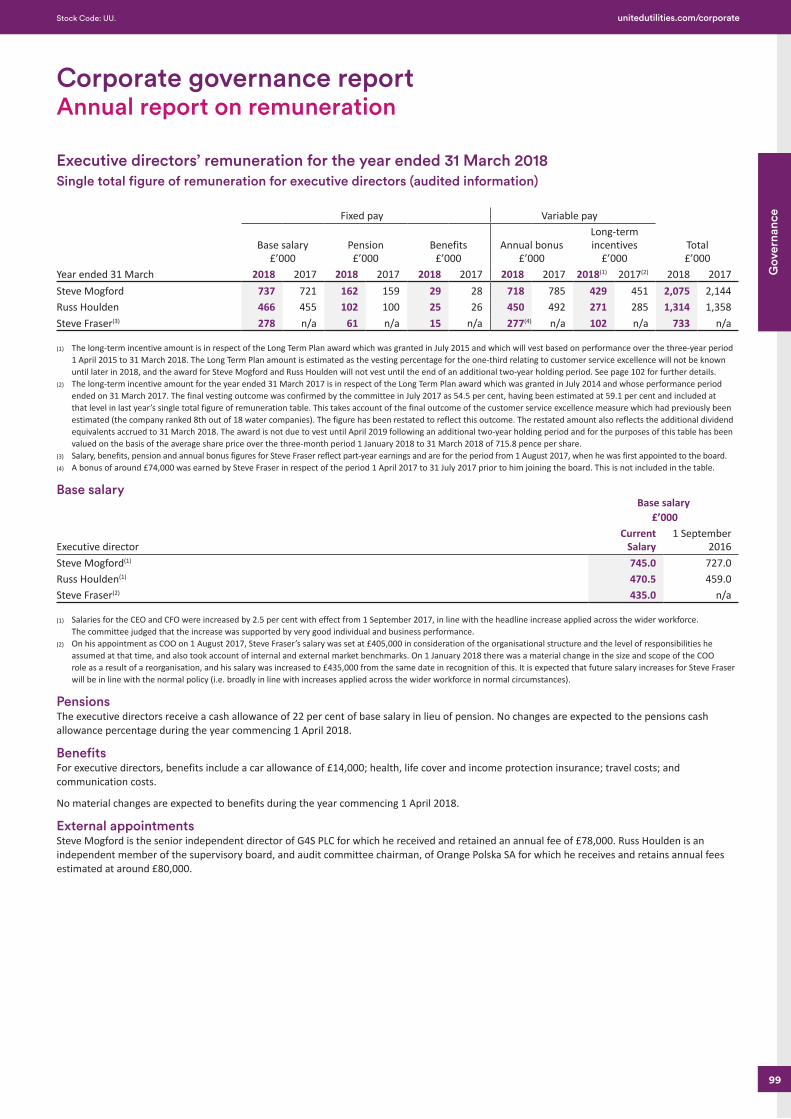
Job Number 4 June 2018 8:56 AM Proof 3 Job Number 4 June 2018 8:56 AM Proof 3
Executive directors’ remuneration for the year ended 31 March 2018Single total figure of remuneration for executive directors (audited information)
Year ended 31 March
Fixed pay Variable pay
Base salary £’000
Pension £’000
Benefits £’000
Annual bonus £’000
Long-term incentives
£’000Total £’000
2018 2017 2018 2017 2018 2017 2018 2017 2018(1) 2017(2) 2018 2017Steve Mogford 737 721 162 159 29 28 718 785 429 451 2,075 2,144Russ Houlden 466 455 102 100 25 26 450 492 271 285 1,314 1,358Steve Fraser(3) 278 n/a 61 n/a 15 n/a 277(4) n/a 102 n/a 733 n/a
(1) The long-term incentive amount is in respect of the Long Term Plan award which was granted in July 2015 and which will vest based on performance over the three-year period 1 April 2015 to 31 March 2018. The Long Term Plan amount is estimated as the vesting percentage for the one-third relating to customer service excellence will not be known until later in 2018, and the award for Steve Mogford and Russ Houlden will not vest until the end of an additional two-year holding period. See page 102 for further details.
(2) The long-term incentive amount for the year ended 31 March 2017 is in respect of the Long Term Plan award which was granted in July 2014 and whose performance period ended on 31 March 2017. The final vesting outcome was confirmed by the committee in July 2017 as 54.5 per cent, having been estimated at 59.1 per cent and included at that level in last year’s single total figure of remuneration table. This takes account of the final outcome of the customer service excellence measure which had previously been estimated (the company ranked 8th out of 18 water companies). The figure has been restated to reflect this outcome. The restated amount also reflects the additional dividend equivalents accrued to 31 March 2018. The award is not due to vest until April 2019 following an additional two-year holding period and for the purposes of this table has been valued on the basis of the average share price over the three-month period 1 January 2018 to 31 March 2018 of 715.8 pence per share.
(3) Salary, benefits, pension and annual bonus figures for Steve Fraser reflect part-year earnings and are for the period from 1 August 2017, when he was first appointed to the board. (4) A bonus of around £74,000 was earned by Steve Fraser in respect of the period 1 April 2017 to 31 July 2017 prior to him joining the board. This is not included in the table.
Base salary
Executive director
Base salary £’000
Current Salary
1 September 2016
Steve Mogford(1) 745.0 727.0Russ Houlden(1) 470.5 459.0Steve Fraser(2) 435.0 n/a
(1) Salaries for the CEO and CFO were increased by 2.5 per cent with effect from 1 September 2017, in line with the headline increase applied across the wider workforce. The committee judged that the increase was supported by very good individual and business performance.
(2) On his appointment as COO on 1 August 2017, Steve Fraser’s salary was set at £405,000 in consideration of the organisational structure and the level of responsibilities he assumed at that time, and also took account of internal and external market benchmarks. On 1 January 2018 there was a material change in the size and scope of the COO role as a result of a reorganisation, and his salary was increased to £435,000 from the same date in recognition of this. It is expected that future salary increases for Steve Fraser will be in line with the normal policy (i.e. broadly in line with increases applied across the wider workforce in normal circumstances).
PensionsThe executive directors receive a cash allowance of 22 per cent of base salary in lieu of pension. No changes are expected to the pensions cash allowance percentage during the year commencing 1 April 2018.
BenefitsFor executive directors, benefits include a car allowance of £14,000; health, life cover and income protection insurance; travel costs; and communication costs.
No material changes are expected to benefits during the year commencing 1 April 2018.
External appointmentsSteve Mogford is the senior independent director of G4S PLC for which he received and retained an annual fee of £78,000. Russ Houlden is an independent member of the supervisory board, and audit committee chairman, of Orange Polska SA for which he receives and retains annual fees estimated at around £80,000.
Corporate governance reportAnnual report on remuneration
99
Gov
erna
nce
Stock Code: UU. unitedutilities.com/corporate
United Utilities Middle Section.indd 99 04/06/2018 13:05:42
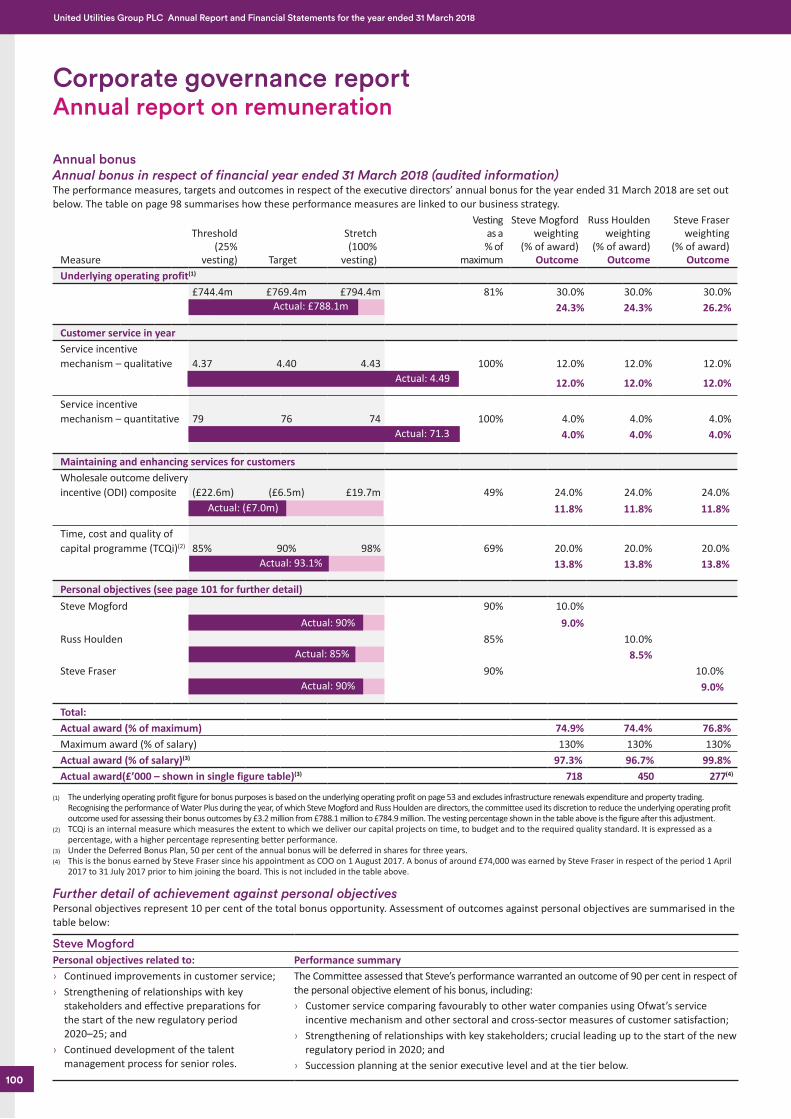
Job Number 4 June 2018 8:56 AM Proof 3 Job Number 4 June 2018 8:56 AM Proof 3
Annual bonusAnnual bonus in respect of financial year ended 31 March 2018 (audited information)The performance measures, targets and outcomes in respect of the executive directors’ annual bonus for the year ended 31 March 2018 are set out below. The table on page 98 summarises how these performance measures are linked to our business strategy.
Measure
Threshold (25%
vesting) Target
Stretch (100%
vesting)
Vesting as a % of
maximum
Steve Mogford weighting
(% of award) Outcome
Russ Houlden weighting
(% of award) Outcome
Steve Fraser weighting
(% of award) Outcome
Underlying operating profit(1)
£744.4m £769.4m £794.4m 81% 30.0% 30.0% 30.0%Actual: £788.1m 24.3% 24.3% 26.2%
Customer service in yearService incentive mechanism – qualitative 4.37 4.40 4.43 100% 12.0% 12.0% 12.0%
Actual: 4.49 12.0% 12.0% 12.0%
Service incentive mechanism – quantitative 79 76 74 100% 4.0% 4.0% 4.0%
Actual: 71.3 4.0% 4.0% 4.0%
Maintaining and enhancing services for customersWholesale outcome delivery incentive (ODI) composite (£22.6m) (£6.5m) £19.7m 49% 24.0% 24.0% 24.0%
Actual: (£7.0m) 11.8% 11.8% 11.8%
Time, cost and quality of capital programme (TCQi)(2) 85% 90% 98% 69% 20.0% 20.0% 20.0%
Actual: 93.1% 13.8% 13.8% 13.8%
Personal objectives (see page 101 for further detail)Steve Mogford 90% 10.0%
Actual: 90% 9.0%Russ Houlden 85% 10.0%
Actual: 85% 8.5%Steve Fraser 90% 10.0%
Actual: 90% 9.0%
Total:Actual award (% of maximum) 74.9% 74.4% 76.8%Maximum award (% of salary) 130% 130% 130%Actual award (% of salary)(3) 97.3% 96.7% 99.8%Actual award(£’000 – shown in single figure table)(3) 718 450 277(4)
(1) The underlying operating profit figure for bonus purposes is based on the underlying operating profit on page 53 and excludes infrastructure renewals expenditure and property trading. Recognising the performance of Water Plus during the year, of which Steve Mogford and Russ Houlden are directors, the committee used its discretion to reduce the underlying operating profit outcome used for assessing their bonus outcomes by £3.2 million from £788.1 million to £784.9 million. The vesting percentage shown in the table above is the figure after this adjustment.
(2) TCQi is an internal measure which measures the extent to which we deliver our capital projects on time, to budget and to the required quality standard. It is expressed as a percentage, with a higher percentage representing better performance.
(3) Under the Deferred Bonus Plan, 50 per cent of the annual bonus will be deferred in shares for three years.(4) This is the bonus earned by Steve Fraser since his appointment as COO on 1 August 2017. A bonus of around £74,000 was earned by Steve Fraser in respect of the period 1 April
2017 to 31 July 2017 prior to him joining the board. This is not included in the table above.
Further detail of achievement against personal objectivesPersonal objectives represent 10 per cent of the total bonus opportunity. Assessment of outcomes against personal objectives are summarised in the table below:
Steve MogfordPersonal objectives related to: Performance summary › Continued improvements in customer service; › Strengthening of relationships with key
stakeholders and effective preparations for the start of the new regulatory period 2020–25; and
› Continued development of the talent management process for senior roles.
The Committee assessed that Steve’s performance warranted an outcome of 90 per cent in respect of the personal objective element of his bonus, including: › Customer service comparing favourably to other water companies using Ofwat’s service
incentive mechanism and other sectoral and cross-sector measures of customer satisfaction; › Strengthening of relationships with key stakeholders; crucial leading up to the start of the new
regulatory period in 2020; and › Succession planning at the senior executive level and at the tier below.
Corporate governance reportAnnual report on remuneration
100
United Utilities Group PLC Annual Report and Financial Statements for the year ended 31 March 2018
United Utilities Middle Section.indd 100 04/06/2018 13:05:43
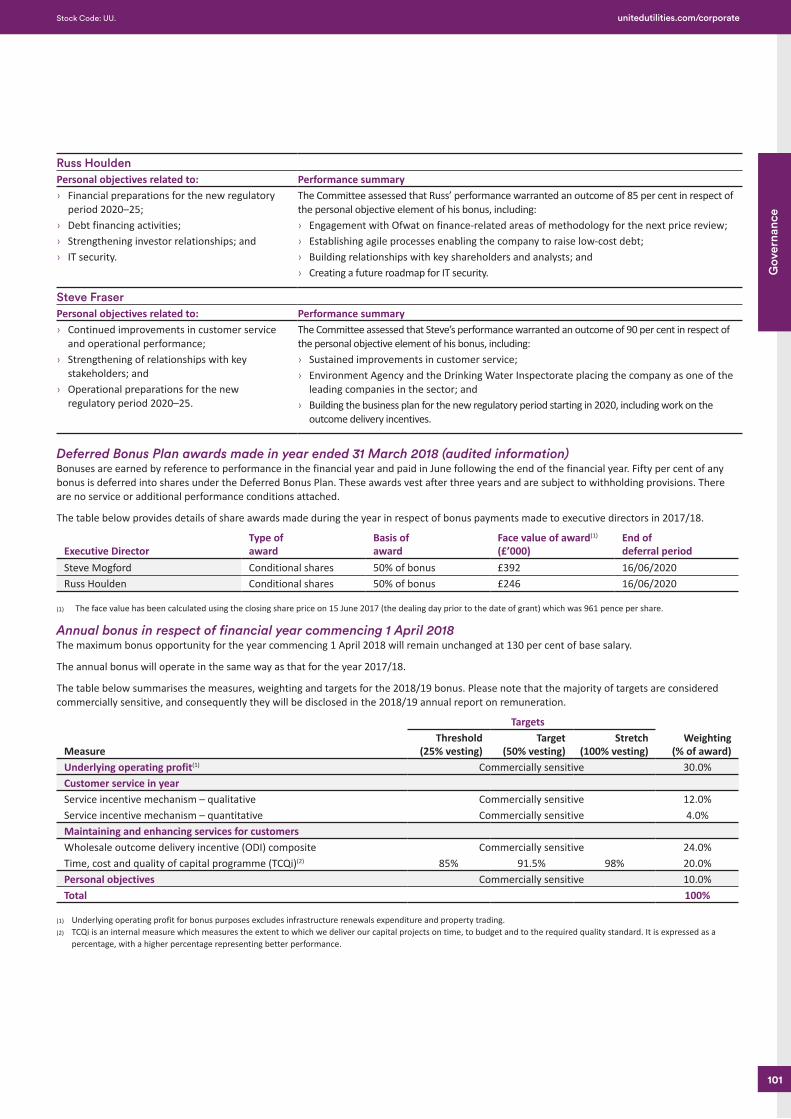
Job Number 4 June 2018 8:56 AM Proof 3 Job Number 4 June 2018 8:56 AM Proof 3
Russ HouldenPersonal objectives related to: Performance summary › Financial preparations for the new regulatory
period 2020–25; › Debt financing activities; › Strengthening investor relationships; and › IT security.
The Committee assessed that Russ’ performance warranted an outcome of 85 per cent in respect of the personal objective element of his bonus, including: › Engagement with Ofwat on finance-related areas of methodology for the next price review; › Establishing agile processes enabling the company to raise low-cost debt; › Building relationships with key shareholders and analysts; and › Creating a future roadmap for IT security.
Steve FraserPersonal objectives related to: Performance summary › Continued improvements in customer service
and operational performance; › Strengthening of relationships with key
stakeholders; and › Operational preparations for the new
regulatory period 2020–25.
The Committee assessed that Steve’s performance warranted an outcome of 90 per cent in respect of the personal objective element of his bonus, including: › Sustained improvements in customer service; › Environment Agency and the Drinking Water Inspectorate placing the company as one of the
leading companies in the sector; and › Building the business plan for the new regulatory period starting in 2020, including work on the
outcome delivery incentives.
Deferred Bonus Plan awards made in year ended 31 March 2018 (audited information)Bonuses are earned by reference to performance in the financial year and paid in June following the end of the financial year. Fifty per cent of any bonus is deferred into shares under the Deferred Bonus Plan. These awards vest after three years and are subject to withholding provisions. There are no service or additional performance conditions attached.
The table below provides details of share awards made during the year in respect of bonus payments made to executive directors in 2017/18.
Executive DirectorType of award
Basis of award
Face value of award(1) (£’000)
End of deferral period
Steve Mogford Conditional shares 50% of bonus £392 16/06/2020Russ Houlden Conditional shares 50% of bonus £246 16/06/2020
(1) The face value has been calculated using the closing share price on 15 June 2017 (the dealing day prior to the date of grant) which was 961 pence per share.
Annual bonus in respect of financial year commencing 1 April 2018The maximum bonus opportunity for the year commencing 1 April 2018 will remain unchanged at 130 per cent of base salary.
The annual bonus will operate in the same way as that for the year 2017/18.
The table below summarises the measures, weighting and targets for the 2018/19 bonus. Please note that the majority of targets are considered commercially sensitive, and consequently they will be disclosed in the 2018/19 annual report on remuneration.
Measure
TargetsThreshold
(25% vesting)Target
(50% vesting)Stretch
(100% vesting)Weighting
(% of award)Underlying operating profit(1) Commercially sensitive 30.0%Customer service in year Service incentive mechanism – qualitative Commercially sensitive 12.0%Service incentive mechanism – quantitative Commercially sensitive 4.0%Maintaining and enhancing services for customers Wholesale outcome delivery incentive (ODI) composite Commercially sensitive 24.0%Time, cost and quality of capital programme (TCQi)(2) 85% 91.5% 98% 20.0%Personal objectives Commercially sensitive 10.0%Total 100%
(1) Underlying operating profit for bonus purposes excludes infrastructure renewals expenditure and property trading.(2) TCQi is an internal measure which measures the extent to which we deliver our capital projects on time, to budget and to the required quality standard. It is expressed as a
percentage, with a higher percentage representing better performance.
101
Gov
erna
nce
Stock Code: UU. unitedutilities.com/corporate
United Utilities Middle Section.indd 101 04/06/2018 13:05:43
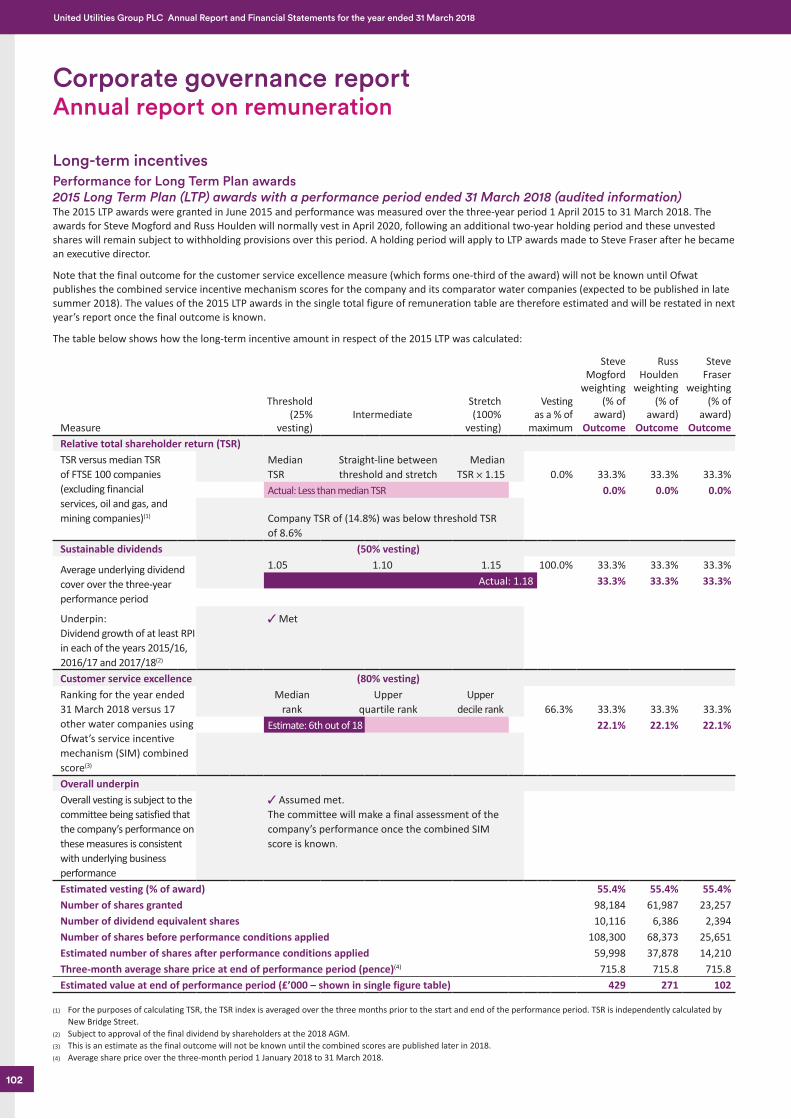
Job Number 4 June 2018 8:56 AM Proof 3 Job Number 4 June 2018 8:56 AM Proof 3
Long-term incentives Performance for Long Term Plan awards2015 Long Term Plan (LTP) awards with a performance period ended 31 March 2018 (audited information) The 2015 LTP awards were granted in June 2015 and performance was measured over the three-year period 1 April 2015 to 31 March 2018. The awards for Steve Mogford and Russ Houlden will normally vest in April 2020, following an additional two-year holding period and these unvested shares will remain subject to withholding provisions over this period. A holding period will apply to LTP awards made to Steve Fraser after he became an executive director.
Note that the final outcome for the customer service excellence measure (which forms one-third of the award) will not be known until Ofwat publishes the combined service incentive mechanism scores for the company and its comparator water companies (expected to be published in late summer 2018). The values of the 2015 LTP awards in the single total figure of remuneration table are therefore estimated and will be restated in next year’s report once the final outcome is known.
The table below shows how the long-term incentive amount in respect of the 2015 LTP was calculated:
Measure
Threshold (25%
vesting)Intermediate
Stretch (100%
vesting)
Vesting as a % of
maximum
Steve Mogford
weighting (% of
award)Outcome
Russ Houlden
weighting (% of
award)Outcome
Steve Fraser
weighting (% of
award)Outcome
Relative total shareholder return (TSR)TSR versus median TSR of FTSE 100 companies (excluding financial services, oil and gas, and mining companies)(1)
Median TSR
Straight-line between threshold and stretch
Median TSR 5 1.15 0.0% 33.3% 33.3% 33.3%
Actual: Less than median TSR 0.0% 0.0% 0.0%
Company TSR of (14.8%) was below threshold TSR of 8.6%
Sustainable dividends (50% vesting)
Average underlying dividend cover over the three-year performance period
1.05 1.10 1.15 100.0% 33.3% 33.3% 33.3%Actual: 1.18 33.3% 33.3% 33.3%
Underpin: Dividend growth of at least RPI in each of the years 2015/16, 2016/17 and 2017/18(2) (2)
✓ Met
Customer service excellence (80% vesting)Ranking for the year ended 31 March 2018 versus 17 other water companies using Ofwat’s service incentive mechanism (SIM) combined score(3)
Median rank
Upper quartile rank
Upper decile rank 66.3% 33.3% 33.3% 33.3%
`` Estimate: 6th out of 18 22.1% 22.1% 22.1%
Overall underpinOverall vesting is subject to the committee being satisfied that the company’s performance on these measures is consistent with underlying business performance
✓ Assumed met. The committee will make a final assessment of the company’s performance once the combined SIM score is known.
Estimated vesting (% of award) 55.4% 55.4% 55.4%Number of shares granted 98,184 61,987 23,257Number of dividend equivalent shares 10,116 6,386 2,394Number of shares before performance conditions applied 108,300 68,373 25,651Estimated number of shares after performance conditions applied 59,998 37,878 14,210Three-month average share price at end of performance period (pence)(4) 715.8 715.8 715.8Estimated value at end of performance period (£’000 – shown in single figure table) 429 271 102
(1) For the purposes of calculating TSR, the TSR index is averaged over the three months prior to the start and end of the performance period. TSR is independently calculated by New Bridge Street.
(2) Subject to approval of the final dividend by shareholders at the 2018 AGM.(3) This is an estimate as the final outcome will not be known until the combined scores are published later in 2018. (4) Average share price over the three-month period 1 January 2018 to 31 March 2018.
Corporate governance reportAnnual report on remuneration
102
United Utilities Group PLC Annual Report and Financial Statements for the year ended 31 March 2018
United Utilities Middle Section.indd 102 04/06/2018 13:05:43
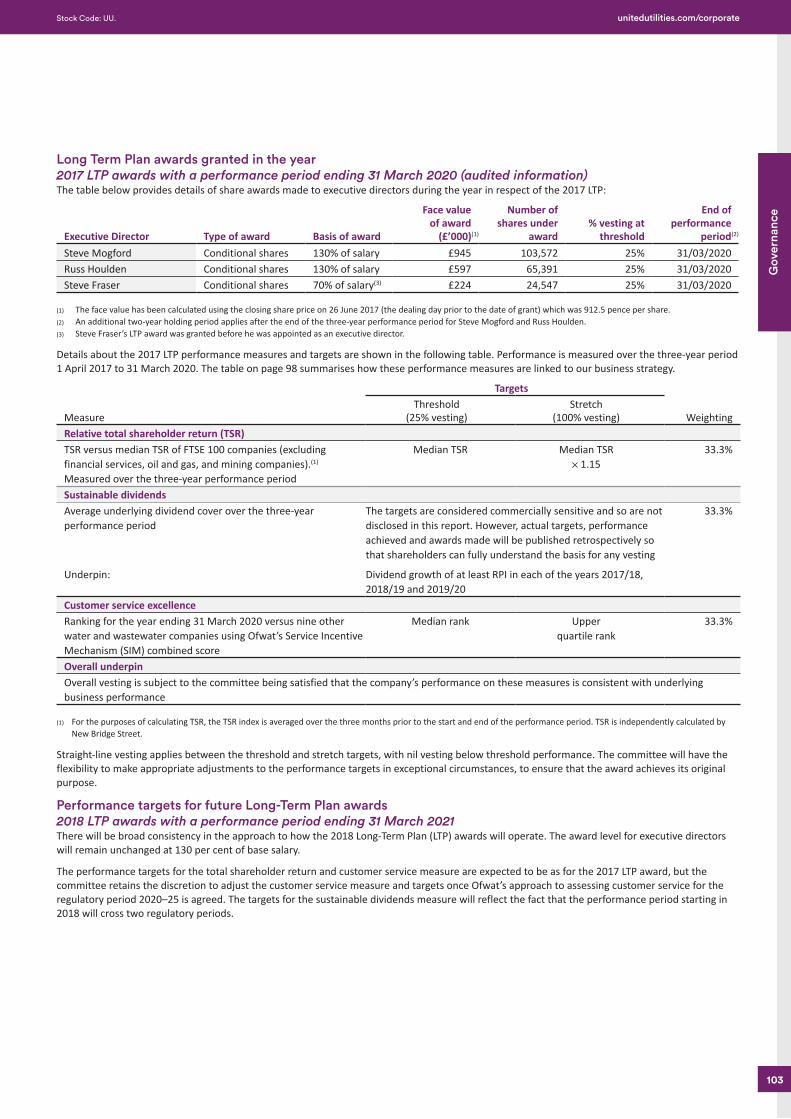
Job Number 4 June 2018 8:56 AM Proof 3 Job Number 4 June 2018 8:56 AM Proof 3
Long Term Plan awards granted in the year2017 LTP awards with a performance period ending 31 March 2020 (audited information) The table below provides details of share awards made to executive directors during the year in respect of the 2017 LTP:
Executive Director Type of award Basis of award
Face value of award
(£’000)(1)
Number of shares under
award% vesting at
threshold
End of performance
period(2)
Steve Mogford Conditional shares 130% of salary £945 103,572 25% 31/03/2020Russ Houlden Conditional shares 130% of salary £597 65,391 25% 31/03/2020Steve Fraser Conditional shares 70% of salary(3) £224 24,547 25% 31/03/2020
(1) The face value has been calculated using the closing share price on 26 June 2017 (the dealing day prior to the date of grant) which was 912.5 pence per share.(2) An additional two-year holding period applies after the end of the three-year performance period for Steve Mogford and Russ Houlden.(3) Steve Fraser’s LTP award was granted before he was appointed as an executive director.
Details about the 2017 LTP performance measures and targets are shown in the following table. Performance is measured over the three-year period 1 April 2017 to 31 March 2020. The table on page 98 summarises how these performance measures are linked to our business strategy.
Measure
Targets
WeightingThreshold
(25% vesting)Stretch
(100% vesting)Relative total shareholder return (TSR)TSR versus median TSR of FTSE 100 companies (excluding financial services, oil and gas, and mining companies).(1) Measured over the three-year performance period
Median TSR Median TSR 5 1.15
33.3%
Sustainable dividendsAverage underlying dividend cover over the three-year performance period
The targets are considered commercially sensitive and so are not disclosed in this report. However, actual targets, performance achieved and awards made will be published retrospectively so that shareholders can fully understand the basis for any vesting
33.3%
Underpin: Dividend growth of at least RPI in each of the years 2017/18, 2018/19 and 2019/20
Customer service excellenceRanking for the year ending 31 March 2020 versus nine other water and wastewater companies using Ofwat’s Service Incentive Mechanism (SIM) combined score
Median rank Upper quartile rank
33.3%
Overall underpinOverall vesting is subject to the committee being satisfied that the company’s performance on these measures is consistent with underlying business performance
(1) For the purposes of calculating TSR, the TSR index is averaged over the three months prior to the start and end of the performance period. TSR is independently calculated by New Bridge Street.
Straight-line vesting applies between the threshold and stretch targets, with nil vesting below threshold performance. The committee will have the flexibility to make appropriate adjustments to the performance targets in exceptional circumstances, to ensure that the award achieves its original purpose.
Performance targets for future Long-Term Plan awards 2018 LTP awards with a performance period ending 31 March 2021 There will be broad consistency in the approach to how the 2018 Long-Term Plan (LTP) awards will operate. The award level for executive directors will remain unchanged at 130 per cent of base salary.
The performance targets for the total shareholder return and customer service measure are expected to be as for the 2017 LTP award, but the committee retains the discretion to adjust the customer service measure and targets once Ofwat’s approach to assessing customer service for the regulatory period 2020–25 is agreed. The targets for the sustainable dividends measure will reflect the fact that the performance period starting in 2018 will cross two regulatory periods.
103
Gov
erna
nce
Stock Code: UU. unitedutilities.com/corporate
United Utilities Middle Section.indd 103 04/06/2018 13:05:43
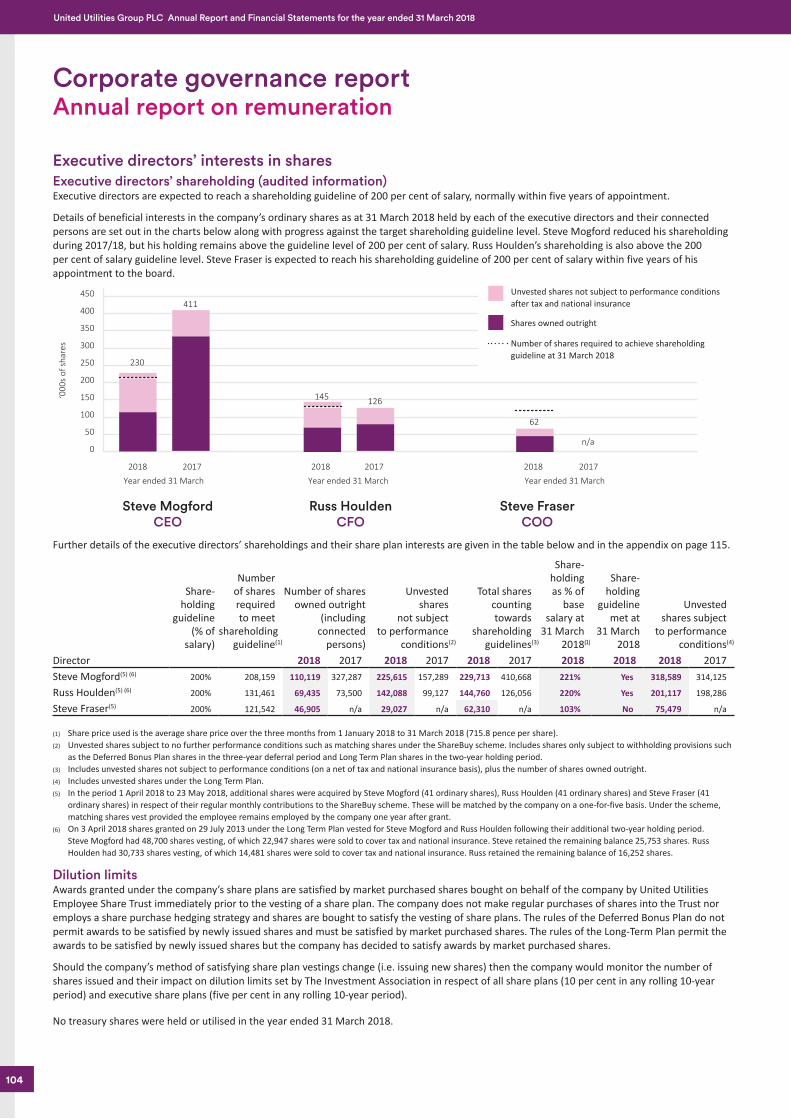
Job Number 4 June 2018 8:56 AM Proof 3 Job Number 4 June 2018 8:56 AM Proof 3
Executive directors’ interests in shares Executive directors’ shareholding (audited information)Executive directors are expected to reach a shareholding guideline of 200 per cent of salary, normally within five years of appointment.
Details of beneficial interests in the company’s ordinary shares as at 31 March 2018 held by each of the executive directors and their connected persons are set out in the charts below along with progress against the target shareholding guideline level. Steve Mogford reduced his shareholding during 2017/18, but his holding remains above the guideline level of 200 per cent of salary. Russ Houlden’s shareholding is also above the 200 per cent of salary guideline level. Steve Fraser is expected to reach his shareholding guideline of 200 per cent of salary within five years of his appointment to the board.
Further details of the executive directors’ shareholdings and their share plan interests are given in the table below and in the appendix on page 115.
Director
Share-holding
guideline(% of
salary)
Numberof sharesrequiredto meet
shareholdingguideline(1)
Number of shares owned outright
(includingconnected
persons)
Unvested shares
not subject to performance
conditions(2)
Total shares counting towards
shareholding guidelines(3)
Share-holding as % of
base salary at
31 March2018(1)
Share-holding
guideline met at
31 March 2018
Unvested shares subject
to performance conditions(4)
2018 2017 2018 2017 2018 2017 2018 2018 2018 2017Steve Mogford(5) (6) 200% 208,159 110,119 327,287 225,615 157,289 229,713 410,668 221% Yes 318,589 314,125
Russ Houlden(5) (6) 200% 131,461 69,435 73,500 142,088 99,127 144,760 126,056 220% Yes 201,117 198,286
Steve Fraser(5) 200% 121,542 46,905 n/a 29,027 n/a 62,310 n/a 103% No 75,479 n/a
(1) Share price used is the average share price over the three months from 1 January 2018 to 31 March 2018 (715.8 pence per share).(2) Unvested shares subject to no further performance conditions such as matching shares under the ShareBuy scheme. Includes shares only subject to withholding provisions such
as the Deferred Bonus Plan shares in the three-year deferral period and Long Term Plan shares in the two-year holding period.(3) Includes unvested shares not subject to performance conditions (on a net of tax and national insurance basis), plus the number of shares owned outright.(4) Includes unvested shares under the Long Term Plan.(5) In the period 1 April 2018 to 23 May 2018, additional shares were acquired by Steve Mogford (41 ordinary shares), Russ Houlden (41 ordinary shares) and Steve Fraser (41
ordinary shares) in respect of their regular monthly contributions to the ShareBuy scheme. These will be matched by the company on a one-for-five basis. Under the scheme, matching shares vest provided the employee remains employed by the company one year after grant.
(6) On 3 April 2018 shares granted on 29 July 2013 under the Long Term Plan vested for Steve Mogford and Russ Houlden following their additional two-year holding period. Steve Mogford had 48,700 shares vesting, of which 22,947 shares were sold to cover tax and national insurance. Steve retained the remaining balance 25,753 shares. Russ Houlden had 30,733 shares vesting, of which 14,481 shares were sold to cover tax and national insurance. Russ retained the remaining balance of 16,252 shares.
Dilution limits Awards granted under the company’s share plans are satisfied by market purchased shares bought on behalf of the company by United Utilities Employee Share Trust immediately prior to the vesting of a share plan. The company does not make regular purchases of shares into the Trust nor employs a share purchase hedging strategy and shares are bought to satisfy the vesting of share plans. The rules of the Deferred Bonus Plan do not permit awards to be satisfied by newly issued shares and must be satisfied by market purchased shares. The rules of the Long-Term Plan permit the awards to be satisfied by newly issued shares but the company has decided to satisfy awards by market purchased shares.
Should the company’s method of satisfying share plan vestings change (i.e. issuing new shares) then the company would monitor the number of shares issued and their impact on dilution limits set by The Investment Association in respect of all share plans (10 per cent in any rolling 10-year period) and executive share plans (five per cent in any rolling 10-year period).
No treasury shares were held or utilised in the year ended 31 March 2018.
450
400
350
300
250
200
150
100
50
0
‘000
s of
sha
res
Year ended 31 March2017
411
2018
Year ended 31 March2018
126
2017Year ended 31 March2018 2017
230
145
62
n/a
Steve MogfordCEO
Steve FraserCOO
Russ HouldenCFO
Unvested shares not subject to performance conditions after tax and national insurance
Shares owned outright
Number of shares required to achieve shareholding guideline at 31 March 2018
Corporate governance reportAnnual report on remuneration
104
United Utilities Group PLC Annual Report and Financial Statements for the year ended 31 March 2018
United Utilities Middle Section.indd 104 04/06/2018 13:05:44
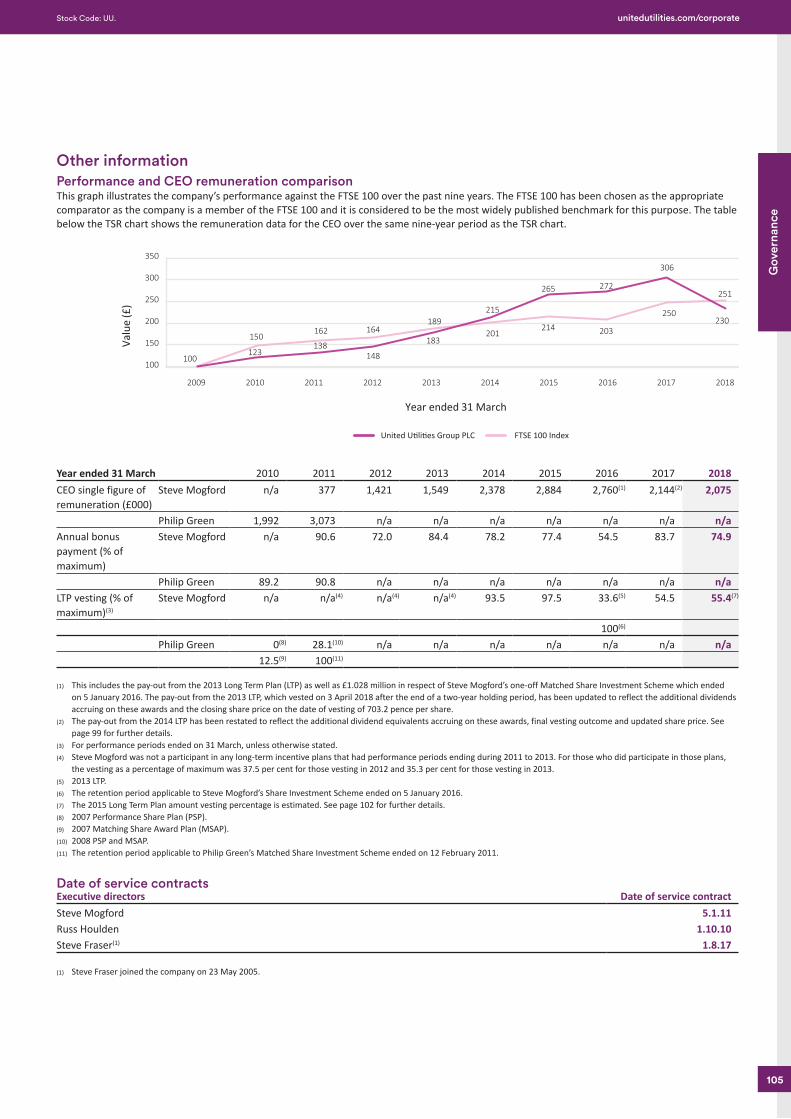
Job Number 4 June 2018 8:56 AM Proof 3 Job Number 4 June 2018 8:56 AM Proof 3
Other information Performance and CEO remuneration comparisonThis graph illustrates the company’s performance against the FTSE 100 over the past nine years. The FTSE 100 has been chosen as the appropriate comparator as the company is a member of the FTSE 100 and it is considered to be the most widely published benchmark for this purpose. The table below the TSR chart shows the remuneration data for the CEO over the same nine-year period as the TSR chart.
100
150
200
250
300
350
2009 2010 2011 2012 2013 2014 2015 2016 20182017
100
Valu
e (£
)
Year ended 31 March
United U�li�es Group PLC FTSE 100 Index
123138
148
183
215
265 272
306
150162 164
189201
214 203
250
251
230
Year ended 31 March 2010 2011 2012 2013 2014 2015 2016 2017 2018CEO single figure of remuneration (£000)
Steve Mogford n/a 377 1,421 1,549 2,378 2,884 2,760(1) 2,144(2) 2,075
Philip Green 1,992 3,073 n/a n/a n/a n/a n/a n/a n/aAnnual bonus payment (% of maximum)
Steve Mogford n/a 90.6 72.0 84.4 78.2 77.4 54.5 83.7 74.9
Philip Green 89.2 90.8 n/a n/a n/a n/a n/a n/a n/aLTP vesting (% of maximum)(3)
Steve Mogford n/a n/a(4) n/a(4) n/a(4) 93.5 97.5 33.6(5) 54.5 55.4(7)
100(6)
Philip Green 0(8) 28.1(10) n/a n/a n/a n/a n/a n/a n/a12.5(9) 100(11)
(1) This includes the pay-out from the 2013 Long Term Plan (LTP) as well as £1.028 million in respect of Steve Mogford’s one-off Matched Share Investment Scheme which ended on 5 January 2016. The pay-out from the 2013 LTP, which vested on 3 April 2018 after the end of a two-year holding period, has been updated to reflect the additional dividends accruing on these awards and the closing share price on the date of vesting of 703.2 pence per share.
(2) The pay-out from the 2014 LTP has been restated to reflect the additional dividend equivalents accruing on these awards, final vesting outcome and updated share price. See page 99 for further details.
(3) For performance periods ended on 31 March, unless otherwise stated.(4) Steve Mogford was not a participant in any long-term incentive plans that had performance periods ending during 2011 to 2013. For those who did participate in those plans,
the vesting as a percentage of maximum was 37.5 per cent for those vesting in 2012 and 35.3 per cent for those vesting in 2013.(5) 2013 LTP.(6) The retention period applicable to Steve Mogford’s Share Investment Scheme ended on 5 January 2016.(7) The 2015 Long Term Plan amount vesting percentage is estimated. See page 102 for further details.(8) 2007 Performance Share Plan (PSP).(9) 2007 Matching Share Award Plan (MSAP).(10) 2008 PSP and MSAP.(11) The retention period applicable to Philip Green’s Matched Share Investment Scheme ended on 12 February 2011.
Date of service contracts Executive directors Date of service contractSteve Mogford 5.1.11Russ Houlden 1.10.10Steve Fraser(1) 1.8.17
(1) Steve Fraser joined the company on 23 May 2005.
105
Gov
erna
nce
Stock Code: UU. unitedutilities.com/corporate
United Utilities Middle Section.indd 105 04/06/2018 13:05:44
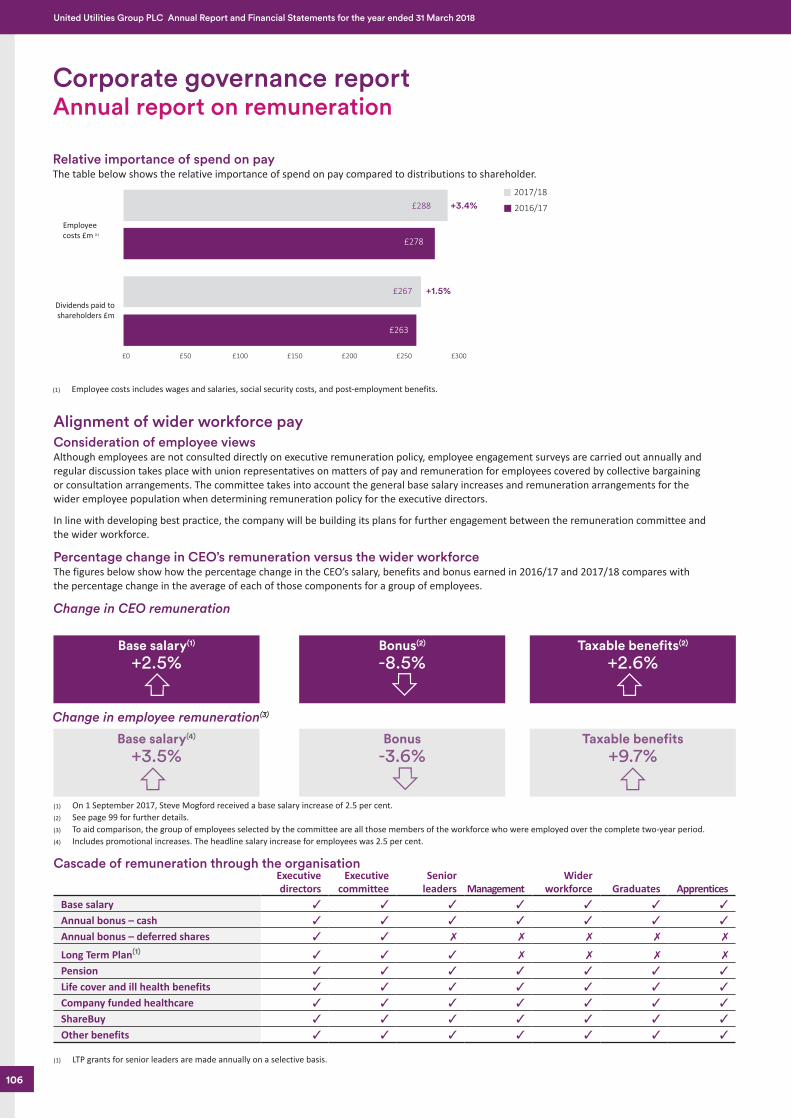
Job Number 4 June 2018 8:56 AM Proof 3 Job Number 4 June 2018 8:56 AM Proof 3
Relative importance of spend on pay The table below shows the relative importance of spend on pay compared to distributions to shareholder.
Employee costs £m (1)
Dividends paid to shareholders £m
+1.5%
£0 £50 £100 £150 £200 £250 £300
+3.4%2017/18
2016/17£288
£278
£263
£267
(1) Employee costs includes wages and salaries, social security costs, and post-employment benefits.
Alignment of wider workforce payConsideration of employee viewsAlthough employees are not consulted directly on executive remuneration policy, employee engagement surveys are carried out annually and regular discussion takes place with union representatives on matters of pay and remuneration for employees covered by collective bargaining or consultation arrangements. The committee takes into account the general base salary increases and remuneration arrangements for the wider employee population when determining remuneration policy for the executive directors.
In line with developing best practice, the company will be building its plans for further engagement between the remuneration committee and the wider workforce.
Percentage change in CEO’s remuneration versus the wider workforce The figures below show how the percentage change in the CEO’s salary, benefits and bonus earned in 2016/17 and 2017/18 compares with the percentage change in the average of each of those components for a group of employees.
Change in CEO remuneration
Change in employee remuneration(3)
(1) On 1 September 2017, Steve Mogford received a base salary increase of 2.5 per cent. (2) See page 99 for further details.(3) To aid comparison, the group of employees selected by the committee are all those members of the workforce who were employed over the complete two-year period.(4) Includes promotional increases. The headline salary increase for employees was 2.5 per cent.
Cascade of remuneration through the organisationExecutive directors
Executive committee
Senior leaders Management
Wider workforce Graduates Apprentices
Base salary ✓ ✓ ✓ ✓ ✓ ✓ ✓
Annual bonus – cash ✓ ✓ ✓ ✓ ✓ ✓ ✓
Annual bonus – deferred shares ✓ ✓ ✗ ✗ ✗ ✗ ✗
Long Term Plan(1) ✓ ✓ ✓ ✗ ✗ ✗ ✗
Pension ✓ ✓ ✓ ✓ ✓ ✓ ✓
Life cover and ill health benefits ✓ ✓ ✓ ✓ ✓ ✓ ✓
Company funded healthcare ✓ ✓ ✓ ✓ ✓ ✓ ✓
ShareBuy ✓ ✓ ✓ ✓ ✓ ✓ ✓
Other benefits ✓ ✓ ✓ ✓ ✓ ✓ ✓
(1) LTP grants for senior leaders are made annually on a selective basis.
Base salary(1)
+2.5%Bonus(2)
-8.5%Taxable benefits(2)
+2.6%
Base salary(4)
+3.5%Bonus
-3.6%Taxable benefits
+9.7%
Corporate governance reportAnnual report on remuneration
106
United Utilities Group PLC Annual Report and Financial Statements for the year ended 31 March 2018
United Utilities Middle Section.indd 106 04/06/2018 13:05:44
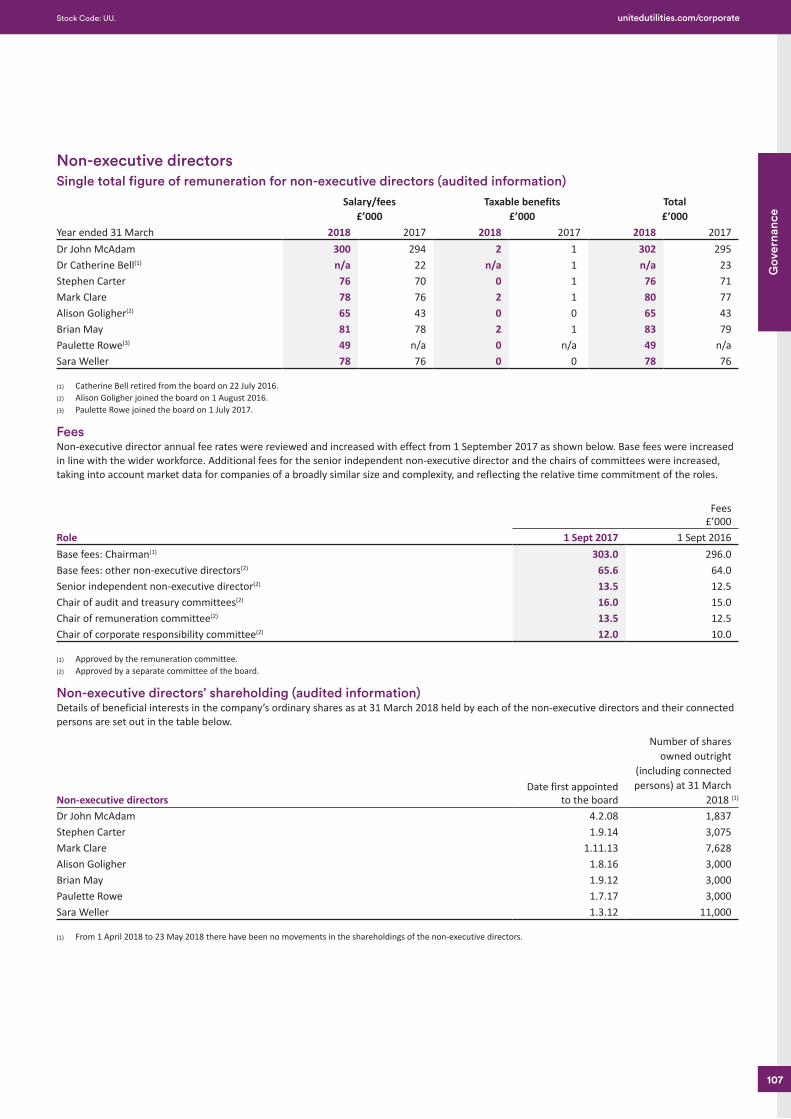
Job Number 4 June 2018 8:56 AM Proof 3 Job Number 4 June 2018 8:56 AM Proof 3
Non-executive directorsSingle total figure of remuneration for non-executive directors (audited information)
Year ended 31 March
Salary/fees £’000
Taxable benefits £’000
Total £’000
2018 2017 2018 2017 2018 2017Dr John McAdam 300 294 2 1 302 295 Dr Catherine Bell(1) n/a 22 n/a 1 n/a 23 Stephen Carter 76 70 0 1 76 71 Mark Clare 78 76 2 1 80 77 Alison Goligher(2) 65 43 0 0 65 43 Brian May 81 78 2 1 83 79 Paulette Rowe(3) 49 n/a 0 n/a 49 n/a Sara Weller 78 76 0 0 78 76
(1) Catherine Bell retired from the board on 22 July 2016.(2) Alison Goligher joined the board on 1 August 2016.(3) Paulette Rowe joined the board on 1 July 2017.
Fees Non-executive director annual fee rates were reviewed and increased with effect from 1 September 2017 as shown below. Base fees were increased in line with the wider workforce. Additional fees for the senior independent non-executive director and the chairs of committees were increased, taking into account market data for companies of a broadly similar size and complexity, and reflecting the relative time commitment of the roles.
Role
Fees£’000
1 Sept 2017 1 Sept 2016Base fees: Chairman(1) 303.0 296.0Base fees: other non-executive directors(2) 65.6 64.0Senior independent non-executive director(2) 13.5 12.5Chair of audit and treasury committees(2) 16.0 15.0Chair of remuneration committee(2) 13.5 12.5Chair of corporate responsibility committee(2) 12.0 10.0
(1) Approved by the remuneration committee.(2) Approved by a separate committee of the board.
Non-executive directors’ shareholding (audited information)Details of beneficial interests in the company’s ordinary shares as at 31 March 2018 held by each of the non-executive directors and their connected persons are set out in the table below.
Non-executive directorsDate first appointed
to the board
Number of sharesowned outright
(including connectedpersons) at 31 March
2018 (1)
Dr John McAdam 4.2.08 1,837Stephen Carter 1.9.14 3,075Mark Clare 1.11.13 7,628Alison Goligher 1.8.16 3,000Brian May 1.9.12 3,000Paulette Rowe 1.7.17 3,000Sara Weller 1.3.12 11,000
(1) From 1 April 2018 to 23 May 2018 there have been no movements in the shareholdings of the non-executive directors.
107
Gov
erna
nce
Stock Code: UU. unitedutilities.com/corporate
United Utilities Middle Section.indd 107 04/06/2018 13:05:45
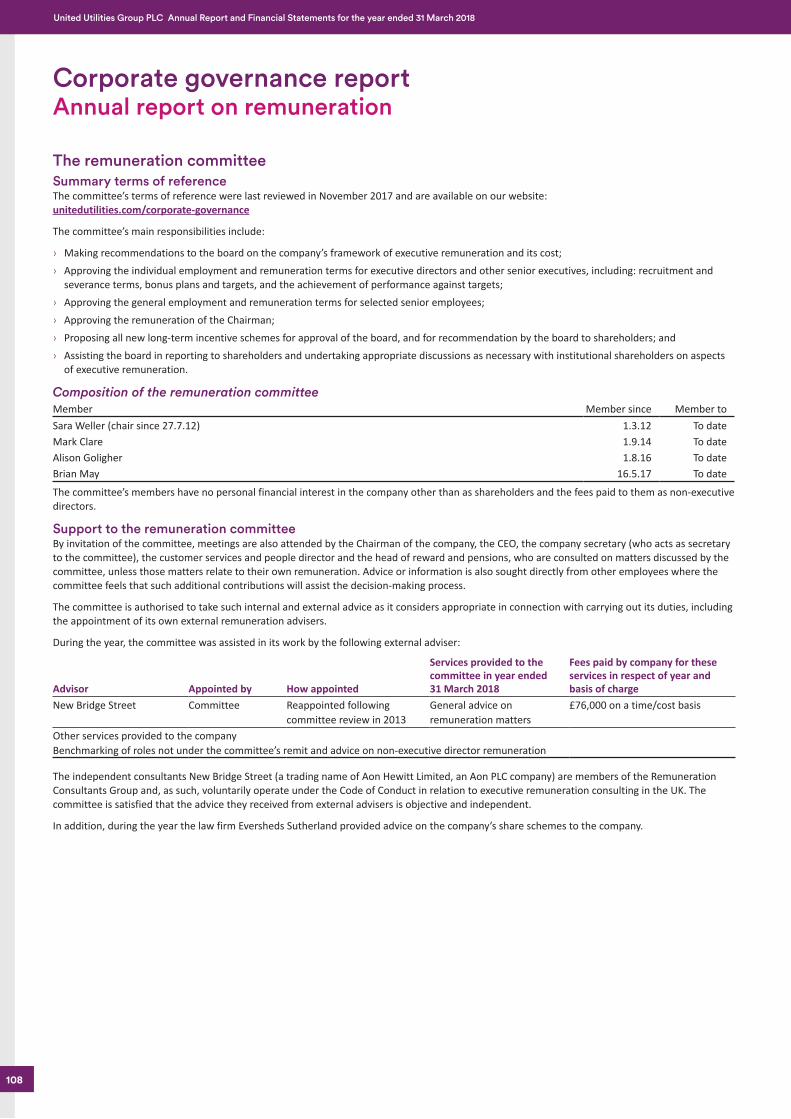
Job Number 4 June 2018 8:56 AM Proof 3 Job Number 4 June 2018 8:56 AM Proof 3
The remuneration committee Summary terms of referenceThe committee’s terms of reference were last reviewed in November 2017 and are available on our website: unitedutilities.com/corporate-governance
The committee’s main responsibilities include:
› Making recommendations to the board on the company’s framework of executive remuneration and its cost; › Approving the individual employment and remuneration terms for executive directors and other senior executives, including: recruitment and
severance terms, bonus plans and targets, and the achievement of performance against targets; › Approving the general employment and remuneration terms for selected senior employees; › Approving the remuneration of the Chairman; › Proposing all new long-term incentive schemes for approval of the board, and for recommendation by the board to shareholders; and › Assisting the board in reporting to shareholders and undertaking appropriate discussions as necessary with institutional shareholders on aspects
of executive remuneration.
Composition of the remuneration committeeMember Member since Member toSara Weller (chair since 27.7.12) 1.3.12 To dateMark Clare 1.9.14 To dateAlison Goligher 1.8.16 To dateBrian May 16.5.17 To date
The committee’s members have no personal financial interest in the company other than as shareholders and the fees paid to them as non-executive directors.
Support to the remuneration committeeBy invitation of the committee, meetings are also attended by the Chairman of the company, the CEO, the company secretary (who acts as secretary to the committee), the customer services and people director and the head of reward and pensions, who are consulted on matters discussed by the committee, unless those matters relate to their own remuneration. Advice or information is also sought directly from other employees where the committee feels that such additional contributions will assist the decision-making process.
The committee is authorised to take such internal and external advice as it considers appropriate in connection with carrying out its duties, including the appointment of its own external remuneration advisers.
During the year, the committee was assisted in its work by the following external adviser:
Advisor Appointed by How appointed
Services provided to the committee in year ended 31 March 2018
Fees paid by company for these services in respect of year and basis of charge
New Bridge Street Committee Reappointed following committee review in 2013
General advice on remuneration matters
£76,000 on a time/cost basis
Other services provided to the companyBenchmarking of roles not under the committee’s remit and advice on non-executive director remuneration
The independent consultants New Bridge Street (a trading name of Aon Hewitt Limited, an Aon PLC company) are members of the Remuneration Consultants Group and, as such, voluntarily operate under the Code of Conduct in relation to executive remuneration consulting in the UK. The committee is satisfied that the advice they received from external advisers is objective and independent.
In addition, during the year the law firm Eversheds Sutherland provided advice on the company’s share schemes to the company.
Corporate governance reportAnnual report on remuneration
108
United Utilities Group PLC Annual Report and Financial Statements for the year ended 31 March 2018
United Utilities Middle Section.indd 108 04/06/2018 13:05:45
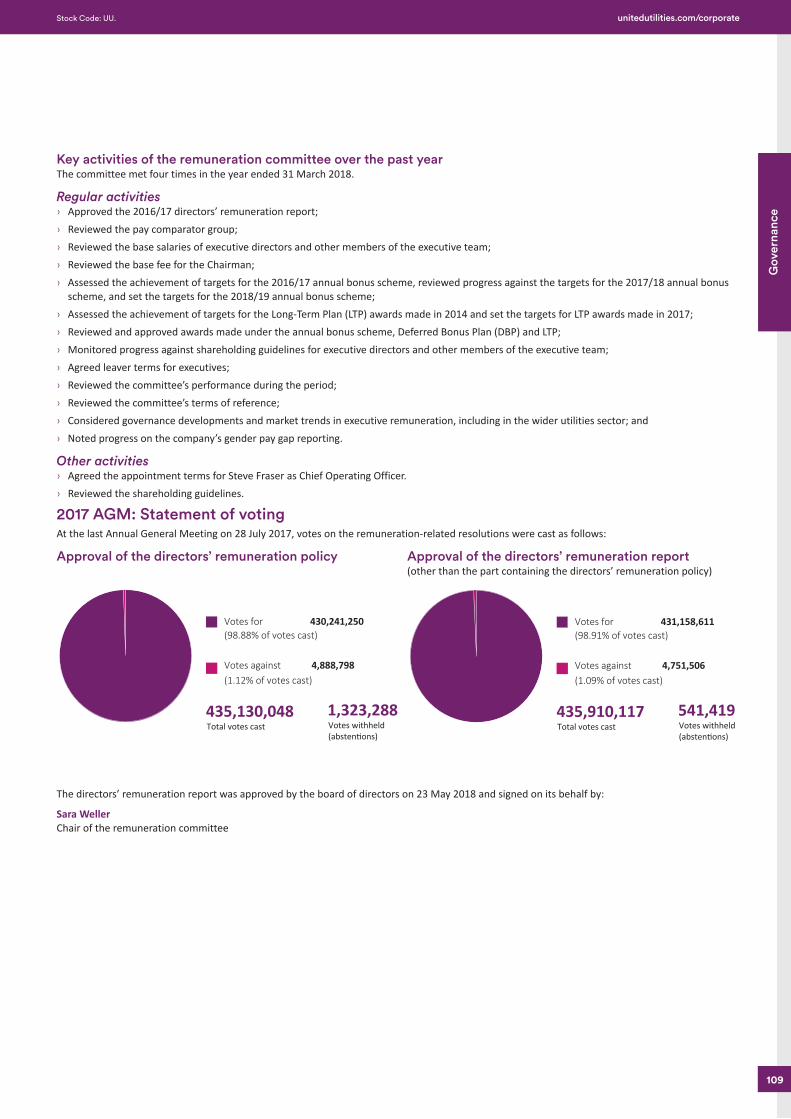
Job Number 4 June 2018 8:56 AM Proof 3 Job Number 4 June 2018 8:56 AM Proof 3
Key activities of the remuneration committee over the past yearThe committee met four times in the year ended 31 March 2018.
Regular activities › Approved the 2016/17 directors’ remuneration report; › Reviewed the pay comparator group; › Reviewed the base salaries of executive directors and other members of the executive team; › Reviewed the base fee for the Chairman; › Assessed the achievement of targets for the 2016/17 annual bonus scheme, reviewed progress against the targets for the 2017/18 annual bonus
scheme, and set the targets for the 2018/19 annual bonus scheme; › Assessed the achievement of targets for the Long-Term Plan (LTP) awards made in 2014 and set the targets for LTP awards made in 2017; › Reviewed and approved awards made under the annual bonus scheme, Deferred Bonus Plan (DBP) and LTP; › Monitored progress against shareholding guidelines for executive directors and other members of the executive team; › Agreed leaver terms for executives; › Reviewed the committee’s performance during the period; › Reviewed the committee’s terms of reference; › Considered governance developments and market trends in executive remuneration, including in the wider utilities sector; and › Noted progress on the company’s gender pay gap reporting.
Other activities › Agreed the appointment terms for Steve Fraser as Chief Operating Officer. › Reviewed the shareholding guidelines.
2017 AGM: Statement of votingAt the last Annual General Meeting on 28 July 2017, votes on the remuneration-related resolutions were cast as follows:
Approval of the directors’ remuneration policy Approval of the directors’ remuneration report (other than the part containing the directors’ remuneration policy)
Votes for 431,158,611
Votes against 4,751,506
(98.91% of votes cast)
(1.09% of votes cast)
435,910,117 Total votes cast
541,419Votes withheld(absten�ons)
Votes for 430,241,250
Votes against 4,888,798
(98.88% of votes cast)
(1.12% of votes cast)
435,130,048 Total votes cast
1,323,288Votes withheld(absten�ons)
The directors’ remuneration report was approved by the board of directors on 23 May 2018 and signed on its behalf by:
Sara Weller Chair of the remuneration committee
109
Gov
erna
nce
Stock Code: UU. unitedutilities.com/corporate
United Utilities Middle Section.indd 109 04/06/2018 13:05:45
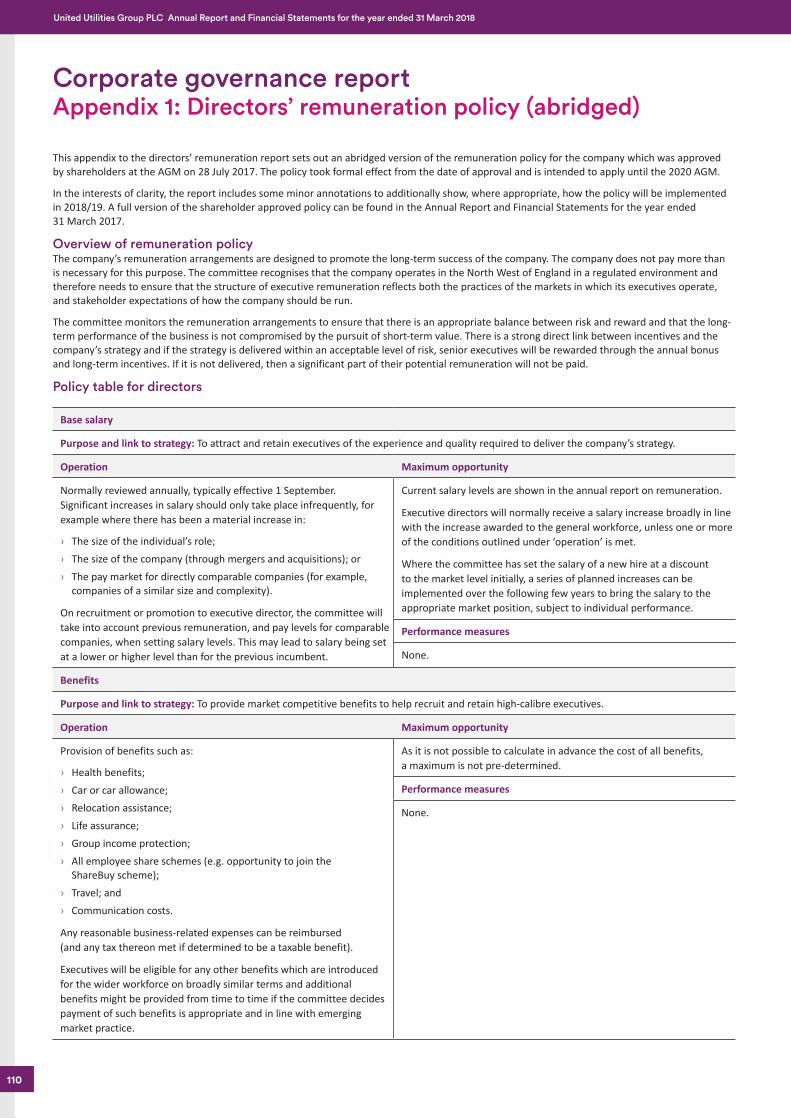
Job Number 4 June 2018 8:56 AM Proof 3 Job Number 4 June 2018 8:56 AM Proof 3
This appendix to the directors’ remuneration report sets out an abridged version of the remuneration policy for the company which was approved by shareholders at the AGM on 28 July 2017. The policy took formal effect from the date of approval and is intended to apply until the 2020 AGM.
In the interests of clarity, the report includes some minor annotations to additionally show, where appropriate, how the policy will be implemented in 2018/19. A full version of the shareholder approved policy can be found in the Annual Report and Financial Statements for the year ended 31 March 2017.
Overview of remuneration policyThe company’s remuneration arrangements are designed to promote the long-term success of the company. The company does not pay more than is necessary for this purpose. The committee recognises that the company operates in the North West of England in a regulated environment and therefore needs to ensure that the structure of executive remuneration reflects both the practices of the markets in which its executives operate, and stakeholder expectations of how the company should be run.
The committee monitors the remuneration arrangements to ensure that there is an appropriate balance between risk and reward and that the long-term performance of the business is not compromised by the pursuit of short-term value. There is a strong direct link between incentives and the company’s strategy and if the strategy is delivered within an acceptable level of risk, senior executives will be rewarded through the annual bonus and long-term incentives. If it is not delivered, then a significant part of their potential remuneration will not be paid.
Policy table for directors
Base salary
Purpose and link to strategy: To attract and retain executives of the experience and quality required to deliver the company’s strategy.
Operation Maximum opportunity
Normally reviewed annually, typically effective 1 September.Significant increases in salary should only take place infrequently, for example where there has been a material increase in:
› The size of the individual’s role; › The size of the company (through mergers and acquisitions); or › The pay market for directly comparable companies (for example,
companies of a similar size and complexity).
On recruitment or promotion to executive director, the committee will take into account previous remuneration, and pay levels for comparable companies, when setting salary levels. This may lead to salary being set at a lower or higher level than for the previous incumbent.
Current salary levels are shown in the annual report on remuneration.
Executive directors will normally receive a salary increase broadly in line with the increase awarded to the general workforce, unless one or more of the conditions outlined under ‘operation’ is met.
Where the committee has set the salary of a new hire at a discount to the market level initially, a series of planned increases can be implemented over the following few years to bring the salary to the appropriate market position, subject to individual performance.
Performance measures
None.
Benefits
Purpose and link to strategy: To provide market competitive benefits to help recruit and retain high-calibre executives.
Operation Maximum opportunity
Provision of benefits such as:
› Health benefits; › Car or car allowance; › Relocation assistance; › Life assurance; › Group income protection; › All employee share schemes (e.g. opportunity to join the
ShareBuy scheme); › Travel; and › Communication costs.
Any reasonable business-related expenses can be reimbursed (and any tax thereon met if determined to be a taxable benefit).
Executives will be eligible for any other benefits which are introduced for the wider workforce on broadly similar terms and additional benefits might be provided from time to time if the committee decides payment of such benefits is appropriate and in line with emerging market practice.
As it is not possible to calculate in advance the cost of all benefits, a maximum is not pre-determined.
Performance measures
None.
Corporate governance reportAppendix 1: Directors’ remuneration policy (abridged)
110
United Utilities Group PLC Annual Report and Financial Statements for the year ended 31 March 2018
United Utilities Middle Section.indd 110 04/06/2018 13:05:45
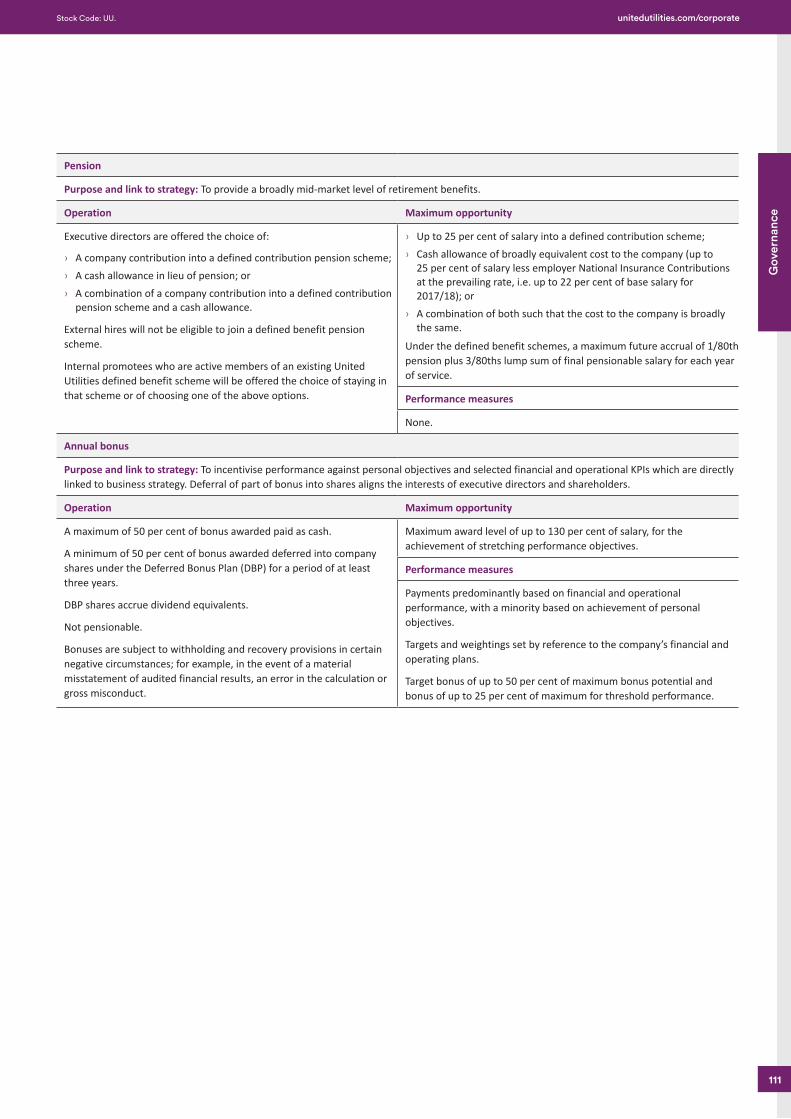
Job Number 4 June 2018 8:56 AM Proof 3 Job Number 4 June 2018 8:56 AM Proof 3
Pension
Purpose and link to strategy: To provide a broadly mid-market level of retirement benefits.
Operation Maximum opportunity
Executive directors are offered the choice of:
› A company contribution into a defined contribution pension scheme; › A cash allowance in lieu of pension; or › A combination of a company contribution into a defined contribution
pension scheme and a cash allowance.
External hires will not be eligible to join a defined benefit pension scheme.
Internal promotees who are active members of an existing United Utilities defined benefit scheme will be offered the choice of staying in that scheme or of choosing one of the above options.
› Up to 25 per cent of salary into a defined contribution scheme; › Cash allowance of broadly equivalent cost to the company (up to
25 per cent of salary less employer National Insurance Contributions at the prevailing rate, i.e. up to 22 per cent of base salary for 2017/18); or
› A combination of both such that the cost to the company is broadly the same.
Under the defined benefit schemes, a maximum future accrual of 1/80th pension plus 3/80ths lump sum of final pensionable salary for each year of service.
Performance measures
None.
Annual bonus
Purpose and link to strategy: To incentivise performance against personal objectives and selected financial and operational KPIs which are directly linked to business strategy. Deferral of part of bonus into shares aligns the interests of executive directors and shareholders.
Operation Maximum opportunity
A maximum of 50 per cent of bonus awarded paid as cash.
A minimum of 50 per cent of bonus awarded deferred into company shares under the Deferred Bonus Plan (DBP) for a period of at least three years.
DBP shares accrue dividend equivalents.
Not pensionable.
Bonuses are subject to withholding and recovery provisions in certain negative circumstances; for example, in the event of a material misstatement of audited financial results, an error in the calculation or gross misconduct.
Maximum award level of up to 130 per cent of salary, for the achievement of stretching performance objectives.
Performance measures
Payments predominantly based on financial and operational performance, with a minority based on achievement of personal objectives.
Targets and weightings set by reference to the company’s financial and operating plans.
Target bonus of up to 50 per cent of maximum bonus potential and bonus of up to 25 per cent of maximum for threshold performance.
111
Gov
erna
nce
Stock Code: UU. unitedutilities.com/corporate
United Utilities Middle Section.indd 111 04/06/2018 13:05:45
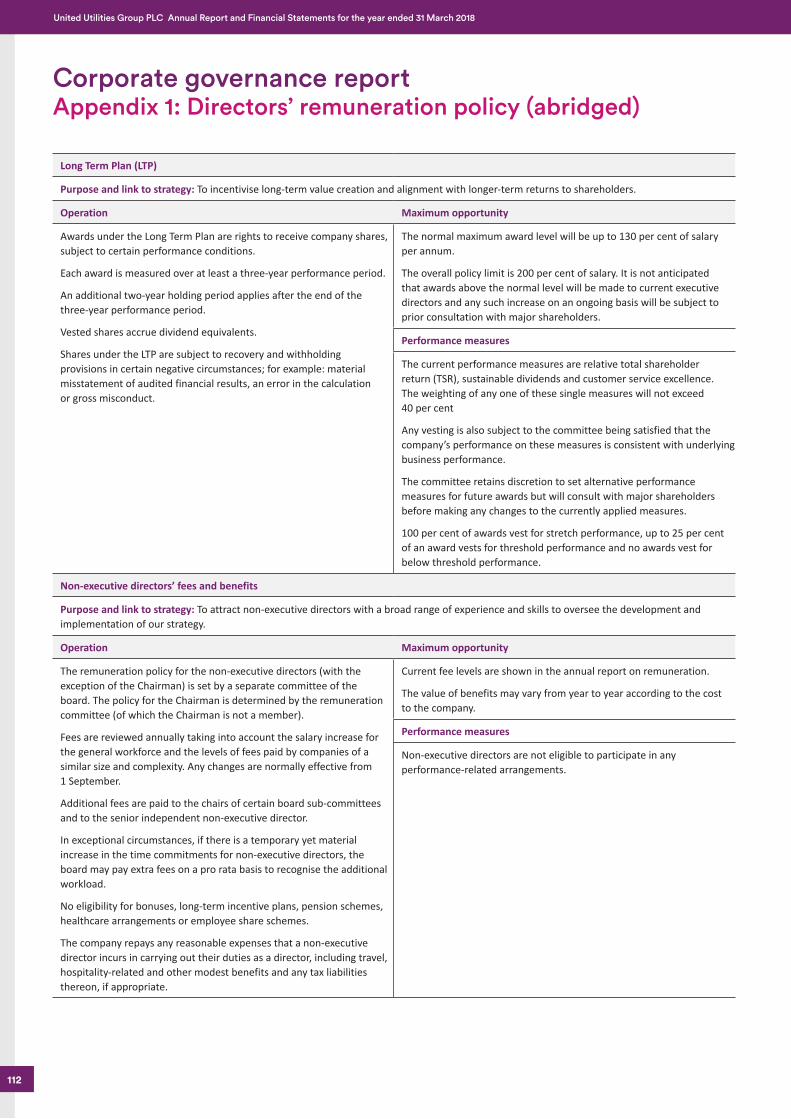
Job Number 4 June 2018 8:56 AM Proof 3 Job Number 4 June 2018 8:56 AM Proof 3
Long Term Plan (LTP)
Purpose and link to strategy: To incentivise long-term value creation and alignment with longer-term returns to shareholders.
Operation Maximum opportunity
Awards under the Long Term Plan are rights to receive company shares, subject to certain performance conditions.
Each award is measured over at least a three-year performance period.
An additional two-year holding period applies after the end of the three-year performance period.
Vested shares accrue dividend equivalents.
Shares under the LTP are subject to recovery and withholding provisions in certain negative circumstances; for example: material misstatement of audited financial results, an error in the calculation or gross misconduct.
The normal maximum award level will be up to 130 per cent of salary per annum.
The overall policy limit is 200 per cent of salary. It is not anticipated that awards above the normal level will be made to current executive directors and any such increase on an ongoing basis will be subject to prior consultation with major shareholders.
Performance measures
The current performance measures are relative total shareholder return (TSR), sustainable dividends and customer service excellence. The weighting of any one of these single measures will not exceed 40 per cent
Any vesting is also subject to the committee being satisfied that the company’s performance on these measures is consistent with underlying business performance.
The committee retains discretion to set alternative performance measures for future awards but will consult with major shareholders before making any changes to the currently applied measures.
100 per cent of awards vest for stretch performance, up to 25 per cent of an award vests for threshold performance and no awards vest for below threshold performance.
Non-executive directors’ fees and benefits
Purpose and link to strategy: To attract non-executive directors with a broad range of experience and skills to oversee the development and implementation of our strategy.
Operation Maximum opportunity
The remuneration policy for the non-executive directors (with the exception of the Chairman) is set by a separate committee of the board. The policy for the Chairman is determined by the remuneration committee (of which the Chairman is not a member).
Fees are reviewed annually taking into account the salary increase for the general workforce and the levels of fees paid by companies of a similar size and complexity. Any changes are normally effective from 1 September.
Additional fees are paid to the chairs of certain board sub-committees and to the senior independent non-executive director.
In exceptional circumstances, if there is a temporary yet material increase in the time commitments for non-executive directors, the board may pay extra fees on a pro rata basis to recognise the additional workload.
No eligibility for bonuses, long-term incentive plans, pension schemes, healthcare arrangements or employee share schemes.
The company repays any reasonable expenses that a non-executive director incurs in carrying out their duties as a director, including travel, hospitality-related and other modest benefits and any tax liabilities thereon, if appropriate.
Current fee levels are shown in the annual report on remuneration.
The value of benefits may vary from year to year according to the cost to the company.
Performance measures
Non-executive directors are not eligible to participate in any performance-related arrangements.
Corporate governance reportAppendix 1: Directors’ remuneration policy (abridged)
112
United Utilities Group PLC Annual Report and Financial Statements for the year ended 31 March 2018
United Utilities Middle Section.indd 112 04/06/2018 13:05:45
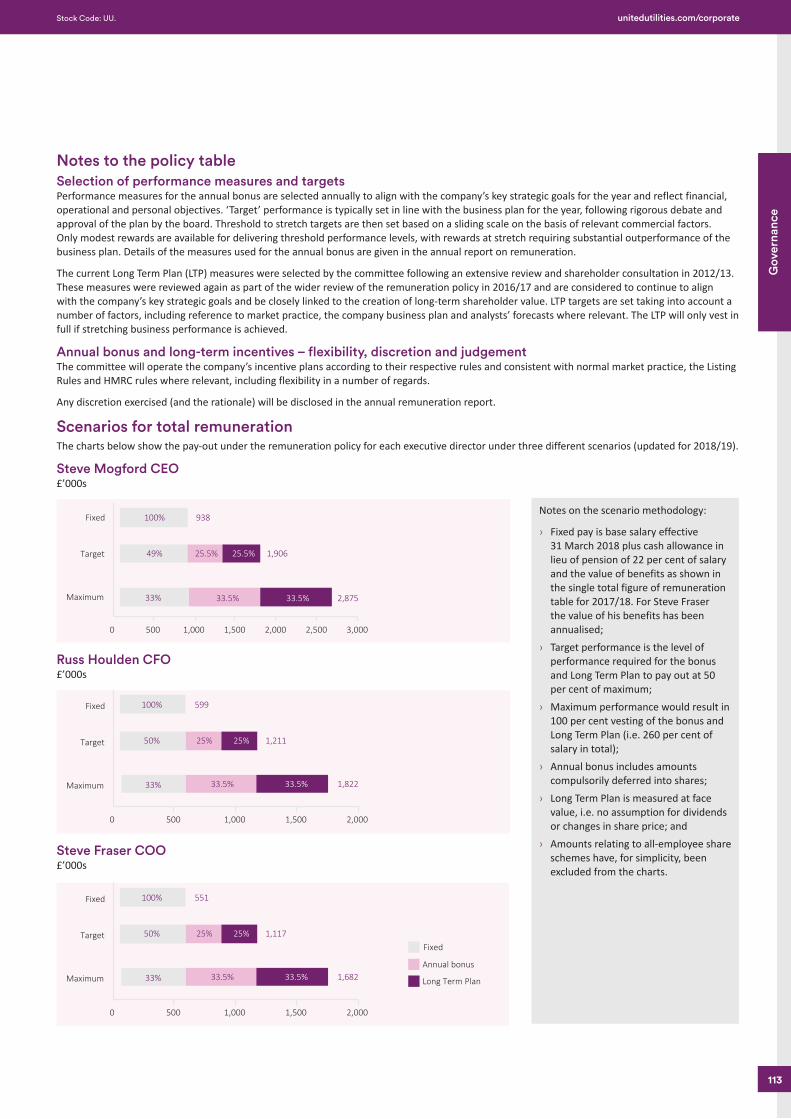
Job Number 4 June 2018 8:56 AM Proof 3 Job Number 4 June 2018 8:56 AM Proof 3
Notes to the policy tableSelection of performance measures and targetsPerformance measures for the annual bonus are selected annually to align with the company’s key strategic goals for the year and reflect financial, operational and personal objectives. ‘Target’ performance is typically set in line with the business plan for the year, following rigorous debate and approval of the plan by the board. Threshold to stretch targets are then set based on a sliding scale on the basis of relevant commercial factors. Only modest rewards are available for delivering threshold performance levels, with rewards at stretch requiring substantial outperformance of the business plan. Details of the measures used for the annual bonus are given in the annual report on remuneration.
The current Long Term Plan (LTP) measures were selected by the committee following an extensive review and shareholder consultation in 2012/13. These measures were reviewed again as part of the wider review of the remuneration policy in 2016/17 and are considered to continue to align with the company’s key strategic goals and be closely linked to the creation of long-term shareholder value. LTP targets are set taking into account a number of factors, including reference to market practice, the company business plan and analysts’ forecasts where relevant. The LTP will only vest in full if stretching business performance is achieved.
Annual bonus and long-term incentives – flexibility, discretion and judgementThe committee will operate the company’s incentive plans according to their respective rules and consistent with normal market practice, the Listing Rules and HMRC rules where relevant, including flexibility in a number of regards.
Any discretion exercised (and the rationale) will be disclosed in the annual remuneration report.
Scenarios for total remunerationThe charts below show the pay-out under the remuneration policy for each executive director under three different scenarios (updated for 2018/19).
Steve Mogford CEO £’000s
100% 938
49% 25.5% 1,906
33.5% 2,87533.5%
25.5%
33%
0 500 1,000 1,500 2,000 2,500 3,000
Fixed
Target
Maximum
Russ Houlden CFO£’000s
100% 599
50% 25% 1,211
33.5% 1,82233.5%
25%
33%
0 500 1,000 1,500 2,000
Fixed
Target
Maximum
Steve Fraser COO £’000s
100% 551
50% 25% 1,117
33.5% 1,68233.5%
25%
33%
0 500
Fixed
Annual bonus
Long Term Plan
1,000 1,500 2,000
Fixed
Target
Maximum
Notes on the scenario methodology:
› Fixed pay is base salary effective 31 March 2018 plus cash allowance in lieu of pension of 22 per cent of salary and the value of benefits as shown in the single total figure of remuneration table for 2017/18. For Steve Fraser the value of his benefits has been annualised;
› Target performance is the level of performance required for the bonus and Long Term Plan to pay out at 50 per cent of maximum;
› Maximum performance would result in 100 per cent vesting of the bonus and Long Term Plan (i.e. 260 per cent of salary in total);
› Annual bonus includes amounts compulsorily deferred into shares;
› Long Term Plan is measured at face value, i.e. no assumption for dividends or changes in share price; and
› Amounts relating to all-employee share schemes have, for simplicity, been excluded from the charts.
113
Gov
erna
nce
Stock Code: UU. unitedutilities.com/corporate
United Utilities Middle Section.indd 113 04/06/2018 13:05:46
Job Number 4 June 2018 8:56 AM Proof 3 Job Number 4 June 2018 8:56 AM Proof 3
Shareholding guidelinesThe committee believes that it is important for a significant investment to be made by each executive director in the shares of the company to provide alignment with shareholder interests. Shareholding guidelines are therefore operated and the details of how these are currently applied are provided in the annual report on remuneration.
Service contracts and letters of appointmentExecutive directors’ service contracts are subject to up to one year’s notice period when terminated by the company and at least six months’ notice when terminated by the director.
The Chairman and other non-executive directors have letters of appointment rather than service contracts. Their appointments may be terminated without compensation at any time. All non-executive directors are subject to re-election at the AGM.
Copies of executive directors’ service contracts and non-executive directors’ letters of appointment are available for inspection at the company’s registered office during normal hours of business and will be available at the company’s AGM. Copies of non-executive directors’ letters of appointment can also be viewed on the company’s website.
Approach to recruitment remunerationThe remuneration package for a new executive director would be set in accordance with the terms of the company’s approved remuneration policy in force at the time of appointment.
Buy-out awardsIn addition, the committee may offer additional cash and/or share-based elements (on a one-time basis or ongoing) when it considers these to be in the best interests of the company (and therefore shareholders). Any such payments would be limited to a reasonable estimate of value of remuneration lost when leaving the former employer and would reflect the delivery mechanism (i.e. cash and/or share-based), time horizons and whether performance requirements are attached to that remuneration. Shareholders will be informed of any such payments at the time of appointment.
Maximum level of variable payThe maximum level of long-term incentives which may be awarded to a new executive director will be limited to the maximum Long Term Plan limit of 200 per cent of salary per annum on an ongoing basis. Therefore, the maximum level of overall variable pay that may be offered will be 330 per cent of salary (i.e. 130 per cent annual bonus plus 200 per cent Long-Term Plan) per annum on an ongoing basis. These limits are in addition to the value of any buy-out arrangements which are governed by the policy above.
In the case of an internal appointment, any variable pay element awarded in respect of the prior role would be allowed to pay out according to its terms, adjusted as relevant to take into account the appointment. In addition, any other previously awarded entitlements would continue, and be disclosed in the next annual report on remuneration.
Base salary and relocation expensesBase salary levels for new recruits will be set in accordance with the policy, taking into account the experience of the individual recruited. The committee has the flexibility to set the salary of a new appointment at a discount to the market level initially, with a series of planned increases implemented over the following years to bring the salary to the appropriate market position, subject to individual performance in the role.
For external and internal appointments, the committee may agree that the company will meet certain relocation and/or incidental expenses as appropriate.
Annual bonus performance conditionsWhere a new executive director is appointed part way through a financial year, the committee may set different annual bonus measures and targets for the new executive director from those used for other executive directors (for the initial year only).
Appointment of non-executive directorsFor the appointment of a new Chairman or non-executive director, the fee arrangement would be set in accordance with the approved remuneration policy in force at that time. Non-executive directors’ fees are set by a separate committee of the board; the Chairman’s fees are set by the remuneration committee.
Payment for loss of officeThe circumstances of the termination, including the individual’s performance and an individual’s duty and opportunity to mitigate losses are taken into account in every case. Our policy is to stop or reduce compensatory payments to former executive directors to the extent that they receive remuneration from other employment during the compensation period. A robust line on reducing compensation is applied and payments to departing employees may be phased in order to mitigate loss.
Corporate governance reportAppendix 1: Directors’ remuneration policy (abridged)
114
United Utilities Group PLC Annual Report and Financial Statements for the year ended 31 March 2018
United Utilities Middle Section.indd 114 04/06/2018 13:05:46
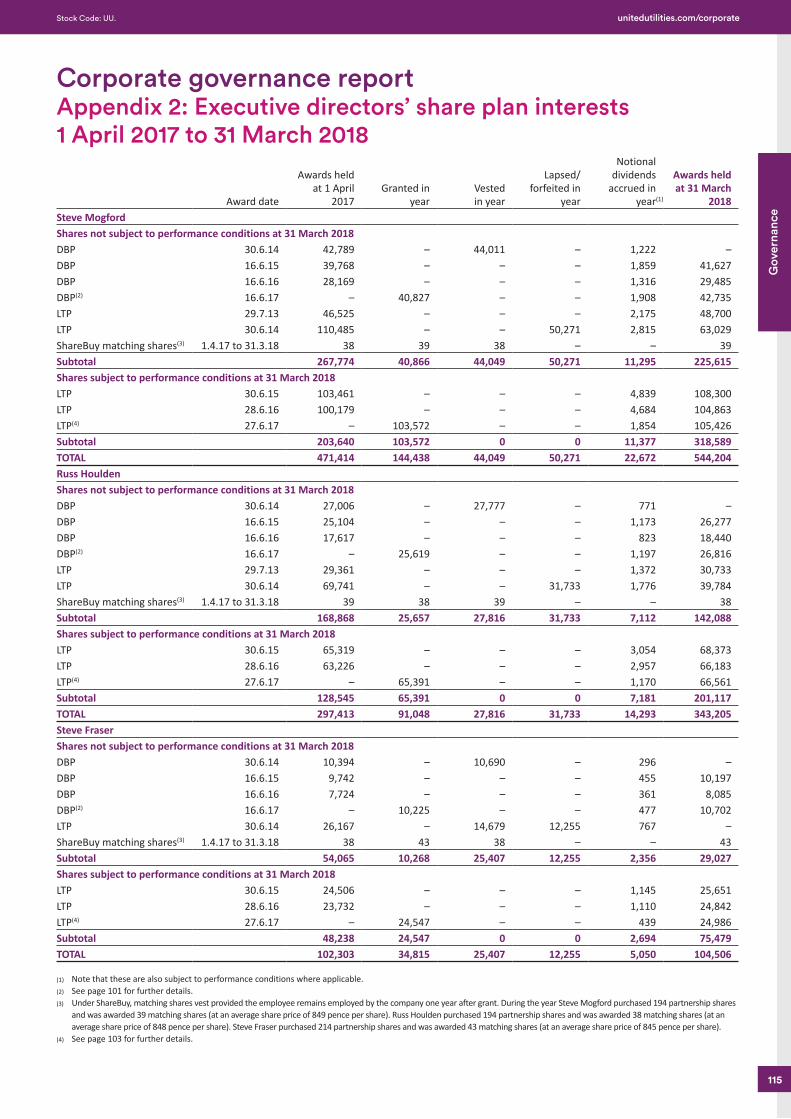
Job Number 4 June 2018 8:56 AM Proof 3 Job Number 4 June 2018 8:56 AM Proof 3
Award date
Awards held at 1 April
2017Granted in
yearVested in year
Lapsed/ forfeited in
year
Notionaldividends
accrued in year(1)
Awards held at 31 March
2018Steve MogfordShares not subject to performance conditions at 31 March 2018DBP 30.6.14 42,789 – 44,011 – 1,222 –DBP 16.6.15 39,768 – – – 1,859 41,627DBP 16.6.16 28,169 – – – 1,316 29,485DBP(2) 16.6.17 – 40,827 – – 1,908 42,735LTP 29.7.13 46,525 – – – 2,175 48,700LTP 30.6.14 110,485 – – 50,271 2,815 63,029ShareBuy matching shares(3) 1.4.17 to 31.3.18 38 39 38 – – 39Subtotal 267,774 40,866 44,049 50,271 11,295 225,615Shares subject to performance conditions at 31 March 2018LTP 30.6.15 103,461 – – – 4,839 108,300LTP 28.6.16 100,179 – – – 4,684 104,863LTP(4) 27.6.17 – 103,572 – – 1,854 105,426Subtotal 203,640 103,572 0 0 11,377 318,589TOTAL 471,414 144,438 44,049 50,271 22,672 544,204Russ HouldenShares not subject to performance conditions at 31 March 2018DBP 30.6.14 27,006 – 27,777 – 771 –DBP 16.6.15 25,104 – – – 1,173 26,277DBP 16.6.16 17,617 – – – 823 18,440DBP(2) 16.6.17 – 25,619 – – 1,197 26,816LTP 29.7.13 29,361 – – – 1,372 30,733LTP 30.6.14 69,741 – – 31,733 1,776 39,784ShareBuy matching shares(3) 1.4.17 to 31.3.18 39 38 39 – – 38Subtotal 168,868 25,657 27,816 31,733 7,112 142,088Shares subject to performance conditions at 31 March 2018LTP 30.6.15 65,319 – – – 3,054 68,373LTP 28.6.16 63,226 – – – 2,957 66,183LTP(4) 27.6.17 – 65,391 – – 1,170 66,561Subtotal 128,545 65,391 0 0 7,181 201,117TOTAL 297,413 91,048 27,816 31,733 14,293 343,205Steve FraserShares not subject to performance conditions at 31 March 2018DBP 30.6.14 10,394 – 10,690 – 296 –DBP 16.6.15 9,742 – – – 455 10,197DBP 16.6.16 7,724 – – – 361 8,085DBP(2) 16.6.17 – 10,225 – – 477 10,702LTP 30.6.14 26,167 – 14,679 12,255 767 –ShareBuy matching shares(3) 1.4.17 to 31.3.18 38 43 38 – – 43Subtotal 54,065 10,268 25,407 12,255 2,356 29,027Shares subject to performance conditions at 31 March 2018LTP 30.6.15 24,506 – – – 1,145 25,651LTP 28.6.16 23,732 – – – 1,110 24,842LTP(4) 27.6.17 – 24,547 – – 439 24,986Subtotal 48,238 24,547 0 0 2,694 75,479TOTAL 102,303 34,815 25,407 12,255 5,050 104,506
(1) Note that these are also subject to performance conditions where applicable.(2) See page 101 for further details.(3) Under ShareBuy, matching shares vest provided the employee remains employed by the company one year after grant. During the year Steve Mogford purchased 194 partnership shares
and was awarded 39 matching shares (at an average share price of 849 pence per share). Russ Houlden purchased 194 partnership shares and was awarded 38 matching shares (at an average share price of 848 pence per share). Steve Fraser purchased 214 partnership shares and was awarded 43 matching shares (at an average share price of 845 pence per share).
(4) See page 103 for further details.
Corporate governance reportAppendix 2: Executive directors’ share plan interests 1 April 2017 to 31 March 2018
115
Gov
erna
nce
Stock Code: UU. unitedutilities.com/corporate
United Utilities Middle Section.indd 115 04/06/2018 13:05:46
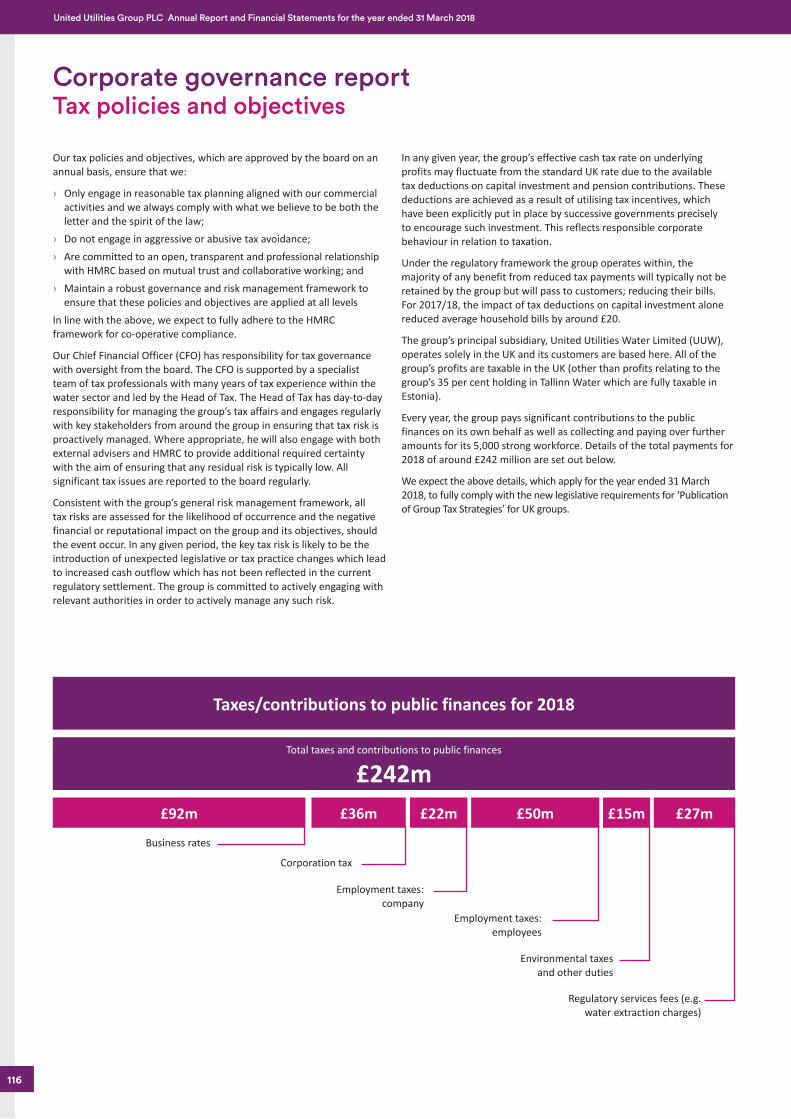
Job Number 4 June 2018 8:56 AM Proof 3 Job Number 4 June 2018 8:56 AM Proof 3
Taxes/contributions to public finances for 2018
Total taxes and contributions to public finances
£242m£92m
Business rates
Corporation tax
Employment taxes: company
Employment taxes: employees
Environmental taxes and other duties
Regulatory services fees (e.g. water extraction charges)
£36m £15m £27m£22m £50m
Corporate governance reportTax policies and objectives
Our tax policies and objectives, which are approved by the board on an annual basis, ensure that we:
› Only engage in reasonable tax planning aligned with our commercial activities and we always comply with what we believe to be both the letter and the spirit of the law;
› Do not engage in aggressive or abusive tax avoidance; › Are committed to an open, transparent and professional relationship
with HMRC based on mutual trust and collaborative working; and › Maintain a robust governance and risk management framework to
ensure that these policies and objectives are applied at all levelsIn line with the above, we expect to fully adhere to the HMRC framework for co-operative compliance.
Our Chief Financial Officer (CFO) has responsibility for tax governance with oversight from the board. The CFO is supported by a specialist team of tax professionals with many years of tax experience within the water sector and led by the Head of Tax. The Head of Tax has day-to-day responsibility for managing the group’s tax affairs and engages regularly with key stakeholders from around the group in ensuring that tax risk is proactively managed. Where appropriate, he will also engage with both external advisers and HMRC to provide additional required certainty with the aim of ensuring that any residual risk is typically low. All significant tax issues are reported to the board regularly.
Consistent with the group’s general risk management framework, all tax risks are assessed for the likelihood of occurrence and the negative financial or reputational impact on the group and its objectives, should the event occur. In any given period, the key tax risk is likely to be the introduction of unexpected legislative or tax practice changes which lead to increased cash outflow which has not been reflected in the current regulatory settlement. The group is committed to actively engaging with relevant authorities in order to actively manage any such risk.
In any given year, the group’s effective cash tax rate on underlying profits may fluctuate from the standard UK rate due to the available tax deductions on capital investment and pension contributions. These deductions are achieved as a result of utilising tax incentives, which have been explicitly put in place by successive governments precisely to encourage such investment. This reflects responsible corporate behaviour in relation to taxation.
Under the regulatory framework the group operates within, the majority of any benefit from reduced tax payments will typically not be retained by the group but will pass to customers; reducing their bills. For 2017/18, the impact of tax deductions on capital investment alone reduced average household bills by around £20.
The group’s principal subsidiary, United Utilities Water Limited (UUW), operates solely in the UK and its customers are based here. All of the group’s profits are taxable in the UK (other than profits relating to the group’s 35 per cent holding in Tallinn Water which are fully taxable in Estonia).
Every year, the group pays significant contributions to the public finances on its own behalf as well as collecting and paying over further amounts for its 5,000 strong workforce. Details of the total payments for 2018 of around £242 million are set out below.
We expect the above details, which apply for the year ended 31 March 2018, to fully comply with the new legislative requirements for ‘Publication of Group Tax Strategies’ for UK groups.
116
United Utilities Group PLC Annual Report and Financial Statements for the year ended 31 March 2018
United Utilities Middle Section.indd 116 04/06/2018 13:05:46
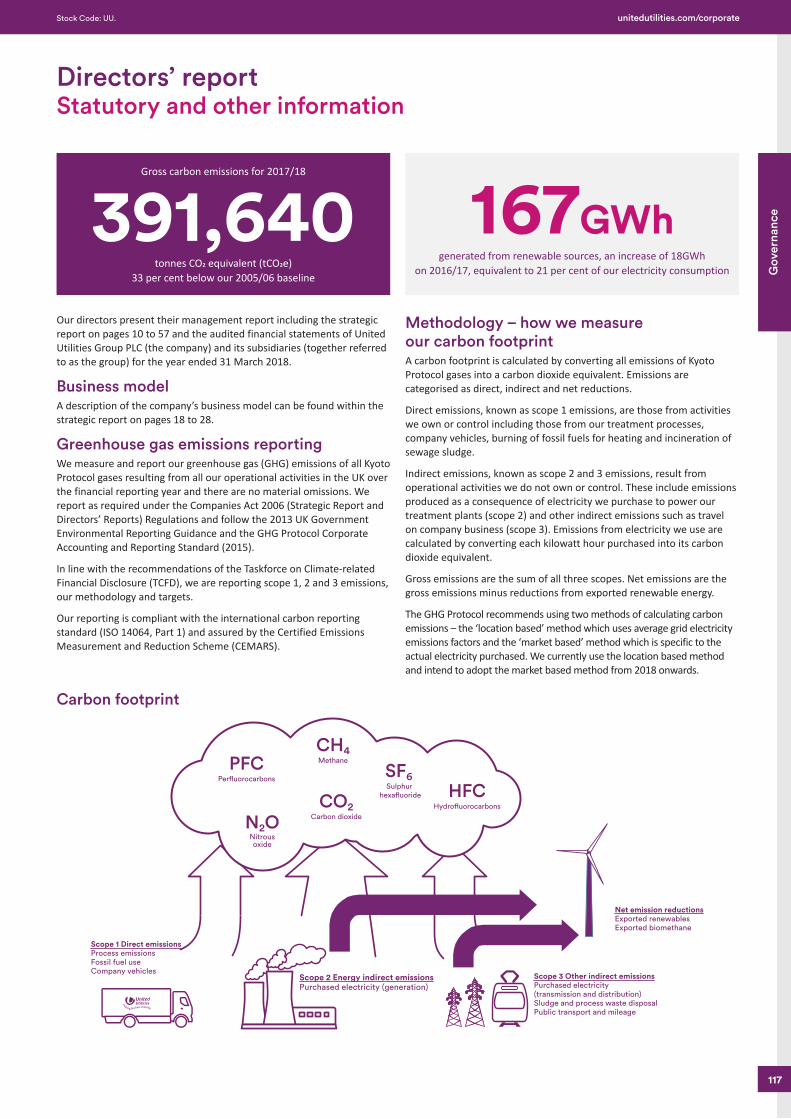
Job Number 4 June 2018 8:56 AM Proof 3 Job Number 4 June 2018 8:56 AM Proof 3
Net emission reductionsExported renewablesExported biomethane
Scope 3 Other indirect emissionsPurchased electricity (transmission and distribution)Sludge and process waste disposalPublic transport and mileage
Scope 2 Energy indirect emissionsPurchased electricity (generation)
Per�uorocarbons
PFC Methane
CH4
Sulphur hexa�uoride
SF6
Carbon dioxide
CO2 Hydro�uorocarbons
HFC
N2ONitrous oxide
Scope 1 Direct emissionsProcess emissionsFossil fuel useCompany vehicles
167GWhgenerated from renewable sources, an increase of 18GWh
on 2016/17, equivalent to 21 per cent of our electricity consumption
Gross carbon emissions for 2017/18
391,640tonnes CO2 equivalent (tCO2e)
33 per cent below our 2005/06 baseline
Our directors present their management report including the strategic report on pages 10 to 57 and the audited financial statements of United Utilities Group PLC (the company) and its subsidiaries (together referred to as the group) for the year ended 31 March 2018.
Business modelA description of the company’s business model can be found within the strategic report on pages 18 to 28.
Greenhouse gas emissions reportingWe measure and report our greenhouse gas (GHG) emissions of all Kyoto Protocol gases resulting from all our operational activities in the UK over the financial reporting year and there are no material omissions. We report as required under the Companies Act 2006 (Strategic Report and Directors’ Reports) Regulations and follow the 2013 UK Government Environmental Reporting Guidance and the GHG Protocol Corporate Accounting and Reporting Standard (2015).
In line with the recommendations of the Taskforce on Climate-related Financial Disclosure (TCFD), we are reporting scope 1, 2 and 3 emissions, our methodology and targets.
Our reporting is compliant with the international carbon reporting standard (ISO 14064, Part 1) and assured by the Certified Emissions Measurement and Reduction Scheme (CEMARS).
Methodology – how we measure our carbon footprintA carbon footprint is calculated by converting all emissions of Kyoto Protocol gases into a carbon dioxide equivalent. Emissions are categorised as direct, indirect and net reductions.
Direct emissions, known as scope 1 emissions, are those from activities we own or control including those from our treatment processes, company vehicles, burning of fossil fuels for heating and incineration of sewage sludge.
Indirect emissions, known as scope 2 and 3 emissions, result from operational activities we do not own or control. These include emissions produced as a consequence of electricity we purchase to power our treatment plants (scope 2) and other indirect emissions such as travel on company business (scope 3). Emissions from electricity we use are calculated by converting each kilowatt hour purchased into its carbon dioxide equivalent.
Gross emissions are the sum of all three scopes. Net emissions are the gross emissions minus reductions from exported renewable energy.
The GHG Protocol recommends using two methods of calculating carbon emissions – the ‘location based’ method which uses average grid electricity emissions factors and the ‘market based’ method which is specific to the actual electricity purchased. We currently use the location based method and intend to adopt the market based method from 2018 onwards.
Carbon footprint
Directors’ reportStatutory and other information
117
Gov
erna
nce
Stock Code: UU. unitedutilities.com/corporate
United Utilities Middle Section.indd 117 04/06/2018 13:05:47
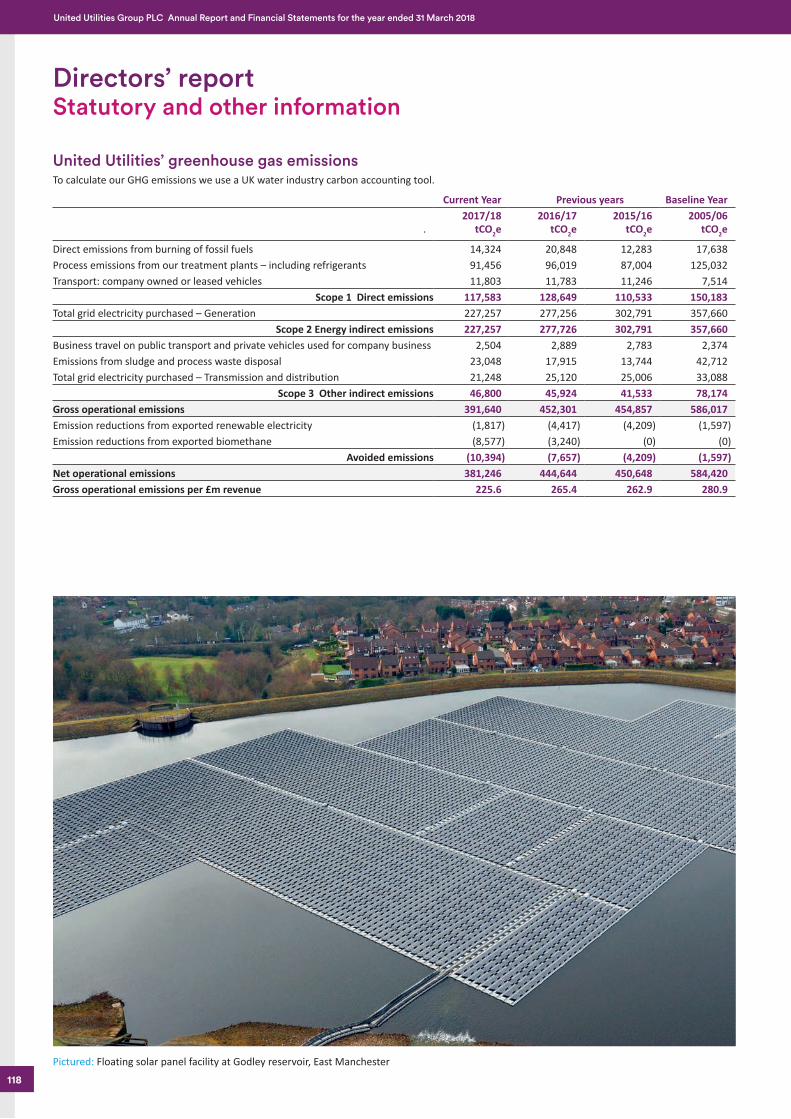
Job Number 4 June 2018 8:56 AM Proof 3 Job Number 4 June 2018 8:56 AM Proof 3
United Utilities’ greenhouse gas emissions To calculate our GHG emissions we use a UK water industry carbon accounting tool.
Current Year Previous years Baseline Year
.2017/18
tCO2e2016/17
tCO2e2015/16
tCO2e2005/06
tCO2e
Direct emissions from burning of fossil fuels 14,324 20,848 12,283 17,638Process emissions from our treatment plants – including refrigerants 91,456 96,019 87,004 125,032Transport: company owned or leased vehicles 11,803 11,783 11,246 7,514
Scope 1 Direct emissions 117,583 128,649 110,533 150,183Total grid electricity purchased – Generation 227,257 277,256 302,791 357,660
Scope 2 Energy indirect emissions 227,257 277,726 302,791 357,660Business travel on public transport and private vehicles used for company business 2,504 2,889 2,783 2,374Emissions from sludge and process waste disposal 23,048 17,915 13,744 42,712Total grid electricity purchased – Transmission and distribution 21,248 25,120 25,006 33,088
Scope 3 Other indirect emissions 46,800 45,924 41,533 78,174Gross operational emissions 391,640 452,301 454,857 586,017Emission reductions from exported renewable electricity (1,817) (4,417) (4,209) (1,597)Emission reductions from exported biomethane (8,577) (3,240) (0) (0)
Avoided emissions (10,394) (7,657) (4,209) (1,597)Net operational emissions 381,246 444,644 450,648 584,420Gross operational emissions per £m revenue 225.6 265.4 262.9 280.9
Pictured: Floating solar panel facility at Godley reservoir, East Manchester
Directors’ reportStatutory and other information
118
United Utilities Group PLC Annual Report and Financial Statements for the year ended 31 March 2018
United Utilities Middle Section.indd 118 04/06/2018 13:05:48
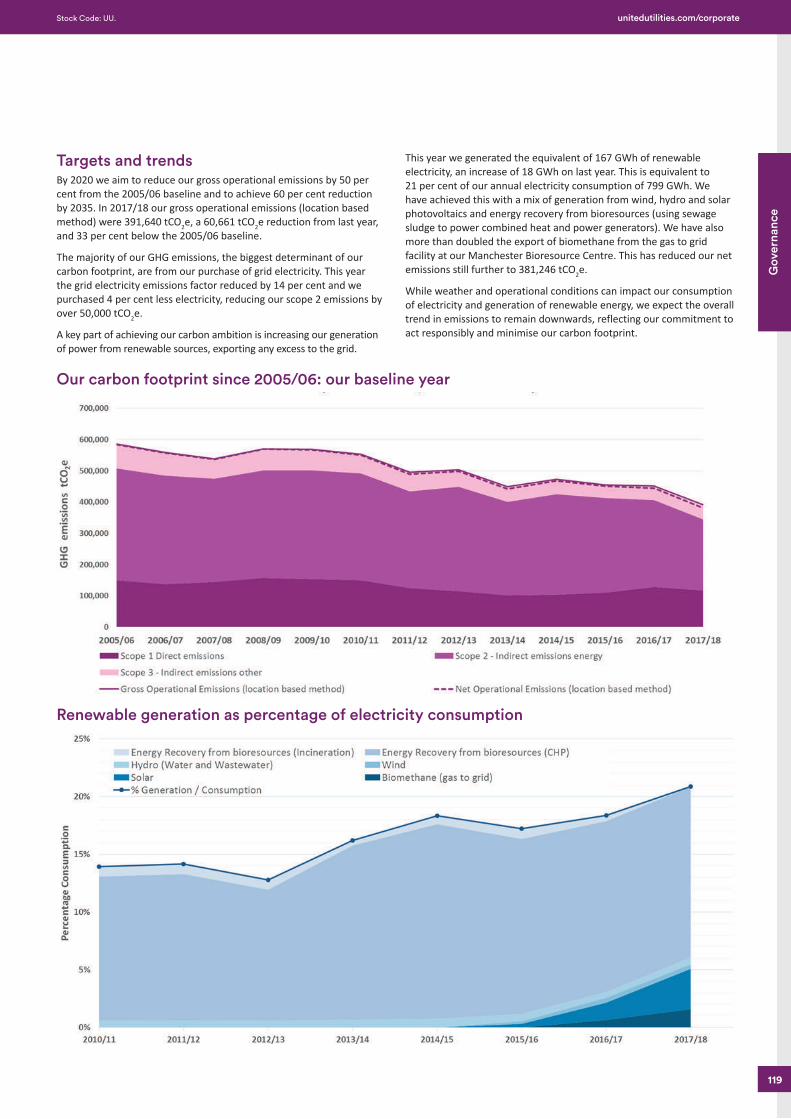
Job Number 4 June 2018 8:56 AM Proof 3 Job Number 4 June 2018 8:56 AM Proof 3
Targets and trends By 2020 we aim to reduce our gross operational emissions by 50 per cent from the 2005/06 baseline and to achieve 60 per cent reduction by 2035. In 2017/18 our gross operational emissions (location based method) were 391,640 tCO2e, a 60,661 tCO2e reduction from last year, and 33 per cent below the 2005/06 baseline.
The majority of our GHG emissions, the biggest determinant of our carbon footprint, are from our purchase of grid electricity. This year the grid electricity emissions factor reduced by 14 per cent and we purchased 4 per cent less electricity, reducing our scope 2 emissions by over 50,000 tCO2e.
A key part of achieving our carbon ambition is increasing our generation of power from renewable sources, exporting any excess to the grid.
This year we generated the equivalent of 167 GWh of renewable electricity, an increase of 18 GWh on last year. This is equivalent to 21 per cent of our annual electricity consumption of 799 GWh. We have achieved this with a mix of generation from wind, hydro and solar photovoltaics and energy recovery from bioresources (using sewage sludge to power combined heat and power generators). We have also more than doubled the export of biomethane from the gas to grid facility at our Manchester Bioresource Centre. This has reduced our net emissions still further to 381,246 tCO2e.
While weather and operational conditions can impact our consumption of electricity and generation of renewable energy, we expect the overall trend in emissions to remain downwards, reflecting our commitment to act responsibly and minimise our carbon footprint.
Our carbon footprint since 2005/06: our baseline year
Renewable generation as percentage of electricity consumption
119
Gov
erna
nce
Stock Code: UU. unitedutilities.com/corporate
United Utilities Middle Section.indd 119 04/06/2018 13:05:48
Job Number 4 June 2018 8:56 AM Proof 3 Job Number 4 June 2018 8:56 AM Proof 3
Dividends Our directors are recommending a final dividend of 26.49 pence per ordinary share for the year ended 31 March 2018, which, together with the interim dividend of 13.24 pence, gives a total dividend for the year of 39.73 pence per ordinary share (the interim and final dividends we paid in respect of the 2016/17 financial year were 12.95 pence and 25.92 pence per ordinary share respectively). Subject to approval by our shareholders at our AGM, our final dividend will be paid on 3 August 2018 to shareholders on the register at the close of business on 22 June 2018.
Directors The names of our directors who served during the financial year ended 31 March 2018 can be found on pages 60 to 63.
Reappointment Our articles of association provide that our directors must retire at every annual general meeting following their last election or reappointment by our shareholders which is consistent with the recommendation contained within the 2016 UK Corporate Governance Code (‘the Code’) that all directors should be subject to annual election by shareholders. This has been the case at all the AGMs since 2011. Information regarding the appointment of our directors is included in our corporate governance report on pages 74 to 77.
Interests Details of the interests in the company’s shares held by our directors and persons connected with them are set out in our directors’ remuneration report on pages 94 to 109 which is hereby incorporated by reference into this directors’ report.
Corporate governance statement
The corporate governance report on pages 60 to 116 is hereby incorporated by reference into this directors’ report and includes details of our compliance with the Code. Our statement includes a description of the main features of our internal control and risk management systems in relation to the financial reporting process and forms part of this directors’ report. A copy of the Code, as applicable to the company for the year ended 31 March 2018, can be found at the Financial Reporting Council’s website frc.org.uk. Copies of the matters reserved for the board and the terms of reference for each of the main board committees can be found on our website.
Share capital At 31 March 2018, the issued share capital of the company was £499,819,926 divided into 681,888,418 ordinary shares of 5 pence each and 273,956,180 deferred shares of 170 pence each. Details of our share capital and movements in our issued share capital are shown in note 21 to the financial statements on page 156. The ordinary shares represented 71.3 per cent and the deferred shares represented 28.7 per cent respectively of the shares in issue as at 31 March 2018.
All our ordinary shares have the same rights, including the rights to one vote at any of our general meetings, to an equal proportion of any dividends we declare and pay, and to an equal amount of any surplus assets which are distributed in the event of a winding-up.
Our deferred shares convey no right to income, no right to vote and no appreciable right to participate in any surplus capital in the event of a winding-up. The rights attaching to our shares in the company are provided by our articles of association, which may be amended or replaced by means of a special resolution of the company in general meeting. The company renews annually its power to issue and buy back shares at our AGM and such resolutions will be proposed at our 2018 AGM. Our directors’ powers are conferred on them by UK legislation and by the company’s articles. At the AGM of the company on 28 July 2017, the directors were authorised to issue relevant securities up to an aggregate nominal amount of £11,364,806 and were empowered to allot equity securities for cash on a non pre-emptive basis to an aggregate nominal amount of £1,704,721.
Voting Electronic and paper proxy appointment and voting instructions must be received by our registrars (Equiniti) not less than 48 hours before a general meeting and when calculating this period, the directors can decide not to take account of any part of a day that is not a working day.
Transfers There are no restrictions on the transfer of our ordinary shares in the company, nor any limitations on the holding of our shares in the company, save: (i) where the company has exercised its right to suspend their voting rights or to prohibit their transfer following the omission of their holder or any person interested in them to provide the company with information requested by it in accordance with Part 22 of the Companies Act 2006; or (ii) where their holder is precluded from exercising voting rights by the Financial Conduct Authority’s Listing Rules or the City Code on Takeovers and Mergers.
There are no agreements known to us between holders of securities that may result in restrictions on the transfer of securities or on voting rights. All our issued shares are fully paid.
Directors’ reportStatutory and other information
120
United Utilities Group PLC Annual Report and Financial Statements for the year ended 31 March 2018
United Utilities Middle Section.indd 120 04/06/2018 13:05:48
Job Number 4 June 2018 8:56 AM Proof 3 Job Number 4 June 2018 8:56 AM Proof 3
Major shareholdings At 23 May 2018, our directors had been notified of the following interests in the company’s issued ordinary share capital in accordance with the Disclosure and Transparency Rules of the Financial Conduct Authority:
Per cent of issued share capital
Direct or indirect nature of holding
Lazard Asset Management LLC 8.03 IndirectBlackRock Inc 5.13 IndirectNorges Bank 3.03 Direct
Purchase of own shares At our last AGM held on 27 July 2017, our shareholders authorised the company to purchase, in the market, up to 68,188,841 of our ordinary shares of 5 pence each. We did not purchase any shares under this authority during the year. We normally seek such an authority from our shareholders annually. At our 2018 AGM, we will again seek authority from our shareholders to purchase up to 68,188,841 of our ordinary shares of 5 pence each with such authority expiring at the end of our AGM held in 2018.
Change of control As at 31 March 2018, Equiniti Trust (Jersey) Limited was the trustee that administered our executive share plans and had the ability to exercise voting rights at its discretion which related to shares that it held under the trust deed constituting the trust. In the event of a takeover offer which could lead to a change of control of the company, the trustee must consult with the company before accepting the offer or voting in favour of the offer. Subject to that requirement, the trustee may take into account a prescribed list of interests and considerations prior to making a decision in relation to the offer, including the interests of the beneficiaries under the trust.
In the event of a change of control, the participants in our all employee share incentive plan (ShareBuy) would be able to direct the trustee of ShareBuy, Equiniti Share Plan Trustees Limited, how to act on their behalf.
Information required by UK Listing Rule 9.8.4
Details of the amount of interest capitalised by the group during the financial year can be found in note 5 to the financial statements on page 146. In line with current UK tax legislation, the amount is fully deductible against the group’s corporation tax liability, resulting in tax relief of £7.5 million.
There are no other disclosures to be made under Listing Rule 9.8.4.
Directors’ indemnities and insurance
We have in place contractual entitlements for the directors of the company and of its subsidiaries to claim indemnification by the company in respect of certain liabilities which might be incurred by them in the course of their duties as directors. These arrangements, which constitute qualifying third-party indemnity provision and qualifying pension scheme indemnity provision, have been established in compliance with the relevant provisions of the Companies Act 2006 and have been in force throughout the financial year. They include provision for the company to fund the costs incurred by directors in defending certain claims against them in relation to their duties as directors of the company or its subsidiaries. The company also maintains an appropriate level of directors’ and officers’ liability insurance.
Political donations We do not support any political party and do not make what are commonly regarded as donations to any political party or other political organisations. However, the wide definition of donations in the Political Parties, Elections and Referendums Act 2000 covers activities which form part of the necessary relationship between the group and our political stakeholders. This includes promoting United Utilities’ activities at the main political parties’ annual conferences, and occasional stakeholder engagement in Westminster.
The group incurred expenditure of £21,662 (2017: £11,298) as part of this process, the increase on the previous year as a result of a parliamentary reception hosted by the company to engage parliamentary stakeholders on its business plan development. At the 2017 AGM, an authority was taken to cover such expenditure.
A similar resolution will be put to our shareholders at the 2018 AGM to authorise the company and its subsidiaries to make such expenditure.
Trade associations We are members of a small number of trade associations. Some of these have a national focus, such as Water UK, the representative body of the UK water industry, which considers industry-wide priorities such as development of markets, customer trust, resilience, and legislation and regulation, and the Confederation of British Industry, which provides a policy making voice for firms at a regional, national and international level. Others focus on specific professions such as the 100 Group representing the views of the finance directors of FTSE100 and large UK private companies and the GC100, the voice of general counsel and company secretaries in FTSE100 companies. The company is also a member of regional bodies, such as the North West Business Leadership Team and Atlantic Gateway, both of which encourage engagement across the public and private sectors to promote the sustainable economic development and long-term wellbeing of the North West. Our contribution to these associations in 2017/18 was £389,743 (2016/17: £393,000).
121
Gov
erna
nce
Stock Code: UU. unitedutilities.com/corporate
United Utilities Middle Section.indd 121 04/06/2018 13:05:48
Job Number 4 June 2018 8:56 AM Proof 3 Job Number 4 June 2018 8:56 AM Proof 3
Employees Our policies on employee consultation and on equal opportunities for our disabled employees can be found in the ‘People’ section on page 24. The company’s business principles make clear how the company and all our employees must seek to act with integrity and fairness and observe legal requirements. Anyone with serious concerns that the company may not be adhering to these principles is encouraged to speak up via their line manager or through a confidential telephone line.
Importance is placed on strengthening employees’ engagement, measuring their views annually, then taking action to improve how they feel about the company and understand its direction. Employees are provided with regular information to enable them to understand the financial and economic factors affecting the company’s performance. The board encourages employees to own shares in the company through the all employee share incentive plan (ShareBuy). For further information on our average number of employees during the year, go to note 2 on page 144.
Environmental, socialand community matters
Details of our approach to corporate responsibility, relating to the environment and social and community issues, can be found on pages 90 to 93.
Essential contractual relationships
Certain suppliers we use contribute key goods or services, the loss of which could cause disruption to our services. However, none are so vital that their loss would affect our viability as a group as a whole nor are we overly dependent on any one individual customer.
Approach to technology development
We are committed to using innovative, cost-effective and practical solutions for providing high-quality services and we recognise the importance of ensuring that we focus our investment on the development of technology and that we have the right skills to apply technology to achieve sustainable competitive advantage and also that we continue to be alert to emerging technological opportunities.
Financial instruments Our risk management objectives and policies in relation to the use of financial instruments can be found in note A4 to the financial statements.
Events occurring after the reporting period
Details of events after the reporting period are included in note 24 to the consolidated financial statements on page 156.
Slavery and Human Trafficking Statement
Our statement can be found on our website at: unitedutilities.com/human-rights
.
Directors’ reportStatutory and other information
122
United Utilities Group PLC Annual Report and Financial Statements for the year ended 31 March 2018
United Utilities Middle Section.indd 122 04/06/2018 13:05:48
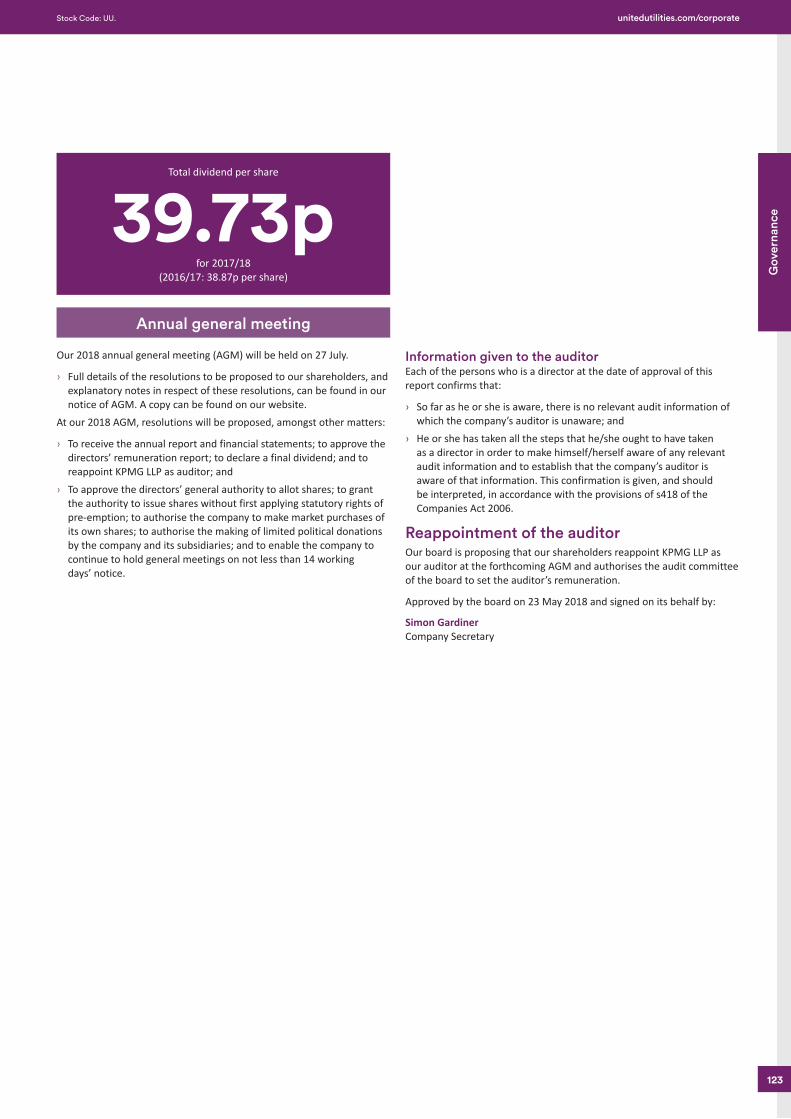
Job Number 4 June 2018 8:56 AM Proof 3 Job Number 4 June 2018 8:56 AM Proof 3
Our 2018 annual general meeting (AGM) will be held on 27 July.
› Full details of the resolutions to be proposed to our shareholders, and explanatory notes in respect of these resolutions, can be found in our notice of AGM. A copy can be found on our website.
At our 2018 AGM, resolutions will be proposed, amongst other matters:
› To receive the annual report and financial statements; to approve the directors’ remuneration report; to declare a final dividend; and to reappoint KPMG LLP as auditor; and
› To approve the directors’ general authority to allot shares; to grant the authority to issue shares without first applying statutory rights of pre-emption; to authorise the company to make market purchases of its own shares; to authorise the making of limited political donations by the company and its subsidiaries; and to enable the company to continue to hold general meetings on not less than 14 working days’ notice.
Information given to the auditorEach of the persons who is a director at the date of approval of this report confirms that:
› So far as he or she is aware, there is no relevant audit information of which the company’s auditor is unaware; and
› He or she has taken all the steps that he/she ought to have taken as a director in order to make himself/herself aware of any relevant audit information and to establish that the company’s auditor is aware of that information. This confirmation is given, and should be interpreted, in accordance with the provisions of s418 of the Companies Act 2006.
Reappointment of the auditorOur board is proposing that our shareholders reappoint KPMG LLP as our auditor at the forthcoming AGM and authorises the audit committee of the board to set the auditor’s remuneration.
Approved by the board on 23 May 2018 and signed on its behalf by:
Simon Gardiner Company Secretary
Total dividend per share
39.73pfor 2017/18
(2016/17: 38.87p per share)
Annual general meeting
123
Gov
erna
nce
Stock Code: UU. unitedutilities.com/corporate
United Utilities Middle Section.indd 123 04/06/2018 13:05:48
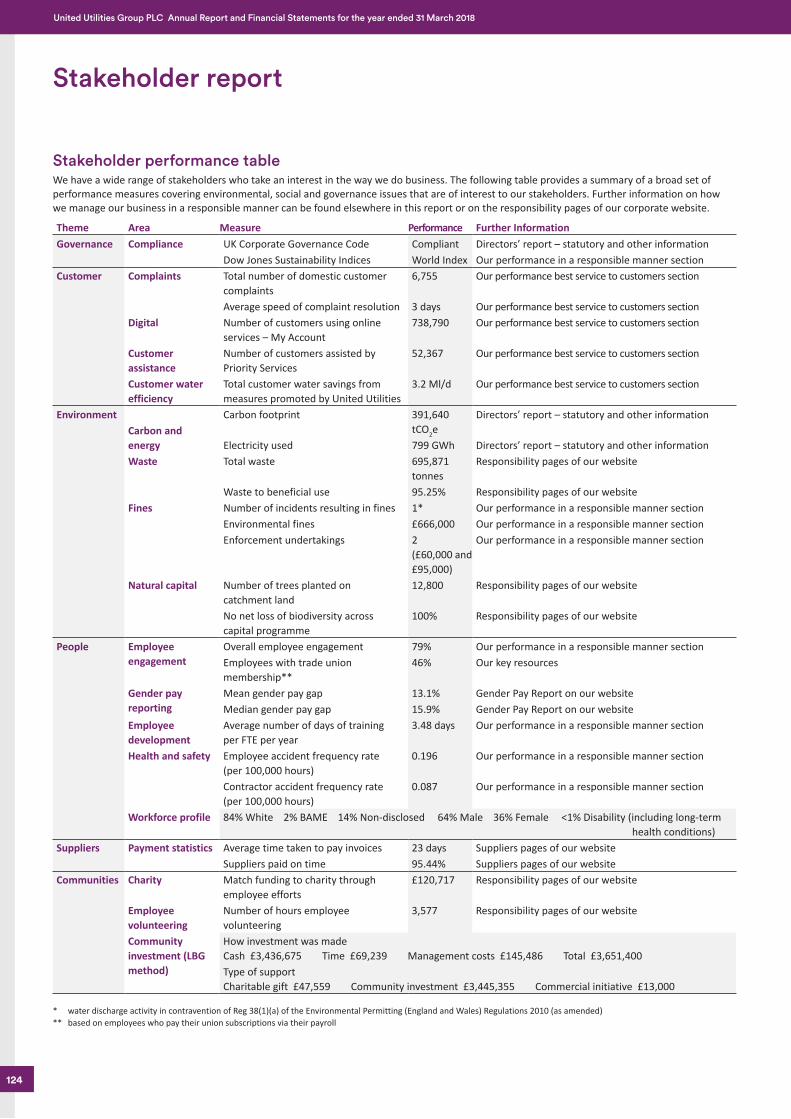
Job Number 4 June 2018 8:56 AM Proof 3 Job Number 4 June 2018 8:56 AM Proof 3
Stakeholder performance tableWe have a wide range of stakeholders who take an interest in the way we do business. The following table provides a summary of a broad set of performance measures covering environmental, social and governance issues that are of interest to our stakeholders. Further information on how we manage our business in a responsible manner can be found elsewhere in this report or on the responsibility pages of our corporate website.
Theme Area Measure Performance Further InformationGovernance Compliance UK Corporate Governance Code Compliant Directors’ report – statutory and other information
Dow Jones Sustainability Indices World Index Our performance in a responsible manner sectionCustomer Complaints Total number of domestic customer
complaints6,755 Our performance best service to customers section
Average speed of complaint resolution 3 days Our performance best service to customers section Digital Number of customers using online
services – My Account738,790 Our performance best service to customers section
Customer assistance
Number of customers assisted by Priority Services
52,367 Our performance best service to customers section
Customer water efficiency
Total customer water savings from measures promoted by United Utilities
3.2 Ml/d Our performance best service to customers section
EnvironmentCarbon and energy
Carbon footprint 391,640 tCO2e
Directors’ report – statutory and other information
Electricity used 799 GWh Directors’ report – statutory and other informationWaste Total waste 695,871
tonnes Responsibility pages of our website
Waste to beneficial use 95.25% Responsibility pages of our websiteFines Number of incidents resulting in fines 1* Our performance in a responsible manner section
Environmental fines £666,000 Our performance in a responsible manner sectionEnforcement undertakings 2
(£60,000 and £95,000)
Our performance in a responsible manner section
Natural capital Number of trees planted on catchment land
12,800 Responsibility pages of our website
No net loss of biodiversity across capital programme
100% Responsibility pages of our website
People Employee engagement
Overall employee engagement 79% Our performance in a responsible manner sectionEmployees with trade union membership**
46% Our key resources
Gender pay reporting
Mean gender pay gap 13.1% Gender Pay Report on our websiteMedian gender pay gap 15.9% Gender Pay Report on our website
Employee development
Average number of days of training per FTE per year
3.48 days Our performance in a responsible manner section
Health and safety Employee accident frequency rate (per 100,000 hours)
0.196 Our performance in a responsible manner section
Contractor accident frequency rate (per 100,000 hours)
0.087 Our performance in a responsible manner section
Workforce profile 84% White 2% BAME 14% Non-disclosed 64% Male 36% Female <1% Disability (including long-term health conditions)
Suppliers Payment statistics Average time taken to pay invoices 23 days Suppliers pages of our websiteSuppliers paid on time 95.44% Suppliers pages of our website
Communities Charity Match funding to charity through employee efforts
£120,717 Responsibility pages of our website
Employee volunteering
Number of hours employee volunteering
3,577 Responsibility pages of our website
Community investment (LBG method)
How investment was made Cash £3,436,675 Time £69,239 Management costs £145,486 Total £3,651,400Type of support Charitable gift £47,559 Community investment £3,445,355 Commercial initiative £13,000
* water discharge activity in contravention of Reg 38(1)(a) of the Environmental Permitting (England and Wales) Regulations 2010 (as amended)** based on employees who pay their union subscriptions via their payroll
Stakeholder report
124
United Utilities Group PLC Annual Report and Financial Statements for the year ended 31 March 2018
United Utilities Middle Section.indd 124 04/06/2018 13:05:49
Job Number 4 June 2018 8:56 AM Proof 3 Job Number 4 June 2018 8:56 AM Proof 3
The directors are responsible for preparing the annual report and the group and parent company financial statements in accordance with applicable law and regulations.
Company law requires the directors to prepare group and parent company financial statements for each financial year. Under that law they are required to prepare the group financial statements in accordance with International Financial Reporting Standards as adopted by the European Union (EU) (IFRSs as adopted by the EU) and applicable law and have elected to prepare the parent company financial statements on the same basis.
Under company law the directors must not approve the financial statements unless they are satisfied that they give a true and fair view of the state of affairs of the group and parent company and of their profit or loss for that period. In preparing each of the group and parent company financial statements, the directors are required to:
› Select suitable accounting policies and then apply them consistently; › Make judgements and estimates that are reasonable, relevant and
reliable; › State whether they have been prepared in accordance with IFRSs as
adopted by the EU; › Assess the group and parent company’s ability to continue as a going
concern, disclosing, as applicable, matters related to going concern; and
› Use the going concern basis of accounting unless they either intend to liquidate the group or the parent company or to cease operations, or have no realistic alternative but to do so.
The directors are responsible for keeping adequate accounting records that are sufficient to show and explain the parent company’s transactions and disclose with reasonable accuracy at any time the financial position of the parent company and enable them to ensure that its financial statements comply with the Companies Act 2006. They are responsible for such internal control as they determine is necessary to enable the preparation of financial statements that are free from material misstatement, whether due to fraud or error, and have general responsibility for taking such steps as are reasonably open to them to safeguard the assets of the group and to prevent and detect fraud and other irregularities.
Under applicable law and regulations, the directors are also responsible for preparing a strategic report, directors’ report, directors’ remuneration report and corporate governance statement that complies with that law and those regulations.
The directors are responsible for the maintenance and integrity of the corporate and financial information included on the company’s website. Legislation in the UK governing the preparation and dissemination of financial statements may differ from legislation in other jurisdictions.
Responsibility statement of the directors in respect of the annual financial report We confirm that to the best of our knowledge:
› The financial statements, prepared in accordance with the applicable set of accounting standards, give a true and fair view of the assets, liabilities, financial position and profit or loss of the company and the undertakings included in the consolidation taken as a whole; and
› The strategic report includes a fair review of the development and performance of the business and the position of the issuer and the undertakings included in the consolidation taken as a whole, together with a description of the principal risks and uncertainties that they face.
We consider the annual report and accounts, taken as a whole, is fair, balanced and understandable and provides the information necessary for shareholders to assess the group’s position and performance, business model and strategy.
Approved by the board on 23 May 2018 and signed on its behalf by:
Dr John McAdamChairman
Russ HouldenChief Financial Officer
Statement of directors’ responsibilities in respect of the annual report and the financial statements
125
Gov
erna
nce
Stock Code: UU. unitedutilities.com/corporate
United Utilities Middle Section.indd 125 04/06/2018 13:05:49

Job Number 1 June 2018 11:11 AM Proof 3 Job Number 1 June 2018 11:11 AM Proof 3United Utilities 2018 - Financial Statements.indd 126 6/1/2018 12:29:06 PM
Job Number 1 June 2018 11:11 AM Proof 3 Job Number 1 June 2018 11:11 AM Proof 3
Financial statementsIn this section you will find our full audited financial results for the year ended 31 March 2018.
Independent auditor’s report to the members of United Utilities Group PLC only 128Consolidated income statement 134Consolidated statement of comprehensive income 134Consolidated and company statements of financial position 135Consolidated statement of changes in equity 136Company statement of changes in equity 137Consolidated and company statements of cash flows 138Guide to detailed financial statements disclosures 139Accounting policies 140Notes to the financial statements 144Notes to the financial statements – appendices 157Five-year summary – unaudited 178Shareholder information 180
United Utilities 2018 - Financial Statements.indd 127 6/1/2018 12:29:07 PM
Job Number 1 June 2018 11:11 AM Proof 3 Job Number 1 June 2018 11:11 AM Proof 3
128
United Utilities Group PLC Annual Report and Financial Statements for the year ended 31 March 2018
Independent auditor’s report to the members of United Utilities Group PLC only
1. Our opinion is unmodifiedWe have audited the financial statements of United Utilities Group PLC (the Company) for the year ended 31 March 2018 which comprise the Consolidated income statement, Consolidated statement of comprehensive income, Consolidated and company statements of financial position, Consolidated and company statements of changes in equity, Consolidated and company statements of cash flows, and the related notes, including the accounting policies on page 140.
In our opinion: the financial statements give a true and fair view of the state of the
group’s and of the parent company’s affairs as at 31 March 2018 and of the group’s profit for the year then ended;
the group financial statements have been properly prepared in accordance with International Financial Reporting Standards as adopted by the European Union (IFRSs as adopted by the EU);
the parent company financial statements have been properly prepared in accordance with IFRSs as adopted by the EU and as applied in accordance with the provisions of the Companies Act 2006; and
the financial statements have been prepared in accordance with the requirements of the Companies Act 2006 and, as regards the group financial statements, Article 4 of the IAS Regulation.
Basis for opinionWe conducted our audit in accordance with International Standards on Auditing (UK) (ISAs (UK)) and applicable law. Our responsibilities are described below. We believe that the audit evidence we have obtained is a sufficient and appropriate basis for our opinion. Our audit opinion is consistent with our report to the audit committee.
We were appointed as auditor by the directors on 9 October 2017. The period of total uninterrupted engagement is for the seven financial years ended 31 March 2018. We have fulfilled our ethical responsibilities under, and we remain independent of the group in accordance with, UK ethical requirements including the FRC Ethical Standard as applied to listed public interest entities. No non-audit services prohibited by that standard were provided.
OverviewMateriality: group financial statements as a whole
£19.0m (2017: £19.5m)4.9% (2017: 4.7%) of normalised group profit before tax
Coverage 98% (2017: 98%) of group profit before taxRisks of material misstatement vs 2017Recurring risks Revenue recognition and
allowance for customer debts
(no change)Capitalisation of costs relating to the capital programme
Retirement benefit obligation valuation
Water Plus joint venture investment and loan carrying value
New risk
Recoverability of intercompany debtors and investment in United Utilities PLC (parent company only)
2. Key audit matters: our assessment of risks of material misstatementKey audit matters are those matters that, in our professional judgement, were of most significance in the audit of the financial statements and include the most significant assessed risks of material misstatement (whether or not due to fraud) identified by us, including those which had the greatest effect on: the overall audit strategy; the allocation of resources in the audit; and directing the efforts of the engagement team. We summarise below the key audit matters, in decreasing order of audit significance, in arriving at our audit opinion above, together with our key audit procedures to address those matters and, as required for public interest entities, our results from those procedures. These matters were addressed, and our results are based on procedures undertaken, in the context of, and solely for the purpose of, our audit of the financial statements as a whole, and in forming our opinion thereon, and consequently are incidental to that opinion, and we do not provide a separate opinion on these matters.
United Utilities 2018 - Financial Statements.indd 128 6/1/2018 12:29:08 PM
Job Number 1 June 2018 11:11 AM Proof 3 Job Number 1 June 2018 11:11 AM Proof 3
129
Fina
ncia
l sta
tem
ents
unitedutilities.com/corporate Stock Code: UU.
The risk Our responseRevenue recognition and provisions for household customer debt
Revenue not recognised: £20.3 million (2017: £28.3 million)
Provision for customer debts: £63.4 million (2017: £85.4 million)
Refer to page 87 (Audit Committee Report), page 140 (accounting policy) and pages 145 and 152 (financial disclosures).
Subjective estimation:
Household revenue recognition and provision for household customer debts are key areas of judgement, particularly in relation to:
identifying properties where there is little prospect cash will be received for revenue that has been billed due to either the occupier not being able to be identified or a past history of non-payment of bills relating to that property; and
assessing the recoverability of trade debtors.
Our procedures included:
Accounting analysis – Assessing whether appropriate revenue recognition policies are applied through comparison with relevant accounting standards including the policy of not recognising revenue where it is not probable that cash will be received;
Control observation – Testing the group’s controls over revenue recognition and provision for customer debts, including reconciliations between sales and cash receipts systems and the general ledger;
Methodology choice – Assessing the appropriateness of the customer debt provisioning policy based on historical cash collections, credits, re-bills and write-off information; and
Assessing transparency – Assessing the adequacy of the group’s disclosures of its revenue recognition and customer debt provisioning policies, including the judgement involved in recording revenue and estimation uncertainty of the bad debt provision.
Our results:
In respect of the recognition of revenue only where it is probable that economic benefits/cash will be received, we found the amount of revenue recognised to be appropriate; and
From the evidence obtained, we considered the level of bad debt provisioning to be acceptable.
Capitalisation of costs relating to the capital programme
£741.3 million (2017: £717.9 million)
Refer to page 87 (Audit Committee Report), pages 141 and 174 (accounting policy) and page 149 (financial disclosures).
Subjective classification:
The group has a substantial capital programme which has been agreed with the Water Services Regulation Authority (Ofwat) and therefore incurs significant annual expenditure in relation to the development and maintenance of both infrastructure and non-infrastructure assets.
The determination of in year project costs as capital or operating expenditure is inherently judgemental. Costs capitalised include an allocation of overhead costs, relating to the proportion of time spent by support function staff, which is also inherently judgemental.
Our procedures included:
Accounting analysis – Assessing the group’s capitalisation policy for compliance with relevant accounting standards;
Control observation – Testing controls over the application of the policy in the period including review of project business case submissions, and attending a sample of capital approval meetings to observe the judgements made and evaluating the documented conclusions;
Tests of details – Critically assessing the costs capitalised for a sample of projects against the capitalisation policy;
Tests of details – Identify and assess the impact of changing capitalisation rates for all existing projects;
Historical comparisons – Critically assess the proportion of overhead costs by business area which are capitalised using historical comparisons and expected changes based upon corroborated enquiry and our sector knowledge; and
Assessing transparency – Assessing the adequacy of the group’s disclosures of its capitalisation policy and other related disclosures.
Our results:
We found the group’s treatment of expenditure as capital or operating to be acceptable.
United Utilities 2018 - Financial Statements.indd 129 6/1/2018 12:29:08 PM
Job Number 1 June 2018 11:11 AM Proof 3 Job Number 1 June 2018 11:11 AM Proof 3
130
United Utilities Group PLC Annual Report and Financial Statements for the year ended 31 March 2018
Independent auditor’s report to the members of United Utilities Group PLC only
The risk Our responseRetirement benefit obligation valuation
£3,498.7 million (2017: £3,615.5 million)
Refer to page 87 (Audit Committee Report), pages 141 and 176 (accounting policy) and page 154 (financial disclosures).
Estimation in valuation of retirement obligations:
The group’s retirement benefit surplus is the difference between the fair value of the pension assets and the retirement benefit obligation.
Significant estimates are made in valuing the group’s retirement benefit obligation. Small changes in assumptions and estimates used to value the group’s pension obligation would have a significant effect on the group’s financial position.
Our procedures included:
Benchmarking assumptions – Challenging the key assumptions supporting the group’s retirement benefit obligations valuation with input from our own actuarial specialists, including comparing the discount rate, inflation rate and life expectancy assumptions used against externally derived data. We performed a comparison of key assumptions against our own benchmark ranges which are derived from available data as well as comparing against those used by other companies reporting on the same period; and
Assessing transparency – Assessing the group’s disclosure in respect of the sensitivity of the liabilities to changes in the key assumptions.
Our results:
The results of our testing were satisfactory and we found the obligation recognised to be acceptable.
Water Plus joint venture investment and loans carrying value
£39.3 million investment in joint venture and £135.8 million loans to joint venture (2017: £39.1 million and £118.5 million respectively)
Refer to page 87 (Audit Committee Report), pages 141 and 173 (accounting policy) and page 150 (financial disclosures).
Forecast-based estimate valuation:
The group’s investment in the equity of, and loans to Water Plus is significant. The estimated recoverable amount is subjective due to the inherent uncertainty involved in forecasting future cash flows. The estimate of the investment in Water Plus is also sensitive to the discount rate used.
Our procedures included:
Benchmarking assumptions – Evaluating assumptions used, in particular those relating to discount rate, terminal growth rate, and the normalised level of working capital in the business, using our own valuation specialist and comparing to externally derived data;
Sensitivity analysis – Performing sensitivity analysis on the assumptions noted above; and
Assessing transparency – Assessing whether the group’s disclosures are appropriate.
Our results:
We found the resulting estimate of the recoverable amount of the total investment and loans in the Water Plus joint venture to be acceptable.
Recoverability of intercompany debtors and investment in United Utilities PLC
Investment in subsidiary and participating interests £6,326.8 million (2017: £6,326.8 million)
Amounts owed by subsidiary undertakings £74.2 million (2017: £69.0 million)
Refer to page 175 (accounting policy) and page 151 (financial disclosures).
Material amounts:
The carrying amount of the company’s investments in subsidiaries held at cost less impairment and intercompany receivables represent 100 per cent (2017: 100 per cent) of the company’s total assets.
We do not consider the valuation of these investments and recovery of intercompany receivables to be at a high risk of significant misstatement, or to be subject to a significant level of judgement. However, due to their materiality in the context of the company financial statements, this is considered to be the area that had the greatest effect on our overall parent company audit.
Our procedures included:
Tests of detail: Comparing the carrying value of intercompany investments and receivables to the relevant subsidiary balance sheet to identify whether their net assets, being an approximation of their minimum recoverable amount, were in excess of the investment carrying amounts and whether the intercompany receivables were included in the net assets.
Our results:
We found the assessment of the amounts recorded to be acceptable.
United Utilities 2018 - Financial Statements.indd 130 6/1/2018 12:29:08 PM
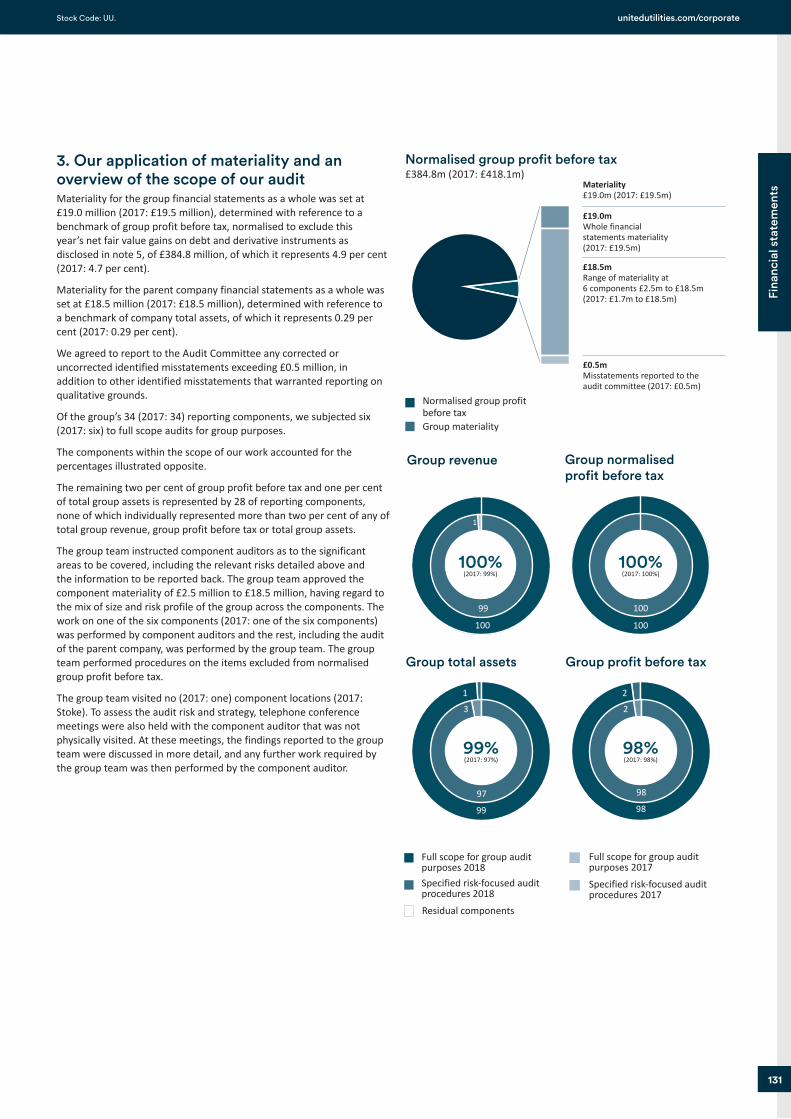
Job Number 1 June 2018 11:11 AM Proof 3 Job Number 1 June 2018 11:11 AM Proof 3
131
Fina
ncia
l sta
tem
ents
unitedutilities.com/corporate Stock Code: UU.
3. Our application of materiality and an overview of the scope of our auditMateriality for the group financial statements as a whole was set at £19.0 million (2017: £19.5 million), determined with reference to a benchmark of group profit before tax, normalised to exclude this year’s net fair value gains on debt and derivative instruments as disclosed in note 5, of £384.8 million, of which it represents 4.9 per cent (2017: 4.7 per cent).
Materiality for the parent company financial statements as a whole was set at £18.5 million (2017: £18.5 million), determined with reference to a benchmark of company total assets, of which it represents 0.29 per cent (2017: 0.29 per cent).
We agreed to report to the Audit Committee any corrected or uncorrected identified misstatements exceeding £0.5 million, in addition to other identified misstatements that warranted reporting on qualitative grounds.
Of the group’s 34 (2017: 34) reporting components, we subjected six (2017: six) to full scope audits for group purposes.
The components within the scope of our work accounted for the percentages illustrated opposite.
The remaining two per cent of group profit before tax and one per cent of total group assets is represented by 28 of reporting components, none of which individually represented more than two per cent of any of total group revenue, group profit before tax or total group assets.
The group team instructed component auditors as to the significant areas to be covered, including the relevant risks detailed above and the information to be reported back. The group team approved the component materiality of £2.5 million to £18.5 million, having regard to the mix of size and risk profile of the group across the components. The work on one of the six components (2017: one of the six components) was performed by component auditors and the rest, including the audit of the parent company, was performed by the group team. The group team performed procedures on the items excluded from normalised group profit before tax.
The group team visited no (2017: one) component locations (2017: Stoke). To assess the audit risk and strategy, telephone conference meetings were also held with the component auditor that was not physically visited. At these meetings, the findings reported to the group team were discussed in more detail, and any further work required by the group team was then performed by the component auditor.
Normalised group profit before tax£384.8m (2017: £418.1m)
Normalised group profit before taxGroup materiality
Materiality£19.0m (2017: £19.5m)
£19.0mWhole financial statements materiality (2017: £19.5m)
£18.5mRange of materiality at 6 components £2.5m to £18.5m (2017: £1.7m to £18.5m)
£0.5mMisstatements reported to the audit committee (2017: £0.5m)
100
1
99
100%(2017: 99%)
Group revenue
100
100
100%(2017: 100%)
Group normalised profit before tax
1
3
99
97
99%(2017: 97%)
Group total assets
Full scope for group audit purposes 2018Specified risk-focused audit procedures 2018
Full scope for group audit purposes 2017
Residual components
2
2
98
98
98%(2017: 98%)
Group profit before tax
Specified risk-focused audit procedures 2017
United Utilities 2018 - Financial Statements.indd 131 6/1/2018 12:29:09 PM
Job Number 1 June 2018 11:11 AM Proof 3 Job Number 1 June 2018 11:11 AM Proof 3
132
United Utilities Group PLC Annual Report and Financial Statements for the year ended 31 March 2018
Independent auditor’s report to the members of United Utilities Group PLC only
4. We have nothing to report on going concernWe are required to report to you if:
we have anything material to add or draw attention to in relation to the directors’ statement on page 140 of the financial statements on the use of the going concern basis of accounting with no material uncertainties that may cast significant doubt over the group and company’s use of that basis for a period of at least 12 months from the date of approval of the financial statements; or
the related statement under the Listing Rules set out on pages 80 to 81 is materially inconsistent with our audit knowledge.
We have nothing to report in these respects.
5. We have nothing to report on the other information in the Annual ReportThe directors are responsible for the other information presented in the Annual Report together with the financial statements. Our opinion on the financial statements does not cover the other information and, accordingly, we do not express an audit opinion or, except as explicitly stated below, any form of assurance conclusion thereon.
Our responsibility is to read the other information and, in doing so, consider whether, based on our financial statements audit work, the information therein is materially misstated or inconsistent with the financial statements or our audit knowledge. Based solely on that work we have not identified material misstatements in the other information.
Strategic report and Directors’ reportBased solely on our work on the other information:
we have not identified material misstatements in the strategic report and the directors’ report;
in our opinion the information given in those reports for the financial year is consistent with the financial statements; and
in our opinion those reports have been prepared in accordance with the Companies Act 2006.
Directors’ remuneration reportIn our opinion the part of the Directors’ remuneration report to be audited has been properly prepared in accordance with the Companies Act 2006.
Disclosures of principal risks and longer-term viabilityBased on the knowledge we acquired during our financial statements audit, we have nothing material to add or draw attention to in relation to:
the directors’ confirmation within the long-term statement on page 81 that they have carried out a robust assessment of the principal risks facing the group, including those that would threaten its business model, future performance, solvency and liquidity;
the Principal Risks disclosures describing these risks and explaining how they are being managed and mitigated; and
the directors’ explanation in the long-term viability statement of how they have assessed the prospects of the group, over what period they have done so and why they considered that period to be appropriate, and their statement as to whether they have a reasonable expectation that the group will be able to continue in operation and meet its liabilities as they fall due over the period of their assessment, including any related disclosures drawing attention to any necessary qualifications or assumptions.
Under the Listing Rules we are required to review the long-term viability statement. We have nothing to report in this respect.
Corporate governance disclosures We are required to report to you if:
we have identified material inconsistencies between the knowledge we acquired during our financial statements audit and the directors’ statement that they consider that the annual report and financial statements taken as a whole is fair, balanced and understandable and provides the information necessary for shareholders to assess the group’s position and performance, business model and strategy; or
the section of the annual report describing the work of the Audit Committee does not appropriately address matters communicated by us to the Audit Committee.
We are required to report to you if the Corporate Governance Statement
does not properly disclose a departure from the 11 provisions of the UK Corporate Governance Code specified by the Listing Rules for our review.
We have nothing to report in these respects.
Based solely on our work on the other information described above:
with respect to the Corporate Governance Statement disclosures about internal control and risk management systems in relation to financial reporting processes and about share capital structures; we have not identified material misstatements therein; the information therein is consistent with the financial
statements; and in our opinion, the Corporate Governance Statement has been
prepared in accordance with relevant rules of the Disclosure Guidance and Transparency Rules of the Financial Conduct Authority.
6. We have nothing to report on the other matters on which we are required to report by exceptionUnder the Companies Act 2006, we are required to report to you if, in our opinion:
adequate accounting records have not been kept by the parent company, or returns adequate for our audit have not been received from branches not visited by us; or
the parent company financial statements and the part of the Directors’ Remuneration report to be audited are not in agreement with the accounting records and returns; or
certain disclosures of directors’ remuneration specified by law are not made; or
we have not received all the information and explanations we require for our audit.
We have nothing to report in these respects.
United Utilities 2018 - Financial Statements.indd 132 6/1/2018 12:29:09 PM
Job Number 1 June 2018 11:11 AM Proof 3 Job Number 1 June 2018 11:11 AM Proof 3
133
Fina
ncia
l sta
tem
ents
unitedutilities.com/corporate Stock Code: UU.
7. Respective responsibilitiesDirectors’ responsibilitiesAs explained more fully in their statement set out on page 125, the directors are responsible for: the preparation of the financial statements including being satisfied that they give a true and fair view; such internal control as they determine is necessary to enable the preparation of financial statements that are free from material misstatement, whether due to fraud or error; assessing the group and parent company’s ability to continue as a going concern, disclosing, as applicable, matters related to going concern; and using the going concern basis of accounting unless they either intend to liquidate the group or the parent company or to cease operations, or have no realistic alternative but to do so.
Auditor’s responsibilitiesOur objectives are to obtain reasonable assurance about whether the financial statements as a whole are free from material misstatement, whether due to fraud or other irregularities (see below), or error, and to issue our opinion in an auditor’s report. Reasonable assurance is a high level of assurance, but does not guarantee that an audit conducted in accordance with ISAs (UK) will always detect a material misstatement when it exists.
Misstatements can arise from fraud, other irregularities or error and are considered material if, individually or in aggregate, they could reasonably be expected to influence the economic decisions of users taken on the basis of the financial statements.
A fuller description of our responsibilities is provided on the FRC’s website at www.frc.org.uk/auditorsresponsibilities.
Irregularities – ability to detectWe identified areas of laws and regulations that could reasonably be expected to have a material effect on the financial statements from our sector experience and through discussion with the directors and other management (as required by auditing standards).
We had regard to laws and regulations in areas that directly affect the financial statements, including financial reporting (including related company legislation) and taxation legislation. We considered the extent of compliance with those laws and regulations as part of our procedures on the related financial statement items.
In addition, we considered the impact of laws and regulations in the specific areas of environmental law, health and safety, anti-bribery, employment law, regulatory capital and liquidity and certain aspects of company legislation recognising the financial and regulated nature of the group’s activities and its legal form. With the exception of any known or possible non-compliance and, as required by auditing standards, our work in respect of these was limited to enquiry of the directors and other management and inspection of regulatory and legal correspondence. We considered the effect of any known or possible non-compliance in these areas as part of our procedures on the related financial statement items.
We communicated identified laws and regulations throughout our team and remained alert to any indications of non-compliance throughout the audit. This included communication from the group to component audit teams of relevant laws and regulations identified at group level, with a request to report on any indications of potential existence of non-compliance with relevant laws and regulations (irregularities) in these areas, or other areas directly identified by the component team.
As with any audit, there remained a higher risk of non-detection of non-compliance with relevant laws and regulations, as these may involve collusion, forgery, intentional omissions, misrepresentations, or the override of internal controls.
8. The purpose of our audit work and to whom we owe our responsibilitiesThis report is made solely to the Company’s members, as a body, in accordance with Chapter 3 of Part 16 of the Companies Act 2006. Our audit work has been undertaken so that we might state to the Company’s members those matters we are required to state to them in an auditor’s report and for no other purpose. To the fullest extent permitted by law, we do not accept or assume responsibility to anyone other than the Company and the Company’s members, as a body, for our audit work, for this report, or for the opinions we have formed.
William Meredith (Senior Statutory Auditor)for and on behalf of KPMG LLP, Statutory AuditorChartered AccountantsSt Peter’s Square, Manchester, M2 3AE23 May 2018
United Utilities 2018 - Financial Statements.indd 133 6/1/2018 12:29:09 PM
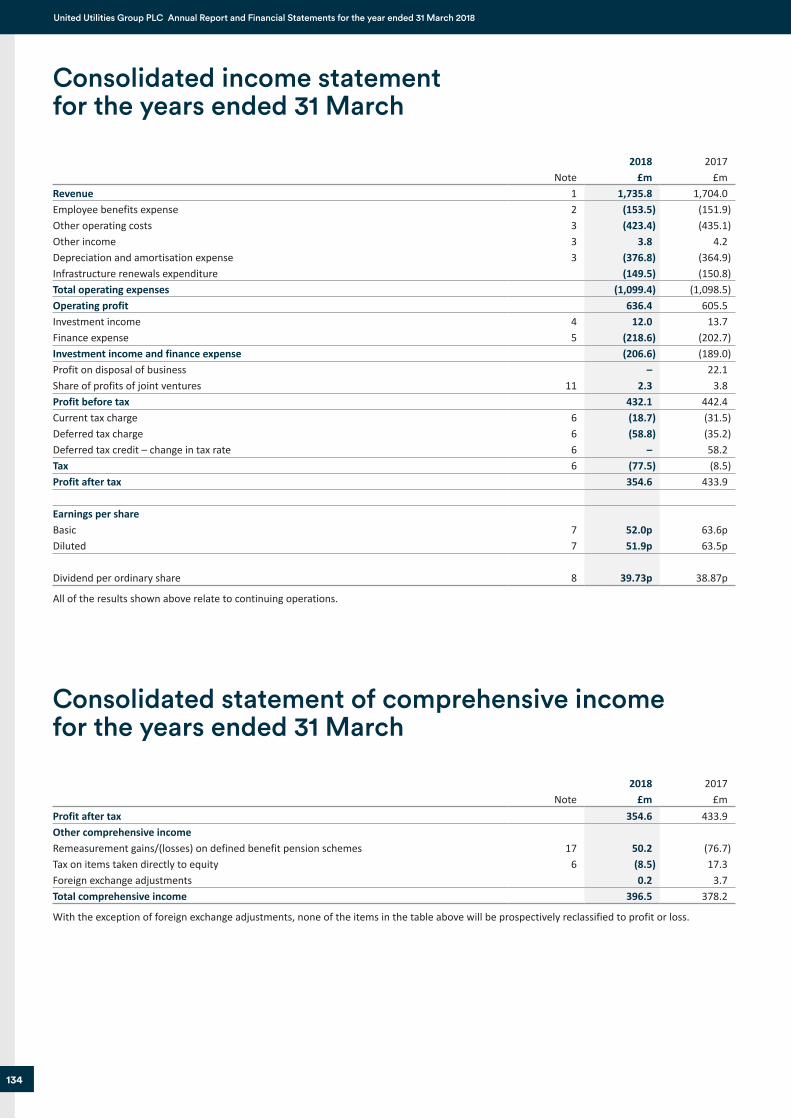
Job Number 1 June 2018 11:11 AM Proof 3 Job Number 1 June 2018 11:11 AM Proof 3
134
United Utilities Group PLC Annual Report and Financial Statements for the year ended 31 March 2018
Consolidated statement of comprehensive income for the years ended 31 March
Consolidated income statement for the years ended 31 March
Note2018
£m2017
£mRevenue 1 1,735.8 1,704.0Employee benefits expense 2 (153.5) (151.9)Other operating costs 3 (423.4) (435.1)Other income 3 3.8 4.2Depreciation and amortisation expense 3 (376.8) (364.9)Infrastructure renewals expenditure (149.5) (150.8)Total operating expenses (1,099.4) (1,098.5)Operating profit 636.4 605.5Investment income 4 12.0 13.7Finance expense 5 (218.6) (202.7)Investment income and finance expense (206.6) (189.0)Profit on disposal of business – 22.1Share of profits of joint ventures 11 2.3 3.8Profit before tax 432.1 442.4Current tax charge 6 (18.7) (31.5)Deferred tax charge 6 (58.8) (35.2)Deferred tax credit – change in tax rate 6 – 58.2Tax 6 (77.5) (8.5)Profit after tax 354.6 433.9
Earnings per shareBasic 7 52.0p 63.6pDiluted 7 51.9p 63.5p
Dividend per ordinary share 8 39.73p 38.87p
All of the results shown above relate to continuing operations.
Note2018
£m2017
£mProfit after tax 354.6 433.9Other comprehensive incomeRemeasurement gains/(losses) on defined benefit pension schemes 17 50.2 (76.7)Tax on items taken directly to equity 6 (8.5) 17.3Foreign exchange adjustments 0.2 3.7Total comprehensive income 396.5 378.2
With the exception of foreign exchange adjustments, none of the items in the table above will be prospectively reclassified to profit or loss.
United Utilities 2018 - Financial Statements.indd 134 6/1/2018 12:29:09 PM
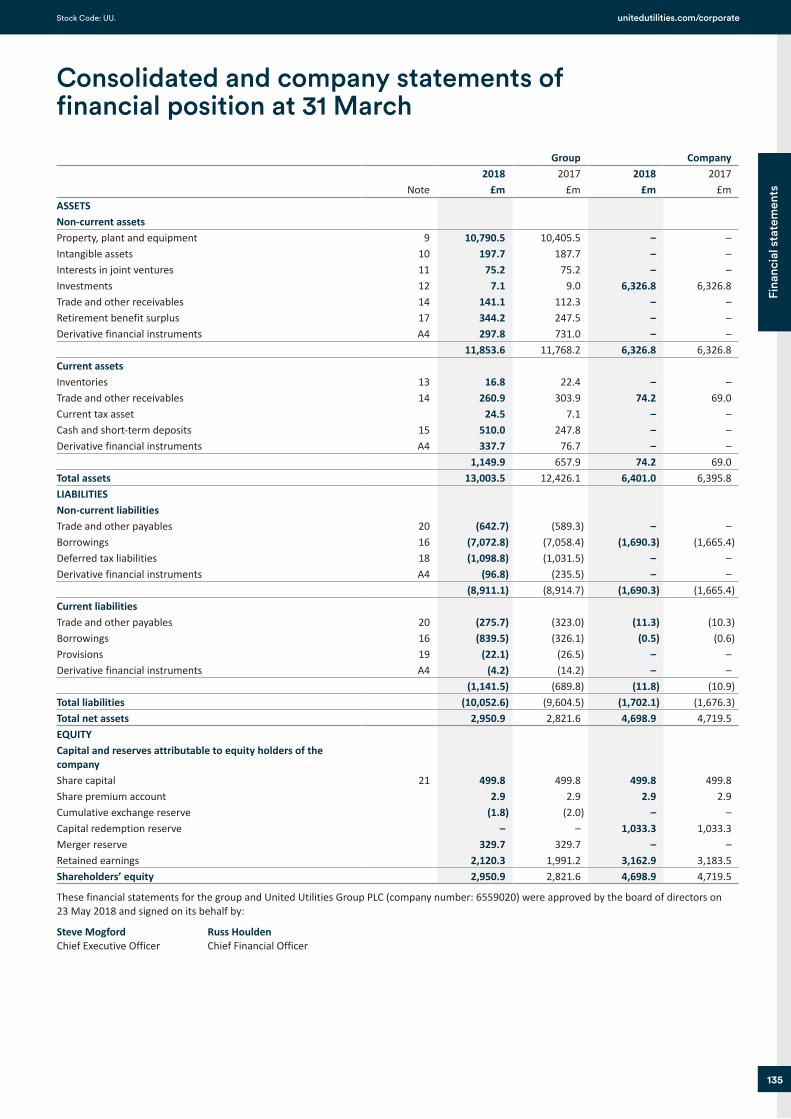
Job Number 1 June 2018 11:11 AM Proof 3 Job Number 1 June 2018 11:11 AM Proof 3
135
Fina
ncia
l sta
tem
ents
unitedutilities.com/corporate Stock Code: UU.
Consolidated and company statements of financial position at 31 March
Group Company
Note2018
£m2017
£m2018
£m2017
£mASSETSNon-current assetsProperty, plant and equipment 9 10,790.5 10,405.5 – –Intangible assets 10 197.7 187.7 – –Interests in joint ventures 11 75.2 75.2 – –Investments 12 7.1 9.0 6,326.8 6,326.8Trade and other receivables 14 141.1 112.3 – –Retirement benefit surplus 17 344.2 247.5 – –Derivative financial instruments A4 297.8 731.0 – –
11,853.6 11,768.2 6,326.8 6,326.8Current assetsInventories 13 16.8 22.4 – –Trade and other receivables 14 260.9 303.9 74.2 69.0Current tax asset 24.5 7.1 – –Cash and short-term deposits 15 510.0 247.8 – –Derivative financial instruments A4 337.7 76.7 – –
1,149.9 657.9 74.2 69.0Total assets 13,003.5 12,426.1 6,401.0 6,395.8LIABILITIESNon-current liabilitiesTrade and other payables 20 (642.7) (589.3) – –Borrowings 16 (7,072.8) (7,058.4) (1,690.3) (1,665.4)Deferred tax liabilities 18 (1,098.8) (1,031.5) – –Derivative financial instruments A4 (96.8) (235.5) – –
(8,911.1) (8,914.7) (1,690.3) (1,665.4)Current liabilitiesTrade and other payables 20 (275.7) (323.0) (11.3) (10.3)Borrowings 16 (839.5) (326.1) (0.5) (0.6)Provisions 19 (22.1) (26.5) – –Derivative financial instruments A4 (4.2) (14.2) – –
(1,141.5) (689.8) (11.8) (10.9)Total liabilities (10,052.6) (9,604.5) (1,702.1) (1,676.3)Total net assets 2,950.9 2,821.6 4,698.9 4,719.5EQUITYCapital and reserves attributable to equity holders of the companyShare capital 21 499.8 499.8 499.8 499.8Share premium account 2.9 2.9 2.9 2.9Cumulative exchange reserve (1.8) (2.0) – –Capital redemption reserve – – 1,033.3 1,033.3Merger reserve 329.7 329.7 – –Retained earnings 2,120.3 1,991.2 3,162.9 3,183.5Shareholders’ equity 2,950.9 2,821.6 4,698.9 4,719.5
These financial statements for the group and United Utilities Group PLC (company number: 6559020) were approved by the board of directors on 23 May 2018 and signed on its behalf by:
Steve Mogford Russ HouldenChief Executive Officer Chief Financial Officer
United Utilities 2018 - Financial Statements.indd 135 6/1/2018 12:29:10 PM
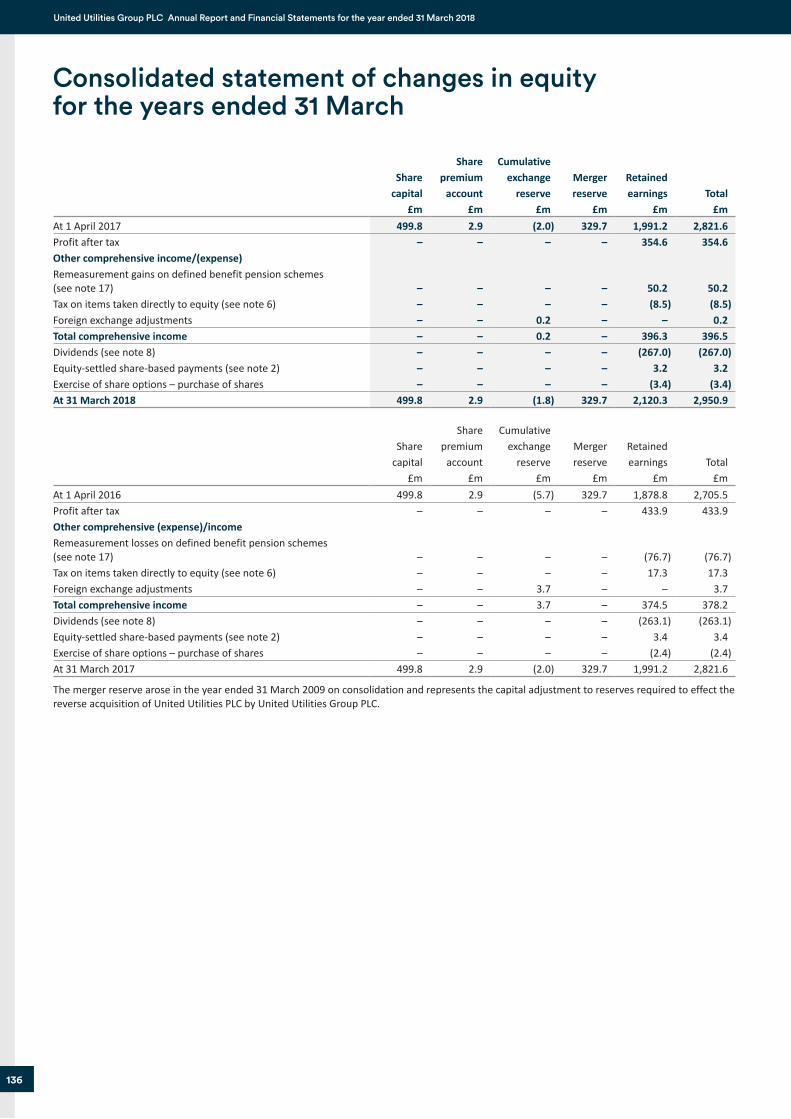
Job Number 1 June 2018 11:11 AM Proof 3 Job Number 1 June 2018 11:11 AM Proof 3
136
United Utilities Group PLC Annual Report and Financial Statements for the year ended 31 March 2018
Consolidated statement of changes in equity for the years ended 31 March
Share capital
£m
Share premium
account £m
Cumulative exchange
reserve £m
Merger reserve
£m
Retained earnings
£mTotal
£mAt 1 April 2017 499.8 2.9 (2.0) 329.7 1,991.2 2,821.6Profit after tax – – – – 354.6 354.6Other comprehensive income/(expense)Remeasurement gains on defined benefit pension schemes (see note 17) – – – – 50.2 50.2Tax on items taken directly to equity (see note 6) – – – – (8.5) (8.5)Foreign exchange adjustments – – 0.2 – – 0.2Total comprehensive income – – 0.2 – 396.3 396.5Dividends (see note 8) – – – – (267.0) (267.0)Equity-settled share-based payments (see note 2) – – – – 3.2 3.2Exercise of share options – purchase of shares – – – – (3.4) (3.4)At 31 March 2018 499.8 2.9 (1.8) 329.7 2,120.3 2,950.9
Share capital
£m
Share premium
account £m
Cumulative exchange
reserve £m
Merger reserve
£m
Retained earnings
£mTotal
£mAt 1 April 2016 499.8 2.9 (5.7) 329.7 1,878.8 2,705.5Profit after tax – – – – 433.9 433.9Other comprehensive (expense)/incomeRemeasurement losses on defined benefit pension schemes (see note 17) – – – – (76.7) (76.7)Tax on items taken directly to equity (see note 6) – – – – 17.3 17.3Foreign exchange adjustments – – 3.7 – – 3.7Total comprehensive income – – 3.7 – 374.5 378.2Dividends (see note 8) – – – – (263.1) (263.1)Equity-settled share-based payments (see note 2) – – – – 3.4 3.4Exercise of share options – purchase of shares – – – – (2.4) (2.4)At 31 March 2017 499.8 2.9 (2.0) 329.7 1,991.2 2,821.6
The merger reserve arose in the year ended 31 March 2009 on consolidation and represents the capital adjustment to reserves required to effect the reverse acquisition of United Utilities PLC by United Utilities Group PLC.
United Utilities 2018 - Financial Statements.indd 136 6/1/2018 12:29:10 PM
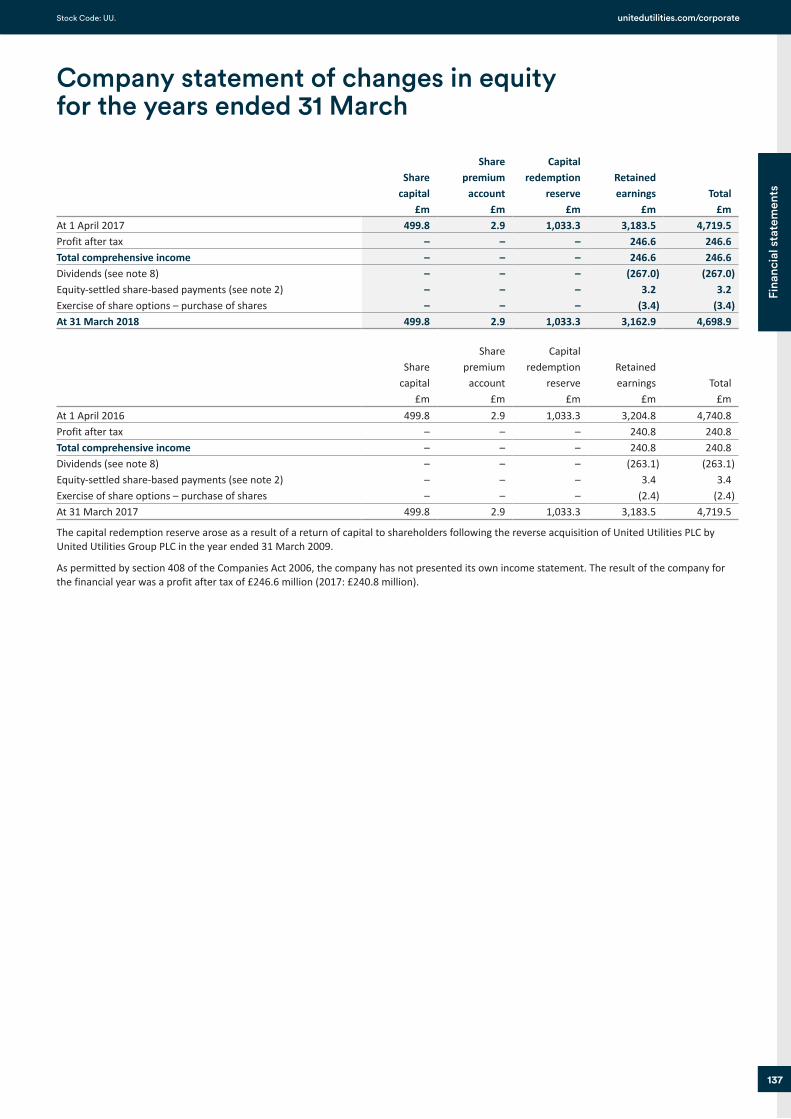
Job Number 1 June 2018 11:11 AM Proof 3 Job Number 1 June 2018 11:11 AM Proof 3
137
Fina
ncia
l sta
tem
ents
unitedutilities.com/corporate Stock Code: UU.
Company statement of changes in equity for the years ended 31 March
Share capital
£m
Share premium
account £m
Capital redemption
reserve £m
Retained earnings
£mTotal
£mAt 1 April 2017 499.8 2.9 1,033.3 3,183.5 4,719.5Profit after tax – – – 246.6 246.6Total comprehensive income – – – 246.6 246.6Dividends (see note 8) – – – (267.0) (267.0)Equity-settled share-based payments (see note 2) – – – 3.2 3.2Exercise of share options – purchase of shares – – – (3.4) (3.4)At 31 March 2018 499.8 2.9 1,033.3 3,162.9 4,698.9
Share capital
£m
Share premium
account £m
Capital redemption
reserve £m
Retained earnings
£mTotal
£mAt 1 April 2016 499.8 2.9 1,033.3 3,204.8 4,740.8Profit after tax – – – 240.8 240.8Total comprehensive income – – – 240.8 240.8Dividends (see note 8) – – – (263.1) (263.1)Equity-settled share-based payments (see note 2) – – – 3.4 3.4Exercise of share options – purchase of shares – – – (2.4) (2.4)At 31 March 2017 499.8 2.9 1,033.3 3,183.5 4,719.5
The capital redemption reserve arose as a result of a return of capital to shareholders following the reverse acquisition of United Utilities PLC by United Utilities Group PLC in the year ended 31 March 2009.
As permitted by section 408 of the Companies Act 2006, the company has not presented its own income statement. The result of the company for the financial year was a profit after tax of £246.6 million (2017: £240.8 million).
United Utilities 2018 - Financial Statements.indd 137 6/1/2018 12:29:10 PM
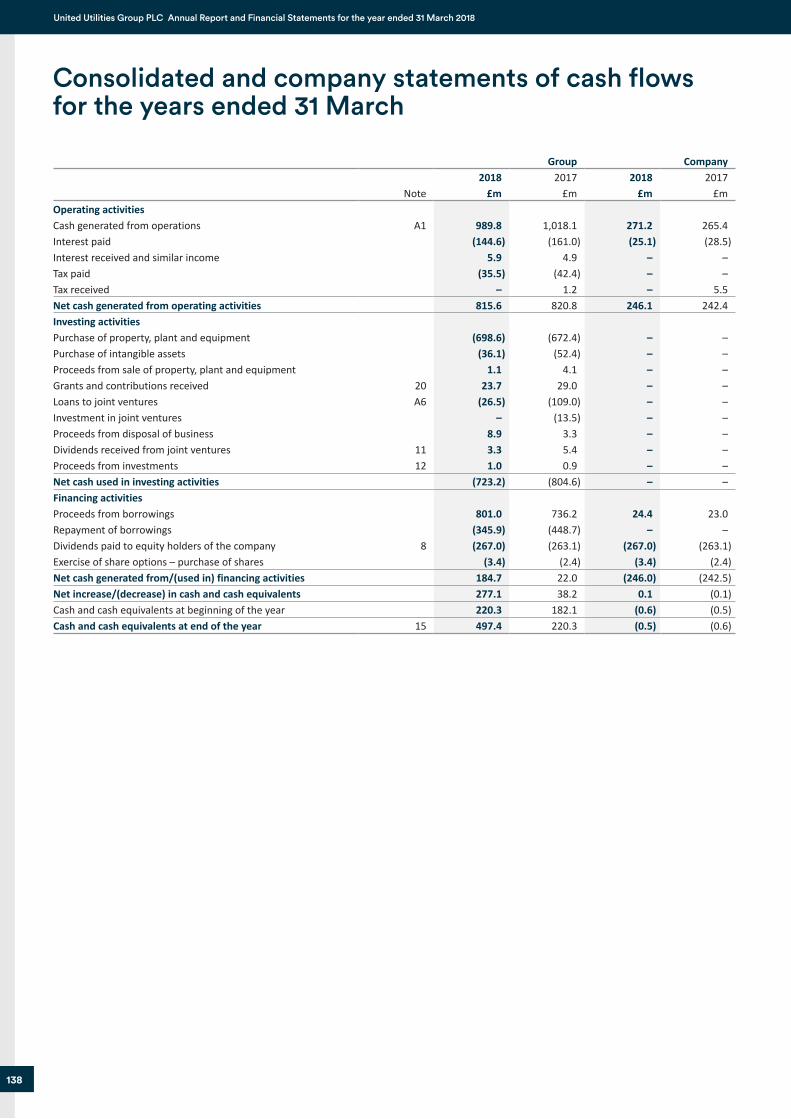
Job Number 1 June 2018 11:11 AM Proof 3 Job Number 1 June 2018 11:11 AM Proof 3
138
United Utilities Group PLC Annual Report and Financial Statements for the year ended 31 March 2018
Consolidated and company statements of cash flows for the years ended 31 March
Group Company
Note2018
£m2017
£m2018
£m2017
£mOperating activitiesCash generated from operations A1 989.8 1,018.1 271.2 265.4Interest paid (144.6) (161.0) (25.1) (28.5)Interest received and similar income 5.9 4.9 – –Tax paid (35.5) (42.4) – –Tax received – 1.2 – 5.5Net cash generated from operating activities 815.6 820.8 246.1 242.4Investing activitiesPurchase of property, plant and equipment (698.6) (672.4) – –Purchase of intangible assets (36.1) (52.4) – –Proceeds from sale of property, plant and equipment 1.1 4.1 – –Grants and contributions received 20 23.7 29.0 – –Loans to joint ventures A6 (26.5) (109.0) – –Investment in joint ventures – (13.5) – –Proceeds from disposal of business 8.9 3.3 – –Dividends received from joint ventures 11 3.3 5.4 – –Proceeds from investments 12 1.0 0.9 – –Net cash used in investing activities (723.2) (804.6) – –Financing activitiesProceeds from borrowings 801.0 736.2 24.4 23.0Repayment of borrowings (345.9) (448.7) – –Dividends paid to equity holders of the company 8 (267.0) (263.1) (267.0) (263.1)Exercise of share options – purchase of shares (3.4) (2.4) (3.4) (2.4)Net cash generated from/(used in) financing activities 184.7 22.0 (246.0) (242.5)Net increase/(decrease) in cash and cash equivalents 277.1 38.2 0.1 (0.1)Cash and cash equivalents at beginning of the year 220.3 182.1 (0.6) (0.5)Cash and cash equivalents at end of the year 15 497.4 220.3 (0.5) (0.6)
United Utilities 2018 - Financial Statements.indd 138 6/1/2018 12:29:10 PM
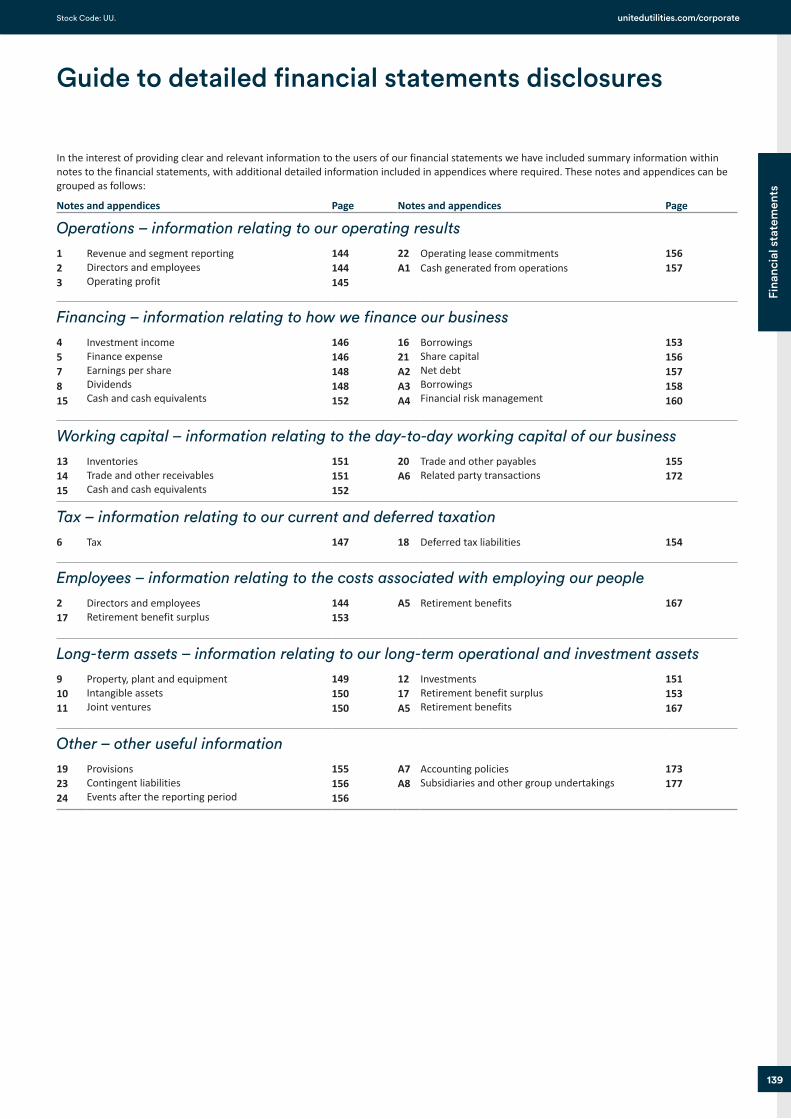
Job Number 1 June 2018 11:11 AM Proof 3 Job Number 1 June 2018 11:11 AM Proof 3
139
Fina
ncia
l sta
tem
ents
unitedutilities.com/corporate Stock Code: UU.
Guide to detailed financial statements disclosures
In the interest of providing clear and relevant information to the users of our financial statements we have included summary information within notes to the financial statements, with additional detailed information included in appendices where required. These notes and appendices can be grouped as follows:
Notes and appendices Page Notes and appendices Page
Operations – information relating to our operating results1 2 3
Revenue and segment reporting Directors and employees Operating profit
144 144 145
22 A1
Operating lease commitments Cash generated from operations
156 157
Financing – information relating to how we finance our business4 5 7 8 15
Investment income Finance expense Earnings per share Dividends Cash and cash equivalents
146 146 148 148 152
16 21 A2 A3 A4
Borrowings Share capital Net debt Borrowings Financial risk management
153 156 157 158 160
Working capital – information relating to the day-to-day working capital of our business13 14 15
Inventories Trade and other receivables Cash and cash equivalents
151 151 152
20 A6
Trade and other payables Related party transactions
155 172
Tax – information relating to our current and deferred taxation6 Tax 147 18 Deferred tax liabilities 154
Employees – information relating to the costs associated with employing our people2 17
Directors and employees Retirement benefit surplus
144 153
A5 Retirement benefits 167
Long-term assets – information relating to our long-term operational and investment assets9 10 11
Property, plant and equipment Intangible assets Joint ventures
149 150 150
12 17 A5
Investments Retirement benefit surplus Retirement benefits
151 153 167
Other – other useful information19 23 24
Provisions Contingent liabilities Events after the reporting period
155 156 156
A7 A8
Accounting policies Subsidiaries and other group undertakings
173 177
United Utilities 2018 - Financial Statements.indd 139 6/1/2018 12:29:10 PM
Job Number 1 June 2018 11:11 AM Proof 3 Job Number 1 June 2018 11:11 AM Proof 3
140
United Utilities Group PLC Annual Report and Financial Statements for the year ended 31 March 2018
Accounting policies
The principal accounting policies adopted in the preparation of these financial statements are set out below. Further detail can be found in note A7.
Basis of preparationThe financial statements have been prepared in accordance with International Financial Reporting Standards (IFRSs) as adopted by the European Union (EU). They have been prepared on the historical cost basis, except for the revaluation of financial instruments, accounting for the transfer of assets from customers and the revaluation of infrastructure assets to fair value on transition to IFRS.
The preparation of financial statements, in conformity with IFRS, requires management to make estimates and assumptions that affect the amounts of assets and liabilities at the date of the financial statements and the amounts of revenues and expenses during the reporting periods presented. Although these estimates are based on management’s best knowledge of the amount, event or actions, actual results ultimately may differ from these estimates.
The financial statements have been prepared on the going concern basis as the directors have a reasonable expectation that the group has adequate resources for a period of at least 12 months from the date of the approval of the financial statements, and that there are no material uncertainties to disclose.
In assessing the appropriateness of the going concern basis of accounting, the directors have reviewed the resources available to the group, taking account of the group’s financial projections, together with available cash and committed borrowing facilities as well as consideration of the group’s capital adequacy. The board has also considered the magnitude of potential impacts resulting from uncertain future events or changes in conditions, the likelihood of their occurrence and the likely effectiveness of mitigating actions that the directors would consider undertaking.
Adoption of new and revised standardsThe following standards, interpretations and amendments, effective for the year ended 31 March 2018, have had no material impact on the group’s financial statements:
Amendments to IAS 12 ‘Income Taxes’, clarifying how to account for deferred tax assets related to debt instruments measured at fair value;
Amendments to IAS 7 ‘Statement of Cash Flows’, requiring disclosures that enable evaluation of changes in liabilities arising from financing activities; and
Improvements to IFRS (2016) (Amendment to IFRS 12 ’Disclosure of Interests in Other Entities’, effective date 1 January 2018).
Critical accounting judgements and key sources of estimation uncertaintyIn the process of applying its accounting policies set out in note A7, the group is required to make certain estimates, judgements and assumptions that it believes are reasonable based on the information available. These judgements, estimates and assumptions affect the amounts of assets and liabilities at the date of the financial statements and the amounts of revenues and expenses recognised during the reporting periods presented. Changes to these estimates, judgements and assumptions could have a material effect on the financial statements.
On an ongoing basis, the group evaluates its estimates using historical experience, consultation with experts and other methods considered reasonable in the particular circumstances. Actual results may differ significantly from the estimates, the effect of which is recognised in the period in which the facts that give rise to the revision become known.
The following paragraphs detail the estimates and judgements the group believes to have the most significant impact on the annual results under IFRS.
Revenue recognition and allowance for doubtful receivablesAccounting judgement – The group recognises revenue generally at the time of delivery and when collection of the resulting receivable is reasonably assured. When the group considers that the criteria for revenue recognition are not met for a transaction, revenue recognition is delayed until such time as collectability is reasonably assured. Management considers that where customers have not paid their bills within the last two years, or have not cleared previously outstanding arrears aged more than two years, collectability is not deemed to be reasonably assured, and therefore amounts billed to these customers are not recognised as revenue. This resulted in £20.3 million of amounts billed not being recognised as revenue during the year (net of cash receipts and credits). Had management made an alternative judgement that collectability was not reasonably assured where customers had not paid within one year or within three years, or had not cleared previously outstanding arrears within these time frames, this would have resulted in £0.9 million of revenue not being recognised during the year or £9.4 million additional revenue being recognised during the year respectively. Payments received in advance of revenue recognition are recorded as deferred income.
Accounting estimate – At each reporting date, the company and each of its subsidiaries evaluate the estimated recoverability of trade receivables and record allowances for doubtful receivables based on experience. Judgements associated with these allowances are based on, amongst other things, a consideration of actual collection history. The actual level of receivables collected may differ from the estimated levels of recovery, which could impact operating results positively or negatively. At 31 March 2018, the allowance for doubtful receivables of £63.4 million was supported by a six-year cash collection projection. Based on a five-year or seven-year cash collection projection the allowance for doubtful receivables would have been £64.3 million or £62.4 million respectively.
Accounting estimate – United Utilities Water Limited raises bills in accordance with its entitlement to receive revenue in line with the limits established by the periodic regulatory price review processes. For water and wastewater customers with water meters, the receivable billed is dependent on the volume supplied including the sales value of an estimate of the units supplied between the date of the last meter reading and the billing date. Meters are read on a cyclical basis and the group recognises revenue for unbilled amounts based on estimated usage from the last billing through to each reporting date. The estimated usage is based on historical data, judgement and assumptions; actual results could differ from these estimates, which would result in operating revenues being adjusted in the period that the revision to the estimates is determined. Revenue recognised for unbilled amounts for these customers at 31 March 2018 was £40.2 million. Had actual consumption been five per cent higher or lower than the estimate of units supplied this would have resulted in revenue recognised for unbilled amounts being £3.8 million higher or lower respectively. For customers who do not have a meter, the receivable billed and revenue recognised is dependent on the rateable value of the property, as assessed by an independent rating officer.
Property, plant and equipmentAccounting judgement – The group recognises property, plant and equipment (PPE) on its water and wastewater infrastructure assets where such expenditure enhances or increases the capacity of the network, whereas any expenditure classed as maintenance is expensed in the period it is incurred. Determining enhancement from maintenance expenditure requires an accounting judgement, particularly when
United Utilities 2018 - Financial Statements.indd 140 6/1/2018 12:29:10 PM
Job Number 1 June 2018 11:11 AM Proof 3 Job Number 1 June 2018 11:11 AM Proof 3
141
Fina
ncia
l sta
tem
ents
unitedutilities.com/corporate Stock Code: UU.
projects have both elements within them. Enhancement spend was 30 per cent of total spend in relation to infrastructure assets during the year. A change of +/- one per cent would have resulted in £2.3 million less/more expenditure being charged to the income statement during the period. In addition, management capitalises time and resources incurred by the group’s support functions on capital programmes, which requires accounting judgements to be made in relation to the appropriate capitalisation rates. Support costs allocated to PPE represent 58 per cent of total support costs. A change in allocation of +/- one per cent would have resulted in £0.9 million less/more expenditure being charged to the income statement during the period.
Accounting estimate – The estimated useful economic lives of PPE and intangible assets is based on management’s experience. When management identifies that actual useful economic lives differ materially from the estimates used to calculate depreciation, that charge is adjusted prospectively. Due to the significance of PPE and intangibles investment to the group, variations between actual and estimated useful economic lives could impact operating results both positively and negatively. As such, this is a key source of estimation uncertainty, although historically few changes to estimated useful economic lives have been required. The depreciation and amortisation expense for the year was £376.8 million. A 10 per cent increase in average asset lives would have resulted in a £33.6 million reduction in this figure and a 10 per cent decrease in average asset lives would have resulted in a £42.3 million increase in this figure.
Retirement benefitsAccounting estimate – The group operates two defined benefit schemes which are independent of the group’s finances. Actuarial valuations of the schemes are carried out as determined by the trustees at intervals of not more than three years. Profit before tax and net assets are affected by the actuarial assumptions used. The key assumptions include: discount rates, pay growth, mortality, and increases to pensions in payment and deferred pensions. It should be noted that actual rates may differ from the assumptions used due to changing market and economic conditions and longer or shorter lives of participants and, as such, this represents a key source of estimation uncertainty. Sensitivities in respect of the assumptions used during the year are disclosed in note A5.
Joint venturesAccounting estimate – The group has interests relating to its joint ventures in the form of equity investments and loans receivable, the recoverability of which are considered with reference to the present value of the estimated future cash flows of the joint ventures. Management tests whether any impairment exists in relation to the equity investments and loans receivable if adverse changes in conditions associated with the joint ventures suggest that this is appropriate. The estimated present value of these future cash flows is sensitive to the discount rate and terminal growth rate used in the calculation, together with the normalised level of working capital in the joint venture, all of which require management judgement. Testing of the carrying value has been performed during the year, which has involved a number of scenarios being modelled. Based on this testing, management believes there is sufficient headroom to support the carrying value of the group’s interests in joint ventures, although it is possible, on the basis of existing knowledge, that outcomes within the next financial year that are different from the assumptions used could require a material adjustment to the carrying amount of assets.
Derivative financial instrumentsAccounting estimate – The model used to fair value the group’s derivative financial instruments requires management to estimate future cash flows based on applicable interest rate curves. Projected cash flows
are then discounted back using discount factors which are derived from the applicable interest rate curves adjusted for management’s estimate of counterparty and own credit risk, where appropriate. Sensitivities relating to derivative financial instruments are included in note A4.
Provisions and contingenciesAccounting estimates – The group is subject to a number of claims incidental to the normal conduct of its business, relating to and including commercial, contractual, employment and environmental matters, which are handled and defended in the ordinary course of business. The group routinely assesses the likelihood of any adverse judgements or outcomes to these matters as well as ranges of probable and reasonably estimated losses. Reasonable estimates are made by management after considering information including notifications, settlements, estimates performed by independent parties and legal counsel, available facts, identification of other potentially responsible parties and their ability to contribute, and prior experience. A provision is recognised when it is probable that an obligation exists for which a reliable estimate can be made after careful analysis of the individual matter. The required provision may change in the future due to new developments and as additional information becomes available. The provisions in respect of these claims, based on management’s best estimates, totalled £19.5 million as at 31 March 2018 as set out in the ‘Other’ category in note 19; due to an inherent level of estimation uncertainty management estimate that there is an 80 per cent probability that the outcomes of these items will fall within a range of £10 million to £25 million. Matters that either are possible obligations or do not meet the recognition criteria for a provision are disclosed as contingent liabilities in note 23, unless the possibility of transferring economic benefits is remote.
New and revised standards not yet effectiveAt the date of authorisation of these financial statements, the following relevant major standards were in issue but not yet effective. The directors anticipate that the group will adopt these standards on their effective dates.
IFRS 9 ‘Financial Instruments’The standard is effective for periods commencing on or after 1 January 2018. Under the provisions of this standard, where the group has chosen to measure borrowings at fair value through profit or loss, the portion of the change in fair value due to changes in the group’s own credit risk will be recognised in other comprehensive income rather than within profit or loss. If this standard had been adopted in the current year, a £24.0 million loss would have been recognised in other comprehensive income rather than within the income statement.
The new standard has moved to a principles-based approach to align hedge accounting to the risk management activities of the entity, broadening the scope of what can be included within a hedge relationship. This change will see the requirement for cross currency basis spread adjustments to be incorporated in the test for the effectiveness of a hedge to be removed. The portion of the change in fair value due to changes in the cross currency basis spread will be recognised in other comprehensive income rather than within profit or loss. If the standard had been adopted in the current year, an £8.2 million gain would have been recognised in other comprehensive income rather than within the income statement.
The changes in hedge accounting may present increased opportunities in the future to put non-financial risks into hedge relationships; however, we do not expect this to have any material impact on the financial statements in the period of initial application.
United Utilities 2018 - Financial Statements.indd 141 6/1/2018 12:29:11 PM
Job Number 1 June 2018 11:11 AM Proof 3 Job Number 1 June 2018 11:11 AM Proof 3
142
United Utilities Group PLC Annual Report and Financial Statements for the year ended 31 March 2018
In addition, the standard requires entities to use an expected credit loss model for impairment of financial assets instead of an incurred credit loss model. Consequently, judgement will be required in forming an expectation of future credit losses, particularly in relation to the group’s trade receivable balances. The group currently employs a model that uses historic cash collection rates to form an expectation of the estimated recoverability of trade receivables at a point in time as this is the best information available on which an expectation can be formed. As such, there will be no significant change to the model currently used, although the group will continue to explore ways in which it might be further refined, and will take into consideration any significant economic changes that may have a bearing on expected credit losses. This is not expected to have a material impact on the overall level of allowances for bad and doubtful receivables.
The group is not required to restate 2018 comparative information for balances affected by the adoption of IFRS 9 in the year of transition.
IFRS 15 ‘Revenue from Contracts with Customers’The standard is effective for periods commencing on or after 1 January 2018. This standard introduces a new revenue recognition model and replaces IAS 18 ‘Revenue’, IAS 11 ‘Construction Contracts’, IFRIC 13 ‘Customer Loyalty Programmes’, IFRIC 15 ‘Agreements for the Construction of Real Estate’, IFRIC 18 ‘Transfer of Assets from Customers’ and SIC-31 ‘Revenue – Barter Transactions Involving Advertising Services’. The standard requires revenue to be recognised in line with the satisfaction of performance obligations identified within contracts between an entity and its customers, at an amount that reflects the transaction price allocated to each performance obligation.
Particular challenges exist within the water industry as formal written contracts do not exist for most transactions with customers. Contracts are instead implied through statute and regulation. Judgement is therefore required in identifying the services contained within the contract and the customer with whom the contract is entered into, which in turn impacts on how the performance obligations are considered and therefore revenue recognised.
There are two main areas of the group’s activities that will be impacted by the adoption of IFRS 15:
Core water and wastewater services, accounting for more than 97 per cent of the group’s revenue under current accounting standards; and
Capital income streams accounting for less than 2 per cent of the group’s revenue in the income statement under current accounting standards, but where around £600 million of balances are currently included within deferred grants and contributions on the statement of financial position.
Other ancillary revenue streams are not expected to be significantly impacted, and no significant judgements are required in relation to these.
Core water and wastewater services – These services relate to: (i) the supply of clean water; and (ii) the removal and treatment of wastewater, with provision of each of these services deemed to be a distinct performance obligation under the contract with customers, though following the same pattern of transfer to the customer who simultaneously receives and consumes both of these services over time. No significant judgements are required in identifying customers of these services. In accordance with IFRS 15, revenue relating to these activities will be recognised over time as these performance obligations are satisfied. The adoption of the new standard is not expected to have any impact on the timing and amount of revenue recognised in these services.
Capital income – Capital income refers to the group’s income streams relating to transactions, typically with property developers, which impact the group’s capital network assets. It should be noted that this area remains under active consideration within the industry and the accounting profession more broadly, and that the accounting treatment ultimately adopted by the group in this area could therefore be impacted by the outcome of these ongoing discussions. We set out below our current assessment of the impact of IFRS 15 in relation to the transactions.
There are two categories of capital income, both of which will be impacted by the adoption of IFRS 15:
Diversions relating to the relocation of water and wastewater assets; and
Activities that facilitate the creation of an authorised connection through which properties can obtain water and wastewater services.
The adoption of IFRS 15 will not result in any net income statement impact relating to diversions, where income is currently recognised in line with the completion of diversion work. However, whereas this income is currently included in the income statement as a credit within infrastructure renewals expenditure (IRE) due to it representing a contribution towards these costs, under IFRS 15 it will be recognised within revenue resulting in an increase in both the revenue and IRE expense balances. If the standard had been adopted in the current year this would have resulted in revenue and IRE both increasing by £7.9 million.
Significant judgement is required in relation to accounting for activities that facilitate an authorised network connection through which water and wastewater services can be delivered. Establishing such an authorised connection can involve a number of activities performed opposite developers which are considered to be neither separable nor distinct and instead form a bundle of activities necessary to establish an authorised connection from which network access can be obtained and water and wastewater services can be provided. These are considered to form part of the group’s ordinary activities associated with the operation, maintenance and expansion of a water and wastewater network and, because they are deemed to result in an exchange transaction, we have determined that they fall within the scope of IFRS 15 as transactions arising from contracts with customers.
In addition, as the group has a legal obligation to keep a connection in place for as long as a property requires water and wastewater services, these initial connection activities are deemed to result in a broader ongoing performance obligation that is not distinct from the ongoing supply of water and wastewater services. The right to benefit from this connection, and obtain water and wastewater services through it, is deemed to be transferable from the initial developer to subsequent occupants of a connected property. Accordingly, under IFRS 15, the element of the performance obligation associated with the connection activities will be deemed to be satisfied over the period of time that water and wastewater services are expected to be provided through the connection, compared with the current treatment under which deferred amounts are released to the income statement over the useful economic life of the related assets or, for certain items, immediately to the income statement. This estimated period is a matter of judgement. We estimate that an average connection will be in place for a period of around 60 years and therefore revenue associated with connection activities will be recognised evenly over this period.
We intend to apply IFRS 15 retrospectively with the cumulative effect of initially applying the standard recognised as an adjustment to the opening retained earnings balance at the date of initial application. The standard permits that, where this approach is used, contracts that have been completed in accordance with current accounting standards at the date of initial application will not be restated on an IFRS 15 basis.
Accounting policies
United Utilities 2018 - Financial Statements.indd 142 6/1/2018 12:29:11 PM
Job Number 1 June 2018 11:11 AM Proof 3 Job Number 1 June 2018 11:11 AM Proof 3
143
Fina
ncia
l sta
tem
ents
unitedutilities.com/corporate Stock Code: UU.
Based on the deferred balance held on the statement of financial position relating to connection activities where the contract has not been completed as at 31 March 2018, the adjustment to retained earnings on the transition date of 1 April 2018 is expected to be a reduction in deferred grants and contributions and a corresponding increase in retained earnings of £2.7 million. In the year of adoption, revenue of £12.3 million is expected to be recognised in the income statement in relation to the updated deferred balances held on the statement of financial position relating to connection activities at 1 April 2018, compared with £8.9 million under current accounting standards. In addition, around £0.1 million of revenue is expected to be recognised in relation to balances that will be newly deferred under IFRS 15, compared with around £4 million that would have been expected to be recognised in the year ending 31 March 2019 under accounting standards adopted at 31 March 2018.
The net effect of these changes is that the total amount of annual revenue recognised in relation to these items is expected to fall by around £0.5 million as a result of the adoption of IFRS 15, compared with the group’s treatment under accounting standards adopted at the reporting date.
IFRS 16 ‘Leases’The standard is effective for periods commencing on or after 1 January 2019. Under the provisions of the standard, most leases, including the majority of those previously classified as operating leases, will be brought onto the statement of financial position, as both a right-of-use asset and a largely offsetting lease liability. The right-of-use asset and lease liability are both based on the present value of lease payments due over the term of the lease, with the asset being depreciated in accordance with IAS 16 ‘Property, Plant and Equipment’ and the liability increased for the accretion of interest and reduced by lease payments.
The key judgements associated with adoption of this standard relate to the identification and classification of contracts containing a lease within the scope of IFRS 16, and the discount rate to use in calculating the present value of future lease payments on which the reported lease liability and right-of-use asset is based when the rate is not implicit in the lease contract.
Work to ensure the correct identification and classification of leases remains ongoing and will continue over the course of the coming year.
The discount rate is a key determinant in calculating the present value of future lease payments. The appropriate rate to use remains an area of active discussion, the outcome of which is likely to have a material impact on the valuation of the right-of-use asset and lease liability on adoption. Accordingly, as we do not yet have clarification on this point, we have not sought to quantify the impact of adoption at this stage.
We intend to use the modified retrospective transitional approach permitted by the standard in which the right-of-use asset and lease liability brought onto the balance sheet will be based on the present value of future lease payments at the adoption date calculated using the appropriate discount rate. The discount rate will be based on the company’s incremental cost of borrowing at the point of adoption where the interest rate is not implicit in the lease contract. As such, the impact on adoption will be sensitive to the group’s incremental borrowing costs as at the 1 April 2019 adoption date.
All other standards, interpretations and amendments, which are in issue but not yet effective, are not expected to have a material impact on the group’s financial statements.
United Utilities 2018 - Financial Statements.indd 143 6/1/2018 12:29:11 PM

Job Number 1 June 2018 11:11 AM Proof 3 Job Number 1 June 2018 11:11 AM Proof 3
144
United Utilities Group PLC Annual Report and Financial Statements for the year ended 31 March 2018
Notes to the financial statements
1 Revenue and segment reportingThe group’s revenue predominantly arises from the provision of services within the United Kingdom, with less than one per cent of external revenue and non-current assets being overseas.
The board of directors of United Utilities Group PLC (the board) is provided with information on a single segment basis for the purposes of assessing performance and allocating resources. The group’s performance is measured against financial and operational key performance indicators which align with our three strategic themes to deliver the best service to customers, at the lowest sustainable cost, in a responsible manner. The board reviews revenue, operating profit and gearing, along with operational drivers at a consolidated level (see page 53). In light of this, the group has a single segment for financial reporting purposes and therefore no further detailed segmental information is provided in this note.
2 Directors and employeesDirectors’ remuneration
2018£m
2017£m
Fees to non-executive directors 0.7 0.7Salaries 1.5 1.2Benefits 0.4 0.3Bonus 0.7 0.6Share-based payment charge 1.8 1.5
5.1 4.3
Further information about the remuneration of individual directors and details of their pension arrangements are provided in the directors’ remuneration report on pages 99 to 109.
Remuneration of key management personnel2018
£m2017
£mSalaries and short-term employee benefits 5.3 5.5Severance 0.6 –Post-employment benefits – 0.1Share-based payment charge 2.4 2.6
8.3 8.2
Key management personnel comprises all directors and certain senior managers who are members of the executive team.
Employee benefits expense (including directors)
Group2018
£m2017
£mWages and salaries 220.7 219.9Employee-related taxes and levies 22.8 21.7Severance 3.7 7.0Post-employment benefits: Defined benefit pension expense (see note 17) 32.2 25.5 Defined contribution pension expense (see note 17) 12.1 11.2
44.3 36.7Charged to regulatory capital schemes (138.0) (129.4)Amounts recharged to related parties at nil margin under transitional service agreements (see note A6) – (4.0)Employee benefits expense 153.5 151.9
Within employee benefits expense there were £6.0 million (2017: £10.1 million) of restructuring costs.
The total expense included within employee benefits expense in respect of equity-settled share-based payments was £3.2 million (2017: £3.4 million). The company operates several share option schemes, details of which are given on pages 102 to 104 in the directors’ remuneration report. Further disclosures have not been included as they are considered immaterial to the assessment of the share-based payments charge.
Average number of employees during the year (full-time equivalent including directors):
2018 number
2017 number
Average number of employees during the year 5,223 5,310
CompanyThe company has no employees.
United Utilities 2018 - Financial Statements.indd 144 6/1/2018 12:29:11 PM
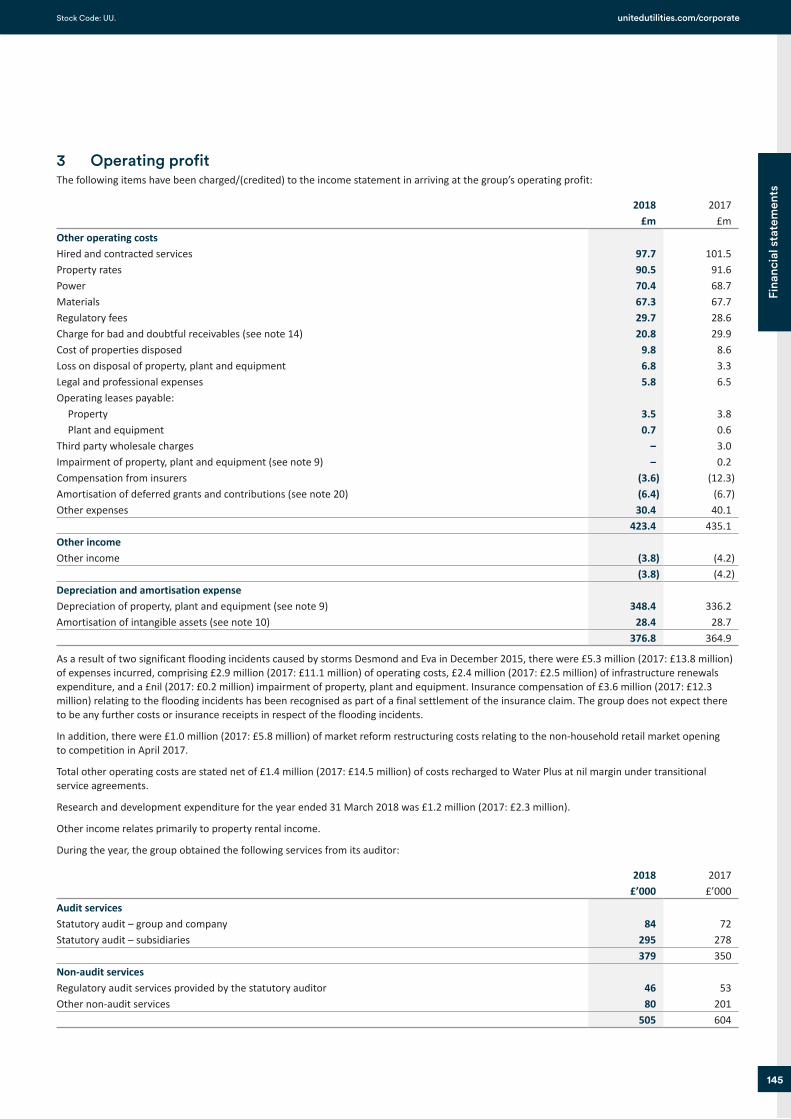
Job Number 1 June 2018 11:11 AM Proof 3 Job Number 1 June 2018 11:11 AM Proof 3
145
Fina
ncia
l sta
tem
ents
unitedutilities.com/corporate Stock Code: UU.
3 Operating profitThe following items have been charged/(credited) to the income statement in arriving at the group’s operating profit:
2018£m
2017£m
Other operating costsHired and contracted services 97.7 101.5Property rates 90.5 91.6Power 70.4 68.7Materials 67.3 67.7Regulatory fees 29.7 28.6Charge for bad and doubtful receivables (see note 14) 20.8 29.9Cost of properties disposed 9.8 8.6Loss on disposal of property, plant and equipment 6.8 3.3Legal and professional expenses 5.8 6.5Operating leases payable: Property 3.5 3.8 Plant and equipment 0.7 0.6Third party wholesale charges – 3.0Impairment of property, plant and equipment (see note 9) – 0.2Compensation from insurers (3.6) (12.3)Amortisation of deferred grants and contributions (see note 20) (6.4) (6.7)Other expenses 30.4 40.1
423.4 435.1Other incomeOther income (3.8) (4.2)
(3.8) (4.2)Depreciation and amortisation expenseDepreciation of property, plant and equipment (see note 9) 348.4 336.2Amortisation of intangible assets (see note 10) 28.4 28.7
376.8 364.9
As a result of two significant flooding incidents caused by storms Desmond and Eva in December 2015, there were £5.3 million (2017: £13.8 million) of expenses incurred, comprising £2.9 million (2017: £11.1 million) of operating costs, £2.4 million (2017: £2.5 million) of infrastructure renewals expenditure, and a £nil (2017: £0.2 million) impairment of property, plant and equipment. Insurance compensation of £3.6 million (2017: £12.3 million) relating to the flooding incidents has been recognised as part of a final settlement of the insurance claim. The group does not expect there to be any further costs or insurance receipts in respect of the flooding incidents.
In addition, there were £1.0 million (2017: £5.8 million) of market reform restructuring costs relating to the non-household retail market opening to competition in April 2017.
Total other operating costs are stated net of £1.4 million (2017: £14.5 million) of costs recharged to Water Plus at nil margin under transitional service agreements.
Research and development expenditure for the year ended 31 March 2018 was £1.2 million (2017: £2.3 million).
Other income relates primarily to property rental income.
During the year, the group obtained the following services from its auditor:
2018 £’000
2017 £’000
Audit servicesStatutory audit – group and company 84 72Statutory audit – subsidiaries 295 278
379 350Non-audit servicesRegulatory audit services provided by the statutory auditor 46 53Other non-audit services 80 201
505 604
United Utilities 2018 - Financial Statements.indd 145 6/1/2018 12:29:11 PM
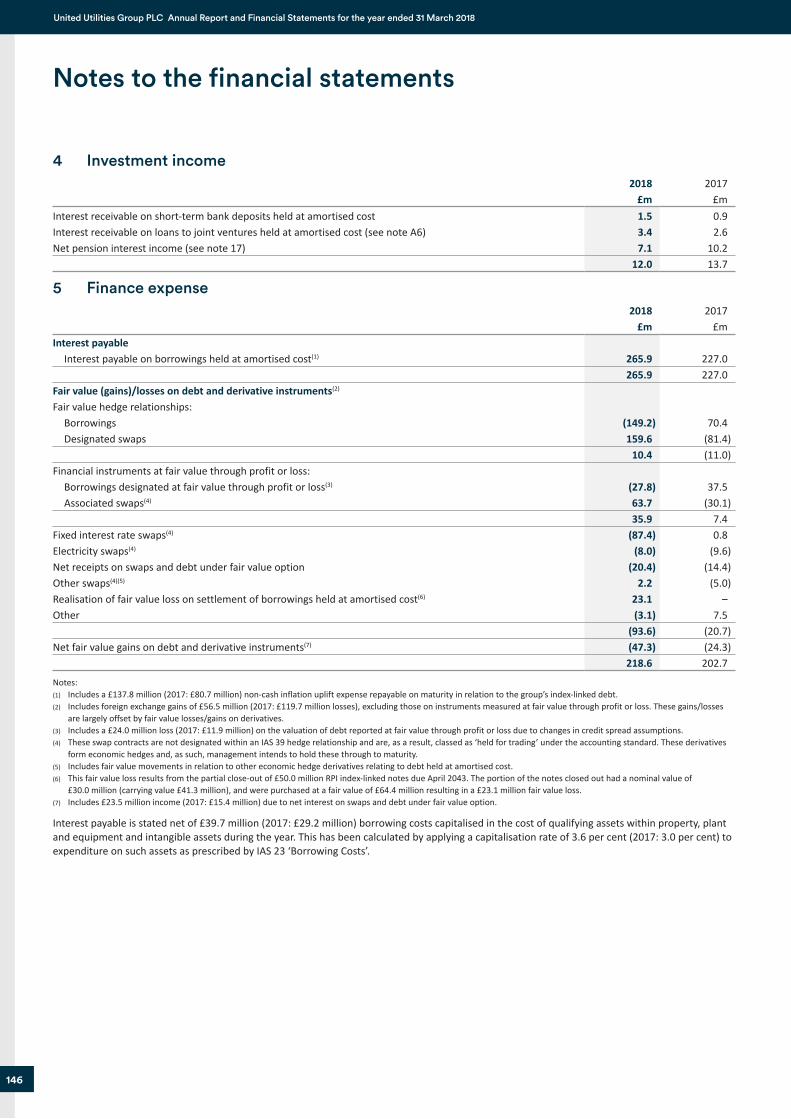
Job Number 1 June 2018 11:11 AM Proof 3 Job Number 1 June 2018 11:11 AM Proof 3
146
United Utilities Group PLC Annual Report and Financial Statements for the year ended 31 March 2018
4 Investment income2018
£m2017
£mInterest receivable on short-term bank deposits held at amortised cost 1.5 0.9Interest receivable on loans to joint ventures held at amortised cost (see note A6) 3.4 2.6Net pension interest income (see note 17) 7.1 10.2
12.0 13.7
5 Finance expense2018
£m2017
£mInterest payable Interest payable on borrowings held at amortised cost(1) 265.9 227.0
265.9 227.0Fair value (gains)/losses on debt and derivative instruments(2)
Fair value hedge relationships: Borrowings (149.2) 70.4 Designated swaps 159.6 (81.4)
10.4 (11.0)Financial instruments at fair value through profit or loss: Borrowings designated at fair value through profit or loss(3) (27.8) 37.5 Associated swaps(4) 63.7 (30.1)
35.9 7.4Fixed interest rate swaps(4) (87.4) 0.8Electricity swaps(4) (8.0) (9.6)Net receipts on swaps and debt under fair value option (20.4) (14.4)Other swaps(4)(5) 2.2 (5.0)Realisation of fair value loss on settlement of borrowings held at amortised cost(6) 23.1 –Other (3.1) 7.5
(93.6) (20.7)Net fair value gains on debt and derivative instruments(7) (47.3) (24.3)
218.6 202.7
Notes:(1) Includes a £137.8 million (2017: £80.7 million) non-cash inflation uplift expense repayable on maturity in relation to the group’s index-linked debt.(2) Includes foreign exchange gains of £56.5 million (2017: £119.7 million losses), excluding those on instruments measured at fair value through profit or loss. These gains/losses
are largely offset by fair value losses/gains on derivatives.(3) Includes a £24.0 million loss (2017: £11.9 million) on the valuation of debt reported at fair value through profit or loss due to changes in credit spread assumptions.(4) These swap contracts are not designated within an IAS 39 hedge relationship and are, as a result, classed as ‘held for trading’ under the accounting standard. These derivatives
form economic hedges and, as such, management intends to hold these through to maturity.(5) Includes fair value movements in relation to other economic hedge derivatives relating to debt held at amortised cost.(6) This fair value loss results from the partial close-out of £50.0 million RPI index-linked notes due April 2043. The portion of the notes closed out had a nominal value of £30.0 million (carrying value £41.3 million), and were purchased at a fair value of £64.4 million resulting in a £23.1 million fair value loss.(7) Includes £23.5 million income (2017: £15.4 million) due to net interest on swaps and debt under fair value option.
Interest payable is stated net of £39.7 million (2017: £29.2 million) borrowing costs capitalised in the cost of qualifying assets within property, plant and equipment and intangible assets during the year. This has been calculated by applying a capitalisation rate of 3.6 per cent (2017: 3.0 per cent) to expenditure on such assets as prescribed by IAS 23 ‘Borrowing Costs’.
Notes to the financial statements
United Utilities 2018 - Financial Statements.indd 146 6/1/2018 12:29:11 PM
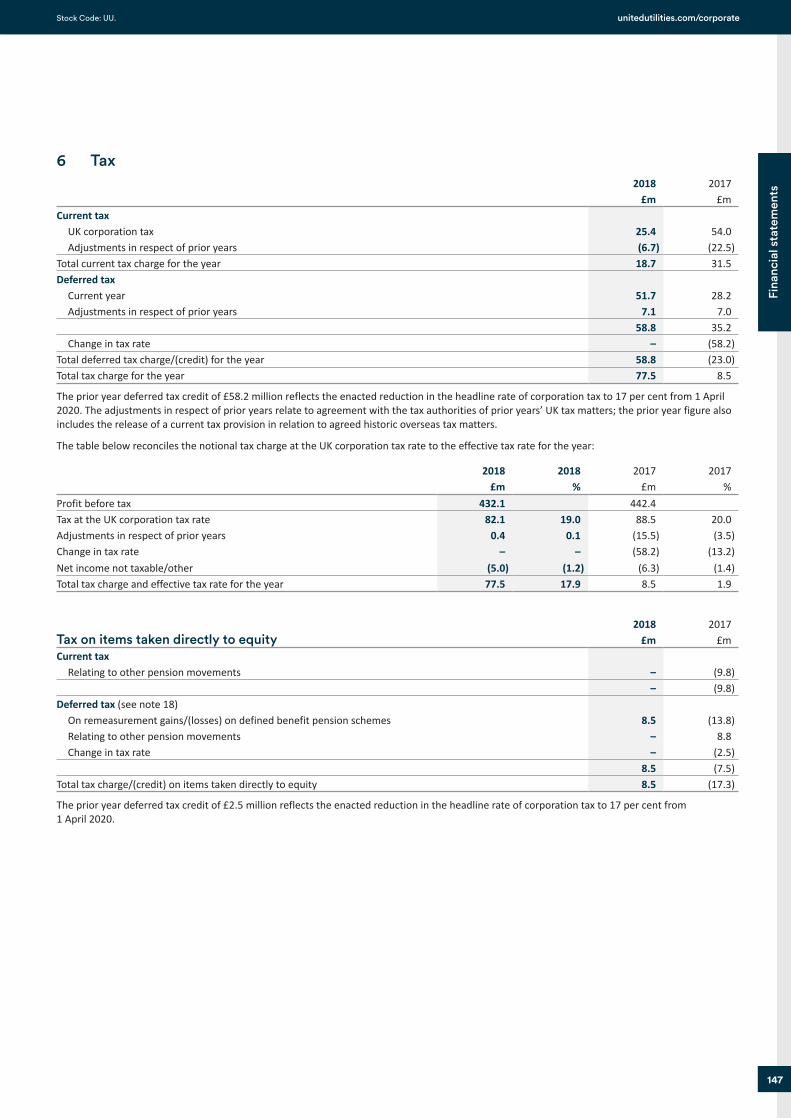
Job Number 1 June 2018 11:11 AM Proof 3 Job Number 1 June 2018 11:11 AM Proof 3
147
Fina
ncia
l sta
tem
ents
unitedutilities.com/corporate Stock Code: UU.
6 Tax2018
£m2017
£mCurrent tax UK corporation tax 25.4 54.0 Adjustments in respect of prior years (6.7) (22.5)Total current tax charge for the year 18.7 31.5Deferred tax Current year 51.7 28.2 Adjustments in respect of prior years 7.1 7.0
58.8 35.2 Change in tax rate – (58.2)Total deferred tax charge/(credit) for the year 58.8 (23.0)Total tax charge for the year 77.5 8.5
The prior year deferred tax credit of £58.2 million reflects the enacted reduction in the headline rate of corporation tax to 17 per cent from 1 April 2020. The adjustments in respect of prior years relate to agreement with the tax authorities of prior years’ UK tax matters; the prior year figure also includes the release of a current tax provision in relation to agreed historic overseas tax matters.
The table below reconciles the notional tax charge at the UK corporation tax rate to the effective tax rate for the year:
2018£m
2018%
2017£m
2017%
Profit before tax 432.1 442.4Tax at the UK corporation tax rate 82.1 19.0 88.5 20.0Adjustments in respect of prior years 0.4 0.1 (15.5) (3.5)Change in tax rate – – (58.2) (13.2)Net income not taxable/other (5.0) (1.2) (6.3) (1.4)Total tax charge and effective tax rate for the year 77.5 17.9 8.5 1.9
Tax on items taken directly to equity2018
£m2017
£mCurrent tax Relating to other pension movements – (9.8)
– (9.8)Deferred tax (see note 18) On remeasurement gains/(losses) on defined benefit pension schemes 8.5 (13.8) Relating to other pension movements – 8.8 Change in tax rate – (2.5)
8.5 (7.5)Total tax charge/(credit) on items taken directly to equity 8.5 (17.3)
The prior year deferred tax credit of £2.5 million reflects the enacted reduction in the headline rate of corporation tax to 17 per cent from 1 April 2020.
United Utilities 2018 - Financial Statements.indd 147 6/1/2018 12:29:11 PM
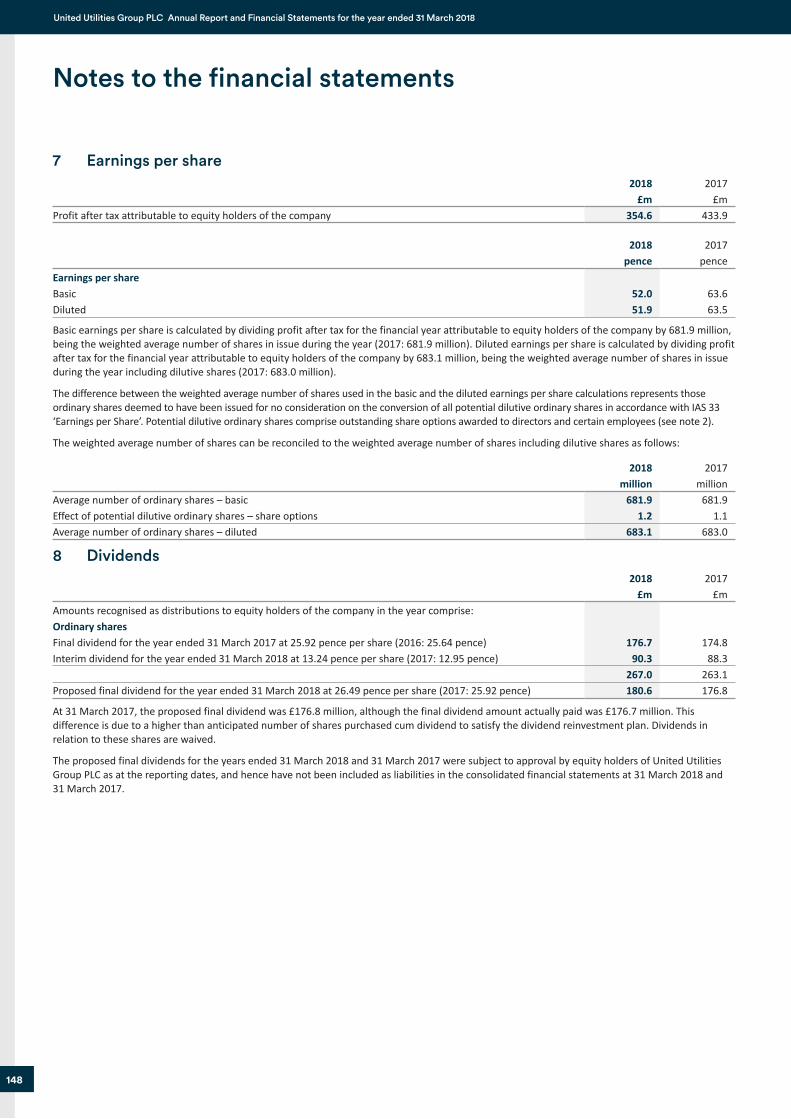
Job Number 1 June 2018 11:11 AM Proof 3 Job Number 1 June 2018 11:11 AM Proof 3
148
United Utilities Group PLC Annual Report and Financial Statements for the year ended 31 March 2018
7 Earnings per share2018
£m2017
£mProfit after tax attributable to equity holders of the company 354.6 433.9
2018pence
2017pence
Earnings per shareBasic 52.0 63.6Diluted 51.9 63.5
Basic earnings per share is calculated by dividing profit after tax for the financial year attributable to equity holders of the company by 681.9 million, being the weighted average number of shares in issue during the year (2017: 681.9 million). Diluted earnings per share is calculated by dividing profit after tax for the financial year attributable to equity holders of the company by 683.1 million, being the weighted average number of shares in issue during the year including dilutive shares (2017: 683.0 million).
The difference between the weighted average number of shares used in the basic and the diluted earnings per share calculations represents those ordinary shares deemed to have been issued for no consideration on the conversion of all potential dilutive ordinary shares in accordance with IAS 33 ‘Earnings per Share’. Potential dilutive ordinary shares comprise outstanding share options awarded to directors and certain employees (see note 2).
The weighted average number of shares can be reconciled to the weighted average number of shares including dilutive shares as follows:
2018 million
2017 million
Average number of ordinary shares – basic 681.9 681.9Effect of potential dilutive ordinary shares – share options 1.2 1.1Average number of ordinary shares – diluted 683.1 683.0
8 Dividends2018
£m2017
£mAmounts recognised as distributions to equity holders of the company in the year comprise:Ordinary sharesFinal dividend for the year ended 31 March 2017 at 25.92 pence per share (2016: 25.64 pence) 176.7 174.8Interim dividend for the year ended 31 March 2018 at 13.24 pence per share (2017: 12.95 pence) 90.3 88.3
267.0 263.1Proposed final dividend for the year ended 31 March 2018 at 26.49 pence per share (2017: 25.92 pence) 180.6 176.8
At 31 March 2017, the proposed final dividend was £176.8 million, although the final dividend amount actually paid was £176.7 million. This difference is due to a higher than anticipated number of shares purchased cum dividend to satisfy the dividend reinvestment plan. Dividends in relation to these shares are waived.
The proposed final dividends for the years ended 31 March 2018 and 31 March 2017 were subject to approval by equity holders of United Utilities Group PLC as at the reporting dates, and hence have not been included as liabilities in the consolidated financial statements at 31 March 2018 and 31 March 2017.
Notes to the financial statements
United Utilities 2018 - Financial Statements.indd 148 6/1/2018 12:29:11 PM
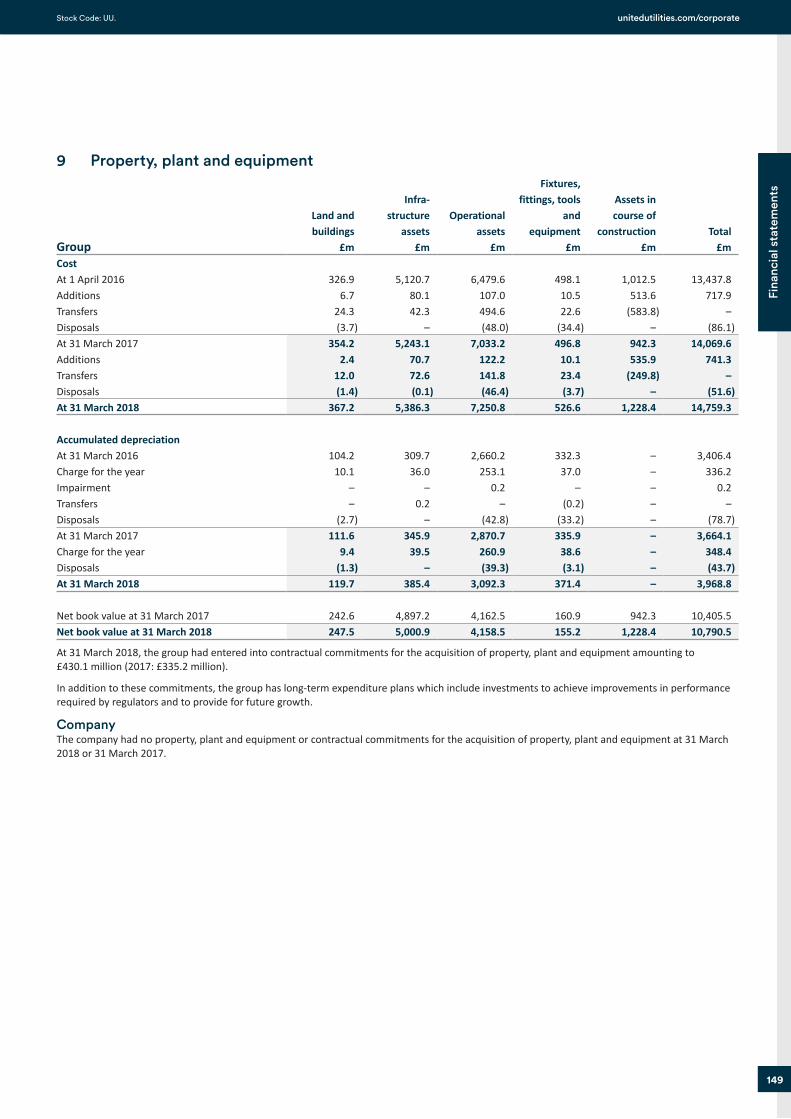
Job Number 1 June 2018 11:11 AM Proof 3 Job Number 1 June 2018 11:11 AM Proof 3
149
Fina
ncia
l sta
tem
ents
unitedutilities.com/corporate Stock Code: UU.
9 Property, plant and equipment
Group
Land and buildings
£m
Infra-structure
assets £m
Operational assets
£m
Fixtures, fittings, tools
and equipment
£m
Assets in course of
construction £m
Total £m
CostAt 1 April 2016 326.9 5,120.7 6,479.6 498.1 1,012.5 13,437.8Additions 6.7 80.1 107.0 10.5 513.6 717.9Transfers 24.3 42.3 494.6 22.6 (583.8) –Disposals (3.7) – (48.0) (34.4) – (86.1)At 31 March 2017 354.2 5,243.1 7,033.2 496.8 942.3 14,069.6Additions 2.4 70.7 122.2 10.1 535.9 741.3Transfers 12.0 72.6 141.8 23.4 (249.8) –Disposals (1.4) (0.1) (46.4) (3.7) – (51.6)At 31 March 2018 367.2 5,386.3 7,250.8 526.6 1,228.4 14,759.3
Accumulated depreciationAt 31 March 2016 104.2 309.7 2,660.2 332.3 – 3,406.4Charge for the year 10.1 36.0 253.1 37.0 – 336.2Impairment – – 0.2 – – 0.2Transfers – 0.2 – (0.2) – –Disposals (2.7) – (42.8) (33.2) – (78.7)At 31 March 2017 111.6 345.9 2,870.7 335.9 – 3,664.1Charge for the year 9.4 39.5 260.9 38.6 – 348.4Disposals (1.3) – (39.3) (3.1) – (43.7)At 31 March 2018 119.7 385.4 3,092.3 371.4 – 3,968.8
Net book value at 31 March 2017 242.6 4,897.2 4,162.5 160.9 942.3 10,405.5Net book value at 31 March 2018 247.5 5,000.9 4,158.5 155.2 1,228.4 10,790.5
At 31 March 2018, the group had entered into contractual commitments for the acquisition of property, plant and equipment amounting to £430.1 million (2017: £335.2 million).
In addition to these commitments, the group has long-term expenditure plans which include investments to achieve improvements in performance required by regulators and to provide for future growth.
CompanyThe company had no property, plant and equipment or contractual commitments for the acquisition of property, plant and equipment at 31 March 2018 or 31 March 2017.
United Utilities 2018 - Financial Statements.indd 149 6/1/2018 12:29:12 PM
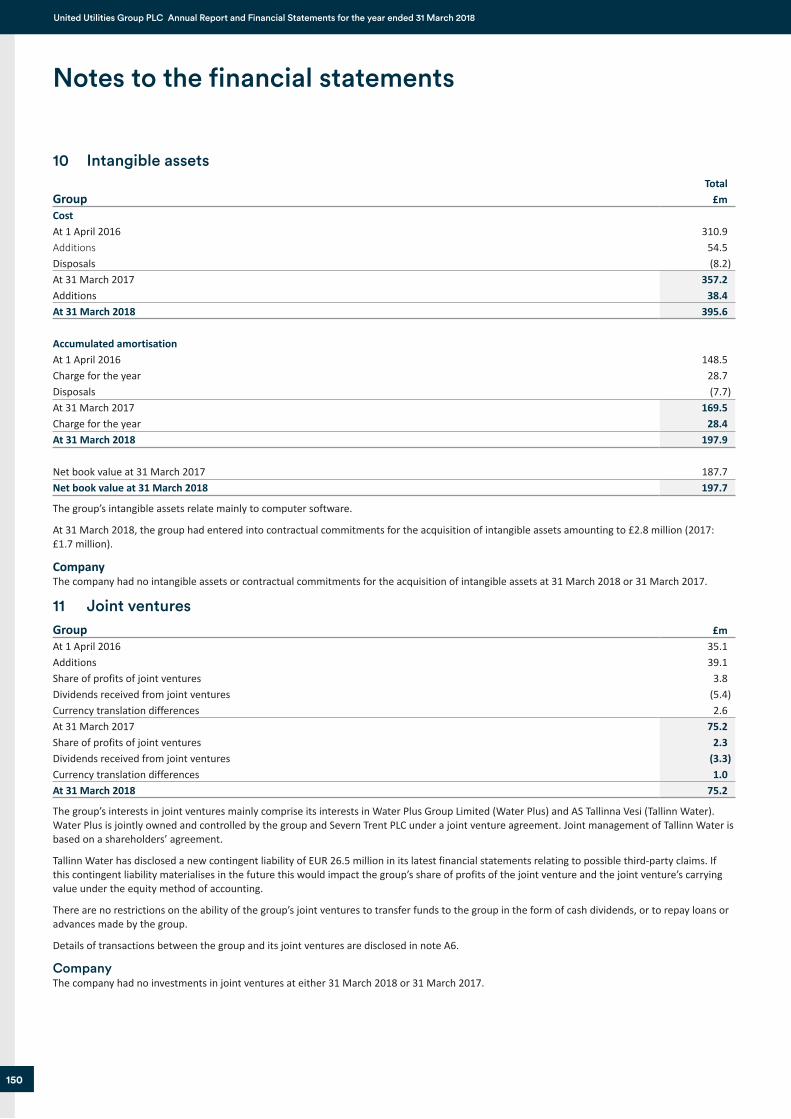
Job Number 1 June 2018 11:11 AM Proof 3 Job Number 1 June 2018 11:11 AM Proof 3
150
United Utilities Group PLC Annual Report and Financial Statements for the year ended 31 March 2018
10 Intangible assets
GroupTotal
£mCostAt 1 April 2016 310.9Additions 54.5Disposals (8.2)At 31 March 2017 357.2Additions 38.4At 31 March 2018 395.6
Accumulated amortisationAt 1 April 2016 148.5Charge for the year 28.7Disposals (7.7)At 31 March 2017 169.5Charge for the year 28.4At 31 March 2018 197.9
Net book value at 31 March 2017 187.7Net book value at 31 March 2018 197.7
The group’s intangible assets relate mainly to computer software.
At 31 March 2018, the group had entered into contractual commitments for the acquisition of intangible assets amounting to £2.8 million (2017: £1.7 million).
CompanyThe company had no intangible assets or contractual commitments for the acquisition of intangible assets at 31 March 2018 or 31 March 2017.
11 Joint venturesGroup £mAt 1 April 2016 35.1Additions 39.1Share of profits of joint ventures 3.8Dividends received from joint ventures (5.4)Currency translation differences 2.6At 31 March 2017 75.2Share of profits of joint ventures 2.3Dividends received from joint ventures (3.3)Currency translation differences 1.0At 31 March 2018 75.2
The group’s interests in joint ventures mainly comprise its interests in Water Plus Group Limited (Water Plus) and AS Tallinna Vesi (Tallinn Water). Water Plus is jointly owned and controlled by the group and Severn Trent PLC under a joint venture agreement. Joint management of Tallinn Water is based on a shareholders’ agreement.
Tallinn Water has disclosed a new contingent liability of EUR 26.5 million in its latest financial statements relating to possible third-party claims. If this contingent liability materialises in the future this would impact the group’s share of profits of the joint venture and the joint venture’s carrying value under the equity method of accounting.
There are no restrictions on the ability of the group’s joint ventures to transfer funds to the group in the form of cash dividends, or to repay loans or advances made by the group.
Details of transactions between the group and its joint ventures are disclosed in note A6.
CompanyThe company had no investments in joint ventures at either 31 March 2018 or 31 March 2017.
Notes to the financial statements
United Utilities 2018 - Financial Statements.indd 150 6/1/2018 12:29:12 PM
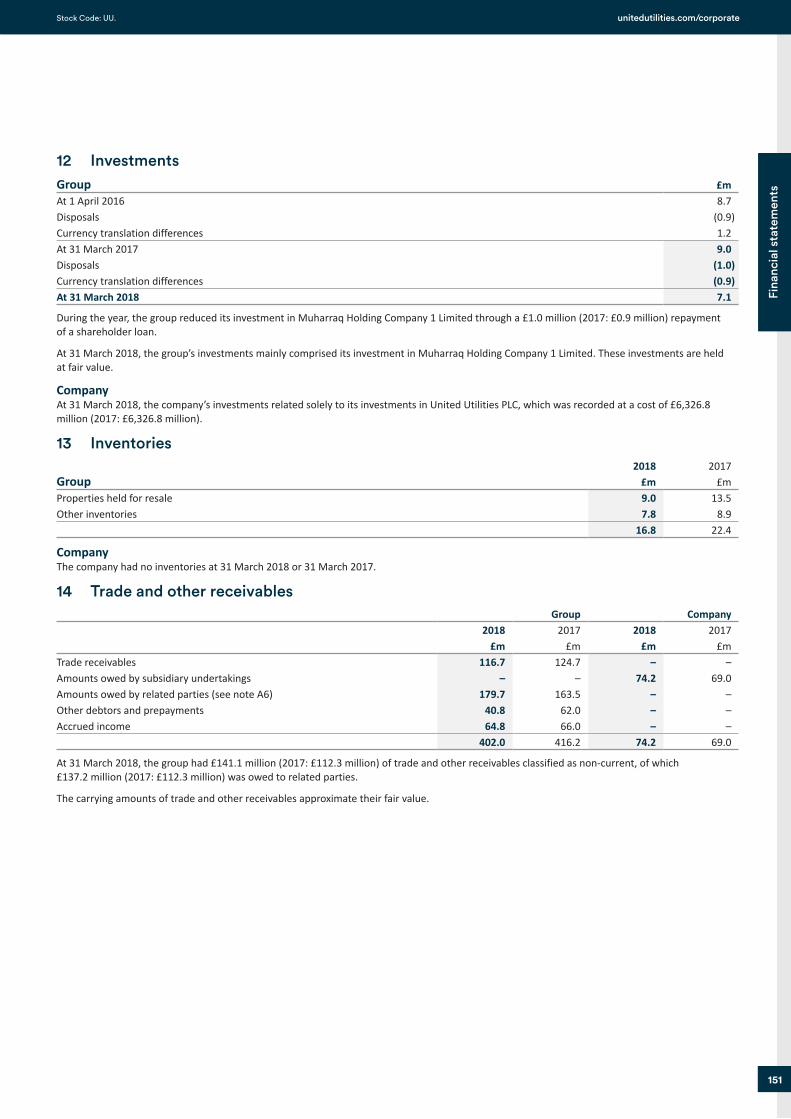
Job Number 1 June 2018 11:11 AM Proof 3 Job Number 1 June 2018 11:11 AM Proof 3
151
Fina
ncia
l sta
tem
ents
unitedutilities.com/corporate Stock Code: UU.
12 InvestmentsGroup £mAt 1 April 2016 8.7Disposals (0.9)Currency translation differences 1.2At 31 March 2017 9.0Disposals (1.0)Currency translation differences (0.9)At 31 March 2018 7.1
During the year, the group reduced its investment in Muharraq Holding Company 1 Limited through a £1.0 million (2017: £0.9 million) repayment of a shareholder loan.
At 31 March 2018, the group’s investments mainly comprised its investment in Muharraq Holding Company 1 Limited. These investments are held at fair value.
CompanyAt 31 March 2018, the company’s investments related solely to its investments in United Utilities PLC, which was recorded at a cost of £6,326.8 million (2017: £6,326.8 million).
13 Inventories
Group2018
£m2017
£mProperties held for resale 9.0 13.5Other inventories 7.8 8.9
16.8 22.4
CompanyThe company had no inventories at 31 March 2018 or 31 March 2017.
14 Trade and other receivables Group Company
2018£m
2017£m
2018£m
2017£m
Trade receivables 116.7 124.7 – –Amounts owed by subsidiary undertakings – – 74.2 69.0Amounts owed by related parties (see note A6) 179.7 163.5 – –Other debtors and prepayments 40.8 62.0 – –Accrued income 64.8 66.0 – –
402.0 416.2 74.2 69.0
At 31 March 2018, the group had £141.1 million (2017: £112.3 million) of trade and other receivables classified as non-current, of which £137.2 million (2017: £112.3 million) was owed to related parties.
The carrying amounts of trade and other receivables approximate their fair value.
United Utilities 2018 - Financial Statements.indd 151 6/1/2018 12:29:12 PM
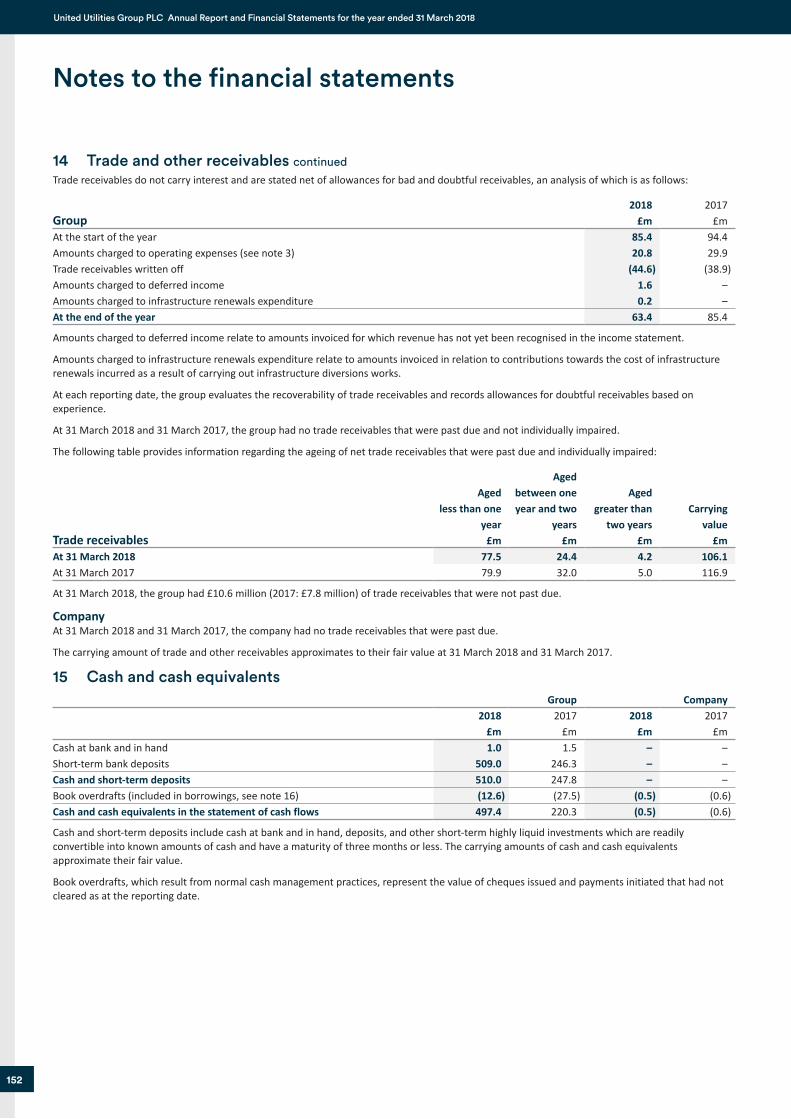
Job Number 1 June 2018 11:11 AM Proof 3 Job Number 1 June 2018 11:11 AM Proof 3
152
United Utilities Group PLC Annual Report and Financial Statements for the year ended 31 March 2018
14 Trade and other receivables continuedTrade receivables do not carry interest and are stated net of allowances for bad and doubtful receivables, an analysis of which is as follows:
Group2018
£m2017
£mAt the start of the year 85.4 94.4Amounts charged to operating expenses (see note 3) 20.8 29.9Trade receivables written off (44.6) (38.9)Amounts charged to deferred income 1.6 –Amounts charged to infrastructure renewals expenditure 0.2 –At the end of the year 63.4 85.4
Amounts charged to deferred income relate to amounts invoiced for which revenue has not yet been recognised in the income statement.
Amounts charged to infrastructure renewals expenditure relate to amounts invoiced in relation to contributions towards the cost of infrastructure renewals incurred as a result of carrying out infrastructure diversions works.
At each reporting date, the group evaluates the recoverability of trade receivables and records allowances for doubtful receivables based on experience.
At 31 March 2018 and 31 March 2017, the group had no trade receivables that were past due and not individually impaired.
The following table provides information regarding the ageing of net trade receivables that were past due and individually impaired:
Trade receivables
Aged less than one
year £m
Aged between one year and two
years £m
Aged greater than
two years £m
Carrying value
£mAt 31 March 2018 77.5 24.4 4.2 106.1At 31 March 2017 79.9 32.0 5.0 116.9
At 31 March 2018, the group had £10.6 million (2017: £7.8 million) of trade receivables that were not past due.
CompanyAt 31 March 2018 and 31 March 2017, the company had no trade receivables that were past due.
The carrying amount of trade and other receivables approximates to their fair value at 31 March 2018 and 31 March 2017.
15 Cash and cash equivalents Group Company
2018£m
2017£m
2018£m
2017£m
Cash at bank and in hand 1.0 1.5 – –Short-term bank deposits 509.0 246.3 – –Cash and short-term deposits 510.0 247.8 – –Book overdrafts (included in borrowings, see note 16) (12.6) (27.5) (0.5) (0.6)Cash and cash equivalents in the statement of cash flows 497.4 220.3 (0.5) (0.6)
Cash and short-term deposits include cash at bank and in hand, deposits, and other short-term highly liquid investments which are readily convertible into known amounts of cash and have a maturity of three months or less. The carrying amounts of cash and cash equivalents approximate their fair value.
Book overdrafts, which result from normal cash management practices, represent the value of cheques issued and payments initiated that had not cleared as at the reporting date.
Notes to the financial statements
United Utilities 2018 - Financial Statements.indd 152 6/1/2018 12:29:12 PM
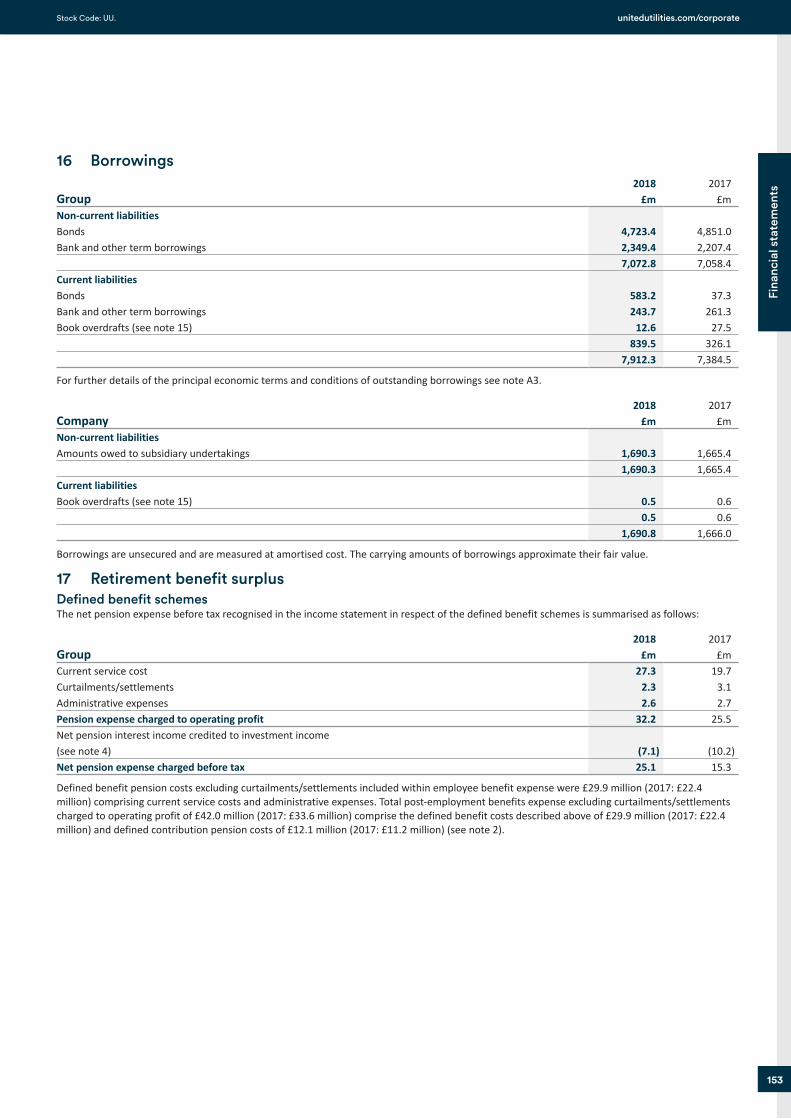
Job Number 1 June 2018 11:11 AM Proof 3 Job Number 1 June 2018 11:11 AM Proof 3
153
Fina
ncia
l sta
tem
ents
unitedutilities.com/corporate Stock Code: UU.
16 Borrowings
Group2018
£m2017
£mNon-current liabilitiesBonds 4,723.4 4,851.0Bank and other term borrowings 2,349.4 2,207.4
7,072.8 7,058.4Current liabilitiesBonds 583.2 37.3Bank and other term borrowings 243.7 261.3Book overdrafts (see note 15) 12.6 27.5
839.5 326.17,912.3 7,384.5
For further details of the principal economic terms and conditions of outstanding borrowings see note A3.
Company2018
£m2017
£mNon-current liabilitiesAmounts owed to subsidiary undertakings 1,690.3 1,665.4
1,690.3 1,665.4Current liabilitiesBook overdrafts (see note 15) 0.5 0.6
0.5 0.61,690.8 1,666.0
Borrowings are unsecured and are measured at amortised cost. The carrying amounts of borrowings approximate their fair value.
17 Retirement benefit surplusDefined benefit schemesThe net pension expense before tax recognised in the income statement in respect of the defined benefit schemes is summarised as follows:
Group2018
£m2017
£mCurrent service cost 27.3 19.7Curtailments/settlements 2.3 3.1Administrative expenses 2.6 2.7Pension expense charged to operating profit 32.2 25.5Net pension interest income credited to investment income (see note 4) (7.1) (10.2)Net pension expense charged before tax 25.1 15.3
Defined benefit pension costs excluding curtailments/settlements included within employee benefit expense were £29.9 million (2017: £22.4 million) comprising current service costs and administrative expenses. Total post-employment benefits expense excluding curtailments/settlements charged to operating profit of £42.0 million (2017: £33.6 million) comprise the defined benefit costs described above of £29.9 million (2017: £22.4 million) and defined contribution pension costs of £12.1 million (2017: £11.2 million) (see note 2).
United Utilities 2018 - Financial Statements.indd 153 6/1/2018 12:29:12 PM
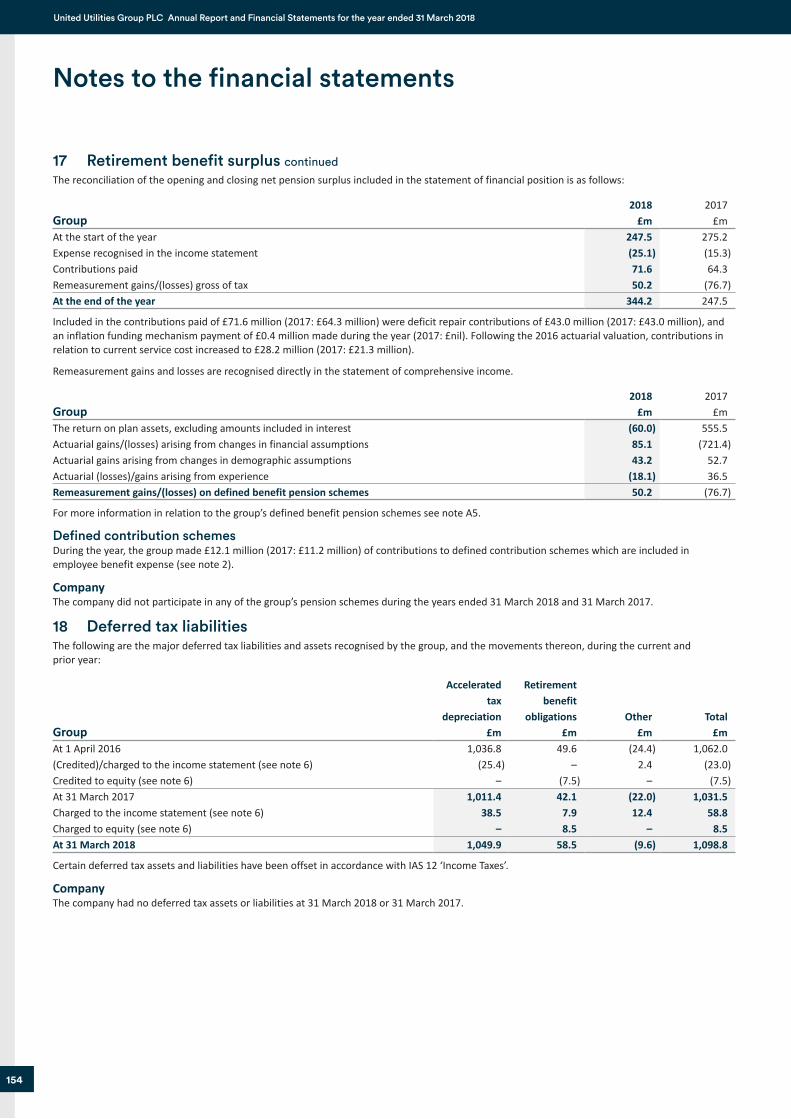
Job Number 1 June 2018 11:11 AM Proof 3 Job Number 1 June 2018 11:11 AM Proof 3
154
United Utilities Group PLC Annual Report and Financial Statements for the year ended 31 March 2018
17 Retirement benefit surplus continuedThe reconciliation of the opening and closing net pension surplus included in the statement of financial position is as follows:
Group2018
£m2017
£mAt the start of the year 247.5 275.2Expense recognised in the income statement (25.1) (15.3)Contributions paid 71.6 64.3Remeasurement gains/(losses) gross of tax 50.2 (76.7)At the end of the year 344.2 247.5
Included in the contributions paid of £71.6 million (2017: £64.3 million) were deficit repair contributions of £43.0 million (2017: £43.0 million), and an inflation funding mechanism payment of £0.4 million made during the year (2017: £nil). Following the 2016 actuarial valuation, contributions in relation to current service cost increased to £28.2 million (2017: £21.3 million).
Remeasurement gains and losses are recognised directly in the statement of comprehensive income.
Group2018
£m2017
£mThe return on plan assets, excluding amounts included in interest (60.0) 555.5Actuarial gains/(losses) arising from changes in financial assumptions 85.1 (721.4)Actuarial gains arising from changes in demographic assumptions 43.2 52.7Actuarial (losses)/gains arising from experience (18.1) 36.5Remeasurement gains/(losses) on defined benefit pension schemes 50.2 (76.7)
For more information in relation to the group’s defined benefit pension schemes see note A5.
Defined contribution schemesDuring the year, the group made £12.1 million (2017: £11.2 million) of contributions to defined contribution schemes which are included in employee benefit expense (see note 2).
CompanyThe company did not participate in any of the group’s pension schemes during the years ended 31 March 2018 and 31 March 2017.
18 Deferred tax liabilitiesThe following are the major deferred tax liabilities and assets recognised by the group, and the movements thereon, during the current and prior year:
Group
Accelerated tax
depreciation £m
Retirement benefit
obligations £m
Other £m
Total £m
At 1 April 2016 1,036.8 49.6 (24.4) 1,062.0(Credited)/charged to the income statement (see note 6) (25.4) – 2.4 (23.0)Credited to equity (see note 6) – (7.5) – (7.5)At 31 March 2017 1,011.4 42.1 (22.0) 1,031.5Charged to the income statement (see note 6) 38.5 7.9 12.4 58.8Charged to equity (see note 6) – 8.5 – 8.5At 31 March 2018 1,049.9 58.5 (9.6) 1,098.8
Certain deferred tax assets and liabilities have been offset in accordance with IAS 12 ‘Income Taxes’.
CompanyThe company had no deferred tax assets or liabilities at 31 March 2018 or 31 March 2017.
Notes to the financial statements
United Utilities 2018 - Financial Statements.indd 154 6/1/2018 12:29:12 PM
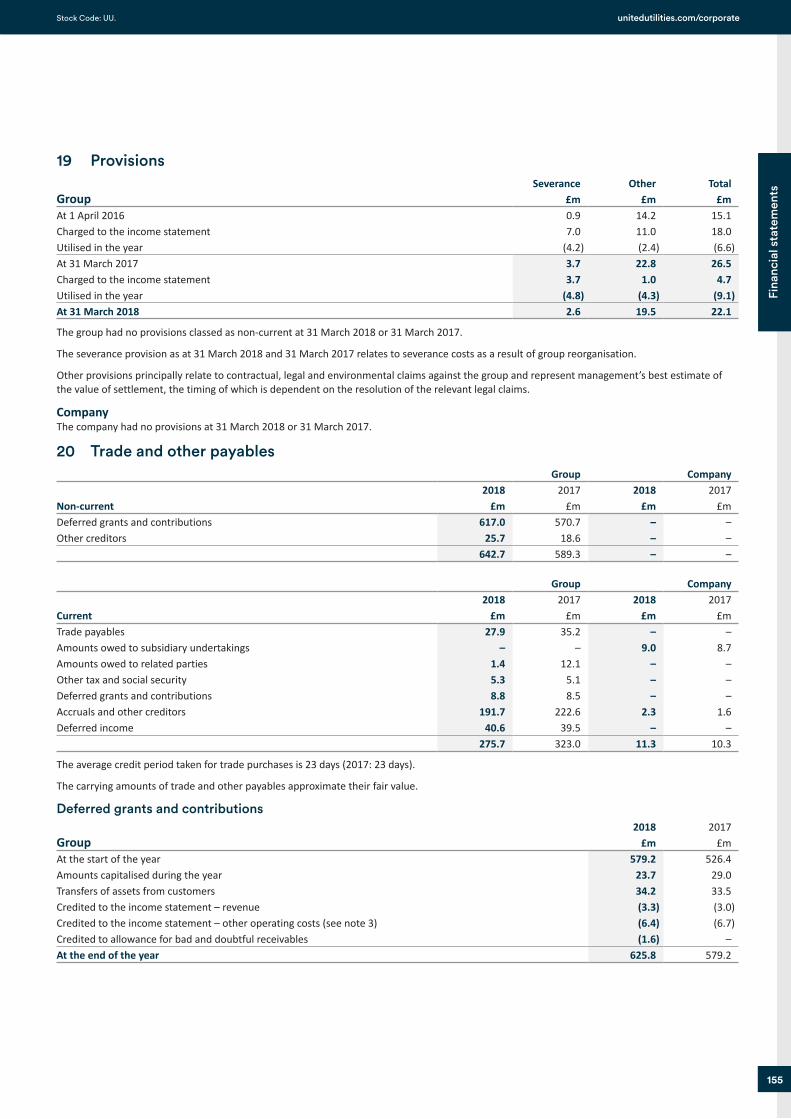
Job Number 1 June 2018 11:11 AM Proof 3 Job Number 1 June 2018 11:11 AM Proof 3
155
Fina
ncia
l sta
tem
ents
unitedutilities.com/corporate Stock Code: UU.
19 Provisions
GroupSeverance
£mOther
£mTotal
£mAt 1 April 2016 0.9 14.2 15.1Charged to the income statement 7.0 11.0 18.0Utilised in the year (4.2) (2.4) (6.6)At 31 March 2017 3.7 22.8 26.5Charged to the income statement 3.7 1.0 4.7Utilised in the year (4.8) (4.3) (9.1)At 31 March 2018 2.6 19.5 22.1
The group had no provisions classed as non-current at 31 March 2018 or 31 March 2017.
The severance provision as at 31 March 2018 and 31 March 2017 relates to severance costs as a result of group reorganisation.
Other provisions principally relate to contractual, legal and environmental claims against the group and represent management’s best estimate of the value of settlement, the timing of which is dependent on the resolution of the relevant legal claims.
CompanyThe company had no provisions at 31 March 2018 or 31 March 2017.
20 Trade and other payablesGroup Company
Non-current2018
£m2017
£m2018
£m2017
£mDeferred grants and contributions 617.0 570.7 – –Other creditors 25.7 18.6 – –
642.7 589.3 – –
Group Company
Current2018
£m2017
£m2018
£m2017
£mTrade payables 27.9 35.2 – –Amounts owed to subsidiary undertakings – – 9.0 8.7Amounts owed to related parties 1.4 12.1 – –Other tax and social security 5.3 5.1 – –Deferred grants and contributions 8.8 8.5 – –Accruals and other creditors 191.7 222.6 2.3 1.6Deferred income 40.6 39.5 – –
275.7 323.0 11.3 10.3
The average credit period taken for trade purchases is 23 days (2017: 23 days).
The carrying amounts of trade and other payables approximate their fair value.
Deferred grants and contributions
Group2018
£m2017
£mAt the start of the year 579.2 526.4Amounts capitalised during the year 23.7 29.0Transfers of assets from customers 34.2 33.5Credited to the income statement – revenue (3.3) (3.0)Credited to the income statement – other operating costs (see note 3) (6.4) (6.7)Credited to allowance for bad and doubtful receivables (1.6) –At the end of the year 625.8 579.2
United Utilities 2018 - Financial Statements.indd 155 6/1/2018 12:29:12 PM
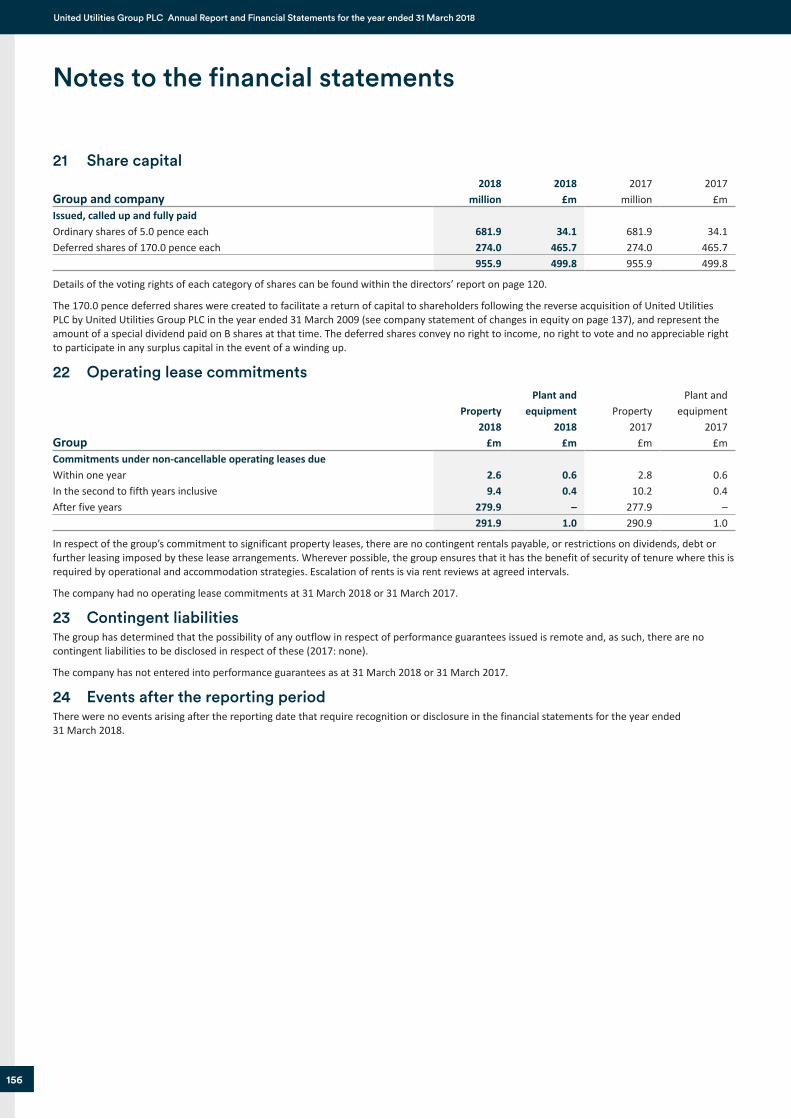
Job Number 1 June 2018 11:11 AM Proof 3 Job Number 1 June 2018 11:11 AM Proof 3
156
United Utilities Group PLC Annual Report and Financial Statements for the year ended 31 March 2018
21 Share capital
Group and company2018
million2018
£m2017
million2017
£mIssued, called up and fully paidOrdinary shares of 5.0 pence each 681.9 34.1 681.9 34.1Deferred shares of 170.0 pence each 274.0 465.7 274.0 465.7
955.9 499.8 955.9 499.8
Details of the voting rights of each category of shares can be found within the directors’ report on page 120.
The 170.0 pence deferred shares were created to facilitate a return of capital to shareholders following the reverse acquisition of United Utilities PLC by United Utilities Group PLC in the year ended 31 March 2009 (see company statement of changes in equity on page 137), and represent the amount of a special dividend paid on B shares at that time. The deferred shares convey no right to income, no right to vote and no appreciable right to participate in any surplus capital in the event of a winding up.
22 Operating lease commitments
Group
Property 2018
£m
Plant and equipment
2018£m
Property 2017
£m
Plant and equipment
2017£m
Commitments under non-cancellable operating leases dueWithin one year 2.6 0.6 2.8 0.6In the second to fifth years inclusive 9.4 0.4 10.2 0.4After five years 279.9 – 277.9 –
291.9 1.0 290.9 1.0
In respect of the group’s commitment to significant property leases, there are no contingent rentals payable, or restrictions on dividends, debt or further leasing imposed by these lease arrangements. Wherever possible, the group ensures that it has the benefit of security of tenure where this is required by operational and accommodation strategies. Escalation of rents is via rent reviews at agreed intervals.
The company had no operating lease commitments at 31 March 2018 or 31 March 2017.
23 Contingent liabilitiesThe group has determined that the possibility of any outflow in respect of performance guarantees issued is remote and, as such, there are no contingent liabilities to be disclosed in respect of these (2017: none).
The company has not entered into performance guarantees as at 31 March 2018 or 31 March 2017.
24 Events after the reporting periodThere were no events arising after the reporting date that require recognition or disclosure in the financial statements for the year ended 31 March 2018.
Notes to the financial statements
United Utilities 2018 - Financial Statements.indd 156 6/1/2018 12:29:12 PM
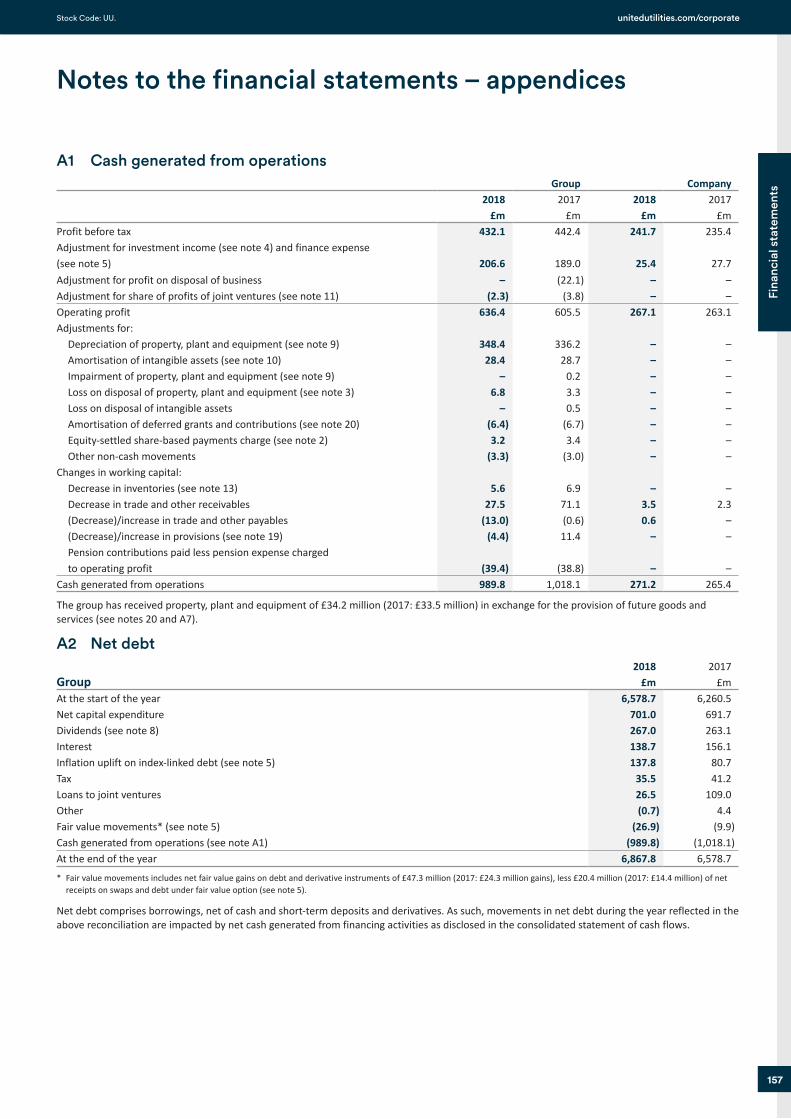
Job Number 1 June 2018 11:11 AM Proof 3 Job Number 1 June 2018 11:11 AM Proof 3
157
Fina
ncia
l sta
tem
ents
unitedutilities.com/corporate Stock Code: UU.
A1 Cash generated from operationsGroup Company
2018£m
2017£m
2018£m
2017£m
Profit before tax 432.1 442.4 241.7 235.4Adjustment for investment income (see note 4) and finance expense(see note 5) 206.6 189.0 25.4 27.7Adjustment for profit on disposal of business – (22.1) – –Adjustment for share of profits of joint ventures (see note 11) (2.3) (3.8) – –Operating profit 636.4 605.5 267.1 263.1Adjustments for: Depreciation of property, plant and equipment (see note 9) 348.4 336.2 – – Amortisation of intangible assets (see note 10) 28.4 28.7 – – Impairment of property, plant and equipment (see note 9) – 0.2 – – Loss on disposal of property, plant and equipment (see note 3) 6.8 3.3 – – Loss on disposal of intangible assets – 0.5 – – Amortisation of deferred grants and contributions (see note 20) (6.4) (6.7) – – Equity-settled share-based payments charge (see note 2) 3.2 3.4 – – Other non-cash movements (3.3) (3.0) – –Changes in working capital: Decrease in inventories (see note 13) 5.6 6.9 – – Decrease in trade and other receivables 27.5 71.1 3.5 2.3 (Decrease)/increase in trade and other payables (13.0) (0.6) 0.6 – (Decrease)/increase in provisions (see note 19) (4.4) 11.4 – – Pension contributions paid less pension expense charged to operating profit (39.4) (38.8) – –Cash generated from operations 989.8 1,018.1 271.2 265.4
The group has received property, plant and equipment of £34.2 million (2017: £33.5 million) in exchange for the provision of future goods and services (see notes 20 and A7).
A2 Net debt
Group2018
£m2017
£mAt the start of the year 6,578.7 6,260.5Net capital expenditure 701.0 691.7Dividends (see note 8) 267.0 263.1Interest 138.7 156.1Inflation uplift on index-linked debt (see note 5) 137.8 80.7Tax 35.5 41.2Loans to joint ventures 26.5 109.0Other (0.7) 4.4Fair value movements* (see note 5) (26.9) (9.9)Cash generated from operations (see note A1) (989.8) (1,018.1)At the end of the year 6,867.8 6,578.7
* Fair value movements includes net fair value gains on debt and derivative instruments of £47.3 million (2017: £24.3 million gains), less £20.4 million (2017: £14.4 million) of net receipts on swaps and debt under fair value option (see note 5).
Net debt comprises borrowings, net of cash and short-term deposits and derivatives. As such, movements in net debt during the year reflected in the above reconciliation are impacted by net cash generated from financing activities as disclosed in the consolidated statement of cash flows.
Notes to the financial statements – appendices
United Utilities 2018 - Financial Statements.indd 157 6/1/2018 12:29:13 PM
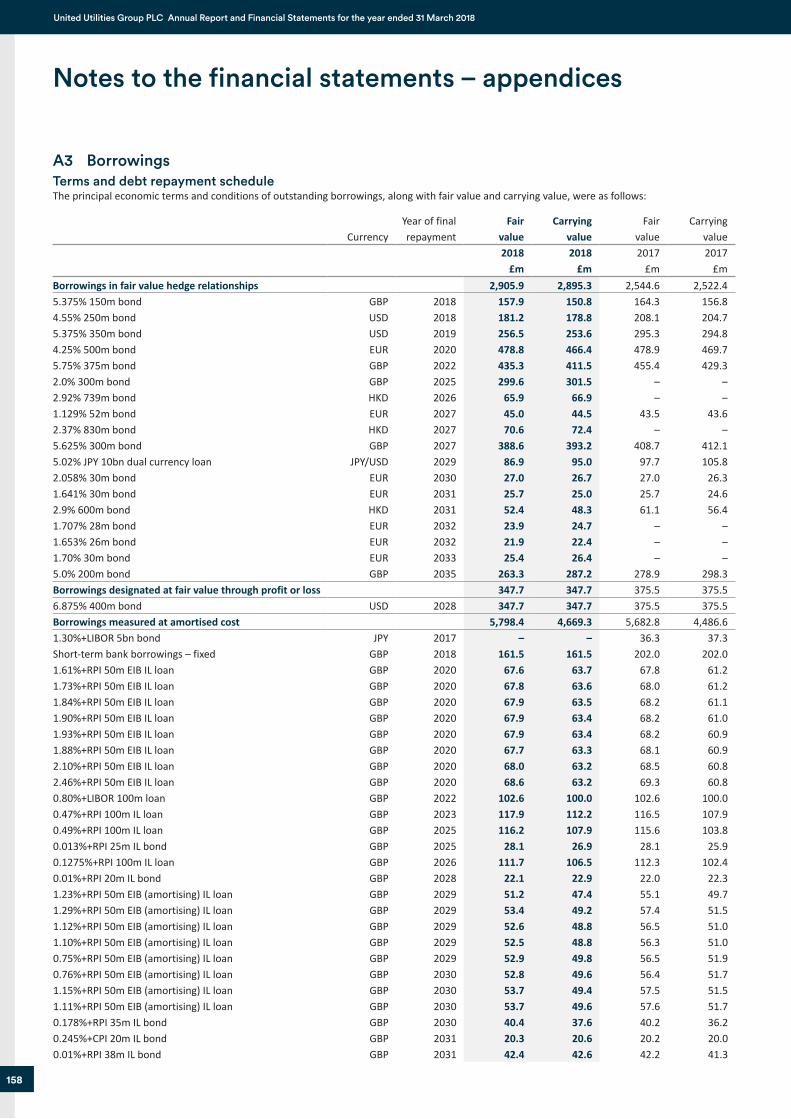
Job Number 1 June 2018 11:11 AM Proof 3 Job Number 1 June 2018 11:11 AM Proof 3
158
United Utilities Group PLC Annual Report and Financial Statements for the year ended 31 March 2018
A3 BorrowingsTerms and debt repayment scheduleThe principal economic terms and conditions of outstanding borrowings, along with fair value and carrying value, were as follows:
CurrencyYear of final repayment
Fair value
Carrying value
Fair value
Carrying value
2018£m
2018£m
2017£m
2017£m
Borrowings in fair value hedge relationships 2,905.9 2,895.3 2,544.6 2,522.45.375% 150m bond GBP 2018 157.9 150.8 164.3 156.84.55% 250m bond USD 2018 181.2 178.8 208.1 204.75.375% 350m bond USD 2019 256.5 253.6 295.3 294.84.25% 500m bond EUR 2020 478.8 466.4 478.9 469.75.75% 375m bond GBP 2022 435.3 411.5 455.4 429.32.0% 300m bond GBP 2025 299.6 301.5 – –2.92% 739m bond HKD 2026 65.9 66.9 – –1.129% 52m bond EUR 2027 45.0 44.5 43.5 43.62.37% 830m bond HKD 2027 70.6 72.4 – –5.625% 300m bond GBP 2027 388.6 393.2 408.7 412.15.02% JPY 10bn dual currency loan JPY/USD 2029 86.9 95.0 97.7 105.82.058% 30m bond EUR 2030 27.0 26.7 27.0 26.31.641% 30m bond EUR 2031 25.7 25.0 25.7 24.62.9% 600m bond HKD 2031 52.4 48.3 61.1 56.41.707% 28m bond EUR 2032 23.9 24.7 – –1.653% 26m bond EUR 2032 21.9 22.4 – –1.70% 30m bond EUR 2033 25.4 26.4 – –5.0% 200m bond GBP 2035 263.3 287.2 278.9 298.3Borrowings designated at fair value through profit or loss 347.7 347.7 375.5 375.56.875% 400m bond USD 2028 347.7 347.7 375.5 375.5Borrowings measured at amortised cost 5,798.4 4,669.3 5,682.8 4,486.61.30%+LIBOR 5bn bond JPY 2017 – – 36.3 37.3Short-term bank borrowings – fixed GBP 2018 161.5 161.5 202.0 202.01.61%+RPI 50m EIB IL loan GBP 2020 67.6 63.7 67.8 61.21.73%+RPI 50m EIB IL loan GBP 2020 67.8 63.6 68.0 61.21.84%+RPI 50m EIB IL loan GBP 2020 67.9 63.5 68.2 61.11.90%+RPI 50m EIB IL loan GBP 2020 67.9 63.4 68.2 61.01.93%+RPI 50m EIB IL loan GBP 2020 67.9 63.4 68.2 60.91.88%+RPI 50m EIB IL loan GBP 2020 67.7 63.3 68.1 60.92.10%+RPI 50m EIB IL loan GBP 2020 68.0 63.2 68.5 60.82.46%+RPI 50m EIB IL loan GBP 2020 68.6 63.2 69.3 60.80.80%+LIBOR 100m loan GBP 2022 102.6 100.0 102.6 100.00.47%+RPI 100m IL loan GBP 2023 117.9 112.2 116.5 107.90.49%+RPI 100m IL loan GBP 2025 116.2 107.9 115.6 103.80.013%+RPI 25m IL bond GBP 2025 28.1 26.9 28.1 25.90.1275%+RPI 100m IL loan GBP 2026 111.7 106.5 112.3 102.40.01%+RPI 20m IL bond GBP 2028 22.1 22.9 22.0 22.31.23%+RPI 50m EIB (amortising) IL loan GBP 2029 51.2 47.4 55.1 49.71.29%+RPI 50m EIB (amortising) IL loan GBP 2029 53.4 49.2 57.4 51.51.12%+RPI 50m EIB (amortising) IL loan GBP 2029 52.6 48.8 56.5 51.01.10%+RPI 50m EIB (amortising) IL loan GBP 2029 52.5 48.8 56.3 51.00.75%+RPI 50m EIB (amortising) IL loan GBP 2029 52.9 49.8 56.5 51.90.76%+RPI 50m EIB (amortising) IL loan GBP 2030 52.8 49.6 56.4 51.71.15%+RPI 50m EIB (amortising) IL loan GBP 2030 53.7 49.4 57.5 51.51.11%+RPI 50m EIB (amortising) IL loan GBP 2030 53.7 49.6 57.6 51.70.178%+RPI 35m IL bond GBP 2030 40.4 37.6 40.2 36.20.245%+CPI 20m IL bond GBP 2031 20.3 20.6 20.2 20.00.01%+RPI 38m IL bond GBP 2031 42.4 42.6 42.2 41.3
Notes to the financial statements – appendices
United Utilities 2018 - Financial Statements.indd 158 6/1/2018 12:29:13 PM
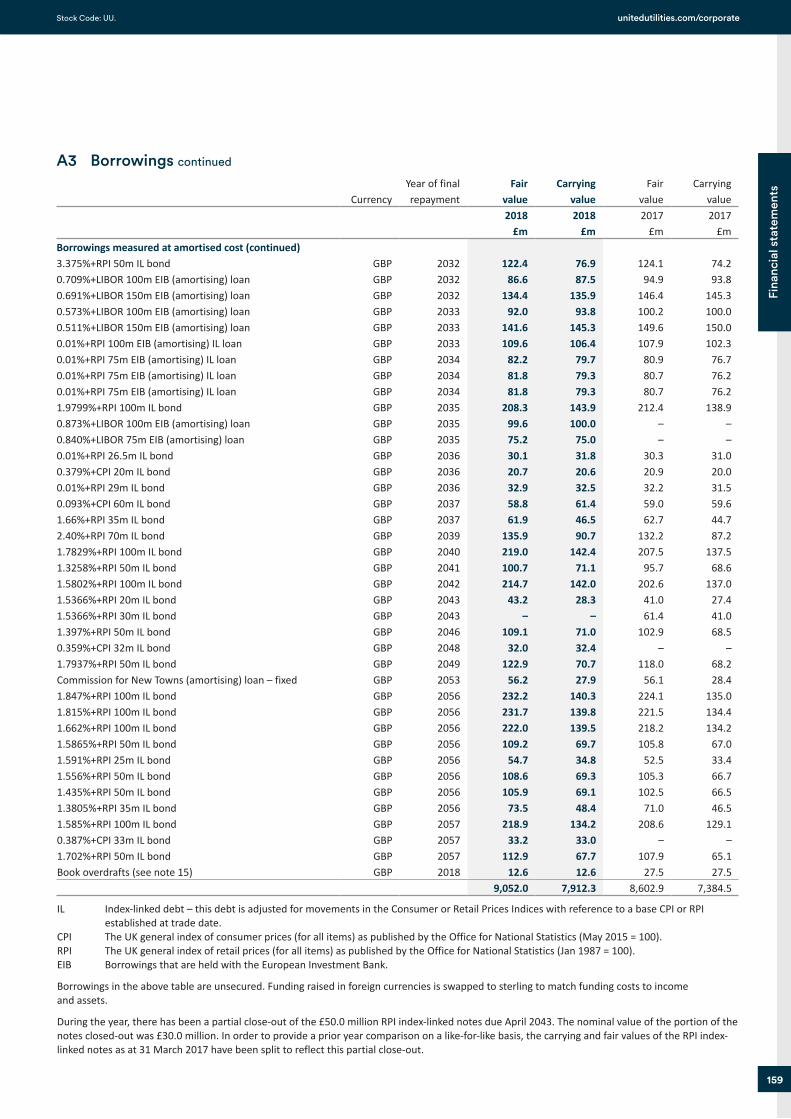
Job Number 1 June 2018 11:11 AM Proof 3 Job Number 1 June 2018 11:11 AM Proof 3
159
Fina
ncia
l sta
tem
ents
unitedutilities.com/corporate Stock Code: UU.
A3 Borrowings continued
CurrencyYear of final repayment
Fair value
Carrying value
Fair value
Carrying value
2018£m
2018£m
2017£m
2017£m
Borrowings measured at amortised cost (continued)3.375%+RPI 50m IL bond GBP 2032 122.4 76.9 124.1 74.20.709%+LIBOR 100m EIB (amortising) loan GBP 2032 86.6 87.5 94.9 93.80.691%+LIBOR 150m EIB (amortising) loan GBP 2032 134.4 135.9 146.4 145.30.573%+LIBOR 100m EIB (amortising) loan GBP 2033 92.0 93.8 100.2 100.00.511%+LIBOR 150m EIB (amortising) loan GBP 2033 141.6 145.3 149.6 150.00.01%+RPI 100m EIB (amortising) IL loan GBP 2033 109.6 106.4 107.9 102.30.01%+RPI 75m EIB (amortising) IL loan GBP 2034 82.2 79.7 80.9 76.70.01%+RPI 75m EIB (amortising) IL loan GBP 2034 81.8 79.3 80.7 76.20.01%+RPI 75m EIB (amortising) IL loan GBP 2034 81.8 79.3 80.7 76.21.9799%+RPI 100m IL bond GBP 2035 208.3 143.9 212.4 138.90.873%+LIBOR 100m EIB (amortising) loan GBP 2035 99.6 100.0 – –0.840%+LIBOR 75m EIB (amortising) loan GBP 2035 75.2 75.0 – –0.01%+RPI 26.5m IL bond GBP 2036 30.1 31.8 30.3 31.00.379%+CPI 20m IL bond GBP 2036 20.7 20.6 20.9 20.00.01%+RPI 29m IL bond GBP 2036 32.9 32.5 32.2 31.50.093%+CPI 60m IL bond GBP 2037 58.8 61.4 59.0 59.61.66%+RPI 35m IL bond GBP 2037 61.9 46.5 62.7 44.72.40%+RPI 70m IL bond GBP 2039 135.9 90.7 132.2 87.21.7829%+RPI 100m IL bond GBP 2040 219.0 142.4 207.5 137.51.3258%+RPI 50m IL bond GBP 2041 100.7 71.1 95.7 68.61.5802%+RPI 100m IL bond GBP 2042 214.7 142.0 202.6 137.01.5366%+RPI 20m IL bond GBP 2043 43.2 28.3 41.0 27.41.5366%+RPI 30m IL bond GBP 2043 – – 61.4 41.01.397%+RPI 50m IL bond GBP 2046 109.1 71.0 102.9 68.50.359%+CPI 32m IL bond GBP 2048 32.0 32.4 – –1.7937%+RPI 50m IL bond GBP 2049 122.9 70.7 118.0 68.2Commission for New Towns (amortising) loan – fixed GBP 2053 56.2 27.9 56.1 28.41.847%+RPI 100m IL bond GBP 2056 232.2 140.3 224.1 135.01.815%+RPI 100m IL bond GBP 2056 231.7 139.8 221.5 134.41.662%+RPI 100m IL bond GBP 2056 222.0 139.5 218.2 134.21.5865%+RPI 50m IL bond GBP 2056 109.2 69.7 105.8 67.01.591%+RPI 25m IL bond GBP 2056 54.7 34.8 52.5 33.41.556%+RPI 50m IL bond GBP 2056 108.6 69.3 105.3 66.71.435%+RPI 50m IL bond GBP 2056 105.9 69.1 102.5 66.51.3805%+RPI 35m IL bond GBP 2056 73.5 48.4 71.0 46.51.585%+RPI 100m IL bond GBP 2057 218.9 134.2 208.6 129.10.387%+CPI 33m IL bond GBP 2057 33.2 33.0 – –1.702%+RPI 50m IL bond GBP 2057 112.9 67.7 107.9 65.1Book overdrafts (see note 15) GBP 2018 12.6 12.6 27.5 27.5
9,052.0 7,912.3 8,602.9 7,384.5
IL Index-linked debt – this debt is adjusted for movements in the Consumer or Retail Prices Indices with reference to a base CPI or RPI established at trade date.
CPI The UK general index of consumer prices (for all items) as published by the Office for National Statistics (May 2015 = 100).RPI The UK general index of retail prices (for all items) as published by the Office for National Statistics (Jan 1987 = 100).EIB Borrowings that are held with the European Investment Bank.
Borrowings in the above table are unsecured. Funding raised in foreign currencies is swapped to sterling to match funding costs to income and assets.
During the year, there has been a partial close-out of the £50.0 million RPI index-linked notes due April 2043. The nominal value of the portion of the notes closed-out was £30.0 million. In order to provide a prior year comparison on a like-for-like basis, the carrying and fair values of the RPI index-linked notes as at 31 March 2017 have been split to reflect this partial close-out.
United Utilities 2018 - Financial Statements.indd 159 6/1/2018 12:29:13 PM
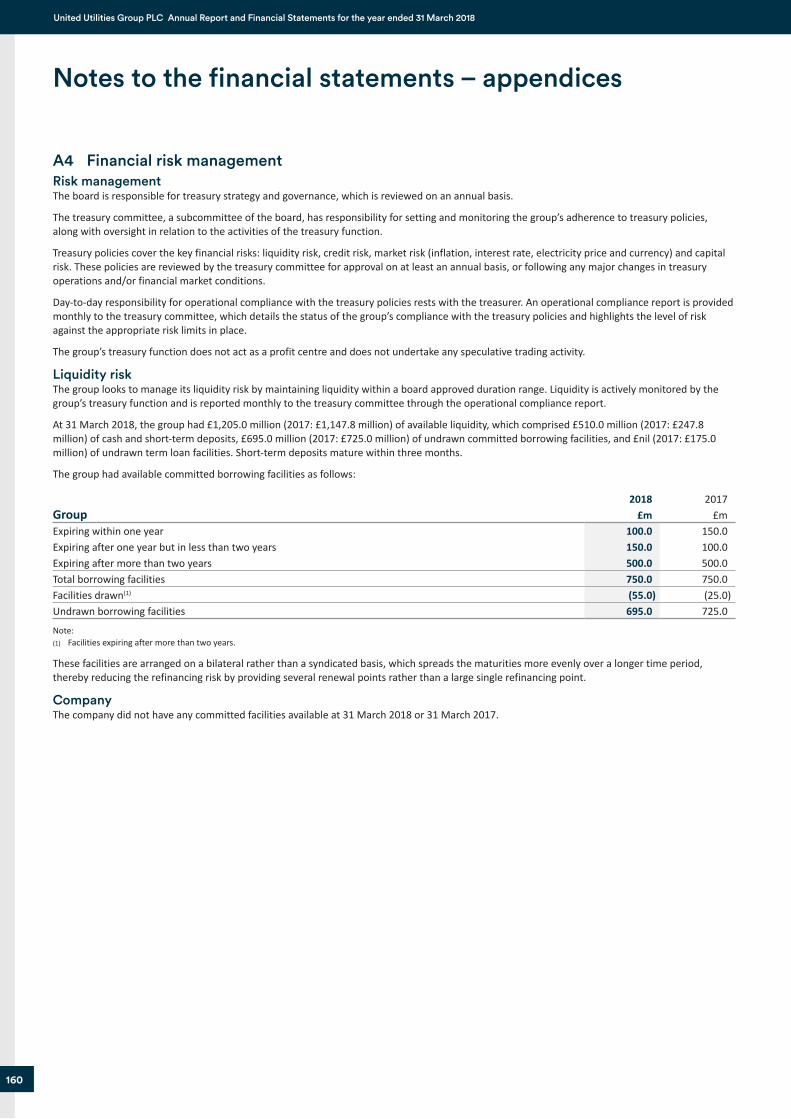
Job Number 1 June 2018 11:11 AM Proof 3 Job Number 1 June 2018 11:11 AM Proof 3
160
United Utilities Group PLC Annual Report and Financial Statements for the year ended 31 March 2018
A4 Financial risk management Risk management The board is responsible for treasury strategy and governance, which is reviewed on an annual basis.
The treasury committee, a subcommittee of the board, has responsibility for setting and monitoring the group’s adherence to treasury policies, along with oversight in relation to the activities of the treasury function.
Treasury policies cover the key financial risks: liquidity risk, credit risk, market risk (inflation, interest rate, electricity price and currency) and capital risk. These policies are reviewed by the treasury committee for approval on at least an annual basis, or following any major changes in treasury operations and/or financial market conditions.
Day-to-day responsibility for operational compliance with the treasury policies rests with the treasurer. An operational compliance report is provided monthly to the treasury committee, which details the status of the group’s compliance with the treasury policies and highlights the level of risk against the appropriate risk limits in place.
The group’s treasury function does not act as a profit centre and does not undertake any speculative trading activity.
Liquidity risk The group looks to manage its liquidity risk by maintaining liquidity within a board approved duration range. Liquidity is actively monitored by the group’s treasury function and is reported monthly to the treasury committee through the operational compliance report.
At 31 March 2018, the group had £1,205.0 million (2017: £1,147.8 million) of available liquidity, which comprised £510.0 million (2017: £247.8 million) of cash and short-term deposits, £695.0 million (2017: £725.0 million) of undrawn committed borrowing facilities, and £nil (2017: £175.0 million) of undrawn term loan facilities. Short-term deposits mature within three months.
The group had available committed borrowing facilities as follows:
Group2018
£m2017
£mExpiring within one year 100.0 150.0Expiring after one year but in less than two years 150.0 100.0Expiring after more than two years 500.0 500.0Total borrowing facilities 750.0 750.0Facilities drawn(1) (55.0) (25.0)Undrawn borrowing facilities 695.0 725.0
Note:(1) Facilities expiring after more than two years.
These facilities are arranged on a bilateral rather than a syndicated basis, which spreads the maturities more evenly over a longer time period, thereby reducing the refinancing risk by providing several renewal points rather than a large single refinancing point.
CompanyThe company did not have any committed facilities available at 31 March 2018 or 31 March 2017.
Notes to the financial statements – appendices
United Utilities 2018 - Financial Statements.indd 160 6/1/2018 12:29:13 PM
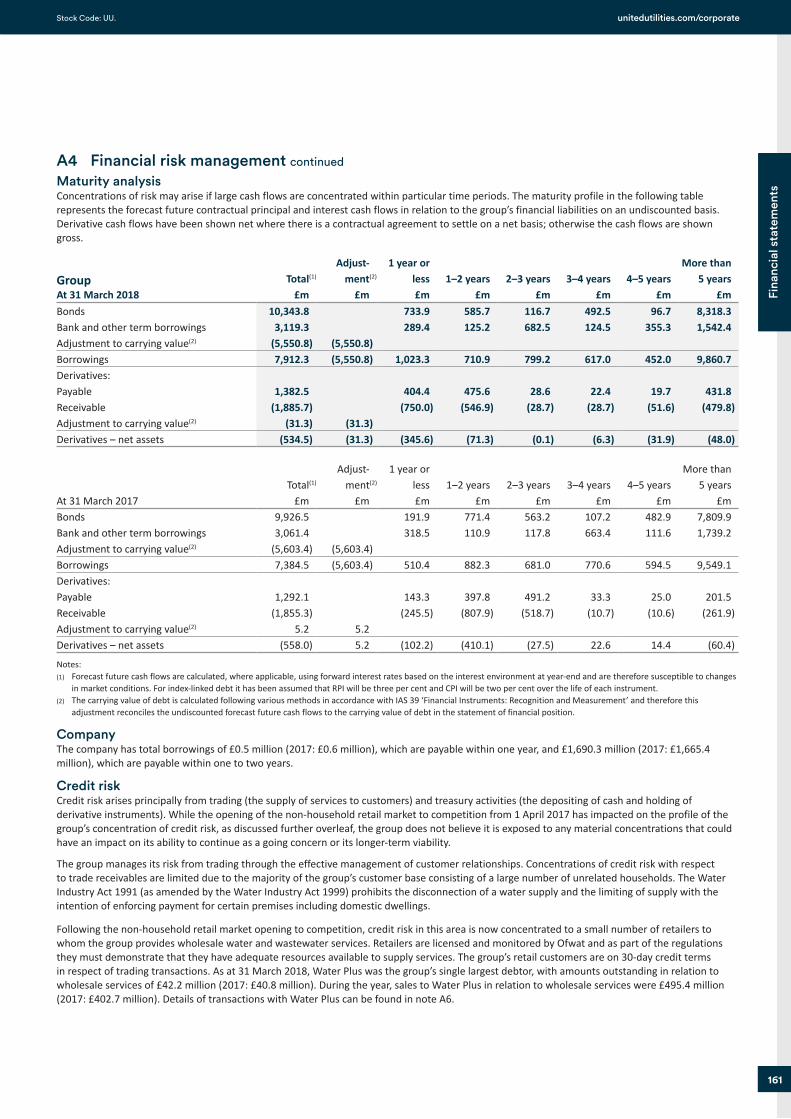
Job Number 1 June 2018 11:11 AM Proof 3 Job Number 1 June 2018 11:11 AM Proof 3
161
Fina
ncia
l sta
tem
ents
unitedutilities.com/corporate Stock Code: UU.
A4 Financial risk management continued
Maturity analysisConcentrations of risk may arise if large cash flows are concentrated within particular time periods. The maturity profile in the following table represents the forecast future contractual principal and interest cash flows in relation to the group’s financial liabilities on an undiscounted basis. Derivative cash flows have been shown net where there is a contractual agreement to settle on a net basis; otherwise the cash flows are shown gross.
GroupAt 31 March 2018
Total(1)
£m
Adjust-ment(2)
£m
1 year or less£m
1–2 years £m
2–3 years £m
3–4 years £m
4–5 years £m
More than 5 years
£mBonds 10,343.8 733.9 585.7 116.7 492.5 96.7 8,318.3Bank and other term borrowings 3,119.3 289.4 125.2 682.5 124.5 355.3 1,542.4Adjustment to carrying value(2) (5,550.8) (5,550.8)Borrowings 7,912.3 (5,550.8) 1,023.3 710.9 799.2 617.0 452.0 9,860.7Derivatives:Payable 1,382.5 404.4 475.6 28.6 22.4 19.7 431.8Receivable (1,885.7) (750.0) (546.9) (28.7) (28.7) (51.6) (479.8)Adjustment to carrying value(2) (31.3) (31.3)Derivatives – net assets (534.5) (31.3) (345.6) (71.3) (0.1) (6.3) (31.9) (48.0)
At 31 March 2017Total(1)
£m
Adjust-ment(2)
£m
1 year or less £m
1–2 years £m
2–3 years £m
3–4 years £m
4–5 years £m
More than 5 years
£mBonds 9,926.5 191.9 771.4 563.2 107.2 482.9 7,809.9Bank and other term borrowings 3,061.4 318.5 110.9 117.8 663.4 111.6 1,739.2Adjustment to carrying value(2) (5,603.4) (5,603.4)Borrowings 7,384.5 (5,603.4) 510.4 882.3 681.0 770.6 594.5 9,549.1Derivatives:Payable 1,292.1 143.3 397.8 491.2 33.3 25.0 201.5Receivable (1,855.3) (245.5) (807.9) (518.7) (10.7) (10.6) (261.9)Adjustment to carrying value(2) 5.2 5.2Derivatives – net assets (558.0) 5.2 (102.2) (410.1) (27.5) 22.6 14.4 (60.4)
Notes:(1) Forecast future cash flows are calculated, where applicable, using forward interest rates based on the interest environment at year-end and are therefore susceptible to changes
in market conditions. For index-linked debt it has been assumed that RPI will be three per cent and CPI will be two per cent over the life of each instrument.(2) The carrying value of debt is calculated following various methods in accordance with IAS 39 ‘Financial Instruments: Recognition and Measurement’ and therefore this
adjustment reconciles the undiscounted forecast future cash flows to the carrying value of debt in the statement of financial position.
CompanyThe company has total borrowings of £0.5 million (2017: £0.6 million), which are payable within one year, and £1,690.3 million (2017: £1,665.4 million), which are payable within one to two years.
Credit risk Credit risk arises principally from trading (the supply of services to customers) and treasury activities (the depositing of cash and holding of derivative instruments). While the opening of the non-household retail market to competition from 1 April 2017 has impacted on the profile of the group’s concentration of credit risk, as discussed further overleaf, the group does not believe it is exposed to any material concentrations that could have an impact on its ability to continue as a going concern or its longer-term viability.
The group manages its risk from trading through the effective management of customer relationships. Concentrations of credit risk with respect to trade receivables are limited due to the majority of the group’s customer base consisting of a large number of unrelated households. The Water Industry Act 1991 (as amended by the Water Industry Act 1999) prohibits the disconnection of a water supply and the limiting of supply with the intention of enforcing payment for certain premises including domestic dwellings.
Following the non-household retail market opening to competition, credit risk in this area is now concentrated to a small number of retailers to whom the group provides wholesale water and wastewater services. Retailers are licensed and monitored by Ofwat and as part of the regulations they must demonstrate that they have adequate resources available to supply services. The group’s retail customers are on 30-day credit terms in respect of trading transactions. As at 31 March 2018, Water Plus was the group’s single largest debtor, with amounts outstanding in relation to wholesale services of £42.2 million (2017: £40.8 million). During the year, sales to Water Plus in relation to wholesale services were £495.4 million (2017: £402.7 million). Details of transactions with Water Plus can be found in note A6.
United Utilities 2018 - Financial Statements.indd 161 6/1/2018 12:29:13 PM
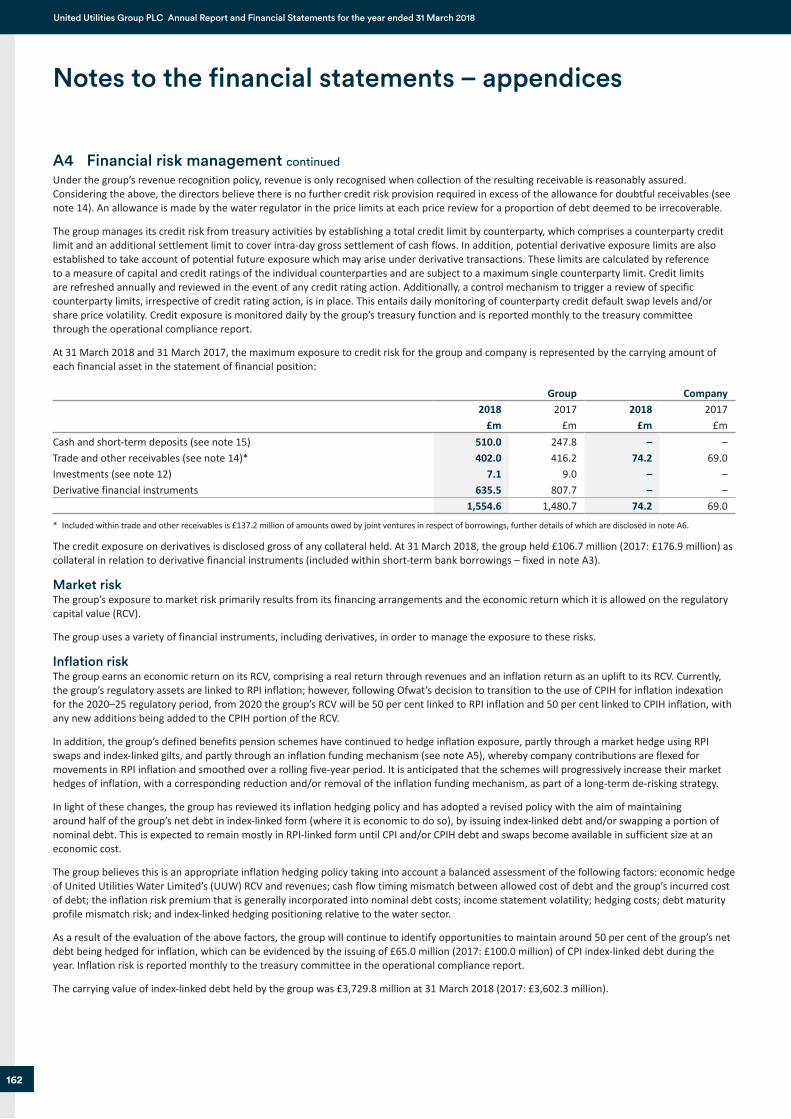
Job Number 1 June 2018 11:11 AM Proof 3 Job Number 1 June 2018 11:11 AM Proof 3
162
United Utilities Group PLC Annual Report and Financial Statements for the year ended 31 March 2018
A4 Financial risk management continuedUnder the group’s revenue recognition policy, revenue is only recognised when collection of the resulting receivable is reasonably assured. Considering the above, the directors believe there is no further credit risk provision required in excess of the allowance for doubtful receivables (see note 14). An allowance is made by the water regulator in the price limits at each price review for a proportion of debt deemed to be irrecoverable.
The group manages its credit risk from treasury activities by establishing a total credit limit by counterparty, which comprises a counterparty credit limit and an additional settlement limit to cover intra-day gross settlement of cash flows. In addition, potential derivative exposure limits are also established to take account of potential future exposure which may arise under derivative transactions. These limits are calculated by reference to a measure of capital and credit ratings of the individual counterparties and are subject to a maximum single counterparty limit. Credit limits are refreshed annually and reviewed in the event of any credit rating action. Additionally, a control mechanism to trigger a review of specific counterparty limits, irrespective of credit rating action, is in place. This entails daily monitoring of counterparty credit default swap levels and/or share price volatility. Credit exposure is monitored daily by the group’s treasury function and is reported monthly to the treasury committee through the operational compliance report.
At 31 March 2018 and 31 March 2017, the maximum exposure to credit risk for the group and company is represented by the carrying amount of each financial asset in the statement of financial position:
Group Company2018
£m2017
£m2018
£m2017
£mCash and short-term deposits (see note 15) 510.0 247.8 – –Trade and other receivables (see note 14)* 402.0 416.2 74.2 69.0Investments (see note 12) 7.1 9.0 – –Derivative financial instruments 635.5 807.7 – –
1,554.6 1,480.7 74.2 69.0
* Included within trade and other receivables is £137.2 million of amounts owed by joint ventures in respect of borrowings, further details of which are disclosed in note A6.
The credit exposure on derivatives is disclosed gross of any collateral held. At 31 March 2018, the group held £106.7 million (2017: £176.9 million) as collateral in relation to derivative financial instruments (included within short-term bank borrowings – fixed in note A3).
Market risk The group’s exposure to market risk primarily results from its financing arrangements and the economic return which it is allowed on the regulatory capital value (RCV).
The group uses a variety of financial instruments, including derivatives, in order to manage the exposure to these risks.
Inflation riskThe group earns an economic return on its RCV, comprising a real return through revenues and an inflation return as an uplift to its RCV. Currently, the group’s regulatory assets are linked to RPI inflation; however, following Ofwat’s decision to transition to the use of CPIH for inflation indexation for the 2020–25 regulatory period, from 2020 the group’s RCV will be 50 per cent linked to RPI inflation and 50 per cent linked to CPIH inflation, with any new additions being added to the CPIH portion of the RCV.
In addition, the group’s defined benefits pension schemes have continued to hedge inflation exposure, partly through a market hedge using RPI swaps and index-linked gilts, and partly through an inflation funding mechanism (see note A5), whereby company contributions are flexed for movements in RPI inflation and smoothed over a rolling five-year period. It is anticipated that the schemes will progressively increase their market hedges of inflation, with a corresponding reduction and/or removal of the inflation funding mechanism, as part of a long-term de-risking strategy.
In light of these changes, the group has reviewed its inflation hedging policy and has adopted a revised policy with the aim of maintaining around half of the group’s net debt in index-linked form (where it is economic to do so), by issuing index-linked debt and/or swapping a portion of nominal debt. This is expected to remain mostly in RPI-linked form until CPI and/or CPIH debt and swaps become available in sufficient size at an economic cost.
The group believes this is an appropriate inflation hedging policy taking into account a balanced assessment of the following factors: economic hedge of United Utilities Water Limited’s (UUW) RCV and revenues; cash flow timing mismatch between allowed cost of debt and the group’s incurred cost of debt; the inflation risk premium that is generally incorporated into nominal debt costs; income statement volatility; hedging costs; debt maturity profile mismatch risk; and index-linked hedging positioning relative to the water sector.
As a result of the evaluation of the above factors, the group will continue to identify opportunities to maintain around 50 per cent of the group’s net debt being hedged for inflation, which can be evidenced by the issuing of £65.0 million (2017: £100.0 million) of CPI index-linked debt during the year. Inflation risk is reported monthly to the treasury committee in the operational compliance report.
The carrying value of index-linked debt held by the group was £3,729.8 million at 31 March 2018 (2017: £3,602.3 million).
Notes to the financial statements – appendices
United Utilities 2018 - Financial Statements.indd 162 6/1/2018 12:29:14 PM
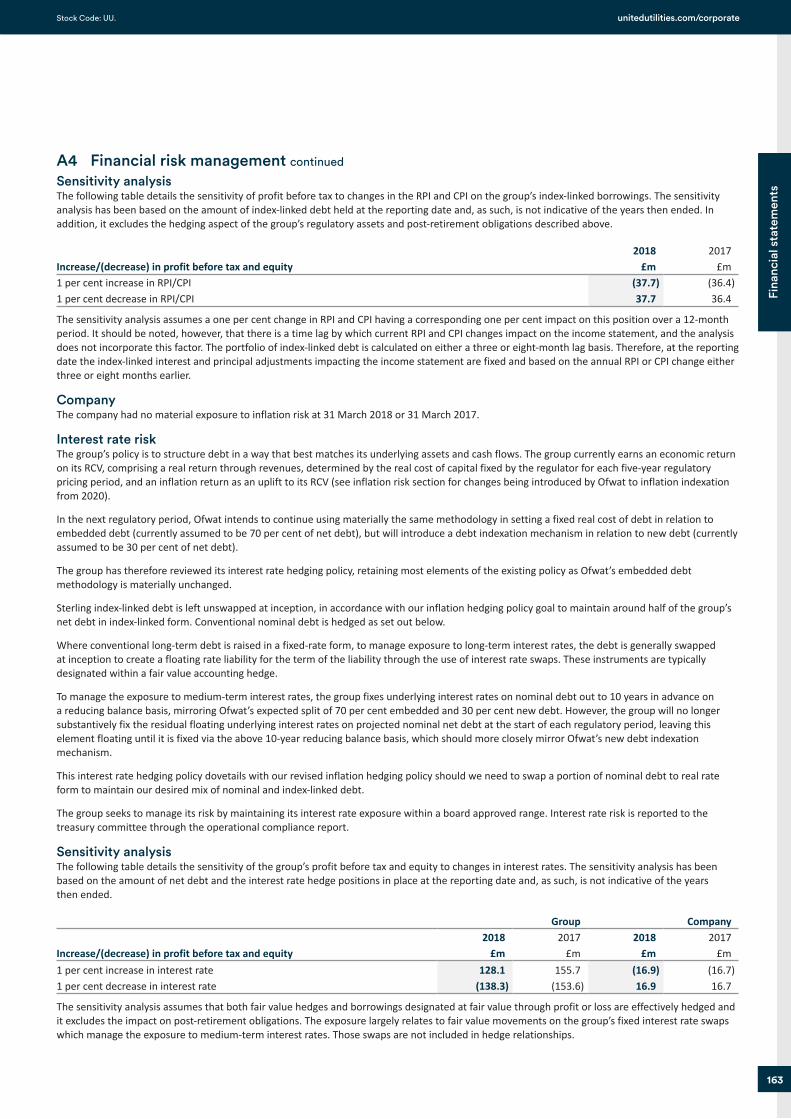
Job Number 1 June 2018 11:11 AM Proof 3 Job Number 1 June 2018 11:11 AM Proof 3
163
Fina
ncia
l sta
tem
ents
unitedutilities.com/corporate Stock Code: UU.
A4 Financial risk management continued
Sensitivity analysisThe following table details the sensitivity of profit before tax to changes in the RPI and CPI on the group’s index-linked borrowings. The sensitivity analysis has been based on the amount of index-linked debt held at the reporting date and, as such, is not indicative of the years then ended. In addition, it excludes the hedging aspect of the group’s regulatory assets and post-retirement obligations described above.
Increase/(decrease) in profit before tax and equity2018
£m2017
£m1 per cent increase in RPI/CPI (37.7) (36.4)1 per cent decrease in RPI/CPI 37.7 36.4
The sensitivity analysis assumes a one per cent change in RPI and CPI having a corresponding one per cent impact on this position over a 12-month period. It should be noted, however, that there is a time lag by which current RPI and CPI changes impact on the income statement, and the analysis does not incorporate this factor. The portfolio of index-linked debt is calculated on either a three or eight-month lag basis. Therefore, at the reporting date the index-linked interest and principal adjustments impacting the income statement are fixed and based on the annual RPI or CPI change either three or eight months earlier.
CompanyThe company had no material exposure to inflation risk at 31 March 2018 or 31 March 2017.
Interest rate riskThe group’s policy is to structure debt in a way that best matches its underlying assets and cash flows. The group currently earns an economic return on its RCV, comprising a real return through revenues, determined by the real cost of capital fixed by the regulator for each five-year regulatory pricing period, and an inflation return as an uplift to its RCV (see inflation risk section for changes being introduced by Ofwat to inflation indexation from 2020).
In the next regulatory period, Ofwat intends to continue using materially the same methodology in setting a fixed real cost of debt in relation to embedded debt (currently assumed to be 70 per cent of net debt), but will introduce a debt indexation mechanism in relation to new debt (currently assumed to be 30 per cent of net debt).
The group has therefore reviewed its interest rate hedging policy, retaining most elements of the existing policy as Ofwat’s embedded debt methodology is materially unchanged.
Sterling index-linked debt is left unswapped at inception, in accordance with our inflation hedging policy goal to maintain around half of the group’s net debt in index-linked form. Conventional nominal debt is hedged as set out below.
Where conventional long-term debt is raised in a fixed-rate form, to manage exposure to long-term interest rates, the debt is generally swapped at inception to create a floating rate liability for the term of the liability through the use of interest rate swaps. These instruments are typically designated within a fair value accounting hedge.
To manage the exposure to medium-term interest rates, the group fixes underlying interest rates on nominal debt out to 10 years in advance on a reducing balance basis, mirroring Ofwat’s expected split of 70 per cent embedded and 30 per cent new debt. However, the group will no longer substantively fix the residual floating underlying interest rates on projected nominal net debt at the start of each regulatory period, leaving this element floating until it is fixed via the above 10-year reducing balance basis, which should more closely mirror Ofwat’s new debt indexation mechanism.
This interest rate hedging policy dovetails with our revised inflation hedging policy should we need to swap a portion of nominal debt to real rate form to maintain our desired mix of nominal and index-linked debt.
The group seeks to manage its risk by maintaining its interest rate exposure within a board approved range. Interest rate risk is reported to the treasury committee through the operational compliance report.
Sensitivity analysisThe following table details the sensitivity of the group’s profit before tax and equity to changes in interest rates. The sensitivity analysis has been based on the amount of net debt and the interest rate hedge positions in place at the reporting date and, as such, is not indicative of the years then ended.
Group Company
Increase/(decrease) in profit before tax and equity2018
£m2017
£m2018
£m2017
£m1 per cent increase in interest rate 128.1 155.7 (16.9) (16.7)1 per cent decrease in interest rate (138.3) (153.6) 16.9 16.7
The sensitivity analysis assumes that both fair value hedges and borrowings designated at fair value through profit or loss are effectively hedged and it excludes the impact on post-retirement obligations. The exposure largely relates to fair value movements on the group’s fixed interest rate swaps which manage the exposure to medium-term interest rates. Those swaps are not included in hedge relationships.
United Utilities 2018 - Financial Statements.indd 163 6/1/2018 12:29:14 PM
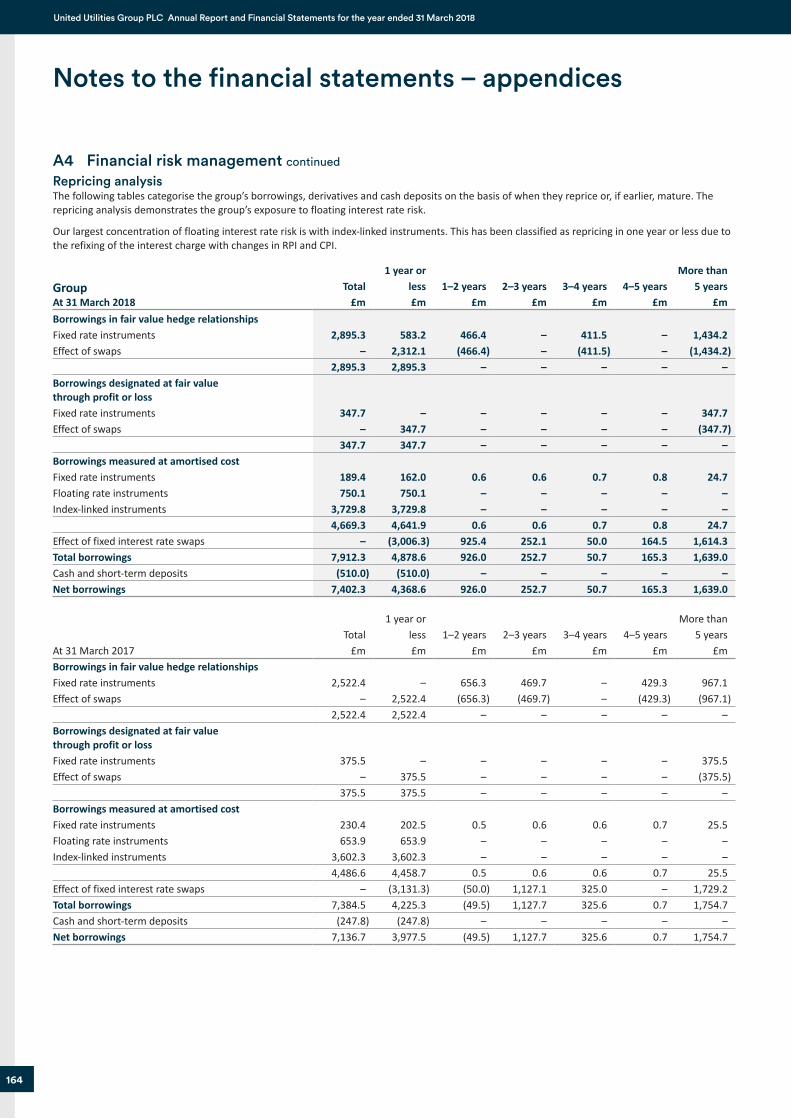
Job Number 1 June 2018 11:11 AM Proof 3 Job Number 1 June 2018 11:11 AM Proof 3
164
United Utilities Group PLC Annual Report and Financial Statements for the year ended 31 March 2018
A4 Financial risk management continued
Repricing analysisThe following tables categorise the group’s borrowings, derivatives and cash deposits on the basis of when they reprice or, if earlier, mature. The repricing analysis demonstrates the group’s exposure to floating interest rate risk.
Our largest concentration of floating interest rate risk is with index-linked instruments. This has been classified as repricing in one year or less due to the refixing of the interest charge with changes in RPI and CPI.
Group At 31 March 2018
Total £m
1 year or less £m
1–2 years £m
2–3 years £m
3–4 years £m
4–5 years £m
More than 5 years
£m Borrowings in fair value hedge relationshipsFixed rate instruments 2,895.3 583.2 466.4 – 411.5 – 1,434.2Effect of swaps – 2,312.1 (466.4) – (411.5) – (1,434.2)
2,895.3 2,895.3 – – – – –Borrowings designated at fair value through profit or lossFixed rate instruments 347.7 – – – – – 347.7Effect of swaps – 347.7 – – – – (347.7)
347.7 347.7 – – – – –Borrowings measured at amortised costFixed rate instruments 189.4 162.0 0.6 0.6 0.7 0.8 24.7Floating rate instruments 750.1 750.1 – – – – –Index-linked instruments 3,729.8 3,729.8 – – – – –
4,669.3 4,641.9 0.6 0.6 0.7 0.8 24.7Effect of fixed interest rate swaps – (3,006.3) 925.4 252.1 50.0 164.5 1,614.3Total borrowings 7,912.3 4,878.6 926.0 252.7 50.7 165.3 1,639.0Cash and short-term deposits (510.0) (510.0) – – – – –Net borrowings 7,402.3 4,368.6 926.0 252.7 50.7 165.3 1,639.0
At 31 March 2017Total
£m
1 year or less £m
1–2 years £m
2–3 years £m
3–4 years £m
4–5 years £m
More than 5 years
£mBorrowings in fair value hedge relationshipsFixed rate instruments 2,522.4 – 656.3 469.7 – 429.3 967.1Effect of swaps – 2,522.4 (656.3) (469.7) – (429.3) (967.1)
2,522.4 2,522.4 – – – – –Borrowings designated at fair value through profit or lossFixed rate instruments 375.5 – – – – – 375.5Effect of swaps – 375.5 – – – – (375.5)
375.5 375.5 – – – – –Borrowings measured at amortised costFixed rate instruments 230.4 202.5 0.5 0.6 0.6 0.7 25.5Floating rate instruments 653.9 653.9 – – – – –Index-linked instruments 3,602.3 3,602.3 – – – – –
4,486.6 4,458.7 0.5 0.6 0.6 0.7 25.5Effect of fixed interest rate swaps – (3,131.3) (50.0) 1,127.1 325.0 – 1,729.2Total borrowings 7,384.5 4,225.3 (49.5) 1,127.7 325.6 0.7 1,754.7Cash and short-term deposits (247.8) (247.8) – – – – –Net borrowings 7,136.7 3,977.5 (49.5) 1,127.7 325.6 0.7 1,754.7
Notes to the financial statements – appendices
United Utilities 2018 - Financial Statements.indd 164 6/1/2018 12:29:14 PM
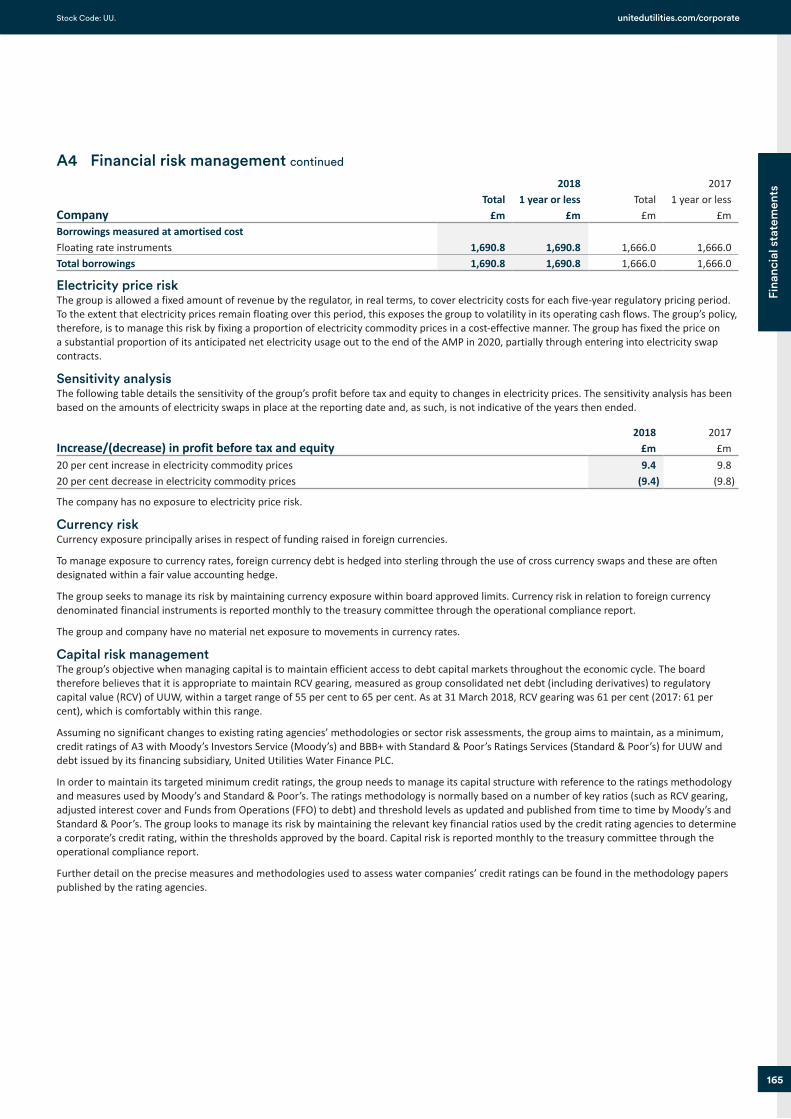
Job Number 1 June 2018 11:11 AM Proof 3 Job Number 1 June 2018 11:11 AM Proof 3
165
Fina
ncia
l sta
tem
ents
unitedutilities.com/corporate Stock Code: UU.
A4 Financial risk management continued
CompanyTotal
£m
2018 1 year or less
£mTotal
£m
2017 1 year or less
£mBorrowings measured at amortised costFloating rate instruments 1,690.8 1,690.8 1,666.0 1,666.0Total borrowings 1,690.8 1,690.8 1,666.0 1,666.0
Electricity price riskThe group is allowed a fixed amount of revenue by the regulator, in real terms, to cover electricity costs for each five-year regulatory pricing period. To the extent that electricity prices remain floating over this period, this exposes the group to volatility in its operating cash flows. The group’s policy, therefore, is to manage this risk by fixing a proportion of electricity commodity prices in a cost-effective manner. The group has fixed the price on a substantial proportion of its anticipated net electricity usage out to the end of the AMP in 2020, partially through entering into electricity swap contracts.
Sensitivity analysisThe following table details the sensitivity of the group’s profit before tax and equity to changes in electricity prices. The sensitivity analysis has been based on the amounts of electricity swaps in place at the reporting date and, as such, is not indicative of the years then ended.
Increase/(decrease) in profit before tax and equity2018
£m2017
£m20 per cent increase in electricity commodity prices 9.4 9.820 per cent decrease in electricity commodity prices (9.4) (9.8)
The company has no exposure to electricity price risk.
Currency riskCurrency exposure principally arises in respect of funding raised in foreign currencies.
To manage exposure to currency rates, foreign currency debt is hedged into sterling through the use of cross currency swaps and these are often designated within a fair value accounting hedge.
The group seeks to manage its risk by maintaining currency exposure within board approved limits. Currency risk in relation to foreign currency denominated financial instruments is reported monthly to the treasury committee through the operational compliance report.
The group and company have no material net exposure to movements in currency rates.
Capital risk management The group’s objective when managing capital is to maintain efficient access to debt capital markets throughout the economic cycle. The board therefore believes that it is appropriate to maintain RCV gearing, measured as group consolidated net debt (including derivatives) to regulatory capital value (RCV) of UUW, within a target range of 55 per cent to 65 per cent. As at 31 March 2018, RCV gearing was 61 per cent (2017: 61 per cent), which is comfortably within this range.
Assuming no significant changes to existing rating agencies’ methodologies or sector risk assessments, the group aims to maintain, as a minimum, credit ratings of A3 with Moody’s Investors Service (Moody’s) and BBB+ with Standard & Poor’s Ratings Services (Standard & Poor’s) for UUW and debt issued by its financing subsidiary, United Utilities Water Finance PLC.
In order to maintain its targeted minimum credit ratings, the group needs to manage its capital structure with reference to the ratings methodology and measures used by Moody’s and Standard & Poor’s. The ratings methodology is normally based on a number of key ratios (such as RCV gearing, adjusted interest cover and Funds from Operations (FFO) to debt) and threshold levels as updated and published from time to time by Moody’s and Standard & Poor’s. The group looks to manage its risk by maintaining the relevant key financial ratios used by the credit rating agencies to determine a corporate’s credit rating, within the thresholds approved by the board. Capital risk is reported monthly to the treasury committee through the operational compliance report.
Further detail on the precise measures and methodologies used to assess water companies’ credit ratings can be found in the methodology papers published by the rating agencies.
United Utilities 2018 - Financial Statements.indd 165 6/1/2018 12:29:14 PM
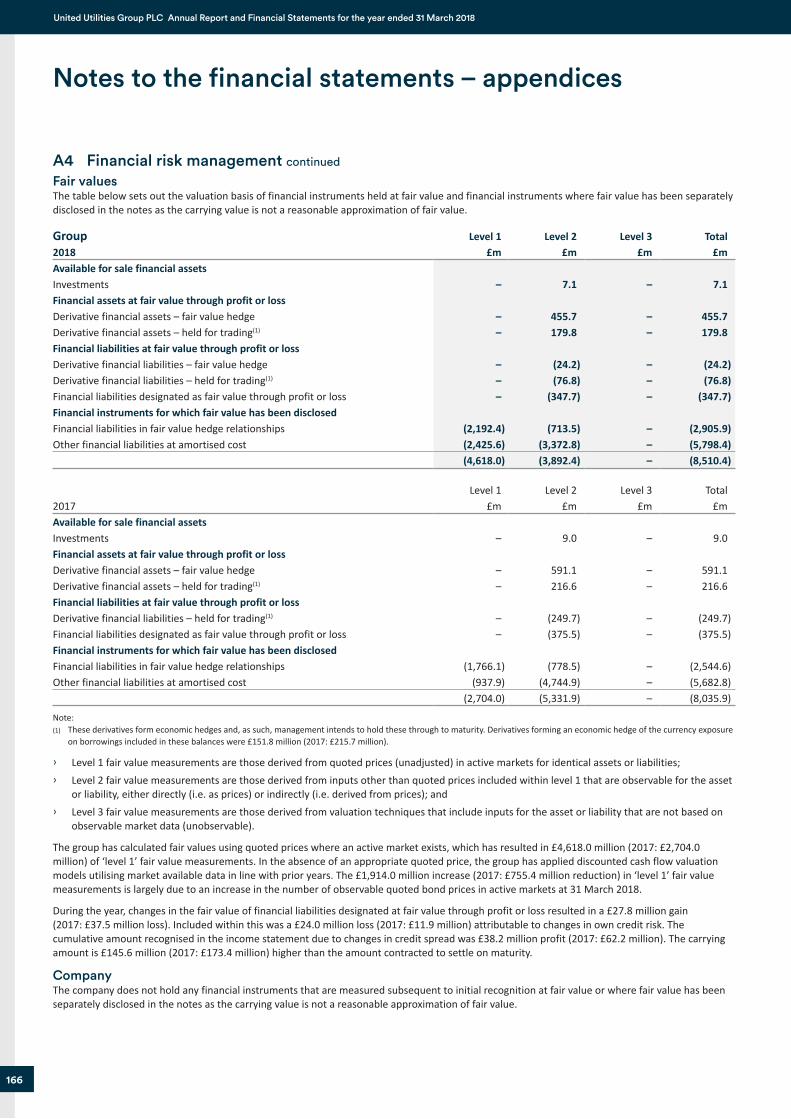
Job Number 1 June 2018 11:11 AM Proof 3 Job Number 1 June 2018 11:11 AM Proof 3
166
United Utilities Group PLC Annual Report and Financial Statements for the year ended 31 March 2018
A4 Financial risk management continued
Fair valuesThe table below sets out the valuation basis of financial instruments held at fair value and financial instruments where fair value has been separately disclosed in the notes as the carrying value is not a reasonable approximation of fair value.
Group 2018
Level 1 £m
Level 2 £m
Level 3 £m
Total £m
Available for sale financial assetsInvestments – 7.1 – 7.1Financial assets at fair value through profit or lossDerivative financial assets – fair value hedge – 455.7 – 455.7Derivative financial assets – held for trading(1) – 179.8 – 179.8Financial liabilities at fair value through profit or lossDerivative financial liabilities – fair value hedge – (24.2) – (24.2)Derivative financial liabilities – held for trading(1) – (76.8) – (76.8)Financial liabilities designated as fair value through profit or loss – (347.7) – (347.7)Financial instruments for which fair value has been disclosedFinancial liabilities in fair value hedge relationships (2,192.4) (713.5) – (2,905.9)Other financial liabilities at amortised cost (2,425.6) (3,372.8) – (5,798.4)
(4,618.0) (3,892.4) – (8,510.4)
2017Level 1
£mLevel 2
£mLevel 3
£mTotal
£mAvailable for sale financial assetsInvestments – 9.0 – 9.0Financial assets at fair value through profit or lossDerivative financial assets – fair value hedge – 591.1 – 591.1Derivative financial assets – held for trading(1) – 216.6 – 216.6Financial liabilities at fair value through profit or lossDerivative financial liabilities – held for trading(1) – (249.7) – (249.7)Financial liabilities designated as fair value through profit or loss – (375.5) – (375.5)Financial instruments for which fair value has been disclosedFinancial liabilities in fair value hedge relationships (1,766.1) (778.5) – (2,544.6)Other financial liabilities at amortised cost (937.9) (4,744.9) – (5,682.8)
(2,704.0) (5,331.9) – (8,035.9)
Note:(1) These derivatives form economic hedges and, as such, management intends to hold these through to maturity. Derivatives forming an economic hedge of the currency exposure
on borrowings included in these balances were £151.8 million (2017: £215.7 million).
Level 1 fair value measurements are those derived from quoted prices (unadjusted) in active markets for identical assets or liabilities; Level 2 fair value measurements are those derived from inputs other than quoted prices included within level 1 that are observable for the asset
or liability, either directly (i.e. as prices) or indirectly (i.e. derived from prices); and Level 3 fair value measurements are those derived from valuation techniques that include inputs for the asset or liability that are not based on
observable market data (unobservable).
The group has calculated fair values using quoted prices where an active market exists, which has resulted in £4,618.0 million (2017: £2,704.0 million) of ‘level 1’ fair value measurements. In the absence of an appropriate quoted price, the group has applied discounted cash flow valuation models utilising market available data in line with prior years. The £1,914.0 million increase (2017: £755.4 million reduction) in ‘level 1’ fair value measurements is largely due to an increase in the number of observable quoted bond prices in active markets at 31 March 2018.
During the year, changes in the fair value of financial liabilities designated at fair value through profit or loss resulted in a £27.8 million gain (2017: £37.5 million loss). Included within this was a £24.0 million loss (2017: £11.9 million) attributable to changes in own credit risk. The cumulative amount recognised in the income statement due to changes in credit spread was £38.2 million profit (2017: £62.2 million). The carrying amount is £145.6 million (2017: £173.4 million) higher than the amount contracted to settle on maturity.
CompanyThe company does not hold any financial instruments that are measured subsequent to initial recognition at fair value or where fair value has been separately disclosed in the notes as the carrying value is not a reasonable approximation of fair value.
Notes to the financial statements – appendices
United Utilities 2018 - Financial Statements.indd 166 6/1/2018 12:29:14 PM
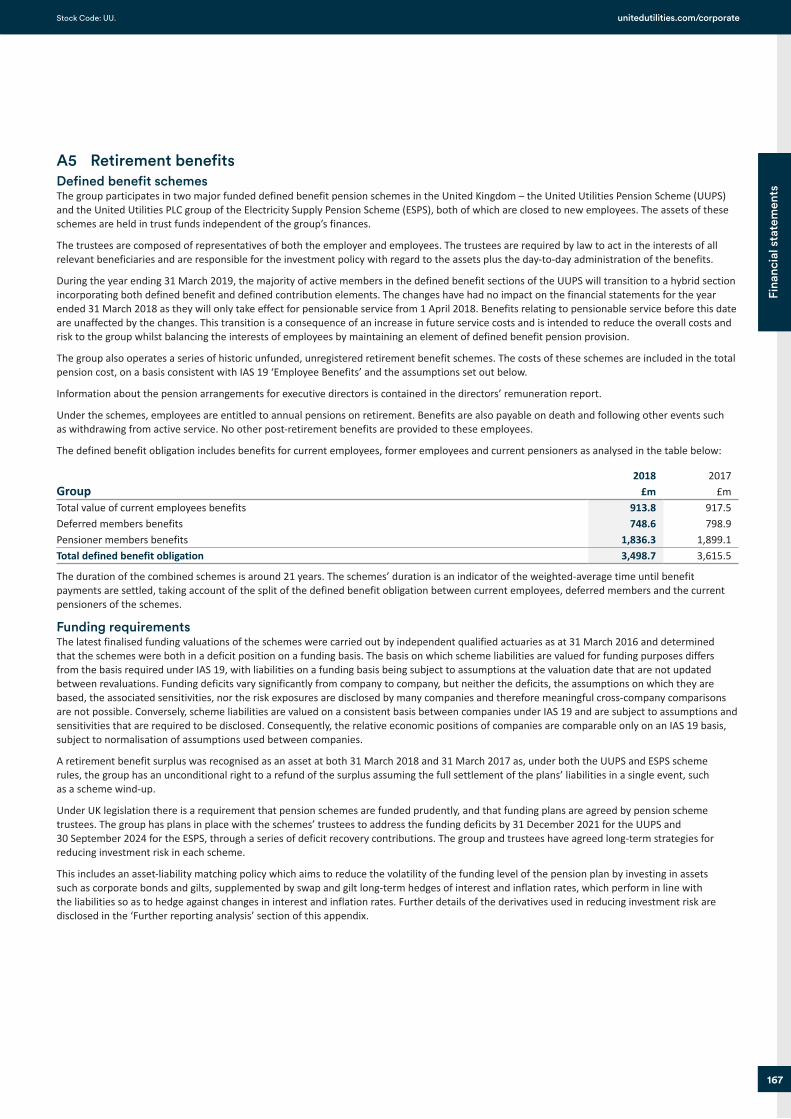
Job Number 1 June 2018 11:11 AM Proof 3 Job Number 1 June 2018 11:11 AM Proof 3
167
Fina
ncia
l sta
tem
ents
unitedutilities.com/corporate Stock Code: UU.
A5 Retirement benefitsDefined benefit schemesThe group participates in two major funded defined benefit pension schemes in the United Kingdom – the United Utilities Pension Scheme (UUPS) and the United Utilities PLC group of the Electricity Supply Pension Scheme (ESPS), both of which are closed to new employees. The assets of these schemes are held in trust funds independent of the group’s finances.
The trustees are composed of representatives of both the employer and employees. The trustees are required by law to act in the interests of all relevant beneficiaries and are responsible for the investment policy with regard to the assets plus the day-to-day administration of the benefits.
During the year ending 31 March 2019, the majority of active members in the defined benefit sections of the UUPS will transition to a hybrid section incorporating both defined benefit and defined contribution elements. The changes have had no impact on the financial statements for the year ended 31 March 2018 as they will only take effect for pensionable service from 1 April 2018. Benefits relating to pensionable service before this date are unaffected by the changes. This transition is a consequence of an increase in future service costs and is intended to reduce the overall costs and risk to the group whilst balancing the interests of employees by maintaining an element of defined benefit pension provision.
The group also operates a series of historic unfunded, unregistered retirement benefit schemes. The costs of these schemes are included in the total pension cost, on a basis consistent with IAS 19 ‘Employee Benefits’ and the assumptions set out below.
Information about the pension arrangements for executive directors is contained in the directors’ remuneration report.
Under the schemes, employees are entitled to annual pensions on retirement. Benefits are also payable on death and following other events such as withdrawing from active service. No other post-retirement benefits are provided to these employees.
The defined benefit obligation includes benefits for current employees, former employees and current pensioners as analysed in the table below:
Group2018
£m2017
£mTotal value of current employees benefits 913.8 917.5Deferred members benefits 748.6 798.9Pensioner members benefits 1,836.3 1,899.1Total defined benefit obligation 3,498.7 3,615.5
The duration of the combined schemes is around 21 years. The schemes’ duration is an indicator of the weighted-average time until benefit payments are settled, taking account of the split of the defined benefit obligation between current employees, deferred members and the current pensioners of the schemes.
Funding requirementsThe latest finalised funding valuations of the schemes were carried out by independent qualified actuaries as at 31 March 2016 and determined that the schemes were both in a deficit position on a funding basis. The basis on which scheme liabilities are valued for funding purposes differs from the basis required under IAS 19, with liabilities on a funding basis being subject to assumptions at the valuation date that are not updated between revaluations. Funding deficits vary significantly from company to company, but neither the deficits, the assumptions on which they are based, the associated sensitivities, nor the risk exposures are disclosed by many companies and therefore meaningful cross-company comparisons are not possible. Conversely, scheme liabilities are valued on a consistent basis between companies under IAS 19 and are subject to assumptions and sensitivities that are required to be disclosed. Consequently, the relative economic positions of companies are comparable only on an IAS 19 basis, subject to normalisation of assumptions used between companies.
A retirement benefit surplus was recognised as an asset at both 31 March 2018 and 31 March 2017 as, under both the UUPS and ESPS scheme rules, the group has an unconditional right to a refund of the surplus assuming the full settlement of the plans’ liabilities in a single event, such as a scheme wind-up.
Under UK legislation there is a requirement that pension schemes are funded prudently, and that funding plans are agreed by pension scheme trustees. The group has plans in place with the schemes’ trustees to address the funding deficits by 31 December 2021 for the UUPS and 30 September 2024 for the ESPS, through a series of deficit recovery contributions. The group and trustees have agreed long-term strategies for reducing investment risk in each scheme.
This includes an asset-liability matching policy which aims to reduce the volatility of the funding level of the pension plan by investing in assets such as corporate bonds and gilts, supplemented by swap and gilt long-term hedges of interest and inflation rates, which perform in line with the liabilities so as to hedge against changes in interest and inflation rates. Further details of the derivatives used in reducing investment risk are disclosed in the ‘Further reporting analysis’ section of this appendix.
United Utilities 2018 - Financial Statements.indd 167 6/1/2018 12:29:14 PM
Job Number 1 June 2018 11:11 AM Proof 3 Job Number 1 June 2018 11:11 AM Proof 3
168
United Utilities Group PLC Annual Report and Financial Statements for the year ended 31 March 2018
A5 Retirement benefits continuedUnder the Inflation Funding Mechanism (IFM), the schedule of deficit contributions is calculated for a notional amount of liabilities (UUPS: £1,572.0 million; ESPS: £192.0 million) based on a fixed RPI inflation assumption of 3.0 per cent, being 1.0 per cent above Bank of England CPI target inflation. Each year, the outturn RPI inflation rate is compared to the fixed assumption and applied to the notional amount of liabilities to determine the IFM amount. This IFM amount, which may be positive or negative, represents a true-up for RPI inflation for the year in question. A cumulative total is maintained, and where this represents a payment due to the pension scheme, 20 per cent of the outstanding balance is contributed as an additional deficit contribution. This approach seeks to smooth the impact of RPI inflation, which is expected to vary around the fixed assumption, and recognises that payments can only flow into the pension scheme. The IFM does not have an accounting impact except to the extent that resulting payments give rise to a cash flow from the group and an increase in the level of scheme assets, as for any other deficit contribution.
The group expects to make contributions of £52.3 million in the year ending 31 March 2019, comprising £38.9 million to the UUPS and £4.1 million to the ESPS in respect of deficit repair contributions, £6.6 million and £0.9 million in respect of current service contributions to UUPS and ESPS respectively, and £0.6 million in respect of expenses to the ESPS; and contributions of £1.1 million and £0.1 million are expected to be made under the IFM for UUPS and ESPS respectively.
The schemes’ funding plans are reviewed every three years, and the next funding valuation for UUPS and ESPS is due no later than 31 March 2019.
Impact of scheme risk management on IAS 19 disclosuresUnder the prescribed IAS 19 basis, pension scheme liabilities are calculated based on current accrued benefits. Expected cash flows are projected forward allowing for RPI and the current member mortality assumptions. These projected cash flows are then discounted by a high-quality corporate bond rate, which comprises an underlying interest rate and a credit spread.
The group has de-risked its pension schemes through hedging strategies applied to the underlying interest rate and the forecast RPI. The underlying interest rate and part of the inflation exposure has been hedged through external market swaps and gilts, the value of which is included in the schemes’ assets. The remaining inflation exposure has been hedged through the IFM, with RPI in excess of 3.0 per cent per annum being funded through an additional schedule of deficit contributions.
As a consequence, the reported statement of financial position under IAS 19 remains volatile due to: changes in credit spread which have not been hedged, primarily due to the difficulties in doing so over long durations; changes in inflation when hedged through the IFM, as the IFM results in changes to the IFM deficit contributions rather than a change in the schemes’ assets; and, to a lesser extent, changes in mortality as management has decided, at the current time, not to hedge this exposure due to its lower volatility in the short term and the relatively high hedging costs.
In contrast, the schemes’ specific funding bases, which form the basis for regular (non-IFM) deficit repair contributions, are unlikely to suffer from significant volatility due to credit spread or inflation. This is because a prudent, fixed credit spread assumption is applied, and inflation-linked contributions are included within the IFM.
Pension benefits under the defined benefit element of the new UUPS hybrid section that will be effective for pensionable service from 1 April 2018 will be linked to CPI rather than RPI.
In the year ended 31 March 2018, the discount rate increased by 0.05 per cent (2017: 0.85 per cent), which includes a 0.05 per cent decrease in credit spreads and a 0.1 per cent increase in swap yields over the year. The IAS 19 remeasurement gain of £50.2 million (2017: £76.7 million loss) reported in note 17 has largely resulted from the impact of the decrease in credit spreads during the year, partially offset by the reduction in gilt-swap spreads, the favourable impact of changes in mortality during the year and growth asset gains.
Reporting and assumptionsThe results of the latest funding valuations at 31 March 2016 have been adjusted for IAS 19 in order to assess the position at 31 March 2018, by taking account of experience over the period, changes in market conditions, and differences in the financial and demographic assumptions. The present value of the defined benefit obligation, and the related current service costs, were measured using the projected unit credit method.
Member data used in arriving at the liability figure included within the overall IAS 19 surplus has been based on the finalised actuarial valuations as at 31 March 2016 for both UUPS and ESPS.
Notes to the financial statements – appendices
United Utilities 2018 - Financial Statements.indd 168 6/1/2018 12:29:14 PM
Job Number 1 June 2018 11:11 AM Proof 3 Job Number 1 June 2018 11:11 AM Proof 3
169
Fina
ncia
l sta
tem
ents
unitedutilities.com/corporate Stock Code: UU.
A5 Retirement benefits continued
Financial assumptionsThe main financial and demographic assumptions used by the actuary to calculate the defined benefit surplus of UUPS and ESPS are outlined below:
Group2018
% p.a.2017
% p.a.Discount rate 2.60 2.55Pensionable salary growth and pension increases 3.35 3.40Price inflation – RPI 3.35 3.40Price inflation – CPI 1.95 –
Demographic assumptionsAt both 31 March 2018 and 31 March 2017, mortality in retirement is assumed to be in line with the Continuous Mortality Investigation’s (CMI) S2PA year of birth tables, with scaling factor of 108 per cent for males and 102 per cent for females, reflecting actual mortality experience. At 31 March 2018, mortality in retirement is based on CMI 2016 (2017: CMI 2015) long-term improvement factors, with a long-term annual rate of improvement of 1.75 per cent (2017: 1.75 per cent). The current life expectancies at age 60 underlying the value of the accrued liabilities for the schemes are:
Group2018 years
2017 years
Retired member – male 27.0 27.0Non-retired member – male 28.7 29.0Retired member – female 29.4 29.8Non-retired member – female 31.1 31.9
Sensitivity of the key scheme assumptionsThe measurement of the group’s defined benefit surplus is sensitive to changes in key assumptions, which are described above. The sensitivity calculations presented below allow for the specified movement in the relevant key assumption, whilst all other assumptions are held constant. This approach does not take into account the interrelationship between some of these assumptions or any hedging strategies adopted.
Asset volatility – If the schemes’ assets underperform relative to the discount rate used to calculate the schemes’ liabilities, this will create a deficit. The schemes hold some growth assets (equities, diversified growth funds and emerging market debt) which, though expected to outperform the discount rate in the long term, create volatility in the short term. The allocation to growth assets is monitored to ensure it remains appropriate given the schemes’ long-term objectives.
Discount rate – An increase/decrease in the discount rate of 0.1 per cent would have resulted in a £72.7 million (2017: £74.8 million) decrease/increase in the schemes’ liabilities at 31 March 2018, although as long as credit spreads remain stable this will be largely offset by an increase in the value of the schemes’ bond holdings and other instruments designed to hedge this exposure. The discount rate is based on high-quality corporate bond yields of a similar duration to the schemes’ liabilities.
Price inflation – An increase/decrease in the inflation assumption of 0.1 per cent would have resulted in a £68.1 million (2017: £70.0 million) increase/decrease in the schemes’ liabilities at 31 March 2018, as a significant proportion of the schemes’ benefit obligations are linked to inflation. However, around half of the schemes’ liabilities were hedged for RPI in the external market at 31 March 2018, meaning that this sensitivity is likely to be halved as a result. In addition, around half of the schemes’ liabilities were hedged through the IFM, with any change in inflation outturn resulting in a change to cash contributions provided under this mechanism. Any change in inflation outturn results in a change to the cash contributions provided under the IFM. As assumptions for pensionable salary growth and pension increases are in line with those for price inflation, sensitivities are also in line.
Life expectancy – An increase/decrease in life expectancy of one year would have resulted in a £128.6 million (2017: £135.3 million) increase/decrease in the schemes’ liabilities at 31 March 2018. The majority of the schemes’ obligations are to provide benefits for the life of the member and, as such, the schemes’ liabilities are sensitive to these assumptions.
United Utilities 2018 - Financial Statements.indd 169 6/1/2018 12:29:15 PM
Job Number 1 June 2018 11:11 AM Proof 3 Job Number 1 June 2018 11:11 AM Proof 3
170
United Utilities Group PLC Annual Report and Financial Statements for the year ended 31 March 2018
A5 Retirement benefits continued
Further reporting analysisAt 31 March, the fair values of the schemes’ assets recognised in the statement of financial position were as follows:
Group
Schemes’ assets
%2018
£m
Schemes’ assets
%2017
£mEquities 9.5 363.9 9.1 350.4Other non-equity growth assets 5.7 219.1 4.8 185.6Gilts 47.2 1,813.3 44.8 1,729.3Bonds 40.6 1,561.7 39.8 1,537.3Other (3.0) (115.1) 1.5 60.4Total fair value of schemes’ assets 100.0 3,842.9 100.0 3,863.0Present value of defined benefit obligations (3,498.7) (3,615.5)Net retirement benefit surplus 344.2 247.5
The fair values in the table above are all based on quoted prices in an active market, where applicable.
The assets, in respect of UUPS, included in the table above, have been allocated to each asset class based on the return the assets are expected to achieve as UUPS has entered into a variety of derivative transactions to change the return characteristics of the physical assets held in order to reduce undesirable market and liability risks. As such, the breakdown shown separates the assets of the schemes to illustrate the underlying risk characteristics of the assets held.
The portfolio contains a proportion of assets set aside for collateral purposes linked to the derivative contracts entered into, as described above. The collateral portfolio, comprising cash and eligible securities readily convertible to cash, provides sufficient liquidity to manage the derivative transactions and is expected to achieve a return in excess of LIBOR.
The fair value of derivatives included within pension scheme asset classification are analysed as follows:
Group
Underlying assets
£m
Fair value of derivatives
£mCombined
£mAt 31 March 2018Equities 357.3 6.6 363.9Other non-equity growth assets 219.1 – 219.1Gilts 1,813.3 – 1,813.3Bonds 1,561.1 0.6 1,561.7Other 170.1 (285.2) (115.1)Total fair value of schemes' assets 4,120.9 (278.0) 3,842.9At 31 March 2017Equities 320.6 29.8 350.4Other non-equity growth assets 185.6 – 185.6Gilts 1,729.3 – 1,729.3Bonds 1,547.6 (10.3) 1,537.3Other 250.5 (190.1) 60.4Total fair value of schemes' assets 4,033.6 (170.6) 3,863.0
The derivative values in the table above represent the net market value of derivatives held within each of these asset categories as follows:
Derivatives are held within the UUPS equity portfolio to gain economic exposure equivalent to around 4.0 per cent of that scheme’s assets, and comprise total return swaps on equity indices with a value of £4.7 million (2017: £18.2 million) and currency forwards with a value of £1.9 million (2017: £11.6 million).
Notes to the financial statements – appendices
United Utilities 2018 - Financial Statements.indd 170 6/1/2018 12:29:15 PM
Job Number 1 June 2018 11:11 AM Proof 3 Job Number 1 June 2018 11:11 AM Proof 3
171
Fina
ncia
l sta
tem
ents
unitedutilities.com/corporate Stock Code: UU.
A5 Retirement benefits continued Derivatives are used within both the UUPS and ESPS bond portfolio to hedge non-sterling exposure back to sterling:
The UUPS value comprises credit default swaps with a value of £nil (2017: £(10.3) million), interest rate swaps with a value of £(3.9) million (2017: £nil) and currency forwards with a value of £1.1 million (2017: £nil); and
The ESPS total value of £3.4 million (2017: £nil) relates to interest rate swaps. Derivatives are used within both the UUPS and ESPS ‘other’ portfolios to manage liability risks. Both schemes use a range of derivatives to
target a high level of interest rate and inflation hedging, comprising £(285.9) million (2017: £(227.8) million) in the UUPS and £0.7 million (2017: £37.7 million) in the ESPS. These are further broken down as follows: The UUPS net value of £(285.9) million (2017: £(227.8) million) comprises asset swaps with a value of £(27.3) million (2017: £(132.9) million),
interest rate swaps with a value of £252.1 million (2017: £522.0 million), gilt repurchase agreements with a value of £(517.2) million (2017: £(655.8) million) and RPI inflation swaps with a value of £6.5 million (2017: £38.9 million); and
The ESPS value of £0.7 million represents gilt repurchase agreements with a value of £2.3 million and RPI inflation swaps with a value of £(1.6) million. The value at 31 March 2017 of £37.7 million represented the total value of pooled funds which made use of derivatives (i.e. underlying assets plus the value of the derivatives within these funds).
The derivatives shown in the tables only cover those expressly held for the purpose of reducing certain undesirable asset and liability risks. The schemes also invest in a number of other pooled funds that make use of derivatives. No allowance is made in the figures above for any derivatives held within these, as these are not held expressly for the purpose of managing risk. The total fair value of pooled funds held within the schemes’ assets was £567.4 million (2017: £1,179.5 million).
Movements in the fair value of the schemes’ assets were as follows:
Group2018
£m2017
£mAt the start of the year 3,863.0 3,245.6Interest income on schemes’ assets 97.7 109.4The return on plan assets, excluding amounts included in interest (60.0) 555.5Member contributions 4.9 5.2Benefits paid (131.7) (114.3)Administrative expenses (2.6) (2.7)Company contributions 71.6 64.3At the end of the year 3,842.9 3,863.0
The group’s actual return on the schemes’ assets was a gain of £37.7 million (2017: £664.9 million), principally due to gains on derivatives hedging the schemes’ liabilities.
Movements in the present value of the defined benefit obligations are as follows:
Group2018
£m2017
£mAt the start of the year (3,615.5) (2,970.4)Interest cost on schemes’ obligations (90.6) (99.2)Actuarial gains/(losses) arising from changes in financial assumptions 85.1 (721.4)Actuarial gains arising from changes in demographic assumptions 43.2 52.7Actuarial (losses)/gains arising from experience (18.1) 36.5Curtailments/settlements (2.3) (3.1)Member contributions (4.9) (5.2)Benefits paid 131.7 114.3Current service cost (27.3) (19.7)At the end of the year (3,498.7) (3,615.5)
The equalisation of Guaranteed Minimum Pensions (GMP), for which the UK Government intends to implement legislation, is expected to have a widespread impact on defined benefit schemes operating in the UK. Such legislation could result in an increase in GMP for certain individuals, which would increase the defined benefit obligation of the schemes. At this stage, until the Government has further developed its proposals in light of ongoing legal review, it is not possible to quantify the impact of this change.
United Utilities 2018 - Financial Statements.indd 171 6/1/2018 12:29:15 PM
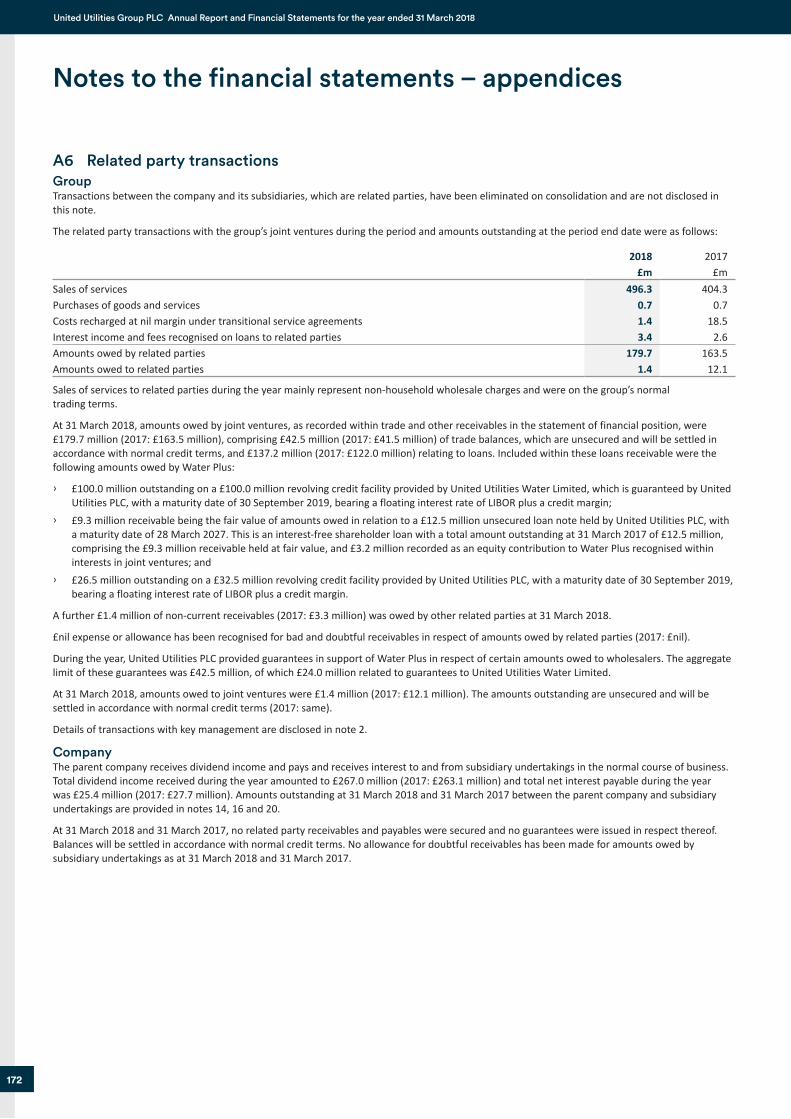
Job Number 1 June 2018 11:11 AM Proof 3 Job Number 1 June 2018 11:11 AM Proof 3
172
United Utilities Group PLC Annual Report and Financial Statements for the year ended 31 March 2018
A6 Related party transactionsGroup Transactions between the company and its subsidiaries, which are related parties, have been eliminated on consolidation and are not disclosed in this note.
The related party transactions with the group’s joint ventures during the period and amounts outstanding at the period end date were as follows:
2018£m
2017£m
Sales of services 496.3 404.3Purchases of goods and services 0.7 0.7Costs recharged at nil margin under transitional service agreements 1.4 18.5Interest income and fees recognised on loans to related parties 3.4 2.6Amounts owed by related parties 179.7 163.5Amounts owed to related parties 1.4 12.1
Sales of services to related parties during the year mainly represent non-household wholesale charges and were on the group’s normal trading terms.
At 31 March 2018, amounts owed by joint ventures, as recorded within trade and other receivables in the statement of financial position, were £179.7 million (2017: £163.5 million), comprising £42.5 million (2017: £41.5 million) of trade balances, which are unsecured and will be settled in accordance with normal credit terms, and £137.2 million (2017: £122.0 million) relating to loans. Included within these loans receivable were the following amounts owed by Water Plus:
£100.0 million outstanding on a £100.0 million revolving credit facility provided by United Utilities Water Limited, which is guaranteed by United Utilities PLC, with a maturity date of 30 September 2019, bearing a floating interest rate of LIBOR plus a credit margin;
£9.3 million receivable being the fair value of amounts owed in relation to a £12.5 million unsecured loan note held by United Utilities PLC, with a maturity date of 28 March 2027. This is an interest-free shareholder loan with a total amount outstanding at 31 March 2017 of £12.5 million, comprising the £9.3 million receivable held at fair value, and £3.2 million recorded as an equity contribution to Water Plus recognised within interests in joint ventures; and
£26.5 million outstanding on a £32.5 million revolving credit facility provided by United Utilities PLC, with a maturity date of 30 September 2019, bearing a floating interest rate of LIBOR plus a credit margin.
A further £1.4 million of non-current receivables (2017: £3.3 million) was owed by other related parties at 31 March 2018.
£nil expense or allowance has been recognised for bad and doubtful receivables in respect of amounts owed by related parties (2017: £nil).
During the year, United Utilities PLC provided guarantees in support of Water Plus in respect of certain amounts owed to wholesalers. The aggregate limit of these guarantees was £42.5 million, of which £24.0 million related to guarantees to United Utilities Water Limited.
At 31 March 2018, amounts owed to joint ventures were £1.4 million (2017: £12.1 million). The amounts outstanding are unsecured and will be settled in accordance with normal credit terms (2017: same).
Details of transactions with key management are disclosed in note 2.
CompanyThe parent company receives dividend income and pays and receives interest to and from subsidiary undertakings in the normal course of business. Total dividend income received during the year amounted to £267.0 million (2017: £263.1 million) and total net interest payable during the year was £25.4 million (2017: £27.7 million). Amounts outstanding at 31 March 2018 and 31 March 2017 between the parent company and subsidiary undertakings are provided in notes 14, 16 and 20.
At 31 March 2018 and 31 March 2017, no related party receivables and payables were secured and no guarantees were issued in respect thereof. Balances will be settled in accordance with normal credit terms. No allowance for doubtful receivables has been made for amounts owed by subsidiary undertakings as at 31 March 2018 and 31 March 2017.
Notes to the financial statements – appendices
United Utilities 2018 - Financial Statements.indd 172 6/1/2018 12:29:15 PM
Job Number 1 June 2018 11:11 AM Proof 3 Job Number 1 June 2018 11:11 AM Proof 3
173
Fina
ncia
l sta
tem
ents
unitedutilities.com/corporate Stock Code: UU.
A7 Accounting policiesOf the accounting policies outlined below, those deemed to be the most significant for the group are those that align with the critical accounting judgements and key sources of estimation uncertainty set out on pages 140 to 143.
Basis of consolidationThe group financial statements consolidate the financial statements of the company and entities controlled by the company (its subsidiaries), and incorporate the results of its share of joint ventures using the equity method of accounting. The results of subsidiaries and joint ventures acquired or disposed of during the year are included in the consolidated income statement from the date control is obtained or until the date that control ceases, as appropriate.
Where necessary, adjustments are made to the financial statements of subsidiaries to bring the accounting policies used under the relevant local GAAP into line with those used by the group.
SubsidiariesSubsidiaries are entities controlled by the group. Control is achieved where the group is exposed to, or has the rights to, variable returns from its involvement in an entity and has the ability to affect those returns through its power over the entity. In the parent company accounts, investments are held at cost less provision for impairment.
On acquisition, the assets and liabilities and contingent liabilities of a subsidiary are measured at their fair values at the date of acquisition. Any excess of the cost of acquisition over the fair values of the identifiable net assets acquired is recognised as goodwill. Any deficiency of the cost of acquisition below the fair values of the identifiable net assets acquired is credited to the income statement in the period of acquisition. All intra-group transactions, balances, income and expenses are eliminated on consolidation.
Joint venturesJoint ventures are entities in which the group holds an interest on a long-term basis and which are jointly controlled with one or more parties under a contractual arrangement. The group’s share of joint venture results and assets and liabilities is incorporated using the equity method of accounting. Under the equity method, an investment in a joint venture is initially recognised at cost and adjusted thereafter to recognise the group’s share of the profit or loss.
On losing control of a subsidiary disposed of to a joint venture, the group recognises the gain or loss attributable to measuring the investment retained in the former subsidiary at its fair value at the date when control is lost.
Revenue recognitionRevenue represents the fair value of the income receivable in the ordinary course of business for goods and services provided, exclusive of value added tax and foreign sales tax. Where relevant, this includes an estimate of the sales value of units supplied to customers between the date of the last meter reading and the period end.
The group recognises revenue generally at the time of delivery and when collection of the resulting receivable is reasonably assured. Should the group consider that the criteria for revenue recognition are not met for a transaction, revenue recognition would be delayed until such time as collectability is reasonably assured. Payments received in advance of revenue recognition are recorded as deferred income.
Operating profitOperating profit is stated after charging operational expenses but before investment income and finance expense.
Borrowing costs and finance incomeExcept as noted below, all borrowing costs and finance income are recognised in the income statement on an accruals basis.
Transaction costs that are directly attributable to the acquisition or issue of a financial asset or financial liability are included in the initial fair value of that instrument.
Where borrowing costs are attributable to the acquisition, construction or production of a qualifying asset, such costs are capitalised as part of the specific asset.
TaxTax on the profit or loss for the year comprises current and deferred tax. Tax is recognised in the income statement except to the extent that it relates to items recognised directly in equity, in which case it is recognised in equity. Assessing the outcome of uncertain tax positions requires judgements to be made regarding the application of tax law and the result of negotiations with, and enquiries from, tax authorities in a number of jurisdictions. A current tax provision is only recognised when the group has a present obligation as a result of a past event and it is probable that the group will be required to settle that obligation to a taxing authority.
Current taxCurrent tax is based on the taxable profit for the period and is provided at amounts expected to be paid or recovered using the tax rates and laws that have been enacted or substantively enacted at each reporting date.
Taxable profit differs from the net profit as reported in the income statement because it excludes items of income or expense that are taxable or deductible in other years and it further excludes items that are never taxable or deductible.
Current tax is charged or credited in the income statement, except when it relates to items charged or credited to equity, in which case the tax is also dealt with in equity.
Deferred taxDeferred tax is the tax expected to be payable or recoverable on differences between the carrying amounts of assets and liabilities in the financial statements and the corresponding tax bases used in the computation of taxable profit. Deferred tax liabilities are provided, using the liability method, on all taxable temporary differences at each reporting date. Such assets and liabilities are not recognised if the temporary difference arises from goodwill or from the initial recognition (other than in a business combination) of other assets and liabilities in a transaction that affects neither the taxable profit nor the accounting profit.
Deferred tax liabilities are recognised for taxable temporary differences arising on investments in subsidiaries and interests in joint ventures, except where the group is able to control the reversal of the temporary difference and it is probable that the temporary difference will not reverse in the foreseeable future.
Deferred tax is measured at the average tax rates that are expected to apply in the periods in which the temporary timing differences are expected to reverse based on tax rates and laws that have been enacted or substantively enacted at each reporting date.
The carrying amount of deferred tax assets is reviewed at each reporting date and is reduced to the extent that it is no longer probable that sufficient taxable profits will be available to allow all or part of the asset to be recovered.
Deferred tax is charged or credited in the income statement, except when it relates to items charged or credited to equity, in which case the deferred tax is also dealt with in equity.
United Utilities 2018 - Financial Statements.indd 173 6/1/2018 12:29:15 PM
Job Number 1 June 2018 11:11 AM Proof 3 Job Number 1 June 2018 11:11 AM Proof 3
174
United Utilities Group PLC Annual Report and Financial Statements for the year ended 31 March 2018
A7 Accounting policies continued
Property, plant and equipmentProperty, plant and equipment comprises water and wastewater infrastructure assets and overground assets.
The useful economic lives of these assets are primarily as follows:
Water and wastewater infrastructure assets: Impounding reservoirs 200 years; Mains and raw water aqueducts 30 to 300 years; Sewers and sludge pipelines 60 to 300 years; Sea outfalls 77 years;
Buildings 10 to 60 years; Operational assets 5 to 80 years; and Fixtures, fittings, tools and equipment 3 to 40 years.
Employee and other related costs incurred in implementing the capital schemes of the group are capitalised.
The group is required to evaluate the carrying values of PPE for impairment whenever circumstances indicate, in management’s view, that the carrying value of such assets may not be recoverable. An impairment review requires management to make uncertain estimates concerning the cash flows, growth rates and discount rates of the cash generating units under review.
Water and wastewater infrastructure assetsInfrastructure assets comprise a network of water and wastewater pipes and systems. Expenditure on the infrastructure assets, including borrowing costs where applicable, relating to increases in capacity or enhancements of the network, is treated as additions. Amounts incurred in maintaining the operating capability of the network in accordance with defined standards of service are expensed in the year in which the expenditure is incurred. Infrastructure assets are depreciated by writing off their cost (or deemed cost for infrastructure assets held on transition to IFRS), less the estimated residual value, evenly over their useful economic lives.
Other assetsAll other property, plant and equipment is stated at historical cost less accumulated depreciation.
Historical cost includes expenditure that is directly attributable to the acquisition of the items, including relevant borrowing costs, where applicable, for qualifying assets. Subsequent costs are included in the asset’s carrying amount or recognised as a separate asset, as appropriate, only when it is probable that future economic benefits associated with the item will flow to the group and the cost of the item can be measured reliably. All other repairs and maintenance costs are charged to the income statement during the financial period in which they are incurred.
Freehold land and assets in the course of construction are not depreciated. Other assets are depreciated by writing off their cost, less their estimated residual value, evenly over their estimated useful economic lives, based on management’s judgement and experience.
Depreciation methods, residual values and useful economic lives are reassessed annually and, if necessary, changes are accounted for prospectively. The gain or loss arising on the disposal or retirement of an asset is determined as the difference between the sales proceeds and the carrying amount of the asset and is recognised in other operating costs.
Transfer of assets from customers and developersWhere the group receives from a customer or developer an item of property, plant and equipment (or cash to construct or acquire an item of property, plant and equipment) that the group must then use, either to connect the customer to the network, or to provide the customer with ongoing access to a supply of goods or services, or to do both, such items are capitalised at their fair value and included within property, plant and equipment, with a credit of the same amount to deferred grants and contributions. The assets are depreciated over their useful economic lives and the deferred contributions released to revenue over the same period (or where the receipt of property, plant and equipment is solely to connect the customer to the network, the deferred contribution is released immediately to revenue). This interpretation has been applied to transfers of assets from customers received on or after 1 July 2009.
Assets transferred from customers or developers are accounted for at fair value. If no market exists for the assets then incremental cash flows are used to arrive at fair value.
Intangible assetsIntangible assets are measured initially at cost and are amortised on a straight-line basis over their estimated useful economic lives. The carrying amount is reduced by any provision for impairment where necessary. On a business combination, as well as recording separable intangible assets already recognised in the statement of financial position of the acquired entity at their fair value, identifiable intangible assets that arise from contractual or other legal rights are also included in the acquisition statement of financial position at fair value.
Internal expenditure is capitalised as internally generated intangibles only if it meets the criteria of IAS 38 ‘Intangible Assets’.
Intangible assets, which relate primarily to computer software, are amortised over a period of three to ten years.
Impairment of tangible and intangible assets Intangible assets and property, plant and equipment are reviewed for impairment at each reporting date to determine whether there is any indication that those assets may have suffered an impairment loss. If any such indication exists, the recoverable amount of the asset is estimated in order to determine the extent of the impairment loss, if any. Where the asset does not generate cash flows that are independent from other assets, the group estimates the recoverable amount of the cash generating unit to which the asset belongs.
The recoverable amount is the higher of fair value less costs to sell, and value in use. Value in use represents the net present value of expected future cash flows, discounted on a pre-tax basis, using a rate that reflects current market assessments of the time value of money and the risks specific to the asset for which the estimates of future cash flows have not been adjusted.
If the recoverable amount of an asset (or cash generating unit) is estimated to be less than its carrying amount, the carrying amount of the asset (or cash generating unit) is reduced to its recoverable amount. Impairment losses in respect of non-current assets are recognised in the income statement within operating costs.
Where an impairment loss subsequently reverses, the reversal is recognised in the income statement and the carrying amount of the asset is increased to the revised estimate of its recoverable amount, but not so as to exceed the carrying amount that would have been determined had no impairment loss been recognised in prior years.
Notes to the financial statements – appendices
United Utilities 2018 - Financial Statements.indd 174 6/1/2018 12:29:15 PM
Job Number 1 June 2018 11:11 AM Proof 3 Job Number 1 June 2018 11:11 AM Proof 3
175
Fina
ncia
l sta
tem
ents
unitedutilities.com/corporate Stock Code: UU.
A7 Accounting policies continued
Non-current assets held for saleNon-current assets classified as held for sale are measured at the lower of carrying value and fair value less costs to sell. Non-current assets are classified as held for sale if their carrying amount will be recovered through a sale transaction rather than through continuing use. This condition is regarded as having been met only when the sale is highly probable and the asset is available for immediate sale in its present condition. Management must be committed to the sale, which should be expected to qualify for recognition as a completed sale within one year from the date of classification.
Financial instrumentsFinancial assets and financial liabilities are recognised and derecognised on the group’s statement of financial position on the trade date when the group becomes/ceases to be a party to the contractual provisions of the instrument.
Cash and short-term depositsCash and short-term deposits include cash at bank and in hand, deposits and other short-term highly liquid investments which are readily convertible into known amounts of cash, have a maturity of three months or less from the date of acquisition and which are subject to an insignificant risk of change in value. In the consolidated statement of cash flows and related notes, cash and cash equivalents include cash and short-term deposits, net of book overdrafts.
Financial investmentsInvestments (other than interests in subsidiaries, joint ventures and fixed deposits) are initially measured at fair value, including transaction costs. Investments classified as available for sale in accordance with IAS 39 ‘Financial Instruments: Recognition and Measurement’ are measured at subsequent reporting dates at fair value. Gains and losses arising from changes in fair value are recognised directly in equity, until the security is disposed of or is determined to be impaired, at which time the cumulative gain or loss previously recognised in equity is included in the net profit or loss for the period.
Trade receivablesTrade receivables are initially measured at fair value, and are subsequently measured at amortised cost, less any impairment for irrecoverable amounts. Estimated irrecoverable amounts are based on historical experience of the receivables balance.
Trade payablesTrade payables are initially measured at fair value and are subsequently measured at amortised cost.
Financial liabilities and equityFinancial liabilities and equity instruments are classified according to the substance of the contractual arrangements entered into. An equity instrument is any contract that evidences a residual interest in the assets of the group after deducting all of its liabilities.
Equity instrumentsEquity instruments issued by the group are recorded at the proceeds received, net of direct issue costs.
BorrowingsThe group’s default treatment is that bonds and loans are initially measured at fair value, being the cash proceeds received net of any direct issue costs. They are subsequently measured at amortised cost applying the effective interest method. The difference between the net cash proceeds received at inception and the principal cash flows due at maturity is accrued over the term of the borrowing.
The default treatment of measuring at amortised cost, whilst associated hedging derivatives are recognised at fair value, presents an accounting measurement mismatch that has the potential to introduce considerable volatility to both the income statement and the statement of financial position. Therefore, where feasible, the group takes advantage of the provisions under IAS 39 ‘Financial Instruments: Recognition and Measurement’ to make fair value adjustments to its borrowing instruments to reduce this volatility and better represent the economic hedges that exist between the group’s borrowings and associated derivative contracts.
Where feasible, the group designates its financial instruments within fair value hedge relationships. In order to apply fair value hedge accounting, it must be demonstrated that the hedging derivative has been, and will continue to be, a highly effective hedge of the risk being hedged within the applicable borrowing instrument.
Borrowings designated within a fair value hedge relationshipWhere designated, bonds and loans are initially measured at fair value being the cash proceeds received net of any direct issue costs. They are subsequently adjusted for any change in fair value attributable to the risk being hedged at each reporting date, with the change being charged or credited to finance expense in the income statement.
Hedge accounting is discontinued prospectively when the hedging instrument is sold, terminated or exercised, or where the hedge relationship no longer qualifies for hedge accounting.
Borrowings designated at fair value through profit or lossDesignation is made where the requirements to designate within a fair value hedge cannot be met at inception despite there being significant fair value offset between the borrowing and the hedging derivative. Where designated, bonds and loans are initially measured at fair value being the cash proceeds received and are subsequently measured at fair value at each reporting date, with changes in fair value being charged or credited to finance expense in the income statement.
Derivative financial instrumentsDerivative financial instruments are measured at fair value at each reporting date, with changes in fair value being charged or credited to finance expense in the income statement. The group enters into financial derivatives contracts to manage its financial exposure to changes in market rates (see note A4).
Derivatives and borrowings – valuationWhere an active market exists, designated borrowings and derivatives recorded at fair value are valued using quoted market prices. Otherwise, they are valued using a net present value valuation model. The model uses applicable interest rate curve data at each reporting date to determine any floating cash flows. Projected future cash flows associated with each financial instrument are discounted to the reporting date using discount factors derived from the applicable interest curves adjusted for counterparty credit risk where appropriate. Discounted foreign currency cash flows are converted into sterling at the spot exchange rate at each reporting date. Assumptions are made with regard to credit spreads based on indicative pricing data.
The valuation of debt designated in a fair value hedge relationship is calculated based on the risk being hedged as prescribed by IAS 39 ‘Financial Instruments: Recognition and Measurement’. The group’s policy is to hedge its exposure to changes in the applicable underlying interest rate and it is this portion of the cash flows that is included in the valuation model (excluding any applicable company credit risk spread).
United Utilities 2018 - Financial Statements.indd 175 6/1/2018 12:29:15 PM
Job Number 1 June 2018 11:11 AM Proof 3 Job Number 1 June 2018 11:11 AM Proof 3
176
United Utilities Group PLC Annual Report and Financial Statements for the year ended 31 March 2018
A7 Accounting policies continuedThe valuation of debt designated at fair value through the profit or loss incorporates an assumed credit risk spread in the applicable discount factor. Credit spreads are determined based on indicative pricing data.
InventoriesInventories are stated at the lower of cost and net realisable value. For properties held for resale, cost includes the cost of acquiring and developing the sites, including borrowing costs where applicable.
Net realisable value represents the estimated selling price less all estimated costs of completion and costs to be incurred in marketing, selling and distribution.
Employee benefitsRetirement benefit obligationsThe group operates two defined benefit pension schemes, which are independent of the group’s finances, for its employees. Actuarial valuations to determine the funding of the schemes, along with future contribution rates, are carried out by the pension scheme actuary as directed by the trustees at intervals of not more than three years. In any intervening years, the trustees review the continuing appropriateness of the funding and contribution rates.
From a financial reporting perspective and in accordance with IAS 19 ‘Employee Benefits’, defined benefit assets are measured at fair value while liabilities are measured at present value, using the projected unit credit method. The difference between the two amounts is recognised as a surplus or obligation in the statement of financial position. Where this difference results in a defined benefit surplus, this is recognised in accordance with IFRIC 14 ‘IAS 19 – The limit on a defined benefit asset, minimum funding requirements and their interaction’, on the basis that the group has an unconditional right to a refund of any surplus that may exist following the full settlement of plan liabilities in a single event.
The pension cost under IAS 19 is assessed in accordance with the advice of a firm of actuaries based on the latest actuarial valuation and assumptions determined by the actuary, which are used to estimate the present value of defined benefit obligations. The assumptions are based on information supplied to the actuary by the company, supplemented by discussions between the actuary and management. The assumptions are disclosed in note A5.
The cost of providing pension benefits to employees relating to the current year’s service (including curtailment gains and losses) is included within employee benefits expense, while the interest on the schemes’ assets and liabilities is included within investment income and finance expense respectively. Remeasurement gains/losses on scheme assets and liabilities are presented in other comprehensive income.
In addition, the group also operates a defined contribution pension section within the United Utilities Pension Scheme. Payments are charged as employee costs as they fall due. The group has no further payment obligations once the contributions have been paid.
Share-based compensation arrangementsThe group operates equity-settled, share-based compensation plans, issued to certain employees. The equity-settled share-based payments are measured at fair value at the date of grant. The fair value determined at the grant date is expensed on a straight-line basis over the vesting period, based on estimates of the number of options that are expected to vest. Fair value is based on simulation models, according to the relevant measures of performance. The group has the option to settle some of these equity-settled share-based payments in cash.
At each reporting date, the group revises its estimate of the number of options that are expected to become exercisable with the impact of any revision being recognised in the income statement, and a corresponding adjustment to equity over the remaining vesting period.
ProvisionsProvisions are recognised when the group has a present legal or constructive obligation as a result of past events, it is probable that an outflow of resources will be required to settle the obligation, and the amount can be reliably estimated. Expenditure that relates to an existing condition caused by past operations that does not contribute to current or future earnings is expensed.
Foreign currency translationTransactions and balancesTransactions in foreign currencies are recorded at the exchange rates applicable on the dates of the transactions. At each reporting date, monetary assets and liabilities denominated in foreign currencies are translated into sterling at the relevant rates of exchange applicable on that date. Gains and losses arising on retranslation are included in net profit or loss for the period.
Exchange differences arising on investments in equity instruments classified as available for sale are included in the gains or losses arising from changes in fair value which are recognised directly in equity. In order to hedge its exposure to certain foreign exchange risks, the group enters into derivative instruments (see note A4).
Group companiesOn consolidation, the statements of financial position of overseas subsidiaries and joint ventures (none of which has the currency of a hyperinflationary economy) are translated into sterling at exchange rates applicable at each reporting date. The income statements are translated into sterling using the average rate unless exchange rates fluctuate significantly, in which case the exchange rate at the date the transaction occurred is used. Exchange differences resulting from the translation of such statements of financial position at rates ruling at the beginning and end of the period, together with the differences between income statements translated at average rates and rates ruling at the period end, are dealt with as movements on the group’s cumulative exchange reserve, a separate component of equity. Such translation differences are recognised as income or expense in the period in which the operation is disposed of.
Goodwill and fair value adjustments arising on the acquisition of a foreign entity are treated as assets and liabilities of the foreign entity and translated at the closing rate. The group has elected to treat goodwill and fair value adjustments arising on acquisitions before the date of implementation of IFRS 3 ‘Business Combinations’ (1 April 1999) as sterling denominated assets and liabilities.
Grants and contributionsGrants and contributions receivable in respect of property, plant and equipment are treated as deferred income, which is credited to the income statement over the estimated useful economic lives of the related assets.
LeasesLeases are classified according to the substance of the transaction. Operating leases are leases that do not transfer substantially all the risks and rewards of ownership to the lessee.
Operating lease rentals are charged to the income statement on a straight-line basis over the period of the lease.
Notes to the financial statements – appendices
United Utilities 2018 - Financial Statements.indd 176 6/1/2018 12:29:15 PM
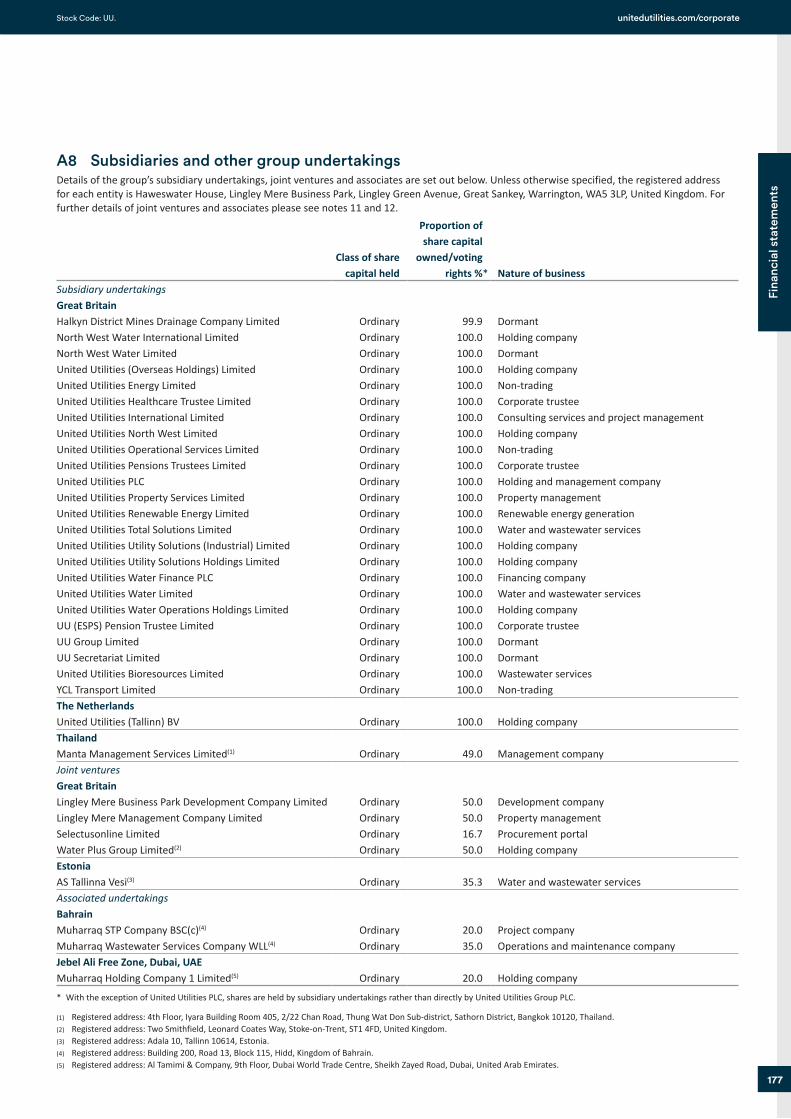
Job Number 1 June 2018 11:11 AM Proof 3 Job Number 1 June 2018 11:11 AM Proof 3
177
Fina
ncia
l sta
tem
ents
unitedutilities.com/corporate Stock Code: UU.
A8 Subsidiaries and other group undertakingsDetails of the group’s subsidiary undertakings, joint ventures and associates are set out below. Unless otherwise specified, the registered address for each entity is Haweswater House, Lingley Mere Business Park, Lingley Green Avenue, Great Sankey, Warrington, WA5 3LP, United Kingdom. For further details of joint ventures and associates please see notes 11 and 12.
Class of share capital held
Proportion of share capital
owned/voting rights %* Nature of business
Subsidiary undertakingsGreat BritainHalkyn District Mines Drainage Company Limited Ordinary 99.9 DormantNorth West Water International Limited Ordinary 100.0 Holding companyNorth West Water Limited Ordinary 100.0 DormantUnited Utilities (Overseas Holdings) Limited Ordinary 100.0 Holding companyUnited Utilities Energy Limited Ordinary 100.0 Non-tradingUnited Utilities Healthcare Trustee Limited Ordinary 100.0 Corporate trusteeUnited Utilities International Limited Ordinary 100.0 Consulting services and project managementUnited Utilities North West Limited Ordinary 100.0 Holding companyUnited Utilities Operational Services Limited Ordinary 100.0 Non-tradingUnited Utilities Pensions Trustees Limited Ordinary 100.0 Corporate trusteeUnited Utilities PLC Ordinary 100.0 Holding and management companyUnited Utilities Property Services Limited Ordinary 100.0 Property managementUnited Utilities Renewable Energy Limited Ordinary 100.0 Renewable energy generationUnited Utilities Total Solutions Limited Ordinary 100.0 Water and wastewater servicesUnited Utilities Utility Solutions (Industrial) Limited Ordinary 100.0 Holding companyUnited Utilities Utility Solutions Holdings Limited Ordinary 100.0 Holding companyUnited Utilities Water Finance PLC Ordinary 100.0 Financing companyUnited Utilities Water Limited Ordinary 100.0 Water and wastewater servicesUnited Utilities Water Operations Holdings Limited Ordinary 100.0 Holding companyUU (ESPS) Pension Trustee Limited Ordinary 100.0 Corporate trusteeUU Group Limited Ordinary 100.0 DormantUU Secretariat Limited Ordinary 100.0 DormantUnited Utilities Bioresources Limited Ordinary 100.0 Wastewater servicesYCL Transport Limited Ordinary 100.0 Non-tradingThe NetherlandsUnited Utilities (Tallinn) BV Ordinary 100.0 Holding companyThailandManta Management Services Limited(1) Ordinary 49.0 Management companyJoint venturesGreat BritainLingley Mere Business Park Development Company Limited Ordinary 50.0 Development companyLingley Mere Management Company Limited Ordinary 50.0 Property managementSelectusonline Limited Ordinary 16.7 Procurement portalWater Plus Group Limited(2) Ordinary 50.0 Holding companyEstoniaAS Tallinna Vesi(3) Ordinary 35.3 Water and wastewater servicesAssociated undertakingsBahrainMuharraq STP Company BSC(c)(4) Ordinary 20.0 Project companyMuharraq Wastewater Services Company WLL(4) Ordinary 35.0 Operations and maintenance companyJebel Ali Free Zone, Dubai, UAEMuharraq Holding Company 1 Limited(5) Ordinary 20.0 Holding company
* With the exception of United Utilities PLC, shares are held by subsidiary undertakings rather than directly by United Utilities Group PLC.
(1) Registered address: 4th Floor, Iyara Building Room 405, 2/22 Chan Road, Thung Wat Don Sub-district, Sathorn District, Bangkok 10120, Thailand.(2) Registered address: Two Smithfield, Leonard Coates Way, Stoke-on-Trent, ST1 4FD, United Kingdom.(3) Registered address: Adala 10, Tallinn 10614, Estonia.(4) Registered address: Building 200, Road 13, Block 115, Hidd, Kingdom of Bahrain.(5) Registered address: Al Tamimi & Company, 9th Floor, Dubai World Trade Centre, Sheikh Zayed Road, Dubai, United Arab Emirates.
United Utilities 2018 - Financial Statements.indd 177 6/1/2018 12:29:16 PM
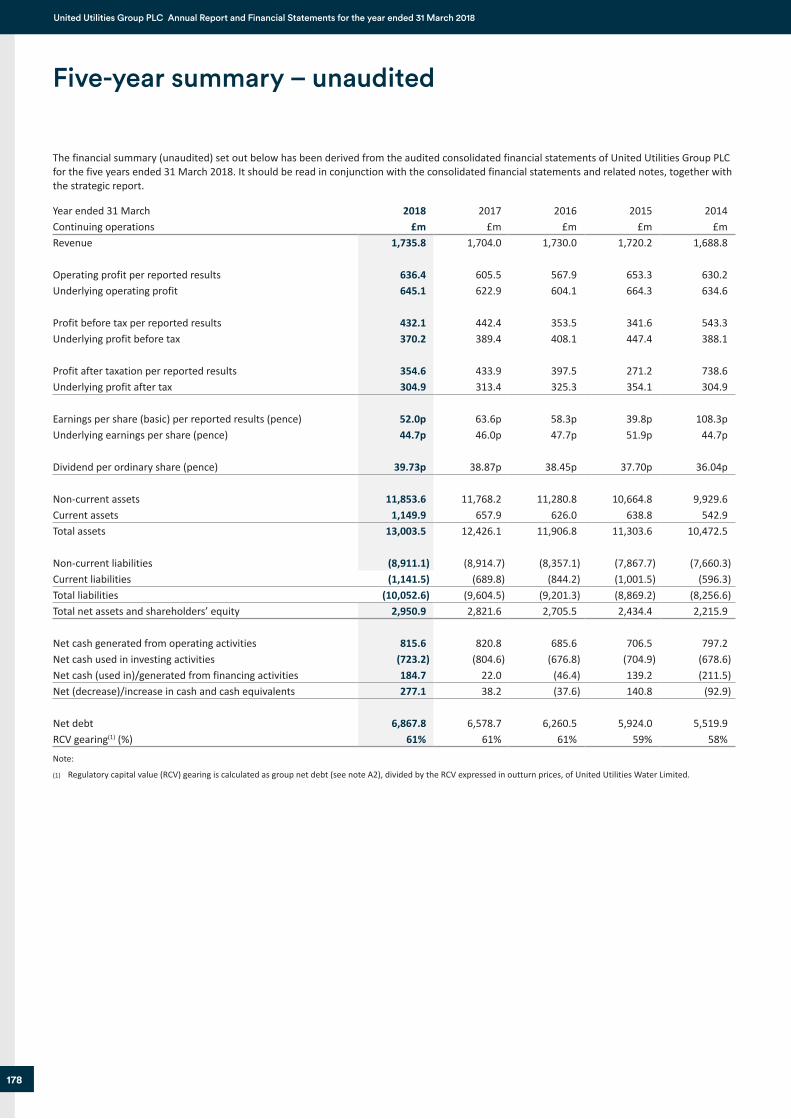
Job Number 1 June 2018 11:11 AM Proof 3 Job Number 1 June 2018 11:11 AM Proof 3
178
United Utilities Group PLC Annual Report and Financial Statements for the year ended 31 March 2018
The financial summary (unaudited) set out below has been derived from the audited consolidated financial statements of United Utilities Group PLC for the five years ended 31 March 2018. It should be read in conjunction with the consolidated financial statements and related notes, together with the strategic report.
Year ended 31 March Continuing operations
2018£m
2017£m
2016£m
2015 £m
2014 £m
Revenue 1,735.8 1,704.0 1,730.0 1,720.2 1,688.8
Operating profit per reported results 636.4 605.5 567.9 653.3 630.2Underlying operating profit 645.1 622.9 604.1 664.3 634.6
Profit before tax per reported results 432.1 442.4 353.5 341.6 543.3Underlying profit before tax 370.2 389.4 408.1 447.4 388.1
Profit after taxation per reported results 354.6 433.9 397.5 271.2 738.6Underlying profit after tax 304.9 313.4 325.3 354.1 304.9
Earnings per share (basic) per reported results (pence) 52.0p 63.6p 58.3p 39.8p 108.3pUnderlying earnings per share (pence) 44.7p 46.0p 47.7p 51.9p 44.7p
Dividend per ordinary share (pence) 39.73p 38.87p 38.45p 37.70p 36.04p
Non-current assets 11,853.6 11,768.2 11,280.8 10,664.8 9,929.6Current assets 1,149.9 657.9 626.0 638.8 542.9Total assets 13,003.5 12,426.1 11,906.8 11,303.6 10,472.5
Non-current liabilities (8,911.1) (8,914.7) (8,357.1) (7,867.7) (7,660.3)Current liabilities (1,141.5) (689.8) (844.2) (1,001.5) (596.3)Total liabilities (10,052.6) (9,604.5) (9,201.3) (8,869.2) (8,256.6)Total net assets and shareholders’ equity 2,950.9 2,821.6 2,705.5 2,434.4 2,215.9
Net cash generated from operating activities 815.6 820.8 685.6 706.5 797.2Net cash used in investing activities (723.2) (804.6) (676.8) (704.9) (678.6)Net cash (used in)/generated from financing activities 184.7 22.0 (46.4) 139.2 (211.5)Net (decrease)/increase in cash and cash equivalents 277.1 38.2 (37.6) 140.8 (92.9)
Net debt 6,867.8 6,578.7 6,260.5 5,924.0 5,519.9RCV gearing(1) (%) 61% 61% 61% 59% 58%
Note:
(1) Regulatory capital value (RCV) gearing is calculated as group net debt (see note A2), divided by the RCV expressed in outturn prices, of United Utilities Water Limited.
Five-year summary – unaudited
United Utilities 2018 - Financial Statements.indd 178 6/1/2018 12:29:16 PM

Job Number 1 June 2018 11:11 AM Proof 3 Job Number 1 June 2018 11:11 AM Proof 3
179
Fina
ncia
l sta
tem
ents
unitedutilities.com/corporate Stock Code: UU.
Shareholder notes
United Utilities 2018 - Financial Statements.indd 179 6/1/2018 12:29:16 PM
Job Number 1 June 2018 11:11 AM Proof 3
United Utilities Group PLC Annual Report and Financial Statements for the year ended 31 March 2018
180
Shareholder information
Key dates − 21 June 2018
Ex-dividend date for 2017/18 final dividend − 22 June 2018
Record date for 2017/18 final dividend − 27 July 2018
Annual general meeting − 3 August 2018
Payment of 2017/18 final dividend to shareholders − 21 November 2018
Announcement of half-year results for the six months ending 30 September 2018
− 20 December 2018 Ex-dividend date for 2018/19 interim dividend
− 21 December 2018 Record date for 2018/19 interim dividend
− 1 February 2019 Payment of 2018/19 interim dividend to shareholders
− May 2019 Announce the final results for the 2018/19 financial year
− June 2019 Publish the Annual Report and Financial Statements for the 2018/19 financial year
Electronic communicationsWe’re encouraging our shareholders to receive their shareholder information by email and via our website. Not only is this a quicker way for you to receive information, it helps us to be more sustainable by reducing paper and printing materials and lowering postage costs.
Registering for electronic shareholder communications is very straightforward, and is done online via shareview.co.uk which is a website provided by our registrar, Equiniti.
Log on to shareview.co.uk and you can:
set up electronic shareholder communication; view your shareholdings; update your address details if you change your address; and get your dividends paid directly into your bank account.
Please do not use any electronic address provided in this notice or in any related document to communicate with the company for any purposes other than those expressly stated.
Why not make life easy and have your dividends paid straight to your bank? The dividend goes directly into your bank account and is available
immediately; No need to pay dividend cheques into your bank account No risk of losing cheques in the post; No risk of having to replace spoiled or out-of-date cheques; and It’s cost-effective for your company.
To take advantage of this, please contact Equiniti via shareview.co.uk or complete the dividend mandate form that you receive with your next dividend cheque.
If you choose to have your dividend paid directly into your bank account you’ll receive one tax voucher each year. This will be issued with the interim dividend normally paid in February and will contain details of all the dividends paid in that tax year. If you’d like to receive a tax voucher with each dividend payment, please contact Equiniti.
Online annual reportOur annual report is available online. View or download the full Annual Report and Financial Statements from: unitedutilities.com/corporate
United Utilities 2018 - Financial Statements.indd 180 6/1/2018 12:29:16 PM
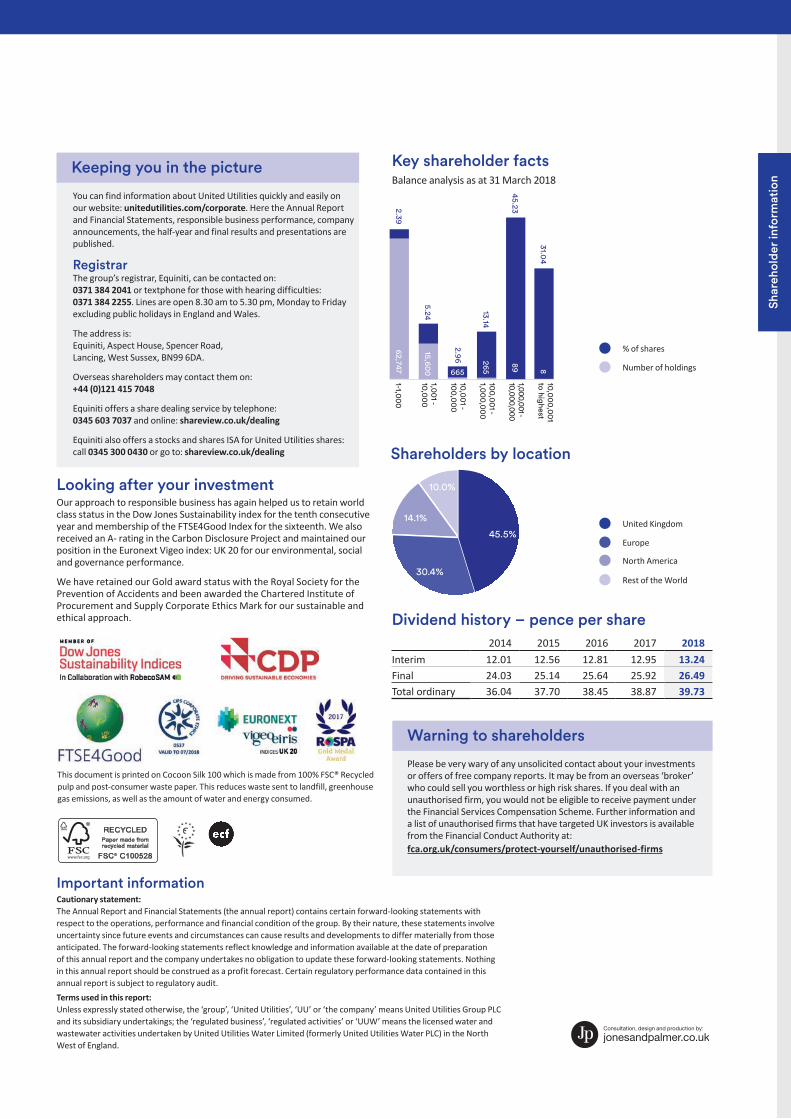
Stock Code: UU. unitedutilities.com/corporate
Important informationCautionary statement: The Annual Report and Financial Statements (the annual report) contains certain forward-looking statements with respect to the operations, performance and financial condition of the group. By their nature, these statements involve uncertainty since future events and circumstances can cause results and developments to differ materially from those anticipated. The forward-looking statements reflect knowledge and information available at the date of preparation of this annual report and the company undertakes no obligation to update these forward-looking statements. Nothing in this annual report should be construed as a profit forecast. Certain regulatory performance data contained in this annual report is subject to regulatory audit.Terms used in this report: Unless expressly stated otherwise, the ‘group’, ‘United Utilities’, ‘UU’ or ‘the company’ means United Utilities Group PLC and its subsidiary undertakings; the ‘regulated business’, ‘regulated activities’ or ‘UUW’ means the licensed water and wastewater activities undertaken by United Utilities Water Limited (formerly United Utilities Water PLC) in the North West of England.
Key shareholder factsBalance analysis as at 31 March 2018
2014 2015 2016 2017 2018Interim 12.01 12.56 12.81 12.95 13.24Final 24.03 25.14 25.64 25.92 26.49Total ordinary 36.04 37.70 38.45 38.87 39.73
Dividend history – pence per share
Looking after your investmentOur approach to responsible business has again helped us to retain world class status in the Dow Jones Sustainability index for the tenth consecutive year and membership of the FTSE4Good Index for the sixteenth. We also received an A- rating in the Carbon Disclosure Project and maintained our position in the Euronext Vigeo index: UK 20 for our environmental, social and governance performance.
We have retained our Gold award status with the Royal Society for the Prevention of Accidents and been awarded the Chartered Institute of Procurement and Supply Corporate Ethics Mark for our sustainable and ethical approach.
2.96
5.24
2.3962,747
15,600 665
13.14265
45.2389
31.04
8
1-1,00
0
1,00
1 -10,0
00
10,00
1 -10
0,00
0
100,0
01 -
1,00
0,00
0
1,000,001 -10,000,000
10,00
0,00
1 to highest
Shareholders by location
45.5%
30.4%
14.1%
10.0%
This document is printed on Cocoon Silk 100 which is made from 100% FSC® Recycled pulp and post-consumer waste paper. This reduces waste sent to landfill, greenhouse gas emissions, as well as the amount of water and energy consumed.
% of shares
Number of holdings
United Kingdom
North America
Europe
Rest of the World
You can find information about United Utilities quickly and easily on our website: unitedutilities.com/corporate. Here the Annual Report and Financial Statements, responsible business performance, company announcements, the half-year and final results and presentations are published.
RegistrarThe group’s registrar, Equiniti, can be contacted on: 0371 384 2041 or textphone for those with hearing difficulties: 0371 384 2255. Lines are open 8.30 am to 5.30 pm, Monday to Friday excluding public holidays in England and Wales.
The address is: Equiniti, Aspect House, Spencer Road, Lancing, West Sussex, BN99 6DA.
Overseas shareholders may contact them on: +44 (0)121 415 7048
Equiniti offers a share dealing service by telephone: 0345 603 7037 and online: shareview.co.uk/dealing
Equiniti also offers a stocks and shares ISA for United Utilities shares: call 0345 300 0430 or go to: shareview.co.uk/dealing
Keeping you in the picture
Please be very wary of any unsolicited contact about your investments or offers of free company reports. It may be from an overseas ‘broker’ who could sell you worthless or high risk shares. If you deal with an unauthorised firm, you would not be eligible to receive payment under the Financial Services Compensation Scheme. Further information and a list of unauthorised firms that have targeted UK investors is available from the Financial Conduct Authority at: fca.org.uk/consumers/protect-yourself/unauthorised-firms
Warning to shareholders
Shar
ehol
der
info
rmat
ion
United Utilities 2018.indd 8 6/1/2018 2:05:29 PM

United Utilities Group PLC Haweswater HouseLingley Mere Business ParkLingley Green AvenueGreat SankeyWarringtonWA5 3LP
Telephone +44 (0)1925 237000
Stock Code: UU.Registered in England and WalesRegistered number 6559020
UN
ITED
UT
ILITIES G
RO
UP PLC
AN
NU
AL R
EPO
RT
AN
D FIN
AN
CIA
L STA
TEM
ENT
S FO
R T
HE Y
EAR
END
ED 31 M
AR
CH
2018
United Utilities 2018.indd 1 6/1/2018 2:05:19 PM
Related Documents