UNITED STATES SECURITIES AND EXCHANGE COMMISSION Washington, D.C. 20549 FORM 10-Q (Mark One) [X] QUARTERLY REPORT PURSUANT TO SECTION 13 OR 15(d) OF THE SECURITIES EXCHANGE ACT OF 1934 For the quarterly period ended September 30, 2017 OR [ ] TRANSITION REPORT PURSUANT TO SECTION 13 OR 15(d) OF THE SECURITIES AND EXCHANGE ACT OF 1934 For the transition period from _________ to _________ Commission file number: 000-31203 NET 1 UEPS TECHNOLOGIES, INC. (Exact name of registrant as specified in its charter) Florida 98-0171860 (State or other jurisdiction (IRS Employer of incorporation or organization) Identification No.) President Place, 4 th Floor, Cnr. Jan Smuts Avenue and Bolton Road Rosebank, Johannesburg 2196, South Africa (Address of principal executive offices, including zip code) Registrant’s telephone number, including area code: 27-11-343-2000 Not Applicable (Former Name, Former Address and Former Fiscal Year, if Changed Since Last Report) Indicate by check mark whether the registrant (1) has filed all reports required to be filed by Section 13 or 15(d) of the Securities Exchange Act of 1934 during the preceding 12 months (or for such shorter period that the registrant was required to file such reports), and (2) has been subject to such filing requirements for the past 90 days. YES [X] NO [ ] Indicate by check mark whether the registrant has submitted electronically and posted on its corporate Web site, if any, every Interactive Data File required to be submitted and posted pursuant to Rule 405 of Regulation S-T (§232.405 of this chapter) during the preceding 12 months (or for such shorter period that the registrant was required to submit and post such files). YES [X] NO [ ]

Welcome message from author
This document is posted to help you gain knowledge. Please leave a comment to let me know what you think about it! Share it to your friends and learn new things together.
Transcript

UNITED STATES SECURITIES AND EXCHANGE COMMISSION
Washington, D.C. 20549
FORM 10-Q(Mark One) [X] QUARTERLY REPORT PURSUANT TO SECTION 13 OR 15(d) OF THE SECURITIES EXCHANGE ACT OF 1934 For the quarterly period ended September 30, 2017
OR
[ ] TRANSITION REPORT PURSUANT TO SECTION 13 OR 15(d) OF THE SECURITIES AND EXCHANGE ACT OF1934 For the transition period from _________ to _________
Commission file number: 000-31203
NET 1 UEPS TECHNOLOGIES, INC. (Exact name of registrant as specified in its charter)
Florida 98-0171860(State or other jurisdiction (IRS Employer
of incorporation or organization) Identification No.)
President Place, 4th Floor, Cnr. Jan Smuts Avenue and Bolton Road Rosebank, Johannesburg 2196, South Africa
(Address of principal executive offices, including zip code)
Registrant’s telephone number, including area code: 27-11-343-2000
Not Applicable (Former Name, Former Address and Former Fiscal Year, if Changed Since Last Report)
Indicate by check mark whether the registrant (1) has filed all reports required to be filed by Section 13 or 15(d) of the SecuritiesExchange Act of 1934 during the preceding 12 months (or for such shorter period that the registrant was required to file suchreports), and (2) has been subject to such filing requirements for the past 90 days. YES [X] NO [ ]
Indicate by check mark whether the registrant has submitted electronically and posted on its corporate Web site, if any, everyInteractive Data File required to be submitted and posted pursuant to Rule 405 of Regulation S-T (§232.405 of this chapter) duringthe preceding 12 months (or for such shorter period that the registrant was required to submit and post such files). YES [X] NO [ ]

Indicate by check mark whether the registrant is a large accelerated filer, an accelerated filer, a non-accelerated filer or a smallerreporting company. See the definitions of “large accelerated filer”, “accelerated filer”, “smaller reporting company”, and “emerginggrowth company” in Rule 12b-2 of the Exchange Act (check one):
[ ] Large accelerated filer [X] Accelerated filer [ ] Non-accelerated filer [ ] Smaller reporting company
(do not check if a smaller reporting company) [ ] Emerging growth company
If an emerging growth company, indicate by check mark if the registrant has elected not to use the extended transition period forcomplying with any new or revised financial accounting standards provided pursuant to Section 13(a) of the Exchange Act. [ ]
Indicate by check mark whether the registrant is a shell company (as defined in Rule 12b-2 of the Exchange Act). YES [ ] NO [X ]
As of November 7, 2017 (the latest practicable date), 56,927,696 shares of the registrant’s common stock, par value $0.001 pershare, net of treasury shares, were outstanding.
Form 10-Q
NET 1 UEPS TECHNOLOGIES, INC.
Table of Contents
Page No.PART I. FINANCIAL INFORMATION Item 1. Financial Statements Unaudited Condensed Consolidated Balance Sheets at September 30, 2017 and June 30, 2017 2
Unaudited Condensed Consolidated Statements of Operations for the three months ended September 30, 2017 and 2016 3 Unaudited Condensed Consolidated Statements of Comprehensive Income for the three months ended September 30, 2017 and2016 4 Unaudited Condensed Consolidated Statement of Changes in Equity for the three months ended September 30, 2017 5 Unaudited Condensed Consolidated Statements of Cash Flows for the three months ended September 30, 2017 and 2016 6
Notes to Unaudited Condensed Consolidated Financial Statements 7 Item 2. Management’s Discussion and Analysis of Financial Condition and Results of Operations 27 Item 3. Quantitative and Qualitative Disclosures About Market Risk 39 Item 4. Controls and Procedures 39PART II. OTHER INFORMATION Item 1. Legal Proceedings 40 Item 6. Exhibits 42 Signatures 43 EXHIBIT 10.71 EXHIBIT 10.72 EXHIBIT 10.73 EXHIBIT 10.74 EXHIBIT 10.75 EXHIBIT 10.76 EXHIBIT 10.77 EXHIBIT 10.78 EXHIBIT 31.1 EXHIBIT 31.2 EXHIBIT 32
1
Part I. Financial Information
Item 1. Financial Statements
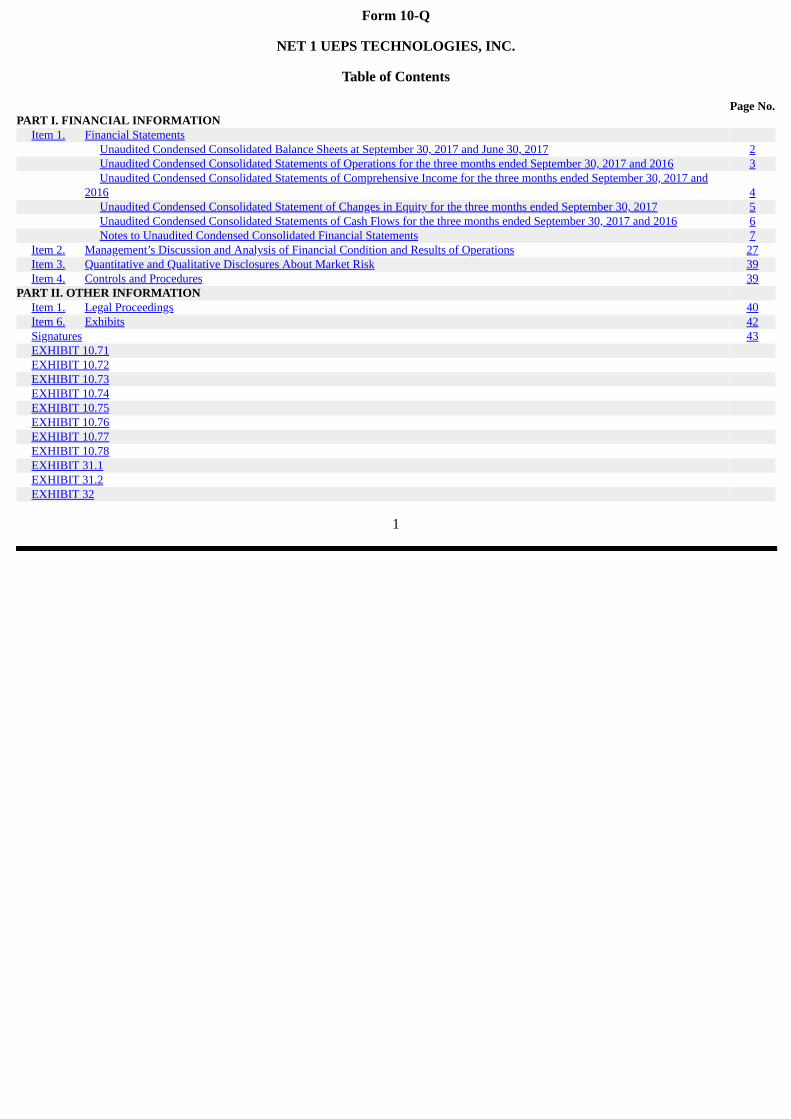
NET 1 UEPS TECHNOLOGIES, INC. Unaudited Condensed Consolidated Balance Sheets
Unaudited (A) September 30, June 30, 2017 2017
(In thousands, except share data) ASSETS
CURRENT ASSETS Cash and cash equivalents $ 138,359 $ 258,457 Pre-funded social welfare grants receivable (Note 2) 3,457 2,322 Accounts receivable, net of allowances of – September: $1,158; June: $1,255 115,652 111,429 Finance loans receivable, net of allowances of – September: $7,456; June: $7,469 106,087 80,177 Inventory (Note 3) 9,278 8,020 Deferred income taxes (Note 1) - 5,330 Total current assets before settlement assets 372,833 465,735 Settlement assets (Note 4) 411,349 640,455 Total current assets 784,182 1,106,190 PROPERTY, PLANT AND EQUIPMENT, net of accumulated depreciation of – September: $122,138; June:$120,212 34,060 39,411EQUITY-ACCOUNTED INVESTMENTS (Note 6) 97,802 27,862 GOODWILL (Note 7) 186,539 188,833 INTANGIBLE ASSETS, net (Note 7) 35,584 38,764 DEFERRED INCOME TAXES (Note 1) 3,969 - OTHER LONG-TERM ASSETS, including reinsurance assets (Note 6 and Note 8) 201,166 49,696 TOTAL ASSETS 1,343,302 1,450,756
LIABILITIES CURRENT LIABILITIES Short-term credit facilities (Note 9) 45,737 16,579 Accounts payable 14,004 15,136 Other payables 38,028 34,799 Current portion of long-term borrowings (Note 10) 59,371 8,738 Income taxes payable 14,126 5,607 Total current liabilities before settlement obligations 171,266 80,859 Settlement obligations (Note 4) 411,349 640,455 Total current liabilities 582,615 721,314 DEFERRED INCOME TAXES (Note 1) 8,615 11,139 LONG-TERM BORROWINGS (Note 10) 34,860 7,501 OTHER LONG-TERM LIABILITIES, including insurance policy liabilities (Note 8) 2,965 2,795 TOTAL LIABILITIES 629,055 742,749 COMMITMENTS AND CONTINGENCIES (Note 18)
EQUITY COMMON STOCK (Note 11) Authorized: 200,000,000 with $0.001 par value; Issued and outstanding shares, net of treasury - September: 56,927,696; June: 56,369,737 80 80 PREFERRED STOCK Authorized shares: 50,000,000 with $0.001 par value; Issued and outstanding shares, net of treasury: September: -; June: - - - ADDITIONAL PAID-IN-CAPITAL 274,353 273,733 TREASURY SHARES, AT COST: September: 24,891,292; June: 24,891,292 (286,951) (286,951) ACCUMULATED OTHER COMPREHENSIVE LOSS (Note 12) (176,565) (162,569) RETAINED EARNINGS 792,759 773,276 TOTAL NET1 EQUITY 603,676 597,569 REDEEMABLE COMMON STOCK 107,672 107,672 NON-CONTROLLING INTEREST 2,899 2,766 TOTAL EQUITY 714,247 708,007 TOTAL LIABILITIES AND SHAREHOLDERS’ EQUITY $ 1,343,302 $ 1,450,756
(A) – Derived from audited financial statements
See Notes to Unaudited Condensed Consolidated Financial Statements
2

NET 1 UEPS TECHNOLOGIES, INC. Unaudited Condensed Consolidated Statements of Operations
Three months ended September 30, 2017 2016 (In thousands, except per share data)
REVENUE $ 152,558 $ 155,633 EXPENSE Cost of goods sold, IT processing, servicing and support 74,652 74,780 Selling, general and administration 43,934 38,468 Depreciation and amortization 8,966 10,204 OPERATING INCOME 25,006 32,181 INTEREST INCOME 5,044 4,304 INTEREST EXPENSE 2,121 796 INCOME BEFORE INCOME TAX EXPENSE 27,929 35,689 INCOME TAX EXPENSE (Note 17) 10,277 11,103 NET INCOME BEFORE EARNINGS FROM EQUITY-ACCOUNTED INVESTMENTS 17,652 24,586 EARNINGS FROM EQUITY-ACCOUNTED INVESTMENTS 2,075 659 NET INCOME 19,727 25,245 LESS NET INCOME ATTRIBUTABLE TO NON-CONTROLLING INTEREST 244 613 NET INCOME ATTRIBUTABLE TO NET1 $ 19,483 $ 24,632 Net income per share, in U.S. dollars (Note 14) Basic earnings attributable to Net1 shareholders $ 0.34 $ 0.46 Diluted earnings attributable to Net1 shareholders $ 0.34 $ 0.46
See Notes to Unaudited Condensed Consolidated Financial Statements
3

NET 1 UEPS TECHNOLOGIES, INC.Unaudited Condensed Consolidated Statements of Comprehensive Income
Three months ended September 30, 2017 2016 (In thousands)
Net income $ 19,727 $ 25,245 Other comprehensive (loss) income Movement in foreign currency translation reserve (13,880) 22,302 Movement in foreign currency translation reserve related to equity-accounted investments (227) - Total other comprehensive (loss) income, net of taxes (14,107) 22,302 Comprehensive income 5,620 47,547 Less comprehensive income attributable to non-controlling interest (133) (1,057) Comprehensive income attributable to Net1 $ 5,487 $ 46,490
See Notes to Unaudited Condensed Consolidated Financial Statements
4

NET 1 UEPS TECHNOLOGIES, INC.Unaudited Condensed Consolidated Statement of Changes in Equity for the three months ended September 30, 2017 (dollar
amounts in thousands)
Net 1 UEPS Technologies, Inc. Shareholders Number Accumulated Number of Number of Additional Other Total Redeemable Non- of Treasury Treasury Shares, Net Paid-In Retained Comprehensive Net1 Common Controlling Shares Amount Shares Shares of Treasury Capital Earnings (Loss) Income Equity Stock Interest Total
Balance – July1, 2017 81,261,029 $ 80 (24,891,292) $ (286,951) 56,369,737 $ 273,733 $ 773,276 $ (162,569) $ 597,569 $ 107,672 $ 2,766 $ 708,007 Restrictedstock granted(Note 13) 588,594 588,594 - - Stock-basedcompensationcharge (Note13) 869 869 869 Reversal ofstockcompensationcharge (Note13) (30,635) (30,635) (42) (42) (42) Reversal ofstock based-compensationcharge relatedto equity-accountedinvestment (207) (207) (207) Net income 19,483 19,483 244 19,727 Othercomprehensiveincome (Note12) (13,996) (13,996) (111) (14,107) Balance –September 30,2017 81,818,988 $ 80 (24,891,292) $ (286,951) 56,927,696 $ 274,353 $ 792,759 $ (176,565) $ 603,676 $ 107,672 $ 2,899 $ 714,247
See Notes to Unaudited Condensed Consolidated Financial Statements
5
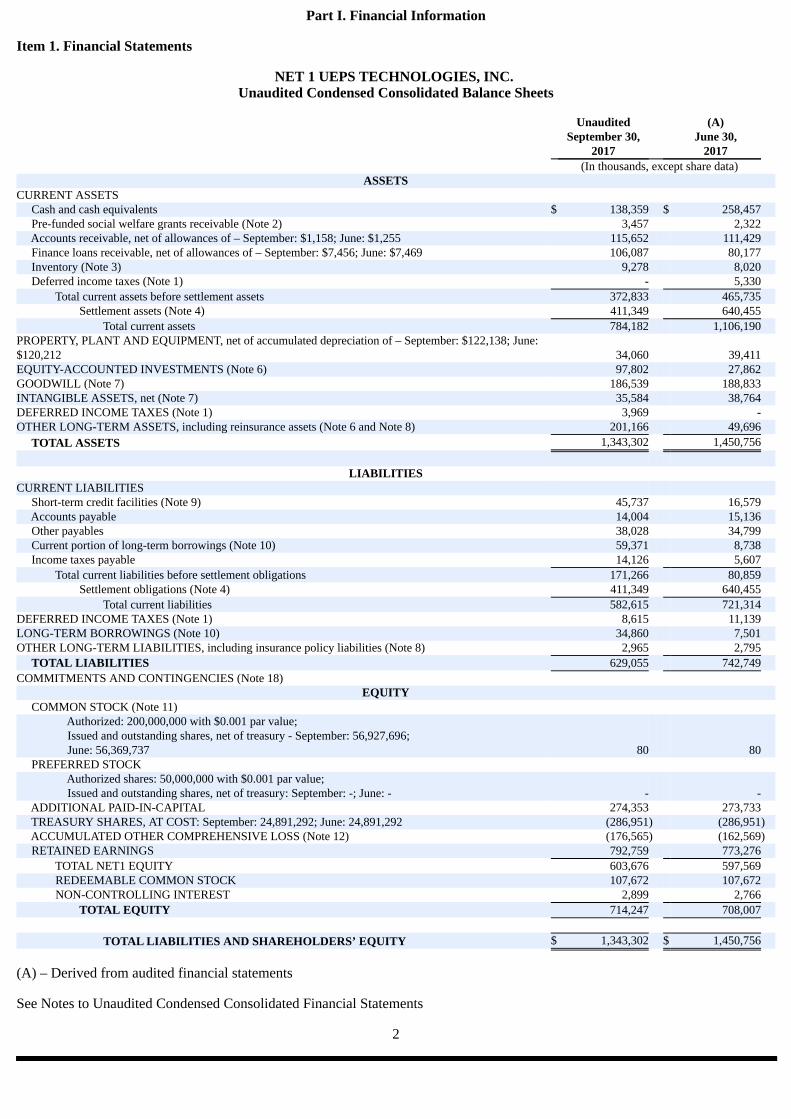
NET 1 UEPS TECHNOLOGIES, INC. Unaudited Condensed Consolidated Statements of Cash Flows
Three months ended September 30, 2017 2016 (In thousands)
Cash flows from operating activities Net income $ 19,727 $ 25,245 Depreciation and amortization 8,966 10,204 Earnings from equity-accounted investments (2,075) (659)Fair value adjustments 91 (83)Interest payable (88) 32 Facility fee amortized 133 36 Loss on disposal of property, plant and equipment 105 66 Stock-based compensation charge (reversal), net (Note 13) 827 (1,324)Dividends received from equity accounted investments 912 370 (Increase) Decrease in accounts receivable, pre-funded social welfare grants receivable and finance loansreceivable (39,141) 7,766Increase in inventory (1,526) (104)Increase in accounts payable and other payables 3,429 3,040 Increase in taxes payable 8,838 10,956 Decrease in deferred taxes (991) (1,632) Net cash (used in) provided by operating activities (793) 53,913 Cash flows from investing activities Capital expenditures (1,473) (3,423)Proceeds from disposal of property, plant and equipment 316 69 Investment in Cell C (Note 6) (151,003) - Investment in equity of equity-accounted investments (Note 6) (72,846) - Investment in MobiKwik - (15,347)Net change in settlement assets 212,649 (37,394) Net cash used in investing activities (12,357) (56,095) Cash flows from financing activities Long-term borrowings utilized (Note 10) 95,431 247 Repayment of long-term borrowings (Note 10) (14,260) (26,669)Proceeds from bank overdraft (Note 9) 31,880 - Repayment of bank overdraft (Note 9) (2,952) - Payment of guarantee fee (Note 10) (552) - Acquisition of treasury stock (Note 11) - (32,081)Dividends paid to non-controlling interest - (555)Net change in settlement obligations (212,649) 37,394 Net cash used in financing activities (103,102) (21,664) Effect of exchange rate changes on cash (3,846) 5,531 Net decrease in cash and cash equivalents (120,098) (18,315)Cash and cash equivalents – beginning of period 258,457 223,644 Cash and cash equivalents – end of period $ 138,359 $ 205,329
See Notes to Unaudited Condensed Consolidated Financial Statements
6
NET 1 UEPS TECHNOLOGIES, INC. Notes to the Unaudited Condensed Consolidated Financial Statements
for the three months ended September 30, 2017 and 2016 (All amounts in tables stated in thousands or thousands of U.S. dollars, unless otherwise stated)
1. Basis of Presentation and Summary of Significant Accounting Policies
Unaudited Interim Financial Information
The accompanying unaudited condensed consolidated financial statements include all majority-owned subsidiaries overwhich the Company exercises control and have been prepared in accordance with U.S. generally accepted accounting principles(“GAAP”) and the rules and regulations of the United States Securities and Exchange Commission for Quarterly Reports on Form10-Q and include all of the information and disclosures required for interim financial reporting. The results of operations for thethree months ended September 30, 2017 and 2016, are not necessarily indicative of the results for the full year. The Companybelieves that the disclosures are adequate to make the information presented not misleading.
These financial statements should be read in conjunction with the financial statements, accounting policies and financialnotes thereto included in the Company’s Annual Report on Form 10-K for the fiscal year ended June 30, 2017. In the opinion ofmanagement, the accompanying unaudited condensed consolidated financial statements reflect all adjustments (consisting only ofnormal recurring adjustments), which are necessary for a fair representation of financial results for the interim periods presented.
References to the “Company” refer to Net1 and its consolidated subsidiaries, collectively, unless the context otherwiserequires. References to “Net1” are references solely to Net 1 UEPS Technologies, Inc.
Recent accounting pronouncements adopted
In August 2014, the FASB issued guidance regarding Disclosure of Uncertainties about an Entity’s Ability to Continue as aGoing Concern. This guidance requires an entity to perform interim and annual assessments of its ability to continue as a goingconcern within one year of the date that its financial statements are issued. An entity must provide certain disclosures if conditionsor events raise substantial doubt about the entity’s ability to continue as a going concern. The guidance is effective for the Companybeginning July 1, 2017. The adoption of this guidance did not have a material impact on the Company’s financial statementsdisclosures.
In July 2015, the FASB issued guidance regarding Simplifying the Measurement of Inventory. This guidance requires entitiesto measure most inventory “at the lower of cost and net realizable value,” thereby simplifying the current guidance under which anentity must measure inventory at the lower of cost or market (market in this context is defined as one of three different measures).The guidance will not apply to inventories that are measured by using either the last-in, first-out (“LIFO”) method or the retailinventory method (“RIM”). The guidance is effective for the Company beginning July 1, 2017. The adoption of this guidance didnot have a material impact on the Company’s financial statements.
In November 2015, the FASB issued guidance regarding Balance Sheet Classification of Deferred Taxes. This guidancerequires that deferred tax liabilities and assets are to be classified as non-current in a classified statement of financial position. Thecurrent requirement that deferred tax liabilities and assets of a tax-paying component of an entity be offset and presented as a singleamount is not affected by the amendments in this update. This guidance is effective for the Company beginning July 1, 2017, andhas been applied on a prospective basis. The adoption of this guidance has resulted in the reclassification of current deferred taxassets and liabilities as non-current deferred tax assets and liabilities in the unaudited condensed consolidated balance sheet as ofSeptember 30, 2017. Prior period current deferred tax assets have not been reclassified as non-current in the unaudited condensedconsolidated balance sheet as of June 30, 2017.
In March 2016, the FASB issued guidance regarding Improvements to Employee Share-Based Payment Accounting. Theguidance simplifies several aspects of the accounting for employee share-based payment transactions for both public and nonpublicentities, including the accounting for income taxes, forfeitures, and statutory tax withholding requirements, as well as classificationin the statement of cash flows. This guidance is effective for the Company beginning July 1, 2017. The adoption of this guidancedid not have a material impact on the Company’s financial statements. The Company has elected to continue to estimate thenumber of forfeitures when an award is made.
Recent accounting pronouncements not yet adopted as of September 30, 2017
In May 2014, the FASB issued guidance regarding Revenue from Contracts with Customers. This guidance requires an entityto recognize revenue when a customer obtains control of promised goods or services in an amount that reflects the consideration towhich the entity expects to receive in exchange for those goods or services. In addition, the standard requires disclosure of thenature, amount, timing, and uncertainty of revenue and cash flows arising from contracts with customers. The guidance wasoriginally set to be effective for the Company beginning July 1, 2017, however in August 2015, the FASB issued guidanceregarding Revenue from Contracts with Customers, Deferral of the Effective Date. This guidance defers the requiredimplementation date specified in Revenue from Contracts with Customers to December 2017. Public companies may elect to adoptthe standard along the original timeline.
7

1. Basis of Presentation and Summary of Significant Accounting Policies (continued)
Recent accounting pronouncements not yet adopted as of September 30, 2017 (continued)
The guidance is effective for the Company beginning July 1, 2018. The Company expects that this guidance may have amaterial impact on its financial statements and is currently evaluating the impact of this guidance on its financial statements onadoption.
In January 2016, the FASB issued guidance regarding Recognition and Measurement of Financial Assets and FinancialLiabilities. The guidance primarily affects the accounting for equity investments, financial liabilities under the fair value option andthe presentation and disclosure requirements for financial instruments. The guidance requires changes in the fair value of theCompany’s equity investments, with certain exceptions, to be recognized through net income rather than other comprehensiveincome. In addition, the guidance clarifies the valuation allowance assessment when recognizing deferred tax assets resulting fromunrealized losses on available-for-sale debt securities. This guidance is effective for the Company beginning July 1, 2018, and earlyadoption is not permitted, with certain exceptions. The amendments are required to be applied by means of a cumulative-effectadjustment on the balance sheet as of the beginning of the fiscal year of adoption. The Company is currently assessing the impactof this guidance on its financial statements disclosure.
In February 2016, the FASB issued guidance regarding Leases. The guidance increases transparency and comparabilityamong organizations by requiring the recognition of lease assets and lease liabilities on the balance sheet. The amendments tocurrent lease guidance include the recognition of assets and liabilities by lessees for those leases currently classified as operatingleases. The guidance also requires disclosures to meet the objective of enabling users of financial statements to assess the amount,timing, and uncertainty of cash flows arising from leases. This guidance is effective for the Company beginning July 1, 2019. Earlyadoption is permitted. The Company expects that this guidance may have a material impact on its financial statements and iscurrently evaluating the impact of this guidance on its financial statements on adoption.
In June 2016, the FASB issued guidance regarding Measurement of Credit Losses on Financial Instruments. The guidancereplaces the incurred loss impairment methodology in current GAAP with a methodology that reflects expected credit losses andrequires consideration of a broader range of reasonable and supportable information to inform credit loss estimates. For trade andother receivables, loans, and other financial instruments, an entity is required to use a forward-looking expected loss model ratherthan the incurred loss model for recognizing credit losses, which reflects losses that are probable. Credit losses relating to available-for-sale debt securities will also be recorded through an allowance for credit losses rather than as a reduction in the amortized costbasis of the securities. This guidance is effective for the Company beginning July 1, 2020. Early adoption is permitted beginningJuly 1, 2019. The Company is currently assessing the impact of this guidance on its financial statements disclosure.
In June 2016, the FASB issued guidance regarding Classification of Certain Cash Receipts and Cash Payments. Theguidance is intended to reduce diversity in practice and explains how certain cash receipts and payments are presented andclassified in the statement of cash flows, including beneficial interests in securitization, which would impact the presentation of thedeferred purchase price from sales of receivables. This guidance is effective for the Company beginning July 1, 2018, and must beapplied retrospectively. Early adoption is permitted. The Company is currently assessing the impact of this guidance on its financialstatements disclosure.
In January 2017, the FASB issued guidance regarding Clarifying the Definition of a Business. This guidance provides a morerobust framework to use in determining when a set of assets and activities is a business. Because the current definition of a businessis interpreted broadly and can be difficult to apply, stakeholders indicated that analyzing transactions is inefficient and costly andthat the definition does not permit the use of reasonable judgment. The amendments provide more consistency in applying theguidance, reduce the costs of application, and make the definition of a business more operable. The guidance is effective for theCompany beginning July 1, 2018. Early adoption is permitted. The Company is currently assessing the impact of this guidance onits financial statements disclosure.
In January 2017, the FASB issued guidance regarding Simplifying the Test for Goodwill Impairment. This guidance removesthe requirement for an entity to calculate the implied fair value of goodwill (as part of step 2 of the current goodwill impairmenttest) in measuring a goodwill impairment loss. The guidance is effective for the Company beginning July 1, 2020. Early adoption ispermitted for interim or annual goodwill impairment tests performed on testing dates after January 1, 2017. The Company iscurrently assessing the impact of this guidance.
In May 2017, the FASB issued guidance regarding Compensation—Stock Compensation (Topic 718): Scope of ModificationAccounting. The guidance amends the scope of modification accounting for share-based payment arrangements and providesguidance on the types of changes to the terms or conditions of share-based payment awards to which an entity would be required toapply modification accounting under Accounting Standards Codification 718. Specifically, an entity would not apply modificationaccounting if the fair value, vesting conditions, and classification of the awards are the same immediately before and after themodification. The guidance is effective for the Company beginning July 1, 2018. Early adoption is permitted. The Company iscurrently assessing the impact of this guidance on its financial statements disclosure.
8
2. Pre-funded social welfare grants receivable
Pre-funded social welfare grants receivable represents primarily amounts pre-funded by the Company to certain merchantsparticipating in the merchant acquiring system. The October 2017 payment service commenced on October 1, 2017, but theCompany pre-funded certain merchants participating in the merchant acquiring systems on the last day of September 2017. TheJuly 2017 payment service commenced on July 1, 2017, but the Company pre-funded certain merchants participating in themerchant acquiring systems on the last day of June 2017.
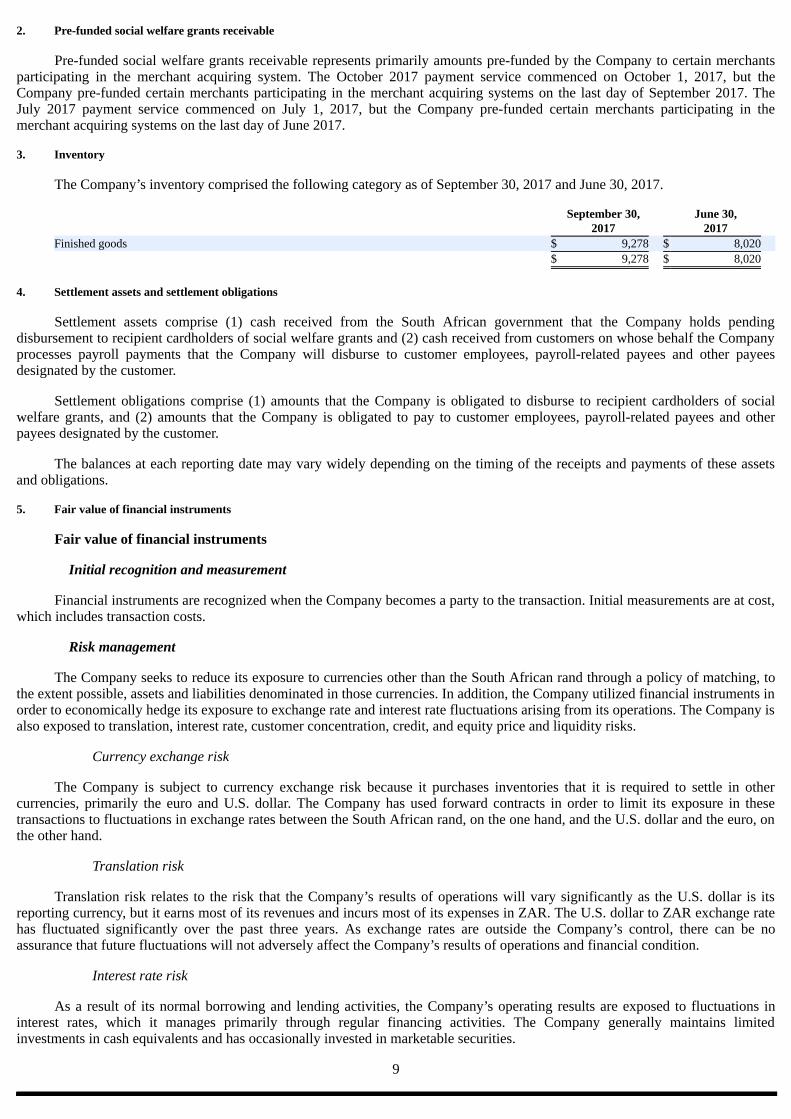
3. Inventory
The Company’s inventory comprised the following category as of September 30, 2017 and June 30, 2017.
September 30, June 30, 2017 2017 Finished goods $ 9,278 $ 8,020 $ 9,278 $ 8,020
4. Settlement assets and settlement obligations
Settlement assets comprise (1) cash received from the South African government that the Company holds pendingdisbursement to recipient cardholders of social welfare grants and (2) cash received from customers on whose behalf the Companyprocesses payroll payments that the Company will disburse to customer employees, payroll-related payees and other payeesdesignated by the customer.
Settlement obligations comprise (1) amounts that the Company is obligated to disburse to recipient cardholders of socialwelfare grants, and (2) amounts that the Company is obligated to pay to customer employees, payroll-related payees and otherpayees designated by the customer.
The balances at each reporting date may vary widely depending on the timing of the receipts and payments of these assetsand obligations.
5. Fair value of financial instruments
Fair value of financial instruments
Initial recognition and measurement
Financial instruments are recognized when the Company becomes a party to the transaction. Initial measurements are at cost,which includes transaction costs.
Risk management
The Company seeks to reduce its exposure to currencies other than the South African rand through a policy of matching, tothe extent possible, assets and liabilities denominated in those currencies. In addition, the Company utilized financial instruments inorder to economically hedge its exposure to exchange rate and interest rate fluctuations arising from its operations. The Company isalso exposed to translation, interest rate, customer concentration, credit, and equity price and liquidity risks.
Currency exchange risk
The Company is subject to currency exchange risk because it purchases inventories that it is required to settle in othercurrencies, primarily the euro and U.S. dollar. The Company has used forward contracts in order to limit its exposure in thesetransactions to fluctuations in exchange rates between the South African rand, on the one hand, and the U.S. dollar and the euro, onthe other hand.
Translation risk
Translation risk relates to the risk that the Company’s results of operations will vary significantly as the U.S. dollar is itsreporting currency, but it earns most of its revenues and incurs most of its expenses in ZAR. The U.S. dollar to ZAR exchange ratehas fluctuated significantly over the past three years. As exchange rates are outside the Company’s control, there can be noassurance that future fluctuations will not adversely affect the Company’s results of operations and financial condition.
Interest rate risk
As a result of its normal borrowing and lending activities, the Company’s operating results are exposed to fluctuations ininterest rates, which it manages primarily through regular financing activities. The Company generally maintains limitedinvestments in cash equivalents and has occasionally invested in marketable securities.
9

5. Fair value of financial instruments (continued)
Fair value of financial instruments (continued)
Risk management (continued)
Working capital finance customer concentration risk
Working capital finance customer concentration risk relates to the risk of loss that the Company would incur as a result of itsinitial concentration of customers as it grows its working capital financing receivables base in Europe and the United States. Duringthe year ended June 30, 2017, the Company commenced marketing activities to develop and expand its working capital financingreceivables base. The Company manages the risk through on-going marketing efforts to further expand its customer base as well asthrough regular contact with its customer to assess their need for the Company’s product.
Credit risk
Credit risk relates to the risk of loss that the Company would incur as a result of non-performance by counterparties. TheCompany maintains credit risk policies with regard to its counterparties to minimize overall credit risk. These policies include anevaluation of a potential counterparty’s financial condition, credit rating, and other credit criteria and risk mitigation tools as theCompany’s management deems appropriate.
With respect to credit risk on financial instruments, the Company maintains a policy of entering into such transactions onlywith South African and European financial institutions that have a credit rating of “BB+” (or its equivalent) or better, as determinedby credit rating agencies such as Standard & Poor’s, Moody’s and Fitch Ratings.
Microlending credit risk
The Company is exposed to credit risk in its microlending activities, which provides unsecured short-term loans toqualifying customers. The Company manages this risk by performing an affordability test for each prospective customer andassigns a “creditworthiness score”, which takes into account a variety of factors such as other debts and total expenditures onnormal household and lifestyle expenses.
Equity price and liquidity risk
Equity price risk relates to the risk of loss that the Company would incur as a result of the volatility in the exchange-tradedprice of equity securities that it holds and the risk that it may not be able to liquidate these securities. The market price of thesesecurities may fluctuate for a variety of reasons and, consequently, the amount that the Company may obtain in a subsequent sale ofthese securities may significantly differ from the reported market value.
Liquidity risk relates to the risk of loss that the Company would incur as a result of the lack of liquidity on the exchange onwhich these securities are listed. The Company may not be able to sell some or all of these securities at one time, or over anextended period of time without influencing the exchange traded price, or at all.
Financial instruments
The following section describes the valuation methodologies the Company uses to measure its significant financial assetsand liabilities at fair value.
In general, and where applicable, the Company uses quoted prices in active markets for identical assets or liabilities todetermine fair value. This pricing methodology would apply to Level 1 investments. If quoted prices in active markets for identicalassets or liabilities are not available to determine fair value, then the Company uses quoted prices for similar assets and liabilities orinputs other than the quoted prices that are observable either directly or indirectly. These investments would be included in Level 2investments. In circumstances in which inputs are generally unobservable, values typically reflect management’s estimates ofassumptions that market participants would use in pricing the asset or liability. The fair values are therefore determined usingmodel-based techniques that include option pricing models, discounted cash flow models, and similar techniques. Investmentsvalued using such techniques are included in Level 3 investments.
Derivative transactions - Foreign exchange contracts
As part of the Company’s risk management strategy, the Company enters into derivative transactions to mitigate exposures toforeign currencies using foreign exchange contracts. These foreign exchange contracts are over-the-counter derivative transactions.Substantially all of the Company’s derivative exposures are with counterparties that have long-term credit ratings of “BBB+“ (orequivalent) or better. The Company uses quoted prices in active markets for similar assets and liabilities to determine fair value(Level 2). The Company has no derivatives that require fair value measurement under Level 1 or 3 of the fair value hierarchy.
10
5. Fair value of financial instruments (continued)
Financial instruments (continued)
Derivative transactions - Foreign exchange contracts (continued)
The Company had no outstanding foreign exchange contracts as of September 30, 2017 and June 30, 2017, respectively.
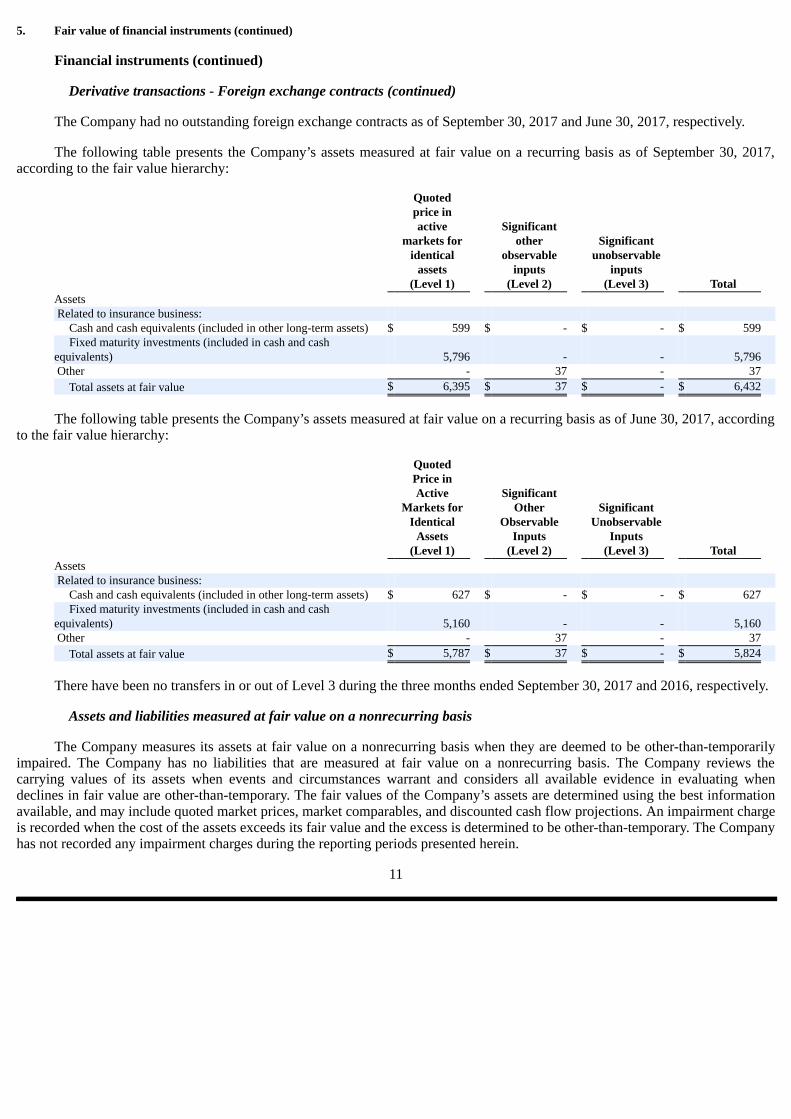
The following table presents the Company’s assets measured at fair value on a recurring basis as of September 30, 2017,according to the fair value hierarchy:
Quoted price in active Significant markets for other Significant identical observable unobservable assets inputs inputs (Level 1) (Level 2) (Level 3) Total Assets Related to insurance business: Cash and cash equivalents (included in other long-term assets) $ 599 $ - $ - $ 599 Fixed maturity investments (included in cash and cash
equivalents) 5,796 - - 5,796 Other - 37 - 37 Total assets at fair value $ 6,395 $ 37 $ - $ 6,432
The following table presents the Company’s assets measured at fair value on a recurring basis as of June 30, 2017, accordingto the fair value hierarchy:
Quoted Price in Active Significant Markets for Other Significant Identical Observable Unobservable Assets Inputs Inputs (Level 1) (Level 2) (Level 3) Total Assets Related to insurance business: Cash and cash equivalents (included in other long-term assets) $ 627 $ - $ - $ 627 Fixed maturity investments (included in cash and cash
equivalents) 5,160 - - 5,160 Other - 37 - 37 Total assets at fair value $ 5,787 $ 37 $ - $ 5,824
There have been no transfers in or out of Level 3 during the three months ended September 30, 2017 and 2016, respectively.
Assets and liabilities measured at fair value on a nonrecurring basis
The Company measures its assets at fair value on a nonrecurring basis when they are deemed to be other-than-temporarilyimpaired. The Company has no liabilities that are measured at fair value on a nonrecurring basis. The Company reviews thecarrying values of its assets when events and circumstances warrant and considers all available evidence in evaluating whendeclines in fair value are other-than-temporary. The fair values of the Company’s assets are determined using the best informationavailable, and may include quoted market prices, market comparables, and discounted cash flow projections. An impairment chargeis recorded when the cost of the assets exceeds its fair value and the excess is determined to be other-than-temporary. The Companyhas not recorded any impairment charges during the reporting periods presented herein.
11
6. Equity-accounted investments and other long-term assets
Equity-accounted investments
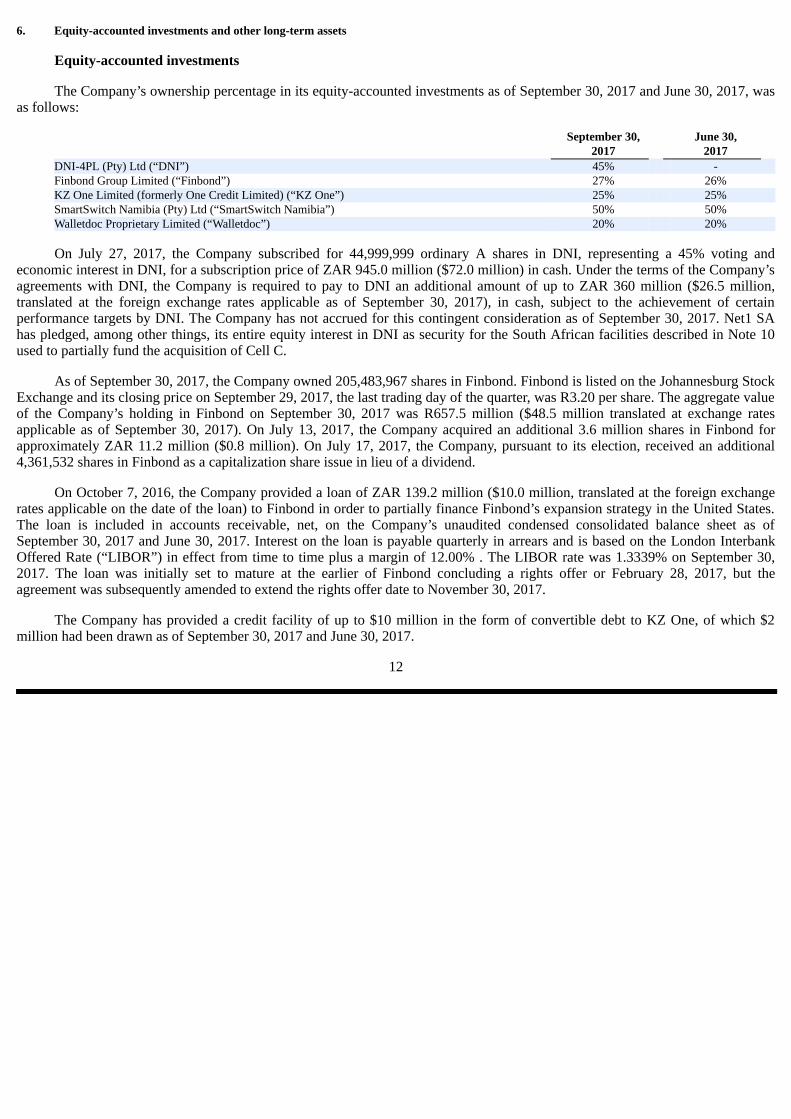
The Company’s ownership percentage in its equity-accounted investments as of September 30, 2017 and June 30, 2017, wasas follows:
September 30, June 30, 2017 2017 DNI-4PL (Pty) Ltd (“DNI”) 45% - Finbond Group Limited (“Finbond”) 27% 26% KZ One Limited (formerly One Credit Limited) (“KZ One”) 25% 25% SmartSwitch Namibia (Pty) Ltd (“SmartSwitch Namibia”) 50% 50% Walletdoc Proprietary Limited (“Walletdoc”) 20% 20%
On July 27, 2017, the Company subscribed for 44,999,999 ordinary A shares in DNI, representing a 45% voting andeconomic interest in DNI, for a subscription price of ZAR 945.0 million ($72.0 million) in cash. Under the terms of the Company’sagreements with DNI, the Company is required to pay to DNI an additional amount of up to ZAR 360 million ($26.5 million,translated at the foreign exchange rates applicable as of September 30, 2017), in cash, subject to the achievement of certainperformance targets by DNI. The Company has not accrued for this contingent consideration as of September 30, 2017. Net1 SAhas pledged, among other things, its entire equity interest in DNI as security for the South African facilities described in Note 10used to partially fund the acquisition of Cell C.
As of September 30, 2017, the Company owned 205,483,967 shares in Finbond. Finbond is listed on the Johannesburg StockExchange and its closing price on September 29, 2017, the last trading day of the quarter, was R3.20 per share. The aggregate valueof the Company’s holding in Finbond on September 30, 2017 was R657.5 million ($48.5 million translated at exchange ratesapplicable as of September 30, 2017). On July 13, 2017, the Company acquired an additional 3.6 million shares in Finbond forapproximately ZAR 11.2 million ($0.8 million). On July 17, 2017, the Company, pursuant to its election, received an additional4,361,532 shares in Finbond as a capitalization share issue in lieu of a dividend.
On October 7, 2016, the Company provided a loan of ZAR 139.2 million ($10.0 million, translated at the foreign exchangerates applicable on the date of the loan) to Finbond in order to partially finance Finbond’s expansion strategy in the United States.The loan is included in accounts receivable, net, on the Company’s unaudited condensed consolidated balance sheet as ofSeptember 30, 2017 and June 30, 2017. Interest on the loan is payable quarterly in arrears and is based on the London InterbankOffered Rate (“LIBOR”) in effect from time to time plus a margin of 12.00% . The LIBOR rate was 1.3339% on September 30,2017. The loan was initially set to mature at the earlier of Finbond concluding a rights offer or February 28, 2017, but theagreement was subsequently amended to extend the rights offer date to November 30, 2017.
The Company has provided a credit facility of up to $10 million in the form of convertible debt to KZ One, of which $2million had been drawn as of September 30, 2017 and June 30, 2017.
12

6. Equity-accounted investments and other long-term assets (continued)
Equity-accounted investments (continued)
Summarized below is the movement in equity-accounted investments during the three months ended September 30, 2017:
DNI Finbond KZ One Other(1) Total Investment in equity: Balance as of June 30, 2017 $ - $ 18,961 $ 5,945 $ 797 $ 25,703 Acquisition of shares 72,001 1,941 - - 73,942 Stock-based compensation - (207) - - (207) Comprehensive income (loss): 865 874 (54) 163 1,848 Other comprehensive loss - (227) - - (227) Equity accounted earnings (loss) 865 1,101 (54) 163 2,075 Share of net income (loss) 1,408 1,931 (54) 163 3,448 Amortization of acquired intangible assets (753) - - - (753) Deferred taxes on acquired intangible assets 210 - - - 210 Dilution resulting from corporate transactions - (830) - - (830) Dividends received (616) (1,096) - (296) (2,008) Foreign currency adjustment(2) (2,327) (767) (502) (33) (3,629) Balance as of September 30, 2017 $ 69,923 $ 19,706 $ 5,389 $ 631 $ 95,649 Investment in loans: Balance as of June 30, 2017 $ - $ - $ 2,000 $ 159 $ 2,159 Foreign currency adjustment(2) - - - (6) (6) Balance as of September 30, 2017 $ 0 $ 0 $ 2,000 $ 153 $ 2,153 Equity Loans Total Carrying amount as of: June 30, 2017 $ 25,703 $ 2,159 $ 27,862 September 30, 2017 $ 95,649 $ 2,153 $ 97,802
(1) Includes SmartSwitch Namibia and Walletdoc; (2) The foreign currency adjustment represents the effects of the fluctuations South African rand, Nigerian Naira and the Namibiandollar, and the U.S. dollar on the carrying value.
Strategic investment
Bank Frick
On October 2, 2017, the Company acquired a 30% interest in Bank Frick & Co AG (“Bank Frick”), a fully licensed bankbased in Balzers, Liechtenstein, from the Kuno Frick Family Foundation (“Frick Foundation”) for approximately CHF 39.8 million($40.8 million translated at exchange rates applicable as of September 30, 2017). Following the successful completion of thisinvestment, the Company has a two-year option to acquire an additional 35% interest in Bank Frick.
Bank Frick provides a complete suite of banking services, with one of its key strategic pillars being the provision of paymentservices and funding of financial technology opportunities. Bank Frick holds acquiring licenses from both Visa and MasterCard andoperates a branch in London. The Company and Bank Frick have jointly identified several funding opportunities, including for theCompany’s working capital finance, card issuing and acquiring and transaction processing activities. The investment in Bank Frickhas the potential to provide the Company with a stable, long term and strategic relationship with a fully licensed bank. TheCompany and Bank Frick have agreed that approximately $30 million of the Bank Frick’s free equity will be utilized as seed capitalfor a fund dedicated to the Company’s future activities.
13
6. Equity-accounted investments and other long-term assets (continued)
Other long-term assets
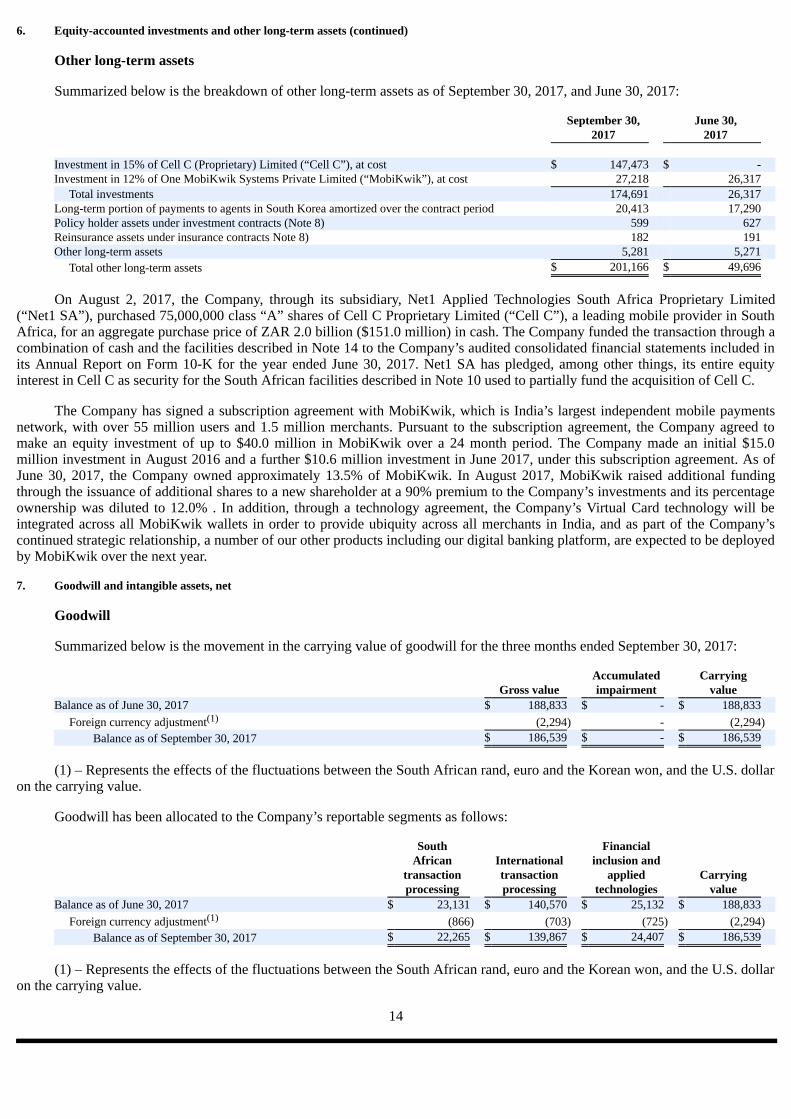
Summarized below is the breakdown of other long-term assets as of September 30, 2017, and June 30, 2017:
September 30, June 30, 2017 2017 Investment in 15% of Cell C (Proprietary) Limited (“Cell C”), at cost $ 147,473 $ - Investment in 12% of One MobiKwik Systems Private Limited (“MobiKwik”), at cost 27,218 26,317 Total investments 174,691 26,317 Long-term portion of payments to agents in South Korea amortized over the contract period 20,413 17,290 Policy holder assets under investment contracts (Note 8) 599 627 Reinsurance assets under insurance contracts Note 8) 182 191 Other long-term assets 5,281 5,271 Total other long-term assets $ 201,166 $ 49,696
On August 2, 2017, the Company, through its subsidiary, Net1 Applied Technologies South Africa Proprietary Limited(“Net1 SA”), purchased 75,000,000 class “A” shares of Cell C Proprietary Limited (“Cell C”), a leading mobile provider in SouthAfrica, for an aggregate purchase price of ZAR 2.0 billion ($151.0 million) in cash. The Company funded the transaction through acombination of cash and the facilities described in Note 14 to the Company’s audited consolidated financial statements included inits Annual Report on Form 10-K for the year ended June 30, 2017. Net1 SA has pledged, among other things, its entire equityinterest in Cell C as security for the South African facilities described in Note 10 used to partially fund the acquisition of Cell C.
The Company has signed a subscription agreement with MobiKwik, which is India’s largest independent mobile paymentsnetwork, with over 55 million users and 1.5 million merchants. Pursuant to the subscription agreement, the Company agreed tomake an equity investment of up to $40.0 million in MobiKwik over a 24 month period. The Company made an initial $15.0million investment in August 2016 and a further $10.6 million investment in June 2017, under this subscription agreement. As ofJune 30, 2017, the Company owned approximately 13.5% of MobiKwik. In August 2017, MobiKwik raised additional fundingthrough the issuance of additional shares to a new shareholder at a 90% premium to the Company’s investments and its percentageownership was diluted to 12.0% . In addition, through a technology agreement, the Company’s Virtual Card technology will beintegrated across all MobiKwik wallets in order to provide ubiquity across all merchants in India, and as part of the Company’scontinued strategic relationship, a number of our other products including our digital banking platform, are expected to be deployedby MobiKwik over the next year.
7. Goodwill and intangible assets, net
Goodwill
Summarized below is the movement in the carrying value of goodwill for the three months ended September 30, 2017:
Accumulated Carrying Gross value impairment value Balance as of June 30, 2017 $ 188,833 $ - $ 188,833 Foreign currency adjustment(1) (2,294) - (2,294) Balance as of September 30, 2017 $ 186,539 $ - $ 186,539
(1) – Represents the effects of the fluctuations between the South African rand, euro and the Korean won, and the U.S. dollaron the carrying value.
Goodwill has been allocated to the Company’s reportable segments as follows:
South Financial African International inclusion and transaction transaction applied Carrying processing processing technologies value Balance as of June 30, 2017 $ 23,131 $ 140,570 $ 25,132 $ 188,833 Foreign currency adjustment(1) (866) (703) (725) (2,294) Balance as of September 30, 2017 $ 22,265 $ 139,867 $ 24,407 $ 186,539
(1) – Represents the effects of the fluctuations between the South African rand, euro and the Korean won, and the U.S. dollaron the carrying value.
14

7. Goodwill and intangible assets, net (continued)
Intangible assets, net
Carrying value and amortization of intangible assets
Summarized below is the carrying value and accumulated amortization of the intangible assets as of September 30, 2017 andJune 30, 2017:
As of September 30, 2017 As of June 30, 2017 Gross Net Gross Net carrying Accumulated carrying carrying Accumulated carrying value amortization value value amortization value Finite-lived intangible assets: Customer relationships $ 98,124 ($67,181) $ 30,943 $ 99,209 $ (65,595) $ 33,614 Software and unpatented technology 32,834 (30,974) 1,860 33,273 (31,112) 2,161 FTS patent 2,825 (2,825) - 2,935 (2,935) - Exclusive licenses 4,506 (4,506) - 4,506 (4,506) - Trademarks 6,863 (4,884) 1,979 6,972 (4,759) 2,213 Total finite-lived intangible assets 145,152 (110,370) 34,782 146,895 (108,907) 37,988 Indefinite-lived intangible assets: Financial institution license 802 - 802 776 - 776 Total indefinite-lived intangible assets 802 - 802 776 - 776 Total intangible assets $ 145,954 $ (110,370) $ 35,584 $ 147,671 $ (108,907) $ 38,764
Aggregate amortization expense on the finite-lived intangible assets for the three months ended September 30, 2017 and2016, was approximately $2.8 million and $2.9 million, respectively.
Future estimated annual amortization expense for the next five fiscal years and thereafter, assuming exchange rates thatprevailed on September 30, 2017, is presented in the table below. Actual amortization expense in future periods could differ fromthis estimate as a result of acquisitions, changes in useful lives, exchange rate fluctuations and other relevant factors.
Fiscal 2018 $ 12,173 Fiscal 2019 10,728 Fiscal 2020 10,027 Fiscal 2021 4,350 Fiscal 2022 74 Thereafter 301 Total future estimated annual amortization expense $ 37,653
8. Reinsurance assets and policyholder liabilities under insurance and investment contracts
Reinsurance assets and policyholder liabilities under insurance contracts
Summarized below is the movement in reinsurance assets and policyholder liabilities under insurance contracts during thethree months ended September 30, 2017:
Reinsurance Insurance assets(1) contracts(2)
Balance as of June 30, 2017 $ 191 $ (1,611) Increase in policyholder benefits under insurance contracts (556) (2,502) Claims and policyholders’ benefits under insurance contracts . 555 2,421 Foreign currency adjustment(3) (8) 60 Balance as of September 30, 2017 $ 182 $ (1,632)
(1) Included in other long-term assets. (2) Included in other long-term liabilities. (3) Represents the effects of the fluctuations between the ZAR against the U.S. dollar.
15
8. Reinsurance assets and policyholder liabilities under insurance and investment contracts (continued)
Reinsurance assets and policyholder liabilities under insurance contracts (continued)
The Company has agreements with reinsurance companies in order to limit its losses from large insurance contracts,however, if the reinsurer is unable to meet its obligations, the Company retains the liability.
The Company determines its reserves for policy benefits under its life insurance products using a model which estimatesclaims incurred that have not been reported at the balance sheet date. This model includes best estimate assumptions of experienceplus prescribed margins, as required in the markets in which these products are offered, namely South Africa. The best estimateassumptions include those assumptions related to mortality, morbidity and claim reporting delays, and the main assumptions usedto calculate the reserve for policy benefits include (i) mortality and morbidity assumptions reflecting the company’s most recentexperience and (ii) claim reporting delays reflecting Company specific and industry experience. The values of matured guaranteedendowments were increased by late payment interest (net of the asset management fee and allowance for tax on investmentincome).
Assets and policyholder liabilities under investment contracts
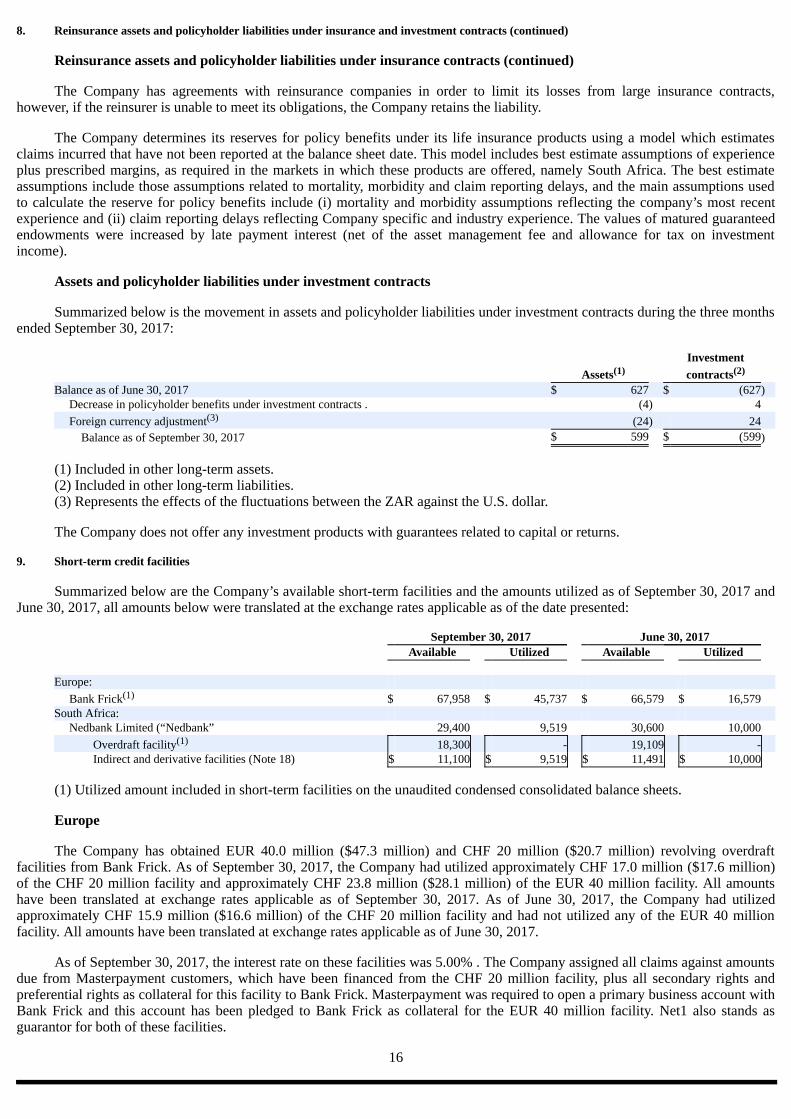
Summarized below is the movement in assets and policyholder liabilities under investment contracts during the three monthsended September 30, 2017:
Investment Assets(1) contracts(2)
Balance as of June 30, 2017 $ 627 $ (627) Decrease in policyholder benefits under investment contracts . (4) 4 Foreign currency adjustment(3) (24) 24 Balance as of September 30, 2017 $ 599 $ (599)
(1) Included in other long-term assets. (2) Included in other long-term liabilities. (3) Represents the effects of the fluctuations between the ZAR against the U.S. dollar.
The Company does not offer any investment products with guarantees related to capital or returns.
9. Short-term credit facilities
Summarized below are the Company’s available short-term facilities and the amounts utilized as of September 30, 2017 andJune 30, 2017, all amounts below were translated at the exchange rates applicable as of the date presented:
September 30, 2017 June 30, 2017 Available Utilized Available Utilized Europe: Bank Frick(1) $ 67,958 $ 45,737 $ 66,579 $ 16,579 South Africa: Nedbank Limited (“Nedbank” 29,400 9,519 30,600 10,000 Overdraft facility(1) 18,300 - 19,109 - Indirect and derivative facilities (Note 18) $ 11,100 $ 9,519 $ 11,491 $ 10,000
(1) Utilized amount included in short-term facilities on the unaudited condensed consolidated balance sheets.
Europe
The Company has obtained EUR 40.0 million ($47.3 million) and CHF 20 million ($20.7 million) revolving overdraftfacilities from Bank Frick. As of September 30, 2017, the Company had utilized approximately CHF 17.0 million ($17.6 million)of the CHF 20 million facility and approximately CHF 23.8 million ($28.1 million) of the EUR 40 million facility. All amountshave been translated at exchange rates applicable as of September 30, 2017. As of June 30, 2017, the Company had utilizedapproximately CHF 15.9 million ($16.6 million) of the CHF 20 million facility and had not utilized any of the EUR 40 millionfacility. All amounts have been translated at exchange rates applicable as of June 30, 2017.
As of September 30, 2017, the interest rate on these facilities was 5.00% . The Company assigned all claims against amountsdue from Masterpayment customers, which have been financed from the CHF 20 million facility, plus all secondary rights andpreferential rights as collateral for this facility to Bank Frick. Masterpayment was required to open a primary business account withBank Frick and this account has been pledged to Bank Frick as collateral for the EUR 40 million facility. Net1 also stands asguarantor for both of these facilities.
16

9. Short-term credit facilities (continued)
Europe (continued)
The initial term of the EUR 40 million facility ends on December 31, 2019 and will automatically be extended for oneadditional year if not terminated with 12 months written notice. The CHF 20 million facility does not have a fixed term; however, itmay be terminated by either party at the end of a calendar month with six months written notice.
South Africa
The aggregate amount of the Company’s short-term South African credit facility with Nedbank Limited (“Nedbank”) wasZAR 400 million ($29.4 million) and consists of (i) a primary amount of up to ZAR 200 million ($14.7 million, and (ii) asecondary amount of up to ZAR 200 million ($14.7 million) (all amounts denominated in ZAR and translated at exchange ratesapplicable as of September 30, 2017). The primary amount comprises an overdraft facility of up to ZAR 50 million ($3.6 million)and indirect and derivative facilities of up to ZAR 150 million ($11.1 million), which include letters of guarantee, letters of creditand forward exchange contracts (all amounts denominated in ZAR and translated at exchange rates applicable as of September 30,2017).
As of September 30, 2017, the interest rate on the overdraft facility was 9.10% . The Company has ceded its investment inCash Paymaster Services Proprietary Limited (“CPS”), a South African subsidiary, as security for its repayment obligations underthe facility. A commitment fee of 0.35% per annum is payable on the monthly unutilized amount of the overdraft portion of theshort-term facility. The Company is required to comply with customary non-financial covenants, including, without limitation,covenants that restrict its ability to dispose of or encumber its assets, incur additional indebtedness or engage in certain businesscombinations.
As of each of September 30, 2017 and June 30, 2017, respectively, the Company had not utilized any of its overdraft facility.As of September 30, 2017, the Company had utilized approximately ZAR 129.1 million ($9.5 million, translated at exchange ratesapplicable as of September 30, 2017) of its ZAR 150 million indirect and derivative facilities to obtain foreign exchange contractsfrom the bank and to enable the bank to issue guarantees, including stand-by letters of credit, in order for the Company to honor itsobligations to third parties requiring such guarantees (refer to Note 18). As of June 30, 2017, the Company had utilizedapproximately ZAR 130.5 million ($10.0 million, translated at exchange rates applicable as of June 30, 2017) of its ZAR 150million indirect and derivative facilities.
10. Long-term borrowings
South Africa
The Company’s South African long-term facility agreement is described in Note 14 to the Company’s audited consolidatedfinancial statements included in its Annual Report on Form 10-K for the year ended June 30, 2017. As of September 30, 2017,$77.9 million was outstanding under the Company’s South African long-term facility agreement, and the carrying amount of thelong-term borrowings approximated fair value. The JIBAR rate has been set at 6.99% for the period to December 29, 2017.
On July 26, 2017, the Company utilized ZAR 1.25 billion (approximately $92.2 million) of its South African long-termfacility to partially fund the acquisition of 15% of Cell C. Principal repayments on the facilities are due in eight quarterlyinstallments commencing on September 29, 2017. The next scheduled principal payment of $13.8 million will be made onDecember 29, 2017. All amounts translated at exchange rates applicable as of September 30, 2017.
The Company paid a non-refundable deal origination fee of approximately ZAR 6.3 million ($0.6 million) in August 2017.Interest expense incurred during the three months ended September 30, 2017, was $1.7 million. During the three months endedSeptember 30, 2017, $0.1 million of prepaid facility fees were amortized.
South Korea
The South Korean senior secured loan facility is described in Note 14 to the Company’s audited consolidated financialstatements included in its Annual Report on Form 10-K for the year ended June 30, 2017. As of September 30, 2017, $16.3 millionwas outstanding under the Company’s South Korean senior secured loan facility, and the carrying amount of the long-termborrowings approximated fair value. The interest rate in effect on September 30, 2017 was 4.51% .
On July 29, 2017, the Company utilized approximately KRW 0.3 billion ($0.3 million) of its Facility C revolving creditfacility under the Company’s South African long-term facility agreement to pay interest due on the Company’s South Koreansenior secured loan facility. The next scheduled principal payment of $8.7 million (translated at exchange rates applicable as ofSeptember 30, 2017) was due on April 29, 2018, however, the Company settled the full outstanding balance, including interest,related to these borrowings on October 20, 2017.
17
10. Long-term borrowings (continued)
South Korea (continued)
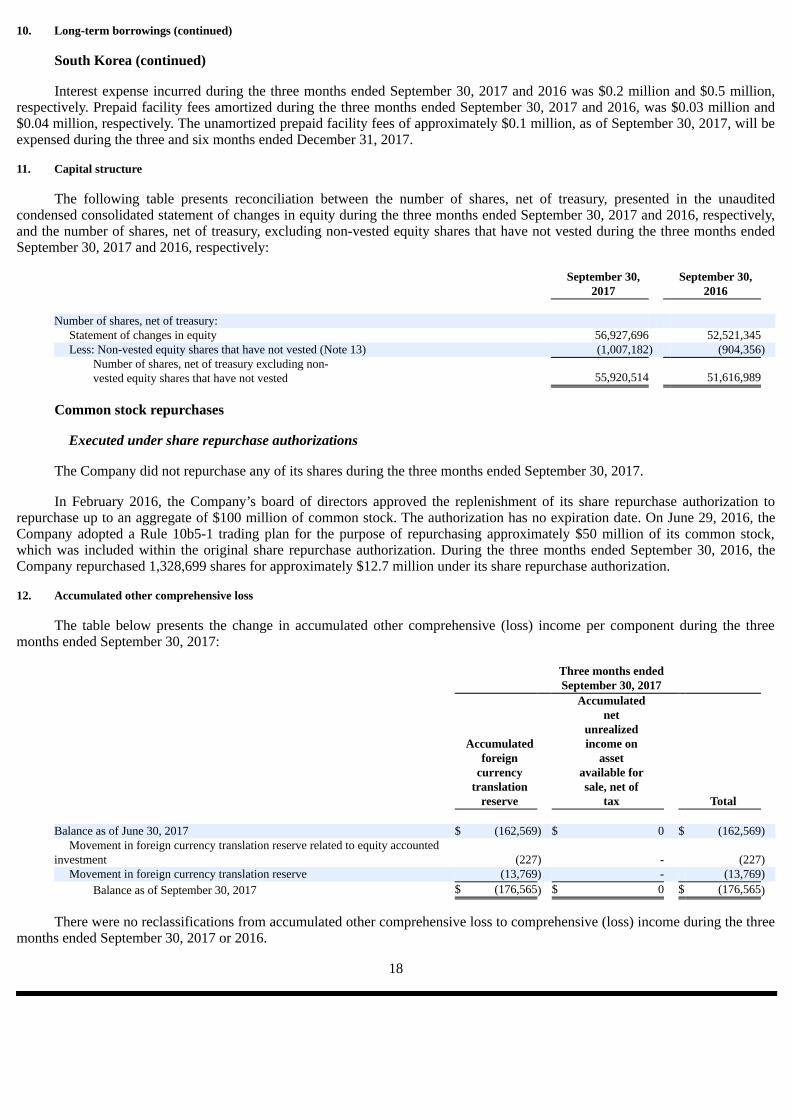
Interest expense incurred during the three months ended September 30, 2017 and 2016 was $0.2 million and $0.5 million,respectively. Prepaid facility fees amortized during the three months ended September 30, 2017 and 2016, was $0.03 million and$0.04 million, respectively. The unamortized prepaid facility fees of approximately $0.1 million, as of September 30, 2017, will beexpensed during the three and six months ended December 31, 2017.
11. Capital structure
The following table presents reconciliation between the number of shares, net of treasury, presented in the unauditedcondensed consolidated statement of changes in equity during the three months ended September 30, 2017 and 2016, respectively,and the number of shares, net of treasury, excluding non-vested equity shares that have not vested during the three months endedSeptember 30, 2017 and 2016, respectively:
September 30, September 30, 2017 2016 Number of shares, net of treasury: Statement of changes in equity 56,927,696 52,521,345 Less: Non-vested equity shares that have not vested (Note 13) (1,007,182) (904,356) Number of shares, net of treasury excluding non-
vested equity shares that have not vested 55,920,514 51,616,989
Common stock repurchases
Executed under share repurchase authorizations
The Company did not repurchase any of its shares during the three months ended September 30, 2017.
In February 2016, the Company’s board of directors approved the replenishment of its share repurchase authorization torepurchase up to an aggregate of $100 million of common stock. The authorization has no expiration date. On June 29, 2016, theCompany adopted a Rule 10b5-1 trading plan for the purpose of repurchasing approximately $50 million of its common stock,which was included within the original share repurchase authorization. During the three months ended September 30, 2016, theCompany repurchased 1,328,699 shares for approximately $12.7 million under its share repurchase authorization.
12. Accumulated other comprehensive loss
The table below presents the change in accumulated other comprehensive (loss) income per component during the threemonths ended September 30, 2017:
Three months ended September 30, 2017 Accumulated net unrealized Accumulated income on foreign asset currency available for translation sale, net of reserve tax Total Balance as of June 30, 2017 $ (162,569) $ 0 $ (162,569) Movement in foreign currency translation reserve related to equity accounted
investment (227) - (227) Movement in foreign currency translation reserve (13,769) - (13,769) Balance as of September 30, 2017 $ (176,565) $ 0 $ (176,565)
There were no reclassifications from accumulated other comprehensive loss to comprehensive (loss) income during the threemonths ended September 30, 2017 or 2016.
18

13. Stock-based compensation
Stock option and restricted stock activity
Options
The following table summarizes stock option activity for the three months ended September 30, 2017 and 2016:
Weighted Weighted average Weighted average remaining Aggregate average exercise contractual intrinsic grant date Number of price term value fair value shares ($) (in years) ($’000) ($) Outstanding – June 30, 2017 846,607 13.87 3.80 486 Forfeitures (37,333) 11.23 Outstanding – September 30, 2017 809,274 13.99 3.40 468 Outstanding – June 30, 2016 2,077,524 15.92 3.65 926 Expired unexercised (474,443) 22.51 Outstanding – September 30, 2016 1,603,081 13.98 4.50 452
No stock options were awarded during the three months ended September 30, 2017 or 2016. During the three months endedSeptember 30, 2017, employees forfeited 37,333 stock options. There were no forfeitures during the three months ended September30, 2016; however, during the three months ended September 30, 2016, 474,443 stock options awarded in August 2006, expiredunexercised.
The following table presents stock options vested and expecting to vest as of September 30, 2017:
Weighted Weighted average average remaining Aggregate exercise contractual intrinsic Number of price term value shares ($) (in years) ($’000) Vested and expecting to vest – September 30, 2017 809,274 13.99 3.40 468
These options have an exercise price range of $7.35 to $24.46.
The following table presents stock options that are exercisable as of September 30, 2017:
Weighted Weighted average average remaining Aggregate exercise contractual intrinsic Number of price term value shares ($) (in years) ($’000) Exercisable – September 30, 2017 809,274 13.99 3.40 468
During the three months ended September 30, 2017 and 2016, respectively, 105,982 and 154,803 stock options becameexercisable. No stock options were exercised during the three months ended September 30, 2017 and 2016. The Company issuesnew shares to satisfy stock option exercises.
19
13. Stock-based compensation (continued)
Stock option and restricted stock activity (continued)
Restricted stock (continued)
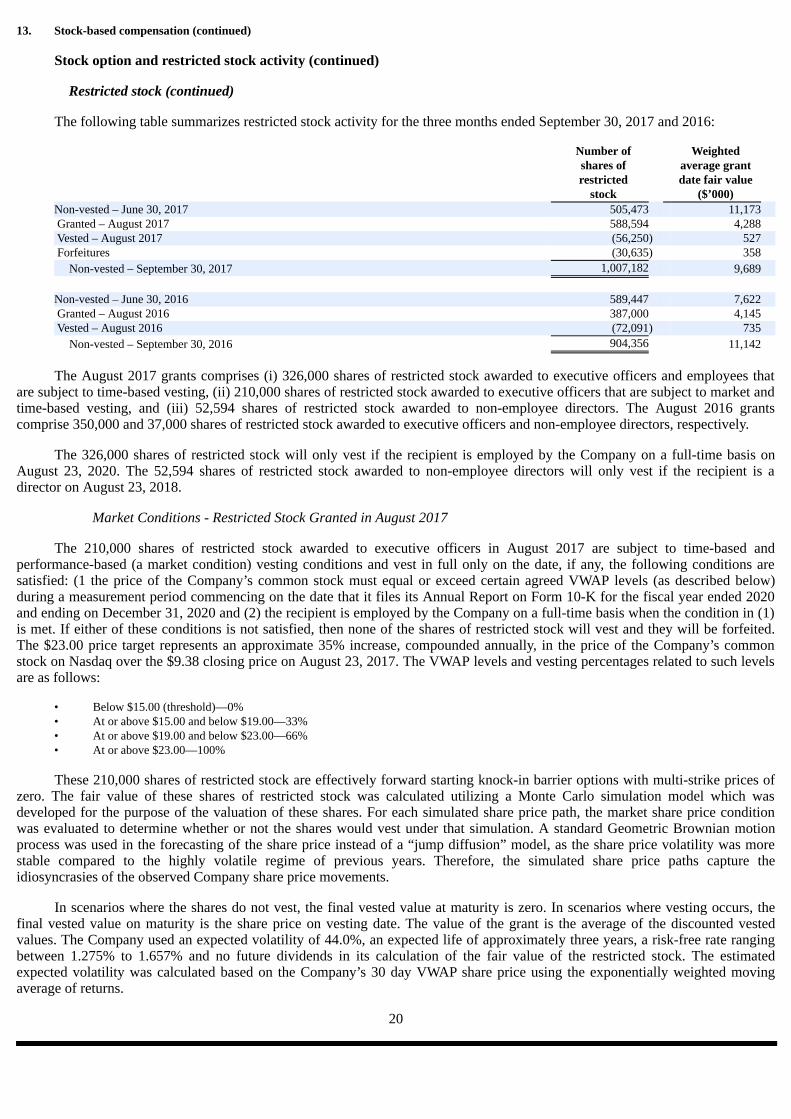
The following table summarizes restricted stock activity for the three months ended September 30, 2017 and 2016:
Number of Weighted shares of average grant restricted date fair value stock ($’000) Non-vested – June 30, 2017 505,473 11,173 Granted – August 2017 588,594 4,288 Vested – August 2017 (56,250) 527 Forfeitures (30,635) 358 Non-vested – September 30, 2017 1,007,182 9,689 Non-vested – June 30, 2016 589,447 7,622 Granted – August 2016 387,000 4,145 Vested – August 2016 (72,091) 735 Non-vested – September 30, 2016 904,356 11,142
The August 2017 grants comprises (i) 326,000 shares of restricted stock awarded to executive officers and employees thatare subject to time-based vesting, (ii) 210,000 shares of restricted stock awarded to executive officers that are subject to market andtime-based vesting, and (iii) 52,594 shares of restricted stock awarded to non-employee directors. The August 2016 grantscomprise 350,000 and 37,000 shares of restricted stock awarded to executive officers and non-employee directors, respectively.
The 326,000 shares of restricted stock will only vest if the recipient is employed by the Company on a full-time basis onAugust 23, 2020. The 52,594 shares of restricted stock awarded to non-employee directors will only vest if the recipient is adirector on August 23, 2018.
Market Conditions - Restricted Stock Granted in August 2017
The 210,000 shares of restricted stock awarded to executive officers in August 2017 are subject to time-based andperformance-based (a market condition) vesting conditions and vest in full only on the date, if any, the following conditions aresatisfied: (1 the price of the Company’s common stock must equal or exceed certain agreed VWAP levels (as described below)during a measurement period commencing on the date that it files its Annual Report on Form 10-K for the fiscal year ended 2020and ending on December 31, 2020 and (2) the recipient is employed by the Company on a full-time basis when the condition in (1)is met. If either of these conditions is not satisfied, then none of the shares of restricted stock will vest and they will be forfeited.The $23.00 price target represents an approximate 35% increase, compounded annually, in the price of the Company’s commonstock on Nasdaq over the $9.38 closing price on August 23, 2017. The VWAP levels and vesting percentages related to such levelsare as follows:
• Below $15.00 (threshold)—0% • At or above $15.00 and below $19.00—33% • At or above $19.00 and below $23.00—66% • At or above $23.00—100%
These 210,000 shares of restricted stock are effectively forward starting knock-in barrier options with multi-strike prices ofzero. The fair value of these shares of restricted stock was calculated utilizing a Monte Carlo simulation model which wasdeveloped for the purpose of the valuation of these shares. For each simulated share price path, the market share price conditionwas evaluated to determine whether or not the shares would vest under that simulation. A standard Geometric Brownian motionprocess was used in the forecasting of the share price instead of a “jump diffusion” model, as the share price volatility was morestable compared to the highly volatile regime of previous years. Therefore, the simulated share price paths capture theidiosyncrasies of the observed Company share price movements.
In scenarios where the shares do not vest, the final vested value at maturity is zero. In scenarios where vesting occurs, thefinal vested value on maturity is the share price on vesting date. The value of the grant is the average of the discounted vestedvalues. The Company used an expected volatility of 44.0%, an expected life of approximately three years, a risk-free rate rangingbetween 1.275% to 1.657% and no future dividends in its calculation of the fair value of the restricted stock. The estimatedexpected volatility was calculated based on the Company’s 30 day VWAP share price using the exponentially weighted movingaverage of returns.
20

13. Stock-based compensation (continued)
Stock option and restricted stock activity (continued)
Restricted stock (continued)
Performance Conditions - Restricted Stock Granted in August 2016
In August 2016 the Company awarded 350,000 shares of restricted stock to executive officers. In May 2017, the Companyagreed to accelerate the vesting of 200,000 of these shares of restricted stock granted to the Company’s former Chief ExecutiveOfficer. These remaining 150,000 shares continue to be subject to time-based and performance-based vesting conditions. In orderfor any of the shares to vest, the recipient must remain employed by the Company on a full-time basis on the date that it files itsAnnual Report on Form 10-K for the fiscal year ended June 30, 2019. If that condition is satisfied, then the shares will vest basedon the level of Fundamental EPS the Company achieves for the fiscal year ended June 30, 2019 (“2019 Fundamental EPS”), asfollows:
• One-third of the shares will vest if the Company achieves 2019 Fundamental EPS of $2.60; • Two-thirds of the shares will vest if the Company achieves 2019 Fundamental EPS of $2.80; and • All of the shares will vest if the Company achieves 2019 Fundamental EPS of $3.00.
At levels of 2019 Fundamental EPS greater than $2.60 and less than $3.00, the number of shares that will vest will bedetermined by linear interpolation relative to 2019 Fundamental EPS of $2.80. Any shares that do not vest in accordance with theabove-described conditions will be forfeited. All shares of restricted stock have been valued utilizing the closing price of shares ofthe Company’s common stock quoted on The Nasdaq Global Select Market on the date of grant.
Performance Conditions - Restricted Stock Granted in August 2015
In August 2015 the Company awarded 301,537 shares of restricted stock to executive officers and employees. These sharesof restricted stock are subject to time-based and performance-based vesting conditions. In order for any of the shares to vest, therecipient must remain employed by the Company on a full-time basis on the date that it files its Annual Report on Form 10-K forthe fiscal year ended June 30, 2018. If that condition is satisfied, then the shares will vest based on the level of Fundamental EPSthe Company achieves for the fiscal year ended June 30, 2018 (“2018 Fundamental EPS”), as follows:
• One-third of the shares will vest if the Company achieves 2018 Fundamental EPS of $2.88; • Two-thirds of the shares will vest if the Company achieves 2018 Fundamental EPS of $3.30; and • All of the shares will vest if the Company achieves 2018 Fundamental EPS of $3.76.
At levels of 2018 Fundamental EPS greater than $2.88 and less than $3.76, the number of shares that will vest will bedetermined by linear interpolation relative to 2018 Fundamental EPS of $3.30. Any shares that do not vest in accordance with theabove-described conditions will be forfeited. All shares of restricted stock have been valued utilizing the closing price of shares ofthe Company’s common stock quoted on The Nasdaq Global Select Market on the date of grant. During the three months endedSeptember 30, 2016, the Company reversed the stock-based compensation charge recognized to date related to the 301,537 sharesof restricted stock because it believed that it was unlikely that the 2018 Fundamental EPS target would be achieved due to thedilutive impact on the fundamental EPS calculation as a result of issuance of the approximate 10 million shares to the IFC in May2016.
Vesting of all non-employee director shares issued prior to June 30, 2017
Grants of restricted stock to non-employee directors made during fiscal 2017, as well as those grants made in prior years,originally vested over a three-year period. After the end of fiscal 2017, the Company’s board consulted with Pay Governance, anindependent compensation consultant, and determined that one-year vesting of restricted stock grants is a more commoncompensation practice for independent directors and therefore, amended the terms of outstanding awards to vest one-year aftergrant. As a result of this amendment, 61,995 shares of restricted stock held by the non-employee directors as of June 30, 2017, werefully-vested.
The fair value of restricted stock vesting during the three months ended September 30, 2017 and 2016, respectively, was $0.5million and $0.7 million.
21

13. Stock-based compensation (continued)
Stock-based compensation charge and unrecognized compensation cost
The Company recorded a stock-based compensation charge (reversal) during the three months ended September 30, 2017and 2016 of $0.8 million and ($1.3 million), respectively, which comprised:
Allocated to cost of goods sold, IT Allocated to processing, selling, general Total servicing and and charge support administration
Three months ended September 30, 2017 Stock-based compensation charge $ 869 $ - $ 869 Reversal of stock compensation charge related to stock options forfeited (42) - (42) Total – three months ended September 30, 2017 $ 827 $ - $ 827 Three months ended September 30, 2016 Stock-based compensation charge $ 503 $ - $ 503 Reversal of stock compensation charge related to restricted stock (1,827) - (1,827) Total – three months ended September 30, 2016 $ (1,324) $ - $ (1,324)
The stock-based compensation charges have been allocated to selling, general and administration based on the allocation ofthe cash compensation paid to the employees.
As of September 30, 2017, the there was no unrecognized compensation cost related to stock options because all stockoptions granted have vested. As of September 30, 2017, the total unrecognized compensation cost related to restricted stock awardswas approximately $5.1 million, which the Company expects to recognize over approximately two years. This amount excludes thetotal unrecognized compensation cost as of September 30, 2017, of approximately $3.9 million, related to restricted stock awardsthat the Company expects will not vest due to it not achieving the 2018 Fundamental EPS. As of September 30, 2017, thecumulative unrecorded stock-based compensation charge related to these awards of restricted stock that the Company hasdetermined are expected not to vest and has not expensed in its consolidated statement of operations is approximately $2.9 million(which amount includes the $1.8 million reversed during the three months ended September 30, 2016).
As of September 30, 2017 and June 30, 2017, the Company recorded a deferred tax asset of approximately $0.6 million and$0.9 million, respectively, related to the stock-based compensation charge recognized related to employees of Net1. The Companydeducts the difference between the market value on date of exercise by the option recipient and the exercise price from incomesubject to taxation in the United States.
14. Earnings per share
The Company has issued redeemable common stock which is redeemable at an amount other than fair value. Redemption ofa class of common stock at other than fair value increases or decreases the carrying amount of the redeemable common stock and isreflected in basic earnings per share using the two-class method. There were no redemptions of common stock, or adjustments tothe carrying value of the redeemable common stock during the three months ended September 30, 2017 or 2016. Accordingly, thetwo-class method presented below does not include the impact of any redemption. The Company’s redeemable common stock isdescribed in Note 15 to the Company’s audited consolidated financial statements included in its Annual Report on Form 10-K forthe year ended June 30, 2017.
Basic earnings per share include shares of restricted stock that meet the definition of a participating security because theseshares are eligible to receive non-forfeitable dividend equivalents at the same rate as common stock. Basic earnings per share havebeen calculated using the two-class method and basic earnings per share for the three months ended September 30, 2017 and 2016,reflects only undistributed earnings. The computation below of basic earnings per share excludes the net income attributable toshares of unvested restricted stock (participating non-vested restricted stock) from the numerator and excludes the dilutive impactof these unvested shares of restricted stock from the denominator.
Diluted earnings per share have been calculated to give effect to the number of shares of additional common stock thatwould have been outstanding if the potential dilutive instruments had been issued in each period. Stock options are included in thecalculation of diluted earnings per share utilizing the treasury stock method and are not considered to be participating securities, asthe stock options do not contain non-forfeitable dividend rights.
22
14. Earnings per share (continued)
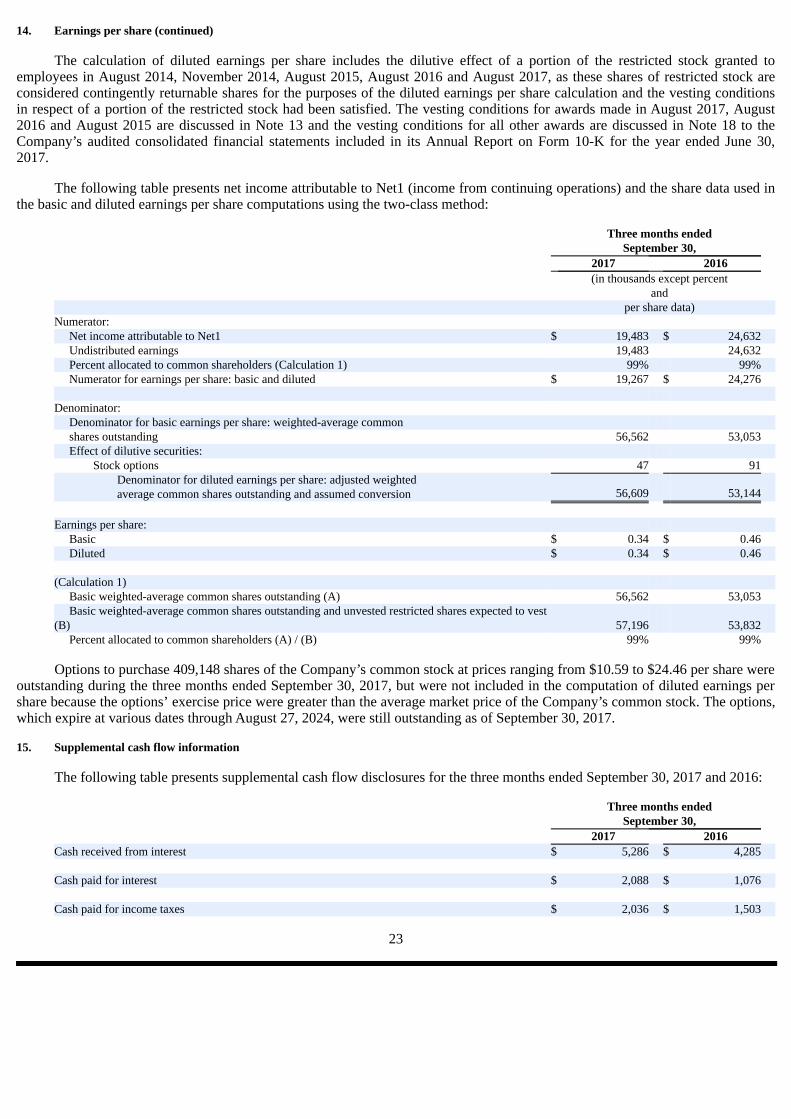
The calculation of diluted earnings per share includes the dilutive effect of a portion of the restricted stock granted toemployees in August 2014, November 2014, August 2015, August 2016 and August 2017, as these shares of restricted stock areconsidered contingently returnable shares for the purposes of the diluted earnings per share calculation and the vesting conditionsin respect of a portion of the restricted stock had been satisfied. The vesting conditions for awards made in August 2017, August2016 and August 2015 are discussed in Note 13 and the vesting conditions for all other awards are discussed in Note 18 to theCompany’s audited consolidated financial statements included in its Annual Report on Form 10-K for the year ended June 30,2017.
The following table presents net income attributable to Net1 (income from continuing operations) and the share data used inthe basic and diluted earnings per share computations using the two-class method:
Three months ended September 30, 2017 2016 (in thousands except percent and per share data) Numerator: Net income attributable to Net1 $ 19,483 $ 24,632 Undistributed earnings 19,483 24,632 Percent allocated to common shareholders (Calculation 1) 99% 99% Numerator for earnings per share: basic and diluted $ 19,267 $ 24,276 Denominator: Denominator for basic earnings per share: weighted-average common shares outstanding 56,562 53,053 Effect of dilutive securities: Stock options 47 91 Denominator for diluted earnings per share: adjusted weighted
average common shares outstanding and assumed conversion 56,609 53,144 Earnings per share: Basic $ 0.34 $ 0.46 Diluted $ 0.34 $ 0.46 (Calculation 1) Basic weighted-average common shares outstanding (A) 56,562 53,053 Basic weighted-average common shares outstanding and unvested restricted shares expected to vest
(B) 57,196 53,832 Percent allocated to common shareholders (A) / (B) 99% 99%
Options to purchase 409,148 shares of the Company’s common stock at prices ranging from $10.59 to $24.46 per share wereoutstanding during the three months ended September 30, 2017, but were not included in the computation of diluted earnings pershare because the options’ exercise price were greater than the average market price of the Company’s common stock. The options,which expire at various dates through August 27, 2024, were still outstanding as of September 30, 2017.
15. Supplemental cash flow information
The following table presents supplemental cash flow disclosures for the three months ended September 30, 2017 and 2016:
Three months ended September 30, 2017 2016 Cash received from interest $ 5,286 $ 4,285 Cash paid for interest $ 2,088 $ 1,076 Cash paid for income taxes $ 2,036 $ 1,503
23
15. Supplemental cash flow information (continued)
Treasury shares, at cost included in the Company’s condensed consolidated balance sheet as of June 30, 2016, includes47,056 shares of the Company’s common stock acquired for approximately $0.5 million which were paid for on July 1, 2016. Theliability for this payment was included in accounts payable on the Company’s condensed consolidated balance sheet as of June 30,2016. The payment of approximately $0.5 million is included in acquisition of treasury stock in the Company’s condensedconsolidated statement of cash flows for the three months ended September 30, 2016.
16. Operating segments
The Company discloses segment information as reflected in the management information systems reports that its chiefoperating decision maker uses in making decisions and to report certain entity-wide disclosures about products and services, majorcustomers, and the countries in which the entity holds material assets or reports material revenues. A description of the Company’soperating segments is contained in Note 23 to the Company’s audited consolidated financial statements included in its AnnualReport on Form 10-K for the year ended June 30, 2017.
The reconciliation of the reportable segments revenue to revenue from external customers for the three months endedSeptember 30, 2017 and 2016, is as follows:
Revenue From Reportable Inter- external Segment segment customers South African transaction processing $ 66,437 $ 6,145 $ 60,292 International transaction processing 46,022 - 46,022 Financial inclusion and applied technologies 54,313 8,069 46,244 Total for the three months ended September 30, 2017 $ 166,772 $ 14,214 $ 152,558 South African transaction processing $ 57,568 $ 5,401 $ 52,167 International transaction processing 46,190 - 46,190 Financial inclusion and applied technologies 63,542 6,266 57,276 Total for the three months ended September 30, 2016 $ 167,300 $ 11,667 $ 155,633
The Company does not allocate interest income, interest expense or income tax expense to its reportable segments. TheCompany evaluates segment performance based on segment operating income before acquisition-related intangible assetamortization which represents operating income before acquisition-related intangible asset amortization and allocation of expensesallocated to Corporate/Eliminations, all under GAAP. The reconciliation of the reportable segments measure of profit or loss toincome before income taxes for the three months ended September 30, 2017 and 2016, is as follows:
Three months ended September 30, 2017 2016 Reportable segments measure of profit or loss $ 31,568 $ 34,548 Operating income: Corporate/Eliminations (6,562) (2,367) Interest income 5,044 4,304 Interest expense (2,121) (796) Income before income taxes $ 27,929 $ 35,689
The following tables summarize segment information that is prepared in accordance with GAAP for the three months endedSeptember 30, 2017 and 2016:
Three months ended September 30, 2017 2016 Revenues South African transaction processing $ 66,437 $ 57,568 International transaction processing 46,022 46,190 Financial inclusion and applied technologies 54,313 63,542 Total $ 166,772 $ 167,300
24
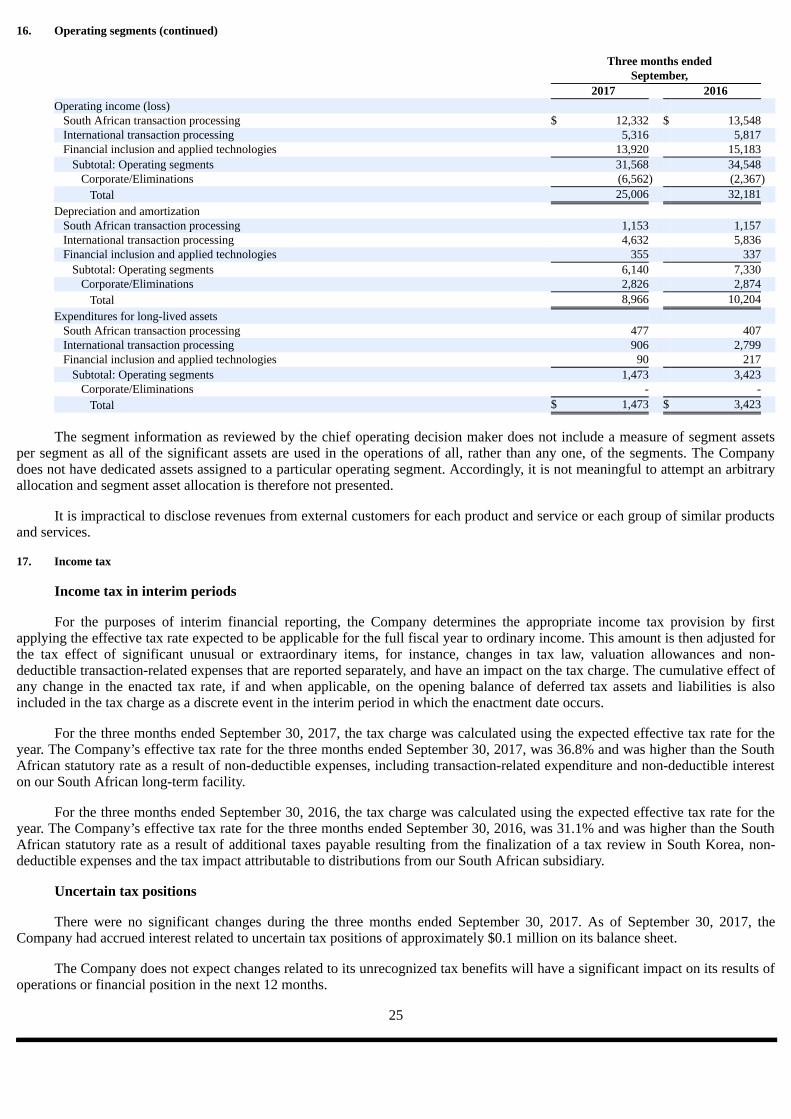
16. Operating segments (continued)
Three months ended September, 2017 2016 Operating income (loss) South African transaction processing $ 12,332 $ 13,548 International transaction processing 5,316 5,817 Financial inclusion and applied technologies 13,920 15,183 Subtotal: Operating segments 31,568 34,548 Corporate/Eliminations (6,562) (2,367) Total 25,006 32,181 Depreciation and amortization South African transaction processing 1,153 1,157 International transaction processing 4,632 5,836 Financial inclusion and applied technologies 355 337 Subtotal: Operating segments 6,140 7,330 Corporate/Eliminations 2,826 2,874 Total 8,966 10,204 Expenditures for long-lived assets South African transaction processing 477 407 International transaction processing 906 2,799 Financial inclusion and applied technologies 90 217 Subtotal: Operating segments 1,473 3,423 Corporate/Eliminations - - Total $ 1,473 $ 3,423
The segment information as reviewed by the chief operating decision maker does not include a measure of segment assetsper segment as all of the significant assets are used in the operations of all, rather than any one, of the segments. The Companydoes not have dedicated assets assigned to a particular operating segment. Accordingly, it is not meaningful to attempt an arbitraryallocation and segment asset allocation is therefore not presented.
It is impractical to disclose revenues from external customers for each product and service or each group of similar productsand services.
17. Income tax
Income tax in interim periods
For the purposes of interim financial reporting, the Company determines the appropriate income tax provision by firstapplying the effective tax rate expected to be applicable for the full fiscal year to ordinary income. This amount is then adjusted forthe tax effect of significant unusual or extraordinary items, for instance, changes in tax law, valuation allowances and non-deductible transaction-related expenses that are reported separately, and have an impact on the tax charge. The cumulative effect ofany change in the enacted tax rate, if and when applicable, on the opening balance of deferred tax assets and liabilities is alsoincluded in the tax charge as a discrete event in the interim period in which the enactment date occurs.
For the three months ended September 30, 2017, the tax charge was calculated using the expected effective tax rate for theyear. The Company’s effective tax rate for the three months ended September 30, 2017, was 36.8% and was higher than the SouthAfrican statutory rate as a result of non-deductible expenses, including transaction-related expenditure and non-deductible intereston our South African long-term facility.
For the three months ended September 30, 2016, the tax charge was calculated using the expected effective tax rate for theyear. The Company’s effective tax rate for the three months ended September 30, 2016, was 31.1% and was higher than the SouthAfrican statutory rate as a result of additional taxes payable resulting from the finalization of a tax review in South Korea, non-deductible expenses and the tax impact attributable to distributions from our South African subsidiary.
Uncertain tax positions
There were no significant changes during the three months ended September 30, 2017. As of September 30, 2017, theCompany had accrued interest related to uncertain tax positions of approximately $0.1 million on its balance sheet.
The Company does not expect changes related to its unrecognized tax benefits will have a significant impact on its results ofoperations or financial position in the next 12 months.
25

17. Income tax (continued)
Uncertain tax positions (continued)
As of September 30, 2017 and June 30, 2017, the Company had unrecognized tax benefits of $0.5 million and $0.5 million,respectively, all of which would impact the Company’s effective tax rate. The Company files income tax returns mainly in SouthAfrica, South Korea, Germany, Hong Kong, India, the United Kingdom, Botswana and in the U.S. federal jurisdiction. As ofSeptember 30, 2017, the Company’s South African subsidiaries are no longer subject to income tax examination by the SouthAfrican Revenue Service for periods before June 30, 2013. The Company is subject to income tax in other jurisdictions outsideSouth Africa, none of which are individually material to its financial position, statement of cash flows, or results of operations.
18. Commitments and contingencies
Guarantees
The South African Revenue Service and certain of the Company’s customers, suppliers and other business partners haveasked the Company to provide them with guarantees, including standby letters of credit, issued by a South African bank. TheCompany is required to procure these guarantees for these third parties to operate its business.
Nedbank has issued guarantees to these third parties amounting to ZAR 129.1 million ($9.5 million, translated at exchangerates applicable as of September 30, 2017) and thereby utilizing part of the Company’s short-term facility. The Company in turn hasprovided nonrecourse, unsecured counter-guarantees to Nedbank for ZAR 129.1 million ($9.5 million, translated at exchange ratesapplicable as of September 30, 2017). The Company pays commission of between 0.4% per annum to 2.0% per annum of the facevalue of these guarantees and does not recover any of the commission from third parties.
The Company has not recognized any obligation related to these counter-guarantees in its consolidated balance sheet as ofSeptember 30, 2017. The maximum potential amount that the Company could pay under these guarantees is ZAR 129.1 million($9.5 million, translated at exchange rates applicable as of September 30, 2017). The guarantees have reduced the amount availablefor borrowings under the Company’s short-term credit facility described in Note 9.
As described in Note 9, Net1 has specifically provided guarantees to Bank Frick related to the EUR 40.0 million ($47.3million) and CHF 20 million ($20.7 million) revolving overdraft facilities provided to Masterpayment. As of September 30, 2017,Masterpayment had utilized approximately $28.1 million of the EUR 40.0 million facility and $17.6 million of the CHF 20 millionfacility and these obligations are recorded as short-term facilities in the Company’s consolidated balance sheet. The maximumpotential amount that the Company could pay under the guarantees to Bank Frick was $45.7 million.
Contingencies
The Company is subject to a variety of insignificant claims and suits that arise from time to time in the ordinary course ofbusiness.
Management currently believes that the resolution of these matters, individually or in the aggregate, will not have a materialadverse impact on the Company’s financial position, results of operations or cash flows.
26
Item 2. Management’s Discussion and Analysis of Financial Condition and Results of Operations
The following discussion should be read in conjunction with our Annual Report on Form 10-K for the year ended June 30,2017, and the unaudited condensed consolidated financial statements and the accompanying notes included in this Form 10-Q.
Forward-looking statements
Some of the statements in this Form 10-Q constitute forward-looking statements. These statements relate to future events orour future financial performance and involve known and unknown risks, uncertainties and other factors that may cause our or ourindustry’s actual results, levels of activity, performance or achievements to be materially different from any future results, levels ofactivity, performance or achievements expressed, implied or inferred by these forward-looking statements. Such factors include,among other things, those listed under Item 1A.—“Risk Factors” and elsewhere in our Annual Report on Form 10-K for the yearended June 30, 2017. In some cases, you can identify forward-looking statements by terminology such as “may,” “will,” “should,”“could,” “would,” “expects,” “plans,” “intends,” “anticipates,” “believes,” “estimates,” “predicts,” “potential” or “continue” or thenegative of such terms and other comparable terminology.
Although we believe that the expectations reflected in the forward-looking statements are reasonable, we do not knowwhether we can achieve positive future results, levels of activity, performance, or goals. Actual events or results may differmaterially. We undertake no obligation to update any of the forward-looking statements after the date of this Form 10-Q to conformthose statements to reflect the occurrence of unanticipated events, except as required by applicable law.
You should read this Form 10-Q and the documents that we reference herein and the documents we have filed as exhibitshereto and thereto and which we have filed with the United States Securities and Exchange Commission completely and with theunderstanding that our actual future results, levels of activity, performance and achievements may be materially different from whatwe expect. We qualify all of our forward-looking statements by these cautionary statements.
Recent Developments
SASSA Update
Our current contract with SASSA is scheduled to expire on March 31, 2018. In accordance with the Constitutional Court’sorder to file quarterly progress reports, SASSA filed its second progress report with the court on September 15, 2017 and the expertpanel appointed by the court filed its first progress report with the court on September 14, 2017. We have provided the expert panelwith all the information required from us and we also met with the panel subsequent to the filing of its first report.
SASSA’s second progress report indicated that it is considering the appointment of the South African Post Office, or SAPO,to assist with certain aspects of the grant payment process, in accordance with a waiver obtained from the National Treasury ofSouth Africa to contract directly with another organ of state without the need for a tender process, and that tenders will be issuedfor the grant payment components that cannot be delivered by SAPO. SASSA has issued no such tenders.
The expert panel’s first report expressed reservations regarding SASSA’s ability to complete a process to take over thepayment of social grants on April 1, 2018 and contained several recommendations. The Constitutional Court has not issued anyorders pursuant to the filing of the expert panel’s first progress report.
According to the Department of Social Development’s website, following a limited due diligence review conducted by theSouth African Council for Scientific and Industrial Research, or CSIR”) SASSA extended a formal offer to SAPO to develop anintegrated grant payment solution, which is one of the four components identified by SASSA that comprise the grant paymentprocess. On October 20, 2017, SAPO informed SASSA that it could not accept the offer on the basis that the four componentsidentified by SASSA could not be separated, and requested SASSA to reconsider its original offer.
On October 31, 2017, SASSA and SAPO were called to a joint meeting of the South African Parliament’s PortfolioCommittee on Social Development and Standing Committee on Public Accounts (‘joint committee”) to provide a progress report.SASSA and SAPO indicated that they had not reached an agreement. SASSA and SAPO were requested to find a solution andreport back to the joint committee on November 1. 2017. At that meeting, SASSA and SAPO reported that an agreement had notbeen reached. The joint committee requested that the National Treasury perform a review of the current procurement processinitiated by SASSA and that an Interministerial Committee that was established in March 2017 should provide guidance on the wayforward. On November 8, 2017, the Interministerial Committee reported to a joint committee meeting that a cooperation agreementbetween SASSA and SAPO will be signed by November 17, 2017
We continue to deliver our grant payment solution in accordance with our current agreement and we have paid all 10.7million social grant recipients, without interruption, every month since our contract was extended in March 2017. We will continueto cooperate with SASSA, the expert panel and any other delegated government entity to assist them in finding a solution andensuring a smooth handover to any entity legally appointed to render the grant payment service.
27

Progress of financial inclusion initiatives in South Africa
In June 2015, we began the rollout of EPE, our business-to-consumer, or B2C, offering in South Africa. At October 31,2017, we had more than 2.14 million active EPE accounts, compared to 2.0 million at July 31, 2017. EPE is a fully transactional,low cost account created to serve the needs of South Africa’s unbanked and under-banked population, most of whom are socialgrant recipients. The EPE account offers customers a comprehensive suite of financial and various financial inclusion services,such as prepaid products, in an economical, convenient and secure solution. EPE provides account holders with a UEPS-EMV debitMasterCard, mobile and internet banking services, ATM and POS services, as well as loans, insurance and other financial productsand value-added services. However, SASSA and a non—profit organization continue to challenge the ability of beneficiaries tofreely transact with the grants that they receive as described under “Item 1—Legal Proceedings.”
In order for us to address the sizeable opportunity for EPE and related financial inclusion services in South Africa, in fiscal2016, we started to expand our brick-and-mortar financial services branch infrastructure, which supplements our nationwidedistribution, with a UEPS/EMV-enabled ATM network, and hired a dedicated sales force. At October 31, 2017, we had 146branches (July 31, 2017: 149), 1,008 ATMs (July 31, 2017: 980), and 1,925 (July 31, 2017: 1,822) dedicated employees.
During the four months since July 1, 2017, we sold approximately 59,000 new policies related to our simple, low-cost lifeinsurance products, in addition to the free basic life insurance policy provided with every EPE account opened.
The graph below presents the growth of the number of EPE cards and Smart Life policies:
Strategic investments
Investments in Cell C Proprietary Limited and DNI-4PL Contracts Proprietary Limited
On August 2, 2017, we purchased 15% of Cell C, for an aggregate purchase price of ZAR 2.0 billion ($151.0 million)) incash. Cell C is one of the three major licensed mobile operators in South Africa with approximately 16 million active subscribers.We funded the transaction through a combination of cash and credit facilities.
On July 27, 2017, we subscribed for 44,999,999 ordinary A shares in DNI, representing a 45% voting and economic interestin DNI, for a subscription price of ZAR 945.0 million ($72.0 million) in cash. Under the terms of our agreements with DNI, we arerequired to pay to DNI an additional amount of up to ZAR 360 million ($26.5 million, translated at the foreign exchange ratesapplicable as of September 30, 2017), in cash, subject to the achievement of certain performance targets by DNI.
28
The investments in Cell C and DNI are consistent with our approach of leveraging our significant and establishedinfrastructures, and pursuing strategic acquisition opportunities or partnerships to gain access to new markets or complementaryproducts. We identified the need to offer customers a truly bespoke, affordable and comprehensive package that will go beyondbasic telephony. An integrated mobile-based digital product will therefore likely differentiate the offerings of all the relevantstakeholders in this transaction including Net1. The Cell C and DNI investments allow us to address the needs of the broader SouthAfrican population through ownership in the value chain including the network, payment, product, distribution and hardware. Wehave pledged, among other things, our entire equity interests in Cell C and DNI as security for the South African facilities used topartially fund the acquisition of Cell C, refer also Note 10 to our unaudited condensed consolidated financial statements.
Investment in Bank Frick
On October 2, 2017, we acquired a 30% interest in Bank Frick & Co AG, a fully licensed bank based in Balzers,Liechtenstein, from the Kuno Frick Family Foundation for approximately CHF 39.8 million ($40.8 million translated at exchangerates applicable as of September 30, 2017). Following the successful completion of this investment, we have a two-year option toacquire an additional 35% interest in Bank Frick.
Bank Frick provides a complete suite of banking services, with one of its key strategic pillars being the provision of paymentservices and funding of financial technology opportunities. Bank Frick holds acquiring licenses from both Visa and MasterCard andoperates a branch in London. We have jointly identified several funding opportunities, including for our working capital finance,card issuing and acquiring, remittance and transaction processing activities. The investment in Bank Frick has the potential toprovide us with a stable, long term and strategic relationship with a fully licensed bank. We have agreed that approximately $30million of the Bank Frick’s free equity will be utilized as seed capital for a fund dedicated to our future activities.
Critical Accounting Policies
Our unaudited condensed consolidated financial statements have been prepared in accordance with U.S. GAAP, whichrequires management to make estimates and assumptions about future events that affect the reported amount of assets and liabilitiesand disclosure of contingent assets and liabilities. As future events and their effects cannot be determined with absolute certainty,the determination of estimates requires management’s judgment based on a variety of assumptions and other determinants such ashistorical experience, current and expected market conditions and certain scientific evaluation techniques.
Critical accounting policies are those that reflect significant judgments or uncertainties, and potentially may result inmaterially different results under different assumptions and conditions. Management has identified the following critical accountingpolicies that are described in more detail in our Annual Report on Form 10-K for the year ended June 30, 2017:
• Business combinations and the recoverability of goodwill; • Intangible assets acquired through acquisitions; • Deferred taxation; • Stock-based compensation; and • Accounts receivable and allowance for doubtful accounts receivable.
Recent accounting pronouncements adopted
Refer to Note 1 to our unaudited condensed consolidated financial statements for a full description of recent accountingpronouncements adopted, including the dates of adoption and the effects on our condensed consolidated financial statements.
Recent accounting pronouncements not yet adopted as of September 30, 2017
Refer to Note 1 to our unaudited condensed consolidated financial statements for a full description of recent accountingpronouncements not yet adopted as of September 30, 2017, including the expected dates of adoption and effects on our financialcondition, results of operations and cash flows.
29
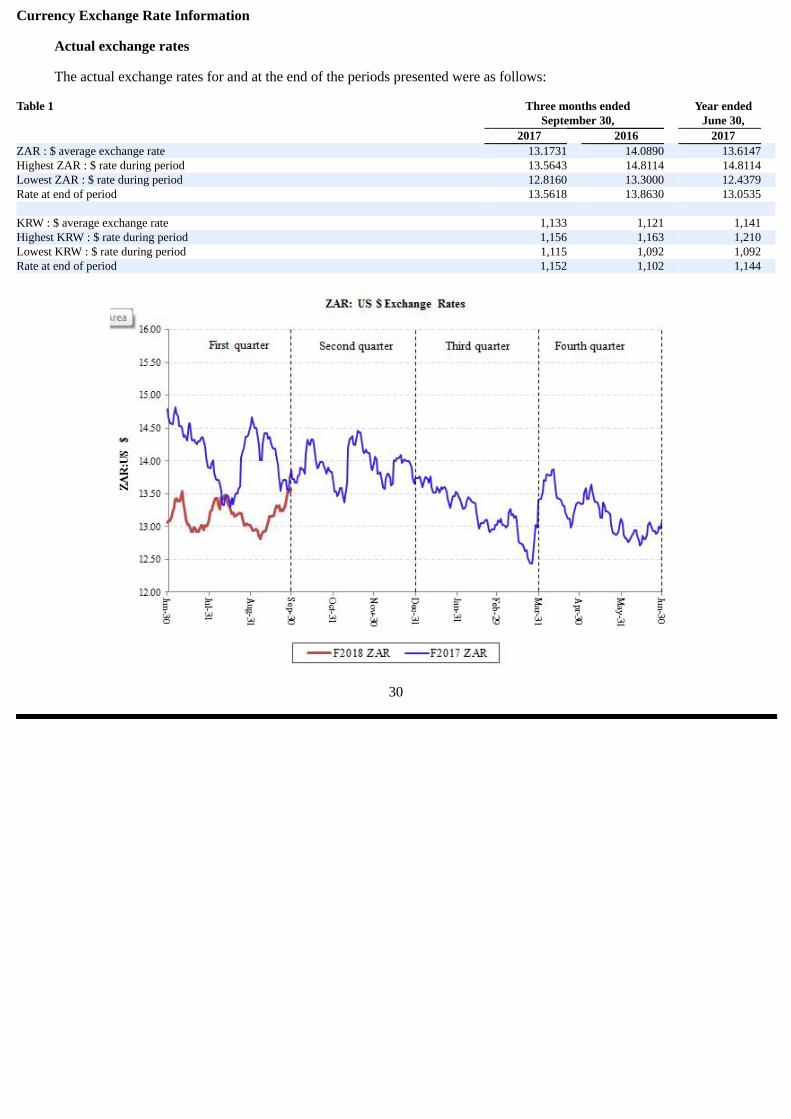
Currency Exchange Rate Information
Actual exchange rates
The actual exchange rates for and at the end of the periods presented were as follows:
Table 1 Three months ended Year ended September 30, June 30, 2017 2016 2017
ZAR : $ average exchange rate 13.1731 14.0890 13.6147 Highest ZAR : $ rate during period 13.5643 14.8114 14.8114 Lowest ZAR : $ rate during period 12.8160 13.3000 12.4379 Rate at end of period 13.5618 13.8630 13.0535 KRW : $ average exchange rate 1,133 1,121 1,141 Highest KRW : $ rate during period 1,156 1,163 1,210 Lowest KRW : $ rate during period 1,115 1,092 1,092 Rate at end of period 1,152 1,102 1,144
30
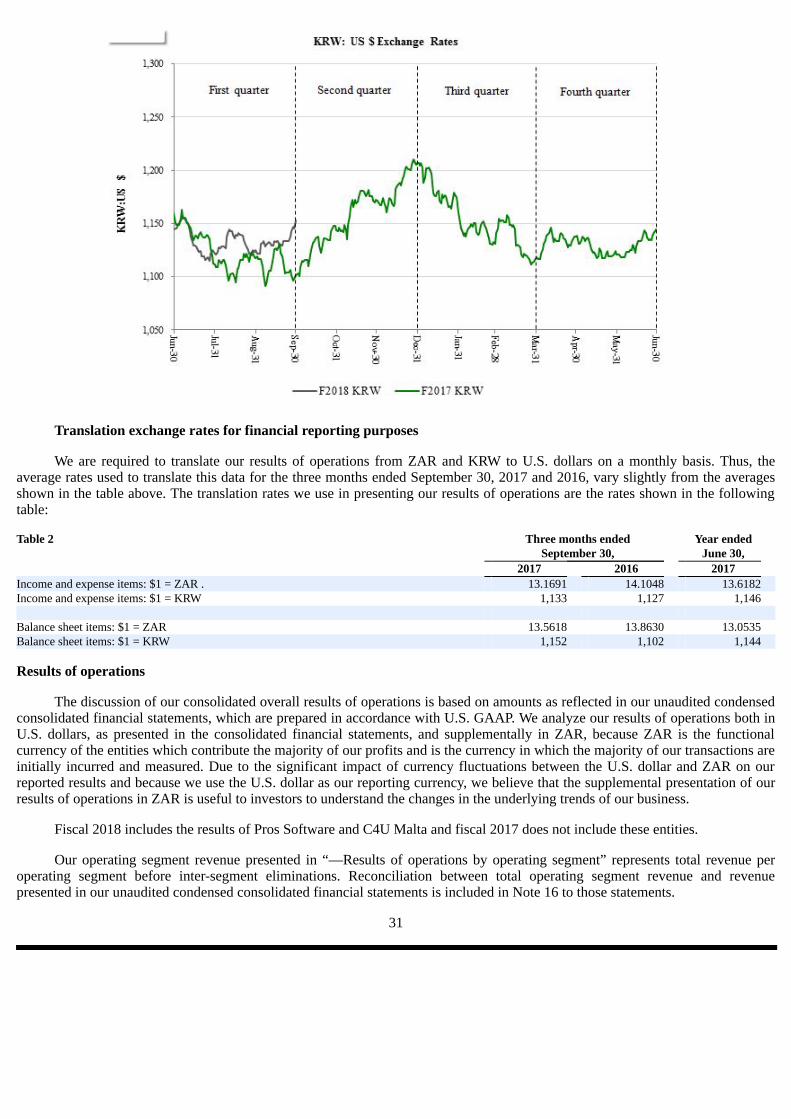
Translation exchange rates for financial reporting purposes
We are required to translate our results of operations from ZAR and KRW to U.S. dollars on a monthly basis. Thus, theaverage rates used to translate this data for the three months ended September 30, 2017 and 2016, vary slightly from the averagesshown in the table above. The translation rates we use in presenting our results of operations are the rates shown in the followingtable:
Table 2 Three months ended Year ended September 30, June 30, 2017 2016 2017
Income and expense items: $1 = ZAR . 13.1691 14.1048 13.6182 Income and expense items: $1 = KRW 1,133 1,127 1,146 Balance sheet items: $1 = ZAR 13.5618 13.8630 13.0535 Balance sheet items: $1 = KRW 1,152 1,102 1,144
Results of operations
The discussion of our consolidated overall results of operations is based on amounts as reflected in our unaudited condensedconsolidated financial statements, which are prepared in accordance with U.S. GAAP. We analyze our results of operations both inU.S. dollars, as presented in the consolidated financial statements, and supplementally in ZAR, because ZAR is the functionalcurrency of the entities which contribute the majority of our profits and is the currency in which the majority of our transactions areinitially incurred and measured. Due to the significant impact of currency fluctuations between the U.S. dollar and ZAR on ourreported results and because we use the U.S. dollar as our reporting currency, we believe that the supplemental presentation of ourresults of operations in ZAR is useful to investors to understand the changes in the underlying trends of our business.
Fiscal 2018 includes the results of Pros Software and C4U Malta and fiscal 2017 does not include these entities.
Our operating segment revenue presented in “—Results of operations by operating segment” represents total revenue peroperating segment before inter-segment eliminations. Reconciliation between total operating segment revenue and revenuepresented in our unaudited condensed consolidated financial statements is included in Note 16 to those statements.
31

We analyze our business and operations in terms of three inter-related but independent operating segments: (1) South Africantransaction processing, (2) International transaction processing and (3) Financial inclusion and applied technologies. In addition,corporate and corporate office activities that are impracticable to ascribe directly to any of the other operating segments, as well asany inter-segment eliminations, are included in corporate/eliminations.
First quarter of fiscal 2018 compared to first quarter of fiscal 2017
The following factors had a significant influence on our results of operations during the first quarter of fiscal 2018 ascompared with the same period in the prior year:
• Favorable impact from the weakening of the U.S. dollar against South African Rand: The U.S. dollar depreciated by 6% against the ZARduring the first quarter of fiscal 2018, which positively impacted our reported results;
• Growth in insurance businesses: We continued to experience volume growth and operating efficiencies in our insurance businesses duringthe first quarter of fiscal 2018, which has resulted in an improved contribution to our financial inclusion revenue and operating income;
• Ongoing contributions from EasyPay Everywhere: EPE revenue and operating income growth was driven primarily by ongoing EPEadoption as we further expanded our customer base utilizing our ATM infrastructure;
• Higher equity accounted earnings related to DNI: The acquisition of 45% of DNI has positively impacted our reported results byapproximately $1.4 million, before amortization of intangible assets, net of deferred taxes;
• Adverse impact on interest income from utilization of surplus cash to invest in Cell C and DNI: Our interest income was adverselyimpacted by approximately $1.2 million, before the impact of any taxes, as a result of our utilization of approximately ZAR 1.4 billion and$23.0 million, respectively, of our surplus cash reserves to partially fund our investments in Cell C and DNI;
• Higher interest expense resulting from South African facility: Our interest expense increased due to the South African lending facility weobtained in August 2017, to partially fund our 15% investment in Cell C;
• Masterpayment expansion costs: Masterpayment has incurred additional employment costs as it grows its staff complement to execute itsexpansion plan into new markets;
• Lower prepaid sales and ad hoc terminal sales: The number of transacting users purchasing prepaid products through our mobile channeldecreased due to security features introduced in fiscal 2017. In addition, our results were adversely impacted by few ad hoc terminal sales;and
• Higher transaction-related costs in fiscal 2018: We incurred $1.5 million in transaction-related costs pertaining to various acquisition andinvestment initiatives pursued during the first quarter of fiscal 2018.
Consolidated overall results of operations
This discussion is based on the amounts prepared in accordance with U.S. GAAP.
The following tables show the changes in the items comprising our statements of operations, both in U.S. dollars and inZAR:
In U.S. Dollars Table 3 (U.S. GAAP)
Three months ended September 30, 2017 2016 $ % $ ’000 $ ’000 change
Revenue 152,558 155,633 (2%)Cost of goods sold, IT processing, servicing and support 74,652 74,780 (0%)Selling, general and administration 43,934 38,468 14% Depreciation and amortization 8,966 10,204 (12%)Operating income 25,006 32,181 (22%)Interest income 5,044 4,304 17% Interest expense 2,121 796 166% Income before income tax expense 27,929 35,689 (22%)Income tax expense 10,277 11,103 (7%)Net income before earnings from equity-accounted investments 17,652 24,586 (28%)Earnings from equity-accounted investments 2,075 659 215% Net income 19,727 25,245 (22%)Less net income attributable to non-controlling interest 244 613 (60%)Net income attributable to us 19,483 24,632 (21%)
32

In South African Rand Table 4 (U.S. GAAP)
Three months ended September 30, 2017 2016 ZAR ZAR ZAR % ’000 ’000 change
Revenue 2,011,951 2,195,171 (8%)Cost of goods sold, IT processing, servicing and support 984,518 1,054,755 (7%)Selling, general and administration 579,406 542,583 7% Depreciation and amortization 118,245 143,926 (18%)Operating income 329,782 453,907 (27%)Interest income 66,521 60,707 10% Interest expense 27,972 11,227 149% Income before income tax expense 368,331 503,387 (27%)Income tax expense 135,534 156,606 (13%)Net income before earnings from equity-accounted investments 232,797 346,781 (33%)Earnings from equity-accounted investments 27,365 9,295 194% Net income 260,162 356,076 (27%)Less net income attributable to non-controlling interest 3,218 8,646 (63%)Net income attributable to us 256,944 347,430 (26%)
The decrease in revenue was primarily due to lower prepaid airtime sales, fewer ad hoc terminal sales, and a lowercontribution from KSNET due to regulatory changes in South Korea, which was partially offset by an improved contribution fromMasterpayment and Transact 24, more fees generated from our EPE and ATM offerings, improved insurance activities, and anincrease in the number of SASSA UEPS/EMV beneficiaries paid.
In ZAR, the decrease in cost of goods sold, IT processing, servicing and support was primarily due to fewer prepaid airtimeand ad hoc terminal sales, which was partially offset by increases in goods and services purchased from third parties, higherexpenses incurred due to increased usage of the South African National Payment System by beneficiaries, expenses incurred tooperate our EPE and ATM offerings, and higher Masterpayment employment costs related to the first quarter of fiscal 2018.
Our selling, general and administration expense increased primarily due to the impact of October 2016 annual salaryincreases for our South African employees, as well as increases in goods and services purchased from third parties. Our fiscal 2018expense also includes transaction-related expenditures of $1.5 million, compared to $0.2 million in the prior year. Fiscal 2017includes $1.8 million related to the reversal of stock-based compensation charges related to awards of restricted stock withperformance conditions which we believe will not be achieved.
Our operating income margin for first quarter of fiscal 2018 and 2017 was 16% and 21% respectively. We discuss thecomponents of operating income margin under “—Results of operations by operating segment.” The decrease was primarilyattributable to higher cost of goods sold, IT processing, servicing and support relative to the reduction in revenue, highertransaction-related expenditure and the reversal of stock-based compensation charges referred to above.
Depreciation and amortization decreased primarily due to lower overall depreciation as a result of additional tangible assetsbecoming fully depreciated, partially offset by an increase in depreciation related to more ATMs in South Africa.
Interest on surplus cash increased to $5.0 million (ZAR 66.5 million) from $4.3 million (ZAR 60.7 million), due primarily tothe interest earned on the loan to Finbond, partially offset by lower average daily ZAR cash balances.
Interest expense increased to $2.1 million (ZAR 28.0 million) from $0.8 million (ZAR 11.2 million), due primarily tointerest on the South African facility we obtained to partially fund our investment in Cell C, somewhat offset by lower averagelong-term debt balance on our South Korean debt and a lower interest rate.
Fiscal 2018 tax expense was $10.3 million (ZAR 135.5 million) compared to $11.1 million (ZAR 156.6 million) in fiscal2017. Our effective tax rate for fiscal 2018, was 36.8% and was higher than the South African statutory rate as a result of non-deductible expenses (including transaction-related expenses and non-deductible interest on our South African long-term facility).Our effective tax rate for fiscal 2017, was 31.1% and was higher than the South African statutory rate as a result of non-deductibleexpenses and the tax impact attributable to distributions from our South African subsidiary.
33

Earnings from equity-accounted investments increased primarily due to the inclusion of our portion of DNI and an increase,in USD, in Finbond’s net income. Finbond is listed on the Johannesburg Stock Exchange and reports its six-month results duringour first quarter and its annual results during our fourth quarter. The table below presents the relative earnings (loss) from ourequity accounted investments:
Table 5 Three months ended September 30, 2017 2016 $ % $ ’000 $ ’000 change
DNI 865 - nm Share of net income 1,408 - nm Amortization of intangible assets, net of deferred tax (543) - nm Finbond 1,101 930 18% Other 109 (271) nm Earnings from equity accounted investments 2,075 659 297%
Results of operations by operating segment
The composition of revenue and the contributions of our business activities to operating income are illustrated below:
Table 6 In U.S. Dollars (U.S. GAAP) Three months ended September 30, 2017 % of 2016 % of % Operating Segment $ ’000 total $ ’000 total change Revenue: South African transaction processing 66,437 44% 57,568 37% 15% International transaction processing 46,022 30% 46,190 30% - Financial inclusion and applied technologies 54,313 36% 63,542 41% (15%) Subtotal: Operating segments 166,772 110% 167,300 108% - Intersegment eliminations (14,214) (10%) (11,667) (8%) 22% Consolidated revenue 152,558 100% 155,633 100% (2%)Operating income (loss): South African transaction processing 12,332 49% 13,548 42% (9%)International transaction processing 5,316 21% 5,817 18% (9%)Financial inclusion and applied technologies 13,920 56% 15,183 47% (8%) Subtotal: Operating segments 31,568 126% 34,548 107% (9%) Corporate/Eliminations (6,562) (26%) (2,367) (7%) 177% Consolidated operating income 25,006 100% 32,181 100% (22%)
Table 7 In South African Rand (U.S. GAAP) Three months ended September 30, 2017 2016 ZAR % of ZAR % of % Operating Segment ’000 total ’000 total change Revenue: South African transaction processing 876,178 44% 811,985 37% 8% International transaction processing 606,943 30% 651,501 30% (7%)Financial inclusion and applied technologies 716,285 36% 896,247 41% (20%) Subtotal: Operating segments 2,199,406 110% 2,359,733 108% (7%) Intersegment eliminations (187,455) (10%) (164,562) (8%) 14% Consolidated revenue 2,011,951 100% 2,195,171 100% (8%)Operating income (loss): South African transaction processing 162,636 49% 191,092 42% (15%)International transaction processing 70,108 21% 82,048 18% (15%)Financial inclusion and applied technologies 183,578 56% 214,153 47% (14%) Subtotal: Operating segments 416,322 126% 487,293 107% (15%) Corporate/Eliminations (86,540) (26%) (33,386) (7%) 159% Consolidated operating income 329,782 100% 453,907 100% (27%)
34

South African transaction processing
The increase in segment revenue was primarily due to higher EPE transaction revenue as a result of increased usage of ourATMs, increased inter-segment transaction processing activities and a modest increase in the number of social welfare grantsdistributed. Operating income decreased primarily due to an increase in inter-segment charges, the impact of annual salaryincreases granted to our South African employees in October 2016 and increases in goods and services purchased from thirdparties, partially offset by higher EPE transaction revenue as a result of increased usage of our ATMs, increased inter-segmenttransaction processing activities and a modest increase in the number of social welfare grants distributed.
Our operating income margin for the first quarter of fiscal 2018 and 2017 was 19% and 24%, respectively. Our fiscal 2018margin was adversely impacted by the annual salary increases granted to our South African employees in October 2016 andincreases in goods and services purchased from third parties.
International transaction-based activities
Segment revenue was moderately lower during the first quarter of fiscal 2018, primarily due to ongoing impact of regulatorychanges in South Korea on KSNET’s revenue, largely offset by increased contributions from Masterpayment and Transact24.Operating income during the first quarter of fiscal 2018 was lower due to a decrease in revenue at KSNET, losses incurred byMasterpayment as it grows its staff complement to execute its expansion plan into new markets, and ongoing operating costs inIndia, which was partially offset by a positive contribution by T24.
Operating income margin for the first quarter of fiscal 2018 and 2017 was 12% and 13%, respectively.
Financial inclusion and applied technologies
Financial inclusion and applied technologies revenue decreased primarily due to fewer prepaid airtime and other value addedservices sales, as well as lower ad hoc terminal sales, partially offset by increased volumes in our insurance businesses, and anincrease in inter-segment revenues.
Operating income margin for the Financial inclusion and applied technologies segment was 26% and 24% during the firstquarter of fiscal 2018 and 2017, respectively, and has increased primarily due to fewer low margin prepaid product sales, improvedrevenues from our insurance businesses and an increase in inter-segment revenues, offset by fewer ad hoc terminal and annualsalary increases granted to our South African employees.
Corporate/Eliminations
Our corporate expenses generally include acquisition-related intangible asset amortization; expenses incurred related toacquisitions and investments pursued; expenditure related to compliance with Sarbanes-Oxley Act of 2002; non-employeedirectors’ fees; employee and executive bonuses; stock-based compensation; legal fees; audit fees; directors and officers insurancepremiums; telecommunications expenses; property-related expenditures including utilities, rental, security and maintenance; andelimination entries.
Our corporate expenses have increased primarily due to higher transaction-related expenditures and modest increases in U.S.dollar denominated goods and services purchased from third parties and directors’ fees. Our corporate expenses for the first quarterof fiscal 2017, includes the reversal of $1.8 million of stock-based compensation charges.
Liquidity and Capital Resources
At September 30, 2017, our cash and cash equivalents were $138.4 million and comprised mainly KRW-denominatedbalances of KRW 52.6 billion ($45.7 million), CHF-denominated balances of CHF 40.5 million ($41.5 million), ZAR-denominatedbalances of ZAR 501.2 million ($37.0 million), U.S. dollar-denominated balances of $6.9 million, and other currency deposits,primarily euros, of $7.3 million, all amounts translated at exchange rates applicable as of September 30, 2017. The decrease in ourcash balances from June 30, 2017, was primarily due to our investments in DNI and Cell C, a scheduled repayment of our SouthAfrican long-term debt, and capital expenditures, which was partially offset by cash generated by most of our core businesses. Weconverted some of our USD reserves to CHF in late September 2017 in order to settle the investment consideration related to theBank Frick transaction in early October 2017.
We currently believe that our cash and credit facilities are sufficient to fund our future operations for at least the next fourquarters.
We generally invest the surplus cash held by our South African operations in overnight call accounts that we maintain atSouth African banking institutions, and surplus cash held by our non-South African companies in U.S. dollar denominated moneymarket accounts. We have invested surplus cash in Korea in short-term investment accounts at Korean banking institutions.
35

Historically, we have financed most of our operations, research and development, working capital, capital expenditures andacquisitions through internally generated cash. When considering whether to borrow under our financing facilities, we consider thecost of capital, cost of financing, opportunity cost of utilizing surplus cash and availability of tax efficient structures to moderatefinancing costs.
We have a short-term South African credit facility with Nedbank of ZAR 400 million ($29.4 million), which consists of (i) aprimary amount of up to ZAR 200 million, and (ii) a secondary amount of up to ZAR 200 million. The primary amounts comprisean overdraft facility of up to ZAR 50 million and indirect and derivative facilities of up to ZAR 150 million, which include lettersof guarantee, letters of credit and forward exchange contracts.
As of September 30, 2017, we had used none of the overdraft and ZAR 129.1 million ($9.5 million, translated at exchangerates applicable as of September 30, 2017) of the indirect and derivative facilities to obtain foreign exchange contracts and tosupport guarantees issued by Nedbank to various third parties on our behalf.
We obtained EUR 40.0 million ($47.3 million) and CHF 20 million ($20.7 million) revolving overdraft facilities from BankFrick. As of September 30, 2017, we had utilized approximately CHF 23.8 million ($28.1 million) of the EUR 40 million facilityand CHF 17.0 million ($17.6 million) of the CHF 20 million facility. As of September 30, 2017, the interest rate on each of thesefacilities was 5.00% . We have assigned all claims against amounts due from Masterpayment customers, which have been financedfrom the CHF 20 million facility, plus all secondary rights and preferential rights as collateral for this facility to Bank Frick. OurMasterpayment subsidiary was required to open a primary business account with Bank Frick, and this account has been pledged toBank Frick as collateral for the EUR 40 million facility. The initial term of the EUR 40 million facility ends on December 31, 2019,but it will automatically be extended for one year if it is not terminated with 12 months written notice. The CHF 20 million facilitydoes not have a fixed term; however, it may be terminated by either party with six months written notice at the end of a calendarmonth. Refer to Note 12 to our audited consolidated financial statements included in our Annual Report on Form 10-K for the yearended June 30, 2017, for additional information related to our short-term facilities and Note 9 to our unaudited condensedconsolidated financial statements for the three months ended September 30, 2017, for additional information related to our short-term facilities.
As of September 30, 2017, we had outstanding long-term debt of ZAR 1.1 billion (approximately $77.9 million translated atexchange rates applicable as of September 30, 2017) under our loan South African facilities. Interest due on the facility is based onthe Johannesburg Interbank Agreed Rate, or JIBAR, in effect from time to time plus a margin of 2.25% for the Facility A loan,3.5% for the Facility B loan and 2.25% for the Facility C loan. The JIBAR rate has been set at 6.99% for the period to December29, 2017. Principal repayments on the Facility A and Facility B loans are due in eight equal quarterly installments, beginning onSeptember 30, 2017. Principal repayment on the Facility C loan is to be determined by the Lenders based on the date of therepayment of any borrowings under the Facility A loan. Voluntary prepayments are permitted without early repayment fees orpenalties.
As of September 30, 2017, we had outstanding long-term debt of KRW 18.8 billion (approximately $16.3 million translatedat exchange rates applicable as of September 30, 2017) under credit facilities with a group of South Korean banks. The loans bearinterest at the South Korean CD rate in effect from time to time (1.41% as of September 30, 2017) plus a margin of 3.10% for oneof the term loan facilities and the revolver. Scheduled remaining repayments of the term loans and loan under the revolving creditfacility are as follows: April 2018 (KRW 10 billion) and October 2018 (all outstanding loans under our revolving credit facility).We settled the full outstanding balance, including interest, related to these borrowings on October 20, 2017. Refer to Note 14 to ouraudited consolidated financial statements included in our Annual Report on Form 10-K for the year ended June 30, 2017, and Note10 to our unaudited condensed consolidated financial statements for the three months ended September 30, 2017, for additionalinformation related to our long-term borrowings.
Cash flows from operating activities
First quarter
Net cash used in operating activities for the first quarter of fiscal 2018 was $0.8 million (ZAR 10.4 million) compared tocash provided by operating activities of $53.5 million (ZAR 755.2 million) for the first quarter of fiscal 2017. Excluding the impactof interest received, interest paid under our Korean and South Africa debt and taxes presented in the table below, the decreaserelates primarily to the growth of Masterpayment’s working capital finance offering and weaker trading activity during fiscal 2018compared to 2017.
During the first quarter of fiscal 2018, we paid South African tax of $1.9 million (ZAR 25.2 million) related to our 2017 taxyear in South Africa. During the first quarter of fiscal 2017, we made an additional tax payment of $1.2 million (ZAR 16.7 million)related to our 2016 tax year in South Africa and received a refund of approximately $1.2 million (ZAR 16.6 million) related totaxes overpaid in previous tax years in South Africa. We paid dividend withholding taxes of $1.5 million (ZAR 21.3 million)during the first quarter of fiscal 2017.
36
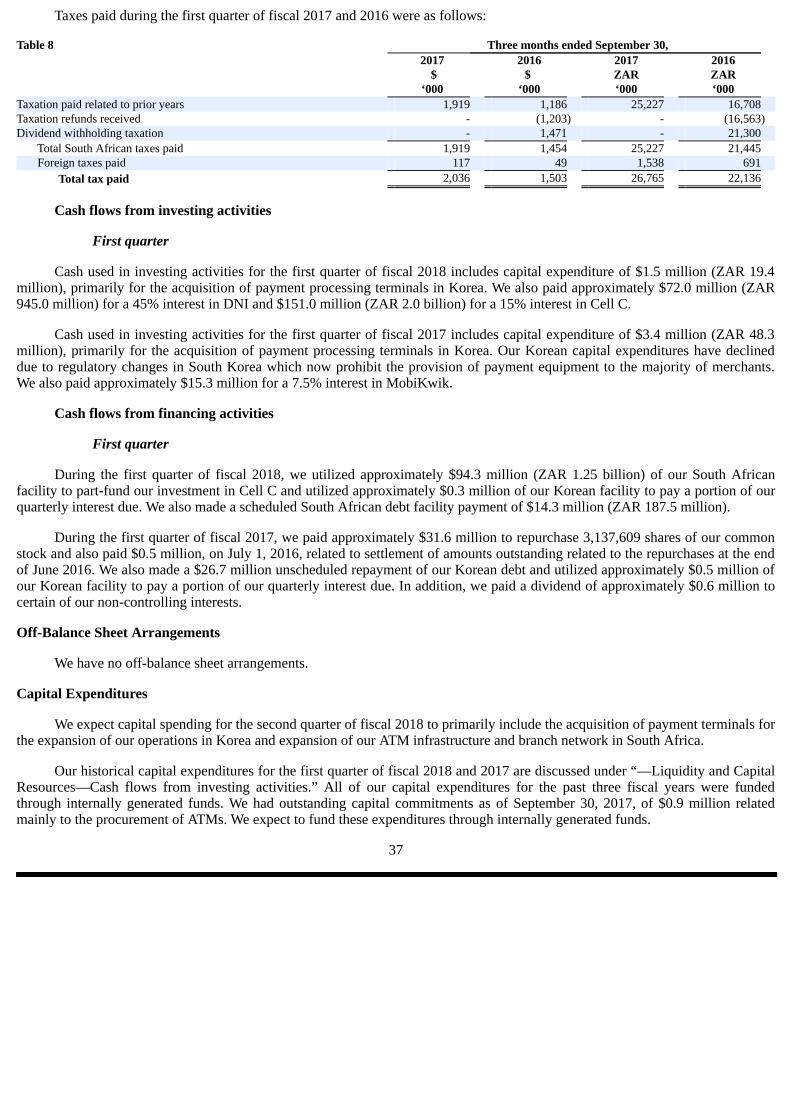
Taxes paid during the first quarter of fiscal 2017 and 2016 were as follows:
Table 8 Three months ended September 30, 2017 2016 2017 2016 $ $ ZAR ZAR ‘000 ‘000 ‘000 ‘000
Taxation paid related to prior years 1,919 1,186 25,227 16,708 Taxation refunds received - (1,203) - (16,563)Dividend withholding taxation - 1,471 - 21,300 Total South African taxes paid 1,919 1,454 25,227 21,445 Foreign taxes paid 117 49 1,538 691 Total tax paid 2,036 1,503 26,765 22,136
Cash flows from investing activities
First quarter
Cash used in investing activities for the first quarter of fiscal 2018 includes capital expenditure of $1.5 million (ZAR 19.4million), primarily for the acquisition of payment processing terminals in Korea. We also paid approximately $72.0 million (ZAR945.0 million) for a 45% interest in DNI and $151.0 million (ZAR 2.0 billion) for a 15% interest in Cell C.
Cash used in investing activities for the first quarter of fiscal 2017 includes capital expenditure of $3.4 million (ZAR 48.3million), primarily for the acquisition of payment processing terminals in Korea. Our Korean capital expenditures have declineddue to regulatory changes in South Korea which now prohibit the provision of payment equipment to the majority of merchants.We also paid approximately $15.3 million for a 7.5% interest in MobiKwik.
Cash flows from financing activities
First quarter
During the first quarter of fiscal 2018, we utilized approximately $94.3 million (ZAR 1.25 billion) of our South Africanfacility to part-fund our investment in Cell C and utilized approximately $0.3 million of our Korean facility to pay a portion of ourquarterly interest due. We also made a scheduled South African debt facility payment of $14.3 million (ZAR 187.5 million).
During the first quarter of fiscal 2017, we paid approximately $31.6 million to repurchase 3,137,609 shares of our commonstock and also paid $0.5 million, on July 1, 2016, related to settlement of amounts outstanding related to the repurchases at the endof June 2016. We also made a $26.7 million unscheduled repayment of our Korean debt and utilized approximately $0.5 million ofour Korean facility to pay a portion of our quarterly interest due. In addition, we paid a dividend of approximately $0.6 million tocertain of our non-controlling interests.
Off-Balance Sheet Arrangements
We have no off-balance sheet arrangements.
Capital Expenditures
We expect capital spending for the second quarter of fiscal 2018 to primarily include the acquisition of payment terminals forthe expansion of our operations in Korea and expansion of our ATM infrastructure and branch network in South Africa.
Our historical capital expenditures for the first quarter of fiscal 2018 and 2017 are discussed under “—Liquidity and CapitalResources—Cash flows from investing activities.” All of our capital expenditures for the past three fiscal years were fundedthrough internally generated funds. We had outstanding capital commitments as of September 30, 2017, of $0.9 million relatedmainly to the procurement of ATMs. We expect to fund these expenditures through internally generated funds.
37

Contingent Liabilities, Commitments and Contractual Obligations
The following table sets forth our contractual obligations as of September 30, 2017:
Table 9 Payments due by Period, as of September 30, 2017 (in $ ’000s) Less More than 1 1-3 3-5 than 5 Total year years years years
South African long-term debt obligations (A) 85,488 56,454 29,034 - - South Korean long-term debt obligations (B) 17,020 9,460 7,560 - - Acquisition of Bank Frick (C) 40,794 40,794 - - - Contingent amount related to DNI investment (D) 26,545 26,545 - - - Short-term credit facilities 45,737 45,737 - - - Acquisition of 8.625% notes in Cell C (E) 9,000 9,000 - - - Operating lease obligations 6,463 4,594 1,551 318 - Purchase obligations 3,467 3,467 - - - Capital commitments 901 901 - - - Other long-term obligations (F)(G) 2,965 - - - 2,965 Total 238,380 196,952 38,145 318 2,965
(A) – Includes $78.3 million of long-term debt and interest payable at the rate applicable on September 30, 2017, under our South Africa debtfacility.
(B) – Includes $16.1 million of long-term debt and interest payable at the rate applicable on September 30, 2017, under our South Korean debtfacility.
(C) – Under the DNI transaction agreements, we are obliged to pay to DNI an additional amount not exceeding ZAR 360 million ($26.5 milliontranslated at exchange rates applicable as of September 30, 2017) in cash, subject to DNI achieving certain performance targets.
(D) – On October 2, 2017, we purchased 30% of Bank Frick for an aggregate purchase price of approximately CHF 39.8 million ($40.1 million
translated at exchange rates applicable as of September 30, 2017) (refer also Note 6 to our unaudited condensed consolidated financialstatements).
(E) – We have agreed to purchase a Cell C issued USD-denominated 8.625% note that matures in 2022 for $9 million. (F) – Includes policyholder liabilities of $2.2 million related to our insurance business.
(G) – We have excluded a cross-guarantees in the aggregate amount of $9.6 million issued as of September 30, 2017, to Nedbank to secureguarantees it has issued to third parties on our behalf as the amounts that will be settled in cash are not known and the timing of any paymentsis uncertain. We have also excluded contractual commitments to invest approximately $15 million in MobiKwik, subject to the achievementof certain contractual conditions.
38

Item 3. Quantitative and Qualitative Disclosures About Market Risk
In addition to the tables below, see Note 5 to the unaudited condensed consolidated financial statements for a discussion ofmarket risk.
The following table illustrates the effect on our annual expected interest charge, translated at exchange rates applicable as ofSeptember 30, 2017, as a result of changes in JIBAR and the South Korean CD rates. The effect of a hypothetical 1% (i.e. 100 basispoints) increase and a 1% decrease in each of JIBAR and the South Korean CD rates as of September 30, 2017, are shown. Theselected 1% hypothetical change does not reflect what could be considered the best or worst case scenarios.
As of September 30, 2017 Table 10 Estimated annual
Hypothetical expected interest change in charge after Annual JIBAR or hypothetical change in expected South JIBAR or South interest Korean CD Korean CD rate, as charge rate, as appropriate ($ ’000) appropriate ($ ’000)
Interest on South Africa long-term debt (JIBAR) 7,631 1% 8,414 (1%) 6,847 Interest on South Korean long-term debt (CD rate) 736 1% 899 (1%) 573
Item 4. Controls and Procedures
Evaluation of disclosure controls and procedures
Under the supervision and with the participation of our management, including our chief executive officer and our chieffinancial officer, we conducted an evaluation of our disclosure controls and procedures, as such term is defined under Rule 13a-15(e) promulgated under the Securities Exchange Act of 1934, as amended, as of September 30, 2017. Management recognizes thatany controls and procedures, no matter how well designed and operated, can provide only reasonable assurance of achieving theirobjectives and management necessarily applies its judgment in evaluating the cost-benefit relationship of possible controls andprocedures. Based on this evaluation, the chief executive officer and the chief financial officer concluded that our disclosurecontrols and procedures were effective as of September 30, 2017.
Changes in Internal Control over Financial Reporting
There have not been any changes in our internal control over financial reporting during the fiscal quarter ended September30, 2017, that have materially affected, or are reasonably likely to materially affect, our internal control over financial reporting.
39

Part II. Other Information
Item 1. Legal Proceedings
Litigation Regarding Legality of Debit Orders under Social Assistance Act Regulations
On June 3, 2016, we filed for a declaratory order with the High Court of the Republic of South Africa Gauteng Division,Pretoria, or Pretoria High Court, to provide certainty to us, as well as other industry stakeholders, on the interpretation of the SocialAssistance Act and recent Regulations promulgated in terms thereof, or the Regulations. The Regulations limit direct deductionsfrom social grants paid to beneficiaries. We interpret the meaning of the word “deductions” to be specific to the practice ofdeducting amounts, historically limited to life insurance premiums from grants, before the grants are paid to social welfarebeneficiaries’ bank accounts, and are of the opinion that the legislature did not intend to curtail the right of beneficiaries to transactfreely after the money is deposited into their bank accounts.
We brought the application for a declaratory order because SASSA seeks to lend a broader interpretation to the meaning ofthe term “deductions” to incorporate any debit orders, EFT debits, purchase transactions, or fund transfers that are effected after thetransfer of social grants to beneficiaries’ bank accounts. If SASSA’s interpretation were to prevail, debit transactions could nolonger be used as a method for beneficiaries to make payments for financial services such as insurance premiums, loan re-payments, electricity and other purchases, money transfers or any other electronic payments. We believe that forcing beneficiariesto pay for these products or services in cash would be a major setback to the national objective of financial inclusiveness, introducefinancial and security risks for beneficiaries and result in significant price increases for these products and services.
We further believe that SASSA’s interpretation of the Social Assistance Act and the Regulations is erroneous for a number ofreasons including, but not limited to, our belief that such an interpretation violates beneficiaries’ constitutional rights by limitingtheir fundamental right to enter into contracts and that such interpretation impermissibly encroaches on the jurisdiction and powersof the SARB and the Payments Association of South Africa, which regulate the national payment system. SASSA's interpretationeffectively prohibits the social welfare recipient community from enjoying the benefits of a convenient, low-cost, reliable andubiquitous payment system that enables the recipients to procure financial services at highly competitive rates.
We were joined in our application by several other industry participants, and the SARB also filed a responding affidavit.
On June 15, 2016, SASSA brought criminal charges against us and Grindrod Bank for contravening the Social AssistanceAct, alleging that we and Grindrod Bank failed to act in accordance with SASSA’s instructions by processing debit orders againstsocial welfare beneficiaries’ bank accounts after the Regulations came into effect.
On June 28, 2016, the Pretoria High Court scheduled a hearing on our application for a declaratory order for October 17 and18, 2016. In its order, the Pretoria High Court prohibited SASSA from making any representations to the South African PoliceServices and the National Prosecuting Authority regarding the criminal charges brought against us and Grindrod Bank pending thedetermination of the dispute, including the determination of any appeals. In addition, the order prevented SASSA from issuingfurther demands to us and Grindrod Bank to stop the processing of debit transactions against SASSA bank accounts pending thedetermination of the dispute, including the determination of any appeals.
On August 8, 2016, we were informed that the NPA had reached a “no prosecution” decision on the criminal charges filed bySASSA.
The matter was heard on October 17 and 18, 2016 and on May 9, 2017, the Pretoria High Court issued the declaratory ordersought by us that the Social Assistance Act and Regulations do not restrict social grant recipients in the operation of their banksaccounts. The order clarifies that recipients may continue to initiate debit order instructions with any service provider, including oursubsidiaries, against their bank accounts for the payment of goods and services. SASSA, its Chief Executive Officer and theMinister of Social Development were ordered to pay the costs of the application. The Pretoria High Court also refused the BlackSash Trust’s, or Black Sash, application to intervene in the matter. In support of its application, the Black Sash made severalallegations of “illegal deductions” which we denied in our answering affidavits.
On May 17, 2017, the NPA reaffirmed its “no prosecution decision” reached in August 2016 on the criminal charges broughtby SASSA against us and Grindrod Bank. In addition, the NPA notified us that no further action will be taken and that we canconsider the case closed.
On June 20, 2017, the Pretoria High Court refused the applicants, including the Minister of Social Development, SASSA andBlack Sash, application for leave to appeal the Pretoria High Court’s May 9, 2017, declaratory order. SASSA, its Chief ExecutiveOfficer and the Minister of Social Development were ordered to pay the costs of the application for the leave to appeal.
On July 19, 2017, each of SASSA and the Black Sash served applications petitioning the South African Supreme Court ofAppeal, or the Supreme Court, to grant them leave to appeal to either the Supreme Court or to a full bench of the Pretoria HighCourt.
40

On September 29, 2017, the Supreme Court referred the petitions to oral argument. The Supreme Court will provide ahearing date after the record of appeal has been filed. SASSA and the Black Sash have three months from the date of the order todeliver the record of appeal.
We believe that SASSA and the Black Sash’s claim is without merit, and we intend to defending it vigorously. However, wecannot predict how the courts will rule on the matter.
Challenge to Payment by SASSA of Additional Implementation Costs
In March 2015, Corruption Watch, a South African non-profit civil society organization, commenced a legal proceeding inthe High Court of South Africa seeking an order by the Court to review and set aside the decision of SASSA’s Chief ExecutiveOfficer to approve the payment to us of ZAR 317 million (approximately ZAR 277 million, excluding VAT) and directing us torepay the aforesaid amount. Corruption Watch claims that there was no lawful basis for the decision to make the payment to us, andthat the decision was unreasonable and irrational and did not comply with South African legislation. We are named as a respondentin this legal proceeding.
As we previously disclosed, in June 2014, we received approximately ZAR 277 million, excluding VAT, from SASSA,related to the recovery of additional implementation costs we incurred during the beneficiary re-registration process in fiscal 2012and 2013. After the award of the tender, SASSA requested that we biometrically register all social grant beneficiaries (includingchild grant beneficiaries) and collect additional information for each child grant recipient. We agreed to SASSA’s request, and as aresult we performed approximately 11 million additional registrations beyond those that we tendered to register for the quotedservice fee. Accordingly, we claimed a cost recovery from SASSA, supported by a factual findings certificate from an independentauditing firm. SASSA agreed to pay us the ZAR 277 million as full settlement of the additional costs we incurred.
Corruption Watch applied for a hearing date and it was initially set down for hearing during the week commencingNovember 6, 2017. However, the hearing has now been moved to February 22, 2018, as a result of certain scheduling conflicts.
We believe that Corruption Watch’s claim is without merit, and we are defending it vigorously. However, we cannot predicthow the Court will rule on the matter.
41
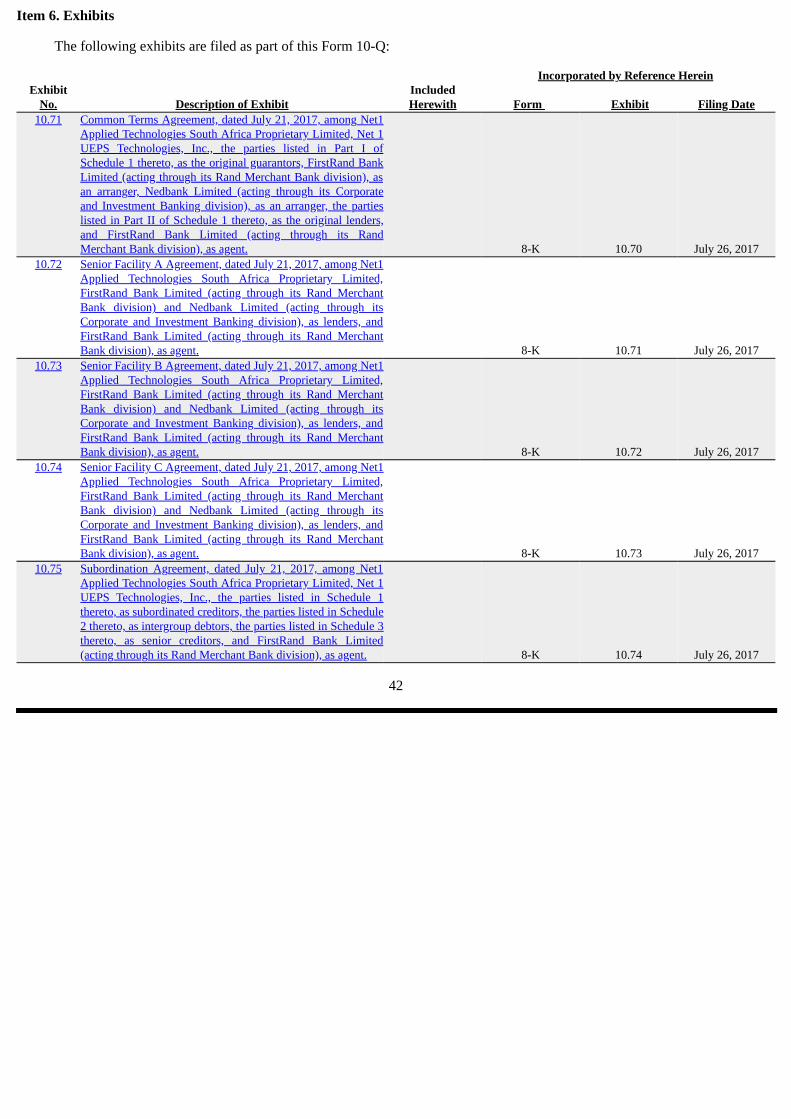
Item 6. Exhibits
The following exhibits are filed as part of this Form 10-Q:
Incorporated by Reference Herein Exhibit Included
No. Description of Exhibit Herewith Form Exhibit Filing Date10.71 Common Terms Agreement, dated July 21, 2017, among Net1
Applied Technologies South Africa Proprietary Limited, Net 1UEPS Technologies, Inc., the parties listed in Part I ofSchedule 1 thereto, as the original guarantors, FirstRand BankLimited (acting through its Rand Merchant Bank division), asan arranger, Nedbank Limited (acting through its Corporateand Investment Banking division), as an arranger, the partieslisted in Part II of Schedule 1 thereto, as the original lenders,and FirstRand Bank Limited (acting through its RandMerchant Bank division), as agent. 8-K 10.70 July 26, 2017
10.72 Senior Facility A Agreement, dated July 21, 2017, among Net1Applied Technologies South Africa Proprietary Limited,FirstRand Bank Limited (acting through its Rand MerchantBank division) and Nedbank Limited (acting through itsCorporate and Investment Banking division), as lenders, andFirstRand Bank Limited (acting through its Rand MerchantBank division), as agent. 8-K 10.71 July 26, 2017
10.73 Senior Facility B Agreement, dated July 21, 2017, among Net1Applied Technologies South Africa Proprietary Limited,FirstRand Bank Limited (acting through its Rand MerchantBank division) and Nedbank Limited (acting through itsCorporate and Investment Banking division), as lenders, andFirstRand Bank Limited (acting through its Rand MerchantBank division), as agent. 8-K 10.72 July 26, 2017
10.74 Senior Facility C Agreement, dated July 21, 2017, among Net1Applied Technologies South Africa Proprietary Limited,FirstRand Bank Limited (acting through its Rand MerchantBank division) and Nedbank Limited (acting through itsCorporate and Investment Banking division), as lenders, andFirstRand Bank Limited (acting through its Rand MerchantBank division), as agent. 8-K 10.73 July 26, 2017
10.75 Subordination Agreement, dated July 21, 2017, among Net1Applied Technologies South Africa Proprietary Limited, Net 1UEPS Technologies, Inc., the parties listed in Schedule 1thereto, as subordinated creditors, the parties listed in Schedule2 thereto, as intergroup debtors, the parties listed in Schedule 3thereto, as senior creditors, and FirstRand Bank Limited(acting through its Rand Merchant Bank division), as agent. 8-K 10.74 July 26, 2017
42
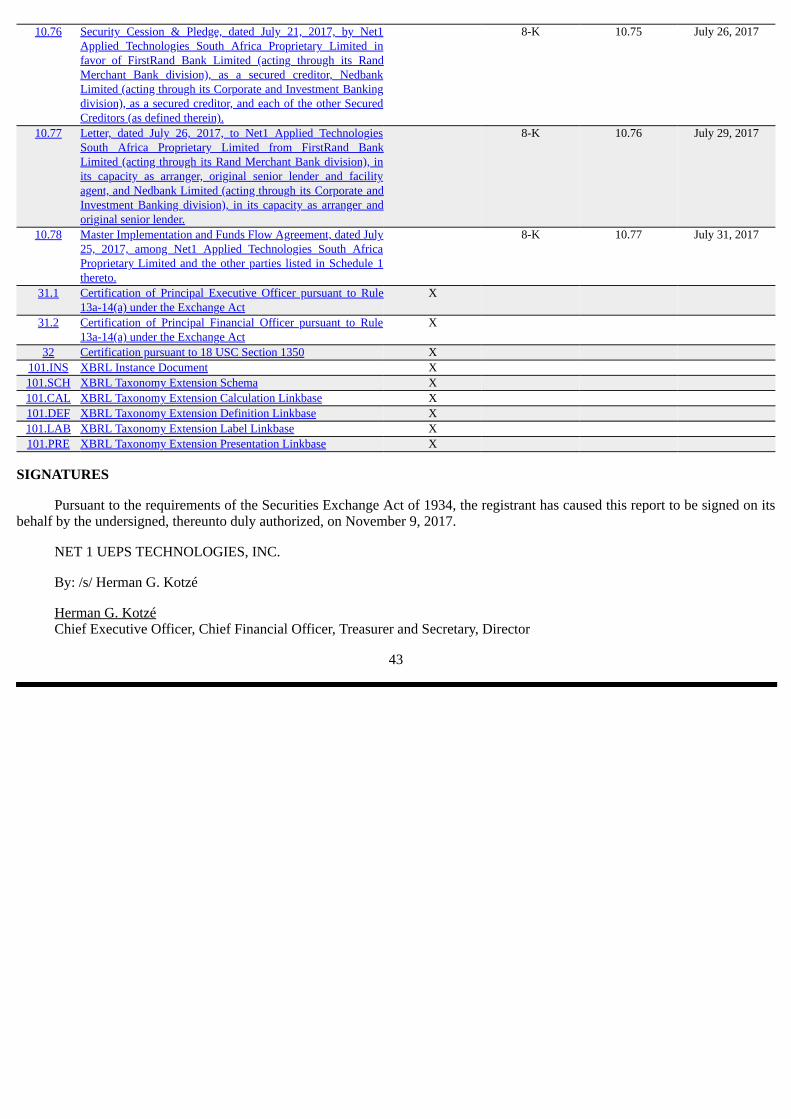
10.76 Security Cession & Pledge, dated July 21, 2017, by Net1Applied Technologies South Africa Proprietary Limited infavor of FirstRand Bank Limited (acting through its RandMerchant Bank division), as a secured creditor, NedbankLimited (acting through its Corporate and Investment Bankingdivision), as a secured creditor, and each of the other SecuredCreditors (as defined therein).
8-K 10.75 July 26, 2017
10.77 Letter, dated July 26, 2017, to Net1 Applied TechnologiesSouth Africa Proprietary Limited from FirstRand BankLimited (acting through its Rand Merchant Bank division), inits capacity as arranger, original senior lender and facilityagent, and Nedbank Limited (acting through its Corporate andInvestment Banking division), in its capacity as arranger andoriginal senior lender.
8-K 10.76 July 29, 2017
10.78 Master Implementation and Funds Flow Agreement, dated July25, 2017, among Net1 Applied Technologies South AfricaProprietary Limited and the other parties listed in Schedule 1thereto.
8-K 10.77 July 31, 2017
31.1 Certification of Principal Executive Officer pursuant to Rule13a-14(a) under the Exchange Act
X
31.2 Certification of Principal Financial Officer pursuant to Rule13a-14(a) under the Exchange Act
X
32 Certification pursuant to 18 USC Section 1350 X 101.INS XBRL Instance Document X 101.SCH XBRL Taxonomy Extension Schema X 101.CAL XBRL Taxonomy Extension Calculation Linkbase X101.DEF XBRL Taxonomy Extension Definition Linkbase X101.LAB XBRL Taxonomy Extension Label Linkbase X 101.PRE XBRL Taxonomy Extension Presentation Linkbase X
SIGNATURES
Pursuant to the requirements of the Securities Exchange Act of 1934, the registrant has caused this report to be signed on itsbehalf by the undersigned, thereunto duly authorized, on November 9, 2017.
NET 1 UEPS TECHNOLOGIES, INC.
By: /s/ Herman G. Kotzé
Herman G. Kotzé Chief Executive Officer, Chief Financial Officer, Treasurer and Secretary, Director
43

Exhibit 31.1
CERTIFICATION OF PRINCIPAL EXECUTIVE OFFICERPURSUANT TO RULES 13A-14(A) AND 15D-14(A)
UNDER THE SECURITIES EXCHANGE ACT OF 1934, AS AMENDED
I, Herman G. Kotzé, certify that:
1. I have reviewed this quarterly report on Form 10-Q of Net 1 UEPS Technologies, Inc. (“Net1”) for the quarter endedSeptember 30, 2017;
2. Based on my knowledge, this report does not contain any untrue statement of a material fact or omit to state a material factnecessary to make the statements made, in light of the circumstances under which such statements were made, not misleading withrespect to the period covered by this report;
3. Based on my knowledge, the financial statements, and other financial information included in this report, fairly present in allmaterial respects the financial condition, results of operations and cash flows of Net1 as of, and for, the periods presented in thisreport;
4. I am responsible for establishing and maintaining disclosure controls and procedures (as defined in Exchange Act Rules 13a-15(e) and 15d-15(e)) and internal control over financial reporting (as defined in Exchange Act Rules 13a-15(f) and 15d-15(f)) forNet1 and have:
(a) Designed such disclosure controls and procedures, or caused such disclosure controls and procedures to be designedunder our supervision, to ensure that material information relating to Net1, including its consolidated subsidiaries, is made knownto us by others within those entities, particularly during the period in which this report is being prepared;
(b) Designed such internal control over financial reporting, or caused such internal control over financial reporting to bedesigned under our supervision, to provide reasonable assurance regarding the reliability of financial reporting and the preparationof financial statements for external purposes in accordance with generally accepted accounting principles;
(c) Evaluated the effectiveness of Net1’s disclosure controls and procedures and presented in this report our conclusionsabout the effectiveness of the disclosure controls and procedures, as of the end of the period covered by this report based on suchevaluation; and
(d) Disclosed in this report any change in Net1’s internal control over financial reporting that occurred during Net1’s mostrecent fiscal quarter that has materially affected, or is reasonably likely to materially affect, Net1’s internal control over financialreporting; and
5. I have disclosed, based on our most recent evaluation of internal control over financial reporting, to Net1’s auditors and theAudit Committee of Net1’s Board of Directors (or persons performing the equivalent functions):
(a) All significant deficiencies and material weaknesses in the design or operation of internal control over financial reportingwhich are reasonably likely to adversely affect Net1’s ability to record, process, summarize and report financial information; and
(b) Any fraud, whether or not material, that involves management or other employees who have a significant role in Net1’sinternal control over financial reporting.
Date: November 9, 2017 /s/ Herman G. Kotzé Herman G. Kotzé Chief Executive Officer
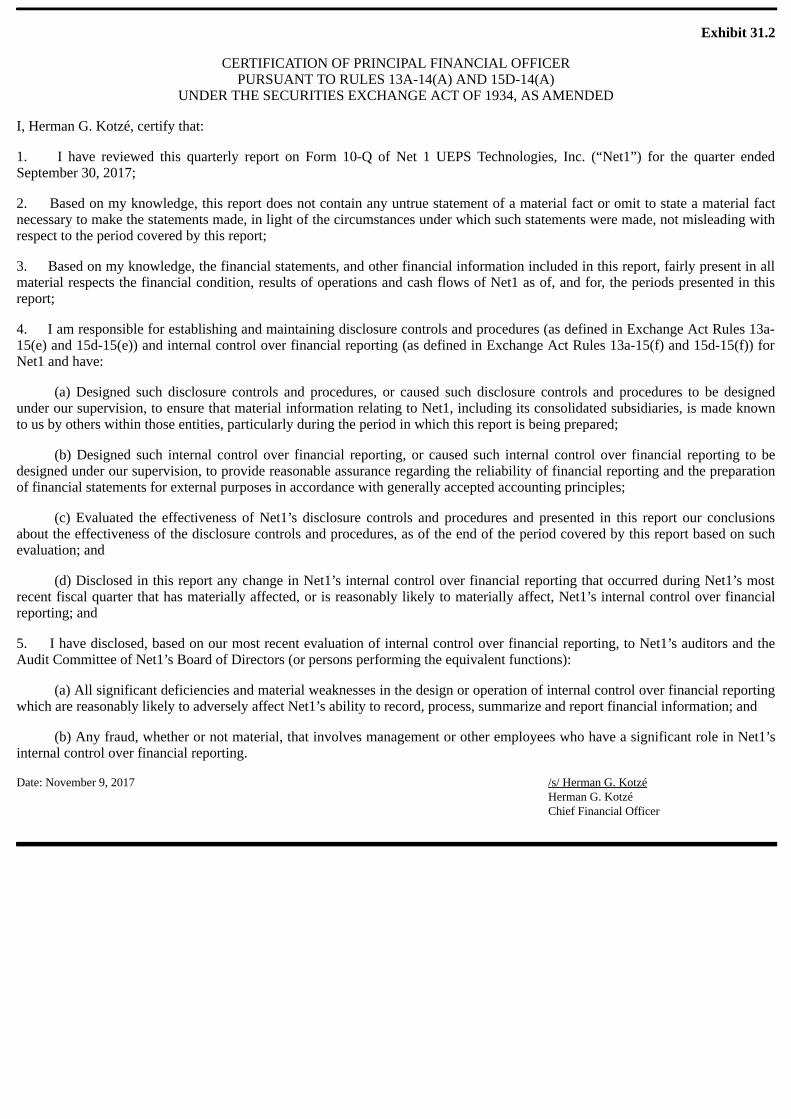
Exhibit 31.2
CERTIFICATION OF PRINCIPAL FINANCIAL OFFICERPURSUANT TO RULES 13A-14(A) AND 15D-14(A)
UNDER THE SECURITIES EXCHANGE ACT OF 1934, AS AMENDED
I, Herman G. Kotzé, certify that:
1. I have reviewed this quarterly report on Form 10-Q of Net 1 UEPS Technologies, Inc. (“Net1”) for the quarter endedSeptember 30, 2017;
2. Based on my knowledge, this report does not contain any untrue statement of a material fact or omit to state a material factnecessary to make the statements made, in light of the circumstances under which such statements were made, not misleading withrespect to the period covered by this report;
3. Based on my knowledge, the financial statements, and other financial information included in this report, fairly present in allmaterial respects the financial condition, results of operations and cash flows of Net1 as of, and for, the periods presented in thisreport;
4. I am responsible for establishing and maintaining disclosure controls and procedures (as defined in Exchange Act Rules 13a-15(e) and 15d-15(e)) and internal control over financial reporting (as defined in Exchange Act Rules 13a-15(f) and 15d-15(f)) forNet1 and have:
(a) Designed such disclosure controls and procedures, or caused such disclosure controls and procedures to be designedunder our supervision, to ensure that material information relating to Net1, including its consolidated subsidiaries, is made knownto us by others within those entities, particularly during the period in which this report is being prepared;
(b) Designed such internal control over financial reporting, or caused such internal control over financial reporting to bedesigned under our supervision, to provide reasonable assurance regarding the reliability of financial reporting and the preparationof financial statements for external purposes in accordance with generally accepted accounting principles;
(c) Evaluated the effectiveness of Net1’s disclosure controls and procedures and presented in this report our conclusionsabout the effectiveness of the disclosure controls and procedures, as of the end of the period covered by this report based on suchevaluation; and
(d) Disclosed in this report any change in Net1’s internal control over financial reporting that occurred during Net1’s mostrecent fiscal quarter that has materially affected, or is reasonably likely to materially affect, Net1’s internal control over financialreporting; and
5. I have disclosed, based on our most recent evaluation of internal control over financial reporting, to Net1’s auditors and theAudit Committee of Net1’s Board of Directors (or persons performing the equivalent functions):
(a) All significant deficiencies and material weaknesses in the design or operation of internal control over financial reportingwhich are reasonably likely to adversely affect Net1’s ability to record, process, summarize and report financial information; and
(b) Any fraud, whether or not material, that involves management or other employees who have a significant role in Net1’sinternal control over financial reporting.
Date: November 9, 2017 /s/ Herman G. Kotzé Herman G. Kotzé Chief Financial Officer

Exhibit 32
CERTIFICATIONPURSUANT TO 18 U.S.C. SECTION 1350, AS ADOPTED PURSUANT TO
SECTION 906 OF THE SARBANES-OXLEY ACT OF 2002
In connection with the quarterly report of Net 1 UEPS Technologies, Inc. (“Net1”) on Form 10-Q for the quarter endedSeptember 30, 2017, as filed with the Securities and Exchange Commission on the date hereof (the “Report”), Herman Kotzé,Chief Executive Officer, Chief Financial Officer, Treasurer and Secretary, of Net1, certifies, pursuant to 18 U.S.C. § 1350, that tohis knowledge:
1. The Report fully complies with the requirements of Section 13(a) or 15(d) of the Securities Exchange Act of 1934, as amended; and 2. The information contained in the Report fairly presents, in all material respects, the financial condition and results of operations of Net1.
Date: November 9, 2017 /s/: Herman Kotzé Name: Herman Kotzé Chief Executive Officer, Chief Financial Officer, Treasurer and Secretary
Related Documents