united states renal data system 2011 USRDS ANNUAL DATA REPORT volume two atlas of end-stage renal disease in the united states NATIONAL INSTITUTES OF HEALTH NATIONAL INSTITUTE OF DIABETES & DIGESTIVE & KIDNEY DISEASES DIVISION OF KIDNEY, UROLOGIC, & HEMATOLOGIC DISEASES

Welcome message from author
This document is posted to help you gain knowledge. Please leave a comment to let me know what you think about it! Share it to your friends and learn new things together.
Transcript
united states renal data system
2011 USRDS ANNUALDATA REPORTvolume twoatlas of end-stage renal disease in the united states
NATIONAL INSTITUTES OF HEALTHNATIONAL INSTITUTE OF DIABETES & DIGESTIVE & KIDNEY DISEASESDIVISION OF KIDNEY, UROLOGIC, & HEMATOLOGIC DISEASES

CONTENTS
précis » an introduction to ckd in the u.s. 27
1 ckd in the general population 37
2 identification and care of patients with ckd 45
3 morbidity and mortality in patients with ckd 59
4 cardiovascular disease in patients with ckd 69
5 prescription drug coverage 77
6 costs of ckd 91reference tables: ckd 101
analytical methods: ckd 119
chapter details 132list of esrd figures and tables
appearing each year 134esrd program highlights 136overview of esrd in the u.s. 138overview of infection and
hospitalization 140
introduction 142précis » an introduction
to esrd in the u.s. 147healthy people 2020 1671 incidence, prevalence,
patient characteristics, and modalities 183
2 clinical indicators and preventive care 195
3 hospitalization 2054 cardiovascular disease 2175 mortality 2256 prescription drug
coverage 233
7 transplantation 2478 pediatric esrd 2579 special studies 26710 esrd providers 27111 costs of esrd 28112 international comparisons 291reference tables: esrd 303
analytical methods: esrd 371usrds products and services 400glossary 406cms forms 411colophon 418
data requests 400data release agreement 409
page130
volume twoESRD
volume oneCKD

page131
My life has been a tapestry of rich and royal hue
An everlasting vision of the ever-changing view
A wondrous, woven magic in bits of blue and gold
A tapestry to feel and see, impossible to hold
Carole King, “Tapestry”
chapterdetails
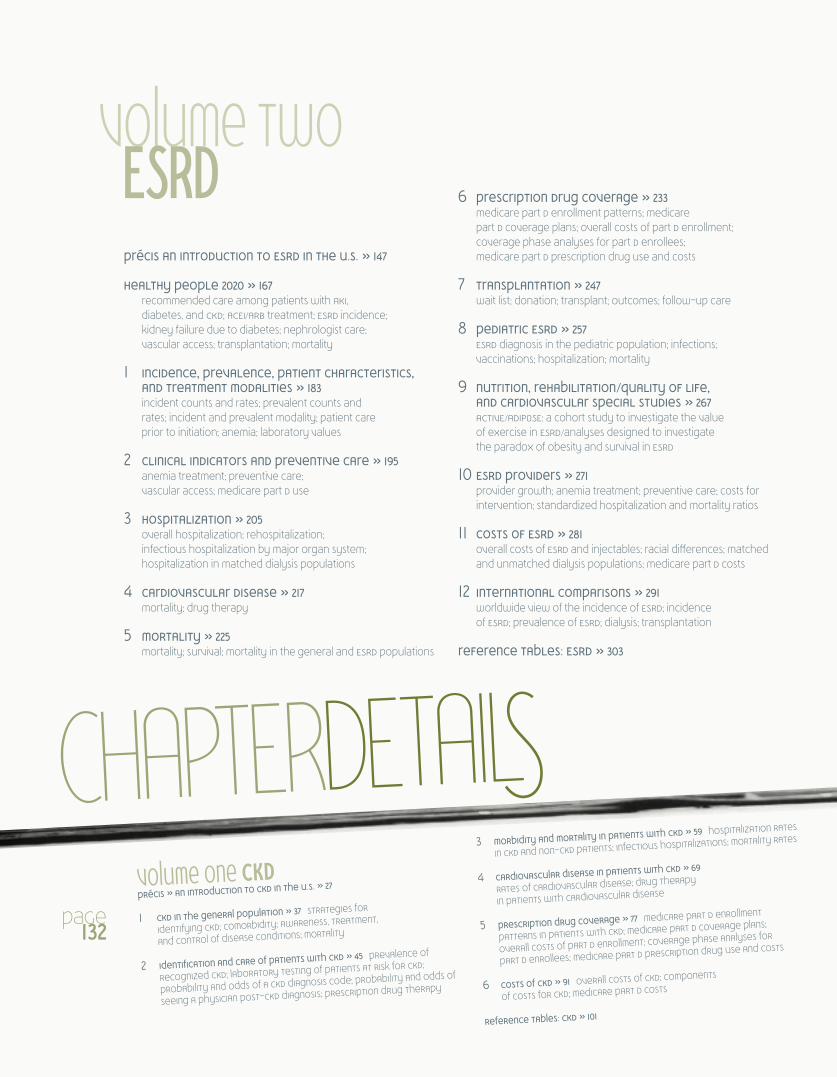
précis an introduction to esrd in the u.s. » 147
healthy people 2020 » 167recommended care among patients with aki, diabetes, and ckd; acei/arb treatment; esrd incidence; kidney failure due to diabetes; nephrologist care; vascular access; transplantation; mortality
1 incidence, prevalence, patient characteristics, and treatment modalities » 183incident counts and rates; prevalent counts and rates; incident and prevalent modality; patient care prior to initiation; anemia; laboratory values
2 clinical indicators and preventive care » 195anemia treatment; preventive care; vascular access; medicare part d use
3 hospitalization » 205overall hospitalization; rehospitalization; infectious hospitalization by major organ system; hospitalization in matched dialysis populations
4 cardiovascular disease » 217mortality; drug therapy
5 mortality » 225mortality; survival; mortality in the general and esrd populations
6 prescription drug coverage » 233medicare part d enrollment patterns; medicare part d coverage plans; overall costs of part d enrollment; coverage phase analyses for part d enrollees; medicare part d prescription drug use and costs
7 transplantation » 247wait list; donation; transplant; outcomes; follow-up care
8 pediatric esrd » 257esrd diagnosis in the pediatric population; infections; vaccinations; hospitalization; mortality
9 nutrition, rehabilitation/quality of life, and cardiovascular special studies » 267active/adipose: a cohort study to investigate the value of exercise in esrd/analyses designed to investigate the paradox of obesity and survival in esrd
10 esrd providers » 271provider growth; anemia treatment; preventive care; costs for intervention; standardized hospitalization and mortality ratios
11 costs of esrd » 281overall costs of esrd and injectables; racial differences; matched and unmatched dialysis populations; medicare part d costs
12 international comparisons » 291worldwide view of the incidence of esrd; incidence of esrd; prevalence of esrd; dialysis; transplantation
reference tables: esrd » 303
volume one ckdprécis » an introduction to ckd in the u.s. » 27
1 ckd in the general population » 37 strategies for
identifying ckd; comorbidity; awareness, treatment,
and control of disease conditions; mortality
2 identification and care of patients with ckd » 45 prevalence of
recognized ckd; laboratory testing of patients at risk for ckd;
probability and odds of a ckd diagnosis code; probability and odds of
seeing a physician post-ckd diagnosis; prescription drug therapy
3 morbidity and mortality in patients with ckd » 59 hospitalization rates
in ckd and non-ckd patients; infectious hospitalizations; mortality rates
4 cardiovascular disease in patients with ckd » 69
rates of cardiovascular disease; drug therapy
in patients with cardiovascular disease
5 prescription drug coverage » 77 medicare part d enrollment
patterns in patients with ckd; medicare part d coverage plans;
overall costs of part d enrollment; coverage phase analyses for
part d enrollees; medicare part d prescription drug use and costs
6 costs of ckd » 91 overall costs of ckd; components
of costs for ckd; medicare part d costs
reference tables: ckd » 101
page132
volume twoESRD

page133
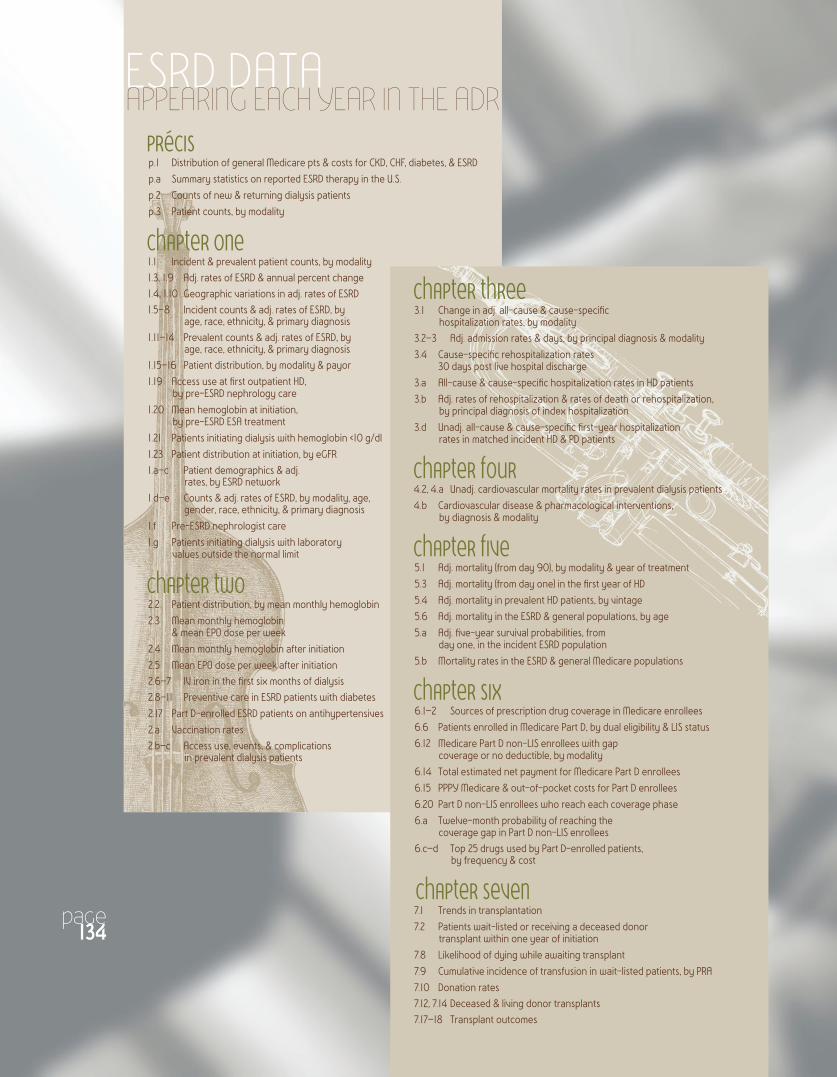
ESRD DATAAPPEARING EACH YEAR IN THE ADR
précis p.1 Distribution of general Medicare pts & costs for CKD, CHF, diabetes, & ESRDp.a Summary statistics on reported ESRD therapy in the U.S.p.2 Counts of new & returning dialysis patientsp.3 Patient counts, by modality
chapter one 1.1 Incident & prevalent patient counts, by modality1.3, 1.9 Adj. rates of ESRD & annual percent change1.4, 1.10 Geographic variations in adj. rates of ESRD1.5–8 Incident counts & adj. rates of ESRD, by
age, race, ethnicity, & primary diagnosis1.11–14 Prevalent counts & adj. rates of ESRD, by
age, race, ethnicity, & primary diagnosis1.15–16 Patient distribution, by modality & payor1.19 Access use at first outpatient HD,
by pre-ESRD nephrology care1.20 Mean hemoglobin at initiation,
by pre-ESRD ESA treatment1.21 Patients initiating dialysis with hemoglobin <10 g/dl1.23 Patient distribution at initiation, by eGFR1.a–c Patient demographics & adj.
rates, by ESRD network1.d–e Counts & adj. rates of ESRD, by modality, age,
gender, race, ethnicity, & primary diagnosis1.f Pre-ESRD nephrologist care1.g Patients initiating dialysis with laboratory
values outside the normal limit
chapter two 2.2 Patient distribution, by mean monthly hemoglobin2.3 Mean monthly hemoglobin
& mean EPO dose per week2.4 Mean monthly hemoglobin after initiation2.5 Mean EPO dose per week after initiation2.6–7 IV iron in the first six months of dialysis2.8–11 Preventive care in ESRD patients with diabetes2.17 Part D-enrolled ESRD patients on antihypertensives2.a Vaccination rates2.b–c Access use, events, & complications
in prevalent dialysis patients
chapter three 3.1 Change in adj. all-cause & cause-specific
hospitalization rates, by modality 3.2–3 Adj. admission rates & days, by principal diagnosis & modality3.4 Cause-specific rehospitalization rates
30 days post live hospital discharge3.a All-cause & cause-specific hospitalization rates in HD patients3.b Adj. rates of rehospitalization & rates of death or rehospitalization,
by principal diagnosis of index hospitalization3.d Unadj. all-cause & cause-specific first-year hospitalization
rates in matched incident HD & PD patients
chapter four4.2, 4.a Unadj. cardiovascular mortality rates in prevalent dialysis patients4.b Cardiovascular disease & pharmacological interventions,
by diagnosis & modality
chapter five5.1 Adj. mortality (from day 90), by modality & year of treatment 5.3 Adj. mortality (from day one) in the first year of HD5.4 Adj. mortality in prevalent HD patients, by vintage5.6 Adj. mortality in the ESRD & general populations, by age5.a Adj. five-year survival probabilities, from
day one, in the incident ESRD population5.b Mortality rates in the ESRD & general Medicare populations
chapter six 6.1–2 Sources of prescription drug coverage in Medicare enrollees6.6 Patients enrolled in Medicare Part D, by dual eligibility & LIS status6.12 Medicare Part D non-LIS enrollees with gap
coverage or no deductible, by modality6.14 Total estimated net payment for Medicare Part D enrollees6.15 PPPY Medicare & out-of-pocket costs for Part D enrollees6.20 Part D non-LIS enrollees who reach each coverage phase6.a Twelve-month probability of reaching the
coverage gap in Part D non-LIS enrollees6.c–d Top 25 drugs used by Part D-enrolled patients,
by frequency & cost
chapter seven 7.1 Trends in transplantation 7.2 Patients wait-listed or receiving a deceased donor
transplant within one year of initiation7.8 Likelihood of dying while awaiting transplant7.9 Cumulative incidence of transfusion in wait-listed patients, by PRA7.10 Donation rates7.12, 7.14 Deceased & living donor transplants 7.17–18 Transplant outcomes
page134

page135
7.19 Acute rejection within the first year post-transplant7.22 Primary diagnoses of cardiac & infectious hospitalizations post-transplant 7.23–24 Cumulative incidence of PTLD & diabetes7.25 Adj. rate of outcomes after transplant7.26 Causes of death with function7.27–28 Immunosuppression & induction antibody use7.29–31 Medication use in the first six months post-transplant7.32 Follow-up care & screening in the first 12 months
post-transplant, by age
chapter eight8.1 Incident & prevalent counts & adj. rates in the pediatric
ESRD population, by primary diagnosis8.a Distribution of incident ESRD pediatric patients, by primary diagnosis8.2–4 Rates of hospitalization in pediatric patients8.5–6 Vaccination rates in pediatric patients8.10 Adj. all-cause mortality rates in pediatric
patients in the first months of ESRD8.13 Adj. five-year survival in pediatric patients
chapter ten10.1 Distribution of patients, by unit affiliation10.3 Dialysis unit & patient counts, by unit affiliation10.4 Dialysis unit distribution, by affiliation & time managed10.5 Distribution of prevalent EPO-treated dialysis patients,
by hemoglobin level & unit affiliation10.6 IV iron use in dialysis patients, by type of iron & unit affiliation10.8 Mean total IV iron dose in the first six months of dialysis, by unit affiliation10.9 Dialysis patients with one or more transfusion events, by unit affiliation10.10–12 Preventive care in diabetic dialysis patients,
by unit affiliation & number of tests10.13–15 Vaccinations in dialysis patients, by unit affiliation10.16–17 PPPY costs for treatment & services in
dialysis patients, overall & by unit affiliation10.18–21 All-cause standardized hospitalization & mortality ratios
chapter eleven11.1 ESRD spending, by payor11.2 Costs of the Medicare & ESRD programs11.3 Estimated numbers of point prevalent ESRD patients11.4 Annual percent change in Medicare ESRD spending11.5 Total Medicare dollars spent on ESRD, by type of service11.6–7 Total Medicare ESRD expenditures overall & PPPY, by modality 11.9 Total Medicare spending for injectables 11.19 Total PPPY outpatient expenditures, by dialysis modality & race11.21–23 PPPY expenditures for ESAs, IV vitamin D, & IV iron11.26 Total Part D ESRD costs in the general Medicare & ESRD populations11.a Top 25 Part D prescription drugs used in the ESRD population
chapter twelve12.1 Comparison of unadjusted ESRD incidence & prevalence worldwide12.2 Geographic variations in the incidence of ESRD12.3, 12.a Incidence of ESRD12.4–5 Percentage of incident patients with ESRD due to diabetes12.6, 12.b Prevalence of ESRD12.7, 12.c Percent distribution of prevalent dialysis patients, by modality12.8, 12.d Prevalent rates of functioning grafts12.9, 12.e Transplant rates

patients 116,395 number of new esrd
patients, 2009 TABLE P.A
355 adjusted rate of incident esrd, 2009 PER MILLION POPULATION; FIGURE 1.6WHITE 277 • AFRICAN AMERICAN 976 • NATIVE AMERICAN 523 • ASIAN 403
16 adjusted rate of incident esrd in pediatric patients, 2009 PER MILLION POPULATION; FIGURE 8.1
571,414 number of prevalent esrd patients, 2009 TABLE P.A
1,738 adjusted rate of prevalent esrd, 2009 PER MILLION POPULATION; FIGURE 1.12WHITE 1,279 • AFRICAN AMERICAN 5,284 • NATIVE AMERICAN 2,735 • ASIAN 2,101
86 adjusted rate of prevalent esrd in pediatric patients, 2009 PER MILLION POPULATION; FIGURE 8.1
72% prevalent hemodialysis patients enrolled
in medicare part d, 2008 FIGURE 6.5
53% prevalent transplant patients enrolled
in medicare part d, 2008 FIGURE 6.5
patient care 52%
patients with hemoglobin <10 g/dl at initiation, 2009 TABLE 1.G
73% diabetic patients receiving two or
more a1c tests, 2008–2009 FIGURE 2.8
58% diabetic patients receiving two or
more lipid tests, 2008–2009 FIGURE 2.9
20% diabetic patients receiving two or
more eye examinations, 2008–2009 FIGURE 2.10
14% patients using a fistula at first
outpatient dialysis, 2009 FIGURE 2.12
55% prevalent patients using
a fistula, 2007 TABLE 2.B
outcomes 1.9 adjusted all-cause admission rate, 2008–2009
ADMISSIONS PER PATIENT YEAR; TABLE 3.AWHITE 1.91 • AFRICAN AMERICAN 1.96 • OTHER RACE 1.53
532 adjusted cardiovascular admission rate for hemodialysis patients, 2009 ADMISSIONS PER 1,000 PATIENT YEARS; FIGURE 3.3
458 adjusted rate of admission for infection among hemodialysis patients, 2009 ADMISSIONS PER 1,000 PATIENT YEARS; FIGURE 3.3
220 adjusted all-cause first-year mortality among 2009 incident patients DEATHS PER 1,000 PATIENT YEARS AT RISK; FIGURE 5.1HEMODIALYSIS 233 • PERITONEAL DIALYSIS 134 • TRANSPLANT 57
204 adjusted all-cause fifth-year mortality among 2004 incident patients DEATHS PER 1,000 PATIENT YEARS AT RISK; FIGURE 5.1HEMODIALYSIS 246 • PERITONEAL DIALYSIS 253 • TRANSPLANT 62
0.32 adjusted five-year survival probability among white esrd patients incident in 2004 TABLE 5.A
0.38 adjusted five-year survival probability among african american esrd patients incident in 2004 TABLE 5.A
page136
programHIGHLIGHTS
patient care 52%
patients with hemoglobin <10 g/dl at initiation, 2009 TABLE 1.G
73% diabetic patients receiving two or
more a1c tests, 2008–2009 FIGURE 2.8
58% diabetic patients receiving two or
more lipid tests, 2008–2009 FIGURE 2.9
20% diabetic patients receiving two or
more eye examinations, 2008–2009 FIGURE 2.10
14% patients using a fistula at first
outpatient dialysis, 2009 FIGURE 2.12
55% prevalent patients using
a fistula, 2007 TABLE 2.B
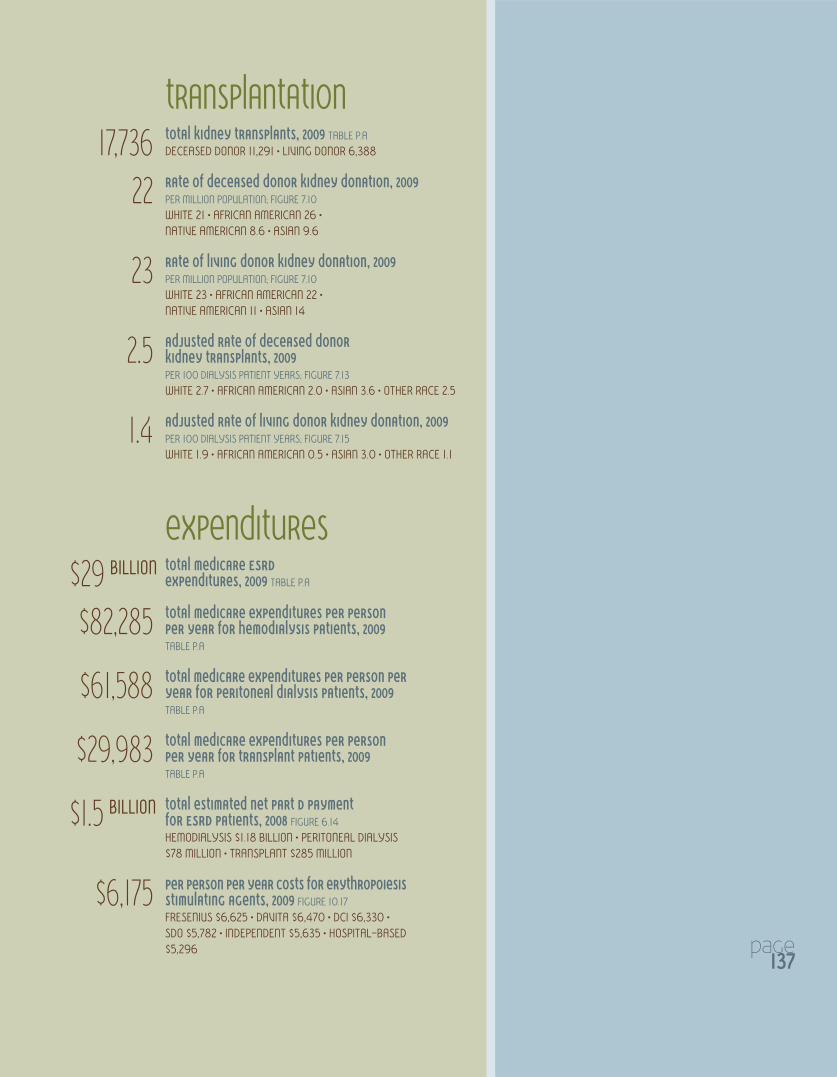
expenditures $29 billion total medicare esrd
expenditures, 2009 TABLE P.A
$82,285 total medicare expenditures per person per year for hemodialysis patients, 2009 TABLE P.A
$61,588 total medicare expenditures per person per year for peritoneal dialysis patients, 2009 TABLE P.A
$29,983 total medicare expenditures per person per year for transplant patients, 2009 TABLE P.A
$1.5 billion total estimated net part d payment for esrd patients, 2008 FIGURE 6.14HEMODIALYSIS $1.18 BILLION • PERITONEAL DIALYSIS $78 MILLION • TRANSPLANT $285 MILLION
$6,175 per person per year costs for erythropoiesis stimulating agents, 2009 FIGURE 10.17FRESENIUS $6,625 • DAVITA $6,470 • DCI $6,330 • SDO $5,782 • INDEPENDENT $5,635 • HOSPITAL-BASED $5,296
transplantation 17,736 total kidney transplants, 2009 TABLE P.A
DECEASED DONOR 11,291 • LIVING DONOR 6,388
22 rate of deceased donor kidney donation, 2009 PER MILLION POPULATION; FIGURE 7.10WHITE 21 • AFRICAN AMERICAN 26 • NATIVE AMERICAN 8.6 • ASIAN 9.6
23 rate of living donor kidney donation, 2009 PER MILLION POPULATION; FIGURE 7.10WHITE 23 • AFRICAN AMERICAN 22 • NATIVE AMERICAN 11 • ASIAN 14
2.5 adjusted rate of deceased donor kidney transplants, 2009 PER 100 DIALYSIS PATIENT YEARS; FIGURE 7.13WHITE 2.7 • AFRICAN AMERICAN 2.0 • ASIAN 3.6 • OTHER RACE 2.5
1.4 adjusted rate of living donor kidney donation, 2009 PER 100 DIALYSIS PATIENT YEARS; FIGURE 7.15WHITE 1.9 • AFRICAN AMERICAN 0.5 • ASIAN 3.0 • OTHER RACE 1.1
page137
80 81 82 83 84 85 86 87 88 89 90 91 92 93 94 95 96 97 98 99 00 01 02 03 04 05 06 07 08 09
80 84 88 92 96 00 04 080
20,000
40,000
60,000
80,000
100,000
120,000
80 84 88 92 96 00 04 080
100,000
200,000
300,000
400,000
500,000
600,000
New patients
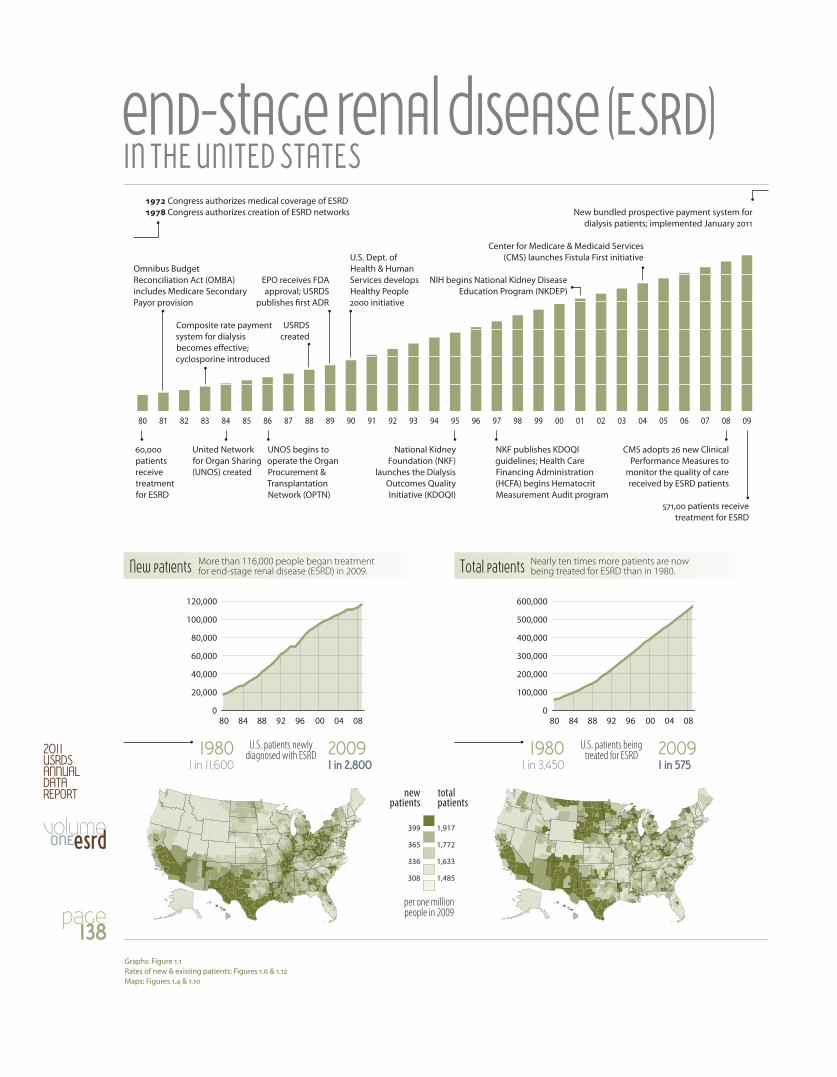
Omnibus Budget Reconciliation Act (OMBA) includes Medicare Secondary Payor provision
Composite rate payment system for dialysis becomes eff ective; cyclosporine introduced
1972 Congress authorizes medical coverage of ESRD1978 Congress authorizes creation of ESRD networks
EPO receives FDA approval; USRDS
publishes fi rst ADR
USRDS created
Center for Medicare & Medicaid Services (CMS) launches Fistula First initiative
New bundled prospective payment system for dialysis patients; implemented January 2011
U.S. Dept. of Health & Human Services develops Healthy People 2000 initiative
NIH begins National Kidney Disease Education Program (NKDEP)
United Network for Organ Sharing (UNOS) created
0,000 patients receive treatment for ESRD
Graphs: Figure 1.1Rates of new & existing patients: Figures 1. & 1.12Maps: Figures 1. & 1.10
1,00 patients receive treatment for ESRD
CMS adopts 2 new Clinical Performance Measures to
monitor the quality of care received by ESRD patients
UNOS begins to operate the Organ Procurement & Transplantation Network (OPTN)
National Kidney Foundation (NKF)
launches the Dialysis Outcomes Quality Initiative (KDOQI)
NKF publishes KDOQI guidelines; Health Care Financing Administration (HCFA) begins Hematocrit Measurement Audit program
enD-stAGe renAl dIseAse (ESRD)IN THE UNITED STATES
Total patientsMore than 116,000 people began treatment for end-stage renal disease (ESRD) in 2009.
U.S. patients newly diagnosed with ESRD
U.S. patients being treated for ESRD
per one million people in 2009
new patients
399
365
336
308
total patients
1,917
1,772
1,633
1,485
Nearly ten times more patients are now being treated for ESRD than in 1980.
19801 in 11,600
19801 in 3,450
20091 in 2,800
20091 in 575
85 88 91 94 97 00 03 06 09 0
100
200
300
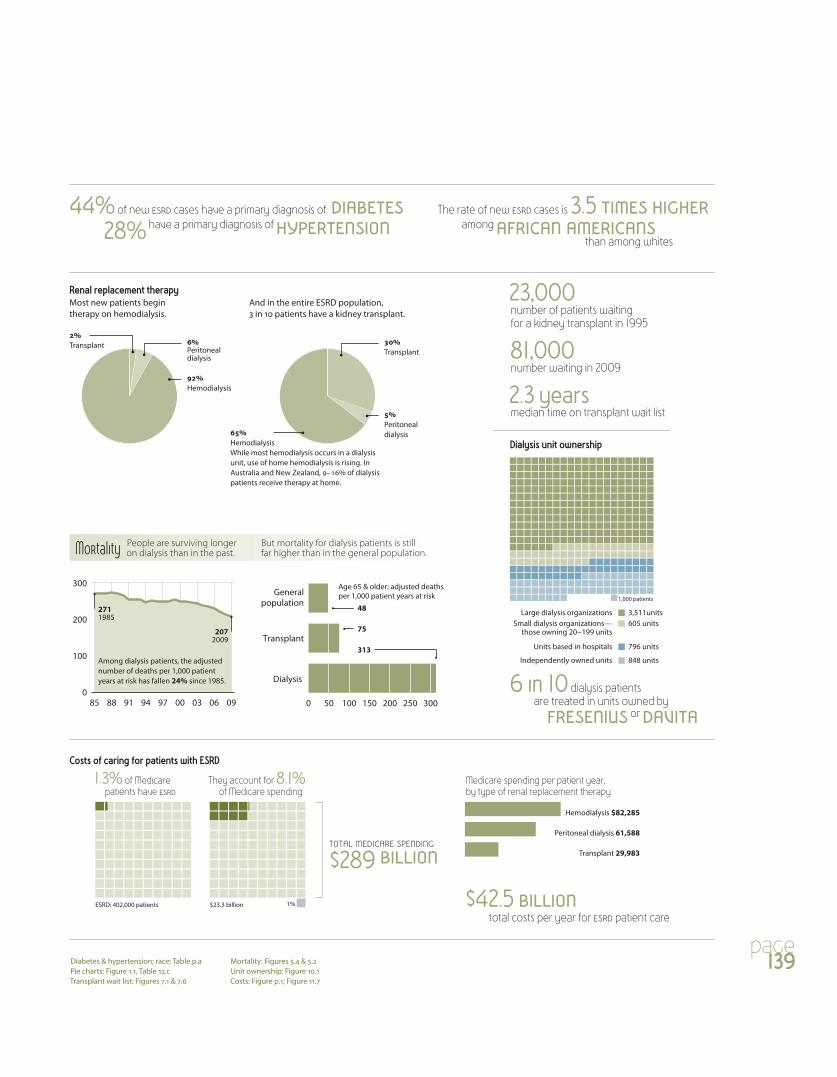
Among dialysis patients, the adjusted number of deaths per 1,000 patient years at risk has fallen 24% since 1985.
2711985
2072009
0 50 100 150 200 250 300
Dialysis
Transplant
Generalpopulation
Age 65 & older: adjusted deaths per 1,000 patient years at risk
48
75
313
ESRD: 402,000 patients $23.3 billion 1%
Hemodialysis $82,285
Peritoneal dialysis 61,588
Transplant 29,983
New patients All patientsNew patients All patients
Large dialysis organizations—those owning 20 or more units
Small dialysis organizations
Units based in hospitals
Independently owned units
3,330 units
438 units
806 units
927 units
1,000 patients
Large dialysis organizationsSmall dialysis organizations—
those owning 20−199 units
Units based in hospitals
Independently owned units
3,511units605 units
796 units
848 units
1,000 patients
Mortality
2%Transplant
92%Hemodialysis
65%HemodialysisWhile most hemodialysis occurs in a dialysis unit, use of home hemodialysis is rising. In Australia and New Zealand, 9–16% of dialysis patients receive therapy at home.
5%Peritoneal dialysis
Diabetes & hypertension; race: Table p.aPie charts: Figure 1.1, Table 12.cTransplant wait list: Figures .1 & .
Mortality: Figures . & .2Unit ownership: Figure 10.1Costs: Figure p.1; Figure 11.
6%Peritonealdialysis
30%Transplant
Renal replacement therapyMost new patients begin therapy on hemodialysis.
And in the entire ESRD population, in 10 patients have a kidney transplant.
People are surviving longer on dialysis than in the past.
But mortality for dialysis patients is still far higher than in the general population.
Dialysis unit ownership
Costs of caring for patients with ESRD
total medicare spending
$289 billion
44% of new esrd cases have a primary diagnosis of diabetes28% have a primary diagnosis of hypertension
6 in 10 dialysis patients are treated in units owned by fresenius or davita
23,000 number of patients waiting for a kidney transplant in 1995
81,000 number waiting in 2009
2.3 yearsmedian time on transplant wait list
$42.5 billiontotal costs per year for esrd patient care
The rate of new esrd cases is 3.5 times higheramong african americans than among whites
1.3% of Medicare patients have esrd
They account for 8.1% of Medicare spending
Medicare spending per patient year, by type of renal replacement therapy
2011 USRDS ANNUAL DATA REPORT
volumeoneesrd
page138
80 81 82 83 84 85 86 87 88 89 90 91 92 93 94 95 96 97 98 99 00 01 02 03 04 05 06 07 08 09
80 84 88 92 96 00 04 080
20,000
40,000
60,000
80,000
100,000
120,000
80 84 88 92 96 00 04 080
100,000
200,000
300,000
400,000
500,000
600,000
New patients
Omnibus Budget Reconciliation Act (OMBA) includes Medicare Secondary Payor provision
Composite rate payment system for dialysis becomes eff ective; cyclosporine introduced
1972 Congress authorizes medical coverage of ESRD1978 Congress authorizes creation of ESRD networks
EPO receives FDA approval; USRDS
publishes fi rst ADR
USRDS created
Center for Medicare & Medicaid Services (CMS) launches Fistula First initiative
New bundled prospective payment system for dialysis patients; implemented January 2011
U.S. Dept. of Health & Human Services develops Healthy People 2000 initiative
NIH begins National Kidney Disease Education Program (NKDEP)
United Network for Organ Sharing (UNOS) created
0,000 patients receive treatment for ESRD
Graphs: Figure 1.1Rates of new & existing patients: Figures 1. & 1.12Maps: Figures 1. & 1.10
1,00 patients receive treatment for ESRD
CMS adopts 2 new Clinical Performance Measures to
monitor the quality of care received by ESRD patients
UNOS begins to operate the Organ Procurement & Transplantation Network (OPTN)
National Kidney Foundation (NKF)
launches the Dialysis Outcomes Quality Initiative (KDOQI)
NKF publishes KDOQI guidelines; Health Care Financing Administration (HCFA) begins Hematocrit Measurement Audit program
enD-stAGe renAl dIseAse (ESRD)IN THE UNITED STATES
Total patientsMore than 116,000 people began treatment for end-stage renal disease (ESRD) in 2009.
U.S. patients newly diagnosed with ESRD
U.S. patients being treated for ESRD
per one million people in 2009
new patients
399
365
336
308
total patients
1,917
1,772
1,633
1,485
Nearly ten times more patients are now being treated for ESRD than in 1980.
19801 in 11,600
19801 in 3,450
20091 in 2,800
20091 in 575
85 88 91 94 97 00 03 06 09 0
100
200
300
Among dialysis patients, the adjusted number of deaths per 1,000 patient years at risk has fallen 24% since 1985.
2711985
2072009
0 50 100 150 200 250 300
Dialysis
Transplant
Generalpopulation
Age 65 & older: adjusted deaths per 1,000 patient years at risk
48
75
313
ESRD: 402,000 patients $23.3 billion 1%
Hemodialysis $82,285
Peritoneal dialysis 61,588
Transplant 29,983
New patients All patientsNew patients All patients
Large dialysis organizations—those owning 20 or more units
Small dialysis organizations
Units based in hospitals
Independently owned units
3,330 units
438 units
806 units
927 units
1,000 patients
Large dialysis organizationsSmall dialysis organizations—
those owning 20−199 units
Units based in hospitals
Independently owned units
3,511units605 units
796 units
848 units
1,000 patients
Mortality
2%Transplant
92%Hemodialysis
65%HemodialysisWhile most hemodialysis occurs in a dialysis unit, use of home hemodialysis is rising. In Australia and New Zealand, 9–16% of dialysis patients receive therapy at home.
5%Peritoneal dialysis
Diabetes & hypertension; race: Table p.aPie charts: Figure 1.1, Table 12.cTransplant wait list: Figures .1 & .
Mortality: Figures . & .2Unit ownership: Figure 10.1Costs: Figure p.1; Figure 11.
6%Peritonealdialysis
30%Transplant
Renal replacement therapyMost new patients begin therapy on hemodialysis.
And in the entire ESRD population, in 10 patients have a kidney transplant.
People are surviving longer on dialysis than in the past.
But mortality for dialysis patients is still far higher than in the general population.
Dialysis unit ownership
Costs of caring for patients with ESRD
total medicare spending
$289 billion
44% of new esrd cases have a primary diagnosis of diabetes28% have a primary diagnosis of hypertension
6 in 10 dialysis patients are treated in units owned by fresenius or davita
23,000 number of patients waiting for a kidney transplant in 1995
81,000 number waiting in 2009
2.3 yearsmedian time on transplant wait list
$42.5 billiontotal costs per year for esrd patient care
The rate of new esrd cases is 3.5 times higheramong african americans than among whites
1.3% of Medicare patients have esrd
They account for 8.1% of Medicare spending
Medicare spending per patient year, by type of renal replacement therapy
page139
InfectIon and hosPItalIzatIonIN THE ESRD POPULATION
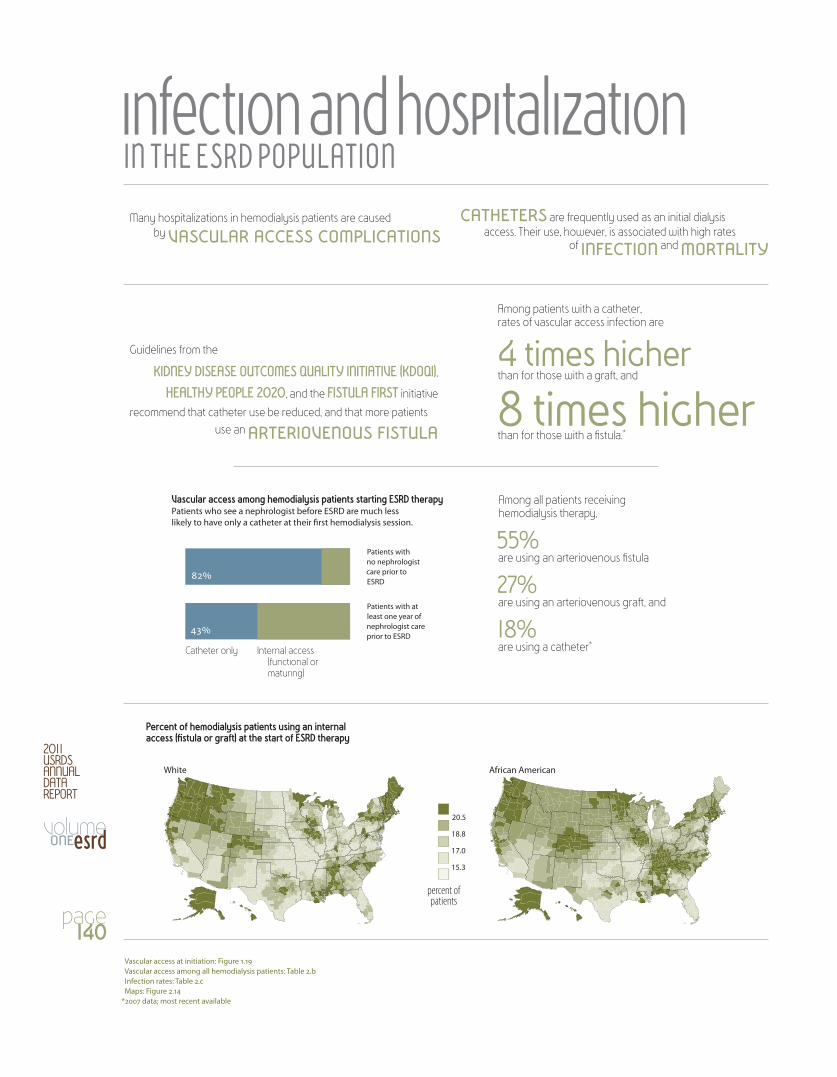
Patients with no nephrologist care prior to ESRD
82%
43%
Patients with at least one year of nephrologist care prior to ESRD
White African American
Many hospitalizations in hemodialysis patients are caused by vascular access complications
catheters are frequently used as an initial dialysisaccess. Their use, however, is associated with high rates
of infection and mortality
Among patients with a catheter, rates of vascular access infection are
4 times higherthan for those with a graft, and
8 times higherthan for those with a fi stula.*
Guidelines from the
KIDNEY DISEASE OUTCOMES QUALITY INITIATIVE (KDOQI), HEALTHY PEOPLE 2020, and the FISTULA FIRST initiative
recommend that catheter use be reduced, and that more patientsuse an arteriovenous fistula
Among all patients receiving hemodialysis therapy,
55% are using an arteriovenous fi stula
27% are using an arteriovenous graft, and
18%are using a catheter*
Catheter only Internal access (functional or maturing)
Vascular access among hemodialysis patients starting ESRD therapyPatients who see a nephrologist before ESRD are much less likely to have only a catheter at their fi rst hemodialysis session.
Vascular access at initiation: Figure 1.19Vascular access among all hemodialysis patients: Table 2.bInfection rates: Table 2.cMaps: Figure 2.1
*200 data; most recent available
Percent of hemodialysis patients using an internal access (fi stula or graft) at the start of ESRD therapy
percent of patients
20.5
18.8
17.0
15.3
0
50
100
150
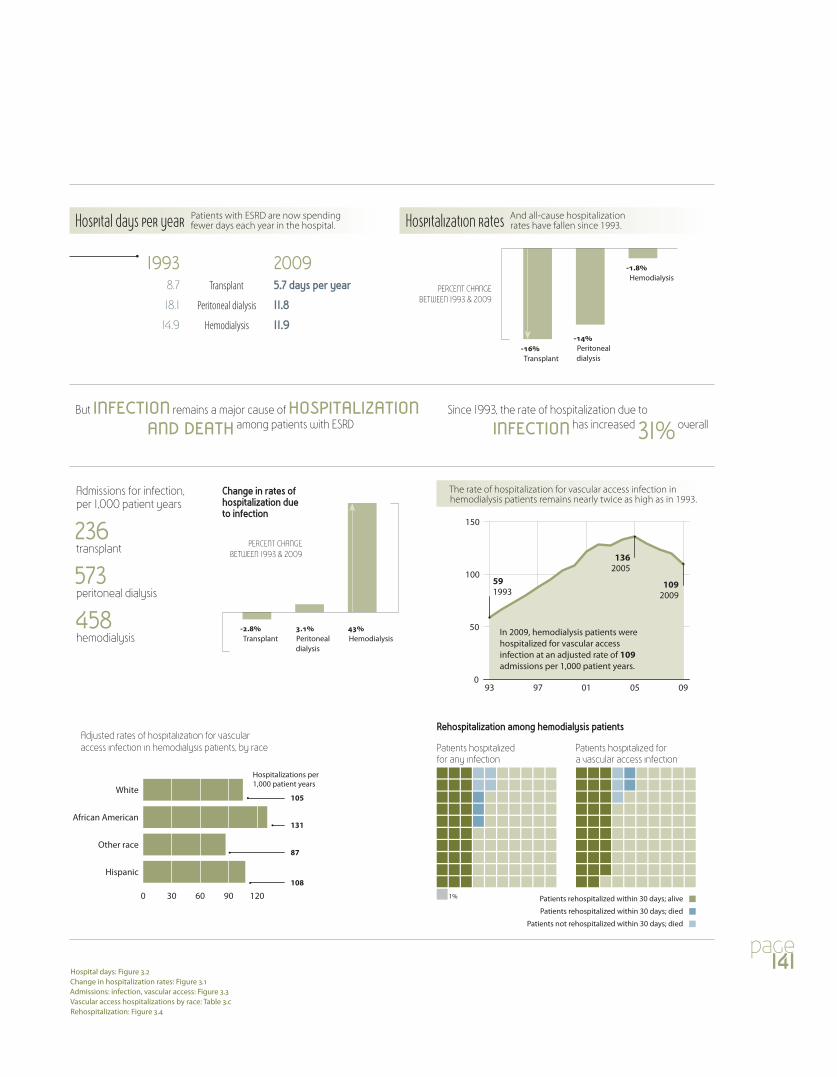
In 2009, hemodialysis patients were hospitalized for vascular access infection at an adjusted rate of 109 admissions per 1,000 patient years.
591993
1092009
1362005
93 09050197
0 30 60 90 120
White
African American
Other race
Hispanic
Hospitalizations per 1,000 patient years
105
131
87
108
19938.7
18.1
14.9
Hospital days per year Hospitalization ratesPatients with ESRD are now spending fewer days each year in the hospital.
And all-cause hospitalization rates have fallen since 1993.
Transplant
Peritoneal dialysis
Hemodialysis
20095.7 days per year
11.8
11.9
-16%Transplant
-14%Peritoneal dialysis
-1.8%Hemodialysis
PERCENT CHANGE BETWEEN 1993 & 2009
But infection remains a major cause of hospitalizationand death among patients with ESRD
Since 1993, the rate of hospitalization due to
infection has increased 31% overall
-2.8%Transplant
3.1%Peritoneal dialysis
43%Hemodialysis
PERCENT CHANGE BETWEEN 1993 & 2009
Change in rates of hospitalization due to infection
Admissions for infection, per 1,000 patient years
236 transplant
573 peritoneal dialysis
458hemodialysis
Patients hospitalized for any infection
Patients hospitalized for a vascular access infection
Rehospitalization among hemodialysis patients
Hospital days: Figure .2Change in hospitalization rates: Figure .1Admissions: infection, vascular access: Figure .Vascular access hospitalizations by race: Table .cRehospitalization: Figure .
Adjusted rates of hospitalization for vascular access infection in hemodialysis patients, by race
The rate of hospitalization for vascular access infection in hemodialysis patients remains nearly twice as high as in 1993.
Patients rehospitalized within 30 days; alive
Patients rehospitalized within 30 days; died
Patients not rehospitalized within 30 days; died
1%
2011 USRDS ANNUAL DATA REPORT
volumeoneesrd
page140
InfectIon and hosPItalIzatIonIN THE ESRD POPULATION
Patients with no nephrologist care prior to ESRD
82%
43%
Patients with at least one year of nephrologist care prior to ESRD
White African American
Many hospitalizations in hemodialysis patients are caused by vascular access complications
catheters are frequently used as an initial dialysisaccess. Their use, however, is associated with high rates
of infection and mortality
Among patients with a catheter, rates of vascular access infection are
4 times higherthan for those with a graft, and
8 times higherthan for those with a fi stula.*
Guidelines from the
KIDNEY DISEASE OUTCOMES QUALITY INITIATIVE (KDOQI), HEALTHY PEOPLE 2020, and the FISTULA FIRST initiative
recommend that catheter use be reduced, and that more patientsuse an arteriovenous fistula
Among all patients receiving hemodialysis therapy,
55% are using an arteriovenous fi stula
27% are using an arteriovenous graft, and
18%are using a catheter*
Catheter only Internal access (functional or maturing)
Vascular access among hemodialysis patients starting ESRD therapyPatients who see a nephrologist before ESRD are much less likely to have only a catheter at their fi rst hemodialysis session.
Vascular access at initiation: Figure 1.19Vascular access among all hemodialysis patients: Table 2.bInfection rates: Table 2.cMaps: Figure 2.1
*200 data; most recent available
Percent of hemodialysis patients using an internal access (fi stula or graft) at the start of ESRD therapy
percent of patients
20.5
18.8
17.0
15.3
0
50
100
150
In 2009, hemodialysis patients were hospitalized for vascular access infection at an adjusted rate of 109 admissions per 1,000 patient years.
591993
1092009
1362005
93 09050197
0 30 60 90 120
White
African American
Other race
Hispanic
Hospitalizations per 1,000 patient years
105
131
87
108
19938.7
18.1
14.9
Hospital days per year Hospitalization ratesPatients with ESRD are now spending fewer days each year in the hospital.
And all-cause hospitalization rates have fallen since 1993.
Transplant
Peritoneal dialysis
Hemodialysis
20095.7 days per year
11.8
11.9
-16%Transplant
-14%Peritoneal dialysis
-1.8%Hemodialysis
PERCENT CHANGE BETWEEN 1993 & 2009
But infection remains a major cause of hospitalizationand death among patients with ESRD
Since 1993, the rate of hospitalization due to
infection has increased 31% overall
-2.8%Transplant
3.1%Peritoneal dialysis
43%Hemodialysis
PERCENT CHANGE BETWEEN 1993 & 2009
Change in rates of hospitalization due to infection
Admissions for infection, per 1,000 patient years
236 transplant
573 peritoneal dialysis
458hemodialysis
Patients hospitalized for any infection
Patients hospitalized for a vascular access infection
Rehospitalization among hemodialysis patients
Hospital days: Figure .2Change in hospitalization rates: Figure .1Admissions: infection, vascular access: Figure .Vascular access hospitalizations by race: Table .cRehospitalization: Figure .
Adjusted rates of hospitalization for vascular access infection in hemodialysis patients, by race
The rate of hospitalization for vascular access infection in hemodialysis patients remains nearly twice as high as in 1993.
Patients rehospitalized within 30 days; alive
Patients rehospitalized within 30 days; died
Patients not rehospitalized within 30 days; died
1%
page141
2011 USRDS ANNUAL DATA REPORT
volumetwoesrd
page142
introduction to volume two » esrd
As noted in the introduction to Volume One, this year we use lyrics from American music to illustrate the human impact of kidney disease, with quotations that express some of the many emotions of the human spirit. Across the many perspectives and cultures represented in the United States, music draws on the unique viewpoints of songwriters and their relation-ships to the society in which they find themselves. So too does kidney disease have a unique and profound impact on dif-ferent populations, creating daily challenges in adapting to a life-changing disease.
The longing tones of the violin evoke the ways in which our hearts reach out to those living with the challenges of kidney disease. At the same time, seeing the versatility of the people affected by this disease is similar to watching an orchestra of diverse instruments harmonize in a unique arrangement, one that touches us on multiple levels. We hope that the use of music as a framework for this ADR helps us connect further to the varied audiences who read this document and use its information to guide healthcare for a vulnerable population of patients.
Volume Two continues to focus on ESRD, and on the his-torical surveillance data that were the basis of the first USRDS
reports. We summarize the ESRD program in the United States, and examine public health issues such as morbidity and mortality in the first year of therapy — an area in which there has been little progress over the last ten years. This year, however, we show that first-year survival has begun to improve, in parallel to the improved survival after the first year of treatment, something we have observed for a number of years.
At the end of 2009, the ESRD program was treating 571,414 dialysis and transplant patients — a 4.0 percent increase from 2008. There were 116,395 new cases of ESRD reported, 3.5 percent more than in 2008, and the largest increase since 2000. Growth in the incident population should, however, be viewed with caution, as it may take several years to deter-mine if the increase will be sustained. Late reporting of data is always an issue, as complete and stable incident counts sometimes take several years to be finalized.
In this year’s Précis we again provide an overview of ESRD patients in the U.S., their care, and their expenditures. We examine pre-ESRD care as reported on the ESRD Medical Evi-dence (ME) form (CMS form 2728), used to register all ESRD patients. We also look at dialysis modality use, the transplant
This is the twenty-third annual report on the end-stage renal disease (ESRD) program in the United States, and the twelfth in our atlas series, which provides an in-depth, graphic presentation of data spanning the last quarter century.

page143
wait list, and indicators of quality of care, and illustrate recent changes in hospitalization rates, mortality rates, and five-year survival in the dialysis population. Prevalent death rates have been falling for a number of years, and death rates in the first year of dialysis have declined since 2004. Figures on ESRD expenditures show per person and total costs in the program. Total Medicare expenditures for separately billed intravenous medications have been stable since 2004, reflecting changes in payment policies implemented by CMS.
Next we provide a full layout of the new Healthy People 2020 goals related to kidney disease. Many of the goals are new to the Healthy People chapter, and, in consultation with the HP2020 group at DHHS and the CDC, we will further develop related data in upcoming reports.
Chapter One consolidates information on incidence, prev-alence, patient characteristics, and modalities of therapy. As in prior years, we illustrate trends in incidence and preva-lence by age, gender, race, and ethnicity, and present data on modality use and insurance coverage. We examine nephrol-ogy referral prior to ESRD, and look at levels of estimated kid-ney function at initiation, using both the MDRD and CKD-EPI formulas. And we present data on the degree of anemia at initiation, on pre-ESRD treatment with erythropoiesis stimu-lating agents (ESAs), and, from the most recent version of the Medical Evidence form, on serum albumin, hemoglobin, cho-lesterol, triglycerides, and hemoglobin A1c levels at initiation.
Chapter Two, on clinical indicators of care, assesses dialy-sis adequacy, vascular access, anemia treatment, anemia correction in the first months of ESRD, IV iron therapy, and preventive care in the diabetic and general ESRD populations. We look, for instance, at the marked differences in vascular access complication rates associated with the use of fistulas, catheters, and grafts. New this year is information on pre-scription medication use under the new Medicare Part D benefit, first implemented in January, 2006. We assess data from 2008, the program’s second full year, looking at differ-ences in medication use among patients with and without
the low income subsidy, in the daily number of medications, and in use of antihypertensive medications, lipid lowering agents, oral vitamin D analogs, phosphate binders, and anti-diabetes agents.
Data on hospitalization and mortality are presented in Chapter Three. In the prevalent hemodialysis popula-tion, rates of hospitalization due to infection declined in 2006–2007, rose in 2008, and fell slightly in 2009; they remain, however, 43 percent higher than in 1993. Catheter placement rates have fallen (as shown in the HP2020 chapter), but there is concern that increased use of permanent cuffed catheters may expose patients to a long-term risk of infec-tion. Rates of hospitalization for vascular access infection have also declined, but those due to bacteremia/sepsis have increased, possibly due to a changing classification of these complications. A concurrent decrease in access infections in the peritoneal dialysis population suggests that these trends may be affected by factors outside of the dialysis populations themselves, but may also reflect the use of hemodialysis cath-eters in peritoneal dialysis patients whose peritoneal dialysis catheter has failed and who are waiting for placement of a new one in order to resume therapy.
New this year is a section on rehospitalization after a prior discharge. Twenty-two percent of hemodialysis patients are rehospitalized within 14 days of discharge, and 36 percent are readmitted within 30 days — a number substantially higher than the 20 percent reported for the general Medicare popu-lation (Jencks et al.).
We next look at further at hospitalizations due to infec-tion, adding data by organ system to give a more complete picture of this area of morbidity. We then conclude the chapter by looking at hospitalizations in matched dialysis populations. Comparisons of hemodialysis and peritoneal dialysis patients are challenging, since there is substantial selection bias in those treated with peritoneal dialysis. This year we compare hemodialysis patients, peritoneal dialysis patients, and hemodialysis patients matched to those on

2011 USRDS ANNUAL DATA REPORT
volumetwoesrd
page144
introduction to volume two » esrd
peritoneal dialysis, looking at hospital admissions in the first and second years after the initiation of ESRD therapy.
In Chapter Four we examine cardiovascular disease in patients with ESRD, beginning with data on cardiovas-cular mortality, then looking at prescription drug therapy used by patients with various cardiovascular diagnoses and by those undergoing cardiovascular procedures such as revascularization.
We begin Chapter Five, on mortality, by highlighting trends in the first and subsequent years on ESRD therapy, with data now showing similar reductions in mortality rates among patients of all vintages. Figures then detail mortal-ity during the first year of hemodialysis, illustrating a sharp increase in all-cause rates in month two of treatment, fol-lowing by a steady decline during the rest of the year. Five-year survival has been improving slowly, but survival in the first six months of treatment has changed little since 1996. The issue of early survival clearly merits increased attention, and the role of infectious complications — particularly those related to dialysis catheters — needs to be addressed. Perhaps the changing incentives in the new bundled payment system, directed at lowering costs and complications, may translate to reductions in the use of dialysis catheters and to a focus on preventive care.
New this year is a chapter focused on use of the Medi-care Part D prescription drug benefit in the ESRD popula-tion. In Chapter Six we show, for example, that CKD, dialysis, and transplant patients are quite different from those in the general Medicare population in their use of the low income subsidy (LIS). Heavy use of LIS among ESRD patients is also reflected in the proportion of patients who reach the cover-age gap. The chapter includes data on Medicare costs for the Part D benefit, on out-of-pocket expenditures for enrollees, and on the most frequently used and most expensive drugs.
As we illustrate in Chapter Seven, the number of trans-plants from deceased donors has slightly declined from its peak of 10,906 in 2006 to 10,679 in 2009, while the number
from living donors has rebounded to 5,981, a level just below the 6,028 reported for 2006. Waiting times continue to grow, due to the continued shortage of donated kidneys. And death with a functioning graft continues to be a concern, with car-diovascular disease accounting for 30 percent of deaths with a known cause. The rate of influenza vaccinations among transplant patients is still far lower than that in the dialysis population, with very little progress since 1991.
In Chapter Eight, on the pediatric ESRD population, we lead with data on incidence and prevalence since 1980, and present data on the full breadth of diseases that have accounted for new ESRD cases in pediatric patients over the last decade. Rates of influenza vaccinations in this popula-tion continue to be low, with fewer than one in three children receiving this treatment, despite their high rates of pneumo-nia and other respiratory infections. In contrast to adults, for whom hospitalization rates are high in the first months of dialysis and decline within the first year, children have pro-gressively higher rates over the first 15 months after the ini-tiation of ESRD therapy. Death rates in children are highest in the first six months of treatment, particularly for those younger than five. And as noted last year, five-year survival among children with ESRD has not changed in more than a decade.
In Chapter Nine, the Special Studies Centers of the USRDS — Nutrition, Rehabilitation/Quality of Life, and Car-diovascular — outline details of ACTIVE/ADIPOSE: A Cohort Study to Investigate the Value of Exercise in ESRD/Analyses Designed to Investigate the Paradox of Obesity and Sur-vival in ESRD. A prospective, multi-center study of prevalent hemodialysis patients, the study will be conducted in collabo-ration with the NIH/NIDDK Division of Kidney, Urologic, and Hematologic Diseases and the USRDS Coordinating Center.
The landscape of dialysis providers continued to evolve in 2009, with growth in some of the smaller dialysis orga-nizations (SDOs). Large dialysis organizations (LDOs) now treat 63 percent of dialysis patients in the United States; SDOs
page145
account for 11.6 percent, hospital-based units 10 percent, and independently owned units 15 percent. In Chapter Ten we provide data on the duration of unit ownership among both the consolidated and remaining providers. We also address iron dosing practices and transfusion use, and costs for inter-vention and preventive care. Comparisons of standardized hospitalization and mortality ratios show that hospital-based units have substantially narrowed the gap in outcomes over the past five years, with ratios now only 7 percent higher than the national average, compared to 20 percent in the past.
Chapter Eleven, on expenditures related to ESRD, begins with data on total spending by type of insurer. After a large increase in 2008, the change in expenditures between 2008 and 2009 was the lowest since 1998. The chapter includes data on expenditure patterns for injectable medications and laboratory testing, and we use the matched hemodialysis and peritoneal dialysis populations to better compare expendi-tures across modalities; such comparisons may influence modality use under the new CMS bundled payment system. We conclude with new data on costs associated with the Part D prescription drug benefit.
In Chapter Twelve we summarize data from the inter-national community. We are again grateful to the registries providing this information, allowing us to see the U.S. ESRD community through a wider lens.
Most of the 2011 ADR contains data through December 31, 2009; data on patient characteristics, obtained from the Med-ical Evidence form, are complete through June, 2010. Only Medicare Part D data through 2008 were available for this ADR; more recent data should be available for the 2012 edition.
Current estimated incident and prevalent counts can be found on the USRDS website.
render and the researcher’s guide Our real-time online query system allows users to build data tables and maps. The Renal Data Extraction and Referencing System (RenDER) can be accessed on our website.
To assist users of USRDS data, the Coordinating Center (CC) annually updates the Researcher’s Guide, which pro-vides information on all analytical methods used by the CC, along with a detailed index of files and variables in the USRDS researcher datasets. It is available on our website in PDF format.
usrds databaseThe USRDS dataset is a living record of patient care in the United States, continually updated with new data. Delays in data reporting are unavoidable, and we add late information as soon as it becomes available. This includes data from the Medical Evidence form, claims for hospital and physician services, and updates of the Medicare Enrollment Database received after the ADR has gone to press.
administrative oversightProject Officers (POs) Lawrence Agodoa, MD, and Paul Egg-ers, PhD, provide direct oversight of the CC and Special Stud-ies Centers (SSCs), and members of CMS, the ESRD networks, and the renal community provide crucial input and feedback through their committee participation.
The Steering Committee, the governing body of the USRDS, is responsible for the operations of the CC and SSCs. It works under the direction of the POs, and includes representatives from CMS, the National Institutes of Health, the CC, and the SSCs. Its responsibilities include coordination among the cen-ters, study design, project tracking, data management and validation, assurance of data availability for researchers and government officials, and oversight of ADR production.
The USRDS External Advisory Committee plays a major role in advising POs on special studies, data studies, and analyses. It is also responsible for reviewing manuscripts and ADRs.
The Special Studies Review and Implementation Commit-tee, the operations committee for SSC proposals and CC proj-ect support, is a collaboration of CMS, the ESRD networks, and
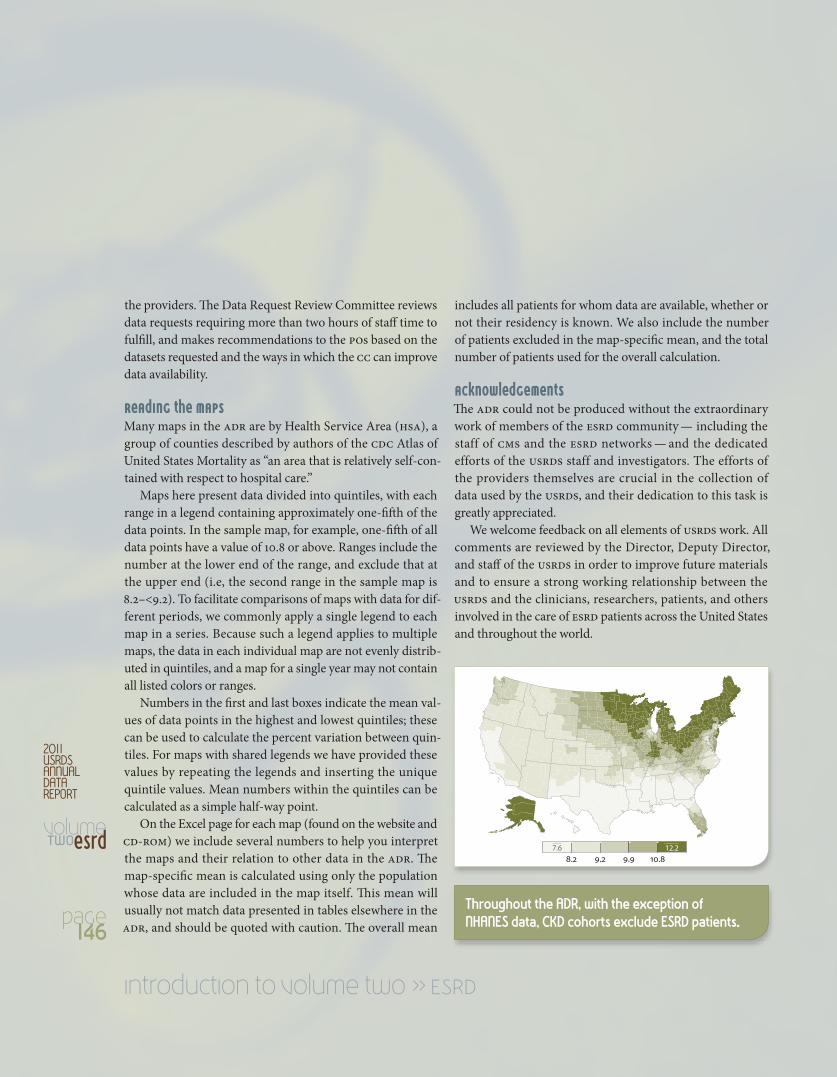
Throughout the ADR, with the exception of NHANES data, CKD cohorts exclude ESRD patients.
8.2 9.2 9.9 10.8 7.6 12.2
2011 USRDS ANNUAL DATA REPORT
volumetwoesrd
page146
introduction to volume two » esrd
the providers. The Data Request Review Committee reviews data requests requiring more than two hours of staff time to fulfill, and makes recommendations to the POs based on the datasets requested and the ways in which the CC can improve data availability.
reading the mapsMany maps in the ADR are by Health Service Area (HSA), a group of counties described by authors of the CDC Atlas of United States Mortality as “an area that is relatively self-con-tained with respect to hospital care.”
Maps here present data divided into quintiles, with each range in a legend containing approximately one-fifth of the data points. In the sample map, for example, one-fifth of all data points have a value of 10.8 or above. Ranges include the number at the lower end of the range, and exclude that at the upper end (i.e, the second range in the sample map is 8.2–<9.2). To facilitate comparisons of maps with data for dif-ferent periods, we commonly apply a single legend to each map in a series. Because such a legend applies to multiple maps, the data in each individual map are not evenly distrib-uted in quintiles, and a map for a single year may not contain all listed colors or ranges.
Numbers in the first and last boxes indicate the mean val-ues of data points in the highest and lowest quintiles; these can be used to calculate the percent variation between quin-tiles. For maps with shared legends we have provided these values by repeating the legends and inserting the unique quintile values. Mean numbers within the quintiles can be calculated as a simple half-way point.
On the Excel page for each map (found on the website and CD-ROM) we include several numbers to help you interpret the maps and their relation to other data in the ADR. The map-specific mean is calculated using only the population whose data are included in the map itself. This mean will usually not match data presented in tables elsewhere in the ADR, and should be quoted with caution. The overall mean
includes all patients for whom data are available, whether or not their residency is known. We also include the number of patients excluded in the map-specific mean, and the total number of patients used for the overall calculation.
acknowledgementsThe ADR could not be produced without the extraordinary work of members of the ESRD community — including the staff of CMS and the ESRD networks — and the dedicated efforts of the USRDS staff and investigators. The efforts of the providers themselves are crucial in the collection of data used by the USRDS, and their dedication to this task is greatly appreciated.
We welcome feedback on all elements of USRDS work. All comments are reviewed by the Director, Deputy Director, and staff of the USRDS in order to improve future materials and to ensure a strong working relationship between the USRDS and the clinicians, researchers, patients, and others involved in the care of ESRD patients across the United States and throughout the world.
Related Documents