UNITED STATES DEPARTMENT OF THE INTERIOR GEOLOGICAL SURVEY / i General Geology and Mineral Resources s | of the Coal Area 9 \ of South-Central Utah it 12 Cory-iled by -'- i K. A. Sargent and Dan E. Hancen ;i With sections on Landslide Hazards by Roger B. Colton, Coal-Mine Subsidence by C. Richard Dunrud, and Landscape i-- Geochemistry by_ J. J. Connor ? Open-File Report 76-811 Tri*? report is preliminary and has not bee" editad or reviewed for conformity with U.S. Geological Survey standards ~~-'3 nomenclature. \

Welcome message from author
This document is posted to help you gain knowledge. Please leave a comment to let me know what you think about it! Share it to your friends and learn new things together.
Transcript
UNITED STATES DEPARTMENT OF THE INTERIOR
GEOLOGICAL SURVEY
/ i General Geology and Mineral Resources
s | of the Coal Area
9 \ of South-Central Utah
it
12 Cory-iled by
-'- i K. A. Sargent and Dan E. Hancen
;i With sections on Landslide Hazards by Roger B. Colton,Coal-Mine Subsidence by C. Richard Dunrud, and Landscape
i-- Geochemistry by_ J. J. Connor
?
Open-File Report
76-811
Tri*? report is preliminary and has not bee" editad or reviewed for conformity with U.S. Geological Survey standards ~~-'3 nomenclature.
\

9 - 1 ? 5 7
CONTENTS
Page > '
Introduction - -- ~ - - 1
Sources of information - - - - ~ 2
Topography and physiography - > -- 36 i
(General geologic setting and stratigraphy -- 7
Unconsolidated deposits ____ ___ __ _ _ ____ 7 a |
1 Sedimentary rocks - 129 ;
I igUCOUS 1TO C1CS" "~" 1 -11 « -1«i* « « « -«>« « ~"-"-«> J i HI L -»w . i. .imrm » ».»« en ̂ w^cn «« «.«.«» J,^
10-
C^-r>ii r«+-iii»a__ __________________ _____________ ______ _____ 1 O,w L>«- Uwi-»L1I. vi J.^
1 I
Economic geology - - - - - 2112
Mineral fuels 22
Coal 22K ;
Stratigraphic relationships 23i a <
CViio 1-f t-ty______ _______________ ______________ ^"^v{ucs.j.xi_y _ _ jj
ib
Xxc s our ce s *""*" * ' "" _____»__ » »-«>__ ^___»__ *_ _>*_ *_ *_ *_ *_ __ *_ *_ *_ *_ *_ _> _>_» ^oI 7
rtj i ___.__________________________._______________________ It 7V/XO. *T /
Central and eastern parts 47:9 i
I Western part 50
Asphalt 50
Metallic mineral deposits - 52
Copper - 52

Page
Economic geology Continued2
! Metallic mineral deposits Continued
Manganese 56
Titanium, zirconium, thorium and rare earths 56
i Uranium 566
1 Lead - 587
I Antimony and arsenic - 59o i
9 ; Selenium and other metalliferous occurrences 59
Nonmetallic and industrial minerals and material resources 61lu- ,
Clay - 61
, Gem materials 61
Gypsum 65
u Lightweight aggregate 67
Limestone 69
16 Sand and gravel 70
, ; Silica 70
Stone 70
, 9 j Crushed and broken stone - 71
| Dimension stone - 71
Field stone 71
Geothermal resources 72
Natural earth hazards 75
Seismicity 75
Landslide hazards, by Roger B. Colton 81

9.12G7
Coal-mine subsidence, by C 0 Richard Dunrud-
General aspects of subsidence -
Effects of topography and geology -
. Effects of mining -
| Summary- - - -
.Landscape geochemistry, by J* J* Connor
Page
83
83.
89
93
97
99
111
iii
ILLUSTRATIONS
Page
- Plate 1. Generalized geologic map of coal area of south-
- central Utah - in pocket
2o Structure map of the coal area of south-central
e { Utah- - - in pocketI
7 3. Coal fields in south-central Utah - in pocket
a j 4. Preliminary generalized map of areas underlaini
9 by landslide deposits in the coal area of
10 south-central Utah - - in pocket
11 Figure 1. Map of Utah showing physiographic divisions and
12 area of this report - - 4
2o Generalized section of Cretaceous strata, Kolob
i* ! Field- 24j
i-- 3o Generalized section of Cretaceous strata, Alton
Field 25
; 4. Generalized section of Cretaceous strata,
Kaiparowits Plateau 26
- ; 5o Diagrammatic section of Cretaceous rock units and i
coal zones of south-central Utah 28
6. Diagrammatic restored section of rocks in the
Orderville-Glendale area 30
7c Relations of members and informal units in the
Straight Formation-southeast Kaiparowits Plateau
coal field 32
iv

9-!? ?
20. Graph showing ratio of maximum subsidence tothickness of coal mined vs ratio of mining panel width to overburden depth, selected mining areas
Page
; Figure 8. Diagram showing classification of total coal
-, resources 39
- 9. Generalized anticline and fault map of the
r- Kaiparowits region 48
e j 10o Tectonic map of south-central Utah showing locationi
7 of the Virgin and Upper Valley oil fields 51i i
s I 11. Tectonic map of south-central Utah showing locationi <
9 , of Miners Mountain and two copper prospects 53
ic 12. Tectonic map of south-central Utah showing location
of Iron Springs and Paragonah iron districts 55
12 13o Tectonic map of south-central Utah showing location
of antimony deposits 60
i :4 14o Tectonic map of south-central Utah showing locations
}<:- of clay deposits 62
15. Map showing location of gem materials in Utah 63
: 16. Map showing location of gypsum and anhydrite in Utah 66
17. Tectonic map of south-central Utah showing location
19 j of lightweight aggregate deposits 68 <i I
18. Map showing seismicity in southern Utah and
northern Arizona 80
19. Subsidence effects caused by coal mining in the
Book Cliffs area near Sunnyside, Utah 86
87
v

Page
Figure 21. Profile along centerline of longwall panel, Raton,
N. Hex, area showing surface relief and vertical
and horizontal components of surface movement -
22e Subsidence development curves for caved longwall
workings in United Kingdom and Raton s N. Mex.
area, and caved room-and-pillar workings near
Somerset, Colo.
23. Regression trends in Parmelia chlorochroa
24. Metal trends in sagebrush away from powerplant -
90
94
106
197
19
vi

TABLESPage
Table 1. Generalized section of the rock formations in3
south-central Utah ~ - - - 8-11
2. Quality analyses of coal. Cedar City and Orderville
areas, Kolob coal field - - - -- - 346
i 3« Quality data for the Alton coal field - - - 357 '
4. Quality data for the Kaiparowits Plateau coal field- 378
5« Coal resources in the Kolob coal field 429
60 Coal resources in the Alton coal field - 44
7. Coal resources in Kaiparowits Plateau coal field 46
8. Modified Mercalli Intensity Scale of 1931- - - 78-7912
9. Formations susceptible to landsliding or slumping
during excavation in the coal area of south-34
central Utah - - - 82i >
10. Copper and molybdenum in sweetclover, and pH in spoil
material from eight coal mines in the Northern
Great Plains - - - - - 103
11. Statistical analysis, element concentrations in the
| ash of crested wheatgrass from topsoil borrow areas
and from reclaimed spoil areas at the Dave Johnston
mine, southern Powder River Basin, Wyoming - 104
12. Environmental Protection Agency primary drinking
water, proposed interim standards for inorganic
chemicals - 109
vii

9.1Z67
5
6
GENERAL GEOLOGY AND MINERAL RESOURCES OF THE COAL AREA
OF SOUTH-CENTRAL UTAH
INTRODUCTION
This report is a summary of the topography, physiography, geology, i
coal and other resources, and geologic hazards of the coal areas of
7 south-central Utah. Although discussion pertains chiefly to the areas
of three coal fields, Kaiparowits Kanab (Alton), and Kolob, it also
discusses mineral resources in nearby areas whose exploration or
10- i exploitation have had or may in the future have effects on south-centrali
Utah. The report area lies generally between lat. 37 and 38 N. and
long. 111° and 113° W. Cedar City s Utah and Zion National Park form
the border on the west, Arizona and Lake Powell are near the border on
the south and southeast, the Waterpocket fold and Henry Mountains
border on the east s and three plateaus, Aquarius, Paunsaugunt, and
Markagunt, form the border on the north.
13
21
24
II. S. UOVbHNMUNI I'HIM'f.V; Ol'HCK : I9VJ o - S1U7I
B42 -171
i.1267
W *
10-
LS
20-
?1
SOURCES OF INFORMATION
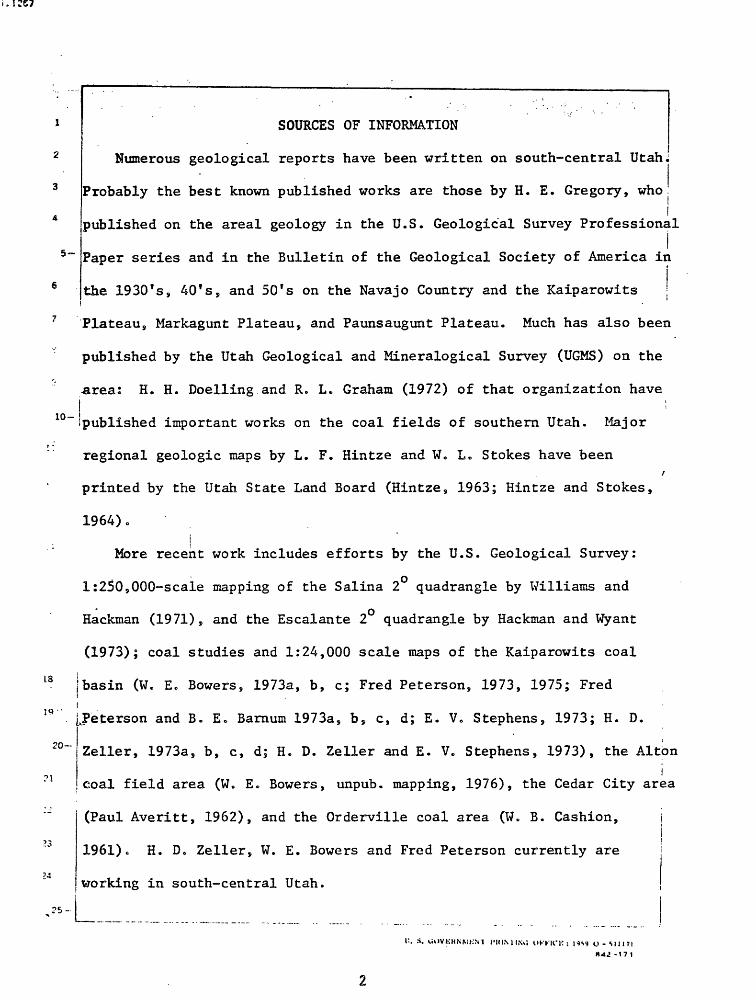
Numerous geological reports have been written on south-central UtahJ
Probably the best known published works are those by H. E. Gregory, whoI
published on the areal geology in the U.S. Geological Survey Professional
Paper series and in the Bulletin of the Geological Society of America in
the 1930 T s, 40* s, and 50*s on the Navajo Country and the Kaiparowits
Plateau, Markagunt Plateau, and Paunsaugunt Plateau. Much has also been
published by the Utah Geological and Mineralogical Survey (UGMS) on the
area: H. H. Doelling and R. L. Graham (1972) of that organization have
ipublished important works on the coal fields of southern Utah. Major
regional geologic maps by L. F. Hintze and W. L. Stokes have been/
printed by the Utah State Land Board (Hintze, 1963; Hintze and Stokes,
1964).I
More recent work includes efforts by the U.S. Geological Survey:
1:250,000-scale mapping of the Salina 2 quadrangle by Williams and
Hackman (1971), and the Escalante 2 quadrangle by Hackman and Wyant
(1973); coal studies and 1:24,000 scale maps of the Kaiparowits coal
1 basin (W. E. Bowers, 1973a, b, c; Fred Peterson, 1973, 1975; Fredi ij^Peterson and B. E* Barnum 1973a, b, c, d; E. V* Stephens, 1973; H. D.
Zeller, 1973a, b, c, d; H. D. Zeller and E. V. Stephens, 1973), the Altoni
coal field area (W. E. Bowers, unpub. mapping, 1976), the Cedar City area
(Paul Averitt, 1962), and the Orderville coal area (W. B. Cashion, j
!
1961)c H. De Zeller, W. E. Bowers and Fred Peterson currently are
working in south-central Utah.
II. S. lIOVKHNMKN'l I'llIMINv'. UKKK'K : I9S» O - SIJ1TI
84J -171
9.1267
Also useful for this report were parts of the 1976 Bureau of Land
Management Environmental Impact Statement on the proposed Kaiparowits
power project.
Carl von Hake of the National Oceanic and Atmospheric
5 .Administration provided information from the earthquake data file which
e ,was particularly helpful for seismic information since 1965.
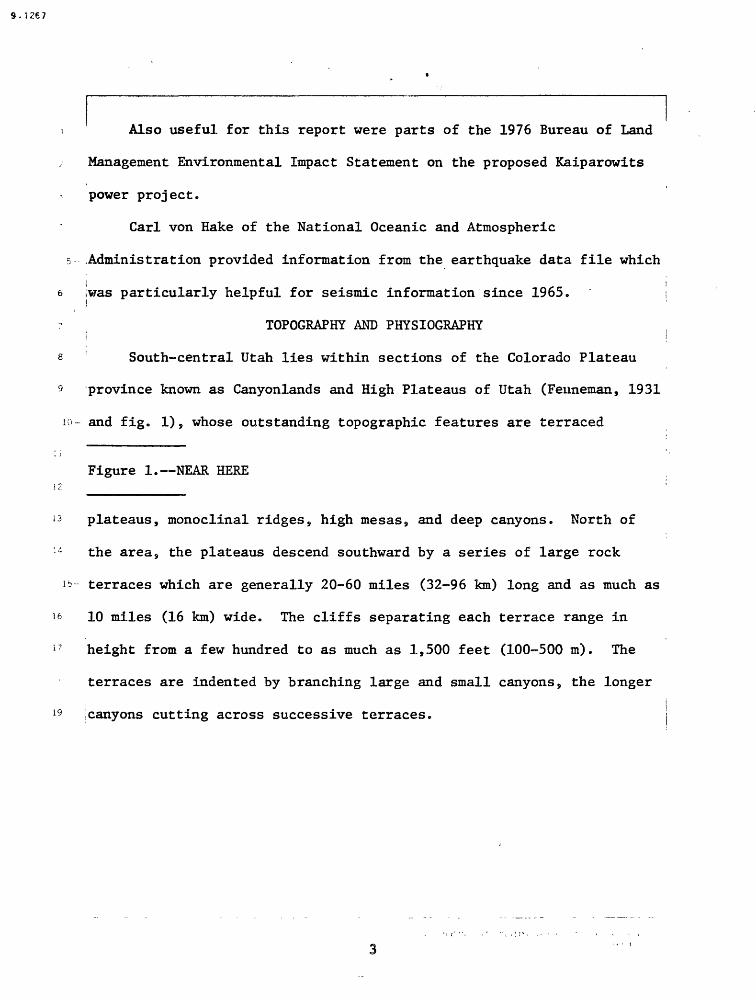
TOPOGRAPHY AND PHYSIOGRAPHY
a ! South-central Utah lies within sections of the Colorado Plateau
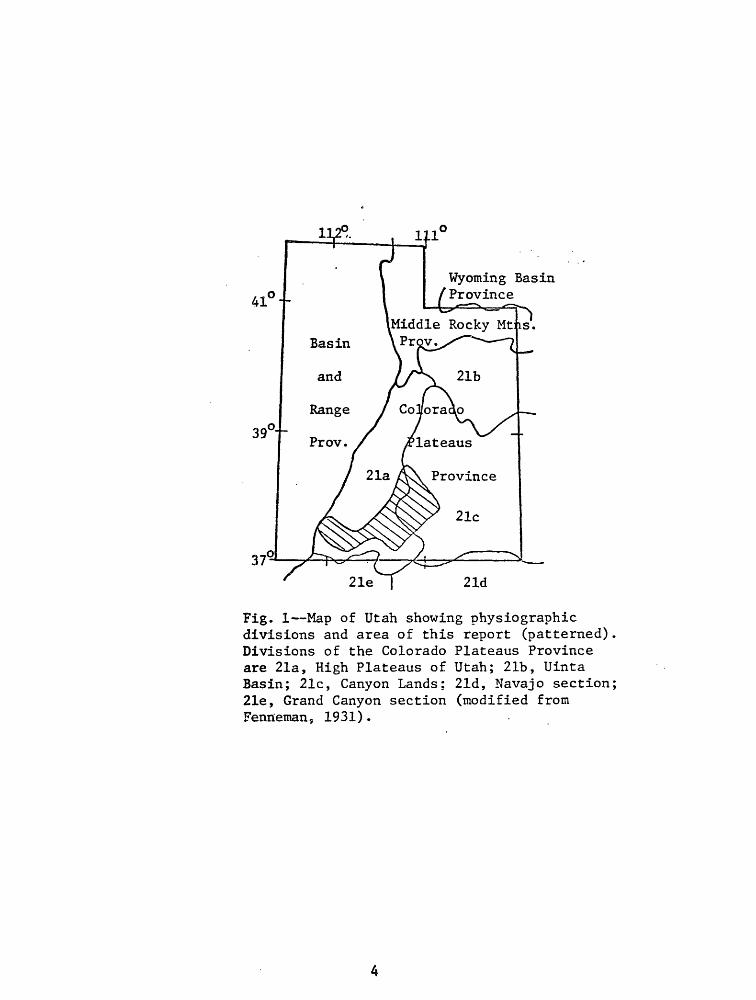
5 province known as Canyonlands and High Plateaus of Utah (Fenneman, 1931
10- and fig. 1), whose outstanding topographic features are terraced
Figure 1. NEAR HERE
16
19
plateaus, monoclinal ridges, high mesas, and deep canyons. North of
the area, the plateaus descend southward by a series of large rock
terraces which are generally 20-60 miles (32-96 km) long and as much as
10 miles (16 km) wide. The cliffs separating each terrace range in
height from a few hundred to as much as 1,500 feet (100-500 m). The
terraces are indented by branching large and small canyons, the longer
jcanyons cutting across successive terraces.
LI'
41
Wyoming Basin Province
Middle Rocky Mtus.
39
21e 21d
Fig. 1 Map of Utah showing physiographic divisions and area of this report (patterned). Divisions of the Colorado Plateaus Province are 21a, High Plateaus of Utah; 21b, Uinta Basin; 21c, Canyon Lands; 21d, Navajo section; 21e, Grand Canyon section (modified from Fenneman, 1931).

9.ire?
5-
Except for the volcanic rocks that partly cover the Aquarius,
Paunsaugunt, and Markagunt Plateaus, the topographic features of south-
central Utah are developed on sedimentary strata. The rocks of the
High Plateaus and Canyonlands are flat or only slightly tilted, locally|
interrupted by such monoclines as the Waterpocket fold on the east and
the East Kaibab fold (The Cockscomb) near the center of the area. i
7 Areas of strong monoclinal folding weather to elongate ridges of steeply
dipping beds. Areas of lesser folding erode to more gentle ridges.
The northwest part of the area is drained by the north-flowingI J
l0~|Sevier River; all other streams flow southward to the Colorado River.
Of the south-flowing rivers, the Virgin, Paria, and Escalante are
perennial, whereas the rest are intermittent or flow only in times of
floods.
is
II. -S. CJUVKHNMKNT HUNTING OKHfK : O SI 1 171
B42 -171

5-
The altitude of the region varies between about 3,700 feet (1,230 m]
at Lake Powell on the south and 11,000 feet (3,700 m) on the Aquarius
!Plateau to the north. Changes in altitude are generally abrupt although
gentle rolling topography may be present on terraces and plateaus.
Above the valley floors the terraces, or benches, rise by steps from
6 south to north. Each bench is underlain by an erosion-resistant geologic
7 unit. In the Kaiparowits Plateau area the benches are well developed.
b (Physical features are shown on Escalante l:250,000-scale USGS sheet
,1956-62.) The first bench is just above Lake Powell, at about 3,800
10- feet (1,270 m). Successively higher benches occur at 4,200-4,400 feet
(1,400-1,470 m) (Grand Bench), 5,200-5,400 feet (1,730-1,800 m) (Nipple
Bench), 6,000-6,200 feet (2,000-2,070 m) (Fourmile Bench), and 10,200-
10,600 feet (3,400-3,530 m) (Aquarius Plateau). A similar series of
benches, although fewer in number, occur to the west. ' (Physical features
are shown on Cedar City l:250,000-scale USGS sheet 1953-1961.) Northward
from Kanab the bench levels are 5,000-5,200 feet (1,670-1,730 m)
(Shinarump Cliffs), 5,600-5,800 feet (1,870-1,930 m) (Wygaret Terrace),! I
18 J6 9 400-6 S 600 feet (2,130-2,200 m) (Skutumpah Terrace), and 8,800-9,200 '! ;
19 jfeet (2,930-3,070 m) (Paunsaugunt Plateau). |
20-
t>. S, UOVKHNMKNT 1'IHN'IIM; OKHCK : Wl O-MII7I
842 -171

9.1267
GENERAL GEOLOGIC SETTING AND STRATIGRAPHY
Most of the exposed section in south-central Utah is composed of
Mesozoic sedimentary rocks (plate 1, in pocket). However, in areas of
upwarp and deep erosion, such as at the Circle Cliffs, rocks as old as
Permian are exposed. The highest plateaus are capped with Tertiary and
i1 some Quaternary volcanic rocks. Table 1, modified from Gregory and
Table 1. NEAR HERE8
9 ' 'Moore (1931), is a generalized section of most of the common units in
i
10 ~ south-central Utah. A thin cover of Quaternary Unconsolidated deposits
is common throughout the area; however, these units are not shown in
fable 1.
Unconsolidated Deposits j
Unconsolidated deposits are largely Quaternary alluvium, colluvium,
and gravel. Windblown sand and silt are common but only locally are
thick enough to be mapped. Glacial moraine and outwash deposits occur
in small areas scattered around the Aquarius Plateau (plate 1).
Landslide deposits are common on steep slopes, especially those
19 '!underlain by thick shales.

.Table 1.
Ge
nera
lize
d se
ctio
n of th
e rock formations in so
uth-
cent
ral
Utah (modified
from
Gregory an
dMo
ore,
19
31)
System
Quat
erna
ry
Tertiary
', '
Series
Holo
cene
(?)
and
Pleistocene
Pliocene to
Oligocene.
Form
atio
n
Basalt
Volc
anic
lavas,
ash- £ low
tuffs
9 an
d se
dime
nts
Character
Dark-gray
dense
basaltic and
ande
siti
c lava and
dark- re
d sc
oria
ceou
s basalt;
hard re
sist
ant
unit,
comm
only
is
ca
p-ro
ck u
nit
Gray
to
da
rk-g
ray
basa
lt and
andesitic
basa
lt flows;
medi
um-g
ray
ash-
flow
tu
ff,
and
ligh
t-gr
ay tuffa-
ceous
sandstone
and
cong
lome
rate
. Ba
salt
and
densely welded tu
ff ar
e generally
dense, resistant
units
and
form
hig
h pl
atea
us.
Thic
knes
s in
fe
et
(meters)
0-30
0 (0
-100
)
0-1,
500
(0-5
00)
>
Tertiary(?)
and
Cretaceous
Eocene an
d Paleocene
Paleocene(T)
Paleoce»..w(?)
and
Uppe
r Cretaceous
Unco
nfor
mity
Wasatch
Form
atio
nCalcareous sa
ndst
one,
shale, and
limestone; pink,
0-1,
600
white, and
vari
colo
red,
soft;
underlies
high
est
(0-5
30)
plat
eaus
; crops
out
in cliffs and
forms
slop
es
Local
Unco
nfor
mity
Pine
Hollow .
Form
atio
n
Local
Unco
nfor
mity
Red
and
gray
calcareous m
udst
one
and be
nton
itic
0-400
claystone; ge
nera
lly
poor
ly ex
pose
d, forms
slop
es
(0-1
30)
Cana
an Peak
Formation^-
Unconf
ormi
ty
Kaip
arow
its
Formation
Light-gray sandstone
and
cong
lome
rate
wit
h clasts
0-1,
000
of qu
artz
ite,
chert, porphyry,
and
limestone
' (0
-330
)
Pale
-oli
ve fine-
to m
oderately
coarse gr
aine
d ar
kosi
c 2,
200
sandstone
and
sandy
shale, wi
th a
wea
k ca
lcar
eous
(730)
ceme
nt;
form
s sl
opes
an
d badlandsj
a fr
esh-
or
brackish-water deposit

Tab
le
1.
Gen
eral
ized
se
cti
on
of
the
rock
fo
rmat
ions
in so
uth
-centr
al
Uta
h C
on
tin
ued
Cre
tace
ous
Upp
er
Cre
tace
ous
Jurassic
Uppe
r Ju
rass
ic
Jurassic
Wahw
eap-
.-1'
Sandstone
Stra
ight
Cliffs
Formation
.Tro
pic
Shale
Dako
ta
Sand
ston
e
Unco
nfor
toit
y
Morrison
> Fo
rmation-
Unconf
ormi
ty
Summ
ervi
lie-
Form
atio
n
Unconformity
Entrad
a Sa
nd
stone
Yell
owis
h-gr
ay m
assi
ve s
andstone with
some sandy
shal
e, 1,100-1,300
the
uppe
r 200
feet
(6
7 m)
ve
ry m
assi
ve and
hard;
(370
-430
) grades do
wnwa
rd in
to al
tern
atin
g ha
rd and
soft
beds;
a pr
omin
ent
clif
f-fo
rmin
g un
it
Yell
owis
h to
bro
wn irregularly
bedd
ed m
edium
to
900-1,200
mass
ive
sand
ston
e; contains co
al b
eds; forms
(300-400)
prominent
escarpments
Blui
sh-d
rab
argi
llac
eous
to
sandy
shal
e; very un
ifor
m 550-1,450
in color
and
texture; gr
ades
to
fossiliferous
(180
-480
) sa
ndst
one
at base;
shale
cont
ains
abundant
Gryphaea newberryi
and
other
foss
ils;
fo
rms
slopes
and ba
dlan
ds
Yellow to ne
arly
whi
te sandstone; co
nglo
mera
tic
in
0-100
part;
irre
gula
rly
bedded;
cont
ains thin b
eds
of
(0-3
0)
coal
and la
rge
silicified t
rees in p
lace
s
Maro
on to
li
ght-
blui
sh-g
ray
sandy
band
ed s
hale,
very
0-56
5 massive,, ha
rd co
nglo
mera
te,
and
coarse gritty
(0-190)
maroon,
yell
ow,
and
gray
irregularly bedded s
and
ston
e; forms
esca
rpme
nts
Thin
-bed
ded
red-brown
to gr
ay friable
sand
ston
e;
100-
500
shale-like b
eds, alternating
red
and white,
.(30-170)
form ban
ded
cliffs
Yellow,
tan, light-red, br
own
and
gray fi
ne,
even-
200-
800
grai
ned
sandstone; in
pla
ces
on m
assi
ve cr
ossb
edde
d (70-270)
stratum; so
me p
oorl
y bedded s
ands
tone
and
red
shal
e

Tab
le
1.
Gen
eral
ized
se
cti
on
of
the
rock
fo
rmat
ion
s in
so
uth
-centr
al
Uta
h C
onti
nued
Upp
er
Jura
ssic
Mid
dle
Jura
ssic
Tri
ass
ic(?
)an
dJu
rass
ic
Tri
assi
cC?)
Uppe
rTr
iass
icC?
) an
d Mi
ddle
Ju
rass
ic
, Up
per
'i. TriassicC?)
Uppe
r Tr
iass
ic
Carm
e1
Form
atio
n
Unconf
ormi
ty
Navajo
Sand
stone
Pink
to re
d an
d bl
uish
sandy
shale; wh
ite
and buff
sand
ston
e; gy
psum
in
beds
an
d as cement;
dense
siliceous
and
earthy dark-maroon
and
light-bluish-
green
lime
ston
e; weathers in
bad
land
s and
forms
benc
h on
top
of N
avaj
o Sandstone
Ligh
t-cr
eamy
-yel
low,
wh
ite,
pi
nkis
h, and
buff,
high
ly cr
ossb
edde
d sandstone; we
athe
rs in h
igh
cliffs and
innu
mera
ble
cone
s, towers,
and
domes;
form
s ca
ves,
alcoves, and
natu
ral
bridges
Local
Unconformity
Kaye
nta
Formation
Uppe
r Tr
iass
ic
Wingate
Sand
stone
Unconf
ormi
ty
Chin
le
Formation
Tria
sffl
c
Maro
on coarse-grained c
ross
bedd
ed s
ands
tone
, con
glom
erat
e, bl
ue-g
ray
hard,
dense
limestone; and
maro
on a
nd bro
wn s
hale
; all
in th
in ir
regu
lar beds
Reddish-brown, ve
ry m
assive sa
ndst
one;
pr
omin
entl
y jo
inte
d; crops
out
commonly in a
single ve
rtic
al
cliff
that resembles
a palisade;
cros
sbed
ded bu
t no
t so
prominently
as Na
vajo
Sandstone
Thic
k variegated ca
lcar
eous
sh
ale
or "
marl
," fine
grai
ned
sand
ston
e, cherty limestone, and
con
glomeratic li
mest
one;
sandstone
most abundant in
th
e mi
ddle
pa
rt;
cont
ains
la
rge
silicified trees.
Basal
0-40
m i
s Sh
inar
ump
Member;
light-gray to
yellow c
oarse-grained
to conglomeratic
sand
ston
e,
very
irregularly
bedded a
nd v
aria
ble
in th
ickn
ess?
gr
ades
locally
into
bluish
sandy
shale; co
ntai
ns
sili
cifi
ed wood; fo
rms
prominent
benc
h
90-9
00
C30-
300)
1,200-1,800
C400-600)
125-2A9
C40-83)
250-400
C80-130)
475-
1,20
0 (1
60-4
00)

__Table JL»
.__G
ener
ali2
ed_s
ecti
Qn.-
o£. the-.rock formations-in
south-central
Utah Cv.-,.tinued
Lowe
r and
Midd
le (?)
Tr
iass
ic
Permian
Permian
.Unc
onfo
rmit
y
Moenkopi
. Fo
rmat
ion
Unconformity
Kaibab
Lime
ston
e
Coconino
Sandstone
Choc
olat
e-br
own
to yellowish
shal
e and
sand
ston
e,
304-500
containing locally
In u
pper
portion v
ery
thin har
d O0
0-17
0)
limestones;
shale
very
sandy
and
grades in
to shaly
sand
ston
e; the
sandstone
ranges fr
om t
hin-bedded
plat
y to
thick
massive
beds;
ripple m
arked
Whit
e to y
ellowish m
assi
ve,
more
or
less
dolomitic
Q-1,050
lime
ston
e, in
par
t cherty;
lower
part
in
crea
sing
ly
(0-350)
sand
y an
d grades do
wnwa
rd into sa
ndst
one without
sharp
chan
ge;
foss
ilif
erou
s in
par
t
Ligh
t-cr
eamy
-whi
te ca
lcar
eous
cr
ossb
edde
d me
dium
- 10
-93+
gr
aine
d sandstone
(3-31+)
I/ St
rati
grap
hic na
mes
and
lithologies
appl
y mainly t
o the Ka
ipar
owit
s re
gion
.

: Sedimentary Rocks
The aggregate exposed sedimentary section exceeds 10,000 feet
(3,300 meters) in the southern Utah study area. It consists mostly
of nonmarine sandstone and siltstone, and marine shale, with some
5 I conglomerate, limestone, dolomite, gypsum, and coal. Many of the
6 |jsandstone units are crossbedded or irregularly bedded, moderately
ifriable, and light gray to tan, or pink. Most formations exhibit little
8 ijlithologic variation across the area, although notable exceptions exist
,in marine to nonmarine transitions along an east-west line (Tropic-i -._
Dakota transitions, Mancos-Straight Cliffs transitions). Significant
11 !changes occur commonly in the percentage of limestone and gypsum in a
!.-given stratigraphic interval across the area. Complex facies changes
i^and stratigraphic correlations occur in Upper Jurassic units as well as
i «jin some lower Tertiary sedimentary rock units,,
15-
Igneous Rocks
i Deposits of Quaternary and Tertiary basaltic-to-andesitic lava
flows and latitic ash-flow tuffs are 500-1,000 feet (170-330 m) thick.
In the. eastern part these rocks were deposited mainly in the high14
plateaus but locally have moved to lower elevations by faulting or
gravity sliding. In the west, Quaternary basalts have been extruded at
lower elevations as well. Quaternary volcanic cones and vents are
common in the basalt fields. Their topographic forms do not appear to
have altered much since the time of their formation.
12

STRUCTURE
2The structural geology of south-central Utah is on the same grand
scale as the physiography. Here are not only the large-scale deformational4-
features such as the large monoclines of the Waterpocket fold and the
Cockscomb (East Kaibab monocline), the large anticlines of the Circle
Cliffs and Kaibab upwarps, the large downwarps of the Henry Mountain
and Kaiparowits synclines, and the large strata displacements of the
Faunsaugunt, Sevierand Hurricane faults , but also there are more
numerous, smaller-scale versions of these deformational features. Mapped io-| "" -------- ----.---. - -:- -- .-.- ___
jon a geologic datum, the portrayed deformational features give the11 :
impression of a large crenulated area of strata broken here and there
by faults (plate 2) .
The area of south-central Utah has been studied extensively by14 ' i
numerous geologists, including many famous pioneer geologists, and
consequently s there are many references. Most background material used
has been limited, however, to relatively recent publications. The
chief source of data north of the 38th parallel are the geology and18 , :
[structural maps by Williams and Hackman (1971). South of the 38th10 !
Iparallel and east of the 112th meridian, the chief source of data are20-! " " ----.-- r I
jthe geology and structural maps by Hackman and Wyant (1973). West of :21 I i
'the 112th meridian,the chief source of data are maps by Cashion (1961,
23
1967), by Averitt (1962, plate 1), and by Gregory (1951, plate 1).
Each publication mentioned contains a large list of reference material.24
I 1 . ; . HAKHNN.IM I'lUMI.V; uM-tli:: l*--s O-sillM
13 842-171
i 1 Beginning in the eastern side of the area, the large Waterpocket
fold extends northwest-southeast for about 90 miles (145 km) as a one-
q to two-mile-wide band of tilted rocks that dip from 3° to 32° northeast.
Immediately east of this large monocline is the Henry Mountain syncline;
i; Immediately west of the monocline is the Circle Cliffs upwarp, a largei
fc land elongate anticline about 65 miles (104 km) long (Davidson, 1967,i --.-.... ~ - -i
? po 59) s and two lesser anticlines, the Thousand Lake anticline and the
8 TTeasdale anticline. North of the Circle Cliffs anticline, the Boulder
0 .Mountain segment of the Aquarius Plateau also abuts the monocline.
i - There is at least an 8,000 foot (2,400 m) amplitude of folding, measured
;1 from the crest of the Circle Cliffs anticline to the deep of the_Henry
12 Mountain syncline. Ages of the strata involved range from Permian to
Late Cretaceous. Faults in this area of the Waterpocket monocline are
14 usually small normal faults, except for the large normal fault that
1i -~ _bounds the Teasdale anticline on the southwest side.
Between the Circle Cliffs upwarp and the basin under the
17 Kaiparowits Plateau are a series of smaller anticlines and synclines.
Largest of the fold features are the Harris Wash syncline, the
j " ^Escalante anticline, and the Escalante monocline. Although relativelyj- -------- - . . _ . _______ ___.. -_... -__. . ,
short in length, the Escalante anticline and monocline together are an
impressive fold feature with an amplitude of about 4,500 feet
(1,350 m) of folding. Most of the strata involved in the folding are
of Triassic and Jurassic age (Navajo Sandstone and the overlying Carmel
Formation),
14
Farther west are a series of crenulations within the Kaiparowits
r basin» Perhaps the most striking fold features are the Upper Valley
3 anticline and the adjacent Button monocline (both of which extend.for
25 miles (40 km) in a northwest-southeast direction). Other large
- folds.are the Table Cliff, Wahweap, Last Chance Creek and Alvey Wash
6 synclineso . The ages of the surface strata involved in folding of thesei
7 features .is Late Cretaceous, but Eocene to Miocene age: rocks are.i
8 jpresent in the Table Cliff syncline. Farther south, the Rees Canyon
9 anticline, Last Chance Creek syncline, Smoky Mountain anticline, Gleni
io~ Canyon syncline, and the north end of the Echo monocline involve rocks
1 as old as the Triassic and Jurassic Navajo.sandstone. Several small
2 normal faults occur in the southernmost_part of the Kaiparowits basin.
North of the Kaiparowits, several normal faults have_been mapped where
4 the Kaiparowits basin goes under the Table Plateau and Griffin Top
10 - (the^Escalante Mountains). There.normal.faults also transect the flat-
lying volcanic rocks of Miocene age.
15
9-1267
Between the Kaiparowits basin and Kaibab upwarp is the East
Kaibab monocline (The Cockscomb). This large monoclinal fold has a
vertical component of structural relief of about 5,500 feet (1,650 m)
in a horizontal distance of less than 4 miles (6.4 km). Rocks involved
5 i in the monocline range in age from Late Cretaceous (Kaiparowitsi
e Formation) to Permian (Kaibab Formation). The fold plunges northeastward
7 and the northeast side of the Kaibab upwarp is defined by the Butler
8 .Valley and Johns Valley anticlines, and the northward continuation of
the Kiabab anticline. Another large flexure on the Kaibab upwarp is the
: Tropic syncline. Numerous small normal faults occur along the East
11 Kaibab monocline and some occur up on the upwarp The upwarp is
12 bounded on the west by the Paunsaugunt fault zone, which probably has
ij a maximum throw of at least 2,000 feet (600 m). Strata involved in the
14 faulting range in age from the Jurassic Navajo Sandstone to the
lb Paleocene-Eocene Wasatch and farther north, volcanic rocks of Miocene
36 age. ;
1 West of the Paunsaugunt fault zone, the strata under the Paunsaugunt
Plateau and Skutumpah terrace are folded into a large syncline. Rocks
19 jwithin this large fold are as young as the Paleocsne-Eocene Wasatch
Formation. The Pausaugunt Plateau is bounded on the west by the
Sevier fault zone, which probably has a maximum throw of about 2,500
feet (750 m). Rocks involved in the faulting range in age from the
Triassic-Jurassic Navajo Sandstone to the Paleocene-Eocene Wasatch
Formation s but some upper Tertiary volcanic rocks (flows) are locally
involved,
16 ' "" ' " '" ' -_ (i ;

1267
5-
The rocks underlying the Kolob Terrace and the Markagunt Plateau :
are chiefly a series of Cretaceous and Paleocene-Eocene strata dipping
rather uniformly northeastward (dips are less than 6 ). Small normal ;
faults are present throughout much of the area. The large-scale
faulting in this western area occurs in the Hurricane fault zone, which
bounds the area on the west. The structure along the Hurricane fault
7 zone is complex, but essentially is an ancestral anticline, the Kanarra
fold of Gregory and Williams (1947, p. 240), broken by later, large
iscale faulting. Beds in the fold generally dip 20 to 60 eastward butI i
10 ~'locally (near Kanarraville), according to Averitt (1962, p. 42), the
beds are overturned westward. Averitt (1962, p. 41) estimated vertical
displacement along the Hurricane fault in the Cedar Mountain quadrangle
to be between 8,000 (2,440 m).and 10,000 feet (3,050 m).
18
22
?4
U. S. OOVKHNMKNT |'HINrtN«1 OK KICK : PIS'* O - -.11171
17 B42-171

11
19
The time when this deformation took place can be ascertained by the
relationships of certain strata within the masses of rock involved. The
earliest evident deformation took place after deposition of the Late
a Cretaceous Kaiparowits Formation. Clues to earlier events of
z .deformation lie buried and are more obscure. In the area of the Table
5 ICliffs, Bowers 1 map (1973) shows that most of the folding in the areaI . !
took place during very Late Cretaceous and Early Paleocene time (about
3 70,000 s 000 years ago). The folded rocks were above depositional level
and were beveled to a relatively smooth surface during this time.
10 Probably the rocks were not very high above the base level of erosion
and shortly after the beveling, deposition of coarse river-borne
materials began. It seems as though there was a relatively abrupt rise
in the southwest source area of the sediments. The strata of south-
central Utah were probably given most of their regional northward tilt
at this time. Gradually an extremely large lake basin developed
northward and the mixed fluvial and lacustrine strata of the Paleocene-
Eocene and Oligocene(?) Wasatch Formation were deposited. After
deposition of the Wasatch and related strata, uplift resumed throughout
jthe entire area and the strata were probably planated again to a
relatively smooth northward sloping surface. Volcanic pyroclastics and
flat-lying flows were deposited in the Aquarius Plateau area and the
plateaus further west. The volcanics probably are Oligocene-Miocene in
age. A surface of moderate relief was formed the tops of the high
plateaus are rather flat. The entire area then was subject to
stronger uplift and the strata along the Paunsaugunt s Sevier and
18 - » - - ;

'Hurricane fault zones were moved into much of their present attitudes,
On the other hand s the entire Colorado Plateau had to be raised high
enough and quickly enough relative to base level in order that the
cycle of canyon erosion could take place.
10-
17
19

9 -1 ?«57
i I Despite the magnitude of structure and of canyon erosion, large
areas of Late Cretaceous coal-bearing rocks have been preserved within
'synclinal and basin structures. On a regional basis, the coal-bearing
rocks are preserved within the Kaiparowits basin and the extension
* under the Aquarius plateau, within the synclinal fold that underliesi
s ;the Paunsaugunt Plateau and Skutumpah terrace, and within the rocks|
7 dipping uniformly northeastward under the Kolob terrace and the
8 Markagunt Plateau.
12
19
20

9- 12«57
j ECONOMIC GEOLOGY
Coal is the single most significant economic product of south-
central Utah. Three fields 9 the Kaiparowits, Alton (Kanab) 9 and Kolob 9
contain enormous reserves in the Cretaceous succession and have been
studied by workers for many years.
Oil has been produced in commercial quantity since 1964 from
7 Permian rocks in the Upper Valley field west of Escalante. Elsewherei
s only shows or minor production have been reported.i
0 The rocks of south-central Utah are only slightly mineralized.i
io-!Some sandstones and shales contain small deposits of uranium, minor
11 gold, titanium, selenium, arsenic, antimony, thorium and rare earths 9
12 manganese, and small amounts of low-grade copper.
Aggregate, "clinker" (rock baked by burning coal), silica, and
semiprecious gem materials are locally abundant. Sandstone for
building is abundant, and some clay deposits are known. Gypsum is
widely distributed and may locally be of commercial grade. Limestones
suitable for industrial use and chemical applications are present but
not common.
13
14
21

Mineral Fuels
Coal
The coal deposits of south-central Utah are very large potential
sources of energy. They are separated east to west by geography and
geology into three major coal fields. These are the Kaiparowits
Plateau, Alton (Kanab), and Kolob fields (plate 3). The coal deposits
occur in a plateau-and-canyonland physiography 9 which is in an area of
; rugged relief at elevations from 5 S 000 to 9,200 feet (1,500 to 2,760 m)c,
above sea level. The coal was first mined in 1852 in the Kolob field1 *"* -
(Doelling and Graham, 1972, p. 267), but except for some sustained and
; i, briefly intensive mining in the Coal Creek-Cedar Mountain areas of the
Kolob field, most production has been of an intermittent nature and the
, mines have been of small areal extent , This is generally an isolated14
area that is far from large markets and from accessible bulk transportation
facilities B
22

Stratigraphic relationships
The coal deposits occur as several coal zones in strata of Late
Cretaceous age. The strata are described in the generalized rock
formation sections (figures 2-4) for each field. The coal zones, as
Figure 2. NEAR HERE
| ' ~ -- 3.---NEAR HERE
4. -NEAR HERE
12
mapped (Doelling and Graham, 1972), have an east-west extent of about
1150 miles (240 km) and south-north of about 40 to 60 miles (64 to 96 km)10 - . _
(Plate 3)c Individual zones generally are composed of several coal beds
that are usually of limited areal extent (lenticular). Lateral
13 continuity of the zone is generally maintained by overlap of the coal
u beds. Locally a coal bed may be thick, up to 25 feet (7.5 m) or more
, t in the Kaiparowits Plateau field; and where thick beds overlap, the
16 total thickness of beds in a zone may be quite large.
19
23

Fig
ure
2
. G
ener
aliz
ed
secti
on
of
Cre
tace
ou
s str
ata
, K
olob
F
ield
POST
-CR
ETA
CEO
US
(TER
TIA
RY
AN
D Q
UA
TERN
ARY
)
Thi
ckne
ss
in-
feet
Sys
tem
S
eri
es
'
: ^S
trat
agra
ph
ic U
nit
-
(met
ers)
Desc
rip
tio
n
CRETACEOUS. ;
Cam
pani
an
7Sa
nton
ian
7 C
onia
cian
?
Tur
ania
n
Ccn
oman
ian
1
Kai
paro
wits
For
mat
ion
Wah
wca
p Fo
rmat
ion
and
Stra
ight
Clif
fs F
orm
atio
n un
divi
ded
Min
or C
oal
Tro
pic
Shal
e an
d D
akot
a Sa
ndst
one
undi
vide
d M
AJO
R C
OA
L
. 0-
1,20
0 (0
-360)
0-1,
590
/ (0
-477)
0-1,
350
(0-4
05)
Gra
y, b
row
n, w
hite
, co
arse
-gra
ined
, ar
kosi
c sa
ndst
ones
, sa
ndy
shal
es
and
thic
k co
nglo
mer
ates
; fr
eshw
ater
de
posi
ts,
in
plac
es
fria
ble,
el
sew
here
re
sist
ant;
form
s ba
dlan
ds,
slop
es a
nd s
tron
g cl
iffs
.
Buf
f, gr
ay,
yello
w,
mas
sive
san
dsto
ne i
n th
ick
and
thin
, su
bord
inat
e an
d so
ft,
irre
gula
r be
ds;
subo
rdin
ate
calc
areo
us,
carb
onac
eous
and
arg
illac
eous
sha
le a
nd
som
e co
al, m
arin
e an
d br
acki
sh w
ater
fos
sils
, fo
rms
a sc
ries
ot e
scar
pmen
ts.
Dra
b,
sand
y,
argi
llace
ous,
ca
lcar
eous
be
ds
of
shal
e,
man
y be
ds
of
yel
low
gra
y sa
ndst
one,
m
ore
abun
dant
in
low
er p
art,
mar
ine,
bra
ckis
h an
d fr
esh
w
ater
fo
ssils
, oc
casi
onal
co
nglo
mer
atic
be
ds
and
coal
.
.
PBE
-CR
ET
AC
EO
US
(JU
RA
SSIC
)(M
odif
ied
from
Do
elli
ng
and
Gra
ham
, 19
72,
p.25
9)
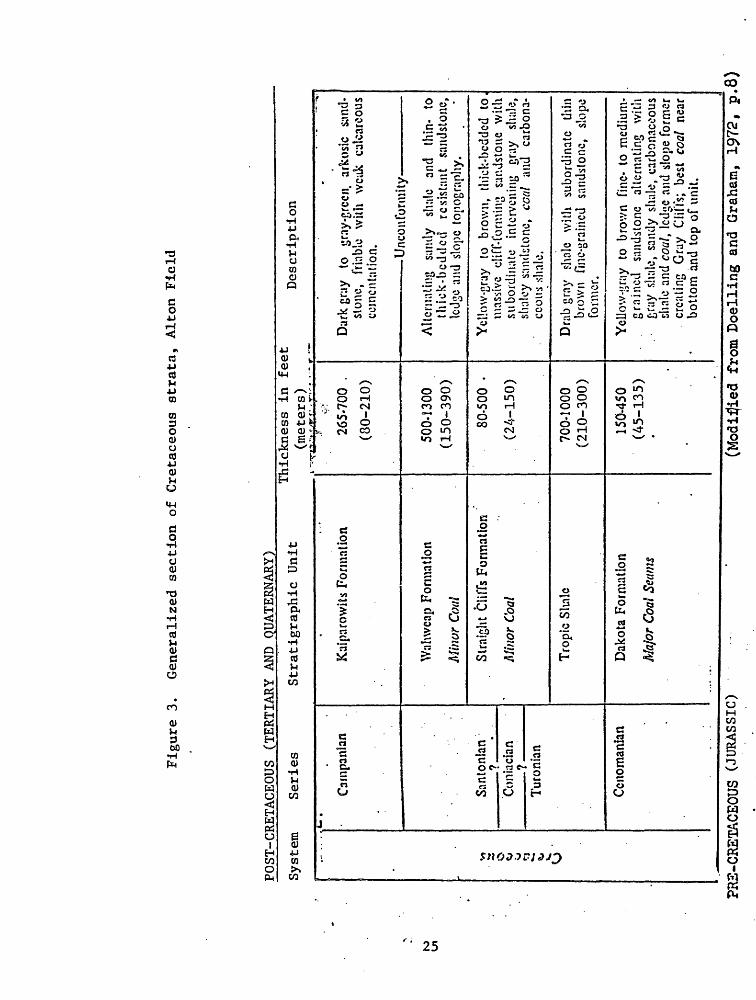
Figure 3.
Generalized
section
of Cretaceous st
rata
, Al
ton
Field
POST-CRETACEOUS (TERTIARY AND QUATERNARY)
System
Seri
es
NJ
Ln
Stra
tigraphic
Unit
Thickness
in fe
et
(meters)
Description
Cretaceous
4-
.
Cam
pani
an
Sant
onia
n ?
Con
iaci
an
?Tu
roni
an
Ccn
oman
lan
Kai
paro
wits
For
mat
ion
Wal
uvca
p Fo
rmat
ion
Min
or C
oal
Stra
ight
Clif
fs F
orm
atio
n
Min
or C
oal
Tro
pic
Slin
lc
Dak
ota
Form
atio
n
Maj
or C
oal S
eam
s
"~y "7
"-i.
;',
265-
700
.
(80-
210)
500-
1300
(1
50-3
90)
80-5
00
(24-
150)
700-
1000
(2
10-3
00)
150-
450
(45-
135)
Dar
k gr
ay
to
gray
-gre
en,
arko
sic
sand
st
one,
fr
iabl
e w
ith
wea
k ca
lcar
eous
ce
men
tatio
n.
U
ncon
form
ity
Alte
rnat
ing
s;ind
y sh
ale
and
thin
- to
th
ick-
bedd
ed
resi
stan
t sa
ndst
one,
le
dge
and
slope
top
ogra
phy.
Yel
low
-gra
y to
br
own,
thi
ck-b
edde
d to
, m
assiv
e cl
iff-f
orm
ing
sand
ston
e w
itli
subo
rdin
ate
inte
rven
ing
gray
sh
ale,
sh
aloy
san
dsto
ne,
coal
an
d ca
rbon
a
ceou
s sh
ale.
Dra
b gr
ay
shal
e w
ith
subo
rdin
ate
thin
br
own
fine-
grai
ned
sand
ston
e,
slop
e fo
rmer
.
Yel
low
-gra
y to
bro
wn
fine-
to
med
ium
- gr
aine
d sa
ndst
one
alte
rnat
ing
with
gr
ay s
hale
, sa
ndy
shal
e, c
arbo
nace
ous
shal
e an
d co
al,
ledg
e an
d sl
ope
form
er
crea
ting
Gra
y C
liffs
; be
st c
oal
near
bo
ttom
and
top
of
unit.
PRE-
CRET
ACEOUS (J
URAS
SIC)
(Modified
from Doe
llin
g and
Grah
am,
1972,
p.8)

Fig
ure
4.
G
ener
aliz
ed se
cti
on
of
Cre
tace
ou
s str
ata
, K
aip
aro
wit
s P
late
au
POST
-CR
ETAC
EOU
S(T£
RTI
ARY
AND
QUA
TERN
ARY
)
System
Series
N3 a\
Stea
tagr
aphi
o .U
nit
Thi
ckne
ss
in fe
et
Description
CRETACF.OUS
I
Cam
paA
iia
Sar*
Ioni
an
Con
iaci
in
Turo
nian
Cen
omin
ian
Con
glom
erat
ic m
embe
r
XaJ
puow
itt F
orm
atio
n
V/ih
wca
p Fo
nnat
ion
Straight
Giffs
Fonnation
1 & 1
Drip
Tan
k M
embe
r a
t-""
"""*
**
John
lls
ary
Mem
ber
MA
JOR
CO
AL
SEA
MS
Smok
y H
ollo
w
Mem
ber
AI/
i\OR
CO
AL
Tib
bct
Can
yon
_
Mem
ber
Trop
ic S
hale
MIN
OR
CO
AL
Dak
ota
I-'o
rnut
ion
MN
OR
CO
AL
0-
SCO
(0-1
50
)
2,00
02,5
00(6
00-7
50)
760-
1.35
0(2
23-4
05)
100-
35
0(3
0-1
05)
500-
90
0
(150
-270
)
24-
500?
(7-1
50?
70-
185
_(2
1
56^)
550-
1,00
0
(165
-300
)
0-
250
(0-7
5)
Red
an
d gr
ay
mud
ston
e an
d bc
nton
iiic
chys
tonc
ov
cily
irg
intc
ibcd
dcd
ligJit
br
own,
sny,
pink
aA
d re
d ta
ndst
or.*
, co
ni'lo
mct
auc
ta/td
kton
e an
d co
nglo
mcr
aie.
Cra
y to
dir
k gr
ay,
fine-
to
mcx
lcuu
ly c
ozrs
e-sn
uncd
. fr
iubi
e 'sa
lt zn
d pe
pper
* ai
kodc
wnj
iton
c w
iih s
ubor
dina
te l
i^lil
gr
ay
niuJ
iior.
c;
wea
k ca
lcxr
cous
ce
men
t, fo
nr.s
bad
land
s aj
i\l s
lope
s.
Yel
low
-£tjy
rc
sist
anl
sand
ston
e,
grits
tone
a.
id
ccng
lonc
nu
allc
mal
in^
wiih
yc
llow
-ora
r.sc
nor.r
esis
'.ont
unO
>:or
.c
i^d
pay
fT!u
d>to
iu-;
low
er l
.alf
dom
ir.an
tly n
o."j
oa>t
anl.
cpp<
r ru
lf n
-.usu
vc a
nd h
^rJ.
Y*U
ow-b
row
n to
gr
ay -o
rang
e,
fine-
to
m
cdiu
m-^
air.c
cS
und-
st
one
with
so
nic
grits
iono
an
d co
nglo
mer
ate
inie
rbcJ
J.'d
. w
it!-.
s-ib
u.-J
ir.ai
c cj
;y s
JioJ;;
rci
iiiir
.t cL
i'f f
onnc
r.
Intc
rbc-
JJod
yc
lIo-A
'-gra
y,
v,hi
tc
o,TJ
oran
ge
rr.c
Uiu
m-g
riir.^
d sa
ndst
one,
ji
iy
sJ-taJ
^, ci
rbon
scco
us
rr.u
dsto
ne
ar.d
ra
c/;
form
s lc
t!gy
outc
rops
; of
ten
exlu
biti
Kdd
iih
to
blac
k ou
tcro
ps f
rom
clin
ker
and
burn
ed s
ands
tone
due
to
natu
ral
burn
ing
of c
oal.
u -
Intc
ibcJ
dcd
whi
te o
r ye
llow
-gra
y su
ndst
or.e
, lig
ht g
ray
to 4
a/k
g/ay
mud
ston
c an
d io
inet
irnos
U'.in
roc
/.sca
.iu;
low
er p
ut
1 le
dge
to s
lope
for
min
g, u
pper
pin
clif
f fo
rmin
g.
Ycl
lcw
-vju
y an
d ^r
^y-c
nn-^
c, m
cdiu
ni-^
iJnc
d ur
.Jil
one
inte
r-
bedd
ed w
jih j
uboi
diT
.au
Cray
rnu
iJsl
or.*
; cl
iff f
o.-rr
.cr.
Med
ium
- to
dir
k-gr
ey s
r^U
^^cc
cus
to u
ndy
ihol
i. co
r.uir
.s i
hLn
yctio
wiy
ay
^r.d
iton
c be
ds
at
top
u\d
bass
. oi
r.cr
*iia
un
ifor
m;
fonn
s ba
dlan
ds ~
nJ s
lcpv
i.
Ycl
low
-gis
y lin
dsto
nc
Jtcr
nati
ng
with
gr
ay
i>.^
c, c
axbO
Ai*
ce
out
khal
o an
d (c
/c/;
form
s M
mir
:sis
ta^t
led
ge.
PRE-
CRET
ACEO
US
(JU
RA
SSIC
)(Modified
from
Oce
llin
g and
Grah
am.
1972.
p. 7
4)

9.
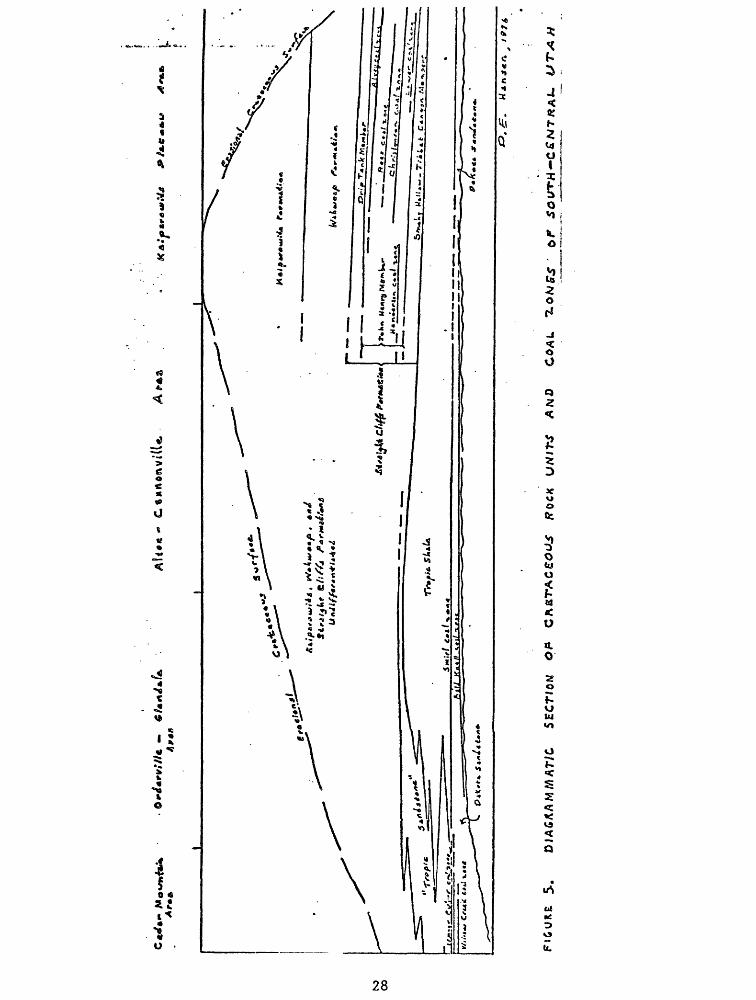
1 ; The coal zones extend stratigraphically upward from the basal i
2 strata of the Dakota-Tropic interval in the eastern part of the Kolob
3 ifield to the highest strata of the John Henry Member, Straight Cliffs
Formation, in the Kaiparowits field. This vertical stratigraphic range
5 ,is about 1 S 800 to 2,000 feet (240 to 600 m) over the miles of outcrop.i
g JThe spatial relationships of the coal zones are the result of
? transgressive and regressive phases of nonmarine and marine deposition
s ;at or near the southwest edge of a Late Cretaceous seaway. The
^ relationships of the coal zones and related strata are illustrated by
10- figure 5.
Figure 5.--NEAR HERE
In the Cedar Mountain area of the Kolob field, the coal beds occur
in several zones (after Averitt, 1962, p. 26). The Straight Cliffs
coal zone is about 75 feet (23 m) above the strata assigned to the
Straight Cliffs Sandstone ("Tropic Sandstone"). This coal zone appears
to be of limited extent and is poorly exposed. The Upper Culver coal
zone occurs at the top of the Tropic-Dakota interval and the Lower
;Culver coal zone is 11 to 34 feet (3.3 to 10.2 m) below the Upper zone.
The Willow Creek coal zone is about 145 feet (44 m) below the top of
the Tropic-Dakota interval. The coal beds in the Willow Creek zone are
thin and discontinuous.
27
ut
i 5 «**
4t ft:
o U
a0;
3O
O
«L O
"z oi^ v>IU
D o
28
9- t?»57
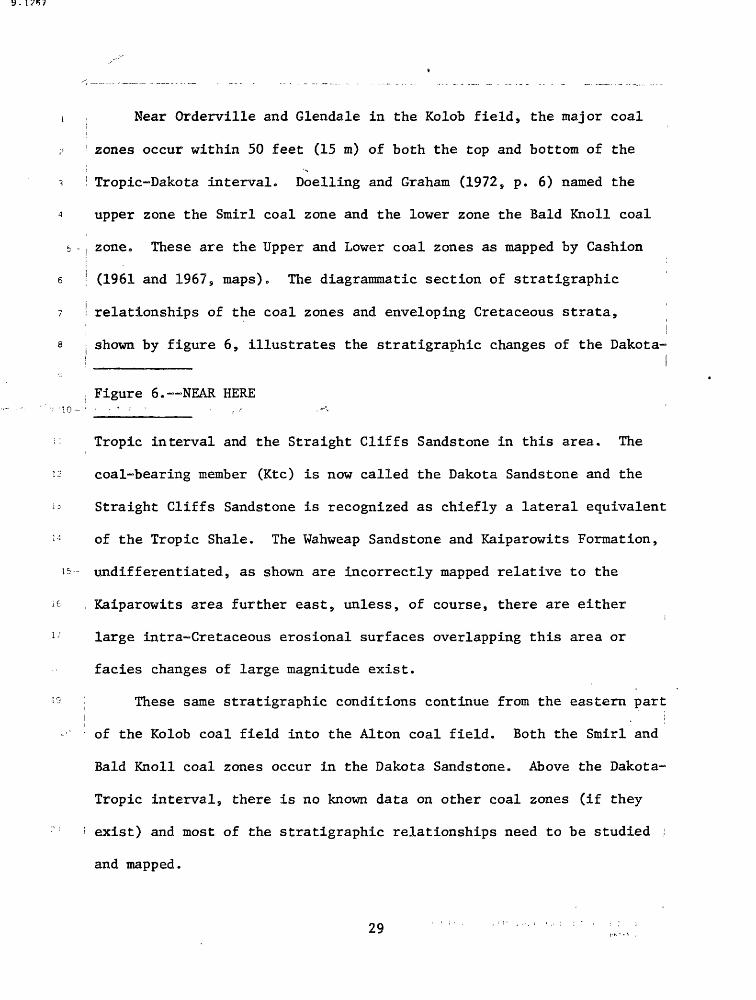
Near Orderville and Glendale in the Kolob field, the major coal
zones occur within 50 feet (15 m) of both the top and bottom of the
Tropic-Dakota interval. Doelling and Graham (1972, p. 6) named the
upper zone the Smirl coal zone and the lower zone the Bald Knoll coal
zone« These are the Upper and Lower coal zones as mapped by Cashion
(1961 and 1967 9 maps). The diagrammatic section of stratigraphic
relationships of the coal zones and enveloping Cretaceous strata,
shown by figure 6, illustrates the stratigraphic changes of the Dakota-
Figure 6. NEAR HERE 10-
Tropic interval and the Straight Cliffs Sandstone in this area. The
coal-bearing member (Ktc) is now called the Dakota Sandstone and the
Straight Cliffs Sandstone is recognized as chiefly a lateral equivalent
of the Tropic Shale. The Wahweap Sandstone and Kaiparowits Formation,
undifferentiated, as shown are incorrectly mapped relative to the
Kaiparowits area further east, unless, of course, there are either
large intra-Cretaceous erosional surfaces overlapping this area or
facies changes of large magnitude exist.
These same stratigraphic conditions continue from the eastern part
of the Kolob coal field into the Alton coal field. Both the Smirl and
Bald Knoll coal zones occur in the Dakota Sandstone. Above the Dakota-
Tropic interval, there is no known data on other coal zones (if they
exist) and most of the stratigraphic relationships need to be studied ;
and mapped.
29

to
o
WE
ST
««'
sow'
SCM
*
O'd
trvt
fi* G
ulch
yE
ut t'
trk
Vir
gin
Itiv
cf
Was
atch
form
atio
n (T
w)
Wah
wca
p sa
ndst
one
and
Kaip
arow
its f
orm
atio
n, u
ndilf
oren
tiatc
d (K
wk)
Sedi
men
tary
roc
ks G
f Jur
osiic
aco
. ur.d
ilfcr
cntia
tcd
(Ju)
SAST
ft «
1
Vcrti
cil(froa Ca
sbic
n, 19
61,
cap)
FIG
URE
6. --
DIA
GRA
MM
ATI
C RE
STO
RED
SEC
TIO
N
OF
ROCK
S IN
TH
E O
RD
ERV
ILLE
-GLE
ND
ALE
ARE
A

The coal zones in the Kaiparowits Plateau field are chiefly in the! . !
: John Henry Member of the Straight Cliffs Formation. Some lenses of coal , i
? occur in the Smoky Hollow Member of the Straight Cliffs, and in the
" Dakota Sandstone, but none of these currently are considered economic.
5 - ;The stratigraphic relationships within the Kaiparowits Plateau have been
e worked out chiefly by Peterson (1969) and fellow USGS geologists. The. i
7 ^relationships of the members of the Straight Cliffs Formation and thej |
a iCoal zones are shown by figure 7. This is an area where coals were
Figure 7. NEAR HERE
deposited in swamps very close to the shoreline of the Cretaceous sea.
: There are many transitions from marine to nonmarine strata in this area
13 and consequently thick and numerous beds of coal were deposited in
;4 elongate lenses parallel to the shoreline (northwest-southeast). There
is are four main coal zones within the John Henry Member. In ascending
16 :order, they are: Lower coal zone, Christensen coal zone, Rees coal!
17 zone, and Alvey coal zone. The zones extend north to south across most
ij of the basin under the Kaiparowits Plateau. They do not, however,
19 (apparently crop out on the northwest flank of the basin where only one I ! 'coal zone is recognized. This is the Henderson coal zone, which appears
to be roughly at a stratigraphic position between the Lower coal zone
and the Christensen coal zone,
i i ' ' Because of the stratigraphic relationships discussed above, and the
: general depth of the coal throughout the southern Utah area, few of the
coals are considered strippable with present technology.
31

Wahweap Creek area
Straight Cliffs Formation
Straight Cliffi area

: Quality
2 f The coals of all the zones are generally classified as medium- to
3 i high-volatile bituminous. Ash content, sulfur content, and moisture
content varies widely. The BTU values also vary widely. Knowledge of
<:- these aspects similarly varies greatly from field to field and area to! '
6 i area. None of the coals have coking qualities and most would require
! i7 i mechanical cleaning.
s : Coals of the Kolob field range in rank from high-volatile bituminousj i
0 C to subbituminous A. They have generally moderate to high sulfur
ic content, and generally-high ash content. A summary of quality is given
' in table 2. Because of bias in sampling and the limited number of
Table 2. NEAR HERE
samples, Doelling and Graham (1972, p. 271) believe the sulfur content
>- in the Orderville area is slightly less than that shown. Cannel coal
also is present in the Orderville area, but it is of limited extenti
and is not included in the analyses, ,
The coals of the Alton field are of subbituminous C to bituminous
high-volatile C rank. They have low to moderate sulfur content, but; ihave very high ash content, especially in the lower zone (Bald Knoll)
i
in the eastern part of the field. According to Doelling and Graham
(1972, p. 15) most of the samples analyzed were from outcrops and the
i quality of coal should be better in the subsurface. Most of the samples were from the upper coal zone (Smirl). A summary of quality is given in table 3.
Table 3. NEAR HERE
33

Table 2. Quality analyses of coal, Cedar City and Orderville areas, Kolob coal field
No. of Samples
PercentAverage 1 Range
CliDAR CITY AREA
MoistureVoblilc matterRxcd carbonAshSulfurBlu/lb
MoistureVolatile matterFixed carbonAsliSulfurBlu/lb
868686876764
ORDERVILLE
999999
8.239.842.310.85.76
10,492
AREA
12.140.136.011.52.21
10.344
. 2.8.-P.333.4 -46.126.7 -50.3
3.2 -27.11.11- 7.30
8,480-11,430
4.8 -17.637.0 -46.927.3 -46.0
3.9 -23.21.10- 4.03
9.508-11,297

5-
&
7
8
9
MoistureVolatile matterFixed carbonAshSulfurBtu/lbo
io-!Moisture
11 ; Volatile matter Fixed carbon
12 'Ash; Sulfur
13 j Btu/lb.
14. ,
is- ! MoistureVolatile matter
16 j Fixed carbonAsh
i/
13
19
20-
21
22
23
24
,25-
SulfurBtu/lb.
MoistureVolatile matterFixed carbonAshSulfurBtu/lb.
(modified from
13.7-20.637.5-44.640.5-54.06.3-14.90.5- 2.3
10,782-12,329 12,
SKUTUMPAH AREA
12.5-28.339.2-47.440.7-53.84.7-14.60.46-2.3
8,580-11,758 10,
CANNONVILLE AREA
8.8-21.735.5-40.737.8-43.515.8-25.70.7- 1.2
8,080-9,723 8,
ENTIRE COAL FIELD
8.4-28.335.5-47.437.8-54.04.7-25.70.46-2.57
8,080-12,329 10,
Doelling and Graham, 1972, p.
17.040.150.39.41.3
069
19.343.646.79.81.07
166
15.837.941.620.50.87
530
17.441.247.511.11.15
371
18)
tl. S. GOVERNMENT
-35
13 as- received12 dry12 dry13 dry13 dry12 dry
' i11 as-received11 dry11 dry ... I11 dry '"*' 11 dry11 dry
i
4 as- received4 dry !4 dry4 dry ;4 dry4 dry
29 as received '27 dry27 dry28 dry28 dry27 dry
1'IUNriNG OFFICE: m* O - SIU7I
842-171

The coals in the Kaiparowits Plateau field are extremely variable
in quality, ranging from subbituminous C to high-volatile bituminous A.
3 Generally, however, these coals are of better quality than the coals in
6 the Kolob and Alton fields. The sulfur content-is generally lower-and
5 the BTU values tend to be higher. Further s on this comparative basis,
e ,the Kaiparowits Plateau coals will require less mechanical cleaning for
7 large-scale usage. In addition, there are several zones and several
e beds within the zones and extreme variation could be normal in the
Kaiparowits Plateau field. The coals in the Christensen zone tend to
: be of higher quality than the coals of the Alvey zone (the two major
;: coal zones). Analyses of the coals in the Kaiparowits Plateau field
- given in table 4 are for samples about one-half of which came from
Table 4. NEAR HERE
surface outcrops or old mine samples (Doelling and Graham, 1972, p. 93).
! Resources ii
The coal beds of south-central Utah presently are relatively
undisturbed by mining. Most of the now abandoned mines produced coal
for local uses and where the mines were larger, in the Cedar Mountain
area of the Kolob field, production was only some tens of thousands of
tons. Faults, steep dips, and great depths are limiting geologic
factors, but the area is large and many places suitable for mining exist,
36

'idl»j.e Ac Quality data for the Kaipai.Plateau coal field
PercentRange Average No. of analyses
KAIPAROWIIS PLATEAU COAL FIELD (all areas) .
Moisture
Volatile matter
Fixed carbon
Ash
Sulfur
Btu/lb
3.60-28.70 11.33
21.92-57.38 43.63
22.8 1-71 .51 47.25
3.38-33.03 8.96
0.26- 3.40 0.87
8,499-14,236 11,999
137 as-received
164 dry
164 dry
165 dry
129 dry
161 dry
SMOKY MOUNTAIN AREA COAL
Moisture
Volatile matter
Fixed carbon
Ash
Sulfur
Btu/lb
3.70-24.20 9.63
21.92-57.38 42.44
22.81-71 .51 48.70
3.60-19.80 8.59
0.26- 1 JO 0.75
77 as-received .
91 dry
91 dry
91 dry
91 dry
10,736-13,746 12,401 91 dry
ESCALANTE AREA COAL
Moisture
Volatile matter
Fixed carbon
Ash
Sulfur
Btu/lb
3.60-24.80 10.51 40 as-received
.37.47-57.49 45.39 53 dry
38.49-53.59 46.81 53 dry
3.38-24.89 7.80 54 dry
0.42-3.40 1.26 24 dry
8,499-14,236 11,563 53 dry
TROPIC AREA COAL
Moisture
Volatile matter
Fixed carbon
Ash
Sulfur
Btu/lb
9.36-28.70 19.50 20 as-received
35.73-48.03 44.42 20 dry
31.2347.07 41.81 20 dry
7.71-33.03 13.77 20 dry
0.60-1.73 0.98 14 dry
8,826- 12.699 11,207 17 dry
-{ i..',,,.j ^,.K.~,,^.~>
37

3. <2fi7
: The coal resource data for south-central Utah (taken from Doelling
2 and Graham, 1972) can be considered for practical purposes estimates of
3 'coal in place (nonmined). The resource data, in addition, generallyi i
* 'fits into the more comprehensive classification of Averitt (figure 8)
:Figure 8. NEAR HERE6; ~" ---" -_-..
! ~ " ~~~°
,as data of unidentified and undiscovered-hypothetical economic coali
s Resources. Subeconomic coal resources were not considered and
9 undiscovered-speculative coal resources could not be considered. The
i.j- terms and definitions used here are from Doelling and Graham but
Averitt's definitions are added in parentheses. Averitt f s definitions
12 are as follows:
38

TOTAL RESOURCES
uIozooid
u2ozouUlaV)
-4)c"5a
Q
aa,~£ Q
«
|3in
IDENTIFIED
Demonstrated
Measured Indicated
RESERVE BASE
1
- H
!
Inferred
UNDISCOVERED
HYPOTHETICAL (In known districts)
.
RESOURCES
+ \ _J"T" "1
If 1
SPECULATIVE (In undiscovered
districts)
.
.
^»
>~
5."55o
«_u1ocou*o
e oT>a
|wc
T Increasing degree of geologic assurance-
Figure 8. Diagram showing classification of total coal resources based on geologic knowledge and economic factors (from Averitt, 1974, p. 3).
39

9.1267
t. _
16
(1) Demonstrated resources combined measured and indicated
categories.
(2) Measured resources tonnage of coal in ground based on assured
coal-bed correlations and on closely spaced observations about
one-half mile apart. _. _____ ___L__I_____ _.. -
(3) Indicated resources tonnage of coal in ground based partly on
specific observations and partly on reasonable geologic
projection. The points of observation and measurement are
about 1 mile apart but may be 1 1/2 miles apart for beds of
known continuity.
(4) Inferred resources ^tonnage of coal in ground based on an
assumed continuity of coal beds downdip from adjoining areas
containing measured and indicated__resources. . In general,
inferred coal lies 2 miles or more from outcrops or from
points of precise observation.
(5) Hypothetical resources estimated tonnage of coal in the
ground in unmapped and unexplored parts of known coal basins
to an overburden depth of 6,000 feet; determined by
extrapolation from nearest areas of identified resources.
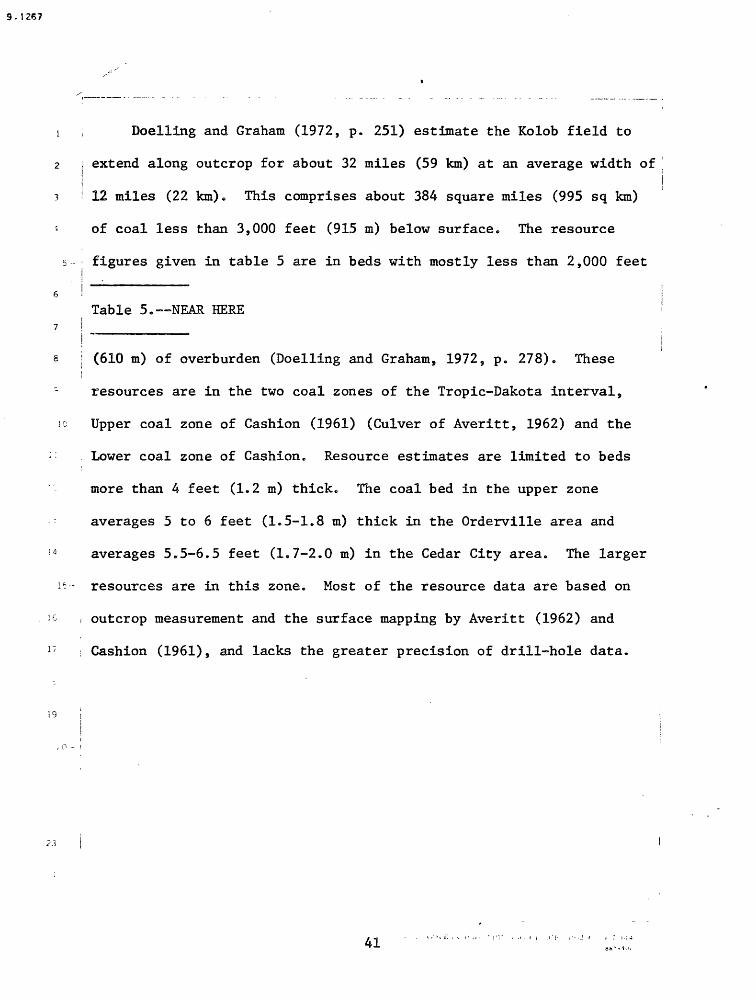
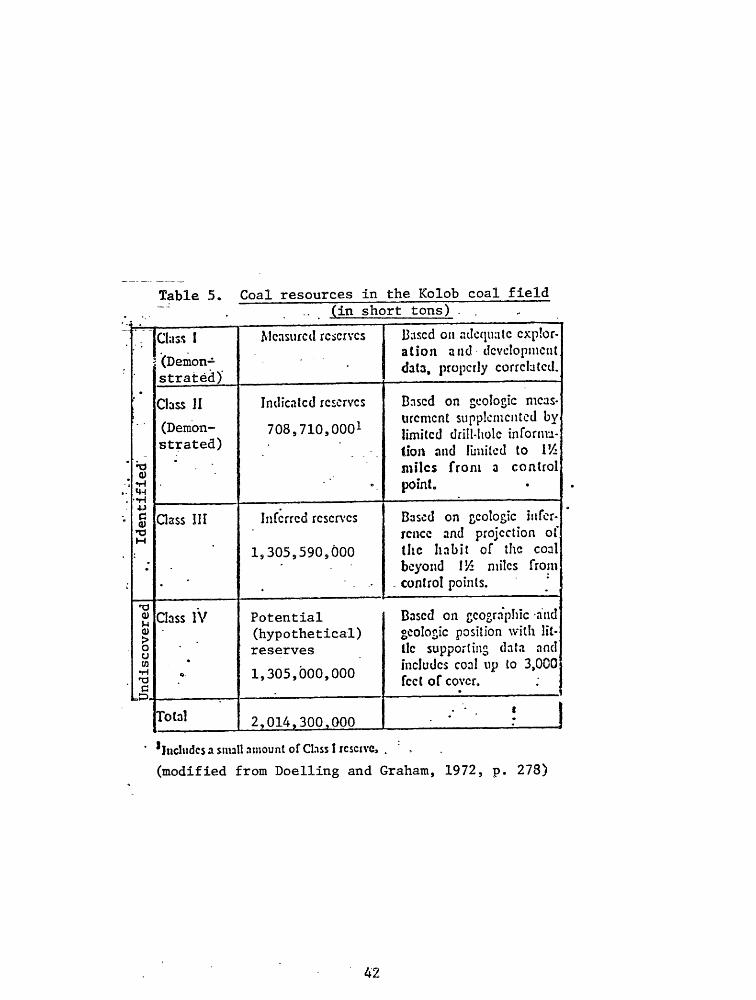
Doelling and Graham (1972, p. 251) estimate the Kolob field to
extend along outcrop for about 32 miles (59 km) at an average width of
12 miles (22 km). This comprises about 384 square miles (995 sq km)
of coal less than 3,000 feet (915 m) below surface. The resource
figures given in table 5 are in beds with mostly less than 2,000 feet
19
23
Table 5. NEAR HERE
s I (610 m) of overburden (Doelling and Graham, 1972, p. 278). These
- resources are in the two coal zones of the Tropic-Dakota interval,
so Upper coal zone of Cashion (1961) (Culver of Averitt, 1962) and the
:: Lower coal zone of Cashion. Resource estimates are limited to beds
more than 4 feet (1.2 m) thick. The coal bed in the upper zone
averages 5 to 6 feet (1.5-1.8 m) thick in the Orderville area and
4 averages 5.5-6.5 feet (1.7-2.0 m) in the Cedar City area. The larger
i-- resources are in this zone. Most of the resource data are based on
'- ; outcrop measurement and the surface mapping by Averitt (1962) and
7 i Cashion (1961), and lacks the greater precision of drill-hole data.
41
8. NJ CO
.Hi If
5P.
§
Hi K
O
si
5tJ
*3
s «
E o
r^
?rCM
«
oQ)
K*
3 2
O
.
Un
dis
co
ve
red
o tT
tSJ
O -P-
» u> o o * g o
.
t
Q 0
.
^
8 * * _
^
M
N
/-«.
»T
J »
(D
PC
OO
J CO
^
ItO
(D
T
J (D
Ui
i-l
O
P»
<
rt
rt
0-
(D
S34
H-
O
W
CD
0)O
rt
M
**
H'
0
0
O
PJO
M N /
? =
Sr-B
g|laf
§ g
8
5
S'
o
^
2
:r. "
«'
^"o^
S
o"X
3 2
p
o^
w*
-^ *
H,'
tm>
d
l
O
v
r->
.."
Ide
ntifie
d',
' '
j
Q ^ « «
«
r _
oj *^
. o
&.
m
£V
JJ
m
ex.
vo
_0
o
V>
tA
o
2
o
3 "*
85T
~o«
| g
^§ g
.*i
*~^!
§5' S
*"*'
w
F
o^ 8
.
s
. O
^ d
o ^
2«"
5*
Tl«
1
w
/-N
Q
ft
O
ET s
§ K
ft
0
J^;
'
3
'
0
1;
00
0«
S
J"-
J o
"H
1 c-
0
^*
0
8
»O
<
e
a
c* s
r: e
»
o i. o
g
^ "
r S
* f
£' o
o.
^ia
^ g
t3
C*
*f^
*^
00
HJ
fj
* "
* «
*^
«^
* *
* %
»^
^/
c-
pj
caO
-,
, 3
S
O
o
o
pr*
orr
^ ^ *
?
M
x>V
0
ft
O
-TH
2 y
0»
0
*
It
0
CD.
0x-
|.
p"
n c o ^^ o ri o
g-
^.
t?
rr
*-
^A**
O
o
J
g f
0
C.
C.
5" E
U^
_ o*
2
o
S.S
^ ^
o 0
CM
M
«
^
*
"I!
(D On O
O o o* Hi
H«
CD M
Pu
9. 1267
7 I
12
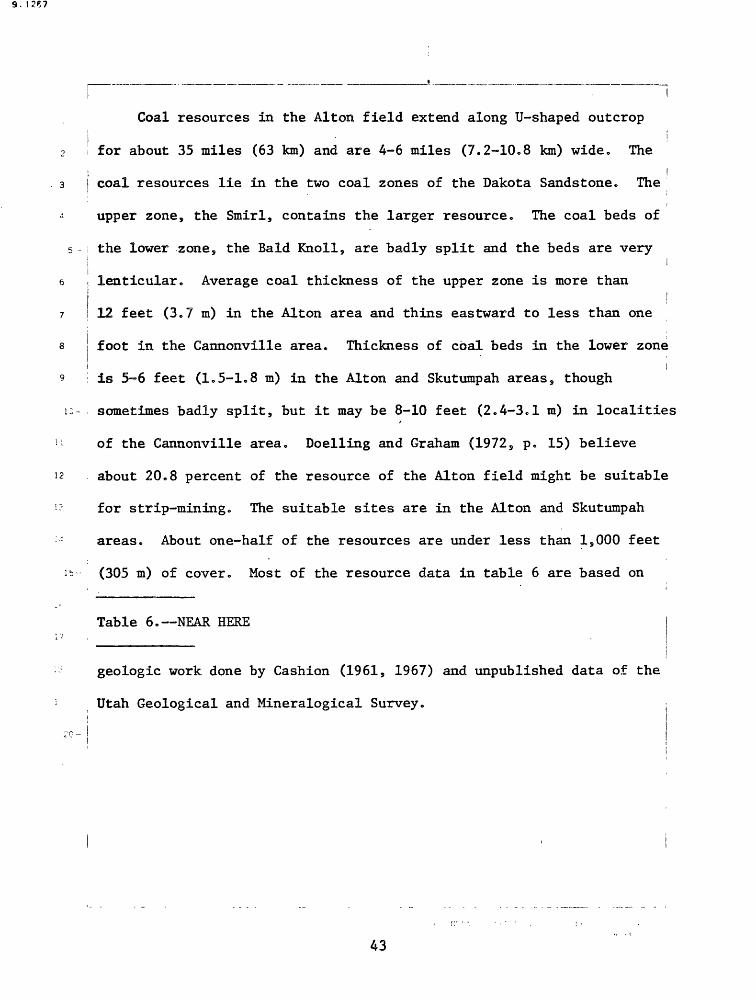
Coal resources in the Alton field extend along U-shaped outcropi
for about 35 miles (63 km) and are 4-6 miles (7.2-10.8 km) wide. Thei
coal resources lie in the two coal zones of the Dakota Sandstone. The
upper zone, the Smirl, contains the larger resource. The coal beds of
the lower zone, the Bald Knoll, are badly split and the beds are veryi
lenticular. Average coal thickness of the upper zone is more thanI
12 feet (3*7 m) in the Alton area and thins eastward to less than one
foot in the Cannonville area. Thickness of coal beds in the lower zonei
is 5-6 feet (1.5-1.8 m) in the Alton and Skutumpah areas s though
sometimes badly split, but it may be 8-10 feet (2.4-3.1 m) in localities
of the Cannonville area. Doelling and Graham (1972 s p. 15) believe
about 20.8 percent of the resource of the Alton field might be suitable
for strip-mining. The suitable sites are in the Alton and Skutumpah
areas. About one-half of the resources are under less than 1,000 feet
(305 m) of cover. Most of the resource data in table 6 are based on
Table 6. NEAR HERE
geologic work done by Cashion (1961, 1967) and unpublished data of the
Utah Geological and Mineralogical Survey.

0
*M
O
aM
. 5
"L
l a
.rn
o
H.
v.fD
u
Pu
'in 3
Ml
£.
H
«O
£
3
§f
3o
2.
JL
2,
S 9
P g
OQ
;,
K
« 2
r'
a.
5_
g
O
P
H
;P
*
1 5 NJ
V t A H*
»J £ £ N>
- -fcw
CO
0 o
"o 0-
o o M
Un
dis
co
ve
red
Q ET
ON ^
/ " x
^xj
w n
> cr
1 o
^O
0) |^
rt
< *
n> "TJ
n>
Ui
H
O
P
O
<J
rt
rto n
> P'
H-
>C>"
rt
M
0
H
' 0
0
rt
H-»
O
^P
.
0)
Q
e
ou f
t*
|0
*0
w
~.
3
cr
?°ill^
"O
=* ""^
3
C*
C
0«.
C-T
3 ^3
0
o
o *
c Q
OQ
2.
w
o
§. 3
O
-»
J^ *
^3
' ° ° 0? 3 ?
--i--
Identified..
.
n ST £, k < «
1
O9
"
ON
*^
"CN
3
O
oO
C
uw o
S
O
o>
0
o
3
MI/)
S? °
ST
. 5
' 1
3 ^ 3
§
«o
c*
£L
«
oO
o
^ 3
Q
.3
* <
ci
i °
g
2
o °
0^"
°* E
" 3
3
2.
vr"
K
-*
OO
*/>"
a
P
*"'
S,
3i
tt.
o*
ca
2
o
9
o'
0)
^-s
O
rt
O
w*
H
JT>
K
p>
3ft
O
S
2n>
PP^J
| O
N tr
*4^
. 3
00 8
J"5 °
o s
o
33
0
§. £
g §
g
i.
3" a
""
3
M ^*
8
5" °"
M ^
3* 3
^ 3
o
t;
js o
«-i
3
t-«
g
=»
"
3
r»
CfO
o
2.
o
(/»
oO
rV
C
U
C
O3
c.
*O
*" *
. 2.
o ~
?*?
'
' w
^
Ort
O
w
H n>
KPJ
3
_
rto
n>
PO
j I
V
J
5?*
o"
c a.
o 8 o v>
. 88*
i-*5
^
S?
w
2, ^
w
o
^ O
. 3
O
' S
. t>
D
&
o"
*O
Q->
*3
^
< "
*a
«2L °
«-^
o
p
p̂i M fD ON
/~\
H-
P 0) P"
O H rt rt
2 i-»
0) x-/
00 '.
V '.
n 0 M H n> 0)
0
C H o n> CO i_i.
p rt P' n> >
(-« rt 0
P n o h-» (D*
(-« CL.

1 I The coal resources in the Kaiparowits Plateau field occur chiefly
2 ,in the Alvey and Christensen coal zones but significant resources also
occur in the Rees zone. Most of the known coal resources are in the
Smoky Mountain and Escalante areas, but recent detailed investigations
s by U.S. Geological Survey geologists and private companies in these and
other areas should increase the estimate of resources, perhaps substantially,i
7 ; Great depths and steep structures limit the northward extent of resources.
8 jThe coal has been extensively burned along the outcrop, especially in
=» the southeastern part of the field, thereby reducing the resources. The
coals occur in a northwest-trending belt 18-25 miles (29-40 km) wide.
Within this belt, beds up to 25 feet (7.5 m) thick have been measured
and total thickness of beds at several locations exceed this. However,
total thickness may locally have been measured in coal beds over a 300-
14 400-foot (90-120 m) vertical span and the total thickness may not mean
:-- the addition of significantly recoverable coal. The resources given in
* table 7 are of beds over 4 feet (1.2 m) thick. Most of the data pertains
Table 7. NEAR HERE
:to the coal beds in the Christensen zone. Much of the data are based on
published work by several U.S. Geological Survey geologists Bowers
(1968a, 1968b), Peterson (1967), Peterson and Horton (1966), Peterson
and Waldrop (1966), Waldrop and Peterson (1967), Waldrop and Sutton
(1966, 1967a, 1967b), and Zeller (1967a, 1967b, 1967c, and 1969). Other
published work was done by Doelling (1967, 1968). Most of the data in the Tropic area are based on work by Robison (1966), who mapped the Henderson coal zone in the area of Tropic*
45 (

x-x
«
1 1
H«
0.
" h
8
H«
££
"C
U
3 3hh
~
0
33
o co
a0
o
fD
-»M
n
(-
ETs*
s.03
-, a
pj
85
3cu
«
o n & fD g V) K VO
«-j
to V) T3 e O
to
v-
/
g » "
H- « vo CO "o
o o "o
o o
Un
dis
co
ve
red
o
t>6
V
)
>_
^* ^
*^J
H
X~
N
^T
J,
w fD
p
4 O
w
w
«<J
rt
o
n o
3»
<
rt rt
o
n> is4
H-
o
w ro
PJO
rt
M
>. H.
0
0o
PJO
H
1^^^
%
o
<5"
p;
w*
^%
O
ut
Q
^
>»
Q
p.
£i»
7T
" C
- "
*
n " I
g
«'
0
P §-
f Is
*5
S p
»
P* "
*a '
o ;i ^
sr*
* t>
^ ^"j
O
"O
£ >
W
O
C.
7*'
eL
Q w i <
>~<
Oi
sr*o ?
>>1
U)
5fe
s.-°
o
11M
o S
"^|
g*»-»
Q
O
O
O
3
> .
^**
^* ^
y
w
o
J"T
*T3
Or*
o
s;
o
3
^v2
. 5"
"r~
-*
o
*i
2«
R
1^*
-»
n°
§'
^.
li o
1
»- i
, «
Identified
Wl
X-N
/»
%
ft a
y
PJ g
Krt
o
^
PL
|x^/
O>J
£r*
o a
.9
° 0
*J^
* w
O
f*
^ *
i0
3* ~
§ |r
S
^r*
(/>
*^
o ^*
~i S*
«/>
*3O
^ E
: c
a
e- -
r^
crj
-
a
tr*H
. J5
P*
O
o -
W
0
J^
1 3
O
C-
J^
CW
..
o
_. 5
' s
o
"
,_ 3
«
O
6l
x-x
f\
rt 0 «
rt
o ^
(D
3a.
i
«?* o*
M C S
P.
>n O
ts.
O ^ 0 n
r^i
£>)
b^
M
«
ti£T
o
*"
" 3
a.
g
o®
s r*
o
C*
C.
r> <
nO
p
. JT
15
O
* ~
2.*H
x
lit
1 i
n 0 &>
I-1
(D*
I-1
/~\ S' CO I34 0 H rt
rt 8 CO <*~/
H 8- M fD vj
n 0 i_j
H fD CO
O
C H
O
fD CO H»
3 ?3 PJ H«
X) PJ H O 5. rt CO M PJ rt S

9.1267
Oil
2 Central and eastern parts (Kaiparowits region)
3 The first oil well to be drilled in the central and eastern parts
of the report area was a dry hole by the Ohio Oil Company in 1921 in
the Circle Cliffs anticline. No shows of oil or gas were encountered.i
In 1930, Midwest Exploration Company drilled a dry hole on a closed
i anticline at Butler Valley. Between 1949 and 1965, 30 wildcat wells
*- were drilled in the region at the rate of several each year (except in
1950. 1953, and 1959 when none were drilled). Shows of oil were firstj !
10 ~Idiscovered in the area in 1948 on the Upper Valley anticline by the
California Company (now Chevron). No production resulted from the rocks
of these shows (Mississippian), even though testing continued until
1951. It was not until 1964, when Tenneco Oil Company found oil in
the Kaibab Formation, that the Upper Valley field became commercial.
Up to that time 27 dry holes 'had been completed by various companies in
the Kaiparowits region (Kunkel, 1965, and fig. 9). Oil is now being
18Figure 9. NEAR HEREj______ ' !.produced from porous zones in the Kaibab and Timpoweap (lowest member
i of the Moenkopi Formation) limestones of Permian age at depths between j
! t
6,700 and 7,700 feet (2,233 and 2,566 m). The oil is brownish black,
;asphaltic-base crude, 27 (API) with 1.75 percent sulphur content j!
(Ritzma, 1970). Production at the Upper Valley field in October 1965 =
was 142,263 barrels from 16 wells, an average of 4,590 barrels per day i
for the field and 287 barrels per day per well. By 1972 the volume
II. S. UOVKIINMENT I'llINI ISU OKHfK : I<»V> O - M1I7I
47 842-171

KAIPAROWITS REGION
-<f>-DRY HOLE «»OIL FIELD
Fig. 9. Generalized anticline and fault map of the Kaiparowits region showing distribution of dry holes (from Kunkel, 1965)
2
3
amounted to 7,900 barrels of oil per day, and wells averaged about 320 ]\
barrels of oil per day. Twenty-two producing wells had yielded 1.95
million barrels and the field had cumulatively produced 6.86 million
barrels of oil. As of June 1974, 12.47 million barrels had been
produced from this field. -.'.. -'.-._. -.-,-.,; -. -,;
10-
18
20-
23
«l. S. OOVKHNMLINr I'MI.NTINU OKfK'i: : l-<h>f O - MU71
49 842-t71

2
Exploration in other areas of the plateau region has not been
productive thus far, nor have commercial quantities of natural gas been
3 found (U.S. Bur. of Land Management, 1976).
Western part
Although no oil has been found to date in the western part of the
study area, oil was discovered in 1907 at the nearby Virgin field on
North Creek about 10 miles (16 km) northwest of Zion National Park
(fig. 10). Production was from the Triassic Moenkopi Formation at about
9Figure 10. NEAR HERE
\ 10-
11
12
13
14
15-
16
500 feet (170 m) depth. By 1938, 125 exploratory wells had been sunk
along North Creek and in neighboring areas. Although 199,569 barrels
of oil were produced at the Virgin field through 1962 an examination ofi
cost versus production as early as 1935 showed the area to be commercially
unprofitable (E. W. Benderson, U.S.G.S., Oil and Gas Leasing Division
records, 1935).
Asphalt
I In the Circle Cliffs area the lowermost beds of the Shinarump is i
19
20-
25-
IMember of the Chinle Formation locally contain asphalt, which generally
occurs as disseminated brown specks but locally is so abundant that
I brownish-black liquid asphalt seeps out along the contact with the
| Moenkopi. Locally where asphalt occurs in the Shinarump Member some has
penetrated into the upper few feet of the Moenkopi (Davidson, 1967, p. 69). Wood and Ritzma (1972, p. 10) report asphalt from vugs in the Kaibab Limestone, also in the Circle Cliffs area. There has been no commercial production of asphalt at Circle Cliffs or elsewhere in south-central Utah.
U. S. GOVERNMENT PRINTING OFFICK : m-» O M117I 50 842-171

38°.
v
i.,"
j r
~fj+
""fiT
r] \
v I
f-4"
^' "^
y A
* Ti
W J/
t~7 T
:^'W
?MIE
_E
%i!;/^
mf/
trn
Figure Id
Tect
onic
map of so
uth-
cent
ral
Utah
sh
owin
g lo
cati
on of
th
e Virgin a
nd U
pper
Va
lley
oi
lfields.
Heav
y line
is b
ound
ary
of study
area.
Patterned
area
s are
igneous
(lar
gely
volcanic)
rock
outcrop.
Modi
fied fr
om St
okes
and
Heylmua
(1965).

2
3
5-
Metallic Mineral Deposits
Copper
Copper deposits in south-central Utah generally are associated with
uranium and vanadium. They occur mostly in fluvial Triassic sandstone
and conglomerate, especially the Shinarump Member of the Chinle
Formation. The ore minerals fill pores in the host rock and locallyr - j
replace fossil wood fragments and detrital grains. Copper deposits areI
8 jmostly in channels cut into the underlying rock and are lenticular or ;} - ' ' i
9 [tabular. Minor copper deposits are reported in Wayne County at Miners
10-
11
12
13
16
Mountain (Capitol Reef area) where oxidized copper minerals (malachite,
azurite) occur in channels in Chinle sandstone (Finch, 1959, p. 152;
U.S. Geol. Survey, 1969, p. 70, 83; Butler and others, 1920, p. 632)
(fig. 11). !
Figure 11. NEAR HERE15-
Elsewhere prospecting for copper in the Moenkopi, Chinle, and
Navajo Formations has been carried out at a number of places in the
18 'Paria Valley and in Tertiary beds around the Aquarius Plateau (Gregory
and Moore, 1931, p« 148); however, no deposits of commercial value were
20-
22
23
.25-
found in any of the rocks.
Iron
Although no iron deposits are known within the study area they are
briefly discussed here because they do occur nearby and constitute a
significant part of the mineral resources of south-central Utah.
Additional buried reserves could exist within the study area.
V. S, COVKHNMKNT HHINTING OFFICK : 1919 O - SUI71
52 B42-171

113
112'
111
1
Ui
U)
HI
i i
. «
. '
. i
:_
S-SS
-P-^
;
"p
ft
**
! I
OJ
l V
X4
I '
I
V^£
W/T
( s&
mi/»
>v!
.? I
/i?
\
s^//
* ~
\*\w
a j
mIN
\r<
> VA
A
, ..
^
::
^/4J
Wxl
i
Ir7"
\
"\
i i*
-i !
: ^
» Tx
<*1
'! -"
5-?/U
^s
x ;
* \
'i
rvz" ^
^^
\,y/'v
is
^ »
'
' ;
t33^-
»
V
/iV
^rrn
s5-7
'n"
M
M
Figure 11.
Tectonic m
ap of
so
uth-
cent
ral Ut
ah sh
owin
g lo
cati
on of
Miners
Mountain an
d tw
o co
pper
pr
ospe
cts
(base
and
tect
onic
map from St
okes
an
d Heylmun, 19
65).
He
avy
line is bo
unda
ry of
stud
y area.
Patt
erned
area
s are
igne
ous
(lar
gely
volcanic) ro
ck o
utcr
op.

Most of the iron ore produced in Utah comes from the Iron Springs
district, about 10 miles (16 km) west of Cedar City (fig. 12.). Here
3
Figure 12. NEAR HERE
5- hematite and magnetite occur as replacement bodies and veins in the
Jurassic Homestake Limestone Member of the Cannel Formation. Ore
7 Ibodies are clustered around three quartz monzonite intrusives. I .
8 [ Iron ore was discovered at Iron Springs in 1849. It has been
9 I intermittently exploited since 1852, and continuously exploited sinceI
1Q -J1924 on a large scale for blast furnaces at Ironton and later at
11
12
13
14
15-
16
16
19
20-
21
Geneva near Provo, Utah. By 1962, 67 million long tons of iron ore
had been produced with a value of $313 million. Large reserves are
still present.
Additional reserves are known east of Paragonah where massive
magnetite occurs as replacement bodies in intrusive volcanic rock
(U.S. Geol. Survey, 1969, p. 89-96).
Gold
Between 1910 and 1913 an attempt was made to recover very fine
grained, widely distributed gold flakes from the Chinle and Moenkopi
Formations on the Paria River at Lees Ferry (south of area shown in
Plate 1) and Paria by hydraulic mining. The planning for such a venture
22 | was considerable and much money was invested in assays and equipment..
23 Eventually work began but because the area was so remote and the
24 jdifficulty and expense in recovery so great, work was discontinued in
1913 (Gregory and Moore, 1931, p. 148)._______________________
tl. S. GOVEHNMENT HUNTING OFFICE : 19*$ O - MU71
54 842-171

Ui
Iron
^=^
0^TT- ^f
|s^C
\ ^\\ _k-2_l
i__\_
____i
; . ,
~s
*rr
\3 7
77T
~v~
i\ A
VC£^«T:,
Q' \
e. i\
/>
-X
~Mountain
Th
e Three
Peak
s_
.
. V
.I
S
^^r^
^\
T£
Jilj
TTsr
^Sii.
V
/v^
4'«ii
o w
/1^
i\\
li37 Fi
gure 12
. Tectonic m
ap of
south-central
Utah
sh
owin
g location of Iron Sp
ring
s an
d Paragonah
iron
dist
rict
s.
Iron
Springs
district is
co
mpri
sed
of th
ree
stoc
ks;
Iron
Mountain, Granite
Moun
tain
, and
The
Three
Peak
s (b
ase
and
tectonic map from St
okes
an
d He
ylmu
n, 19
65).
He
avy
line is
boundary of study
area.
Patt
erne
d ar
eas
are
igne
ous
(lar
gely
volcanic)
rock
outcrop.

1 | Manganeseil
2 ! Although manganese deposits occurring as thin veins, nodules, andi
3 impregnations of oxides are known in sedimentary rocks at several
j localities in south-central Utah the low concentration and cost of
5-jmilling make it unlikely that they will ever be productive, excepti
e -during periods of artificial price supports (U.S. Geological Survey,
7 J1969, p. 103-108; Davidson, 1967, p. 91-92).
a i Titanium, zirconium, thorium and rare earths! i
Minerals containing titanium, zirconium, thorium, and rare earths
i:- : are found in paleo-placer deposits in which monazite, ilmenite,
"'- leucoxene, zircon, and other heavy minerals have been concentrated. The
- paleo-placers are in Late Cretaceous sandstones and they probably formed
: from the weathering of igneous and metamorphic rocks«, Such placers are
- known in the Straight Cliffs Sandstone and Ferron Sandstone Member of
is- the Mancos Shale, but none appear to have commercial significance at the
it present time because of the extremely fine grain size and the varying
-i degrees of alteration of the minerals (U.S. Geological Survey, 1969,
p. 115-120).
i 19 i Uraniumi
The uranium deposits of south-central Utah are small and of low
grade. Of the numerous scattered occurrences in south-central Utah only
those in the Circle Cliffs and Capital Reef areas constitute deposits
iwhich might be of future interest. The interested reader should consult
Map 36 of the Utah Geological and Mineralogical Survey (1975) for
additional localities of minor occurrences.
56 ! ' """ " '
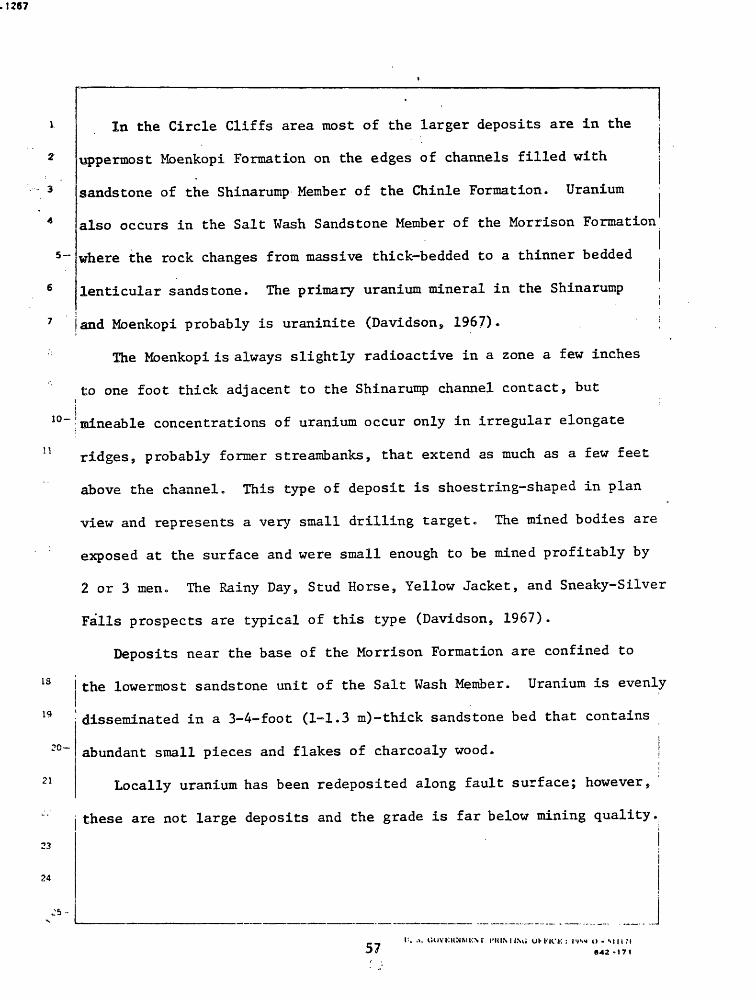
1267
5-
In the Circle Cliffs area most of the larger deposits are in the
uppermost Moenkopi Formation on the edges of channels filled with
sandstone of the Shinarump Member of the Chinle Formation. Uranium
also occurs in the Salt Wash Sandstone Member of the Morrison Formation
where the rock changes from massive thick-bedded to a thinner beddedf
lenticular sandstone. The primary uranium mineral in the Shinarump i
7 land Moenkopi probably is uraninite (Davidson, 1967). ;
The Moenkopi is always slightly radioactive in a zone a few inches
to one foot thick adjacent to the Shinarump channel contact, but1 i
10 ~|mineable concentrations of uranium occur only in irregular elongate
ridges, probably former streambanks, that extend as much as a few feet
above the channel. This type of deposit is shoestring-shaped in plan
view and represents a very small drilling target. The mined bodies are
exposed at the surface and were small enough to be mined profitably by
2 or 3 men. The Rainy Day, Stud Horse, Yellow Jacket, and Sneaky-Silver
Falls prospects are typical of this type (Davidson, 1967).
Deposits near the base of the Morrison Formation are confined to
the lowermost sandstone unit of the Salt Wash Member. Uranium is evenly
disseminated in a 3-4-foot (1-1.3 m)-thick sandstone bed that contains
11
is
19
20-
21
23
1
abundant small pieces and flakes of charcoaly wood. j
Locally uranium has been redeposited along fault surface; however,
these are not large deposits and the grade is far below mining quality.
i:. .>. i:uvt:i<NMt:\r CIUMI.V; UI-HC*::842 -171
1267
In places large charcoaly and silicifiecl logs in beds near the base
of the Petrified Forest Member of the Chinle Formation are heavily
impregnated with carnotite. Most of the mineralized logs have been
found on the west side of the Circle Cliffs area. This type of
occurrence, however, is not mineable (Davidson, 1967; Finch, 1959).
Minor occurrences of uranium are also found in the Wingate
7 ,. jsandstone. Deposits appear to be the result of ground-water
redeposition along fractures (Finch, 1959).
Lead
10- Minor amounts of lead occurring as cerussite and plumbojarosite
are associated with the small copper deposits found at Miners Mountain.
(See discussion on copper, this report; Butler and others, 1920, p. 632.)
No lead has been produced from south-central Utah.
20-
58I'IIIMI.M; »>I-KU-K: ! » » * O-MIITI
a*:: -171
1
2
3
5-
Antimony and arsenic
Antimony minerals (stibnite, mainly) occur as veinlets, irregular :
i masses, and disseminations in and near faults and fractures in argillaceous
sandstone and conglomerate of the Paleocene Flagstaff Limestone at
Antimony Creek (also known as Coyote Creek) in northwestern Garfield
County (a few miles west of the study area) (fig. 13). Although
21
>3
Figure 13. NEAR HERE' > ' '
production between 1880 and 1917 was sporadic, 1,200 tons of hand sorted
i 10 ~'ore containing 600 tons of stibnite was mined. Commonly deposits occur
1 as layerlike irregular bodies a few inches (several centimeters) thick.
The larger lenslike deposits have been mined out and no sizeable bodies
of stibnite are known to remain. Large quantities of low-grade ore are
still present at Antimony Creek and at several small deposits about 5
miles (8 km) to the north. An excellent discussion of the antimony
deposit is presented by Callaghan (1973) .
Small quantities of arsenic minerals (realgar, orpiment) have been
found contiguous to the antimony deposits but not immediately associated
with them. They are not commercially mineable (Butler and others, 1920,
20~'p. 561-563; U.S. Geol. Survey, 1969, p. 138-140). j}
Selenium and other metalliferous occurrences
Selenium is reported associated with carnotite from the Salt Washi
Member of the Morrison Formation in the Circle Cliffs area (Davidson, .
18 i
1967, p. 92). Various other metals occurring in minor (but detectable) amounts and associated with uranium include cobalt, vanadium, and
^ .arsenic (Finch, 1959).
II. S, liOVKHNMKNf HUNTINi; OK KICK : ! »< ! u . s| || T| 59 842-171

ON
O
^V
AN
TIC
LIN
ES
*
CIN
DER
CO
NES
FAU
LTS
Tt^
^N
^l'^
Ant
imon
Y C
reek
(J'
.T '
.V
/-Y
WK
^-
. ;$
,.i^
4h',<
.
f.t."
v ,/n
/« ;»
>>
" \v
ki.
v I
> '
«~V
7i 'v
'''
E '
-
<
. ' -e
-'"*
I
:^:>
.\'->
/>:-
>i3
^V' '
'P
^:'^
<^-
J /n
V/:;
;v;.Y
/^
Lrn
vv:..
? ij
^\iV
|\
\ KV
^. - j
,..;
\\A
i\
i ^^
" "
if 4 /
^ '
Tl
n r
i w
\I
II
-I*
-NX
\"
"l//^^
-!^>
\5E3
33yv
,,.,.,
" BW
\7|V
^a
^
M:»
I
n
< 'L
37 Figu
re 13.
Tectonic m
ap of
south-central
Utah showing
loca
tion
of an
timo
ny de
posi
ts (h
achu
red)
at
Antimony Cr
eek
(base
and
tect
onic
map fr
om Stokes and
Heyl
raun
, 19
65).
Heavy
line
is
bou
ndar
y of study
area
. Patterned
area
s are
igne
ous
(lar
gely
volcanic) ro
ck o
utcr
op.

1267
Nonmetallic and industrial ntinerals
and material resources
Clay
Clays suitable for use in low-heat refractory products are present \\
in the Straight Cliffs (fig. 14, loc. 1) and Dakota (Cretaceous) sandstones
10-
13
?1
Figure 14. NEAR HERE
(fig. 14, loc. 2) west of Escalante and the Dakota at the Barney deposits
(fig. 14, loc. 3) in northern Garfield County (near the Waterpocket fold)
The latter are the highest grade refractories of sedimentary origin in
Utah and are considered to be of significant economic importance (Van
Sant, 1964).
Common clays and bentonitic mudstones suitable for drilling mud,
canal sealing, and the bonding of molding sand have been found in the
Tropic-Dakota formation near Tropic and Henrieville and have been mined .
and processed north of Cannonville (fig. 14, loc. 4) in Garfield County
(U.S. Geol. Survey, 1969, p. 160; U.S. Bur. of Land Management, 1976,
p. 11-99). |!
Gem materials»
The most common gem minerals occurring south-central Utah are agate,
i jasper, petrified dinosaur bone, petrified wood, and green onyx marble.
Excellent red and yellow moss agate are reported present in the areai
surrounding Cedar Breaks National Monument (fig. 15, loc. 30).
24Figure 15. NEAR HERE
61V. S. UUVKUNMKNT I'KINTINC OKHCK : Wt O - *IU7I
842 -171

ON
X" A
NT
-.C
LI.S
tS
CIN
DE
R C
ON
ES
FA
ULT
S
^r
c i^^
iim
/T
IV*N
iV
1 r
i\.\!
-r
'4i
i! !
:Jj
/!&, *\ l\
\ \
sy^r
-4--
Figu
re 14
. Te
cton
ic map
of sout
h-ce
ntra
l Utah sh
owin
g locations
of clay
deposits (n
umbe
red)
.Lo
cali
ties
ar
e described
in te
xt.
Base an
d tectonic m
ap from Stokes
an
d He
ylmu
n (1965).
Heavy
line
is b
oundary
of study
area
. Patterned
area
s ar
e igneous
(large
ly v
olcanic) ro
ck o
utcr
op.

42 *' tir. - "T"'i' \ ^
.BOX, e
. ' t.2
v ^'
0
~\(V
\i
D
"1
B>
1»
f Jl,
'l^>
, 42' «
60 Miles
K> Km.
> ' ! y?r^;i 43s£iL_Ju^ .jno-. 41 .[T ^x!T^\^-3errj-- H^ »-w^rSo 4 x.' 1 ^-" V'' ~'vi >' i -- I ' v ^?- """"" r---'"'? v/, --\ '11 ! *C . > .;<. j .* SAuVbAKLeTTTY !Y--" ' \$ !\ \ V^-1
Ij 1 Vitf l?X^'J 'L'-* l^i xAxl; T OO k-e-. ««%i ?:;..«i;:N ^\K j>^ !,..-- : - ff$ X «, I . :>oJc>ESNE^ i e-/' - k ' / f^^«4i^^f T̂ ..-1 .
N X: u>' A ri _,
» Deposit of gem material
A AzuriteBa AquamarineBm MorganiteC Calcite, referred toG Garnet, unspecifiedCp PyropeGs SpessartiteJ JetL LabrndoriteM MalachiteOb ObsidianOp Opal
EXPLANATION(Numbers refer to localities mentioned in text)
Q Cryptocrystalline quartz (One or more varieties: agate, chalcedony, jasper
as "onyx" petrified wood, dinosaurbone)
Qa Amethyst , Qs Smoky quartz R Banded rhyolite S Scheelitc T Topaz V Variscite
Fig.15 Gem materials in Utah. Heavy line is boundary of area of this report. Numbered localities in study . area are described in text (from U. S. Geol. Survey, 1969, p. 171).
63

5-
Petrified wood has been reported in the vicinity of Kanab (fig. 15,
loc. 28) and agate and petrified wood are present near Orderville
(fig. 15, loc. 29). Agate, agatized wood, and dinosaur bone are
reported from the vicinity of Escalante (fig. 15, loc. 33). Petrified
logs, some measuring from 10-12 feet (3.5-4 m) in diameter are
abundant in the Circle Cliffs area (fig. 15, loc. 34),
7 | Most of the petrified wood occurs in the Triassic Petrified Forest
* ; and Shinarump Members of the Chinle Formation. Dinosaur bones,
"; replaced by varieties of quartz, occur in the Jurassic Brushy Basin
i iQ-jMember of the Mbrrison Formation.
1 Translucent.green onyx marble has been quarried at Hatch (fig. 15 s
loc. 32) and on Mammoth Creek (fig. 15, loc. 31) in southwestern
Garfield County (U.S. Geol. Survey, 1969, p. 173-175).
is
19
20-
21
23
Sti
lt. !>. tUWKKNMKNl HMMINO oKtlCi: : |«)*9 i) . SII171
64 1142-171

1267
1 Gypsum
2 Utah has an abundant supply of gypsum; its resources are among the
largest in the United States. In the study area large deposits are
known, although none have ever been commercially mined. By far the. I
5 - most extensive gypsum deposits are in the Curtis Formation of Jurassicii
age. According to Cashion (1967) this unit is the gypsiferous member of
7 I the Carmel Formation of Middle and Upper Jurassic age. . The formation
crops out discontinueusly from Cedar City southward into Washington
County and eastward into Kane County. A basal gypsum bed in the Curtis I . i.10~granges in thickness from less than 6 feet (2 m) to as much as 101 feet
I: (34 m) in the crest of anticlines. An exposure in Cedar Canyon (fig. 16,
loc. 33) showed 101 feet (34 m) of massive resistant white alabaster
18
Figure 16. NEAR HERE
apparently in one bed. About 4 miles (6 km) east of Kanarraville (fig.
1.6, loc. 34), Gregory (1950b, p. 126) reported about 92 feet (31 m) of
gypsum mixed with clay (U.S. Geol. Survey, 1969, p. 184).
In the northeast corner of Washington County (fig. 16, loc. 35), the
- gypsum in the Curtis has thinned to about 6 feet (2 m), is white to gray
2°~!and contains lenses of red silt (Gregory, 1950b, p. 89). Southward in
21 'Washington County, the gypsum thickens to 15 feet (5 m). In an exposure
i11 miles (18 km) west of Orderville and also further eastward in Kane
-* ; County (fig. 16, loc. 36), the gypsum is in a 30-foot (lO-m)-thick bed(Gregory, 1950a, p. 125). About 3 miles (5 km) southwest of Orderville, Kane County (fig. 16, loc. 37), Gregory (1950a, p. 126) reported three , beds of gypsum, ranging from 3-16 feet (1-5 m) in thickness and (
/* [separated by_sandstone and shale (U.S. Geol. Survey, 1969, p. 184). j
24
KM' riUMI.v; UKUl'K : I »'. * U . Mil 71
842 -171

113'
BOX.
! ' | V^ ^J-"*' ^ -./~-'Xs . I 25 o 20 *" W'M««
h * W/ \* ̂ 0&Ju E *-' ^ >- ' 4* ° ^° ^° '° ^in'
^.^ *'" v ' ' IK«'£J'I^>-' jni* _ no* ' ____.-^4i»
112- 1:1"
EXPL^NATION
Approximate trace of gypsum- and anhydrite-bearing stratigraphic units; formations identified by initials: Upper Jurassic Sursnervillc (Js), and Arapien (Ja); Upper and Middle Jurassic Carmel (Jc) and Curtis (Jcu).
Approximate outline of basin of sedimentation containing extensive gypsifeious and associated saline units of the Paradox Member of the Pennsylvanian Hcrmosa Formation.
6 ttGypsum locality described in text ' Gypsum mine or quarry
i
Fig. 1.6 Gypsum and anhydrite in Utah. Heavy solid line is boundary of area of this report. Numbered localitiej in study area are described in text (from U. S. Geol. Survey, 1969, p. 180).
66

The gypsum in the Curtis thickens eastward, and 3 miles (5 km) east
of Glendale (fig. 16, loc. 38), Gregory (1950a, p. 126) reported a 28-
foot (9-m)-thick bed of white, massive gypsum part of it a waxlike
alabaster (U.S. Geol. Survey., 1969, p. 184).
Eastward from Glendale, the area of the outcrop of the Curtis is
relatively inaccessible. According to Gregory (1951, p. 29) the gypsum
7 is a persistent stratigraphic marker that ranges in thickness from 3-16
feet (1-5 m). Near Cannonville (fig. 16, loc. 39), two thin beds of
* ;gypsum, both impure, are present (Gregory, 1951, p. 57-58). Eastward
10 ~ the Curtis becomes less gypsiferous, and in the eastern parts of Kane
and Garfield Counties gypsum is absent (Gregory and Moore, 1931, p. 22)
Lightweight aggregate
Two potential sources of lightweight aggregate exist in south-
central Utah basaltic cinder deposits and diatomaceous earth deposits.
Numerous Quaternary volcanic cinder cones are present south of .
Parowan (fig. 17). Some have been quarried, probably for road metal.
. Figure 17. NEAR HERE is 1
iAlthough the quality of these deposits for lightweight aggregate is I mostly unknown, they constitute a large potential source area (U.S.
Geol. Survey, 1969, p. 187).
t'. S. COVKHNMKN I I'HINI'IM; (IKI-JCK : Wl O - MII7I
67 842-171

Figu
re ly
. Tectonic m
ap of so
uth-
cent
ral Utah showing
location of
li
ghtweight
aggregate
depo
sits
; A, cinder
cones, D, diatomite deposit.
Base an
d te
cton
ic m
ap from S
tokes
and Heylmun
(196
5).
Heav
y li
ne is b
oundary
of study
area
. Patterned
area
s are
igne
ous
(lar
gely
volcanic) ro
ck o
utcrop.
9. 12«57
Deposits of diatomaceous earth have been reported in southwestern! j
2 Garfield County (locality D, fig. 17) near the entrance to Bryce Canyon, !
3 i(about 2 miles (3 km) east of Hillsdale). The extent and thickness of
the deposits are not known. Claims have been developed and pits dug,
% one of which indicates the deposits to be at least 20 feet (7 m) thick.i i
6 jThe diatomite is believed to be of Pliocene age and is reported to bei l
7 interbedded with tuffaceous material. The suitability of these deposits
s for lightweight aggregate has not been evaluated (Crawford, 1951; U.S.i . iGeological Survey, 1969 9 p. 187).
10-1 Limestone !
Limestone is common in southern Utah. Many deposits known to be
2 high-carbonate varieties are suitable for chemical applications such
as stack scrubbing of SCL in coal-fired electric generating plants or
- as rock dust for protection against fire and explosion propagation in
is- mines. One deposit of limestone that has the desired qualities for
industrial use occurs in the Wasatch Formation on the west side ofi
? Johns Valley (north of Bryce Canyon National Park); it was planned for
use with the Kaiparowits power plant. Equally good deposits probably
occur in the Wasatch Formation throughout the area and in the Carmeli
:o :Formation near Orderville (Bur. of Land Management, 1976, p. 11-99-100).
69

Sand and gravel
Sand and gravel are generally abundant throughout south-central
Utaho Most canyon bottoms and terraces in the area contain gravel in
amounts ample for local use. Important deposits are contained on
5- Wahweap Creek drainage near Glen Canyon City, where sand and gravel' . . i
are mined, on Horse Mountain and along the Paria River drainage (Bur.
7 jof Land Management, 1976, p. 11-99)» Additional resources have been
indicated in Johns Valley and on the south flank of the Aquarius
Plateau, although the latter appears to be largely colluvium with
i°--much clay suggesting that good sand and gravel deposits may be difficult
: to find (U.S. Geol. Survey, 1969, p. 217).
Dune sands are most abundant in the southern part of the area at
East Clark Bench (southwest of Nipple Bench), but smaller scattered
deposits are common locally.
I , Silica
Utah's principal reserves of pure silica are in sandstones and
quartzites. In south-central Utah the principal siliceous rocks are
18 jTriassic and Jurassic aeolian formations such as the Wingate, Navajo,!
C' .Entrada, and Bluff Sandstones. The only known active quarry in southr
central Utah, located just north of Kanab, mines silica from the Navajo
Sandstone (U.S. Geol. Survey, 1969, p. 220).
Stone ii
Resources in this catego.ry are of three types: (1) crushed and
broken stone, or aggregate, (2) dimension stone, and (3) field stone.
20 -
71
I. X liliVKMNMKM I'UIMINU OKI'K'l-:: l'*i-< o- Sill 71
842-171

5 ~
10 ~
18
20---
23
25-
Crushed and broken stone
Large quantities of clinker, a term used here for rock baked and
fused by the burning of adjacent coal beds, are present in many of the
canyons where coal-bearing strata are exposed. Clinker is commonly
used as a road-surface material and as railroad ballast (Bur. of Land
Management, 1976, p. 11-99). Common rock types that are suitable for
' aggregate include most quartzites, basalt, and limestone; and resources
in this area are abundant. Stone suitable for rip-rap consists of
well-indurated irregular cobble- to boulder-size fragments common in
I many canyon bottoms and along most terraces throughout the region (U.S.
Geol. Survey, 1969, p. 222-225; Bur. of Land Management, 1976, p. 11-99)
Dimension stone
Sandstone is the most widely used dimension stone in Utah. Most
of it comes from the Nugget (Lower Jurassic) in central-northern Utah,
but other sandstones of good quality are quarried from the Moenkopi,
Chinle, and Wingate Formations in southern and eastern Utah. Quarries
southeast of Cedar City, near Parowan, and near Kanab are in sandstone
(U.S. Geol. Survey, 1969, p. 224-227). j
Field stone
Field stone has been used as a building material since pioneer days.
Cobbles and boulders are split and trimmed for veneers and walls in both
Iexterior and interiors of residences and commercial buildings.i ;
Numerous localities in south-central Utah have abundant sandstone ^
suitable for this usage. i
II. S. UUVKHNMKVl I'HIN HMJ CH-'KICK; |1S'» O . MU7I
71 H4i-I71

9.1267
1 , Geothermal Resources
2 ' Two principal origins of the heat necessary for a geothermal] i
3 'resource are: 1) heat directly related to volcanic sources localized as
- "hotspots" in the shallow crust of the Earth, and 2) heat related to
D ,geothermal gradient, or the general increase in temperature with depthi ;
e ias a consequence of conductive heat flow. Basalts and andesites,
7 tcommon in much of Utah, have probably risen rapidly from the Earth'si j
s .mantle to the surface in volcanic eruption and their heat is dispersedirather than stored and generally does not provide useful geothermal
10- 'Concentrations. However, the high silica varieties of volcanic rocks
- 1 (rhyolites, rhyodacites), perhaps because of their high viscosities,
i commonly are associated with magma chambers at shallow levels in the
- crust (perhaps 2 to 10 km but most commonly about 4 km) and can sustain
[4 high-temperature convection systems for many thousands of years. Many
is- large geothermal systems appear to be associated with young silicic
^ volcanic rocks. Some hot-spring systems that have no direct association
with young silicic volcanic systems may derive their heat from older
volcanic systems or from very young igneous systems with no surface
Q expression. Other hot-spring systems are probably not related toi j:silicic volcanic rocks. The heat of their systems is related to the
regional geothermal gradient, which is higher in some regions such as
the Basin and Range province than in others. Many hot springs of the
j !Basin and Range emerge from steeply dipping faults that may extend to
depths of at least a few kilometers. The water may be entirely of surface origin, circulating downward, being heated by thermal conduction and then rising and discharging from surface springs (Renner, White, and Williams, 1975).
72

9.1267
In southern Utah, geothennal prospects of high-temperature (above
2 i 150 C) hot-water convection systems are found at Roosevelt Hot Springs,
Cove Fort-Sulphurdale, and Thermo Hot Springs, and systems of
intermediate temperature (90 to 150 C) are found at Monroe Hot
C _
12
1?
19
Springs and Joseph Hot Springs (Renner, White, and Williams, 1975).
All these prospects, however, are north and northwest of the study area,
Other areas having geothermal interest are the LaVerkin (Dixie) Hot
Springs located to the southwest, near Hurricane (Mundorff, 1970) and
the Newcastle KGRA (known geothermal resource area), located 50 km west
of Cedar City. The latter probably represents a typical basin-range
hot spring system derived by deep circulation of cold meteoric waters
along high-angle faults. The heat is related to the higher than normal
geothermal gradient characteristic of the Basin and Range province
(U.Se Geological Survey, Utah Geothermal Resource Leasing Minutes No.
ll s 1976; Sass and others, 1971).
Heylmun (1966, fig. 1) shows the Panguitch area (western Garfield
and parts of adjacent Piute and Kane Counties) to be a thermal area
but says (p. 13) that "Only a few warm springs are recorded for the
Panguitch area. Prospects are not encouraging for steam development
in spite of Late Tertiary or Quaternary volcanism." No specific
reports of hot springs occurring within the boundary of the study area
were found.
73

9.
io-
Young basic volcanoes are indicators of magma source regions in theI
mantle and under some conditions are potential indicators of buried; i
high-level silicic bodies with no obvious surface manifestations. The
common association of silicic domes and lavas with basaltic lava fields
shows that basaltic systems should not be automatically rejected for
geothermal exploration (Smith and Shaw, 1975) . The Markagunt Plateau
; contains basic lava fields and cinder cones, some of which are inferred
|to be less than about 10,000 years old (Smith and Shaw, 1975). Thei J Navajo Lake area, about 20 miles (32 km) southeast of Cedar City is a
iKGRA (Utah Geological and Mineralogical Survey, 1975) containing about
20 volcanic cones. Many of the cones retain their summit craters,
indicating a relatively young age, and outpouring of lava from many of
their vents has interrupted drainage systems in the area. Some of the
flows were early enough to have been faulted; some are covered with a
- thin mantle of soil and vegetation; others appear to be very recent
(Holocene?) (Wilson and Thomas, 1964). Eruptions probably began in the
Pleistocene and continued into the Holocene. The youngest dated basalt
in the area is a flow dated at 0.44+0.04 m.y. (Pleistocene), located
iabout 3 miles (5 km) northeast of Parowan (Fleck and others, 1975).
! Silicic and intermediate composition volcanic lavas and tuffs are
common in and adjacent to the Markagunt Plateau, but all are middle to
late Miocene in age and are believed too old to provide a heat source of
i sufficient magnitude for geothermal development.
At present it is difficult to evaluate the geothermal resource
value of the south-central Utah study area, but it is probably very low.
74 /

NATURAL EARTH HAZARDS
Seismicity
3 Seismic activity in the area is slight except for two zones parallel
- and related to well-known faults. Earthquake zones occur locally along
5 the Hurricane fault which trends NNE-SSW and passes near Cedar City andi
e JFarowan, and along the Sevier fault trending NNE-SSW near Orderville
7 and Alton. Data on the seismicity of Utah, tabulated by Cook and Smithi Ii j
B 1(1967) for the period between 1850 and June 1965, indicate that'. i
magnitudes along these faults have not exceeded 4.9 and the majority
10-iare less than 4.0. Earthquake data since June 1965 (Carl von Hake s
;i written commun. s 1976) indicate a continuation of mild activity in the
' 2 western part of the area along the Hurricane and Sevier faults and
' some additional mild earthquakes on the east side of the Sevier Plateau
u east of Mt. Dutton and Casto Bluff.
75

Smith and Sbar (1974, p. 1210) report that "The most recent swarmi
2 iof activity of the ISB (Intermountain seismic belt, a north-trending
3 zone of seismicity in the western United States) was located north of
Cedar City near the Hurricane fault zone. This sequence began on
'j November 11, 1971, and culminated after four hours with an earthquakei !
6 jof magnitude 4.5. As many as 300 events per day occurred following the
7 imain event. The activity was located along a north-trending zone thati i
s ibounds Tertiary and Quaternary basalt flows and outlines a prominent
r- line of springs. Field investigations revealed three north-trending
10- fractures in alluvium. The longest fracture was 0.8 km and showed
several centimeters of east-west horizontal extension. Focal depths
2 were shallow, from near surface to 2 km, which probably accounts for
3 the surface deformation." For the same area Smith and Sbar (1974,
p 0 1212) report: "A composite fault plane solution, from the main event
i&~ and aftershocks, indicates normal faulting along a north-northwest-
trending fault plane. On the basis of a comparison with the Hurricane
7 fault s the most likely fault plane dips 62 northeast."
76
9.1267
tialy a few shocks of intensity VII to VIII on the Modified
Mercalli scale (table 8) have been recorded in northern Arizona and
Table 8, NEAR HERE
5- southern Utah» The nearest moderate-sized recorded earthquakes were
6 magnitude 5.5 and 5.7 near Kanab, Utah in 1887 and 1959 respectively,
7 ^Seismologists have classified the entire area as a region of lesser
! !8 fseismicity, indicating that earthquakes of a Modified Mercalli intensity
! j i [
9 ?of VII or greater, or a Richter magnitude of 5 or greater, will occuri
10 teith a frequency of one or fewer per square degree of surface per decade
11 KBocky Mountain Association of Geologists, 1972).
12 Relevant data indicate that the region is still active and that
13 ^earthquakes of low intensity will occur (fig. 18); however, the effects
14
15 IFigure 18. NEAR HERE
16 [of such activity can be predicted as slight (Bur. of Land Management,
17 !1976 9 p. 11-88-90).
18
20-
21
77I' S OOVEttMMtNT PRINTING OFFICE . 3:172 O - 4 piV-0«4

9.1267
10-
11
12
14
15
16
17
18
19
20-
^Table 8. Modified Mercalli Intensity Scale of 1931 (abridged)
X* Not felt except by a very few under especially favorable
circumstances*
XL, Felt only by a few persons at rest, especially on upper floors
of buildings. Delicately suspended objects may swinge
TIIo Felt quite noticeably indoors, especially on upper floors of j|
buildings, but many people do not recognize it as an earthquake,i
^Standing motorcars may rock slightly* Vibration like a passingj
truck. Duration estimated. j
IV- During the day felt indoors by many, outdoors by few* At night,, . ., . -,^. !
some awakened. Dishes, windows, doors disturbed; walls makei
creaking sound. Sensation like heavy truck striking building.
Standing motorcars rocked noticeably.
V« Felt by nearly everyone, many awakened* Some dishes, windows,
etc., broken; a few instances of cracked plaster; unstable|
^objects overturned. Disturbances of trees, poles, and otheri
tall objects sometimes noticed. Pendulum clocks may stop.i
VI* Felt by all; many frightened and run outdoors. Some heavy
^furniture moved; a few instances of fallen plaster or damaged!i
-chimneys« Damage slight. . j
"VII* Everybody runs outdoors. Damage negligible in buildings of good
design and construction; slight to moderate in well-builti
ordinary structures; considerable in poorly built or badly 'i i
-designed structures; some chimneys broken. Noticed by persons
_____.__.driving motorcars. _._ . ____________________________
78L" S GOVETINVENT PRINTING
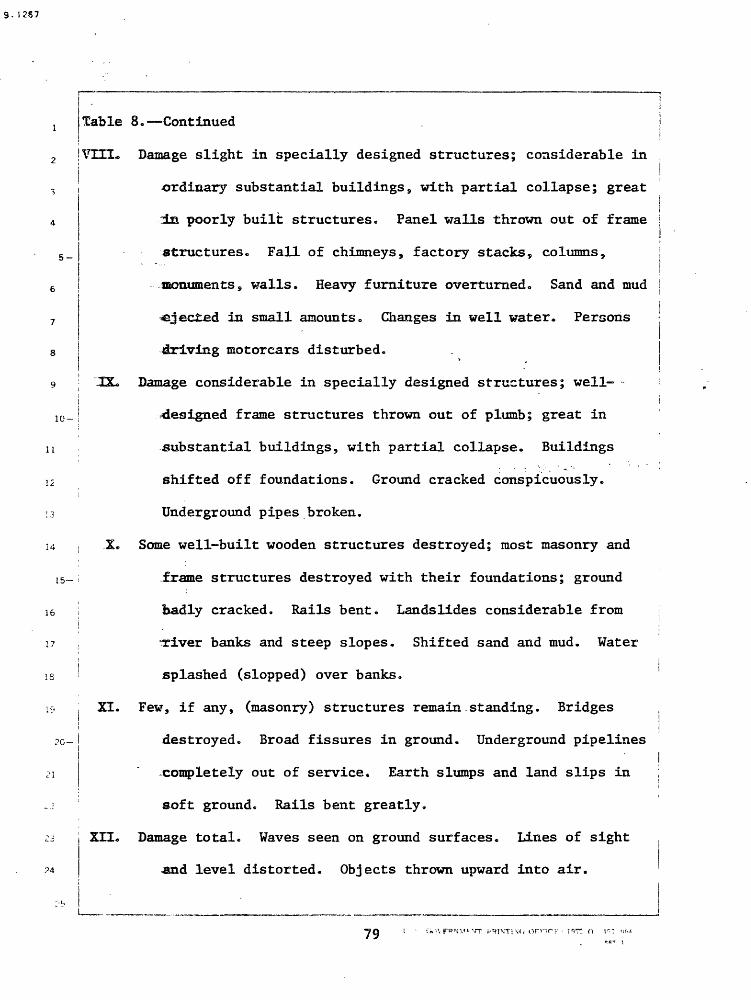
9.
5-
10-
11
12
14
15-
16
IS
?4
Table 8. Continued
VIH* Damage slight in specially designed structures; considerable in
ordinary substantial buildings, with partial collapse; great
iln poorly built structures. Panel walls thrown out of frame
structures. Fall of chimneys, factory stacks, columns,
monuments 9 walls. Heavy furniture overturned,, Sand and mud
^ejected in small amounts 0 Changes in well water« Persons
driving motorcars disturbed.
Damage considerable in specially designed structures; well-
^designed frame structures thrown out of plumb; great in
substantial buildings, with partial collapse. Buildings
shifted off foundations. Ground cracked conspicuously.
Underground pipes broken.
Some well-built wooden structures destroyed; most masonry and
frame structures destroyed with their foundations; ground
badly cracked. Rails bent. Landslides considerable from
river banks and steep slopes* Shifted sand and mud. Water
splashed (slopped) over banks.
Few, if any, (masonry) structures remain.standing. Bridges
destroyed. Broad fissures in ground. Underground pipelines
^completely out of service. Earth slumps and land slips in
soft ground. Rails bent greatly.
i XII« Damage total. Waves seen on ground surfaces. Lines of sight
and level distorted. Objects thrown upward into air.
XI.
79

P3J3TP°H
06X68-II *
u-iaqqjou pupuj

9.1267
Landslide Hazards! ' *
2 j By Roger B. Colton
3 | In the general area of the Kaiparowits Plateau Coal Field, the
: Alton Coal Field, and the Kolob Coal Field, several formations are
*-.susceptible to landsliding especially those containing bentonite.I
e |They are named, their lithology described, and their thickness presented
7 in table 9, which is derived from the explanations on the geologic maps
a !JTable 9. NEAR HERE
9 !
10-iof the Escalante and Salina 1x2 quadrangles (Hackman and Wyant,
:; 1973; Williams and Hackman, 1971) and from stratigraphic charts in
12 Hintze (1973) for the Cedar City 1° x 2° quadrangles. The incidence of
13 landsliding is shown in a generalized way on plate 4, which was compiled
- from the published l:250,000-scale geologic maps and by an inspection> i
is-i0f large-scale (1:24,000 and 1:63,360) topographic maps. Many areas ofi
16 landslide and rockfall deposits probably were missed during the
17 compilation of the l:250,000-scale maps and should be mapped on aerial
photographs and shown on maps at a scale of 1:125,000.
. Rockfall areas lie along the outcrop of such cliff-formingi :
: °- !stratigraphic units as the Navajo Sandstone, various lava flows, and
various sandstone members of the Straight Cliffs, Moenkopi, Chinle, and
Moenave Formations. These areas are shown in a generalized way on
iplate 4. ,
81
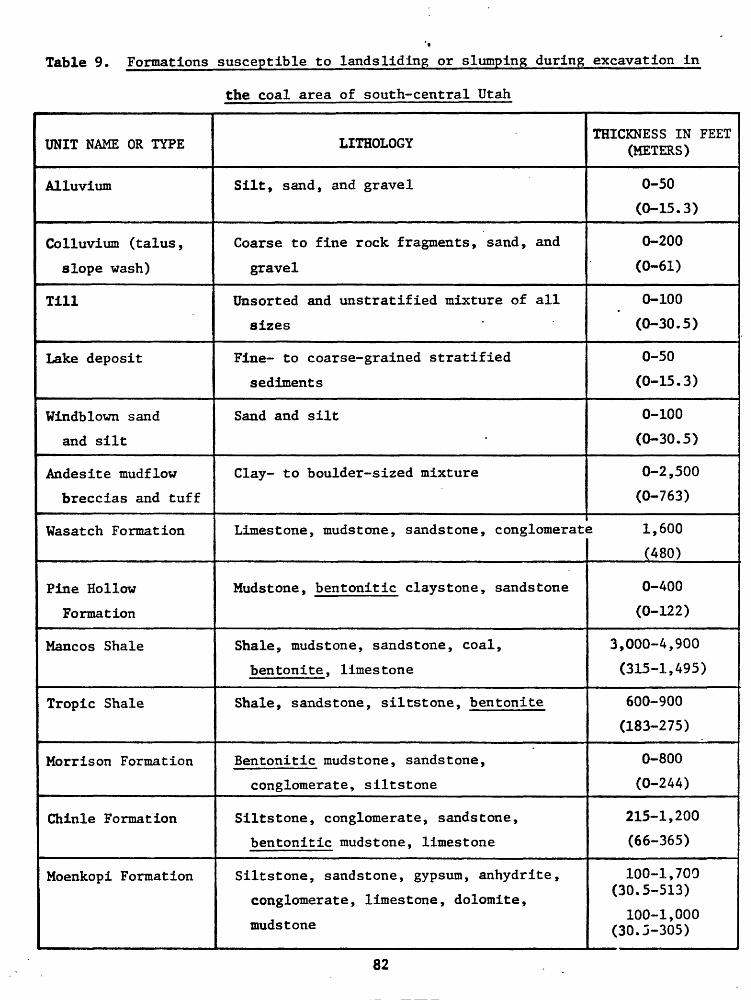
Table 9. Formations susceptible to landsliding or slumping during excavation in
the coal area of south-central Utah
UNIT NAME OR TYPE LITHOLOGYTHICKNESS IN FEET
(METERS)
Alluvium Silt, sand, and gravel 0-50
(0-15.3)
Colluvium (talus,
slope wash)
Coarse to fine rock fragments, sand, and
gravel
0-200
(0-61)
Till Unsorted and unstratified mixture of all
sizes
0-100
(0-30.5)
Lake deposit Fine- to coarse-grained stratified
sediments
0-50
(0-15.3)
Windblown sand
and silt
Sand and silt 0-100
(0-30.5)
Andesite mudflow
breccias and tuff
Clay- to boulder-sized mixture 0-2,500
(0-763)
Wasatch Formation Limestone, mudstone, sandstone, conglomerate 1,600
(480)
Pine Hollow
Formation
Mudstone, bentonitic claystone, sandstone 0-400
(0-122)
Mancos Shale Shale, mudstone, sandstone, coal,
bentonite, limestone
3,000-4,900
(315-1,495)
Tropic Shale Shale, sandstone, siltstone, bentonite 600-900
(183-275)
Morrison Formation Bentonitic mudstone, sandstone,
conglomerate, siltstone
0-800
(0-244)
Chinle Formation Siltstone, conglomerate, sandstone,
bentonitic mudstone, limestone
215-1,200
(66-365)
Moenkopi Formation Siltstone, sandstone, gypsum, anhydrite,
conglomerate, limestone, dolomite,
mudstone
82
100-1,700 (30.5-513)
100-1,000 (30.3-305)

9- I?*57
COAL-MINE SUBSIDENCE
By C. Richard Dunrud
General Aspects of Subsidence
Mining activities in south-central Utah will be controlled by
5- igeologic and topographic conditions in at least two ways. First, the
Iplateau cliff-and-canyon topography probably will require that nearly
all the coal be mined by underground methods. The overburden is thick,
;or it varies in thickness over short distances. Also, most of the rocks
comprising the overburden are competent, strong Upper Cretaceous
i?-- sandstones, alternating with mudstones. The cost of mining a given
quantity of coal by surface methods here would be higher than the cost,
for example, of mining in the weaker lower Tertiary rocks of the
Powder River Basin of Wyoming and Montana. Second, the rugged topography
and the presence of numerous joints and local faults near cliffs and
is- steep slopes may increase or alter the effects of subsidence as compared
to mining conditions beneath more uniform overburden of similar thickness,
even though the amount of ground settlement may be comparable in the
two situations. In this section, only the more important effects of
i underground coal mining will be discussed because only a very smalli
0 - iarea is amenable to current surface-mining methods*
83
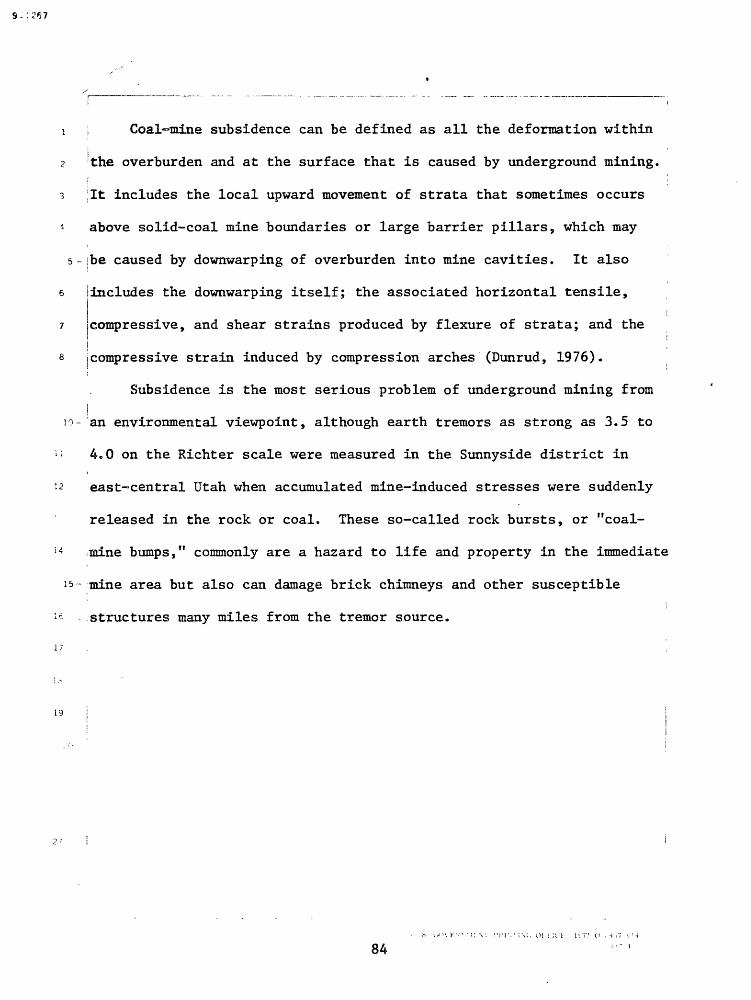
1 ; Coal-mine subsidence can be defined as all the deformation within
2 'the overburden and at the surface that is caused by underground mining.
i [It includes the local upward movement of strata that sometimes occurs
above solid-coal mine boundaries or large barrier pillars, which may
5 - ibe caused by downwarping of overburden into mine cavities. It also
s !includes the downwarping itself; the associated horizontal tensile,
7 compressive, and shear strains produced by flexure of strata; and the
s compressive strain induced by compression arches (Dunrud, 1976).
Subsidence is the most serious problem of underground mining from
] 10- an environmental viewpoint, although earth tremors as strong as 3.5 to
;; 4eO on the Richter scale were measured in the Sunnyside district in
-2 east-central Utah when accumulated mine-induced stresses were suddenly
released in the rock or coal. These so-called rock bursts, or "coal-
i4 mine bumps," commonly are a hazard to life and property in the immediate
is- mine area but also can damage brick chimneys and other susceptiblei
li? structures many miles from the tremor source.
19
84
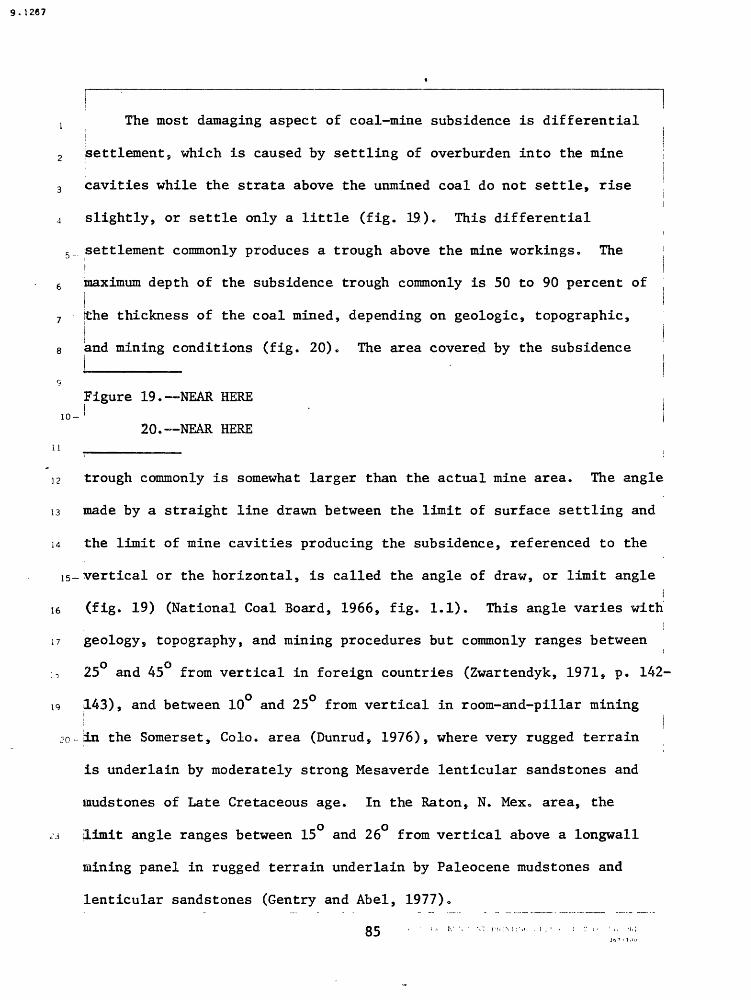
9-1267
j The most damaging aspect of coal-mine subsidence is differential |
2 ^ettlement, which is caused by settling of overburden into the minei
3 Cavities while the strata above the unmined coal do not settle, rise
4 slightly, or settle only a little (fig. 19.). This differential
5 . settlement commonly produces a trough above the mine workings. The
6 maximum depth of the subsidence trough commonly is 50 to 90 percent of
rhe thickness of the coal mined, depending on geologic, topographic,8 and mining conditions (fig. 20). The area covered by the subsidence
Figure 19. NEAR HEREI 10- '
20. NEAR HERE
12 trough commonly is somewhat larger than the actual mine area. The angle
13 made by a straight line drawn between the limit of surface settling and
14 the limit of mine cavities producing the subsidence, referenced to the
15- vertical or the horizontal, is called the angle of draw, or limit angle!
16 ;(fig. 19) (National Coal Board, 1966, fig. 1.1). This angle varies with
17 geology, topography, and mining procedures but commonly ranges between! * 1
25 and 45 from vertical in foreign countries (Zwartendyk, 1971, p. 142-
19 143), and between 10 and 25 from vertical in room-and-pillar mining| |
2o-iin the Somerset, Colo. area (Dunrud, 1976), where very rugged terrain
is underlain by moderately strong Mesaverde lenticular sandstones and
mudstones of Late Cretaceous age. In the Raton, N. Mex» area, the
.3 limit angle ranges between 15 and 26 from vertical above a longwall
mining panel in rugged terrain underlain by Paleocene mudstones and
lenticular sandstones (Gentry and Abel, 1977) 0
85 ' ' '" " " 1 v: ' " :N "'" ' ' ' ' '' ' '" ;
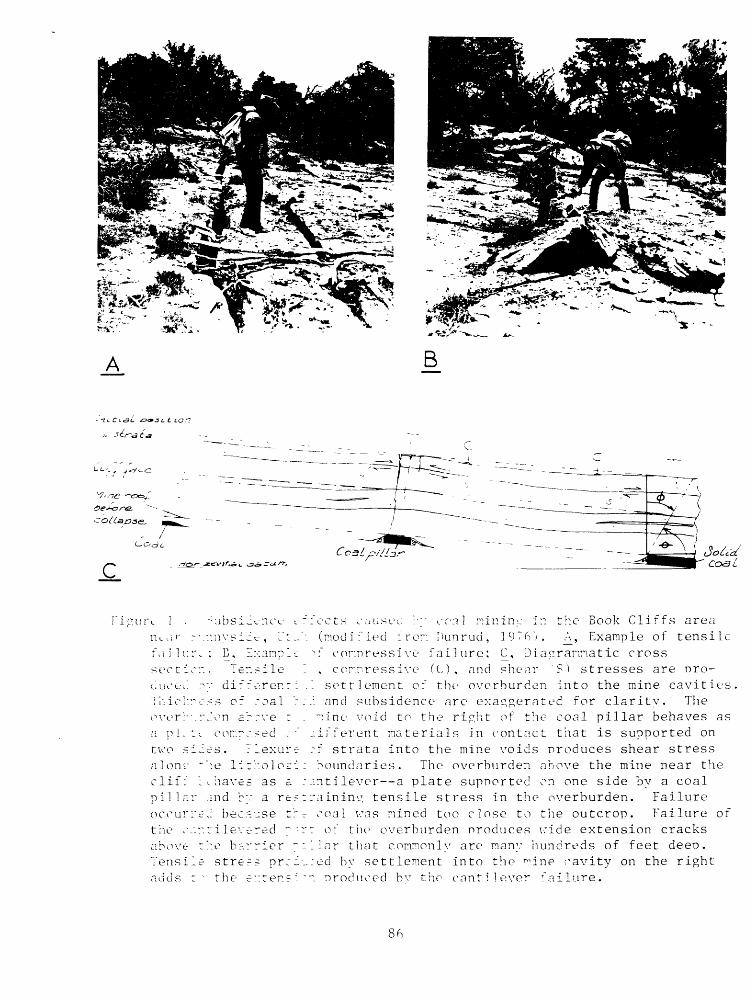
A B
fai lur. : B, Ixanpl sec tier.. Ter.sile clucei! ry different T"nicl:r c-ss ef coal over:--.rJ.on arcve : a pi. t^ cor.rc-ed ; two sides. 71exur' alonr ^'ie litr.oloz: clif: :.haves as a pillar and by a re ocrurrec because t: the car.ti levered - above tc.e barrier ; Tensile stre?~ prc. adds t ^ the e::ten =
"ects caused cy cc'al rrininc ir. the Book Cliffs area (modified fror. IHmrud, 19T6~). A., Example of tensile
"f connressive failure; C_, Diafiranmatic cross , connressive (L), and shear '?) stresses are nro-
- settlement of the overburden into the mine cavities : and subsidence arc exaggerated for claritv. The ":ine void to the right of the coal pillar behaves as .ifferent materials in contact that is supported on 'f strata into the mine voids produces shear stress boundaries. The overburden above the mine near the intilever a plate supported on one side by a coal-a in ing tensile stress in the overburden. Failure coal was mined too close to the outcrop. Failure of
: of the overburden produces wide extension cracks . lar that commonly are many hundreds of feet deep. :ed by settlement into the ^ine cavity on the right . produced bv the cantilever failure.
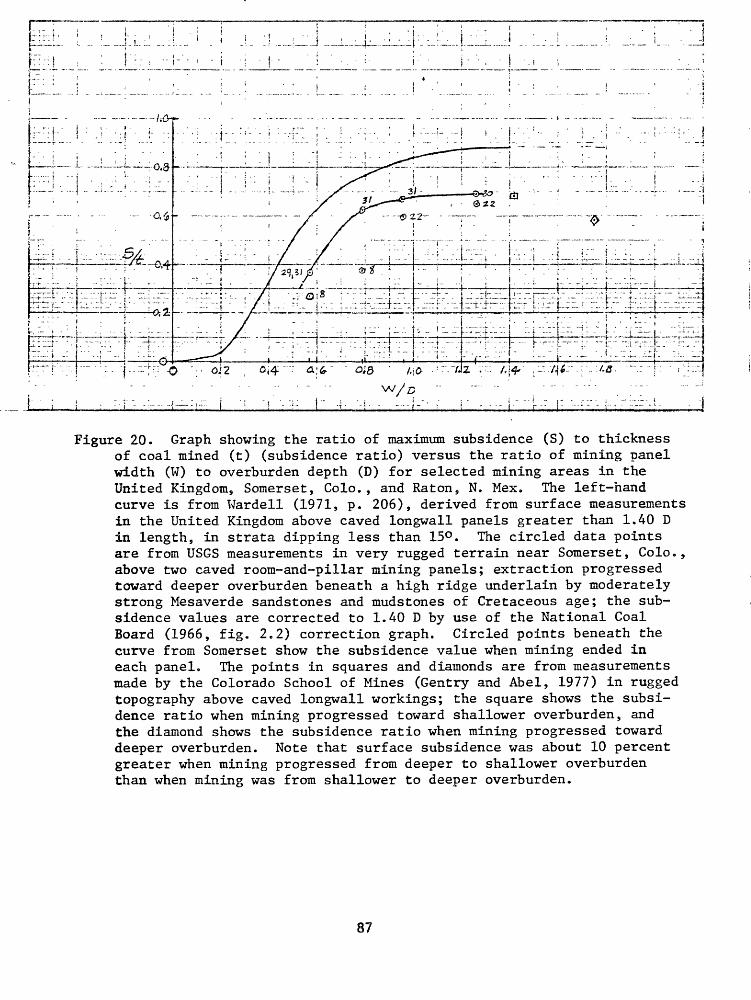
:J
! - ! -. ; :"""'1 ' -r:-,-r,..z- J.; .-- j
Figure 20. Graph showing the ratio of maximum subsidence (S) to thickness of coal mined (t) (subsidence ratio) versus the ratio of mining panel width (W) to overburden depth (D) for selected mining areas in the United Kingdom, Somerset, Colo., and Raton, N. Mex. The left-hand curve is from Wardell (1971, p. 206), derived from surface measurements in the United Kingdom above caved longwall panels greater than 1.40 D in length, in strata dipping less than 15°. The circled data points are from USGS measurements in very rugged terrain near Somerset, Colo., above two caved room-and-pillar mining panels; extraction progressed toward deeper overburden beneath a high ridge underlain by moderately strong Mesaverde sandstones and mudstones of Cretaceous age; the sub sidence values are corrected to 1.40 D by use of the National Coal Board (1966, fig. 2.2) correction graph. Circled points beneath the curve from Somerset show the subsidence value when mining ended in each panel. The points in squares and diamonds are from measurements made by the Colorado School of Mines (Gentry and Abel, 1977) in rugged topography above caved longwall workings; the square shows the subsi dence ratio when mining progressed toward shallower overburden, and the diamond shows the subsidence ratio when mining progressed toward deeper overburden. Note that surface subsidence was about 10 percent greater when mining progressed from deeper to shallower overburden than when mining was from shallower to deeper overburden.
87

9-12R7
Differential settlement that produces the trough geometry tends I to cause horizontal strain and deformation. At the margins of the
trough, the surface commonly is subjected to tensile stresses because
the ground is bowed upward (positive curvature) (fig. 19A_). These
tensile stresses commonly produce tensile strains and open cracks,
, particularly where bedrock joints or faults parallel the direction of
mining. Tensile stresses and associated extension and cracking
: commonly are increased or even doubled above coal barrier pillars that
separate two mining panels. Inward from the margins of the trough, the
ground surface tends to bow downward (negative curvature). This
produces high compressive stresses and strains that can bulge and
buckle strong massive sandstones (fig. 19B).
88

9-12*7
j i Effects of Topography and Geology
2 Gentry and Abel (1977) noted topographic effects on subsidence in
the Raton, N. Hex. s area. When a longwall face that was parallel to
canyon-and-ridge topography retreated from beneath a canyon toward a
,. . j ridge, vertical settlement was as much as 10 percent less than it was
6 j when the longwall face progressed from a ridge toward a canyon (figs. I 20, 21). Topographic effects on horizontal movement were even more
Figure 21. NEAR HERE
striking. The horizontal component of movement commonly was as much
as or more than the vertical component of movement when the longwall
face moved from beneath a ridge toward a canyon, whereas the horizontal
component commonly either was nearly zero or was in a direction
opposite to the direction of movement of the face when the face moved
from beneath a canyon toward a ridge. ;
89

V5 o
DIRECTION
OF M
OVEMENT
OF L
ONGW
ALL
FACE
-- ""~
' '
' *"
~
-T-
Flgu
re 21.
Prof
ile
alon
g a
cent
erli
ne of a
longwall panel
In the
Rato
n, N. Mex.,
area
sh
owin
g su
rfac
e re
lief
an
d the
vert
ical
an
d horizontal co
mpon
ents
of su
rfac
e movement (m
odif
ied
from G
entr
y and
Abel
, 1977).
Note
th
at when th
e direction
of mo
veme
nt of
the
long
wall
face is
in
the
downslope
dire
ctio
n of
the
ground surface
the
horizontal co
mpon
ent
of surface movement is
mu
ch gr
eate
r an
d th
e vertical co
mpon
ent
is as
mu
ch as
10
percent
more
th
an they are when face movement
is in
th
e up
slop
e di
rect
ion with re
spec
t to
th
e gr
ound
surface.
Longwall face is
or
ient
ed perpendicular
to
profile; direction
of movement
is parallel to
pr
ofil
e.

9.1267
1 i In other words, with a longwall face oriented parallel to a slope
contour and the direction of movement of the face parallel to thei
downslope direction, both the vertical and horizontal components of
subsidence are increased, whereas when the direction of face movement
5 is in the upslope direction, both the vertical and horizontal components i of subsidence are decreased. The mining direction of room-and-pillar
7 : mining at Somerset, Colo. has been only in a direction toward deeper
8 overburden in the subsidence study area, so that comparative information
is not available. Gentry and Abel (1977) also found that the vertical
component of subsidence beneath draws was much less than that measured
beneath ridges (fig. 21); the horizontal component also was small as
compared to that measured beneath ridges. This might be attributed to
the subjection of canyons to greater lateral confinement than uniform
overburden because of adjacent ridges, which could cause stable
15 compression arches to form above mine workings and thereby reduce
subsidence.
19
91

9.1267
i , The effects of cliff-and-canyon topography on subsidence in thei |
? ! Sunnyside area of Utah are striking, especially where coal is mined
3 j near cliffs (fig. 19). The overburden has no lateral support near the
cliffs; consequently, any mining activity near the cliffs that produces
settlement of the overburden at the cliff face tends to cause thei| overburden to behave as a cantilever a rock mass supported by coal on
7 ! one side, inward from the cliff, and a restraining force. Rocks,i
s , particularly jointed rocks, are weak in tension. Failure of thei l
overburden as a cantilever tends to produce large open cracks that
10- follow joints. Cracks such as these have been observed to extend as
1 much as 950 ft (290 m) below the surface (Dunrud, 1976; fig. 19A).
~ Surface drainage is, of course, diverted underground by open cracks
: (as in fig. 19A), and any underground waterflow also is interrupted and
often diverted to the mine workings. In more uniform overburden with
15~ , lateral support, cracks and bulges produced in subsidence troughs
commonly are much shallower and less extensive than those produced by
cantilever failure.
Rockfalls and small landslides are common when coal is mined
, beneath cliff outcrops or in steep canyons. Large-scale landslides
could occur, however, where bedrock dips toward the cliff outcrop
instead of away from it, as shown in figure 19. If the dip is
sufficient to overcome frictional resistance along the coal bed, the
! overburden can fail as a cantilever, become detached, and slide as a
block along the coal; the effects could have serious mining and
environmental consequences.
92 " :-..,.,-..

9 . 1 2*1
i , Effects of Mining ,
; Mining methods, together with topography and geology, also control
3 the time at which initial subsidence occurs, as well as the rate and
i amount of surface subsidence. Subsidence development curves for
5 : selected caved longwall mining panels in the United Kingdom and near
e ; Raton s N. Mex., and caved room-and-pillar mining near Somerset, Colo.,
? : are shown in figure 22. They show that (1) the surface commonly begins
8
! Figure 22. NEAR HERE
10- to subside farther ahead of a retreating longwall face in the United
Kingdom than in the rugged terrain in the Raton, N. Mex. area; (2) in
' " the United Kingdom, the surface commonly has subsided nearly 20 percent
[ ' of the total amount when the face is directly beneath the measuring
4 station, whereas in the Raton, N. Mex, area the corresponding surface
li; -- has subsided only about 5 percent; and (3) the overburden subsides more
1 quickly, completely, and apparently more predictably above longwall
17 mining panels than occurs above the room-and-pillar mining panels. In
addition, subsidence measuring stations near the initial positions of
19 pillar retreat lines (the curves defined by the circled points ini i
fig. 22A, B) were not subsiding when the pillar retreat lines were
beneath the stations (positions X/D = 0 in fig. 22A_, B), whereas the
stations near the final positions of the pillar retreat lines had
3 i settled 10 to 15 percent of the total amount when the pillar retreat
lines were directly beneath these stations.
93

Figure 22. Subsidence development curves for caved longwall workings in theUnited Kingdom and in the Raton, N. Mex. area, and for caved room-and-pillar workings near Somerset, Colo. The curves are a plot of the ratio of surface subsidence measured (s) to the maximum subsurface subsidence (S) versus the ratio of the position of face or pillar line distance (X) to the overburden depth (D) at the point where the subsidence was measured (P). The circled points in A and ]5 are USGS measurements from surface bench marks near the initial position of the pillar retreat lines; the points enclosed by squares are USGS measurements from bench marks near the final position of the pillar retreat lines, and the points enclosed by triangles are subsidence measure ments made by the Colorado School of Mines in the Raton, N. Mex. area (Gentry and Abel, 1977).
94

9. 1267
1 , Subsidence above the 5L room-and-pillar mining panel in the
2 i Somerset area, where the panel width-to-depth ratio was about 1:1.25,i
3 i tended to follow the amount and rate of subsidence measured above !
* longwall mining panels much more closely than that above panel 6L,
5- where the ratio of W/D was about 0.6:0.8 (fig. 22). Also, the residual
6 j subsidence, after mining was completed, was much less in panel 5L than| '
7 I that in panel 6L, probably because a compression arch is present above
a | panel 6L (Dunrud, 1976). Subsidence appears to have been complete about i 9 months after mining was finished in panel 5L, whereas subsidence may
10- : not have been complete in panel 6L for about 21 months after mining was
11 completed. Measurements are continuing to determine whether or not
12 subsidence is complete above these and other room-and-pillar mining
j l * panels in the Somerset area.
15-
17
23
-> (V»\ EHN'MFVT PKlVItNij OFUCK 1'.72 O - 4'-7
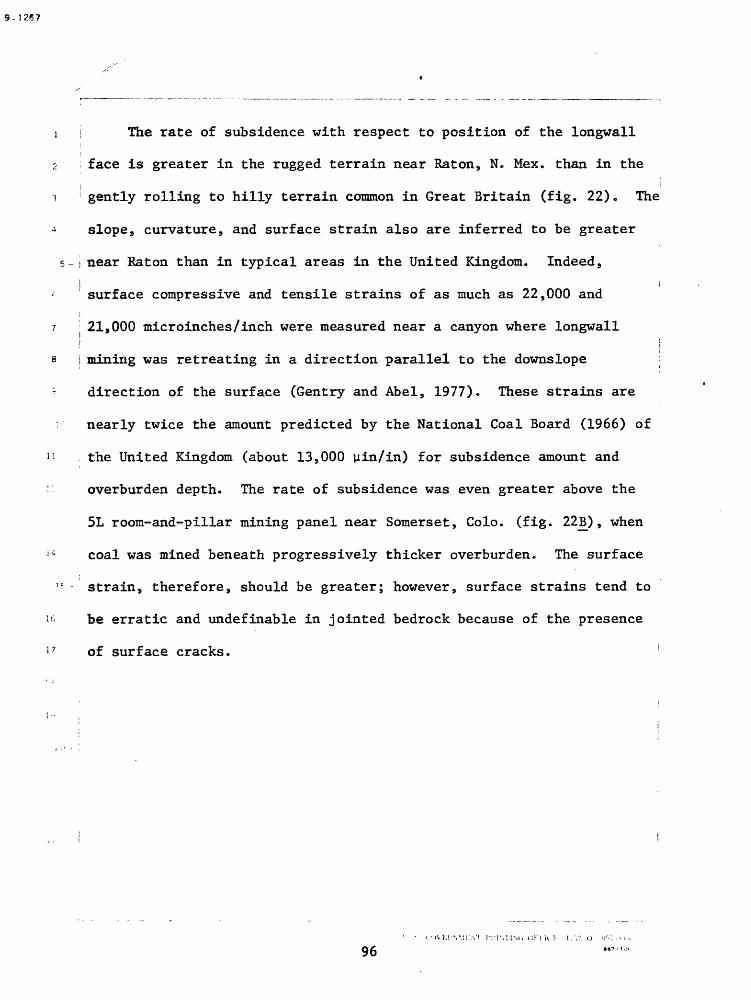
1 ) The rate of subsidence with respect to position of the longwall
2 face is greater in the rugged terrain near Raton, N. Mex. than in thei
i ! gently rolling to hilly terrain common in Great Britain (fig. 22). The
^ slope5 curvature, and surface strain also are inferred to be greater
5- i near Raton than in typical areas in the United Kingdom. Indeed sI i
* surface compressive and tensile strains of as much as 22,000 and
7 21,000 microinches/inch were measured near a canyon where longwallI i
a i mining was retreating in a direction parallel to the downslope
direction of the surface (Gentry and Abel, 1977). These strains are
' nearly twice the amount predicted by the National Coal Board (1966) of
11 the United Kingdom (about 13,000 yin/in) for subsidence amount and
'- overburden depth. The rate of subsidence was even greater above the
5L room-and-pillar mining panel near Somerset, Colo. (fig. 22B), when
]i coal was mined beneath progressively thicker overburden. The surface
'" strain, therefore, should be greater; however, surface strains tend to
it be erratic and undefinable in jointed bedrock because of the presence
17 of surface cracks. !
96

9. 1267
1 Summary
2 ; Subsidence can severely alter the ground surface as well as other
3 coal or mineral deposits or fluid-bearing rocks. The effects of
topography, geology, and mining procedure on subsidence type, rate, and
5 - amount are significant. The obvious remedy to subsidence seems to be
5 either (1) to mine the coal completely in a uniform manner over a large
? enough area so that the overburden settles uniformly and the tensile,
a icompressive, and shear stress effects of differential settlement are
- minimized, or (2) to leave enough coal in the ground to support the
10- overburden uniformly until mining is completed, and later on perhaps to
extract the remaining coal by another means, assuming that the coal
<-' pillars left behind will remain competent and not lose strength through
exposure to air or water.
17
97
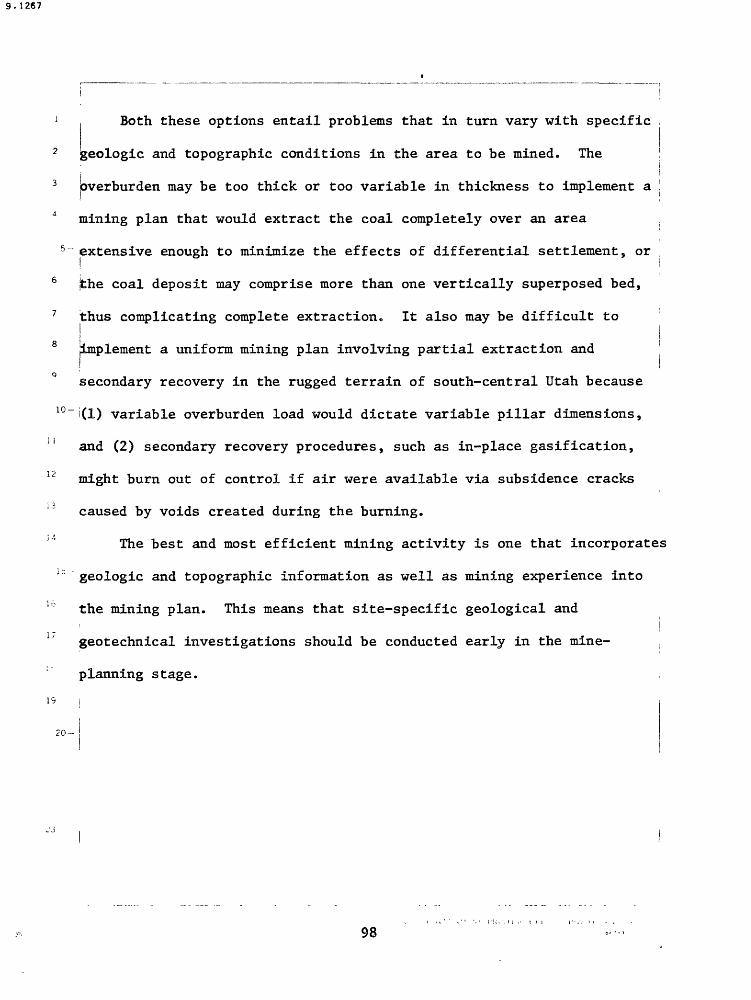
9.1267
Both these options entail problems that in turn vary with specific
2 geologic and topographic conditions in the area to be mined. Thei i
3 bverburden may be too thick or too variable in thickness to implement a 1
mining plan that would extract the coal completely over an area
5 extensive enough to minimize the effects of differential settlement, or
6 jthe coal deposit may comprise more than one vertically superposed bed,
7 thus complicating complete extraction. It also may be difficult to 'i
o !implement a uniform mining plan involving partial extraction and
secondary recovery in the rugged terrain of south-central Utah because
10 ~i(l) variable overburden load would dictate variable pillar dimensions,
jl and (2) secondary recovery procedures, such as in-place gasification,
11 might burn out of control if air were available via subsidence cracks
caused by voids created during the burning.
The best and most efficient mining activity is one that incorporates
1D geologic and topographic information as well as mining experience into
10 the mining plan. This means that site-specific geological andi i geotechnical investigations should be conducted early in the mine- ,
planning stage.
19 i
20-
98

9. 1267
LANDSCAPE GEOCHEMISTRY
By J. J. Connor
Coal-based energy development in south-central Utah is expected to
affect the geochemical landscape primarily by changing the chemistry ofi
5 _ vegetation. Examples of such effects observed to date in the Northerni
6 Great Plains Coal Region include altered copper/molybdenum ratios in
7 sweetclover growing on spoil banks, slightly increased concentrations of
8 cadmium, cobalt, fluorine, uranium, arid zinc in crested wheatgrass
9 growing on reclaimed spoils, and elevated concentrations of selenium
10 _ ̂ nd uranium in native vegetation growing within 5-10 km of coal-firedI
r. electric-generating plants. Lowered copper/molybdenum ratios might
12 (induce molybdenosis in ruminants; cadmium, selenium, and fluorine are
13 known poisons. In general, while natural scientists can define an
14 "excessive" trace-element level in natural materials, medical scientists
it- are the only ones capable of assessing a "health hazard" based on such
its levels.i j
17 | The two greatest geochemical impacts on the western landscapei i resulting from large-scale coal development are likely to be
19 geochemical alteration at coal mine sites by overturn, and geochemical
20- alteration adjacent to electric-generating sites through coal combustion.
The first impact tends to be rather localized, but the second may have
regional significance.
99

The environmentalist interest in the chemical composition of the
natural landscape arises solely from fears that disturbed (or restored)
3 landscapes may exhibit visibly changed compositions. For all practical
purposes, this interest focuses on the chemical potential of disturbed
5 "ior restored materials in supporting a desirable vegetative cover, whichi
6 In turn can support animal life of interest (including animals exploited! ' !
directly by humans).
8 If the area to be disturbed by mining or related activity presently
'supports vegetation, the chemical composition of the substrate (soil or
10 ~ rock) obviously .meets at least the minimum requirements of this ,
vegetation. Therefore, a primary geochemical need in impact assessment
,is a knowledge of the chemistry of these substrates in terms of j
geochemical backgrounds or "baselines." Such baselines in essence
define the minimum levels of total nutrient elements and the maximum
15 " levels of "toxic" elements to which this vegetation is exposed, although
lc not necessarily defining the extremes that this vegetation can endure.j
They also provide a basis for estimating the chemical potential ofi Iabandoned or reclaimed land to support the same vegetation.
100

3. 1267
j Considerable research suggests that bulk soil chemistry is onlyi
2 jweakly reflected by element levels in plant tissue. Therefore, work in
| j3 (plant geochemistry should focus on levels in the plant that may be toxic
4 to wildlife or domestic animals. Because the plants that are there
5 _ demonstrate by their very presence that current element-concentrationI i
6 jlevels in the supporting soil can be tolerated by the vegetation, thei
7 major botanical problem becomes whether or not such plants can bei j
s iexpected to grow on some new kind of substrate (resulting from man T s | I activities) and whether or not such growth will result in changed
10-itissue concentrations of elements. i
11 The first part of this question can only be answered by a study of
12 the geochemistry of the new substrate. The chemical composition of
:« these materials may indicate levels of nutrient elements below, or
:^ levels of toxic elements above, the concentrations found in the
is- original ("native") substrate. It is true that chemical requirements or
is chemical tolerances of vegetation are determined by the "available"
17 amounts, not total amounts, of certain elements in the substrate, but
ii the experimental difficulties of determining or stating in a general
IQ way the criterion of element availability without reference to species-i |
-o-^selective membrane response make the concept very difficult or
impossible to apply to native ecosystems.
101

3-1267
1 While nutrient deficiencies are not uncommon in the plant and animal
2 world, public concern over trace-element impact of coal development
3 tends to focus on element excesses or "toxicities." Examples of such
4 impact on vegetative cover is suggested in an examination of the
5 copper/molybdenum ratio in sweetclover (Melilotus officinalis or M.
6 Jalba) growing on spoil banks in the Northern Great Plains (table 10).
liable 10. NEAR HERE8 i
This ratio ranges from 0.43-6.5 and averages about 2; this compares with
10 ~ an "optimal" ratio in forage of about 5-7 (U.S. Geological Survey, 1976).
11 A browse diet formed largely of such a plant might induce symptoms of a
12 copper/molybdenum imbalance in grazers. Grass (Bouteloua gracilis) in
11 the Powder River Basin, Wyoming has an average ratio of 4.7 (U.S.
i4 Geological Survey, 1975, p. 17) s and sagebrush (Artemisia tridentata) in
lb~ the Green River Basin exhibits an average ratio of about 11 (U.S.
^ Geological Survey, 1976). Presumably such plants growing in south-
central Utah would have similar ratios* ,
Additional effects have been observed in crested wheatgrass
19 I (Agropyron desertorum and A., cristatum) at the southern edge of the
0 Powder River Basin (table 11). Expected concentrations (geometric
Table 11. NEAR HERE
beans) of cadmium, cobalt, fluorine, uranium, and zinc are elevated in
wheatgrass growing on reclaimed spoil materials when compared to
controls. Uranium in particular is increased four-fold. ......
102
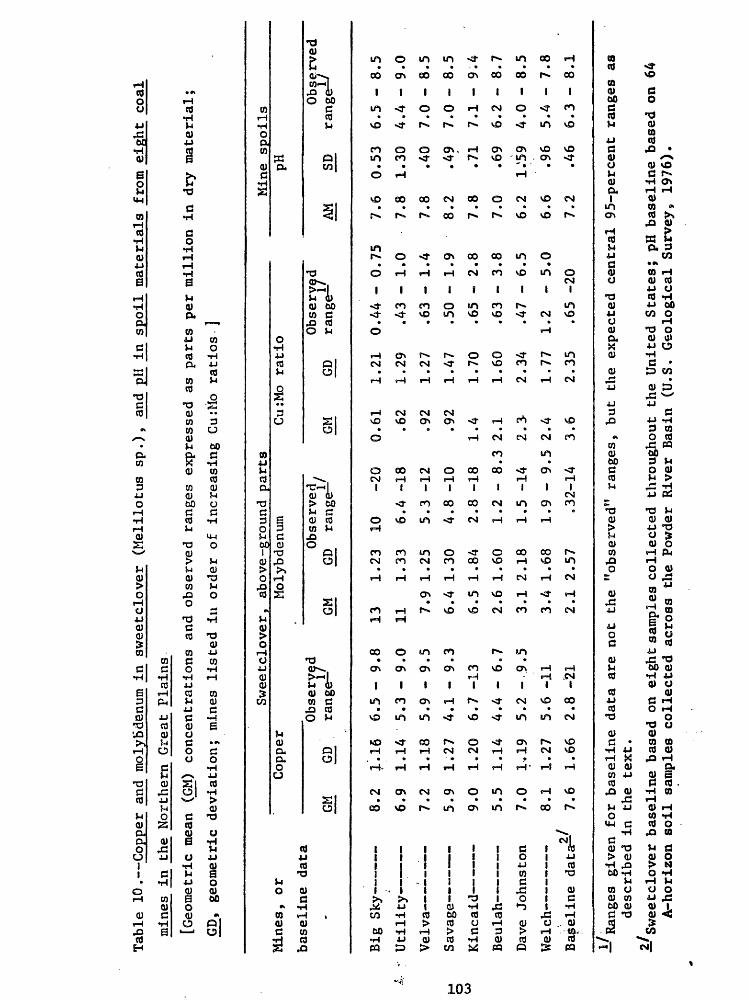
Table 10. Copper an
d molybdenum i
n sweetclover
(Melilotus sp
.),
and
pH in
sp
oil
mate
rial
s from e
ight
co
al
mine
s in the
Northern Great
Plains
[Geo
metr
ic m
ean
(GM)
concentrations
and
observed ra
nges
expressed
as pa
rts
per mi
llio
n in dr
y ma
teri
al;
GD,
geometric
devi
atio
n; mines
list
ed in
order
of in
crea
sing
Cu
:Mo
rati
os
]
Sweetc
lover, above-ground pa
rts
Mine
s, or
baseli
ne data
Big
Sky
Util
ity
Velv
a
Savage
Kinc
aid
Dave Jo
hns ton
tjpi rVi _____
2/
Base
line data
GM 8.2
6.9
7.2
5.9
9.0
5.5
7.0
8.1
7.6
Copper
GD .1.1
6
1.14
1.18
1.27
1.20
1.14
1,19
1.27
1.66
Moly
bden
um
Observed
range
6.5
5.3
5.9
4.1
6.7
4.4
5.2
5.6
2.8
- 9.
8
- 9.
0
- 9.
5
- 9.
3 -1
3
- 6.
7
-9.5
-11
-21
Obse
rved
, GM
GD
range^
13
1.23
11
1.33
7.9
1.25
6.4
1.30
6.5
1.84
2.6
1.60
3.1
2.18
3.4
1.68
2.1
2.57
10
-20
6.4
-18
5.3
-12
4.8
-10
2.8
-18
1.2
- 8.
3
1.5
-14
1.9
- 9.
5
.32-
14
Mine spoils
Cu:M
o ratio
GM 0.61
.62
.92
.92
1.4
2.1
2.3-
2.4
3.6
GD 1.21
1.29
1.27
1.47
1.70
1.60
2.34
1.77
2.35
Observed
range^-
0.44
.43
.63
.50
.65
.63
.47
1.2 .65
- 0.
75
- 1.0
- 1.
4
- 1.
9
- 2.
8
- 3.
8
- 6.
5
- 5.
0 -2
0
AM 7.6
7.8
7.8
8.2
7.8
7.0
6.2
6.6
7.2
pH SD 0.53
1.30
.40
.49
.71
.69
1.V59
.96
.46
Observed
rang
e-^
6.5
-
4.4
-
7.0
-
7.0
-
7.1
-
6.2
-
4.0
-
5.4
-
6.3
-
8.5
9.0
8.5
8.5
9.4
8.7
8.5
7.8
8.1
Ranges gi
ven
for ba
seli
ne da
ta are
not
the
"observed" ra
nges
, bu
t th
e ex
pected central
95-percent ranges as
de
scri
bed
in the
text.
2/ Swe
etcl
over
bas
elin
e ba
sed
on ei
ght sa
mple
s collected
throughout th
e United St
ates
; pH
bas
elin
e based
on 64
A-ho
rizo
n so
il samples
coll
ecte
d ac
ross
th
e Powder Ri
ver
Basi
n (U.S.
Geological Su
rvey
, 1976).

Table
II. Statist
ical an
alys
is of el
emen
t co
ncen
trat
ions
In
th
e ns
h of crested
whiv
it n
r.-i
reclaimed
spoi
l re
as at
th
e Dave Johnston
mine,
southern P
owder
River
Basin, Wyoming
from topsoll borrow a
reas and
from
[Concentrations. exp
ress
ed as
part
s per
mill
ion,
ex
cept
for..Ca, Na
, K,
P, S,
Si,
and
ash, wh
ich
are
in percent;
*, component
or variance tested to
be si
gnificant
at the
0.05
probability
level; Ratio,
number of
samples
in
which
elem
ent was
dete
cted
to
total
numb
er of samples
analyzed.] .
Anal
ysis
of variance_______
Natu
ral
vari
ance
-1^
Vari
ance
Tota
l ____________
Element,
logj
g Be
twee
n Among
or as
h'
variance afoaa
samp
les
Summary
statistics
area
swi
thin
ar
eas
due
toanalytical
erro
rJL/
Topsoil
borrow ar
eas
Recl
aime
d sp
oil
areas
Rati
o Ge
omet
ric
Geometric
mean
deviation
Obse
rved
ra
nge
Rati
o Geometric
Geometric
Obse
rved
me
an
devi
atio
n ra
nge
Cd .
Co
pi/
*J->
K
Li
p _____2/
S, to
tal
Se2/
Si
Zn
K0046
.070
2
.099
1
.024
0
.0138
.0148
.1081
.026
7
.020
3
.0710
.0138
91 A*
.0199
.0035
27*
35*
30*
<1 <1 15 55*"
<1 <1 15 __ .
59* 1
95*
<1 13 61*
18 96*
83*
29*
97*
91*
65*
54*
39*
94*
5 73 52
9 82
4 2 16
3 9 20
7 2 6'
20:2
0
20:20
10:20
20:2
0
20:20
20:2
0
20:2
0
20:20
20:20
20:2
0
20:2
0
9:20
20:2
0
20:2
0
4.1 .86
.72
4.5 .011
18 13
2.1 .17
.23
20
.25
310 6
*s J
1.11
1.90
1.76
1.17
1.33
1.23
2.02
1.16
1.29
1.91
1.22
2.41
1.20
1.15
3fc K
>. 0 J »
f.
.2-2
<l-2 3-6
.01-. 02
13-2
4
4-30
1.8-
2.4
.10-. 27
.10-. 60
14-2
64-
1 2
220-460
5.3-8.0
20:2
0"'
,20:
20\
.
15:2
0
. 20
:20
20:2
0
. 20
:20
20:2
0
20:2
0
20:2
0
20:2
0
20:2
0
19:2
0
20:20
20:2
0
3.9
i';..
.:'. 1.
4 ' .
. 1.5
,i'- 6.2
"'
.011
20 22
' 1.4
,'i
j /
' .18
.27
'.. 16
1.0
440 6.
0
1.21
1.40
2.59
1.46
1.29
1.38
1.93
1.38
1.45
1.73
1.33
3.02
1.25
1.14
2&
K 1
oo. J
.6-2
<l-8 3-10
.01-
. 02
9.8-
308-
65
.6-2.4
.09-
. 33
.10-
. 70
9.4-
26
< 4-
10
300-
580
2.6-
5.3
Expressed as perc
ent
of th
e to
tal variance
21
f Ana
lyses
determin
ed on
dry ma
teri
al,
not
ash;
therefore
expressed
on dry
weight ba
sis

Regional geochemical impacts are likely to result largely from
2 windborne transport of extraneous materials. Two sources of such
3 (materials are unreclaimed or abandoned disturbed areas and stack emissions : j i i
4 from coal-fired generating plants. Again, the focus of such impact is
5- ion potential changes in the vegetative cover. It is reasonable to ;
6 suppose that powerplant emissions contain at least small amounts ofj i
7 every naturally occurring element, but any practical assessment of their
8 impact can only be based on elemental effects observed in the landscape
9 adjacent to or downwind from the stack. Such effects were looked for
10 ~ iin both sagebrush and soil lichen downwind of the Dave Johnston
11 powerplant at the southern edge of the Powder River Basin (fig. 23 and
12 !24)c The strongest effect, as measured by regression techniques, was
13 '
Figures 23, 24. NEAR HERE
15~ that due to selenium, a particularly important element because of its
15 known toxic effects to browsers. In both vegetation species, seleniumi
17 (appears to be elevated out to distances of 5-10 km. Other suspect
! ~ elements include strontium, vanadium, uranium, fluorine, and perhaps
19 jtitanium, zinc, lithium, and cobalt.
20- The fears aroused by such accumulations reflect concern not so much
for absolute amounts introduced as concern for the availability to
plants of such emissions. Because the lichen samples were cleaned prior
to analysis, the selenium accumulation noted there probably reflectsi
biological accumulation, not simple physical entrapment.
105

.3
2'AJc
Bee*0«
600
u c *dQ) rH O 0) M -H
30
20
I
§
10)
o o
A?
£.3
Distance in kilometers Figuve 23. Regression trends In Pnrmclia chlorochroa for concentrations
of fluorine, selenium, strontium, and ash progressing east . - from the Dave Johnston powerplant. Sbpcs are significantly
different from zero nt fhe 0,01 probability level or
106

1000
sen
SBO
£ 100
S 50
f|Z a ui C
10
it o
1.0
i - JJO - 0.16 Lot O
«= 2.71 - 0.10 Log &
Log ti-1.31-0.13 L09O
Log Co « OBI - 0.14 La$ O
Log S« 0.04 . 0.45 Log D
togU-0^1-0-30.o=O
2.6 51& 02 26,4-
DISTANCE FROM POWERPLANT, IN KILOMETERS ' . : , .,
Figure 24. Metal trends in sagebrush away from powerplant. Slopes of solid regression lines are statistically significant at the 0.05 or lower probability level of dashed regression lines at the 0.05- to 0.10-probability levels; both define trends in concentration. Concen* trations of selenium mpasured in dry weight; all other concentrations measured in ash weight. (From Connor and others, 1976.)
107

9-1267
The most abundant emissions from power plants probably would be
the oxides of sulfur, carbon, nitrogen, and hydrogen (water); but as
3 essential constituents of vegetative tissue, it is unlikely that such
4 ieffects on plant material could be measured as simple distance-related
5- accumulation (although it might be measured in general terms of plant
"health").
The hydrologic impact of energy development is expected to be
[substantial, although the greatest changes will likely be on the
quantity or flow direction of water supplies, rather than on chemical
1C ~ quality (at least in a regional sense). Table 12 lists interim EPA
standards for nine constituents in primary drinking water.
12
Table 12. NEAR HERE
15-
16
17
18
23
108i, .s. (JOVKRNMI:NT PIUNTINU un-ics- 1972 o - 4'.,i- 044

Table 12. ""Environmental Protection Agency primary drinkingwater, proposed interim standards for inorganic
. . chemicals . -.-_ ^.-A ;/-;;-; 0;':;:-':,-
-.£*', varies with annual average of the maximum daily air temperature for the locality]
*
Maximum Constituents allowable
values
As .-- 0.05 mg/1
Ba ...- 1.0 mg/1
Cd ~ cOl mg/1
Cr «...« - - .05 02/1
CN*. C2 ng/1
pb ..... . C05 ng/1
Constituents 2
NO- (as N) -
<j« __«, ._-,.,_.,«.
F ? ------
Gross alpha
Gross beta
p~Ra226 - *
Maximum allowable values
10.0 mg/1
.01 mg/1«
.05 mg/1
1.4-2.4 mg/1
15 pCi/1
50 pCi/I
3 pCi/1
U«S C Environmental Protection Agency, 1975, Interim primary drinking water regulations: 40 Code of Federal Regulations, Pt. 141, Federal Register, v. 40, no* 51, March 14, 1975, p. 11,990-11,993.
«
U.S. Environmental Protection Agency, 1975, Interim primary drinking water regulations: 40 Code of Federal Regulations, Pt. I4l t Federal Register, v. 40, no. 150, August 14, 1975, 5 p.
109

9-1267
5-
10-
12
The most difficult aspect of impact assessment on the trace-element;i
character of the landscape, however, is that of assessing the broad-
scaled regional effects. This is so because while changes in trace-
element concentrations far from mines or powerplants will almost
certainly be very small, the fear exists that such changes may still
pose a potential hazard to plant, animal, or human health. This fear
arises largely from the fact that the exact roles played by many trace!
elements in living tissue remain unclear or unknown and the relation ofi
the local geochemical environment to biological health or disease is
ieven more obscure. (See Hopps and Cannon, 1972; Cannon and Hopps, 1971.)
Moreover, such assessment must be an interdisciplinary one. While it i i is the role of the natural scientist to determine the magnitude of
man's contributions to the geochemical environment, it is the role of
the medical scientist to determine what, if any, health hazard may
ensue from that contribution.
20-
110
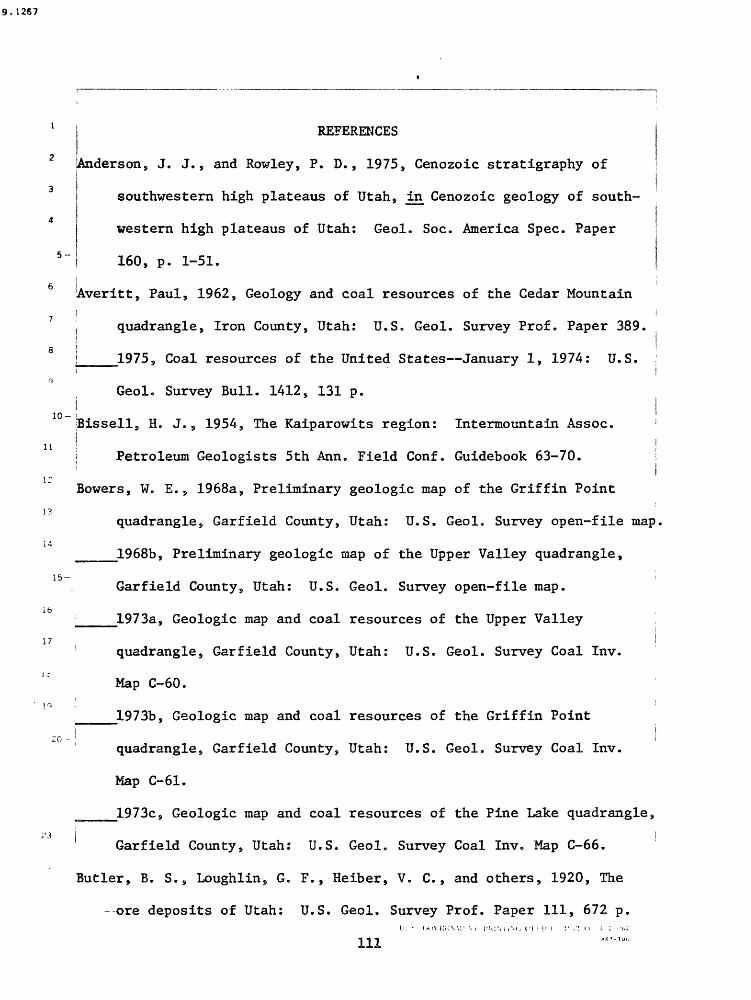
9.1267
REFERENCES
2 Anderson, J. J., and Rowley, P. D., 1975, Cenozoic stratigraphy of
southwestern high plateaus of Utah, in Cenozoic geology of south
western high plateaus of Utah: Geol. Soc. America Spec. Paper
160, p. 1-51.
lAveritt, Paul, 1962, Geology and coal resources of the Cedar Mountain
, quadrangle, Iron County, Utah: U.S. Geol. Survey Prof. Paper 389.
Q j____1975, Coal resources of the United States January 1, 1974: U.S. I' ' i
Geolc Survey Bull. 1412, 131 p.
10- ' 'jBissell, H. J., 1954, The Kaiparowits region: Intermountain Assoc. ! | i i Petroleum Geologists 5th Ann 0 Field Conf. Guidebook 63-70. ! 1 i
Bowers, W. E., 1968a, Preliminary geologic map of the Griffin Point
13quadrangle, Garfield County, Utah: U.S. Geol. Survey open-file map,
14
____1968b, Preliminary geologic map of the Upper Valley quadrangle,
Garfield County, Utah: U.S. Geol. Survey open-file map.
16 ___1973a, Geologic map and coal resources of the Upper Valley
! quadrangle, Garfield County, Utah: U.S. Geol. Survey Coal Inv.
Map C-60.
____1973b, Geologic map and coal resources of the Griffin Pointi !20 - ' I
quadrangle, Garfield County, Utah: U.S. Geol. Survey Coal Inv.
Map C-61.
____1973c, Geologic map and coal resources of the Pine Lake quadrangle,i'3 I !
Garfield County, Utah: U.S. Geol. Survey Coal Inv. Map C-66.
Butler, B. S., Loughlin, G. F., Heiber, V. C., and others, 1920, The
ore deposits of Utah: U.S. Geol. Survey Prof. Paper 111, 672 p.I;.
Ill

10-
Callaghan, Eugene, 1973, Mineral resources potential of Piute County,
Utah and adjoining area: Utah Geol. and Mineralog. Survey Bull.
102, 135 p. . ... : v
Cannon, H» L., and Hopps, H. C., editors, 1971, Environmental
geochemistry in health and disease: Geol. Soc. America Mem. 123,
230 p.
Cashion, W. B., 1961, Geology and fuel resources of the Orderville-
Glendale area, Kane County, Utah: U.S. Geol. Survey Coal Inv.
Map C-49.
____1967, Geologic map of the south flank of the Markagunt Plateau,
11 ' northwest Kane County, Utah: U.S. Geol. Survey Misc. Geol. Inv.
Map 1-494.
Connor, J.. J., Keith, J. R., and Anderson, B. M., 1976, Trace-metal
variation in soils and sagebrush in the Powder River Basin,
Wyoming and Montana: U.S. Geol. Survey Jour. Research, v. 4,
no. 1, p. 49-59.
Cook, K. L., and Smith, R. B., 1967, Seismicity in Utah, 1850 through
18 June 1965: Seismol. Soc. America Bull., v. 57, no. 4., p. 689-718.
19 'Crawford, A. L., 1951, Diatomaceous earth near Bryce Canyon National
20-
21
23
Park, Utah: Utah Geol. and Mineralog. Survey Circ. 38, 34 p.
Davidson, E. S., 1967, Geology of the Circle Cliffs area, Garfield and
Kane Counties, Utah: U.S. Geol. Survey Bull. 1229, 140 p.
Doelling, H. H. s 1967, Escalante-Upper Valley coal area, Kaiparowits
24 Plateau, Garfield County, Utah: Utah Geol. and Mineralog. Survey
jSpecial_SItudies_20 ?_16_p^ _____________ ____ __
' '- l '*'V M!\!\ I.M i-IJIMl.V. v'i I-iri. ; ; » .. u - -,!,.,
042*171

9.1267
1968 9 Carcass Canyon coal area in the Kaiparowits Plateau, Garfield
and Kane Counties, Utah: Utah Geol. and Mineralog. Survey Special
Studies 25, p. 23.
Doelling, H. H., and Graham, R. L., 1972, Southwestern Utah coal fields:
Alton, Kaiparowits Plateau and Kolob-Harmony: Utah Geol. and
Mineralog. Survey Mon. Ser. no. l s 333 p.
Dunrud, C. R., 1976, Some engineering geologic controls on coal mine
subsidence in Colorado and Utah: U.S. Geol. Survey Prof. Paper
969 (in press).
1C _ Fenneman, N. M., 1951, Physiography of western United States, McGrawi
11 Hill Book Company, 534 p.i; i
12 Finch, W. I., 1959, Geology of uranium deposits in Triassic rocks of
13 the Colorado Plateau region: U.S. Geol. Survey Bull. 1074-D,
u p. 125-164.
i5_ Fleck, R. J., Anderson, J. J. 9 and Rowley, P. D. 9 1975, Chronology of:(
^ mid-Tertiary volcanism in High Plateaus region of Utah, in Cenozoic
i? geology of southwestern High Plateaus of Utah: Geol. Soc. America
Specc Paper 160, p. 53-61.
19 Gentry, D. W., and Abel, J. F., Jr., 1977, Surface response to longwallj I
.0 coal mining in mountainous terrain: Assoc. Engineering Geologists
Bull, (in press).
Gregory, H. E., 1948, Geology and geography of central Kane County,
, Utah: Geol. Soc. America Bull., v. 59, no. 3, p. 211-248.
____1949, Geologic and geographic reconnaissance of eastern Markagunt
Plateau, Utah: Geol. Soc. America Bull., v. 60, no. 6, p. 969-998.
113 " - "' ! '"' "

5-
__1950a, Geology and geography of the Zion Park Region, Utah and
Arizona: U.S. Geol. Survey Prof. Paper 220, 200 p.
__1950b 9 Geology of eastern Iron County, Utah: Utah Geol. and
Mineralog. Survey Bull. 37, 153 p.
__19519 The geology and geography of the Paunsaugunt Region, Utah:
UoSc Geol. Survey Prof. Paper 226, 116 p.
Gregory, H. E., and Moore, R. C., 1931 S The Kaiparowits region, a :!
geographic and geologic reconnaissance of parts of Utah and Arizona
U.S. Geol. Survey Prof. Paper 164, 161 p.
10 _ Gregory, H. E., and Williams, N. C., 1947, Zion National Monument, Utah:j i
11 ! Geol. Soc. America Bull., v. 58, no. 3, p. 211-244.
12 Hackman, R. J., and Wyant, D. G., 1973, Geology, structure, and uraniumi
n deposits of the Escalante quadrangle, Utah and Arizona: U.S. Geol.
:* Survey Misc. Geol. Inv. Map 1-744.
15_ Heylmun, E. B. s 1958, Paleozoic stratigraphic and oil possibilities of
lb Kaiparowits region, Utah: Am. Assoc. Petroleum Geologists Bull.,!i i
17 ! v. 42, no. 8, p. 1781-1811. ji
,, ____1966, Geothermal power potential in Utah: Utah Geol. and
19 Mineralog. Survey Special Studies 14, 28 p.
:o . Hintze, L. F., 1963, Geologic map of southwestern Utah: Washington,
B.C., Williams and Heintz Map Corp.; available from Utah Geol. and
Mineralog. Survey, Salt Lake City, Utah, 84112.
23 |____1973, Geologic history of Utah: Brigham Young Univ. Geology
Studies, v. 20, pt. 3 S Studies for Students No. 8, Provo, Utah.
114
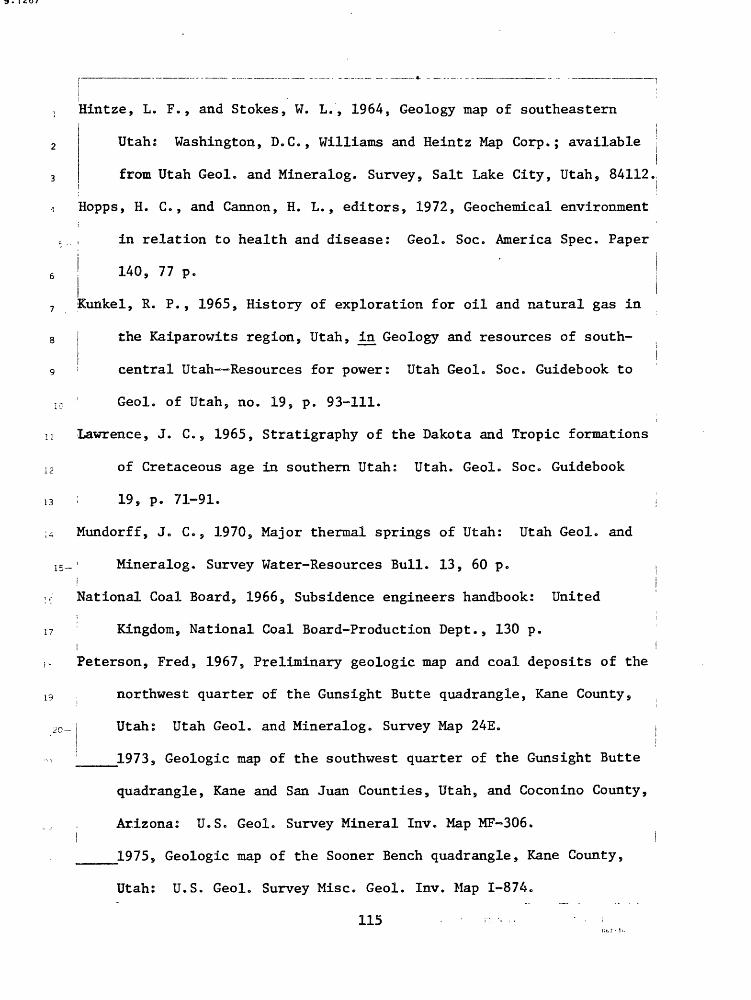
11
12
13
17
19
20-
Hintze, L. F., and Stokes, W. L., 1964, Geology map of southeastern
Utah: Washington, D.C., Williams and Heintz Map Corp.; available
from Utah Geol. and Mineralog. Survey, Salt Lake City, Utah, 84112.i
Hopps, H. C., and Cannon, H. L., editors, 1972, Geochemical environment
in relation to health and disease: Geol. Soc. America Spec. Paper
I 140, 77 p.
Kunkel, R. P., 1965, History of exploration for oil and natural gas in
the Kaiparowits region, Utah, in Geology and resources of south-
central Utah Resources for power: Utah Geol. Soc. Guidebook to
Geol. of Utah, no. 19, p. 93-111.
Lawrence, J. C., 1965, Stratigraphy of the Dakota and Tropic formations
of Cretaceous age in southern Utah: Utah. Geol. Soc. Guidebook
; 19, p. 71-91.
Mundorff, J. C., 1970, Major thermal springs of Utah: Utah Geol. and
Mineralog. Survey Water-Resources Bull. 13, 60 p.INational Coal Board, 1966, Subsidence engineers handbook: United
Kingdom, National Coal Board-Production Dept., 130 p.
Peterson, Fred, 1967, Preliminary geologic map and coal deposits of the
northwest quarter of the Gunsight Butte quadrangle, Kane County,
Utah: Utah Geol. and Mineralog. Survey Map 24E.
__1973, Geologic map of the southwest quarter of the Gunsight Butte
quadrangle, Kane and San Juan Counties, Utah, and Coconino County,
Arizona: U.S. Geol. Survey Mineral Inv. Map MF-306.
__1975, Geologic map of the Sooner Bench quadrangle, Kane County,
Utah: U.S. Geol. Survey Misc. Geol. Inv. Map 1-874.
115

5-
10-
1 Peterson, Fred, and Barnum, B. E., 1973a, Geologic map of the southeast ,
quarter of the Cummings Mesa quadrangle, Kane and San Juan
Counties, Utah, and Coconino County, Arizona: U.S. Geol. Survey
Misc. Geol. Inv. Map 1-758.
_1973b, Geologic map of the southwest quarter of the Cummings Mesa
quadrangle, Kane and San Juan Counties, Utah, and Coconino County,
Arizona: U.S. Geol. Survey Misc. Geol. Inv. Map 1-759.
_1973c, Geologic map and coal resources of the northeast quarter of
the Cummings Mesa quadrangle, Kane County, Utah: U.S. Geol. Survey
Coal Inv. Map C-63. !
11 ____1973d, Geologic map and coal resources of the northwest quarter of
12 ! the Cummings Mesa quadrangle, Kane County, Utah: U.S. Geol.
Survey Coal Inv. Map C-64.
14 Peterson, Fred, and Horton, G. W., 1966, Preliminary geologic map andi ;
15 " coal deposits of the northeast quarter of the Gunsight Butte
lfc quadrangle, Kane County, Utah: Utah Geol. and Mineralog. Survey
17 Map 24F. '
l ~ Peterson, Fred, and Waldrop, H. A., 1965, Jurassic and Cretaceous
1 , stratigraphy of south central Kaiparowits Plateau, Utah, in Geology
'T ~' and resources of south central Utah Resources for power: Utah
Geol. Soc. Guidebook 19, p. 47-69.
____1966, Preliminary geologic map and coal deposits of the southeast!
quarter of Gunsight Butte quadrangle, Kane and San Juan Counties,
Utah, and Coconino County, Arizona: Utah Geol. and Mineralog.
Survey Map 24G. _ . . . _ . . ..__.S COVEHfxMfNT PRINTINti OKHCE : 1972 O-457-QH4
867-100
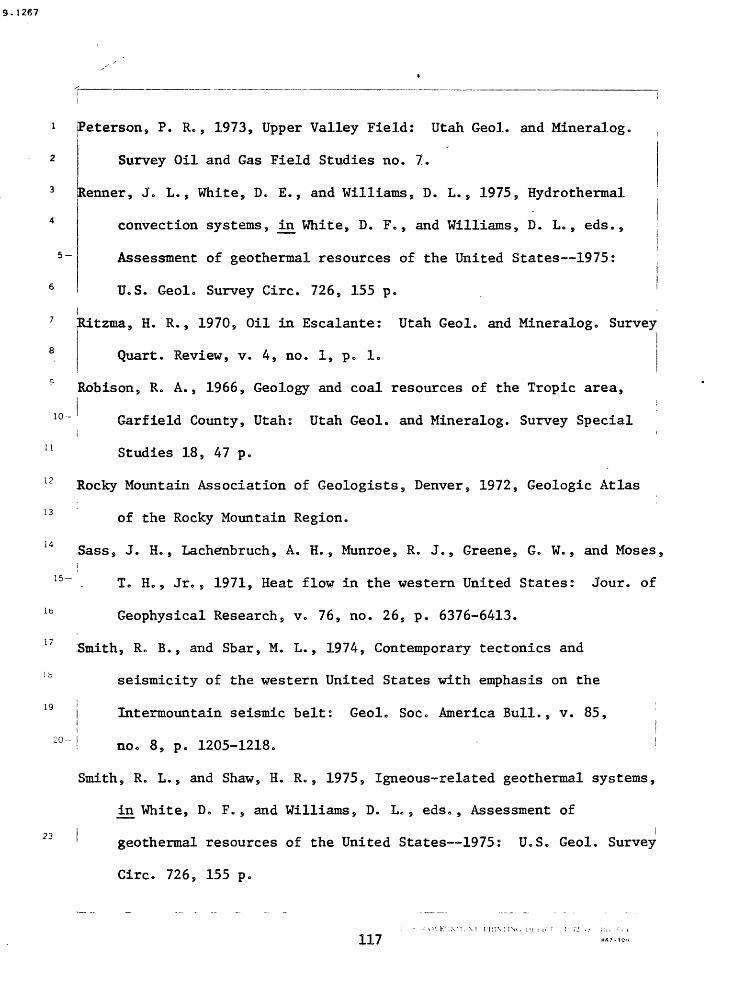
9-1267
5-
10-
Peterson, P. R., 1973, Upper Valley Field: Utah Geol. and Mineralog.
Survey Oil and Gas Field Studies no. 7.
Renner, J. L., White, D. E., and Williams, D. L., 1975, Hydrothermal
convection systems, in White, D. F., and Williams, D. L., eds.,
Assessment of geothermal resources of the United States 1975:
U.S. Geol. Survey Circ. 726, 155 p.
7 JRitzma, H. R., 1970, Oil in Escalante: Utah Geol. and Mineralog. Survey
Quart. Review, v. 4, no. 1, p. 1.
Robison, R. A., 1966, Geology and coal resources of the Tropic area,
Garfield County, Utah: Utah Geol. and Mineralog. Survey Speciali '
11 Studies 18, 47 p.
12 Rocky Mountain Association of Geologists, Denver, 1972, Geologic Atlas
13 of the Rocky Mountain Region.
14 Sass, J. H., Lachetibruch, A. H., Munroe, R. J., Greene, G. W., and Moses,i
I5~ , T. H., Jr., 1971, Heat flow in the western United States: Jour, of
16 Geophysical Research, v. 76, no. 26, p. 6376-6413.
17 Smith, R. B., and Sbar, M. L., 1974, Contemporary tectonics and
lb seismicity of the western United States with emphasis on the
j Intermountain seismic belt: Geol. Soc. America Bull., v. 85,ii t20 ! no. 8, p. 1205-1218. >
Smith, R. L., and Shaw, H. R., 1975, Igneous-related geothermal systems,
^.n White, D. F. , and Williams, D. L. , eds., Assessment of
O T j I
1 geothermal resources of the United States 1975: U.S. Geol. Survey
Circ. 726, 155 p.
117

2
3
5-
Stephens, E. V., 1973 S Geologic map and coal resources of the Wide
Hollow Reservoir quadrangle, Garfield County, Utah: U.S. Geol.
Survey Coal Inv. Map C-55.
Stokes, W. L., and Heylmun, E. B., 1965, Tectonic history of south-
central Utah, in Geology and resources of south-central Utah
Resources for power: Utah Geol. Soc. Guidebook to Geol. of Utah,i
no. 19, p. 3-11. '..' > i
Thomas, H. E., and Taylor, G. H., 1946, Geology and ground-water
resources of Cedar City and Parowan Valleys, Iron County, Utah:
10 -j U.S. Geol. Survey Water-Supply Paper 993, 210 p. [1947]. ;
11 U.S. Environmental Protection Agency, 1975a, Interim primary drinking
water regulations: 40 Code of Federal Regulations, Pt. 141, Federal
Register, v. 40, no. 51, March 14, 1975, p. 11,990-11,998.
U.S. Environmental Protection Agency, 1975b, Interim primary drinking
water regulations: 40 Code of Federal Regulations, Pt. 141, Federal
Register, v. 40, no. 150, August 14, 1975, 5 p.
U.S. Geological Survey, 1969, Mineral and Water Resources of Utah:
18 i Washington, D. C., U.S. Govt. Printing Office, 275 p. (reprinted from
: ° , 1964 edition; compiled for the U.S. Senate Committee on Interior
:o ~! and Insular Affairs)-
__1974, Geochemical survey of the Western Coal Regions, 1st ann.
progress report (July, 1974): U.S. Geol. Survey Open-file Rept.
74-250, 38 p. '-
118

1267
5-
10-
18
24
__1975, Geochemical survey of the Western Coal Regions, 2nd ann.
progress report (July, 1975): U.S. Geol. Survey Open-file Rept.
75-436, 132 p.
__1976, Geochemical Survey of the Western Energy Regions (formerly
Geochemical Survey of the Western Coal Regions), Third annual i- . i
progress report, July, 1976: U.S. Geol. Survey Open-file Rept.
' No. 76-(in press).
U.S* Bureau of Land Management, 1976, Proposed Kaiparowits Project,
, Utah s Arizona, Nevada, California, final environmental impactj :
statement; U.S. Govt. Printing Office, 3514 p.
Utah Geological and Mineralogical Survey, 1966, Gold placers in Utah, a
compilation: Utah Geol. and Mineralog. Survey Circ. 47, 29 p.
Utah Geological and Mineralogical Survey, 1975, Energy resources map
of Utah: Utah Geol. and Mineralog. Survey Map 36.
Van Sant, J. N., 1964, Refractory-clay deposits of Utah: U.S. Bur.
Mines Inf. Circ. 8213, 176 p.
Waldrop, H. A., and Peterson, Fred, 1967, Preliminary geologic map of
1 ;j the southeast quarter of the Nipple Butte quadrangle, Kane County,
Utah, and Coconino County, Arizona: Utah Geol. and Mineralog.
jSurvey Map 24C.
iWaldrop, H. A., and Sutton, R. L., 1966, Preliminary geologic map and
coal deposits of the southwest quarter of the Nipple Butte quadrangle,
Kane County, Utah, and Coconino County, Arizona: Utah Geol. and!
Mineralog. Survey Map 24D. '
119I'. S. CUIVKKN.VKM I'KIN TINi; HKftCK: I** 1* O 4IIIJI
842 -171

__1967a, Preliminary geologic map and coal deposits of the northeast
quarter of the Nipple Butte quadrangle, Kane County, Utah: Utah
Geol. and Mineralog. Survey Map 24B.
__1967b, Preliminary geologic map and coal deposits of the northwest
quarter of the Nipple Butte quadrangle, Kane County, Utah: Utah
Geol. and Mineralog, Survey Map 24A.
Wardell, K., 1971, The effects of mineral and other underground
excavations on the overlying ground surface, in Symposium [on]j
geological and geographical problems of areas of high population
10 ~"' density, Washington, B.C., 1970, Proc.: Sacramento, Calif., Assoc.
11 Eng. Geologists, p. 201-217.
^ Williams, P. L., 1972, Map showing landslides and areas of potential
i landsliding in the Salina quadrangle, Utah: U.S. Geol. Survey
4 Misc. Geol. Inv. Map 1-591-L.! I
15~ Williams, P. L. 9 and Hackman, R. J., 1971, Geology, structure, and \
lfc uranium deposits of the Salina quadrangle, Utah: U.S. Geol. Survey i i
i Misc. Geol. Inv. Map 1-591.i
Wilson, M. T., and Thomas, H. E., 1964, Hydrology and hydrogeology of
Navajo Lake, Kane County, Utah: U.S. Geol. Survey Prof. Paper
417-C, 26 p.
Wood, R. E., and Ritzma, H. R., 1972, Analyses of oil extracted from
oil-impregnated sandstone deposits in Utah: Utah Geol. and
Mineralog. Survey Spec. Studies 39, 19 p.
120

iZeller, H. D., 1967a, Preliminary geologic map and coal section of the
; Canaan Creek quadrangle, Garfield County, Utah: U.S. Geol. Survey
Open-file Rept.
____1967b, Preliminary geologic map and coal sections of the Carcass
5 j Canyon quadrangle, Garfield and Kane Counties, Utah: U.S. Geol. i
Survey Open-file Rept.
__1967c, Preliminary geologic map and coal sections of the Dave
Canyon quadrangle, Garfield County, Utah: U.S. Geol. Survey Open-
file Reptc
__1969, Preliminary geologic map and coal section of the Death Ridge
19
quadrangle, Garfield and Kane Counties, Utah: U.S. Geol. Survey
Open-file Rept.
1973a, Geologic map and coal resources of the Carcass Canyon
quadrangle Garfield and Kane Counties, Utah: U.S. Geol. Survey
Coal Inv. Map C-56 e
1973b, Geologic map and coal and oil resources of the Canaan
Creek quadrangle, Garfield County, Utah: U.S. Geol. Survey Coal
Inv. Map C-57.
1973c, Geologic map and coal resources of the Death Ridge
quadrangle, Garfield and Kane Counties, Utah: U.S. Geol. Survey
Coal Inv. Map C-58.
1973d, Geologic map and coal resources of the Dave Canyon quadrangle,
Garfield County, Utah: U.S. Geol. Survey Coal Inv. Map C-59.
121
Zeller, H. D., and Stephens, E. V. 5 1973, Geologic map and coal
resources of the Seep Flat quadrangle, Garfield and Kane Counties,
Utah: U.S. Geol. Survey Coal Inv. Map C-65.
Zwartendyk 9 J., 1971, Economic aspects of surface subsidence resulting
from underground mineral exploitation: Pennsylvania State Univ.
' Ph. D. thesis, 411 p.
122
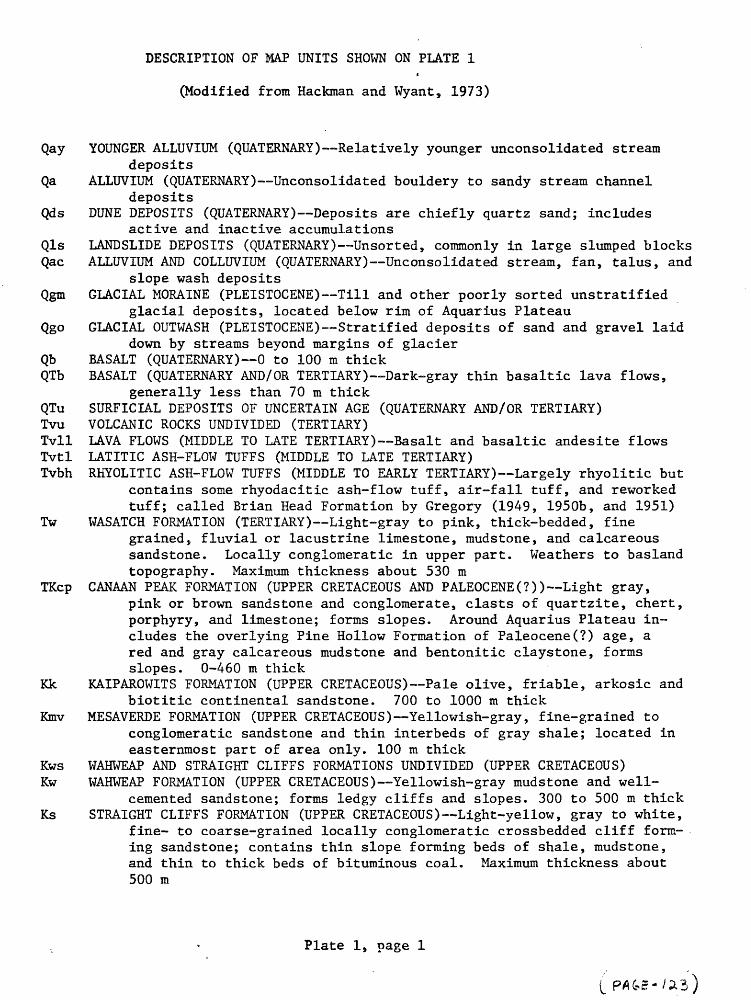
DESCRIPTION OF MAP UNITS SHOWN ON PLATE 1
(Modified from Hackman and Wyant, 1973)
Qay YOUNGER ALLUVIUM (QUATERNARY) Relatively younger unconsolidated stream deposits
Qa ALLUVIUM (QUATERNARY) Unconsolidated bouldery to sandy stream channel deposits
Qds DUNE DEPOSITS (QUATERNARY) Deposits are chiefly quartz sand; includes active and inactive accumulations
Qls LANDSLIDE DEPOSITS (QUATERNARY) Unsorted, commonly in large slumped blocksQac ALLUVIUM AND COLLUVIUM (QUATERNARY) Unconsolidated stream, fan, talus, and
slope wash depositsQgm GLACIAL MORAINE (PLEISTOCENE) Till and other poorly sorted unstratified
glacial deposits, located below rim of Aquarius PlateauQgo GLACIAL OUTWASH (PLEISTOCENE) Stratified deposits of sand and gravel laid
down by streams beyond margins of glacierQb BASALT (QUATERNARY) 0 to 100 m thickQTb BASALT (QUATERNARY AND/OR TERTIARY) Dark-gray thin basaltic lava flows,
generally less than 70 m thickQTu SURFICIAL DEPOSITS OF UNCERTAIN AGE (QUATERNARY AND/OR TERTIARY)Tvu VOLCANIC ROCKS UNDIVIDED (TERTIARY)Tvll LAVA FLOWS (MIDDLE TO LATE TERTIARY) Basalt and basaltic andesite flowsTvtl LATITIC ASH-FLOW TUFFS (MIDDLE TO LATE TERTIARY)Tvbh RHYOLITIC ASH-FLOW TUFFS (MIDDLE TO EARLY TERTIARY) Largely rhyolitic but
contains some rhyodacitic ash-flow tuff, air-fall tuff, and reworked tuff; called Brian Head Formation by Gregory (1949, 1950b, and 1951)
Tw WASATCH FORMATION (TERTIARY) Light-gray to pink, thick-bedded, finegrained, fluvial or lacustrine limestone, mudstone, and calcareous sandstone. Locally conglomeratic in upper part. Weathers to basland topography. Maximum thickness about 530 m
TKcp CANAAN PEAK FORMATION (UPPER CRETACEOUS AND PALEOCENE(?)) Light gray,pink or brown sandstone and conglomerate, clasts of quartzite, chert, porphyry, and limestone; forms slopes. Around Aquarius Plateau in cludes the overlying Pine Hollow Formation of Paleocene(?) age, a red and gray calcareous mudstone and bentonitic claystone, forms slopes. 0-460 m thick
Kk KAIPAROWITS FORMATION (UPPER CRETACEOUS) Pale olive, friable, arkosic and biotitic continental sandstone. 700 to 1000 m thick
Kmv MESAVERDE FORMATION (UPPER CRETACEOUS) Yellowish-gray, fine-grained toconglomeratic sandstone and thin interbeds of gray shale; located in easternmost part of area only. 100 m thick
Kws WAHWEAP AND STRAIGHT CLIFFS FORMATIONS UNDIVIDED (UPPER CRETACEOUS)Kw WAHWEAP FORMATION (UPPER CRETACEOUS) Yellowish-gray mudstone and well-
cemented sandstone; forms ledgy cliffs and slopes. 300 to 500 m thickKs STRAIGHT CLIFFS FORMATION (UPPER CRETACEOUS) Light-yellow, gray to white,
fine- to coarse-grained locally conglomeratic crossbedded cliff form ing sandstone; contains thin slope forming beds of shale, mudstone, and thin to thick beds of bituminous coal. Maximum thickness about 500 m
Plate 1 9 page 1

Km MANGOS SHALE (UPPER CRETACEOUS) Nearshore continental and marine beds aggregating about 1000 m thick; consists of five members: an upper dark gray silty mudstone, carbonaceous shale and light-gray sand stone, 200-300 m thick (Masuk Member); a crossbedded pale-gray sandstone, mudstone, carbonaceous shale, and coal, 40-120 m thick (Emery Sandstone Member); a bluish-gray marine shale 400-500 m thick (Blue Gate Shale Member); a yellowish-brown lenticular sand stone and marine mudstone, coal in upper part, 50-120 m thick (Ferron Sandstone Member); and a lower dark-gray marine mudstone and shale, partly bentonitic, 170-220 m thick (Tununk Shale Member)
Kdt TROPIC SHALE AND DAKOTA SANDSTONE UNDIVIDED (UPPER CRETACEOUS)Kt TROPIC SHALE (UPPER CRETACEOUS) Dark bluish-gray calcareous marine
shale. Weathers to slopes. 200 to 500 m thickKd DAKOTA SANDSTONE (UPPER CRETACEOUS) Yellow to nearly white, and pale
reddish-brown, cross bedded, coarse-grained sandstone and quartzite. Contains thin interbedded mudstone, carbonaceous shale and coal. 0-50 m thick
Ju JURASSIC UNDIFFERENTIATED Near Escalante includes Morrison and Summer- ville Formations; near south end of Kaiparowits Plateau includes Summerville Formation and Entrada Sandstone; in southwestern part of map area includes some Entrada Sandstone but probably is largely the Winsor Member of the Carmel Formation
Jm MORRISON FORMATION (UPPER JURASSIC) Maroon to light-bluish-gray cont inental sandstone, conglomeratic sandstone and bentonitic mudstone; thins west of Kaiparowits Plateau to a wedge edge. Includes Summer ville Formation, a reddish to pale-brown sandstone and shaly silt- stone in Straight Cliffs area. May include some Curtis Formation in northern part of area. 0-200 m thick
Je ENTRADA SANDSTONE (UPPER JURASSIC) Upper pale-gray to brown eoliansandstone, a middle pale-reddish-brown marine siltstone and silty sandstone, and a lower reddish-brown to pale-gray fine-grained eolian sandstone. Total thickness about 300 m
Jc CARMEL FORMATION (MIDDLE JURASSIC) Thin-bedded limy siltstone, friablesandstone, limestone and gypsum, all of marine origin. 50-300 m thick
JTrn NAVAJO SANDSTONE (TRIASSIC(?) AND JURASSIC) Gray and yellowish-graythickly crossbedded medium- to fine-grained eolian sandstone. Erodes to massive cliffs and domes. 150 to 600 m thick
Trk KAYENTA FORMATION (UPPER TRIASS1C(?)) Reddish-brown to pale-gray fluvial sandstone, siltstone, shale, and minor shale-pellet conglomerate and fresh-water limestone. Interfingers with overlying and underlying formations. About 80 m thick
Trmo MOENAVE FORMATION (UPPER TRIASSIC(?)) Composed of two fluvial members: an upper pale-reddish-brown, medium-grained, micaceous, cliff- forming sandstone and minor siltstone; and an underlying reddish- orange, coarse- to fine-grained, slope-forming friable sandstone, siltstone, and mudstone. Unit indicated on map only south of Cedar City. 0-130 m thick
Trw WINGATE SANDSTONE (UPPER TRIASSIC) Reddish-brown, light-brown, grayish- orange, fine-grained, thickly crossbedded, calcareous eolian sand stone. Erodes to vertical cliffs. 0 to 130 m thick
Plate 1, page 2

Trc ^ CHINLE FORMATION (UPPER TRIASSIC) Varico-lored beds of fluvial and lacustrine origin, generally sandy at top; limy, muddy, and bentonitic in middle; sandy and conglomeratic near base. 130 to 400 m thick
Trm MOENKOPI FORMATION (LOWER AND MIDDLE (?) TRIASSIC) Reddish-brown,fine-grained shale and sandstone beds and thin gray marine lime stone and evaporite tongues. 30 to 330 m thick
IPk KAIBAB LIMESTONE (PERMIAN) Grayish-yellow, fossiliferous, cherty,thin- to thick-bedded dolomitic limestone and interbedded light- gray to brown siltstone and sandstone. 0-350 m thick. In Circle Cliffs area contains White Rim Sandstone Member of the Cutler Formation (called Coconino(?) Sandstone by some workers), a yellowish-orange, crossbedded, very fine grained, silty sandstone
SYMBOLS
CONTACT
FAULT Dashed where approximately located; dotted where concealed. Bar and ball on downthrown side
VOLCANIC CONE
Plate 1, page 3

PERM
IAN
T
RIA
SSIC
JUR
ASS
ICCR
ETA
CEO
US
TER
TIA
RY
QU
ATE
RNA
RY
| Ju
7?1
O*
§S
pO
**
Kdt
gs
Kw
s
£ff
B|
*'
rt OQ a
JQ XD
OQ
O
*
CO
f
XD to XD
P
O
H
^< T> ?>
<^
01
i M r-
Related Documents