UNITED STATES DEPARTMENT OF INTERIOR GEOLOGICAL SURVEY Analytical results of plant and soil samples collected near Flat, Idltarod, and Llvengood, Alaska In 1984 By B. M. Erickson, R. C. Severson, and J. G. Crock Open-File Report 86-473 This report is preliminary and has not been reviewed for conformity with U.S. Geological Survey editorial standards and stratigraphic nomenclature. Any use of trade names is for descriptive purposes only and does not imply endorsement by the USGS. 1986

Welcome message from author
This document is posted to help you gain knowledge. Please leave a comment to let me know what you think about it! Share it to your friends and learn new things together.
Transcript

UNITED STATES DEPARTMENT OF INTERIOR
GEOLOGICAL SURVEY
Analytical results of plant and soil samples collected near
Flat, Idltarod, and Llvengood, Alaska In 1984
By
B. M. Erickson, R. C. Severson, and J. G. Crock
Open-File Report 86-473
This report is preliminary and has not been reviewed for conformity with U.S. Geological Survey editorial standards and stratigraphic nomenclature. Any use of trade names is for descriptive purposes only and does not imply endorsement by the USGS.
1986
CONTENTS
Page
Introduction.............................................................. 1
Collection Methods and Sample Descriptions................................ 1
Vegetati on Samples................................................... 1
Soil Samples......................................................... 1
Analytical Methods........................................................ 3
Soil and Plant Preparation........................................... 3
Total Element Content Determinations................................. 3
Coding Explanations for Tables 5 and 6.................................... 3
Acknowledgments........................................................... 4
References Cited.......................................................... 5
ILLUSTRATIONS
Figure 1. Map showing the general sampling locations..................... 2
TABLES
Table 1. List of vegetation species samples at Flat (FT-),Iditarod (ID-), and Livengood (LV-), Alaska.......................... 6
Table 2. Descriptions of the soil profile samples at Flat (FT-),Iditarod (ID-), and Livengood (LV-), Alaska.......................... 7
Table 3. Methods used for total element content of plants and soils...... 8
Table 4. Methods used for extractable element content of soils........... 9
Table 5. Analytical results for plant samples collected near Flat,Iditarod, and Livengood, Alaska...................................... 10
Table 6. Analytical results for soil samples collected near Flat,Iditarod, and Livengood, Alaska...................................... 18
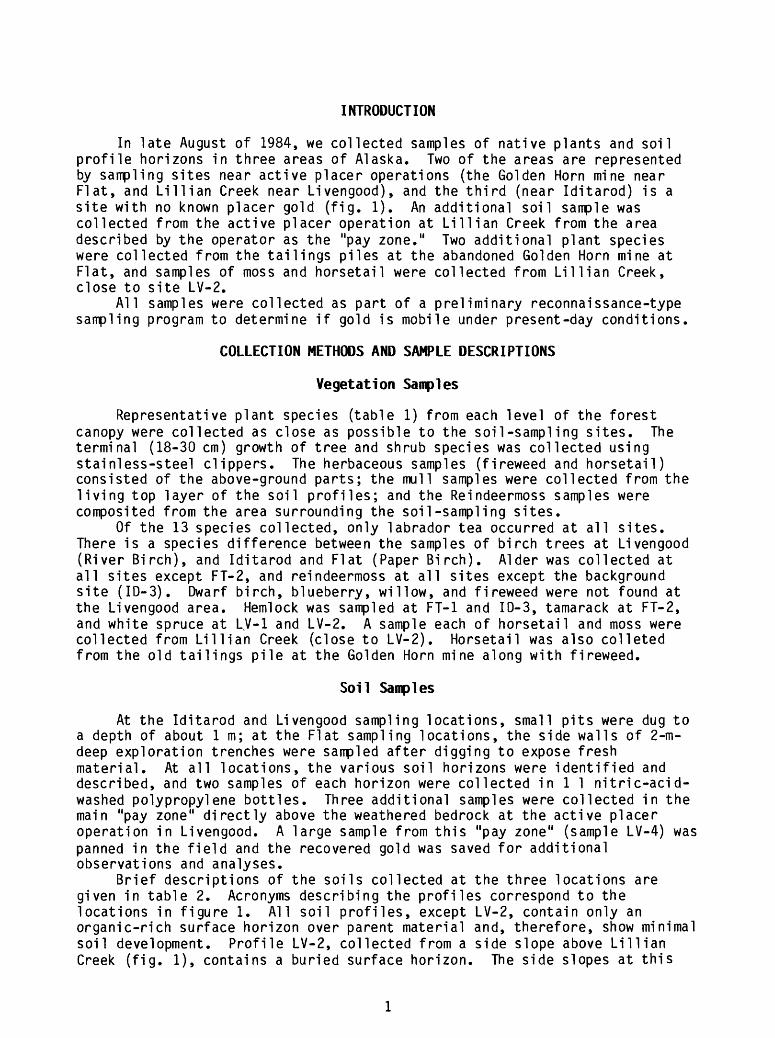
INTRODUCTION
In late August of 1984, we collected samples of native plants and soil profile horizons in three areas of Alaska. Two of the areas are represented by sampling sites near active placer operations (the Golden Horn mine near Flat, and Lillian Creek near Livengood), and the third (near Iditarod) is a site with no known placer gold (fig. 1). An additional soil sample was collected from the active placer operation at Lillian Creek from the area described by the operator as the "pay zone." Two additional plant species were collected from the tailings piles at the abandoned Golden Horn mine at Flat, and samples of moss and horsetail were collected from Lillian Creek, close to site LV-2.
All samples were collected as part of a preliminary reconnaissance-type sampling program to determine if gold is mobile under present-day conditions.
COLLECTION METHODS AND SAMPLE DESCRIPTIONS
Vegetation Samples
Representative plant species (table 1) from each level of the forest canopy were collected as close as possible to the soil-sampling sites. The terminal (18-30 cm) growth of tree and shrub species was collected using stainless-steel clippers. The herbaceous samples (fireweed and horsetail) consisted of the above-ground parts; the mull samples were collected from the living top layer of the soil profiles; and the Reindeermoss samples were composited from the area surrounding the soil-sampling sites.
Of the 13 species collected, only labrador tea occurred at all sites. There is a species difference between the samples of birch trees at Livengood (River Birch), and Iditarod and Flat (Paper Birch). Alder was collected at all sites except FT-2, and reindeermoss at all sites except the background site (ID-3). Dwarf birch, blueberry, willow, and fireweed were not found at the Livengood area. Hemlock was sampled at FT-1 and ID-3, tamarack at FT-2, and white spruce at L.V-1 and LV-2. A sample each of horsetail and moss were collected from Lillian Creek (close to LV-2). Horsetail was also colleted from the old tailings pile at the Golden Horn mine along with fireweed.
Soil Samples
At the Iditarod and Livengood sampling locations, small pits were dug to a depth of about 1 m; at the Flat sampling locations, the side walls of 2-m- deep exploration trenches were sampled after digging to expose fresh material. At all locations, the various soil horizons were identified and described, and two samples of each horizon were collected in 1 1 nitric-acid- washed polypropylene bottles. Three additional samples were collected in the main "pay zone" directly above the weathered bedrock at the active placer operation in Livengood. A large sample from this "pay zone" (sample LV-4) was panned in the field and the recovered gold was saved for additional observations and analyses.
Brief descriptions of the soils collected at the three locations are given in table 2. Acronyms describing the profiles correspond to the locations in figure 1. All soil profiles, except LV-2, contain only an organic-rich surface horizon over parent material and, therefore, show minimal soil development. Profile LV-2, collected from a side slope above Lillian Creek (fig. 1), contains a buried surface horizon. The side slopes at this

Figure 1. General location map showing the sampling locations at Iditarod, Flat, and Livengood, Alaska.
2

location consist of a series of buried organic horizons, probably due to solifluction and surface creep. All soil profiles sampled suggest constant oxidizing conditions in the surface horizons, and alternating oxidizing (dry) and reducing (water-saturated) conditions in the C-horizon. The sample from the placer mine (LV-4) has the characteristics of the soil C-horizons.
ANALYTICAL METHODS
Soil and Plant Preparation
The soils were dried under forced air at ambient temperature, classified, and disaggregated. The minus 10-mesh fraction was used for all analytical work. A small split of this material was ground in an agate shatter box to pass 100 mesh and was used for all total analyses.
The vegetation materials were dried at 50°C for 1 week in a forced air oven, ground with a Wiley mill, and split. One set of split samples were ashed at 500°C for inductively coupled plasma-atomic emission spectroscopy and the unashed or raw samples were submitted for neutron activation analysis.
Total Element Content Determinations
Table 3 lists the methods used for total element determination. All analyses were performed at the USGS Analytical Chemistry Laboratories, Denver, CO. Table 4 lists the methods used for the extractable elements.
CODING EXPLANATIONS FOR TABLES 5 and 6
The first character of the sample identification (A) in table 5 indicates the vegetation samples were collected in the State of Alaska, and the second and third characters represent the geographical sampling locations within the state (ID = Iditarod or Flat areas; LV = Livengood area). The fourth character (4) indicates the year of collection, 1984. The fifth character (1, 2, or 3) represents the sampling site within a geographical location. The sixth and seventh characters of the sample identification indicate the plant species collected, as follows:
AL - AlderBB - BlueberryDB - Dwarf BirchES - HorsetailFW - Fi reweedLL - TamarackLT - Labrador TeaMH - Mountain HemlockRM - ReindeermossTB - Tree Birch or Paper BirchWS - White SpruceWW - Willow.
Where present, the eighth character (x, or -), indicates a split, and the ninth character (1, or 2) the locality within a sampling site.

The characters following the element symbols indicate units of measurement and analytical methods, respectively:
Units of Measurement
ppm - parts per millionppb - parts per billion
% - percent
Analytical Methods
n - neutron activation analysiss - inductively coupled plasma-atomic emission spectroscopy blank - continuous flow hydride generation-atomic
absorption spectroscopy
The following list interprets the symbols used in table 6. The fourth through eighth characters of the sample identification indicate soil horizon according to the U.S. Department of Agriculture (1952) nomenclature. The characters following the element symbol indicate units of measurement- analytical method, respectively:
Units of Measurement
ppm - parts per million ppb - parts per billion
% - percent mmhos/cm - milimhos per centimeter
Analytical Methods (Methods p and w represent an extractable fraction of the total element content in the sample; the remaining methods represent the total content.)
c - continuous flow cold vapor-atomic absorption spectroscopy
h - continuous flow hydride generation-atomic absorption spectroscopy
p - 20 gm soil extracted with 100 ml hydrogen peroxide- acetic acid
s - inductively coupled plasma-atomic emission spectroscopy
w - 20 gm soil extracted with 100 ml water
ACKNOWLEDGMENTS
The authors wish to thank John Miscovitch of the Golden Horn mine, Flat, Alaska, and E. W. Montgomery of the Nugget Estate Mining Company, Livengood, Alaska for their generous help in our sampling of their properties. The authors also wish to thank the various analysts with the U.S. Geological Survey, Analytical Labs for their support.

REFERENCES CITED
Crock, J. G., and Lichte, F. E., 1982, An improved method for thedetermination of trace-level arsenic and antimony in geological materials by automated hydride generation-atomic absorption spectroscopy: Analytica Chimica Acta, 144, p. 223-233.
Crock, J. G., Lichte, F. E., and Briggs, P. H., 1983, Determination ofelements in National Bureau of Standards Geological reference materials SRM 278 Obsidian and SRM Basalt by inductively coupled argon plasma- atomic emission spectrometry: Geostandards Newsletter, 7, p. 335-340.
Crock, J. G., and Severson, R. C., 1980, Four reference soil and rock samples for measuring element availability in the western energy regions: U.S. Geological Survey Circular 841, 16 p.
Koirtyohann, S. R., and Khali 1, Moheb, 1976, Variables in the determination of mercury by cold vapor atomic absorption: Analytical Chemistry, 48, p. 136-139.
Severson, R. C., Crock, J. G., and McConnell, B. M., 1985, Processes in the formation of crystalline gold in placers: Conference Proceedings, The 1985 Symposium on Organics and Ore Deposits sponsored by the Denver Region Exploration Geologists Society, 34 p.
Thompson, C. E., Nakagawa, H. W., and Van Sickle, G. H., 1968, Rapid analysisfor gold in geological materials: U.S. Geological Survey ProfessionalPaper 6008, p. B 130-132.
Wershaw, R. L., Fishman, M. J., Grabbe, R. R., and Lowe, L. E., 1982, Methods for the determination of organic substances in water and fluvial sediments: U.S. Geological Survey Open-File Report 82-1004, p. 25-26.

Table
1.
List o
f ve
geta
tion
sp
ecie
s samples
at F
lat
(FT-), Id
itar
od (ID-), an
d Li
veng
ood
(LV-
), Alaska
Spec
ies
collected
Forest M
ull *.
....
....
....
....
............................................
Cladonium
rang
ifei
na (Reindeer
moss).....................................
Equisetum
pratense L
. ( Horsetai
1 **)......................................
Epilobium
angu
sti fo
lium
L.
subs
p. an
gust
i fo
lium
(F
irew
eed*
* ).............
Ledum
palustre L.
su
bsp.
decumbens
(Ait.) Hult.
(Labrador
tea). ..........
Betula n
ana
L. su
bsp.
exilis (Sukatusch.) Hu
lt.
(Dwa
rf b
irch) ..
....
....
..
Vacc
iniu
m uliginosum L
. su
bsp.
alpinum
(Bigel.) Hult.
(Alp
ine
blueberry)
Alnus
incana (L.) Mo
ench
(A
lder
) .........................................
Sali
x sp
. (W
illo
w)..
....
....
....
....
....
....
....
....
....
....
....
....
....
.
Betu
la o
ccid
enta
l is Ho
ok (Tree
birc
h) ...
....
....
....
....
....
....
....
....
.
B. pa
pyri
f er
a Ma
rsh,
su
bsp.
humilis
(Regel)
Hult.
(Paper bi
rch)
....
....
..
Tsuga
Merten
siana
(Bong.)
Sarg.
(Mou
ntai
n hemlock). ......................
Pice
a gl
auca
(Moench) Vo
ss (W
hite
spr
uce)
....
....
....
....
....
.. ..........
Lari
x laricina (D
u Roi) K.
Ko
ch (Tamarack).. ...
....
....
....
....
....
....
..
"FT-
1
X X X X X X X X X
FT-2
X X X X X
X X X X X X
Site
s
ID-3
X X X X X XX X X X X
LV-1
LV-2
X X
X
X
X X
X X
X X
X X
*Ana
lysi
s pe
ndin
g.
**Collected
also a
t abandoned
Gold
en Ho
rn m
ine
site
nea
r si
te F
T-2.

Table 2. Descriptions of the soil profiles samples at Flat (FT-), Iditarod (ID-), and Livengood (IV-), Alaska
Horizon description
01 02 Cl C2
Living moss mat 01 Al Cl C2g
IIC3 11C4
Fibric peat 02 Cl C2
C3
02 Cl C2 C3 IIC4
01 02 Cl Alb C2 C3 C4
Undefined
Depth (cm)
0-14 14-24 24-36 36-90+
0-12 12-15 15-37 37-50 50-60
60-80 80-120+
0-20 20-23 23-43 43-50
50-70
0-4 4-17 17-26 26-55 55-70+
0-8 8-11 11-19 19-24 24-33 33-74 74-90+
8+ meters
MatrixWet color
1 10YR3/4 2 2.5Y5/4 2.5Y5/4
10YR3/2 2.5Y4/4 2.5Y5/4
10YR4/4 10Yr5/6
10YR2/1 2.5Y5/2 2.5Y3/2
2.5Y4/2
10YR2/2 2.5Y5/4 2.5Y4/4 2.5Y4/3 10YR5/5-5/6
N2/0 10YR3/2 N2/0 10YR3/1 10YR3/2 10YR3/3
Dry color
10YR5/3 2.5Y6/3 2.5Y6/4
10YR5/3 2.5Y6/3 2.5Y6/3
10YR6/5 10YR7/6
10YR3/2 2/5Y6/2 2.5Y5/2
2.5Y7/2
10YR3/2 2.5Y6/3 2.5Y6/2 2.5Y7/2 10YR4/3
10YR3/2 10YR5/1 10YR4/2 10YR5/2 2.5Y5/2 2.5Y5/3
mottled matrix
Wet Color Dry color Abundance
FT-1
10YR5/8 10YR6/8 1% 10YR5/8 10YR6/8 20%
FT- 2
not sampled not sampled
2.5Y5/2 2.5Y7/0 30% 7.5YR4/4 7.5YR5/8 30%
ID-3
not sampled
7.5YR4/4 7.5YR5/6 - 30% 7.5YR4/4 7.5YR5/6 10%
7.5YR4/4 7.5YR5/6 20%
LV-1
--
LV-2
not sampled
LV-4
2.5Y4/3 2.5Y5/2 70% 5YR4/6 10YR6/6 30%
Description
Root mat Silt Silt Silt
Silt Silt Silt
Transition zone Weathered monzonite
Highly organic Silt 2.5Y3/0 organic stains between varve-like layers Silt
Highly organic Silt Silt Silt Sand and gravel
Highly organic Silt Highly organic silt Silt Silt Silt
Silt
*Not present or determinable. 2Munsell color notation.

Table 3. Methods used for total element content of plants and soils
[AAS = atomic absorption spectroscopy; ICAP-AES = inductively coupled argon plasma-atomic emission spectroscopy; and NAA = neutron activation analysis ]
Element Method Reference
As, Sb Hydride generation-AAS Crock and Lichte, 1982.
Hg Cold vapor-AAS Koirtyohann and Khali 1, 1976.
C, S Leco standard combustion Standard manufacturer techniques
Au (soils) HBr-Br2 digestion, AAS Thompson and others, 1968.
44-element scan ICP-AES Crock and others, 1983.
Au (plants) NAA, raw material Standard manufacturer techniques

Table 4. Methods used for extractable element content of soils
[HOAc = hydrogen peroxide-acetic acid]
Element/Parameter Method Reference
pH
Organic Au
Water-extractable Au
Total organic carbon
Specific conductivity
Water-solubilized cation and anions
Soil slurry
digest -AAS
Water extraction
Wet oxidation
Myron L DS meter
Ion chromatography
Crock and Severson, 1980.
Severson and others, 1985.
Severson and others, 1985.
Wershaw, 1982
Standard manufacturer technique
Standard manufacturer technique (Dionex, Inc.)

Tabl
a 5.
--
Analytical results for
plant samples collected near Fl
at,
Idit
aror
i, an
d Liven-joo*,
Alaska.
IN,
not
detected; <,
detected bu
t below the
limit of determination sh
own;
>, determined to
be greater than the
valu
t* shown.1
Sample
AlAs
ppm-s
As
ppm
As ppm-n
Au ppb-n
Pa ppm-s
Pe ppm-s
Br ppm-n
Ca
%-s
Cd
ppir
.-s
Plan
t samples collected ne
ar Flat,
Alaska location-1 (FT-1).
AIDI41AL
AIOU1ALX
AIDU1BB
AIDU1PP
Aioume
A I D U
1 F K
ATDU1FWX
AIDU1IT
AIDU1MH
AIDU1MHX
AIDU
1R!*
AIDU1TP
AIDU1TBX
AID41KW
AIDU1WWX
1.70
1.80 .9U
2.20
.143
.72
.80
3.60
.38
.UO
7.30
.18
. 19
.38
.UO
<20
<20
<20 140
<20
<20
<2C 60
<20
<20 70
<20
<20
<20
<20
1 .10
-- .70
.90
< .
1 Z
1.3C
1.30
1.10
.50
< .
1 0
2.30
.20
.20
.10
. 1 U
1.10 -- -- -- .11
1.20
--1 .5
0.1
3--
3.00
. 2U .38
-- --
7.- - - .
2.-
2.. -
5.. . - -
90 - - - 80 20 - UO UO - 2C 80 80 - -
880
1,800
600
790
1,500
1,700
670
UOO
920
9ur
930
1,50
02,300
900
260
<2 <2 <2 <2 <2 <2 <2 <2 <2 <2 <2 <2 <2 <2 <2
1 .4
0
.57
?.UO
.61
2.60
2.00
1.20
1.20
Plan
t samples collected near Flat,
Alas
ka location-2 (FT-2).
Plant samples collected ne
ar liitarod, Alaska location-3 (I
D-3)
ATD43AL
AIPU3BB
AID43DB
AIDU3DBX
AIDU3FM
AID43E3
AIDU3LT
AIDU 3
¥H
AI043FHX
AIDU3TB
A1D43WW
.06
.35
.20
.22
. 19
.OU
.30
.27
.27
.OU
.08
<20
<20 2C 30 50
<2C
<2P
<T20 20
<20
<2C
.UO
.33
.'40
-- u.co -- .20
-- .30
. 1 c
. 3^
<.3C
<.20 -- --
<.(40
.25
.32
.11
< . 10
--
<2.00
--<2.00
-- --< U
. 0 C
2.70
<. 8"
<.80
<1.00
--
990
U60
1,300
1 ,300
1 ,100
520
1 ,000
770
790
930
790
<2
<2
<2
<2
<2
<2
<2
<2
<2
<2
<2
153.00
176.00
373.00
30.90
58.00
51 .00
, 105.00
19.0
17.0
15.0
17.0
17.0
18.0
16.0
19.0
19.0
3.0
20.C
21 .0
17.0
17.0
AIDU2FS-1
AID!4?LSX1
AIDU2ES-2
AID42F^X2
ATOU2BB
AIDU2DB
AIDU2DBX
AIDU2FW
AIDU2FWX
AID42FW-2
ATDU2LL
AIDU2L1X
A1D42LT
ATDU2LTX
AIDU2TR
A1DU7TBX
h I D 4 2 V
tfA1DU2WWX
.143
.39
1.DO .51
.35
.50
.09
3.30
. 18
. 17
1.80
1 .9
C.68
.71
.16
. 1 5
.38
.37
<20
<2C' UO no UO '»0
UO<2C 30 20 140
5n
90 60 90 3C
<20
<20
3.70
7.6°
.58
2.7C
5.80
2.20
1 .UO
1 .7
01.10
.20
.63
.56
1 .00
.62
.6f
-- -- .146
.79
.52
1.77
1 .70
-- .93
-- .73
.6^
-- -- --
-- -- .9R
2.90
3.50
7.70
9.30
--11.60
-- --10.50
.UO
-- -- --
870
831
2,100
?,200
850
1 ,300
1,100
1 ,000
6140
620
750
2UO
3(40
1,000
250
840
160
520
<2
<2
<2 <2 <2 <2 <2 <? <2 <2 <2 <2 <2 <2 <2 <2 <2 <2
-- -- 1. 1C
1 .3
01
. UO
3.60
U.33
--1.
140
--
--
1.UO
1 .5
0-- -- --
9.1
9.2
11.0
12.0
16 .0
17.0
17. G
15.0
25.0
2u .:
>15.0
16.0
1 9
. u2C
.0
1Q.0
2^.0
13.
G18.0
18 .
^'
16.C
17.0
2U.O
13 .C
19.0
26.0
^6.0
21.0
22.0
h R u
«4
153
me 1 1 <u HP 18 HI 13 3?
31

Teble 5.
--
Analytical results fo
r pl
ant
samples collected ne
ar Fl
at,
Iditarod, and
Livengood, Alaska.--Cent
Sample
Ce ppm-s
Co ppm-s
Cr ppm-s
Cu ppm-s
Fe
%- ?
K
%-s
La ppm-s
La ppm-n
Li
ppir.
Plant samples collected ne
ar Fl
at,
Alaska location-1 (FT-1). Continued
-s
Mn
AIDU1AL
AIDU1ALX
AIDUIBB
AIDU1BB
AIDU1DB
AIDUIFW
AinuiFWX
AID141LT
AIDU1MH
AID141MHX
AinmRK
AIDU1TB
AIDU1TBX
AIDU1WW
MD141WWX
25
30 <8 1<»
<8 19 ia U2
<B
<8 63 1 1
<8 U5 38
AID<42E?-1
AIDU2ESX1
AIDU2ES-2
AIDU2ESX2
AIOU2BB
AIDU2DB
AIDH2DBX
AIDU2FW
AIDU2FHX
AIDU2FW-2
AIDU2LL
AID142L1X
AIDi42LT
AIDa2LTX
AID142TB
A1DU2TBX
AIDU2WW
AID42WWX
10 15 <8 <B <8
<8
<8 33
33 28 <B 9<8 <8<B
<8 18 17
AIDU3AL
RIDU3BB
AIDU3DB
AID143DBX
AIDU3FW
AIDU3LT
AIDU3MH
AIDH3MHX
A1UU3TR
AIDI43WK
<8
<8
<8
<8
<8 <e <8
<B
<8
<8
1. 10
.06
1.30
.72
.oa
. 17
. 17
Plan
t samples collected ne
ar Fl
at,
Alaska location-2 (FT-2). Continue^
16 16 13
'23 11 17 25 (42 5 6
85 8 7 U 5
2UO
250
330
250
52090
100
310
180
210
230
230
210
130
130
1. 10
1.1D
.60
1.UO
.142
.38
.45
2.50
.20
.23
3. HO
. 18
. 18
. 12
. 12
11.0
11.0
16.0
1U.O
16.0
22.0
22.0
12.0
17.0
17.0
5.6
16.0
15.0
?U.O
2U.O
15 19 6 12 <H 20
23 27 <H <U 32 H <u l»1 U1
6 5 q<u 8 7
15 39
p 91U 13 11 1
111 28 5 610 105 6 7 8
65 65
16 23 30 19 U3 17 16
270 9 830 37 15 177 7
1C 10
30 8*4
130
93
220
31C
2UO
100
120
120
180
190
220
220
200
210
170
160
.25
.25
.53
.36
.31
.50
. U
12
.80
.23
.22
.88
.98
,U7
. U
5.
19.
19.2
7.2
6
m.o
12
.07
. -5
8.8
17
.01
6,0
16.0
13..0
17.0
18
.01U
.O114.0
18
.017.0
13
.01
4.
021.0
21
.0
6 5 6 6<U <1
4 <u 21 16 17 <U5
<U <U «4
<14
13 10
Plant samples collected ne
ar Iditarod, Alaska location-3 (10-3
) .-
-Con
t inu
6 14
10
11 u 3 H a a
21 13
3 5 6 5 U<2 6 7 5
<2->
180
2UO
230
220
110 58
280
100 97
72 Pc
.12
.21
.23
.26
. 17
.01
.20
.20
. 19
,OU
.09
17.0
16.0
17.0
17.0
16.0
9.1
17.0
12.0
12. J
11.0
<u
<u
<u <u
<u
<. 10
,20
,02
,05
,05
25,000
2 u,
r <: c
53,
003
50,uOO
(43,
000
in,: c
a15,OCJ
32,000
50,000
5 (4
, C 0 0
5, 3 C j
30,000
30,000
15,000
16,00"
eu:
.03
.05
.04
1.90
1.90 -- .05
-- -- .05
.014
-- -- --
<n <u <u 114
<4 <u f, 7<U i* <u n<u <u
m , -co
53, of
J52,000
5,UC 0
(4,0
004, 1CO
30,OOD
31,000
143,
">00
<4H,OCC
39,003
3 8
, 0 u
C11
1 ,
" r J
10,GC^
<. 06
<u
<u
f> 8,000
70,000
2,1Cj
f'K
f, 1
, C
' 0
5 3
, r 0 H
51,000
3,2(0
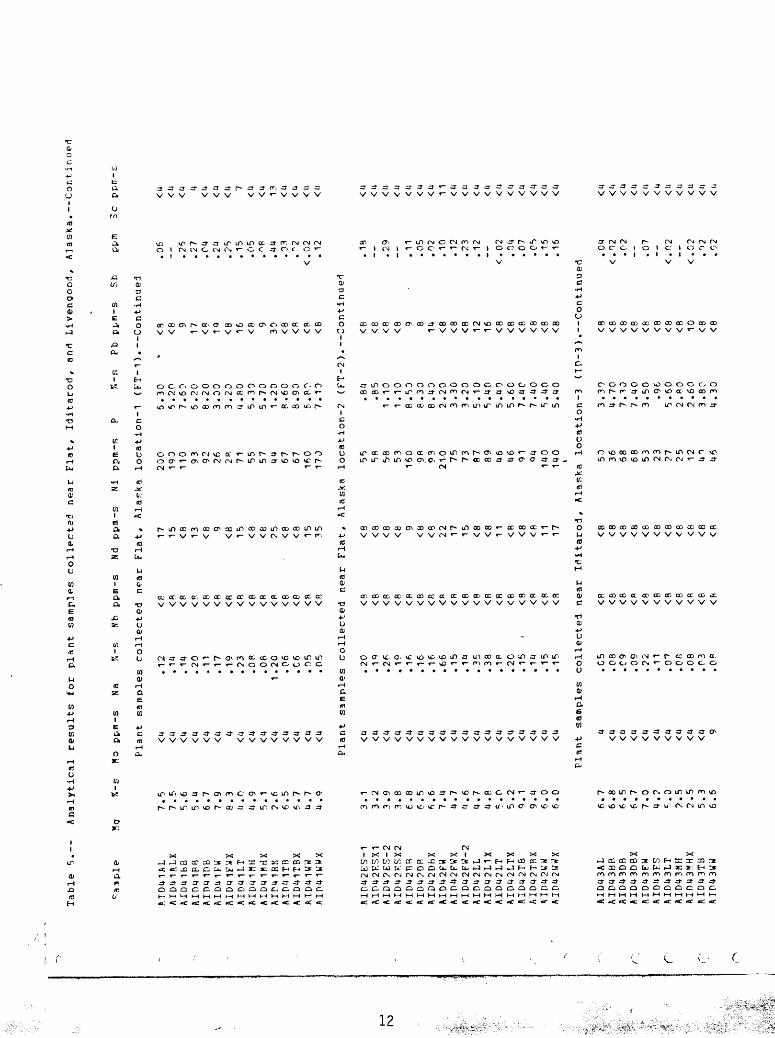
Table 5.
--
Analytical results for
plan
t samples collected ne
ar Flat,
Iditarod, and
Livengood, Alaska. Continued
Ho ppm-s
Na
%-s
Nb ppm-s
Nd ppm-s
Ni ppm-s
P%-
s Pbppn-s
Sb
ro
AID41AL
AID41ALX
AID41BB
AID41PB
AID41PB
AID41FW
AID41FWX
AID41LT
AID41MH
AID41MHX
AIPIMRM
AIP41TR
AID41TBX
ATD41WH
AIP41WWX
7.5
7.5
5.6
5.4
6.7
7.9
8.3
4.0
4.9
5. 1
2.6
6.5
6.7
4.7
4 .9
<4<4
<4<4 <4
<4 4
<4<4
<4<4<4
<4<4
<4
.12
. 14
. 14
.20
.11
.17
.19
.23
.08
.08
1 .20
.06
.06
.05
.05
Plant
samples collected near Fl
at,
Alaska location-1 (FT-1).--Continued
<8
<8
<8
<8
<8 <8
<8
<8
<8 <8
Plant
samples collected ne
ar Flat,
Alaska location-2 (FT-2). Continued
17 15 <8 13 <8 9
<8 15
<8
<825
<8 <8 15 35
200
190
110
93 92 26 28 71 5557
446767
160
17J
6.30
5 .2
07.60
6.20
8.20
3.00
3.20
4.80
5.30
5.70
1 .20
8.60
8.90
6.80
7.10
<8<8 917 <8 19
<8 16 <89
30
<8
<8
<8 <8
AID42ES-1
A1P42ESX1
AID42ES-2
AID42PSX2
AID42RB
AID42DR
AID42DBX
AID42FH
AI042FWX
AID42FW-2
AID42LL
AID42L1X
AID42LT
AID42LTX
AID42TB
AID42TBX
HID42KW
AID42WWX
3.1
3.2
3.9
3.8
6.8
6.5
6.6
7.4
4.7
".6
4.7
4.8
5.0
5.2
9. 1
9.4
6.0
6.0
<4<4
<4
<4<4
<4<4<4<4
<4
<4<4
<4<4<4
<4<4<4
20 19
26 19 16 16 16 66 15 14 35 38 18 20 15
.14 15 15
<8<8
<8 <8<8
<8
<B <" <8
<8
<8 <8
<8<8 <8 <8
<8<R
<8<8
<8
<8 9<8
<8 22 17 15 <8<8 1 1
<8 <8<8 1 1
17
55 58
5-8
53160
98
*>3
21.0 75
73 8789
46 46 91 04
140
140
.84
.85
1 .10
1 .1
08.50
8.30
8.40
2.20
3.30
3.20
5.10
5.40
5.40
5.60
7.4P
7 .4
05.40
5.40
<8
<8 <8 <8 9 814 <8<8
<8 12 16 <8
<8 <8<8
<8
<8
pym
.05
<4
.25
.27
.04
.24
.25
. 15
.05
.°8
.44
.03
. "2
<.02
.12
<4 4<4<4
<4 7<4<4 13
<4
<4<4<4
. 1B
__ .29
-- .11
.05
.02
. 10
.12
.23
. 12
<.02
.04
.07
.05
.15
.16
<4<4
<4 <4 <4 <4
<4 11
<4<4<4
<4
<4
<4 <4
<4 <4
Plant samples collected near Id
itar
ocl,
Alaska location-3 (in-3
) .--Continued
AID43AL
AID43BR
AID43DB
AID43DBX
AID43FW
AID43FS
AID43LT
AID43MH
AI043KHX
AID43TB
6.7
6.8
6.5
6.7
7.0
4.?
5.0
2.5
2.5
5.3
6.6
4<4
<4
<4
<4
<4
<4
<4
<4
<49
,C5
,08
.09
,09
,22
,11
,0^
OB
,08
,03
,08
<8
<8
<8
<R <8
<8
<8
<8
<8
<8
<8
<8
<8
<8
<8
<8
<8
<8
<B
<8
<8
<8
50
36 686853 23
2725 12 41
46
3.30
4.70
7.30
7.40
3.50
.96
5.60
2.80
2.60
3.8?
4.30
<8
<8
<8
<8 <8 <8
<8
<8 10 <8 <8
.04
<.02
.02
.07
<.r>2
<.02
.02
.02
<4 <4
<4
<4 <n

Table 5.
--
Analytical results fo
r pl
ant
samples co
llec
te-1
ne
ar Fl
at,
Iditarod, and
Livengood, Alaska. --Cent
inue
ri
Sample
Sr ppm-s
Th ppm-s
Ti
*.-s
V ppm-s
Y ppn-s
Yb ppm-s
7,n
ppm-s
Plan
t samples collected ne
ar Flat, Alaska location-1 (FT-1). Continued
AID41AI,
AID41ALX
AID41BB
AID41BB
AIP4 H~>
BAID41FW
AID41FWX
AID41LT
A1D41KH
AID41MHX
AID41RM
AID41TB
AID41TBX
AID41WW
AID41WWX
1,600
1,700
500
460
760
1,200
1,300
380
400
U10
190
1,400
1,500
1,900
2,000
<8 <8 12 15 <8 <8
<P <R 12 149
<8 10 <8 12
AID43AL
ATD43BB
AID43DB
AID43DBX
AID43FW
AID43E?
AID'43LT
AID43MH
A1D43KHX
AID43TR
1,UOO
830
600
510
1,400
790
300
450
440
1,200
1,UOO
AID42K3-1
AIDU2FSX1
AIP42F5-2
AID42ESX2
UD42
rifc
AID42Dd
AIDU2DBX
A1D42FK
AIP42FWX
MD42FW-2
AID42LL
AID42L1X
AIDU2LT
ATP42LTX
AID42TH
A1D42TBX
AID42WW
Mn42W',IX
750
760
1,000
1,100
390
450
U30
1,800
2,500
2,500
500
510
190
200
670
700
1,8CO
1,800
<8 <8 <8 <8 14 <P 13 <8 <8 <8
<8 <8 169
<P9
<R8
05
05 03
07 02 02 03 15 01 01 31 01 01 01 01
1 F
166
24 <4 4 5
46 <4
<4
110
<4<4
<4<4
2628 513 <4 13 13 27<4
<4 174
<444
46
<2
<2
<2 <2
<2 <2
<2
<2 2
<2
<2
<2
96P
94D
6,500
4,100
8 ,100
7RG
820
1,300
2,000
2,100
520
3,000
3 ,100
3 ,4
r 0
3,600
samples collected ne
ar Flat,
Alas
ka location-? (FT-2). Continued
02
02 05
03
02
03 02 22 01 01 05 07 03 C3 01 01 01 02
6 R13 Q
<4<4<4
7«<4<4 17
1P <4<4
<4<4<4<4
7 8 7 6<4<4<4 15
21 20 4
<4
<4<4<4<4 8 7
<2
<2
<2
<2
<2 <2 <2
<2<2<2
<">
<2<2
<2
<?
<?.
<2<2
110
11C
270
27T
6,20C
10,030
9 ,800
24f
200
190
1 ,300
1 ,400
1 ,100
1 ,100
5,9^0
6,000
3,300
3 ,400
Plant
samples collected near Iditaroi, Alaska location-3
( ID-3
) .--Continued
<8 <8
25 19
<8
<8 20
15
13
<8
<8
,01
,01
,02
,01
,01
,01
<4 <4
<4<4<4<4
<4<4
<4<4
<4
<4<4
<4<4<4<4
<4<4
<4<4
<4
<?<2
<2 <2<2<2
<2<2
<2 <2
<2
790
1 ,800
7,500
7,200
27 0
28C
1,100
2,40C
2,400
3,100
2 , 3 C 0

TaMe 5.
--
Analytical results fo
r pl
ant
samples collected ne
ar Plat, Iditarod, and
Livengood, Alaska.--Cont ii nutd
Saiiple
AlAs ppm-s
AsPp
mAs
ppm-n
Au ppb-n
Ba ppm-s
Be ppii-s
Br ppm-n
r rt
p p. m -
Plan
t samples collected near Livengood, Alaska location-1 (L
V-1)
ALV
I41&
LA
LV14
1ALX
AL
VU
1LT
ALV
141R
MA
LV41
RM
XA
LV14
1TB
XA
LVU
1WS
AL
V41
K3X
.92
.90
1.3
08
.00
7.9
01.3
0.6
0.6
3
130
120
270
2,3
00
2,3
00
330
150
160
5.0
05.1
07.5
0510.0
05
30
.00
12.0
06.1
06.3
0
5.9
05.1
08.9
8396.0
0399.0
01
1 .f
iO--
--
13.
6C13.0
061
.U
O3
2.
CO3
7.0
0U
8 .8
0-- --
5RO
620
(420
1 ,U
OO
1,1
400
1,0
00
2,14
002,4
00
<2
<2
<2 2 3
<2
<2
<2
2.2
02.
10.5
82
.80
3.
101
.20
--
--
20.0
2C .
01
8.
01
.U1
. 3
18 .
021.0
22.0
Plant samples collected near Livengood, Alaska location-2 (L
V-2)
AL
VU
2AL
ALV
142E
5A
LV
I42F
SXA
LV
I42L
TA
LV14
2LTX
ALV
142T
BA
LVU
2W3
ALV
142W
5X
.93
.73
.85
1.8
02
.00
.80
3.1
03.2
0
150
1,1
00
1,2
00
290
310
130
800
820
5.7
0230.0
0
9.7
1--10.0
03.6
0uo
.oo
39.0
0
6.6
027(4
.00
--1
1.2
0--
14. U
C__ --
(48.9
031
.14
0--
10
6.0
0--
37.7
0-- --
970
320
3UO
750
020
870
1,900
1,900
<2
<2
<2
<2
<2
<2
1.10
23.00
.58
1U.O
9. 1
9.2
1U.O
1b.O
11 .0
13.0
13.0
15

Table 5.--
Analytical results for
plan
t samples collected near Fl
at,
Iditarod, an
d Livengood, Maska.--Continuei
Sample
ALVU1AL
ALV<
41AL
XAT.vmLT
ALVH1RM
ALV41RMX
ALVU1TBX
Ce ppm-s
Co ppm-s
Cr ppm-s
Cu ppm-s
Fe
JJ-s
KLa
ppm-s
La ppm-n
Li ppm-s
Mn pp
m-'
ALVU1WSX
Plan
t samples collected near Livengood, Alaska location-1 (L
V-1
) .--Continued
<8
<8
58
6(4
17
<8
<8
11 11 10 31 31 267 8
17 19 37220
2UO 39 17 22
170
180
2UO 91 PC
1PO
100
100
1.13
1. 10
.96
6.00
5.9?
1.30
.50
.55
15.0
15.0
1*4.
02.
*2.8
12.0
12.0
12.0
<U <u 6 33 376
<U <U
.27
.25
.25
7 .UO
7.50
.37
--
--
<I4
<14 e
145
145 8 6 c,
Plant samples collected near Livengood, Alaska location-2 (LV-2).--Continued
ALVH2AL
ALVU2ES
ALVt
42FS
XALVU2LT
ALVH2LTX
ALVH2TB
ALVU2WS
ALV42WSX
<8 15 17 16 15 <8 26 29
10 9 7 9119
2U 19 22 57 55 2U
,
250
74 8221C
210
3CO
.81
1.20
1.30
1 .30
1.UO
.77
1U.O
10.0
Q.9
1U.O
1U.O
1U.O
20 ia99 81
98 1CO
2.80
2.80
10.0
10.0
14 7 8 9 9
16 16
.24
2.80
6 710 115
22 19
1U ,
0 0 0
21,000
1 ,ocn
17 ,
0 fO
12,0:
:
9 , B C 0
?T
2F-:
7 , 0 0 D
6 , ?
[ :16,000
9, 1
rO
9,200

Table 5.--
Analytical results fo
r pl
ant
samples collected ne
ar Fl
at,
Iditarod, and
Livengool, Al
ask
*.--Continued
Sample
%-s
Ho ppm-s
Na
%-s
Nb ppm-s
Nd pp
fli-
s Ni
ppm-s
%-s
Pb ppm-s
Sb
ppm
Sc pp
it-b
ALV41AL
ALV41ALX
ALV41LT
ALV41RW
ALV41RKX
ALV41TBX
ALV41WS
ALV41W5X
6.3
6.4
5.9
2. 1
2.0
P. 2
2.5
2.7
19 219 7 7
<4 <4 <4
.07
.08
. 14
.75
.73
.11
.06
.06
Plant samples collected ne
ar Livengood, Alaska location-1 (LV-1).--Continued
<8
<8 <8
<8
<R<8 10 31 31 16 10 <8
240
240
100
200
190
160
4R
51
3.80
3.90
4.80
.38
.37
5.00
3.70
4.00
8<8 1 1
4544 17 810
181
Plant
samples collected near Livengood, Alaska location-2 (LV-2) .--Continued
ALV42AL
ALVU2KS
AL742E3X
ALV42LT
ALV42LTX
ALV42TB
ALV42W5
ALV42WSX
14.0
5.3
5.3
P. 1
8 .4
17.0
4.7
4.8
<4
<4 <4 <4 <4 <4 <4 <4
.10
.10
. 11
.21
.23
.08
.25
.26
11 <R
<8<R <8
<8 <R '8
<8 10 15 8
<8
<8 916
2<n 56 58 81 R3
270
170
170
3.10
.66
.66
4.70
4 .70
4.50
2.60
2.70
1C <8
<P 11 15 1 1
31 30
,47
,48 30 10
.57
1 .70
.95
.96
.42
2.80
2.80
19 19 <4 <4
<4
<H U 4
<4 P. F
o C;

1
Table 5.--
Analytical results for
plant
Sample
Sr ppm-s
Th ppm-s
Ti
7.-s
V
Plant
samples collected
ALV41AL
1,700
<8
.03
ALV41ALX
1,700
<8
.03
ALV-41LT
UUO
<8
.OU
ALV41RM
250
14
.44
ALV41RMX
240
<R
.39
ALVU1TBX
1,UOO
<8
.08
^
ALV41WS
970
<8
.03
ALV41R5X
1,000
<8
.03
, " '-
Plant samples collected
ALVU2AL
780
<8
.05
ALV42RS
610
<P
.03
ALV42ESX
520
<8
.04
ALVU2LT
420
<8
.01
ALVU2I.TX
430
<8
.08
ALVU2TB
590
<8
.04
ALVU2HS
800
<8
.14
ALVU2HSX
830
<8
.15
(" i " r-
samples collected near Flat,
Tditarod, and
Live
ppm-s
Y pp
ii-s
Yb
ppm-s
Zn ppm-s
near Livengood, Alaska location-1 (LV-1
) .--Continued
15
<4
<2
1,200
» 15
<4
<2
1,200
32
<4
<2
R?0
270
19
3 440
260
19
2 43C
40
6 <2
4,600
15
<4
<2
1,400
16
<4
<2
1,400
near Livengood, Al
aska
location-2 (L
V-2
) .--Continued
23
<4
<2
1,000
58
12
<2
420
68
13
<2
430
(47
4 <2
1,300
47
5 <?
1,300
19
<4
<2
6,200
95
8 <2
1,100
96
9 <2
1,100
i

bo
C
6.--
Analytical results fo
r so
il samples collected near Flat,
Iditarod,and Livengood, Alaska.
[N,
not
detected; <,
detected but
below the
limit of determination sh
own;
>, determined to
be
creater than th
e value sh
own,
Sample
FT101
FT1C2
FT2M
FT2C1
FT232G
FT2IIC3
FT2IIC4
ID3D
2
ID333
LV131
LV1C2
LV1C3
LV1IIC4
As ppm-h
ppm-s
Al
%-s
Au pp
m A.
u ppb-w
Au ppm-p
Ba ppm-E
Re ppm-s
Total
Soil
samples collected ne
ar Fl
at,
Alaska location-1 (F
T-1)
.
21
.0U
1.0
12
0.0
190.0
42
.06
3.
C7
0.
r3B
O.O
640.0
8.2
14
.013.:
22
. &
3 '4
D .
37
50
.0R
10.0
3,4
00
.06
,10
0.0
330.0
43
0.0
210.0
1 ,1
00
.0850.
C6
00
.0
20
40
90
16
0
So 40 50
70
33
0590
Soil
<10
<10
<1
0 20
Soil 33
0620
66
03,2
00
6,0
00
Soil 320
mo
560
1 ,0
00
72n
530
2.5
4.7
7.3
7.8
<.05
<.05 .05
.10
1 7 321
.02
.02
<.f>
2 .10
320
540
860
1,10
0
Soil
samples collected near Flat,
Alas
ka location-2 (F
T-2)
.
5.8
6.6
7.1
7.6
8.9
<.05
<.05
<.05
.88
Soil samples collected near Iditarod, Al
aska
location-3 (I
D-?)
2.1
6.6
6.8
6.U
<.05
<.05
<.05
<.05
<.02
3PO
850
880
P70
oil
samples collected ne
ar Livenaood, Alaska location-1 (LV-1).
7.0
7.0
8.7
Soil samples collected near Livengood, Alaska location-2 (LV-2).
.05
.07
. 0°
.24
.37
f 3 2 215
.02
.04
.06
.05
.02
1,000
1,000
1 ,200
1,700
1,900
2 2 3 5 6
35. 10
2D.60
1.69 .44
35.00
4.33
5.07
1.03
18.30
1.65
1 . 1C
Organic
r
530 4!)
24
<1 <11
29
750
<.02
.02
.02
. 16
.78
650
720
790
1,400
1,400
1 1 1 3 4
8.51
3.11
3.28
.21
.05
70 30 30 30 22
440
100
120 60
465
70
60
40
4?
LV2D2
LV2~1
LV2A1B
LV2:2
LV2C3
LV2"4
330.0
430.0
210.0
1 ,100.0
850. C
600.0
320
410
560
1 ,000
720
530
3.7
5.7
5.5
7.0
6.6
6.1
.06
.56
.45
.5"
. 1R
.13
414 14 18 148
. ^5
.06
.04
.05
.07
.04
58">
790
790
1 ,000
960
980
<11 1 2 2 1
22.^0
9.11
11.80
2.29
1.74
2.09
45C
260
200 70 50 6C
Sample collected from the
'pay
zo
ne'
of a
placer mi
ne near Livengood, Alaska location-^ (L
V-4)
.
LVU
2,100.0
2,100
7.3
1.20
200
.02
2,200
.1+7
35
r n

Table 6. Analytical results for soil samples collected near Flat, Iditarod,and Livenoood, Alaska.--Continued
Sanple
FT101
FT1D2
FT1C1
FT1C2
FT2A1
FT2C1
FT2C2G
FT2IIC3
FT2IIC4
ID302
ID3C1
ID 3 Z 2
ID3C3
LV102
LV1C1
LV1C2
LV1C3
LV1IIC4
LV202
LV2C1
LV2A1B
LY2C2
LY7C3
LV2C4
Ca ppm-w
Ca
%-s
Cd ppm-r
Ce ppm-s
Cl ppm-w
Co ppm-?
Cr ppm-s
Cu ppm-s
Fe
7,-s
Soil samples collected near Flat, Rlaska location-1 (FT-1). Continued
12 32 2 2
.U2
.59
.77
.70
<2
<2 <2 <2
22
4076
6.00
3.80
1.50
81
12.00
Soil samples collected near Flat,
4 2 2 2 U
77 29 27 10 P5 137 7 8
67
61 48 17 15 15
.81
.75
.78
2.30
.87
Soil sairples
1.00
.R7
.8U
.73
Soil samples
.85
.90
.85
.56
.19
Soil samples
1.00
1.10
1.10
.55
.66
.65
<2
<2
<2 <2
<2
collected
<2 <2
<2 <2
collected
<2 <2<2 U a
collected
<2 <2
<2<2 <2
<2
(49
59
6U69
7«4
near Iditarod
?* 59 61 66
near Livenqood
. 65
75 Q5
150 75
near
Livengood
?3 46
U8 68 7257
(4 615 21
31 50
120
140
Alaska location-2 (FT-2).-
1.0C
.73
.85
.30
.51
, Alaska
6.00
6 .50
.51
.5R
, Alaska
6 .2
01.1?
1 .30
1.20
.55
, Al
aska
u.uo
5. 40
5.20
1.50
2.80
2. 50
510 1
159
21
location-3
16 15 13 23
location-1
10 11 12 10 2a
location-2
20 25 28 37 3R 37
63
100
11C
5SD
1PO
(ID-3)
32120
130
mo
(LV-1)
89110
12C
1DC
35"
(LV-2)
200
260
300
U30
(440
460
1 1
15
31 (41
-Continued
12 21 24
110
190
.--Continued
1C 16 2029
.--Continued
42
22 28
37140
. --Continued
23 29 36 36 30
31
1 .1
2.5
4.1
4.4
2.0
4.C
4 .6
6.5
3.P
1 .4
3. f
t3.8
4.2
2.2
3.R
3.8
4.8
6.r
2.4
3.5
3.8
4.9
4.5
4.5
11
16
1R 15 16 17 15 15 17 1°
2C 9
13 13 17 17 15
Sample collected from the
'p^y
zo
ne'
of
a placer mine ne
?r Livehgood, Alaska location-U (LV-U) .--Cont.inuf-rl
LVU
UU
.51
2 11
0 .U
9 21
200
57
5.0
18

' ro o iU.
;
} : « * f V-
'
feJr'
'
feft
v^ '
S" /
:'
ffri
fA-.
4^.%
;;,
|i:;.J
t£V
Table 6.-
Sa.ple
FT101
FT1?2
FT1C1
FT1C2
FT2A1
FT2C1
FT232G
FT2IIC3
FT2IIC4
- Analytical results £or
Hg ppm
.21
.17
.10
.14
.'45
.18
.11
.08
.16
-c
K %-s
La
Soil samples
.57
1 .0
01.60
1.70
Soil samples
1 .4
01 .40
1 .50
1.60
3.50
soil
ppro
-s
samples
Li ppm
collected near
10 19
35 37
918 34 38
collected near
23 rp 30 35 36
23 3C 31 35 25
collected near
-s
Mg
%-s
Flat, Mask a
.25
.48
.98
1.00
Flat, Alaska
.54
.87
.92
5.30
2.50
Flat, Iditaro3,and Livengood, Alaska.
1g pp
m-w
location- 1
517
1 1
locn
t io
n -2
2 1 1 1 2
Soil samples collected near Iditarod, Alaska location
IF3D2
IP3C1
IL>3C2
ID3C3
i
. 10
. 10
.10
.06
.45
1.30
1.40
1 .4
0
10 27 ?B 31
Soil samples collected
LV1D2
LV1C
1LV1C2
LV1C3
LV1IIC4
. 15
.04
.12
.14
.54
1.20
1.60
1 .80
2.00
2.50
30 37 45 68 32
Soil samples collected
LV2
r>2
LV2C1
LV2A1P
LV2C2
f
LV2C3
LV2C4
Sample
LV4
f r ,-
.31
.38
.42
.38
.46
.44
.95
1.30
1 .4
02.10
1.PO
1.60
collected fr
om th
e 'p
ay
1.20
2.90
15 22 23 30 31 27
zone
1
53
11 35 36 35
.33
.85
.85
.92
208 8 3
fln
ppm-
(FT-1)
2.4
4.0 .2 . 1
(FT-2)
. 1
. 1
<. 1 . 2
. 4
-3 (i
n-
7 .? .5 .8 .3
near Livengood, Alaska location-1 (LV-
19 36 36 4010
0
.60
.91
.91
.81
.73
425 2 3 3
19.0 .5 .2 .1 .1
near Livengood, Al
aska
location-2 (L
V-
19 31 32 43 38 35
1.80
2. 10
2.00
2.10
2.50
3.20
of a
placer mine near
37.7
0
148
111 93 33 31 31
Livengood ,
17
4.9
1.7 .8 .2 .2 .2
Alaska
. 1
w rtn ppm-s
fo
.--Continued
340
310
410
680
. --Cont inued
480
310
320
1,410
740
3 ) .--Continued
840
510
580
6CO
1 ) .--Continued
98C
380
4 1C
330
270
2). --Continued
870
930
1,200
1,700
1,600
1,000
location-4 (L
V
500
rp.-
C
<? <2 <2 <2 <2 <2 <2 <2 O <2 <? <2 <2 <2
<2 <27 7
<2 <2
<2 <2
<2 <2
-4).--
4
TontinuM
N a
p F m - w
13 24C,
1f 1 1 r. 6 6 7
1 1 9 P 4
1?C} $
10 7 e149 7 7 q
Continued
c,

K>
c
Table 6. Analytical results for soil samples collected near Flat, Iditarod,and Livengood, Alacka.--Continu
Sample
FT101
FT1D2
FT1C1
FT132
FT2M
FT2C1
FT2C2G
FT2IIC3
FT2IIC4
ID302
ID3C1
ID3C2
ID3C3
LV1D2
LV1C1
LV1T2
LV133
LV1IICU
Na
%-s
Nb ppm-s
Nd ppm-s
Ni ppm-s
P %-
s Pb ppm-s
Ph
Total S%
Sb ppb-h
Sc ppm-
Soil samples collected near Flat, Alaska location-1 (FT-1).--Continued
5 815 17 12 13 22
V4
513 14
912 128
22
LV2C1
LV2A1B
LV2C2
LV2C3
LV234
.47
.92
1.20
1.10
<4 <44 5
10 18 33 36
1 1
19 43 55
Soil samples collected near Flat,
1.60
1.10
1.10
1.20
2.70
.30
1.10
1.10
1.00 .73
1.10
1.10
1.20 .08
.59
.97
.7U
.58
.89
.89
5<U6 8
13
Soil
samples
<45 5 6
Soil
samples
7 7 7266
Soil samples
<46
<U5
<44
23 76 27 36 13
collected
12 ?( ?6 30
collected
20 33 38 fiO
36
collected
15
18 23 27 32 28
19 33 3U300
110
near
Iditsror
1
16 "8 51 64
near Livengood
C8
37 UO 46
290
near Livengood
180
210
2UO
260
29. -
>330
.12
. 12
.07
.08
5 12 17 15
Maska location-2
.06
.08
.09
. 14
. 18
, Alaska
. 10
.06
.07
.05
, Alaska
.12
.04
.04
.06
.09
, Alaska
.09
.08
. 10
.08
.07
.05
10 11 14 15
22
location
1* 10 12 1.3
3.52
3.95
4.43
4.87
(PT-2)
4.38
4.56
4.56
4.47
4.76
-3 (ID-
4.36
4.99
4.97
4.93
location-1 (LV-
15 15 22 '22 .8
location
812 12 13 11 11
4.24
4.49
4.73
4.89
5.30
-2 (LV-
4.62
5.26
5.35
6.14
6.20
5.92
.OP
39.0
».06
3.3
.01
9.5
<.01
15.0
. --Cont inued
.01
1.9
.01
2.4
.01
3.1
<.01
?3.0
<.01
55.
C
3) .--Continued
.12
2C.C
.02
4.3
.02
4.4
<.01
18.0
1 ) .--Continued
.05
1 2 C .
0.0
2 11.0
.03
13.0
.13
1 2 0
. 0.0
2 280.0
2). --Continued
.08
73.:
.04
100.0
.06
11L.C
.02
250. C
.01
210.:
<.01
140.0
15 15 14
Sample collected from the 'pay zone' of a
placer mine near Livtengood, Alaska location-4
( LV-4 ).--Con tin
u^ri
LVU
.78
7 45
13
0 .1
0 37
6.76
.02
220.0
15
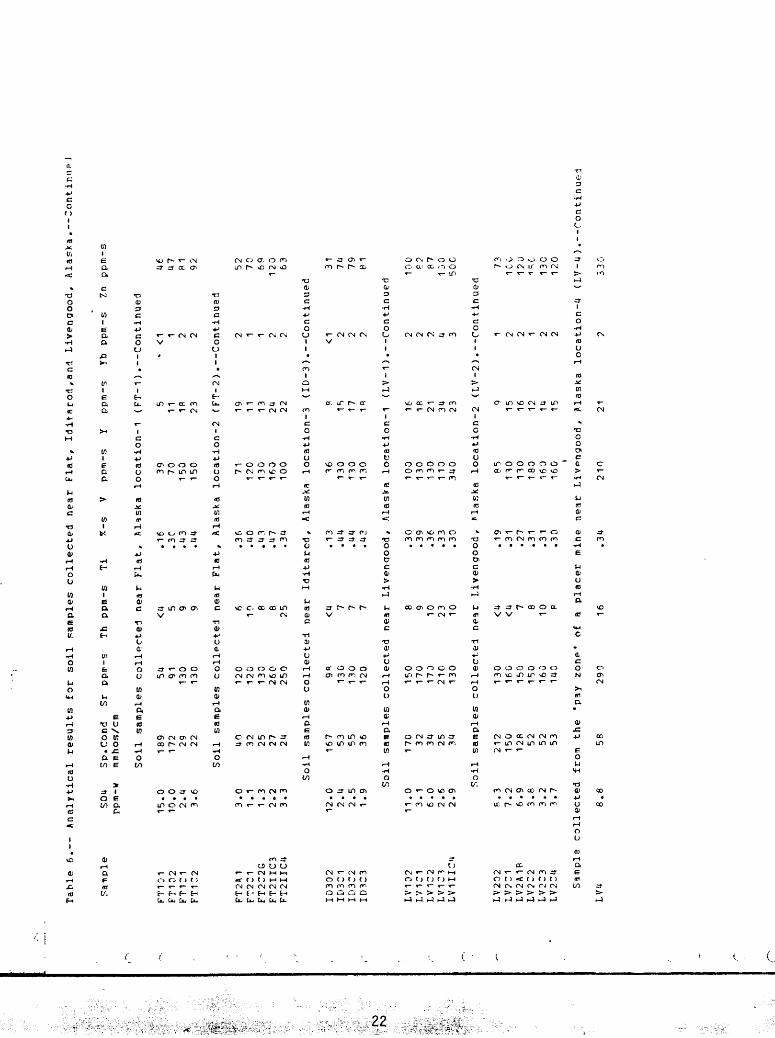
Table 6.
-- Analytical results for
soil
samples collected near Flat,
Iditarod,and Livengood, Alaska.--Continn?J
SD4
Sp.Cond
Sr pp
ir-s
Th
ppm-s
Ti
ppm-
w mmhos/cm
ppm-s
Y ppm-s
Yb ppm-s
Zn ppm-s
Soil samples collected near Flat, Alaska location-1 (FT-1). Continued
Sa-nple
FT101
FT102
FT1C1
FT1"2
FT2A1
FT2C1
FT2C2G
FT2IIC3
FT2IIC4
ID302
ID3C1
IP3C2
ID3C3
LV102
LV1C1
LV1C2
LV1C3
LV1IIC4
LV202
LV2A1B
LV2C2
LV2C3
Sample collected fr
om the
'pay
zo
ne'
of
a placer mine near Livpngood, Alaska location-4 (LV-U).--Continued
LV4
8.8
58
290
16
.34
210
21
2 330
15.0
10.0
2.4
3.6
189
172 29 22
54
91130
130
<4 5 9 9
.16
.30
.43
.44
39
70
150
150
Soil samples collected near Flat, Alaska location-2
3.0
1.1
1.3
2.2
3.3
12.0
2.4
2.5
1.9
11.0
3.1
6.0
2.6
2.9
8.3
7.2
6.9
3.8
3.2
3.7
40
32 25
27
24
Soil
samples
167 53 55 36
Soil samples
170 32
34
25 34
Soil samples
212
150
128
52 52
53
120
120
130
260
250
collected
98
130
130
120
collected
150
170
170
210
130
collected
130
160
150
150
160
140
6108 8
25
near
<4 7 7 7
near 8 9 10 23 10
near <4<4 7 8108
.36
.40
.43
.47
.34
Iditarcd,
.13
.44
.44
.43
Livenoood ,
.30
.39
.36
.33
.30
Livengood ,
.19
.31
.27
.31
.31
.30
71120
130
160
100
511 18 23
* <1
1 2 2
4647
81 92
(FT-2) .--Continued
19 11 13 24 22
Alaska location-3
36 130
130
130
Alaska location
100
130
130
1 10
340
Alas
ka location
85
130
130
180
160
160
R
15 17 18
-1 16 18 21 34 23
-2
g
15 16 12 14 15
2 1 1 2 2
(ID-3). --Continued
<12 2 2
(LV-1). --Continued
2 2 2 4 3
(LV-2). --Continued
1 2 2 1 2 2
527069
120 63 31 7479
61
100 P 2
87
1 DO
50C 73
1 CC
120
1 ^G
130
120
r
Related Documents


