United States Department of Agriculture National Agricultural Statistics Service ISSN: 1948-9048 Citrus Fruits 2019 Summary August 2019

Welcome message from author
This document is posted to help you gain knowledge. Please leave a comment to let me know what you think about it! Share it to your friends and learn new things together.
Transcript

United States Department of Agriculture National Agricultural Statistics Service
ISSN: 1948-9048
Citrus Fruits 2019 Summary August 2019


Citrus Fruits 2019 Summary (August 2019) 3 USDA, National Agricultural Statistics Service
Contents Utilized Citrus Production – United States: 2008-2018 .......................................................................................................... 6
Citrus Value of Production – United States: 2008-2018 ......................................................................................................... 6
Citrus Narrative ....................................................................................................................................................................... 7
Citrus Acreage, Production, Utilization, and Value – States and United States: 2016-2017, 2017-2018,
and 2018-2019 ........................................................................................................................................................................ 8
Citrus Acreage, Production, Utilization, and Value by Crop – United States: 2016-2017, 2017-2018,
and 2018-2019 ........................................................................................................................................................................ 9
Orange Acreage, Yield, Utilization, Price, and Value by Type – States and United States: 2016-2017,
2017-2018, and 2018-2019 ................................................................................................................................................... 10
Bearing Acres of Oranges – United States: 2008-2018 ........................................................................................................ 12
Utilized Orange Production – United States: 2008-2018 ...................................................................................................... 12
Grapefruit Acreage, Yield, Utilization, Price, and Value by Type – States and United States: 2016-2017,
2017-2018, and 2018-2019 ................................................................................................................................................... 13
Lemon, Tangerine and Mandarin Acreage, Yield, Utilization, Price, and Value – States and United States:
2016-2017, 2017-2018, and 2018-2019 ................................................................................................................................ 14
Citrus Prices Narrative .......................................................................................................................................................... 15
Orange Average Prices and Equivalent Returns by Type and Season – California: 2017-2018 and 2018-2019 ................. 16
Orange Average Prices and Equivalent Returns by Type and Season – Florida: 2017-2018 and 2018-2019 ...................... 18
Orange Average Prices and Equivalent Returns by Type and Season – Texas: 2017-2018 and 2018-2019 ........................ 20
Orange Average Prices and Equivalent Returns by Season – United States: 2017-2018 and 2018-2019 ............................ 21
Grapefruit Average Prices and Equivalent Returns by Season – California: 2017-2018 and 2018-2019 ............................ 22
Grapefruit Average Prices and Equivalent Returns by Type and Season – Florida: 2017-2018 and 2018-2019 ................. 23
Grapefruit Average Prices and Equivalent Returns by Season – Texas: 2017-2018 and 2018-2019 ................................... 25
Grapefruit Average Prices and Equivalent Returns by Season – United States: 2017-2018 and 2018-2019 ....................... 25
Lemon Average Prices and Equivalent Returns by Season – California: 2017-2018 and 2018-2019 .................................. 26
Lemon Average Prices and Equivalent Returns by Season – United States: 2017-2018 and 2018-2019............................. 27
Marketing Year Average Prices Received for Oranges – States and United States: 2017-2018 and 2018-2019 ................. 28
Marketing Year Average Prices Received for Grapefruit – States and United States: 2017-2018 and 2018-2019 .............. 29

4 Citrus Fruits 2019 Summary (August 2019) USDA, National Agricultural Statistics Service
Marketing Year Average Prices Received for Lemons, Tangerines and Mandarins – States and United States:
2017-2018 and 2018-2019 .................................................................................................................................................... 30
Terms and Definitions ........................................................................................................................................................... 31
Marketing Year Average Prices and Value of Production .................................................................................................... 31
Box Weights by Crop - States: 2016-2017, 2017-2018, and 2018-2019 .............................................................................. 32
Marketing Seasons ................................................................................................................................................................ 32
Statistical Methodology ......................................................................................................................................................... 33
Information Contacts ............................................................................................................................................................. 33

Citrus Fruits 2019 Summary (August 2019) 5 USDA, National Agricultural Statistics Service
This page intentionally left blank.

6 Citrus Fruits 2019 Summary (August 2019) USDA, National Agricultural Statistics Service
0
3
6
9
12
2009 2010 2011 2012 2013 2014 2015 2016 2017 2018 2019
Million tons
Utilized Citrus Production – United States
0
1
2
3
4
2009 2010 2011 2012 2013 2014 2015 2016 2017 2018 2019
Billion dollars(PHD equivalents)
Citrus Value of Production – United States

Citrus Fruits 2019 Summary (August 2019) 7 USDA, National Agricultural Statistics Service
Citrus Utilized Production Up 31 Percent, Value Up 1 Percent
Citrus utilized production for the 2018-19 season totaled 7.94 million tons, up 31 percent from the 2017-18 season.
California accounted for 51 percent of total United States citrus production; Florida totaled 44 percent, and Texas and
Arizona produced the remaining 5 percent.
Florida's orange production, at 71.8 million boxes, is up 59 percent from the previous season. Grapefruit utilization in
Florida, at 4.51 million boxes, is up 16 percent from last season's utilization. Florida's total citrus utilization increased
56 percent from the previous season. Bearing citrus acreage, at 387,100 acres, is 13,800 acres below the 2017-18 season.
Utilized citrus production in California increased 15 percent from the 2017-18 season. California's all orange production,
at 49.8 million boxes, is 13 percent higher than the previous season. Grapefruit production is down 16 percent from the
2017-18 season but tangerine and mandarin production is up 35 percent. Utilized production of citrus in Texas is
up 29 percent from the 2017-18 season. Orange production is up 33 percent from the previous season and grapefruit
production increased 27 percent. Total citrus production in Arizona’s lemon production is up 35 percent from last season.
The value of the 2018-19 United States citrus crop increased 1 percent from last season, to $3.35 billion (packinghouse-
door equivalent). Orange value of production decreased 7 percent from last season and grapefruit value is down 1 percent.
Tangerine and mandarin value of production is 31 percent higher than last season but lemon value of production is down
4 percent.
Overall comparisons discussed above are based on similar fruit types. The revised production and utilization estimates are
based on all data available at the end of the marketing season, including information from marketing orders, shipments,
and processor records. Allowances are made for recorded local utilization and home use. Estimates for the 2018-19
California Valencia oranges and grapefruit are preliminary, since the marketing season is not complete at publication
time. Revisions to the utilized production estimates for all citrus for the 2018-19 season will be published in the April
2020 Crop Production.

8 Citrus Fruits 2019 Summary (August 2019) USDA, National Agricultural Statistics Service
Citrus Acreage, Production, Utilization, and Value – States and United States: 2016-2017, 2017-2018, and 2018-2019
State and season Bearing acreage
Production Value of
production 1 Total Utilization
Fresh Processed
(acres) (1,000 tons) (1,000 tons) (1,000 tons) (1,000 dollars)
Arizona 2016-2017 ............................. 2017-2018 ............................. 2018-2019 ............................. California 2016-2017 ............................. 2017-2018 ............................. 2018-2019 ............................. Florida 2016-2017 ............................. 2017-2018 ............................. 2018-2019 ............................. Texas 2016-2017 ............................. 2017-2018 ............................. 2018-2019 ............................. United States 2016-2017 ............................. 2017-2018 ............................. 2018-2019 .............................
7,300 7,300 7,300
267,400 265,300 267,000
410,700 400,900 387,100
24,400 24,400 24,800
709,800 697,900 686,200
62 40 54
3,880 3,536 4,072
3,505 2,228 3,468
250 272 350
7,697 6,076 7,944
45 32 36
3,048 2,824 3,048
317 221 233
162 175 141
3,572 3,252 3,458
17 8
18
832 712
1,024
3,188 2,007 3,235
88 97
209
4,125 2,824 4,486
45,700 34,197 41,706
2,221,762 2,400,330 2,106,051
1,178,085 795,007
1,116,283
86,578 100,618 89,797
3,532,125 3,330,152 3,353,837
1 Packinghouse-door equivalents.

Citrus Fruits 2019 Summary (August 2019) 9 USDA, National Agricultural Statistics Service
Citrus Acreage, Production, Utilization, and Value by Crop – United States: 2016-2017, 2017-2018, and 2018-2019
Crop and season Bearing acreage
Production Value of
production 1 Total Utilization
Fresh Processed
(acres) (1,000 tons) (1,000 tons) (1,000 tons) (1,000 dollars)
Oranges Early, midseason, and Navel 2016-2017 ...................................................... 2017-2018 ...................................................... 2018-2019 ...................................................... Valencia 2016-2017 ...................................................... 2017-2018 ...................................................... 2018-2019 ...................................................... All oranges 2016-2017 ...................................................... 2017-2018 ...................................................... 2018-2019 ...................................................... Grapefruit 2 2016-2017 .......................................................... 2017-2018 .......................................................... 2018-2019 .......................................................... Lemons 2016-2017 .......................................................... 2017-2018 .......................................................... 2018-2019 .......................................................... Tangerines and mandarins 2016-2017 .......................................................... 2017-2018 .......................................................... 2018-2019 ..........................................................
286,100 278,600 274,100
241,400 238,900 235,800
527,500 517,500 509,900
59,600 54,800 49,700
54,300 54,300 54,300
68,400 71,300 72,300
3,103 2,354 3,094
1,985 1,521 2,233
5,088 3,875 5,327
698 509 564
882 888 966
1,029 804
1,087
1,430 1,343 1,325
350 316 329
1,780 1,659 1,654
402 298 282
701 680 704
689 615 818
1,673 1,011 1,769
1,635 1,205 1,904
3,308 2,216 3,673
296 211 282
181 208 262
340 189 269
1,170,847 1,196,646
977,274
772,831 633,799 727,125
1,943,678 1,830,445 1,704,399
256,917 207,970 206,541
763,446 715,761 685,708
568,084 575,976 757,189
1 Packinghouse-door equivalents. 2 Includes pummelos in California.

10 Citrus Fruits 2019 Summary (August 2019) USDA, National Agricultural Statistics Service
Orange Acreage, Yield, Utilization, Price, and Value by Type – States and United States: 2016-2017, 2017-2018, and 2018-2019 [See Statistical Methodology for net weight per box and price per box calculations]
State, type, and season
Bearing acreage
Yield per acre
Utilization of production Price per box 1 Value of production
Total Fresh Processed All Fresh Processed Total Fresh Processed
(acres) (boxes) (1,000 boxes)
(1,000 boxes)
(1,000 boxes)
(dollars) (dollars) (dollars) (1,000 dollars)
(1,000 dollars)
(1,000 dollars)
California Navel and miscellaneous 2016-2017 ......... 2017-2018 ......... 2018-2019 ......... Valencia 2016-2017 ......... 2017-2018 ......... 2018-2019 ......... All 2016-2017 ......... 2017-2018 ......... 2018-2019 ......... Florida Non-Valencia 2016-2017 ......... 2017-2018 ......... 2018-2019 ......... Valencia 2016-2017 ......... 2017-2018 ......... 2018-2019 ......... All 2016-2017 ......... 2017-2018 ......... 2018-2019 .........
122,000 118,000 118,000
30,000 29,000 29,000
152,000 147,000 147,000
158,300 154,400 149,800
209,200 207,400 204,300
367,500 361,800 354,100
322 304 346
300 286 310
318 301 339
208 123 203
171 126 202
187 125 203
39,300 35,900 40,800
9,000 8,300 9,000
48,300 44,200 49,800
33,000 18,950 30,400
35,850 26,100 41,350
68,850 45,050 71,750
33,100 30,900 30,600
7,000 5,900 6,500
40,100 36,800 37,100
1,503 1,316 1,504
1,300 1,443 1,261
2,803 2,759 2,765
6,200 5,000
10,200
2,000 2,400 2,500
8,200 7,400
12,700
31,497 17,634 28,896
34,550 24,657 40,089
66,047 42,291 68,985
17.97 25.36 14.23
20.25 22.00 9.99
18.39 24.73 13.46
13.56 13.70 12.40
16.27 16.95 15.29
14.98 15.58 14.07
(D) (D) (D)
(D) (D) (D)
(D) (D) (D)
21.20 23.05 20.05
20.90 22.85 18.25
21.06 22.95 19.23
(D) (D) (D)
(D) (D) (D)
(D) (D) (D)
13.20 13.00 12.00
16.10 16.60 15.20
14.72 15.10 13.86
706,121 910,492 580,584
182,210 182,560 89,945
888,331 1,093,052
670,529
447,624 259,576 376,907
583,425 442,279 632,366
1,031,049 701,855
1,009,273
(D) (D) (D)
(D) (D) (D)
(D) (D) (D)
31,864 30,334 30,155
27,170 32,973 23,013
59,034 63,307 53,168
(D) (D) (D)
(D) (D) (D)
(D) (D) (D)
415,760 229,242 346,752
556,255 409,306 609,353
972,015 638,548 956,105
See footnote(s) at end of table. --continued

Citrus Fruits 2019 Summary (August 2019) 11 USDA, National Agricultural Statistics Service
Orange Acreage, Yield, Utilization, Price, and Value by Type – States and United States: 2016-2017, 2017-2018, and 2018-2019 (continued) [See Statistical Methodology for net weight per box and price per box calculations]
State, type, and season
Bearing acreage
Yield per acre
Utilization of production Price per box 1 Value of production
Total Fresh Processed All Fresh Processed Total Fresh Processed
(acres) (boxes) (1,000 boxes)
(1,000 boxes)
(1,000 boxes)
(dollars) (dollars) (dollars) (1,000 dollars)
(1,000 dollars)
(1,000 dollars)
Texas Early and midseason 2016-2017 ........ 2017-2018 ........ 2018-2019 ........ Valencia 2016-2017 ........ 2017-2018 ........ 2018-2019 ........ All 2016-2017 ........ 2017-2018 ........ 2018-2019 ........ United States Early, midseason, and Navel 2016-2017 ........ 2017-2018 ........ 2018-2019 ........ Valencia 2016-2017 ........ 2017-2018 ........ 2018-2019 ........ All 2016-2017 ........ 2017-2018 ........ 2018-2019 ........
5,800 6,200 6,300
2,200 2,500 2,500
8,000 8,700 8,800
286,100 278,600 274,100
241,400 238,900 235,800
527,500 517,500 509,900
188 247 351
127 140 116
171 216 284
257 202 268
187 145 215
225 176 243
1,090 1,530 2,210
280 350 290
1,370 1,880 2,500
73,390 56,380 73,410
45,130 34,750 50,640
118,520 91,130
124,050
900 1,140
780
280 350 290
1,180 1,490 1,070
35,503 33,356 32,884
8,580 7,693 8,051
44,083 41,049 40,935
190 390
1,430
- - -
190 390
1,430
37,887 23,024 40,526
36,550 27,057 42,589
74,437 50,081 83,115
15.69 17.37 8.95
25.70 25.60 16.60
17.74 18.90 9.84
15.83 20.92 13.26
17.05 18.14 14.44
16.30 19.82 13.76
(D) (D) (D)
(D) (D) (D)
(D) (D) (D)
21.10 28.85 19.18
24.00 27.49 14.42
21.67 28.59 18.23
(D) (D) (D)
(D) (D) (D)
(D) (D) (D)
11.32 10.36 8.83
15.56 15.68 14.45
13.42 13.25 11.74
17,102 26,578 19,783
7,196 8,960 4,814
24,298 35,538 24,597
1,170,847 1,196,646
977,274
772,831 633,799 727,125
1,943,678 1,830,445 1,704,399
(D) (D) (D)
(D) (D) (D)
(D) (D) (D)
749,241 963,826 630,383
206,356 212,325 115,447
955,597 1,176,151
745,830
(D) (D) (D)
(D) (D) (D)
(D) (D) (D)
421,606 232,820 346,891
566,475 421,474 611,678
988,081 654,294 958,569
- Represents zero. (D) Withheld to avoid disclosing data for individual operations. 1 Equivalent packinghouse-door returns.

12 Citrus Fruits 2019 Summary (August 2019) USDA, National Agricultural Statistics Service
480
520
560
600
640
680
2009 2010 2011 2012 2013 2014 2015 2016 2017 2018 2019
Thousand acres
Bearing Acres of Oranges – United States
0
3
6
9
12
2009 2010 2011 2012 2013 2014 2015 2016 2017 2018 2019
Million tons
Utilized Orange Production – United States

Citrus Fruits 2019 Summary (August 2019) 13 USDA, National Agricultural Statistics Service
Grapefruit Acreage, Yield, Utilization, Price, and Value by Type – States and United States: 2016-2017, 2017-2018, and 2018-2019 [See Statistical Methodology for net weight per box and price per box calculations]
State, type, and season
Bearing acreage
Yield per acre
Utilization of production Price per box 1 Value of production
Total Fresh Processed All Fresh Processed Total Fresh Processed
(acres) (boxes) (1,000 boxes)
(1,000 boxes)
(1,000 boxes)
(dollars) (dollars) (dollars) (1,000 dollars)
(1,000 dollars)
(1,000 dollars)
California 2 2016-2017 ............. 2017-2018 ............. 2018-2019 ............. Florida White 3 2016-2017 ......... 2017-2018 ......... 2018-2019 ......... Red 2016-2017 ......... 2017-2018 ......... 2018-2019 ......... All 2016-2017 ......... 2017-2018 ......... 2018-2019 ......... Texas 2016-2017 ............. 2017-2018 ............. 2018-2019 ............. United States 2 2016-2017 ............. 2017-2018 ............. 2018-2019 .............
9,400 9,300 9,000
8,100 6,300 4,300
25,700 23,500 20,400
33,800 29,800 24,700
16,400 15,700 16,000
59,600 54,800 49,700
468 409 356
183 111 179
244 135 183
230 130 183
293 306 381
285 228 278
4,400 3,800 3,200
1,480 700 770
6,280 3,180 3,740
7,760 3,880 4,510
4,800 4,800 6,100
16,960 12,480 13,810
3,500 2,800 2,600
406 189 221
3,131 1,555 1,700
3,537 1,744 1,921
2,800 2,800 2,400
9,837 7,344 6,921
900
1,000 600
1,074 511 549
3,149 1,625 2,040
4,223 2,136 2,589
2,000 2,000 3,700
7,123 5,136 6,889
19.01 18.34 17.49
12.99 16.81 18.98
14.61 19.32 18.92
14.30 18.87 18.93
12.98 13.56 10.69
15.12 16.71 15.04
(D) (D) (D)
21.65 28.45 31.35
18.75 26.55 25.55
19.08 26.76 26.22
(D) (D) (D)
21.14 23.88 23.77
(D) (D) (D)
9.71 12.50 14.00
10.50 12.40 13.40
10.30 12.42 13.53
(D) (D) (D)
6.93 6.56 6.31
83,647 69,690 55,956
19,219 11,765 14,614
91,771 61,435 70,771
110,990 73,200 85,385
62,280 65,080 65,200
256,917 207,970 206,541
(D) (D) (D)
8,790 5,377 6,928
58,706 41,285 43,435
67,496 46,662 50,363
(D) (D) (D)
208,441 175,042 164,243
(D) (D) (D)
10,429 6,388 7,686
33,065 20,150 27,336
43,494 26,538 35,022
(D) (D) (D)
48,476 32,928 42,298
(D) Withheld to avoid disclosing data for individual operations. 1 Equivalent packinghouse-door returns. 2 Includes pummelos in California. 3 Includes seedy grapefruit.
14 Citrus Fruits 2019 Summary (August 2019) USDA, National Agricultural Statistics Service
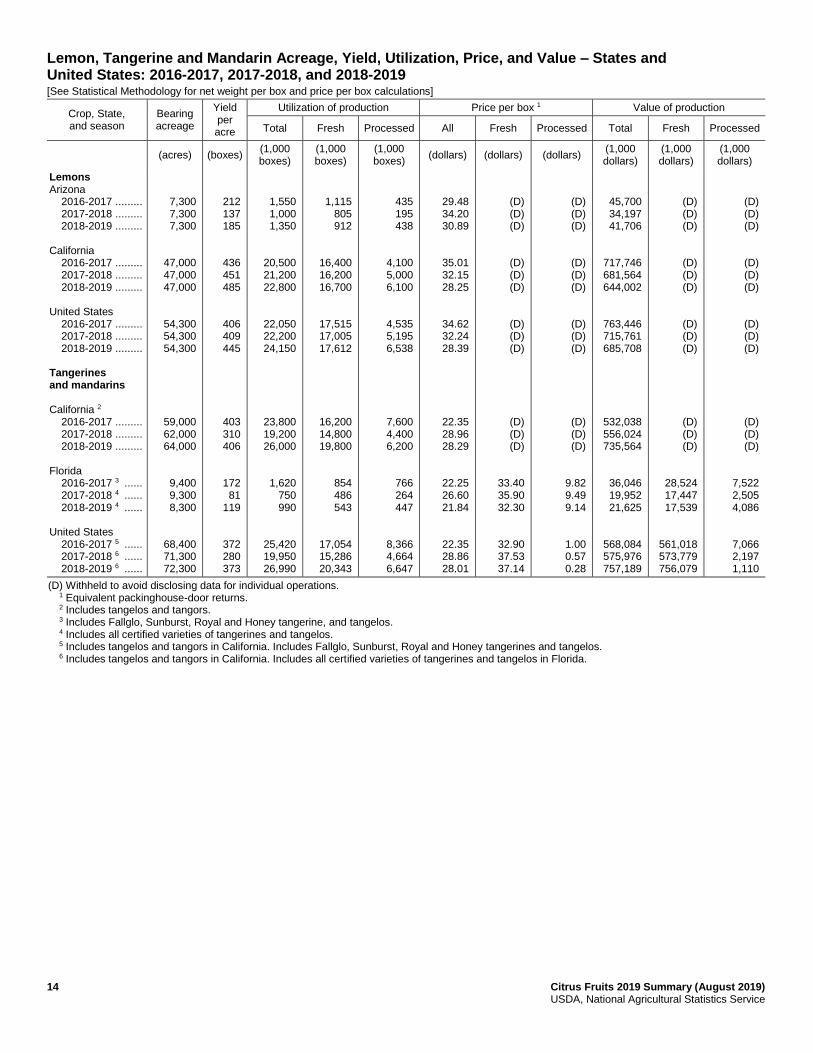
Lemon, Tangerine and Mandarin Acreage, Yield, Utilization, Price, and Value – States and United States: 2016-2017, 2017-2018, and 2018-2019 [See Statistical Methodology for net weight per box and price per box calculations]
Crop, State, and season
Bearing acreage
Yield per acre
Utilization of production Price per box 1 Value of production
Total Fresh Processed All Fresh Processed Total Fresh Processed
(acres) (boxes) (1,000 boxes)
(1,000 boxes)
(1,000 boxes)
(dollars) (dollars) (dollars) (1,000 dollars)
(1,000 dollars)
(1,000 dollars)
Lemons Arizona 2016-2017 ......... 2017-2018 ......... 2018-2019 ......... California 2016-2017 ......... 2017-2018 ......... 2018-2019 ......... United States 2016-2017 ......... 2017-2018 ......... 2018-2019 ......... Tangerines and mandarins California 2 2016-2017 ......... 2017-2018 ......... 2018-2019 ......... Florida 2016-2017 3 ...... 2017-2018 4 ...... 2018-2019 4 ...... United States 2016-2017 5 ...... 2017-2018 6 ...... 2018-2019 6 ......
7,300 7,300 7,300
47,000 47,000 47,000
54,300 54,300 54,300
59,000 62,000 64,000
9,400 9,300 8,300
68,400 71,300 72,300
212 137 185
436 451 485
406 409 445
403 310 406
172 81
119
372 280 373
1,550 1,000 1,350
20,500 21,200 22,800
22,050 22,200 24,150
23,800 19,200 26,000
1,620 750 990
25,420 19,950 26,990
1,115 805 912
16,400 16,200 16,700
17,515 17,005 17,612
16,200 14,800 19,800
854 486 543
17,054 15,286 20,343
435 195 438
4,100 5,000 6,100
4,535 5,195 6,538
7,600 4,400 6,200
766 264 447
8,366 4,664 6,647
29.48 34.20 30.89
35.01 32.15 28.25
34.62 32.24 28.39
22.35 28.96 28.29
22.25 26.60 21.84
22.35 28.86 28.01
(D) (D) (D)
(D) (D) (D)
(D) (D) (D)
(D) (D) (D)
33.40 35.90 32.30
32.90 37.53 37.14
(D) (D) (D)
(D) (D) (D)
(D) (D) (D)
(D) (D) (D)
9.82 9.49 9.14
1.00 0.57 0.28
45,700 34,197 41,706
717,746 681,564 644,002
763,446 715,761 685,708
532,038 556,024 735,564
36,046 19,952 21,625
568,084 575,976 757,189
(D) (D) (D)
(D) (D) (D)
(D) (D) (D)
(D) (D) (D)
28,524 17,447 17,539
561,018 573,779 756,079
(D) (D) (D)
(D) (D) (D)
(D) (D) (D)
(D) (D) (D)
7,522 2,505 4,086
7,066 2,197 1,110
(D) Withheld to avoid disclosing data for individual operations. 1 Equivalent packinghouse-door returns. 2 Includes tangelos and tangors. 3 Includes Fallglo, Sunburst, Royal and Honey tangerine, and tangelos. 4 Includes all certified varieties of tangerines and tangelos. 5 Includes tangelos and tangors in California. Includes Fallglo, Sunburst, Royal and Honey tangerines and tangelos. 6 Includes tangelos and tangors in California. Includes all certified varieties of tangerines and tangelos in Florida.

Citrus Fruits 2019 Summary (August 2019) 15 USDA, National Agricultural Statistics Service
Citrus Prices
Revised State and United States monthly average prices and equivalent returns, and marketing year average prices for the
2017-18 and 2018-19 citrus crops are shown on the following pages. Revised monthly prices refer to all fruit sold in a
given month regardless of the crop year in which the fruit was harvested.
Marketing year average prices refer to the prices received by growers for the entire marketing season for any one crop
year. The crop year 2018-19 as shown on all citrus tables in this publication refers to the crop which bloomed in 2018 and
was marketed during the 2018-19 season. For example, the 2018-19 marketing year average price received by Florida
growers for grapefruit refers to marketings from September 2018 through June 2019. In some years the season may vary a
month or two, but a price was estimated only for those months with sufficient movement.
Monthly and marketing year average prices are weighted by box size at the United States level for oranges, grapefruit, and
tangerines and mandarins. See page 32 for approximate net contents per box at the State level.
Citrus prices are based on weighted average F.O.B. packed prices received for fresh fruit and weighted average prices
received at the processing plant door for processing fruit. Equivalent returns for fresh and processed fruits are calculated
at the packinghouse-door level and on-tree level by deducting hauling, picking, sorting, grading, packing, cooling,
marketing, and other costs from the two base prices. In some cases, this results in negative returns.

16 Citrus Fruits 2019 Summary (August 2019) USDA, National Agricultural Statistics Service
Orange Average Prices and Equivalent Returns by Type and Season – California: 2017-2018 and 2018-2019 [Only months with reported prices in a given crop year are listed]
Crop, season and month
FOB packed fresh
Equivalent returns
Packinghouse door On-tree
All Fresh Process All Fresh Process
(dollars per box) (dollars per box) (dollars per box) (dollars per box) (dollars per box) (dollars per box) (dollars per box)
Oranges, all 2017-2018 September ........... October ................ November ............ December ............ January ................ February .............. March ................... April ..................... May ...................... June ..................... July ...................... August ................. 2018-2019 September ........... October ................ November ............ December ............ January ................ February .............. March ................... April ..................... May ...................... June ..................... July ...................... Navel and miscellaneous 2017-2018 October ................ November ............ December ............ January ................ February .............. March ................... April ..................... May ...................... June ..................... 2018-2019 October ................ November ............ December ............ January ................ February .............. March ................... April ..................... May ...................... June .....................
41.30 (D)
40.70 38.40 38.90 39.00 37.90 37.80 39.60 42.00 39.40 39.60
41.90 36.80 32.90 32.50 29.00 27.70 28.40 27.10 26.00 25.10 23.70
(D) 40.70 38.40 38.90 39.00 37.90 38.10 41.60 43.70
(D) 32.90 32.50 29.00 27.70 28.40 27.60 26.90 27.00
23.63 (D)
27.85 25.81 25.87 25.74 23.28 22.38 23.63 26.37 23.38 20.89
23.01 22.78 20.60 18.67 15.28 13.12 14.39 12.08 10.11 7.11 9.60
(D) 27.85 25.81 25.87 25.74 23.28 22.66 24.77 29.63
(D) 20.60 18.67 15.28 13.12 14.39 12.12 10.06 5.77
31.57 (D)
30.78 28.48 28.98 29.08 27.98 27.88 29.69 32.07 29.48 29.68
31.98 26.73 22.78 22.38 18.88 17.58 18.28 17.02 15.88 14.93 13.58
(D) 30.78 28.48 28.98 29.08 27.98 28.18 31.68 33.78
(D) 22.78 22.38 18.88 17.58 18.28 17.48 16.78 16.88
(D) (D) (D) (D) (D) (D) (D) (D) (D) (D) (D) (D)
(D) (D) (D) (D) (D) (D) (D) (D) (D) (D) (D)
(D) (D) (D) (D) (D) (D) (D) (D) (D)
(S) (D) (D) (D) (D) (D) (D) (D) (D)
20.87 (D)
25.07 23.03 23.09 22.96 20.49 19.58 20.82 23.57 20.57 18.06
20.18 19.95 17.76 15.81 12.42 10.25 11.52 9.21 7.22 4.19 6.71
(D) 25.07 23.03 23.09 22.96 20.49 19.86 21.96 26.84
(D) 17.76 15.81 12.42 10.25 11.52 9.24 7.16 2.82
28.86 (D)
28.02 25.72 26.22 26.32 25.22 25.12 26.93 29.31 26.72 26.92
29.22 23.93 19.96 19.56 16.06 14.76 15.46 14.20 13.06 12.11 10.76
(D) 28.02 25.72 26.22 26.32 25.22 25.42 28.92 31.02
(D) 19.96 19.56 16.06 14.76 15.46 14.66 13.96 14.06
(D) (D) (D) (D) (D) (D) (D) (D) (D) (D) (D) (D)
(D) (D) (D) (D) (D) (D) (D) (D) (D) (D) (D)
(D) (D) (D) (D) (D) (D) (D) (D) (D)
(S) (D) (D) (D) (D) (D) (D) (D) (D)
See footnote(s) at end of table. --continued

Citrus Fruits 2019 Summary (August 2019) 17 USDA, National Agricultural Statistics Service
Orange Average Prices and Equivalent Returns by Type and Season – California: 2017-2018 and 2018-2019 (continued) [Only months with reported prices in a given crop year are listed]
Crop, season and month
FOB packed fresh
Equivalent returns
Packinghouse door On-tree
All Fresh Process All Fresh Process
(dollars per box) (dollars per box) (dollars per box) (dollars per box) (dollars per box) (dollars per box) (dollars per box)
Valencia 2018 April ..................... May ..................... June .................... July ...................... August ................. September ........... October ................ 2019 April ..................... May ..................... June .................... July ......................
(D) 35.80 39.60 39.40 39.60 41.90 40.00
(D) (D)
23.10 23.70
(D) 21.42 22.65 23.38 20.89 23.01 21.74
(D) (D)
9.67 9.60
(D) 25.88 29.68 29.48 29.68 31.98 30.08
(D) (D)
12.98 13.58
(D) (D) (D) (D) (D) (D) (D)
(D) (D) (D) (D)
(D) 18.62 19.83 20.57 18.06 20.18 18.92
(D) (D)
6.79 6.71
(D) 23.12 26.92 26.72 26.92 29.22 27.32
(D) (D)
10.16 10.76
(D) (D) (D) (D) (D) (D) (D)
(D) (D) (D) (D)
(D) Withheld to avoid disclosing data for individual operations. (S) Insufficient number of reports to establish an estimate.

18 Citrus Fruits 2019 Summary (August 2019) USDA, National Agricultural Statistics Service
Orange Average Prices and Equivalent Returns by Type and Season – Florida: 2017-2018 and 2018-2019 [Only months with reported prices in a given crop year are listed]
Crop, season and month
FOB packed fresh
Equivalent returns
Packinghouse door On-tree
All Fresh Process All Fresh Process
(dollars per box) (dollars per box) (dollars per box) (dollars per box) (dollars per box) (dollars per box) (dollars per box)
Oranges, all 2017-2018 September ............... October .................... November ................ December ................ January .................... February .................. March ....................... April ......................... May .......................... June ......................... July .......................... August ..................... 2018-2019 September ............... October .................... November ................ December ................ January .................... February .................. March ....................... April ......................... May .......................... June ......................... July .......................... Non-Valencia 2017-2018 September ............... October .................... November ................ December ................ January .................... February .................. March ....................... 2018-2019 September ............... October .................... November ................ December ................ January .................... February .................. March .......................
(S) 39.80 35.50 33.60 33.00 33.90 33.50 34.00 35.70 35.70 35.70
(S)
(S) 34.90 34.30 30.80 30.10 28.00 30.20 28.60 28.90 29.40
(S)
(S) 39.80 35.50 33.60 32.30 31.50
(S)
(S) 34.90 34.30 30.80 30.10 25.20
(S)
(S) (S)
14.11 13.44 13.53 17.27 16.67 16.76 17.09
(S) (S) (S)
(S) (S)
14.26 11.80 12.38 12.86 14.86 15.15 15.55 15.79
(S)
(S) (S)
14.11 13.44 13.42
(S) (S)
(S) (S)
14.26 11.80 12.37 12.64
(S)
(S) 27.95 23.65 21.75 21.16 22.01 21.70 22.15 23.85 23.85 23.85
(S)
(S) 23.55 22.95 19.45 18.79 16.63 18.86 17.25 17.55 18.05
(S)
(S) 27.95 23.65 21.75 20.45 19.65
(S)
(S) 23.55 22.95 19.45 18.75 13.85
(S)
(S) (S)
12.60 13.10 13.12 15.57 16.48 16.60 16.60
(S) (S) (S)
(S) (S)
10.50 11.50 12.20 12.67 14.74 15.10 15.50 15.60
(S)
(S) (S)
12.60 13.10 13.10
(S) (S)
(S) (S)
10.50 11.50 12.20 12.60
(S)
(S) (S)
10.83 10.18 10.28 14.11 13.62 13.71 14.03
(S) (S) (S)
(S) (S)
11.00 8.60 9.17 9.66
11.80 12.10 12.49 12.72
(S)
(S) (S)
10.83 10.18 10.16
(S) (S)
(S) (S)
11.00 8.60 9.17 9.43
(S)
(S) 24.50 20.20 18.30 17.73 18.67 18.40 18.85 20.55 20.55 20.55
(S)
(S) 20.15 19.55 16.05 15.39 13.28 15.61 14.00 14.30 14.80
(S)
(S) 24.50 20.20 18.30 17.00 16.20
(S)
(S) 20.15 19.55 16.05 15.35 10.45
(S)
(S) (S)
9.35 9.85 9.88
12.47 13.43 13.55 13.55
(S) (S) (S)
(S) (S)
7.30 8.30 9.00 9.48
11.69 12.05 12.45 12.55
(S)
(S) (S)
9.35 9.85 9.85
(S) (S)
(S) (S)
7.30 8.30 9.00 9.40
(S)
See footnote(s) at end of table. --continued

Citrus Fruits 2019 Summary (August 2019) 19 USDA, National Agricultural Statistics Service
Orange Average Prices and Equivalent Returns by Type and Season – Florida: 2017-2018 and 2018-2019 (continued) [Only months with reported prices in a given crop year are listed]
Crop, season and month
FOB packed fresh
Equivalent returns
Packinghouse door On-tree
All Fresh Process All Fresh Process
(dollars per box) (dollars per box) (dollars per box) (dollars per box) (dollars per box) (dollars per box) (dollars per box)
Valencia 2018 January .................... February .................. March ...................... April ......................... May ......................... June ........................ July .......................... August ..................... 2019 January .................... February .................. March ...................... April ......................... May ......................... June ........................ July ..........................
37.00 34.60 33.60 34.00 35.70 35.70 35.70
(S)
(S) 32.60 30.40 28.60 28.90 29.40 29.30
(S) 18.07 16.69 16.76 17.09
(S) (S) (S)
(S) (S)
14.92 15.15 15.55 15.79
(S)
25.15 22.75 21.75 22.15 23.85 23.85 23.85
(S)
(S) 21.25 19.05 17.25 17.55 18.05 17.95
(S) 16.30 16.50 16.60 16.60
(S) (S) (S)
(S) (S)
14.80 15.10 15.50 15.60
(S)
(S) 14.95 13.63 13.71 14.03
(S) (S) (S)
(S) (S)
11.86 12.10 12.49 12.72
(S)
21.85 19.45 18.45 18.85 20.55 20.55 20.55
(S)
(S) 18.00 15.80 14.00 14.30 14.80 14.70
(S) 13.25 13.45 13.55 13.55
(S) (S) (S)
(S) (S)
11.75 12.05 12.45 12.55
(S)
(S) Insufficient number of reports to establish an estimate.

20 Citrus Fruits 2019 Summary (August 2019) USDA, National Agricultural Statistics Service
Orange Average Prices and Equivalent Returns by Type and Season – Texas: 2017-2018 and 2018-2019 [Only months with reported prices in a given crop year are listed]
Crop, season and month
FOB packed fresh
Equivalent returns
Packinghouse door On-tree
All Fresh Process All Fresh Process
(dollars per box) (dollars per box) (dollars per box) (dollars per box) (dollars per box) (dollars per box) (dollars per box)
Oranges, all 2017-2018 October .................... November ................ December ................ January .................... February .................. March ....................... April ......................... May .......................... 2018-2019 November ................ December ................ January .................... February .................. March ....................... April ......................... May .......................... Early and midseason 2017-2018 October .................... November ................ December ................ January .................... February .................. March ....................... April ......................... May .......................... 2018-2019 November ................ December ................ January .................... February .................. March ....................... April ......................... May .......................... Valencia 2018 March ....................... April ......................... May .......................... 2019 February .................. March ....................... April ......................... May ..........................
39.30 42.50 29.90 30.40 30.90 36.00 36.60 36.50
32.80 31.40 33.30 33.30 28.30 28.40 27.90
39.30 42.50 29.90 30.40 30.90 30.90
(S) (S)
32.80 31.40 33.30 33.30
(S) (S) (S)
37.20 37.20 37.20
(S) 27.90 27.90 27.90
25.28 25.81 16.14 14.94 13.96 19.56 19.10 20.59
16.35 12.81 13.89 13.49 13.38 12.63
(D)
25.28 25.81 16.14 14.94 13.96 8.99 6.20
(S)
16.35 12.81 13.89 12.47
(D) (D) (D)
25.60 25.60 25.60
(S) 16.30 16.30 16.30
27.70 30.90 18.30 18.80 19.30 24.45 24.96 24.93
21.20 19.80 21.70 21.70 16.71 16.84 16.30
27.70 30.90 18.30 18.80 19.30 19.30
(S) (S)
21.20 19.80 21.70 21.70
(S) (S) (S)
25.60 25.60 25.60
(S) 16.30 16.30 16.30
(D) (D) (D) (D) (D) (D) (D) (D)
(D) (D) (D) (D) (D) (D) (D)
(D) (D) (D) (D) (D) (D) (D) (D)
(D) (D) (D) (D) (D) (D) (D)
(S) (S) (S)
(S) (S) (S) (S)
23.46 24.01 14.34 13.15 12.19 17.76 17.32 18.80
14.56 11.05 12.13 11.73 11.59 10.85
(D)
23.46 24.01 14.34 13.15 12.19 7.27 4.50
(S)
14.56 11.05 12.13 10.72
(D) (D) (D)
23.77 23.77 23.77
(S) 14.47 14.47 14.47
25.87 29.07 16.47 16.97 17.47 22.62 23.13 23.10
19.37 17.97 19.87 19.87 14.88 15.01 14.47
25.87 29.07 16.47 16.97 17.47 17.47
(S) (S)
19.37 17.97 19.87 19.87
(S) (S) (S)
23.77 23.77 23.77
(S) 14.47 14.47 14.47
(D) (D) (D) (D) (D) (D) (D) (D)
(D) (D) (D) (D) (D) (D) (D)
(D) (D) (D) (D) (D) (D) (D) (D)
(D) (D) (D) (D) (D) (D) (D)
(S) (S) (S)
(S) (S) (S) (S)
(D) Withheld to avoid disclosing data for individual operations. (S) Insufficient number of reports to establish an estimate.
Citrus Fruits 2019 Summary (August 2019) 21 USDA, National Agricultural Statistics Service
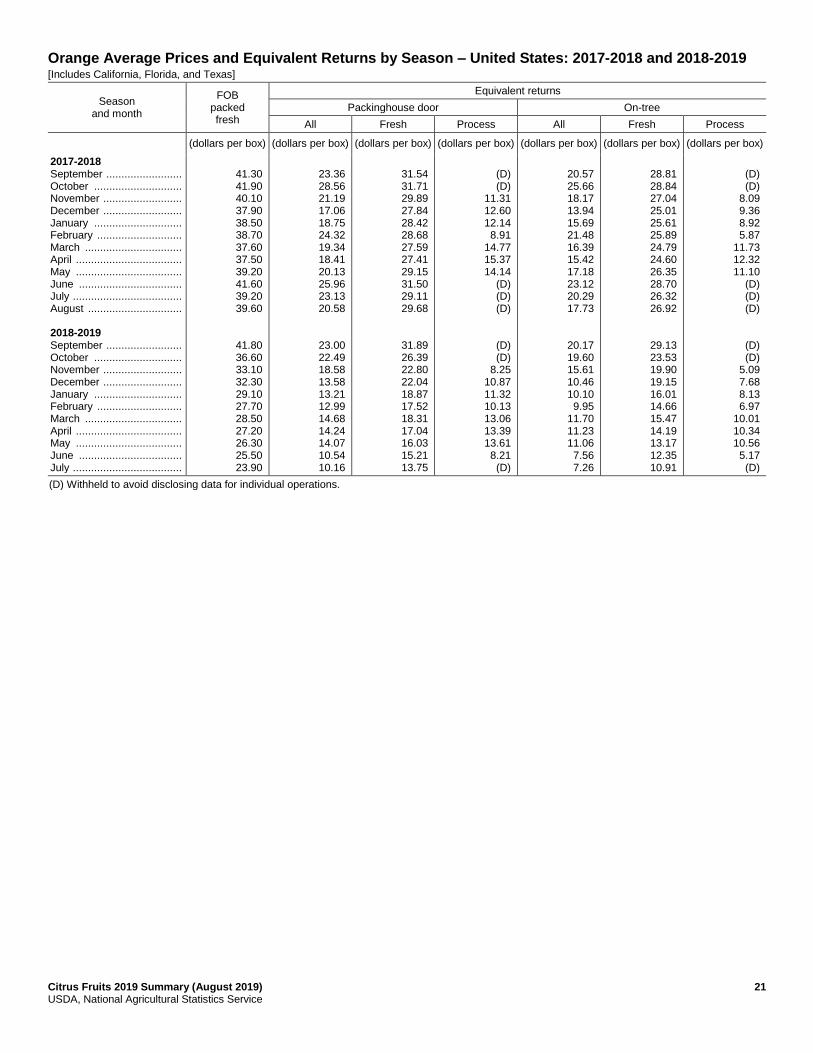
Orange Average Prices and Equivalent Returns by Season – United States: 2017-2018 and 2018-2019 [Includes California, Florida, and Texas]
Season and month
FOB packed fresh
Equivalent returns
Packinghouse door On-tree
All Fresh Process All Fresh Process
(dollars per box) (dollars per box) (dollars per box) (dollars per box) (dollars per box) (dollars per box) (dollars per box)
2017-2018 September ......................... October ............................. November .......................... December .......................... January ............................. February ............................ March ................................ April ................................... May ................................... June .................................. July .................................... August ............................... 2018-2019 September ......................... October ............................. November .......................... December .......................... January ............................. February ............................ March ................................ April ................................... May ................................... June .................................. July ....................................
41.30 41.90 40.10 37.90 38.50 38.70 37.60 37.50 39.20 41.60 39.20 39.60
41.80 36.60 33.10 32.30 29.10 27.70 28.50 27.20 26.30 25.50 23.90
23.36 28.56 21.19 17.06 18.75 24.32 19.34 18.41 20.13 25.96 23.13 20.58
23.00 22.49 18.58 13.58 13.21 12.99 14.68 14.24 14.07 10.54 10.16
31.54 31.71 29.89 27.84 28.42 28.68 27.59 27.41 29.15 31.50 29.11 29.68
31.89 26.39 22.80 22.04 18.87 17.52 18.31 17.04 16.03 15.21 13.75
(D) (D)
11.31 12.60 12.14 8.91
14.77 15.37 14.14
(D) (D) (D)
(D) (D)
8.25 10.87 11.32 10.13 13.06 13.39 13.61 8.21 (D)
20.57 25.66 18.17 13.94 15.69 21.48 16.39 15.42 17.18 23.12 20.29 17.73
20.17 19.60 15.61 10.46 10.10 9.95
11.70 11.23 11.06 7.56 7.26
28.81 28.84 27.04 25.01 25.61 25.89 24.79 24.60 26.35 28.70 26.32 26.92
29.13 23.53 19.90 19.15 16.01 14.66 15.47 14.19 13.17 12.35 10.91
(D) (D)
8.09 9.36 8.92 5.87
11.73 12.32 11.10
(D) (D) (D)
(D) (D)
5.09 7.68 8.13 6.97
10.01 10.34 10.56 5.17 (D)
(D) Withheld to avoid disclosing data for individual operations.

22 Citrus Fruits 2019 Summary (August 2019) USDA, National Agricultural Statistics Service
Grapefruit Average Prices and Equivalent Returns by Season – California: 2017-2018 and 2018-2019 [Includes pummelos]
Season and month
FOB packed fresh
Equivalent returns
Packinghouse door On-tree
All Fresh Process All Fresh Process
(dollars per box) (dollars per box) (dollars per box) (dollars per box) (dollars per box) (dollars per box) (dollars per box)
2017-2018 November ................ December ................ January .................... February .................. March ....................... April ......................... May .......................... June ......................... July .......................... August ..................... September ............... October .................... 2018-2019 November ................ December ................ January .................... February .................. March ....................... April ......................... May .......................... June ......................... July ..........................
(D) (D) (D) (D) (D) (D) (D) (D) (D) (D) (D) (D)
(D) (D) (D) (D) (D) (D) (D) (D) (D)
23.35 23.25 24.65 21.60 20.52 20.79 19.69 17.22 16.18 12.67 17.66 17.30
23.60 24.20 22.60 20.21 15.88 16.64 16.78 14.83 14.23
(D) (D) (D) (D) (D) (D) (D) (D) (D) (D) (D) (D)
(D) (D) (D) (D) (D) (D) (D) (D) (D)
(S) (S) (S) (S) (D) (D) (D) (D) (D) (D) (D) (D)
(S) (S) (S) (S) (D) (D) (D) (D) (D)
20.94 20.84 22.24 19.06 17.82 18.12 16.98 14.35 13.34 9.57
14.80 14.48
21.14 21.74 20.14 17.62 13.12 13.92 14.02 11.92 11.34
(D) (D) (D) (D) (D) (D) (D) (D) (D) (D) (D) (D)
(D) (D) (D) (D) (D) (D) (D) (D) (D)
(S) (S) (S) (S) (D) (D) (D) (D) (D) (D) (D) (D)
(S) (S) (S) (S) (D) (D) (D) (D) (D)
(D) Withheld to avoid disclosing data for individual operations. (S) Insufficient number of reports to establish an estimate.

Citrus Fruits 2019 Summary (August 2019) 23 USDA, National Agricultural Statistics Service
Grapefruit Average Prices and Equivalent Returns by Type and Season – Florida: 2017-2018 and 2018-2019 [Only months with reported prices in a given crop year are listed]
Type, season and month
FOB packed fresh
Equivalent returns
Packinghouse door On-tree
All Fresh Process All Fresh Process
(dollars per
box) (dollars per
box) (dollars per
box) (dollars per
box) (dollars per
box) (dollars per
box) (dollars per
box)
Grapefruit, all 2017-2018 September ......................... October .............................. November .......................... December .......................... January .............................. February ............................ March ................................ April ................................... May ................................... 2018-2019 September ......................... October .............................. November .......................... December .......................... January .............................. February ............................ March ................................ April ................................... May ................................... June .................................. Grapefruit, white 1 2017-2018 October .............................. November .......................... December .......................... January .............................. February ............................ March ................................ April ................................... May ................................... 2018-2019 October .............................. November .......................... December .......................... January .............................. February ............................ March ................................ April ...................................
(S) 42.60 39.40 36.90 36.80 36.80 36.50
(S) (S)
(S) 43.60 39.10 37.10 35.50 34.70 33.10 35.50
(S) (S)
40.40 44.00 38.00 39.80 35.30
(S) (S) (S)
44.20 45.20 43.00 40.60 39.60 39.60
(S)
(S) 25.70 22.05 17.82 17.68 17.81 18.02
(S) (S)
(S) 29.42 23.83 20.91 18.74 17.57 14.51 16.00
(S) (S)
(S) 20.55 15.82 16.73 15.76
(S) (S) (S)
(S) 26.47 22.06 19.46 17.33 14.49
(S)
(S) 31.43 28.23 25.73 25.61 25.63 25.35
(S) (S)
(S) 32.99 28.49 26.42 24.83 24.09 22.44 24.85
(S) (S)
29.25 32.85 26.85 28.65 24.15
(S) (S) (S)
33.55 34.55 32.35 29.95 28.95 28.95
(S)
(S) 10.45 11.97 12.14 12.26 13.37 13.48
(S) (S)
(S) 13.00 13.08 13.90 14.45 14.60 12.16 10.89
(S) (S)
(S) 12.20 11.70 12.40 14.00 13.30
(S) (S)
(S) 13.00 13.90 13.90 14.30 13.90
(S)
(S) 22.65 18.94 14.54 14.40 14.48 14.68
(S) (S)
(S) 26.49 20.81 17.80 15.53 14.31 11.19 12.74
(S) (S)
(S) 17.40 12.60 13.52 12.49
(S) (S) (S)
(S) 23.50 19.01 16.37 14.17 11.26
(S)
(S) 28.62 25.43 22.92 22.81 22.82 22.55
(S) (S)
(S) 30.19 25.69 23.62 22.03 21.29 19.64 22.05
(S) (S)
26.40 30.00 24.00 25.80 21.30
(S) (S) (S)
30.75 31.75 29.55 27.15 26.15 26.15
(S)
(S) 6.77 8.35 8.53 8.66 9.74 9.81
(S) (S)
(S) 9.48 9.58
10.41 10.96 11.12 8.68 7.36
(S) (S)
(S) 8.85 8.35 9.05
10.65 9.95
(S) (S)
(S) 9.75
10.65 10.65 11.05 10.65
(S)
See footnote(s) at end of table. --continued

24 Citrus Fruits 2019 Summary (August 2019) USDA, National Agricultural Statistics Service
Grapefruit Average Prices and Equivalent Returns by Type and Season – Florida: 2017-2018 and 2018-2019 (continued) [Only months with reported prices in a given crop year are listed]
Type, season and month
FOB packed fresh
Equivalent returns
Packinghouse door On-tree
All Fresh Process All Fresh Process
(dollars per
box) (dollars per
box) (dollars per
box) (dollars per
box) (dollars per
box) (dollars per
box) (dollars per
box)
Grapefruit, red 2017-2018 September ........................ October ............................. November ......................... December ......................... January ............................. February ........................... March ................................ April .................................. 2018-2019 September ........................ October ............................. November ......................... December ......................... January ............................. February ........................... March ................................ April .................................. May ................................... June ..................................
(S) 42.70 38.90 36.70 36.20 36.90 36.50
(S)
(S) 43.60 38.30 36.20 34.50 33.90 32.90 35.50
(S) (S)
(S) 25.77 22.30 18.36 17.98 18.21 18.30
(S)
(S) 29.55 23.41 20.69 18.57 17.64 14.52 16.09
(S) (S)
(S) 31.55 27.75 25.55 25.05 25.75 25.35
(S)
(S) 32.95 27.65 25.55 23.85 23.25 22.25 24.85
(S) (S)
(S) 10.40 11.90 12.30 12.20 13.20 13.50
(S)
(S) 13.00 13.10 13.90 14.60 14.70 11.70 10.70
(S) (S)
(S) 22.73 19.20 15.07 14.68 14.87 14.96
(S)
(S) 26.62 20.39 17.57 15.34 14.35 11.17 12.82
(S) (S)
(S) 28.75 24.95 22.75 22.25 22.95 22.55
(S)
(S) 30.15 24.85 22.75 21.05 20.45 19.45 22.05
(S) (S)
(S) 6.70 8.20 8.60 8.50 9.50 9.80
(S)
(S) 9.45 9.55
10.35 11.05 11.15 8.15 7.15
(S) (S)
(S) Insufficient number of reports to establish an estimate. 1 Includes seedy grapefruit.

Citrus Fruits 2019 Summary (August 2019) 25 USDA, National Agricultural Statistics Service
Grapefruit Average Prices and Equivalent Returns by Season – Texas: 2017-2018 and 2018-2019 [Only months with reported prices in a given crop year are listed]
Season and month
FOB packed fresh
Equivalent returns
Packinghouse door On-tree
All Fresh Process All Fresh Process
(dollars per box) (dollars per box) (dollars per box) (dollars per box) (dollars per box) (dollars per box) (dollars per box)
2017-2018 October ................... November ................ December ................ January ................... February .................. March ...................... April ......................... May ......................... 2018-2019 November ................ December ................ January ................... February .................. March ...................... April ......................... May .........................
45.30 36.50 30.70 34.30 32.30 32.20 32.20
(S)
37.80 38.40 36.90 36.90 33.00 33.70 33.70
29.24 19.53 13.79 13.94 11.52 10.40 10.28
(S)
18.40 15.01 12.26 10.57 8.14 8.43 (D)
33.70 24.90 19.10 22.70 20.70 20.60 20.60
(S)
26.20 26.80 25.30 25.30 21.40 22.10 22.10
(S) (D) (D) (D) (D) (D) (D) (S)
(D) (D) (D) (D) (D) (D) (D)
27.65 17.96 12.22 12.39 9.98 8.87 8.75
(S)
16.84 13.47 10.73 9.05 6.63 6.92 (D)
32.09 23.29 17.49 21.09 19.09 18.99 18.99
(S)
24.59 25.19 23.69 23.69 19.79 20.49 20.49
(S) (D) (D) (D) (D) (D) (D) (S)
(D) (D) (D) (D) (D) (D) (D)
(D) Withheld to avoid disclosing data for individual operations. (S) Insufficient number of reports to establish an estimate.
Grapefruit Average Prices and Equivalent Returns by Season – United States: 2017-2018 and 2018-2019 [Includes pummelos in California. Includes California, Florida, and Texas]
Season and month
FOB packed fresh
Equivalent returns
Packinghouse door On-tree
All Fresh Process All Fresh Process
(dollars per box) (dollars per box) (dollars per box) (dollars per box) (dollars per box) (dollars per box) (dollars per box)
2017-2018 November ................ December ................ January ................... February .................. March ...................... April ......................... May ......................... June ........................ July .......................... August ..................... September ............... October ................... 2018-2019 November ................ December ................ January ................... February .................. March ...................... April ......................... May ......................... June ........................ July ..........................
37.20 35.10 35.90 35.50 34.30 32.20
(D) (D) (D) (D) (D)
37.80
36.70 35.30 34.40 33.50 31.10 29.00
(D) (D) (D)
22.27 18.58 18.30 18.22 18.98 20.75 19.65 17.22 16.18 12.67 18.02 23.48
23.77 21.64 19.12 17.81 14.69 16.42 16.73 14.86 14.23
27.02 25.03 25.43 25.17 25.29 24.86
(D) (D) (D) (D) (D)
28.65
27.02 25.67 24.36 23.62 21.49 20.93
(D) (D) (D)
11.97 12.14 12.26 13.18 11.66
(D) (D) (D) (D) (D) (D)
6.94
13.08 13.90 14.45 14.44 11.77 7.76 (D) (D) (D)
19.27 15.43 15.10 14.97 15.88 18.07 16.94 14.35 13.34 9.57
15.16 20.61
20.89 18.68 15.99 14.61 11.44 13.51 13.94 11.95 11.34
24.32 22.33 22.70 22.46 22.71 22.45
(D) (D) (D) (D) (D)
26.03
24.32 22.99 21.63 20.90 18.81 18.40
(D) (D) (D)
8.35 8.53 8.66 9.55 7.96 (D) (D) (D) (D) (D) (D)
3.26
9.58 10.41 10.96 10.95 8.28 4.11 (D) (D) (D)
(D) Withheld to avoid disclosing data for individual operations.

26 Citrus Fruits 2019 Summary (August 2019) USDA, National Agricultural Statistics Service
Lemon Average Prices and Equivalent Returns by Season – California: 2017-2018 and 2018-2019 [Only months with reported prices in a given crop year are listed]
Season and month
FOB packed fresh
Equivalent returns
Packinghouse door On-tree
All Fresh Process All Fresh Process
(dollars per box) (dollars per box) (dollars per box) (dollars per box) (dollars per box) (dollars per box) (dollars per box)
2017-2018 August ................. September ........... October ................ November ............ December ............ January ................ February .............. March ................... April ..................... May ...................... June ..................... July ...................... 2018-2019 August ................. September ........... October ................ November ............ December ............ January ................ February .............. March ................... April ..................... May ...................... June ..................... July ......................
(S)
49.40 47.90 51.40 54.70 55.50 53.80 48.40 46.60 46.50 49.10 60.70
(S) 79.30 60.40 52.30 48.40 44.60 41.10 40.10 40.50 40.90 43.40 46.20
(S)
35.81 30.90 34.18 37.83 37.10 29.81 26.79 24.22 27.91 35.53 46.75
(S) 55.98 47.24 37.85 33.41 29.27 22.37 21.77 19.45 22.46 25.71 28.43
(S)
39.37 37.87 41.37 44.67 45.47 43.77 38.37 36.57 36.47 39.07 50.67
(S) 69.07 50.17 42.07 38.17 34.37 30.87 29.87 30.27 30.67 33.17 35.97
(D) (D) (D) (D) (D) (D) (D) (D) (D) (D) (D) (D)
(S) (S) (S) (D) (D) (D) (D) (D) (D) (D) (D) (D)
(S)
29.42 24.65 27.91 31.53 30.85 23.75 20.72 18.20 21.73 29.14 40.34
(S) 49.60 40.68 31.36 26.96 22.87 16.19 15.59 13.38 16.25 19.43 22.12
(S)
32.85 31.35 34.85 38.15 38.95 37.25 31.85 30.05 29.95 32.55 44.15
(S) 62.42 43.52 35.42 31.52 27.72 24.22 23.22 23.62 24.02 26.52 29.32
(D) (D) (D) (D) (D) (D) (D) (D) (D) (D) (D) (D)
(S) (S) (S) (D) (D) (D) (D) (D) (D) (D) (D) (D)
(D) Withheld to avoid disclosing data for individual operations. (S) Insufficient number of reports to establish an estimate.

Citrus Fruits 2019 Summary (August 2019) 27 USDA, National Agricultural Statistics Service
Lemon Average Prices and Equivalent Returns by Season – United States: 2017-2018 and 2018-2019 [Includes Arizona and California]
Season and month
FOB packed fresh
Equivalent returns
Packinghouse door On-tree
All Fresh Process All Fresh Process
(dollars per box) (dollars per box) (dollars per box) (dollars per box) (dollars per box) (dollars per box) (dollars per box)
2017-2018 August ..................... September ............... October ................... November ................ December ................ January ................... February .................. March ...................... April ......................... May ......................... June ........................ July .......................... 2018-2019 August ..................... September ............... October ................... November ................ December ................ January ................... February .................. March ...................... April ......................... May ......................... June ........................ July ..........................
(S)
49.50 48.30 51.50 54.30 55.20 53.70 48.40 46.60 46.50 49.10 60.70
77.70 79.20 61.00 53.00 48.70 44.90 41.10 40.10 40.50 40.90 43.40 46.20
(S)
35.97 31.77 34.60 37.12 36.41 29.71 26.79 24.22 27.91 35.53 46.75
51.51 56.01 47.85 38.24 32.63 28.96 21.91 21.72 19.45 22.46 25.71 28.43
(S)
39.49 38.28 41.47 44.26 45.13 43.63 38.37 36.57 36.47 39.07 50.67
67.47 68.95 50.76 42.75 38.43 34.63 30.90 29.84 30.27 30.67 33.17 35.97
(D) (D) (D) (D) (D) (D) (D) (D) (D) (D) (D) (D)
(D) (D) (D) (D) (D) (D) (D) (D) (D) (D) (D) (D)
(S)
29.58 25.49 28.32 30.84 30.17 23.65 20.72 18.20 21.73 29.14 40.34
45.20 49.63 41.29 31.76 26.23 22.58 15.76 15.54 13.38 16.25 19.43 22.12
(S)
32.97 31.76 34.95 37.74 38.61 37.11 31.85 30.05 29.95 32.55 44.15
60.82 62.30 44.11 36.10 31.78 27.98 24.25 23.19 23.62 24.02 26.52 29.32
(D) (D) (D) (D) (D) (D) (D) (D) (D) (D) (D) (D)
(D) (D) (D) (D) (D) (D) (D) (D) (D) (D) (D) (D)
(D) Withheld to avoid disclosing data for individual operations. (S) Insufficient number of reports to establish an estimate.

28 Citrus Fruits 2019 Summary (August 2019) USDA, National Agricultural Statistics Service
Marketing Year Average Prices Received for Oranges – States and United States: 2017-2018 and 2018-2019
State, type, and utilization
2017-2018 2018-2019
FOB packed
Equiv. PHD
Equiv. on-tree
FOB packed
Equiv. PHD
Equiv. on-tree
(dollars per
box) (dollars per
box) (dollars per
box) (dollars per
box) (dollars per
box) (dollars per
box)
California Navel and miscellaneous ............................................. Fresh ....................................................................... Processing ............................................................... Valencia ....................................................................... Fresh ....................................................................... Processing ............................................................... All ................................................................................ Fresh ....................................................................... Processing ............................................................... Florida Non-Valencia ............................................................... Fresh ....................................................................... Processing ............................................................... Valencia ....................................................................... Fresh ....................................................................... Processing ............................................................... All ................................................................................ Fresh ....................................................................... Processing ............................................................... Texas Early and midseason .................................................... Fresh ....................................................................... Processing ............................................................... Valencia ....................................................................... Fresh ....................................................................... Processing ............................................................... All ................................................................................ Fresh ....................................................................... Processing ............................................................... United States Early, midseason, and Navel ........................................ Fresh ....................................................................... Processing ............................................................... Valencia ....................................................................... Fresh ....................................................................... Processing ............................................................... All ................................................................................ Fresh ....................................................................... Processing ...............................................................
(NA)
(D) (NA) (NA)
(D) (NA) (NA)
(D) (NA)
(NA) 34.90 (NA) (NA)
34.70 (NA) (NA)
34.80 (NA)
(NA) (D)
(NA) (NA)
(D) (NA) (NA)
(D) (NA)
(NA) 38.90 (NA) (NA)
37.90 (NA) (NA)
38.70 (NA)
25.36
(D) (D)
22.00 (D) (D)
24.73 (D) (D)
13.70 23.05 13.00 16.95 22.85 16.60 15.58 22.95 15.10
17.37 (D) (D)
25.60 (D) (D)
18.90 (D) (D)
20.92 28.85 10.36 18.14 27.49 15.68 19.82 28.59 13.25
22.57
(D) (D)
19.18 (D) (D)
21.94 (D) (D)
10.43 19.60 9.75
13.88 19.55 13.55 12.43 19.57 11.97
15.58 (D) (D)
23.77 (D) (D)
17.11 (D) (D)
17.98 26.10 7.19
15.13 24.66 12.64 16.86 25.82 10.15
(NA)
(D) (NA) (NA)
(D) (NA) (NA)
(D) (NA)
(NA) 31.40 (NA) (NA)
29.60 (NA) (NA)
30.60 (NA)
(NA) (D)
(NA) (NA)
(D) (NA) (NA)
(D) (NA)
(NA) 29.40 (NA) (NA)
24.80 (NA) (NA)
28.50 (NA)
14.23
(D) (D)
9.99 (D) (D)
13.46 (D) (D)
12.40 20.05 12.00 15.29 18.25 15.20 14.07 19.23 13.86
8.95 (D) (D)
16.60 (D) (D)
9.84 (D) (D)
13.26 19.18 8.83
14.44 14.42 14.45 13.76 18.23 11.74
11.36
(D) (D)
7.12 (D) (D)
10.59 (D) (D)
9.19 16.65 8.80
12.24 15.00 12.15 10.95 15.90 10.75
7.23 (D) (D)
14.77 (D) (D)
8.11 (D) (D)
10.28 16.35 5.72
11.43 11.56 11.40 10.76 15.40 8.67
(D) Withheld to avoid disclosing data for individual operations. (NA) Not available.

Citrus Fruits 2019 Summary (August 2019) 29 USDA, National Agricultural Statistics Service
Marketing Year Average Prices Received for Grapefruit – States and United States: 2017-2018 and 2018-2019
State, type, and utilization
2017-2018 2018-2019
FOB packed
Equiv. PHD
Equiv. on-tree
FOB packed
Equiv. PHD
Equiv. on-tree
(dollars per box) (dollars per box) (dollars per box) (dollars per box) (dollars per box) (dollars per box)
California 1 ...................................... Fresh ........................................... Processing ................................... Florida Red .............................................. Fresh ....................................... Processing ............................... White 2 ......................................... Fresh ....................................... Processing ............................... All ................................................ Fresh ....................................... Processing ............................... Texas .............................................. Fresh ........................................... Processing ................................... United States 1 ............................... Fresh ........................................... Processing
(NA) (D)
(NA)
(NA) 37.70 (NA)
(NA)
39.60 (NA)
(NA)
37.90 (NA)
(NA)
(D) (NA)
(NA)
33.80 (NA)
18.34 (D) (D)
19.32 26.55 12.40
16.81 28.45 12.50
18.87 26.76 12.42
13.56
(D) (D)
16.71 23.88 6.56
15.57 (D) (D)
16.06 23.75 8.70
13.59 25.60 9.15
15.61 23.95 8.81
12.01
(D) (D)
14.24 21.67 3.73
(NA) (D)
(NA)
(NA) 36.20 (NA)
(NA)
42.00 (NA)
(NA)
36.90 (NA)
(NA)
(D) (NA)
(NA)
33.60 (NA)
17.49 (D) (D)
18.92 25.55 13.40
18.98 31.35 14.00
18.93 26.22 13.53
10.69
(D) (D)
15.04 23.77 6.31
14.76 (D) (D)
15.71 22.75 9.85
15.86 28.55 10.75
15.74 23.42 10.04
9.17 (D) (D)
12.67 21.50 3.85
(D) Withheld to avoid disclosing data for individual operations. (NA) Not available. 1 Includes pummelos. 2 Includes seedy grapefruit.

30 Citrus Fruits 2019 Summary (August 2019) USDA, National Agricultural Statistics Service
Marketing Year Average Prices Received for Lemons, Tangerines and Mandarins – States and United States: 2017-2018 and 2018-2019
Crop, State, and utilization
2017-2018 2018-2019
FOB packed
Equiv. PHD
Equiv. on-tree
FOB packed
Equiv. PHD
Equiv. on-tree
(dollars per box) (dollars per box) (dollars per box) (dollars per box) (dollars per box) (dollars per box)
Lemons Arizona ...................................................... Fresh ..................................................... Processing ............................................. California ................................................... Fresh ..................................................... Processing ............................................. United States ............................................. Fresh ..................................................... Processing ............................................. Tangerines and mandarins California 1 ................................................. Fresh ..................................................... Processing ............................................. Florida 2 ..................................................... Fresh ..................................................... Processing ............................................. United States 3 ........................................... Fresh ..................................................... Processing .............................................
(NA)
(D) (NA)
(NA)
(D) (NA)
(NA)
(D) (NA)
(NA) (D)
(NA)
(NA) 50.20 (NA)
(NA)
47.00 (NA)
34.20
(D) (D)
32.15
(D) (D)
32.24
(D) (D)
28.96 (D) (D)
26.60 35.90 9.49
28.86 37.53 0.57
27.94
(D) (D)
25.94
(D) (D)
26.03
(D) (D)
25.58 (D) (D)
21.50 30.55 4.84
25.39 34.45 -4.14
(NA)
(D) (NA)
(NA)
(D) (NA)
(NA)
(D) (NA)
(NA) (D)
(NA)
(NA) 46.10 (NA)
(NA)
46.80 (NA)
30.89
(D) (D)
28.25
(D) (D)
28.39
(D) (D)
28.29 (D) (D)
21.84 32.30 9.14
28.01 37.14 0.28
24.68
(D) (D)
21.96
(D) (D)
22.11
(D) (D)
24.82 (D) (D)
16.87 27.10 4.44
24.48 34.02 -4.51
(D) Withheld to avoid disclosing data for individual operations. (NA) Not available. 1 Includes tangelos and tangors. 2 Includes all certified varieties of tangerines and tangelos. 3 Includes tangelos and tangors in California. Includes all certified varieties of tangerines and tangelos in Florida.
Citrus Fruits 2019 Summary (August 2019) 31 USDA, National Agricultural Statistics Service
Terms and Definitions
Citrus crop year: Begins with the bloom of the first year listed and ends with the year harvest is completed.
Equivalent on-tree (EOT) price: Represents the PHD price minus picking and hauling costs.
Freight on board (FOB) price: A commercial price term that signifies a contractual agreement between a buyer and a
seller to have the subject of a sale delivered to a designated place, usually either the "place of shipment" or the "place of
destination," without expense to the buyer. This term indicates delivery will be made on board or into a carrier by the
shipper without charge. The abbreviation FOB is usually followed by a shipping point or destination. Reports from fresh
fruit sales organizations and from citrus packers provide data for an average FOB price.
Packinghouse door (PHD) price: The packinghouse door in generally referred to as the point of first sale. PHD prices
are calculated by subtracting costs incurred through the packinghouse from the FOB price. These costs may include
sorting, grading, packing, cooling, etc.
Marketing Year Average Prices and Value of Production
State level marketing year average (MYA), or price per box, for fresh and processed sales are the weighted average of
monthly sales that occur during a crop's marketing season, adjusted to the packinghouse-door level. The "all" sales MYA
price is derived by dividing the "all" sales value by the "all" sales boxes. MYA prices at the United States level for
commodities with different State box weights are computed as follows:
Fresh Market MYAP = Σ(State Fresh Value * State Box Weight)
Σ(State Fresh Boxes * State Box Weight)
Process Market MYAP = Σ(State Process Value * State Box Weight)
Σ(State Process Boxes * State Box Weight)
"All" Sales MYAP = Σ(State All Value * State Box Weight)
Σ(State All Boxes * State Box Weight)
For commodities with the same box weights across all States, the United States MYA prices are derived by dividing the
sum of States’ values by the sum of States' boxes.
United States value of production for a given commodity is the sum of the States’ values for that commodity. The State
level value of production for each commodity is computed as follows:
Fresh Market Value = Fresh Market MYAP * Fresh Market Boxes
Process Market Value = Process Market MYAP * Process Market Boxes
"All" Sales Value = Fresh Market Value + Process Market Value
Citrus prices are based on weighted average FOB packed prices received for fresh fruit and weighted average prices
received at the processing plant door for processing fruit. Equivalent returns for fresh and processed fruit are calculated at
the packinghouse-door level by deducting sorting, grading, packing, cooling, marketing, and other costs from the two base
prices. In some cases, this results in negative returns.

32 Citrus Fruits 2019 Summary (August 2019) USDA, National Agricultural Statistics Service
Box Weights by Crop - States: 2016-2017, 2017-2018, and 2018-2019
State Crop year
2016-2017 2017-2018 2018-2019
(pounds) (pounds) (pounds)
Oranges California ........................................................ Florida ............................................................ Texas ............................................................. Grapefruit California 1 ..................................................... Florida ............................................................ Texas ............................................................. Lemons Arizona .......................................................... California ........................................................ Tangerines California 2 ..................................................... Florida ............................................................
80 90 85
80 85 80
80 80
80 95
80 90 85
80 85 80
80 80
80 95
80 90 85
80 85 80
80 80
80 95
1 Includes pummelos. 2 Includes tangelos and tangors.

Citrus Fruits 2019 Summary (August 2019) 33 USDA, National Agricultural Statistics Service
Marketing Seasons
Oranges, Early, midseason, and Navel:
California ........................................................................................................................................... October 1 to June 15
Florida ............................................................................................................................................ October 1 to March 31
Texas ................................................................................................................................................ October 1 to April 30
Oranges, Valencia:
California ...................................................................................................................................... March 15 to October 31
Florida ................................................................................................................................................ January 1 to July 31
Texas ............................................................................................................................................... January 15 to May 31
Grapefruit:
California (including pummelos) ............................................................................................ November 1 to October 31
Florida ......................................................................................................................................... September 15 to June 30
Texas ................................................................................................................................................. October 1 to May 31
Lemons:
Arizona ................................................................................................................................... September 1 to February 28
California ............................................................................................................................................. August 1 to July 31
Tangerines:
California (including tangelos and tangors) ...................................................................................... October 1 to May 15
Florida ........................................................................................................................................ September 15 to April 30
Statistical Methodology
Survey Procedures: Grower and objective measurement surveys are used to collect acreage, production, yield, price, and
value data. Grower surveys are conducted by mail, telephone, and personal interview. Objective measurement data is
collected in citrus groves.
Estimating Procedures: Information obtained from the citrus grower and objective measurement surveys along with
administrative data is used to establish estimates of bearing acres, production, yield, price, and value. These estimates are
reviewed for errors, reasonableness, and consistency with historical estimates.
Revision Policy: Current season estimates are open for revision in April and August.
Reliability: The citrus grower surveys are subject to non-sampling errors such as omission, duplication, and mistakes in
reporting, recording, and processing the data. These errors cannot be measured directly, but are minimized through rigid
quality controls in the data collection process and a careful review of all reported data for consistency and reasonableness.

34 Citrus Fruits 2019 Summary (August 2019) USDA, National Agricultural Statistics Service
Information Contacts
Listed below are the commodity statisticians in the Crops Branch of the National Agricultural Statistics Service to contact
for additional information. E-mail inquiries may be sent to [email protected]
Lance Honig, Chief, Crops Branch ....................................................................................................... (202) 720-2127
Fleming Gibson, Head, Fruits, Vegetables and Special Crops Section ................................................. (202) 720-2127
Joshua Bates– Almonds, Apples, Apricots, Asparagus, Carrots, Coffee, Onions,
Plums, Prunes, Sweet Corn, Tobacco ........................................................................................ (202) 720-4288
Vincent Davis – Dry Beans, Garlic, Hazelnuts, Honeydews, Kiwifruit, Lettuce,
Maple Syrup, Mint, Pears, Sweet Cherries, Tart Cherries, Tomatoes ....................................... (202) 720-2157
Fleming Gibson – Cauliflower, Celery, Grapefruit, Lemons, Macadamia,
Mandarins and tangerines, Mushrooms, Olives, Oranges ......................................................... (202) 720-5412
Greg Lemmons –Cranberries, Cucumbers, Pistachios, Potatoes, Pumpkins,
Raspberries, Squash, Strawberries, Sugarbeets, Sugarcane, Sweet Potatoes,
Tame Blueberries, Wild Blueberries.......................................................................................... (202) 720-4285
Dan Norris – Artichokes, Cantaloupes, Dry Edible Peas, Green Peas, Lentils,
Nectarines, Papayas, Peaches, Snap Beans, Spinach, Walnuts, Watermelons ........................... (202) 720-3250
Fleming Gibson – Avocados, Bell Peppers, Broccoli, Cabbage, Chickpeas,
Chile Peppers, Dates, Floriculture, Grapes, Hops, Pecans ........................................................ (202) 720-2127

Access to NASS Reports For your convenience, you may access NASS reports and products the following ways:
All reports are available electronically, at no cost, on the NASS web site: www.nass.usda.gov
Both national and state specific reports are available via a free e-mail subscription. To set-up this free
subscription, visit www.nass.usda.gov and click on “National” or “State” in upper right corner above “search”
box to create an account and select the reports you would like to receive.
Cornell’s Mann Library has launched a new website housing NASS’s and other agency’s archived reports. The
new website, https://usda.library.cornell.edu. All email subscriptions containing reports will be sent from the new
website, https://usda.library.cornell.edu. To continue receiving the reports via e-mail, you will have to go to the
new website, create a new account and re-subscribe to the reports. If you need instructions to set up an account or
subscribe, they are located at: https://usda.library.cornell.edu/help. You should whitelist notifications@usda-
esmis.library.cornell.edu in your email client to avoid the emails going into spam/junk folders.
For more information on NASS surveys and reports, call the NASS Agricultural Statistics Hotline at (800) 727-9540,
7:30 a.m. to 4:00 p.m. ET, or e-mail: [email protected].
The U.S. Department of Agriculture (USDA) prohibits discrimination against its customers, employees, and applicants for
employment on the basis of race, color, national origin, age, disability, sex, gender identity, religion, reprisal, and where
applicable, political beliefs, marital status, familial or parental status, sexual orientation, or all or part of an individual's
income is derived from any public assistance program, or protected genetic information in employment or in any program
or activity conducted or funded by the Department. (Not all prohibited bases will apply to all programs and/or
employment activities.)
If you wish to file a Civil Rights program complaint of discrimination, complete the USDA Program Discrimination
Complaint Form (PDF), found online at www.ascr.usda.gov/filing-program-discrimination-complaint-usda-customer, or
at any USDA office, or call (866) 632-9992 to request the form. You may also write a letter containing all of the
information requested in the form. Send your completed complaint form or letter to us by mail at U.S. Department of
Agriculture, Director, Office of Adjudication, 1400 Independence Avenue, S.W., Washington, D.C. 20250-9410, by fax
(202) 690-7442 or email at [email protected].

USDA NASS Data Users’ Meeting Tuesday, October 15, 2019
American Farm Bureau Federation
600 Maryland Ave SW #1000w
Washington, DC 20024
USDA’s National Agricultural Statistics Service will hold an open forum for users of U.S. domestic and
international agriculture data. NASS is organizing the Data Users’ Meeting in cooperation with five other
USDA agencies – Agricultural Marketing Service, Economic Research Service, Farm Service Agency, Foreign
Agricultural Service, and World Agricultural Outlook Board – and the Census Bureau’s Foreign Trade
Division. Agency representatives will provide updates on recent and pending changes in statistical and
information programs important to agriculture, answer questions, and welcome comments and input from data
users.
For registration details and additional information about the Data Users’ Meeting, see the meeting page on the
NASS website (https://www.nass.usda.gov/Education_and_Outreach/Meeting/index.php). Contact Vernita
Murray (NASS) at 202-690-8141 or [email protected] or Patricia Snipe (NASS) at 202-720-2248
or [email protected] for information.
USDA
Data Users’ Meeting
Related Documents


