United States, Brazil, China Variations in Purchasing Patterns

United States, Brazil, China Variations in Purchasing Patterns.
Dec 16, 2015
Welcome message from author
This document is posted to help you gain knowledge. Please leave a comment to let me know what you think about it! Share it to your friends and learn new things together.
Transcript

United States, Brazil, China
Variations in Purchasing Patterns
2
Copyright © 2012 The Nielsen Company. Confidential and proprietary.
Overview
• Trends in Consumer Choice Environment • Focus on United States : modern trade, largely stagnant• Focus on Brazil and China: modern and traditional growth• Advertising • Social media data• Bringing it all together: an example
2
3
Copyright © 2012 The Nielsen Company. Confidential and proprietary.
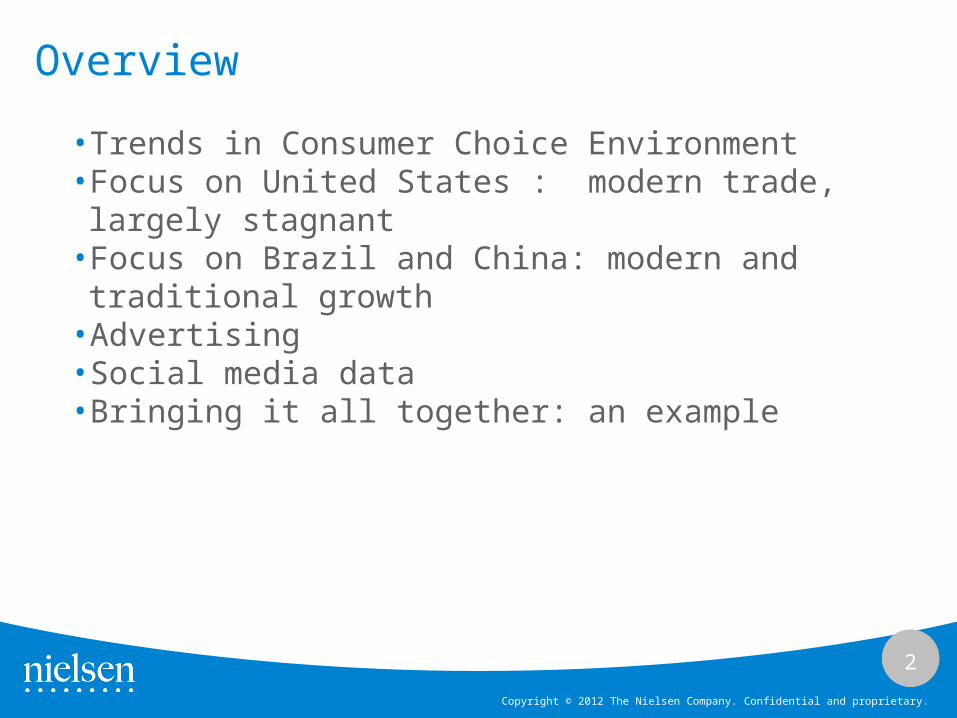
Distinguish shoppers around the world
87% of the population
lives in urban areas
Over 12 million
kirana shops
160 cities with population
over a million18.4 million
mobile money users
97% have purchased
over the Internet
4
Copyright © 2012 The Nielsen Company. Confidential and proprietary.
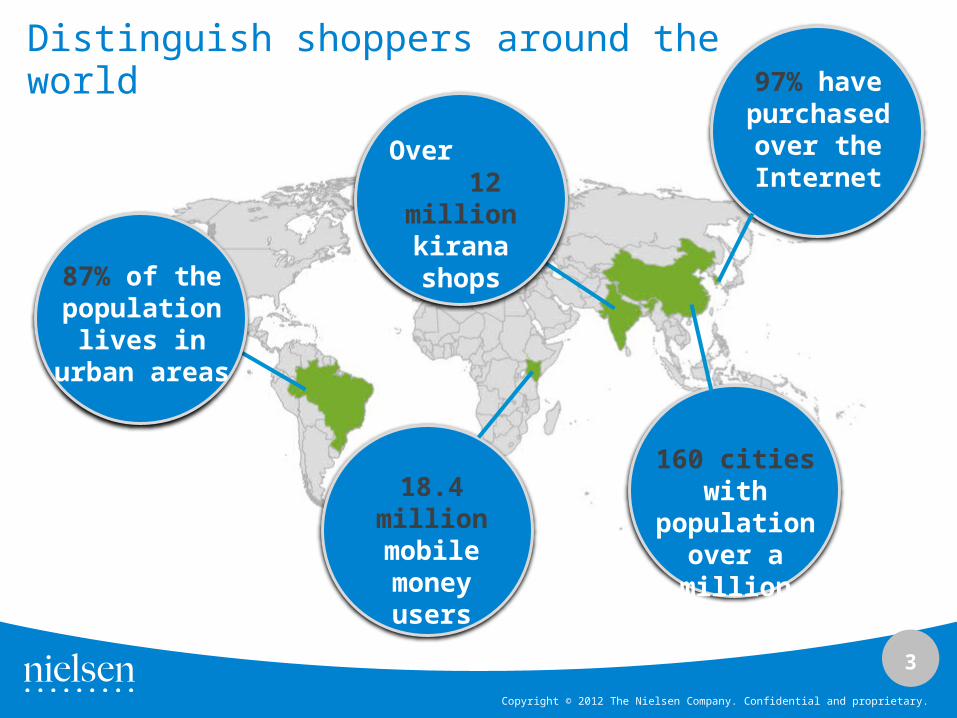
Consider modern vs. traditional trade
Modern Trade Traditional Trade
80% of Developed countries
40,000+ SKUs
30,000+ sq ft
$43 per trip twice a week
Self-service model
80% of global population
<2,000 SKUs
<500 sq ft
$3 per trip daily
Retailers are gatekeepers
VS
5
Copyright © 2012 The Nielsen Company. Confidential and proprietary.
344 342
298 288268
202173
392370
0
100
200
300
400
500
600
Belgium Italy Spain France UK Bulgaria Germany Poland Romania
Total Expenditure (2012) Fresh Food
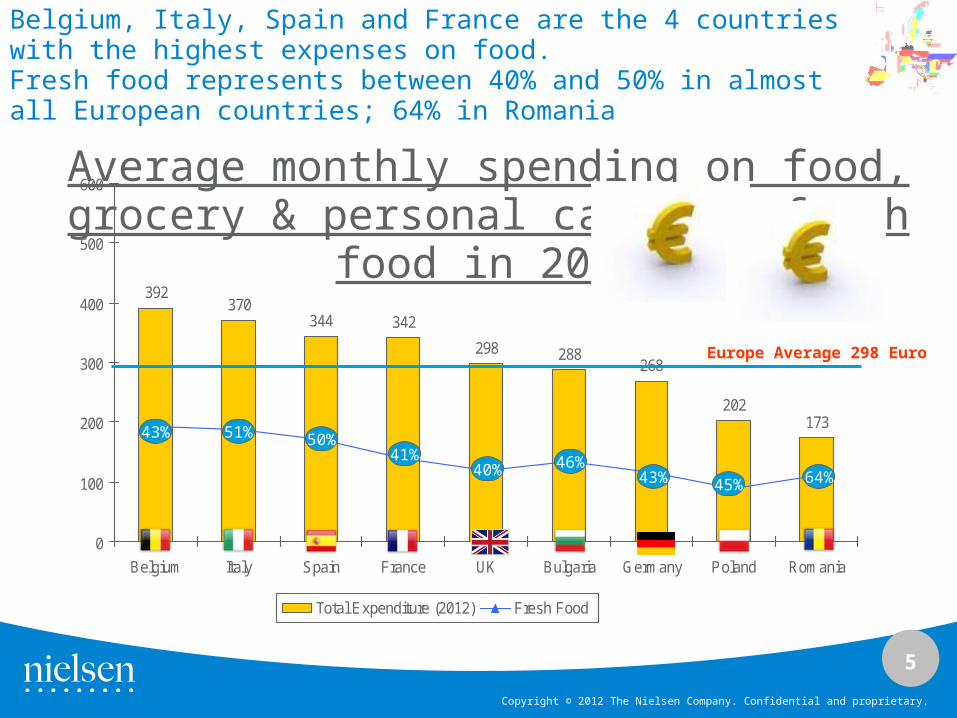
Average monthly spending on food, grocery & personal care vs. fresh food in 2012
Europe Average 298 Euro
51%
41%40% 46%
43%
45% 64%
50%
43%
Belgium, Italy, Spain and France are the 4 countries with the highest expenses on food.Fresh food represents between 40% and 50% in almost all European countries; 64% in Romania

6
Copyright © 2012 The Nielsen Company. Confidential and proprietary.
United States: Quantity Shift Analysis: Non-Alcoholic Beverages
2010 Growth
2011 Growth
Source: Nielsen ScanTrack; Note: 2009 refers to year ending May 2010, 2011 refers to year ending May 2012;
7
Copyright © 2012 The Nielsen Company. Confidential and proprietary.
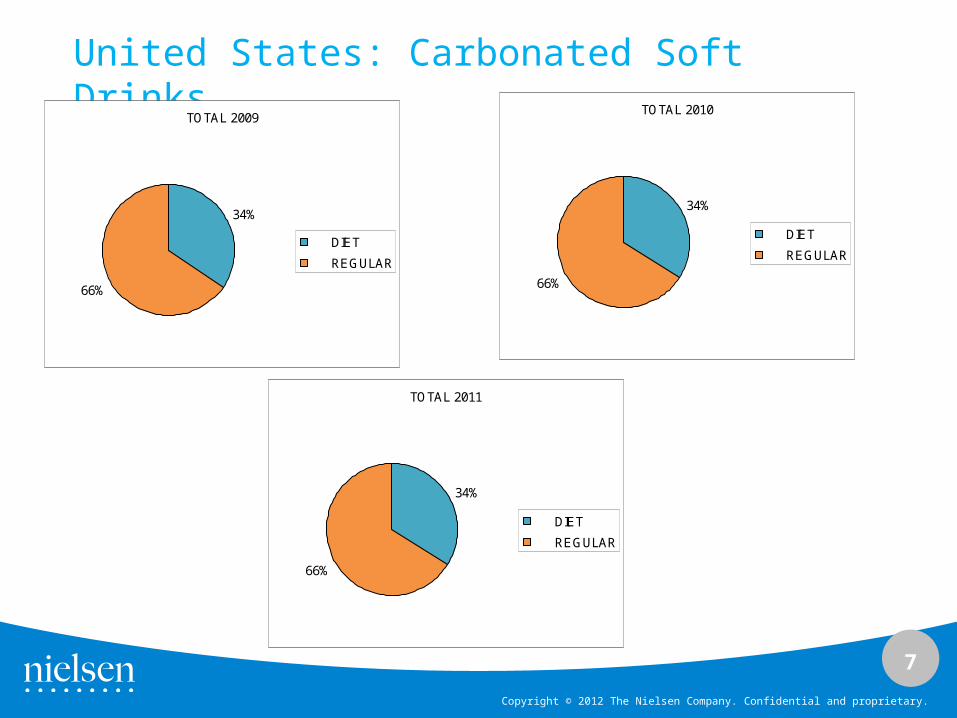
United States: Carbonated Soft Drinks
TOTAL 2009
34%
66%
DIET
REGULAR
TOTAL 2011
34%
66%
DIET
REGULAR
TOTAL 2010
34%
66%
DIET
REGULAR
8
Copyright © 2012 The Nielsen Company. Confidential and proprietary.
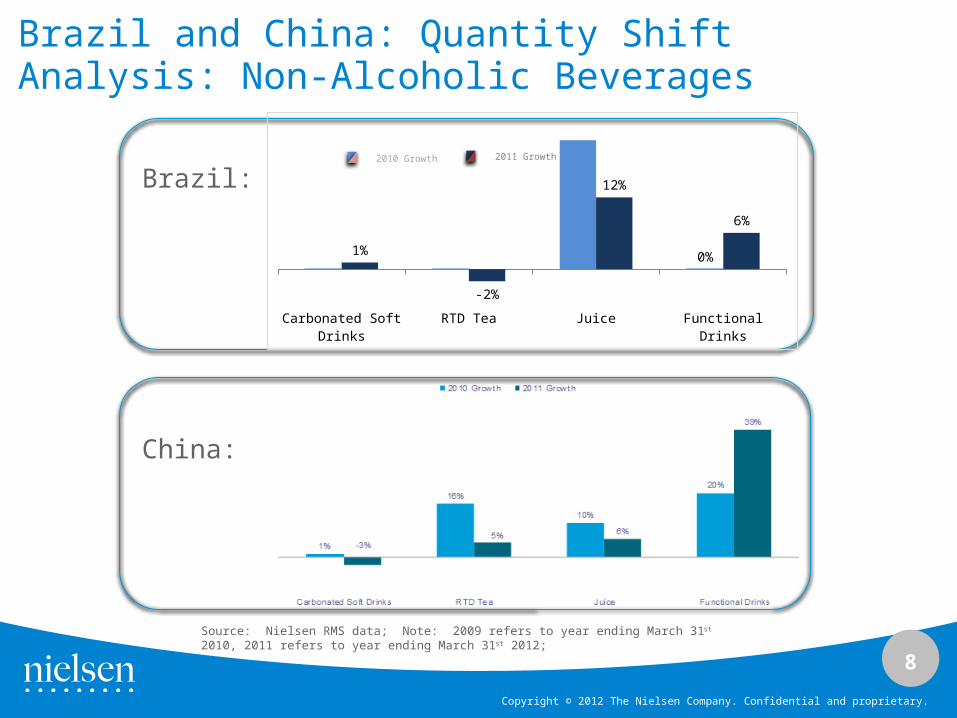
Brazil and China: Quantity Shift Analysis: Non-Alcoholic Beverages
2010 Growth 2011 Growth
Brazil:
China:
Source: Nielsen RMS data; Note: 2009 refers to year ending March 31st 2010, 2011 refers to year ending March 31st 2012;
Carbonated Soft Drinks
RTD Tea Juice Functional Drinks
1%
-2%
12%
6%
0%
9
Copyright © 2012 The Nielsen Company. Confidential and proprietary.
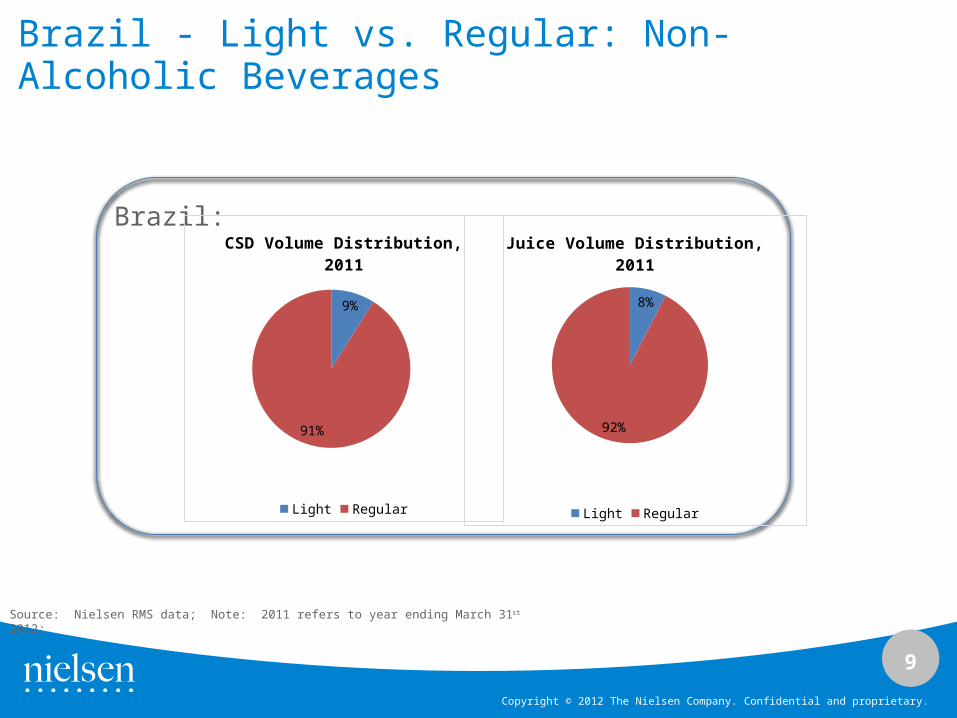
Brazil - Light vs. Regular: Non-Alcoholic Beverages
Brazil:
9%
91%
CSD Volume Distribution, 2011
Light Regular
8%
92%
Juice Volume Distribution, 2011
Light Regular
Source: Nielsen RMS data; Note: 2011 refers to year ending March 31st 2012;
10
Copyright © 2012 The Nielsen Company. Confidential and proprietary.
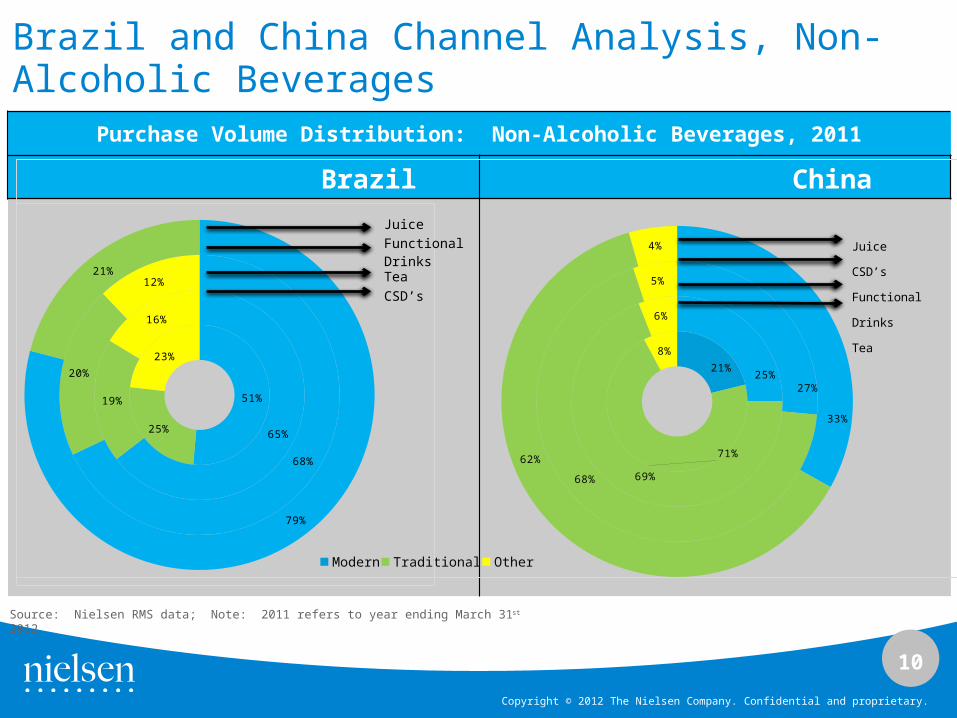
Purchase Volume Distribution: Non-Alcoholic Beverages, 2011
Brazil China
21%
71%
8%
25%
69%
6%
27%
68%
5%
33%
62%
4%
Modern Traditional Other
Juice
CSD’s
Functional Drinks
Tea
Brazil and China Channel Analysis, Non-Alcoholic Beverages
51%
25%
23%
65%
19%
16%
68%
20%
12%
79%
21%
JuiceFunctional DrinksTeaCSD’s
Source: Nielsen RMS data; Note: 2011 refers to year ending March 31st 2012
11
Copyright © 2012 The Nielsen Company. Confidential and proprietary.
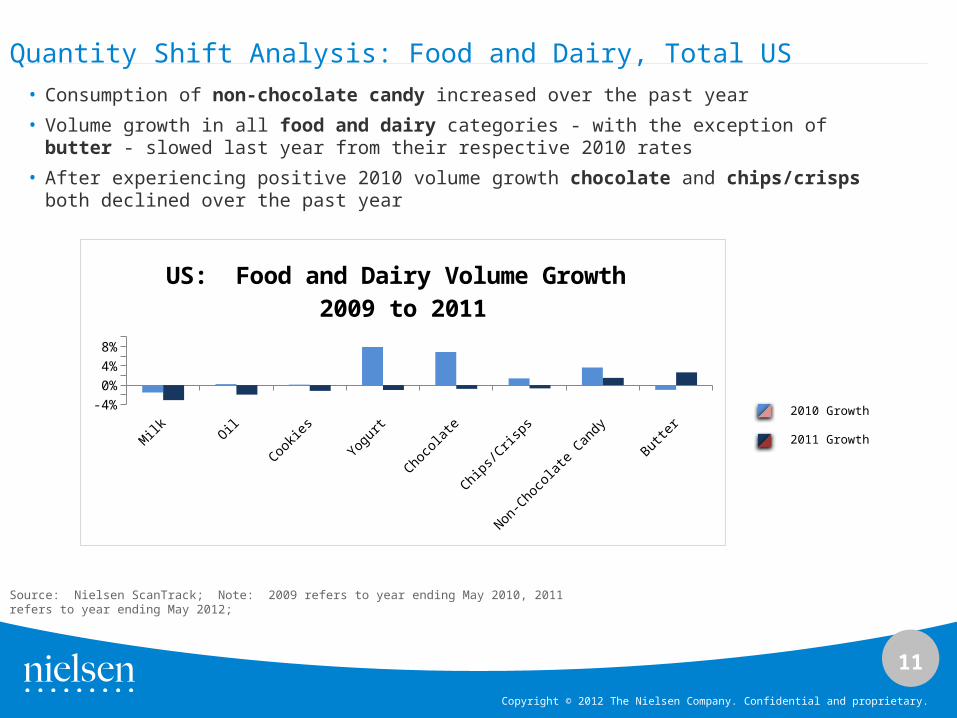
Quantity Shift Analysis: Food and Dairy, Total US
2010 Growth
2011 Growth
Milk Oil
Cookies
Yogu
rt
Chocolat
e
Chips/Cris
ps
Non-Chocolat
e Can
dyButter
-4%-2%0%2%4%6%8%
10%
US: Food and Dairy Volume Growth 2009 to 2011
• Consumption of non-chocolate candy increased over the past year
• Volume growth in all food and dairy categories - with the exception of butter - slowed last year from their respective 2010 rates
• After experiencing positive 2010 volume growth chocolate and chips/crisps both declined over the past year
Source: Nielsen ScanTrack; Note: 2009 refers to year ending May 2010, 2011 refers to year ending May 2012;

12
Copyright © 2012 The Nielsen Company. Confidential and proprietary.
Quantity Shift Analysis: Food and Dairy, Total Brazil and China
• Chocolate and chips/crisps experienced notable growth each of the past two years in both Brazil and China
• While sales of non-chocolate candy continued to grow last year in China, sales slowed in Brazil
Source: Nielsen RMS data; Note: 2009 refers to year ending March 31st 2010, 2011 refers to year ending March 31st 2012;
2010 Growth
2011 Growth
Milk Oil Cookies Yogurt Chocolate Chips/Crisps Non-chocolate candy
Margarine-8%-6%-4%-2%0%2%4%6%8%
10%12%
Brazil: Food and Dairy Volume Growth 2009 to 2011
Milk Oil Yoghurt Chocolate Chips/crisps Non-chocolate candy
0%
5%
10%
15%
20%
25%
30%China: Food and Dairy Volume Growth 2009 to 2011
13
Copyright © 2012 The Nielsen Company. Confidential and proprietary.
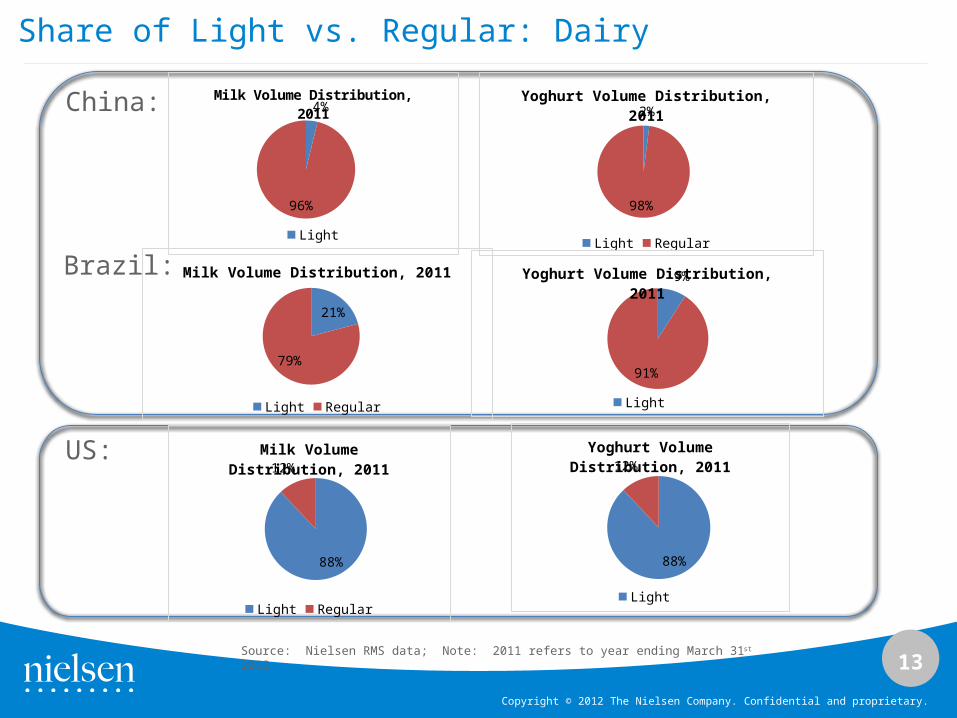
Share of Light vs. Regular: Dairy
China: 4%
96%
Milk Volume Distribution, 2011
Light Regular
2%
98%
Yoghurt Volume Distribution, 2011
Light Regular
Brazil:
21%
79%
Milk Volume Distribution, 2011
Light Regular
9%
91%
Yoghurt Volume Distribution, 2011
Light Regular
88%
12%
Yoghurt Volume Distribution, 2011
Light Regular
88%
12%
Milk Volume Distribution, 2011
Light Regular
US:
Source: Nielsen RMS data; Note: 2011 refers to year ending March 31st 2012
14
Copyright © 2012 The Nielsen Company. Confidential and proprietary.
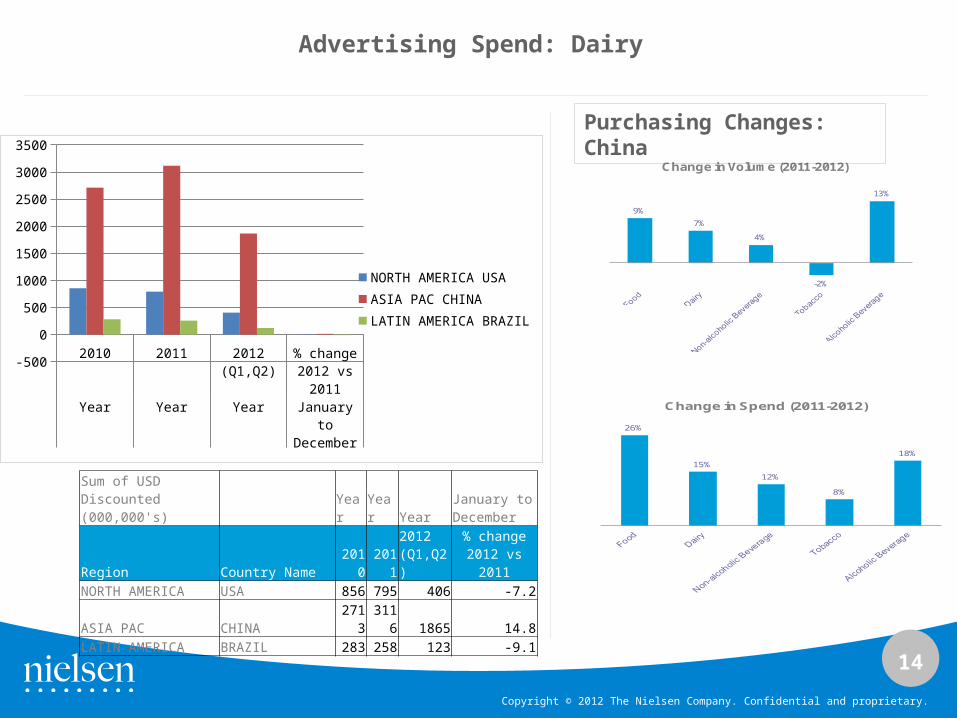
Sum of USD Discounted (000,000's) Year Year Year
January to December
Region Country Name 2010 20112012 (Q1,Q2)
% change 2012 vs 2011
NORTH AMERICA USA 856 795 406 -7.2ASIA PAC CHINA 2713 3116 1865 14.8LATIN AMERICA BRAZIL 283 258 123 -9.1
2010 2011 2012 (Q1,Q2)
% change 2012 vs
2011Year Year Year January to
December
-500
0
500
1000
1500
2000
2500
3000
3500
NORTH AMERICA USA
ASIA PAC CHINA
LATIN AMERICA BRAZIL
Advertising Spend: Dairy
9%
7%
4%
-2%
13%
Change in Volume (2011-2012)
Purchasing Changes: China
26%
15%
12%
8%
18%
Change in Spend (2011-2012)
15
Copyright © 2012 The Nielsen Company. Confidential and proprietary.
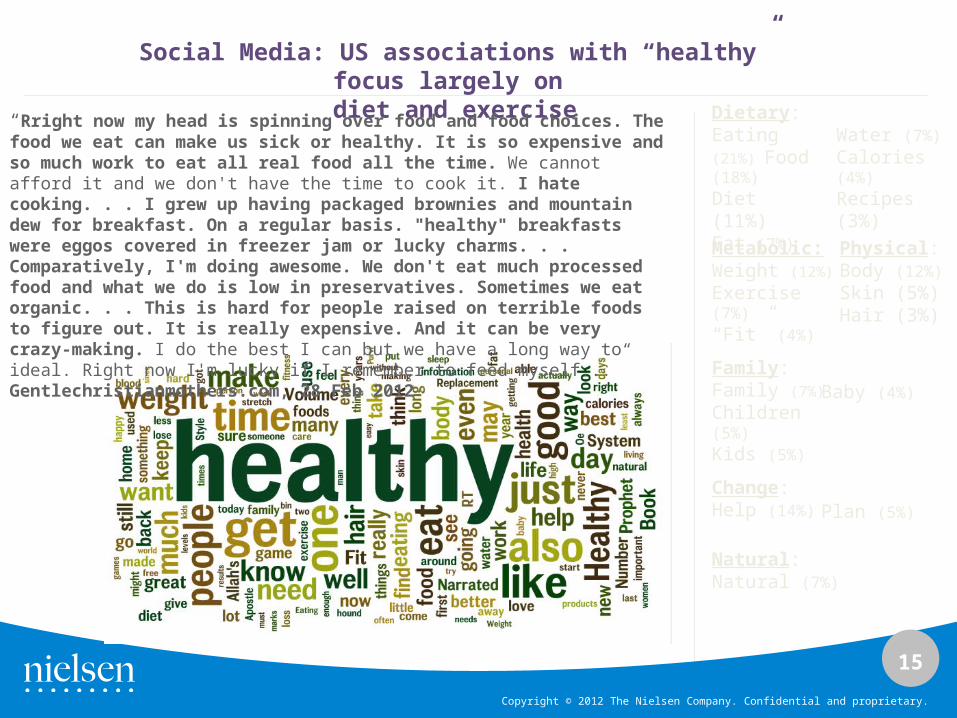
Dietary: Eating (21%)
Food (18%)
Diet (11%)Fat (7%)
Water (7%)
Calories (4%)
Recipes (3%)
Metabolic:Weight (12%)
Exercise (7%)
“Fit” (4%)
Physical: Body (12%)
Skin (5%)Hair (3%)
Family: Family (7%)
Children (5%)
Kids (5%)
Baby (4%)
Change: Help (14%) Plan (5%)
Natural: Natural (7%)
Social Media: US associations with “healthy” focus largely on diet and exercise
“Rright now my head is spinning over food and food choices. The food we eat can make us sick or healthy. It is so expensive and so much work to eat all real food all the time. We cannot afford it and we don't have the time to cook it. I hate cooking. . . I grew up having packaged brownies and mountain dew for breakfast. On a regular basis. "healthy" breakfasts were eggos covered in freezer jam or lucky charms. . . Comparatively, I'm doing awesome. We don't eat much processed food and what we do is low in preservatives. Sometimes we eat organic. . . This is hard for people raised on terrible foods to figure out. It is really expensive. And it can be very crazy-making. I do the best I can but we have a long way to ideal. Right now I'm lucky if I remember to feed myself...” Gentlechristianmothers.com, 28 Feb 2012

16
Copyright © 2012 The Nielsen Company. Confidential and proprietary.
Interaction Between Cigarette Sales and Advertising
Related Documents