United Nations Office for Disaster Risk Reduction

Welcome message from author
This document is posted to help you gain knowledge. Please leave a comment to let me know what you think about it! Share it to your friends and learn new things together.
Transcript

United Nations Office for Disaster Risk Reduction

To download the full report visit: https://gar.unisdr.orgTo share your comments and news on the GAR on Twitter and Facebook, please use #GAR2019
eISBN: 978-92-1-004180-5©United Nations 2019. All rights reserved.
DisclaimerThe designations employed and the presentation of the material in this publication do not imply the expression of any opinion whatsoever on the part of the Secretariat of the United Nations concerning the legal status of any country or territory or of its authorities or concerning the delimitations of its frontiers or boundaries. The designations of country groups in the text and the tables are intended solely for statistical or analytical convenience and do not necessarily express a judgment about the stage reached by a particular country or area in the development process. Mention of the names of firms and commercial products does not imply the endorsement of the United Nations.
This publication may be freely quoted but acknowledgement of the source is requested.Citation: UNDRR (2019), Global Assessment Report on Disaster Risk Reduction, Geneva, Switzerland, United Nations Office for Disaster Risk Reduction (UNDRR).
Design and layout: AXIS Inc. and Earth Literacy Program (NPO), Tokyo, Japan. Takae Ooka, Pinkuneko Production.Graphics: James Brown, DesignisRealPrinting: Imprimerie Centrale.

United Nations Office for Disaster Risk Reduction

ii

This fifth edition of the United Nations Global Assessment Report on Disaster Risk Reduction (GAR) is being issued four years after the adoption of the Sendai Framework for Disaster Risk Reduction 2015–2030 (Sendai Framework). Now is a time of heightened global urgency, and the need for ambitious collective action to reduce disaster risk, build resilience and achieve sustainable development has never been greater.
At no point in human history have we faced such an array of both familiar and unfamiliar risks, interacting in a hyperconnected, rapidly changing world. New risks and correlations are emerging. Decades-old projections about climate change have come true much sooner than expected. With that come changes in the intensity and frequency of hazards. Risk really is systemic, and requires concerted and urgent effort to reduce it in integrated and innovative ways.
Countries adopted the Sendai Framework in 2015 to address a broader scope of hazards and risks. The Sendai Framework charts a clear policy pathway for governments and citizens to prevent and mitigate shocks caused by natural and man-made hazards, as well as related environmental, technological and biological hazards and risks. In making the logical connection between reducing risk and building resilience, the Sendai Framework provides the connecting tissue for the 2030 Agenda for Sustainable Development, the Paris Agreement, the New Urban Agenda, the Addis Ababa Action Agenda and the Agenda for Humanity.
This edition of GAR is the first punctuation mark in the implementation of the Sendai Framework. It offers an update on progress made in implementing the outcome, goal, targets and priorities of the Sendai Framework and disaster-related Sustainable Development Goals. It provides an analysis of how risk science is chang-ing, presents areas for additional endeavour, and explores aspects of understanding and managing systemic risk. It presents innovative research and practice for pursuing risk-informed sustainable development, and provides an introduction to the wider scope and nature of hazards and related risks to be considered.
This report represents a major step towards a twenty-first century view of risk and its reduction – an under-standing that is imperative in our collective efforts to craft a sustainable future. We are fast approaching the point where we may not be able to mitigate or repair impacts from realized cascading and systemic risk, particularly those due to climate change. The urgency is evident. It demands much greater ambition around the speed and magnitude of the changes the global community needs to make; changes that must be proportionate to the scale of threat. Above all, we cannot let inertia and short-sightedness impede action. As we have been reminded recently by Greta Thunberg (the Swedish climate change activist): “There are no grey areas when it comes to survival. Now we all have a choice. We can create transformational action that will safeguard the future living conditions for humankind, or we can continue with our business as usual and fail. That is up to you and me.”
Foreword
Special Representative of the Secretary-General for Disaster Risk ReductionHead of the United Nations Office for Disaster Risk Reduction
iii
Mami Mizutori

Surprise is the new normal
Non-linear change is a reality and is threatening all three pillars (social, environmental, economic) of sustainable development. It is happening across multiple dimensions and scales, more quickly and surprisingly than previously thought possible. New risks and correlations are emerging in ways that had not been anticipated. Through global intercon-nectedness of highly interdependent social, techni-cal and biological systems, human civilization has become a “super-organism”, changing the envi-ronment from which it evolved, and inducing new hazards with no analogue.
Human activity grows exposure, increasing the propensity for systems reverberations, setting up feedback loops with cascading consequences that are difficult to foresee. Small changes can produce initial ripples, which can be amplified by non-linear effects and associated path dependencies, causing changes that lead to significant and potentially irre-versible consequences. With increasing complexity and interaction of human, economic and political systems within ecological systems, risk becomes increasingly systemic.
To allow humankind to embark on a development trajectory that is at least manageable, and at best sustainable and regenerative (consistent with the aspirations for 2030), a fundamental re-exami-nation and redesign of how to deal with risk is essential.
Executive Summary
Challenging the assumptions
The way in which such changes – including in the intensity and frequency of hazards – affect human activity is as yet difficult to foresee. Current approaches to risk measurement and management are inadequate to meet the challenges of the multi-faceted interconnectedness of hazard, the barely understood breadth of exposure, and the profound detail of vulnerability; this inadequacy must be addressed if we are to ever do more than simply treat the symptoms.
Existing approaches to understanding risk are often based on the largest and most historically obvious and tractable risks for humans, rather than on the full topography of risks. Most models draw on historical data and observations, assuming that the past is a reasonable guide to the present and the future. The sheer number of people on Earth, a changing climate and the dynamic connectedness of biological and physical worlds challenges this, requiring us to revisit assumptions about the rela-tionship between past and future risk.
The era of hazard-by-hazard risk reduction is over; present and future approaches to managing risk require an understanding of the systemic nature of risk. This entails quantum improvements in our understanding of anthropogenic systems in nature to identify precursor signals and correlations to better prepare, anticipate and adapt.
Major renovations of current approaches to risk assessment are therefore needed to be able to realize the outcomes and goals of the post-2015 agreements – the Sendai Framework for Disaster
iv Executive Summary

Risk Reduction 2015–2030 (Sendai Framework), the Transforming our World: the 2030 Agenda for Sustainable Development (2030 Agenda), the Paris Agreement, the Addis Ababa Action Agenda (AAAA) and the New Urban Agenda (NUA).
Learning to deal with complexity
Risk is complex. While it can be practical to cate-gorize risk so that responsibility can be delegated to different organizations, institutions or individu-als, risk management must not be “departmental-ized”. Complexity challenges the problem-solving model of separating issues into singularly defined parts and solving for the symptoms. It is imperative that our understanding of risk is developed without resorting to reductive measures that isolate and remove from context, and ignore systemic charac-teristics. This applies as much to our institutional arrangements for risk governance as it does to community organization, research endeavours or policy formulation.
The lens of contextual enquiry and trans-contextual research is one that brings together disciplines and many other forms of knowledge, including the place-based wisdom of local practitioners and cultural and indigenous sensitivities. By incentiv-izing transdisciplinary, integrated, multisectoral research engaging non-traditional counterparts, risk assessment and decision-making efficiency can be improved, duplication of effort reduced, and connected collective action facilitated.
National planning bodies with representation from all sectors must develop risk reduction strategies that assume an all-of-State institutions approach to risk reduction, to be able to adequately address the expanded scope of hazards and risks repre-sented in the Sendai Framework. A process to develop a Global Risk Assessment Framework (GRAF) has been established to facilitate the generation of information and insights that would sustain and guide the incorporation of systemic
risk and opportunity into policies and investments. Sustained, multi-year and creative funding and collaboration must support State and non-State actors so that they have the tools they need to better recognize and address systemic risks and apply sustainable risk management strategies at all scales.
Data, direction, decisions
Turning the aspirations of risk-informed sustainable development into reality requires robust data and statistics that are timely, accurate, disaggregated, people-centred and accessible, and which enable us to capture progress and direct investments accord-ingly. Four years after the adoption of the 2030 Agenda and the Sendai Framework, many coun-tries have taken concrete steps towards meeting the ambitious aspirations of these transformative plans, including in the realm of data.
Integrated monitoring and reporting on the Sendai Framework and disaster-related Sustainable Devel-opment Goals (SDGs) is a reality – thanks to the use of common metrics and the online Sendai Framework Monitor (SFM). National statistical offices are building the framework to include disas-ter-related data within the domain of official statis-tics. The percentage of reporting by Member States containing economic loss data, for all income groups, has increased in the last four years.
Data availability and quality is steadily improv-ing, and the realm of statistical capacity-building is opening up to accommodate collaboration and synergies across increasingly complex data systems. Coordinated, integrated global and national efforts strengthening data generation, taxonomy, interoperability, statistical capacity and reporting must continue. Leveraging related efforts that are ongoing across different global frameworks is important – this includes supporting and drawing from the data revolution for sustainable develop-ment that was recommended by the United Nations
v

Secretary-General’s Independent Expert Advisory Group (IEAG). Increased international attention and targeted funding across different goals is slowly starting to yield results. It is critical that momentum is not lost.
Data collection is however often fragmented, non-universal, incommensurable and biased, and the disconnect among “knowing” something, making it “available and accessible” and “applying” what is known, often remains. Many countries are unable to report adequately on progress in implementing the Sendai Framework and risk-related SDGs. Others lack the capacity to analyse and use data, even if they have the means to collect it. Development actors, the private sector, and the academic and research community may have the capacity, but the true dividends of interoperable, convergent data and analytics often remain elusive. This will not change without a sense of urgency translated into political leadership, sustained funding and commitment for risk-informed policies supported by accurate, timely, relevant, interoperable, accessible and context-specific data.
Investment in physical infrastructure, especially in the information technology sector, is required to ensure better online reporting and loss account-ing at all administrative levels while also building capacities in cartography and geospatial data. Data innovations, including citizen-generated data, must be mainstreamed.
Partnerships with other stakeholders and expert organizations – including from the private sector – must be built on a foundation of global public benefit to enable strong data-sharing networks and comprehensive reporting, including those address-ing the data challenges of the 2030 Agenda. Such partnerships should explore multiple uses of data, to stimulate demand and intrinsic incentivization for data collection and sharing – including in the context of aligned regional targets and indicators (for example of countries with similar geopolitical and hazard profiles) that allow spatial comparisons.
Developments in open data and analysis, shared and interoperable software, computing power
and other technologies are the technical enablers of improved data science, risk assessment, risk modelling, reporting and ultimately evidence-based policies. For their success, they rely on investment and the willingness of people to work with other disciplines, across cultural, language and political boundaries, and to create the right regulatory envi-ronment for new and urgent work to proceed.
These are time-critical actions for the achieve-ment of the goals of the Sendai Framework and the 2030 Agenda by the end of the next decade. With improved access to good data, Member States can monitor and report on progress, prioritize where to invest resources and determine requirements for course correction.
State of play
This 2019 Global Assessment Report on Disas-ter Risk Reduction (GAR) is informed by the latest data – including Sendia Framework target reporting by countries using SFM – and infers early lessons on the state of the global disaster risk landscape. While the observed period is still too short to reach definitive conclusions at a global scale, it is possi-ble to ascertain certain patterns in terms of magni-tude, geographic and socioeconomic distribution of impacts and abstract several points of departure for where and how countries have seen successes in reducing risk.
In terms of losses, severe inequalities between low- and high-income countries persist, with the lowest-income countries bearing the greatest rela-tive costs of disasters. Human losses and asset losses relative to gross domestic product tend to be higher in the countries with the least capacity to prepare, finance and respond to disasters and climate change, such as in small island develop-ing States.
Sendai Framework Target A – Mortality relative to population size has declined in the long term. However, since 1990, 92% of mortality attributed to internationally reported disasters
vi Executive Summary
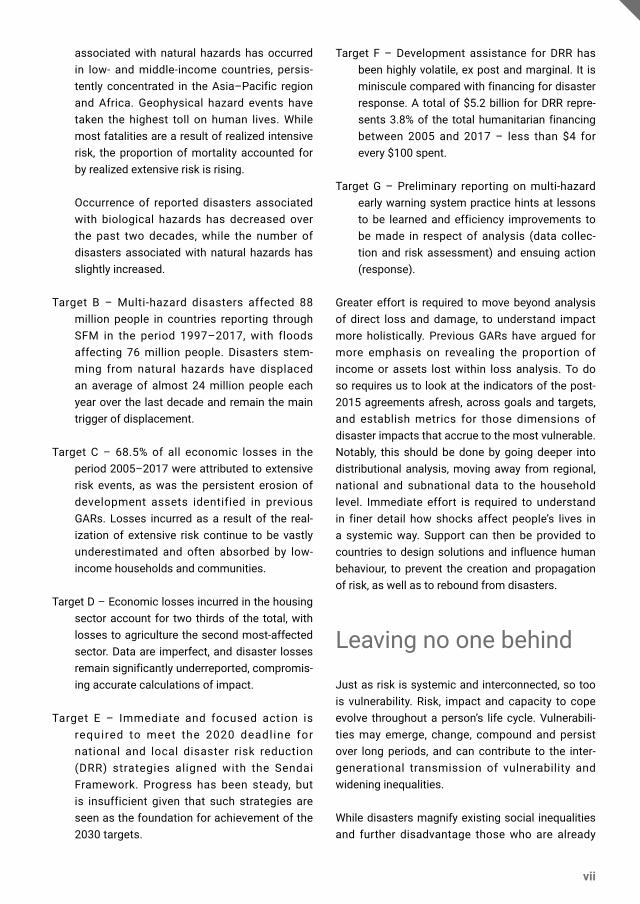
associated with natural hazards has occurred in low- and middle-income countries, persis-tently concentrated in the Asia–Pacific region and Africa. Geophysical hazard events have taken the highest toll on human lives. While most fatalities are a result of realized intensive risk, the proportion of mortality accounted for by realized extensive risk is rising.
Occurrence of reported disasters associated with biological hazards has decreased over the past two decades, while the number of disasters associated with natural hazards has slightly increased.
Target B – Multi-hazard disasters affected 88 million people in countries reporting through SFM in the period 1997–2017, with floods affecting 76 million people. Disasters stem-ming from natural hazards have displaced an average of almost 24 million people each year over the last decade and remain the main trigger of displacement.
Target C – 68.5% of all economic losses in the period 2005–2017 were attributed to extensive risk events, as was the persistent erosion of development assets identified in previous GARs. Losses incurred as a result of the real-ization of extensive risk continue to be vastly underestimated and often absorbed by low-income households and communities.
Target D – Economic losses incurred in the housing sector account for two thirds of the total, with losses to agriculture the second most-affected sector. Data are imperfect, and disaster losses remain significantly underreported, compromis-ing accurate calculations of impact.
Target E – Immediate and focused action is required to meet the 2020 deadline for national and local disaster risk reduction (DRR) strategies aligned with the Sendai Framework. Progress has been steady, but is insufficient given that such strategies are seen as the foundation for achievement of the 2030 targets.
Target F – Development assistance for DRR has been highly volatile, ex post and marginal. It is miniscule compared with financing for disaster response. A total of $5.2 billion for DRR repre-sents 3.8% of the total humanitarian financing between 2005 and 2017 – less than $4 for every $100 spent.
Target G – Preliminary reporting on multi-hazard early warning system practice hints at lessons to be learned and efficiency improvements to be made in respect of analysis (data collec-tion and risk assessment) and ensuing action (response).
Greater effort is required to move beyond analysis of direct loss and damage, to understand impact more holistically. Previous GARs have argued for more emphasis on revealing the proportion of income or assets lost within loss analysis. To do so requires us to look at the indicators of the post-2015 agreements afresh, across goals and targets, and establish metrics for those dimensions of disaster impacts that accrue to the most vulnerable. Notably, this should be done by going deeper into distributional analysis, moving away from regional, national and subnational data to the household level. Immediate effort is required to understand in finer detail how shocks affect people’s lives in a systemic way. Support can then be provided to countries to design solutions and influence human behaviour, to prevent the creation and propagation of risk, as well as to rebound from disasters.
Leaving no one behind
Just as risk is systemic and interconnected, so too is vulnerability. Risk, impact and capacity to cope evolve throughout a person’s life cycle. Vulnerabili-ties may emerge, change, compound and persist over long periods, and can contribute to the inter-generational transmission of vulnerability and widening inequalities.
While disasters magnify existing social inequalities and further disadvantage those who are already
vii

vulnerable, vulnerability is not a function of poverty alone. People do not all have the same opportunity to make positive choices. Location, age, gender, income group, disability, and access to social protection schemes and safety nets greatly affect the choices people have to anticipate, prevent and mitigate risks. Vulnerabilities accumulate and cascade, and so interventions that protect those groups whose vulnerability profiles make them more susceptible to disaster are imperative.
The measurement of multidimensional vulnerabil-ity remains immature, and systematic effort and sustained funding is required for disaggregated data collection. However, the use of quantitative markers, proxy indicators and extrapolated data represents lines of enquiry to be further elaborated. These can support the development of a more coherent, higher-resolution understanding of vulner-ability in society that can enrich the operational response and coverage of those left behind. If the assessments of multiple organizations are pooled, then coordinated data collection and communica-tion can be realized for integration within risk reduc-tion strategies and plans.
People must be put at the centre of data genera-tion and collection, so that information collected is contextual and improves our understanding of how people experience risk and loss, allowing the devel-opment of solutions that are relevant and effective. Risk information must be integrated into develop-ment indicators, and inform the sequencing of plan-ning, budgeting and action.
Designing effective interventions requires an under-standing of context – how life circumstances affect individuals’ likelihood of being healthy and educated, accessing basic services, leading a dignified life and eventually “building back better” after a shock. This requires sound socioeconomic management that is more fair, inclusive and equi-table, underpinned by a systemic, multidimensional understanding of vulnerability. Measuring disas-ter impact as experienced by individuals requires consideration of how resources are shared among regions, cities, communities, as well as members of the same household.
Levelling the playing field
Most of the benefits of socioeconomic develop-ment, economic integration and trade are shared by a limited number of countries, leaving others with constrained policy space to negotiate terms commensurate with their needs. There is growing evidence that the benefits of increasing economic integration have not been equitably shared among and within countries. Unsustainable patterns of growth hide the build-up of systemic risks across different sectors. When realized, these will severely disrupt economic activity and inflict long-term damage to sustainable development.
This calls for a fundamental redesign of global financing and international development coop-eration systems to include proportionate and context-driven solutions commensurate with the disproportionate exposure to environmental and economic risk faced by many countries. In recogniz-ing this challenge, the Sendai Framework set Target F to substantially enhance international coopera-tion to developing countries, and allow space for countries to adopt effective policies that enhance domestic public finance for risk-informed sustain-able development.
International pressure for a fairer, sustainable, equi-table planet must materialize mixed and innovative financing approaches, pro-growth tax policies and well-managed domestic resource mobilization that respond to the cascading and interlinked nature of these risks.
National and local enabling environments
The primary responsibility for Sendai Frame-work implementation lies with Member States. The broader national frameworks of laws, poli-cies and institutions for risk reduction, sustainable
viii Executive Summary

development and action on climate change have a significant impact on States’ abilities to formulate and implement national and local strategies and plans on DRR, development and climate change adaptation (CCA). Such frameworks are critical in empowering and including all stakeholders, in establishing the basis for gender equality, and for including people and groups more exposed and more vulnerable to disaster impacts.
The legislative, policy and institutional structures and processes that include the views and experi-ences of women and girls, people with disabilities, older persons and, for example, people from differ-ent ethnic or religious backgrounds, and which include protection measures for children, result in measures at national and local levels that allow a more equal and effective reduction of risk.
These enabling frameworks can be understood as central components of national and local plans for DRR, development, CCA and emerging integrated approaches to risk reduction. Coherent and inte-grated national and local plans are the means by which Member States can best implement the combined commitments made under the Sendai Framework, 2030 Agenda, Paris Agreement, AAAA and NUA, as well as other agreements related to particular regions, sectors or themes. The multi-dimensional nature of these commitments, and more importantly the underlying risks they address, require systems-based approaches to assess needs and make national and local decisions about the most effective use of available resources.
Governments and national stakeholders, supported by the private sector and civil society, are therefore encouraged to review these frameworks to identify the enablers and opportunities, as well as the barri-ers to integrated risk governance. These may come in the form of legislative mandates, institutional structures, capacity, resources, social equality/vulnerability, gender roles, and people’s awareness of and habitual treatment of risk.
Risk reduction processes have multiple connec-tions with climate change mitigation, adaptation and vulnerability reduction, and yet few DRR plans
take these connections into account. Given the very threat to humanity posed by the effects of climate change, a more integrated approach is required to adapt to and reduce risk from climate change, as well as from shorter-term risks from natural and man-made hazards, and related biological, techno-logical and environmental hazards and risks, when seeking to prevent the creation of new risk through development. Failure to include climate change scenarios in assessment and risk reduction plan-ning will build inherent redundancy in all we do.
While regional cooperation mechanisms can provide key support to knowledge-sharing and capacity-building among countries with similar risk profiles and regional concerns, aspects such as regional risk assessment, risk information systems and national capacity-building must be more actively promoted.
The regenerative potential of the social and natural systems envisaged in the aligned, post-2015 agree-ments will be better understood, and progress will be accelerated, by incorporating systemic risk and systemic opportunity into the design of policies and investments at all scales. However, few coun-tries operate centralized coordination mechanisms among DRR, CCA and development planning, let alone transdisciplinary, integrated, multisectoral assessment, planning and decision-making struc-tures that are required to understand and address systemic risks.
In seeking achievement of Target E, and the estab-lishment or realignment of national and local DRR strategies consistent with the Sendai Framework, countries employ a variety of approaches. These include: stand-alone plans and strategies, full inte-gration within sustainable development plans, inte-grated DRR and CCA strategies, and urban DRR strategies or DRR strategies in complex contexts. With this GAR coming so soon after the adoption of the indicators for measuring the global targets of the Sendai Framework and disaster-related SDGs, insufficient information is available to be able to determine whether such measures are affecting outcomes, in particular to the creation of new risk.
ix

The dynamic, interrelated and multidimensional risks that exist in urban areas require systemic approaches that seek to understand the nature of interacting systems and adopt governance adapted to the context. Fragile and complex contexts, especially where there is significant internal and cross-border migration, present a particular set of challenges for local and national risk reduction and for integrated risk governance. As the risk context is constantly changing, flex-ibility and agility is required of national- and local-level processes, to be able to accommodate new and emerging risks.
Climate emergency
Climate change is a major driver of disaster losses and failed development. It amplifies risk. Decades-old projections about climate change have come true much sooner than expected. The Intergov-ernmental Panel on Climate Change (IPCC) 2018 Special Report on Global Warming of 1.5°C brings a new sense of urgency for risk reduction efforts. The threshold of limiting global warming increase to 1.5°C above pre-industrial levels, which the Paris Agreement sought to cap, will be surpassed in the late 2030s / early 2040s. Worse, IPCC estimates that if countries restrict effort to the commitments made in the Paris Agreement (nationally determined contributions), we are looking at warming in the realm of 2.9°C–3.4°C by the end of the century.
Non- l inear change in hazard intensity and frequency is already a reality. Affecting the inten-sive and extensive nature of risk, climate change can generate more powerful storms, exacerbate coastal flooding, and bring higher temperatures and longer droughts. Emergent climate-related risks will alter most of our current risk metrics. Growth in death, loss and damage will surpass already inadequate risk mitigation, response and transfer mechanisms.
If the 1.5°C threshold is breached, the possibili-ties to adapt will diminish as ecosystem services collapse. Unable to support current economic
activity and human populations, migration on a scale never before seen may be triggered, with people moving from arid and semi-arid regions to low-elevation coastal zones, thus increasing risk.
The urgency is evident; greater ambition is required with regard to the speed and magnitude of the changes to be made. Vulnerability reduction measures – captured in national adaptation plans for action and DRR plans – must be closely linked to the simultaneous systemic changes that must be engineered in energy, industrial, land, ecological and urban systems if we are to remain below the 1.5°C threshold.
The development of DRR plans at the local, national and regional levels, and the assessments that underpin them, must integrate near-term climate change scenarios, and elaborate the enabling condi-tions for transformative adaptation presented by IPCC.
Own the consequences of choice
While the onus rests with States, the responsibility to prevent and reduce risk is a shared one. Risk is ultimately the result of decisions that we all make, either individually or collectively.
The consequences of inaction in addressing the systemic nature of risk to individuals, organiza-tions and society are becoming increasingly appar-ent. Even half a planet away, risk that is allowed to grow unchecked – and in plain sight – can affect us (for example, the 2008 global financial crisis). While governments are responsible for incentiv-izing and leading risk reduction, as individuals, we must own the consequences of our decisions, our action or inaction, and the risks that we create and propagate. This means fundamental changes in our behaviour.
With the sense of urgency brought by IPCC, we must mobilize to collectively determine solutions.
x Executive Summary

We must examine our own decisions and choices – our inaction as much as our action – to determine how we are contributing to the risk ledger. We must honestly review how our relationship with behav-iour and choice transfers to individual and collective accountability for risk creation, or risk reduction. This understanding must translate into action, for example, by revisiting how and what we produce and consume.
More broadly, we must provide decision-friendly scenarios and options at relevant geospatial and temporal scales, providing data and information to support people to better understand the nature of their own risk and how to deal with it.
The ambition, richness and expansive spirit of cooperation required to meet systemic challenges will require levels of selfless humanism that match the scale of the challenge. Humans can (or should) decide on changing deeply embedded values that define higher level rules of operation and inter-action. If not, societies may continue to create wealth at the expense of declining ecological life support functions in a positive spiralling feedback loop that creates systemic risks with cascading effects and makes overarching economic, ecologi-cal and social systems increasingly susceptible to collapse.
This is a time of heightened global urgency; we are fast approaching the point where we may not be able to mitigate or repair impacts from cascading and systemic risk. This calls for intensified efforts, political resolve and sustained funding – by govern-ments, by the private sector, by cities, communi-ties and individuals – to build solutions based on a better understanding of systemic risk.
We must move away from short-sighted, segmented planning and implementation to transdisciplinary, collaborative approaches that build resilience and regenerate relevant resources, avoiding negative consequences. We must apply what we know and acknowledge the gaps in our knowledge, prioritizing ways to understand what we do not yet know. Our flexibility must be as dynamic as the changes we hope to survive.
Above all, we cannot let inertia and short-sighted-ness impede action. We must act with urgency and with greater ambition, proportional to the scale of threat.
xi

?
We make choices as to where we inhabit, how we build and
what research we do
Risk is the combination ofhazard, exposure and
vulnerability
Death, loss and damage is the function of the context
of hazard, exposure and vulnerability
There is no such thing as anatural disaster, only natural
hazards
GAR19 - A guided tour
Risk and the context of hazard, exposure and vulnerability
The Sendai Framework for Disaster Risk Reduc-tion 2015–2030 (Sendai Framework) emphasizes that risk is everyone’s business – explicitly iden-tifying the need for all-of-society and all-of-State institutions’ engagement. Past Global Assess-ment Reports (GARs) presented the now-accepted wisdom that managing risk does not equate to firefighters, first responders and civil protec-tion authorities managing the consequences of
This puts the onus on all of us to understand the nature of risk – that death, loss or damage (impacts that define a disaster – that are the disaster) are a function of the context of hazard,
realized risk. Risk must be understood in much broader terms – contextually and temporally. Previous GARs also emphasized that risk is a function of more than simply hazard, that disas-ters are not natural, but a product of the interac-tion of often naturally occurring events and human agency. We define these events as disasters when people suffer and things we care about are damaged or lost.
vulnerability and exposure. The Sendai Framework exhorts us to reduce risk by avoiding decisions that create risk, by reducing existing risk and by building resilience.
(Source: UNDRR 2019)
xiixii GAR19 - A guided tour

The Sendai Framework translates those messages into ones that can be used in the real world:
The Sendai Framework tells us that the risk land-scape has changed, that it is complex, that we have perhaps been slow to realize this, and that we have a lot of catching up to do. In calling for engagement
of all stakeholders, and integration with policy on climate change, development and risk financing, the Sendai Framework identifies that risk and disas-ters are part of a complex set of human systems that operate at different scales and along differ-ent time frames. Failure to manage these systems will reverse development gains for most people in the world, and place the functioning of our global society in jeopardy.
This GAR is about understanding better the sys-temic nature of risk, how we are able to recognize, measure and model risk, and about strategies to enhance the scientific, social and political coopera-tion needed to move towards systemic risk gover-nance. It reinforces the message that we need to reduce vulnerability and build resilience if we are to reduce risk. It looks at what countries and regional and international organizations have been doing according to formal reporting under the Sendai Framework Monitor (SFM). It also considers country practices in developing national and local plans to enhance risk reduction capacity, to integrate disas-ter risk reduction (DRR) with development planning and climate change adaptation (CCA), and to pay special attention to risk in rapidly growing cities and fragile/complex contexts.
This GAR demonstrates the urgency of the action and ambition required, reinforced by current climate science. We can expect non-linear changes in the intensity and frequency of hazards. We know that many of the ways in which human activity will be affected are, as yet, unforeseeable, and that we are fast approaching the point where we may not be able to mitigate or repair impacts from cascading and systemic risk in our global systems. In propel-ling systems-based thinking and approaches to the fore, this GAR adds to the call for urgent action to deal with simultaneous systemic change around land, ecosystems, energy, industrial and urban systems, and the social and economic transforma-tions that these infer.
• Risk is everyone’s business: “While the enabling, guiding and coordinating role of national and federal State Governments remain essential, it is necessary to empower local authorities and local communities to reduce disaster risk, including through resources, incentives and decision-making responsibilities, as appropri-ate.” (Para. 19f)
• Disasters are not natural: “The present Frame-work will apply to the risk of small-scale and large-scale, frequent and infrequent, sudden and slow-onset disasters caused by natural or man-made hazards, as well as related environmental, technological and biological hazards and risks. It aims to guide the multi-hazard management of disaster risk in development at all levels as well as within and across all sectors.” (Para. 15)
• Risk is a function of the decisions we take and how we consume, which then shape the world around us: “Business, professional associations and private sector financial institutions, includ-ing financial regulators and accounting bodies … to integrate disaster risk management, includ-ing business continuity, into business models and practices through disaster-risk-informed investments.” (Para. 36c)
• Understanding and managing risk is everyone’s business and integral to the success of all 2015 agendas: “Disaster risk reduction requires an all-of-society engagement and partnership” and “Civil society, volunteers, organized volun-tary work organizations and community-based organizations to participate, in collaboration with public institutions, to, inter alia,….advocate for resilient communities and an inclusive and all-of-society disaster risk management that strengthen synergies across groups.” (Paras. 19d and 36a)
xiii

Setting the scene
The introduction, Chapter 1: How we got to now, provides background on a decades-long shift that has brought us to the Sendai Framework. It traces how a shared global policy commitment has emerged from the idea of managing disasters and seeking to mainstream DRR, to an approach of managing the wider risks embedded in our social, economic and environmental activity. The Sendai Framework is about transitioning towards resilient and sustainable – even regenerative – societies in a way that is informed by a deeper understanding of risk and its drivers.
Chapter 1 also introduces the wider context of the Sendai Framework as one of a group of key interna-tional agreements adopted in 2015 and 2016 that look towards a better future for people and societ-ies around the globe. These include:
These are reference points for implementation of the Sendai Framework’s concept of integrated risk governance, at all scales.
The substantive elements of this GAR begin with Chapter 2: Systemic risks, the Sendai Framework and the 2030 Agenda, which is an examination of the nature of systemic risk and the systems-based approaches that the Sendai Framework invokes. There are profound implications in making the shift from a hazard-by-hazard view of risk, to a holistic understanding of disaster risk as a dynamic three-dimensional topography that changes through time. This chapter introduces and elaborates the concept of systemic risk. It delves into this field to explore what we need to understand, and how it might be possible to change the ways we think, learn and act.
The chapter discusses how current approaches measure and model holistic representations of disaster risk in light of the concept of systemic risk. It describes different types of systemic risks that vary with respect to temporal patterns, the ways in which feedback works in systems and the ways in which the scales used to view the system are related. It then considers the issue of governance of systemic risks and how it might be possible to change the ways we think about risk and behaviour. It examines combinations of theory, human ingenuity and uses of technology that may help to tackle risk reduction in systems, and to interrogate the complicated and complex nature of the dynamic interactions of social, economic, politi-cal and ecological dimensions.
Chapter 2 also tackles the topic of collective intelli-gence, the issue that data can change as a function of context, and considers the collaboration neces-sary to advance our understanding of systemic risks. It introduces the Global Risk Assessment Framework, which is an open and collaborative initiative called for, designed and developed by experts and facilitated by the United Nations Office for Disaster Risk Reduction. This framework seeks to help the world deal with complexity, uncer-tainty and inefficiencies in risk assessment and to provide decision makers at different scales with enhanced risk information and actionable insights, tools and demonstrations that are open, inclusive, collaborative and recognisant of the systemic nature of risk.
• Transforming our World: 2030 Agenda for Sus-tainable Development (2030 Agenda), which provides a plan of action for people, planet and prosperity that envisages a world free of poverty, hunger, disease and want, where all life can thrive
• Paris Agreement on climate change, which provides the foundation for sustainable, low-carbon and resilient development in a changing climate
• Addis Ababa Action Agenda, which outlines fis-cally sustainable and nationally appropriate mea-sures to realign financial flows with public goals and reduce structural risks to inclusive growth
• New Urban Agenda, which introduces a new model of urban development that promotes equity, welfare and prosperity
• Agenda for Humanity, which addresses conflict-related risk drivers and seeks to reduce future vulnerability through investment in humanitarian response that builds local capacities
xiv GAR19 - A guided tour

The Sendai Framework’s broadened view of the world’s risk
Part I highlights how risk science is changing. Hazards interact with each other in increasingly complex ways, and our understanding of this is expanding. Vulnerability can have myriad dimen-sions. Calculating the exposure to a virus is differ-ent to calculating the exposure to a landslide. Representation of risk in this GAR is therefore not as elegant as it has been in the past. Risk is messy.
The production of calculations to represent the risk a country faces is a highly complicated task that relies on complex equations and the inputs of multi-ple data sets. This produces an elegant series of metrics and graphics: multi-hazard average annual loss, probable maximum loss and hybrid loss exceedance curves. All are impressive scientific ways to inform a community about how to reduce risk. However, in practice, they do not actually do that.
Such metrics may be multi-hazard, but they rely on hazards being probabilistically measurable. Some hazards can be measured this way, but with others, it is harder. Return periods for seismic risk are well understood, but flooding is more complicated because there are many more drivers of floods (coastal and riverine floods, human infrastructure and settlements, etc.). It is harder still for droughts and insect infestations. And when hazards are no longer natural hazards only, but include industrial accidents, epidemics or agricultural blights, those elegant calculations become untenable.
The metrics usually rely on measuring exposure and vulnerability of the built environment. This is an important part of the cost of disasters and the nature of risk, but it does not take into account the human cost in terms of lives lost, health and livelihoods affected, or the differential impacts of hazards on vulnerable people.
With this recognition of uncertainty at the fore, Chapter 3: Risk, investigates how we currently monitor and model a range of hazards, includ-ing tsunamis, landslides, floods and fires. Other hazards are less familiar as they were not part of the Hyogo Framework for Action. However, they are part of the Sendai Framework and include: biological, nuclear/radiological, chemical/industrial, NATECH (natural hazards triggering technological disasters) and environmental hazards. Chapter 3 looks at our understanding of how these hazards interact with exposure and vulnerability.
Chapter 4: Opportunities and enablers of change highlights that the technological, policy, regula-tory and scientific context has changed to enable new kinds of analysis, new understanding and new ways of communicating risk. It also informs us that disaster risk science has new partners. Thousands of people have realized they have a role to play in reducing risk since the Sendai Framework was adopted. Epidemiologists, nuclear safety experts, climate researchers, utility companies, financial regulators, zoning officials and farmers can all see themselves reflected in the Sendai Framework. People interested in protecting life, assets and the environment have been interlinking their knowledge and energy.
However, new opportunities unveil new challenges. Chapter 5: Challenges to change outlines some issues such as changing our mindsets, political factors, and technological and resource challenges. To succeed, the technical enablers of improved data science, risk assessment and risk modelling rely on the willingness of people to work with other disciplines, across cultural, language and political boundaries, and to create the right regulatory envi-ronment for new and urgent work to proceed.
Chapter 6: Special section on drought links all these themes. Drought risk contains elements of meteorology, climate change, agriculture, power politics, food security, commodity markets, soil science, hydrology, hydraulics, etc. Drought is highly destructive and is projected to become more frequent and more severe in many parts of the world due to climate change. This chapter lays
(Part I, Chapters 3–6)
xv

the groundwork for the GAR 2020 special report on drought, but in this GAR, it provides a detailed example of complex, systemic risk that can be reduced and managed only through a systems response.
Implementation of the Sendai Framework and disaster risk-informed sustainable development
The United Nations General Assembly endorsed the 2017 recommendations of the Open-ended Intergovernmental Expert Working Group on indi-cators and terminology relating to DRR, which was established to develop indicators for monitoring implementation of the Sendai Framework. The reporting period for Member States has thus been short. Consequently, the data available for infer-ring trends in terms of the targets is limited and does not yet offer statistical confidence. However, we can observe with confidence certain patterns in terms of the magnitude and the geographic and socioeconomic distribution of disaster impacts and abstract several points of departure for where and how countries have managed to reduce disaster risk. Nevertheless, we note that the observed period is still too short to reach definitive conclusions on a global scale.
Part II introduces the global disaster risk land-scape with emphasis on the globally agreed goals and targets of the Sendai Framework and the 2030 Agenda. It takes stock of experiences so far, with a comparative analysis of country-specific evidence on national reporting, including roll out of the new SFM.
Chapter 7: Risk reduction across the 2030 Agenda sets out the targets and agreed indicators of the
Sendai Framework and the disaster-related Sustain-able Development Goals (SDGs) of the 2030 Agenda, now that integrated and common report-ing by Member States has been established. Since 2015, significant efforts have been made to imple-ment the Sendai Framework, by an increasingly diverse spectrum of stakeholders, reaching across different geographies, sectors and scales. This chapter concludes with a discussion of the type of data needed for effective monitoring and also recognizes that the current gaps in data and knowl-edge limit governments’ ability to act and effectively communicate with the public on reducing risk.
Chapter 8: Progress in achieving the global targets of the Sendai Framework presents the latest data available – including those presented by the ninety-six countries using SFM since it went live on 1 March 2018 - and infers early lessons on the status of the global disaster risk landscape. There has been growing awareness since 2015 of the need for better data. SFM represents a unique opportunity to streamline interoperable data on disaster losses. This chapter recognizes that national disaster loss databases may use different methodologies, and that reporting data in a comparable manner to the SFM system remains a challenge for many coun-tries, not just developing countries.
Chapter 8 also reviews the contribution of SFM to reporting on relevant SDGs, by underlining the cross benefits of integrated reporting across the global frameworks. Recognizing that extra efforts are required to optimize these interactions to the mutual benefit of different frameworks, Part II offers some insights on improved opportunities for cross reporting through different SDGs.
Chapter 9: Review of efforts made by Member States to implement the Sendai Framework looks at successes and challenges as they emerge from the first years of reporting, including in terms of data, statistics and monitoring capability, and provides recommendations for further improve-ments. It also highlights best practices in capacity-building, monitoring and reporting, and discusses engagement of a broad spectrum of State institu-tions and non-State actors.
(Part II, Chapters 7–9)
xvi GAR19 - A guided tour

Creating the national and local conditions to manage risk
The Sendai Framework calls on governments to adopt and implement national and local DRR strate-gies and plans that meet its essential elements and which are thereby aligned with its goal and princi-ples (Target E).
Fulfilment of Target E is a foundational step for governments to: (a) achieve the ultimate targets of the Sendai Framework by 2030 and (b) move towards risk governance that incorporates the broadened risk scope of the Sendai Framework in the context of the 2030 Agenda, and which incor-porates systems-based approaches. It requires integration across different sectors and levels of government, engagement with civil society and the private sector, and contemplation of different time frames to address current and emerging risks. This is why Member States agreed that Target E should be achieved by 2020. National and local DRR strat-egies and plans are a necessary foundation for broader implementation of the Sendai Framework and for risk-informed sustainable development.
Part III discusses the enabling environment for Member States to develop and effectively imple-ment national and local plans and strategies, including the technical support systems and resources available around the Sendai Frame-work and the other post-2015 agendas mentioned above. Chapter 10: Regional support and national enabling environments for integrated risk reduc-tion discusses important aspects of the enabling environment, including the mutual support and resources that Member States access through their regional organizations and agreements. These can be formal intergovernmental mechanisms or innovative multi-stakeholder partnerships, and the governance framework of laws, policies, institutions and financing in place within Member States at national and local levels.
Part III then moves onto the evidentiary chapters on national and local practices, extending the Sendai Framework Monitoring data reported in Part II with qualitative analysis. Chapters 11–13 provide research and analysis on current practices in devel-oping national and local DRR strategies and plans that align with the Sendai Framework, integration of DRR into development planning, and integration of DRR with national climate adaptation strategies and plans. Taking Sendai Framework Target E as the starting point, these chapters aim to provide a picture of the challenges, good practices and lessons learned in using a systems-based approach to risk reduction at national and local levels when developing and implementing these types of government policy instruments.
Chapter 11: National and local disaster risk reduc-tion strategies and plans shows that while there are many examples of good practices around the world – with case studies highlighting how some countries have overcome resource and capac-ity challenges – Member States cannot assume that existing arrangements are fit for purpose under the broadened hazard and risk scope of the Sendai Framework. Likewise, Chapter 12: Disas-ter risk reduction integrated in development plan-ning and budgeting examines the challenges and gathers examples of good practices, notably the opportunities provided during renewal of national socioeconomic development plans. Chapter 13: Integration between disaster risk reduction and national climate adaptation strategies and plans examines the degree of integration between DRR and CCA plans, including in the context of formal reporting to the United Nations Framework Conven-tion on Climate Change and the Paris Agree-ment, and internationally financed CCA projects. The chapter is couched in terms of the existen-tial threat posed by global warming if it exceeds a temperature of 1.5°C above pre-industrial levels, as presented in the 2018 report of the Intergovernmen-tal Panel on Climate Change.
Part III concludes with two chapters on risk environ-ments that are of concern due to their complexity and potential for risk creation, including cascad-ing and compounding risks. Rapidly growing urban
(Part III, Chapters 10–15)
xvii

environments and fragile or complex situations can create new risks as well as compound risks arising from natural hazards, armed conflict, poverty, malnutrition and disease outbreaks, thereby increasing the vulnerability of affected populations and reducing their coping capacity. They exemplify the imperative for systems-based approaches in risk governance, including addressing socioeco-nomic vulnerability in government policy and the engagement of non-State actors in a wide concept of risk governance.
Chapter 14: Local disaster risk reduction strate-gies and plans in urban areas considers urban
Conclusions, recommendations and supporting materialPrincipal Conclusions and recommendations of this GAR19 are consolidated in the above Executive summary, as well as in the accompanying document, GAR19 Distilled. They are drawn from the conclusions and recommendations presented in each chapter and part.
As with previous GARs, this report is underpinned and informed by the extensive research, knowledge and expertise of experts and competent bodies. This GAR continues the tradition of sponsoring and presenting additional, innovative research and evidence to support our understanding of the creation and propagation of disaster risk, as well as the conducive conditions and impediments to its management.
GAR19 introduces a more formal process of generating commissioned research. The online section GAR19 contributing papers presents research selected following a call for papers and which successfully passed external, academic peer review. Additional material is also available in the online Bibliography.
This GAR, and the supporting material and data that informed its development, can be accessed online and downloaded from the GAR19 website (www.gar.unisdr.org/2019), which offers readers the opportunity to explore the report interactively.
environments, which are growing rapidly in develop-ing countries around the globe and which present challenges for many local governments. These challenges are amplified where the development of urban environments is accompanied by the growth of informal settlements. Chapter 15: Disas-ter risk reduction strategies in fragile and complex risk contexts tackles the critical and complicated aspects of risk reduction in fragile or complex situ-ations – such as those created by population move-ments due to armed conflict and famine, in which decision makers need to take account of known threats as well as new and emerging sources of risk that are difficult to foresee.
xviii GAR19 - A guided tour

xix

ContentsForeword iii
Executive Summary iv
GAR19 - A guided tour xii
Chapter 1: How we got to now 25
1.1 Evolution of the global policy agenda for disaster risk reduction 25
1.2 Sendai Framework and the pursuit of risk-informed sustainable development 28
Chapter 2: Systemic risks, the Sendai Framework and the 2030 Agenda 35
2.1 Assessing and analysing systemic risks: mapping the topology of risk through time 37
2.2 Spatio-temporal characteristics of systemic risks 47
2.3 Systemic risk governance 54
2.4 Collective intelligence, contextual data and collaboration 58
2.5 Shifting the paradigm – introducing the Global Risk Assessment Framework 64
Chapert 2 Conclusions and recommendations 70
Part I: The Sendai Framework’s Broadened View of the World’s Risk 79
Chapter 3: Risk 82
3.1 Hazards 83
3.2 Exposure 137
3.3 Vulnerability 146
xx Contents

Chapter 4: Opportunities and enablers of change 158
4.1 Changes in technology and data sharing 158
4.2 Conclusions 164
Chapter 5: Challenges to change 165
5.1 Mindset challenges 165
5.2 Political challenges 166
5.3 Technological challenges 168
5.4 Resource challenges 169
5.5 Conclusions 169
Chapter 6: Special section on drought 171
6.1 Drought indicators 172
6.2 Climate change and future droughts 173
6.3 Assessing global drought risk 176
6.4 Assessing the risk for agriculture and other primary sectors 178
6.5 Considerations for other sectors 183
6.6 Drought impact 191
6.7 Recognizing drought as a complex hazard 193
6.8 Drought risk management 196
6.9 Way forward 199
6.10 Emerging issues: setting the context for the 2020 special report on drought 200
Part I Conclusions and recommendations 201
xxi

Part II: Implementation of the Sendai Framework and 206Disaster Risk-informed Sustainable Development
Chapter 7: Risk reduction across the 2030 Agenda 208
7.1 Sendai Framework targets and monitoring: a snapshot 208
7.2 Data required to monitor the targets 213
7.3 Conclusions 217
Chapter 8: Progress in achieving the global targets of the Sendai Framework 218
8.1 Sendai Framework Monitoring database 219
8.2 Disaster losses: Sendai Framework Targets A–D 221
8.3 Target E: Progress on disaster risk reduction strategies for 2020 252
8.4 Target F: Measuring international cooperation 256
8.5 Target G: Multi-hazard early warning systems, and risk information and assessment 258
8.6 Conclusions on the first reporting data for Sendai Framework Targets A–G 261
CHAPTER 9: Review of efforts made by Member States to implement 264the Sendai Framework
9.1 Disaster loss databases 265
9.2 Successes and challenges in establishing national monitoring capabilities 268
9.3 Support for thematic and sectoral review of progress 281
9.4 Development of national disaster-related statistics 283
9.5 Conclusions 285
Part II Conclusions and recommendations 286
xxii Contents

Part III: Creating the National and Local Conditions to manage Risk 289
Chapter 10: Regional support and national enabling environments for 297integrated risk reduction
10.1 Regional support for integrated risk reduction 297
10.2 National enabling environments for integrated risk reduction 309
10.3 Conclusions 314
CHAPTER 11: National and local disaster risk reduction strategies and plans 315
11.1 Sendai Framework monitoring data on Target E 315
11.2 The importance of national and local disaster risk reduction strategies and plans 316
11.3 Aligning strategies and plans with the Sendai Framework 318
11.4 Lessons learned from the Hyogo Framework for Action and Sendai Framework 320
11.5 Good practices at national and local levels 322
11.6 Conclusions 331
Chapter 12: Disaster risk reduction integrated in development 333planning and budgeting
12.1 The importance of integrating disaster risk reduction in development planning 333
12.2 The Sendai Framework and integrating disaster risk reduction in development 335
12.3 Country experiences with integrating disaster risk reduction into development 337planning and budgeting
12.4 Conclusions 354
Chapter 13: Integration between disaster risk reduction and national climate 355change adaptation strategies and plans
13.1 Disaster and development risks from climate change 355
13.2 Synergies between climate change adaptation and disaster risk reduction 361
xxiii

13.3 Guidance and mechanisms for integrated climate change adaptation under 363the United Nations Framework Convention on Climate Change
13.4 Selected country experiences with integrated climate and disaster risk reduction 368
13.5 Pacific region approach to integrated climate, disaster and development policy 378
13.6 Conclusions 381
Chapter 14: Local disaster risk reduction strategies and plans in urban areas 383
14.1 Significance of urban areas and local-level action in the 2030 Agenda 383
14.2 Opportunities and benefits of local disaster risk reduction strategies and plans 385
14.3 Design, development and implementation challenges of local disaster risk reduction 389strategies and plans
14.4 Enabling factors for developing and implementing local disaster risk 397reduction strategies and plans
14.5 Conclusions 401
Chapter 15: Disaster risk reduction strategies in fragile and complex risk contexts 403
15.1 Problem statement 403
15.2 Empirical examples of disaster risk reduction in fragile contexts 404
15.3 Implications of complexity for addressing disaster risk 413
15.4 Conclusions 418
Part III Conclusions and recommendations 419
Abbreviations and acronyms cdxxvi
Acknowledgements cdxxx
References cdxxxii
Box and figure sources cdlxiv
xxiv Contents

Chapter 1: How we got to now
1.1
Figure 1.1. Risk reduction – a journey through time and space
(Source: UNDRR 2019) 1 (United Nations General Assembly 2015a)
The adoption of the Sendai Framework for Disaster Risk Reduction 2015–2030 (Sendai Framework)1 at the third United Nations World Conference on Disaster Reduction (WCDR) – and its subsequent endorsement by the General Assembly of the United Nations (Resolution A/RES/69/283) in June 2015 – marked the culmina-tion of a process formally begun in the 1970s.
Evolution of the global policy agenda for disaster risk reduction
2525

1970sHaving observed that actual and potential conse-quences of natural hazards were becoming so severe, and were of such a scale, that much greater emphasis on pre-disaster planning and prevention was imperative, the United Nations Disaster Relief Coordinator convened an International Expert Group Meeting in July 1979 to review six years’ worth of work developing a methodology for risk and vulner-ability analysis.
1980s This work laid the foundations for the develop-ment, 10 years later, of the International Frame-work of Action for the International Decade for Natural Disaster Reduction (IDNDR)2, beginning on 1 January 1990.3
1990s Supported by a Secretariat established at the United Nations Office in Geneva, IDNDR was intended to reduce – through concerted international action – loss of life, damage to property, and social and economic disruption caused by “natural disas-ters”, especially in developing countries. With a strong emphasis on engaging and deploying exist-ing scientific and technical knowledge, IDNDR succeeded in raising public awareness – notably of governments – to move away from fatalism and to reduce disaster losses and impacts. A pivotal moment in IDNDR was the adoption (in 1994) of the Yokohama Strategy for a Safer World: Guidelines for Natural Disaster Prevention, Preparedness and Mitigation, containing the Principles, the Strategy and the Plan of Action (Yokohama Strategy)4 at the World Conference on Natural Disaster Reduction.
1994The Yokohama Strategy marked the beginning of a significant shift in the political and analytical context within which disaster reduction was being considered. While IDNDR was largely influenced by scientific and technical approaches, the Yokohama Strategy attributed great importance to socioeco-nomic vulnerability in disaster risk analysis, empha-sizing the crucial role of human actions in reducing the vulnerability of societies to natural hazards and disasters.
2000sHaving been so mobilized, at the conclusion of IDNDR, Member States determined in 1999 that IDNDR would be succeeded by the International Strategy for Disaster Reduction (ISDR).5 This would seek to: (a) enable communities to become resil-ient to the effects of natural hazards, and related technological and environmental disasters, thus reducing the compound risk posed to social and economic vulnerabilities within modern societies, and (b) proceed from protection against hazards to the management of risk, by integrating risk prevention strategies into sustainable develop-ment activities.
At the end of the period covered by the Yokohama Strategy, in 2004 and 2005, the United Nations Secretariat of the International Strategy for Disas-ter Reduction carried out a review of the Yoko-hama Strategy and Plan of Action for a Safer World. The Yokohama Review found evidence of greater official and public understanding of the effects of disasters on the economic, social and political fabric of societies, and stated that “signifi-cantly greater commitment in practice is required”. It also identified challenges and gaps in five main areas: governance; risk identification, assessment, monitoring and early warning; knowledge manage-ment and education; reducing underlying risk factors; and preparedness for effective response and recovery.
2005–2015 The Yokohama Review was submitted to the second WCDR in Kobe, Japan, in January 2005. It formed the basis for formulation of the Hyogo Framework for Action 2005–2015: Building the Resilience of Nations and Communities to Disas-ters (HFA). The adoption and implementation of HFA following WCDR marked a milestone in cata-lysing national and local efforts to reduce disaster risk and in strengthening international cooperation through the development of regional strategies, plans and policies, and the creation of global and regional platforms for disaster risk reduc-tion (DRR), as well as the adoption by the United Nations of the United Nations Plan of Action on Disaster Risk Reduction for Resilience.
26 Chapter 1

Member States adopted a series of principles to support implementation of HFA including: the primary responsibility of States to prevent and reduce disaster risk together with empowered relevant national and local authorities, sectors and stakeholders; all-of-society, inclusive, engage-ment; coordination within and across sectors and with relevant stakeholders at all scales; a multi-hazard approach and inclusive, evidence-based risk-informed decision-making; addressing underlying risk factors through public and private investments informed by disaster risk; strengthening interna-tional cooperation; and emphasis on developing countries.
HFA provided detailed guidance and policy space to advance the management of underlying risks in countries’ growth and development – a space that the disaster risk management (DRM) commu-nity mostly failed to fill. Nevertheless, in establish-ing policy, legislative and planning frameworks, many countries laid the foundation for the shift from managing disasters to managing risk, which would eventually be enshrined in the Sendai Framework. HFA oversaw inter alia an increasing emphasis on multi-hazard, as opposed to single-hazard, approaches to risk reduction, albeit in a context characterized by competition for political or economic priority, limitations in terms of capac-ity, technical and financial resources across sectors and scales, and the subsequent application of risk information in decision-making.
Least progress was made in HFA Priority for Action 4 (Reduce the underlying risk factors). In general, institutional, legislative and policy frameworks did not sufficiently facilitate the integration of disaster risk considerations into public and private invest-ment, environmental and natural resource manage-ment, social and economic development practices in all sectors, land-use planning and territorial development.
Weak alignment and coherence in policies, finan-cial instruments and institutions across sectors became a driver of risk. Few countries adopted frameworks of accountability, responsibility and enforcement and also appropriate political, legal
and financial incentives to actively pursue risk reduction and prevention.
In addition, few countries addressed the often-interdependent risks they faced in a holistic manner, with investments in key sectors such as health, agri-culture and food security, education, infrastructure, tourism and water omitting disaster risk. Incentive structures were found to be in need of reinforcing, including the encoding of costs and benefits of DRR in economic valuations, competitiveness strategies and investment decisions, including in debt ratings, risk analysis and growth forecasts or the inaccurate pricing of risk in the global financial architecture.
Therefore, hazard exposure in both higher and lower income countries increased faster than vulner-ability decreased, new risks were being generated faster than existing risks were being reduced. The value of lost and damaged housing, businesses, infrastructure, schools, health facilities and other assets increased relentlessly, leading to increases in contingent liability and sovereign risk for govern-ments in many instances.
Underpinned by poorly planned and managed urban development, environmental degradation, poverty and inequality, and also weak risk governance, frequent and extensive low-severity disasters were found to increasingly affect the more vulnerable elements of society, thus challenging the achieve-ment of social development goals. With the causes and consequences of risk being transmitted across geographic regions and income classes, between present and future generations and between social and economic sectors, HFA helped to iden-tify disaster risk as a critical issue of global and regional governance, national safety and security, and a threat to the achievement of sustainable development.
2 (United Nations General Assembly 1987)3 (United Nations General Assembly 1989)4 (United Nations General Assembly 1989)5 (United Nations General Assembly 2000)
27
At the end of implementation of HFA, Member States recognized that efforts had not led to reduced physical losses and economic impacts. They concluded that the focus of national and inter-national attention must shift from protecting social and economic development against perceived external shocks, to transforming growth and devel-opment to manage risks, in a holistic manner, in a way that promotes sustainable economic growth, social well-being and a healthy environment that strengthens resilience and stability.
This conclusion formed the basis for the develop-ment of the Sendai Framework, and the subsequent increased emphasis on addressing the underlying drivers of risk, preventing the creation of new risk, reducing the existing stock of risk and strengthen-ing the resilience of nations and communities.
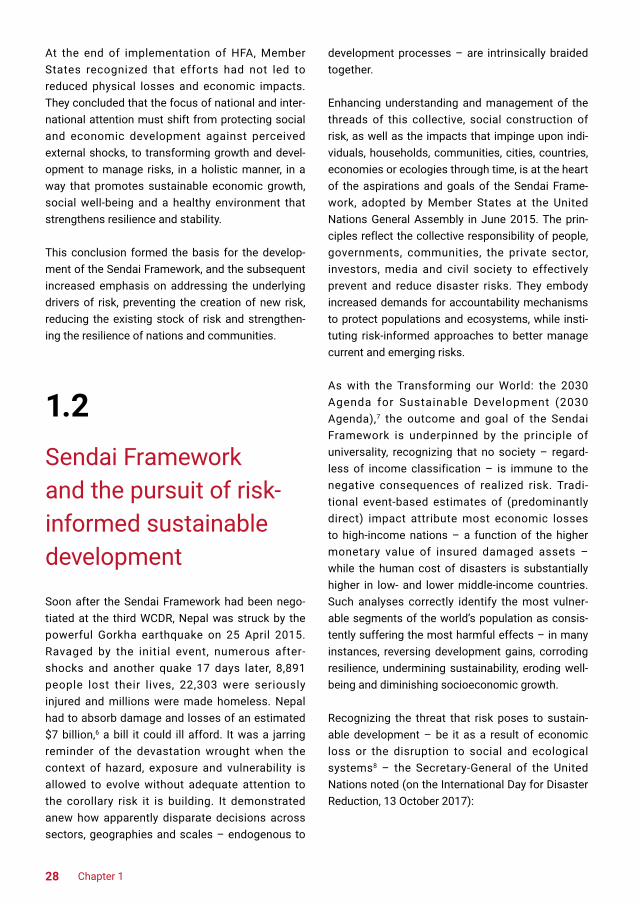
1.2 Sendai Framework and the pursuit of risk-informed sustainable development
Soon after the Sendai Framework had been nego-tiated at the third WCDR, Nepal was struck by the powerful Gorkha earthquake on 25 April 2015. Ravaged by the initial event, numerous after-shocks and another quake 17 days later, 8,891 people lost their lives, 22,303 were seriously injured and millions were made homeless. Nepal had to absorb damage and losses of an estimated $7 billion,6 a bill it could ill afford. It was a jarring reminder of the devastation wrought when the context of hazard, exposure and vulnerability is allowed to evolve without adequate attention to the corollary risk it is building. It demonstrated anew how apparently disparate decisions across sectors, geographies and scales – endogenous to
development processes – are intrinsically braided together.
Enhancing understanding and management of the threads of this collective, social construction of risk, as well as the impacts that impinge upon indi-viduals, households, communities, cities, countries, economies or ecologies through time, is at the heart of the aspirations and goals of the Sendai Frame-work, adopted by Member States at the United Nations General Assembly in June 2015. The prin-ciples reflect the collective responsibility of people, governments, communities, the private sector, investors, media and civil society to effectively prevent and reduce disaster risks. They embody increased demands for accountability mechanisms to protect populations and ecosystems, while insti-tuting risk-informed approaches to better manage current and emerging risks.
As with the Transforming our World: the 2030 Agenda for Sustainable Development (2030 Agenda),7 the outcome and goal of the Sendai Framework is underpinned by the principle of universality, recognizing that no society – regard-less of income classification – is immune to the negative consequences of realized risk. Tradi-tional event-based estimates of (predominantly direct) impact attribute most economic losses to high-income nations – a function of the higher monetary value of insured damaged assets – while the human cost of disasters is substantially higher in low- and lower middle-income countries. Such analyses correctly identify the most vulner-able segments of the world’s population as consis-tently suffering the most harmful effects – in many instances, reversing development gains, corroding resilience, undermining sustainability, eroding well-being and diminishing socioeconomic growth.
Recognizing the threat that risk poses to sustain-able development – be it as a result of economic loss or the disruption to social and ecological systems8 – the Secretary-General of the United Nations noted (on the International Day for Disaster Reduction, 13 October 2017):
28 Chapter 1

6 (Nepal 2015)7 (United Nations General Assembly 2015c)8 (Benson 2016); (Hallegatte et al. 2017)9 (Internal Displacement Monitoring Centre 2019)10 (Wallemacq, Below and McLean 2018)11 (Benson 2016); (Hallegatte et al. 2017); (ESCAP 2017a)
12 (ESCAP 2017b)13 (Benson 2016); (Kousky 2016)14 (IFRC 2015); (IFRC 2017)15 (ESCAP 2017a); (Hallegatte et al. 2017)16 (UNFCCC 2016)17 (United Nations General Assembly 2017b)
The challenge is to move from managing disas-ters themselves to managing risk. Poverty, rapid urbanization, weak governance, the decline of ecosystems and climate change are driving disaster risk around the world. The Sendai Framework for Disaster Risk Reduction with its seven targets for the prevention of disasters and reducing disaster losses is essential to achiev-ing the Sustainable Development Goals.
Unresolved vulnerabilities, rising exposure and proliferating, mutable hazard events continue to drive catastrophic loss of life, disrupt livelihoods and fuel new displacement – an additional 17.2 million people were internally displaced in 2018 alone as a result of climate-related disasters and natural hazards.9 It is estimated that people in least developed countries are, on average, six times more likely to be injured, lose their home, be displaced or evacuated, or require emergency assistance, than those in high-income countries.10
The impact is greatest on the most marginalized populations, exacerbating inequality and further entrenching poverty, where vulnerabilities trans-late into reduced access to entitlements, impaired capabilities and opportunities.11 For instance, it is estimated that 35.6% of the population affected by floods in Pakistan in 2010 consequently slipped under the poverty line as a result.12 Beyond focused attribution to single events, when extending the spatio-temporal nature of consequence analy-sis, impacts are often found to be a function of a series of associated shocks – famine, disease and displacement for instance – that collectively prompt disruptions in multiple dimensions (e.g. live-lihoods, educational trajectories or labour-market opportunities).
Such analyses remain a grossly under investigated domain. The longitudinal, indirect consequences of the realization of accumulated risks are likely to affect and potentially reverse development gains in affected areas for generations to come. These consequences may be in the form of deprivations in early childhood nutrition, disease, school inter-ruption, ill-developed cognitive and social skills, or limited labour-market opportunities. Children are particularly affected by the disruption of education and health-care systems;13 women and girls suffer higher levels of violence and generally worse eco-nomic outcomes following disasters;14,15 and the extent to which mental health, well-being and the ability to lead a dignified life are negatively affected is little understood.
Such are the current limitations in understanding of risk and the interdependencies and correlations that exist within and among social, ecological, economic and political systems, which, in turn, dimin-ish the ability to predict or influence outcomes. However, the principles of integration and indivis-ibility that underpin the Sustainable Development Goals (SDGs), and the related call in the Sendai Framework for the adoption of systems-based approaches and an improved understanding of the dynamic nature of systemic risk, are driving new lines of enquiry, model methodologies, and oppor-tunities for data cultivation and exchange among communities.
1.2.1 Risk reduction post-2015
All post-2015 agreements – namely the 2030 Agenda, the Paris Agreement on climate change,16 the New Urban Agenda (NUA),17 the Addis Ababa
29

Addis Ababa
Action Agenda
Agenda for
Hum
anitySendai
Framework
2030
Age
nda
Paris
AgreementNew UrbanAgenda
Economic
Loss
Affected
PeopleInfrastrcutu
e Damage
Mortality
BasicServices
Disruption
REDUCE
INCREASE
Cooperation
Access ToRisk
Information
/Warnings
Disaster Risk
Reduction
Strategies
RiskA
ssessment
Resilience
Prevention
Sustain
able
dev
elop
men
t goals
Sustain
able
dev
elop
men
t goals
RISK-INFORMEDSUSTAINABLEDEVELOPMENT
Action Agenda (AAAA)18 and the Agenda for Humanity19 – include elements of DRR and resil-ience in their scope.20 They all point to the intercon-nection of global challenges and risks.
The implementation of these agreements requires and provides the opportunity to address underlying risk drivers by fostering risk-informed investment and focusing on issues such as poorly planned urbanization, climate change, environmental degra-dation and poverty.21 In so doing, common actions
will simultaneously support the achievement of the goals and targets of all agreements, including the Sendai Framework. The relevance of DRR to the post-2015 development agreements and the links among them create opportunities to: build interna-tional coherence and foster risk-informed policy and decision-making; promote multi-hazard and cross-sectoral approaches to assessing risk; and encourage a deeper understanding of socioeco-nomic and environmental vulnerability across differ-ent sectors and levels of government.22
Figure 1.2. Risk-informed sustainable development
(Source: UNDRR 2019)
30 Chapter 1

18 (United Nations General Assembly 2015b)19 (United Nations General Assembly 2016a)20 (Peters et al. 2016); (Murray et al. 2017); (Garschagen et al. 2018)21 (UNISDR 2015b)22 (Murray et al. 2017); (United Nations 2018)
23 (Mercy Corps 2013); (IRDR and ICSU 2014); (Peters et al. 2016); (Benson 2016); (Hallegatte et al. 2017)24 (United Nations 2018)25 (United Nations 2015d)26 (UNISDR 2015b)
Though each agreement frames disaster risk and resilience from different perspectives, there is a common understanding that DRM is one of the prerequisites to building resilience. This is an imper-ative to achieving sustainable development and a reminder of how integrated the responses ought to be.23 Reinforcing the point, the Secretary-General of the United Nations emphasized that DRR must be at the core of sustainable development strategies and economic policies if countries are to fulfil the commitment in the 2030 Agenda and ensure that “no one will be left behind”.24
1.2.2 2030 Agenda
Unlike HFA and the Millennium Development Goals, implementation of the 2030 Agenda and its SDGs have now been linked with the Sendai Framework. This was partly at the request of Member States to reduce the overlapping reporting burden by estab-lishing common metrics and integrated reporting protocols (see Part II of this GAR), but also due to a wider shift in recognition that these agendas are mutually dependent in achieving their objectives (risk-informed sustainable development).
The 2030 Agenda and its SDGs build on the achievements of the Millennium Development Goals, and aim to go further towards ending all forms of poverty and promoting prosperity, peace and partnerships, while protecting the planet.25 The 2030 Agenda recognizes the core role that risk reduction and resilience play in sustainable devel-opment policy, by making direct reference to the Sendai Framework, by adopting common indicators and by setting targets related to risk reduction in many SDGs.26
The adoption of common metrics for measuring the goals and targets of the two agreements and the development of mutually reinforcing implementa-tion architectures (including common data and inte-grated monitoring and reporting protocols) support the prospect of a greatly enriched data environ-ment. Disaggregated data sets and statistical data, hitherto scarce in the disaster risk realm, are now prerequisites for measuring risk-informed sustain-able development. Consequently, the international statistical community has already been mobilized (see Chapters 7 and 9); improvements in data avail-ability, quality and accessibility are anticipated as these capabilities are deployed and other resources (potentially through the global and national SDGs architecture) are made available to countries seeking to redress data and capacity gaps.
The expectation is that with an enriched data envi-ronment and enhanced assessment capabilities, there will be an improved understanding of the forensics of the aforementioned multidimensional disruptions. This also applies to the systemic dimensions so essential for a better anticipation of future opportunities, shocks, risks, precursor signals, correlations and trends.
1.2.3 Paris Agreement
Disaster risk and resilience are encoded within the Paris Agreement. At the twenty-first Conference of the Parties in Paris in 2015, Parties to the United Nations Framework Convention on Climate Change (UNFCCC) welcomed the adoption of the Sendai Framework. Articles 2, 7, 8 and 10 of the Paris Agreement call for actions that have direct impli-cations for disaster risk. In particular, the Sendai
31

Framework notes that “disasters, many of which are exacerbated by climate change and which are increasing in frequency and intensity, significantly impede progress towards sustainable develop-ment.” The aim of holding the global average temperature this century below an increase of 2oC above pre-industrial levels requires systemic risk management on a scale never seen before, neces-sitating collective action to address the causal factors of natural and man-made hazards and risks. With countries’ nationally determined contri-butions (NDCs) of the Paris Agreement estimated by the Intergovernmental Panel on Climate Change (IPCC) to be leading the climate system to temper-ature increases of between 2.9oC and 3.4oC,27 this would result in future hydrometeorological hazard intensities that surpass known experience and which alter loss and damage equations and fragil-ity curves of almost all human and natural systems at risk.
The Paris Agreement recognized the need to address loss and damage associated with the effects of climate change. The agreement iden-tified areas of cooperation central to DRR and called for investments to address the underlying risk drivers associated with rising greenhouse gas (GHG) emission levels and to inspire innovation and low-carbon growth.28 However, with non-linear change in hazard intensity and frequency a reality,29 much greater ambition and accelerated action is required pre-2030, so as to converge with the goal, outcome and targets of the Sendai Framework.
Building coherence between the Paris Agree-ment and the Sendai Framework is currently prin-cipally framed around commonalities of DRR and climate change adaptation (CCA). The two frame-works have the common objective of strengthen-ing communities’ resilience across the full range of environmental, technological and biological hazards, so they build back better. Support for these objectives manifests through coordinated action between the United Nations Office for Disaster Risk Reduction (UNDRR), the Adapta-tion Committee of UNFCCC and the Least Devel-oped Countries Expert Group, which is supporting mainstreaming DRR into national adaptation
programmes of action (NAPAs). Much more must be done to understand and integrate the conse-quences of simultaneous systemic change around energy, industrial, land, ecological and urban systems within ongoing vulnerability reduction measures of NAPAs, local adaptation programmes of action and DRR plans.
Adaptation has multiple connections with risk reduction processes at the local and regional levels, and will be most effectively pursued when integrated efforts reflect the important relation-ship between climate mitigation (and its associ-ated risks, including technological risk), adaptation, hazard modification and vulnerability reduction.
Key to successful integration of the two frame-works will be the presence of clear governance arrangements and accountability mechanisms to ensure successful collective action and joined-up monitoring processes, thus minimizing the report-ing burden on countries while learning from previ-ous successes.
1.2.4 Addis Ababa Action Agenda
AAAA proposes a global framework for financ-ing sustainable development efforts post-2015. In paragraph 34, it refers to the Sendai Framework in its commitment to develop and implement holistic DRM at all levels in line with the Sendai Framework. It also supports national and local capacities in the development of integrated strategies and plans towards inclusion, resource efficiency, mitigation and adaptation to climate change, and resilience to disasters. AAAA encourages the consideration of climate and disaster resilience in development financing (para. 62) and calls for innovative financ-ing mechanisms that allow countries to better prevent and manage risks, and to strengthen the capacity of national and local actors to manage and finance DRR.30
AAAA highlights the importance of improving global economic governance to counter excessive
32 Chapter 1

27 (IPCC 2018)28 (United Nations 2015c); (UNFCCC 2017)29 (IPCC 2018)30 (United Nations 2015a)
31 (United Nations General Assembly 2015b)32 (United Nations 2015b)33 (United Nations 2016b)34 (Murray et al. 2017); (Garschagen et al. 2018)
volatility and support sustainable development by underlining issues of coherence and consistency of international financial, monetary and trading systems. Commitments made by Member States primarily reflect challenges of systemic risk from regulatory monetary gaps and misaligned incen-tives in the financial sector and allow countries to plan more efficient responses to shocks and disasters. More fundamentally, AAAA summa-rized concerns over the sustainability of global economic growth in the face of increasing environ-mental, social and financial challenges. It provides a comprehensive set of policy actions with over 100 concrete measures to address the larger and more diverse financing needs associated with transforming the global economy and achieving SDGs.
AAAA calls on the international community to offer targeted support to countries whose domestic resources and debt sustainability are threatened by disasters, by encouraging tailor-made finan-cial instruments.31 Relevant examples on disas-ter risk include sovereign bonds linked to gross domestic product (GDP), the inclusion of “hurri-cane” or “catastrophe” clauses in loan contracts, countercyclical loans and weather-related insur-ance schemes. Member States also committed to intensify efforts towards domestic resource mobilization to develop fiscally sustainable social protection schemes by setting national spend-ing targets for quality investment,32 to support the most vulnerable in the aftermath of a disaster and allow access to essential public services for all. This translates to a global financial infrastruc-ture that supports the special needs of countries most in need, least developed countries and small island developing States (SIDS), through coordi-nated polices aimed at fostering debt financing, debt restructuring, improved access to finance and domestic resource mobilization. AAAA made one
message clear with regard to financing for risk-informed development. While it remains important to address the short-term risks of today, decision makers must stay steadfast in promoting a long-term financing strategy to meet the environmental, social and economic challenges of tomorrow.
1.2.5 New Urban Agenda
In its vision, principles and commitments NUA explicitly mentions DRR and resil ience, and promotes proactive risk-based, all-hazard and all-of-society approaches. It calls for sustain-able management of natural resources in cities to promote DRR by developing DRR strategies and assessing disaster risk periodically (para. 65). Moreover, it expresses Member State commitments to improve cities’ resilience to disasters by adopt-ing approaches in line with the Sendai Framework (paras. 67 and 77).33
As NUA moves into an operational phase, signifi-cant opportunities to link more coherently to other agendas are apparent.34 The synergies between NUA and the Sendai Framework provide the basis for expanded collaboration, including between the UNDRR-led Making Cities Resilient Campaign and the United Nations Human Settlements Programme (UN-Habitat). This pursues achievement of Target E of the Sendai Framework and the objectives of NUA, particularly on supporting cities in developing and integrating local DRR strategies into urban develop-ment plans.
33

35 (Agenda For Humanity 2019)
1.2.6 Agenda for Humanity
Reduction of risk and vulnerability on a global scale is a key message of the Agenda for Humanity, which calls for the anticipation and prevention of disaster and crises. It consists of five core respon-sibilities that are essential to achieve progress to address and reduce humanitarian need, risk and vulnerability, namely: political leadership to prevent and end conflict, leave no one behind, uphold the norms that safeguard humanity, change people’s lives from delivering aid to ending need, and invest in humanity.
The Agenda for Humanity aims to reduce risk by promoting different ways of working together so as to transcend the humanitarian-development divide, and to ensure that investments in sustainable devel-opment are risk informed. These include: conduct-ing risk and vulnerability analysis with development partners and local authorities, and strengthening existing coordination efforts to share analysis of needs and risks, and better align humanitarian and development planning tools and interventions.
Adopted in 2016, the Grand Bargain: A Shared Commitment to Better Serve People in Need35, recognizes that today’s humanitarian challenges require new and coherent approaches that address the economic, social and political root causes of crises, conflict and disaster.
Enshrined in each of the above 2015 agreements is recognition of the systemic nature of risk, and so the call for a paradigm shift to adopt systems-based approaches and work in new ways to collaboratively reduce the creation of new risk and manage the existing stock of risk.
34 Chapter 1
The preamble to the 2030 Agenda states that SDGs are integrated and indivisible, balancing the three dimensions of sustainable development: economic, social and environmental. However, this century is likely to be dominated by the emergence of large-scale dynamic risks that inherently cut across these dimensions. The Sendai Framework reflects the certainty that in an ever more populous, networked and globalizing society, the very nature and scale of risk has changed, to such a degree that it surpasses established risk management institutions and approaches. Recent events - such as large-scale prolonged droughts and heatwaves, financial and commodity market crashes, large scale and long term human migration, cybervulnerabilities and political upheavals - carry the potential to generate diverse types of damage and destruction simulta-neously, to vital infrastructure and even to the life support systems of very large parts of societies and economies.
With non-linear change in hazard intensity and frequency a reality,36 and now threatening all three dimensions of sustainable development, the imper-ative for greater ambition and accelerated systemic action pre-2030 to converge with the Sendai Frame-work is clear. The Sendai Framework compels new conceptual and analytical approaches to improve understanding and management of risk dynamics and risk drivers at a range of spatial and temporal
scales. It requires particular emphasis on the inter-action among physical, technological, social and environmental hazards, and attention to “anthro-pogenic metabolism”. (Anthropogenic metabolism means the systemic interaction between humans and the environment that consists of the inputs, outputs and stock of materials and energy required to sustain physiological needs for food, air, water and shelter, as well as the products, substances and services necessary to sustain modern human life.37 It emerges from the application of systems thinking to industrial and other human-made activities, and is central to sustainable development.)
Technical communities use models to better “see” risk in the present or near future, and so the view of risk is inherently shaped by the tools used to describe it. Most models have been based on historical data and observations, assuming that the past is a reasonable guide to the present and the future. That assumption is now rendered obsolete on almost every frontier: by the sheer number of human beings, never before seen on Earth; by the changing climate; and by the dynamic and global connectedness of biological and physical worlds, individuals and communities.
Chapter 2: Systemic risks, the Sendai Framework and the 2030 Agenda
36 (IPCC et al. 2018)37 (Brunner and Rechberger 2002)
35

With the certainty of near-term non-linear changes, the critical assumption of the relationship between past and future risk must now be revisited. The Sendai Framework defines a new era for the classifi-cation, description and management of risk.
The Sendai Framework stipulates that the global community must come to terms with a new under-standing of the dynamic nature of systemic risks, new structures to govern risk in complex, adaptive systems and develop new tools for risk-informed decision-making that allows human societies to live in and with uncertainty. Coming to terms with the limitations of a hazard-by-hazard view of risk management, the Sendai Framework spurs the dialogue and action necessary to refine, extend and enhance the ability to understand and manage systemic risks.
Today’s environmental, health and financial systems, supply chains, information and commu-nication systems are clearly vulnerable. They also create vulnerability on multiple spatial scales (local to global) and across different timescales (from immediate to decadal and beyond). They are chal-lenged by, and are causal drivers, of disruptive influences such as climate change, loss of biodiver-sity and ecological systems degradation, disease outbreaks, food shortages, social unrest, politi-cal instability and conflict, financial instability and inequality. The eruptions of Eyjafjallajökull in Iceland, the impacts of Hurricane Sandy in the United States of America, and the Great East Japan Earthquake, tsunami and Fukushima Daiichi nuclear accident are recent examples of complex risk events. They each encompass critical spatio-temporal contexts, including elements of surprise and non-linearity. All incurred immediate and prolonged impacts driven by significant underlying risk drivers that were underestimated, including background conditions
related to critical infrastructure placement, vulner-ability and lack of redundancy.38
In today’s globalized economic system, networks of communication and trade have generated highly interdependent social, technical and biological systems. These networks are built on, and have built-in, incentives to be highly efficient and to generate economic gains. This narrow focus means there are often undetected fragilities that produce an array of changing systemic risks. In effect, through global interconnectedness, human civili-zation has become a “super-organism”, changing the environment from which it evolved, and induc-ing new hazards with no analogue. Despite techni-cal and analytical capabilities and the vast webs of information about social and Earth systems, human society is increasingly unable to understand or manage the risks they create. Humans have also been slow to realize that the degradation of the Earth’s natural systems is becoming a source of large-scale, even existential, threat affecting fragile social systems at local, national, regional and global scales. Far-reaching changes to the structure and function of the Earth’s natural systems represent a growing threat to human health.39 While global economic integration continues to strengthen resilience to smaller shocks through trade adjust-ments, increasingly integrated network structures also create expanding vulnerabilities to traditionally recognized and novel systemic risks.40
This chapter explores the systemic risks that are embedded in the complex networks of an increas-ingly interconnected world. The behaviour of these networks defines quality of life and will shape the dynamic interactions among the Sendai Framework, the 2030 Agenda, the Paris Agreement, NUA and the Agenda for Humanity. Ultimately, the behaviour of these networks determines exposure and vulner-ability at all scales. The regenerative potential of the social and natural systems envisaged in these aligned intergovernmental agendas will be better understood, and progress will be accelerated, by incorporating systemic risk and systemic oppor-tunity into the design of policies and investments across all scales.
38 (Pescaroli and Alexander 2018)39 (Whitmee et al. 2015)40 (Klimek, Obersteiner and Thurner 2015) 41 (Harari 2018)
36 Chapter 2

2.1 Assessing and analysing systemic risks: mapping the topology of risk through time
It takes strong nerves to question the very fabric of society.41
A paradigm shift has occurred since the mid-twentieth century. Enabled by increases in computational power and the availability and mobilization of vast streams of data and observations, models and narratives, systems approaches increasingly help make sense of the failure of linear constructs in a world where everything is connected. (Linear constructs refer to the pervasive extraction–production–distribution–consumption–disposal linear process of resource use in the current economic paradigm). Earth is one system – a system of systems. Systems thinking is obvious and essential to create the future enshrined in the 2030 Agenda.
Figure 2.1. Topology of risk
(Source: UNDRR 2019)
37

Traditional understanding of risk can be likened to a view of the Himalayan peaks from above, with a cloud cover that obscures the topography below. From above, humans have described and named these peaks of risk as if they are separate and inde-pendent, when in fact, below the clouds, the connec-tions are clear. Significant and influential peaks of risk occur that do not rise to the level of the clouds and currently remain obscured from view but are nonetheless highly relevant. This chapter examines several of these, including food system instability, cyberrisk and financial systems.
2.1.1 Examples of systemic risks
By definition, systemic risks are emergent, and not necessarily obvious using contemporary hazard-plus-hazard approaches, until the disaster occurs. Disasters resulting from systemic risks also may not fall into a traditional disaster taxon-omy of a sudden event or an event with a clear start date. Emergent risks are typically obvious in retrospect – a result of a series of events that cross human-imposed boundaries, whether insti-tutional, geographic, disciplinary, conceptual or administrative.
The term “emergent risk” is most commonly applied to financial systems (e.g. when one signifi-cant financial institution fails and others collapse because of opaque, complex, coupled relationships that connect them). In banking, emergent risks may result as a consequence of large interbank depos-its, net settlement payment systems, investor panic or counterparty risk on derivative transactions, such as credit default swaps. Just as the “disease-fixing” medical establishment is not necessarily well suited for preventive, holistic approaches to achieving good health and happiness – and in many instances has inadvertently created new ills while curing old ones – traditional disaster response and mitigation capabilities are not the appropriate appa-ratus to increase community resilience or under-standing of systemic risks.
Multiple breadbasket failure
A projected increase in extreme climate events and an increasingly interdependent food supply system pose a threat to global food security. Conse-quently, it is crucial that agricultural models take into account local parameters, as these represent binding constraints on global production resources. For instance, local shocks can have far-reaching effects on global agricultural markets. Conse-quently, it is crucial that agricultural models take into account local parameters, as these are critical variables in global food production. Increasing trade flows and trade network complexity also make the system more vulnerable to systemic disruption.42 For example, climate shocks and consequent crop failure in one of the global cereal breadbaskets might have knock-on effects on the global agricul-tural market. The turbulences are exacerbated if more than one of the main crop-producing regions suffers from losses simultaneously – a scenario often described as multiple breadbasket failure (MBBF).
38 Chapter 2

Figure 2.2. Multiple Breadbasket Failure
42 (Puma et al. 2015)43 (Bailey et al. 2015)44 (FAO 2017a)45 (Hovland 2009)
46 (Gilbert 2010); (Baffes and Haniotis 2010)47 (Nazlioglu and Soytas 2011)48 (Saghaian 2010); (Frank et al. 2015)
(Source: UNDRR 2019)
Academics, industry and policy experts warn that a better understanding of the risks of MBBF, as well as improved modelling, are needed to manage climate risks and the increasing global demand for food.43 Of special interest are the effects of production shocks on crop prices and agricultural commodity markets. Due to increased demand and limited production capabilities, the volatility associated with agricultural prices is expected to rise in the coming decades.44 This trend is already apparent, notably in the 2007–2008 food price crisis.45 Energy shocks, increased energy demand
and exchange rate fluctuations, as well as fiscal and monetary expansions, played a key role in this process, amplifying the impact of reduced produc-tion resulting from severe drought and heat-wave conditions.46
This experience suggests that the financial sector has a key role to play in agricultural markets.47 For example, a number of studies have found ethanol policies in the United States of America signifi-cantly affect oil prices, as well as agricultural commodity prices.48 The linkage of energy prices
39

and agricultural markets is also documented in the reverse direction.49 These effects are expected to increase in the future as a result of climate change.50
Moreover, changes in financial markets can also prompt agricultural producers to increase their production, either through cropland intensification or through expansion. Both of these responses can have negative environmental impacts, which would eventually feed back into the financial markets (through increased climate variability). This also implies that financial markets are in the unique position to support preventive action, avoiding GHG emissions, and potentially prevent or reduce climate risks, by reallocating trillions of dollars of invest-ments and assets under management so as to be compatible with a global warming target of less than 1.5°C.
Paragraph 36(c) of the Sendai Framework explicitly includes the role of private sector financial institu-tions to integrate DRM into their business models and practices through disaster risk-informed invest-ments.51 The main challenge of implementing finan-cial market policy and changing investor behaviour is the non-synchronous time horizons and spatial scope of the modelling instruments available to climate change researchers and financial policymakers and investors. Climate change models tend to focus on long-run horizon scenarios of development, typically until 2100, while financial market activity is evalu-ated on annual or multi-annual time horizons, some-thing that Bank of England Governor Mark Carney has referred to as “the tragedy of the horizon”.52
Scenario building in this context can help facili-tate thinking and decision-making if those involved are able to consider local events, and regional and global drivers and trends. Exploratory scenarios start with the present situation in mind and explore the future impacts of various drivers, such as envi-ronmental degradation or climate change, shocks such as disasters, and trends such as urbanization and migration.
To fully understand the systemic risks of MBBFs, it is necessary to understand the gap between global,
regional and local risks, risk perception, and risk prevention and mitigation strategies, and to evalu-ate the potential impacts of financial market regu-lations and possible innovative financial tools with regard to their impact on food security and the environment.
Societal resilience, cyberrisk and network hyper-risk
Interconnectedness is amplified by the connective tissue that runs through all of today’s systems – the digital infrastructure that is itself susceptible to breakdowns and attacks from malicious third parties.
Understanding the degree of cascading risk and developing ways to isolate, measure and manage or prevent risk is a new challenge in today’s environ-ment of computer systems and computer actions that dominate economic, social and even envi-ronmental systems management. Consequently, our approaches to risk management and build-ing our understanding of the interactive nature of the drivers of risk must focus on this emerg-ing, massive threat and develop actions based on knowledge of systems and their interrelationships and interdependencies.
40 Chapter 2

Cyberattacks cascading into health systems and compromising patient lives through attacks on health-care monitoring devices (“medjacking”) emerged in 2015. Security researchers discovered security flaws in the Hospira infusion pump that could remotely force multiple pumps to dose patients with potentially lethal amounts of drugs. In addi-tion to insulin pumps, deadly vulnerabilities
were found in dozens of devices, including X-ray systems, computerized tomography scanners, medical refrigerators and implant-able defibrillators. After the discovery, regula-tors, including the United States Department of Homeland Security and Federal Drug Admin-istration, began warning customers not to use the devices due to their vulnerability. The announcement was the first time the United States Government advised health-care provid-ers to discontinue the use of a medical device.
Box 2.1. Medjacking the infusion pump
51 (UNISDR 2015a)52 (Carney 2015)53 (Toregas and Santos 2019)
49 (Enders and Holt 2014); (Harri, Nalley and Hudson 2009); (Nazlioglu and Soytas 2011)50 (Gilbert 2010)
(Source: World Economic Forum 2016)
Modern society has benefited from the addi-tional efficiency achieved by improving coor-dination across interdependent systems using information technology (IT) solutions. Nonetheless, this IT dependence has also exposed critical infra-structure and industry systems to a myriad of cyber-security risks, ranging from accidental causes, to technological glitches, to malevolent wilful attacks. The scale of systemic risk emanating from the increasing vulnerability to cyberattacks on critical infrastructure systems at national or local levels is still not fully understood. The cascading effect beyond the system under attack into interconnected systems can be devastating, creating chaos across economic, food and health systems over potentially prolonged periods well beyond the initial timing of a cyberattack. Consequently, approaches to risk management and building understanding of the interactive nature of the drivers of risk must focus on the emerging, massive threats in this area, and develop actions based on knowledge of systems and their interrelationships and interdependencies.
Models that can describe single-system vulner-abilities for cyberattack are not helpful for decision
makers to understand and properly prepare for such systemic risks. By contrast, models that can describe the degree of risk expansion, as interre-lated technological systems propagate the attack deep into the ecosystem of society, are now avail-able.53 Such models can begin to provide risk information helpful to governments, the insurance industry and the corporate world, so that proper preparations to prevent cyberattacks or manage the system components that are potentially vulnerable to attack may be considered.
These models bring together work from two fields: conceptual models exploring the impact of cyberattacks on insurance rate setting and other risk measurement mechanisms, and detailed mathematical models that explore the impact of cyberattacks on interconnected economic and infra-structure sectors. With the shift by Member States away from hazard-based disaster management to risk-based strategies enshrined in the Sendai Framework, these two streams of exploration are being united to highlight additional hazards, risks and dynamic interactions that need to be consid-ered to understand the full impact of cyberattacks.
41

54 (Lanier 2013)55 (Firth 2017)56 (Lucas et al. 2018)
The relevance of this methodology to decision makers grappling with cascading risk problems is shown in the domain of food security within the United States of America. The rapid evolution of American agriculture from analogue to “smart” farming, transportation and food processing systems is opening new and often unappreciated cyberattack vectors. The structure and operation of modern highly networked food systems (and the obvious requirement for functional energy, transportation and other systems) fundamentally depends on networked information systems, some of which may not be secured from cyberattacks. The combined complexities of these networked systems interacting together stands to amplify threats and vulnerabilities that exist in any of the major systems, as well as risk to other dependent systems. The result is uncharacterized risks that are highly relevant for food safety and supply, manufac-turing, banking, commodities, insurance and other sectors.
Among the salient large-scale features in contem-porary, industrialized food systems that have poten-tial to increase cyberrisk are:
Just-in-time distribution further exacerbates potential fragility in food supply between farm and table. All of these changes cause, or are caused by, advances in information flows and interactive sys-tems that support the food system. Wherever infor-mation flows are crucial to the regular function of food systems, the potential for interruption or dis-ruption via cyberattack exists.
2.1.2Measuring and modelling systemic risks
Any information technology, from the most ancient money to the latest cloud computing, is based fundamentally on design judgments about what to remember and what to forget.54
Established risk management techniques deal with threats generated by factors external, also termed “exogenous”, to the situation being assessed and managed. Typically, such situations allow a sepa-ration between risk assessment and risk manage-ment. Repetitive historical observations have been used to characterize risk by statements about the probability of certain interactions of hazards, vulner-ability, exposure and capacity. However, the essen-tial feature of the extreme, catastrophic, risk events actually witnessed in recent history, is the lack, or complete absence, of the patterns expected based on historical observations.
a. Increasing farm consolidation with heavy and rapid reliance on smart technology with artificial intelligence (e.g. use of robotic milking machines).
b. Vertical integration through the food supply chains in which agricultural producers may directly process agricultural commodities (e.g. milk processed into dairy products on farms to directly supply supermarkets and grocery stores).
c. Widespread lack of compliance with food safety, traceability and insurance requirements.
d. Rapidly advancing use of smart technology throughout supply chains and transportation systems.
e. Increasing interdependency among food system components in smart markets resulting from new and often uncharacterized outsourcing relationships, service and highly coordinated supply arrangements, creating greater exposure to inter-organizational cascading defaults and failures.
f. Lack of systematic surveillance of social media, markets and other dynamic real-time or near-real-time reflections of food systems in a defensive mode to quickly detect precursor signals or system anomalies (physical and digital issues) of substantial concern.
42 Chapter 2

To characterize systemic risks, which neces-sarily involves dealing with information gaps or ambiguity, it helps to capture the random patterns of possible disasters, including those arising from extensive and intensive risks, on maps of values describing the vulnerability of objects, infrastructure and activities. A result-ing systemic risk model will then allow for a quantification of mutually dependent losses in space and time, allowing for the use of stochastic risk management models. Stochas-tic systemic risk assessment tools recognize complexity and do not try to simplify things to make calculations easier. They need to repre-sent how complex components are distributed across systems, and even if the probability is low, they need to encompass extreme events (distributional heterogeneity and additivity of extreme events). Such tools are therefore
Box 2.2. For the curious – systemic risk modelling
difficult to establish, and the approach differs from that taken in multi-hazard modelling, which relies on “regularity assumptions” that attempt to make reality less complex and disor-derly to facilitate calculation.
Scenario analysis and stochastic simulation are used in many applications by the insurance industry. The purpose is to identify and evalu-ate risks and examine possible interconnec-tions among them. For example, in the area of natural hazards, earthquake strength and possible hurricane paths are simulated, impact scenarios defined and potential losses anal-ysed. The findings are used for purposes such as pricing, internal guidelines and management of a portfolio of insured assets. The ability to assess risks quantitatively has a direct effect on the insurability of the hazards concerned.
The complexity that underlies systemic risk may be sufficiently intricate that quantification and prediction of risk is not easy. In many instances, the capacity to make pertinent real-world obser-vations is limited or absent, and yet an improved understanding of systems dynamics is required to elaborate estimates that are valid for improved decision-making. Systemic risk modelling may offer quantitative information to estimate spatio-tempo-ral hazard exposures and potential catastrophic impacts. The design and computation of such models is typically a multidisciplinary endeavour with scientific challenges and important judgments as to what to include and what to exclude.
To make these complex, interconnected systems more manageable, a new view of risk is needed. This is analogous to clearing away the cloud cover to reveal the three-dimensional shape of risk, with a topology that also shifts through time. The Sendai Framework impels a move away from an obses-sion with prediction and control towards an ability to embrace multiplicity, ambiguity and uncertainty.55
There has been important recent work predicated on these concepts that suggests that the shape of risk is similar in very different systems. This “homo-morphism” of systemic risks in different domains suggests that as attempts are made to understand the effects of endogenous triggers and critical transitions, there will be more patterns apparent in different domains, which will allow the development of a consistent understanding of the fundamental characteristics of systemic risk.56 An apparently stable macroconfiguration of a complex system will break down, and will be re-shaped by amplifica-tions of a series of microevents until a new macro-configuration emerges. An example of this is the “invisible” asset price bubble in the housing sector, which remains unseen until the bubble bursts due to microscopic fluctuations in the system. To under-stand these critical aspects and disseminate new approaches for decision makers at various scales (in a simple-to-understand format) will require a more comprehensive understanding of spatio-temporal dimensions and the differentiated nature of complicated and complex systems.
43
There are concepts that are often used interchange-ably in the field of risk modelling and complex systems management, but which mean very differ-ent things. A non-exhaustive collection of types of risk in the context of systems is provided in Box 2.3 as guidance as to how these terms will be used in this GAR.
To focus the attention of analysts and decision makers on the indicators that most appropri-ately capture the character of systemic risk, the impending phase transitions and regime changes of the underlying complex system, new approaches to modelling are required.
Systemic risks might be easy to mitigate early on. However, failure or even intentional igno-rance to capture the role of underlying drivers of systemic risk will allow small risks to grow into major problems, increasing the opportu-nity costs of failed interventions and missed opportunities. Developing and implementing multidisciplinary approaches to identify and act on precursor signals and systems anomalies is critical to minimizing or avoiding discontinui-ties in complex systems.
If appropriately co-produced, systemic risk modelling will uncover the incentives driving policymaker resistance to going beyond conventional views of risk, and which currently allow salient early warnings from systemic risk indicators to be ignored or rejected.
Assessment and management methodologies for systemic risks that have been conceived are still in early gestation, and are not yet part of the current operations of twenty-first century risk management institutions. Nonetheless, there is a growing sense of urgency for a para-digm shift hitting every major twentieth century risk management institution, as the limitations of the linear constructs of that era are now acutely revealed by the occurrence and pros-pect of massive failures and potential species-limiting vulnerabilities.
Modelling systemic risks – multi-agent systems research
The adoption of a multi-agent system in assessments subject to systemic risk is an emerging approach that is growing in importance, as it represents network effects and allows the random nature of human behaviour and (emotional) decision-making to be considered. A multi-agent system is a loosely coupled network of software agents that interact to solve problems beyond the individual capacities or knowledge of each problem solver. When certain agents pose a deliberate or unintentional threat, systemic risk management requires the countermeasures taken by other agents to be configured across all interconnected subsystems to maintain the integrity of the entire system. The application of multi-agent systems research may be considered appropriate in approaches to online trading, disaster management or social structure modelling for example.
44 Chapter 2

The origins of modern investigation in systems and the development of systems-based approaches can be traced back to the late nineteenth century. These lines of inquiry flourished through the twentieth century, in the study of complexity science and adaptive systems, through Ludwig von Bertalanffy’s General System Theory in 1968, to cybernetics, catastrophe theory, complexity theory and complex adaptive systems.
And yet a commonly accepted vocabulary describing the manner in which risk features in systems is yet to be developed. The imperative to adopt systems-based approaches in understanding and managing risk that is enshrined in the Sendai Framework and the 2030 Agenda, has prompted UNDRR to propose the following definitions to guide the inquiry and the address of risk in systems, in this GAR, and potentially henceforth in implementation. Definitions may overlap each other.
Systemic risk – risk that is endogenous to, or embedded in, a system that is not itself considered to be a risk and is therefore not generally tracked or managed, but which is understood through systems analysis to have a latent or cumulative risk potential to negatively impact overall system performance when some characteristics of the system change.
Femtorisk – a seemingly small-scale event that can trigger consequences at a much higher level of organization, often through complex chains of events (after Simon Levin 2011).
Systems risk – the inherent risk of a system when substantive elements of the system contribute to the entire system having a certain risk profile, which could be anywhere on the risk spectrum from very low risk, like an intact rainforest ecosystem, to very high risk, like a tar sands mining system.
Network hyper-risk (after Dirk Helbing 2013) or cascading multiple systems risk – the inherent risk across multiple systems when there are substantive elements contributing to the system of systems having a certain risk profile, which could be anywhere on the risk spectrum from very low risk to very high risk. An example of very high risk might be the network hyper-risk across the entire food system as described by the analysis in the MBBF programme of work.
Existential risk – the risk of a fundamental, irreversible change in the performance of all systems relative to a specific perspective; for example, the existential risk to the survival of humans on Earth that is posed by the collective of risks associated with climate breakdown.
Topological map of risk through time (after Molly Jahn 2015) – a dynamic temporal and geospa-tial representation of risks at multiple scales including representation of the functioning of multiple complex, non-linear, interlocking systems across all scales and the interlinkages, dependencies, correlations and relationships among and across all types of risk (as broadly defined in the Sendai Framework, para. 15). The purpose is to provide an understanding of the current and future condi-tions on Earth to manage uncertainty through the identification of precursor signals and anomalies, including sensitivities to change, system reverberations, bleed-over and feedback loops, by utilizing artificial intelligence and collective human intelligence.
Box 2.3. Selected definitions relating to systemic risks
(Sources: von Bertalanffy 1968; Levin 2011; Helbing 2013a; Jahn 2015)
45

COMPLEX
COMPLICATED
Figure 2.3. Complicated and complex systems
2.1.3 Complicated and complex systems
In discussing the different types of assessments of risk, it is important to clarify the distinction between a “complicated” system and a “complex” system. A complicated system can be (dis-)assembled and understood as the sum of its parts. Just as a car
is assembled from thousands of well-understood parts, which combined allow for simpler and safer driving, multi-hazard risk models allow for the aggre-gation of risks into well-behaved, manageable or insurable risk products. By contrast, a complex system exhibits emergent properties that arise from interactions among its constituent parts. Examples of a complex system include a traffic jam, regime change or social unrest triggered by natural hazards.
The priorities for action of the Sendai Framework spur a new understanding of risk, and the obvious value of discerning the true nature and behaviour of systems rather than a collection of discrete elements. This view allows the use of complexity theory for risk management problems in the context of the Sendai Framework and the wider 2030 Agenda. Historically, risk management models, as well as economic models and related policymak-ing, have tended to treat systems as complicated. Applying this method, simplified stylized models are
often applied to single entities or particular chan-nels of interaction, to first define and then label the risk phenomena. Methods are then negotiated by stakeholders to quantify, or otherwise objectively reflect, the risk in question, and then to generalize it again to make policy choices. Most prevailing risk management tools assume underlying systems are complicated, rather than complex. In fact, these tools are often deliberately designed to suppress complexity and uncertainty. This approach is increasingly out-dated and potentially harmful in a
(Source: Gaupp 2019)
46 Chapter 2

globalizing and increasingly networked world, and is likely to produce results that simply fail to capture the rising complexity of the topology of risks.
Risk and uncertainty are measures of deviation from “normal”. Risk is the portion of the unexpected that can be quantified by the calculation of probabilities. Uncertainty is the other portion of the unexpected, where information may exist but is not available, not recognized as relevant or simply unknowable. Therefore, probabilities for uncertainties cannot be reliably measured in a manner currently accept-able to the global risk management community. Converting uncertainty into acceptable risk quanti-ties that essentially emanate from complex system behaviour is currently very difficult, even impos-sible. Some uncertainties in any complex system will always remain unmeasurable. The risks can be characterized and quantified, to some degree, by networks made up of individual agents whose inter-actions exert macroscopic consequences feeding back to individual behaviour. Understanding sensi-tivities to change and system reverberations is far more important and more challenging in the context of complex systems. Simulations of such systems show that small changes can produce initial ripples, which can be amplified by non-linear effects and associated path dependencies, causing changes that lead to significant, and potentially irreversible, consequences.
Increasing complexity in a networked world of anthropogenic systems within nature can be unstable and uncontrollable, and it may not be possible to understand them ex ante. This inabil-ity to adequately understand and robustly manage systemic risk is an important challenge for risk assessment in the context of the Sendai Framework and achievement of the 2030 Agenda.
To allow humankind to embark on a development trajectory that is at least manageable, and at best sustainable and regenerative consistent with the 2030 Agenda, a fundamental rethink and rede-sign of how to deal with systemic risk is essential. Improved understanding of system components, including precursor signals and anomalies, systems reverberations, feedback loops and sensitivities to
change, will be imperative. Ultimately, the choices made in respect of risk and resilience will determine progress towards the goals of the 2030 Agenda.
2.2 Spatio-temporal characteristics of systemic risks
Systemic risk events can be sudden and unex-pected, or the likelihood of occurrence can build up through time in the absence of appropriate responses to precursor signals of change. An understanding of systemic risk requires a time-dependent description of the interacting elements, the strength of interactions among elements, and the nature of trigger events. Modelling the systemic risk behaviour of complex systems is intrinsi-cally difficult. The degree to which harm is caused depends on the temporal dependence of the under-lying processes and the severity of the trigger event, which are usually studied through numerical simu-lations. In other words, the impacts of realized systemic risk depend on the rapidity of interaction of different parts of systems and how extreme the event is that triggers the risk.
Time and timing are critical parameters that deter-mine the properties of the impacts of systemic risks when realized, or, in more familiar terminol-ogy, when the consequences of hazard, vulnerability and exposure manifest. It is salient to mention here two aspects concerning timing in the context of systemic risk. The first issue is related to the poly-synchronous time signature of dynamic systems and the occurrence of risks; the second refers to the temporal evolution of how systemic risks build up and unfold, involving feedback loops of asynchro-nous operations of system components.
47

2.2.1 Polysynchronous time signatures of dynamic systems
Polysynchronous events refer to simultaneous disruptions (events) in a system or systems. If a single extreme event such as a drought occurs, the system is usually buffered, reducing the consequences. For example, trade mitigates price shocks resulting from crop losses in one of the world’s breadbaskets. However, if multiple extreme events happen simultaneously (see section 2.3.1), the system may cross a threshold where nega-tive impacts increase in a non-linear fashion with every additional event. Studies have shown that disasters – such as floods – often exhibit a higher spatial correlation in the extremes, a so-called
Further innovations in risk modelling are needed to better understand polysynchronous events.59 For example, the risks of current and future hazard events such as wildfires, droughts or extreme precipitation, as well as their knock-on effects on agricultural production, food prices and food security need to be under-stood, especially in the context of rapid climatic change. See section 2.1.1 and the risks and consequences of MBBF.
2.2.2 Feedback loops of asynchronous operations of system components
An adverse event affecting the functioning of an individual system component can cause reverberations or ripples within the larger system and lead to a breakdown of related system components and potentially the complete system.
tail-dependency.57 In Central and Eastern Europe, for instance, river basins show strong positive cross-correlation in peak discharges owing to atmospheric circulation patterns. Those interde-pendencies across regions are not yet sufficiently included in probabilistic risk modelling, which is crucial, for example, for the development of robust insurance schemes. Risks of extreme events in complex systems will be underestimated as long as risk projections ignore geographic risk patterns.
One useful method to better account for inter-dependencies in risk modelling is the copulas method.58 This is a statistical tool to account explicitly for non-linear dependencies in complex, multivariate models. It has been applied in the fields of finance, medicine and catastrophe model-ling so far.
In supply chains and traffic systems, applica-tions using global navigation satellite systems – notably the global positioning system (GPS) – have been expanding exponentially, deliver-ing innovative and efficiency-enhancing capa-bilities, revolutionizing the operations across entire supply chains. Efficiency gains through just-in-time delivery systems have been
Box 2.4. Systems reverberations – global navigation satellite system
remarkable in the logistics sector and also in related sectors such as financial services (e.g. settlement systems), food systems and health (e.g. manufacturing).* A failure in a GPS will cause deliveries to be delayed. Order and deliv-ery jams could cause, through positive feed-back loops, the simultaneous failure of many services that are likely otherwise assumed
48 Chapter 2

Cascading hazard processes refer to a primary impact (trigger) such as heavy rainfall, seismic activity or unexpectedly rapid snow melt, followed by a chain of consequences that can cause secondary impacts. These result in a complex array of vulnerabilities that inter-act in interdependent and unpredictable ways and can have tremendous impacts on popu-lations downstream of the initial triggers. High-mountain Asia is highly vulnerable to cascading hazard processes given the tectonic,
Box 2.5. High-mountain Asia geomorphologic and climatic setting of the region, particularly as it relates to glacial lake outburst floods.
It is expected that the occurrences of glacial lake outburst floods will increase in the future due to permafrost thaw and glacial retreat exposing mountain slopes and destabilizing the environment. This will increase the poten-tial of landslides, avalanches and debris flow hazards, which can hit the glacial lake and trigger an outburst flood.
57 (Timonina et al. 2015)58 (Aas 2004); (Aas et al. 2009)
59 (Golnaraghi et al. 2018)60 (Masih 2018)
(Source: Nussbaumer et al. 2014)
The most prominent macroscopic example for asynchronous feedback is the disturbance of the climate system. The fast extraction of fossil fuels due to short-term economic incentives leads to a steadily increasing stock of GHGs in the atmo-sphere. The unprecedented speed of the transfer of carbon from the ground to the atmosphere is not scaled to match with the regenerative dynam-ics of the natural carbon cycle causing alterations in the functioning of the Earth system. These altera-tions are predicted to cause new, more-frequent and intensive disasters ranging from drought and flood-ing all the way to changes in seismic activity.60
Some of these disturbances lead to feedback loops such as increased frequency of forest and savannah burning, and permafrost thawing, which further accelerate the build-up of carbon stocks in the atmosphere and cause increased warming, potentially triggering even more catastrophic abrupt climate change phenomena. Evidently, a synchroni-zation of the rate of extraction of carbon from the ground with the rate of natural carbon sequestration would have been a more robust development strat-egy for humankind and is currently envisaged as an element of a possible future emissions trajectory to be implemented under UNFCCC.
to be independent of each other. It is entirely plausible that the malfunctioning of a rela-tively small service delivery system, originally designed to assure the synchronization of
business operations reaping efficiency gains, could cause large-scale breakdown of food and health systems at local or even national or global scale.
* Beneficial efficiency gains must be measured against new risks posed; for example, the potential deleterious effect of just-in-time food delivery programmes on the resilience of communities.
49

Civi
l Unr
est
Food
Inse
curit
y
Polit
ical
Des
tabi
lizat
ion
Curr
ency
Des
tabi
lizat
ion
Mig
ratio
nDi
spla
cem
ent
War
Food
Rio
ts
Pric
e Sp
ikes
Wat
er R
eser
voir
Depl
etio
n Ep
idem
ic O
utbr
eak
Chem
ical
Acc
iden
t
Glob
al W
arm
ing
Grow
ing
Popu
latio
nDi
sem
pow
erm
ent
Agric
ultu
ral T
echn
ical
Lim
itsIn
adeq
uate
Dis
ease
Sur
veill
ance
Envi
ronm
enta
l Deg
rada
tion
Disc
rimin
atio
n
Drou
ghts
Hea
t-wav
es
Crop
Vul
nera
bilit
y
Loss
Of B
iodi
vers
ity
Chem
ical
Acc
iden
t
Inad
equa
te R
egul
atio
n
Ineq
ualit
y
BUIL
DIN
G S
TRES
SORS
Wat
er S
carc
ity
Mon
ocul
ture
Agr
icul
ture
Trag
edy
Of T
he C
omm
ons
Stat
e O
f Em
erge
ncy
Wea
k En
forc
emen
t
Publ
ic D
ebt
Corr
uptio
n
Info
rmal
Urb
aniz
atio
n
Popu
list R
heto
ric
Prop
rieta
ry D
ata
Defo
rest
atio
n
Soci
al D
ivis
ion
Cons
truct
ion
Boom
Curr
ency
Spe
cula
tion
Com
mod
ities
Pric
e Sp
ikes
Labo
ur M
igra
tion
SYST
EMIC
FA
ILUR
E
Ope
n So
urce
sIn
tero
pera
ble
Data
Rece
nt a
nd
Acc
urat
e C
ensu
s
Mul
tiple
Sc
ale/
Syst
ems
Soci
alSa
fety
Net
s
Long
Ter
mPu
blic
Pla
nnin
g
Ecos
yste
ms-
Base
dSo
lutio
ns
MIT
IGAT
ING
FAC
TORS
Ethi
cal
cons
umpt
ion
Figure 2.4. Systemic risk stressors and mitigating factors
(Source: UNDRR 2019)
50 Chapter 2

61 (IFRC 2010)62 (UNISDR 2009); (UNISDR 2011b); (UNISDR 2013b); (UNISDR 2015a)
Stochastic risk management models have been developed to help understand and quantify the dynamics of systemic risk in general and of asynchronous feedback events in particular. Numerical models can either be non-structural time-series models (e.g. vector autoregres-sive models), structural models (e.g. system dynamics models) or combinations where scenarios are generated by a structural model to specify a non-structural emulator model. The latter approach then allows for the use of stochastic optimization models to calculate robust prevention or response strategies.
For assessment of the systemic risk dynam-ics of large integrated systems, it is necessary
Box 2.6. For the curious – modelling asynchronous feedback
that the resolution in timescales of the system components are matched with the relevant dynamics. Fine spatial scale processes might be measured in seconds while processes on planetary scales can be measured in decades or centuries. When the whole of the system endogenously adjusts itself or gets triggered through an exogenous shock to a transition to a new equilibrium by feedback loops, an asyn-chronous operation of temporal scales might render the system unstable. In attempting to understand disruption and collapse of func-tioning in natural and human systems, it is likely that such dynamic mismatches are core drivers.
2.2.3 Multiple spatial scales of systemic risks
HFA primarily focused on risk at the national scale, to inform public policy and provide guidance to national governments on DRR. However, risk is inter-connected across larger and smaller geographic scales. One example of the smaller spatial scale is urban areas, which are central sites where people, economic activity and built assets are concentrated, and which are increasingly considered as being the front line for DRR.61 Disasters in urban areas affect local residents and livelihoods, and also trans-fer shocks through supply chains and resource networks to other locations.
Primary risks to urban areas
Previous Global Assessment Reports (GARs) have divided risk into multiple classes: everyday risk (which includes food insecurity, disease, crime, accidents, pollution, and lack of sanitation and clean water), extensive risk (which includes death, injury, illness and impoverishment from smaller
intensity hazards) and intensive risk (which includes major disasters causing death to 25 people or 600 houses or more).62 By including these multiple classes of risk, the need for urban specialists to work alongside disaster specialists to understand how risk accumulates in urban areas had become abundantly apparent by 2015.
The Sendai Framework takes this further by estab-lishing the need to understand and manage the interdependent, multidimensional variables of risk that are created by, and magnified among, different systems as they interact, across differ-ent geographic or spatial scales. Considerations of urban risk must embody the multitude of deci-sions that interact with the underlying hazards and conditions that are constantly present in an urban environment, such as infectious disease outbreaks, fires and crime. It must also consider risks that are occasional or exceptional, such as flooding, earth-quakes, landslides, extreme weather events and
51

Box 2.7. Risk and interacting urban subsystems – Lagos, Nigeria
sea-level rise, to build a more representative under-standing of systemic risks.
While systemic risks also affect rural areas, they are particularly relevant to urban areas because of the unique characteristics of city regions as complex systems of systems. For example, sea-level rise and coastal flood risks are critical concerns for urban areas. Most of the world’s megacities are located within low-elevation coastal zones without adequate structural measures or behaviour adjust-ments to avoid either the initial trigger events or the cascading hazard processes.63 Many small- and medium-sized urban areas are similarly situated and growing rapidly. The need to understand and manage systemic risk associated with infectious epidemics is multiplied in the urban context as a result of urban population densities.
To reduce or prevent the creation of risk, a better understanding of the interactions and interde-pendencies between urban and rural areas is essential. This requires a functioning urban/rural (city region) data metabolism to process infor-mation at appropriate scales to understand the systems implications. City regions are collecting and processing progressively more sophisticated data – increasingly in systems models – includ-ing through approaches already tested in urban
health observatories.64 This serves to build collec-tive urban intelligence (see section 2.4.1) among informed groups of people in city regions across sectors and disciplines, to make better decisions together.
Drivers of risk and change in the vulnerability of urban areas
The nature and scale of urban risks continue to increase due to the confluence of multiple contem-porary trends, including rapid urbanization, climate change and rising inequalities. Increased urban development pressure can cause settlement growth in hazard-prone areas, such as the informal settle-ments on the natural flood drainage areas of Cape Town, or the landslide-prone gullies and ridges around Guatemala City. Such settlements can also destroy natural protective ecosystems that have historically mitigated the risks of landslides, flood-ing and storms, such as absorbent wetlands and binding vegetation cover on steep land. Often, the areas most affected by these hazards are infor-mal settlements occupied by populations with the lowest adaptive capacity, including residents without land tenure, and recent migrants.
In Lagos, Nigeria, between 1986 and 2002, urbanization resulted in a 13% increase in developed land, and an 11% decrease in mangrove, swamp thickets and other natural vegetation useful for buffering against coastal
floods. Subsequent flooding affected several slum communities, which had developed on sand infill land that could not support solid structures, and that therefore had a low market value.
(Sources: Okude and Ademiluyi 2006; Adelekan 2010)
With the increased prevalence of hazardous events due to climate change, and dynamic and evolving vulner-ability and exposure, such corrosive impacts in urban areas are predicted to increase in coming decades.
52 Chapter 2

Box 2.8. Latent systemic risk – Puerto Rico
After Hurricane Maria struck Puerto Rico in 2017, a major wholesale medical supply company in San Juan was unable to maintain production. As a result, hospitals across the globe faced a critical shortage and a 600% increase in the cost of intravenous bags. More-over, Puerto Rican pharmaceutical manufactur-ers were unable to manufacture drugs needed to treat diabetes, cancer and heart conditions. This was not an isolated instance of significant
63 (Brown et al. 2013)64 (International Science Council 2018)
business interruption. The secretary of Puerto Rico’s Department of Economic Development and Commerce considered “the lack of power is the root of everything”, when referring to the chronic underinvestment in the electricity grid in the decades leading up to Hurricane Maria as a major driver of the prolonged and exten-sive impacts of what was the largest blackout in the history of the United States of America.
(Sources: Alvarez 2017; Conrad 2018; Wong 2018)
Recent research has shown that the global urban-industrial network is more vulnerable to multiple simultaneous hazards than to singular impacts in wealthy, large urban areas.65 Therefore, as climate
Transfer of disaster impacts from urban areas to other distant locations
Disaster risk in urban areas has commonly been studied from the perspective of individual cities. However, as urban areas are part of a global social and economic network, impacts in one urban area can cascade to other distant regions.
impacts become more prevalent, impacts capable of interrupting urban economic flows and creating social instability may become more severe.
65 (Shughrue and Seto 2018)
53

2.3 Systemic risk governance
Governance generally refers to actions, processes, traditions and institutions (formal and informal) by which collective decisions are reached and imple-mented.66 Risk governance can be defined as “the totality of actors, rules, conventions, processes and mechanisms concerned with how relevant risk infor-mation is collected, analysed and communicated and management decisions are taken.”67 It is usually associated with the question of how to enable soci-eties to benefit from change, so-called “upside risk”, or opportunity, while minimizing downside risk, or losses. In contrast, systemic risk is usually seen as downside risk. The realization of systemic risk by definition leads to a breakdown, or at least a major dysfunction, of the system as a whole.68 Assessing, communicating and managing – in short, governing – systemic risk is compounded by the potential for losses to cascade across interconnected socioeco-nomic systems, to cross political borders (including municipal and Member State boundaries or regional mandates), to irreversibly breach system bound-aries and to impose intolerable burdens on entire countries. Risk governance is also confounded by almost intractable difficulties in identifying causal agents and assigning liability.
What needs to be set up so that institutions can govern systemic risk? Like any emerging phenom-ena, systemic risk cannot be measured by sepa-rately quantifying the contributing parts. This means that effective governance should consider the interconnected elements and interdependencies among individual risks. For this purpose, a network perspective, with attention to interconnected nodes or agents, can be useful, as well as greater account-ability and responsibility on the part of individual and institutional decision makers, for example, through the establishment of the principle of collec-tive responsibility.69
Some of the characteristics of such institutions at the global scale can be explored through examples from the global financial system and international climate change institutions (see Chapter 13).
2.3.1 Global financial crisis in 2008
Systemic risk governance requires new institutional structures, as was recognized after the global finan-cial crisis in 2008. Before the crisis, early warning systems (EWSs) were in place to identify precursor signals and anomalies in the overall performance of the complex financial system. Yet they failed to detect what are now understood to be clear signals. The probability of a financial crisis occurring in the United States of America in 2007 was calculated to be between 0.6% and 1%. For the United Kingdom of Great Britain and Northern Ireland, the results were similar, with the probability of a financial crisis calculated at between 0.6% and 3.4% in 2007. Financial systems operated in a siloed fashion with constituents operating rationally from their perspec-tive and within their mandates. However, such systems often become corrupted or behave in a way that is suboptimal or procyclical at a systems level – namely reinforcing of underlying dynamics. Few organizations have the wherewithal to investigate at a system level, let alone a system-of-systems level, and so ownership of the problem is often lost.70
The global financial crisis prompted the develop-ment of new – or reshaping of old – institutions and mechanisms to identify, and ideally prevent, future systemic risks in the financial system. The inclusion of key developing economies (such as Brazil, China and India) in global economic decision-making processes was a central development – notably through the G20 group of globally important industrialized and developing economies plus the European Union (EU). This was accompanied by a more important role of the International Monetary Fund in the surveillance of major economics.71 New financial mechanisms were also set in place; for example, the European Stability Mechanism is an international financial institution designed to help
54 Chapter 2

66 (Renn 2008)67 (IRGC 2018)68 (Kovacevic, Pflug and Pichler 2015)69 (Helbing 2013b)70 (Agathangelou 2018)71 (Kahler 2013)
72 (Bank for International Settlements 2018)73 (Poledna and Thurner 2016)74 (Agathangelou 2018)75 (Goldin and Vogel 2010) 76 (IPCC 2018)
Box 2.9. Systemic risk governance – global climate change governance
Initiated by the United Nations, global climate governance took the form of multilateral agree-ments beginning with UNFCCC in 1992. The 2012 Doha Amendment to the Kyoto Protocol extends UNFCCC until 2020. As of February 2019, 126 of the 144 Member States required for the amendment to enter into force had deposited their instrument of acceptance. Negotiations held in the context of UNFCCC resulted in the adoption of the Paris Agree-ment in 2015, which has been ratified by 185 of the 197 Parties to the Convention. As a
hybrid of legally binding and non-binding provi-sions, under this agreement, 183 countries have outlined their post-2020 climate actions (through NDCs). Beyond the evolution in offi-cial global climate governance, alternative political narratives have emerged that include market entrepreneurship and lifestyle changes that will encompass more flexible and partici-patory approaches to addressing the multifari-ous problems of climate change. These include adopting “climate-friendly food” or eco-driving and car-sharing.
(Sources: de Boer, de Witt and Aiking 2016; Barkenbus 2010)
the euro area countries in case of severe financial distress.72 A systemic risk tax has also been proposed to decrease the number of banks that are too central to fail.73 However, post-crisis governance structures are considered by many analysts to be insufficient to prevent a further financial crises.74,75
2.3.2 Climate change
While the global financial crisis focused attention on global interdependencies and cascading risks with potentially catastrophic consequences, there are a worrying number of other potential triggers. These include extreme climate events, armed conflict, forced migration, food and water shortages, unregulated digitalization, pandemics and loss of biodiversity. Climate change is increasingly recognized as a systemic risk with potentially catastrophic impacts cascading through financial, ecological and social systems. Climate change also perhaps has the most developed global governance regime.
While neither the governance of the financial system nor the climate system can claim full success (note IPCC warnings that NDCs of the Paris Agree-ment entail a potential global warming trajectory
of between 2.9°C and 3.4°C above pre-industrial temperatures),76 both have raised awareness of the necessity, and spatio-temporal complexity, of governance regimes to address systemic risks at
55

the global scale. Moreover, the financial and climate governance regimes have brought attention to the complex web of challenges. One major challenge is establishing causal attribution of systemic losses as the basis for assigning accountabilities and respon-sibilities so essential for risk governance.
The attribution of climate change has been established by accounting for past GHG emis-sions. Commitments and accountabilities could be tackled via GHG projections into the future.77 However, attribution in other areas of systemic risk may be less clear, where large uncertainties exist in determining the causal effects across complex geospatial regions, across stakeholders and across sectors. For example, experts generally agree that the risk of extreme droughts and floods in some regions is increased by climate change,78 but attrib-uting losses from any event to human-induced climate change is still unachievable. Attribution is complicated further as systemic risk can evolve up to the global macroscopic scale through disrup-tions at the microscopic scale, so-called “scale-free properties”,79 or through behaviour that is indi-rectly linked to the disruption it causes in a specific system. Consequently, the difficulty of attributing accountability bounds the solution space for the reduction of systemic risks; it also hampers the development of a joint vision defining clear targets for its management.
Another challenge, although not unique to systemic risk, is the often deep uncertainty surrounding the triggers, exposure and cascading consequences, which are all the nodes of the network. One way of tackling uncertainties, albeit not suggested for nodes with catastrophic potential, is trial and error through an iterative risk management approach.80 Uncer tainties can be hedged by combining systemic risks with other types of risks so they can be tackled together.81 Taking a systems approach that takes account of network dynamics and social processes can form a basis for designing risk governance approaches.
Beyond uncertainty, a more daunting challenge is a lack of understanding of the systemic nature of many risk contexts.82 One suggestion taken from
the climate risk community is to use a triple-loop learning process, from reacting to reframing and finally to transformation.83 This is also in line with suggestions made towards an increasingly adaptive risk management framework with a focus on solu-tions with multiple benefits.84
At the core of any risk governance framework, including systemic risk, is the need for inclusive stakeholder expert processes for co-designing and co-generating solutions. While the importance of stakeholder buy-in has become increasingly appar-ent, there are special challenges for systemic risks.85 For one, the cascading and uncertain nature of the losses means that stakeholder communities are ill defined and often span political borders. Because of the uncertainty, the issues will likely be character-ized by varied views on the nature of the problem and its solution, as well as different “risk constructs” on the part of the stakeholder communities.86 For the “realists” the risks can be objectively assessed in terms of their likelihood and impact, whereas for the “constructivists”, the existence and nature of risk derives from its political, historical and social context, that is, it is constructed. The two divergent views can have a significant impact with regard to policy implementation.87 Modernity reflexively relies on increasing complexity to manage the very risks it creates, which, in turn, causes disasters that are often embedded in the construction of social organizations and institutions.88 Consequently, iterative approaches are better able to determine potential conflicts and possible solutions by iden-tifying precursor signals or anomalies in system performance at the earliest possible point in time.89 Human agency may play a less-important role in some systemic risk considerations (e.g. in supply chain risks) than in others (e.g. political disruption), which is important for the corresponding gover-nance approaches. The question is related to the optimal complexity to govern systemic risk, that is, how detailed the approach should be, given limited resources.
It can be argued that in the case of complex systems and systemic risks, current measures and approaches represent a collection of failed attempts.90 Nevertheless, the approaches are
56 Chapter 2

PROCESSMANAGEMENT& NAVIGATION
ExploreThe System
Develop
Scenarios
Determine
Goals And Level
Of Tolera
bility
Deci
de,
Test
, Im
plem
ent
Stra
tegi
es
Address
Unanticipated
Barriers
Co-developManagement
Strategies
Monitor,
Learn From,
Review,Adapt
raising awareness and addressing challenges that can shed light onto critical aspects of what is itself a complex issue – systemic risk governance.
Emerging approaches (e.g. International Risk Gover-nance Center (IRGC) systemic risk governance
Successful implementation of such systemic risk governance approaches assumes flexibility and (continuous) adaptation to context (an iterative process in IPCC parlance). It is contingent upon strong leadership with mid- to long-term focus, the willingness to adapt or revise often non-linear,
guidelines; see Figure 2.5) seek to address the diffi-cult problem of assessing or measuring systemic risk, of modelling cascading consequences, of applying different management instruments,91 and of implementing participatory processes.92
non-sequential processes, and the willingness to accept and resolve trade-offs.93 Insights from more conventional risk analysis,94 risk communication and risk management can be applied fruitfully to connect systemic risk with more traditional risk governance approaches.
Figure 2.5. Flexible elements of systemic risk governance
(Source: IRGC 2018)
77 (IPCC 2001)78 (IPCC 2012)79 (Poledna and Thurner 2016)80 (Schinko and Mechler 2017)81 (Timonina et al. 2015)82 (IRGC 2018); (Timonina et al. 2015)83 (Tosey, Visser and Saunders 2012)84 (Frank et al. 2014); (Helbing 2013b) 85 (IRGC 2018)
86 (Centeno et al. 2015)87 (Yazdanpanah et al. 2016)88 (Beck 1999)89 (Linnerooth-Bayer et al. 2016) 90 (Page 2015)91 (Poledna and Thurner 2016)92 (Linnerooth-Bayer et al. 2016) 93 (IRGC 2018)94 (Timonina et al. 2015)
57
2.4 Collective intelligence, contextual data and collaboration
Risk is ultimately a human construct, created in language and meaning to describe the felt or feared volatility and uncertainty of human life – in other words, the experience of complexity and of complex systemic effects. Humans in many societies have become accustomed and attached to the illusion of control that the construct of risk has given us. But as it becomes apparent that the effects of interde-pendent, globally connected systems and vulner-abilities may be beyond human measurement or management, the limits of that illusion must be acknowledged. So too must the limits of present systems of governance and organization of human knowledge. This requires a new paradigm for under-standing and living with uncertainty and complex-ity – one that activates the power of human social and contextual intelligence, and where possible, leverages it through appropriately designed artificial intelligence.
Developing the capability for contextual under-standing and decision-making is a far more effec-tive way of dealing with uncertainty and complexity than the present reliance on extrinsic frames of reference and categorical technical expertise, siloed into disciplines. In part, such capability can be built using a lifelong learning approach, so as to grow an aware, internalized ability to notice the relevance of context and the role of self; and in so doing, recog-nize and anticipate interdependencies and non-linear effects.
Human decision-making is emotional, not ratio-nal, and is therefore more successfully activated by mental models based on meaning attached to values and beliefs.95 Over time, use of narrative and meaning to negotiate the constantly changing rela-tionship between identity and context has proven
to be an effective mechanism to build resilience, to enable rapid sensing, understanding and sense-making. In this way, collective intelligence becomes possible as an essential precondition for collec-tive responsibility, which is at the core of systemic risk governance. Collaboration with and through that intelligence holds the key to building systemic resilience.
2.4.1 Collective intelligence
“Collective intelligence” is the powerful combination of human intelligence, artificial or machine intelli-gence and processing capacity.
Building resilience is necessary to adequately respond to, and reduce, risks and prevent disasters. Resilience requires: planning and preparation based on assessments to avoid or minimize risk creation and reduce the existing stock of risk; the develop-ment of capacity to restore functions quickly and effectively in the face of disruptions; and the capac-ity to adapt and change after a shock.
By addressing these complex systems challenges, every individual, organization or group involved in resilience building could thrive more successfully if they tapped into a “bigger mind” through collective intelligence. This could be by drawing on the brain power of other people with diverse cultural experi-ence, chronological age, education or occupation and gender, combined with the processing power of machines.
While needed for processing big data about the functioning of complex systems, machine learn-ing and artificial intelligence do not help people to solve more complex coordination and governance problems that require trust between people. They cannot decide on how people want to live human lives, for example in cities. Blockchain, a distrib-uted network solution for coordinating interactions and exchanges, likewise cannot alone solve this complex human dynamic problem.
58 Chapter 2

95 (Gatzweiler et al. 2017)96 (Whitmee et al. 2015)97 (Whitmee et al. 2015)
98 (EU, Directorate-General for Research and Innovation, Direc-torate I - Climate Action and Resource Efficiency 2018)99 (Craglia et al. 2018)
Truly global collective intelligence is a long way short of being able to solve global problems. It is now important to assemble new combinations of tools that can help the world think and act at a pace, as well as at the scale commensurate with the complex problems we face. In too many fields, the most important data and knowledge remain flawed, fragmented or closed, lacking the context and orga-nization required for them to be accessible and useful for decisions; as yet, no one has the means or capacity to bring them together.
The critical interdependence among human health and well-being, ecology and technology is highly complex – both in the nature of connections and in responses in time and space.96 Achievement of an improved understanding of human–ecologi-cal–technological system interactions is essential, just as is starting to be achieved in climate science through the application of sophisticated computer modelling.
This revolution in systems modelling has reached the point where it is now possible to begin model-ling the interlinkages and interdependencies among the economic (values), societal (health, welfare and productivity) and environmental impacts of decisions and investments driven by the live interactions between weather, Earth crust shifts, soils, land, ocean ecology and human activity.97 Geodata at multiple scales is available to support this approach to better understand the interactive nature of the drivers of risk and for long-term risk reduction.
In many cases, models of complex ecological systems used to make projections of future trends, use data derived statistically from putative causal associations, but these associations can change under novel conditions, and thus predictions might be questionable. Novel models that are based on an understanding of the underlying processes that
cause a system to behave in particular ways are increasingly needed, spanning and interacting from global to local levels. They can be used to create a resilience compass to enable communities to steer towards a more resilient future.
Such novel models, supported by artificial intelli-gence and machine learning, can then build collec-tive intelligence among communities through independent regional or national transitional super-laboratories98 – or collaborative laborato-ries (discussed further in section 2.4.2). These comprise leading experts from across sectors, including academic, government, private sector and community.
Recent advances in computing power, availability of data and new algorithms have led to major break-throughs in artificial intelligence and machine learn-ing in the last six or seven years. Many applications are entering everyday lives, from machine transla-tions, to voice and image recognition, to geospa-tial optimizations, all of which are increasingly exploited in industry, government and commerce. Increasingly constructive deployment of artificial intelligence combined with developing collective intelligence in the field of DRR will have a positive impact on saving lives, reducing injuries, minimiz-ing damage to property and improving economic systems. At all times, these promote social equality through enhanced decision-making capabilities. To do this successfully will require strong evaluation frameworks that can assess the performance and the quality of artificial intelligence, and build trust in this disruptive technology.99
Further research is needed to understand fair-ness in the context of automated decision-making. An algorithm or decision is fair when it does not discriminate against people because of their membership in a specific group (e.g. as gender, race or sexual orientation). In the emerging field of
59

explainable artificial intelligence (i.e. techniques in artificial intelligence that can be trusted and easily understood by humans, and which contrast with the concept of the black box in machine learning where it is often difficult to explain why the artifi-cial intelligence arrived at a specific decision100), there is considerable work in progress to address these complex issues and replace the black-box approaches of conventional artificial intelligence, so as to reduce bias and increase the understandabil-ity for decision makers.
When it comes to cybersecurity, artificial intelli-gence is a double-edged sword. It can be greatly beneficial to increase the security of devices, systems and applications, but it can also empower those who seek to attack systems and networks and thus become an advanced tool in the arsenal for cyberattacks. The Sendai Framework takes into account the need to address risks that arise from technological innovations and their application (see Chapter 3 of this GAR). Moreover, the robustness of artificial intelligence against malicious action becomes an issue, posing the most immediate danger for the security of cyberphysical systems, in which artificial intelligence will be increasingly deployed.
Therefore, technology-based solutions to coordina-tion problems need to be combined with human-based solutions (solutions that are made by or involving humans for solutions at a human scale). Unlike machines, which need to operate with prob-abilities, humans – within a social network of trust – can make decisions under radical uncertainty by attaching values to decisions. This ability in healthy human beings is due to emotional responses to highly complex decision situations to which there are no solutions from purely calculative and value-free accounting of costs and benefits.
Purely technological solutions that build on objec-tivity and value-neutrality detach the human being from being intrinsically connected to the environ-ment. Humans can (or should) decide on chang-ing deeply embedded values that define higher level rules, and shape attitude, choices and behav-iour. Otherwise, societies may continue to create
wealth at the expense of declining ecological life support functions in a positive spiralling feedback loop, which creates systemic risks with cascading effects and makes overarching economic, ecologi-cal and social systems increasingly susceptible to collapse.
2.4.2 Contextual data, innovative collaboration and transdisciplinarity
Complexity vexes the traditional problem-solv-ing model of separating problems into singu-larly defined parts and solving for the symptoms. None of the “wicked problems”,101 as described by IPCC102 and multiple other scientific bodies,103 that are currently pressuring policymakers to try new approaches to meet today’s challenges, can be understood with reductionist approaches. In other words, the deliberate simplification of a problem and its causes by removing it from its context renders the understanding and ensuing solution obsolete. The issues with which we are confronted are wrapped in contextual interdependencies that require an entirely different approach in assessment and action.
Most current scientific research tools and method-ologies pull “subjects” from their contexts in order to derive detailed, specialized, quantifiable informa-tion. A wider practice of science in the future may develop ways to fully use information derived from detail and interdependency. For now, the cultural habit of de-contextualizing information, or reduc-tionism, is the standardized, authorized and empiri-cal norm. To make more appropriate assessments of risks arising out of multi-causal circumstances, observations that can appropriately address this complexity are urgently needed. The decisions on what actions to take, by whom and with what resources, are decisions based upon information of the situation or event. If that information cannot hold the appropriate complexity, the decisions will be founded on inadequate knowledge.
60 Chapter 2

Transdisciplinary research and response
Risk creation and realization in complex systems do not remain in one sector at a time. Yet, current institutional structures mitigate these complex issues through the protocols of attending only to what is within their specific jurisdiction. Health crises remain in the realm of health ministries, while economic issues are under the separate attention of ministries of finance or employment. Likewise, ecological risks overlapping with cultural or political risks are still, in most cases, considered in parallel, but must be researched and understood better in terms of their relational interdependence.
Research bridges and increased communication across societal systems need to be developed. This is particularly true of public service systems. Lack of communication and contextual perspective among systems such as education, health, trans-portation and communication can increase commu-nity-level vulnerability. Connection and increased contact between such sectors will make commu-nities more robust and resilient to long-term risks and sudden onset emergencies. The development of warm data approaches can cultivate the rela-tionship among sectors to strengthen inter-system interaction and collaboration.
Warm data and contextual information
“Warm data” is a specific kind of information about the way parts of a complex system (e.g. members of a family, organisms in the oceans, institutions in a society or departments of an organization) come together to give vitality to that system.
By contrast, other data will describe only the parts, while warm data describes their interplay in context. Warm data illustrates vital relationships among many parts of a system. For example, to under-stand a family, it is not enough to understand each family member, the relationships among them must also be understood – this is the warm data. This warm data is used to better understand inter-dependencies and improve responses to issues that are located in relational ways. This includes understanding systemic risks in health, ecology, economic systems, education systems and many more. De-contextualizing gives specific infor-mation that can generate mistakes, while warm data promotes coherent understanding of living systems.
Box 2.10. Warm data enquiry
Systemic consequences (and consequences of consequences) are easily disconnected from their networks of causation and the impor-tance of the relationships among contexts can be lost. For example, the caravan of asylum seekers moving north through Central America in the latter part of 2018 was viewed by the media as fleeing either violence or poverty (the
“obvious” drivers of such desperate behav-iour). In fact, historic drought conditions over multiple years, exacerbated by climate-induced shifts in weather patterns without accompany-ing shifts in human behaviour, policy or infra-structure development, were an underlying risk driver. This would be the focus of a warm data approach to understanding the complex, inter-dependent set of factors leading to large-scale migration.
100 (Sample 2017)101 (Rittel and Webber 1973)102 (IPCC et al. 2018)
103 (Rockström et al. 2009); (Whitmee et al. 2015); (World Wide Fund for Nature 2018)
61

Context includes the relational processes that come together to produce a given situation. In fact, most complex situations or systems are “trans-contex-tual”, that is, there is more than one context in play. Trans-contextual information brings together multi-ple forms of observation, from multiple perspec-tives. In recognition that information comes in many forms, a warm data research team would look for on-the-ground “wisdom” of locals, art and culture, personal stories and the voices of many generations. The task of warm data is not only to incorporate details and data points, but the relation-ship among details as well, at many scales.
Contextual information in the form of warm data has begun to be used by researchers, governments, and public service professionals. They use it to assess complex situations and identify preventive approaches or responses to complex community (or ecological) crises, necessitating expertise that spans a breadth of contextual conditions.
When applied to specific local contexts and fields, scenarios using warm data can be useful to involve local stakeholders and decision makers in an trans-disciplinary environment – a collaborative labo-ratory or “collaboratory” – to produce alternative futures that are robust to the relevant uncertainties and complexities.104 A set of scenario exercises conducted within an agreed set of parameters across scales (from smallholder farmers to glob-ally collaborative institutions) help to identify stake-holder preferences, motivations, scale-specific trends and drivers, and most importantly, add the local contexts needed for the modelling exercises.
Changing patterns of interaction at local levels using trans-contextual knowledge processes
The natural extension of the above process is bridge-building across systems. This is a step towards forming collaborative decision-making bodies at local levels (“collaboratories”). In doing so, there is the possibility to bring together people from different, but interdependent fields, to explore and energize or regenerate local community vital-ity. As these community groups form and exchange trans-contextual knowledge, new communication patterns begin to form, linking otherwise separated sectors of experience. The place-based solutions that emerge from the collaborative development of contextual warm data lend themselves to self-orga-nizing around actions that are co-created, with local ownership of data, risks and solutions. By provid-ing context, warm data is a metashift that gener-ates connection, communication and action, which is able to address complexity in new ways. Local capacity can be increased significantly by drawing from collective intelligence and mutual learning, .
62 Chapter 2

104 (Vervoort et al. 2014)
Figure 2.6. Transdisciplinary knowledge generation
(Source: adapted from Brown et al. 2015)
When research is done in this way (i.e. across contexts), the interdependency becomes apparent. For example, food cannot be separated from the economic, nor even political, systems; neither can it be separated from culture nor medicine. Food is also an important catalyst for strong bonds among generations. In this sense the work of supporting food initiatives is not simply to distribute nutrition, but to also knit relationships among the diverse contexts into projects and actions that involve the whole community. The solutions lie in the recogni-tion of collective response. No single response is enough to address a complex problem.
Warm data is the overlap across systems and is produced by teams whose enquiry is practised in crossing contextual frames, sense-making and finding patterns. The lens of contextual enquiry and trans-contextual research is one that not only brings disciplines together but many other forms
of knowledge also, including the place-based wisdom of local practitioners, as well as cultural and indigenous sensitivities.
When superficial solutions are implemented to provide answers to problems in complex systems, the problems proliferate. Developing the capability for contextual understanding and decision-making is far more effective, and the benefits are felt across multiple sectors simultaneously. Structures and approaches are needed that can bring forward infor-mation that presents the contextual interlinking of the potential systemic risk impacts as they are felt at the individual, microscopic level within larger global, macroscopic contexts.
63

FROM THEHYOGO FRAMEWORK
2005
3.6Global RiskModel Metrics
SCALE
HAZARD
EXPOSURE
VULNER-
ABILITYX X
Earthquake
Tsunami
Riverine Flood
Cyclonic Wind
Storm Surge
Structural Economic Global
National
2.5 Shifting the paradigm – introducing the Global Risk Assessment Framework
Paradigms are not corr ig ible by normal science, paradigm change is a value change.105
Our global society has come to realize that the systemic risks we create can induce situations of large-scale instability and even uncontrollability.106 There is therefore an urgent and growing need to better understand and manage uncertainties and to mobilize people, innovation and finance. The impera-tive to extend standard risk management frame-works or even to heed the call for a paradigm shift on
Figure 2.7. From global risk assessment to GRAF
(Source: UNDRR 2019)
64 Chapter 2

THROUGH THESENDAI FRAMEWORK
2015
SCALE
HAZARD
EXPOSURE
VULNER-
ABILITY
SYSTEMS
Human
Ecological
Economic
Biological
Technological
Fire
Volcano
Tsunami
Flooding
Earthquake Economic
Social
Environ-mental
Structural
Agriculture
Basic Services
NationalLocal
Global
105 (Kuhn 1962)106 (Helbing 2013b)
how to deal with both controllable and uncontrollable risks – the sort of change that the Sendai Frame-work exhorts – is undeniable. A transition is needed from one paradigm to another – from managing disasters to managing risk – and from managing “conventional” hazards to engineering an improved understanding of the dynamic interactions with systemic risks. Exploring the facilitation of a “new system of relations” that allows future theories and solutions to emerge that are “wider in scope, more accurate in prediction, and solve more problems”.107
Major renovations of approaches to risk assess-ment and analysis are needed to fully realize the challenge and call of the Sendai Framework. As has been noted, methods today are tuned to the largest and most historically obvious and tractable “peaks” of risks for human beings rather than the interde-pendencies among them.
In recent decades, we have both created and recognized many other types of risks of the great-est consequences for humankind. Understanding
107 (Butterfield 2007)
65

TO THE GLOBAL RISKASSESSMENT FRAMEWORK – GRAF
2020+
Human
Ecological
Cultural
Financial
Political
Economic
Biological
Chemical
Nuclear
Fire
Drought
Industrial
Radiological
NATECH
Volcano
Tsunami
Flooding
Earthquake Economic
Social
Environmental
Governance
Legal
Security
Structural
Agriculture
Basic Services
Housing
Critical Systems
Subsystems
Natural Capital
National
Sub-national
Metropolitan
Local
Regional
Global
SCALE
HAZARD
EXPOSURE
VULNER-
ABILITY
SYSTEMS
Figure 2.8. GRAF 2020–2030
the systemic nature of risks, and the opportunities afforded by new approaches and new concepts of risk, will be the central challenge of the first half of the twenty-first century.
(Source: UNDRR 2019)
If I had to select one sentence to describe the state of the world, I would say we are in a world in which global challenges are more and more integrated, and the responses are more and more fragmented, and if this is not reversed, it’s a recipe for disaster.108
66 Chapter 2

108 (António Gutteres, United Nations Secretary-General, Janu-ary 2019)109 (Butterfield 2007)
In response to this challenge, UNDRR – mandated to support the achievement of the outcome and goals of the Sendai Framework and the 2030 Agenda – was called upon by experts to establish a process to co-design and develop a Global Risk Assessment Framework (GRAF) to inform decision-making and transform behaviour, specifically with respect to systemic risks.
This will explicitly support national and subnational governments, as well as non-State actors including private sector businesses and financial institutions referred to in paragraph 36(c) of the Sendai Frame-work, to recognize new patterns of vulnerability and risk formation within efforts to achieve the targets of all the 2015 intergovernmental agreements, and assist in measuring progress in reducing risk. GRAF is also intended to be a crucial component of a comprehensive United Nations risk assessment and analysis framework in support of the 2030 Agenda. It will contribute to the vision of the Secretary-General of the United Nations to support decision-making for an Integrated Platform on Prevention as well as within the United Nations Resilience Framework.
GRAF is designed to inform and focus action within and across sectors and geographies by decision makers at local, national, regional and global levels on the outcomes, goals and priorities for action set out in the Sendai Framework and the 2030 Agenda. It addresses multiple issues such as assessing systemic vulnerabilities of agricultural systems, or strengthening the resilience of electricity generation and distribution systems in hurricane-prone loca-tions, or business continuity planning for public and private sector actors for basic service delivery in rapidly growing metropolitan areas.
The goal for GRAF is to improve the understand-ing and management of current and future risks, at all spatial and temporal scales. It aims to better manage uncertainties and mobilize people, inno-vation and finance by fostering interdisciplinary systems thinking and enabling identification of anomalies and precursor signals. It seeks to reveal the interlinkages, relationships, correlations and dependencies of multiple risks and actors across systems to build a shared understanding and enable
decision makers to act.The design and develop-ment of GRAF is led by the GRAF Expert Group, GRAF Working Groups and UNDRR. Driven by a user-centric design process, GRAF will work with all stakeholders to create a framework and community of practice for the understanding and sharing of risk contexts, data, information, models, metrics, risk communication modalities and decision support.
Paradigm change has been described as “handling the same bundle of data as before, but placing them in a new system of relations with one another by giving them a different framework”.109
Through approaches such as ensemble model-ling and intercomparison, GRAF will improve understanding of the multidimensional nature and dynamic interactions of risks, so as to prevent or adapt discontinuities in critical systems (includ-ing human health, ecosystem functioning and economic development) and create the potential to transform behaviours. GRAF seeks to enable self-organization and learning focused on local process-ing of information by relevant stakeholders on the impacts and consequences of decisions. Recog-nizing that major reductions in risk will be achieved through understanding and addressing patterns of vulnerability and exposure, and acknowledging that data on vulnerability (social and environmental) are severely underdeveloped, experts recommended this as a priority area for GRAF.
The GRAF Theory of Change sets out early think-ing about the development and implementation of key elements of GRAF. It includes causal pathways (people, science and systems), which are intended to clearly and explicitly define questions to be addressed and elements to be tested and estab-lished. The co-design and development of GRAF will continue in three broad phases of activity: Phase 1 – design and set up; Phase 2 – building the frame-work; and Phase 3 – scaling implementation.
67

Probabilistic/ non-probabilistic hazard models
Intercomparisonand ensemble
models
Exposure models
PROVIDERS
Transdisciplinary,multi - science
and data setsfoundation
Interoperabilityand standards
Working practicesand modalities
HA
ZARD
S
EXPO
SURE
VULN
ERA
BILI
TY
HUMAN
GLOBAL
NATIONAL
LOCAL
SUBNATIONAL
ECOLOGICAL
ECONOMIC
INFRASTRUCTURE
POLITICAL
GRAF Expert Group
GRAF Working GroupsProject Teams
Transformed behaviours
Vulnerability models(social / ecological)
Scope of hazards/ risks (Para. 15)
Systemic risk
Words into Action Guidelines
Uncertainty
Actionable insights, scenarios, tools,
demonstrations, options and dashboards available
to support the needs of users
GLOBAL RISK ASSESSMENT
PLATFORM (GRASP)
GRAF IMPACT CUBE
GAR
Proactive risk-informed decisions and action to
mobilize finance, investment and
communities
SUSTAINABLE SOCIETIES AND SYSTEMS (SENDAI FRAMEWORK, 2030 AGENDA,
PARIS AGREEMENT, NUA)Sendai Framework Monitor
National DesInventar
NATIONAL REPORTING
GRAF Secretariat
Prevention of risk creation and reduction
of existing risk
Increased number of lower cost models and
databases available and connected with more users as a result of
increased standardization and economies of scale
More people can build risk models and understand the
interactive nature of risk through time
Application Programming
Interface(APIs)
Figure 2.9. Schematic representation of GRAF
(Source: UNDRR 2019)
By providing insights, tools and practical demon-strations to decision makers at relevant scales through the development of multi-user, open and inclusive, collaborative and shared methodolo-gies for stakeholders on a timely basis, GRAF can
stimulate interdisciplinary systems behaviours that will support transformative action. This will enable warm data research, establishment of collaboratories and the accelerated development of collective intelligence about systemic risk to
68 Chapter 2

Probabilistic/ non-probabilistic hazard models
Intercomparisonand ensemble
models
Exposure models
PROVIDERS
Transdisciplinary,multi - science
and data setsfoundation
Interoperabilityand standards
Working practicesand modalities
HA
ZARD
S
EXPO
SURE
VULN
ERA
BILI
TY
HUMAN
GLOBAL
NATIONAL
LOCAL
SUBNATIONAL
ECOLOGICAL
ECONOMIC
INFRASTRUCTURE
POLITICAL
GRAF Expert Group
GRAF Working GroupsProject Teams
Transformed behaviours
Vulnerability models(social / ecological)
Scope of hazards/ risks (Para. 15)
Systemic risk
Words into Action Guidelines
Uncertainty
Actionable insights, scenarios, tools,
demonstrations, options and dashboards available
to support the needs of users
GLOBAL RISK ASSESSMENT
PLATFORM (GRASP)
GRAF IMPACT CUBE
GAR
Proactive risk-informed decisions and action to
mobilize finance, investment and
communities
SUSTAINABLE SOCIETIES AND SYSTEMS (SENDAI FRAMEWORK, 2030 AGENDA,
PARIS AGREEMENT, NUA)Sendai Framework Monitor
National DesInventar
NATIONAL REPORTING
GRAF Secretariat
Prevention of risk creation and reduction
of existing risk
Increased number of lower cost models and
databases available and connected with more users as a result of
increased standardization and economies of scale
More people can build risk models and understand the
interactive nature of risk through time
Application Programming
Interface(APIs)
create a culture of risk-informed decision-making, to transform behaviours and to ultimately increase the resilience of societies and systems.
69

DISASTER
DISASTERRESPONSE
PREVENTION
DISASTERMANAGEMENT
RISK LIVING WITH UNCERTAINTY
Whe
re we are
LIVING WITH UNCERTAINTY
DISASTER
DISASTERRESPONSE
RISK PREVENTION
DISASTERMANAGEMENT
IntegratedEnabling
AlignedEfficient
ProactiveEffective
ReactiveSurvival
EvolvingContainment Where we need to
be
Risk-informed systems-based approaches and decision-making
Dest
ruct
ive
Compliant
Sustainable
Regenerative
Chapter 2 Conclusions and recommendations
The solutions lie in the recognition of collective response. No single response is enough to address a complex problem.110
Conclusions
With the certainty of near-term non-linear changes, the critical assumption of the relationship between past and future risk must be revisited.
The regenerative potential of the social and natural systems envisaged in the aligned intergovernmental agendas will be better understood, and progress will be accelerated, by incorporating systemic risk and systemic opportunity into the design of policies and investments across all scales. Similarity of the char-acteristics of systemic risks in different domains suggests that as attempts are made to understand the effects of endogenous triggers and critical transitions, there will be more patterns apparent in different domains, which will allow the development of a consistent understanding of the fundamental characteristics of systemic risks.
Figure 2.10. “Innovation curve” – from destructive to regenerative approaches
(Source: UNDRR 2019)
70 Chapter 2

110 (Bateson 2018)
Systemic risks might be easy to mitigate early on. However, failure or even intentional ignorance to capture the role of underlying drivers of systemic risk will allow small risks to grow into major prob-lems, increasing the opportunity costs of failed interventions and missed opportunities. Developing and implementing multidisciplinary approaches to identify and act on precursor signals and systems anomalies are critical to minimizing or avoiding discontinuities in complex systems.
Most prevailing risk management tools assume underlying systems are complicated, rather than complex. Understanding sensitivities to change and system reverberations is far more important and challenging in the context of complex systems. Simulations of such systems show that small changes can produce initial ripples, which can be amplified by non-linear effects and associated path dependencies, causing changes that lead to signifi-cant and potentially irreversible consequences.
To allow humankind to embark on a development trajectory that is at least manageable, and at best sustainable and regenerative consistent with the 2030 Agenda, a fundamental rethink and rede-sign of how to deal with systemic risk is essential. Improved understanding of system components, including precursor signals and anomalies, systems reverberations, feedback loops and sensitivities to change, will be imperative.
The global urban–industrial network is more vulner-able to multiple simultaneous hazards than to singular impacts in wealthy, large urban areas. Therefore, as climate impacts become more prevalent, impacts capable of interrupting urban economic flows and creating social instability may become more severe.
Systemic risk governance is confounded by diffi-culties in identifying causal agents and assigning liability. While neither the governance of the finan-cial system nor the climate system can claim full success, both have raised awareness of the neces-sity and spatio-temporal complexity of governance regimes to address systemic risks at the global scale.
While needed for processing big data about the functioning of complex systems, machine learning and artificial intelligence are limited in their capabil-ity to help people solve more complex coordination and governance problems that require trust among people. Unlike machines, which need to operate with probabilities, humans – within a social network of trust – can make decisions under radical uncer-tainty by attaching values to decisions.
Complexity vexes the traditional problem-solv-ing model of separating problems into singularly defined parts and solving for the symptoms. Such issues are wrapped in contextual interdependencies that require an entirely different approach in assess-ment and action. Warm data is the overlap across systems. The lens of contextual enquiry and trans-contextual research is one that brings together disciplines and many other forms of knowledge, including the place-based wisdom of local practitio-ners and cultural and indigenous sensitivities.
Realizing the systemic nature of risks, and the opportunities afforded by new approaches and new concepts of risk will be the central challenge of the first half of the twenty-first century. GRAF seeks to improve understanding of the multidimen-sional nature and dynamic interactions of risks, so as to prevent or adapt to discontinuities in critical systems and enable local processing of information by relevant stakeholders on the impacts and conse-quences of decisions. GRAF can stimulate inter-disciplinary systems behaviours that will support transformative action, enabling accelerated devel-opment of collective intelligence about systemic risk to create a culture of risk-informed decision-making, transform behaviours and ultimately increase resilience of societies and systems. It is intended to contribute to a comprehensive United Nations risk assessment and analysis framework in support of the 2030 Agenda and the Sendai Framework.
71

Recommendations• Accelerated action and ambition is needed to
transition from one paradigm to another – from managing disasters to managing risk – and from managing “conventional” hazards to engineering an improved understanding of the dynamic interactions with systemic risks.
• Humans can (or should) decide on changing deeply embedded values that define higher level rules of operation and interaction. If not, societies may continue to create wealth at the expense of declining ecological life support functions in a positive spiralling feedback loop that creates systemic risks with cascading effects and makes overarching economic, ecological and social systems increasingly susceptible to collapse.
• To fully realize the challenge and call of the Sendai Framework, major renovations of approaches to risk assessment and analysis are needed. Methods today are tuned to the largest and most historically obvious and tractable risks for human beings rather than on the full topography of risks.
• Scenario building and stochastic simulation need to be included in risk modelling to facil-itate thinking and decision-making in complex systems.
• A new paradigm for understanding and living with uncertainty and complexity is required – one that activates the power of human social and contextual intelligence, and where possible, leverages it through appropriately designed artificial intelligence.
• Developing the capability for contextual under-standing and decision-making can prove a more effective way of dealing with uncertainty and complexity than the present reliance on extrinsic frames of reference and categorical technical expertise, siloed into disciplines.
• Greater focus is required on place-based solutions that emerge from the collaborative development of contextual warm data based
on self-organizing around actions that are co-created, with local ownership of data, risks and solutions. Local capacity can be significantly increased by drawing from collective intelli-gence and mutual learning.
• A better understanding of the interactions and interdependencies between urban and rural areas is essential to reduce or prevent the creation of risk. This requires a functioning urban/rural (city region) data metabolism to process information at appropriate scales to understand the systems implications.
• Private sector financial institutions need to integrate DRM into their business models and practices through disaster risk-informed investments.
• Structures and approaches to bringing forward information are needed that present the contextual interlinking of the potential systemic risk impacts as they are felt at the individual, microscopic level within larger global, macro-scopic contexts.
72 Chapter 2

73

SpecialCase StudyHow small and medium enterprise disaster resilience became everybody’s business in the Philippines – a story of “cascading risk reduction”
Impact of Super Typhoon Meranti in the province of Batanes, Philippines, 2016. Loss of communications in disasters can have a cascading effect, causing widespread business disruption.
(Source: PDRF 2016)
74 Special Case Study

Small and medium enterprises (SMEs), includ-ing small-scale agriculture, are the backbone of many economies worldwide, and very much so in the Philippines and neighbouring South-East Asia. SMEs range from micro-businesses such as sole retailers in street markets, to manufacturing plants with significant capital investments in equip-ment and workforce training. They are recognized by the Asia-Pacific Economic Commission (APEC) and the Association of Southeast Asian Nations (ASEAN) as central to socioeconomic development in South-East Asia111, which is the global region most exposed to natural hazards. Their resilience to disas-ters is therefore also central to sustainable develop-ment. In the Philippines, 99.56% of businesses are micro, small and medium enterprises (MSMEs), and they provide 62.85% of all jobs.112
When disasters occur, a common image of the private sector is of large corporations helping with equipment or relief supplies. However, SMEs rarely have significant resources to offer others in this way, and they are often not part of business networks such as chambers of commerce. SMEs are embed-ded in their rural and urban communities, sharing the same risks from natural hazards as their neigh-bours. They are also at risk from fires, and chemi-cal, technological and environmental hazards (as well as potentially being a source of such hazards). They are set apart from their residential neighbours in that, in a globalized economy, SMEs are increas-ingly susceptible to systemic risks related to supply chains and access to markets from events that may occur at a great distance away.
Previous GARs and a range of other reports have documented the systemic impacts of the 2011 Bangkok floods on manufacturing supply chains in South-East and East Asia113. Flooding in and around Bangkok triggered a cascading regional
111 (ASEAN 2015, 2016–25); (APEC 2013); (APEC 2014); (APEC 2015a); (APEC 2015b) 112 (Almeda and Baysic-Pobre 2012); (Philippine Department of Trade and Industry 2017)113 (UNISDR 2013); (UNISDR 2015);
75

system. Most SMEs that the partnership works with have never done this kind of risk-informed planning in the past.
Soon after it began in 2009, PDRF was formally recognized as the private sector coordinator to work with the Government.116 A decade later, it has evolved into the major umbrella organization of the private sector for disaster preparedness, relief and recovery. PDRF gained new impetus to support SMEs from a 2015 regional project on strengthen-ing disaster and climate resilience of SMEs in Asia, with the intergovernmental organization the Asian Disaster Preparedness Center (ADPC) and other partners.117 As part of the SME resilience project, a survey of MSMEs in the Philippines indicated that, although owners were aware of risks from natural hazards, few MSMEs had contingency response plans, business continuity plans, insurance or financial resources that would see them through a major event such as a local destructive hurricane or earthquake.118 Systemic or cascading risk from hazard events occurring elsewhere was not part of their calculations. Most of them reported that they recovered from disasters by working longer and harder, and often using informal loans for recovery capital. Essentially, they were starting again each time a disaster hit, often with additional debt. In the hazard-prone territory of the Philippines, this meant they could not grow or build a secure busi-ness. MSME owners epitomized, in their individual lives, the premise that disasters reverse develop-ment gains.
In the same project, an analysis of the enabling environment made up of legislative and policy frameworks in the Philippines was conducted. It revealed that although there was a series of govern-ment agencies responsible for MSME development, small business financing, DRR and CCA, there were no clear mechanisms to bring these together to support MSME resilience against natural and mixed hazards and systemic risk. In a sense, Philippine MSME resilience was “everybody’s business” and “nobody’s business”, and yet the situation clearly required a systems response.119
impact because so many components essential to manufacturing in countries such as Japan were made there. The disruption of Bangkok manufac-turing through loss of electricity supply, no access to their premises and flood damage blocked the supply chain. Most of the disrupted suppliers in Thailand were SMEs that lacked resilience to flood hazards. Few SMEs had contingency plans or alter-native premises to relocate stock or plant, some had sensitive equipment and supplies at ground level and few had relevant insurance cover. Many that did not have access to capital or recovery loans never re-opened their doors.114 In the delta city of Bangkok, which is close to sea level, and in a country where SMEs are the majority employ-ers, these flood impacts were the realization of a series of risks that, like many systemic risks, seem obvious in hindsight, but were not perceived fully until the impact occurred.
Despite the negative impact, the experience of the 2011 floods has also had a positive cascad-ing effect in the region, generating new research and partnerships among the private sector, govern-ment and civil society for private sector and SME resilience. These floods and other disasters in South-East Asia have shown that it is not only large multinational enterprises that face systemic risks in the global economy, but also much smaller and apparently local enterprises, and therefore the supply chains that operate among them.
The Philippine Disaster Resilience Foundation (PDRF) the country’s primary private sector coor-dinator for disaster resilience – is working with the Government and other partners to offer train-ing on business continuity planning and also other disaster resilience programmes for SMEs.115 In just a few years, this partnership has trained around 7,000 enterprise owners throughout the Philippines. The training considers risks to business continu-ity from the direct impacts of natural and techno-logical hazards, the indirect or systemic impacts of hazards (e.g. power blackouts, loss of communica-tions, breakdown in transport systems and supply chains) and the more traditionally recognized risks to business continuity such as economic reces-sion and other shocks through the global financial
76 Special Case Study

Presentation during the Train for Business Resilience Course, Tuguegarao, Philippines, 2018(Source: PDRF 2018)
The Government of the Philippines promptly took up the challenge. Together with ADPC, it convened relevant government and private sector organiza-tions to agree a road map intended to improve government and private sector collaboration across sectoral silos, to support Philippine MSMEs to move towards resilience to the range of shocks they are
likely to experience.120 The MSME Resiliency Core Group was formalized in July 2016, made up of a diverse group of government and private sector agencies: the Bureau of Small and Medium Enter-prise in Development of the Department of Trade and Industry; the Office of Civil Defense; the Phil-ippine Chamber of Commerce and Industry; the
Philippine Exporters Confederation; the Asia-Pacific Alliance for Disaster Management, Philippines; the Employers Confederation of the Philippines; the Department of Science and Technology; the Depart-ment of Interior and Local Government; PDRF; and ADPC. The group is continuing its work and has
114 (ADPC 2014); (ADPC 2017d); (Haraguchi and Lall 2015)115 (PDRF 2019)116 (Philippines 2010)117 Supported by Asian Development Bank, Deutsche Gesell-schaft für Internationale Zusammenarbeit GmbH within the framework of the Global Initiative on Disaster Risk Manage-ment, and Canada.
118 (ADPC 2017b)119 (ADPC 2017a) 120 (ADPC 2017c)121 (ADPC 2017a)
assigned various organizations to lead implemen-tation of different themes, nationally and in the regions.121 It is under this core group that PDRF plays a leading role in business continuity aware-ness and capacity-building.
77
The idea of supporting individual SME resilience has also expanded to the regional level, with PDRF and others joining the Asian Preparedness Partner-ship (APP), launched in 2017. Adopting a “network of networks” approach, APP aims to improve networking, strengthen interactions and partner-ships, share knowledge and resources among governments, networks of local humanitarian orga-nizations, and private sector networks.122 With ADPC as its Secretariat, APP has already formalized national preparedness partnerships in Cambodia, Myanmar, Nepal, Pakistan, the Philippines and Sri Lanka.123
A positive cascade of risk reduction awareness trig-gered by the Bangkok floods has thus permeated government policy and action and private sector engagement in other countries in the region. In the Philippines, it has energized new ways of working in “systemic risk reduction” to tackle a broad spectrum of local and regional disaster risks that affect SMEs’ business continuity and their contribution to socio-economic development.
122 (ADPC 2018)123 (ADPC 2018)
78 Special Case Study

Introduction
The basis for understanding risk the world will face in the coming century cannot rely on past informa-tion to inform future states. The myriad effects of climate change, intentionally diverted or dammed river flows, new dynamics of human interaction, air quality, new industrial facilities, inevitable accidents, biodiversity loss, ocean acidification, increasing social and wealth inequality, and new wars all repre-sent a context that can be estimated only.
Some hazard effects can be modelled. Hydrody-namic models can project what would happen in a given watershed given predefined conditions of volume, speed, depth and obstacles. Models can be used to indicate disease spread with a specified viru-lence, mortality rate, vector type, etc. Their ability to
Part I: The Sendai Framework’s Broadened View of the World’s Risk
give an accurate sense of risk in the terms expected extends to a few years – in some cases decades. Seismic hazard is driven largely by factors well below the Earth’s surface, beyond the ability of humanity to affect them, without ignoring the unknown risk posed by induced seismicity caused by fracking. But to be understood in risk terms, seismic hazard research must forecast the effects of events on exposed assets, and there too it faces challenges.
The underlying fabric of exposure, vulnerability and interconnectedness is changing so quickly that the exposure model presented in the previous version of this publication (GAR15) has been overtaken by more accurate measurement tools, a world that has changed drastically in the last five years, and increased expectations of the understanding of the effects of hazards on communities, ecosystems and institutions.
79

Figure: The Sendai Framework’s Broadened View of the World’s Risk
Out of necessity, the way risk is depicted in this GAR still makes reference to the way it was done in past GARs. It still seeks to measure, quantify and trans-mit messaging about risk that can enable decision makers to take appropriate action, because these are the tools that are now available. In this part, Chapter 3 considers a range of hazards that will be familiar to readers of past GARs (seismic, tsunami, landslide, flooding and fire), as well as a range of other hazards incorporated into the broader risk scope of the Sendai Framework (biological, nuclear/radiological, chemical, industrial, NATECH (natural hazards triggering technological disasters) and
environmental) and the issues of exposure and vulnerability to these hazards. In doing so, it aims to provide an overview of the latest information, modelling and developments, to support decision makers in preparing for and reducing risk, based on what is known. But this part is also, profoundly, about change.
Chapter 4 explores the enablers of change in terms of the technology available and how it can be used (nature of knowledge, the potential of open data and software, interoperability of knowledge and data systems, and progress in data science), and
80 Part I

explores positive developments and opportunities for multidisciplinary and transboundary collabora-tion. Chapter 5 recognizes that systemic change, even when necessary, is extremely challenging, due to the way people are accustomed to thinking about risk (mindset challenges) and how to better communicate it to them, the ever-present political challenges, and recognized limitations in technol-ogy and resources.
The last chapter of this part, Chapter 6, is a special section on drought risk. The incidence of drought is projected to increase over the coming century. It is
one of the most complex weather-related hazards due to its wide-ranging and cascading impacts that affect socioeconomic activity, social vulner-ability and development. Yet proactive drought risk reduction is still a challenge in most parts of the world, as it is often underestimated as a source of risk, and its effects are compounded across human and environmental systems, across short and long timescales. The chapter highlights a type of risk that cannot be dealt with through a single-hazard approach and requires the systemic risk analysis and integrated risk governance emphasized in the Sendai Framework.
81

The term “risk” has different meanings: (a) as a synonym for probability of a harmful effect occur-ring and (b) as a synonym for the mathematical expectation of the magnitude of the undesirable consequence (even as a quasi-synonym of conse-quence, whereby risk has a similar meaning to undesirable outcome).
Ten years from the publication of this GAR, the world population is projected to exceed 8 billion, and by 2055, more than 10 billion. This growth in population has resulted in an increase in economic losses due to natural hazards from $14 billion annu-ally to more than $140 billion between 1985 and 2014.1
In the period since GAR15, the hazard community has shifted away from a focus on individual hazards and broadened its scope to examine more complex, real scenarios that acknowledge the likelihood of one hazard eventually leading to another (cascad-ing hazard), or multiple hazards crossing in either time and/or space creating an even larger disaster. In addition, the Sendai Framework has expanded the range of hazards to be considered.
Most hazard sciences now use open source tools and are part of a larger movement promoting the widespread use of sharing open data. The democ-ratization of risk information empowers individuals,
Chapter 3:Risk
communities and governments to draw conclusions and influence their own exposure and vulnerability. The shift towards open source and open data has provided a foundation for greater collaboration on a global scale within hazard communities and across hazard science.
The march towards openness, collaboration, inter-change and cooperation has momentum. While there will be holdouts to this movement, trends in technology and data science suggest they will be increasingly in the minority. Openness solves many challenges, but there are still challenges to produc-ing and communicating good risk information.
This part will outline developments related to under-standing of risk since the publication of GAR15. In addition to expanding the scope of hazards under consideration beyond natural hazards, the Sendai Framework has called for recognition of the impact on and role to play for local, regional, national and global actors, and for a richer understanding of exposure and vulnerability. Furthermore, it consid-ers an expanded list of hazards including human-made hazards and natural hazards that have been historically difficult to represent. In investigating the dynamic interconnected nature of risk, it calls for the imperative to develop new ways of think-ing, living and working together that recognise the nature of systems.
82 Chapter 3

New challenges call for novel solutions. While the GAR may never again produce individual risk metric figures for countries, this GAR is intended to give as true a picture of risk as possible. Facing that chal-lenge, it must be acknowledged that: (a) the truth can be complicated and (b) some readers will be disappointed that the focus of this section is not on presenting probable maximum loss (PML) and average annual loss (AAL) figures. Furthermore, inasmuch as this GAR seeks to pay due respect to the expanded scope of hazards in the Sendai Framework there are hazards this report has previ-ously covered that are not represented – notably, wind and storm. This GAR does include many hazards that have never been covered before, including biological risk, chemical and industrial, environmental, NATECH and nuclear/radiological. The GAR has never been exhaustive in its cover-age of hazard and while GAR19 makes an effort to be comprehensive, there are and always will be sections that stand to be enriched in future iterations.
People and assets around the world are being exposed to a growing mixture of hazards and risks, in places and to an extent previously unrecorded. Heat-waves mixed with drought conditions can trigger intense wildfires that cause high levels of air pollution from burning forests and hazardous chemicals, such as the dioxins from burning plas-tics, as well as water pollution from the flame retar-dants used to fight the fires leaking into waterways, drinking water and marine systems. In other words, a perfect storm is created by the complex interlink-ages of different natural and anthropogenic events and processes.
This part concludes with an exploration of drought hazard from a multidimensional perspective. Past GARs did not present drought risk partly because it is a highly complicated risk. The drivers are mani-fold, and the impact is felt more strongly in the secondary effects (lost livelihoods, forced migra-tion, and top soil and nutrient erosion) than in primary effects. The chapter on drought will serve as an introduction to an off-cycle GAR special report on drought to be published in 2020.
3.1 Hazards
The growth of accuracy and sophistication of risk assessment has been propelled by the hazard community. This is reflective of a past paradigm where disaster and hazard were used interchange-ably. It also reflects the emphasis on empiricism in risk science. In many ways, that emphasis on scientific methods to understand hazards has led to a state in which disaster research is accorded a certain respect. Hazard research continues to domi-nate global research related to understanding risk.
The era of the Sendai Framework has opened the door for the inclusion of a broader community of research in understanding the true nature of risk. Social science researchers, economists, public policy specialists, epidemiologists and others who can contribute valuable information about the nature of vulnerability and exposure are finding a welcoming community whose main objective is to give increasingly clear and accurate risk informa-tion. There is no doubt that the nature of risk infor-mation is and will continue to be quantitative, but the focus on probabilistic modelling and homoge-neous data sets is giving way to a future that is less definitive and more accurately representative of the world as it is.
In this section, there is still a focus on hazards first, but the interconnection among hazards and the connections of the hazard research community to other risk research is validation of the Sendai Framework.
1 (UN DESA 2019)
83

3.1.1 Seismic
This peril has been responsible for an average direct death toll of over 20,000 people per year in the last several decades and economic losses that can reach a significant fraction of a country’s wealth. On average, earthquakes constitute 20% of annual economic losses due to disasters, but in some years, this proportion has been as high as 60% (e.g. in 2010 and 2011).2 In Central America and the Caribbean, the earthquakes of Guatemala (1976), Nicaragua (1972), El Salvador (1986) and Haiti (2010) caused direct economic losses of approximately 98%, 82%, 40% and 120% of the nominal GDP of each country, respectively.3
While global earthquake models have not changed dramatically, many of the inputs have changed, as has the way in which earthquakes are being studied and understood. GAR15 focused on earthquakes as ground shaking and the impact of earthquakes as related to structural damage to buildings due to shaking. Nearly five years on, knowledge of earthquakes is being informed by new models, and by a better understanding of faults and thus movement within time and space.
This has been facilitated by greater collaboration enabling local-level data to help inform the global level.
In general, earthquake models are heavily based on data from past earthquakes: magnitude, frequency, ground shaking and damage. Thus, models at the global level have been created mainly through statistical analyses of past events and empirical data on damage and mortality. Models are improv-ing in several ways: increased understanding of how active faults accumulate seismic energy; greater availability of ground shaking recordings from damaging earthquakes; better understanding of the vulnerability of structures from field observa-tions as well as computer simulations; and better descriptions of the human and built environment from a wide range of sources, including satellite imagery and crowdsourcing.
Global models now integrate local information about faults and microfaults as well as to reflect verified plate movement measurements. There is a growing emphasis on the use of geodesy (the branch of mathematics dealing with the shape and area of the Earth). Each factor affects ground shaking differently, thus the greater the level of detail, the more accurate forecasting can be.
A particularly interesting development is the use of information about the drivers of seismic risk from one location to inform risk scenarios and planning in other locations with similar dynamics. This enables experts to understand models by learning from the results of those run elsewhere. This technique is also in use by the volcanic research community. During volcanic crises, the most challenging task is to interpret the monitoring data to better antici-pate the evolution of the unrest and react.4 In other words, volcanologists need to make
an informed decision about what is likely to happen next. Aside from real-time monitor-ing data, volcanologists will rely on histori-cal unrest and past episodes of the same volcano. Such analysis requires a standardized and organized database of past events of the same volcano. Moreover, if the volcano has not erupted frequently or is not well studied, the only recourse of the volcanologist is to consult what has happened at other volcanoes, for which the need of a robust monitoring data-base is even more acute.
Box 3.1. Volcano Risk
(Source: (Costa et al. 2019); (Newhall et al. 2017)
84 Chapter 3

The Global Earthquake Model (GEM) now includes nearly 10,000 fault lines. This level of comprehen-siveness is available only due to the confluence of improved satellite capability, expanded availability of computing power and the inputs of hundreds of national and local seismic specialists.
As the level of available detail varies by location (by region, by country and sometimes even within countries), to ensure the most up-to-date data is incorporated into a global model, it is necessary to apply consistent methodologies and tools at all levels of analysis, from local to global. This infor-mation can then be combined into a homogeneous mosaic that allows comparisons of hazard among locations and regions.
In late 2018, GEM researchers released a mosaic-style model that brought together various earth-quake models to create global hazard and risk maps that included the most advanced information available at the national/regional levels for seismic risk. The mosaic element refers to the fact that
Regionally, seismic models have extended such that there are now models for a larger part of the world at a better quality with improved catalogues and geological parameters than ever before. Risk modelling has progressed to include cascading hazards in the models. An example of this new capacity is the increasing focus on modelling contingent losses or indirect losses. Pilot efforts are showing that it could be possible to estimate the price increases for certain types of goods when disaster events of different scales occur in some contexts. For risk managers and planners, this will be useful in understanding the probable knock-on effects of the event, but also to inform emergency measures.
Figure 3.1. Example earthquake mosaic map of part of Asia in 2018
(Source: GEM 2018)Disclaimer: The boundaries and names shown and the desig-nations used on these maps do not imply official endorse-ment or acceptance by the United Nations.
2 (Centre for Research on the Epidemiology of Disasters 2018)3 (Silva et al. 2019)4 (Sobradelo et al. 2015)
85

this model stitches together regional and national models from around the world and overlays them as tiles, using local inputs to inform the global picture.
The improved characterization of active faults and the ability to associate the locations of future earthquakes to active fault sources is an impor-tant shift. The Global Seismic Hazard Assessment Program (GSHAP),5 launched in the mid-1990s, also promoted a regionally coordinated, homoge-neous approach to seismic hazard evaluation. In a divergence from GSHAP, new assessments of risk for the largest earthquakes are now associ-ated with specific fault sources, resulting gener-ally in more refined and accurate estimates of the most significant earthquake risks. These advances contribute to a better understanding of the hazard. Local-level information on faults is changing how earthquakes are understood and how the move-ment of the Earth’s plates and subplates (e.g. microfaults) accretes. The collaborative approach now includes locally generated information about faults that can be seen in the hazard map, driving the shift from a spatial pattern of past earthquakes to a detailed pattern of faults derived from local geologic and geodesic knowledge. This level of detail is available in a few places only, particularly in more developed countries and near major plate boundaries. Away from these boundaries, in stable continental regions, researchers rely on relatively simpler methods based on historical earthquakes and general knowledge of geologic conditions.
In the short term, the mosaic model accepts a degree of loss of guarantee about the pedigree of the inputs in favour of collaboration and buy-in while promoting the open data paradigm for risk assessment. This structure also provides incentives for national and local risk modellers to produce high-quality local perspectives of their own commu-nities – the democratization of the data and the source material engenders long-term sustainability.
The open source, collaborative approach appears to be helping increase standardization and permitting shared information. This is primarily because open source modelling engines like OpenQuake6 have provided a platform for experts to build consistent
models using well-tested tools and to transpar-ently compare and evaluate the results. Historically, public institutions, particularly in developing coun-tries either did not have advanced analysis tools, or often relied on external consultants to model hazard and risk. The shift from reliance on private, black-box models to public, open source models enables public institutions to build their own view of hazard and risk. In turn, this provides open, trans-parent and high-quality information to raise risk awareness with a broader range of stakeholders.
Models are generally becoming more complex, with increased volumes of data, and leading to more robust results. Though forecasts are still discussed in terms of decades (rather than years or months), it is now possible to project probabilities of results in some areas in 30-year time periods. Most global seismic models are based on the idea that in any given year, a location would have the same probabil-ity of experiencing a 50- or 100- or 500-year event. And if one such event happened, the next year they would go back to having the same chance as the previous year of such an event occurring again.
To understand this, imagine a 50-sided die that was rolled the first day of every year – this would deter-mine whether a 50-year earthquake would occur in that year. Even if an earthquake was unluckily rolled in a particular year, the next year when the die was rolled, there would be precisely the same probability of experiencing an earthquake.
There is research under way in Japan, New Zealand and the United States of America to produce fore-casts that are time dependent. These sophisticated models can make statements like “the San Andreas Fault is now closer to failure than it was 20 years ago”. In this sense, if there is a 50-year probability, towards the end of the 50-year period, if nothing has happened, the event is more likely than it was at the beginning of that period. At the end of each scenario period, model likelihood can be adjusted.
This is mathematically complicated and is even more complicated to explain to the public, but aligns well with public perceptions of the ripeness of events that have not happened in recent memory.
86 Chapter 3

Time-dependent forecasting will not be applicable to most other hazards. It can work in seismic science – only with sufficiently detailed data – because most seismic events are the results of increasing pressure leading to a slip or rupture, and the probability does indeed increase.
Understanding the magnitude of losses from damaging events is fundamental to informing decision makers and disaster risk managers in the development of risk reduction measures. For example, in 2002, a catastrophe insurance pool for residential buildings was created in Turkey to transfer the risk from the public sector to the inter-national reinsurance market.7 The establishment of this financial mechanism required an earthquake model to estimate the expected economic losses for each province. More recently, researchers demonstrated how a probabilistic loss model could prioritize which schools should be the target of a retrofitting intervention in Colombia.8
The open source, active fault database is freely available to use and to contribute to, thus increas-ingly improving forecasts about the time, location and characteristics of rupture. The comparison of scenarios with similar drivers is also being used by the volcano risk community. The objective is to include all processed data of historical unrest from all reliable sources, including that which led to eruption. The database contains volcano infor-mation, monitoring data and supporting data such as images, maps and videos, as well as the alert levels where applicable.9 The data points are time stamped and georeferenced, so that they can be analysed in space and time.10
Other advanced tools are seeking to forecast seismic events from GPS measurements and land-based positioning of points that show how plates are moving. Since 2015, the Global Earth-quake Activity Model has been estimating shallow
earthquakes above magnitude 6 using this tech-nique.11 The premise is that to blend data from a record of historical earthquake events in a given region with the global strain rate map where strain rate acts as a proxy for fault stress accumulation, and earthquakes are the release of that stress.
Groupings of earthquakes can have huge implica-tions for insurance premiums, with companies often determining what they cover (only the main shock, or covering aftershocks within a predefined period). This makes it increasingly necessary to understand how earthquakes cluster and define foreshock versus main shock versus aftershock and then ensure that the appropriate considerations are used in planning and risk transfer. For example, in Christchurch (New Zealand) in 2011, a 6.2 magni-tude earthquake caused significant damage. This damage is thought to have been especially severe because a 7.1 magnitude earthquake had occurred in the same area the previous year and had weak-ened structures, although it caused relatively little damage. Was the Christchurch earthquake an after-shock or a separate occurrence?
Seismic science is predicted to be affected by climate change and similar dynamics as they relate to exposure and vulnerability. Historically, earth-quake risk models considered only built structures in assessing exposure and the type and height of those structures in assessing vulnerability. There can be little doubt, however, that a more holistic representation of the human, social, economic and ecological impact of seismic events must be part of future research.
There is growing political interest in induced seis-micity (earthquakes that are caused by human activity). Recent focus has been on fracking, but there were recorded earthquakes resulting from fluid being injected into an oilfield as far back as the 1960s.12 Furthermore, there are several examples
5 (GFZ Helmholtz-Zentrum Potsdam 2019) 6 (GEM 2019)7 (Bommer et al. 2002)8 (Mora et al. 2015); (Silva et al. 2019)
9 (Winson et al. 2014); (Fearnley et al. 2017)10 (Newhall et al. 2017)11 (Bird et al. 2015)12 (Raleigh, Healy and Bredehoeft 1976)
87

of water dams inducing earthquakes (reservoir induced) such as the Aswan Reservoir in Egypt.13 Though induced seismicity may not be a new occur-rence, it is a new factor in hazard models, and in selected areas where fracking is common (western Canada and central United States of America), it is being factored in to hazard maps for updating build-ing codes.
Change exists in risk exposure and recorded losses. Most insurance companies predicting risk anticipate an escalation in losses because there is expected to be an increase in exposed assets as economies grow to meet growing populations. These losses must be put into context; many trends that have been identified in the developed world are not necessarily mirrored in their developing country counterparts. Insurance penetration and regulatory standards to reduce risk before it is constructed are vastly more prevalent in richer countries. In 2017, compared with the average emerging market non-life insurance penetration rate of 1.5%, African premiums accounted for only 0.9% of GDP. Only Morocco, Namibia and South Africa exceed 2%,14 compared to the average in Organisation for Economic Co-operation and Development (OECD) countries of between 8.5% and 9.5% of GDP.15 Policy changes and a greater focus on risk reduction also help to decrease risk, but in places where economic growth outstrips investment in risk management and governance structures, risk will continue to grow.
3.1.2 Tsunami
Tsunamis must be treated as a multidisciplinary hazard. They can be triggered by earthquakes, land-slides, volcanoes or meteorological events, with large earthquakes being the most frequent trigger. Because their drivers require specific conditions to result in a tsunami, they are decidedly rarer than their triggering events. Tsunamis have a basis of historical evidence, but the data set is too sparse to characterize the tsunami risk on each specific coastline, especially in confined areas where there is a limited coastline section. Making this more challenging, over the last 100 years, only a handful of truly devastating tsunamis have occurred, contributing to most of the disaster tsunami losses across the globe. Large tsunamis occur with relatively low frequency but have potentially high impact. In the last two decades, this has been demonstrated, for instance, by the Indian Ocean (2004) and the Great East Japan (2011) tsunamis. The scale of these disasters far exceeded the previ-ously perceived risk in these areas.
Assessing tsunami risk requires a comprehen-sive and multidisciplinary approach. It is a topic that includes a wide range of disciplines, such as geophysics (e.g. seismology, geology and faulting), hydrodynamics and flow modelling (e.g. landslide dynamics, volcanology, coastal engineering and oceanography), vulnerability and risk assessment (e.g. geography, social sciences, economy, struc-tural engineering, mathematical and statistical sciences), in addition to disaster risk management and mitigation.
The tsunami maximum wave heights in Figure 3.2 do not correlate with their level of damage. The largest known tsunami occurred in Lituya Bay, Alaska, in the United States of America in 1958. The massive scale of the wave caused relatively little damage due to the limited exposed stock in the area at the time. The Great East Japan tsunami in 2011 and the Indian Ocean tsunami in 2004 were far smaller than the Lituya Bay tsunami, but they caused far more losses.
88 Chapter 3

Figure 3.2. Selected tsunami wave heights (maximum wave heights recorded)
(Sources: National Oceanic and Atmospheric Administration National Geophysical Data Center/World Data Service Global Historical Tsunami Database 2019; National Centers for Environmental Information 2019)
Tsunami hazards are heterogeneous; smaller events can cause devastation, as evidenced by the events in Indonesia with the Palu tsunami in 2018 and the Mentawai tsunami in 2010. These events exemplify cases where unconventional mecha-nisms generate tsunamis that are unexpectedly large given the magnitude of the triggering event.
Due to their infrequent nature, tsunamis often catch coastal communities off-guard. Perhaps the most pertinent example is the 2004 Indian Ocean tsunami that hit a largely unprepared coastal popu-lation in nearly a dozen countries and resulted in more than 230,000 fatalities. Due to the enormous consequences of that tsunami, the need for more sophisticated and comprehensive methodologies to understand and manage tsunami risk in a wider range of locations immediately became obvious. The most obvious interventions were in risk mitiga-tion activities such as construction of wave-absorb-ing sea walls, elevated facilities, evacuation routes and EWSs. After 2004, tsunami research and risk
mitigation activities spread to many regions that previously had very little focus on tsunami risk – particularly South and South-East Asia.
Understanding the drivers of tsunami hazards
The use of probabilistic models for tsunami hazard analysis started in the early 2000s. A range of appli-cations followed, from local to regional to global scales. A great deal of uncertainty is involved in tsunami hazard modelling, especially in the low-probability region of hazard curves, which is where the most extreme consequences are expected. Traditionally, probabilistic tsunami hazard assess-ments (PTHAs) have covered intermediate to
13 (Gahalaut and Hassoup 2012) 14 (African Insurance Organization 2018)15 (OECD 2019)
89

large regions, providing quantitative estimates of maximum tsunami elevation in deep coastal waters. However, as tsunami damage is caused by the flow onshore where assets and population are located, additional effort is needed to characterize tsunami hazard intensities in those areas.
Several measures of tsunami intensity have been suggested:
While it may not provide optimal accuracy, flow depth is the quantity that is the most frequently used tsunami hazard intensity measure.16 The reason is that most building damage observations and probability assessments of tsunami mortality risk present vulnerability as a function of flow depth as the sole damage indicator. Flow depth is also the most readily observed intensity parameter (using water or debris marks) at multiple locations once tsunami water has receded.17
Tsunami hazard is expressed in terms of different probabilities of exceeding a given tsunami intensity at a given location. This includes maximum values of the height of a tsunami in a given time frame. A tsunami with a maximum wave height of 20 m is much less likely than one with a maximum wave height of 5 m. This is because the drivers of tsuna-mis of those scales are rarer – larger earthquakes, landslides or volcanic events are less common than smaller ones. To determine tsunami hazard, PTHA methods are used to quantifying the probability of tsunami losses at a global scale. To do this, tsunami propagation was modelled globally, and offshore wave amplitudes were converted into estimates of the onshore maximum inundation height by combin-ing amplification factors with a statistical model.
PTHA was used to quantify the tsunami hazard globally for GAR15. But because GAR15 was oriented to quantifying tsunami risk, official tsunami hazard maps were never issued. A set of upgraded global tsunami hazard maps was devel-oped later, based on the GAR15 data and including epistemic uncertainty (uncertainty due to lack of knowledge) stemming from the probabilistic earth-quake model.18 These global tsunami hazard maps presented maximum inundation heights at the shoreline due to earthquake sources for a large set of coastlines worldwide, using global tectonic infor-mation from the earthquake model.19
There are other generators of tsunamis that are more difficult to model. There are also tsunamis generated by landslides and meteo-tsunamis (rare events when specific meteorological conditions create a destructive tsunami).
Risk and impact assessment require the integra-tion of hazard estimates with exposure data and vulnerability functions (relationships describing the expected impact of several levels of hazard intensi-ties on different types of exposure). This will estab-lish the likelihood and severity of impacts in terms of casualties, cost of direct damage or number of damaged structures. Impact assessments esti-mate the consequences of one or a few scenarios (i.e. using deterministic assessment, which estab-lishes the potential impacts of tsunamis at one or more sites). Risk assessments include a frequency component, derived from the hazard frequency, to describe the expected severity of an event within a defined time frame (e.g. the amount of loss expected to be exceeded once on average in, say, a 50-year period), or with a given annual probability of occurrence.
Due to the complexity of simulating onshore inun-dation for the large numbers of events in a fully probabilistic event set, no studies have been carried out with a full range of probabilistic estimates of tsunami impact onshore, and only a few have done so for selected return periods.20 Frequently, these scenario-based risk assessments are motivated by the need for very detailed simulations for engi-neering requirements; these should ideally happen
• Tsunami flow depth, i.e. the maximum height the water reaches above land
• Wave current speed
• Wave current acceleration
• Wave current inertia (product of wave accelera-tion and flow depth)
• Wave current momentum flux (product of flow depth and square wave current speed)
90 Chapter 3

Evacuation route in Iquique, Chile (Source: Flickr.com user Francois Le Minh 2007)
16 (Behrens and Dias 2015)17 (Suppasri et al. 2013)18 (Davies et al. 2018) 19 (Berryman et al. 2015)
20 (Dominey-Howes et al. 2010)21 (Shoji and Nakamura 2017)22 (Suppasri et al. 2013)
due to disaggregation from probabilistic estimates, rather than using individual, detailed assessments to project a global understanding of risk. But they are indicative of an appetite for detailed and accu-rate risk information for tsunamis to inform building codes, mitigation measures, insurance options and public safety measures.
Researchers have a growing understanding of vulnerability to tsunamis due to post facto analysis from recent tsunami events. A variety of new data has become available in recent years. For example, findings from the 2011 Great East Japan tsunami reveals that road bridges appear to be able to with-stand 10 m flow depth with only 10% probability of being washed away.21 Further, at flow veloci-ties of 1 m/s and 5 m/s, small fishing boats will be washed away with 60% and 90% probabilities,
respectively.22 Aquaculture rafts and eelgrass will be washed away with 90% probability when the flow velocities are 1.3 m/s and 3 m/s, respectively. These details enrich the understanding of expo-sure and its vulnerability to other effects of tsuna-mis, and serves to refine the quality of the risk assessment.
In terms of global risk assessments, the proba-bilistic tsunami risk assessment (PTRA) method provides PML estimates for direct economic loss due to building damage for coastal nations world-wide. This is presently the most advanced global model on tsunami risk. In absolute values Japan by far exceeds other countries’ risk. However, normalizing PML to the total exposed value of each country, several SIDS face similar relative tsunami risk.
91

Countries in the Eastern Mediterranean Basin also ranked high in the above method. The global PTRA was one of the first applications of its kind, regard-less of geographic scale. Consequently, there are large uncertainties in the different methods and data applied. For exposure estimation, there are also major challenges related to the availability of topographic data sets with sufficient resolution. Those provisions indicate that while this model provides some clues about trends in global tsunami risk, in coming years with refined methods and better data, future models will provide more refined estimates of global tsunami risk.
Tsunami risk research has focused thus far on tsunamis triggered by earthquakes. Further work is required to characterize events triggered by landslides, volcanoes and meteorological loading, particularly in the frame of the current move towards understanding the systemic nature of risk, as outlined in this GAR. The understanding of tsunami risk is not yet at the same level as the understanding of the hazard. To bring tsunamis up to speed in the context of the first priority of the Sendai Framework “Understanding disaster risk”, more work is needed in enriching a sound PTRA methodological framework that accounts for expo-sure and vulnerability in more dimensions.
3.1.3 Landslide
The evaluation of landslide hazard should entail diagnosis of the geo-hydro-mechanical processes bringing about the landslides that eventually gener-ate damage.
The assessment of landslide hazard based upon geo-hydro-mechanical analysis of slopes is gener-ally recognized to be the planning basis for coun-tries experiencing high landslide susceptibility (e.g. in Afghanistan, in Himalaya belt slopes in Asia, in Bolivia, Brazil and the Bolivarian Republic of Vene-zuela in South America, and in Italy and Spain in Europe). But the experienced losses from contem-porary landslide events testify that these assess-ments, or the mitigation measures they should have precipitated, are not appropriately developed.
The Multiscalar Method for Landslide Mitigation is a new methodology for the assessment of land-slide hazard at the local scale, based on geo-hydro-mechanical analyses. This method seeks to identify the geo-hydro-mechanical contexts most common in the slopes of the region,23 and for the corresponding landslide mechanisms, which are then recognized as the mechanisms typical to the region.24 Having as a basis the set of representative landslide mechanisms can make landslide risk management at the local scale more sustainable, since it can guide the selec-tion of the mitigation measures based on awareness of the typical landslide features and causes.
Urbanization frequently extends over unstable slopes and ancient landslides. This is particularly true for informal settlements. Therefore, landslides often affect the poorest parts of urban areas, whose expansion is restricted to land that would not withstand simple engineering tests.
Diagnosis of the landslide mechanism
Landslides are the final process of a sequence of phenomena taking place in the slope that involve strain localization and progressive failure (overall
92 Chapter 3
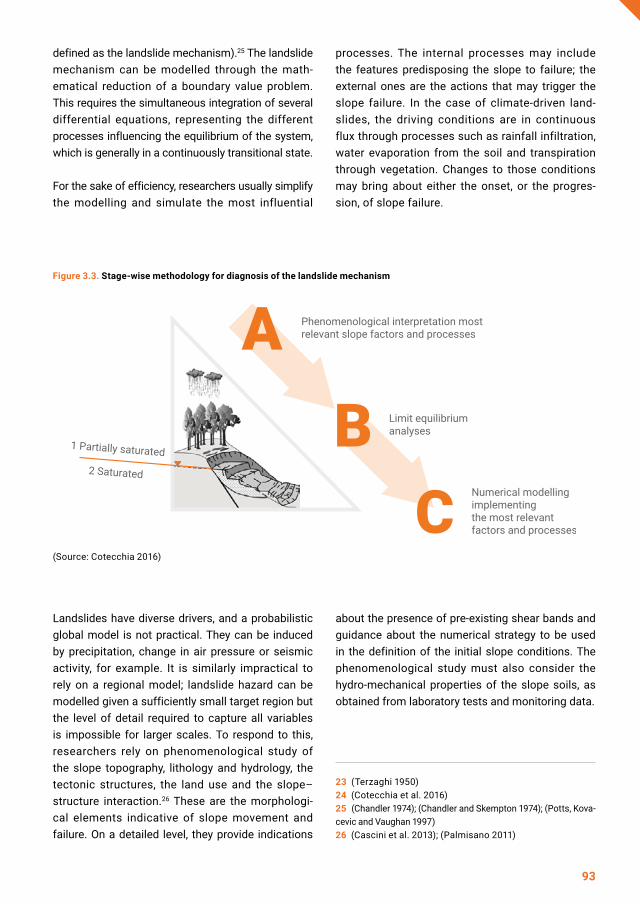
defined as the landslide mechanism).25 The landslide mechanism can be modelled through the math-ematical reduction of a boundary value problem. This requires the simultaneous integration of several differential equations, representing the different processes influencing the equilibrium of the system, which is generally in a continuously transitional state.
For the sake of efficiency, researchers usually simplify the modelling and simulate the most influential
Landslides have diverse drivers, and a probabilistic global model is not practical. They can be induced by precipitation, change in air pressure or seismic activity, for example. It is similarly impractical to rely on a regional model; landslide hazard can be modelled given a sufficiently small target region but the level of detail required to capture all variables is impossible for larger scales. To respond to this, researchers rely on phenomenological study of the slope topography, lithology and hydrology, the tectonic structures, the land use and the slope–structure interaction.26 These are the morphologi-cal elements indicative of slope movement and failure. On a detailed level, they provide indications
processes. The internal processes may include the features predisposing the slope to failure; the external ones are the actions that may trigger the slope failure. In the case of climate-driven land-slides, the driving conditions are in continuous flux through processes such as rainfall infiltration, water evaporation from the soil and transpiration through vegetation. Changes to those conditions may bring about either the onset, or the progres-sion, of slope failure.
about the presence of pre-existing shear bands and guidance about the numerical strategy to be used in the definition of the initial slope conditions. The phenomenological study must also consider the hydro-mechanical properties of the slope soils, as obtained from laboratory tests and monitoring data.
Figure 3.3. Stage-wise methodology for diagnosis of the landslide mechanism
23 (Terzaghi 1950) 24 (Cotecchia et al. 2016)25 (Chandler 1974); (Chandler and Skempton 1974); (Potts, Kova-cevic and Vaughan 1997)26 (Cascini et al. 2013); (Palmisano 2011)
(Source: Cotecchia 2016)
93

Though numerical modelling may be extremely advanced, a slope model implementing all the slope factors and processes is not feasible in most cases and could produce misleading results. Therefore, modelling alone is not sufficient for appropriate hazard diagnosis and must be paired with field studies.
The map database thus obtained then becomes a guideline in the assessment of the landslide hazard within the given area of interest. It will include data representing the landslide factors at the site of interest, with particular emphasis on those recog-nized to be predisposed to landslides in the first phase, and data about the slope movements.
Multiscalar Method for Landslide Mitigation
All the knowledge acquired during Phase 1 in Figure 3.5, along with the methodological steps to be applied for the assessment of the landslide hazard in a given specific territorial cell of interest for the region, should be reported in a landslide manual using a global information system platform.27 This gathers together the geo-hydro-mechanical knowl-edge about the slopes across the region, of reference for land-use planning or in mitigation design for the unstable slopes of the region. The model should be continuously upgraded in any region.
Once the active landslide mechanisms for the studied region are analysed, it becomes possible to focus on design of the measures for risk mitigation. These must be carefully tailored to the character-istics of the landslide-prone area and can include the construction of drainage trenches and planting highly transpiring vegetation to stabilize the slope.
Figure 3.4. Sequence of actions required to derive landslide hazard assessments
(Source: Cotecchia 2016)
94 Chapter 3

27 (Mancini, Ceppi, and Ritrovato 2008); (Lollino et al. 2016); (Cotecchia et al. 2012); (Santaloia, Cotecchia and Vitone 2012) 28 (Ikeuchi et al. 2017)
With current methods, assessment of landslide risk remains highly contextual and localized. At its most rigorous, it involves different stages of analysis, first phenomenological, thereafter mathematical/numer-ical, to characterize the representative geo-hydro-mechanical context and landslide mechanisms.
In principle, with sufficiently detailed data sets, risk profiles could be created with input from the specific landslide hazard assessment mentioned above. This is simply not practical in most circumstances.
3.1.4 Flooding
While seismic science has been able to move forward with a coordinated, collaborative approach to modelling the hazard, flood science faces several obstacles that make the process of reaching the same point more complicated. Floods are simply the presence of water on land that is usually dry. The causes of that flooding can be too much precipitation, snow melt that occurs too quickly, a dam break, a tsunami or storm surge, inadequate water management practices, etc. The dynamics that dictate flood risk are difficult to model – a key reason why not all flood causations can be modelled with contemporary resources. There are models for many different drivers of flooding, but not all, and the work of harmonizing the different drivers into a harmonized flood model remains a challenge for the flood community.
Several different flood models have been developed for riverine and coastal flooding. But the challenge in developing a more comprehensive global model is to combine these models together. A first step in this direction has been made by linking one hydrodynam-ics model with downstream boundary conditions from a tide and storm-surge data set.28 In doing this, the linked effects of flooding at river water levels and in estuaries have been mapped globally. Other initiatives are developing methods to nest local flood models within global models, thereby increasing computational efficiency and enhancing localized accuracy in those areas where the local models exist
When assessing flood risk, a key concern is related to triggering factors. There is no single source that causes a flood; it can arise from multiple drivers. Considering the challenges in accuracy related to short-term weather forecasts, where at least some of the dynamics can be modelled, the challenge of risk projection for precipitation drivers of flooding are orders of magnitude more complex. Precipi-tation patterns must consider multiple dynamic sources. Even in the same catchment area, the same precipitation distributed in different ways can lead to vastly different results. Other conditions must be factored in, including the soil conditions (very dry, partial saturation, snow melt, etc.), and all those elements must then be linked to local factors that are not always possible to project at the global level. The primary difference between global and local models is not the processes – those are effec-tively the same – but rather the ability to tailor them to a local context that can make the difference for producing a comprehensive understanding of risk.
Older hydrological models were focused on project-ing probable discharge of rivers, creating a time series of the flow in the river and applying those discharge values to a hydraulics model that incor-porated flood flow and depth. Now, with the ability to run calculations on far more powerful computers, the hydrological cycle can be resolved in a more accurate way, thus enabling improved simulation of hydrology and the production of more reliable values of discharge.
Using these tools, many probabilistic flood maps are now available. Recent work to combine them has highlighted the significant advances possible in recent years. Through the Global Flood Partnership (GFP), work is under way to compare the various existing models and identify gaps that will require further research and development. GFP is a multi-disciplinary group of scientists, agencies and flood risk managers focused on developing efficient and
95
effective global flood tools. Its aim is to build coop-eration for global flood forecasting, monitoring and impact assessment to strengthen preparedness and response and to reduce global disaster losses.29 Much like seismic science, the ideal case is to use locally produced models, and a plan is required to collect these and figure out how to fill gaps. The result should provide a basis for other models and enable them to be mutually improved.
In the past, people working on flood mapping and flood forecasting were working independently, but they are now using the same base data and have slowly come together to use the same timescales. Since 2015, drought and flood communities have been working together on a common framework that provides a single model which indicates simply whether there is too much or too little water. One example that clearly shows the interplay between droughts and flooding is the border between India and Pakistan. This area experiences sequential flooding and drought, both of which provide a basis for agricultural production in the region (as flood-ing increases the water table, the area absorbs that water during drought, and the water table is lowered before the next round of flooding).
The key is to move away from a simple hydrological risk paradigm and instead focus on impact. If expo-sure and vulnerability are incorporated into models, probabilistic modelling then becomes more impor-tant to provide information on the potential impact, not just to understand a hazard. It can then inform decision makers so that they are able to issue detailed early warnings, or over a larger timescale, incorporate the information into decisions on land-use planning, building approvals and infrastructure development.
Climatological models have also improved, in the analysis of the past and in their ability to forecast into the future. More detail is derived with the community working on high-resolution simulations of the climate. In 2015, the resolution of the climatological model was 80 km2; now, detailed models are a maximum of 40 km2, improving the overall global granularity. Unfortunately, capacity of simulating models at the global level is limited, but it is expected to improve
in the coming years with even greater increases in resolution. Meteorological reanalysis has also been extended further into the past, with the twentieth century reanalysis providing global hindcasts of meteorological conditions back to 1851. GFP has been working to better represent the dynamics of the hydraulics by improving depth measures but doing this for total global coverage requires significant resources. Many researchers are working to improve the available instruments and build on current research allowing for an evaluation of the hydraulics hazards. At the local scale, further research is needed to go even further so that reliable hazard and damage computations can become a reality.
Data scarcity is a hurdle for global models and is fuelled by lack of resources for an area to produce such data and by concerns regarding the secu-rity sensitivity of the data, which inhibits the free exchange on which such a model relies. The avail-ability of detailed data from satellites is aiding the calibration and validation of hydrological models that can be used in parts of the world where local data are scarce. An example of work that is filling in the gaps is the Soil Moisture Active Passive sat-ellite, which provides detailed information on soil moisture. although the resource has been avail-able for some time, it is only the latest versions of models that can incorporate this data.30 Availability of high-quality and high-resolution digital elevation data remains a key challenge when undertaking global simulations of flooding.
The inclusion of epistemic uncertainty represents another major shift in the way the risk is calculated. It is difficult to compute flood risk due to the wide range of variables that are required for model-ling flood scenarios, as well as the computational resources that are required (with a single scenario taking up to a day to run). As a result, it has become necessary to sample scenarios. The collection of samples creates a portfolio that produces a mean result and standard deviation.
Shorter-term forecasts are time dependent (e.g. three to six hours for flash flooding, normal weather forecasts of one to three days, medium range being 3 to 15 days and seasonal forecasts are longer
96 Chapter 3

term). Longer-term forecasts for climate change are based on Poisson distributions (representing the probability of a given event independently of the time since the last event). They are normally depicted with three different horizons: short-, mid- and long-term futures.
It is difficult to examine changes in flood risk at the global level. Temperatures are rising, and this will have drastic effects on how flood risks are studied and calculated and on the effects of floods in the world. Using this as a basis, various scenarios have been developed to examine how anticipated climato-logical changes will affect flood risk. The challenge is that the effects of climate change will not increase the mean temperature in all parts of the world evenly. Mean temperature changes will vary significantly from one location to the next. While flooding is likely to increase overall, as increasing temperatures melt glaciers and increase water levels, in general, the warmer temperature is expected to amplify aridity and evaporation in some regions. There will be more droughts and more floods, but this balance will serve to highlight the differences between regions.
At the global level, the consensus is that changes in mean sea-level, storm-surge levels, the frequency of storm surges, wave action and water tempera-ture/volume will have tremendous implications for the underlying assumptions of the long-term risk models currently in use. In all scenarios, there will be an increased risk of coastal flooding in many parts of the world. Coastal flooding is projected to have a more significant impact than even riverine flooding; the value of the infrastructure and assets that stand to be damaged is increasing.
Using models to predict the probability of suc-cess and value of possible intervention methods is another important change in the scientific commu-nity, and can be used to help inform decision makers.
Global flood risk modelling is now taking a step forward from simulating scenarios of flood risk, to developing methods to assess how adaptation strategies could reduce that risk. For example, the Global Flood Risk model was applied to examine the costs and benefits of adaptation through dikes
and levees with scenarios of climate change and socioeconomic development until 2100.31 To make such research useful to decision makers, the tool Aqueduct Floods will be released in 2019 to allow anyone to assess these costs and benefits for any country, State or basin.
Recent years have seen a growing recognition in the flood risk community that many hydrological and meteorological risks (e.g. floods, wildfires, heat-waves or droughts) result from a combination of interacting physical processes having differ-ent effects across different spatial and temporal scales, and that correctly assessing the risk there-fore requires scientists and practitioners to include these interactions in their risk analyses.32 This can result in the disproportionate representation of the probability of extreme events, referred to as “com-pound flood events”.33 These compound events have been identified as an important challenge by the World Climate Research Programme Grand Challenge on Weather and Climate Extremes. As a result, a new process has been initiated to: (a) iden-tify key process and variable combinations under-pinning compound events; (b) describe the available statistical methods for modelling dependence in time, space and between multiple variables; (c) identify data requirements needed to document, understand and simulate compound events; and (d) propose an analysis framework to improve the assessment of compound events.34
Compound event analysis has been a rapidly growing field of analysis in large-scale flood risk analysis. Whereas flood risk studies traditionally examined floods from one driver (either river flood-ing, pluvial flooding or coastal flooding), research is increasingly examining the impact of combina-tions of these drivers. In 2017, the combination of unprecedented local rainfall intensities (pluvial flood
29 (EC 2019)30 (NASA 2019b)31 (Winsemius et al. 2013)32 (Zscheischler et al. 2018)33 (Zscheischler et al. 2018)34 (Zhang et al. 2017)
97

driver) with storm surges (coastal flood driver) from Hurricanes Harvey, Irma and Maria led to major flood events and damage in Houston, Florida and numer-ous islands in the Caribbean.35 Hurricane Harvey is now the second costliest natural hazard event in American history. Moreover, by not considering compound flooding, the risk Houston faced was, and continues to be, underestimated. Despite their potential for high impacts, compound events remain poorly understood and are typically ignored in disas-ter management plans. This is an omission that fundamentally and seriously biases existing flood risk assessments.
At local scale, several studies have found that there is a statistical dependence between the frequency or magnitude of coastal floods and river/pluvial floods in Australia, China, European countries and the United States of America.36 Interactions between storm surge and discharge can lead to elevated water levels in deltas and estuaries.37 To understand this, researchers coupled a state-of-the-art global river routing model with results from a global hydro-dynamic model of storm surge and tides.38,39 Globally, there was an increase in the annual maximum water surface elevation of 0.1 m in deltas and estuaries when dynamic sea-surface levels are used as the downstream boundary compared to when they are not, with increases exceeding 0.5 m in many low-lying flat areas such as the Amazon basin and many river basins in South-East and East Asia.
There have already been studies to investigate the effectiveness of various risk reduction measures as an aid to decision makers. These studies are based on hypothetical interventions, but they show that not all risk reduction measures are equal, and what fits for one scenario might not fit for another. For example, building up the levees of a river can protect from losses due to floods to a certain level, but the most certain measure is moving that popu-lation to a safer location. However, this also brings into play the complexities of post facto develop-ment planning and the myriad legal and social issues around resettlement.
Another trend has been the increased use of adap-tive pathway approaches for managing flood risk.
In the United Kingdom of Great Britain and Northern Ireland, the Environment Agency has established the Thames Estuary 2100 project, with the aim of developing a strategic flood risk management plan for London and the Thames Estuary through to the end of the century.40 This was instrumental in intro-ducing a novel, cost-effective approach to manage growing flood risk by defining adaptation pathways that can manage a range of changes as needed. A possible path of cheaper flood defence options could be initially followed, but decision makers could switch to more expensive options if the drivers of the risk were not sufficiently addressed by the first pathway. For example, if mean sea level was found to be increasing faster than predicted due to accelerating effects of climate change, deci-sion makers could pursue a different pathway with different costs and implications such as the instal-lation of a new downstream barrage. The adaptive pathways approach is being developed into a tool for global application.41
3.1.5 Fire
The increased number of intense heat-waves and wildfires that has been recorded during recent years on a global basis has raised great concerns. It is apparent that projected climatic changes may signif-icantly affect such phenomena in the future. Each year, wildfires result in high mortality rates and prop-erty losses, especially in the wildland urban interface (WUI). These fires affect millions of people and have devastating global consequences for biodiver-sity and ecosystems. Wildfire disasters can rapidly change their nature into technological disasters (e.g. in mixed areas of forest and residential, in heavy industrial or in recycling zones). In such cases, there is a global concern because toxic components such as dioxins are released, as well as fine and ultrafine particles with transboundary effects. Even though international policies and fire safety legislation have resulted in effective prevention mechanisms, envi-ronmental and technological fire hazards continue to threaten the sustainability of local populations and the biodiversity of affected areas.42
98 Chapter 3

The year 2018 was reported as one of the warmest, affecting European Mediterranean countries such as Greece, Italy, Portugal and Spain, and also the countries of Central and Northern Europe. For example, Austria’s June 2018 national tempera-ture was 1.9°C above average and was one of the 10 warmest Junes on record.43 Higher tempera-tures have generally been correlated with extreme weather events such as prolonged droughts,
heat-waves and flash floods. The short-term precipi-tation period that is spatially intensive usually causes flash floods and hence it more often occurs in drier climates.44 Under such circumstances, fire incidents in dry climate zones can easily be converted to megafires such as the Greek fires of August 2007,45 which destroyed huge forest areas, and even within the Arctic Circle, as seen in the Swedish wildfires of July 2018.46
35 (Dilling, Morss and Wilhelmi 2017)36 (Loganathan, Kuo and Yannacconc 1987); (Pugh, Wiley and Chinchester 1987); (Samuels and Burt 2002); (Svensson and Jones 2002); (Svensson and Jones 2004); (van den Brink et al. 2005); (Hawkes 2008); (Kew et al. 2013); (Lian, Xu and Ma 2013); (Zheng et al. 2014); (Klerk et al. 2015); (van den Hurk et al. 2015); (Bevacqua et al. 2017)37 (Ikeuchi et al. 2017)38 (Yamazaki et al. 2011)
39 (Muis et al. 2016)40 (Environment Agency 2012)41 (Ranger et al. 2010) 42 (Karma et al. 2019)43 (National Centers for Environmental Information 2018)44 (Allan and Soden 2008)45 (Gouveia et al. 2017)46 (Anderson and Cowell 2018)
Wildfires in California in the United States of America in 2018(Source: Joshua Stevens via the National Aeronautics and Space Administration (NASA) Earth Observatory)
99

There is a general challenge surrounding the defini-tion of fires. In the European Union (EU) the focus has been on forest fires. More frequent occur-rences of wildfires have spurred an expanded defi-nition into wildfire that does not require the fire at any point to affect a forest. A wildfire is a fire that is out of control. This excludes fires set for legiti-mate purposes such as crop burning but would include the same fires if they spread outside of the intended area.
A fire in WUI fire can generally be triggered either by natural (e.g. lightning strikes) or human-made causes (e.g. campfires or arson). As it spreads, it can draw fuel from all types of flammable sources, expand in size and impact, and, under specific conditions, may turn into a megafire.47 Mega-fires near residential areas (WUI fires) can gener-ally pose significant risks to populations, critical
infrastructure and the environment. The dramatic and uncontrolled expansion of fire usually leads to human casualties and property losses as in Greece (2018), Portugal (2017) and the United States of America (2017).
For example, 2018 was the deadliest and most destructive fire season in California’s history. Fires burned 766,439 ha, and caused more than $3.5 billion in damage. The Mendocino Complex Fire burned more than 186,000 ha, becoming the largest single fire in the California history.48,49,50
Apart from the fire expansion impact, smoke produced by fire also poses significant risks to health because it is a chemical mixture of a variety of substances, such as particles or gaseous pollutants like carbon monoxide, carbon dioxide, ammonia, dioxins and other highly toxic compounds
Figure 3.5. Tracking aerosols from California’s fires
(Source: Copernicus Sentinel data 2017, processed by The Royal Netherlands Meteorological Institute 2017)
100 Chapter 3

that can be produced based on the types of materi-als burned towards the fire-front expansion.51 The huge quantities of smoke produced in combina-tion with the extreme thermal radiation emitted can cause suffocation and death for people who are directly exposed, even well after the fire has been controlled.52
In the past, there was often no information on fires, even at the regional level. It was frequently not possible to compile the various information together at the national level because of differ-ences in methodology, models and definitions. A first step has been to harmonize systems by collect-ing fire information from countries and putting it into a common database, such as the European Forest Fire Information System (EFFIS). While this approach is a step in the right direction, it remains limited by the number of countries that have hetero-geneous data-collection methods. In the EU, there are 22 countries providing information into EFFIS, but there are an additional 39 countries in the network that do not have a systematic data-collec-tion method and thus cannot contribute data. This situation is not uncommon in other regions.
EFFIS has been in development for the last 20 years. The purpose originally was to estimate potential fire risk. When a fire occurs, the objective is then to monitor its progress and burned areas in real time including land-cover damage assess-ments, emissions assessments and potential soil erosion estimates, along with vegetation regen-eration. The EU previously worked on comput-ing various indexes from individual countries, but harmonization and standardization have led to countries using a standardized index.
A global fire information system has been under development since 2015 – the Global Wildfire Infor-mation System (GWIS). Its global group working on
wildfire risk assessment is expected to produce a global level risk assessment by 2020. GWIS uses open source tools, is committed to open data and has records of 350 to 400 million ha of land burned every year. However, the base information used still does not include very small fires, so the total area burned is likely to be higher than these figures. In Europe alone, it is estimated that between 15% and 20% of fires are excluded from this data. This percentage is likely to be the same on the global level, putting the global estimate of burned hect-ares at approximately 450 million. Verification of global data on the ground is expensive. In some regions, there is a move towards using remote-sensing data to avoid the expense of data collec-tion on the ground. Remote sensing works well for fires because the incidence and the impact are visually manifest; the combination of satellites and other sensors are useful for fire monitoring. These resources have been pooled into GWIS.
New satellites with more sensitive instruments allow access to higher-resolution sensors and will soon allow for the inclusion of smaller fires. One of the largest steps made by GWIS is the analysis of a data set that was so large at the global level that it required massive computing capacity to analyse, which was previously not accessible. With this data now available, other sectors will be able to incor-porate it for inclusion in academic research, global multi-hazard risk assessment and consideration of chained, or cascading, hazards.
Analysis can be conducted on single fires to under-stand how they evolve. Twice-daily imagery is anal-ysed to determine the speed of the fire and spread, which provides a view of the fire “climate” (if it is spreading and if the coverage is increasing). But the base requirement is a database of fires, and the GWIS database now covers the period from 2000 to the present.
47 (Ronchi et al. 2017); (Intini et al. 2017)48 (Geographic Area Coordination Centers 2019b)49 (Berger and Elias 2018)
50 (Geographic Area Coordination Centers 2019a)51 (Dokas, Statheropoulos and Karma 2007) 52 (Karma et al. 2019)
101

Not all fires picked up through remote sensing are wildfires. Every summer, researchers observe unusual fire activity in Ireland, but they have learned that throughout the summer, Ireland celebrates several bonfire festivals that give false-positive readings.
In 2017, the Canadian province of British Colum-bia experienced its largest single fire in its history, with 1.3% area of its total territory burned. A total of 12,160.53 km2 of forest and residential areas was burned; almost 40,000 people were evacuated from their homes and more than 300 buildings were destroyed.
With the effects of climate change warming the planet, the incidence of fires will increase, and fires will arise in areas that have not previously been fire prone. One significant shift will see increased atten-tion on the study of fire seasons to determine how seasons are changing. In 2017 in Europe, the most damaging fires (in June and October) fell outside of the traditional fire season (July to September). Fire seasons are becoming longer with greater areas being affected each year.
Figure 3.7 shows that peak season for fire occur-rence and for average acres burned is between July and October in California. But 14 out of 20 of the most damaging fires have occurred in October or later, and all but three of the most damaging fires have occurred in the past 20 years
Another output of wildfires is emissions. The envi-ronmental impact of large-scale wildfires, particu-larly the huge quantities of carbon dioxide and water vapour produced, may have a significant greenhouse effect.53 Equally, flora and fauna are heavily damaged with major impacts on biodi-versity.54 Wildfire impact on hydrology, soil prop-erties and soil erosion by water are also of high importance,55 and physicochemical properties and microbial characteristics of burned soils due to wildfires are strongly disturbed. Moreover, some of the toxic compounds such as heavy metals that are produced by fires are absorbed into a larger affected area than that which was burned. Ashes can be deposited on soil and water,56 with conse-quences for crop quality and food chain safety. According to a recent study, severe wildfires may also endanger the water supply in downwind communities.57 Particulate matter from wildfires is
Figure 3.6. British Columbia, Canada, 2017 wildfire that burned an area the size of Lebanon
(Source: British Columbia Wildfire Service 2018)
102 Chapter 3

also a health risk (mostly the result of haze), as are dust-storms and sandstorms. While still difficult to quantify reliably, estimates indicate that 260,000 deaths a year can be attributed to smoke from forest, peat and grassland fires.58
State-of-the-art dynamic fire simulation models have been tested in a wildfire-prone region in Australia.59 These have yielded a novel framework for modelling wildfire urban evacuation processes and calculating the safe escape time.60 Personal fire evacuation plans may prove vital for the communities near areas at risk of fire. Simplified family-level plans for coping with WUI fires have been established in some regions, providing fami-lies with residential safety checklist and tips to
improve family and property survival during a wild-fire. However, these are available mostly in wealthy areas.
All types of fires over 300,000 deaths annually, and they are the fourth largest cause of accidental injury globally and represented 5% of all injury deaths globally in 2014.61 Over 95% of fire deaths and burn injuries are in low- and middle-income countries. A high proportion of the urban populations in these countries are in low-income and informal settle-ments, with poor-quality housing, limited supporting infrastructure and services, and high vulnerability to fires and other hazards. However, little is known about the incidence, impact and causes of urban fires in these settings.62
Figure 3.7. California fire occurrence by month and acres burned by month, 1996–2017
53 (Kim and Sarkar 2017); (Kim et al. 2009)54 (Boisramé et al. 2017)55 (Shakesby 2011)56 (Pereira et al. 2013)57 (Robinne, Parisien and Flannigan 2016); (Hallema et al. 2018)
58 (Johnston et al. 2012)59 (Beloglazov et al. 2015)60 (Ronchi et al. 2017); (Kinateder et al. 2014)61 (WHO 2014)62 (Rush et al. 2019)
(Source:UNDRR with data from California Fire Service 2018 and State of California 2019)
103

Box 3.2. Selected large informal settlement fires
3.1.6 Biological
Biological hazards cover a category of hazards that are of organic origin or conveyed by biologi-cal vectors, including pathogenic microorganisms, toxins and bioactive substances. Examples are bacteria, viruses or parasites, as well as venomous wildlife and insects, poisonous plants and mosqui-toes carrying disease-causing agents.63 While biological hazards also cause diseases in plants and animals, this chapter focuses on those biologi-cal hazards that affect human health.
Like other hazards, biological hazards and their associated infectious diseases occur at differ-ent scales with varying levels of consequence for public health. Diseases may be categorized by the way in which they are spread and people are infected, namely: water and food-borne diseases, where the pathogen can enter the body via contami-nated food or water; vector-borne diseases, which involve mosquitoes, ticks and other arthropod species, or other animals that transmit the disease from animals to humans (zoonotic diseases) or among humans; air-borne or respiratory infections, which are spread between humans by the respira-tory route; and other infectious diseases involving contact with bodily fluids such as blood.
Biological hazards affect people at all levels of society. At the extreme, epidemic infectious diseases affect millions of people every year, with
potentially severe consequences for individuals, communities, health systems and economies, espe-cially in fragile and vulnerable countries where they are most common. However, no country is immune to the risk. New pathogens continue to emerge by mutating, re-assorting and adapting. Previously well-understood infectious agents change their behaviour or scale of impact as the world is getting warmer and more populated, with associated animal husbandry strategies, and with ecosystem changes, increasing speed of transportation and mass distribution systems.
As infectious diseases travel easily across adminis-trative boundaries, the world’s defences are only as effective as the weakest link in any country’s efforts to anticipate and prevent emergence and outbreak at all scales. Biological hazards and their impact on global public health have brought to prominence the need for a collective and coordinated mecha-nism involving all sectors to prevent new risks, reduce and mitigate existing risks, and strengthen resilience. This approach is being promoted and reinforced by the integration of biological hazards in whole-of-society and all-hazard approaches to the management of risks, as reflected in the Sendai Framework, SDGs and the Paris Agreement, which are complemented by the International Health Regu-lations (2005) (IHR)64 and other relevant global, regional, national and subnational strategies and agreements.
• In February 2011, a fire left 10,000 home-less in three hours in Bahay Toro, Manila, Philippines.
• In May 2012, a fire affected approximately 3,500 people in Old Fadama, the largest informal settlement in Accra, Ghana.
• In April 2014 a fire in Valparaiso, Chile, destroyed about 2,500 homes and forced 12,500 people to evacuate.
• In March 2017, a fire in Imizamo Yethu informal settlement in Cape Town, South Africa, destroyed over 2,100 homes and left 9,700 people homeless.
104 Chapter 3
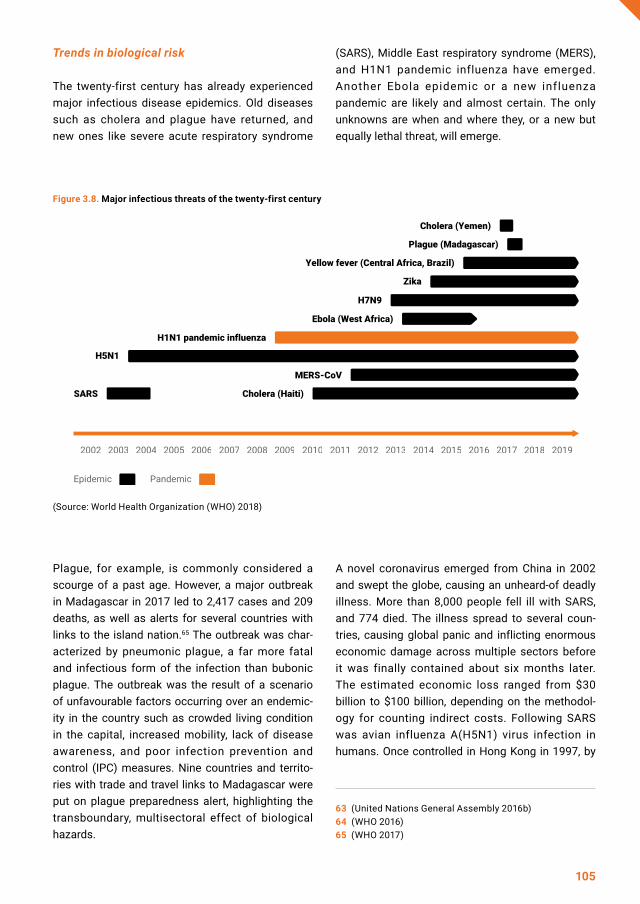
Trends in biological risk
The twenty-first century has already experienced major infectious disease epidemics. Old diseases such as cholera and plague have returned, and new ones like severe acute respiratory syndrome
(SARS), Middle East respiratory syndrome (MERS), and H1N1 pandemic influenza have emerged. Another Ebola epidemic or a new influenza pandemic are likely and almost certain. The only unknowns are when and where they, or a new but equally lethal threat, will emerge.
63 (United Nations General Assembly 2016b)64 (WHO 2016)65 (WHO 2017)
Figure 3.8. Major infectious threats of the twenty-first century
Plague, for example, is commonly considered a scourge of a past age. However, a major outbreak in Madagascar in 2017 led to 2,417 cases and 209 deaths, as well as alerts for several countries with links to the island nation.65 The outbreak was char-acterized by pneumonic plague, a far more fatal and infectious form of the infection than bubonic plague. The outbreak was the result of a scenario of unfavourable factors occurring over an endemic-ity in the country such as crowded living condition in the capital, increased mobility, lack of disease awareness, and poor infection prevention and control (IPC) measures. Nine countries and territo-ries with trade and travel links to Madagascar were put on plague preparedness alert, highlighting the transboundary, multisectoral effect of biological hazards.
A novel coronavirus emerged from China in 2002 and swept the globe, causing an unheard-of deadly illness. More than 8,000 people fell ill with SARS, and 774 died. The illness spread to several coun-tries, causing global panic and inflicting enormous economic damage across multiple sectors before it was finally contained about six months later. The estimated economic loss ranged from $30 billion to $100 billion, depending on the methodol-ogy for counting indirect costs. Following SARS was avian influenza A(H5N1) virus infection in humans. Once controlled in Hong Kong in 1997, by
(Source: World Health Organization (WHO) 2018)
105

effectively eliminating the transmission in poultry, the virus re-emerged from Quin Hai Lake of China, a crossroad of migratory birds and a huge water-fowl reserve. The virus spread across Asia and Africa and resulted in a huge economic loss in the agricultural sector. In 2009, a novel influenza virus, H1N1, known to originate in swine, started to spread, creating the first influenza pandemic of the twenty-first century. Thankfully, it was not as severe as expected due to strengthened health monitor-ing and prevention structures. But in 2012, a new coronavirus emerged, causing an illness similar to SARS. MERS is a viral respiratory disease caused by the coronavirus that was first identified in Saudi Arabia in 2012 and entered the human popula-tion via contact with infected dromedary camels.66 MERS cases remain active at the time of this publi-cation, causing concerns that the virus could cause a catastrophic epidemic in the Middle East and beyond.
The 2014 Ebola epidemic in West Africa was another unexpectedly severe event (in Guinea, Liberia and
Sierra Leone). Instead of being restricted geo-graphically, Ebola affected three African countries, spread to several others and sparked global alarm. The 2018–2019 Ebola outbreak in the Democratic Republic of the Congo, the country’s tenth outbreak in four decades, was officially declared on 1 August 2018. The outbreak is centred in provinces where geographic challenges and security hazards have hindered containment and management of the outbreak.
Antimicrobial resistance (AMR) has become another health threat, compromising the medical community’s ability to treat infectious diseases.67 Inappropriate use of antimicrobials in the medical field and unregulated use in animal husbandry and food products – added to the natural capacity of microbes to acquire resistance to antimicrobials – are contributing to and accelerating AMR risk glob-ally. It is predicted that the AMR problem will claim more lives and provoke massive increases in costs of management.68
One of the largest pandemic killers ever recorded, AIDS (acquired immunodeficiency syndrome) is an example of how rapidly a new infectious disease can take hold glob-ally. Within a decade of its identification in 1981, over 10 million people across the world had become infected. The cumulative total is 70 million, half of whom have died. Thirty-seven million people worldwide now live with HIV (human immunodeficiency virus), 1.8 million new infections occurred in 2017, and every country has been touched. Death rates have been dramatically slowed by combina-tion antiretroviral therapy, now reaching nearly 22 million people globally through massive mobilization of domestic and international resources, including in the poorest countries of the world.
Box 3.3. HIV/AIDS As was often observed at the height of the pandemic, AIDS exploits the fault lines of a society. Marginalization, disruption and conflict become conduits for the spread of HIV. Some 53% of the global total number of people living with HIV is in Eastern and Southern Africa, where the epidemic’s spread was fuelled by the combined effects of poor access to diag-nosis, scarce treatment of sexually transmitted infections, sexual mixing patterns dominated by labour migration, post-conflict demobiliza-tion and effective response delayed by stigma, denial and resource scarcity. But in the past two decades, the region has shown the great-est progress in curbing new infections and expanding treatment access and reducing deaths.
However, a re-emergence is not inconceivable if the response is neglected in these high preva-lence regions, or through the widening spread
106 Chapter 3

Drivers of biological risk/causal factors
Unlike some other hazards (e.g. earthquakes or floods), biological hazards can be constantly present in the community – endemic – and usually pose low risk when the population is largely immune. Biological hazards, which are endemic in some communities, pose a risk of becoming epidemics when they are introduced to a new host community with no immunity. When people migrate from disease-free areas to endemic regions, they typically lack immunity, making them susceptible to infection and transmission of the disease, result-ing in cases in excess of normal expectancy. These hazards have the potential to cause many cases and high rates of morbidity and mortality, and may spread to other areas of the country or across borders. The risk may also change when crises or emergencies such as droughts, floods, earthquakes and conflicts arise, exacerbating the conditions favourable for disease transmission and causing population displacement.
The pattern is clear. Old diseases such as plague and cholera continue to reappear, and new ones invariably emerge to join them. This is driven by a complex and challenging interplay of factors,
of the epidemic – the annual number of new HIV infections has doubled in less than 20 years in Central Asia, Eastern Europe, the Middle East and North Africa. Disaster and related issues of treatment supply chain (e.g. in the post 2010 earthquake in Haiti), war, or any major stresses or shocks to fragile national health systems could easily disrupt treatment regimes and give rise to a resurgence of the disease.
The case of the global HIV pandemic is a systemic risk, with roots spread through socio-economic, cultural and behavioural dimen-sions. The high incidence of comorbidities such as tuberculosis (TB) and viral hepatitis in immunocompromised persons with HIV
66 (Zaki et al. 2012)67 (WHO 2015)68 (WHO 2014)69 (Jones et al. 2008)
infection calls for comprehensive and coordi-nated responses to HIV, TB, viral hepatitis and other sexually transmitted infections. The wider approach to the disease requires population-wide responses that transcend the diagnosis and treatment of individuals, looking for long-term, collective and multidisciplinary measures that include education, behavioural change, social services, testing, care and programme evaluation. Addressing these challenges demands strengthening of health systems: communication, IT, logistics, drug and vaccine supplies, and, particularly, building the capa-bilities of health personnel and community leaders and the platforms for them to work in synergy.
reflecting the interaction between biological hazards, people’s exposure to hazards, their suscep-tibility to becoming infected and the capacity of individuals, communities, countries and interna-tional actors to reduce risks and manage the conse-quences of outbreaks.
Almost all the newly emerging or re-emerging viral infections have come from transmission from animals. Potentially hazardous changes in land use, agricultural practices, animal husbandry and food production have led to increased contact between people and animals, with little regard for the ecological and human consequences of connected systems. Key drivers from domesticated animals include contemporary farming and livestock production systems and live animal markets.69 Wildlife zoonoses can arise from factors related to hunting practices, deforestation and ecosystem breakdown.
(Sources: UNAIDS 2015, 2018; WHO 2019; Schneider 2011)
107

The probability that a new disease threat will spread is influenced by pathogen- and population-specific factors.70 In the twenty-first century, ecological changes such as climate change and water scarcity have emerged as strong drivers of disease trans-mission. In a growing number of countries, rapid and unplanned patterns of urban development are making rapidly growing cities focal points for many emerging environmental and health hazards. Zika virus outbreaks are a case in point; the larvae of the Aedes mosquitoes thrive in stagnant water, which is abundant, for example, in slum areas where open containers, tyres, barrels and drums are used for gathering rainwater for household and garden use. Improving the human environment can therefore reduce exposure to the vector mosquitoes.71
War, civil unrest and political violence and their repercussions, such as refugee populations, displaced people and food insecurity, can result in a resurgence of previously controlled infectious diseases such as cholera, measles and diphtheria.72 The movement of large numbers of people creates new opportunities for the spread and establish-ment of common or novel infectious diseases. For example, one of the worst cholera outbreaks in recent history is occurring in Yemen. Since April 2017, more than 1.3 million suspected cases of cholera and 2,641 deaths have been reported.73 The catastrophic spread of disease is a consequence of two years of conflict and the resulting decima-tion of the country’s health, water and sanitation systems and facilities, coupled with widespread internal displacement and alarmingly high rates of malnutrition.
One intention of this GAR is to help understand how the true nature of risk mirrors the systemic risk approach practised in public health services for several decades. The systemic approach for assessing biological risks affecting human health begins with the characterization of biological hazards. These include aspects such as infectivity, pathogenicity and virulence, infectious dose and survival outside the host. Next, exposure is defined by criteria such as host factors, environmental factors, transmission, reservoirs and vectors. Finally, vulnerability, a field exhaustively explored
in public health, is characterized by factors such as population characteristics and population infra-structure. These factors are further disaggregated into the so-called social determinants of health: (a) social and economic environment: education, health services, social support networks – greater support from families, friends and communities, culture, customs, traditions, beliefs, income and social status; (b) physical environment: clean water and air, healthy workplaces, safe houses, communi-ties and roads all contribute to good health; employ-ment and working conditions; and (c) person’s individual characteristics: behaviours, genetics and coping skills.74 The intricacy of the measurement and interaction of the three risk factors – threats, exposure and vulnerability – are reflected in the complexity of the modelling used to assess the systemic health risk for biological hazards.75
Biological risk management and international instruments
With regard to biological risk, the health and epide-miology fields rely on a rich network of partnerships that span the health sector link with social and development partners. For non-influenza patho-gens, sharing takes various forms: ad hoc, routine surveillance set up internationally, nationally or locally for the Extended Program on Immunization or through existing networks of institutions and researchers.
To respond to the emergence and spread of zoonotic pathogens, WHO has strengthened collab-oration with the Food and Agricultural Organization of the United Nations (FAO) and the World Orga-nization for Animal Health by forming a tripartite agreement for sharing responsibilities and coordi-nating global activities to address health risks at the animal–human–ecosystem interfaces.76 In the context of influenza, risk monitoring, preparedness and response are continuous processes, requiring constant access to circulating viruses. This involves sharing viruses every year from as many countries as possible with the Global Influenza Surveillance and Response System (GISRS), a WHO-coordinated global network of laboratories. Based on these
108 Chapter 3

samples, WHO and GISRS can conduct risk assess-ments, monitor the evolution of seasonal influenza virus and the disease activity. Vaccine manufactur-ers use materials and information generated by GISRS to produce influenza vaccines. In return, the manufacturers contribute financially and by in-kind committments for pandemic preparedness and response (PIP Framework). GISRS also serves as a global alert mechanism for the emergence of influ-enza viruses with pandemic potential.
Disease risks can often be prevented or mitigated, and their harm reduced through vigilance coupled with a rapid response at all levels.77 The basis of effective and efficient, well-targeted risk manage-ment measures is provided by different forms of risk assessment.
Strategic risk assessment is used for planning for risk management with a focus on prevention and preparedness measures, capacity development, and medium- to longer-term risk monitoring and evalu-ation, including tracking changes in risk over time. Strategic risk assessments enable the analysis of risks through a combination of hazard, exposure, vulnerability and capacity analyses, so that action can be taken to reduce the level of risk and conse-quences for health. Several common risk factors are addressed in risk assessments for biological and other hazards, such as population demograph-ics (age or gender), health service availability and the capacity of the health and other systems in society. In addition, some more specific risk factors or sources of vulnerability apply to populations who are exposed to biological hazards, overcrowded living conditions, population displacement and the environmental factors in which the disease or vector may survive or grow.
It is also important to assess the risk of biologi-cal hazards after natural or human-induced events, including diseases. For example, the functioning of
health facilities including diagnostic function and the vaccine cold chain can be affected by damage and interruption of services such as water and power. Disaster impacts on safe water, sanita-tion facilities and hygiene conditions may result in water-related communicable diseases or vector-borne diseases.
Risk management measures
Risk assessments inform policymakers to act to prevent, detect, prepare for and respond to biologi-cal hazards. This includes measures to reduce exposure of groups at increased risk of infection due to biological hazards, containing the spread of the risk, and eventually stopping it. Community-based actions and primary health care are at the core of strengthening community and individual resilience to all types of emergencies, by boost-ing the heath, immunization and nutritional status of individuals to reduce their susceptibility to diseases. The provision of primary care in epidemic, disaster and post-conflict situations is critical for prevention, early diagnosis and treatment of a wide range of diseases.
Effective water, sanitation and hygiene (WASH) planning can prevent or mitigate the risk of severe diarrheal diseases. The health sector must work with planners and engineers to ensure safe water and sanitation infrastructure. Chlorine is widely available, inexpensive, easily used and effective against most important waterborne pathogens. Some specific preventive interventions will reduce risks of vector-borne diseases such as malaria. Disease-specific strategies such as bed-nets, improving drainage to reduce vector breeding sites or insecticide spraying can help reduce these risks.
National disease surveillance and an EWS that extends to the community level is essential for
70 (Sands et al. 2016)71 (WHO 2019)72 (Blumberg et al. 2018)73 (WHO 2018b)
74 (Sarmiento 2015)75 (Sarmiento 2015)76 (WHO 2010)77 (Morse et al. 2012)
109

the rapid detection of cases of epidemic-prone diseases and rapid control. Surveillance and EWSs to detect outbreaks should be established, and cases reported through national systems to WHO when meeting the criteria for reporting under the IHR. Further risk management measures include protective equipment, IPC, behaviour-change prac-tices by raising awareness and education of the public through risk communication, and effective treatments and/or routine and emergency vacci-nations. Risk information is also used to inform response planning at various levels and capacity-development measures for health systems, includ-ing the training of health workers and key personnel from other sectors, such as logisticians, water and sanitation engineers, and the media.
Biological risk can often be prevented and harm can be reduced through vigilance coupled with a clear regulatory framework.78 In 2005, all countries agreed to the revised IHR, which are designed to assist the global community in preventing and responding to acute public health risks that have potential to cross borders. The IHR were originally developed for only three diseases – smallpox, cholera and yellow fever – and were focused on arresting the spread of disease at borders and other points of entry. However, smallpox was eradicated in the 1970s, cholera reporting was disfavoured by countries because of negative effects on travel and trade, and yellow fever control has become easier thanks to an effective vaccine. But the value of an internationally recognized regulatory struc-ture was not lost. A warning episode of H5N1 in Hong Kong in 1997 and the international spread of SARS in 2003 showed that an update to the IHR was required to deal with globalization and the interconnectivity of systems to forestall yet-unfore-seeable microbial threats that have since become a reality. The IHR (2005) that came into force in 2007 are more flexible and future-oriented, requir-ing countries to consider the possible impact of all biological hazards, whether they occur naturally, accidentally or intentionally.
3.1.7 Nuclear/radiological
Radioactivity and the radiation it produces existed on Earth long before life emerged. In fact, they have been present in space since the beginning of the Universe, and radioactive material was part of the Earth at its very formation. But humanity first discov-ered this elemental, universal phenomenon only in the last years of the nineteenth century. Most people are aware of the use of radiation in the nuclear power production of electricity or in medical applica-tions, yet many other uses of nuclear technologies in industry, agriculture, construction, research and other areas are hardly known at all. The sources of radiation causing the greatest risk to the public are not necessarily those that attract the most atten-tion (Figure 3.10). In fact, everyday experience such as air travel and living in well-insulated homes in certain parts of the world can substantially increase exposure to radiation.79
There is no formal distinction between nuclear and radiological risks and thus between associated safety arrangements. However, it is a well-estab-lished practice to distinguish exposures related to nuclear power generation from other radiation
Figure 3.9. Sources of radiation
(Source: World Nuclear Association 2018)
110 Chapter 3

78 (Morse et al. 2012)
exposures. From the physical point of view, both situations may result in the same kind of radiation exposure, so this distinction considers the different characteristics of the source of the risk. This GAR assumes that nuclear risks arise (or may potentially
arise) from the uncertainties in the management of a nuclear chain reaction or the decay of the prod-ucts of a chain reaction. Consequently, the radio-logical risks arise from uncertainties related to any other activities involving ionizing radiation.
Figure 3.10. Potential biological impacts of radiation damaging a cell
(Source:UNDRR)
79 (UNEP 2016)
111

The starkest manifestation of physical risk associ-ated with nuclear power is when it affects living things. Cellular damage caused by ionizing radia-tion can do one of three things:
Outcomes (b) and (c) have very different implica-tions for the organism as a whole.
Very high doses of radiation can cause serious damage to the blood-forming organs, stomach, intestinal tract and central nervous system, which can lead to death. Doses at this level will normally
In addition to health effects such as acute radia-tion syndrome and increased incidence of cancer, adverse effects on mental health are observed. Mental health was the biggest long-term public health problem that ensued from the nuclear acci-dents of Three Mile Island and Chernobyl. The
only occur because of very serious accidents, and only in case of exposures very close to the source of radiation.
Lower doses of ionizing radiation can cause leukae-mia and cancer, appearing even many years after exposure, and can have effects that are manifest in future generations. High doses of radiation can cause other health problems, such as heart disease, strokes and cataracts.
Even though there is no clear scientific proof that cancer is caused by low doses of radiation, to be conservative, regulatory authorities around the world assume that any dose, no matter how small, is a risk and could be dangerous. It is assumed that the risk is in linear proportion to the dose.
United Nations Scientific Committee on the Effects of Atomic Radiation (UNSCEAR) found that in the case of the Fukushima Daiichi accident, the most important consequences on health were mental health and social well-being. Existing international safety standards include generic requirements for
Figure 3.11. Relationship of radiation doses and health effects
(Source: Data adapted from UN Environment 2016)
a. Repair itself successfully
b. Fail to repair itself and die
c. Fail to repair itself but survive
112 Chapter 3

80 (UNSCEAR 2015)81 IAEA Fundamental Safety Principles are jointly sponsored by multiple organizations: European Atomic Energy Commu-nity (Euratom), FAO, the International Labour Organization, the International Maritime Organization, OECD NEA, the Pan American Health Organization, the United Nations Environ-ment Programme (UNEP) and WHO; (IAEA 2006).82 (NEA 2016)
other safety related risks, including those to ecosys-tems in the environment). The fundamental safety objective in these standards is to protect people – individually and collectively – (and, in addition, the environment) from the harmful effects of ionizing radiation. The standards recognize that the effects of radiation on human health involve uncertainties; in particular, “assumptions have to be made owing to uncertainties concerning the health effects of radiation exposure at low doses and low dose rates.”
The most harmful consequences arising from nuclear facilities and activities have come from the loss of control over a nuclear reactor core, nuclear chain reaction, radioactive source or other source of radiation.
To reduce the likelihood of an accident having harmful consequences, several design principles, concepts and tools for optimizing nuclear safety, as well as the defence in depth (DiD) concept, have been developed. DiD is based on the military philosophy of providing multiple barriers of defence and may be summarized as a sequence of preven-tive, control (protective) and mitigative measures in performance of three basic safety functions: (a) controlling the power, (b) cooling the fuel and (c) confining the radioactive material. It comprises five levels, as shown in Table 3.1.82
The effectiveness of protection is established using the principles of, inter alia, redundancy, diversity, segregation, physical separation and single-point failure protection. The protective layers comprise the physical barriers and also the administrative procedures and other related arrangements.
provisions that are necessary to consider mitiga-tion of the psychosocial and mental health impacts of nuclear accidents. However, they do not offer explicit descriptions of the required tools. A recent joint initiative by WHO and the OECD Nuclear Energy Agency (NEA) aims at proposing practi-cal solutions/tools for support of the decision-making process while planning for and responding to nuclear and radiological emergencies. These actions are based on the development of a policy framework that adopts existing WHO guidelines on mental health and psychological support in nuclear and radiological emergencies.
The burden of nuclear accidents on mental health, while specific, is not unique to the nuclear field. The inclusion of mental health in the Sendai Frame-work marks a pivotal point in the recognition of the impact of disasters – of both natural and anthropo-genic – on mental health, and a global commitment to its reduction.
The United Nations General Assembly acted to resolve the question of how objectively adverse health effects can be attributed to radiation as compared to the subjective inference of potential radiation risks.
The UNSCEAR report:80
For the safety standards outlined in the report it is assumed that there is no threshold level of radiation dose below which there are no associated radiation risks.81 The term “radiation risks” is used in these standards in a general sense to refer to detrimen-tal health effects of radiation exposure, including the likelihood of such effects occurring (and to any
• Distinguishes the objective attribution of health effects to retrospective exposure situations from the subjective inference of potential risks from prospective exposure situations.
• Concludes that increases in the incidence of health effects in populations cannot be attributed to low doses, but risk from planned situations may be prospectively inferred for purposes of radiation protection and allocation of resources.
113

Both nuclear risk analysis methods (deterministic and probabilistic) use “postulated initiating events”. These are “all foreseeable events with the poten-tial for serious consequences and all foreseeable events with a significant frequency of occurrence are anticipated and are considered in design.”83 Examples include: loss of coolant accident (break in the cooling system), loss of off-site power (station blackout), reactivity-initiated accident (boron
dilution, pump flow increase, etc.) or external events such as earthquakes or fires. The principal deter-ministic approaches seek to verify if the frequency of the postulated initiating events stays within acceptable criteria.84
In the aftermath of the Chernobyl accident, the International Atomic Energy Agency (IAEA) and NEA jointly developed an International Nuclear
Table 3.1. DiD levels
(Source: IAEA 1996)
Figure 3.12. International Nuclear and Radiological Event Scale
(Source: IAEA 2019)
114 Chapter 3
Trust in processes that authorize, verify and confirm safety of domestic and international consumer markets is central to maintaining viable agricultural production in radiologically contaminated areas. This suggests the need for a coordinated communica-tions strategy involving farmers, fishers, distributors, consumers, experts (including universities), and local and central governments to bring stakeholders in closer contact with the efforts being made and the results being achieved. Independent, international validation and inviting co-expertise, for example through non-governmental organizations (NGOs), could be considered as trust-building approaches.
Of the many important lessons learned about nuclear safety over years, the one that has been most diffi-cult to communicate and difficult to address is that human aspects of nuclear safety may be as important as any technical issue that arises during nuclear operations. Nuclear power is a highly tech-nical undertaking and those who design, build and operate nuclear plants are highly qualified special-ists in a wide range of engineering and scientific fields. However, technical aspects cannot be the only area of focus to ensure safety: attention to the safety culture that exists in the work environment is also required. Organizations need to consider how people interact and communicate with each other, when issues are raised and how are they addressed, what priority is given to safety – especially when presented with competing priorities.88
The ethical and social dimensions are important, and radiological protection and social sciences should work together. A better understanding of the radiation protection system, involving the social sciences, could facilitate incorporation of new find-ings, and make the system more flexible.
The effects of climate change might have an impact on the risk related to nuclear power plants in two ways.89 The gradual change in climate slowly affects
and Radiological Event Scale (INES). This is a tool for promptly and consistently communicating the safety significance of events associated with sources of radiation.85
Initially developed for nuclear events, INES now explains the significance of events from a range of activities, including industrial and medical use of radiation sources, operations at nuclear facilities and transport of radioactive material. The scale is based on a numerical rating including seven levels (each increase in level implies 10× greater severity). Evaluation of the level is made on the basis of the impact on three areas:
The evaluation of economic impacts of a nuclear accident is controversial and strongly dependent on subjective assumptions about the types of losses included in the analysis, the resilience of the economy to the event, and the behaviour of authori-ties and population after the accident.86
One of the factors evoked by an NEA report concerns the damage to agriculture.87 Many of the world’s nuclear installations are surrounded, at least in part, by agricultural lands. These areas are usually lightly populated, and small farms and gardens are not uncommon. In such situations, dealing with post-accident contamination of agricul-tural areas, while very personal, can also be impor-tant from economic and social standpoints. These issues need to be addressed in the context of active involvement by affected individuals in planning and decision-making processes.
Moreover, the importance of trust has been high-lighted in recent lessons learned through analysis.
83 (IAEA 2016)84 (IAEA 2010)85 (IAEA 2013); (IAEA 2014)86 (NEA 2018a)
87 (NEA 2018a)88 (NEA 2018b)89 (IAEA 2018)
a. People and the environment
b. Radiological barriers and control
c. DiD
115

a plant’s operational environment. The main poten-tial threats are: sea-level rise, which could result in inundation of coastal sites; the increase of ambient temperature decreasing a nuclear power plant’s thermal efficiency; lower mean precipitation reduc-ing the cooling effectiveness; and higher average wind speeds affecting the construction of a plant. Another category arises from the fact that nuclear power plants, like any other construction, are prone to the effects of extreme weather events. Notably, existing site selection and design criteria anticipate a variety of extreme weather events. Examples of such events include extreme heat and drought, which could decrease the cooling efficiency, floods resulting in inundation or fires affecting plant construction. Like any other complex technology, nuclear power generation brings benefits and risks. Continuous development of more efficient nuclear risk management brings to the fore a discussion of value of nuclear power generation as a poten-tial element in zero-emission energy generation worldwide. With low GHG emissions over a plant’s lifetime, nuclear energy is an alternative to the high-emission fossil fuel technologies that dominate electricity generation worldwide. A system-wide shift to a combination of renewable energy sources and nuclear would contribute to reductions of carbon dioxide emissions and help to limit global temperature rise.
No industry is immune from accidents, but all industries learn from them. There have been three major reactor accidents in the history of civil nuclear power: Three Mile Island, Chernobyl and Fukushima Daiichi. All three have had a significant impact on nuclear risk management and public perceptions of the risks of nuclear energy. The lessons learned have been carefully identified and are incorporated worldwide. They have contributed to a level of excellence in risk management in the nuclear field.
The root causes of nuclear accident have been found to be cultural and institutional.90 A follow-up of the International Nuclear Safety Group (INSAG) emphasizes that “to achieve high levels of safety in all circumstances and against all challenges, the nuclear safety system in its entirety must be
robust.”91 It identified three stakeholder groups to be engaged in building a robust and effective nuclear safety system:
In its recommendations for the protection of people from exposure to radiation, the International Commission on Radiological Protection empha-sizes the effectiveness of directly involving the affected population and local professionals in the management of post-accident situations, and the responsibility of authorities at national and local levels to create conditions and provide means favouring the involvement and empowerment of the population in the aftermath of a radiological event.
Lessons learned from accident recovery manage-ment include the following:
For all types of hazards, societal understanding and acceptance of risk depend on scientific knowledge
• Regulator – responsible for independent safety oversight
• Industry – including the licensee who holds the prime responsibility for safety of nuclear power plant
• Stakeholders – primarily members of the public.
• Trust needs to be built before accidents occur
• A flexible regulatory framework is needed to best address the accident conditions that occur
• Medical community networks should be identified around known hazardous installa-tions, and relevant plain-language radiological information should be ready to send so that they can address affected stakeholder concerns
• Governmental decisions should actively reflect that stakeholder concerns have been considered
• Expert resources needed to address affected stakeholder concerns can be extensive, and should be planned in an all-hazards framework
• Personal dosimetry and area monitoring equipment should be available
116 Chapter 3

and evaluations, and also on perceptions of risk and benefit. Radiological hazards are among the most studied risks in modern society. While the risk of death from exposure to the annual public dose limit (1 mSv) is small – approximately 0.00005% – and certainly much lower than other cancer risks (e.g. age, alcohol, diet, obesity, immunosuppres-sion, sunlight, tobacco and asbestos), evidence for any effects on individuals at low doses is still very limited. This inability to satisfactorily describe effects at the exposure levels commonly encoun-tered in most exposure situations can lead to misunderstanding, mischaracterization of the risk and disproportionate responses.
The radiation protection and nuclear community has continued to encounter difficulties in effectively communicating risk and uncertainty – whether in respect of siting new nuclear plants or waste disposal facilities, selecting endpoints for decom-missioning or legacy-management operations, or managing emergency or post-accident recovery operations. However, awareness of the negative effects on health has evolved over the last decade, leading to the development of new approaches to radiation risk communication.
3.1.8 Chemical/industrial
Industrial production is a central characteristic of the modern world economy. Industry creates jobs and provides a wide range of essential materials, products and services. However, authorities, in cooperation with industry, must ensure that indus-trial facilities producing, handling or storing hazard-ous substances such as tailings management facilities (TMFs), pipelines, oil terminals and chemi-cal installations are safely located and operated, as accidents can have far-reaching and severe effects on people, environments and economies.
Industrial hazards originate from technological or industrial conditions, dangerous procedures, infra-structure failures or specific human activities.92 These include toxic releases, explosions, fires and chemical spills into the air, adjacent water courses and land. In many countries, industrial hazards are exacerbated by ageing, abandoned or idle installa-tions. These problems are amplified by insufficient institutional and legal capacities to deal with techno-logical risk reduction. Natural hazards – for example, storms, landslides, floods or earthquakes – can also cause industrial accidents by triggering the release of hazardous substances from industrial facilities that are located within their path of destruction (see section 3.1.9). The impact associated with industrial accidents relate to loss of life, injury, or destruction or damage of assets that could occur to a system, society or a community.93 Effective management of risks requires cooperation within and across systems, sectors, countries and scales.
Most industrial accidents entail the release of hazardous substances into water bodies with grave impacts on water resources, threatening the avail-ability of safe water for drinking, household use and agriculture, as well as human safety.
90 (IAEA 2015); (IAEA 2017) 91 (IAEA 2017)
92 (United Nations General Assembly 2016b)93 (United Nations General Assembly 2016b)
117

For many decades, the issue of industrial accident prevention, preparedness and response has been of concern to governments, as well as industry. In the mid-1980s, the issue took on a new level of urgency and political importance in response to the Bhopal accident in India, which resulted in more than 15,000 deaths and more than 100,000 people affected. While regulation and new standards have driven significant progress in industrial safety in the past 40 years, major accidents still occur as countries face new challenges and emerging risks. In recent years, extreme weather-related events trig-gered industrial accidents with severe environmen-tal and economic consequences, such as Hurricane Harvey in the United States of America.
A multidisciplinary and cross-sectoral approach to addressing industrial accident risk is required. The Sendai Framework promotes this across its four priorities in the systems-based approaches to risk management.
This section explores the trends in industrial risks and the underlying drivers of these risks (identify-ing the casual factors). It examines how progress in managing risks is measured, introduces industrial accident risk reduction approaches, and explores challenges and opportunities for effective risk management in the future.
Trends in industrial hazards and risks
Industrial accident risk is highly dependent on the activity of the site, the processes it operates and the types of dangerous substances it uses. There are hundreds of processes in oil and gas or chemi-cals processing industries. They may be present in land-based facilities (also known as “fixed facilities” such as chemical establishments, oil terminals and TMFs), pipelines, transport by rail, road and water, and offshore oil exploration platforms. Explosives industries, involving manufacture and/ or storage of explosives, fireworks and other pyrotechnic articles, are also prominent sources of industrial accident risk. Widespread use of dangerous substances, such as cyanide and arsenic, in metals processing means that the mining industry also represents a high risk.
In addition, numerous other industries can be sources of industrial risk. Sometimes known as “downstream users”, these include industries such as food production, power plants and metal plating; these use dangerous substances in large quantities for refrigeration, fuel, metal treatment and various other specialized uses. The latter are particularly challenging in risk management because aware-ness about these materials may be lower than in those industries whose core business involves exploitation, manufacture, storage or handling of highly regulated substances.
Figure 3.14 shows information in media reports worldwide on chemical accidents over a one-year period, demonstrating that hundreds of people die every year and at higher rates in some areas of the world than others. Media reporting does not represent a complete picture of all incidents that have occurred, but it does tend to be consistent and reasonably reliable when citing major impacts, especially for deaths, injuries, evacuations and environmental contamination. Of these incidents, 12% (77) involved at least one death, 25% (163) involved death and/or injury, and evacuations and
Figure 3.13. Distribution of high hazard, fixed facility sites (Seveso Directive) in EU and European Economic Area coun-tries in 2014
(Source: Wood and Fabbri 2019)
118 Chapter 3

environmental impacts were involved in an addi-tional 4% (26) of cases.
There is limited data collected for assessing the status of industrial accident risk globally. There are some sources of data on industrial accidents in government and industry that can be used to quantify the frequency and severity of some types of events, but they fall short of providing a complete perspective that covers all accidents occurring in industry and commerce globally. Systematic identi-fication and recording of causal trends and impacts is largely driven by government requirements (this excludes “incident notification” databases) and industry initiatives, so that existing data is frag-mented and disjointed in nature.94
While industrial accidents are deterministic events that cannot be fully evaluated with a simple measure of counting the occurrences or trends of a particular scale, an industrial accident is still clear evidence of a failure to control risk. Past accidents can also provide diagnostic information, particularly if some accidents have common features (e.g. location, or type of industry, equipment, substance or cause).
Major accidents are generally rarer events. The average frequency of events in any one country across a period of even 10 years will tend to be
extremely low, especially in small countries and those with a low level of industrialization. However, many emerging economies have experienced rapid growth in hazardous operations from expansion of particular segments of oil and gas, chemical and petrochemical and mining industries, driven by a combination of factors including increased demand in emerging economies, access to raw materials and the need to lower production costs, facilitated by a decline in trade barriers and government incen-tives to attract foreign investors.
Tailings management facilities
The consequences of failure in the design, construc-tion, operation or management of TMFs – essentially large dams storing chemical waste at oil terminals and mining facilities – can release contained hazard-ous waste products that pose grave risks to human health, infrastructure and environmental resources. No publicly accessible inventory of TMFs or data on the global volume of stored tailings exists. Howev er, the scale of accidents of this nature can
94 (Wood and Fabbri 2019)
Figure 3.14. Chemical incidents in the media by continent, 1 October 2016 to 30 September 2017
(Source: Wood and Fabbri 2019)
119

be seen in recent disasters. The Mount Polley spill in Canada in 2014 and the Bento Rodrigues acci-dent in Brazil in 2015 each released more than 25
million m3 of hazardous substances, which, when combined, represent the volume of 20,000 Olympic swimming pools.95
The collapse of two TMFs of an iron ore mine located in Bento Rodrigues, Brazil, resulted in one of the worst human and environmental disasters in Brazil’s history. Some 40 million m3 of waste laden with heavy metals flooded villages downstream, causing 19 deaths and contamination of the Doce River basin, with huge damage to biodiversity and drinking water supplies. The toxic slick flowed 650 km down river, contaminating 2,200 ha of land and affecting about 40 municipalities. The disas-ter revealed critical gaps in regulation, moni-toring, enforcement, information flow, early warning, response and coordination mecha-nisms between the operator and authorities
at all scales. Three years later, remediation measures had still not been effectively imple-mented, and affected populations continued to endure the environmental and socioeconomic repercussions of the failure. At the time of writing, Brazilian state prosecutors are bring-ing a case against the mine and dam opera-tors, alleging that as early as 2011, the board was apprised of seepage in the dam, advised to consider suspending operations, relocating the town of Bento Rodrigues and installing early warning sirens, but had failed to act.
In early January 2019, another dam failure in Brumadinho, Brazil, collapsed, causing the
Box 3.4. Bento Rodrigues TMF accident, Brazil, 2015 and Brumadinho, Brazil, 2019
Debris and damage at a school in Bento Rodrigues, Brazil from the upstream dam failure (Source: Rogério Alves/TV Senado 2017)
120 Chapter 3

death of 186 people and a further 122 missing. The TMF in Brumadinho, owned by one of the two parent companies who owned the Bento Rodrigues dam released 12 million m3 of
tailings. The spilled chemicals have been incor-porated into river soil and affect the region’s ecosystem permanently.
95 (Roche, Thygesen and Baker 2017)96 (Roche, Thygesen and Baker 2017)
Box 3.5. Liquefied petroleum gas (LPG) accidents in Ghana
Figure 3.15. Fatalities in Ghana related to LPG accidents since 2007
In October 2017, seven people were killed at an LPG distribution point, taking the number
of deaths from LPG accidents at industrial and commercial sites in Ghana to 286 since 2007.
An analysis of TMF failures worldwide over the last decade indicates that while the overall number of failures has decreased, the number of serious fail-ures has increased.96 Despite the many advances in the mining sector, TMF failures still occur. In the past six years, there have been eight major TMF failures in Brazil (three times), Canada, China, Israel, Mexico and the United States of America. Identifying
TMFs and their hazard potential (including the risk of failure) is important to target intervention measures and adjust the legal and policy framework.
(Source:UNDRR with data from Citimfonline 2016)
121

Box 3.6. Daugava pipeline spill in Belarus, 2007
The rupture, due to ageing infrastructure, of a pipeline on 23 March 2007 in Belarus resulted in a spill of approximately 120 tonnes of diesel fuel into the Ulla River, a tributary of the Daugava River. The slick extended over 100 km downstream through Daugavpils and Riga to reach the Gulf of Riga in the Baltic Sea. Long-term damage from the spill was averted by coordinated inter-national emergency action and coordinated
assessment methodology (Bonn Agreement Oil Appearance Code) applied by Belarus-sian and Latvian experts, which resulted in payments by the company commensurate to assessed environmental damage.
Figure 3.16. Path of the spill in the Ulla River
(Source:UNDRR 2019) Disclaimer: The boundaries and names shown and the designations used on this map do not imply official endorse-ment or acceptance by the United Nations
Petrochemical facilities
Petrochemical plants, oil terminals and wells store and process large amounts of hazardous substances. In the event of improper design, construction, management, operation or maintenance, this can provoke uncontrolled spills, fires and explosions, with potentially catastrophic consequences in terms
of loss of life or environmental damage. The effec-tive and safe extraction, storage and distribution of oil products present technical and environmental challenges, while remaining essential for economic activity. As each facility is unique, a tailor-made and comprehensive approach is needed to ensure that these facilities are operated in a safe, environmen-tally sound and economic manner.
122 Chapter 3

On 11 December 2005, overfilling of a petro-leum storage tank at a fuel storage depot led to several explosions and a fire that burned for five days, with no loss of life and relatively few injuries. It caused the evacuation of approxi-mately 2,000 people, destroyed 20 homes and caused damage to 60 businesses, incurring an estimated total cost of over 750 million euros.
Pollutants contaminated soil and groundwa-ter and toxic plume dispersed over southern
England to northern coastal regions of France and Spain. The Major Incident Investigation Board established in the aftermath provided recommendations for industry, regulators and the emergency services related to safety and environmental standards for fuel storage terminals and emergency response measures. Following the accident, inspections were also conducted inside fuel storage terminals in France and other European countries.
Box 3.7. Buncefield accident, United Kingdom of Great Britain and Northern Ireland, 2005
While data on industrial accidents is often insuf-ficient to assess the full range of potential impacts and is difficult to quantify in any stan-dardized manner, it does exist. Table 3.2 explores the strengths and limitations of various impact
Toxic plume emanating from the explosion at the Buncefield fuel storage depot, United Kingdom of Great Britain and Northern Ireland, 2005 (Source: Flickr.com user Ken Douglas 2005)
data available in public databases of chemical incidents.
123

Table 3.2. Strengths and limitations of different sources of impact data to measure industrial risk
(Source: Wood and Fabbri 2019)
Complex nature of industrial accident risk and risk management processes
The heterogeneous nature of chemicals, the infinite ways in which chemical engineering transforms chemicals into products, and the vast infrastructure of road, pipelines, ships and railways, facilitating product distribution, are intrinsic to the challenge of assessing global industrial accident risk and predicting the next catastrophe. The likelihood of an incident occurring depends significantly on how well the risks are managed (the safety management system) and by decisions of the organization(s) that affect the functional effectiveness of the safety management system.97
At all types of industrial facilities, continuous efforts by experts and authorities, on site and off site, are required to avoid accidents. The safety of industrial facilities and the effectiveness of risk management is contingent on the quality and implementation of planning, analysis, design, construction, operational
diligence, monitoring and regulatory actions at every level.
With the advent of the Sendai Framework has come a suite of regulation process and initiatives. Govern-ment and industry seeking to understand industrial accident risk began data collection and analysis in the 1980s, and by the 1990s, collected data on accidents and near misses was widely accepted as inputs to understand and correct weaknesses in the risk control system.
The primary purpose of the databases that ensued was to foster learning from accidents, but many of the databases were not publicly accessible. By contrast, collecting data to assess performance in controlling industrial accident risk is driven by lessons learned from disasters as well as contem-porary developments in national and international law that unequivocally assign responsibility for chemical accident risk reduction to site operators.
124 Chapter 3

can be generalized in regard to a specific industry or geographic location.
The nature of industrial accidents however poses significant challenges to measuring progress in reducing this type of risk, as shown in Box 3.8. Obtaining sufficient incident frequency and severity data to calculate chemical accident risk metrics is not practical. Chemical accident statistics measure only disastrous failures that became accidents; they cannot measure the disastrous failures that could happen but have not happened yet.
Box 3.8. Industrial accident risk reduction is difficult to measure using accident data
The variables that influence the probability of a chemical accident are unstable so that the risk figure associated with any one hazard source is surrounded by uncertainty and can change dramati-cally in a short period of time. For every chemical process, there are some conditions that must be maintained to prevent a release. Any modification in those conditions changes the risk. Some leading industries and authorities have developed diagnos-tic tools that can suggest elevated risks for specific types of activities and geographic regions. A rela-tively new practice, the use of safety performance indicators to diagnose potential risk, may eventually be an option for industry-wide self-assessment or for inspection authorities to assess risks across specific types of sites and problem areas.98
Methods have also been developed by government and international organizations to measure the strength of management systems in industry or government for controlling industrial accident risk. However, measuring performance in reducing acci-dent risk is complicated. The use of frequency and severity of past accident as a risk measure is not a solution for global assessment of industrial acci-dent risk. National governments require more infor-mation to understand their industrial risk and target their interventions to reduce them.
97 (Wood and Fabbri 2019)98 (Wood and Fabbri 2019)
Frequency and severity of past accidents can provide no indication as to where the next accident could occur and how severe it might be. For this reason, additional data and analysis are necessary to provide insight on causal trends, typical failure mechanisms and other signs of elevated risk, to guide strategies that can help reduce accidents occurring in future. This type of information gener-ally includes causal patterns emerging from past accidents and near misses, evidence of the pres-ence of potential accident precursors, and other circumstantial data about a particular site, or that
• Industrial accident risk is not a stable figure. Numerous variables that influence industrial accident risk make it more likely that actual risk levels fluctuate significantly over time.
• High-severity industrial accidents are low-frequency, high-probability events. Accident data can greatly underestimate actual risk.
• Industrial accident risk sources are distrib-uted over many industries and geographic areas. It is challenging to have a complete picture.
• Data on industrial accident causality mainly belongs to companies. Data on what caused the accident is usually not in the hands of government.
• Loss data obtained following an accident is due to many actors, and is difficult to col-lect and quantify.
125

Convention on the Transboundary Effects of Industrial Accidents
The Industrial Accidents Convention is a multilat-eral legal instrument that supports countries in establishing and enhancing governance, policymak-ing and transboundary cooperation on industrial accident prevention, preparedness and response. Developed initially for the European region follow-ing the Sandoz accident in 1986, the approaches and experience offer insights to countries pursuing Sendai Framework commitments in technological risk management.
The convention’s legal provisions, policy forum, guidelines and capacity-development activities support countries in preventing accidents from occurring, reducing their frequency and severity and mitigating their effects at the local, national and cross-border levels. The scope of the convention also applies to industrial accidents that are trig-gered by the impacts of natural hazards.
3.1.9 NATECH
Many of the goods and services upon which soci-eties depend are provided by industrial activities. From refining, oil and gas production and transport, to nuclear power generation or the preparation of specialty chemicals, many of these activities have constructed inherent susceptibility to shocks, including those provoked by natural hazards.
Natural hazards have the potential to surpass safe-guards, triggering negative impacts that may entail hazardous substance release, fire, explosion or indirect effects with wider repercussions than those felt in the immediate proximity. The cascading tech-nological side effects of natural hazards are called NATECH accidents.99
NATECH events are a recurring but often overlooked feature in many disaster situations. They can add significantly to the burden of a population already struggling to cope with the effects of the triggering
There is activity seeking to enhance national and global assessment of industrial accident risk. Three main data sources are being cultivated to correlate causal factors and other information in association with specific hazard sources.
Strengthening land-use planning policies
Land-use planning is central to reducing industrial risk. Decisions on the siting of industrial facilities and the planning of surrounding land use are criti-cal in protecting and minimizing the effects of acci-dents on the surrounding populations, environment and property. The enhancement of land-use plan-ning schemes and zoning mechanisms to enhance the level of safety and reduce risk to industrial facilities has been observed in several countries, primarily by:
a. Incident data together with causal and failure trends drawn from analysis of near misses
b. Safety performance indicator programmes identifying safety-relevant weaknesses
c. Hazard ranking systems geared to forecast the likelihood that certain weaknesses are present
• Developing risk-informed land-use policies and plans and establishing land-use zoning schemes that set requirements on the use of land, siting and development proposals
• Updating land-use planning and industrial safety procedures to require formal consultations among the relevant authorities, experts and the public at an early stage in the planning process
• Ensuring that risk assessments and other industrial safety aspects are incorporated into decision-making procedures
• Creating tools to simplify the identification and communication of risk assessments to planners, decision makers and other experts for a common understanding of the risks
126 Chapter 3

natural event. NATECH event consequences can range from health impacts and environmen-tal degradation (e.g. during the 2008 Wenchuan earthquake)100 to major economic losses at local or regional levels due to damage to assets and business interruption (e.g. due to the 2011 Thai floods).101 In some cases, ripple effects across sectors can reach global proportions, resulting in a shortage of raw materials and finished products (as was the case following the 2011 Great East Japan earthquake and tsunami)102 and price hikes (e.g. the impact of Hurricanes Katrina and Rita on the offshore infrastructure in the Gulf of Mexico).103
This section introduces the concept of NATECH risk and the challenges associated with its
management, with particular emphasis on industrial facilities and critical infrastructure that process, store and transport hazardous substances. It pres-ents the principal factors that influence the risk, and proposes proxies of how progress in NATECH risk reduction can be measured.
NATECH risks exist anywhere where hazardous industry and critical infrastructure are located in natural hazard-prone areas, which is the case in many parts of the world. While NATECH events can, in principle, be triggered by any natural hazard type, they are not contingent upon catastrophic events. Many NATECH events with major consequences have been triggered by natural hazards that were considered of minor importance, such as lightning,
Figure 3.17. Hurricane Harvey caused several oil spills and chemical releases in Texas, 2017
(Source: Union of Concerned Scientists 2019) Disclaimer: The boundaries and names shown and the designations used on this map do not imply official endorsement or accep-tance by the United Nations.
99 (Krausmann, Cruz and Salzano 2017)100 (Krausmann, Cruz and Affeltranger 2010)101 (Aon Benfield Corporation and Impact Forecasting 2012)
102 (Fearnley et al. 2017)103 (Pan and Karp 2005); (Grunewald 2005)
127

low temperature or rain.104 In the Baia Mare acci-dent in Romania in 2000, heavy rain and unexpected levels of snowmelt coupled with design deficiencies led to the failure of a tailings dam, releasing large amounts of cyanide-laced wastewater into the river system, polluting some 2,000 km of the Danube River’s catchment area.105
No single registry of the location of industrial facili-ties in natural hazard zones exists, nor are NATECH events systematically tracked over time. Hence there is no baseline available to compare risk trends. Few statistical analyses exploring NATECH trends exist. An analysis of NATECH events in the onshore hazardous liquid pipeline network of the United States of America for the period 1986–2012 using the official database of the United States Pipeline and Hazardous Materials Safety Adminis-tration concluded that NATECH accidents experi-enced increases in impact while the relative number
of NATECH events remained stable and the abso-lute number of pipeline accidents from all causes decreased.106
Where legal obligations for reporting incidents do not exist, relevant information is lost from the lesson-learning process. However, even where acci-dent reporting is mandatory, it usually applies only to incidents where the impact exceeds a defined sever-ity threshold. This is also seen in public records, where media rarely report on low-impact events and near misses are seldom captured. Underreporting is further exacerbated as the attribution of NATECH triggers to a natural hazard is often difficult. Natural hazard information is often absent in industrial acci-dent databases; vice versa, information on NATECH events is often missing in disaster loss databases. Quantitative NATECH event trend analysis is there-fore difficult, and proxies are needed for measuring progress in NATECH risk reduction.
Radiation warning sign in Kashiwa, Japan, 2012 (Source: Abasaa 2012)
128 Chapter 3

104 (Krausmann and Baranzini 2012)105 (UNEP and OCHA 2000); (EC 2000)106 (Girgin and Krausmann 2016)107 (Hudec and Lukš 2004)
108 (Krausmann, Cruz and Salzano 2017)109 (Krausmann, Girgin and Necci 2019)110 (Krausmann, Cruz and Salzano 2017)111 (Cruz, Kajitani and Tatano 2015)
The positive news is that awareness of NATECH risk and the need for management has increased over the past decade, not least due to some land-mark events. In Europe for example, the overwhelm-ing of protection barriers of a chemical facility in Czechia – that had been designed for floods with a 100-year return period – caused the release of chlorine and other hazardous substances into the River Elbe.107 This and other accidents prompted the EU to initiate action to combat NATECH events. The Great East Japan earthquake and tsunami and subsequent Fukushima Daiichi nuclear accident in 2011 put NATECH risks on the global agenda. With growing industrialization (notably in emerg-ing economies), rising vulnerability (e.g. due to community encroachment and often unplanned urban development), as well as changing hazard frequency and occurrence (including as a result of a changing climate), NATECH risk is expected to trend upwards.108
Drivers of NATECH risk
Different factors determine NATECH risk. Some are of a technical nature and linked with the character-istics inherent to NATECH events; other underly-ing causes are a consequence of risk governance challenges and socioeconomic context. The boundaries between these risk factors are often blurred with links between the various causes.109 Disaster risk reduction (DRR) frameworks have not fully addressed the issue of technological hazards in general, and NATECH hazards in particular, although they usually highlight it as an example of a cascading multi-hazard risk. Furthermore, instru-ments for reducing technological risks, such as chemical accident prevention and preparedness programmes, often tend to overlook the specific drivers of NATECH events, leaving an important gap in managing this type of risk.110
NATECH risk is a multi-hazard risk that cuts across different domains and stakeholder communities that traditionally have not interacted much with each other (technological risk, natural risk, indus-try, civil protection, etc.). For governing such a cascading risk, a paradigm change is required that acknowledges the diverse and interdisciplinary nature of the risk and the challenges associated with it. What is also crucial is a departure from the “act of God” mentality, which has often kept stake-holders from taking responsibility for NATECH risks and protecting against them. While in the past, this mindset may have been partly justified by the unavailability of reliable natural hazard forecast-ing, lack of knowledge no longer justifies inac-tion thanks to readily available modern prediction systems for many triggering natural hazards.
The risk management of an industrial installation cannot be viewed in isolation from its surroundings, but should take account of potential interactions with other industry, lifelines and nearby communi-ties to capture the potential for cascading events. Since natural hazards often affect large areas, this is even more relevant for NATECH risks. A systemic view is required for the effective management of NATECH risks, requiring a territorial approach to risk governance and incorporating physical (e.g. indus-trial facilities, lifelines and building stock), organiza-tional and socioeconomic factors into the analysis of natural hazard risks.111 In some regions, rules for land-use planning around high-risk chemical facili-ties aim to ensure the protection of the surrounding communities by compelling risk management anal-ysis to consider domino effects on nearby industrial installations.
While NATECH accidents in non-nuclear industrial activities have been happening regularly, it was only after the Fukushima Daiichi disaster that the public truly started to take notice of the potential
129
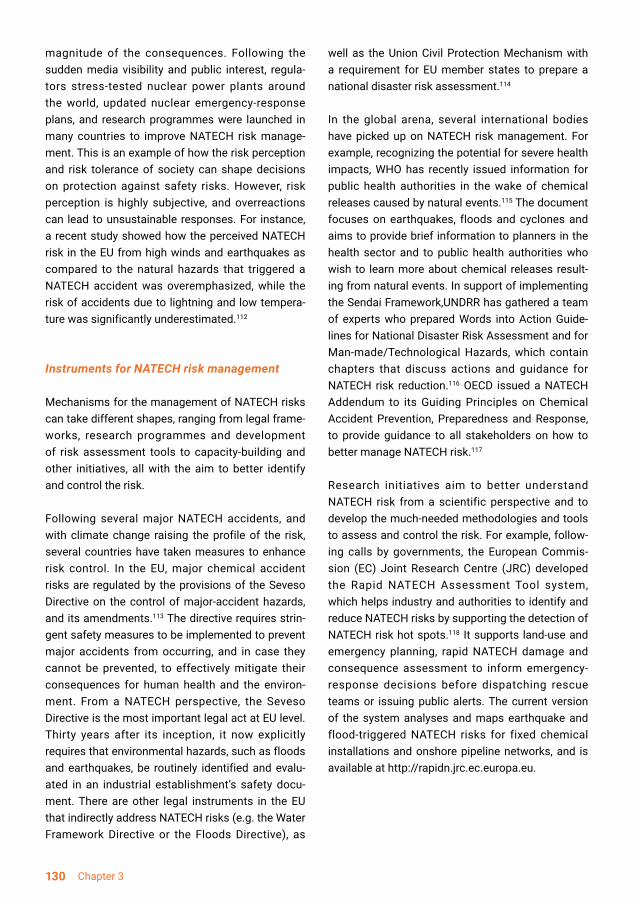
magnitude of the consequences. Following the sudden media visibility and public interest, regula-tors stress-tested nuclear power plants around the world, updated nuclear emergency-response plans, and research programmes were launched in many countries to improve NATECH risk manage-ment. This is an example of how the risk perception and risk tolerance of society can shape decisions on protection against safety risks. However, risk perception is highly subjective, and overreactions can lead to unsustainable responses. For instance, a recent study showed how the perceived NATECH risk in the EU from high winds and earthquakes as compared to the natural hazards that triggered a NATECH accident was overemphasized, while the risk of accidents due to lightning and low tempera-ture was significantly underestimated.112
Instruments for NATECH risk management
Mechanisms for the management of NATECH risks can take different shapes, ranging from legal frame-works, research programmes and development of risk assessment tools to capacity-building and other initiatives, all with the aim to better identify and control the risk.
Following several major NATECH accidents, and with climate change raising the profile of the risk, several countries have taken measures to enhance risk control. In the EU, major chemical accident risks are regulated by the provisions of the Seveso Directive on the control of major-accident hazards, and its amendments.113 The directive requires strin-gent safety measures to be implemented to prevent major accidents from occurring, and in case they cannot be prevented, to effectively mitigate their consequences for human health and the environ-ment. From a NATECH perspective, the Seveso Directive is the most important legal act at EU level. Thirty years after its inception, it now explicitly requires that environmental hazards, such as floods and earthquakes, be routinely identified and evalu-ated in an industrial establishment’s safety docu-ment. There are other legal instruments in the EU that indirectly address NATECH risks (e.g. the Water Framework Directive or the Floods Directive), as
well as the Union Civil Protection Mechanism with a requirement for EU member states to prepare a national disaster risk assessment.114
In the global arena, several international bodies have picked up on NATECH risk management. For example, recognizing the potential for severe health impacts, WHO has recently issued information for public health authorities in the wake of chemical releases caused by natural events.115 The document focuses on earthquakes, floods and cyclones and aims to provide brief information to planners in the health sector and to public health authorities who wish to learn more about chemical releases result-ing from natural events. In support of implementing the Sendai Framework,UNDRR has gathered a team of experts who prepared Words into Action Guide-lines for National Disaster Risk Assessment and for Man-made/Technological Hazards, which contain chapters that discuss actions and guidance for NATECH risk reduction.116 OECD issued a NATECH Addendum to its Guiding Principles on Chemical Accident Prevention, Preparedness and Response, to provide guidance to all stakeholders on how to better manage NATECH risk.117
Research initiatives aim to better understand NATECH risk from a scientific perspective and to develop the much-needed methodologies and tools to assess and control the risk. For example, follow-ing calls by governments, the European Commis-sion (EC) Joint Research Centre (JRC) developed the Rapid NATECH Assessment Tool system, which helps industry and authorities to identify and reduce NATECH risks by supporting the detection of NATECH risk hot spots.118 It supports land-use and emergency planning, rapid NATECH damage and consequence assessment to inform emergency-response decisions before dispatching rescue teams or issuing public alerts. The current version of the system analyses and maps earthquake and flood-triggered NATECH risks for fixed chemical installations and onshore pipeline networks, and is available at http://rapidn.jrc.ec.europa.eu.
130 Chapter 3

Measuring progress in NATECH risk reduction
Traditionally, it is very difficult to measure prog-ress in reducing NATECH (and technological) risks. There are no universal performance measures, and there is no reliable point of reference that can be used for comparison. To provide a measure
of progress, qualitative indicators can be used as proxies for the status of NATECH risk reduction. The nature, complexity and scale of such indica-tors can vary (e.g. at facility, community or national levels), and they may differ across countries and implemented legislative regimes, and according to country priorities. For example, indicators for
112 (Krausmann and Baranzini 2012)113 (EU 2012) 114 (Girgin, Necci and Krausmann 2019)115 (WHO 2018a)
116 (UNISDR 2018e)117 (OECD 2003b); (OECD 2015)118 (Girgin and Krausmann 2012)
Table.3.3. Examples of qualitative criteria for measuring NATECH risk reduction in a country
(Source: Krausmann, Girgin and Necci 2019)
131

countries in which legal frameworks cover NATECH risk might differ from those used where no such instruments exist. Some indicators might be considered more appropriate than others depend-ing on the scope of the analysis. Similarly, some indicators may address only government resources and systems, while others evaluate industry infra-structure and competence, or social norms and risk perception.119
Proxies for measuring progress in NATECH risk reduction should relate to human, financial and physical resources, as well as the legal and admin-istrative infrastructure in a country. Table 3.3 gives examples of qualitative performance indicators on a four-level scale, which assumes as a minimum level the complete absence of tools for reduc-ing NATECH risk. The choice of these indicators is based on expert judgment and assumes that basic information on technological and natural hazards already exists (e.g. industrial facility regis-ters including type of activity, type and amount of hazardous substances present, industry location; and natural hazard information including maps).
The indicators proposed are markers that can consist of one or more subindices. For example, the indicator on a legal framework for the control of NATECH accident risk can include subindicators such as land-use planning, safety cases and emer-gency planning.
Work is under way to develop a method for the compilation of the individual indicators into a composite indicator that reflects the many dimen-sions of the measured risk. This also includes weighting of the single indicators according to their importance for reducing NATECH risks. In the absence of such a composite indicator, indi-vidual performance measures from Table 3.3 can be compared separately or all measures can be visualized by using radar charts as in Figure 3.19, comparing two hypothetical country examples with low and high levels of NATECH risk measures.
Figure 3.18. Example visualization of comparative NATECH risk reduction measures proposed in Table 3.3 for two hypotheti-cal countries
(Source: Krausmann, Girgin and Necci 2019)
132 Chapter 3

121 (IPBES 2018)122 (Rockström et al. 2009)123 (Schippmann 2006)124 (European Environment Agency 2013)
119 (Baranzini et al. 2018)120 (IPBES 2018); (United Nations 2017); (IPCC et al. 2018); (OECD and OCDE 2018); (FAO 2018); (International Resource Panel 2017)
3.1.10 Environmental
Evidence from the latest intergovernmental and global assessments shows that the planet is overheating and becoming increasingly densely populated. Climate change, food insecurity, rapid urbanization and growing levels of pollution are damaging human and ecosystem health. Growing inequalities in wealth and access to technology and resources are leading to malnutrition, conflicts and the displacement of millions of people.120
Understanding of environmental hazards and associated risks and distributional impacts caused by these pressures has been enhanced through the assessments of various key interna-tional scientific bodies.121 The concept of inter-linkages among environmental risks lies at the heart of the concept of planetary boundaries and dynamic systems. Four out of the nine planetary boundaries (climate change, loss of biosphere integrity, land-system change, altered biogeo-chemical cycles (phosphorus and nitrogen)) have now been crossed.122 Fifteen out of 24 catego-ries of ecosystem services are in decline due to overuse of resources. The spread of zoonoses and invasive alien species is being exacerbated by climate change and global trade, and is already posing direct threats to native and endemic species and ecosystem functioning. Overharvest-ing, land-use change, unsustainable use of – and lack of fair access to – genetic resources, and climate change are key drivers of the decline in wild plant resources, including those used commercially for food and medicinal purposes. Approximately 15,000 species or 21% of global medicinal plant species are now endangered due to overharvesting and habitat loss.123
Intense heat-waves, wildfires and storms occurred in 2018. The 20 warmest years on record have all occurred in the last 22 years. Meanwhile, GHG emis-sions keep rising (another 2.7% increase in 2018) and extreme weather-related events continue to spread and intensify globally.
By 2050, the median projected population is expected to rise to 10 billion, and to grow to nearly 12 billion by 2100. These figures are based on current declines in infant mortality coupled with female education, improvements in health care and increases in life expectancy. When linked with rising levels of consumption, the pressures on global resources will be greater than at any other time in human history, creating competition for resources and overstretching the planet’s regenera-tive capacity.
To fully understand the nature of environmental risks, it is important to understand their sources. This means understanding the dynamics of the hazards themselves, the exposure of human popu-lations and ecosystems to these hazards, the vulnerability of the affected people and ecosystems and their resilience to change.124 This section exam-ines some of the principal threats that we face, now and in the future, emerging from a combination of natural and anthropogenic factors.
These must be considered when determining how best to deliver frameworks and intergovernmen-tal agreements such as the 2030 Agenda, the Sendai Framework, the Paris Agreement and NUA in a coherent way. In adopting the Sendai Frame-work, Member States identified as prerequisite the need to understand the dynamic interactions among economic, ecological, social, political, health and infrastructure systems when consider-ing risk-informed decision-making across sectors, geographies and scales. In so doing, the Sendai
133

Framework provides the frame for the application of systems-based approaches in pursuing the goals and targets of other 2015 agendas.
Given the intensification of many environmental hazards and their complex interactions, risk reduc-tion strategies and risk informed decision-making cannot afford to ignore the integrated, multiscalar, multiplier effects of environmental hazards.
Climate change
Climate change is a hazard and threat multiplier. It is an aggressive driver of environmental change, affecting human and ecosystem health, and chang-ing the complex interrelationships among living organisms and ecosystems. Climate change is having a detrimental effect on the environmental and social determinants of health, from the avail-ability of clean air and water, to heat shocks, food security and shelter, and has the potential for wide-ranging systemic impacts on food availability and large-scale disasters. In this century, it has been identified as the defining issue for public health125 and also the biggest global health threat.126
Ongoing increases in GHG emissions have put the world on an extended warming trajectory. Without rapid decarbonization,127 this will lead to further sea-level rise, ocean warming and acidification, and more extreme weather that will amplify existing and emerging risks, such as the spread of zoonoses and infectious diseases, especially for the poor and vulnerable. Cautious estimates from WHO under a medium-high emissions scenario indicate that 250,000 additional deaths could potentially occur each year between 2030 and 2050 because of climate change.128
Air quality and pollution
As one of the most significant environmental hazards after climate change, air pollution contrib-utes to the global burden of disease (GBD) through atmospheric concentrations of GHG emissions and their precursors, particulate matter, heavy
metals, ozone and associated heat-waves, leading to approximately 7 million premature deaths and economic losses of $5 trillion annually.129 The most susceptible are the elderly, children and poor, with air pollution exposure highest for urban residents compared with rural communities.
Transboundary flows of air pollution are also a matter of serious concern, hindering countries as they attempt to meet their own goals on ambient environmental quality and public health. Studies suggest that the sum of the health impacts of transported pollution in foreign nations downwind of a source can sometimes be larger than the health impacts of emissions in the source region.130 Making matters more complicated, reducing some air pollutants (e.g. sulfates), which would be in line with air quality remediation guidelines, is likely to reduce cloud cover and increase incoming solar radiation, leading to further global warming.
Atmospheric concentrations of carbon dioxide and other long‐lived GHGs continue to increase. This is driven primarily by fossil fuel energy, industry, trans-portation, land-use change and deforestation, and making significant, adverse, irreversible changes in climate and sea levels inevitable. Decreasing emis-sions of short‐lived climate pollutants such as black carbon, methane, tropospheric ozone and hydro-fluorocarbons, can help to limit warming in the near term, but are no substitutes for mitigating long‐lived GHGs.
Some of these biodiversity-related environmental hazards and associated risks are being addressed through multilateral environmental agreements and their protocols (e.g. United Nations Conven-tions on Biological Diversity, Climate Change and Combating Desertification). However, the complex-ity of the feedbacks and dynamics of ecosystems and biodiversity means that safeguarding species and ecosystems requires more than conservation and protection of natural habitats. It also requires risk-based decision-making to be represented in sectoral policies and agreements such as in agricul-ture, fisheries and forestry.
134 Chapter 3

Land
Agriculture is the single, largest use of land, accounting for more than one third of the world’s land surface, excluding Antarctica and Greenland. Deep tilling, and overuse of pesticides, fertilizers and antibiotics in agriculture, has led to significant levels of soil erosion, pollution of surface waters and the spread of AMR, with very real risks to human and wildlife health.131 Rising global temperatures and changing rainfall patterns are having a detrimental effect on crop yields, especially in tropical regions, where the effects of higher temperatures are greater than in temperate zones. As the growing seasons change, yield growth has also slowed down. Shifting rainfall patterns and greater variability in precipita-tion poses a risk to the 70% of global agriculture that is rain-fed.132 It is estimated that over 1.3 billion people are now trapped on degrading agricultural land.133 Farmers and pastoralists on marginal lands, especially in semi-arid and dryland areas, have limited options for alternative livelihoods.
The environmental impact of industrialized farming practices cost the environment $3 trillion per year,134 and contributes up to one third of global GHG emis-sions.135 Livestock takes up 75% of agricultural land for feed production, pasture and grazing, yet it only generates 16% of dietary energy and 32% of dietary protein demands.136 Approximately one third of global edible food is being lost or wasted before getting to market.137
Deforestation is creating a wide range of impacts in the biophysical world, from feedbacks to the climate system itself, loss of biodiversity and soil erosion. It is leading to a significant reduction in the resilience of local communities.
Coasts and oceans
The marine environment provides multiple ecosys-tem services, and is therefore key to any consider-ation of environmental hazards, climate regulation, resource extraction and food production. Storms and ocean weather events are the most prominent of the environmental hazards, but there is also ocean warming and acidification, and waste and chemicals pollution. The degradation of coastal zones and watersheds exacerbates the effects of natural hazards such as floods and storms, while land degradation severely exacerbates the effects of drought and causes an increase in flash floods.138
The cumulative pressures and multiple stress-ors on the marine environment are affecting the health of oceans and their ability to support human populations. The major risks come from the high dependency of humans on the oceans for food and livelihoods. More than 3 billion people rely on the marine environment for 20% of their dietary protein.139 The annual value of fisheries and aqua-culture is more than $250 billion, and up to 120 million people rely on the sea for their livelihood.140 But overfishing, illegal and unregulated fishing, and damaging fishing practices are placing many fish stocks at risk. Marine pollution, litter and plas-tics expose marine ecosystems and marine life to a wide array of chemicals, including microplas-tics, and heavy metals, which are accumulated throughout the marine trophic food chains leading to human exposures when they eat marine food species. Approximately 8 tonnes of plastics enter the oceans from land-based sources annually.141 The hazards from eating contaminated marine sources of food have been well documented and do not yet have a simple mitigation solution.
125 (Chan 2019)126 (Watts et al. 2015) 127 (Rockström et al. 2017)128 (Hales et al. 2014) 129 (Health Effects Institute 2018)130 (Task Force on Hemispheric Transport of Air Pollution 2010)131 (UNEP 2019)132 (United Nations 2017c)133 (United Nations 2017c)
134 (FAO 2015a)135 (Campbell et al. 2017)136 (United Nations 2017)137 (United Nations 2017)138 (UNEP 2019)139 (UNEP 2019)140 (UNEP 2019)141 (UNEP 2019)
135
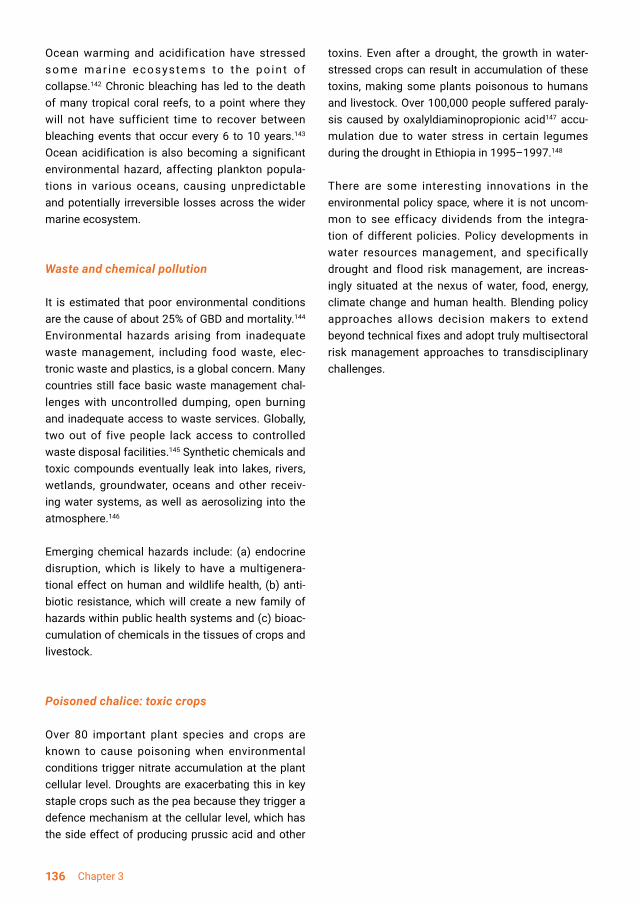
Ocean warming and acidification have stressed some mar ine ecosystems to the po int of collapse.142 Chronic bleaching has led to the death of many tropical coral reefs, to a point where they will not have sufficient time to recover between bleaching events that occur every 6 to 10 years.143 Ocean acidification is also becoming a significant environmental hazard, affecting plankton popula-tions in various oceans, causing unpredictable and potentially irreversible losses across the wider marine ecosystem.
Waste and chemical pollution
It is estimated that poor environmental conditions are the cause of about 25% of GBD and mortality.144 Environmental hazards arising from inadequate waste management, including food waste, elec-tronic waste and plastics, is a global concern. Many countries still face basic waste management chal-lenges with uncontrolled dumping, open burning and inadequate access to waste services. Globally, two out of five people lack access to controlled waste disposal facilities.145 Synthetic chemicals and toxic compounds eventually leak into lakes, rivers, wetlands, groundwater, oceans and other receiv-ing water systems, as well as aerosolizing into the atmosphere.146
Emerging chemical hazards include: (a) endocrine disruption, which is likely to have a multigenera-tional effect on human and wildlife health, (b) anti-biotic resistance, which will create a new family of hazards within public health systems and (c) bioac-cumulation of chemicals in the tissues of crops and livestock.
Poisoned chalice: toxic crops
Over 80 important plant species and crops are known to cause poisoning when environmental conditions trigger nitrate accumulation at the plant cellular level. Droughts are exacerbating this in key staple crops such as the pea because they trigger a defence mechanism at the cellular level, which has the side effect of producing prussic acid and other
toxins. Even after a drought, the growth in water-stressed crops can result in accumulation of these toxins, making some plants poisonous to humans and livestock. Over 100,000 people suffered paraly-sis caused by oxalyldiaminopropionic acid147 accu-mulation due to water stress in certain legumes during the drought in Ethiopia in 1995–1997.148
There are some interesting innovations in the environmental policy space, where it is not uncom-mon to see efficacy dividends from the integra-tion of different policies. Policy developments in water resources management, and specifically drought and flood risk management, are increas-ingly situated at the nexus of water, food, energy, climate change and human health. Blending policy approaches allows decision makers to extend beyond technical fixes and adopt truly multisectoral risk management approaches to transdisciplinary challenges.
136 Chapter 3

142 (UNEP 2019)143 (UNEP 2019)144 (UNEP 2017)145 (UNEP 2019)146 (UNEP 2019)
147 (UNDP 2016b)148 (Surya and Rao 2013)149 (World Bank 2016) 150 (Centre for Disease Control and Prevention 2019)
3.2 Exposure
In past GARs, the production of the Global Risk Model and standard risk metrics (AAL, PML and hybrid loss exceedance curves) relied on a global data set of standardized and homogeneous expo-sure data. Due to the heterogeneity of national reporting and the availability of data, model-based exposure calculations relied on an understand-ing of the constructed environment and used data from satellite observations. These satellite-based exposure layers were often validated locally through ground truthing. A team of on-the-ground analysts would visit a satellite-modelled site and verify if the model layer accurately depicted the extent of construction, building use, construction type, density, floors, materials, etc. The advantage of this approach was that the loss and replacement value of construction materials is relatively easy to describe country by country, even considering local market variability. A second advantage was that the use of built assets meant that in the cases of disaster events that affected areas that were more often insured, modelling data could be validated and corrected based on loss claims. Third, many of the hazards that were modelled were major natural hazards for which extensive engineering tests had been done to better understand their robustness faced with certain natural phenomena. For example, extensive testing has been done to understand the maximum ground acceleration due to earthquakes that the different types of building materials can withstand or the scales of modelled flooding a typical family home would be expected to experience.
3.2.1 Structural exposure
There are several difficulties in relying on struc-tural exposure. Huge regions of the world rarely experience seismic hazards. For example, much of Africa is at relatively low risk from a seismic perspective. Furthermore, the nature of construc-tion materials, population densities and other elements of structural exposure as modelled for Africa dictate that the true risk of many African countries was not fully revealed. As past GARs have noted, the prevalence of extensive risk in many parts of the world have been historically underrepresented. When the predominantly exten-sive risk profile is coupled with relatively low rates of insurance penetration and very diverse construction types, it becomes evident how diffi-cult it has historically been to reveal the true cost of risk in many countries. Droughts, epidemics, epizootics, agricultural infestations, etc., imply effectively no damage to structures, but their economic cost in direct and indirect terms could be devastating.
The Ebola virus outbreak in Guinea, Liberia and Sierra Leone in 2014–2015, which killed more than 11,000 people, is estimated to have cost 9.4% of GDP in Guinea, 8.5% in Liberia and 4.8% in Sierra Leone.149 Liberia lost more than 8% of its health-care workers. Surveillance, treatment and care of HIV/AIDS, malaria and TB were set back, and the entire region suffered economic effects of the stigma.150 An exposure model predicated on count-ing and categorizing buildings would have captured effectively none of the above exposed elements and thus failed to show the true risk faced by those countries.
137

None of the above should detract from the contin-ued development and refinement of understanding of structural exposure. It represents an important part of the equation. While it is the best-developed description of exposure in contemporary use, it benefits from continual improvements.
The increased availability of high-resolution satel-lite data and crowdsourcing are fostering a capacity to develop better building profiles, which is impor-tant for modelling risk for some hazard types. It is possible to use remote sensing and crowdsourc-ing to characterize a building’s physical exposure. The development of building portfolios through a combination of high-resolution satellite imagery and crowdsourcing has helped to improve the base understanding of structural exposure. Knowing the size and structure of a building can make models far more accurate and enables better risk assess-ment in its ability to describe the likelihood of damage. The damage caused by an event can also be better and more quickly understood using satel-lite imagery by comparing before and after photo-graphs to see if the height of a given building had changed (indicating damage or destruction). Using this information, simulations can identify to what degree changes in adherence to various building codes would affect outcomes in other areas.
There are challenges with using satellite data to impute even structural exposure. For example, some administrative districts cover very large areas within which the hazard effects can vary consider-ably. For this reason, an additional step is needed to spatially redistribute assets within each area, based on other sources of information. To identify where buildings are expected to exist, several auxil-iary data sets are considered, such as night-time lights,151 population maps, the location of smaller roads and public infrastructure information from open source mapping resources. The evenly spaced exposure data set can be aggregated following different approaches to illustrate the distribution of the building stock at the national, regional or global scales. The estimated number of buildings at the global scale is depicted at 0.5 × 0.5 decimal degrees. Unsurprisingly, the resulting global expo-sure database indicates a large concentration of buildings in South-East Asia, Western Latin America, Central and South Europe, and Eastern sub-Saharan Africa.
It is technically possible to validate country-level data by collaborating with local experts and insti-tutions. Bringing the local level into understanding exposure is necessary, and there is a clear appetite among underrepresented governments and citizen groups, but a more enabling environment is required
Figure 3.19. Projected economic losses due to Ebola in Liberia, Guinea and Sierra Leone, 2010–2016
(Source: World Bank 2016)
138 Chapter 3

151 (Elvidge et al. 2012)
to encourage people to contribute and share data about their communities.
At the time of writing, GEM results indicate an average global loss of $63.47 billion per year due specifically to earthquakes. Residential building stocks contribute 64% of the total annual modelled loss, while commercial and industrial stocks
represent 22% and 14%, respectively. In terms of the total absolute losses per country; Japan, the United States of America, Indonesia and China lead the ranking, mostly due to the considerably high
The existing exposure information used in the global human settlements layer was built using data from the European Space Agency (ESA) satellite Sentinel-1. With the launch of Sentinel-2 researchers expect to be able
to provide much more detail, with smaller communities being captured that might have been missed under Sentinel-1. Information can then also be informed through other sources such as social networks.
Box 3.9. Global human settlements layer
(Source: ESA 2019: 1 February 2019 10:00 a.m. Contains modified Copernicus Sentinel data, processed by ESA, CC BY-SA 3.0 IGO)
Figure 3.20. Iraq flooding revealed by high-resolution satellite imagery, 2019Detailed satellite imagery is providing a richer picture of the impact of hazards. This image combines two acquisi-tions over the same area of eastern Iraq, one from 14 November 2018 before heavy rains and one from 26 November 2018, after the storms. The image reveals the extent of flooding in (false colour) red, near the town of Kut.
139

Figure 3.21. Highest average annual economic losses due to earthquake risk (in billion $)
(Source: GEM 2018)
Figure 3.22. Earthquake AAL as a percentage of GDP
economic value of the building stock, as presented in Figure 3.21.152
The evaluation of risk in terms of absolute economic losses can be misleading, as poor or lesser popu-lated countries with vulnerable structures will have annual losses several orders of magnitude below nations such as China, Japan or the United States of America. It is thus useful to normalize AALs based on the total exposed value. Unsurprisingly, the high
range of Figure 3.22 is dominated by countries with a history of high-impact disastrous events (in 2001, a magnitude 7.7 event in El Salvador, in 2007 a magnitude 8.0 event in Peru, and in 2015 a magni-tude 7.8 event in Nepal).
The development of the global residential expo-sure model relied predominantly on data from the national housing census of each country. These surveys are performed at different timescales
(Source: GEM 2018)
140 Chapter 3

152 (Silva et al. 2019)
around the world, occasionally at the lowest admin-istrative level. In the best cases, the survey data comprises information concerning the number of buildings, type of structures (e.g. individual houses
For many nations, the survey data provides informa-tion only about the type of dwelling and the main material of the structure. In these cases, a system is applied using alternative sources of information and the judgment of local experts. For some coun-tries, the mapping schemes must be derived using different techniques within the same region (urban versus rural areas).
However, there are some challenges with this approach, such as different definitions of the distinc-tion between urban and rural (in Japan, areas with more than 20,000 people are urban; in Australia,
or collective accommodation), main material of construction, material of the roofs, material of the floors, number of storeys, year of construction and sometimes the state of the building.
Figure 3.23. Degree of urbanization: red = urban centre; yellow = urban cluster; transparent = rural grid cell
(Source: EC 2018)Disclaimer: The boundaries and names shown and the designations used on this map do not imply official endorsement or accep-tance by the United Nations.
141

areas above 1,000 people are urban). To solve this, global human settlements researchers have created three artificial but homogeneous catego-ries: urban centres, urban clusters and rural areas. Urban centres are assumed to have contiguous grid cells of 1 km2 with a density of at least 1,500 inhabitants per km2 and a minimum total population of 50,000. Urban clusters are contiguous grid cells of 1 km2 with a density of at least 300 inhabitants per km2 and a minimum total population of 5,000. Rural areas are grid cells of 1 km2 with a density below 300 inhabitants per km2 and other grid cells outside urban clusters or centres.153 At the time of writing, the data layer that contains information
about human settlement is being updated with data from 2018.
For a few countries there are highly reliable data sets available. This applies to the Australia, Canada, New Zealand154 and the United States of America.155 On the other end of the spectrum, there are also coun-tries that have no housing information available or have been so heavily affected by disasters that after completion of the national census, the information is no longer accurate (e.g. Haiti or Nepal). In these cases, an alternative approach must be adopted that capitalizes on population data sets, satellite imagery and open source mapping data.
Figure 3.24. Distribution of number of residential buildings at the smallest available administrative subdivision for 12 coun-tries in the Middle East as of 2018
(Source: GEM 2018)Disclaimer: The boundaries and names shown and the designations used on these maps do not imply official endorsement or acceptance by the United Nations.
142 Chapter 3

157 (African Development Bank 2018)158 (UN-Habitat 2015)159 (Gunter and Massey 2017)
153 (Melchiorri et al. 2019)154 (Nadimpalli, Edwards and Mullaly 2007) 155 (FEMA 2017) 156 (Tsionis et al. 2017)
Exposure information regarding non-residential buildings is rarely compiled systematically at a regional or national scale. In most cases, secondary sources of data such as economic census surveys provide data regarding the number of employees and various other indicators that are related to commercial and industrial structures. As a result, the development of the exposure sources for non-residential occupancy types relies on three main sources of data sets: (a) demographic data concern-ing the workforce across different sectors; (b) data concerning the number of permits, which may also specify the date, type of business, size of the facility and number of workers; and (c) large-scale data sets that identify regions according to occupancy.156 The combination of these data sets permits an estimate of the average number of facilities per occupancy, which is then distributed across several classes.
The combination of various sources of exposure information will inevitably lead to a global exposure data set that is not uniform in resolution, quality or vintage. And by integrating alternative data sources to validate information for structural exposure, for example, a collection of other exposure data is becoming enriched and validated. And by integrat-ing data about roads, infrastructure installations, use of water, distance to food sources, electricity demand, availability of primary health care, educa-tion attainment, etc., the global understanding of exposure beyond the structural level will grow. In this way, challenges related to the heterogeneity in data availability and scale will eventually become obviated as availability of open exposure data grow.
3.2.2 Exposure related to growth
Leaving aside the above-mentioned challenges of keeping pace with the exposure drivers for the built environment, the exposure for people, infrastructure and systems implied in those growth rates repre-sents an astronomically complicated computation.
Exposure is not static, risk can increase with changes in exposure (e.g. a three-storey build-ing can become five storeys over the course of a few weeks, populations can displace en masse very quickly or border crossings can be closed). In Africa, average GDP growth for 2018 was above 4%, with one third of African countries experiencing real GDP growth of more than 5% year on year.157 In developing countries and countries in transition, growing middle classes and expanded access to the global market are fuelling growth of exposed assets while regulatory structures and risk manage-ment capacity struggle to keep pace. The result is a compounded risk, as the scale of exposed assets and lower likelihoods of careful application of safety standards overtake public investment in risk management strategies. This applies equally to construction regulation as to food safety inspec-tion, industrial facilities verification, disease surveil-lance, biodiversity preservation, etc.
Urbanization is one of the twenty-first century’s most transformative trends, posing challenges in terms of exposure and vulnerability, with implications in housing, infrastructure and basic services. The developing world is experiencing 90% of this urban growth, and it is estimated that 70 million new resi-dents are added to urban areas in developing coun-tries each year;158 infrastructure development cannot keep pace with growth.159 Africa is the fastest urban-izing continent; between 1990 and 2015, the popu-lation in urban clusters increased by 484 million,
143

while Asia has 89% of its population living in urban clusters.160 Low-income countries have seen a 300% increase in built-up areas and an 176% increase in population over the past 40 years.161 For example, the number of fire incidents in formal and informal dwellings per year are similar, but with approximately
18% of the population living in informal settlements, the informal settlement dweller is 4.8 times more likely to be affected by fire than someone residing in a formal dwelling. The propensity of informal settle-ments to fire indicates that the burden of fire disas-ters is often borne by the poor.162
Historically, many megacities such as Chicago, London and Tokyo have experienced major urban fires,163 but have been able to progressively improve infrastructure and build structures that take into con-sideration the hazard. Similar intervention is needed in new megacities and other growing urban areas to protect urban communities from preventable risk.
Informal settlements present an increasing chal-lenge for municipalities. In such areas, as many as 10,000 people can be left homeless in a single event like a fire. The urban morphology of informal settlements contributes to disasters propagating rapidly, resulting in loss of life, homes and belong-ings, devastating already-vulnerable communities.
In this way, structural exposure drives other aspects of exposure to risk.
Fire has as many political, social and economic properties as physical ones. Fire is a material condition dependent on ignition, combustion and fuel. It is also embedded in the history of a loca-tion, its governance and class structures, and its specific cultural attitudes towards risk and under-standings of exposure. Poverty and other forms of marginalization generate conditions of vulnerability, contributing to poor housing quality, overcrowding and failure to invest in protective measures.164 Of course, this profile of the multiple dimensions of intertwined exposure is not unique to fire.
Figure 3.25. Growth in formal and informal urban dwellings in South Africa
(Sources: Fire Protection Association South Africa 2018)
144 Chapter 3

160 (Devigne, Mouchon and Vanhee 2016)161 (Rush et al. 2019)162 (Rush et al. 2019)163 (Knowles 2013)
164 (Rush et al. 2019)165 (Pacifici et al. 2015)166 (Hassan et al. 2005)167 (Hassan et al. 2005)
Though flooding is relatively common, damage data is incomplete because there are so many kinds of floods that affect so many different forms of exposed assets. Floods often do not cause struc-tural damage so there is not the same focus on data collection that there would be in the wake of an earthquake.
The exposure calculation for wildfires does not include human settlement; it includes only the value of the natural area that was lost (meaning the cost of wood stocks and the time to replace). For the EU in 2017, economic losses due to fires were $11.2 billion, but this did not include the cost of built assets. Housing has not been traditionally relevant for fire risk, but is increasingly important to consider as the economic impact of fires on human settlements is growing. In densely populated areas, fires are often started in proximity to human settle-ments, and the economic cost and mortality is increasing.
Despite what may seem to be the dehumanization of disaster impact, it is important for some users of risk information to measure losses and, by conse-quence, exposure in monetary terms. This is partic-ularly important in making the case for effective mitigation methods like risk-transfer services such as insurance. The fact is that the return on invest-ment of risk reduction initiatives is positive (usually several times over) compared to projected losses; but not all risk reduction is equal. Public policy plan-ners are better equipped to make good decisions when the economic case is made clear. In many cases, risk reduction initiatives, on their own, are not politically popular. A politician in a poor jurisdic-tion may struggle to justify to their constituents an investment in a warning system that may not sound the alarm about a hazard for years when there are children not in school or people who are hungry.
3.2.3 Environmental exposure
Exposure in a global environmental sense takes into consideration systems for which individual quantitative figures do not exist. Over the last two decades, approximately 20% of the productivity of the Earth’s vegetated surface has shown a persis-tent downward trend, due to climate change, biodi-versity loss and poor management practices. With overharvesting of resources and land-use change remaining as key pressures, more than half of the world’s ecosystems services are in decline.
The widespread loss of biodiversity and ecosystem health is evidence of a failure to account for and manage the breadth of exposed global assets. That loss also has a major effect on risk reduction and the mitigation of environmental hazards.165 This is because ecosystem services help to regulate climate, filter air and water, and mitigate the impact of natural hazards. There are other direct benefits such as availability of timber, fish, crops and medi-cines, all of which support human health. These are often lost in the immediate aftermath of a disaster and can take many years to restore. Freshwater biodiversity and ecosystem services are threatened more than any others. Rivers and wetlands the world over are distorted, dried and overwhelmed with waste, toxic pollution, invasive species, and are damaged by overfishing and overuse of irrigation water. Two thirds of all rivers are highly degraded,166 along with the freshwater habitat they support. This problem affects nearly 5 billion people living in high-water-threat areas.167
Marine biodiversity is at risk from overfishing, ocean warming and acidification, melting of sea-ice with the loss of under-ice biota, oil and gas development, shipping, coastal habitat destruction, loss of coral reefs, eutrophication and pollution (including marine
145

plastics, toxic algal blooms and invasive species). Terrestrial biodiversity is at risk from rising tempera-tures, loss of grasslands to deserts and drylands making them unsuitable for wildlife or agriculture, deforestation and degradation of tropical forests, and melting of glaciers in high mountain ecosys-tems and polar regions.
Exposure to unsafe drinking water and poor sani-tation already results in 2 million preventable deaths per year from waterborne infections.168 With droughts on the increase in many parts of the devel-oping world, water-based sanitation will become even more difficult to implement and sustain, with the result that the occurrence and extent of hazards and risk will rise.
Overall, the pressures on exposed biodiversity and ecosystems (caused by climate change, habitat de-struction and transformation, as well as land‐use change) mean an irreversible and continuing decline of genetic and species diversity, and ecosystem deg-radation at all scales.169 When ecosystems decline or disappear, important ecosystem services such as pollination are lost, and so are natural resilience build-ers such as carbon sinks, natural pest control, and access to herbal and traditional medicines, which are important for the health of much of the world’s popu-lation.170 In the loss of ecosystem biodiversity, there is the near-certain prospect of more-frequent hazard events occurring, in addition to sacrificing one of the remaining resources to mitigate the risk.
In summary, there are different dimensions of expo-sure beyond what any individual stakeholder is interested in. This is not an indictment of the analy-sis of past versions of this GAR, but is reflective of the new paradigm that the Sendai Framework has elucidated. Risk is a function of natural and anthro-pogenic hazards and is a question of management for all levels of governance, all sectors and all dimensions of society. A robust health system and a well-managed road system and network of well-trained monitors are all mutually building resilience. For this reason, throughout the Sendai Framework’s applicability until 2030, it is important that research and science seek to better understand and repre-sent as many dimensions of exposure as possible.
3.3
Vulnerability
The impact of disasters encompasses more than just affected people or economic losses. While every society is vulnerable to risk, some suffer significantly more and recover more slowly than others when adversity strikes. Much of the existing literature on risk remains sector specific and treats vulnerability as people’s exposure to risk. This section, building on the analysis offered in previ-ous GARs and empirical evidence on the multi-dimensional aspects of risk exposure, reiterates the need for a more holistic and people-centred approach to vulnerability. It asks why some people do better in overcoming adversity than others by assessing the main obstacles that individuals, households and societies may face in managing risk, including challenges in terms of information, resources and incentives to build back faster and better.
Vulnerability is defined as the “conditions deter-mined by physical, social, economic and environ-mental factors or processes which increase the susceptibility of an individual, community, assets or systems to the impacts of hazards.”171 It occurs in connection with the incidence of disasters of varying magnitudes, which negatively affect the economic, social environmental/ecological profiles of countries over time. Implicit here is the notion of “differential vulnerability”, referring to the different facets and variant levels of risk, to which populations are exposed, accounting for differenti-ated impacts and outcomes in disasters.172
Hazard identification is only an initial step within a risk management strategy. While the intensity remains important, of greater importance is the profile of a population whose economic, demo-graphic, environmental, institutional and social characteristics may place its members at greater risk before, during and after a disaster. Whereas evidence suggests that wealthier countries with more developed institutions or governance are
146 Chapter 3

better able to reduce disaster risk,173 several coun-tries have witnessed rapid economic growth in the last few decades without a commensurable rate of vulnerability reduction.
The Sendai Framework was conceived as the world was witnessing impressive reductions in extreme poverty, major progress in improv-ing access to schooling and health care, and the promotion of the empowerment of women, youth, persons with disabilities and older persons. Yet, four years later, despite such achievements, poverty reduction remains uneven across regions, within countries and among various population groups. While more than 1 billion people have risen above the $1.90-a-day line since 1990, millions fall back into poverty annually due to shocks.174
Across the globe, in developing and developed economies alike, those left behind (e.g. people living in poverty, unemployed and underem-ployed, persons with disabilities, women and girls, displaced populations and migrants, youth, indigenous groups and older people) are often considered to be stuck in cycles of compound-ing vulnerability. People living in poverty may be caught in protracted cycles of unemployment and underemployment, low productivity and low wages, and are particularly vulnerable to extreme weather. Disenfranchised minorities, displaced populations and migrants are often exposed to discriminatory practices, have interrupted or no access to formal justice systems and health services. For those households, vulnerabilities may have evolved and persisted over long periods leading to dispari-ties in income, gender, ethnicity, household and social status, and job type, which are difficult to overcome.175 The governmental challenges of how to adapt and implement DRR plans in fragile and complex contexts such as conflict, famine and
other situations where people are displaced or migrating in large numbers are discussed further in Chapter 15.
3.3.1 Measuring vulnerability
Disasters significantly interfere with daily life. They disrupt livelihoods, family and social networks, and interrupt schooling trajectories, access to health services, infrastructure networks, supply chains and connections of essential services, all of which are critical for people’s well-being. Concep-tually, the quantification of vulnerability has been surrounded by debate in recent decades about appropriate methodologies, metrics and indicators applied within quantitative, survey-based methods (single cross sections, panel surveys and commu-nity surveys) and qualitative ones. Empirical literature on risk and vulnerability is extensive. It is therefore inevitable that there would be differences in how analysts/organizations define and measure vulnerability in relation to disasters. However, considering the increasingly damaging impact of disasters, an improved ability to measure vulner-ability – albeit incomplete and imperfect – should be a welcome step towards the promotion of a disaster-resilient culture.176
Vulnerability and risk
Vulnerability must be defined in terms of what it is that a population is vulnerable; its measurement therefore requires precise characteristics. Expo-sure to risk should be analysed as one of the many dimensions of vulnerability. For instance, vulner-able households are typically more exposed to risk
168 (WHO 2018c)169 (Heywood 2017) 170 (United Nations 2016a)171 (OEIWG 2016)172 (Shupp and Arlington 2008)
173 (UNISDR 2009); (UNISDR 2011b); (UNISDR 2013b); (UNISDR 2015b)174 (United Nations Economic and Social Council 2018b)175 (UNDP 2014)176 (Wei et al. 2017)
147

and less protected from it.177 Such exposure has a direct effect on their socioeconomic status and welfare. Equally important is how risk exposure causes vulnerability or increases its profundity.178 For instance, households, in their efforts to avoid risk exposure, may be forced to take costly preven-tive measures, which increases the likelihood of falling into poverty. Consequently, the decision not to invest in a high-risk but high-return activity means foregone income and also a higher likelihood that a household remains or becomes poor.179 For example, a disaster can push an already income-poor household further into poverty or drive a non-poor household below the income poverty line.180 A shock may account for the decision to take children out of school, affect people’s health permanently, the ability to obtain sufficient nutrition, a reduction in life expectancy or access to remedies for treat-able diseases.
The direction of causality between vulnerability and risk should also be assessed in reverse order. Hoogeveen and colleagues offered useful concep-tual insights on reverse causalities while incorporat-ing vulnerability in poverty analysis.181 For example, to avoid deprivation or food insecurity, a household may choose low-value crops or may be forced to cultivate in insecure areas (e.g. landmine-contami-nated land or areas in conflict) or to live in a hazard-prone environment (e.g. landslides, flood plains or along railway lines). It is thus not only exposure that may lead to detrimental welfare outcomes. The manifestation of risk (as a shock) also leads to undesirable welfare outcomes.
Vulnerability Assessment
Vulnerability assessments can be sectoral or multi-dimensional, demonstrating the distribution of the vulnerability indicators used and disaggregating by sex, family size, location, etc. While several meth-odologies exist, they are often ex ante and limited to specific sectors. In addition, many vulnerability measurements focus on hazards and risks while overlooking information on capacities to address them, hence solving only one piece of the vulner-ability puzzle. They are initiated at the request
of a specific policy question for a specific group or area (e.g. vulnerability profiles of displaced population due to disasters in an area), and their importance is largely overseen for other policy planning purposes. Lastly, such assessments are often conducted by international organizations, NGOs and the private sector within a project life cycle, compromising opportunities for systemati-cally integrating their findings into the overall risk management process and often making supposi-tions about categories that are influenced more by stereotypes of vulnerability than measured vulnerability.
Vulnerability profiling is used to identify groups that are “liable to serious hardship” – a term coined by economist and Nobel Laureate, Amartya Sen. Typical examples include to children and orphans, pregnant women or girls, nursing mothers, sole or primary carers (of dependent children, elderly people or people living with disabilities), people at risk of sexual or gender-based violence (GBV), adults or children experiencing family violence, exploitation or abuse, people living with HIV, elderly, ethnic minorities, certain castes, internally displaced persons (IDPs), and households headed by single women or children. These groups are often described as vulnerable in the common usage of the term. However, one point that merits specific attention is that even though these groups are characterized as vulnerable, risk is not a core char-acteristic of their problems, even if in some cases, risks may have contributed to their destitution as their opportunities to cope with those risks are limited.182 In other words, personal characteristics can be linked to vulnerability, but not define it, and it is precisely the correlations between vulnerability profiles and risks that vulnerability assessments can help determine.
Risks vary by their frequency, intensity and welfare impact.183 Although the sources of vulnerability are multiple and diverse, some of the most important factors that are recurrent in vulnerability assess-ment revolve around poverty, inequality, gender,184 education and health status, disability and environ-mental concerns. A few examples are presented in Table 3.4. These outline the risk categories and
148 Chapter 3

possible indicators that measure vulnerability in disaster contexts.
There is no perfect answer to the question of which indicators are most appropriate, as each context
dictates a different approach. However, a common denominator is that indicators should be selected based on: (a) their validity to represent their under-lying concepts appropriately and (b) their ability to inform action and policy planning.
177 (Hoogeveen et al. 2003)178 (Bergstrand et al. 2015)179 (Bergstrand et al. 2015)180 (UNISDR 2013b); (Sen 2000); (Narayan et al. 2000); (UNDP 2014); (World Bank 2013)
Haitian woman takes refuge from Tropical Storm Hanna, 2008A woman stands in the entrance of the cathedral in Gonaives, Haiti, where up to 400 people took refuge after Tropical Storm Hanna flooded the region, stranding thousands and killing more than 160 people. (Source: United Nations 2008; Logan Abassi)
181 (Hoogeveen et al. 2003)182 (Hoogeveen et al. 2003)183 (Holzmann and Jorgensen 2000) 184 (Nelson 2015)
149

Table 3.4. Selected risk categories and indicators in vulnerability assessments
150 Chapter 3

The feasibility of applying one methodology over another is often dictated by data considerations. While risk analysts for the past decade have increasingly recognized the importance of assessing the differentiated impacts of disasters through vulner-ability assessments, a cross-sectional household survey is usually the minimum available for most countries. Identifying data sources, assessing their suitability for measurement and proposing suggestions for complementary measures are crucial in developing a vulnerability assessment methodology.185
Data sources for vulnerability assessments
In a vulnerability survey context (single cross sections, panel surveys or community surveys), quantitative indicators measure the degree to which a characteristic is present, while qualitative data comprises numeric observations that point to the presence or absence of a characteristic to a single category. Qualitative data may also include textual or visual data stemming from interviews, observa-tions, project data, administrative data or records and can support inferences. A qualitative mapping of the strategies that individuals, households and communities choose to use to anticipate, mitigate and cope with these disaster risks is also helpful, not least in terms of broadening the policy options available.
In the absence of large household surveys, a small panel component may also serve to under-stand dynamic issues of vulnerability as related to systemic risks. As they only cover a certain year range, retrospective models can assist in bridging the gap between survey years. In the (fortunate) event where panel data was collected before and after a disaster, analysts can examine variables across the disaster continuum (before,
during and after) by assessing earlier periods for ex ante mechanisms and later periods for ex post response.186 For instance, information on displacement, migration, income diversification and livelihood opportunities are useful for ex ante mechanisms, while variations on employment and underemployment, remittances and informal trans-fers are ex post mechanisms.187
Secondary data
Secondary data sources may include administra-tive data, geographic information system (GIS) data, development/resilience/ livelihoods project data, census and demographic data, and demographic and health surveys. Information from such sources can complement vulnerability analysis given their ability to capture intertemporal dimensions of risk, particularly when risk analysts have a single cross-section survey to base their assessment on.
185 (UNDP 2016a)186 (UNISDR 2013b); (UNISDR 2015b)187 (Hoddinott and Quisumbing 2003b)
151

GIS data is also an extremely useful source of infor-mation, as it allows analysts to map and spatially reference units of vulnerability information, hence exploring relationships among natural hazard and vulnerability variables. It allows improved
Qualitative, interview and focus group data at the community level will be valuable sources in under-standing how people react and are thus projected to react in the future, in the wake of a disaster. During the 2017 Hurricane Harvey in the United States of America, more women than men decided to not evacuate despite alarming messages from EWSs. Across the world, women and girls are over-whelmingly tasked, personally and professionally, with caring for children, housework, the elderly and people with disabilities. They are often the last to leave. So, simple life-saving decisions, like decid-ing when and whether to evacuate a disaster area, become a difficult choice.189
visualization of the spatial distribution of data, stratification of sampling, identification of spatial correlates of vulnerability, geographic targeting, and assessment of the local and non-local (externality) impacts of some types of shocks.188
Translating the above into action for vulnerability assessments dictates that questions on disasters preparedness and response should be asked at the household and community levels for cross-validation. In cases where shocks are multiple and covariant, community information can provide the context for individual responses to be analysed and go beyond the obvious yes or no answers. The use of proxy questions to ascertain the probability of certain groups benefiting or, conversely, of being excluded from risk management plans is also critical. Vulnerability assessments have repeatedly proven that disasters discriminate on the same divi-sions that societies discriminate against people.190
Enumerator in Bamyan district, Afghanistan, 2010(Source: United Nations 2010)
152 Chapter 3

Lastly, census data and demographic surveys (e.g. demographic and health surveys) are espe-cially valuable for mapping and analysing life-cycle risks.191 Census data can improve understanding of the size of age cohorts as well as the geographic distribution. Matching the geographic distribution of the population to, for example, rainfall and seismic hazard data could prioritize population groups that are most vulnerable to weather and earthquake shocks. Furthermore, nutrition and health surveys can also provide information on issues related to health and diet, food components, food production, food safety, food insecurity and highlight regions with higher likelihood of malnutrition prevalence, as well as high incidence of contagious diseases.
3.3.2 Life-cycle vulnerability
Risks and capacities to cope accumulate over life-times. The life-cycle approach has been commonly used to cluster different vulnerable groups and prioritize action among them.192 It is founded on a multidimensional concept of vulnerability, initially conceived by the World Bank, which allows the iden-tification of risk factors for each group and thereaf-ter forecasts the long-term consequences of those risks into next stages in life.193 Life trajectories are the result of investments made in preceding stages as the consequences of shocks may cascade into long-term consequences. A setback in early child-hood has compounding effects throughout the rest of a person’s life, in terms of growth, job and social status and the uncertainties involved with growing older and the transmission of vulnerability to the next generation.194 This GAR argues that the cumu-lative and cascading nature of vulnerability requires timely and continuous investment to effectively protect those groups whose vulnerability profiles
– many structural and many tied to the life cycle – make them more susceptible to risks.
Once metrics for observation have been selected, the life-cycle approach can be used to rank various groups, by degree of destitution, by their numbers or a combination of both. As vulnerable groups are clustered according to their specific character-istics, poverty data can be extremely useful as a touchstone because it is well measured and relates to most of the other characteristics (age, gender, health and asset ownership).195 If such basic data is not available, the survey-based approach is preceded by a qualitative analysis to cluster popula-tion groups.196
The advantages of a life-cycle approach to vulnera-bility is that it can forecast socioeconomic impacts for different population groups and thus prioritize risk-coping mechanisms but also develop policies to prevent these risks from cascading into the next stages in life. In other words, the analysis is not static; rather it adapts based on learning from the dynamic processes that perpetuate vulnerabilities over time.
In practical terms, when it comes to assessing such vulnerabilities this means that if a vulnerable group is identified at an early stage of analysis, analysts can better measure the elements of such vulnerabil-ities over time by tracking those indicators through longitudinal surveys. This type of information does not need to be collected in isolation. Rather, vulner-ability analysis can inform the development of existing and future surveys and census data devel-oped by national statistical offices (NSOs). In ideal cases, the inclusion of disaster-sensitive indicators offers improved measurements of disaster inci-dences, identifies linkages with other aspects of welfare and integrates those with risk management instruments.
188 (Hoddinott and Quisumbing 2003a)189 (Vidili 2018) 190 (Hallegatte et al. 2016)191 (Hallegatte et al. 2016)192 (Bonilla Garcia and Gruat 2003)
193 (Irving 1996)194 (Morrissey and Vinopal 2018)195 (Hoogeveen et al. 2003)196 (Lokshin and Mroz 2013)
153

3.3.3 Socioeconomic vulnerability
An overreliance on asset losses to explain vulner-ability obscures the relationship between risk and poverty. By definition, wealthy individuals have more assets to lose; therefore, their interests dominate in risk assessments that are limited to asset losses. But measuring asset losses misses a major dimen-sion, particularly in the developing world; the poor are less likely to have assets to lose. Just as highly developed countries are more exposed to risk (by virtue of having more to lose), so too are wealthy people. But the losses felt by less-wealthy countries and less-wealthy people are not less important. In fact, they also lack the means and opportunity to smooth the impact of shocks while maintaining their consumption, and to recover and rebuild their assets.
To compensate for the bias towards asset losses as the key metric of vulnerability, the Unbreakable: Building the Resilience of the Poor in the Face of Natural Disasters report introduced the concept of well-being losses. In addition to traditional asset losses, well-being losses account for people’s socioeconomic resilience, including:197
Traditional risk assessments evaluate asset expo-sure and vulnerability to hazards to determine expected asset losses. The Unbreakable model additionally incorporates the socioeconomic resil-ience of the communities to predict well-being losses.
There has been progress towards understanding and representing socioeconomic vulnerability in a systematic way. Multi-partner projects like INFORM,
led by the United Nations Office for the Coordina-tion of Humanitarian Affairs (OCHA), have identi-fied several structural vulnerability indicators that are tracked globally. These include static measures of socioeconomic vulnerability such as the Gini coefficient and aid dependency and more dynamic data such as the number of IDPs, prevalence of certain diseases and malnutrition rates. These are useful as a starting point but are limited to usually years-old static data, national-level resolutions and certain kinds of vulnerability. Still, the information is standardized and validated by many contributing partners.
New metrics of disaster impacts – including poverty headcount, poverty gap and well-being losses – can be used to quantify the value of inter-ventions outside the traditional risk management toolbox. Asset-informed risk management strate-gies primarily focus on protection infrastructure, such as dikes, and the position and condition of assets, for instance with land-use plans or building norms.198
Strategies informed by well-being information can utilize a wider set of available measures, such as financial inclusion, private and public insurance, disaster-responsive social safety nets, macrofiscal policies, and disaster preparedness and contin-gency planning. Even if they do not reduce asset losses, these measures can bolster communities’ socioeconomic resilience, or their capacity to cope with and recover from asset losses and reduce the well-being impact of disasters.
Social vulnerability accounts for the inability of people and society to withstand the effects of the multiple stresses they are exposed to. In contrast to physical vulnerability, social vulnerability is indepen-dent of hazard intensity. Methodologies for measur-ing components of social vulnerability vary greatly, but can be broadly grouped into quantitative, index-based assessments and qualitative, community participatory ones.
a. Their ability to maintain their consumption for the duration of their recovery
b. Their ability to save or borrow to rebuild their asset stock
c. The decreasing returns in consumption – that is, poorer people are more affected by a $1 reduction in consumption than richer individuals
154 Chapter 3

Index-based assessments
A vulnerability index is built by a combination of vulnerability indicators. In turn, the vulnerability indicators are a direct measure of, or a proxy for vulnerability characteristics. Vulnerability char-acteristics can then be grouped into vulnerability categories. For example, a building has multiple physical vulnerability categories, such as a roof and number of storeys, and each category has one or more characteristics, such as roof shape and covering and number of storeys above ground and below ground. For social vulnerability, examples of vulnerability categories are education and food security. These categories have a variety of vulner-ability characteristics such as education level and access to education, and food availability, accessi-bility and stability.199
By analysing different clusters of variables to determine the level of vulnerability and resilience of target populations, it is possible to begin to quantify social vulnerability.200 The target variables are divided into two groups. The first includes vari-ables about individuals (e.g. education, age and gender) that are aggregated to produce community-level results. The second group covers variables about the community as a whole, such as popula-tion growth, infrastructure quality and urban/rural division that need not be disaggregated. Eleven
Tent city, Vancouver, Canada (Source: flickr.com user Sally T. Buck 2010)
197 (Hallegatte et al. 2017) 198 (Walsh and Hallegatte 2019)199 (Murnane et al. 2019)200 (Cutter, Boruff and Shirley 2003)
155

composite factors can be extracted to formulate a social vulnerability index.
This method was used in 2015 to calculate the social vulnerability to floods in the city of Vancou-ver, taking into account the:201
Another initiative built a socioeconomic vulnerabil-ity index specific to landslide hazards, by looking into the three subindices relating to different issues of vulnerability/disaster risk:202
Qualitative approaches
Through a vulnerability and capacity assessment (VCA),203 the International Federation of Red Cross and Red Crescent Societies (IFRC) employs various participatory tools to gauge people’s exposure to and capacity to resist natural hazards. It is an integral part of disaster preparedness and contrib-utes to the creation of community-based disaster preparedness programmes at the rural and urban grass-roots level. VCA enables local priorities to be identified and appropriate action taken to reduce disaster risk, and assists in the design and develop-ment of programmes that are mutually supportive and responsive to the needs of the people most closely concerned.
VCA is complementary to national and subnational risk, hazard, vulnerability and capacity-mapping exercises that identify communities most at risk. VCA is undertaken in these communities to diag-nose the specific areas of risk and vulnerability and determine what action can be taken to address them.
The United Nations Development Programme (UNDP), the Office of the United Nations High Commissioner for Refugees (UNHCR) and the United Nations Chil-dren’s Fund (UNICEF) broadly use participatory tools for VCAs that enable communities to identify their own capacities and vulnerabilities in rela-tion to disaster management, developing mitiga-tion strategies and building resilience to cope with future hazards. Data collected through these exercises can and should become more compa-rable, adding to a greater store of understanding and analysis of vulnerable populations. Through sustainably pooling assessments by different orga-nizations, vulnerability analysis can expand opera-tional response and coverage for those left behind as coordinated data collection and communication of findings among different actors on the ground becomes more integrated into DRR strategies and provides a more coherent picture and finer detail into vulnerability assessments.
• Ability to cope (age, gender), ethnicity (minority status, immigration)
• Access to resources (income, property value, percentage of renters, education, unemploy-ment, income from government transfers)
• Household arrangement (single-parent house-holds, single-member households)
• Public transport (as the main family transpor-tation mode)
• Built environment (quality of housing, age of construction, population density, dwelling in five or more storey apartments)
• Demographic and social index (age distribution, number of workers who may be exposed to disasters, population density, foreigner ratio, education level and housing type)
• Secondary damage triggering index (number of public offices, road area ratio, number of electronic supply facilities, school area ratio, and commercial and industrial area ratio)
• Preparation and response index (disaster frequency, Internet penetration rate, number of disaster prevention facilities, perceived safety, number of medical doctors and financial independence of the borough)
156 Chapter 3

Conclusions
Vulnerability assessments have repeatedly proven that disasters discriminate on the same lines that societies discriminate against people. Just as risk is generally systemic and interconnected, so too are the drivers of risk. This is also true when it comes to vulnerability. Even children can recognize the interlinked effects of poverty, ill-health, poor employment prospects and social exclusion, but the ability to quantify and measure that multidi-mensional vulnerability is still immature. The use of quantitative markers, proxy indicators and extrapo-lated data shows the way forward.
“Vulnerable populations” are often identified with high risk. However, risk is not a defining character-istic of the situation. The simple characteristic of being a child or disabled or of a particular caste or economic group does not define the vulnerability. Vulnerability must be thought of in terms of vulner-ability to something. It is true that in many cases, realized risks may have contributed to their destitu-tion as their opportunities to cope with those risks were limited. In other words, personal characteris-tics can be linked to vulnerability, but not define it; it is precisely the correlations among vulnerability profiles and risks that vulnerability assessments can help determine.
Vulnerability assessments are conducted in an isolated manner, usually with the objective of supporting the targeting of a specific policy ques-tion or beneficiary population in development planning and in emergency contexts. Through pooling assessments by different organizations/actors, vulnerability analysis can enrich operational response and coverage for those left behind as coordinated data collection and communication of findings among different actors becomes more integrated into DRR strategies and provides a more coherent picture of the entire society in finer detail.
Systematic collection of rich survey and census data at a global level would propel the accuracy of targeting social safety net projects and emer-gency measures ahead by decades, in pursuit of SDGs and with the objective of enabling better
interventions to build social and economic resil-ience. Having good data on the coping mecha-nisms at the disposition of different classes of vulnerable people can help governments to better arrange for a more equitable repartition of public resources for social safety programming or to target development partner programming. The mutual and compounding value of fulfilling this simple act of governance in a systematic and thor-ough way unlocks resilience.
201 (Oulahen et al. 2015)202 (Park et al. 2016) 203 (IFRC 2018b)
157

4.1 Changes in technology and data sharing
Knowing where people and things are, and their relationship to each other, is essential for informed decision-making. Real-time information is useful to prepare for and respond to disasters. Location-based services are helping governments to develop strategic priorities, make decisions, and measure and monitor outcomes.
As identified by the Global Facility for Disaster Reduction and Recovery (GFDRR),204 for communi-ties and governments to build resilience to hazards, they must have access to information about disas-ter risk that is understandable and actionable. Advances in science, technology and innovation can further the understanding of disaster risk and help achieve this goal. Especially when a wide variety of stakeholders across the public, private, academic and NGO sectors form partnerships and work together.
Improvements in technology have been exponential since the publication of GAR15. This, coupled with the increased awareness and willingness to share data, information and data processing capabilities,
has enabled a greater understanding of global change and the ability to forecast how natural systems will respond to human activity and political decisions.
Ongoing efforts to engage the science and technol-ogy community in developing, implementing and providing data and services to the risk management community are being strengthened. This ensures that the DRR community benefits from the best possible scientific and technological advances and advice. One of the greatest areas of techno-logical enhancement has been in the availability of, and access to, computational processing power. This can be seen through the greater availability of supercomputers and virtual servers, which have increased the overall availability of cloud-based computing capabilities for hazard modelling. In turn, the data available has also improved. As an example, the ESA Copernicus satellite marks a significant improvement in globally available, open, high-resolution satellite imagery.
4.1.1 Hazard knowledge
Data collected on the Earth systems (climate, oceans, land and weather), as well as the societal systems (population location, density and vulner-ability), is a fundamental input for many of the
Chapter 4: Opportunities and enablers of change
158 Chapter 4

What isFAIR data?
FindableAccessible
ReusableInter-operable
calculations to permit a better understanding of the nature and drivers of risk.
The science and technology community have an essential role in the continual advancement of the understanding of hazards, exposure and vulnerability and its effect on reducing the risks to people, infrastructure and society. Satellites have a unique vantage point for monitoring many kinds of large-scale processes, from forest fires to over-flowing rivers, to earthquake-prone zones as well as patterns of human settlement, herd migration trends and degradation of coral reefs. Remotely sensed data can be provided in near real time. This can include maps, optical images or radar images that accurately measure the affected areas.
4.1.2 Open data
Open data can have many different interpretations and meanings. Here, open data is described as “data that can be freely used, re-used and redis-tributed by anyone – subject only, at most, to the requirements to attribute and share alike.”205
Open data policies have been shown to be an economic force enhancer for nations, with value created many times over and providing greater returns on investment through increased tax reve-nues on the products and services created with the data. Open data also meets society’s needs for
Figure 4.1. FAIR data is findable, accessible, interoperable and reusable
204 (GFDRR 2018a)205 (Open Data Handbook 2019)
ethical principles for accessing and using public data. Within the research and innovation sectors, open data can facilitate interdisciplinary, inter-institutional and international research. It also enables data mining for automated knowledge discovery among the growing amount of big data available to researchers and policymakers. Finally, open public data supports improved decision-making and enhances transparency in government and society.
An open science approach, complementing open data principles, is often followed by research and academic institutions. This works on the basis that data is as open as possible but recognizes that it can be closed if necessary. The findable, accessible, interoperable and reusable (FAIR)
(Source: UNDRR 2019: https://www.nature.com/articles/sdata201618)
159

data principles are also a core facet of open and exchangeable knowledge.
For data created with public funds or where there is a strong demonstrable public interest, open data should be the default. There are, of course, several reasons for keeping some data more proprietary or secret, and these need to be balanced against the benefits of openness outlined above. For example, proportionate exceptions include restrictions based on national security, law enforcement, personal pri-vacy and commercial proprietary concerns. Less well known and sometimes more relevant include the pro-tection of indigenous people’s rights, and the exact lo-cation of cultural artefacts or endangered species.206
There are movements advocating for open data. For example the Open Data for Resilience Initiative is designed to support teams of regional risk manage-ment specialists to build capacity and long-term ownership of open data projects. The creation of the global open data index also helps by ranking, at the State level, the various degrees to which data is openly available with a view to encouraging use of data from more open jurisdictions.
Some countries have open data policies, while others may have open policies but derive their funding through consulting, which places limita-tions on how open they can be. Protectionism remains a barrier to open sharing of tools, data and knowledge as people are naturally concerned for the long-term viability of their livelihoods and believe their competitive advantage is rooted in their access to the exclusivity of their knowledge.
There are some cases where the best available data is produced and owned by private companies. Private risk modelling in the private sector is also not open and is dominated by a few big companies that supply “black-box” models. These are models that – whether they are available for public use or not – do not divulge the nature of the calcula-tion used in the model. When data is made publicly available, it is often at least one version behind the most current; in some cases, it is simply not avail-able for free. This can then lead to the challenge of clear data accountability. If data is being used for
risk and hazard modelling, it needs to be accurate, trusted and reliable, leading to important questions about the provenance and refresh rates of data. Without clear information about the provenance, history and processing of a given data set, it is diffi-cult to determine how reliable it might be.
Advancements in open data provided from satel-lites have made more advanced models possible. Landsat and Copernicus are the two contemporary examples by the United States Geological Survey/NASA and ESA, respectively. Landsat provides the longest temporal records of moderate resolu-tion multispectral data of the Earth’s surface, while Copernicus is providing the highest-resolution imagery available openly and globally. In 2014, the Sentinel-1 mission provided a polar-orbiting, all-weather, day and night radar imaging mission for land and ocean services. In 2015, Sentinel-2A was launched followed by Sentinel-2B in 2017, provid-ing spatial resolutions of 10, 20 and 60 m. This has improved the resolution previously available and provides high-resolution imagery to be used in various hazard models. The fact that the data is open has resulted in a boom in scientific research based on satellite data.
The initial two Sentinel missions have since been joined by Sentinel-3 (which measures sea-surface topography, sea- and land-surface temperature, ocean colour and land colour) with high-end reli-ability that helps inform ocean forecasting systems and environmental and climate monitoring. Senti-nel-5P was launched in 2017 and provides data on air quality and climate. The variety of data avail-able from Copernicus through the Sentinel missions has revolutionized the scale of open source data available.
It is recognized that while open and available data is useful for many applications within disaster risk management, during an extreme event there is often the need for higher-resolution imagery. In this regard and with the sharing of relevant data enshrined in the International Charter on Space and Major Disasters, private sector providers can work with space agencies to provide timely and accurate data for disaster recovery.
160 Chapter 4

4.1.3 Open source software
Open source software can be described as the provision of source code that is available at no cost and for use by anyone for any purpose. The oppo-site of open source software is proprietary soft-ware, where a user normally must pay to access the software and abide by several restrictions in its use and distribution.
Open source software was rare 10 years ago, but it is now commonplace. Perhaps the greatest benefit of open source tools is their flexibility and evolv-ing capacity that develops as more people use and adapt the software for their specific needs. Shared software helps promote greater levels of understanding of hazards rooted in the same methodology.
Community-driven open source software is increas-ingly being used in government organizations, and there is a growing number of private sector compa-nies focused on providing technical support to open source software. This movement by governments to use open source software has gone a long way in overcoming barriers to adoption. As with any tech-nology, significant assessments need to be made on the total cost of ownership of open source soft-ware. While there may be an initial economic benefit from using open source software, it can be expen-sive to customize and maintain, as this is depen-dent on the community developing the software, and the knowledge of the user.
Future-proofing is also a consideration. With open source software, the software itself is less likely to be affected if the company behind its design closes. As other developers can simply pick up where the original ones left off, its sustainability is better ensured. The vision of future-proofing under-pins this philosophy. If the base information is avail-able and comprehensible broadly, the likelihood of continued interest in and research about the topic is more likely to continue. These systems empha-size testing and continuous integration where every change in the engine is reviewed by someone else
and can include a scientific review and publica-tion. When a change goes into the system, all tests are re-run. Having the whole processes visible and transparent ensures that if a bug is fixed, it will often result in improvements to the tests.
Open software and tools are becoming the software of choice within research institutions. In the early stages, open source implied a free but often primi-tive version of the commercial software. However, in the last few years, open source software has progressed exponentially and often represents best-in-class versions of scientific modelling tools. With the science rooted in open source tools, more users have access to them, enabling greater contributions and allowing their knowledge and research to feed back into improved development of the tool itself.
Not all software is open source, and their remains reliance on some proprietary software. Propri-etary software can have its benefits for organiza-tions using their own data and information for risk modelling, especially if it has been produced by a commercial enterprise and is for commercial use.
One area where open data and open source cross paths is in crowdsourcing. Growing interest in the use of crowdsourced data to solve certain kinds of data problems has led to the development of a number of layers in use within risk science. A notable example is the use of OpenStreetMap, which is foundational to almost all risk sciences. The Humanitarian OpenStreetMap Team has worked on several projects that use community volunteers to produce locally sourced context infor-mation. It is training volunteers to collect and code messages in a quality-controlled manner, feeding data to centres that can use it for better under-standing of a multitude of hazards. Because there is still some reluctance to rely on crowds to answer important contextual information about risk, expo-sure and vulnerability, these systems are supple-mented in some cases with “expert opinion” to reinforce the pedigree of the data.
206 (GEO 2015)
161

4.1.4 Interoperability
Interoperability may be defined as “the ability of a computer system of software to work with other systems or products without special effort on the part of the user.”207 The interoperability of data has technical, semantic and legal dimensions. From a technical standpoint, the data needs to have compatible formats and well-known quantities that make diverse data possible to integrate to form new data and products.208
From the semantic point of view, one of the main challenges to interoperability is contained within the metadata used to describe any given data set. When trying to combine data, challenges can be as simple as the native language of the data creator being different from the data user, meaning that it can be difficult to combine. Another semantic challenge can be with the naming conventions and descriptive terms used in different disciplines (or even subdisciplines). These issues of nomenclature are very important, especially for identifying and measuring risks and hazards.
Legal interoperability can be described as having occurred when multiple data sets from different sources have been merged, and users are able to access and use each of the different data sets without having to seek explicit authorization from each creator of the data.
It is not only the interoperability of data and systems that is important for disaster risk manage-ment. DRR is inherently interdisciplinary, and this is reflected in the discussions around cascading risks and hazards. Researchers and professionals often work in silos within their own disciplines. Improving the availability of knowledge and data can encour-age practitioners to think about the wider implica-tions of risk-informed decisions.
In terms of interoperability of model components, one suggestion is to bridge the gap between differ-ent hazards models using machine learning, leading to a harmonized model across hazards creating
a whole simulation model that produces global Earth simulations systems. This is a goal in the future, and could be a very useful policy and advo-cacy tool. However, it cannot be done at a scale that would make any sense beyond the global level at this stage. For models to inform risk reduction, preparedness and response efforts, they need to be at the local level. Machine learning may be able to assist in this, but it requires a lot of effort to ensure data is fed into the system in the right way. This is an area that is likely to expand in the future as multi-hazard risk continues to be considered.
For data to be used for disaster risk management, it must be discoverable, available, accessible and usable.209 Initiatives such as the United Nations Committee of Experts on Global Geospatial Infor-mation Management work on Geospatial Infor-mation and Services for Disasters highlight that during a crisis, the sharing of data about citizens and infrastructure among international organi-zation, NGOs and governments can be critically important.
In recent years, the impacts from natural hazards such as typhoons and hurricanes, as well as epidemics such as the Ebola outbreak in West Africa, have heightened the gaps in availability and access of data. The increasing need for data to be used in DRR and management has also highlighted challenges in coordination and collaboration among stakeholders. This led the United Nations Committee of Experts on Global Geospatial Infor-mation Management to create a Strategic Frame-work for Geospatial Information and Services for Disasters.
Successful implementation of the strategic frame-work will lead to an outcome where “the human, socioeconomic and environmental risks and impacts of disasters are prevented or reduced through the use of geospatial information and services.”210
The strategic framework builds on key documents such as the Sendai Framework and United Nations General Assembly Resolution 59/12, and calls for all Member States and other stakeholders to
162 Chapter 4
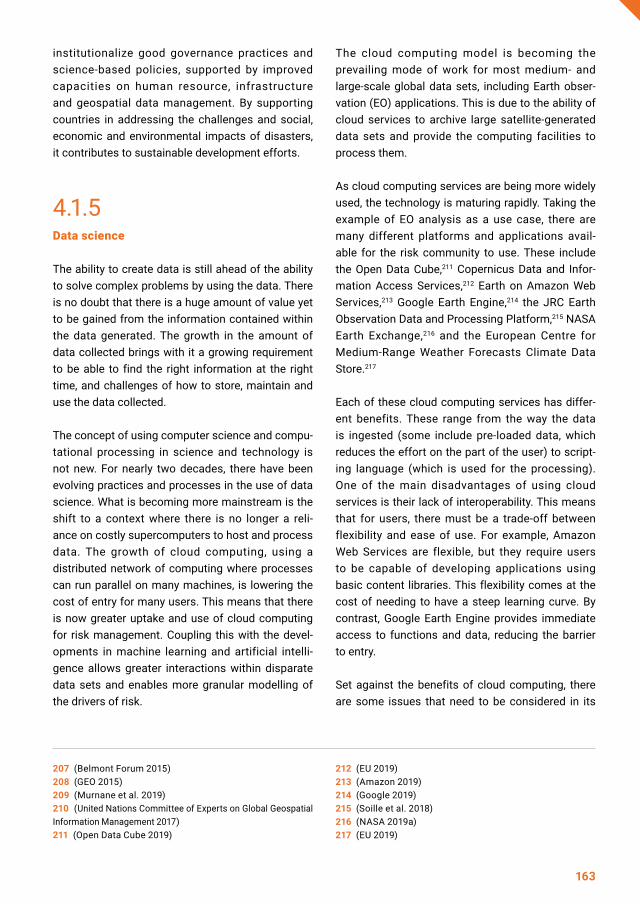
institutionalize good governance practices and science-based policies, supported by improved capacities on human resource, infrastructure and geospatial data management. By supporting countries in addressing the challenges and social, economic and environmental impacts of disasters, it contributes to sustainable development efforts.
4.1.5 Data science
The ability to create data is still ahead of the ability to solve complex problems by using the data. There is no doubt that there is a huge amount of value yet to be gained from the information contained within the data generated. The growth in the amount of data collected brings with it a growing requirement to be able to find the right information at the right time, and challenges of how to store, maintain and use the data collected.
The concept of using computer science and compu-tational processing in science and technology is not new. For nearly two decades, there have been evolving practices and processes in the use of data science. What is becoming more mainstream is the shift to a context where there is no longer a reli-ance on costly supercomputers to host and process data. The growth of cloud computing, using a distributed network of computing where processes can run parallel on many machines, is lowering the cost of entry for many users. This means that there is now greater uptake and use of cloud computing for risk management. Coupling this with the devel-opments in machine learning and artificial intelli-gence allows greater interactions within disparate data sets and enables more granular modelling of the drivers of risk.
The cloud computing model is becoming the prevailing mode of work for most medium- and large-scale global data sets, including Earth obser-vation (EO) applications. This is due to the ability of cloud services to archive large satellite-generated data sets and provide the computing facilities to process them.
As cloud computing services are being more widely used, the technology is maturing rapidly. Taking the example of EO analysis as a use case, there are many different platforms and applications avail-able for the risk community to use. These include the Open Data Cube,211 Copernicus Data and Infor-mation Access Services,212 Earth on Amazon Web Services,213 Google Earth Engine,214 the JRC Earth Observation Data and Processing Platform,215 NASA Earth Exchange,216 and the European Centre for Medium-Range Weather Forecasts Climate Data Store.217
Each of these cloud computing services has differ-ent benefits. These range from the way the data is ingested (some include pre-loaded data, which reduces the effort on the part of the user) to script-ing language (which is used for the processing). One of the main disadvantages of using cloud services is their lack of interoperability. This means that for users, there must be a trade-off between flexibility and ease of use. For example, Amazon Web Services are flexible, but they require users to be capable of developing applications using basic content libraries. This flexibility comes at the cost of needing to have a steep learning curve. By contrast, Google Earth Engine provides immediate access to functions and data, reducing the barrier to entry.
Set against the benefits of cloud computing, there are some issues that need to be considered in its
207 (Belmont Forum 2015)208 (GEO 2015)209 (Murnane et al. 2019)210 (United Nations Committee of Experts on Global Geospatial Information Management 2017)211 (Open Data Cube 2019)
212 (EU 2019)213 (Amazon 2019)214 (Google 2019)215 (Soille et al. 2018)216 (NASA 2019a)217 (EU 2019)
163

use. These include the recognition that the distribu-tion of available technology is rarely even, and that many areas still have challenges meeting the needs of basic electricity let alone the high-speed Internet connectivity required for accessing, sharing and processing large quantities of data. For this reason, it is often necessary for software developers to factor in the ability to function offline along with the capacity for downloading the required data sets, so models can be run locally. Access to electricity is a particular concern in an active disaster scenario, so the capacity to work offline is essential. Some models can take multiple days to run, and if power is cut or technology fails during that period, the model must be re-run, which costs valuable time and computing resources.
Large amounts of data (from traditional in situ sources as well as satellite sensors) are now being exchanged rapidly and across the globe by research-ers and practitioners in many different fields. The growing interdependence among traditional scien-tific disciplines leads to the practice that data collected in one discipline is likely to be used in other disciplines. This leads to the greater need of sharing of data for the advancement of science.218
One of the main benefits from the large amount of data that has been created from EO sensors and many other sources has been developments in automated knowledge discovery. The ease of access to computational processing power, as well as better access to data, has led to the develop-ment of machine learning techniques. As identified by GFDRR, with any new and emerging technolo-gies, there are many ambiguous and overlap-ping terminologies such as artificial intelligence, machine learning, big data and deep learning.219 For this purpose, it is accepted that the terms are interchangeable.
Risk management is no exception to the use of machine learning, and there are new applications and uses continually being developed. Many of the uses of machine learning within disaster risk management focus on the improvement of the different components of risk modelling, such as exposure, vulnerability, hazard and risk.
Machine learning is moving beyond hard-coded algorithms to algorithms that continually learn and update themselves. This is facilitated by the development of methods where a machine may be instructed to seek information within large quanti-ties of apparently unstructured data.220 Although recent developments are delivering very power-ful machine learning algorithms, it is important to remember that a model is only as good as the data used within it.
4.2 Conclusions
It is clear from recent developments that open data and analysis, shared and interoperable software, computing power and other technology, are the technical enablers of improved data science, risk assessment and risk modelling. For their success, they also rely on the willingness of people to work with other disciplines, across cultural, language and political boundaries, and to create the right regulatory environment for new and urgent work to proceed.
218 (Kunisawa 2006)219 (GFDRR 2018b)220 (UN-GGIM 2015)
164 Chapter 4

Overwhelmingly, the shift to the Sendai Framework has ushered in a period of methodologically compli-cated but ultimately accurate thinking and working about reducing risk. Examples of extraordinary advances in technological ability, openness, integra-tion and mutual support inspire hope for the future. However, significant challenges remain.
There are still mainstream journals and newspa-pers that publish articles about natural disasters (a term long-abandoned by the risk community – with emphasis on the tagline “disasters are not natural”). There are still those who would prefer to think of risk as a function only of hazard, with very limited perspectives on exposure and vulnerability. There are those who would prefer to see familiar risk metrics like PML attributed to each country, and are not bothered at how limited a picture of risk that presents.
There are still serious challenges related to how to calculate, characterize or depict certain kinds of data. The most obvious is the challenge with presenting probability of non-probabilistic hazards –many of which have already been outlined in this GAR – or of characterizing the vulnerability of people or assets to different hazards.
There are still challenges related to prioritization of risk reduction in the grand scheme of public invest-ment and development planning. There are chal-lenges related to the politicization of certain kinds
Chapter 5: Challenges to change
of risk and risk-reducing actions, and there are chal-lenges related to the resources required to face risk in a meaningful way.
5.1 Mindset challenges
There is growing interest to show the links among hazards, particularly hazards affected by climate change and their threat to human security through impacts on economies and livelihoods. However, the connection is complex. While water scarcity and food insecurity have been shown to play roles in displacement and unstable livelihood conditions, little is known about the strength of those relation-ships. Researchers are still grappling with how to ascertain specific drivers in ways that inform delib-erate action.
The highly varied and complex nature of hazards dictates the need for continuous efforts by experts and authorities to reduce the risks of disaster that can affect human health, infrastructure and envi-ronmental resources. Ageing infrastructure and weak institutional and infrastructural capacities pose a challenge to risk management in many regions of the world. Industrial safety is not always
165

high on political agendas, and human error comes into play when companies and authorities become complacent. Multidisciplinary cooperation across authorities is key to strengthening industrial safety governance with prevention at the forefront. Some countries, including large industrialized ones, are yet to establish dedicated disaster prevention and preparedness programmes and protocols. In the case of industrial safety, the number of Parties to the Industrial Accidents Convention has risen to 41 and the National Implementation Reports show progress over time. Past accidents have highlighted that transboundary cooperation on accident preven-tion and transboundary water pollution require greater attention.
The recommendation of the OECD Council on the governance of critical risks, adopted by Ministers in May 2014, recommends that “Members estab-lish and promote a comprehensive, all-hazards and transboundary approach to country risk governance to serve as the foundation for enhancing national resilience and responsiveness.”221 Every disaster has had an enormous impact on enhancing aware-ness and safety. Lessons learned have been care-fully identified and are incorporated in the regimes worldwide. However, it is important to keep in mind the overarching conclusion of the root causes of the disasters as being cultural and institutional.222 The follow-up of INSAG emphasizes that “to achieve high levels of safety in all circumstances and against all challenges, the nuclear safety system in its entirety must be robust.”223 But if catastrophic failure is the most reliable driver of change, it is clearly not a sufficiently proactive mindset.
Building a comprehensive, all-hazards and trans-boundary approach to risk governance is not an easy endeavour. There is an increased aware-ness of the importance of establishing such an approach, with Japan being one of the leading examples. At the international level, this GAR repre-sents a milestone in the efforts to develop global overview of risk trends and risk management. Finally, the NEA report represents a major mile-stone for the nuclear sector in contributing to the all-hazards mindset.224
The Sendai Framework is a first step to fostering increased awareness of all risk and multi-stake-holder collaboration to better manage risk. Inte-gration of anthropogenic risks in the GAR and the GRAF will bring international attention to this topic and will change public perspectives on reducing these kinds of risks.
5.2 Political challenges
The rapid rate of urbanization happening world-wide poses a wide range of challenges for governments, industry and other stakeholders in preventing and managing the risks and impacts associated with hazardous industrial facilities. Socioeconomic pressures to develop land for housing or other uses in hazard-prone areas is increasing. Some major incidents such as that at the port of Tianjin in China (2015) are a reminder that the effects can often be rendered more severe due to the absence of appropriate safety measures. It is a delicate challenge to balance the needs and demands of society and make best use of available tools to address risks.
The reduction of risk rarely features high on national political agendas. On the one hand, the risk of complacency in countries with a seemingly high level of safety standards may hamper the priority of this policy area. On the other hand, a predominant focus on economic development in other countries contributes to the lack of political visibility given to hazard or risk prevention and preparedness poli-cies. The Sendai Framework presents an opportu-nity in this respect – to raise the profile of all risk reduction and convince policymakers of the need to continue and step up investments in prevention – rather than bearing the cost of inaction.
166 Chapter 5

The Macondo blowout and explosion of an offshore oil drilling well in the Gulf of Mexico caused 11 deaths and 16 critical injuries. It dumped approximately 5 million barrels of oil into the Gulf of Mexico. In its study of the Macondo accident, the Deepwater Horizon Study Group noted that it was marked by orga-nizational failures including:
Box 5.1. Macondo, United States of America, 2010
Figure 5.1. Envisat image of oil spilling into the Gulf of Mexico off the coast of the United States of America, on 22 April 2010; the oil spill is visible as a dark purple whirl at centre bottom
221 (OECD 2014b)222 (IAEA 2015b); (IAEA 2017a)
223 (IAEA 2017)224 (NEA 2018b)
(Source: ESA 2010 and Nadeau, P H. (2015).
a. Multiple system operator malfunctions during a critical period in operations
b. Not following required or accepted opera-tions guidelines (“casual compliance”)
c. Neglected maintenance
d. Instrumentation that either did not work properly or whose data interpretation gave false positives
e. Inappropriate assessment and management of operations risks
f. Multiple operations conducted at critical times with unanticipated interactions
g. Inadequate communications between members of the operations groups
h. Lack of awareness of risks
i. Diversion of attention at critical times
j. Culture with incentives that provided increases in productivity without commen-surate increases in protection
k. Inappropriate cost and corner cutting
l. Lack of appropriate selection and training of personnel
m. Improper management of change
167

5.3 Technological challenges
While probabilistic models have been in develop-ment for decades, there is a lack of consolidated risk analysis methodologies and tools. Extensions to traditional industrial risk analysis are needed to consider the characteristics of anthropogenic and other non-probabilistic events. The risks are there-fore not adequately considered in deterministic risk assessment. As a clear understanding of the full nature of risk is suboptimal, preparedness levels are low, even in countries generally considered well prepared for disasters.
Data availability is the bottleneck in understanding many hazards. Data is the basis for gaining knowl-edge on the dynamics of risk, and is crucial for risk assessment, scenario planning and risk reduction practice. Data (un) availability is driven by a variety of factors. In natural-disaster situations, chained events like NATECH disasters are often overlooked, and their importance is recognized only when the full brunt of their impact becomes visible in terms of medium- to long-term health effects, persistent water and soil pollution, and major economic losses due to clean-up and recovery. An additional reason for data unavailability is that information on tech-nological risks is often considered confidential and is closely held by industry or as a matter of national security. In many countries, there is no register of disaster impact, and often regulators do not even know the number, activity type and location of hazardous installations in a country’s territory. Also, there is a tendency among operators of hazardous installations to avoid voluntarily disclosing informa-tion about accidents or near misses in their estab-lishments to avoid negative repercussions on their activity.225
Another contributing factor to the scarcity of data is the loss of stakeholder interest in the risk once media attention abates. This usually goes together
with a redefinition of priorities and a subsequent drop in resources available for mitigating a specific risk. Economic pressures are a powerful factor in decision-making, especially for activities and loca-tions where profit margins are poor or in coun-tries suffering from other governance challenges. Economic constraints can lead to intentional or unintentional bad decision-making where, for example, productivity gains or the optimization of operational efficiency are prioritized over possible safety concerns.226 In some cases, the failure to implement adequate risk management solutions can also be attributed to economic drivers, for example when resources are stretched, and other risks are perceived as more critical. The quality of information in loss databases is not uniform, and exhibits different levels of detail and accuracy. The level of detail is particularly heterogeneous for anthropogenic hazards.
Vulnerability remains a weak component in hazard models. As noted in previous chapters, with few exceptions, vulnerability has – until recently – been examined largely in terms of physical vulner-ability only. Socioeconomic vulnerability is much more complicated, and its inclusion in models will require clearer definitions, different kinds of data and a series of delicate decisions about what can be modelled. It is also a dynamic variable depend-ing on the scenario; for example, in epidemics, any given disease is usually identified as affect-ing certain groups faster and more severely than others. Validation of models is also a technical challenge. Satellites can provide a great deal of information for certain kinds of risk information, but the models need to be validated with ground-based evidence, which requires resources. Finding answers at one scale by extracting them from a much larger scale risks the validity of the conclu-sions if not done very carefully. The use of proxies – imperfect functions to characterize elements for which no accurate measurement is possible – is a popular way of enriching risk models, but this practice risks the credibility and defensibility of the results. Ground-truth exercises are becoming a standard requirement, as are requests for validation of climate change impact at the local level.
168 Chapter 5

5.4 Resource challenges
Foreseeable disasters continue to happen in coun-tries with generally high levels of risk awareness and advanced risk management capacities. The situation is even more challenging in the develop-ing world where the foundational facilities, techni-cal competencies and computing capacity are often lacking, leaving decision makers ill-prepared to understand risk on their own terms. Moreover, low-income countries often struggle to access financial support, particularly as risk reduction often falls outside the humanitarian funding stream.
In the case of an active disaster situation, manag-ing impact on the population and built environ-ment while having to respond to a chained hazard event precipitated by the first event inevitably leads to competition for scarce response resources.227 For example, after the 1999 Kocaeli earthquake in Turkey, about half of Izmit fire department’s human resources were sent to fight the fire at a burning oil refinery instead of being available to support search and rescue for earthquake victims.228 This becomes complicated because the consequences of the secondary event could include the risk of toxic releases, fires or explosions that would hamper emergency-response activities and exacerbate impact by endangering the first responders.229
5.5 Conclusions
An important paradigm shift has been taking place in risk communication towards integrated and participatory processes, which are often challeng-ing to manage in practice. Risk communication cannot be viewed as an afterthought to risk assess-ment and decision-making. Risk information and warnings are likely to be questioned by populations who are anxious about the decisions they are being asked to make related to the risk. If people are asked to evacuate to uncomfortable shelters, they will want good reasons for this. Their criteria may not emphasize accurate scientific evidence or may they interpret it differently to risk researchers. The involvement of a wider community in risk assess-ment, management and mitigation would improve risk literacy, benefiting authors and readers, there-fore ensuring that risk communication is more effective, and that people’s questions about risk are addressed.
The following challenges require direct attention and action:
225 (Krausmann, Cruz and Salzano 2017)226 (Wood et al. 2017)227 (Necci et al. 2018)
228 (Cruz et al. 2004) 229 (Girgin 2011)230 (IRGC 2015)
• Awareness: Further educational and awareness-raising campaigns are needed to help stake-holders recognize vulnerability to hazards.
• Risk governance: Risk governance should be approached in a holistic way. Also, private sector and government need to have the incen-tives and modes that facilitate sharing the responsibility and cost of risk. IRGC proposes an innovative risk governance framework and guidelines on how to address emerging risks.230
169

• Legal infrastructure: As experience shows that risk reduction works best if required by law, specific legislation for risk reduction should be enacted and enforced. This needs to be accompanied by guidance on how to achieve the goals set out in the legal framework to help industry be compliant and to support authorities in assessing if undertaking has met the associ-ated safety objectives. A liability and compensa-tion framework is also required.
• Risk communication: Communication at all levels should be improved to ensure that infor-mation on risks flows freely and effectively across all of society. Better exchange of and access to risk management resources should also be guaranteed.
• Risk assessment: Research should focus on the development of methodologies and tools for risk assessment and mapping. For this purpose, better loss and damage functions are needed for all hazards. Human, environmental and eco-nomic impacts should also be assessed, with the latter two often being neglected.
• Data collection: The easy and free sharing of relevant data on all risks, disaster events and even near misses should be promoted and facilitated to support learning from past events for prevention and mitigation. Data exchange should ideally also happen among sectors and countries.
• Cooperation and partnerships: Cooperation among all stakeholders, particularly at the local level, is essential for reducing risks. Public–pri-vate partnerships, and regional and international networks should be fostered that facilitate col-laboration for effective risk management.
170 Chapter 5

231 (UNISDR 2011a)232 (UNISDR 2011a)233 (van Lanen et al. 2017); (UNESCO 2016)234 (Spinoni et al. 2018); (IPCC 2014)235 (Wilhite 2014); (Wilhite, Sivakumar and Pulwarty 2014)236 (Wilhite 2014); (Global Water Partnership Central and Eastern Europe 2015)
Among the weather-related natural hazards, drought is probably the most complex and severe due to its intrinsic nature and wide-ranging and cascading impacts. It affects agricultural production, public water supply, energy production, transportation, tourism, human health, biodiversity, natural ecosys-tems, etc. Droughts are recurrent; they can last from a few weeks to several years, and can affect large areas and populations. The related impacts develop slowly, are often indirect and can linger for long times after the end of the drought. While the impacts result in severe economic losses, envi-ronmental damage and human suffering, they are generally less visible than the impacts of other natural hazards (e.g. floods and storms) that cause immediate and structural damages, which are clearly linked to the hazard and quantifiable in economic terms.231 Therefore, the drought risk is often underestimated and remains a “hidden” hazard.232 Proactive drought risk management is still not a reality in most parts of the world.
Drought-related fatalities mainly occur in poor coun-tries. However, in wealthy countries, people suffer from indirect effects such as heat stress or dust, leading to a variety of health impacts.233 Examples are persistent unemployment, migration and social instability related to failures in public water supply, food insecurity and potential conflict.
Drought is likely to become more frequent and severe in the twenty-first century in many regions of
Chapter 6: Special section on drought
the world.234 A better understanding of the physical processes leading to drought, its propagation, the societal and environmental vulnerability to drought and its impacts are more important than ever. The key challenge is to move to the widespread adop-tion of proactive risk management strategies.235 This includes the analysis of past trends and future projections of drought, as well as analysis of the societal and environmenttal exposure and vulner-ability. All determine drought risk, which can be managed by developing policies and management plans that are adapted to the local context.236
Droughts are a recurring feature and are defined with respect to the long-term average climate of a given region. They should be distinguished from aridity, a seasonally or fully dry climate (e.g. desert) and from water scarcity, a situation where the climatologically available water resources are insufficient to satisfy long-term average water requirements. A megadrought is a very lengthy and pervasive drought, lasting much longer than normal, usually a decade or more.
171

Depending on the effect in the hydrological cycle and the impact on society and environ-ment, different drought types can commonly be distinguished:
1. Meteorological drought is a period of months to years with a deficit in precipitation or climatological water balance (i.e. precipi-tation minus potential evapotranspiration) in a given region. The deficit is defined with respect to the long-term climatology. These droughts are often accompanied by above-normal temperatures and precede and cause other types of droughts. Meteorological drought is caused by persistent anomalies in large-scale atmospheric circulation patterns, which are often triggered by anomalous
tropical sea-surface temperatures or other remote conditions.
2. Soil moisture (agricultural) drought is a period with reduced soil moisture that results from below-average precipi tation. This impinges on crop production, causes land degradation and affects ecosystem function in general.
3. Hydrological drought occurs when river stream flow and water storage in aquifers, lakes or reservoirs fall below long-term mean levels. Hydrological drought develops slowly because it involves stored water that is depleted but not replenished. Time series of these variables are used to analyse the occur-rence, duration and severity of hydrological droughts.
Box 6.1. Drought types
While a lack of precipitation often triggers drought, other factors, including more-intense but less-frequent precipitation, soil moisture conditions, poor water management and soil erosion, can also cause or enhance these droughts. Overgrazing, for example, led to elevated erosion and dust-storms that amplified the “Dust Bowl” drought of the 1930s over the Great Plains in North America.237 Droughts threaten human security because they undermine livelihoods, compromise culture and individual identity, and increase migration. As they can also undermine the ability of States to provide the conditions necessary for human security. Droughts may influence some or all the factors at the same time. Situations of acute insecu-rity, such as famine and sociopolitical instability, usually emerge from the interaction of multiple factors. The conflict in the Syrian Arab Republic is a clear example of how drought could acceler-ate instability.238,239 For many populations that are already socially marginalized, resource dependent and have limited capital assets, human security will be progressively undermined. In such cases, sequences of smaller magnitude droughts can have disproportionate impacts.
6.1 Drought indicators
Different drought types require different indicators for their characterization. The World Meteorological Organization (WMO) and the Global Water Partner-ship (GWP) published an overview on widely used drought indicators.240 The standardized precipita-tion index (SPI) and the standardized precipitation-evapotranspiration index (SPEI),241,242 for example, are well known for meteorological drought analy-sis. Indicators related to soil moisture such as the drought severity index243 or the Palmer drought severity index244 aim to characterize drought impact in terms of plant water stress. Hydrologi-cal indicators such as flow percentiles are used to quantify the volume of water deficit in rivers and reservoirs.245 Finally, indicators based on remote sensing, such as the normalized-difference vegeta-tion index or the fraction of absorbed photosyntheti-cally active radiation, are used to monitor drought effects on vegetation.
172 Chapter 6
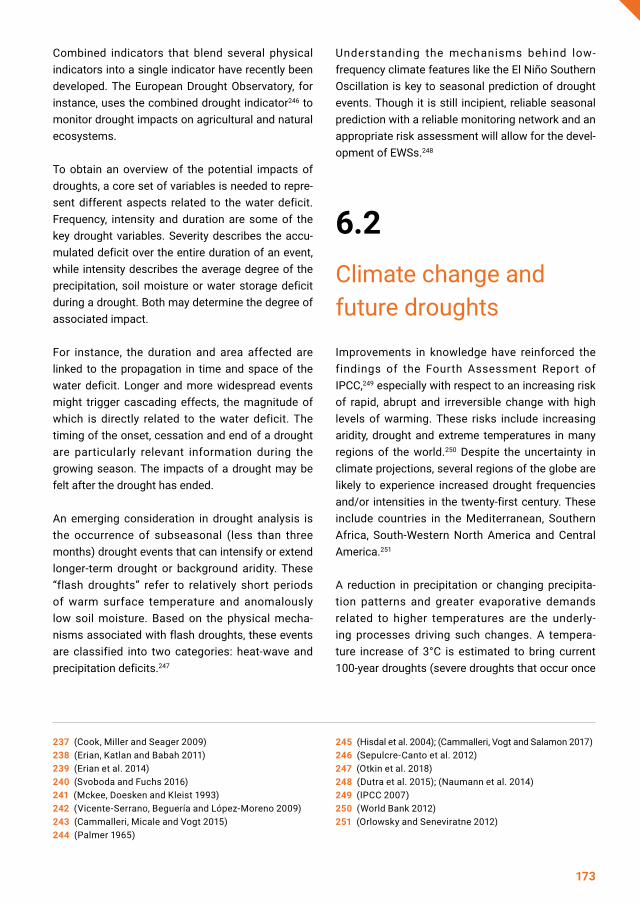
Combined indicators that blend several physical indicators into a single indicator have recently been developed. The European Drought Observatory, for instance, uses the combined drought indicator246 to monitor drought impacts on agricultural and natural ecosystems.
To obtain an overview of the potential impacts of droughts, a core set of variables is needed to repre-sent different aspects related to the water deficit. Frequency, intensity and duration are some of the key drought variables. Severity describes the accu-mulated deficit over the entire duration of an event, while intensity describes the average degree of the precipitation, soil moisture or water storage deficit during a drought. Both may determine the degree of associated impact.
For instance, the duration and area affected are linked to the propagation in time and space of the water deficit. Longer and more widespread events might trigger cascading effects, the magnitude of which is directly related to the water deficit. The timing of the onset, cessation and end of a drought are particularly relevant information during the growing season. The impacts of a drought may be felt after the drought has ended.
An emerging consideration in drought analysis is the occurrence of subseasonal (less than three months) drought events that can intensify or extend longer-term drought or background aridity. These “flash droughts” refer to relatively short periods of warm surface temperature and anomalously low soil moisture. Based on the physical mecha-nisms associated with flash droughts, these events are classified into two categories: heat-wave and precipitation deficits.247
Understanding the mechanisms behind low-frequency climate features like the El Niño Southern Oscillation is key to seasonal prediction of drought events. Though it is still incipient, reliable seasonal prediction with a reliable monitoring network and an appropriate risk assessment will allow for the devel-opment of EWSs.248
6.2 Climate change and future droughts
Improvements in knowledge have reinforced the findings of the Fourth Assessment Report of IPCC,249 especially with respect to an increasing risk of rapid, abrupt and irreversible change with high levels of warming. These risks include increasing aridity, drought and extreme temperatures in many regions of the world.250 Despite the uncertainty in climate projections, several regions of the globe are likely to experience increased drought frequencies and/or intensities in the twenty-first century. These include countries in the Mediterranean, Southern Africa, South-Western North America and Central America.251
A reduction in precipitation or changing precipita-tion patterns and greater evaporative demands related to higher temperatures are the underly-ing processes driving such changes. A tempera-ture increase of 3°C is estimated to bring current 100-year droughts (severe droughts that occur once
237 (Cook, Miller and Seager 2009)238 (Erian, Katlan and Babah 2011)239 (Erian et al. 2014)240 (Svoboda and Fuchs 2016)241 (Mckee, Doesken and Kleist 1993)242 (Vicente-Serrano, Beguería and López-Moreno 2009)243 (Cammalleri, Micale and Vogt 2015)244 (Palmer 1965)
245 (Hisdal et al. 2004); (Cammalleri, Vogt and Salamon 2017)246 (Sepulcre-Canto et al. 2012)247 (Otkin et al. 2018)248 (Dutra et al. 2015); (Naumann et al. 2014)249 (IPCC 2007)250 (World Bank 2012)251 (Orlowsky and Seneviratne 2012)
173

every 100 years) to around 30% of the emerged lands on a 10-year basis.252
These scenarios suggest that drought risk will increase for many economic sectors and vulnerable regions unless appropriate climate change miti-gation and adaptation measures are taken. Many regions in the world with high population densities and vulnerable societies that rely on local agricul-tural production could experience significant losses because of droughts.
Studies after the IPCC Fourth Assessment Report indicate that there is medium confidence in a projected increase in duration and intensity of
droughts in some regions of the world, including Southern Europe and the Mediterranean region, Central Europe, Central North America, Central America and Mexico, North-East Brazil and South-ern Africa. Decreases in soil moisture are likely in several regions, particularly in Central and South-ern Europe, and Southern Africa. For a range of scenarios, soil moisture droughts lasting four to six months double in extent and frequency, and droughts longer than 12 months become three times more common, between the mid-twentieth century and the end of the twenty-first century.253 A decrease in soil moisture can increase the risk of extreme hot days and heat-waves.254
Figure 6.1. Drought severity according to SPI-12 (left) and SPEI-12 (right). Top panels show the cumulative severity for the period 1981–2010, bottom panels show the difference between the periods 1951–1980 and 1981–2010. Grey zones represent masked cold and desert areas.
Disclaimer: The boundaries and names shown and the designations used on this map do not imply official endorsement or accep-tance by the United Nations.(Source: JRC 2018)
174 Chapter 6
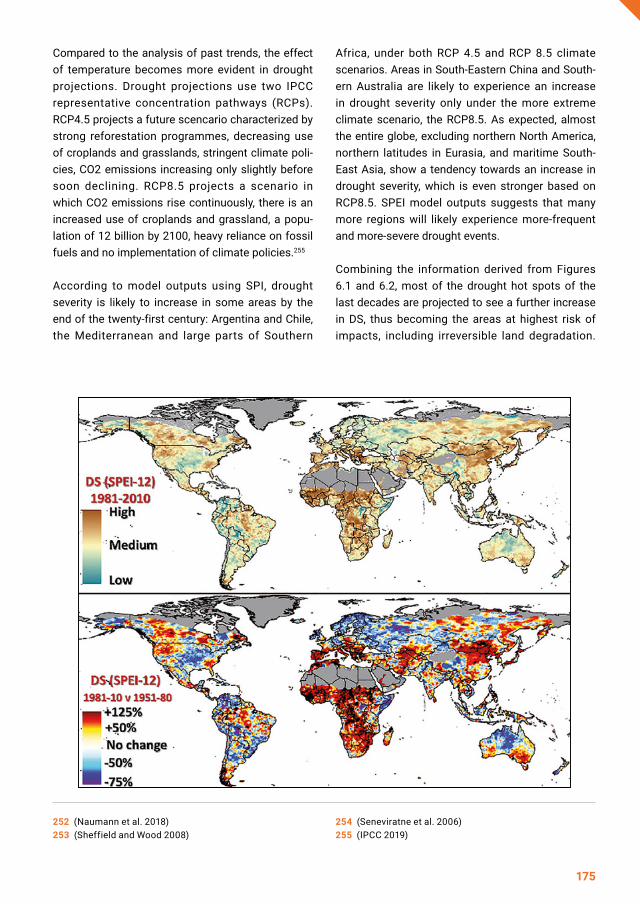
Compared to the analysis of past trends, the effect of temperature becomes more evident in drought projections. Drought projections use two IPCC representative concentration pathways (RCPs). RCP4.5 projects a future scencario characterized by strong reforestation programmes, decreasing use of croplands and grasslands, stringent climate poli-cies, CO2 emissions increasing only slightly before soon declining. RCP8.5 projects a scenario in which CO2 emissions rise continuously, there is an increased use of croplands and grassland, a popu-lation of 12 billion by 2100, heavy reliance on fossil fuels and no implementation of climate policies.255
According to model outputs using SPI, drought severity is likely to increase in some areas by the end of the twenty-first century: Argentina and Chile, the Mediterranean and large parts of Southern
Africa, under both RCP 4.5 and RCP 8.5 climate scenarios. Areas in South-Eastern China and South-ern Australia are likely to experience an increase in drought severity only under the more extreme climate scenario, the RCP8.5. As expected, almost the entire globe, excluding northern North America, northern latitudes in Eurasia, and maritime South-East Asia, show a tendency towards an increase in drought severity, which is even stronger based on RCP8.5. SPEI model outputs suggests that many more regions will likely experience more-frequent and more-severe drought events.
Combining the information derived from Figures 6.1 and 6.2, most of the drought hot spots of the last decades are projected to see a further increase in DS, thus becoming the areas at highest risk of impacts, including irreversible land degradation.
252 (Naumann et al. 2018)253 (Sheffield and Wood 2008)
254 (Seneviratne et al. 2006)255 (IPCC 2019)
175

Figure 6.2. Drought severity (DS) to SPI-12 (left) and SPEI-12 (right). All panels show the difference in percentage between 1981–2010 and 2071–2100 under RCP4.5 (top) and RCP8.5 (bottom) scenarios. Light grey zones represent areas in which less than two thirds of the simulations agree on the sign of change. Dark grey zones represent the cold and desert masked areas.
(Source: JRC 2018)Disclaimer: The boundaries and names shown and the designations used on this map do not imply official endorsement or accep-tance by the United Nations.
The regions where a continuous increase in DS is projected, according to moderate and high-emis-sion scenarios (RCP4.5 and 8.5) are Argentina and Southern Chile, the Mediterranean region and large parts of Southern Africa. Higher temperatures are likely to exacerbate droughts in these areas.
6.3 Assessing global drought risk
The term “risk” and the related terms of “hazard”, “exposure” and “vulnerability” have been used and defined in different ways within the scientific community, with notable differences between the DRR and the climate change adaptation (CCA) communities.256 They base their analysis on two theoretical frameworks, commonly referred to as
176 Chapter 6
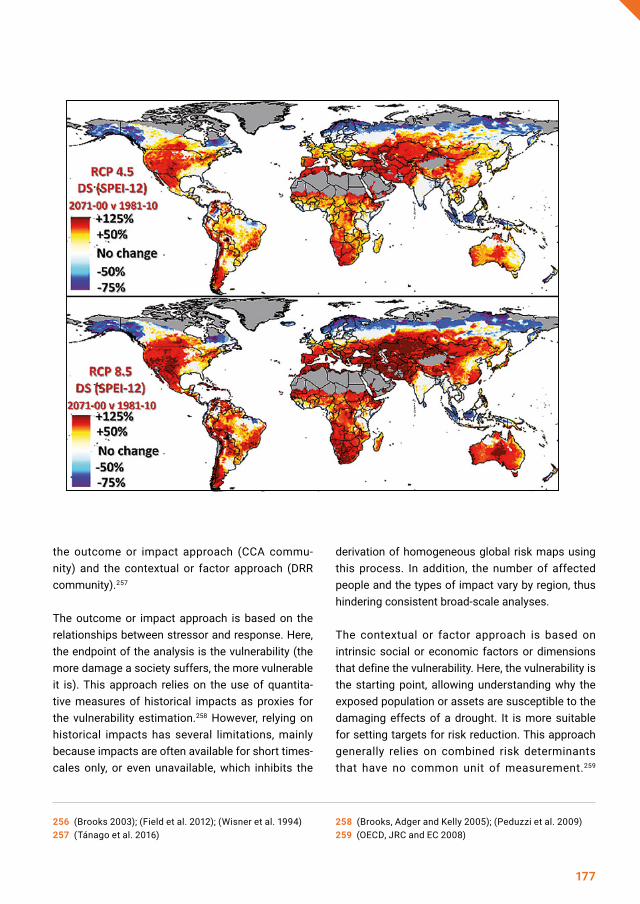
the outcome or impact approach (CCA commu-nity) and the contextual or factor approach (DRR community).257
The outcome or impact approach is based on the relationships between stressor and response. Here, the endpoint of the analysis is the vulnerability (the more damage a society suffers, the more vulnerable it is). This approach relies on the use of quantita-tive measures of historical impacts as proxies for the vulnerability estimation.258 However, relying on historical impacts has several limitations, mainly because impacts are often available for short times-cales only, or even unavailable, which inhibits the
derivation of homogeneous global risk maps using this process. In addition, the number of affected people and the types of impact vary by region, thus hindering consistent broad-scale analyses.
The contextual or factor approach is based on intrinsic social or economic factors or dimensions that define the vulnerability. Here, the vulnerability is the starting point, allowing understanding why the exposed population or assets are susceptible to the damaging effects of a drought. It is more suitable for setting targets for risk reduction. This approach generally relies on combined risk determinants that have no common unit of measurement.259
256 (Brooks 2003); (Field et al. 2012); (Wisner et al. 1994)257 (Tánago et al. 2016)
258 (Brooks, Adger and Kelly 2005); (Peduzzi et al. 2009)259 (OECD, JRC and EC 2008)
177

260 (UNDP 2004)261 (Carrão, Naumann and Barbosa 2016)
The resulting values are not an absolute measure of economic loss or damage to the society or the environment, but a relative statistic that provides a regional ranking of potential impacts, which can serve to prioritize actions for reinforcing disaster management and adaptation plans.
Both approaches represent alternative but comple-mentary ways for drought risk estimation at differ-ent scales. As drought impacts are context specific and vary geographically, regression models (i.e. the outcome approach) are important for developing preparedness plans and mitigation activities from local to national scales, while composite indicators (i.e. the contextual approach) can identify generic leverage points for reducing impacts at the regional to global scales.
For a global assessment, a contextual approach is adopted. This defines risk as a function of the natural hazard, the exposed assets and the inher-ent vulnerability of the exposed social or natural system. Following this definition, the risk of incur-ring losses from a drought depends on the combi-nation of DS and the probability of occurrence, the exposed assets and/or people, and their vulnerabil-ity or capacity to cope with the hazard.
End users, water managers and policymakers rely on drought risk assessments to better protect popu-lations from shocks and to develop management plans to reduce impacts. Therefore, drought risk assessments should include information tailored to the needs of specific users. This information should answer questions about where and which entities are more likely to be affected. As exposure and vulnerability vary between economic sectors (e.g. agriculture, public water supply, energy production, inland water transport, tourism and public health) and different ecosystems, drought risk assess-ments need to be sector specific.
6.4
Assessing the risk for agriculture and other primary sectors
This section presents an example of a global drought risk assessment with emphasis on agricul-tural and primary sector impacts, which are relevant at the global scale. The assessment is based on the conceptual approach proposed by UNDP.260,261 It includes the assessment of the hazard, the expo-sure and the societal vulnerability, which are then combined to arrive at an assessment of the risk for significant impacts due to droughts. The individual steps are explained in the following subsections.
6.4.1 Assessing the hazard
Precipitation can be used as a proxy indicator of the water available to the coupled human–envi-ronment system.262 The frequency and intensity of precipitation deficits, therefore, can represent the drought hazard for a given area. However, increas-ing temperatures and evaporative demand is now better understood to affect available water supplies.
262 (Svoboda et al. 2002)
178 Chapter 6

Figure 6.3. Global drought hazard according to the weighted anomaly of standardized precipitation (WASP) index: (a) hazard, (b) exposure and (c) vulnerability
(a)
(Source: JRC 2018)
(b)
(Source: JRC 2018)
179

(Source: JRC 2018)Disclaimer: The boundaries and names shown and the designations used on these maps do not imply official endorsement or acceptance by the United Nations.
In the present assessment, drought hazard was estimated as the probability of exceedance of the median of global severe precipitation deficits for a historical reference period (1901–2010) (Figure 6.3(a)). The severity of the precipitation deficit is computed by means of the WASP index.263 The WASP index was selected because it: is standard-ized in time and space; allows confining the influ-ence of large standardized anomalies that result from small precipitation amounts occurring near the beginning or end of dry seasons; and empha-sizes anomalies during the rainy season when crops are more sensitive to water fluctuations.
6.4.2 Assessing the exposure
Meaningful information about the exposure is related to the entities, assets, infrastructures, agri-cultural land and people located in a drought-prone area. The model of drought exposure as applied
for this GAR is computed and validated based on spatially explicit geographic layers. This approach to drought exposure is comprehensive and consid-ers the spatial distribution of several physical elements (proxy indicators) characterizing agricul-ture and primary sector activities,264 namely: crop areas (agricultural drought), livestock (agricultural drought), industrial/domestic water stress (hydro-logical drought) and human population (socioeco-nomic drought).
This approach proposes a non-compensatory model to combine the different proxy indicators of drought exposure. Using this methodology, superiority in one indicator cannot be offset by an inferiority in another indicator. Thus, a region is highly exposed to drought if at least one type of asset is abundant there. For example, a region that is completely covered by rain-fed crops is fully exposed to drought, independent of the presence of other elements at risk.
(c)
180 Chapter 6

(Source: JRC 2018)
(a)
Figure 6.4. (a) Global distribution of livestock in number per grid cell, (b) global agricultural lands, in per cent croplands per grid cell, (c) Global human settlement population estimates for 2015. Distribution and density of population, in number of people per grid cell, and (d) baseline water stress: total annual water withdrawals (municipal, industrial and agricultural), as a percentage of the total annual available flow.
263 (Lyon and Barnston 2005) 264 (Carrão, Naumann and Barbosa 2016)
(b)
(Source: JRC 2018)
181
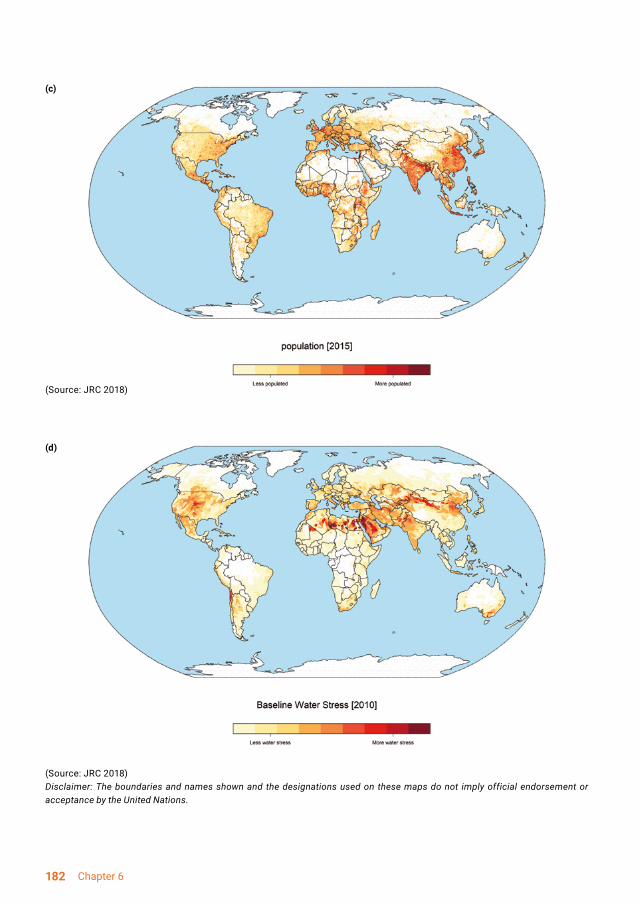
(Source: JRC 2018)Disclaimer: The boundaries and names shown and the designations used on these maps do not imply official endorsement or acceptance by the United Nations.
(d)
(Source: JRC 2018)
(c)
182 Chapter 6

6.4.3 Assessing the vulnerability
Vulnerability assessments are a key component of any drought risk estimation as they support the design of mid- and long-term preparedness actions to target sectors or more sensitive populations. Particularly, interventions to reduce drought impact should be oriented towards mitigating the vulner-ability of human and natural systems.
In the present framework, vulnerability to drought is represented by a multidimensional model composed of social, economic and infrastructural factors. Social vulnerability is linked to the level of well-being of individuals, communities and society. Economic vulnerability is highly dependent upon the economic status of individuals, communities and nations. Infrastructural vulnerability is comprised of the basic infrastructures needed to support the production of goods and sustainability of liveli-hoods. This definition of vulnerability is in line with the framework proposed by UNDRR,265 where vulner-ability is defined as a reflection of the state of the individual and collective social, economic and infra-structural factors of a specific region. Such factors may be viewed as the foundation on which local plans for reducing vulnerability and facilitating adaptation are built.266
According to this theoretical framework, each factor is characterized by generic proxies that reflect the level of quality of different constituents of a society and its economy. This follows the concept that individuals and populations require a range of independent factors or capacities to achieve positive resilience to impacts and that no single factor is sufficient to describe the varied livelihood outcomes that societies need to cope with such disasters.
As represented in Figure 6.3(c), the most vulner-able regions to drought are in Central America, North-West South America, Central and South Asia, South-Western North America and almost the entire African continent, except for some areas in South-ern Africa. These results match the outcomes of
265 (UNISDR 2004)266 (Naumann et al. 2014)267 (Brooks, Adger and Kelly 2005)268 (Carrão, Naumann and Barbosa 2016)
other authors,267 which classified nearly all nations situated in sub-Saharan Africa among the most vulnerable to climate disasters.
6.4.4 Assessing the drought risk
Figure 6.3 presents the three components of drought risk as well as their combination, which results in the global drought risk map. The three components of risk were aggregated following a multivariate and non-parametric linear program-ming algorithm (Data Envelopment Analysis).268 The values for each component are not an abso-lute measure, but a relative statistic that provides a regional ranking of potential impacts (hot spots) with which to prioritize actions to reinforce adap-tation plans and mitigation activities. Figure 6.5 shows that drought risk is generally higher for highly exposed regions – mainly heavily populated areas and regions extensively exploited for agriculture – such as South-Central Asia, the southeast South American plains, Southern and Central Europe and the midwestern United States of America.
6.5 Considerations for other sectors
The assessment presented above is targeted to the agricultural sector and other primary activities. However, the methodology can be implemented and re-calibrated for analysing the risk in other sectors, such as energy production (hydropower generation,
183

Figure 6.5. Drought risk based on the risk components shown in Figure 6.3
(Source: JRC 2018)Disclaimer: The boundaries and names shown and the designations used on this map do not imply official endorsement or accep-tance by the United Nations.
and cooling of thermal and nuclear plants), naviga-tion and transportation (waterways), public water supply or recreation, which should be part of any comprehensive drought risk management plan.
6.5.1 Uncertainty
Several factors of uncertainty must be consid-ered in such analysis, as the metrics involved are
Though it is possible to observe analogues in the patterns between the drought hazard map in Figure 6.3a and the one in Figure 6.5, different conclusions at local scale can be obtained by using one indica-tor or the other.
partially subjective and conditioned by the data availability at a global scale. Agricultural drought can be quantified by several different indica-tors, each one able to provide a valid estimate of the different components of drought risk. As an example, Figure 6.6 depicts the drought hazard map according to the soil moisture-based yearly drought severity index (YDSI). This indicator quan-tifies the simultaneous occurrence of soil water deficit and extremely rare dry conditions,269 and could replace or be combined with the WASP index used above.
In the case of other sectors and related drought types, such as hydrological drought, the divergence can be more dramatic when adopting a more suit-able indicator. Indicators related to stream flow and river discharge rather than soil moisture and precipi-tation better capture the drought hazard for energy production and navigation. An example of such an
184 Chapter 6

269 (Cammalleri, Micale and Vogt 2015)270 (Cammalleri, Vogt and Salamon 2017)271 (Bauer 2014)
Figure 6.6. Drought hazard according to YDSI, 1980-2013
(Source: JRC 2018)Disclaimer: The boundaries and names shown and the designations used on these maps do not imply official endorsement or acceptance by the United Nations.
indicator is the one reported in Figure 6.7, where the hazard is represented by the number of hydrologi-cal drought events observed in a fixed time window (1980–2013) according to the low-flow index.270 This indicator detects unbroken sequences of river
The foregoing exemplifies how the maps reported in Figures 6.3(a), 6.6 and 6.7 are just a few of the possible depictions of drought hazard. This highlights the complexity in providing a definitive measure of drought hazard. Similar arguments can be made for drought vulnerability and exposure, whose characterization is even more fundamentally related to the factors considered relevant for the analysis. Factors relevant for assessing agricultural exposure and vulnerability may be irrelevant for energy production and vice versa, for example.
Even within a specific economic sector, the options for representation and quantification of risk and
discharge below a daily low-flow threshold. The number of events is just one of the possible metrics to be used to quantify the “average” hazard of a region to drought.
its components are multifaceted. As an example, power plants may depend on water directly (hydro-power) and indirectly (cooling systems of genera-tors). In both cases, insufficient water implies a reduction or a halt in energy production. Power plants typically use surface water;271 therefore, they are affected by hydrological droughts and conse-quent low stream flows.
185

Figure 6.7. Drought hazard according to the number of events detected by the low-flow index
(Source: JRC 2018)Disclaimer: The boundaries and names shown and the designations used on these maps do not imply official endorsement or acceptance by the United Nations.
This translates into the likelihood of reduced water intake at the installation. An indicator such as the low-flow index of Figure 6.7 may provide a good indicator for the drought hazard for energy produc-tion. While the use of meteorological drought
With regard to exposure, as electricity can be transported long distances from the source and across national boundaries, identifying people and assets potentially affected by reductions in power output is a challenging task. However, installed power capacity is a proxy for exposure (Figure 6.8): the higher the capacity, the higher the exposure, as presumably more electricity users are relying on it. This assumes that, even if power plants are not operated at full power, when energy demand is high, their full capac-ity is critical, especially when this occurs during warmer and drier periods.273 An advantage of using power capacity is that thorough data is
indices such as SPI has been tested for limited geographic scales,272 a general correlation with hydrological droughts could not be established at the global scale.
available for individual installations at the global level.274
Actual energy demand in a given time interval may provide a more accurate estimate of exposure. Such specific information is available only for a limited number of power plants, while the only consistent data is found at the national scale, such as yearly electricity consumption per capita. This data can be downscaled through population data (Figure 6.9), but with some caveats. First, the per capita consumption refers to the whole consump-tion, regardless of the use. For instance, indus-trial sites in sparsely populated areas will strongly
186 Chapter 6

272 (Barker 2016); (Bayissa et al. 2018)273 (van Vliet et al. 2016)274 (Global Energy Observatory et al. 2018); (S and P Global Platts 2015)
Figure 6.8. Map of installed power capacity whose facilities depend on water directly or indirectly (cooling)
(Source: JRC 2018)Disclaimer: The boundaries and names shown and the designations used on this map do not imply official endorsement or accep-tance by the United Nations.
influence the per capita consumption in the related mapping unit. Second, it assumes that electric-ity consumption and generation are located close together; therefore, a drought occurring at an impor-tant but remote power plant will not be accurately
represented. Third, demand is equated to consump-tion (i.e. all demand is met).
Finally, vulnerability to droughts refers to the means available to mitigate the lack of water. Conceptu-ally, this may have several definitions depending on the context. At the power plant level, it essentially relates to the amount of water required to produce a unit of energy.
From a broader perspective, country statistics on the energy sector can provide a wide range of indi-cators that are helpful to understand and model overall vulnerability to droughts. Examples are the ratio between energy sources dependent and non-dependent on fresh water, the diversifica-tion of fuel types (which usually entails different
capacity factors), the percentage of electricity imports against total use, the amount of freshwa-ter resources per capita, the ratio of water use for energy production against the total, the electricity prices evolution, etc. Each of these descriptors may be combined to show specific aspects of vulnerabil-ity at the country scale.
187
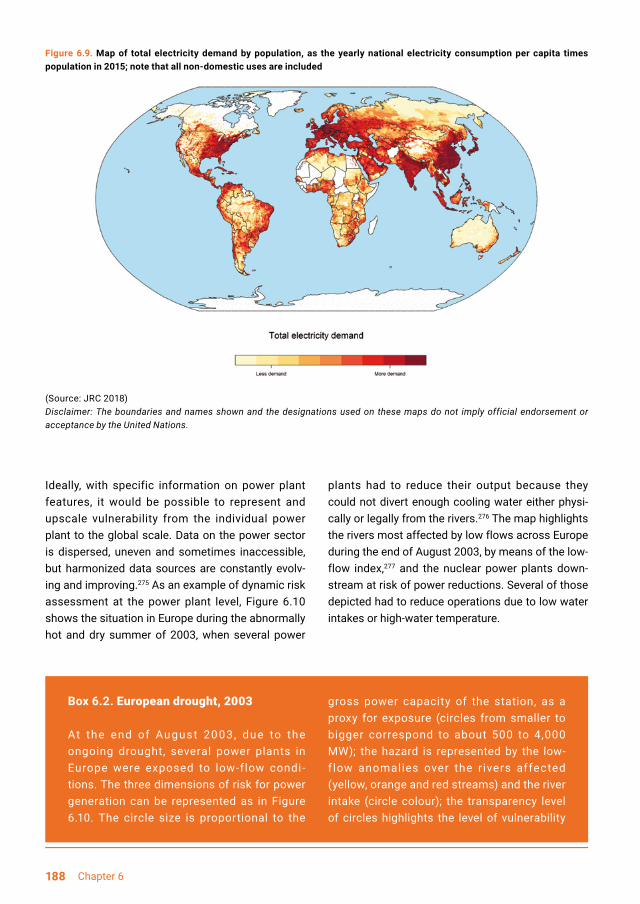
Figure 6.9. Map of total electricity demand by population, as the yearly national electricity consumption per capita times population in 2015; note that all non-domestic uses are included
(Source: JRC 2018)Disclaimer: The boundaries and names shown and the designations used on these maps do not imply official endorsement or acceptance by the United Nations.
Box 6.2. European drought, 2003
At the end of August 2003, due to the ongoing drought, several power plants in Europe were exposed to low-flow condi-tions. The three dimensions of risk for power generation can be represented as in Figure 6.10. The circle size is proportional to the
gross power capacity of the station, as a proxy for exposure (circles from smaller to bigger correspond to about 500 to 4,000 MW); the hazard is represented by the low-f low anomalies over the rivers affected (yellow, orange and red streams) and the river intake (circle colour); the transparency level of circles highlights the level of vulnerability
Ideally, with specific information on power plant features, it would be possible to represent and upscale vulnerability from the individual power plant to the global scale. Data on the power sector is dispersed, uneven and sometimes inaccessible, but harmonized data sources are constantly evolv-ing and improving.275 As an example of dynamic risk assessment at the power plant level, Figure 6.10 shows the situation in Europe during the abnormally hot and dry summer of 2003, when several power
plants had to reduce their output because they could not divert enough cooling water either physi-cally or legally from the rivers.276 The map highlights the rivers most affected by low flows across Europe during the end of August 2003, by means of the low-flow index,277 and the nuclear power plants down-stream at risk of power reductions. Several of those depicted had to reduce operations due to low water intakes or high-water temperature.
188 Chapter 6

275 (Global Energy Observatory et al. 2018); (S and P Global Platts 2015)
(Source: JRC 2018)Disclaimer: The boundaries and names shown and the designations used on this map do not imply official endorse-ment or acceptance by the United Nations.
Figure 6.10. Major European rivers feeding hydroelectric power generation facilities, 2003
276 (Fink et al. 2004)277 (Cammalleri, Vogt and Salamon 2017)
associated with the cooling system, with the more intense colours related to the more
vulnerable (i.e. a higher amount of water required per unity of energy output).
6.5.2 Scale considerations
Besides the highlighted differences in hazard, expo-sure and vulnerability among sectors, risk assess-ment is also dependent on the scale of analysis. This is due to the generally increasing detail of input data when moving to smaller spatial domains. As such, the presented methodology allows rescal-ing the analysis over different spatial domains and therefore obtaining adequate (useful) results at different scales of analysis. These can range from
the farm level to the continent and the global levels as demonstrated above, thus allowing analysis of the spatial distribution of the drought risk within a given area of interest (e.g. farm, country, region, continent or global levels).
As this framework is data driven, more socioeco-nomic data at local levels is required to obtain reliable estimates. Wherever this information is available, it allows tailoring the analysis and setting adaptation strategies fitted to local require-ments and specific sectors that might be adversely affected by droughts.
189

Figure 6.11. Drought hazard, exposure, vulnerability and overall drought risk for Argentina in 2018
(Source: JRC 2018)Disclaimer: The boundaries and names shown and the designations used on these maps do not imply official endorsement or acceptance by the United Nations.
Figure 6.11 shows the same analysis as shown in Figures 6.3 and 6.5 for the global level, based on the same data re-scaled for the domain of Argen-tina. The country analysis shows that vulnerability in Argentina is higher in the northern part of the country due to weaker infrastructure and other drivers.
Combining the vulnerability with the hazard and the exposure shows that the drought risk is lower for remote regions, and higher for populated areas and regions extensively exploited for crop production and livestock farming, such as the Buenos Aires, Córdoba and Santa Fe provinces. Regions charac-terized by a lower or almost null exposure experi-ence a lower drought risk. As the remaining regions
190 Chapter 6
are still subject to severe drought events, their risk increases as a function of the total exposed entities (mainly croplands) and their local coping capacity.
6.6 Drought impact
Drought conditions frequently remain unnoticed until water shortages become severe and adverse impacts on environment and society become evident. Drought impacts may be influenced by adaptive buffers (e.g. water storage, purchase of livestock feed, land and ecological conditions) or can continue long after precipitation has returned to normal (e.g. owing to groundwater, soil moisture or reservoir deficits). The slowly developing nature and long duration of drought, together with a large variety of impacts beyond direct and visible agricul-tural losses, typically make the task of quantifying drought impact difficult.278
Impact of droughts can be classified as direct or indirect.279 Examples of direct impacts include limited public water supplies, crop loss and damage to buildings due to terrain subsidence and reduced energy production. Because of the dependence of livelihoods and economic sectors on water, most drought impacts are indirect. These indirect effects can propagate quickly through the economic system, including trade, affecting regions far from where the drought originates. Indirect impacts may affect ecosystems and biodiversity, human health, commercial shipping and forestry. In extreme cases, drought may result in temporary or perma-nent unemployment or even business interruption, and lead to malnutrition and disease in more vulner-able countries. Drought-related damage may further
be classified as tangible (market related) or intan-gible (non-market related). The latter is particularly difficult to quantify, including, for example, ecosys-tem degradation or the costs of long-term adapta-tion measures.
In the few disaster databases that are publicly avail-able, drought disasters are particularly poorly esti-mated or are underreported.280 The general lack of tangible damages combined with a prolonged dura-tion make it extremely difficult to retrieve correct or attributable loss estimates. Given these data gaps, droughts are estimated at less than 7% of total losses from natural hazards since 1960.281 However, it should be noted that there is a significant gap between the reported and real drought impacts, which hinders their systematic quantification.
Developed and larger economies like Austra-lia, Brazil, China or the United States of America suffer from economic and environmental conse-quences of droughts. Less developed countries face more direct or indirect impacts on the popu-lation. Economic damage from single drought events can be catastrophic, with a single event capable of causing billions of dollars of damage. In term of losses, the most severe events can affect the economy of an entire region or country. For instance, according to NatCatSERVICE data, the severe drought in California in 2006 caused losses of $4.4 billion, and during the 2013–2015 drought in midwestern United States of America, the reported losses were $3.6 billion. Estimates of impacts are however thought to be much higher than these numbers as they primarily reflect direct agricultural damage. The 2013–2015 drought that affected central eastern Brazil (mainly São Paulo, Minas Gerais and Rio de Janeiro) was linked to reported losses of about $5 billion. The 2010–2011 drought in the Horn of Africa is estimated to have caused up to a quarter of a million deaths, and to have left over 13 million people dependent on humwanitarian aid.
278 (Wilhite 2005)279 (UNISDR 2011a); (Tallaksen and van Lanen 2004); (Meyer et al. 2013); (Spinoni et al. 2016)
280 (Svoboda et al. 2002)281 (Gall, Borden and Cutter 2009)
191

Approximately $1.3 billion was spent on drought-relief measures.282
Among all economic activities, the agriculture sector has been one of the sectors most directly affected by drought. Impacts on health and water resources for non-agricultural uses are increas-ingly better understood. To identify trends in the economic impact of disasters on crops, livestock, fisheries and forestry, a review was conducted of 78 post-disaster needs assessments (PDNAs) undertaken in the aftermath of medium- to large-scale disasters in 48 developing countries in Africa, Asia and Latin America between 2003 and 2013.283 According to this GAR, agriculture absorbs on average about 84% of all the economic impact in these countries. Livestock is the second most affected subsector after crops, accounting for $11 billion, or 36% of all damage and losses reported in PDNAs, where almost 86% of these losses were caused by drought events. Missing from these esti-mates are losses due to livelihood disruption, migra-tion and insecurity. Environmental conditions affect
plants and their productivity during all phases of growth and development. Studies show that mois-ture stress in all growth stages reduced the grain yield significantly.284 Severe droughts are linked with significant reduction in yields of the main cereals and most other crops throughout the most drought-prone regions.285
The health of human populations is sensitive to shifts in weather patterns and other aspects of climate change. These effects occur directly, due to changes in temperature and precipitation and in the occurrence of heat-waves and droughts. Human health may be affected indirectly by ecological disruptions related to climate change (e.g. crop fail-ures or shifting patterns of disease vectors) or by social responses to climate change (e.g. displace-ment of following prolonged drought) and the elderly face disproportional physical harm from heat stress and drought.286
Climate change is likely to increase the frequency and severity of meteorological and agricultural
Figure 6.12. Expected annual damage due to droughts in billion $, 2015
(Source: JRC with data from NatCatSERVICE, Emergency Events Database (EM-DAT) and DesInventar 2018)Disclaimer: The boundaries and names shown and the designations used on these maps do not imply official endorsement or acceptance by the United Nations.
192 Chapter 6

282 (OCHA 2011)283 (FAO 2015b)284 (Singh, Mishra and Imtiyaz 1991)285 (Hlavinkaa et al. 2009)286 (IPCC 2014); (van Lanen et al. 2017)
287 (IPCC 2014)288 (van Vliet et al. 2016)289 (IPCC 2014)290 (Duguy et al. 2013)
droughts in presently dry regions by the end of the twenty-first century. Particularly vulnerable are countries located in arid and semi-arid regions where water stress will be further exacerbated due to strain from overexploitation and degradation already tangible under the present conditions.287 Consequently, many other economic sectors and ecosystems are likely to be adversely affected by climate change. For instance, freshwater-depen-dent biota will suffer directly from changes in flow conditions and also from drought-induced river temperature increases linked to discharge reduc-tions.288 Decreases in soil moisture and increased risk of agricultural drought are likely in drylands, and the agricultural risk in these areas is projected to increase by the end of this century.289 This is likely to lead to an increased risk of food insecu-rity, which is particularly relevant for poorer popula-tions. In many countries, increased fire risk, longer fire season and more-frequent large, severe fires are expected because of increasing heat-waves in combination with drought.290
6.7 Recognizing drought as a complex hazard
Drought is a slow-onset hazard, often referred to as a creeping phenomenon. The absence of a precise, universally accepted definition of drought adds to the confusion. Definitions must be region specific because each climate regime has distinctive climatic characteristics. Drought impacts are non-structural and are spread over larger geographic areas and temporal scales than damage that results from other natural hazards such as floods, tropi-cal storms and earthquakes. Drought risk drivers include non-meteorological factors, and are often spatially or temporally removed from drought impacts These characteristics of drought have hindered: development of accurate, reliable and timely forecasts; estimates of severity and impacts; and, ultimately, the formulation of drought manage-ment plans and implementation of appropriate risk reduction strategies. Similarly, local communities struggle to deal with the large temporal and spatial coverage usually associated with drought, resulting in secondary and tertiary impacts that may remain invisible to traditional risk assessments.
193

Theewaterskloof Reservoir at 12% capacity near Cape Town, South Africa, 10 February 2018 (Source: Antti Lipponen CC 2.0 2018)
Box 6.3. Multiple droughts in South Africa
Since 2015, the South African province of Western Cape has experienced a sustained chain of very low and below-average precipita-tion periods, resulting in a hydrological drought that further intensified between April and Sep-tember 2017. The precipitation deficit became, in early 2018, the worst drought recorded in
the region in a century, and a true emergency for the city of Cape Town. This is one of the biggest urban areas of the country with an exposed population of over four million people.
During this multi-annual drought, the water deficit propagated through the hydrological cycle, and most affected were the water reser-voirs that supply Cape Town with drinking water.
Figure 6.13. Long-term SPI with a cumulative period of 12 months reaches extremely low values for many months, indicating a prolonged and severe hydrological drought in Cape Town, South Africa
(Source: JRC 2018)
194 Chapter 6
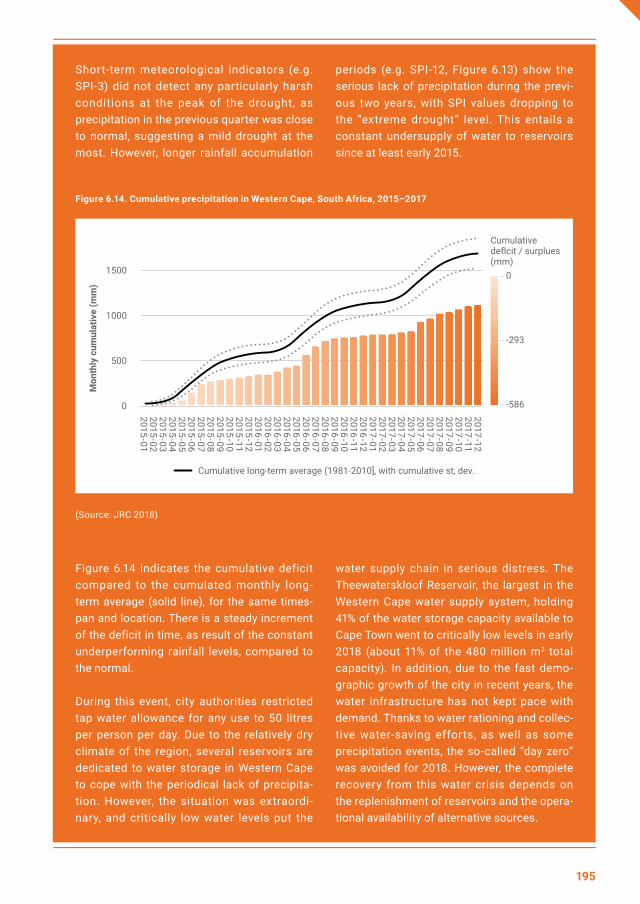
Short-term meteorological indicators (e.g. SPI-3) did not detect any particularly harsh conditions at the peak of the drought, as precipitation in the previous quarter was close to normal, suggesting a mild drought at the most. However, longer rainfall accumulation
periods (e.g. SPI-12, Figure 6.13) show the serious lack of precipitation during the previ-ous two years, with SPI values dropping to the “extreme drought” level. This entails a constant undersupply of water to reservoirs since at least early 2015.
Figure 6.14. Cumulative precipitation in Western Cape, South Africa, 2015–2017
(Source: JRC 2018)
Figure 6.14 indicates the cumulative deficit compared to the cumulated monthly long-term average (solid line), for the same times-pan and location. There is a steady increment of the deficit in time, as result of the constant underperforming rainfall levels, compared to the normal.
During this event, city authorities restricted tap water allowance for any use to 50 litres per person per day. Due to the relatively dry climate of the region, several reservoirs are dedicated to water storage in Western Cape to cope with the periodical lack of precipita-tion. However, the situation was extraordi-nary, and critically low water levels put the
water supply chain in serious distress. The Theewaterskloof Reservoir, the largest in the Western Cape water supply system, holding 41% of the water storage capacity available to Cape Town went to critically low levels in early 2018 (about 11% of the 480 million m3 total capacity). In addition, due to the fast demo-graphic growth of the city in recent years, the water infrastructure has not kept pace with demand. Thanks to water rationing and collec-tive water-saving efforts, as well as some precipitation events, the so-called “day zero” was avoided for 2018. However, the complete recovery from this water crisis depends on the replenishment of reservoirs and the opera-tional availability of alternative sources.
195
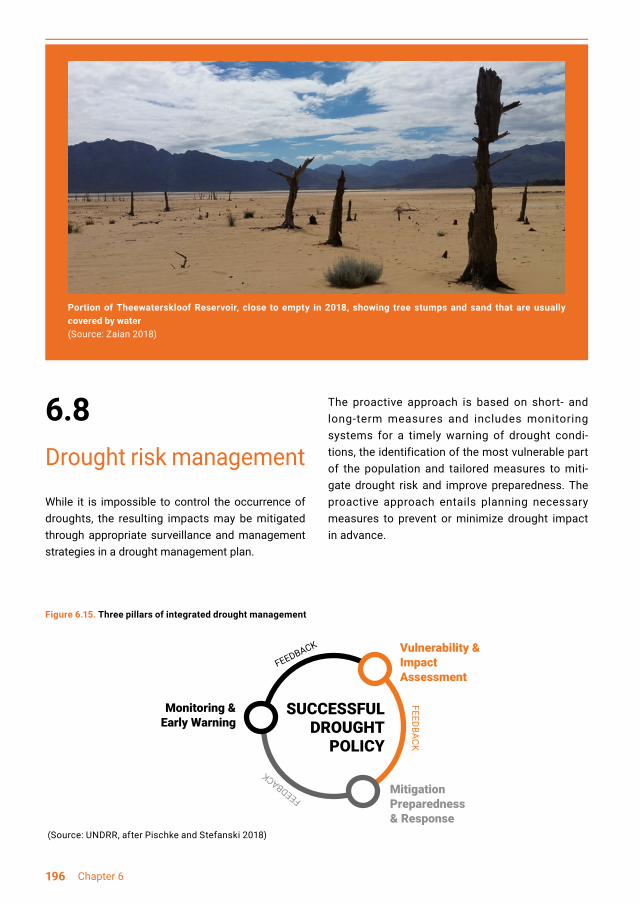
Figure 6.15. Three pillars of integrated drought management
(Source: UNDRR, after Pischke and Stefanski 2018)
Portion of Theewaterskloof Reservoir, close to empty in 2018, showing tree stumps and sand that are usually covered by water (Source: Zaian 2018)
6.8 Drought risk management
While it is impossible to control the occurrence of droughts, the resulting impacts may be mitigated through appropriate surveillance and management strategies in a drought management plan.
The proactive approach is based on short- and long-term measures and includes monitoring systems for a timely warning of drought condi-tions, the identification of the most vulnerable part of the population and tailored measures to miti-gate drought risk and improve preparedness. The proactive approach entails planning necessary measures to prevent or minimize drought impact in advance.
196 Chapter 6

Drought monitoring and early warning (Pillar 1) is the foundation of effective proactive drought poli-cies to warn about impending drought conditions. It identifies climate and water resources trends and detects the emergence or probability of occurrence and the likely severity of drought and its impact. Reliable information must be communicated in a timely manner to water and land managers, policy-makers and the public through appropriate commu-nication channels to trigger actions described in a drought plan. That information, if used effectively, can be the basis for reducing vulnerability and improving mitigation and response capacities of people and systems at risk.
Vulnerability and impact assessment (Pillar 2) aims to determine the historical, current and likely future impacts associated with drought and to assess the vulnerability. Drought impact and vulnerability assessment aims to improve the understanding of the natural and human processes associated with drought and the impacts that can occur. The outcome of the vulnerability and impact assessment is a depiction of who and what is at risk and why.
The work related to drought mitigation, prepared-ness and response (Pillar 3) determines appropri-ate mitigation and response actions aimed at risk reduction, identification of appropriate triggers to phase in and phase out mitigation actions, particu-larly short-term actions, during drought onset and termination and, finally, identification of organiza-tions to develop and implement mitigation actions. Triggers are defined as specific values of an indica-tor or index that initiate and/or terminate responses or management actions by decision makers based upon existing guidelines or preparedness plans.291 Triggers should link indices or indicators to impact.
To move from a reactive to a proactive approach, local or regional conditions must be taken into consideration, including the legislative and admin-istrative framework as well as the local drought drivers. An effective drought management plan should provide a dynamic framework for an ongoing set of actions to prepare for, and effectively respond to drought, including: periodic reviews of the achievements and priorities; readjustment of
goals, means and resources; and strengthening institutional arrangements, planning and policymak-ing mechanisms for drought mitigation.292
A key decision support tool for crisis mitigation is embedded within the concept of early warning information systems across timescales. Efforts in drought early warning continue in countries such as Brazil, China, Hungary, India, Nigeria, South Africa and the United States of America.293 Regional drought monitoring activities exist or are also being developed in Eastern and Southern Africa and efforts are ongoing in West Asia and North Africa. Research and experience in several watersheds show that several paradoxes in multistate water management and governance across borders can militate against the accurate assessment of socio-economic impacts and the effective use of scien-tific information for meeting short-term needs in reducing longer-term vulnerabilities.
These lessons include an expanded use of incen-tives for improving collaboration, water-use effi-ciency, demand management and development of climate services to inform water-related manage-ment as new threats arise.
Several cases show that changes in the manage-ment of climate-related risks (in this case, drought) may be most readily accomplished when: (a) a focusing event (climatic, legal or social) occurs, creating widespread public awareness and oppor-tunities for action; (b) leadership and the public, the so-called “policy entrepreneurs”, are engaged; and (c) a basis for integrating research and manage-ment is established.294 This latter dimension empha-sizes the structure for developing the capacity to apply knowledge and to evaluate the consequences of actions among partners, to ensure the reliability and credibility of the projections of changes in the
291 (Svoboda and Fuchs 2016)292 (EC 2007)293 (Pulwarty and Sivakumar 2014); (Wilhite and Pulwarty 2017)294 (Pulwarty and Maia 2015); (Wilhite and Pulwarty 2017); (Gleick S2018)
197

system outputs and to enable acceptable revisions on management practices in light of new informa-tion. Examples of end-to-end information systems in which monitoring and forecasting, risk assess-ment and engagement of communities and sectors are aligned across the weather-climate continuum are exemplified by the National Integrated Drought Information System (NIDIS) and the Famine Early Warning System Network (FEWSNet), which provide coordination of diverse regional, national and local data and information for supporting planning and preparedness.295 Owing to FEWSNet, there have been successful cases of drought risk interventions to prevent humanitarian crises, including the severe drought in Ethiopia in 2015–2016.
However, drought remains a “hidden risk”.296 The microlevel actions involving households, commu-nities and individual businesses are often under-appreciated but are arguably the most important elements of drought risk mitigation. This is summa-rized as follows:297
Although drought insurance is an effective and proactive measure, the development of formal drought insurance mechanisms is hindered in many developing countries by obstacles such as high transaction costs, asymmetric information and adverse selection.298
The experience of JRC, the Integrated Drought Management Programme, NIDIS, FEWSNet and other information and risk management systems illustrates that early warning represents a proac-tive social process whereby networks of orga-nizations conduct collaborative analyses and coordination.299 In this context, indicators help to identify when and where policy interventions are most needed, and historical and institutional analy-ses help to identify the processes and entry points that need to be understood if vulnerability is to be reduced. Taking local knowledge and practices into account promotes mutual trust, acceptability, common understanding, and community sense of ownership and self-confidence.300 As important as indicators are to such systems, it is also the gover-nance context in which EWSs are embedded that needs further attention. A mix of centralized and decentralized activities is required, particularly for people-centred strategies at the so-called “last mile”.
EWSs are more than scientific and technical instru-ments for forecasting hazards and issuing alerts. They should be understood as sources of scien-tifically credible, authoritative and accessible knowledge. These integrate information about and from areas of risk that facilitate decision-making (formal and informal) in a way that empower vulnerable sectors and social groups to mitigate potential losses and damage from impending hazard events.
• More secure land tenure and better access to electricity and agricultural extension were found to facilitate the adoption of drought risk mitiga-tion practices among agricultural households in Bangladesh. Similarly, access to secure land tenure, markets and credit played a major role in helping farmers cope with droughts in Morocco.
• Improved access to credit helped farming households in Ethiopia to cope better with drought impacts since they no longer needed to divest their productive assets. Moreover, as many rural households in Ethiopia tend to channel their savings into livestock, which may be wiped out during droughts, developing access to financial services and alternative sav-ings mechanisms could also help to mitigate drought risk.
• Land-use change and modification of cropping patterns are frequently cited as ways to build resilience against droughts.
• Improved diversification of livelihoods by adopt-ing off-farm activities and divesting of livestock assets.
• A strong asset base and diversified risk man-agement options are among the key character-istics of drought-resilient households in Kenya and Uganda. These aspects were due primarily to the households having better education and greater knowledge of coping actions against various hazards. This allowed them to diversify their income sources.
198 Chapter 6
295 (Pulwarty and Verdin 2013)296 (UNISDR 2011a)297 (Gerber and Mirzabaev 2017b)298 (OECD 2016)299 (Pulwarty and Verdin 2013)
The costs of proactive drought management are usually lower than the costs of inaction, and can generate significant economic benefits. For example, one study estimated that every dollar spent by the United States Federal Emergency Management Agency (FEMA) on drought risk miti-gation,301,302 the country would save at least $2 on future disaster costs. Related actions to miti-gate drought impacts include more secure tenure, better access to electricity, improved access to credits, land-use change and modification of crop-ping patterns, better use of groundwater resources and adoption of off-farm activities to diversify livelihoods.303
Drought risk management can have substantial socioeconomic co-benefits, as some of the related actions build resilience against droughts and also against additional socioeconomic and environmen-tal shocks. Regional and local networks that provide agricultural extension, precision farming, off-farm activities and higher education, for example, which are associated with stronger resilience to drought shocks, were identified as factors that also help address land degradation, facilitate poverty reduc-tion and improve household food security.304
6.9 Way forward
Assessing the risk for drought-related impacts to society and environment is a difficult task. It is complicated by the creeping nature of the phenom-enon, its often-large spatial extent and temporal duration, leading to cascading impacts that may affect areas distant from the drought and it may last long after the drought has ceased. Missing standardized data on past impacts (damage and loss) is a further complication. Finally, the interlink-ages with other hazards such as wildfires, heat-waves and even floods and the combined risks need to be explored. These risk assessments need to be sector specific, requiring an adequate set of environmental and socioeconomic data related to the respective sectors.
Many hot spots that show fragility in the face of climate change also exhibit soil moisture and soil quality reduction combined with reduced adaptive capacity. Scenario planning (based on past, present, and projected events) may provide better understanding of whether and how best to use probabilistic information with past data and cumulative risks across climate timescales. There is a strong need to approach climate model outputs far more critically than at present, espe-cially for impact assessment to support adapta-tion at the local level. Central to all of the above is a sustained network of high-quality monitoring systems.
The major assumption behind proactive action around drought is that present or upfront actions and investments can produce significant future
300 (Dekens and International Centre for Integrated Moun-tain Development 2007)301 (Multihazard Mitigation Council 2005)302 (Logar and van den Bergh 2013)303 (Gerber and Mirzabaev 2017a)304 (Gerber and Mirzabaev 2017a)
199

benefits. No comprehensive study exists for drought. Some have outlined the advances to date in assessing benefits of action and the costs of inaction.305 In drought and other hazards, much more work needs to be done to realize what has been called the “triple dividend of resilience”.306
The benefits include:
The need to explicitly acknowledge differing social values, to strengthen institutional mechanisms for collaboration, and to collect standardized data on drought impacts as a basis for reducing vulnerabil-ity and enhancing resilience needs to be acknowl-edged. How drought and climate change may play into future fragility will be an area of increasing research and security interest.
6.10 Emerging issues: setting the context for the 2020 special report on drought
Despite the significant advances of the past century of drought research, in an increasingly intercon-nected world, several areas of concern for drought risk management are emerging:
•
In the light of these challenges, UNDRR will publish a special report on drought risk in 2020. The fore-going discussion highlighted some of the key aspects and challenges to be discussed and further explored in this special report.
a. Avoiding losses when disasters strike
b. Stimulating economic activity from reduced disaster risk
c. Developing co-benefits, or uses, of a specific disaster risk management investment
a. Uncertainties associated with climate change and its manifestation at all levels including cas-cading risks.
b. Understanding the increasingly complex path-ways through which drought affects filter (e.g. the water–energy–food nexus, socioecological buffers and thresholds).
c. Assessing the costs of drought impacts, and the benefits of action and costs of inaction.
d. Enhancing the role of technology, efficiency and community-based knowledge.
e. Links to human security, globally networked risks and conflict that affect resilience.
f. Emphasizing the role of governance, financing and decision-making in anticipating, assess-ing and acting on reducing and managing the impacts of complex risks.
g. The need to explicitly acknowledge various social values and strengthening institutional mechanisms for collaboration, including data collection. How drought and climate change may play into future fragility will be an area of increasing research and security interest.
200 Chapter 6
305 (Gerber and Mirzabaev 2017b)306 (Tanner et al. 2015)
Part I Conclusions and recommendationsConclusions
This part has endeavoured to demonstrate the scope of current knowledge on risk management across a range of hazards. It has also outlined that measurement, quantification and proportionate responses are almost certainly inadequate to meet the challenges of the multifaceted interconnect-edness of hazard, the barely understood richness of exposure and the profound detail of vulnerabil-ity that it will take to ever do more than treat the symptoms. Risk really is systemic, and it requires a concerted and urgent effort to work in integrated, systemics and innovative ways.
Recommendations
“Millions don’t rally to the banner ofuncertainty”
- George Packer
• Connect and collaborate: This work is already under way and was before the Sendai Frame-work came into effect. But the ambition, richness and expansive spirit of cooperation required to meet systemic challenges will require levels of selfless humanism that match the scale of the challenge. In particular, integra-tion with social science research is important.
• Invest: Resource challenges are always the first-cited obstacle to better risk management. EO, computing power, mitigation measures, regulatory enforcement and safety nets should be invested in, as should reducing inequality and improving participation, access and education.
• Leverage: The movement towards open data, collaborative science and cloud computing is in a golden age. The value of information is such that impulses towards hoarding, insular-ity, competition and protection could come to
dominate an increasingly unequal world. This is the moment to capitalize, entrench and fortify the values of mutual support and humanity.
• Relish uncertainty: Past GARs have avoided including drought as fulsomely as other haz-ards, particularly due to intractability. It has so many drivers and so many effects, which are often indirect. This should not be a reason to avoid talking about them as damaging hazards that affect hundreds of millions of people a year and exact an untold economic toll. Risk will never be simple again. That is difficult and important to accept for risk scientists, for poli-cymakers and for anyone faced with the task of communicating risk.
201

SpecialCase StudyLocal collection of disaster loss data in national risk management systems – from Ethiopia to The Gambia
Many rural communities in Ethiopia rely on traditional shallow wells such as this one in Gumsalasa. When drought lowers groundwater levels they can become dry, leading to local stock losses, food shortages and health impacts.
(Source: Jean-Yves Jamin, https://flic.kr/p/Gsj85C)
202 Special Case Study

This case study relates to the imperative to link risk management systems, seek local-level input and reinforce growing systems with policy, structure, governance and patience.
In 2014, Ethiopia began to undertake the challeng-ing job of recording losses due to disaster events. This process is supported by UNDRR, based on a tool developed specifically to collect, validate and aggregate data at the lowest possible administra-tive unit.
In the case of Ethiopia, this means that data is being collected at the wereda level (the third-level administrative division). The country has nearly 700 weredas. Their data is then aggregated into one of around 70 zones, and the zone data is aggregated into one of 11 regions. In collecting disaster event data and related losses at the local level, Ethiopia has joined a group of about 100 countries that are systematically record-ing disaster losses using the disaster loss account-ing tool DesInventar.307 More importantly, Ethiopia has committed to a data-collection undertaking that would challenge the administrative gover-nance capacities of any country. But it has done so knowing that, as well as being seismically active, its territory is exposed to hitherto uncounted small-scale, extensive disasters that sap develop-ment resources and undermine opportunities for the poorest people in the country to thrive. As Ethi-opia has a large population (100+ million) and a GDP per capita in the lowest quintile of any global index,308,309,310 having an accurate understanding of the nature of these myriad localized losses will permit development decisions to better target resilience building.
307 (UNISDR 2019)308 (International Monetary Fund 2019)309 (World Bank 2019)310 (United Nations Statistics Division 2019)
203

Ethiopia’s disaster loss database record of hazard event types, 2018
At the time of writing, Ethiopia has around 15,000 records in its public database of disaster-related losses. It has another 10,000 records awaiting veri-fication. This scale of data collection is exceptional and is indicative of the commitment of Ethiopia to: knowing its profile of disaster impacts; communi-cating to its population that every farm damaged, every localized flood or epizootic outbreak matters and will be counted; and sharing its experience in the interests of a better global understanding of risk.
Loss figures from Ethiopia’s database are among those that populate the loss figures in Part II of this GAR. Without Ethiopia’s immense effort, those figures would be less accurate and thus less valid. Ethiopia’s model has inspired other countries in the region to begin accounting systematically for disaster losses. Since 2014, 19 more countries in Africa have begun the process of recording their losses using the same method.
One of the later countries to join this movement is The Gambia. Its process will be the same. The objective is to develop a system that facilitates the incorporation of risk information into public investment planning and decision-making. This will be done by first establishing a national disas-ter loss database to account for past losses, then assessing experienced losses against a handful of modelled risks, and then assessing budgetary spending against forecast losses to determine whether budgeting has been sufficient and appro-priately targeted. This process is going on in 18 other countries around Africa as part of the same project.
The Gambia’s database is much newer than Ethio-pia’s and therefore contains far fewer records. This is also a reflection of the size of the country, the exposure profile it faces and the reporting structures in place to gather information. But even though The Gambia has a smaller population, a
Source: (UNDRR 2019)
204 Special Case Study

Sea storms cause losses to the fishing economy in Gambia and are likely to increase in intensity due to climate change(Source: Vila, R. (2015))
more limited scope of hazards and fewer exposed assets than Ethiopia, its losses are just as impor-tant. The Gambia’s National Disaster Management Agency knows that to manage losses, it needs to understand them and account for them. Through a series of platforms, data-collection conferences, and new regulations and plans, it has also commit-ted to supporting institutionalization of data collec-tion, to ensure that data collection continues as a parallel process even as the other elements of the project get under way.
Data collection of past losses is a necessary but not sufficient measure. Ethiopia and The Gambia have invested heavily in data collection and reflec-tive processes of understanding what worked well in past circumstances and what could be improved in future. They are thinking about the regulatory, systemic and interconnected nature of managing their risks. Though the effects of climate change portend serious challenges for large parts of Africa, the countries that start today and plan for the long term are positioning themselves for resilience.
205
Introduction
As the complexity and range of risks evolve, the Sendai Framework represents a shift from main-streaming disaster risk to an approach of manag-ing the risks inherent in social, economic and environmental activity for sustainable development. It includes seven global targets, accompanied by a comprehensive set of guiding principles that give direction to reduce the impact of disasters, while also addressing the underlying drivers of disaster risk and safeguarding development gains for current and future generations. Transitioning towards resil-ient and sustainable societies hinges on responsible management of disaster risks. Member States have taken bold steps in developing and incorporating the goals, targets and indicators – and associated data – within national reporting systems.
This part introduces the global disaster risk land-scape and takes stock of experience so far with a comparative analysis of country-specific evidence on national reporting, informed by the latest disas-ter data available. It sheds light on successes and challenges as they emerge from the first years of reporting and provides early lessons for further improvements. While the observed period is still too short to reach definitive conclusions on a global scale, we can observe certain patterns in terms of magnitude, geographic and socioeconomic distri-bution of disaster impacts and several departure points of where and how countries have managed to do better in reducing disaster risk.
By the time Member States agreed on the Sendai Framework, disaster risks compounded by climate change, environmental degradation, poverty and inequality were evolving rapidly, with cascading
Part II:Implementation of the Sendai Framework and Disaster Risk-informed Sustainable Development
206 Part III

HIGH INCOME COUNTRIES
More than 90% of mortality attributed to internationally reported disaster events has occurred in low and middle income countries
Disasters associated to hydro-meteorological hazards account for about 2/3 of housing damages
Member States reporting on the status of their national and local disaster risk reduction
strategies (Target E) are gradually increasing but are still in the minority.
LOW AND MIDDLE INCOME COUNTRIES
REPORTS
HYDRO-METEOROLOGICALHAZARDS
1 (United Nations General Assembly 2015c)2 (United Nations 2015c)
3 (United Nations 2015a)4 (United Nations 2016b)
effects across geographic and income-level regions. The analysis in this part concludes with a review of the contribution of the UNDRR Sendai Framework Monitor (SFM) by underlining the cross-benefits of integrated reporting across the different global frameworks. Recognizing that extra efforts are required to manage these interactions, so that they become synergies, the analysis offers an overview of international and national developments in build-ing coherence among the Sendai Framework and other post-2015 agreements.
The Sendai Framework is not alone in pursuing an integrated approach to risk reduction and develop-ment. Rather, it is an indivisible part of a series of international negotiated agreements made during 2015–2016: the 2030 Agenda,1 the Paris Agree-ment on climate change (providing the foundation for sustainable, low-carbon and resilient develop-ment under a changing climate),2 AAAA3 adopted at
the Third International Conference on Financing for Development (outlining a series of fiscally sustain-able and nationally appropriate measures to realign financial flows with public goals and reduce struc-tural risks to inclusive growth) and NUA adopted at the 2016 United Nations Conference on Housing and Sustainable Urban Development (introducing a new model of urban development that promotes equity, welfare and prosperity).4
(Source: UNDRR)
207
Chapter 7: Risk reduction across the 2030 Agenda
7.1 Sendai Framework targets and monitoring: a snapshot
The Sendai Framework’s intended outcome is a “substantial reduction of disaster risk and losses in lives, livelihoods and health and in the economic, physical, social, cultural and environmental assets of persons, businesses, communities and coun-tries” by 2030. The goal towards this, described in paragraph 17, is:
Prevent new and reduce existing disaster risk through the implementation of integrated and inclusive economic, structural, legal, social, health, cultural, educational, environmen-tal, technological, political and institutional measures that prevent and reduce hazard exposure and vulnerability to disaster, increase preparedness for response and recovery, and thus strengthen resilience.
The Sendai Framework outlines seven targets and four priority areas for action to strengthen resil-ience by preventing new and reducing existing disaster risks. The four priority areas are: (1) under-standing disaster risk, (2) strengthening disas-ter risk governance to manage disaster risk, (3) investing in DRR for resilience and (4) enhancing disaster preparedness for effective response and “build back better” in recovery, rehabilitation and reconstruction.5
An increasingly diverse spectrum of stakeholders has made significant efforts since 2015 to imple-ment the Sendai Framework, reaching across differ-ent geographies, sectors, jurisdictions and scales. These efforts are organized to pursue the realiza-tion of one key outcome and goal, and seven global targets (A–G), as set out in Table 7.1.
5 (United Nations 2015b)
208 Chapter 7

Table 7.1. Seven global targets of the Sendai Framework
209

210 Chapter 7

Realization of the outcome, goal and targets is made possible thanks to the significant efforts of Member States under the Hyogo Framework for Action (HFA) 2005–2015. While HFA focused on DRR as an evolution from disaster response and management,6 the Sendai Framework supports a shift in paradigm. It focuses on a much wider hazard and risk scope, to include natural and man-made, environmental, technological, and biologi-cal hazards and risks. It emphasizes the reduction of existing risk and underscores that prevention of new risks is essential to sustainable development (without which development gains will be reversed).
During the HFA period, the monitoring system consisted of biennial self-assessment reporting by Member States and regional intergovernmen-tal organizations. This identified trends, areas of progress and challenges, based on 22 core, princi-pally policy, indicators, according to the five priori-ties for action. Many Member States participated, with approximately 80% providing national reports at least once over four biennial monitoring cycles since 2007. Sixty-one countries developed reports for 2007–2009, 105 for 2009–2011, 101 for 2011–2013 and 95 for 2013–2015.
The HFA core indicators focused on inputs rather than outputs or outcomes. However, the Sendai Framework has seven global targets, four of which are outcome focused. Consistent with the shift to managing risk, the four targets from A to D are objective and measurable, with the reduction of disaster losses to be assessed relative to the size of national population and economy. Targets A and B explicitly allow international benchmarking of progress relative to the quantitative baseline data of 2005–2015.
Although the Sendai Framework was agreed prior to SDGs, negotiations for the post-2015 agreements occurred in parallel and were mutually supportive. Accordingly, the Sendai Framework anticipates the review of the United Nations General Assem-bly of “global progress in the implementation of the Sendai Framework as part of its integrated and coordinated follow-up processes to United Nations conferences and summits, aligned with the
Economic and Social Council, the High-level Politi-cal Forum on Sustainable Development and the quadrennial comprehensive policy review cycles, as appropriate, …” (para. 49). Similarly, the Sendai Framework recommended that indicators should be developed through an intergovernmental process by establishment of an Open-ended Intergovernmental Expert Working Group (OEIWG) on indicators and terminology relating to DRR. The work of this group took place in conjunction with the work of the Inter-agency and Expert Group on Sustainable Develop-ment Goal Indicators (IAEG-SDGs) (para. 50). From the second half of 2015, both intergovernmen-tal groups and respective Secretariats – UNDRR and the United Nations Department of Economic and Social Affairs (UN DESA) – have collaborated closely to develop the global indicators and moni-toring frameworks for the Sendai Framework and the 2030 Agenda.
Comprising experts nominated by Member States and relevant stakeholders, OEIWG developed the terminology relating to DRR and a set of 38 indica-tors of progress for the seven global targets. The recommendations for the indicators and the termi-nology were captured in the OEIWG report and were subsequently endorsed by the United Nations General Assembly in February 2017.7
OEIWG recommended that UNDRR takes forward the following work:
(a) Develop minimum standards and metadata for disaster-related data, statistics and analysis with the engagement of national government focal points, national disaster risk reduction offices, national statistical offices, the Department of Economic and Social Affairs and other relevant partners;
(b) Develop methodologies for the measure-ment of indicators and the processing of statistical data with relevant technical partners;
6 (United Nations 2007) 7 (United Nations General Assembly 2016b)
211

In parallel, Member States in IAEG-SDGs identified the explicit relationship between several targets of SDGs and DRR, namely SDGs 1, 11 and 13: eradica-tion of poverty, resilient and sustainable cities, and action to climate change. IAEG-SDGs subsequently recognized the indicators recommended by OEIWG in measuring progress against the targets under these goals. This OEIWG report was endorsed by the United Nations Statistical Commission, at its
To support the monitoring of the Sendai Frame-work and related elements of the 2030 Agenda, UNDRR was requested to develop an online SFM as the reporting mechanism for all Member States to report on their progress. UNDRR led a comprehen-sive process that included:8
forty-eighth session in March 2017. Common indi-cators, for which UNDRR was nominated as a custo-dian agency, are now in use for measuring progress in achieving the global Targets A–E of the Sendai Framework as well as the disaster-related targets of SDGs 1, 11 and 13. Monitoring between the two frameworks was therefore made a reality, reducing duplication of data-collection efforts and the report-ing burden for countries.
Figure 7.1. Sendai Framework and the 2030 Agenda – multipurpose data, integrated monitoring and reporting
(Source: UNDRR)
• The Sendai Framework Data Readiness Review, which was conducted by Member States to assess capacity and ability to report against the 38 global indicators of the seven global targets
of the Sendai Framework. This revealed gaps in data requirements of the Sendai Framework and data availability and monitoring capacity; no country reported that data was available or possible for all indicators.
• User-driven development of a prototype of the online SFM based on consultation with Member States and other partners. SFM was developed in partnership with the Enterprise Application Centre and went live on 1 March 2018.
212 Chapter 7

The first cycle of reporting using SFM and its disas-ter loss database subsystem began in March 2018 for Targets A–E and informed the deliberations of the 2018 HLPF on sustainable development.11 Rporting on the period 2015–2017 for Targets A–G took place in October 2018 and forms the basis of the analysis presented in Chapter 8 of this GAR.
7.2 Data required to monitor the targets
This section describes the types of country data required for monitoring the seven Sendai Frame-work targets. Such an overview will assist under-standing of how the monitoring system gathers and uses data.
The global targets listed in Table 7.1 require measure-ment of three separate but interconnected types of indicator:
8 (United Nations 2017)9 (United Nations 2017a); (UNISDR 2018b)10 (United Nations Economic and Social Council 2017)11 (United Nations Economic and Social Council 2018)
• Development of technical guidance notes on the agreed global indicators covering minimum standards of data and metadata for disaster-related data and statistics, and methodologies for the measurement of indicators.9 These were made available in January 2018 to assist Member States in the compilation of data for reporting using SFM. Initiated in OEIWG, when developing the technical guidance notes, UNDRR worked closely with NSOs of some Member States, as well as the statis-tical divisions of UN DESA and the United Nations Regional Economic Commissions (RECs) – in particular the United Nations Economic Commission for Europe (UNECE) and the United Nations Economic and Social Commission for Asia and the Pacific (ESCAP) – to support standard setting related to disaster statistics.
• Information reported in the monitor has been included in the 2017 and 2018 SDG reports of the 2018 High-level Political Forum (HLPF) on sustainable development. All indicators common to the targets of the Sendai Framework and SDGs are ranked as Tier I or Tier II in the SDG classification.10
• Comprehensive capacity-development exercises with national government institutions, to support Member States in systematic reporting using SFM. Designed to enable participation of a wide spectrum of stakeholders in the monitoring and reporting of progress – as effective risk reduction requires – national governments can select as many reporting insti-tutions across different government and admin-istrative levels as appropriate.
• Development of nationally determined custom targets and indicators – as per the recommen-dation of OEIWG – to support the monitoring of context-specific national strategies for DRR (Target E due to be achieved in 2020).
• Contributions from regional intergovernmental organizations to monitor and report progress of implementation in their regions using SFM.
• The first type measures the concrete outcomes at the national level of implementing risk reduction in accordance with the Sendai Framework, in terms of a reduction in losses and disaster impacts. This includes reduc-tions in mortality (Target A), number of people affected (Target B), direct economic loss (Target C) and damage to critical infra-structure and disruption to basic services (Target D). These targets measure some of the main benefits that implementing the Sendai Framework will bring for countries.
213

7.2.1 Targets A to D – disaster losses
Targets A, B, C and D are targets to reduce the losses attributed to disasters relating to mortality (A), number of people affected (B), economic loss relative to GDP (C) and damage to critical infra-structure and disruption of basic services (D). Each of these targets has several indicators of loss and damage. For example, Target A seeks a reduction in mortality caused by disasters and is measured by two indicators: number of deaths and number of missing people.
Each of these indicators may be presented in a more detailed way by disaggregating in relation to specific criteria/variables. For example, both of Target A’s loss indicators (dead or missing) can be disaggregated by age, sex, income level, disabil-ity, hazard and location. As a consequence, what appears as one number will, in reality, be many numbers that describe the different facets of the main indicator.
The purpose of disaggregated data is to add value and analytical power to the information. Data disag-gregated by age or sex, for example, will assist evidence-based understanding of how disasters differently affect children, youth, people with disabil-ities, older people or women in different stages of
their life cycle. Disaggregation by hazard supports a heightened understanding of the impact of specific hazards and risks on a given community.
Given the complexity of this process, paragraph 24(d) of the Sendai Framework recommends that countries “systematically evaluate, record, share and publicly account for disaster losses and under-stand the economic, social, health, education, environmental and cultural heritage impacts, as appropriate, in the context of event-specific hazard-exposure and vulnerability information.”
The best way to collect this data is by building, maintaining and systematically improving disaster loss databases. More countries around the world are using DesInventar Sendai, which is a simple and homogeneous methodology to collect, store, analyse and display data on losses caused by disas-ters. It uses definitions of hazards and impacts that are compliant with the Sendai Framework while employing indicators (including all 38 recom-mended by OEIWG) with possible disaggregation.12
Due to the level of detail at which this kind of data is captured, it is also possible to record losses associ-ated with a range of small- and medium-scale recur-ring events that cause and accumulate damage, allowing the estimation of what is known as “exten-sive risk”.13 These small- and medium-scale disas-ters are frequently absent from global disaster databases but can have a corrosive effect on lives and livelihoods, especially in poor and vulnerable communities and households.
The data of SFM represents annual aggregates of the impacts of a myriad of small-, medium- and large-scale disasters. disaster loss databases allow consolidation of the annual data reported via SFM. DesInventar Sendai can generate these figures or provide for the automated electronic transfer of information to the global targets area of SFM.
One of the subsystems of SFM is a multi-country disaster loss database where information from multiple country-based, independent databases is collated, harmonized and integrated. From this system, consolidated loss data is automatically
• The second type relates to Targets E and G and is a qualitative measure of how Member States have established the political and institutional mechanisms to enable them to reduce risk in line with the Sendai Framework, namely the development of DRR strategies and progress in the areas of multi-hazard early warning systems (MHEWSs) and risk information.
• The third type measures enhancements in international cooperation in line with Target F, which is not a measure of a concrete outcome or national implementation, but of the level and type of support for DRR from within the interna-tional community.
214 Chapter 7

14 (UNISDR 2018b)12 (UNISDR 2019a)13 (UNISDR 2013b)
transferred to the corresponding targets and indica-tors from the SFM main system.
This large database (approximately 700,000 records at the time of writing) is made public along with GARs and is built using DesInventar Sendai. It is important to note that DesInventar Sendai is not used by all countries, although those Member States that build their own loss databases comply-ing with the specifications in the technical guid-ance notes may use one of several alternatives for detailed loss data transfer to the Sendai Framework loss database.
Effective monitoring is ultimately in the hands of Member States, necessitating their active and sustained participation. A first review demonstrated the need for more detailed, well-structured disaster loss databases at national level, to enable measure-ment of outcomes under Targets A–D. This will be an area for focus on capacity-building and institutional coordination at national level in coming years. Such systems are valuable tools and data sets, which will contribute to a better understanding of risks and disaster impacts globally and at national level.
7.2.2 Target E – risk reduction strategies
Targets E and G differ from Targets A–D and F, in that they are qualitative in nature. Consequently, the nature of the data and thus the processes required to collect the data are distinct. Instead of taking numbers from a data source such as loss reports or national budget figures, those who report on Targets E and G must be familiar with the policy framework for DRR in their countries.
Target E, whose deadline for achievement is 2020, has two global indicators: (a) the number of coun-tries that adopt and implement national DRR
strategies in line with the Sendai Framework and (b) the percentage of local governments that adopt and implement local strategies in line with national strategies.
When reporting, Member States need to first iden-tify the existence of national and local strategies, then apply 10 evaluative criteria of alignment of the national disaster strategy with the Sendai Frame-work. In this way, an indicative total “score” of the strategy’s alignment is possible from a series of qualitative judgments.14 Evaluators of the criteria will need expertise in DRR as well as familiarity with the strategies and relevant institutional archi-tecture, legislation, availability of information, and programmes and processes associated with DRR in their country. There is a subjective element, as intermediate scores can be assigned optimisti-cally or pessimistically with the corollary impact on the assessment score. But for as long as they are consistent over time and recognized as a qualita-tive measure of a different type than data such as disaster loss statistics, the criteria provide a useful methodology to assess national risk reduction strategies.
7.2.3 Target F – international cooperation
Target F requires the provision of financial data on international cooperation from recipient countries and provider countries.
Provide country data: Data for this target includes that reported on an annual calendar year basis by statistical reporters on international cooperation in national administrations. A statistical reporter, usually located in the national aid agency, Minis-try of Foreign Affairs, or Ministry of Finance or Economy, is responsible for the collection of devel-opment assistance statistics in each country/
215

agency.15 Historically, neither all donors nor recipi-ents have systematically produced data pertaining to DRR; therefore, the requirements of the Sendai Framework reporting are expected to catalyse systematic collection of this data.
The technical guidance notes on Target F recom-mend statistical reporters apply a new policy marker for DRR, adopted by the OECD Working Party on Statistics,16 which supports the statistical analysis of financial flows from provider to recipi-ent countries. OECD designed the marker to inform deliberations of the OECD Development Assistance Committee (DAC). The marker is a qualitative statis-tical tool to identify and record aid activities that target DRR as a policy objective. It offers a method-ology for greater specificity for providers and recipi-ents. Data based on the marker provides a measure of the aid that DAC members (or, depending on where the marker and methodology is applied, within the aid budget of a ministry or appropriate agency) allocate in support of DRR, including a snapshot of:
In adopting the marker methodology, providers and recipients of aid have further options to gener-ate disaggregated data, such as by sector. This is an approach consistent with that proposed for Targets A–D, wherein disaggregated data can be collected and used at the national level to inform policy and administrative decisions and at the international level to identify global trends, challenges and priorities for investment in risk reduction.
Recipient country data: OEIWG also encouraged recipient countries to provide information on the
estimated amount of national DRR expenditure. By calculating national DRR expenditure using data from national accounts, recipient countries can estimate the proportion of total expenditure on national DRR actions that is accounted for by official international support. This responds to the observations of OEIWG members of the impor-tance of demonstrating government policy lead-ership (of developing countries) in measuring the target.
The Rio Marker methodology, initially developed by OECD to track public investment in CCA, and later modified by UNDRR to be applied to DRR, has been tested in five countries of the South West Indian Ocean region and subsequently in 15 more countries in Asia, Latin America and Africa, where it helped to estimate national expenditure of recipi-ent countries as part of a risk-sensitive budget review (RSBR).17
RSBR is a simple, systematic, quantitative analy-sis of a budget, or series of budgets, that enables countries to estimate and take credit for invest-ment in DRR (the budget review methodology is described in Annex A18 of each national report), and some countries are beginning to use this method to review public investment planning and financing strategies.19 20 If RSBR is conducted by a national government, the findings typically track public investment and can include inward financial flows. An RSBR conducted on a series of annual budgets allows for the identification and tracking of trends over time. An RSBR that also catego-rizes components of risk management can point to trends in focus such as increasing investment in prevention/risk reduction, as opposed to repeated response to disasters.
RSBR and OECD DRR aid marker methodolo-gies can be combined by countries during budget reviews, depending on their context, to effectively obtain all of the figures required to report in SFM the international aid received, aimed at national DRR actions.
• Individual DRR-focused projects/programmes
• Global estimate of aid committed for DRR
• Proportion of DAC member aid focused on DRR
• Sectors prioritized for DRR-focused aid
• Investments within individual sectors
• Aid prioritized by countries for DRR-focused purposes
216 Chapter 7

15 (OECD 2018b)16 (OECD 2017c)17 (UNISDR 2015f)18 (UNISDR 2015d)
7.2.4 Target G - availability of and access to multi-hazard early warning systems and disaster risk information
Target G entails a series of qualitative measures to assess progress in substantially increasing “the availability of and access to multi-hazard early warning systems and disaster risk informa-tion and assessments to the people by 2030.” It has six global indicators, relating to the quality of MHEWSs, as well as that of disaster risk informa-tion and assessments. One of the indicators (G-6) is a unique output indicator that quantifies the impact and effectiveness of early warning information in terms of evacuated people.
Reporting for Target G requires a complex set of qualitative data around effective national systems for MHEWSs, for which guidance is provided in the UNDRR technical guidance manual.21 The guid-ance is based on the deliberations of OEIWG that have also been informed by experts, through open consultations. The guidance also draws on the MHEWS checklist.22
7.3 Conclusions
The centrality of risk reduction to sustainable urban-ization and development and CCA is unquestioned and hardwired into the post-2015 global develop-ment agendas. Ongoing effort at global, regional and national levels demonstrate a collective inten-tion to foster and implement holistic and risk-based approaches to generating resilient and sustainable economies and societies. While data availability and capacities to realize this ambition are gradually increasing, activities are also scaling up at interna-tional, regional, national and subnational levels and define a direction of travel that will be explored in more detail in Part III. However, it is critical to main-tain momentum and continue coordinating global and national efforts in terms of strengthening statistical capacity and reporting moving forward. If those who are furthest behind are to be reached first, a sense of urgency is needed. This should be translated into political leadership, sustained funding and commitment for risk-informed policies supported by accurate, timely, relevant, interoper-able and accessible data.
19 (UNISDR 2015b); (UNISDR 2015c); (UNISDR 2015e)20 (UNISDR 2015b)21 (UNISDR 2018b)22 (WMO 2017)
217

Chapter 8:Progress in achieving the global targets of the Sendai Framework
The 2018 report of the United Nations Secretary-General on implementation of the Sendai Frame-work emphasized the vital importance of “a comprehensive overview of progress towards the seven global targets of the Sendai Framework and the disaster risk reduction targets of the Sustain-able Development Goals” to guide discussions at the HLPF and Global Platform for DRR in 2019.23
The online SFM system is the official Member State reporting mechanism and is complemented by the preparation and release of technical guidance notes. The monitoring system provides an avenue for national reporting on:
Monitoring requires significant effort by Member States to collect, enter and validate all data required by the indicators that were agreed by the United Nations General Assembly and the United Nations Statistical Commission.
Using the data from the SFM system, including the disaster loss database complemented with data from other sources, this chapter focuses on a quan-titative analysis of the progress made by countries towards the achievement of the global targets of the Sendai Framework (A–G). It does so through a detailed analysis of specific trends, patterns and distribution of selected indicators, based on avail-able data from reporting to date in the online moni-toring system. It also introduces the structure of the monitoring system, showcases results achieved and, where possible, data trends, while demonstrat-ing the level of participation and engagement of Member States in the monitoring process.
• Seven Sendai Framework global targets based on the agreed 38 indicators
• Eleven indicators in three SDG goals, of which UNDRR is the custodian
218 Chapter 8

8.1 Sendai Framework Monitoring database
The new online Sendai Framework Monitoring system is a state-of-the-art system built to support all the new indicators, extended hazards types and meta-data mechanisms that were recommended by OEIWG and adopted by the United Nations General Assem-bly. It can be accessed at https://sendaimonitor. unisdr.org.
The related online tool for disaster loss and damage data collection, DesInventar Sendai, accessible at https://www.desinventar.net, was launched on 15 January 2018. The existing databases in the
UNDRR public repository of loss and damage data were migrated to also support the requirements of OEIWG. This improved system will enable the collection of detailed disaster loss and damage data at all scales (temporal and spatial) using common methodologies. It also allows the capture of disaster information that is location- and time-stamped, contributing to a strong analysis of disas-ter loss and damage. Member States were invited to participate in monitoring and to start data-collection processes as soon as possible; the first milestone for data reporting that contributed to the SDG monitoring and reporting was set for 31 March 2018.
Cyclone Pam made downfall on Vanuatu (2015), destroying and damaging 15,000 homes(Source: Silke von Brockhausen/UNDP Vanuatu)
23 (United Nations General Assembly 2018)
219

8.1.1 How the loss data subsystem contributes to data on the global targets
As of the time of writing of this GAR, data is avail-able for 104 countries in DesInventar format. These databases contain detailed locally collected data on disaster losses, enabling a representative view of the way the impact of disasters affects countries. This initiative is an open data and open source initiative, making the information available for governments, affected communities and other stakeholders, including the private sector. Analysis presented in the following sections has been generated based on data from the SFM consolidated loss database.
target is Target A, on mortality, for which 63 coun-tries supplied data for at least one year. Target B was reported by 53 countries, Targets C and E by 56, Target D by 33, Target G by 48 and Target F by 36.
Within each target, there are also differences in reporting of the different indicators, which reflects the availability of data and collection challenges. The most evident of those is Target F (international cooperation), for which around half the countries
reporting were unable to provide data on any of the eight indicators (19 out of 36).
8.1.3 New types of data that may come to the monitoring system in the future
As of July 2018, the Sendai Framework Monitoring system allowed Member States to set up nationally
8.1.2 Member State participation in the monitoring system in 2018
By 31 October 2018, ninety-six countries had started to use the Sendai Framework Monitor-ing system, out of which 79 were entering global targets data with different levels of progress on each target. Another 16 countries had started defining their institutional settings or entering the socioeconomic data required in the system such as population, GDP, exchange rate and other variables.
Among those 79 countries that entered indica-tor data, by far the most commonly reported
Figure 8.1. Progress on global targets, SFM (as of October 2018)
(Source: UNDRR, SFM)
220 Chapter 8

defined and customized targets and indicators, in addition to those already defined and built into the system for the Sendai Framework global targets. There are several important reasons a Member State may wish to do so. Measuring the level of implementation of the Sendai Framework global targets can capture only some aspects of prog-ress in a country. But the Sendai Framework is a complex document that contains a broad set of suggested measures to reduce risk and losses. Countries will need to verify to what extent these recommendations and measures are applicable to their circumstances, and accordingly may want to measure their own level of implementation in a way that informs policy implementation. Further-more, according to Target E, national DRR strategies should have national “targets, indicators and time frames”, and custom indicators that are part of the Sendai Framework Monitoring system.
Member State efforts to define systems of custom targets and indicators are incipient, such that a detailed analysis is not possible. It is expected that, as part of the efforts to reach Target E, Member States will design a variety of custom targets and indicators in national DRR strategies, as suggested by Priority 2 of the Sendai Framework.
8.2 Disaster losses: Sendai Framework Targets A–D
8.2.1 Achievement of Targets A–D: are losses being reduced?
As the development of the reporting system for Member States required extensive expert inputs and consultations, the data collection and report-ing period has been brief so far, and the number
of countries providing data is too small to provide in-depth trend analysis. The following findings are therefore qualified, but make the best use of avail-able data, including comparison with other data sources.
Two of the targets, mortality (A) and direct economic loss (C), were compared with global data sources. Analysis confirmed that progress found appears to be correct, as data series from all sources present the same trends – despite limita-tions in the scope and composition of the indicators available in global data sets. Most of the conclu-sions on the achievement of the first four targets are rather positive, especially when relative values are taken into consideration. As economies grow and the world population increases, more assets and people are exposed, which affects the interpre-tation of indicators such as the number of deaths or economic losses. Relative values allow inference of more accurate conclusions on the real impacts and magnitude of disasters over time for differ-ent people. For example, in absolute terms, richer households may lose more as they have more to lose. Although absolute figures are useful – they offer information on the trends and costs of disas-ters – they often fail to detail how disasters affect people’s lives in the long run. Most important in disaster loss data analysis is the proportion of income or assets lost, as the severity of losses depends on who and how they experienced it.
8.2.2 Target A – mortality: a confirmed long-term decline in fatalities relative to population size
The first of the global targets refers to the reduc-tion of mortality attributed to disasters. Mortality is decreasing in absolute and relative terms in the data gathered for the countries participating in the Sendai Framework Monitoring process, as well as in other global data sets.
Ultimately, Targets A and B, mortality and number of people affected by disasters, will require a compari-son between the HFA years of 2005–2015 and the
221

final decade of the Sendai Framework of 2020–2030. Only 35 countries have a complete set of data from 2005 to 2017. In 2016 and in 2017, 69 and 81 countries reported mortality data, respectively, but these countries are not the same as the group that
Figure 8.2 reports mortality data from SFM and EM-DAT over the period 2005–2015. Numbers reported by countries in the Sendai Framework Monitoring system are higher than in EM-DAT by an average of 39%, and as much as 300% higher in some years, due to different methodologies applied to the data sets. The thresholds applied by EM-DAT on what constitutes a disaster (at least 10 people killed, 100 affected, declaration of a state of emergency and call for international assistance) mean that many small- and medium-scale disasters are not considered. This differ-ence can be significant, especially for countries not exposed to large-scale hazardous events, or in years where large-scale disasters do not dominate the data.
has completed the HFA baseline. Therefore, the following preliminary analysis mostly focuses on the 83 countries that completed the HFA baseline and examines the period 2005–2015.
Global mortality appears to decline from 2005 to 2015 when looking at data reported in both data-bases (Figure 8.2). Several reasons may account for this. Numerous studies24 and previous GARs have highlighted this trend and have associated contin-ued economic development and better disaster management with reduced mortality, especially for those types of hazards for which early warning is possible. In addition to better and more available EWSs, which have demonstrated to be effective in hydrometeorological events, Part I discussed the added value of vulnerability analysis and the need to establish metrics for those dimensions of disas-ter impacts that accrue to the most vulnerable.25
Wh i le ev idence across the g lobe demon-strates the direct links between resilience and
Figure 8.2. Mortality reported nationally in the Sendai Framework Monitoring system and globally in EM-DAT for 83 countries and territories with baseline completed, 2005–2015
(Source: UNDRR with data from DesInventar and EM-DAT) Note: 2010 appears low due to the absence of Haiti in the sample.
222 Chapter 8

vulnerability reduction, improved data and analy-sis when moving forward to monitoring the Sendai Framework will be able to better reveal these rela-tionships and inform action and budgeting in the right directions. Other possible explanations of the reduction of mortality is the active work of Member States in reducing the stock of risks, for example the construction of flood defences in many areas of the world, better preparation for large-scale events (including the design of shelters and evacu-ation facilities) or retrofitting buildings to comply with seismic regulations.
Mortality numbers in the last two decades have continued to be driven by large geological events, accounting for 51% of worldwide mortality (EM-DAT), and 39% of all fatalities in the sample of
Other patterns previously discovered in the distribu-tion of mortality remain valid. In particular, mortality due to disasters is concentrated in lower-income countries, still accounting for the majority of overall disaster deaths.
Countries with higher relative mortality are concen-trated in low- and lower–middle-income groups (Figure 8.4). For example, of the top 20 countries by disaster mortality in proportion to their popula-tion for the years 1990–2017, the top five are low- or lower–middle-income countries, and only five are upper–middle income. Haiti, with by far the
the SFM baseline in the same period. Other data sources and studies confirm this pattern. There are several possible reasons for this concentra-tion, including that warnings for earthquake events are not possible or not effective, and the enormous size of the current stock of existing risk in buildings and infrastructure that are not earthquake resistant (these are extremely costly and time-consuming to retrofit, despite the efforts of owners and gov-ernments and improved and better-enforced con-struction codes and land-use plans). In addition, tsunami warnings can, in some cases, give enough lead time to save lives, as demonstrated in Japan in 2011. However, a tsunami event killed more than 1,500 people following a 7.5 magnitude earthquake in Palu, Indonesia, in October 2018, with only a 4-minute lead time and a less-effective EWS.
highest figure of 91.33 deaths per 100,000 popula-tion was largely affected by earthquakes, followed by a cholera epidemic in 2010, and storms and floods in 2004. The second-highest figure comes from Myanmar, with a high death toll from cyclones (e.g. Cyclone Nargis), tropical storms, floods and landslides.
Figure 8.3. Hazard distribution of mortality 1997–2017, for all countries in the Sendai Framework Monitoring system
24 (Guha-Sapir et al. 2017); (Below and Wallemacq 2018)25 (UNISDR 2017e); (Walsh and Hallegatte 2019)
(Source: UNDRR with data from DesInventar)
223

Figure 8.4. Mortality from disasters concentrated in a few intensive events, 1990–2017
(Source: UNDRR with data from EM-DAT)
A high concentration in intensive disasters can be observed when analysing trends in disaster mortal-ity (Figure 8.4). Nearly half of the total mortality since 1990 is dominated by four big events. The 2005 earthquake in Pakistan accounted for 64% and 93% of global mortality recorded in SFM and EM-DAT, respectively, in 2005. The 2008 cyclone
in Myanmar accounted for 85% and 97% of global mortality recorded in SFM and EM-DAT, respec-tively, in 2008. Although these figures point to an upward trend, this trend is statistically insignificant as it changes arbitrarily subject to the time period chosen and specific intensive disasters in the respective period.
As shown in Figure 8.5, which reports data compiled from baseline countries and a sample of all SFM countries, low-income countries are characterized by a much higher number of deaths and missing persons relative to population size than any other income group. Generally, the average ratio of deaths and missing persons to 100,000 people
tends to be lower for countries classified in higher-income groups. When compared to income groups, SIDS have, on average, higher ratios than lower–middle-income countries on average. Taking into account that data for SIDS remains largely incom-plete, Figures 8.5 and 8.6 may be underestimated.
26 (Samoa 2018) 27 (UNISDR 2015a); (United Nations General Assembly 2017c); (United Nations General Assembly 2014b)
224 Chapter 8

SIDS have been repeatedly recognized as a special case requiring intensified attention and funding for sustainable development, in view of their unique characteristics and intrinsic vulnerabilities to envi-ronmental and economic shocks. Future disaster losses represent an existential threat for many SIDS.
In the midterm review process of the Samoa Pathway, world leaders called for urgent action to address the systemic risks and vulnerabilities SIDS continue to face:
We remain deeply concerned about the esca-lating devastation already being inflicted on SIDS by the adverse impacts of climate change and…… we reaffirm our solidarity with our members impacted by increased intensity and frequency of natural disasters. We further call for the prevention of new and the reduction of existing disaster risk through the implementa-tion of integrated and inclusive economic, struc-tural, legal, social, health, cultural, educational, environmental, technological, political, financial and institutional measures that prevent and
reduce hazard exposure and vulnerability to disaster, increase preparedness for response and recovery thereby strengthening resilience.26
Such vulnerabilities relate to small population size and land masses, spatial dispersion, remoteness, narrow resource and export base, subdued trade growth, high levels of national debt and exposure to global environmental challenges, including a large range of impacts from climate change.27 In several cases, weak human, technological and institu-tional capacities, coupled with scarcity of domestic resources and inequality, induce a vicious cycle of low productivity and investment and limited tech-nology transfer.
SIDS are faced with a particular web of challenges making them less able to mobilize and attract the significant amount of necessary finance to imple-ment the 2030 Agenda, as compared to other developing countries. For instance, most SIDS are classified as middle-income countries and do not meet the eligibility criteria for concessional loans from multilateral and bilateral lending insti-tutions, despite their disproportionate exposure
Figure 8.5. Yearly average number of deaths and missing persons per 100,000 people, income groups and SIDS, 2005–2017
(Source: UNDRR with data from DesInventar and World Bank) Note: Baseline countries in the analysis refers to countries that consistently reported data over the period 2005–2015.
225

Figure 8.6. SIDS yearly average number of deaths and missing persons per 100,000 people, by country, 2005–2017
to environmental and economic risks. The United Nations, the World Bank, the Commonwealth Secre-tariat, the Caribbean Development Bank and several other international organizations have established a
Figure 8.6 shows the yearly average number of deaths and missing persons per 100,000 people in the period 2005–2017, for the top 15 countries with the highest ratios among SIDS. It is evident that disasters represent an existential threat for several SIDS and can derail an island’s entire economy. Without tropical cyclones, for instance, the World Bank estimates that Jamaica’s economy would be expected to grow by as much as 4% per year. However, over the past 40 years, it has grown 0.8% annually. Similarly, when Hurricane Maria struck Dominica in 2017, it caused damage and losses equivalent to 226% of the country’s GDP.29 Figure 8.7 captures the same ratio, but for groups of country
joint technical working group to study how they can best support countries to gain access to finance on terms and conditions that are appropriate to their circumstances.28
in terms of geographic location. It is observed that Asia and Oceania, followed by Africa, are the regions with the highest number of ratio of deaths and missing persons per 100,000 people.
Long-term trends
As previously stated, trends reported in Figure 8.2 based on 11 years of data may have limitations, even though this is the latest available data to inform future measurement of progress towards the target. For example, the reduction in mortal-ity appears to be entirely driven by the higher
(Sources: UNDRR and the World Bank)
28 (Hurley 2017) 29 (Kreisberg et al. 2018)
226 Chapter 8

frequency of large-scale events between 2005 and 2010 compared to the subsequent period, which may not be representative given the short period of time. It could be assumed that the frequency of large-scale events causing high numbers of fatali-ties is the real driver of trends in global mortality in
the short term. Therefore, longer periods of time are required to draw clearer conclusions.
Figure 8.8 thus examines a 41-year period using EM-DAT data. The downward-sloping fitted line shows that the ratio of deaths to 100,000 people
Figure 8.7. Yearly average number of deaths and missing persons per 100,000 people, by region, 2005–2017
(Source: UNDRR with data from DesInventar)
Figure 8.8. Relative global mortality per 100,000 population), 1977–2017
(Sources: EM-DAT, United Nations statistics, processed by UNDRR)
227

Figure 8.9. Absolute global mortality (EM-DAT), 1977–2017
has declined from 1977 to 2017. The yearly average of the ratio of deaths to 100,000 people was 1.56 for the period 1977–1996 and dropped to 1.08 for 1997–2017.
In SFM, the average of number of deaths and missing persons attributed to disasters, per 100,000 people (Indicator A-1), or other relative indicators such as number of people affected by disaster per
(Sources: EM-DAT, United Nations statistics, processed by UNDRR)
Figure 8.10. Indicator A-1, mortality by 100,000 people with data for 2017 from 81 Sendai Framework Monitoring system countries
(Source: UNDRR) Disclaimer: The boundaries and names shown, and the designations used on this map do not imply official endorsement or accep-tance by the United Nations.
228 Chapter 8

Countries that build and maintain detailed loss databases could use this technique to produce proxy risk maps, which can be useful representa-tions of recurrent and localized hazards such as weather-related or biological hazards, even at a low level of resolution. Earthquakes, tsunamis and other less-frequent hazards cannot be represented with
100,000 (Indicator B-1), or direct economic loss in relation to GDP (Indicator C-1) for each country over the reporting period, could be seen as a risk map if a long enough history of losses and popula-tion could be gathered (Figure 8.10). So far, there is insufficient data for these maps to be produced with a high statistical confidence. If Member States continue monitoring the Sendai Framework, data for a map like this would become enriched and eventually could offer useful insights as to the
such tools, neither would they replace mathematical modelling of the type conducted by risk research-ers. They would be limited by the degree of resolu-tion possible from available data, but they provide a powerful means of validating models with direct data of experienced losses.
advancement in the implementation, progress and impact of the Sendai Framework.
GAR09 featured a multi-hazard (major natural hazards) map of the world. Abstracting the empty areas of the world in the Sendai Framework Moni-toring system data, there is a good resemblance between the map of relative mortality (A-1) and the GAR09 mortality risk map.
Figure 8.11. Mortality risk index, global risk assessment – GAR09
(Source: UNDRR) Disclaimer: The boundaries and names shown, and the designations used on this map do not imply official endorsement or accep-tance by the United Nations.
229

Figure 8.12. Indicator B-1a, number of people affected, in SFM 83 countries with 2000–2015 data
8.2.3 Target B – people affected
A proxy for the number of people directly affected by disaster can be made through: (a) the number of people who require medical attention (injured or ill), (b) those who are living in dwellings damaged or destroyed by disasters and (c) those whose liveli-hoods are affected. While some double counting will occur (e.g. those injured and living in affected dwell-ings), the main objective of this proxy is to verify trends. Consequently, it aims to measure the achieve-ment of the target on the basis that if these numbers grow, then the total number of people affected must be growing, and vice versa. If this proxy measure trends downwards, it would be safe to assume the total number of affected people was decreasing.
Application of these methodologies requires impor-tant data. Each indicator for the relative number of people affected by disasters in a country faces chal-lenges, especially the determination of the number of those whose livelihoods were affected. Targets A and B of the Sendai Framework require dividing loss
data by population, so that the numbers are relative to population and therefore more comparable with each other within a country, and among countries.
For this GAR, good data was available for the first five indicators of Target B: relative number affected in the population (B-1), ill or injured people (B-2) and damaged and/or destroyed dwellings (B-3, B-4 and B-5). However, for the livelihoods indicator (B-6), it was possible to estimate the number of workers associated with losses in agriculture only, not in other sectors. As more countries report in the moni-toring system, including better reporting on produc-tive assets lost (Indicators C-2 and C-3), these indicators will be able to account for more of the affected people.
Figure 8.12 shows the calculated number of affected people relative to population size over 16 years. Data from 83 countries that had highly consistent reporting for 2000–2015 is shown. No clear trend emerges from the figure, and high ratios must be treated with caution – for instance, 2015 is domi-nated by the earthquake in Nepal and fewer coun-tries reported data for this year.
(Source: UNDRR data)
230 Chapter 8

This contrasts with Target A, where relative trends are showing a decrease in mortality. This may be a reflection of the good results on reducing mortal-ity risk, achieved with preventive measures such as evacuations, better EWSs and less vulnerabil-ity in many exposed elements, most notably in the housing sector (Figure 8.20, showing the trend of relative losses in this sector). However, other impacts that are included in the calculation of affected people, including injuries and disruption of livelihoods, especially agriculture, and the econom-ics of the associated damage seem to be growing in contrast to the decrease in mortality.
People affected and systemic risks – the face of displacement
As demonstrated throughout this GAR, a single unavoidable natural event may trigger prevent-able repercussions across sectors and systems that expand the breadth, duration, scale and size of adverse consequences. These negative impacts may come in the form of internal and cross-border population movements, preventable business disruption, economic distress, social unrest, hunger, poverty and diseases, to name just a few.
Over the period 2008–2018, disasters stemming from natural hazards have displaced an average of 23.9 million people each year.30 Disasters, which are the main triggers of forced displacement recorded – show no signs of abating.31 People choose to respond to disaster impacts with a web of in situ and ex situ strategies, including mobility. They may flee to other areas within their country or cross borders32 in search for a safer and less exposed place. Other forms of human mobility – includ-ing forced displacement, voluntary migration and planned relocation – are occurring in response to hazards and environmental degradation, or in antici-pation of those. Economic motives pay a key role as push and pull factors shaping migration paths from rural to urban centres.
On a global scale, the Internal Displacement Moni-toring Centre (IDMC) counted 17.2 million people as newly internally displaced due to climate-related disasters and natural hazards in 2018. Displace-ment in the context of disasters is a global and increasingly alarming reality. According to the UNHCR Protection and Return Monitoring Network, around 883,000 new internal displacements were recorded between January and December 2018, of which 32% were associated with flooding and 29% with drought. Many more people are believed to be on the move, resulting from the slow-onset effects of climate change and environmental degrada-tion.33 The effects of climate change are predicted to increase the irregularity and intensity of extreme weather events, as well as to drive slow-onset disaster displacement risk through exacerbating existing natural resource scarcity such as water stress. The situation in Yemen, one of the world’s most severely water-stressed countries, is a clear example and reminder of the face of displacement over dwindling resources.
Figure 8.13. Disaster-related new displacements by hazard category
32 (The Nansen Initiative 2015)33 (Internal Displacement Monitoring Centre 2018)
30 (Irish Red Cross 2018)31 (Internal Displacement Monitoring Centre 2017)
(Source: IDMC data 2019)
231

In an increasingly interconnected and interdepen-dent world, displacement may exacerbate vulner-abilities by exposing people to new risks and challenges such as inequality, climate change, poverty, under/unemployment and fast-paced urbanization. Fleeing home to escape the impacts of a hazard is often a decision between life and death. But disaster displacement – which includes evacuation and, in some cases, planned reloca-tion following environmental stressors – often has severe and long-lasting social, economic and legal impacts, particularly in protracted contexts.34 Climate change effects and poor natural resource management, leading to the gradual erosion of live-lihoods, are often decisive factors for alternative household strategies, to diversify risks of environ-mental stressors and disaster impacts. Fast-paced and unplanned urbanization comes with new risks. Employment opportunities for IDPs are often confined to poor-quality daily labour, which has a negative impact on household budgets, savings and spending, and compounds IDP ability to further manage risks and cope with negative shocks.35 In
addition, IDPs are often obliged to settle in high-risk areas – such as floodplains, subsiding land or hillside slopes – which are less controlled and often the most affordable yet hazard-prone areas. This further increases the likelihood of secondary displacement risk.36
The Sendai Framework pays due attention to the systemic complexities of population movements as drivers of risk, but also as opportunities for strengthened resilience. It highlights consequences of disasters in terms of displacement, but equally acknowledges the contributions that migrants can make – through remittances, networks, skills and investments – in addressing root causes and promoting resilience. The relationship between DRR and disaster displacement has also been recog-nized by the Global Compact on Migration, aiming to mitigate the adverse drivers and structural factors that hinder people from building and main-taining sustainable livelihoods.
Figure 8.14. Total new displacements in absolute and relative terms, 2018
(Source: UNDRR with data from IDMC 2019)
232 Chapter 8

Figure 8.15. New displacements due to disasters and conflict, 2008–2017
(Source: IDMC data 2018)
However, Figures 8.13–8.15 demonstrate that advancements in the development of global nor-mative frameworks and policies have not been matched by implementation and adequate invest-ment in preventing and addressing disaster-induced displacement challenges.37 Without scaled-up action to reduce risk and strengthen resilience, vulnerabil-ity and exposure will continue contributing to driving disaster risks upwards over the years to come.38
8.2.4 Target C – direct economic loss
Absolute and relative loss data
For a long time, statements such as “losses are growing exponentially” and “rising losses reached unprecedented levels” have dictated discussions of economic losses due to disaster. These estimates are useful for indicating the “stocktake” of average losses. Figure 8.16 demonstrates that overall losses and insured losses, adjusted to take into account inflation, significantly increased from 1980 to 2017. However, these figures fail to determine and provide finer detail on how disaster losses affect people’s lives.
34 (UNISDR 2018a)35 (Santos and Leitmann 2016)36 (UNISDR 2014)
37 (Internal Displacement Monitoring Centre 2018)38 (UNISDR 2015a)
233

A somewhat different picture emerges from several studies that examined economic losses by relat-ing the data to the size of the population or the economy. This approach looks at losses relative to exposure, be it size of population, GDP, capital stock, etc., as well as changes in the size and shape of the economy driven by forces such as inflation and wealth growth.39
The Sendai Framework mandates a certain type of methodology for economic loss data by stating that Target C is to be the reduction of direct disas-ter economic loss in relation to global GDP by 2030. When figures of losses are divided by GDP, a differ-ent perspective on relative damage emerges, as shown later in this section.
Increases in the level of recorded loss in current data may occur because the monetary value of the exposed elements is higher and because more of these valuable assets are exposed. These factors should not be confused with higher risk. Individual
assets have a specific level of risk, which is inde-pendent of the value of the asset, and is indepen-dent of the existence of other assets also being exposed. Dividing losses by GDP also reflects better the changing levels of risk.
Using the available date, the following sections measure the extent to which Target C is being achieved by participating countries, and show the behaviour of economic losses. As with the case of mortality, there is a group of countries that has complete data for the years of the baseline (2005–2015), and a different set of countries that reported only for 2016 and 2017. This hampers the possibil-ity of a full-period consistent analysis.
It is also important to recall that Target C does not explicitly set a minimum period of data to be anal-ysed. If the results being monitored are to corre-spond to those of the Sendai Framework period, then waiting until year 2030 to analyse trends between 2015 and 2030 could be too late. However, the work of countries on reducing risk did not start in 2015. The HFA period should also be taken into account, and even some years before the two frameworks (a period when DRR was less high in
Figure 8.16. Overall and insured disaster losses, 1980–2017
(Source: UNDRR with data from Munich Re)
39 (Barthel and Neumayer 2012); (Barredo 2009)40 (Zapata Martí and Madrigal 2009)
234 Chapter 8
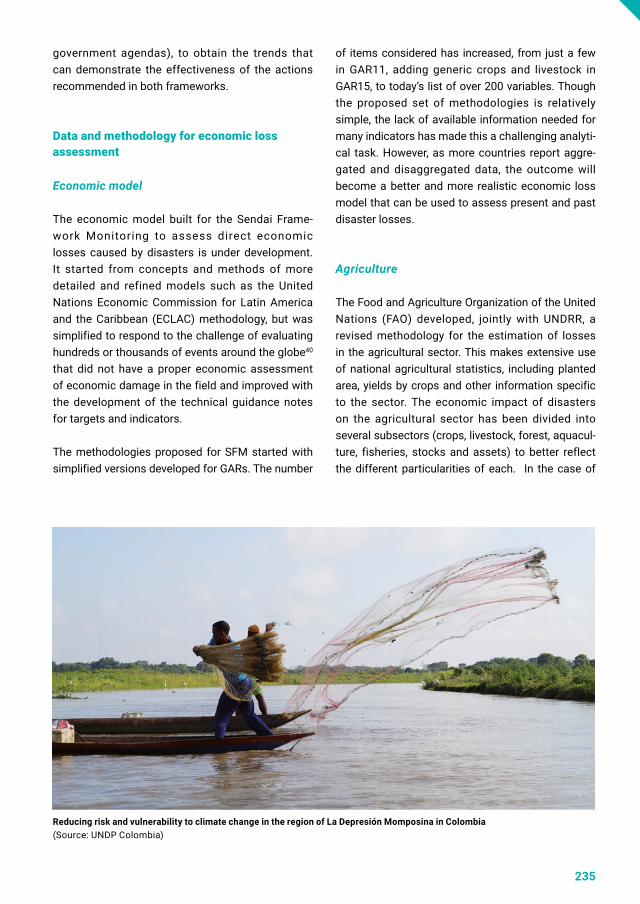
government agendas), to obtain the trends that can demonstrate the effectiveness of the actions recommended in both frameworks.
Data and methodology for economic loss assessment
Economic model
The economic model built for the Sendai Frame-work Monitoring to assess direct economic losses caused by disasters is under development. It started from concepts and methods of more detailed and refined models such as the United Nations Economic Commission for Latin America and the Caribbean (ECLAC) methodology, but was simplified to respond to the challenge of evaluating hundreds or thousands of events around the globe40
that did not have a proper economic assessment of economic damage in the field and improved with the development of the technical guidance notes for targets and indicators.
The methodologies proposed for SFM started with simplified versions developed for GARs. The number
of items considered has increased, from just a few in GAR11, adding generic crops and livestock in GAR15, to today’s list of over 200 variables. Though the proposed set of methodologies is relatively simple, the lack of available information needed for many indicators has made this a challenging analyti-cal task. However, as more countries report aggre-gated and disaggregated data, the outcome will become a better and more realistic economic loss model that can be used to assess present and past disaster losses.
Agriculture
The Food and Agriculture Organization of the United Nations (FAO) developed, jointly with UNDRR, a revised methodology for the estimation of losses in the agricultural sector. This makes extensive use of national agricultural statistics, including planted area, yields by crops and other information specific to the sector. The economic impact of disasters on the agricultural sector has been divided into several subsectors (crops, livestock, forest, aquacul-ture, fisheries, stocks and assets) to better reflect the different particularities of each. In the case of
Reducing risk and vulnerability to climate change in the region of La Depresión Momposina in Colombia (Source: UNDP Colombia)
235

agricultural crops and animal produce, the values countries are requested to report on – hectares and number of animals, respectively – must be trans-formed to match the units of the available economic value. This is possible to calculate when enough data is available. For example, for a particular year and crop, the number of lost hectares is multiplied by the expected yield by the average value per tonne.
Unfortunately, information on prices and yields is not always locally available for all countries, crops and years. In many cases, data can be drawn from FAOSTAT information, but there will still be impor-tant data gaps. To fill these, regional clusters of prices are estimated based on similar GDP per capita (GDPPC). When any country has missing
information, the respective cluster data is used. In extreme cases, the world average must be used. In the case of animal product, a similar logic is followed, with the only difference being the yield, for which an international effective weight average has been provided by FAO statistical offices. Another particularity occurs when disaggregation has not been provided, that is, when crop and livestock have not been individually reported. In this case, a weighted average is calculated based on the avail-able area harvested and the crop prices.
Despite possible data gaps, the triangulation of sources possible through the SFM functionality enables broad analyses of agricultural sector disas-ter losses, such as in Figure 17.
Figure 8.17. Direct agricultural losses by hazard type, 2005–2015
Productive assets and housing sector
SFM implements a basic methodology to assess the economic value of built elements as described in the technical guidance notes. This methodology assigns a value of a built element (e.g. a house or school, or a building in general) based on construc-tion costs (expressed per square metre), the average size of the building, an overhead to account for the contents of the building (furniture, appliances and equipment) and another to account for the asso-ciated physical infrastructure (urban and network infrastructure such as driveways, sewerage, water and electricity connections).
Value= Number of assets × average asset size × construction cost per M2 × equipment ratio × infrastructure ratio
For the practical implementation of the methodol-ogy, a database of costs for an important number of types of assets has been prepared based on the International Standard Industrial Classifica-tion of all economic activities (ISIC, Rev. 4).41 This list contains items for almost all types of buildings corresponding to major economic sectors, leaving it to the discretion of each country to add more specific classes, and to refine the construction prices initially proposed.
(Source: UNDRR, SFM reported by 83 countries, March 2018 data, in constant 2010 $)
236 Chapter 8

Following analysis advanced in GAR13 and GAR15, the housing sector is initially assessed using the concept of social housing units (i.e. the default economic assessment estimates the cost of houses using as its average the size of social housing units required to provide basic shelter to the families in need). This average size can be modified by coun-tries to obtain a more accurate and contextualized value. In a similar fashion, sizes for educational and health facilities are initially set as the size of small facilities of each type, thus providing a conserva-tive estimate of value. Similarly, as with procedures used in agricultural losses, the methodology makes use of the clustering of country data by GDPPC to obtain a construction value per unit area in coun-tries where no data was found.
Member States can modify all of the provided parameters for each item, based on regional or national preferences, such as the average area of the assets, the construction costs per type of asset, the percentage of equipment in relation to construc-tion cost, the percentage of related infrastructure in relation to construction cost and the average repair cost damage ratio of damaged assets. This provides an extremely flexible tool that is fully adjustable to the context of each country.
Critical infrastructure
The OEIWG report on terminology related to DRR defines critical infrastructure as the physical structures, facilities, networks and other assets that provide services that are essential to the social and economic functioning of a community or society. The types of assets listed under the section “Proposed UNDRR Classification of Infra-structure sector”, given in the technical guidance notes for Target D as critical infrastructure, cover a wide scope of facilities and networks. They include health centres, hospitals and educational facilities, as required by the target itself, and also specific structures in other sectors such as power plants, government facilities, transportation networks, and water, sewerage and solid waste treatment facili-ties. Critical infrastructure buildings (e.g. health and education facilities) are assessed in a similar
fashion to the productive assets described in the previous section, although their role as critical service providers is accounted for differently under Target D.
The technical guidance notes methodology has simple recommendations for the economic assess-ment of linear networks, in particular for roads. The methodology is based on either the cost to build a linear unit (metre) of the network or the cost of rehabilitation of the same. In the case of roads, default conservative values for rehabilitation and reconstruction of unpaved and single lane paved roads are provided, based on data and statistics of the World Bank.
The types of assets listed also include more specific structures such as power plants and water treatment facilities. No default values are provided for these items, given their enormous variability, which must be priced specifically for each country. This is particularly important as each one of these types of asset is subject to local regulations, and is bounded by unique regional geographic, climatic and environmental characteristics.
Cultural heritage
Cultural heritage sites relate to monuments, tradi-tions and places of worship, and also to the affected communities whose identity, culture and livelihoods are directly linked with those sites. Cultural heritages vary vastly within and among countries, which makes standardized methodolo-gies to assign economic value challenging. Most losses associated with cultural heritage are intan-gible losses (i.e. those associated with the histori-cal and/or artistic value of cultural heritage assets). Also, a good part of economic losses associated with cultural assets are indirect losses, mainly connected to future income losses associated with tourism, culture and recreation.
41 (UN DESA 2008)
237

However, to calculate at least a portion of the direct economic loss, it is suggested that Member States report the cost of rehabilitating, recovering and restoring the assets to a standard similar to that of the pre-disaster situation. This is feasible for fixed assets (buildings, monuments and fixed infrastruc-ture of cultural heritage assets) and for movable assets such as paintings, documentation and sculp-tures. When cultural assets are totally lost, economic assessment is extremely difficult, as there is simply no way to assign the value of what is recognized as priceless cultural artefacts. In some cases (and whenever available), the inflation-adjusted acquisi-tion price or market value of movable cultural heri-tage destroyed or totally lost can be used, as can the cost of building replicas of these assets.
Trends and figures of economic loss
Relative loss is presented in Figure 8.18, where each year contains the sum of losses from all 83 coun-tries, divided by the sum of GDPs of all the same 83 countries. As GDP is often expected to increase from one year to the next, the net result in the base-line period of 2005–2015, which corresponds with
HFA, is a steep trend downwards. This apparently demonstrates that countries were doing well reduc-ing risk during that period, as it shows a reduction in economic losses from disasters in relation to GDP. But, as noted above, outliers are key in the analy-sis of trends (see Box 9.1). In any time series with loss values, the location of the outliers (in this case, large-scale disasters) can completely change the trend. Furthermore, with such a short time series, adding one year before or after could similarly disrupt the trend line.
It is well known that 2017 was particularly disrup-tive in terms of economic loss. According to Swiss Re, it broke several records:42
Figure 8.18. Indicator C-1, direct economic loss relative to GDP, 83 countries with baseline in SFM, 2005–2017
(Source: UNDRR data)
• Total global economic losses from natural haz-ards and man-made catastrophes were $337 billion in 2017
• Global insured losses from disaster events in 2017 were $144 billion – the highest ever recorded
• Hurricanes Harvey, Irma and Maria resulted in combined insured losses of $92 billion, equal to 0.5% of GDP in the United States of America
238 Chapter 8

Unfortunately, the data sample in the monitoring system has different countries reporting for 2016 and 2017 than for the baseline years 2005–2015. Also, in 2011 and 2017, most losses occurred in the United States of America, which is not included in the sample of reporting countries. Nevertheless, including 2016 and 2017 in the relative loss calcu-lations still does not alter the downward trend in economic losses.
Hazard distribution of economic damage
Different hazards affect exposed assets in differ-ent ways. In the following paragraphs, due to data limitations, only the total loss, losses to agriculture and losses in the housing sector are presented. Agriculture and housing are the two sectors for which highest losses have been reported among all sectors.
Figure 8.19 shows that weather-related hazards are the cause of most economic loss, with floods as the costliest hazard, bearing 30.5% of all losses, followed by multihazard events and earth-quakes with 12.5%. Notable in the extended data set compliant with the Sendai Framework is the appearance, in seventh place, of a biological hazard (epidemic).
Figure 8.19. Distribution of total economic loss (constant 2010 $) in 83 countries by hazard, 2005–2015
Housing sector damage is dominated by the same three hazards (floods, earthquakes and cyclones). Despite the housing sector being one of the most affected and critical sectors for populations, avail-able data about the global impact of disasters in the housing sector is scarce and scattered among many sources.
Using the data from SFM, the importance of the housing sector is apparent. In the sample of 83 countries for the period 2005–2015, losses in the
housing sector represented 62% of all economic losses. While the proportional size of housing losses may reduce when better data on other sectors and more countries is available, it is never-theless representative of the importance of this sector. For the year 2017 alone, when a different set of 81 countries (including China and a large group
(Source: UNDRR data)
42 (Swiss Re 2019)
• Insured losses from all wildfires in the world totalled $14 billion in 2017, the highest ever in a single year
• More than 11,000 people died or went missing in disaster events in 2017
239

Figure 8.20. Housing sector losses (constant 2010 $) in 83 countries by hazard, 2005–2015
of developed countries) reported, the weight of the sector was similar: 60.65%.
National disaster loss databases, and more recently SFM, are allowing Member States to collect detailed data in these and other economic sectors. Data on the housing sector is important during emergency response (e.g. for calculation of shelter needs and affected population) and is an important input in risk assessments, which may use loss data as a calibration point.
Identifying patterns and trends of damage in the housing sector is crucial in policymaking, given that most populations, especially the poor, are affected by their houses, which are the shelter they depend on and also the place where livelihoods are anchored. Additional factors underlining the impor-tance of the housing sector are: the understanding
Agricultural losses mostly driven by floods, droughts and biological hazards
Agricultural losses are mostly driven by floods, droughts and biological hazards in the 83 countries of the sample with baseline data.
A 2017 report from FAO on the impact of disasters in this sector recognizes that impacts on agricul-ture “are seldom quantified or analysed in depth, yet agriculture tends to be one of the main economic
of risk in cities, which are particularly vulnerable due to rapid and chaotic urbanization; the uneven concentration of economic wealth in cities, render-ing large segments of the population with high levels of vulnerability; the expansion of slums (often into hazardous locations); and the failure of urban authorities to enforce building codes and land-use planning.
The OEIWG report noted that data on housing damage, along with data about who live in those houses, will be used in the indicators to measure the achievement of Target B, the reduction of number of affected people. As with other data requirements, it is up to Member States to meet the challenge of properly accounting for this data. This will ultimately be a beneficial asset in the hands of those in charge of reducing risk through evidence-based information.
activities in developing countries, contributing on average between 10 and 20 percent of national GDP in lower-middle-income countries and over 30 percent in low-income countries”.43 The same report, and after a review of 74 PDNAs, found that losses in the agriculture sector represent 23% of all loss attributed to medium- to large-scale disasters and 26% of losses due to climate-related hazards, stating that “Almost one third of all disaster loss is accrued in the agricultural sectors.” The data in the 83-country baseline is consistent with this
(Source: UNDRR data)
240 Chapter 8

figure, showing 31% of losses are in the agricultural sector.
The FAO report and the data of the sample concur in that the most damaging hazards are droughts and floods. However, the relative size of damage by drought in the FAO report is much bigger, reach-ing more than 83% of the total. This disparity results from limitations of data and the lack of countries highly affected by drought in the 83 countries in the baseline sample. Many of the drought-affected countries of Africa, the Americas and other conti-nents do not actively report losses to SFM and
Regional distribution of economic damage and analysis by income group
In terms of geographic distribution of relative to GDP loss over the period 2005–2017 (Figure 8.22), Asia and Africa continue to outpace others, demon-strating the gravity and magnitude of the impact of disasters in comparison with other regions. For example, ESCAP reports that between 1970 and 2016, Asia and the Pacific lost $1.3 trillion in assets.44 A significant part of those losses was the result of floods, storms, droughts and earth-quakes including tsunamis. Forecasts for the future
are not part of the group of countries that have completed their baseline data (2005–2015). These data gaps will reduce as Member States proactively monitor and account for their losses.
Another difference comes from the accounting of extensive risk. FAO data is from PDNAs, which are conducted only for large-scale disasters, most of which have been droughts in the past few years. Considering extensive risk impacts (small- and medium-scale disasters) would likely change the final composition due to hazards of agricultural damage.
are equally alarming with 40% of global economic losses from disasters being projected to be in Asia and the Pacific, with the greatest losses in the largest economies: Japan and China, followed by the Republic of Korea and India. Yet, when analys-ing those figures as a proportion of GDP, the burden is disproportionately high in countries with special needs, in particular SIDS, which are forecasted to have average annual losses close to 4% of their GDPs.45 The impact in terms of losses and deaths is probably much higher than the data suggests, as disasters in several of these countries remain underreported.
Figure 8.21. Agricultural losses (in constant 2010 $) in 83 countries by hazard, 2005–2015
43 (FAO 2017c)44 (UNESCAP 2017)
45 (ESCAP 2017a)
(Source: UNDRR data)
241
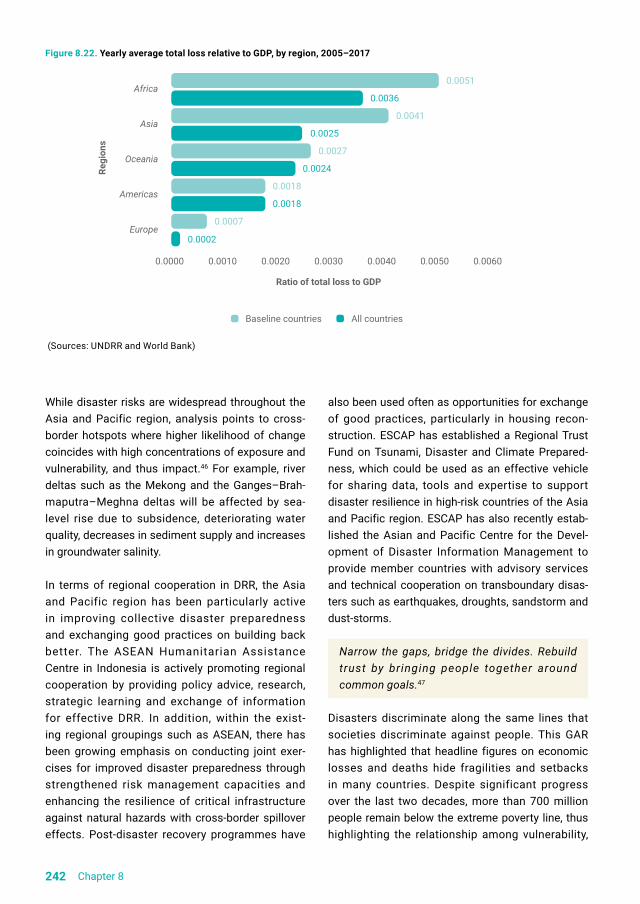
Figure 8.22. Yearly average total loss relative to GDP, by region, 2005–2017
While disaster risks are widespread throughout the Asia and Pacific region, analysis points to cross-border hotspots where higher likelihood of change coincides with high concentrations of exposure and vulnerability, and thus impact.46 For example, river deltas such as the Mekong and the Ganges–Brah-maputra–Meghna deltas will be affected by sea-level rise due to subsidence, deteriorating water quality, decreases in sediment supply and increases in groundwater salinity.
In terms of regional cooperation in DRR, the Asia and Pacific region has been particularly active in improving collective disaster preparedness and exchanging good practices on building back better. The ASEAN Humanitarian Assistance Centre in Indonesia is actively promoting regional cooperation by providing policy advice, research, strategic learning and exchange of information for effective DRR. In addition, within the exist-ing regional groupings such as ASEAN, there has been growing emphasis on conducting joint exer-cises for improved disaster preparedness through strengthened risk management capacities and enhancing the resilience of critical infrastructure against natural hazards with cross-border spillover effects. Post-disaster recovery programmes have
also been used often as opportunities for exchange of good practices, particularly in housing recon-struction. ESCAP has established a Regional Trust Fund on Tsunami, Disaster and Climate Prepared-ness, which could be used as an effective vehicle for sharing data, tools and expertise to support disaster resilience in high-risk countries of the Asia and Pacific region. ESCAP has also recently estab-lished the Asian and Pacific Centre for the Devel-opment of Disaster Information Management to provide member countries with advisory services and technical cooperation on transboundary disas-ters such as earthquakes, droughts, sandstorm and dust-storms.
Narrow the gaps, bridge the divides. Rebuild trust by bringing people together around common goals.47
Disasters discriminate along the same lines that societies discriminate against people. This GAR has highlighted that headline figures on economic losses and deaths hide fragilities and setbacks in many countries. Despite significant progress over the last two decades, more than 700 million people remain below the extreme poverty line, thus highlighting the relationship among vulnerability,
(Sources: UNDRR and World Bank)
242 Chapter 8

poverty and exposure. After a prolonged decline, the number of undernourished people rose from 777 million in 2015 to 815 million in 2016, mainly due to droughts, conflicts and disasters linked to climate change.48 The United Nations forecasts that further declines or weak per capita income growth are anticipated in 2019 in Central, Southern and West Africa and Latin America and the Caribbean. These are home to nearly a quarter of the global population living in poverty and often those facing the highest risks of adverse consequences from climate change and extreme weather events.49
People living in poverty suffer disproportionally in the wake of a disaster. They are less able to cope as they rarely benefit from social protection schemes, have fewer or no savings to smooth the impacts, their livelihoods depend on fewer assets, and they are more likely to live in low-value, hazard-prone areas in urban centres or depend on vulner-able ecosystems in rural areas. They are locked in protracted cycles of poverty, translated into irre-versible effects on education and health, which can strengthen the likelihood of intergenerational trans-mission of poverty. For example, in Peru, the effects of the 1970 Ancash earthquake on educational
attainment can be traced back to the children of mothers affected at birth, highlighting that the effects of large disasters can extend to future generations.50
Even though causality should be analysed in finer detail, there is a close two-way relationship between disasters and poverty. Disasters aggravate the depth and breadth of poverty, while poverty exacer-bates the way people experience, cope and recover from disasters. ESCAP estimates a significant segment of the Asia–Pacific population fall into poverty from selected disasters (Figure 8.23). This is a reality for several countries across the globe. Previous studies point to similar findings in Latin America where, among the Guatemalan households hit by Tropical Storm Agatha in 2010, per capita consumption fell by 5.5%, increasing poverty by 14%.51 In Senegal, it is estimated that impacts of disasters between 2006 and 2011 affected house-holds, with 25% more likely to fall into poverty.52 Similarly, according to World Bank analysis, esti-mates for 89 countries found that if all disasters were to be prevented next year, the number of people in extreme poverty – those living on less than $1.90 a day – would fall by 26 million.53
Figure 8.23. Estimated percentage of people falling into poverty from selected disasters in the Asia–Pacific region
46 (ESCAP 2017a)47 (United Nations Secretary General 2018)48 (United Nations 2019a)49 (United Nations 2019b)
50 (Caruso and Miller 2015)51 (Baez et al. 2017)52 (Dang, Lanjouw and Swinkels 2017)53 (Hallegatte et al. 2017)
(Sources: ESCAP statistical database and country post-disaster damage assessments, Asia-Pacific Disaster Report 2017)
243

Four years after the adoption of the 2030 Agenda, countries have taken bold steps in terms of report-ing, particularly when it comes to indicators used for measuring poverty and inequality (SDGs 1 and 10). Disaster loss data could be analysed against poverty and inequality data to understand, in finer detail, how disasters affect people’s lives and direct interventions to reduce poverty and disaster risk in a complementary way, without adding addi-tional reporting burden for countries. This means seeking out high-quality data that can be applied to compare outcomes and changes in poverty, inequal-ity and impact of disasters over time, among and within countries, and investing in doing so year after year. It also means making this data available, raising awareness and building trust in its use while strengthening people’s ability to use it, so that their needs are at the core of such processes.54
Figure 8.24 reports the distribution of absolute data, namely the total number of disaster occurrences, the total number of deaths and missing persons, the total number of affected people and total economic losses from 2005 to 2017, among the different geographic regions. In terms of geographic distri-bution, it again becomes apparent that, despite accounting for 23% of disaster occurrences, Asia incurred 42% of the total economic losses recorded at the global level between 2005 and 2017, carry-ing a disproportionate burden in terms of disaster occurrences and impacts. The Americas, where 46% of disasters occurred, ranks second as far as total economic loss is concerned, but accounts for 12% of the total number of deaths and missing people. Differences in terms of socioeconomic develop-ment, preparedness plans and resilience among and within regions can explain this disparity.
Figure 8.24. Distribution of disaster occurrences and impacts, by region, 2005–2017
(Source: UNDRR with data from DesInventar and World Bank)
Figure 8.25 reports yearly average losses rela-tive to GDP for different income groups over the period 2005–2017. Again, the ratio is significantly higher for low-income countries compared to other income groups, highlighting the gross inequality
of burden sharing among income groups, with the lowest-income countries shouldering the greatest impact of disasters. When compared to economic losses, the picture is somewhat different: upper–middle-income and high-income countries account
244 Chapter 8

for 46% of economic losses and low-income coun-tries account for the bulk of total mortality in the period 2005–2017 (Figure 8.26). The higher mone-tary value and more complete data on assets in
upper–middle- and high-income countries, where 41% of disasters reported in the database between 2005 and 2017 occurred, can explain the larger extent of economic losses.
54 (IEAG 2014)
Figure 8.25. Yearly average total loss relative to GDP, by income group and SIDS, 2005–2017
Figure 8.26. Distribution of disaster occurrences and impacts, by income group, 2005–2017
(Source: UNDRR with data from DesInventar and World Bank)
(Source: UNDRR with data from DesInventar and World Bank)
245

Economic loss trends in global data sets
These are the disparities that headline figures mask where higher registration of disasters and more com-plete figures on insured losses account for the higher registration of costs. Such figures are misleading as they fail to demonstrate and provide finer details on how disasters affect people’s lives. In absolute terms, high-income households lose more because they have more to lose, and those losses are more visible as they tend to be insured and better reported. The 32% of total economic losses that low-income countries in Figure 8.26 experience will be far more challenging to overcome than similar percentages in upper–middle-income or high-income countries. An important issue in disaster loss analysis is the proportion of income or assets lost, as the severity of losses depends on which households experience disasters and how. Proxy indicators and combina-tion of data sources on poverty, inequality, health and sanitation, and education outcomes are useful for adding finer detail and a more comprehensive picture in the analysis, accounting for the real costs of disasters and directing funding to the appropriate initiatives to address the systemic nature of risks.
8.2.5
Target D – damage to critical infrastructure and public services: an encouraging decline in recent years
The Asian Ministerial Conference on Disaster Risk Reduction (AMCDRR) in 2018 discussed the criti-cal importance of the problem of infrastructure,55
highlighting that “half of the infrastructure needed in Asia by 2050 has yet to be built”. In addition, the whole urban infrastructure should be treated as an interconnected and unique entity in terms of resil-ience, including the housing, industrial and commer-cial infrastructure that provides basic services to a growing population in urban areas. A holistic and multisectoral approach is needed when planning critical infrastructure. It should look beyond physi-cal infrastructure and take into account the interde-pendent nature of services that urban infrastructure
provides to society, including energy, water supply, transportation, telecommunications and other criti-cal services.
While the private sector needs to be involved and regulated via policy instruments (including build-ing codes and land-use planning), the responsibility of governments in creating new resilient, risk-informed critical infrastructure is undeniable. Indi-cators of loss in critical infrastructure in the Sendai Framework will continue to monitor the outcomes of impacts that are usually the direct responsibil-ity of, and executed directly by, governments. This promotes evolution of existing critical infrastructure towards sensible, risk-informed public investments that should result in resilient critical infrastructures serving resilient societies.
Examining long-term trends for infrastructure damage is challenging due to data limitations. Upward trends are particularly susceptible to outli-ers. For example, 2015 is an outlier in relation to damage to the education and health sectors. This is due to the large impact of the earthquake in Nepal during that year, which caused enormous damage to the built environment, health and education infra-structure. However, data attrition about the amount of damage reported in national databases is becom-ing a less-significant problem as more damage is reported compared to previous periods.
If shorter-term trends are examined (e.g. 2005–2017), the view is different and appears more opti-mistic. Figures 8.27 and 8.28 show the ratio of affected education facilities and the number of affected health facilities to 100,000 people, respec-tively, for baseline countries. These figures examine extensive risk only, which limits outlier-related issues. The numbers reported for 2016 and 2017 in Figures 8.26–8.28 are highlighted in different colours as the countries for which data is available is usually different from the baseline period and their number is smaller. Figure 8.29 shows the ratio of damaged roads to the total length of the road network. Health and education damage relative to population size have a downward trend, as shown in the figures. The same is true as far as relative damage to road is concerned, at least before 2016.
246 Chapter 8

55 (Fuller 2018)
Figure 8.28. Damage to health facilities, HFA and Sendai Framework period, extensive risk in 83 baseline countries, 2005–2017
Figure 8.27. Damage to education facilities relative to population size, HFA and Sendai Framework period, extensive risk in 83 baseline countries, 2005–2017
(Source: UNDRR with data from DesInventar and World Bank)
(Source: UNDRR with data from DesInventar and World Bank)
247

Figure 8.29. Damage to roads relative to total length of road network, HFA and Sendai Framework period, extensive risk in 83 baseline countries, 2005–2017
Disruptions to basic services, the second part of the target, also exhibit downward trends in recent years. Figure 8.30shows the number of facilities affected by disaster in several sectors, relative to
population size. Shorter-term trends (since the start of HFA) show a tendency to decrease in the case of all services.
(Source: UNDRR with data from DesInventar and CIA World Factbook on global road infrastructure) Note: Countries included in the reporting for 2016 and 2017 in the Sendai Framework period may differ.
Figure 8.30. Disruptions to public services relative to population size, 2000–2015
(Source: UNDRR data)
248 Chapter 8

These trends are occurring despite the existence of a big outlier at the end of the series, in 2015, which influences all trends upwards. This is some-thing that must be taken into consideration when analysing trends, as a large-scale disaster can happen at any time and the reading of the data may completely change.
Some of these downward trends in the last 15 years can be explained by DRR efforts of many coun-tries. Campaigns such as Safe Hospitals and Safe Schools have had an important effect on reducing
overall damage. Development generally reduces risk. For example, in countries where the percent-age of paved roads is growing every year, roads are becoming more resilient.
8.2.6 Targets A–D: extensive risk analysis for the period 2005–2017: surprising facts of extensive risk in recent years
Previous GARs (in 2013 and 2015) have defined extensive risk as the set of frequent disasters associated with relatively low inten-sity hazards. In general terms, extensive risk is the idea of widely spread and relatively frequent small- and medium-scale disasters.
Extensive risk manifests as large numbers of recurrent, low-to-medium-severity disas-ters, which are mainly associated with local-ized hazards such as flash floods, landslides, urban flooding, storms, fires and other time-specific events.
When HFA was adopted, the mortality, physi-cal damage and economic loss from extensive risk had not been accounted for in national or international reports, except in a few Latin American countries. As a result, this risk layer remained largely invisible to the international community. However, the sustained efforts from the United Nations system and partners to assist countries in systematically recording local disaster losses has generated system-atic and comparable evidence regarding the scale of extensive risk, with data now covering more than 100 countries.
Given most of these data sets have been built using the same indicators, a comparable
approach and similar methodology, it is possi-ble to analyse these local records at a global level of observation. Unlike intensive risk, extensive risk is more closely associated with inequality and poverty than with physical features such as earthquake fault lines and cyclone tracks.
Extensive disaster risk is thus magnified by risk drivers such as badly planned and managed urban development, environmental degradation, poverty and inequality, vulner-able rural livelihoods and weak governance. This layer of risk is not captured by global risk modelling, and its losses are not reported internationally in global data sources.
One key feature of previous GARs has been to highlight the contingent liabilities associated with this risk layer, which tend to be absorbed by low-income households and communi-ties, small businesses, and local and national governments, and which are a critical factor in poverty.
Box 8.1. Basics of extensive risk
249

Table 8.1. Extensive risk figures disaggregated by hazard family, 2005–2017, summarizing the main figures obtained in the analysis
Framework – meaning the latest 12 years of data. In previous GARs, a longer period was researched, which may have introduced biases due to less data reporting in the initial years covered by the data-bases. While the period of the research is now shorter, the number of records analysed is high, with 320,000 disaster records, and includes a higher number of countries (104), which add to its strength as a statistical sample.
There is now a broader scope of hazards included in this sample, because of the call in the Sendai Framework to also address biological and envi-ronmental hazards (grouped under “biological”) and human-induced (technological) hazards. This sample therefore includes all reported epidemics, industrial accidents and deforestation.
This section presents an update to the extensive risk analysis featured in previous GARs. Extensive risk is important for many reasons. However, the main one is that extensive risks are responsible for most damage to infrastructure and livelihoods, perhaps for most economic loss (as shown below) and represents an erosion of development assets such as houses, schools, health facilities, roads and local infrastructure. GAR efforts to reveal exten-sive risk aim at making the cost visible, as exten-sive risk losses tend to be underestimated and are usually absorbed by low-income households and communities.
For this GAR19, a focused analysis of extensive/intensive risk has been conducted. It is now limited to the period of the monitoring of the two frame-works – HFA (or the baseline) and the Sendai
(Source: UNDRR data)
250 Chapter 8

and with a generally damaging year in 2011. Had the sample included the United States of America, there would be bigger outliers in 2011 and 2017. The trend without the outliers is important because it shows how risk is affecting a huge proportion of the world – most importantly, the poor.
Figure 8.31 shows relative losses in the housing sector, which dominate the overall losses, along with agriculture, in all SFM countries from 2000 to 2017. Relative losses are calculated by divid-ing the number of damaged or destroyed houses by population. Against steady increases in the first 10 years, losses have significantly declined since 2010. However, data for years 2015, 2016 and 2017 should be taken with caution as the number of disasters for which data on the number of damaged or destroyed available in the database is signifi-cantly smaller than in previous years.
One of the conclusions is that economic loss, in absolute terms, continues to grow in disasters at all scales. However, despite the high number of exten-sive risk disaster records (99.6% of all data) and a higher contribution to overall economic loss, the impact of extensive risk is slowly receding within the data available at this time. This reduction of economic impact is visible at a global scale and is
Figure 8.31. Number of houses damaged/destroyed relative to population size, extensive risk in all SFM countries, 2000–2017
It is important to note that year aggregates of economic loss cannot be classified as extensive or intensive because they are not records of indi-vidual disasters. In general, the annual consolidate surpasses the threshold of extensive risk, so most consolidated data would come under the category of intensive.
The weight of extensive risk in the economic losses area, using this sample of data, is much higher than that found in previous research periods: 68% of all economic losses in this period are caused by small and medium, localized and frequent disas-ters. This contrasts with previous findings of 42% of economic loss, and is perhaps a confirmation that after many achievements made by Member States in reducing intensive risk, their attention should now shift to addressing extensive risk.
Monitoring extensive and intensive risk
Extensive risk shows different trends from those that are apparent in the full sample of data. This is a consequence of the absence of outliers produced by large-scale disasters. In the case of the HFA and Sendai Framework eras, there were some outliers, especially in 2015 with the earthquake in Nepal,
(Source: UNDRR with data from DesInventar and World Bank)
251

reflected in similar trends in the relative losses of the set of countries reporting to the Sendai Frame-work Monitoring system.
8.3
Target E: Progress on disaster risk reduction strategies for 2020
Two years before the deadline of Target E, there is no comprehensive picture of all strategies in place. The target speaks plainly about “national and local disaster risk reduction strategies”, but the indica-tors that will measure this target are more difficult to quantify. Indicator E-1 requires national strate-gies to be “in line with the Sendai Framework”, and local strategies to be “in line with National Strat-egies”. It could be inferred therefore that local strategies should also be aligned with the Sendai Framework.
Some strategies are limited in scope and action, taking into consideration the specific context and capacity of the country. Therefore, DRR strategies are considered as a set of policy documents on
relevant policy areas, from sectoral perspectives, or of targeted specific hazards. Measurement of compliance with the Sendai Framework should consequently be loosely interpreted.
The technical guidance notes proposed that the alignment of strategies with the Sendai Framework could be measured by a simple system of assign-ing scores, which, despite their subjectivity, could identify the alignment of a national strategy to the Sendai Framework. Box 8.2 shows the 10 criteria used for monitoring the progress of national DRR strategies where Member States conduct their own self-assessments. It should be underlined that attrib-uted scores are for the alignment of national strate-gies to the Sendai Framework only, and do not offer any assessment on implementation of the strategy.
As with other targets and indicators, there are several data sources, which gives nuance to the conclusions to be drawn. In order of priority, these data sources are: the monitoring system, the UNDRR survey on implementation of the Sendai Framework, the Data Readiness Review and the results of the last rounds of reporting of HFA.56
This section presents the results of the officially reported data available in the online Sendai Frame-work Monitoring system. By expanding on facts and figures from other data sources, it provides the best available overview of how Member States are progressing on DRR strategies.
Box 8.2. Key elements in DRR strategies used to assign a score to Indicator E-1, Number of countries that adopt and implement national DRR strategies in line with the Sendai Framework
i. Have different timescales, with targets, indicators and time frames
ii. Have aims at preventing the creation of risk
iii. Have aims at reducing existing risk
iv. Have aims at strengthening economic, soc ia l , hea l th and e nv i ronme n ta l resilience
v. Address the recommendations of Priority 1, Understanding disaster risk
vi. Address the recommendations of Priority 2, Strengthening disaster risk governance to manage disaster risk
vii. Address the recommendations of Priority 3, Investing in disaster risk reduction for resilience
252 Chapter 8

56 (United Nations 2017a)
Figure 8.32. Indicator E-1, number of countries reporting on national DRR strategies, 2015–2017
(Source: UNDRR 2018b)
(Source: UNDRR data)
8.3.1 Data from the online Sendai Framework Monitoring system
The first important figure is the number of coun-tries that reported on their progress on their strate-gies. In 2017, 47 Member States reported the status of their national and local DRR strategies. In 2016, only 27 countries reported, and 25 did so for 2015. The fact that more data was reported for 2017 than previous years reflects that the online monitoring system was launched in March 2018 and the techni-cal guidance notes were developed over the course of 2016. Among the 47 reporting countries, only 6 reported that they have national DRR strategies in comprehensive alignment (100% compliance) with the Sendai Framework, according to the 10 crite-ria of the national DRR strategies in line with the Sendai Framework. Seventeen countries reported that their national DRR strategies have substantial alignment with the Sendai Framework (E-1 score of 0.67–0.99), while 10 countries have limited or no alignment (score of 0–0.33).
As of October 2018, the overall average compli-ance of alignment with the Sendai Framework is 0.60.
On closer examination, more Member States report that their national DRR strategies have better ratings in elements of measuring reducing existing risk (0.67 average) and in Priority 1, Understand-ing risk (0.64 average), than implementing Sendai Framework Priority 3, which seems to be more chal-lenging (0.53 average). In the Readiness Review, conducted in early 2017, having indicators in the
viii. Address the recommendations of Priority 4, Enhancing disaster preparedness for effective response and to build back better in recovery, rehabilitation and reconstruction
ix. Promote policy coherence relevant to DRR such as sustainable development, poverty eradication and climate change, notab l y w i th S D Gs and th e Par is Agreement
x. Have mechanisms to follow up, periodi-cally assess and publicly report on progress
Each element is weighted equally with the following criteria:
i. Comprehensive implementation (full score): 1.0
ii. Substantial implementation, additional progress required: 0.75
iii. Moderate implementation , nei ther comprehensive nor substantial: 0.50
iv. Limited implementation: 0.25
v. If there is no implementation or no existence: 0
253

Figure 8.33. Average scores of the 10 key elements for national DRR strategies to be in line with the Sendai Framework
(Source: UNDRR data)
national DRR strategies seemed the biggest chal-lenge for countries. One third of reporting countries answered they did not have indicators, while by
Several countries have reflected recent progress to improve their national DRR strategies in line with the Sendai Framework in currently reported values. For example, Namibia already had national DRR strategies in 2015, with a low alignment to the new Sendai Framework at that time. The strategy has been improved over three years (score of 50% in 2016). With the National Strategy for Mainstream-ing Disaster Risk Reduction and Climate Change Adaptation into Development Planning in Namibia 2017–2021, the set of DRR strategies and poli-cies is in comprehensive alignment with the Sendai Framework (self-score of 100% in 2017).
Czechia did not have a DRR strategy in 2015. National DRR strategies have been implemented since 2016 (score of 90% in 2016). In 2017, the country added full compliance to subindicator (x) – embedded mechanisms to follow up – increasing its score to 92.5%.
October 2018, about one quarter of reporting coun-tries did not have “different timescales, with targets, indicators and time frames” (0.60 average).
8.3.2 Indicator E-2
Another important figure to highlight is the number of countries that reported on their local DRR strat-egies. In 2017, 42 Member States reported the proportion of local DRR strategies available in local governments, while only 21 Member States reported so in 2016 and 18 in 2015. Note that local government is defined as a form of subnational public administration with responsibility for DRR – to be determined by countries. Among 35 countries that reported the status of their local DRR strate-gies, 17 reported that all of their local government bodies have local DRR strategies in line with their national DRR strategies, while 7 countries reported no local DRR strategies or without alignment to their national strategies.
254 Chapter 8
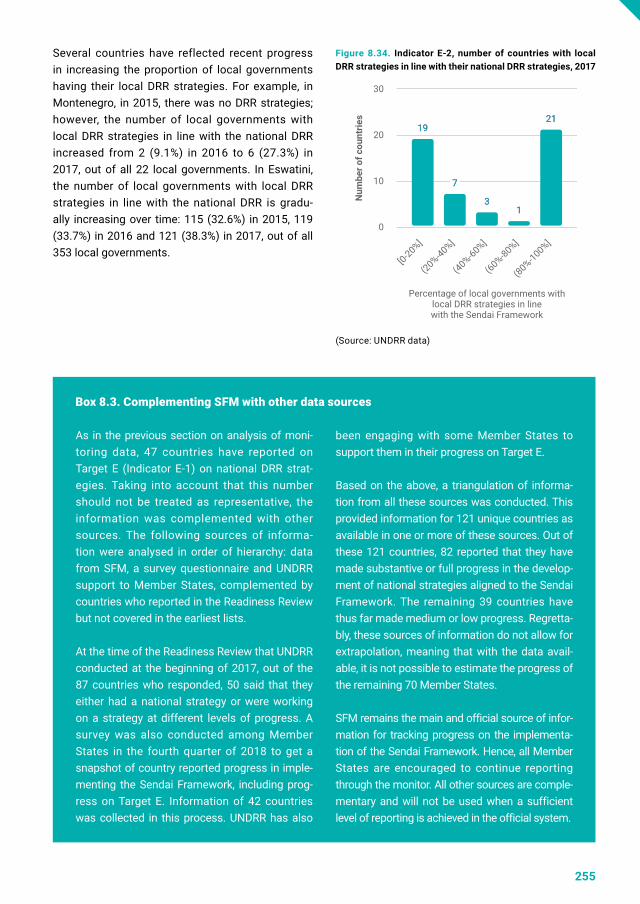
Several countries have reflected recent progress in increasing the proportion of local governments having their local DRR strategies. For example, in Montenegro, in 2015, there was no DRR strategies; however, the number of local governments with local DRR strategies in line with the national DRR increased from 2 (9.1%) in 2016 to 6 (27.3%) in 2017, out of all 22 local governments. In Eswatini, the number of local governments with local DRR strategies in line with the national DRR is gradu-ally increasing over time: 115 (32.6%) in 2015, 119 (33.7%) in 2016 and 121 (38.3%) in 2017, out of all 353 local governments.
Figure 8.34. Indicator E-2, number of countries with local DRR strategies in line with their national DRR strategies, 2017
As in the previous section on analysis of moni-toring data, 47 countries have reported on Target E (Indicator E-1) on national DRR strat-egies. Taking into account that this number should not be treated as representative, the information was complemented with other sources. The following sources of informa-tion were analysed in order of hierarchy: data from SFM, a survey questionnaire and UNDRR support to Member States, complemented by countries who reported in the Readiness Review but not covered in the earliest lists.
At the time of the Readiness Review that UNDRR conducted at the beginning of 2017, out of the 87 countries who responded, 50 said that they either had a national strategy or were working on a strategy at different levels of progress. A survey was also conducted among Member States in the fourth quarter of 2018 to get a snapshot of country reported progress in imple-menting the Sendai Framework, including prog-ress on Target E. Information of 42 countries was collected in this process. UNDRR has also
been engaging with some Member States to support them in their progress on Target E.
Based on the above, a triangulation of informa-tion from all these sources was conducted. This provided information for 121 unique countries as available in one or more of these sources. Out of these 121 countries, 82 reported that they have made substantive or full progress in the develop-ment of national strategies aligned to the Sendai Framework. The remaining 39 countries have thus far made medium or low progress. Regretta-bly, these sources of information do not allow for extrapolation, meaning that with the data avail-able, it is not possible to estimate the progress of the remaining 70 Member States.
SFM remains the main and official source of infor-mation for tracking progress on the implementa-tion of the Sendai Framework. Hence, all Member States are encouraged to continue reporting through the monitor. All other sources are comple-mentary and will not be used when a sufficient level of reporting is achieved in the official system.
Box 8.3. Complementing SFM with other data sources
(Source: UNDRR data)
255

8.4 Target F: Measuring international cooperation – too early for conclusions
In the Data Readiness Review study, Member States were asked to assess the availability and feasibil-ity of providing data on the key indicators. This revealed that only 38% of Member States (33 out of 86 participating countries) would be capable of reporting on Indicator F-1: “Total official inter-national support (official development assistance (ODA) plus other official flows), for national disas-ter risk reduction actions”; similar or lower numbers were reported for other indicators. For example, only 23% stated they would be able to report Indi-cator F-4: “Total official international support (ODA plus other official flows) for the transfer and exchange of disaster risk reduction-related tech-nology”. Participation in the first cycle of the moni-toring exercise confirms this sparse availability of data. The average reporting rate for Indicator F-1, by far the best for Target F, reached only 25% of Member States. No analysis is provided for the rest of the indicators of Target F due to the low partici-pation in monitoring.
The data available for tracking ODA and DRR expen-diture and to fully account for these costs remains incomplete at a global scale. For instance, OECD reports that where such information exists, it is not gathered on a regular basis due to accounting and administrative fragmentation across sectors and levels of government collecting and processing such data.57 Macrolevel data on the global disaster risk financing gaps, and national and subnational data are necessary. To achieve this, improvements in reporting are required immediately. The renewed attention through the Sendai Framework provides an excellent opportunity for countries to report on national data and better understand the interplay
between national and international sources in disas-ter risk financing. Providing a more comprehensive picture on where disaster aid and spending flows will help to build the evidence base for improved prevention, mitigation and preparedness funding. It is possible to start forming a global picture of financing for DRR using proxy indicators. In coming iterations of reporting for SFM, the availability of nationally reported figures will grow, and the use of proxies will complement increasingly granular data.
Analysing data from other sources such as OECD DAC58 shows that, for instance, development assis-tance for DRR has remained a persistently small fraction of the total international aid financing land-scape, and that disaster expenditure is predomi-nantly ex post.59 Data on development assistance for disasters can be captured – but is not limited to – three types of ODA: disaster prevention and preparedness, reconstruction relief and rehabilita-tion, and emergency response (Figure 8.35). The figure of $5.2 billion for DRR represents 3.8% of the spending in the period 2005–2017, which is a marginal fraction of the total amount. Most of the finance, $122 billion (89%), flows to emergency response, while $9.84 billion goes to reconstruction relief and rehabilitation (Figure 8.35).
Resource gaps continue to be significant and disproportionally borne by countries most in need. In addition, most efforts are concentrated in supporting preparedness and recovery, at the expense of funding dedicated to understanding the underlying vulnerabilities contributing to disasters. As captured in previous GARs, the increasing gap between demand for response to disasters and available global funding stresses the need for effec-tive integrated measures that support DRR in the framework of sustainable development.
Although there is an increasing convergence between international development and humani-tarian funding, financing gaps for disasters also support the above findings. Figure 8.36 demon-strates the difference between funding requested and the funding provided by the global humanitar-ian community; pointing to an eightfold increase in terms of financing gaps. In other words, and aligned
256 Chapter 8

57 (OECD 2018a)58 (OECD 2018b)59 (Watson et al. 2015)
Figure 8.35. Share of DRR in international aid for disasters (constant 2016 $, millions), 2005–2017
with previous GAR findings, global funding require-ments are increasing, while the national and inter-national capacity to address them is not growing in proportionate terms. This finding should be treated with considerable caution given pressures on tradi-tional funding sources and sustained concern for the millions of people affected by disasters each year, who do not receive the assistance and protec-tion required to rebuild their lives.60 A previous study on 20-year trends of ODA61 demonstrates that where the economy is at risk, volumes of financing tend to be more timely and substantially higher; where predominantly populations are at risk, volumes are often lower.
Deliberations in AAAA reiterated the need for renewed attention to financial instruments and innovations designed to reduce vulnerability to risk. For instance, scaling up the use of State contingent debt instruments – debt contracts that link debt service payment to a country’s obligation to service it – linked to disasters could be an alternative
(Source: UNDRR with data from OECD)
measure. Such approaches need to be integrated in a broader package of efforts that seek to ensure countries have access to a risk-informed approach to finance on terms and conditions commensurate with their circumstances.
A positive international development in funding for disaster risk is the burgeoning field of disaster risk financing – a term that covers a wide range of global, regional and national risk-sharing and risk-transfer systems and products (public and private). The quantification of disaster risk for insurance and risk-sharing purposes is another form of incentive to reduce risk, although its focus is to produce better outcomes in socioeconomic development. Again, the financial flows related to these are unlikely to be counted in ODA figures. The complexity of this field requires a much more detailed treatment than can be done in this GAR, but these developments are important to note for future consideration in reporting on F-1 (total international flows), F-2 (multilateral organization flows) and F-3
60 (OCHA 2019)61 (Kellett and Caravani 2013)
257

8.5 Target G: Multi-hazard early warning systems, – progress and challenges observed
Target G addresses the availability of, and access to, MHEWSs and disaster risk information and assessments. Indicators G-2 to G-4 are based on the four key elements of EWSs, informed by an international network on MHEWSs,66 namely: (a) disaster risk knowledge based on the systematic collection of data and disaster risk assessments (G-5); (b) detection, monitoring, analysis and fore-casting of the hazards and possible consequences (G-2); (c) dissemination and communication, by an official source, of authoritative, timely, accurate and actionable warnings and associated information on likelihood and impact (G-3); and (d) preparedness at all levels to respond to the warnings received (G-4). Indicator G-1 is a compound indicator of the four
(bilateral flows). For example, concerning multilat-eral organizations, GFDRR,62 the World Bank63 and its Global Risk Financing Facility,64 and regional development banks such as the Asian Develop-ment Bank (ADB)65 provide national project funding, grants and loans specifically targeted at disaster risk financing. They also focus on capacity devel-opment to reduce risk, to track expenditure on DRR and to promote integration with CCA and climate change mitigation.
Figure 8.36. Funding received and funding requested through United Nations appeals, constant 2017 $, billions, 2000–2018
(Source: UNDRR with data from OCHA Financial Tracking Service)
258 Chapter 8

Table 8.2. Target G, number of countries by total score for each dimension of Indicators G-2 to G-6
indicators and stands for a fully fledged MHEWS with four key elements taking the values 0–1.
Reporting against Target G has been a challenge for Member States, although indicators were developed to take into account the global feasibil-ity of reporting. Thirty-four Member States have reported at least one indicator for 2015–2018 (mostly related to Indicator G-3), while the small-est number reported on G-2 and G-5, which require a multi-hazard approach and specification of major hazards.
Among the 34 reporting countries, 14 have reported a complete set of indicators from G-2 to G-5, which enables calculation of G-1. Despite a small number of reporting countries, the results reveal room for improvement on this target in most countries. Above all, reporting against G-5, with the lowest average among G-2 to G-5, demonstrates that most countries need comprehensive risk assessment for their defined major hazards.
Indicator G-2 refers to multi-hazard monitoring and forecasting systems. This indicator requires
62 (Hallegatte, Maruyama and Jun 2018); (De Bettencourt et al. 2013); (GFDRR 2018b)63 (Alton, Mahul and Benson 2017)
64 (Global Risk Financing Facility 2019) 65 (Juswanto and Nugroho 2017); (ADB 2019)66 (UNISDR 2006); (WMO 2017)
defining major hazards targeted for monitoring and forecasting systems. As shown in Table 8.2, there are two peaks at the upper and lower ends. In other words, several countries have multi-hazard monitoring and forecasting systems that cover major hazards well, while other countries do not. For example, Lebanon identified a wide variety of major hazards, including biological hazards, to be monitored and forecast. As some institutions are involved in MHEWSs, Lebanon is working on the development of an early warning platform, which will contribute to standardized processes and clear roles and responsibilities. Warning messages of several types of hazards would be further improved to include risk information to trigger response reactions disseminated in a timely and consistent manner.
Indicator G-3 relates to coverage of early warning information or penetration rate of communication modes. Among 31 reporting countries, 10 reported their targeted population is fully covered. In the case of Namibia, penetration ratios of local commu-nication and mass media increased from 2015 to 2017, which has enabled early warning information
259

Figure 8.37. Number of countries reporting on Indicators G-1 to G-5
to reach the whole population. Reported penetration rates show that mass media can reach more people than local communication systems such as sirens and public bulletin boards.
Indicator G-4 relates to local plans to act on early warnings, which are related to preparedness. Among 23 reporting countries, 12 reported that all of their local governments have a plan to act on early warnings, while 4 reported no plan to act on early warnings at the local level. To improve preparedness and respond to the warnings received at the local level, all local governments need such plans to act on early warnings.
Indicator G-5 is related to risk information and assessment. Only 3 out of 17 countries have avail-able disaster risk information and assessment for their defined major hazards. Myanmar reported the existence of risk information and assessment for seven major hazards. The data demonstrates that Myanmar has high-quality risk information and assessment systems against cyclones, earth-quakes, floods, heavy rainfalls and tsunamis.
Indicator G-6 relates to population protected through pre-emptive evacuation following early warning. This indicator can measure a posi-tive aspect of evacuated people with a focus on saving lives. However, data collection and report-ing against this indicator is a challenge. Among six reporting countries, only the United Republic of Tanzania reported data for this indicator, while another three countries reported nothing and the other two reported partially on the number of people protected through pre-emptive evacuation (or a proxy as evacuated people).
Several countries reported their recent progress on improving their MHEWSs from 2015 to 2017. For example, Czechia has improved monitoring and forecasting systems and risk assessment against drought from 2015 to 2016, which can be observed by increasing scores of G-1, G-2 and G-5. The United Republic of Tanzania has continuously improved its MHEWSs over this period in all areas of the four key elements. It is piloting implementation of MHEWSs, which can provide warning information on natural (Source: UNDRR data)
260 Chapter 8

hazards such as extreme temperatures, landslides, floods, strong winds and storm surges/tsunamis. Progress is reflected in increasing scores on the five indicators G-1 to G-5.
8.6
Conclusions on the first reporting data for Sendai Framework Targets A–G
This GAR is informed by the latest disaster data available and infers early lessons on where the global disaster risk landscape currently stands. In terms of data infrastructure, there has been growing awareness since 2015 on the need for better and more comparable data, and SFM represents a unique opportunity to streamline interoperable data on disaster losses. While the observed period is still too short to reach definitive conclusions on a global scale, it is possible to observe certain patterns in terms of magnitude, geographic and socioeco-nomic distribution of disaster impacts and abstract several departure points of where and how coun-tries have managed to do better in reducing disas-ter risk:
a. In the broader picture, in terms of losses, there are severe inequalities of burden sharing between low- and high-income countries, with the lowest-income countries taking the highest toll and greatest costs of disasters. Asset and human losses tend to be higher in countries that have the least capacity to prepare, finance and respond, such as SIDS. However, the good news is that there has been an increase in the percentage of reporting containing economic loss data, for all income groups, particularly in the last four years, in contrast to former declining trends.
261

b. Mortality relative to population size has declined in the long term. However, since 1990, 92% of mortality attributed to internationally reported disasters associated with natural hazards has occurred in low- and middle-income countries, persistently concentrated in the Asia–Pacific region and Africa.
c. Geophysical hazard events (e.g. earthquakes and tsunamis) have taken the highest toll on human lives. Occurrences of reported disas-ters associated with biological hazards have decreased, while the number of disasters associated with natural hazards has slightly increased, over the past two decades. In terms of affected people, multi-hazard disasters affected 88 million people in SFM countries, fol-lowed by floods affecting 76 million people, in the period 1997–2017.
d. Disasters stemming from natural hazards have displaced an average of 23.9 million people each year over the last decade.67 Disasters – the main triggers of forced displacement recorded – show no signs of decreasing.
e. Intensive risk continues to dominate fatali-ties, but the participation of extensive risk in mortality seems to be increasing. Most eco-nomic losses in the period 2005–2017 were caused by disasters associated with extensive risk, with 68.5% of all economic losses attrib-uted to extensive risk events. With disasters becoming increasingly frequent, the cumulative damage, especially for people living in poverty, is often greater for extensive disasters such as droughts, than small- and medium-sized shocks that deliver low intensity but more frequent and recurrent shocks.
f. In line with the analysis in previous GARs, extensive risks represent an ongoing erosion of development assets, such as houses, schools, health facilities, roads and local infrastructure. However, the cost of extensive risk continues to be underestimated, as it is usually absorbed by low-income households and communities.
g. Weather-related hazards take the lead in economic losses, with floods being the costliest
hazard, followed by earthquakes. Meanwhile, losses in the housing sector account for two thirds of total economic losses.
h. Losses in agriculture, the second most-affected sector, are again significantly higher and more persistent in low- and low–middle-income countries, with increasing frequency and severity of floods, droughts and tropical storms. The relationship between drought and agriculture deserves special attention, as 84%68 of the damage and losses caused by droughts resides therein. Beyond the obvious production losses, disasters have a significant impact on rural livelihoods, food value chains, trade flows of agricultural commodities, and food and non-food agro-industries. Initiatives to support diversification of livelihood opportu-nities, farm and non-farm activities, and more sustainable (self-) employment are critical. Expanding financial inclusion, providing social protection and adaptive safety nets, contingent finance and forging ownership by supporting rural communities to invest their savings into economic ventures of choice can place house-holds in a better position to cope with disasters and build back better.
i. Financing for DRR has been highly volatile, ex post and marginal. A total of $5.2 billion for DRR represents 3.8% of total humanitarian financing between 2005 and 2017 – less than $4 for every $100 spent – a marginal fraction of the total amount. Global funding requirements are increasing, while the national and international capacity to address them is not growing in proportionate terms, leaving millions of affected populations behind.
j. Member States reporting on the status of their national and local DRR strategies are gradually increasing, yet improvements for a full coverage on a global scale are to be made, one year ahead of the deadline.
k. Economic losses from disasters totalled $75 billion in 2017 (UNDRR data), and over $300 billion from other sources (Munich Re and Swiss Re). The $75 billion estimate of the average annual losses deviates substantially
262 Chapter 8

67 (Internal Displacement Monitoring Centre 2019)68 (FAO 2015b)
from other observations, as data is imperfect and disasters remain significantly non-/under-reported, compromising accurate calculations of the true impacts of disasters. Eleven years ahead of the 2030 deadline, a sense of urgency should be injected into improving reporting across indicators and targets, enabling the engineering of evidence-based solutions for disaster-affected populations.
l. While useful for illustrating the stocktake of average losses, average estimates often fail to provide finer details on how disasters affect people’s lives. In absolute terms, high-income households lose more because they have more to lose, and those losses are more visible because they tend to be insured and better reported. Previous GARs have repeatedly argued that what matters most in disaster loss analysis is the proportion of income or assets lost, as the severity of losses depends on households and how they experience disasters.
m. This GAR argues that as data-collection efforts across different global frameworks are embarked upon, it is necessary to look at indicators afresh across goals and targets. It is also necessary to establish metrics for those dimensions of disaster impacts that accrue to the most vulner-able by delving deeper into distributional anal-ysis, moving away from regional, national and subnational data to the household level. The goal is to first learn in finer detail how disas-ters affect people’s lives in a systemic way and then support countries to engineer solutions and influence human behaviour to successfully rebound from disasters.
263

Chapter 9: Review of efforts made by Member States to implement the Sendai Framework
The Sendai Framework represents a risk-informed approach to sustainable development and is closely associated with specific demands regarding data collection and analysis. Renewed commitments and demand for robust and evidence-based guid-ance on DRM require the transformation of behav-iour and practice in multiple dimensions. These include data, policy, planning protocols, collabora-tion mechanisms for effective decision-making, and technical and functional implementation capacities. The data requirements to meet these goals require coordination among relevant stakeholders, which has traditionally not been a reality.
The 2017 Sendai Framework Data Readiness Review, with contributions from 87 countries, assessed countries’ readiness to monitor and report, in addition to the availability of national
disaster-related data and requisite gaps in terms of financial resources and technical expertise. Within the group of countries participating in the review, a quarter reported no or only preliminary progress on national and local DRR strategies and plans aligning with the Sendai Framework (Target E), 72% reported medium to substantive progress on alignment and 3% reported full implementation. The review concluded that effective reporting of progress towards the global targets of SDGs and the Sendai Framework would require the use of multiple types of data, including EO and geospatial information. Advances in national reporting and data-collection practices offer useful standards, tools and approaches to guide countries efforts in bridging the gap between where they are today and where they need to be to support the goals of the Sendai Framework.
264

9.1 Disaster loss databases
The Sendai Framework and its predecessor, HFA, have explicitly recognized the importance and usefulness of collecting loss data as one of the actions that will help countries to increase knowl-edge about the risks they face. In addition to the loss data for Targets A–D outlined in the previous chapter, Sendai Framework Priority 1, Understand-ing disaster risk (para. 24), suggests that Member States:
(d) Systematically evaluate, record, share and publicly account for disaster losses and understand the economic, social, health, education, environmental and cultural heri-tage impacts, as appropriate, in the context of event-specific hazard-exposure and vulnerability information;
(e) Make non-sensitive hazard exposure, vulner-ability, risk, disaster and loss-disaggregated information freely available and accessible, as appropriate;
The text of the Sendai Framework (para. 15) states:
The present Framework will apply to the risk of small-scale and large-scale, frequent and infrequent, sudden and slow-onset disas-ters caused by natural or man-made hazards, as well as related environmental, technologi-cal and biological hazards and risks. It aims to guide the multi-hazard management of disas-ter risk in development at all levels as well as within and across all sectors.
There are several consequences of the wider scope of the Sendai Framework. The explicit recommen-dations of Priority 1 on loss data collection, and that the global indicators for Targets A–D require loss data, mean that countries are strongly encouraged to account systematically for disaster losses and
damage for a wide spectrum of disaster scales and a broader set of hazards. For over a decade, UNDDR has been working with Member States to promote disaster loss accounting. Systematically account-ing for losses translates, in technological terms, into the creation of national disaster loss databases that can record many loss indicators for disasters, at all scales, in a disaggregated manner. Priority 1 recommendations go even further, suggesting these databases and information should be publicly accessible.
While there are some reputable global disaster loss databases such as EM-DAT, NatCat from Munich Re, Sigma from Swiss Re and others,69 it is impor-tant to note that any reporting process to the Sendai Framework Monitoring system has to be based on officially endorsed data, collected and validated by national governments. This data should comply with the requirements of the Sendai Framework. It should address small- and large-scale disasters, and slow- and rapid-onset events, cover a large number of hazards (including man-made hazards) and, most importantly, record data for a set of global indicators, some of which were not available in the global loss databases.
Furthermore, for effective implementation of the recommendations of the Sendai Framework, databases should be built gathering geographi-cally disaggregated data that has to be usable at a subnational scale. As a minimum, data in the disaster loss databases should be disaggregated by event, hazard and geographic area. Aligning loss databases with the SDG principles, countries are encouraged to pursue even higher levels of disaggregation (by recording differences in socio-economic impacts based on sex and gender roles, household level, etc.). People experience disas-ters differently, even within the same household. Traditional measures are not able to capture these variations because metrics stop at the national, subnational or even household level. While data remains sparse, there is evidence that women and
69 (Centre for Research on the Epidemiology of Disasters 2018)
265

The first review showed the need for more detailed, well-structured disaster loss databases at the national level, to enable measurement of outcomes under Targets A–D. This will be an area for focus on capacity-building and institu-tional coordination at the national level in the coming years. Such systems are valuable tools and data sets in their own right; they will contrib-ute to a better understanding of risks and disas-ter impacts globally and at national level.
Methodological advice on disaster data and trends
Trend analysis is susceptible to manipulation to obtain desired results, especially when the data being analysed contains either highly dispersed values or outliers (i.e. data points that are much higher or lower than average). When data series contain dispersed values or outliers, there is high uncertainty that must be accounted for when analysing trends and reaching conclusions.
For example, patterns of economic loss from disasters may show a general trend towards growth or decrease over a certain period, but this pattern could be driven by the occurrence of large-scale disasters near the beginning or end of the series. In many respects, infrequent large-scale events can be viewed as outliers, compared with extensive risk events that are at a smaller scale, recurrent, more frequent and show more solid trends. Changing the number of years displayed, and including or excluding these outliers, can result in trends that look markedly different.
Good statistical analysis requires data covering an appropriate period. In general, the longer the period of the data sample, the more reliable the conclusions (and the lower the uncertainty). The Sendai Framework targets specify a period of time that starts in 2005 and carries on until the end of the period of the Sendai Framework in 2030 for analysis. The initial period, from 2005 to 2015, referred to as the baseline, is suggested for Targets A and B, but it is highly recommended that Member States produce data for all four loss-based targets over the baseline period.
Nevertheless, a period of 10 years (the base-line) or even the full 25-year timespan for the reporting exercise of the Sendai Framework are still short periods of time, which will probably not provide enough statistical strength to deter-mine trends in a conclusive manner.
Another factor that deeply affects the quality of a trend analysis is the quality and complete-ness of all the data points across the sample. Unfortunately, in the case of the baseline, coun-tries will need to conduct historical research going back in time to 2005, at the minimum, and ideally even further back, to reduce the uncertainty of the analysis. Gathering all this past data on the quality and completeness will be a challenge for Member States. In many cases, no data collection was put in place that would guarantee homogeneous gathering of all the data required.
children are disproportionally affected by disasters in some – but not all – countries. Therefore, more surveys are needed to capture the underlying risks
that can include, but go beyond, gender and age divides and inform policies on such disparities.
Box 9.1. Methodological aspects of statistical analysis of the first reporting years: outliers, and statistical strength in trends and recommendations for further research
266 Chapter 9

Outliers and misleading trends
Outliers must be taken into consideration when analysing trends, as a large-scale disaster can happen at any time and the reading of the data may completely change. This is particularly true for earthquakes. As a result, upward trends are more likely to be found if the outlier is in recent years; equivalently, downward trends are more likely to be found if the outlier event happened in earlier years.
Missing data in earlier years and upward trends
Trend analysis depends on the length of period being analysed, which should be as long as
possible. In cases where quality of data is a challenge, taking a look at shorter periods of time when data availability and quality is better, might result in a more reliable analysis. Missing data points are more common in earlier years. Therefore, by taking absolute values by year, upward trends may be found that are the result of more data points being available in recent years. For example, data quality and cover-age have a significant effect on determining trends of losses. In this case, recognizing that not enough good data exists for the years under review, thus underestimating losses that occurred far in the past, makes more recent losses appear relatively higher.
70 (Marin Ferrer et al. 2018)
From the perspective of the international commu-nity working towards reduction of disaster losses, the need for data triggered by the Sendai Frame-work and the SDG monitoring processes represents a unique opportunity to build a bottom-up global disaster loss database. This would catalyse the process of global consolidation of data required to assess the progress in achieving the targets and consolidate a holistic, solid, evidence-based frame-work for DRR. From a country perspective, national disaster loss databases increase the capacity of countries to understand their risks and provide a solid evidence base upon which to assess and address their disaster losses and impacts, particu-larly those associated with climate and weather-related hazards. More specifically, loss databases may help to significantly improve the understanding of how disasters and risks affect the most vulner-able and could be a basis for better understanding trends in climate variability impacts and their true magnitude. The common aspirations of the global, national and subnational disaster risk community call for a better structured, effective, coordinated and harmonized way of collecting disaster loss data, alongside corresponding reporting
The landscape of disaster loss data is complex, as countries follow disparate approaches to collect, code and analyse data. Recent studies of the JRC Working Group70 show that within the European continent, there are disparities in the types of data indicators, thresholds, hazards and resolution of data collected (which may range from building or asset level to national aggregates), including data-collection procedures. For example, some European countries collect data at the building/asset level for the purposes of compensation. In Spain, compensation from official funds in data is collected by the Defensa Civil Española, or in France from insurance policies with data collected by l’Observatoire National des Risques Naturels. Other countries such as Australia and Canada have developed property and publicly accessible data sets, with the same caveat of smaller sets of indica-tors. Those databases that are focused on financial compensation usually lack disaggregated human loss indicators, or even some of the main human loss indicators such as numbers of people injured or made ill.
267

Despite the initial expectations that information-rich countries could easily comply with all of the requirements for the Sendai Framework Monitor-ing system, preliminary evidence demonstrates that most developed countries do not have inte-grated loss and damage information systems due to the large number of data sources that provide scattered sector or hazard-specific information. Even where national databases exist, they do not always contain most of the indicators required in OEIWG recommendations. Available databases, for example, in Australia, Canada and the United States, or other property loss databases, contain only a limited subset of the indicators proposed; a similar situation has been found in some European countries. For instance, no indicators are collected around critical infrastructure, injured/ill persons or affected people in many of these databases.
In most known loss databases, no matter their origin, software or age, there is little or no disag-gregation of human loss data by sex, age or other criteria requested by the SDG data disaggregation work stream.
As Member States continue their commitment to build, improve and align these loss databases, a consolidated global data set could be feasible within a few years. UNDDR has already been conducting consolidation exercises with data
Figure 9.1. Number of countries covered in the DesInventar Sendai repository, 2009–2017
from a growing number of countries to build the data sets used for analysis posted in GARs. Start-ing with 12 countries in GAR09, then 21 in GAR11, followed by 56 in GAR13, 82 in GAR15 and now, for GAR19, a consolidated data set contains data for 103 countries.
9.2
Successes and challenges in establishing national monitoring capabilities
9.2.1 Expectations of Member States for monitoring Sendai Framework implementation
To understand the successes and challenges of Sendai Framework monitoring, it is important to put into perspective what Member States are expected to do, in terms of establishing the institu-tional mechanisms that are required to undertake reporting as well as substantive information to be collected and shared through the system. Though the Sendai Framework Monitoring system has many functions that are common to a standard report-ing mechanism related to any area of international development, it also has certain distinctive points owing to the cross-sectoral nature of DRR.
Institutional structure
The first steps to be undertaken in the Sendai Framework monitoring process are to nominate a focal point for Sendai Framework monitoring, select institutions involved in the monitoring process, and define the roles and responsibilities of the selected institutions.
(Source: UNDDR)
268 Chapter 9

Every Member State is expected to nominate a main focal point for monitoring its implementation of the Sendai Framework and formally inform UNDDR. The focal point then has to undertake a selection of national institutions that will be engaged in the monitoring process. This enhances a decentralized and systematized process of monitoring through data sharing among various ministries and depart-ments. It is also possible for the designated focal point to bring in institutions outside its jurisdiction, if deemed necessary for the monitoring progress. The last step involves the designation of roles to the individuals nominated by the selected institu-tions. Roles can include:
Technical requirements
Different institutions are made responsible for reporting against one or more of the 38 global indi-cators or national custom indicators based on the above-mentioned structure. Unlike the reporting process for HFA, there are no established cycles in Sendai Framework Monitoring. However, there are usually two milestones when a snapshot is taken: (a) every March, contributing to the SDG monitoring reporting in HLPF for global Targets A, B, C, D and E and (b) in October for GAR in one year or a stock-take of the reported progress in the other year, for all Targets A–G. In addition, each Member State is expected to develop its own set of nationally deter-mined targets and indicators for implementing the custom reporting. However, the reporting require-ments on this are the prerogative of the Member State and can be adjusted according to the needs and requirements of national DRR strategies.
Through a rigorous process of consultation, UNDDR has developed guidelines that are publicly available in all United Nations languages, including informa-tion on minimum data sets required, recommended optimal data sets (including disaggregation), chal-lenges, temporal considerations, computation methodology (minimal to recommended data sets) and metadata: contents, methodology and other topics (coverage, representativeness and quality).71 These technical guidance notes form the basis for the reporting process but allow parameters to be defined within their national contexts.
71 (UNISDR 2018b)
a. Coordinator: This role is usually assumed by the national Sendai Framework focal point. S/he has the responsibility of setting up national reporting for the global targets, which includes adding institutions/users, configuring metadata, and for custom reporting, setting up nationally determined targets and indicators. (Metadata refers to the additional demographic and socio-economic parameters needed as an input into SFM by each country for calculations to be performed according to the technical guidance for monitoring and reporting on progress in achieving the global targets of the Sendai Framework, for example: currency foreign exchange rate, GDP and population.)
b. Contributor: Representative of institution assigned different indicators as per the area of focus of their parent institution. The main responsibility is to enter data for the indicators assigned.
c. Validator: This responsibility is usually held by the parent institution of the Sendai Framework focal point, but could be held by others as well. It is usually held within the government and at a high level of seniority. Only after a validator validates the data is it publicly available in the online system (under the analytics module).
d. Observer: An optional function that allows the holder to observe and make comments on the data entered. However, it does not come with rights for editing. Hence, this function could
be held by any institution within or outside the government.
269

As the gatekeepers of social, economic and envi-ronmental statistics, NSOs are well positioned to respond to important data needs arising from the Sendai Framework, the 2030 Agenda, the Paris Agreement and other global initiatives.
The integration of metrics for the global targets of the Sendai Framework within the global indica-tor framework for SDGs provides the opportunity for many of the aspects to be addressed as part of countries’ broader follow-up to the 2015 agree-ments. An appetite for joint analysis and develop-ment of applied information has been observed in many countries.73 Some Member States have brought in NSOs as one of the key contributors in their monitoring system, demonstrating the need for rigorous evidence to respond systematically and consistently to the requirements of the Sendai Framework.
Capacity development for monitoring: mastering the skills
The new Sendai Framework was developed in a consultative manner following calls by Member States for a more robust, comprehensive quan-titative framework. As recommended by OEIWG, steps were taken by UNDDR while developing the monitor:
9.2.2 Successes in establishing national capabilities for monitoring Sendai Framework implementation
This section presents the successes that have emerged since the launch of the Sendai Framework Monitoring on 1 March 2018, regarding the scale of reporting, engagement of NSOs, capacity-develop-ment efforts, and cross-sectoral, multi-stakeholder partnerships in data collection and monitoring procedures.
Scale of reporting: nothing succeeds like numbers
The success of Member States in developing capabilities for the Sendai Framework Monitoring system can be gauged from the number of coun-tries that have reported since the launch of the Sendai Framework Monitoring until the time when a snapshot of data was taken in October 2018. During this period, 80 countries reported on one or more of the reporting years since 2015. In addition, there are many others who have established the institutional structures described above. A review of these struc-tures shows that 43 of the Member States have three or more ministries and departments to whom one or more of the roles have been assigned in the online system.
In terms of country reporting against at least one target in each of the years, there is an upward trend, with the number of countries gradually increasing from 43 to 75 countries between 2015 and 2017, against at least one target in each of the years.
Engagement of national statistical offices: vital statistics
Monitoring and data collection should be embed-ded in NSOs and support a culture of evidence-based learning at the national and subnational levels.72
• The overarching finding of the Sendai Frame-work Readiness Review (a comprehensive survey among Member States) was that almost no country had the necessary capacities and subsequent functions to report against all the targets. In response, the technical guidance notes were developed to serve as a road map in support of Member State data consolidation efforts.
• Countries have been supported by trained personnel since the launch of the monitor-ing system, with different approaches in each region. The African Union Commission led the charting of a road map through its Africa Work-ing Group on DRR at a policy level. Regional Economic Communities also committed
270 Chapter 9

Strategic approach to capacity development
The Sendai Framework recognizes a State’s primary role in facilitating the achievement of its DRR goal and priorities and highlights the criticality of sharing these responsibilities with other stakeholders and realizing a participatory approach. To support this approach, United Nations Member States have identified a need for implementation support and enhancement of the capacity of institutions and individuals dealing with DRR. Without adequate capacity, it will be challenging to implement the Sendai Framework.
With the aim of guiding sustainable capacity devel-opment for Sendai Framework implementation, the UNDDR Global Education and Training Insti-tute began facilitating consultations with Member States, stakeholders and partners towards a Strategic Approach to Capacity Development for
Implementation of the Sendai Framework for Disas-ter Risk Reduction – a Vision of Risk-informed Development by 2030.
Consultations resulted in refinement of language, and Member States and other relevant stakeholders re-emphasizing the driving principles for effective capacity development for DRR, including that efforts are nationally owned and coordinated. Importantly, the strategic approach generalized advice on the capacity-development roles and responsibilities of various DRR stakeholders, provided high-level guidance in six critical areas of need, and validated proposed “anchors” to help strengthen and institu-tionalize capacity development.
The strategic approach is a guidance document that aims to reflect changes in needs and trends over time, envisaged to capture and share lessons learned, best practices and examples over time. Among the next steps for its implementation are orientation and awareness-raising for all, pilot testing, development of a monitoring, evaluation and learning mechanism for its implementation, and development of capacity development “market-place” guidance for adaptation at various levels. Capacity development is a long-term process that should be included in the implementation plans of DRR strategies, to effectively support the imple-mentation of the strategy and realize the Sendai Framework.
Engagement of multiple departments and stakeholders: leaving no one behind in monitoring
Sendai Framework monitoring calls for a new way of thinking when it comes to national reporting on DRR. In the HFA era, the national disaster manage-ment organization (NDMO) assumed responsi-bility for submitting the required information in the HFA monitor. The reporting was a centralized
72 (Peters et al. 2016) 73 (United Nations 2017a)
themselves to supporting their Member States in the monitoring process. In 2018, the Inter-governmental Authority on Development (IGAD) organized an event in June, the Southern Afri-can Development Community (SADC) in August and the Economic Community of West African States (ECOWAS) in November. In the Asia–Pacific region, subregional training was com-plemented at the national level, hosted by the Member States (subregional training involved two to three key officials from focal institutions, including the National Disaster Management Agencies and NSOs, while the national ones brought in representatives from virtually every ministry or department responsible for sharing the required data).
• Development of an online e-training module to support Member States in encouraging self-learning of assigned staff members in their focal ministries and departments. It is designed with the incentive of certification for trained personnel, and will also incorporate refresher courses as required, to ensure that the trainees have cutting-edge knowledge of the periodic improvements envisaged in the Sendai Frame-work Monitoring system.
271

exercise conducted under the authority of NDMOs. Many NDMOs established an offline coordination process, which, in most cases, involved the National Platform for Disaster Risk Reduction as the multi-sectoral and multi-stakeholder mechanism for coordination in this area of work. However, it was still the primary responsibility of NDMOs to compile the reports and feed into the HFA monitor.74 SFM provides a different approach to data sharing and information management. It presents the opportu-nity to assign different roles to various ministries as per the indicators accorded to them for data-collection purposes. For example, while the Ministry of Agriculture could focus on the economic losses of the sector in Target C, the Ministry for Health and the Ministry for Education could contribute data for the related infrastructure in Target D. However, it should be noted that responsibility of data provision must be distributed in a structured manner within established limits to ensure qualitative rigour and timeliness of reporting.
In addition, governments are not the sole produc-ers of data. Private companies, universities and other third-party actors may offer complementary sources of data useful for augmenting or validat-ing the official reporting system.75 In line with this, several Member States have brought their inter-national and national development partners in as observers or contributors. Building interoperability and comparisons into existing reporting and data-collection systems may also enhance such part-nerships for a wide range of purposes supporting global frameworks on sustainable development.76
9.2.3 Challenges in establishing national capabilities
This section identifies the challenges that Member States are experiencing in reporting against the indicators of the seven global targets of the Sendai Framework. Challenges relate to data management through sequential phases of collection, valida-tion, storage and analysis, proposed baselines for analysis, as well as overall institutional capacities in monitoring and reporting as they emerge from different country experiences.
Data is at the core of the monitoring process. The United Nations Secretary-General’s Independent Expert Advisory Group (IEAG) on the data revolu-tion has suggested nine core principles that should be common to all actors contributing data to the measurement of sustainable development.77 With regard to the Sendai Framework, the initial years of reporting point to the following challenges:
• Data availability. This includes collection practices, organizational culture, data-sharing mechanisms or the lack thereof, cost (e.g. of establishing collection systems, housing data and purchasing data), private sector proprietary concerns and data governance. Critical data gaps exist in specific areas of disaster loss, in all areas of international cooperation, and for many aspects of early warning, risk information and DRR strategies.
• Data quality. The implementation, monitoring and repor t ing of the Sendai Framework and the 2030 Agenda is predicated on the generation and provision of, and access to, high-quality disaster-related data that will allow effective collation, comparison and analysis by Member States and other stakeholders, within a country context, as well as among countries and regions. This will become all the more challenging without the application of commonly agreed methodologies and quality standards. Some NSOs are exploring the integration of open EO data and statistical data in existing decision-making structures.
272 Chapter 9

78 (United Nations 2017a)79 (Fakhruddin, Murray and Maini 2017)80 (Fakhruddin, Murray and Maini 2017)
74 (UNISDR 2013a)75 (Murray 2018) 76 (Migliorini et al. 2019)77 (Espey 2017)
The need for collective effort in enhancing aspects of data availability, accessibility and quality has been recognized by some key communities such as NSOs, and national mapping and geo-information
agencies. Unless gaps in data availability, quality and accessibility are addressed, countries’ ability to ensure accurate, timely and high-quality moni-toring and reporting of implementation across all targets and priorities of the Sendai Framework will be severely impaired.78
Disaster loss accounting: working behind the scenes
Processes and methods involved in the collection of loss data is a complex task, with the involvement of technical and non-technical inputs, as well as partners from a range of different disciplines. Even though having a disaster loss database has not been made compulsory by the Sendai Framework, a loss accounting system without an event-wise recording of events would lack credibility. Some of the key challenges related to the output-oriented indicators are as follows:
The complementarity of EO with traditional statistical methods means that EO can offer validation options of in situ data measurements (e.g. survey and inventory data), can commu-nicate and visualize the geographic dimensions and context of SDGs and Sendai Framework indicators, and, where appropriate, provide disaggregation of the indicators.
• Data accessibility. Data sharing among gov-ernment institutions is a cause of concern for several countries. A minority of agencies have a set procedure in place for data access. Even if informal exchanges occur, publica-tion or secondary use may be difficult without official authorization. However, as reflected in the above paragraph on the division of labour among relevant ministries, some Member States are beginning to set up mechanisms of data sharing that facilitate comprehensive reporting in SFM.
• Application of data. While sustained invest-ments in data creation and management are necessary, the ultimate value of information is not in its production, but in its use. To ensure the appropriate application of data, there is a need for data to be generated with users in mind. Herein lies one of the critical challenges that Member States face with the uptake of data and translation of information into actionable policies. Data providers often underinvest in operational tools supporting the translation of information and oversee the importance of engaging with those in a position to use data and drive action, thus compromising opportu-nities for uptake.
• Not all countries systematically collect disaster loss and damage data, and even fewer integrate this data into official national statistics.79
• Several disaster loss databases exist, but they face challenges such as standardizing data-col-lection processes, missing data, and inconsis-tent economic valuations of physical damage and losses.80
• There is a lack of simple loss data reporting procedures and common language to ensure the standardization of loss data collection, comparability, recording and reporting across countries. Even where loss accounting systems exist, they may be in the non-governmental domain and thus not officially endorsed as required for Sendai Framework monitoring purposes.
273

Disaggregation of data: more is less
Even though disaggregation has not been made compulsory by the Sendai Framework, Member States are encouraged to provide as much disag-gregation as possible against the different crite-ria established in support of each of the global
indicators. The key theme “leave no one behind” recognizes that the dignity of the individual is fundamental and that the 2030 Agenda’s goals and targets should be met for all nations and people and for all segments of society. Ensuring that these commitments are translated into effective action requires a precise understanding of target popula-tions. Disaggregation of indicators, where relevant, by income, sex, age, race, ethnicity, migratory status, disability, geographic location and other character-istics is essential in measuring vulnerabilities of affected populations. Aggregated data may mask inequalities within vulnerable groups that, unless disaggregated, will remain hidden to policymakers. Paying closer attention to the differentiated vulner-abilities of people requires data and analysis that zooms in on specific groups in finer detail. Differ-ent levels of disaggregation are useful depending on the context. Household data is widely used in examining, monitoring and evaluating the impact of disasters at the microlevel and informing policy development accordingly. Policies and nationwide programmes may necessitate data at the national or regional level, while interventions wishing to alter poverty and vulnerability dynamics at the household level (e.g. elderly, women and children) require data collection at the individual level.
Significant efforts in this regard are being made for the indicators of SDG 1 on poverty eradica-tion. The international household survey network, demographic and health surveys, multiple indicator cluster surveys, as well as regional initiatives such as the Africa Household Survey Databank, the Latin American and Caribbean Household Survey Data-bank, are promising examples. They offer opportu-nities for cross-sectoral data collection, tackling the interfaces of systemic global challenges.
Baselines: going back in time
Progress and change can be monitored only if there is a baseline. For example, in the Sendai Frame-work targets, countries are expected to report on human-related loss data for the period 2005–2015 to enable comparison with data from 2015 to 2030, per 100,000 population. However, the collection of
• Most of the countries responding to the Global Readiness Review collect a critical mass of disaster loss data (Targets A–D, more so for A and B). The practice of disaster loss accounting was said to be well established in many countries; however, data sets are typically more available on physical damage and human impact, and less available on economic losses, livelihoods, losses of specific assets and infra-structure, cultural heritage and disruptions to basic services.81
• Multiple taxonomies for hazards exist, including the Integrated Research on Disaster Risk (IRDR) peril classification82 and Cambridge taxonomy of threats for complex risk management.83 Controlled vocabularies are an essential component of technical data standards, as they provide a precise and agreed definition of what is being measured or counted.84
• In relation to classification, among hazard types, a system for naming individual tropical cyclones has been widely adopted only at the international level. At the same time, expansion of a system for assigning unique identifiers across multiple hazard types introduces some challenges (e.g. lack of creation of internationally recognized mechanisms for identifier generation, proce-dures for reconciliation of identifiers for events affecting multiple countries and adoption of standard operating procedures).85
• Lastly, 40% to 60% of countries reporting in the Global Readiness Review felt they could develop a baseline for most indicators for the disaster loss-related Targets A–D, though much fewer could do so for critical infrastructure, disrup-tions to basic services, losses to productive assets and the housing sector.86
274 Chapter 9

historical loss data will require an investment of time and resources and may not be possible for countries lacking the necessary data infrastruc-ture. The GBD study led by the Institute for Health Metrics and Evaluation is a potential resource to understand trends in disaster-related mortality. It is the most comprehensive worldwide epidemiologi-cal study in existence, with a description of mortal-ity from a variety of causes at global, national and regional levels. The extraction of baseline health measurements for some SDGs from GBD is already being explored. Capitalizing on and maximizing use of complementary data sets monitoring disaster loss data is critical for: (a) data comparability and (b) a nuanced understanding of more accurate benchmarks as points of departure if commitments under the Sendai Framework and the 2030 Agenda are to be realized.
Adapting to expected institutional mechanisms
Despite robust steps by many Member States, there is still room for improvement in terms of political recognition and active engagement for improved alignment of the different global frameworks in national planning. It will be necessary to demon-strate the synergies among the frameworks and efficiencies that can be realized in ensuring coor-dination by integrating, for example, Sendai Frame-work discussions into SDG data when advising at the country level.
In addition to this, political will and sustained funding is also required to enhance investment in the required data infrastructure. Raising awareness with national and subnational governments on how the different frameworks align is also critical. Given the higher international and political profile of SDGs, the SDG community needs to be sensitized to the Sendai Framework and actively consider coher-ence with the framework as it advocates for SDG
81 (United Nations 2017a)82 (IRDR 2014)83 (Coburn et al. 2014)84 (Fakhruddin, Murray and Maini 2017)
85 (Dilley and Grasso 2016) 86 (United Nations 2017a)87 (Murray 2018)88 (Peters et al. 2016)
data system improvements. This combination will serve to reduce fragmentation and duplication.87 The criteria for portfolio development in donors and regional development banks should recognize and reward initiatives designed in ways that deliver progress on multiple resilience goals and targets.88 Some countries have also set up committees comprising national stakeholders to identify data holders and gaps in data needed, which should be coordinating with SDGs as and where available.
SFM provides an opportunity for a shared approach to monitoring and related reporting. However, given the need for interministerial policy decisions and associated administrative steps, it has not been easy for countries to establish this institutional structure within a short period of time. This has led to some countries reverting back to HFA proce-dures of soliciting offline information and opting for a centralized data management process. As a result, sometimes the dilemma has been that Member States that did not focus on establishing a decentralized institutional mechanism may have progressed faster in their reporting commitments, while those that put extended efforts into develop-ing the new institutional structure as per SFM may have done so at the cost of a delay in their reporting in the system.
Problems encountered in the first year
SFM is expected to have a lifespan of 12 years. At the time of writing this GAR, it has been launched for about a year. It was launched in a phased approach where different modules were released over time. There was a period of learning as the online tool was rolled out and gained more users. However, nomination of the country focal points has also taken time in many cases, and there has been a high turnover in the focal agencies and their staff, requiring retraining orientation of new staff.
275

Over 600 users now have access to the system, with different kinds of roles. However, it cannot be assumed that all users become conversant with the system with equal ease. Even when information is available within the government domain, there is still a period of time needed to ensure its smooth transition into the desired formats of the monitor-ing system. In fact, to assume the assignment of these roles is a mere technical function would be a gross underestimation. Even if within the monitor-ing system it is a simple matter of filling a form, in the context of the government’s procedural requirements, the efforts and commitment behind it cannot be overemphasized. This is another process that requires dedicated time and must be under-taken at the outset.
SFM is an online tool, and is therefore highly depen-dent on broadband Internet access. Thus, the differ-ential bandwidth among regions and even countries within the same region, was a fundamental issue, as expected in any online reporting mechanism. Though part of this is a broader challenge of con-nectivity, the substantial reporting from some of the developing countries is a testament to how they have not let such constraints inhibit their commit-ment to accountability.
Translation of content into the languages of the United Nations has taken time and has sometimes been conducted in a staggered manner. Moreover, translation is not a one-time phenomenon, as the deployment of each new module (including in multi-ple languages) requires a similar feedback loop. This enriches the software, making it progressively easier for users to record their data.
9.2.4 Reporting by targets: trying to be on target
There are several target-specific challenges that Member States may be facing while report-ing against the indicators of each of the global targets. This requires further technical discussion on those issues that have been highlighted in the technical guidance for monitoring and reporting
on progress in achieving the global targets of the Sendai Framework. One of the main considerations OEIWG made in its report89 was that Member States agreed that countries may choose to use a national methodology or other methods of measurement and calculation to measure the key parameters of individual targets, especially for Targets A–D. However, OEIWG also recommended that countries keep the metadata consistent if the methodology is changed.90 For the purposes of this GAR, some of the key issues are outlined below.
Target A
As described previously, this target is related to reduction of mortality by 100,000 population in the decade 2020–2030 as compared to 2005–2015. Some issues related to the estimation of mortality are as follows:91
• Determining which deaths are relevant and comprehensively attributable to disasters is complex; alongside the direct impact of a hazard on health, there are many indirect pathways to mortality.
• The time periods between the exposure to a hazard and death can vary widely. The disruption of care for chronic conditions and onset of persistent stress can lead to a greater disease burden or deaths that may not occur for months or years after a disaster.
• Data availability is not uniform across the world. WHO regularly receives cause-of-death statistics from about 100 Member States, yet two thirds (38 million) of 56 million annual deaths are still not registered.
• Though all countries are vulnerable to disasters and loss of life, there is generally a higher exposure to disasters and the risk of death in low- and middle-income countries, which often coincide with those lacking vital registration data, further magnifying the data gap.
• Populations are mobile across country borders, causing challenges in accounting; it has been suggested that each death should be counted in
276 Chapter 9

A disaster loss accounting system that records event-wise losses is a critical requirement to make credible information available for Target A. In fact, despite the above-mentioned challenges, Target A had the highest number of countries reporting comparing to other targets. It is also evident that more countries are making concerted efforts in accumulating disaggregated data, even though this was not a mandatory requirement.
Target B
This target is related to reduction of people affected by disasters by 100,000 population in the period 2020–2030 as compared to 2005–2015. Some issues related to the estimation of affected persons are as follows:93
89 (United Nations General Assembly 2016a) 90 (UNISDR 2018b)91 (Saulnier et al. 2019)
92 (UNISDR 2018b)93 (Clarke et al. 2018)
Given the different forms in which disasters can affect individual lives and assets, countries need to take a multisectoral approach to monitoring and reporting, to foster a broader set of information and strengthen the resultant analysis. Key organizations working on health such as WHO and Public Health England are trying to address some of the health-related issues through extended guidelines for the ministries and departments of health. Critical study-ing, careful planning and robust systems to improve data analysis across different sectors in health, agri-culture and transport can assist building trust in the data, expanding people’s ability to use it, so that their needs are at the heart of data-collection processes.
the country where the death occurred, regardless of the nationality of the dead person.92
• Most vulnerable people, including il legal migrants, tend to be unrecognized by author-ities; thus, the real number would be higher than that reported.
• As reported by some Member States, data disag-gregation is a challenge that requires systematic records of disaster losses per hazardous events. In spite of addressing this in the target, it is difficult to obtain baseline data without disaster loss accounting systems from the respective period.
• As with Target A, concerns around attribution apply. Target B encompasses scenarios where cascading effects from hazards can develop into significant impacts. A simple assessment approach is critical, as measurement involves drawing information from a wide range of sectors.
• Like Target A, data on injured and ill people can come from existing health indicators that are adapted to target disaster-specific impacts, but clarification is essential of the periods of time used for measurement and the inclusion of sec-ondary illness and injury. Mental health issues, among the most acute health impacts associated with disasters, are a specific area requiring defini-tion within ill- and injured-person calculations.
• Local authorities and international standards need to also account for degrees of damage to informal settlements through GIS and remote-sensing techniques that can assess impacts to the physical environment such as for dwellings and local infrastructure.
• When data for assessing impacts of disasters on affected persons is not available or suf-ficient, proxies may serve as useful, alternative sources. Proxy indicators for instance, are widely used by the World Bank Group’s GFDRR, which has employed PDNA techniques using sector-specific data for employment, agricul-ture, health, transport and communication, and by FAO using data on agriculture, food security and nutrition.
277

Target C
This target encompasses the reduction of total direct economic losses as a proportion of global GDP. Some issues related to the estimation of economic losses are outlined below:94
Though indicators related to economic losses seem to be one of the more complicated ones in terms of methodology and computation, this is the target that is covered most comprehensively by the avail-able guidelines. Moreover, since a large part of the economic losses are borne by high-income coun-tries, these are also the same countries where the penetration of formal insurance mechanisms is high, thus providing more structured information on validation of economic losses. Reiterated efforts and sustained funding are needed to better capture the indirect costs and cascading impacts of disas-ters for the most vulnerable segments of the world’s population.
Target D
This target aims at the reduction of losses to criti-cal infrastructure and disruption of basic services. Some issues related to the estimation of losses are outlined below:97
• The definition of global annual losses attributed to disasters omits the substantial losses in pro-ductivity and well-being, which lead to economic impact. However, the complexity of necessary assessment protocols is avoided to ensure that indicator calculation is practical and feasible.
• Measurements for assessment of indirect economic losses are less developed and not included in the Sendai Framework. But under-standing the cascading impacts of disasters on economic welfare and productivity is critical, particular as drivers of hazard risks changes over time.
• As in the case of Target B, when reliable infor-mation is absent, proxies may be useful, but come with the caveat that non-private price indi-ces be used as often as possible; an example of this is reconstruction inputs such as building materials. Noted challenges extend to the appli-cation of affected ratios (i.e. amount of damage due to a hazard) that may give binary, catego-rized (segmented) or continuous (percentage) values in damage ratios. At different periods following a hazard impact, reporting practices should also reflect need, thus requiring assess-ment protocols providing for a rapid one and a subsequent one, a year later.95 Estimating losses to cultural heritage is a unique and context-specific challenge. While available guid-ance proposes assignment for non-movable and movable cultural heritage assets, their value is difficult to disentangle from local connection and (if applicable) tourism-related income. Cul-tural heritage issues associated with the natural environment further add to this challenge.
• In the Global Readiness Review, the responding countries mentioned that data sets were typically more available on physical damage and human impact, and less available on economic losses.96
• Clear definitions are key to consistency in reporting on Target D. For instance, there are challenges of measuring disruption due to slow-onset and small-scale disasters.98
• Disaster loss data is greatly influenced by large-scale catastrophic events, which represent important outliers in terms of damage to critical infrastructure. UNDDR recommends countries report the data by event, so that complementary analysis can be undertaken to obtain trends and patterns in which such catastrophic events (which can represent outliers in terms of damage) can be included or excluded.
• As national disaster loss databases that have been developed do not necessarily include historical data on damage to railways, ports, airports and other infrastructures, establishing baseline data is a challenge.99
• Contrary to recommendations, damage and disruption to infrastructural assets and services can be disaggregated according to the institu-tional level (e.g. primary or secondary health facilities), rather than based upon size. Such
278 Chapter 9

94 (Clarke et al. 2018)95 (Clarke et al. 2018)96 (United Nations 2017a)97 (Clarke et al. 2018)98 (UNISDR 2018b)
99 (UNIS7DR 2018b)100 (Clarke et al. 2018)101 (United Nations 2017a)102 (UNISDR 2018b)103 (OEIWG 2016)
For the purposes of the Sendai Framework monitor-ing, baselines for Targets C and D are not compul-sory because the targets, as articulated, do not include a baseline comparison. However, to the extent possible, it is recommended that countries account for data by event, so that complementary analysis can be undertaken to obtain trends and patterns in which such catastrophic events (which can represent outliers in terms of damage) can be included or excluded. As part of Target D, captur-ing information on critical infrastructure is key for a government, as reducing losses on this infra-structure and these services could lead to reduced losses in other targets, especially Targets A and B.
Target E
This target relates to the increase in the number of countries having national and local DRR strategies, aligned to the Sendai Framework:
Countries are therefore recommended to conduct detailed self-assessment of national DRR strategies and use them as a benchmark against established global targets and indicators. They can then iden-tify gaps for undertaking DRR actions and for other actions.
Target F
This target aims at enhancing international coop-eration on DRR. In the Global Readiness Review, for Target F, only 20% (the lowest among all targets) of the countries reported that they have the available data.101 The provision or receipt of international cooperation for DRR is conducted with subsequent modalities in each country.102
The challenges raised by Member States for some of the Target F indicators include:103
classifications are in line with practices in public sector risk assessment and private sector catastrophe modelling used to inform insurance products.100
• There is an element of subjectivity in the self-assessment of the national DRR strategies because Member States score themselves against 10 criteria related to the Sendai Frame-work. However, it is similar to the HFA monitor with which Member States are familiar, where there was also an element of subjective scoring.
• SFM can provide a monitoring platform for DRR strategies with defined indicators and targets.
• A focus should be placed on implementation of DRR strategies. As the statutory and regulatory systems vary among Member States, the deci-sion regarding the adoption and implementation
• Separating DRR components from the overall amount of resources.
• Confidentiality concerns about sharing the requested information.
• Common terminology for “disaster risk reduc-tion actions”, “disaster risk reduction-related technology” and “disaster risk reduction-related capacity-building”.
of DRR strategies to be included in the calcula-tion has been left to Member States.
• Compared to national strategies, local DRR strategies are far more heterogeneous, vary across countries and local administrative units, and change over time. It is therefore difficult for the national government to track all local strategies without a substantial scheme (e.g. legislation).
279

Target G
This target relates to enhanced capacities for EWSs, risk information and assessment, and pre-disaster evacuation. As with Target E, this target also has an element of subjective scoring based on ranking of hazards and scoring of initiatives under-taken on issues related to EWSs and risk informa-tion. Key components of effective MHEWSs include aspects of systematic detection, monitoring and forecasting of hazards, vulnerability and exposure. They also include detailed capacity analysis of the risks involved and appropriate means of communi-cating risk information from accountable authori-ties to populations exposed to or at risk at the local level, such that appropriate action to prepare and respond in a timely manner is prompted.
A few issues for consideration are as follows:104
Early lessons on MHEWSs highlight that early warning practice can still improve from past expe-riences and increase its efficiency, at the level of analysis (data collection and risk assessments) and ensuing action (response). National institu-tions need to exercise strong ownership of the risk assessment and identification steps of the system. There is no single “off-the-shelf” EWS; instead, a variety of practices make the MHEWS design diverse and context specific. International organizations, strengthening local capacities, can have a complementary role by means of promot-ing national ownership and strengthening national capacities for early warning.
• While useful to identify DRR actions, the OECD DAC Creditor Reporting System codes do not comprehensively cover DRR-related support to developing countries in terms of sectoral defini-tion within development assistance.
• The methodology for capturing the data for Indi-cator F-2. This needs to be further developed and clarified, particularly about the option to report as a “provider” and ways in which funding channelled through multilateral agencies should be reported.
• SDG Indicator 17.7.1 does not have an interna-tionally established methodology or standard yet, and a definition of “environmentally sound technologies” is missing from the methodologi-cal development for Indicator F-4.
• There is a lack of useful and reliable indicators for science and technology innovation in many developing countries. In addition, there is no internationally established methodology or stan-dard yet for SDG Indicator 17.6.1. on “science and/or technology cooperation agreements and programmes between countries, by type of cooperation”.
• As MHEWSs vary considerably among countries, instead of counting the number of systems, UNDDR suggested a focus on functionality.
• The selection of major hazards to be included in MHEWSs is determined nationally, recogniz-ing that hazardous events differ significantly among countries in terms of frequency, scale and intensity.
• With regard to measuring coverage of early warning information, Member States may wish to examine proxies for the level of “information redundancy”, that is, the number and kind of dif-ferent warning dissemination channels provid-ing the same authoritative warning information.
• In calculating coverage, the number of exposed populations would ideally be used. However, identification and calculation will be challeng-ing, especially for small- and medium-sized hazardous events and for such an event when not everyone exposed is affected. Therefore, UNDDR suggested the use of a proxy, for exam-ple, the total population in targeted subnational administrative units.
• As more than one MHEWS could cover the same geography or population, Members States should consider double counting and consis-tency of information.
280 Chapter 9

9.3
Support for thematic and sectoral review of progress
Sectoral analysis is required for full reporting under the Sendai Framework. There has already been considerable international cooperation in various sectors. Two examples are given below of such cooperation, relating to agriculture and school safety.
9.3.1 Agriculture sector
Agriculture forms the livelihoods of 2.5 billion people worldwide. Three quarters of the world’s poor obtain their food and income from farming, livestock rearing, forestry or fishing. Smallholders manage over 80% of the world’s estimated 500 million small farms and provide over 80% of the food consumed across the developing world.105 With the growing frequency and impact of disas-ters and extreme events, they regularly face storms, drought, floods, pests and diseases that destroy or damage harvests, livestock, supplies, equip-ment, seeds and food. Over the past decade, 26% of all damage and loss from climate-related disas-ters in developing countries was in the agriculture sector.106 Moreover, the impact of disasters is not limited to the immediate short term. Disasters often undermine decennial development gains, thus making communities increasingly vulnerable and less able to absorb, recover and adapt to future risks.
In partnership with UNDDR, FAO has developed the Methodology to Assess Direct Loss from Disas-ters in Agriculture, which is used to track progress towards achieving Indicator C-2 on reducing direct agricultural loss attributed to disasters, under
104 (UNISDR 2018b)105 (UNEP and International Fund for Agricultural Develop-ment 2013)106 (FAO 2018)
Sendai Framework Target C on global economic loss. This new methodology seeks to standard-ize disaster impact assessment in agriculture. However, it needs to be institutionalized at the country level. FAO has therefore been providing support and building capacity of national institu-tions for the adoption, operationalization and imple-mentation of this methodology. A growing number of countries across Latin America, the Caribbean, East Africa and Southeast Asia are already adopt-ing this new approach and are becoming ready to report and track their progress towards Sendai Framework commitments to reduce direct loss from disasters in agriculture.
FAO supports countries in reducing risk and strengthening agricultural livelihoods for building resilience to disasters and crises, while remain-ing context specific and anchored in local liveli-hoods and food systems. FAO resilience-relevant work is defined around three main groups of shocks: natural hazards, including climate change extreme events; food chain crises and transbound-ary threats, including pests and diseases and food safety, in alignment with the Sendai Framework broader scope of hazards; and protracted crises, including violent conflicts. Through this holistic approach, FAO is able to address the compound nature of disasters and the interconnectedness of threats.
Improving crisis and risk governance
Agricultural livelihoods can be protected from multi-hazards only if adequate disaster risk and crisis governance is present at all levels through risk-informed legal, policy and institutional systems, as well as disaster and risk management capacities for the food and agriculture-related sectors.
281

partners from the Global Alliance on Disaster Risk Reduction Education and Resilience in the Education Sector as a response to the High-Level Dialogue Communiqué at the 2013 Global Platform for Disaster Risk Reduction. This initiative aims at securing political commitment and fostering the implementation of safe schools globally. The World-wide Initiative motivates and supports governments to develop and implement national school safety policies, plans and programmes in combination with the three technical aspects of comprehensive school safety. It offers technical assistance and expertise to support interested governments in implementing comprehensive school safety at the national level and promotes good practices and achievements in safe school implementation for replication in other countries and regions.
Partners of the Global Alliance developed different tools and methodology to enhance school safety. For example, the United Nations Educational, Scien-tific and Cultural Organization (UNESCO) promotes a multi-hazard school safety assessment method-ology, namely visual inspection for defining safety upgrading strategies (VISUS). The VISUS methodol-ogy has a strong component on capacity-building for decision makers, technical staff and universi-ties. It allows them to make better informed deci-sions on how to prioritize funding for improved school safety and has been successfully tested in seven countries (El Salvador, Haiti, Indonesia, Italy, Lao People’s Democratic Republic, Mozambique and Peru), where the security of more than 500,000 students and educational staff was assessed. UNESCO is working on the conceptualization of an International Programme for Safe School Assess-ment, through the implementation of the VISUS methodology worldwide.
Early warning – early action
Monitoring risk and disasters helps to prevent, prepare and reduce impact. The FAO Early Warning Early Action (EWEA) system translates warnings into anticipatory actions to reduce the impact of specific disaster events. It focuses on consolidating available forecasting information and putting plans in place to ensure government partners act when a warning is at hand. On a global level, early warning sources to monitor the main risks to agriculture and food security are published in the EWEA quarterly report. At a country level, FAO works closely with country offices to develop EWEA systems tailored to local contexts. Implementation is under way in Kenya, Madagascar, Mongolia, Pacific Islands, Para-guay, Sudan and others.
9.3.2 School safety initiatives
The Global Alliance for Disaster Risk Reduction and Resilience in the Education Sector is a multi-stake-holder mechanism composed of United Nations agencies, international organizations and regional networks. Partners are working to ensure that all schools are safe from disaster risks and all learners live in a culture of safety. The work of the Global Alli-ance is expected ultimately to contribute to a global culture of safety and resilience through education and knowledge, in support of SDGs and in line with the Sendai Framework. It promotes a comprehensive approach to DRR education through the Compre-hensive School Safety Framework.107 This is based on education policies, plans and programmes that are aligned with disaster management at regional, national, subnational, district and local school site levels, whose goals are to: (a) protect students and educators from death, injury and harm in schools, (b) plan for continuity of education through all expected hazards and threats, (c) safeguard education sector investments and (d) strengthen risk reduction and resilience through education.
The Worldwide Initiative for Safe Schools was launched in 2013 by UNDDR in collaboration with
282 Chapter 9

107 (Global Alliance for Disaster Risk Reduction and Resil-ience in the Education Sector 2017)
9.4 Development of national disaster-related statistics
The adoption of common reporting mechanisms for the Sendai Framework and the 2030 Agenda has prompted the international statistical community to support the development of disaster-related statis-tics and frameworks. The following section exam-ines this work and its repercussions.
Within the context of a globally agreed policy frame-work and global indicator monitoring systems, governments have given increased attention to disaster-related statistics. As this area of statistics is a new endeavour in nearly all countries, there is a strong demand for technical guidance and sharing of tools and good practices internationally.
Core concepts and indicators for DRR for interna-tional monitoring are defined in the Sendai Frame-work and SDGs, but there is a need to translate the agreed concepts and definitions into specific instructions and technical recommendations for production and dissemination of statistics. Basic requirements for the international indicator monitor-ing systems include comparability of concepts and methods for measurement across disaster occur-rences. These systems depend heavily on coordi-nation and consistency at the national and local levels.
Countries have different practices for compil-ing data and preparing statistical tables related to disasters, which makes it difficult to make comparisons or conduct time-series analyses covering multiple disasters. The Sendai Framework focuses on risk assessments, mirroring government demands for improving prevention and prepared-ness efforts. As risk assessments require infor-mation beyond operational disaster data, there is a need for disaster measurements and statistics
across disasters, times and geographic locations, and for the integration of disaster information with social, economic and environment statistics.
In many cases, disaster-related data is produced outside the national statistical system and is not included in official statistics. NSOs are often not involved in compiling the data. However, consider-ing the traditional strengths of NSOs and the institu-tional context for national DRM, different roles can be identified for NSOs. These roles can be grouped into two parts:
9.4.1 Conceptual issues
Disaster-related statistics include, but are not limited to, statistics about disaster occurrences and their impacts. Disaster-related statistics also include statistical information used for risk assess-ment and post-disaster impact assessments, which rely on analysis of a variety of sources of data on the population, society and economy, like censuses, surveys and other instruments used in official statistics for multiple purposes. Geo-referenced
• Core roles that should be undertaken by any NSO. These reflect typical strengths of NSOs, such as producing time-series statistics and indicators, providing baseline information f i t for purpose for DRM, suppor ting the assessment of social, environmental and economic impacts, etc.
• Expanded roles with additional tasks that could be incorporated into the functions and respon-sibilities of NSOs. These can include leading impact assessments, coordinating geographic information services and conducting risk assessments. Some NSOs have already imple-mented such roles.
283

statistics on population, businesses and infra-structure support the assessment of the number of affected people and other possible impacts of disasters from natural hazards.
Disaster risk is unevenly dispersed within countries, across the world and over time. Each disaster event is different; it is relatively unpredictable, and creates significant changes to the social and economic context for affected regions. To identify authentic trends, rather than random fluctuations or effects of extreme values, much of the analysis of disaster-related statistics requires a coherent time series and depends on clear and well-structured statisti-cal compilations. This context puts an exception-ally high value on harmonizing of measurement for related statistics over time and, as much as feasi-ble, across countries and regions.
Statistics on impacts of disasters are linked to uniquely identifiable disaster occurrences. Collec-tions of these statistics need to be structured and documented in such a way as to maintain the links to relevant characteristics of the underlying disaster occurrence (e.g. timing, location or hazard type), while also remaining accessible to users as inputs for cross-disaster analyses (e.g. monitor-ing indicators over time or in models for predict-ing and minimizing disaster risk). Thus, a basic challenge in disaster-related statistics is to make statistics accessible for use in multiple forms and purposes of analyses, while maintaining harmo-nized and coherent compilations via structured use of metadata.
The challenge is best addressed through the devel-opment, agreement and application of a commonly agreed measurement framework.
Based on the above, the fiftieth session of the United Nations Statistical Commission took place from 5–8 March 2019. In this Session (Report of the Commission subject to editing),108 the Commission requested the United Nations Statistics Division, ESCAP, UNECE, ECLAC and UNDDR, in consulta-tion with members of the existing regional expert groups and task forces to consider options and modalities for the establishment and coordination
of: (a) a formal mechanism under the purview of the Commission to progress a common statisti-cal framework on disaster-related statistics; (b) a network across the expert communities to sustain cooperation, coordination and fundraising for enhancing statistics related to hazardous events and disasters; and (c) report back to the Commis-sion at a suitable time.
The Commission also urged the international statis-tical community to expand its capacity building efforts in statistics relating to hazardous events and disasters to assist countries in strengthen-ing capacities for disaster management agen-cies, national statistical offices and other related contributors of official data to meet reporting requirements for evidence-based approaches to achieving national development policies, plans and programmes, and the goals and targets in the Sendai Framework and the 2030 Agenda.
9.4.2 International support for development of disaster-related statistics
There are several international initiatives to support development of disaster-related statistics. Key high-lights include: the United Nations Statistics Division Framework for the Development of Environment Statistics109 with the support of the Expert Group on the Revision of the Framework for the Development of Environment Statistics, and the UNECE Task Force on Measuring Extreme Events and Disasters since February 2015.
At a regional level, ESCAP established an expert group on disaster-related statistics in Asia and the Pacific in 2014. This has produced a disaster-related statistics framework and a technical guide-line designed for national statistics systems and applicable at multiple scales. ECLAC has long provided technical assistance and training to coun-tries in disaster statistics and indicators and has now established a Working Group on Measuring and Recording Indicators related to DRR for the biennium 2018–2019.
284 Chapter 9

108 (United Nations Economic and Social Council 2019)109 (UN DESA 2017)110 (United Nations Economic and Social Council 2018a)
111 (GEO 2019b) 112 (GEO 2019b)113 (GEO 2019a)
9.4.3 Leveraging disaster-related geospatial and Earth observation data
The 2030 Agenda requires data to understand needs, to study and define solutions, and to monitor progress. The leveraging of disaster-related geospa-tial and EO data and tools in the pursuit of SDGs and the goals and targets of the Paris Agreement, NUA and other related agreements is essential.
The United Nations Committee of Experts on Global Geospatial Information Management (UN-GGIM) supports country implementation by focusing on guidance setting directions with regard to the production, availability and use of geospatial infor-mation within national, regional and global policy frameworks. This will lead to a better integration of geospatial and other key information in support-ing the various post-2015 development agendas as well as their national risk reduction strategies and other national plans. Two reports considered at the eighth annual session of UN-GGIM are particularly important as they bring into context the contribution of geospatial information and services for disasters as well as geospatial information for sustainable development.110
The Group on Earth Observations111 (GEO) is an intergovernmental partnership working to improve the availability, access and use of EOs for the benefit of society. GEO has a work programme of over 70 activities, which cover the global priority areas of the 2030 Agenda, the Paris Agreement and the Sendai Framework. Through this work, GEO has brought together the Global Earth Observa-tion System of Systems,112 which makes available more than 400 million units of data, information and resources.113
9.5Conclusions
Four years after the adoption of the 2030 Agenda and the Sendai Framework, countries have taken bold steps towards meeting the ambitious aspira-tions of these transformative plans. In their shared quest to achieve the goals, countries are dealing with daunting global challenges: inequality, a chang-ing climate, instability and fast-paced urbanization. Decision makers across the globe need to critically reflect on how their countries, cities and communi-ties can become more resilient while confronting the interrelated risks. These normative aspirations must be matched with implementation and tangible progress by providing the most up-to-date data and achievements so far. More solid evidence is required, but preliminary findings reiterate previous trends on the highest toll of disasters experienced in the most vulnerable segment of the world’s populations.
285

Part II Conclusions and recommendations Conclusions
Direct losses are only one piece of the puzzle. The impact of disasters needs to be understood more holistically. When disasters hit, indirect effects are experienced in terms of mortality and morbidity, as well as assets, infrastructure, employment and education opportunities that determine the well-being of affected populations. It is necessary to look at data afresh across goals and targets and establish metrics for those dimensions of disas-ter impacts that accrue to the most vulnerable by going deeper into distributional analysis, moving away from regional, national and subnational data to the household level.114 Key indicators such as mortality, morbidity, educational attainment and nutrition outcomes should be disaggregated across all metrics wherever appropriate. If it is endeav-oured to reach first those who are furthest behind, it is necessary to understand how socioeconomic circumstances affect any given individual’s likeli-hood of being healthy and educated, accessing basic services, leading a dignified life and eventu-ally building back better after a shock.
Open access, validated and interoperable data across the disaster continuum is critical for the development of evidence-based policies. The exam-ples presented above, together with the roll-out of technical guidance notes on Sendai Framework Monitoring, encourage understanding of the cross-sectoral benefits of reporting on progress against SDGs and the Paris Agreement. Increased interna-tional attention and targeted funding across differ-ent goals is slowly starting to yield results. However, it is critical to maintain momentum and continue to coordinate global and national efforts in terms of taxonomy and comparability across databases moving forward.
This part has demonstrated that while disaster risks are intensifying at a global scale, the collec-tive will to address them has been insufficient. The hope with initial findings is that by assessing the true costs of disasters, prioritization will be placed on the trade-offs inherent in the setting of national planning and budgeting. Given limited capacities and funding on data collection, governments need to decide where they should invest their resources first. By analysing the underlining risks inherent in social, economic and environmental activity and having precise understandings of target popula-tions, policymakers can tailor durable solutions and effective action for their societies.
Recommendations to Member States on improved data collection for Sendai Framework monitoring
• Connect data-collection efforts for the Sendai Framework, which should be brought into the realms of official statistics in coordination with NSOs. This can make disaster loss accounting a standard good practice for feeding into Sendai Framework monitoring as it enables event-wise disaggregated data that lends itself to more credible analysis.
• Invest efforts on building a strong customized reporting mechanism that focuses on nationally oriented issues and supports the monitoring framework of national DRR strategies in con-junction with NAPs and local-level monitoring of the Sendai Framework.
• Align targets and indicators with other countries in the region or with similar geo-political/hazard profile so that spatial comparison can be under-taken if desired.
286 Chapter 9
114 (UNISDR 2017e); (Walsh and Hallegatte 2019)115 (Data Revolution Group 2019)116 (Sustainable Development Solutions Network 2017)
• Leverage the latest research in data science to facilitate the reporting process based on common principles and standards. Meanwhile, it is essential to support the data revolution for sustainable development as recommended by the Secretary-General’s IEAG on the data revolution.115
• Invest in physical infrastructure, especially in the IT sector, to ensure better online reporting and loss accounting at all administrative levels while building capacities in cartography and geospatial data to better record losses through a complementary initiative of in situ and satellite-based monitoring.
• Build synergies so that Member States, espe-cially developing and less developed countries, endeavour to engage with resident and non-resident United Nations entities that are cus-todian agencies for different SDG targets and indicators, to ensure best possible in-country synergies for SDG reporting.
• Build partnerships with other stakeholders and expert organizations as a key to enable a strong data-sharing network and comprehensive reporting. To the extent possible, such partner-ships should explore multiple uses of the data so that there is a broader demand and intrinsic incentivization for data collection and sharing. Engage with the private sector, for example, the insurance industry, housing sector, chambers of commerce and industry. This is essential for a more comprehensive capture of economic losses.
• Promote a data system that is fit for purpose to monitor and achieve SDGs and the other United Nations landmark agreements and help govern-ments to:116
о Manage and govern more effectively, pro-viding policymakers with real-time or near-time information on the quality of services, the welfare of the population and the state of the environment so they can correct their course and change policies to meet chang-ing demands.
о Monitor historical progress and ensure objectives can be met, track changes over time and help to project where we are headed into the future.
287
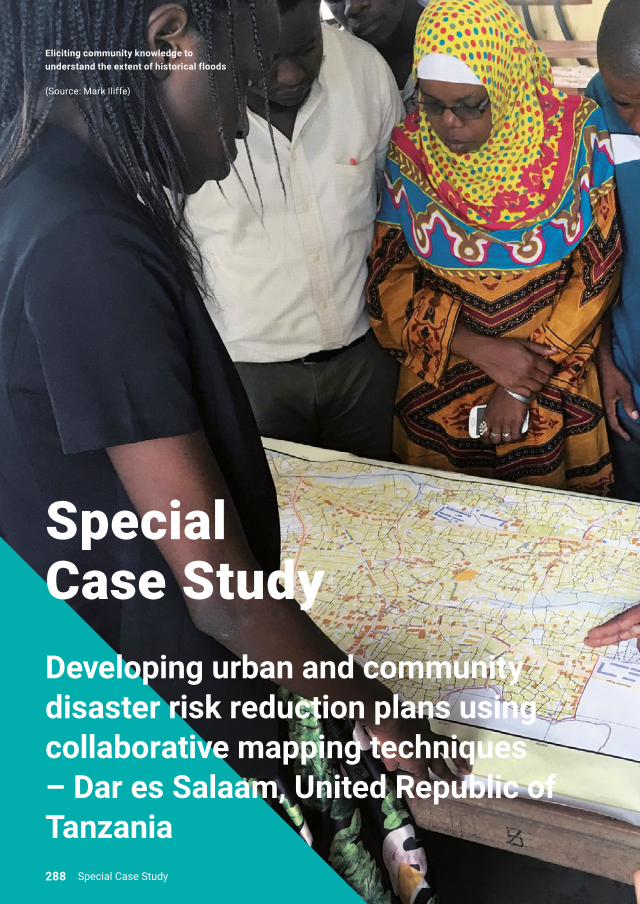
Developing urban and community disaster risk reduction plans using collaborative mapping techniques – Dar es Salaam, United Republic of Tanzania
SpecialCase Study
Eliciting community knowledge to understand the extent of historical floods
(Source: Mark Iliffe)
288 Special Case Study

Dar es Salaam, United Republic of Tanzania, is one of the fastest growing cities in Africa. With a current population of 4.1 million, it is projected to become a megacity by 2030. Maps and geospatial infor-mation are critical to the development of any city, vital for placing public services and ensuring the safety of its citizens. However, numerous factors add complexity to the security of Dar es Salaam’s residents.
These include the rapid population growth from a population of roughly 300,000 in 1970 to that of the present day, unplanned and informal settle-ment, and a highly variable climatic environment, all of which contribute to a high risk of flooding.117 Dar es Salaam’s institutions have limited technical capacity in terms of skills, training and equipment. This challenge is further compounded by lack of access to existing geospatial information and gaps in data.118
In early 2018, heavy rains caused widespread flood-ing that affected 50,000 people and claimed at least 41 lives. According to official figures, the emer-gency response and recovery cost to the Govern-ment was more than $780,000.119
In response to this rising set of challenges, a consortium of local academic institutions and NGOs working with the Tanzanian Commission of Science and Technology, the Tanzania Red Cross Society, the World Bank and community members formed Ramani Huria in 2015. This is a commu-nity risk mapping project in Dar es Salaam that is generating substantial amounts of geospatial infor-mation. Such information includes land-use, infra-structure and exposure data that directly informs the development of DRM and DRR plans. As of October 2018, Ramani Huria has mapped neigh-bourhoods covering roughly 3.5 million residents in over 228 communities.
117 (Calas 2010)118 (World Bank 2017)119 (World Bank 2018)
289

The collaborative process informs decision-making at various levels within the city to take actions that can ameliorate urban conditions for the residents of Dar es Salaam. At a community level, the maps are used to inform actions related to drain cleaning programmes and evacuation planning, supporting the establishment of 10 emergency flood response teams, in collaboration with the Tanzania Red Cross Society programme Zuia Mafuriko (Swahili for “Stop
Flooding”). At the city level, the mass of geospatial information supports the development of an ex ante plan for emergency declaration, actions, and defini-tions of roles and responsibilities in the event of a disaster. This is done through the Dar es Salaam Multi-Agency Emergency Response Team, a city-wide, multi-stakeholder initiative that coordinates city- and regional-level response and planning for disasters.
Maps are created through a collaborative process that combines students and community members. This enables technological skills that generate geospatial information to be transferred, historical flood extents to be established, and the commu-nity to participate and be informed with respect to disaster plans as a single process. In increasing the capacity for generating and consuming geospatial information, city- and community-level resilience to disasters is strengthened.
Furthermore, the collaborative approach acts as a mechanism to engage and inform community members and local government to simultaneously change behaviour and support community action. For example, the combination of informing commu-nity members on the impact of solid waste being dumped into drains and the provision of locally accessibly solid waste processing sites facilitates a reduction in the severity of flooding. At the broader city level, this allows for a streamlined focus on the larger underlying issues and causes of risk.
Flooding near Jangwani Bridge, Dar es Salaam, April 2018 (Source: Ramani Huria 2018)
290 Special Case Study

Introduction
Chapters 1, 2 and Part I of this GAR described how the Sendai Framework calls on governments to move towards risk-informed governance arrange-ments that include a broader hazard and risk scope, and incorporate the concept of systemic risk. This requires integration across different sectors and levels of government, working with scientists, civil society and the private sector to address current and emerging risks. Part II then provided the first global reporting of Member States’ progress against the Sendai Framework targets and indica-tors, and identified priority areas to increase the necessary data-collection capacity.
This part takes Target E as its starting point, that is, to substantially increase the number of countries with national and local DRR strategies by 2020, but it places it in the broader context of Member State efforts to achieve all the targets and ultimately the
Sendai Framework outcome and goal through inte-grated risk management. Fulfilment of Target E is a stepping stone towards achieving the 2030 targets of reducing disaster losses, mortality, affected people, economic losses, damage to infrastruc-ture and disruption to critical services. Hence, the decision by Member States to set delivery of this target by 2020. This part therefore takes a quali-tative approach to give a broad picture of current practices, challenges and lessons learned in creat-ing the enabling environment for integrated risk governance at national and local levels. It consid-ers the role of regional cooperation, as well as the many ways and means Member States are using to also integrate DRR into national and local plans for development, CCA, urban settings and fragile or complex contexts.
Our greatest responsibility is to be good ancestors(Jonas Salk)1
1 (Cornish 2005)
Part III: Creating the National and Local Conditions to manage Risk
291

Enabling environment and regional cooperation
The Sendai Framework promotes regional and national cooperation, particularly in Priority 2, which speaks of “disaster risk governance at the national, regional and global levels”. Global and regional mechanisms are therefore important elements of the enabling environment for effective risk gover-nance at national level. As the technical support systems and resources around the Sendai Frame-work monitoring processes have been discussed previously, it is timely to recognize the support and resources that Member States access through their regional organizations and agreements, as well as the governance frameworks they have put in place at national and local levels. Accordingly, the first chapter of this part looks at progress in the enabling environment created by Member States through regional plans, strategies and knowledge-sharing.
Disaster risk reduction strategies or plans aligned with the Sendai Framework
Achievement of Target E by 2020 is a marker of progress and an essential element of the enabling environment to achieve all the Sendai Framework targets and goal by 2030. With only a year to go until 2020 and only 11 years until 2030, it is now a matter of urgency for countries to set themselves more ambitious priorities by updating their exist-ing strategies and plans to pursue prospective risk management objectives that can access public and private investments.
Recognition of the importance of national and local DRR strategies is not new and was already highlighted during the HFA implementation period, albeit without a dedicated target. By the end of the implementation period of HFA in 2015, 94 of the 105 countries that made progress reports in the 2013–2015 period reported having legislative and/or regulatory provisions for managing disaster risk,2 and 69 countries reported having national strate-gies and plans. There was no official record of local DRR strategies, as this has only been monitored
systematically since 2015. However, as docu-mented in GAR15, most national DRR strategies and plans endorsed under HFA were primarily focused on disaster preparedness and on reducing existing risk. Now, unless countries can curb the creation of new risk, the goal of the Sendai Framework is unlikely to be achieved by 2030.
It is also important to heed one of the lessons from the implementation period, which was that many excellent DRR strategies were developed but not implemented because a country either lacked the resources or political support, and stakeholder awareness were not present.3 Plans and strategies need to be practical in the country context, not only aspirational. To be effective, they need to engage relevant stakeholders and be developed and imple-mented with sufficient resources, capacity and commitment. Chapter 11 looks at selected country practice in developing and implementing national and local plans.
Risk reduction in development planning
Unless nations accelerate their efforts to curb the development-based drivers of risk, the sustainabil-ity of development will be at stake. Also at stake is the need to hold on to the many co-benefits that DRR may bring to sustainable development.4 GAR15 stated that annual global investment of $6 billion in appropriate DRR strategies would generate total benefits in the realm of $360 billion.5
The 2030 Agenda recognizes that disasters threaten to reverse much of the development prog-ress in recent decades.6 Building the resilience of development assets to shocks and disasters, and reducing the disaster risks inherent in new invest-ments is therefore a logical and important course of action. But it is not enough to address the risk of disasters to development, as many risks arise from development. Development can be a major driver of disaster risk, resulting in populations and economic assets located in exposed geographic areas, accu-mulation of risk in urban areas due to rapid and unplanned development, overreliance on natural resources and degradation of ecosystems, and
292 Part III

2 (UNISDR 2019b)3 (Jackson, Witt and McNamara 2019); (UNISDR 2015b)4 (Tanner et al. 2015)5 (UNISDR 2015c)6 (United Nations General Assembly 2015a)
7 (Leahy 2018)8 (UNISDR 2015c)9 (Centre for Science and Environment 2018)10 (ADPC and iPrepare Business facility 2017)
social inequalities due to limited income-generating opportunities for some population groups.
There are sectoral development dynamics that are contributing to risk, such as tourism development in hazard-prone coastal areas or farming of water-inten-sive crops in drylands, as well as the wider conse-quences of climate change.7 Development patterns
The potential to stimulate economic activity by reducing disaster risk is yet to be fully understood. However, it can create a conducive environment for public and private investment, as well as livelihoods investment at the household level. This is not the
that increase inequalities result in poverty and also create processes of social and political exclusion, which drive disaster risks.8 This makes social justice and equality core values for disaster- and climate-resilient development, as they ensure that options, visions and values are deliberated, among and within countries and communities, without making the poor and disadvantaged worse off.9
sole responsibility of government, as disaster risk and climate change need to be considered in busi-ness continuity management by large and small enterprises; this is now recognized increasingly in the private sector.10
Flooding in Jakarta (Source: World Bank)
293

Despite the growing political commitment to inte-grating DRR into development as reflected in the Sendai Framework and other global and national policy frameworks, the working knowledge of how to mainstream DRR in practical and effective ways is still uneven across countries. The mechanisms explored in Chapter 12 are intended to illuminate how to achieve this in practice through integrated national and local plans and strategies, now that it has become so clear through the post-2015 agendas that risk-informed development is the only type of development that is sustainable.
Risk reduction and climate change adaptation
The idea of converging DRR and CCA agendas has been gathering interest progressively, conceptu-ally and in practice at international, national and subnational levels. These efforts share the common aim of building resilience of people, economies and natural resources to the impacts of extreme weather and climate.
At the global level, the integration of DRR with CCA has been a key component of decisions under UNFCCC since the 2007 Bali Declaration, as well as the outcomes of the 2012 United Nations Conference on Sustainable Development (Rio+20), and of course the post-2015 agreements already discussed. The Sendai Framework gives explicit recognition of the importance of CCA in calibrat-ing DRR.11 However, especially in light of the 2018 IPCC special report Global Warming of 1.5°C (IPCC SR1.5), action on climate change is now understood as an urgent global and national priority for risk reduction strategies and plans.12
The impacts of climate change are already being felt in many regions of the world. Current projec-tions make it clear that, without concerted action on climate change, the goal of sustainable devel-opment cannot be achieved, many societies are likely to face significant reversals and the longer-term survival of the human species on the planet is under threat. Climate change is already causing shifts in average conditions, more-frequent and more-intense weather events, and sea-level rise. It
is expected to further exacerbate weather-related disasters in the coming decades, leading to losses that could soon erase development gains in key sectors,13 with cascading impacts on human health and food security, and many related ecosystems and human-made structures and systems.
Countries that face high risk from impacts related to climate change and other natural and human-made hazards have tended to prioritize develop-ment of stand-alone CCA strategies and plans, rather than integrating them with DRR strategies, especially if resources and capacities are limited and external financing is more readily available for CCA. Some national CCA strategies and plans have integrated DRR, especially in the Pacific. However, it is time for a more fully integrated approach to the combined risks each country faces – short and long term. As reiterated in earlier parts of this GAR, the systemic nature of risk requires systems-based approaches; climate risk needs to be a part of all development and risk reduction planning.
Local disaster risk reduction strategies and plans in urban areas
Much of the world’s population – 4.22 billion, or 55.3%14 – now lives in urban areas. By 2050, it is expected that 66% of the population will be living in cities, urban centres, peri-urban areas and agglom-erations. Most of this growth will take place in cities in Africa, Asia and Latin America, where the expansion rate of informal settlements is high and capacities for urban management are limited. As of 2014, the urban slum population worldwide was 880 million.15 At the same time, displacement patterns are changing. UNHCR figures indicate that “one in every 122 people in the world is now either a refugee, internally displaced, or seeking asylum, while 6 out of 10 refugees and at least half of all internally displaced persons (IDPs) are located in urban areas, in cities and towns across the globe.”16 In addition to changing the entire landscape of cities, it also adds context-specific vulnerabilities, which were previously absent or exceptional, and reduces the capacity of local governments to under-stand and manage risk.
294 Part III

11 (UNISDR 2017a)12 (IPCC et al. 2018); (IPCC 2018); (Centre for Science and Environment 2018)13 (IPCC 2012); (IPCC et al. 2018)14 (UN DESA 2018b) 15 (UN-Habitat 2015); (Sarmiento et al. 2019)16 (Global Alliance for Urban Crises 2016); (Crawford et al. 2015); (Internal Displacement Monitoring Centre 2015)
17 (Rosenzweig et al. 2018)18 (OECD 2017b)19 (OECD 2017b)20 (OECD 2017b)21 (UNISDR 2018a) 22 (Gencer 2013); (UNISDR 2017c); (OECD 2017b); (The Economist Intelligence Unit Ltd 2013)
The physical and spatial characteristics of cities, their settlement patterns, the standards of their built environment, socioeconomic vulnerability and poverty of urban residents, and environmental chal-lenges are some of the risk drivers that thrive in rapidly developing urban areas. Unplanned expan-sion of cities to accommodate rising populations often gives rise to inappropriate land use, where vulnerability to climate change impacts combines with poor infrastructure and services. Frequently, a lack of appropriate building codes and chal-lenges in regulating compliance with existing build-ing standards further increase risk. The risks from inadequate living conditions, poor health, inad-equate nutrition, poverty and poor sanitation are magnified during events such as floods and heat-waves. Indeed, under changing climate conditions and the extension of coastal cities, “heat-waves, drought, heavy downpours, and coastal flooding are projected to increase in frequency and inten-sity in many cities over the twenty-first century, adding to the risk of urban residents.”17 Urbaniza-tion and the complex characteristics of cities can increase vulnerabilities and risk to natural hazards and climate change; at the same time, they can also present opportunities for sustainable development. National urban policy is identified as a key instru-ment for governments to support the implementa-tion of NUA, SDGs and DRR in line with the Sendai Framework. The 2016 United Nations Confer-ence on Housing and Sustainable Urban Devel-opment (Habitat III) considered an assessment of the state and scope of national urban policies across 35 OECD countries, based on data collected by UN-Habitat.18 Those countries implementing national urban strategies understand that there is a strong economic argument for doing so, with urban areas contributing an increasingly higher proportion
of GDP as urbanization proceeds. If policy and financial support is given to urban areas to under-stand and effectively reduce or manage climate and other risks, then this improves the area’s economic competitiveness, brings businesses in, attracts investment capital, creates jobs, and improves tax revenue and services.19
Increasingly urban areas and cities may look to bond financing to improve infrastructure. However, in the past five years, credit ratings agencies have issued warnings about or guidance on municipal credit ratings and climate change. Cities may be downgraded if they are not managing and reducing risk, so this reinforces the need for national govern-ments to support cities through national urban poli-cies to help them attract investments needed for resilient development.20
Local and urban strategies and plans21 need to address these risk drivers to reduce current risk and prevent future risk creation, and to move towards inclusive and equitable urban development, which can be more resilient and sustainable.22 If these challenges of rapid urban growth are not addressed, the greater exposure of people and assets (physi-cal, cultural and economic) and higher frequency of extreme events can create an explosive combi-nation of risk with potentially disastrous conse-quences from which it is hard to recover.
Disaster risk reduction strategies in fragile and complex risk contexts
Contexts in which disaster risks manifest, and local and national DRR strategies are designed and implemented, are increasingly complex. However,
295

23 (Opitz–Stapleton et al. 2019)24 (Opitz–Stapleton et al. 2019); (World Economic Forum 2018); (OECD 2018c)25 (UNISDR 2015d)
most tools and guidelines designed to facilitate the development of such strategies consider only conducive, “normal” development, non-crisis and non-complex risk scenarios. Decision makers have to contend with existing known dynamic devel-opment trends, together with new threats such as climate change, and emerging threats, which are yet to be realized.23 Entities such as the World Bank, OECD and the World Economic Forum have, for some time, sought to identify major threats posing challenges to development progress.24 Most recently, these have included: global economic and financial instability, international criminal activity and terrorism, severe environmental change includ-ing climate and oceanic change, cyberfragility and technological disruption, geopolitical volatility, growing antibiotic resistance, pandemics – and of course, natural hazards.25 The interaction of such threats and risk drivers creates complex risks that already have a significant bearing on the environ-ment in which DRR, the development and imple-mentation of national and local DRR strategies, and therefore the attainment of the Sendai Framework Target E is sought.
Understanding complex risks is important when developing local and national DRR strategies as these complexities influence the context in which disaster risk manifests, by altering patterns of hazards, exposure, vulnerabilities and capacities to cope. Policies are commonly designed where value-laden, subjective assessments of risk – influ-enced by nuances in risk perception and risk toler-ance – come to bear. Implementation takes place where the trade-offs inherent in development trajec-tories shape the barriers and incentives for advanc-ing progress on DRR, and where decisions that lead to the creation of new risk materialize. Those concerned with attaining DRR therefore need to begin moving towards a deeper understanding of complex risk, adopting systems thinking, and using interdisciplinary insights and knowledge, across spatial and temporal scales, to more effectively deal with uncertainty. DRR is one well-known demon-strated means to reduce and manage risks related to natural hazards, with much to offer the wider world. There is a growing understanding within the DRR community that DRR approaches can be
applied to reduce and manage risks beyond natural hazards. This is reflected in the expanded scope of the global framework, wherein the Sendai Frame-work includes natural and man-made, biological, technological and environmental hazards, leading to slow- and rapid-onset, large- and small-scale disasters.
296 Part III

Chapter 10: Regional support and national enabling environments for integrated risk reduction
10.1 Regional support for integrated risk reduction
The Sendai Framework calls on Member States to establish common platforms to exchange good practices and experiences relating to common and transboundary disaster risk, emphasizing the importance of regional and subregional DRR strate-gies and mechanisms for cooperation. In this way, regional cooperation is recognized as an important element in creating the enabling environment for effective DRR at national level, especially for small States and developing economies.
While recognizing that Member States have the primary role in implementing the Sendai Framework, regional organizations are able to support efforts with regionally focused strategies and frameworks, tailored risk information, risk-sharing mechanisms, tools and capacity-building on DRR. They do this through pooling regional capacity and resources and also by accessing international funding and technical assistance. Regional organizations are especially important for smaller developing States, which do not individually have the economic means to invest in such a range of tools, but are more able to bring their voices and experience to regional processes in developing the systems and capacity most useful to them.
In most regions with high exposure to natural hazards there are already intergovernmental
297

organizations and mechanisms in place for coor-dination on DRM. Therefore, the regional focus for supporting Sendai Framework implementa-tion has been ensuring existing organizations have updated DRR mandates to align with its goal and priorities. Specifically, regional intergovernmental organizations can play a practical role in national compliance with Target E, by building capacity and supporting the development and implementation of national and local DRR strategies and plans. They can also lead and support their Member States to integrate DRR into risk-informed development planning, CCA and risk financing, as well as agree on approaches and coordinate action on shared regional and transboundary risks.
In addition to treaty-based regional organiza-tions, the regional platforms on DRR facilitated by UNDRR to consult with and support Member States are another important mechanism for infor-mation sharing and capacity-building to imple-ment the Sendai Framework. Regional platforms became an established mechanism during the HFA years 2005–2015, and these continue under the Sendai Framework. They have already produced or approved important regional strategies and plans on Sendai Framework implementation, also engag-ing at the political level with regional intergovern-mental organizations.
Regional platforms for DRR are not fixed in the breadth or narrowness of focus or who can be involved. For example, an innovation in 2018 was the first combined Africa-Arab Platform on Disas-ter Risk Reduction. This provided these two very large regions, which face significant drought, aridity, refugee and migration issues, with opportunities to share knowledge, experiences and best practices in advancing DRR in the context of the Sendai Frame-work.26 In contrast, the second Central Asia and South Caucasus (CASC) Sub Regional Platform also held in 2018 is an example of a subregional focus, with an emphasis on DRR integrated with develop-ment planning.27
Regional strategies and plans are not intended to supersede or substitute for national strategies and plans. Instead, they support and complement them
by providing guidance and coherence, promot-ing collaboration and exchange, or addressing issues that cross national borders, for which a joint approach can create synergies, comparative advantages or economies of scale. For example, the Treaty of Lisbon (2009) mandates the EU “to foster cooperation, effectiveness, and consistency in disaster risk management among member coun-tries.”28 In line with the African Union (AU) Africa Regional Strategy for Disaster Risk Reduction,29 the Programme of Action for the Implementation of the Sendai Framework for Disaster Risk Reduction 2015-2030 in Africa30 calls for integration of DRM into policies of the member countries, but leaves the responsibility of implementation with national governments.31 There are also other types of regional partnerships that go beyond governmental arrangements, such as the ISDR Asia Partnership (IAP), which is an informal multi-stakeholder forum of Asian governments and stakeholders to facilitate DRR. IAP has been the main consultation forum for the Asia Ministerial Conferences, which operate as the Regional Platform in Asia, and is made up of regional intergovernmental organizations, govern-ments, civil society organizations, United Nations and international organizations, and bilateral and multilateral donors.32 Similarly innovative is the Pacific Resilience Partnership, a multi-stakeholder partnership established by Pacific leaders in 2017 for an initial trial period of two years, to support implementation of the 2016 Framework for Resil-ient Development in the Pacific: An Integrated Approach to Address Climate Change and Disas-ter Risk Management 2017–2030 (FRDP).33 This is discussed further in section 13.5.1 on the Pacific region approach to integrated DRR development and action on climate change.
In addition to such broad-spectrum regional coop-eration on risk reduction and integration with devel-opment planning and climate change, there are also many instances of regional action within sectors, on particular issues or even for smaller climatic or geological subregions. For example, the Mekong River Commission for Transboundary Development allows the four member countries of Cambodia, Lao People’s Democratic Republic, Thailand and Viet Nam to cooperate on sustainable development and
298 Chapter 10

hydrological/climate risks in the transboundary river basin.34 An example of sectoral coordination is the Central American Council for Agriculture concerning disaster risk in rural development,35 based around the Central American Strategy for Rural Develop-ment, which aims for stronger relationships with other risk management instruments, highlighting
the issues associated with integrated water resource management and climate change. It dove-tails with the Central American Policy on Compre-hensive Disaster Risk Management (PCGIR)36 and the Central American Forestry Strategy.37 Some cooperation relies on the regional level to magnify and complement national efforts, such as risk
Media winners at the Africa and Arab States Regional Platform, 2018(Source: UNDRR)
reduction, warning systems and management of regional and transboundary hazards. Following the 2004 Indian Ocean tsunami, networks of national, regional and eventually global seismic and observa-tional monitoring systems were set up to allow early
warnings to reduce the impacts of tsunamis (as discussed in Chapter 3). The Indian Ocean Tsunami Warning and Mitigation System is an example,38 as is the Indian Ocean Tsunami Information Center, which is not part of a warning system but shares
26 (AU 2018)27 (UNISDR 2018a)28 (Morsut 2019)29 (AU and UNISDR 2018)30 (AU 2016)31 (Omoyo Nyandiko and Omondi Rakama 2019)32 (AMCDRR 2016)33 (SPC 2016)
34 (Mekong River Commission for Sustainable Development 2018)35 (Central American Council for Agriculture 2010)36 (Coordination Center for the Prevention of Disasters in Central America 2010)37 (Central American Council for Agriculture 2010)38 (Intergovernmental Coordination Group for the Indian Ocean Tsunami Warning and Mitigation System 2019)
299

knowledge and builds capacity.39 National meteoro-logical and hydrological services are also cooperat-ing to provide earlier warning and more complete data for regional extreme weather warnings,40 while other initiatives take a regional multi-hazard approach.41
Disaster risk financing was noted in section 8.4 as a growth area in international development coop-eration requiring more detailed analysis for future monitoring of Sendai Framework Target F. It is also an area where regional mechanisms are being established in addition to global mechanisms, espe-cially in highly exposed regions. Examples include: the Caribbean Catastrophe Risk Insurance Facil-ity established in 2007 as a parametric insurance facility;42 the African Risk Capacity, a specialized agency of AU established in 2012, and the related African Risk Capacity Insurance Company;43 the Pacific Catastrophe Risk Insurance Company, which was set up as a multinational sovereign risk pool in 2012;44 and a new ASEAN facility, the Southeast Asia Disaster Risk Insurance Facility currently being piloted.45 ESCAP has recently identified significant areas for regional cooperation in the Asia–Pacific region on risk financing.46 The importance of disaster risk financing for national- and local-level implementation of the Sendai Framework is also considered in Chapter 12, which describes how financing can be an entry point for mainstreaming DRR into development (see section 12.3.5).
There are many types of partnerships and mecha-nisms for regional cooperation and planning for DRR. The Sendai Frameworks encourages new partnerships and networks, as well as reliance on more traditional intergovernmental processes. New models may be needed to work across sectoral silos and different geographic areas and times-cales, to step outside “business as usual” and apply systems thinking to address immediate and long-term risk.
The following overview of key regional mechanisms and the roles they play in supporting Member States in implementation of the Sendai Framework in each global region, focuses on: (a) regions that have high exposure to natural hazards and significant
numbers of smaller and/or lower-income States and (b) innovation in regional support for integrated risk governance across the post-2015 frameworks. For these reasons, developments in Africa, South-East Asia, Central America, the Caribbean and the Pacific are given more attention.
10.1.1 Africa
Natural and human-made hazards in Africa, such as drought, floods, cyclones, earthquakes, epidem-ics, environmental degradation and technological hazards are a springboard for disasters. Although efforts to reduce exposure and vulnerability, under-pinned by accountability at all levels, are predicted to reduce disaster risks, economic losses are mounting and disasters have become a barrier to sustainable development.47
One of the two declarations adopted at the Africa-Arab Platform on Disaster Risk Reduction 2018 was the Tunis Declaration on Accelerating the Imple-mentation of the Sendai Framework and the Africa Regional Strategy for Disaster Risk Reduction. This reaffirmed the urgency of implementing the strat-egy first adopted in 2004,48 and supported the 2016 Programme of Action for the implementation of the Sendai Framework in Africa. The Programme of Action had already received support at the political level.49 The Programme of Action’s objectives are to: (a) increase political commitment to DRR; (b) improve identification and assessment of disaster risks; (c) enhance knowledge management for DRR; (d) increase public awareness of DRR; (e) improve governance of DRR institutions; and (f) integrate DRR in emergency response management. It builds on the intergovernmental work on DRR of AU and the Regional Economic Communities in Africa.
The Programme of Action is specifically linked to reporting under the Sendai Framework, with the monitoring and reporting system validated through formal agreement with AU member States. The AU Commission monitors progress of Regional Economic Communities towards the Programme of
300 Chapter 10

Action goals. The Regional Economic Communities then guide its implementation at the subregional level, in cooperation with their respective member States. Progress will be reviewed using existing global and regional monitoring systems and mech-anisms, with each member State and Regional Economic Community expected to submit a bien-nial report through SFM. The reports generated will support the monitoring of progress under the Sendai Framework and the Programme of Action.50 The monitoring information also supports DRR ministerial meetings, the Africa Regional Platform, the Africa Working Group on Disaster Risk Reduc-tion, and review processes and DRR programming at all levels. It is thus a multilevel regional mecha-nism that supports Member States with information and tools for implementation, facilitates subre-gional and regional cooperation through Regional Economic Communities and AU Commission roles and regional platforms, and also supports reporting under the Sendai Framework.
The AU regional approach has created an enabling environment for Regional Economic Communities and member States to pursue DRR policies and strategies with a focus on regional risks and using existing institutional structures. Each Regional Economic Community therefore has its own methods and mechanisms.
SADC already had a strategic plan aligned to HFA and the 2004 Africa Regional Strategy. Then in 2016, the SADC Council of Ministers approved the Sendai Framework aligned SADC Regional Disaster Preparedness and Response Strategy 2017–2030.
An SADC draft DRR strategic plan 2017–2030, and a regional DRR and CCA study are pending SADC Council approval.51 In 2018, the SADC Regional Disaster Risk Reduction Conference recognized the importance of regional strategies, plans and frame-works, but also urged SADC to move beyond these to help accelerate implementation of the Sendai Framework, along with SDGs and the other key post-2015 framework agendas.52
In the Horn of Africa, IGAD has had a regional focus on drought risk through the IGAD Drought Disaster and Resilience Initiative since 2011,53 and ECOWAS has had in place its Policy for Disaster Risk Reduction since 2006.54 Neither of these Regional Economic Communities has yet adopted new subre-gional policies based on the Sendai Framework, although the IGAD drought initiative is an ongoing approach that seeks to address the effects of drought and related shocks in the IGAD region in a sustainable and holistic manner. The initiative still serves as a common framework for developing national and subregional programmes designed to enhance drought resilience through building sustain-ability in the region. IGAD also engages at a practi-cal level, for example through the project Building Resilience to Disasters through Risk Management and Climate Change Adaptation, implemented with GFDRR and the National Meteorological and Hydro Metrological Services.55 This is evidence of an inte-grated approach to climate and disaster risk, in line with the broader post-2015 frameworks.
ECOWAS has also focused on practical imple-mentation of the Sendai Framework, including
39 (International Oceanographic Commission and UNESCO 2019)40 (WMO 2018)41 (Regional Integrated Multi-Hazard Early Warning System 2019)42 (CCRIF 2019)43 (African Risk Capacity 2019)44 (Pacific Catastrophe Risk Assessment and Financing Initia-tive 2019)45 (ASEAN Finance Ministers’ Meeting 2018)46 (ESCAP 2018)47 (AU 2004); (International Institute for Sustainable Develop-ment 2016)
48 (AU 2004)49 (AU 2016); (Mauritius 2016)50 (AU 2016) 51 (SADC 2018b)52 (SADC 2018a)53 (IGAD 2019); (IDDRSI 2014)54 (Communauté économique des États de l’Afrique de l’Ouest and ECOWAS 2006)55 (World Bank 2019)
301

capacity-building towards meeting Sendai Target E,56 and advocating for improved hydrometeoro-logical services to address the risks of flood and drought in West Africa.57
This small sample of regional and subregional mechanisms in Africa illustrates how they are linked into global monitoring but also have a specific geographic focus based on the shared risk of Member States in the subregions. They are thus part of the enabling environment for Sendai Framework implementation at international, regional and subre-gional levels, where they provide direct support and capacity-building to Member States through sharing regional expertise and accessing international resources, as well as through regional strategies.
10.1.2 Americas and the Caribbean
The Americas and the Caribbean region is highly exposed to a range of natural hazards, including drought, earthquakes, floods, forest fires, hurri-canes, landslides, tsunamis and volcanoes. The El Niño and La Niña phenomena occur periodically, exacerbating the impacts of hydrometeorological events.
The sixth Regional Platform for Disaster Risk Reduction in the Americas, held in June 2018, approved the Regional Action Plan for the Imple-mentation of the Sendai Framework.58 It is a non-binding plan that marks a step towards wider regional efforts to support countries build commu-nity resilience and reduce disaster risk and its impacts.59 The action plan helps further the imple-mentation of the Sendai Framework in the Ameri-cas and the Caribbean through the identification of regional initiatives that contribute to one or more of the Sendai Framework priorities for action,60 and it respects the whole-of-society approach that features prominently within the Sendai Framework. The initiatives it includes can be advanced collec-tively by Member States, civil society organiza-tions, volunteers and other relevant actors.
Held as part of the same Regional Platform in 2018, the high-level ministerial meeting issued the Carta-gena Declaration, which affirmed the region’s politi-cal commitment to the Sendai Framework, including an integrated approach to the post-2015 agree-ments, and noted the importance of the Regional Action Plan.61
Caribbean
The Caribbean States were early adopters of coor-dinated intergovernmental approaches to manag-ing disaster risk, faced as they are with a shared, high exposure to natural hazards and comprising mainly smaller developing economies with relatively limited resources to manage the risk.
Within the Caribbean Community institutions, the Caribbean Disaster Emergency Management Agency (CDEMA) serves 18 States, most of them lower-income countries and/or SIDS. CDEMA has supported the region since the 1990s, with tools such as its Model Comprehensive Disaster Management Legislation and Regulations 2013.62 In the Caribbean region, the comprehensive disas-ter management (CDM) concept includes DRR and sustainable development, and CDEMA has operated under a CDM framework since 2001. The current CDM Strategy 2014–2024, endorsed by Member States, is in alignment with the Sendai Framework.63
The CDM Strategy 2014–2024 has four priority areas: (a) strengthened institutional arrangements for CDM; (b) increased and sustained knowledge management and learning for CDM; (c) improved integration of CDM at sectoral levels; and (d) strengthened and sustained community resilience. CDEMA member States report directly to CDEMA on CDM Strategy implementation through their country audits and the Performance Management Frame-work with a basket of indicators aligned to the indicators of the Sendai Framework’s seven global targets. To support the implementation of the strat-egy, there is a corresponding CDEMA Corporate Plan and a CDM Monitoring Evaluation and Report-ing Policy, along with country audits to identify gaps and needs at the national level, the Country Work
302 Chapter 10
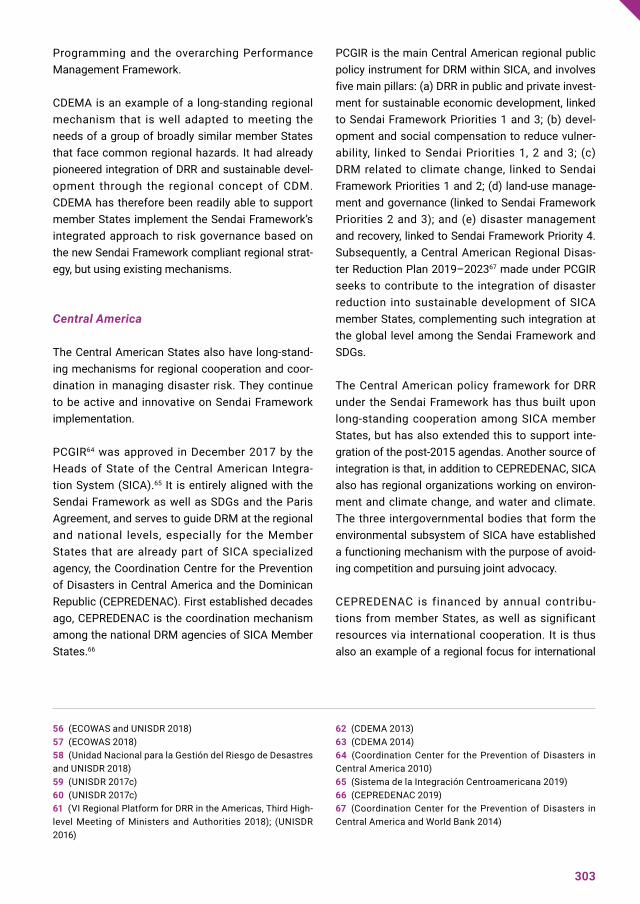
Programming and the overarching Performance Management Framework.
CDEMA is an example of a long-standing regional mechanism that is well adapted to meeting the needs of a group of broadly similar member States that face common regional hazards. It had already pioneered integration of DRR and sustainable devel-opment through the regional concept of CDM. CDEMA has therefore been readily able to support member States implement the Sendai Framework’s integrated approach to risk governance based on the new Sendai Framework compliant regional strat-egy, but using existing mechanisms.
Central America
The Central American States also have long-stand-ing mechanisms for regional cooperation and coor-dination in managing disaster risk. They continue to be active and innovative on Sendai Framework implementation.
PCGIR64 was approved in December 2017 by the Heads of State of the Central American Integra-tion System (SICA).65 It is entirely aligned with the Sendai Framework as well as SDGs and the Paris Agreement, and serves to guide DRM at the regional and national levels, especially for the Member States that are already part of SICA specialized agency, the Coordination Centre for the Prevention of Disasters in Central America and the Dominican Republic (CEPREDENAC). First established decades ago, CEPREDENAC is the coordination mechanism among the national DRM agencies of SICA Member States.66
PCGIR is the main Central American regional public policy instrument for DRM within SICA, and involves five main pillars: (a) DRR in public and private invest-ment for sustainable economic development, linked to Sendai Framework Priorities 1 and 3; (b) devel-opment and social compensation to reduce vulner-ability, linked to Sendai Priorities 1, 2 and 3; (c) DRM related to climate change, linked to Sendai Framework Priorities 1 and 2; (d) land-use manage-ment and governance (linked to Sendai Framework Priorities 2 and 3); and (e) disaster management and recovery, linked to Sendai Framework Priority 4. Subsequently, a Central American Regional Disas-ter Reduction Plan 2019–202367 made under PCGIR seeks to contribute to the integration of disaster reduction into sustainable development of SICA member States, complementing such integration at the global level among the Sendai Framework and SDGs.
The Central American policy framework for DRR under the Sendai Framework has thus built upon long-standing cooperation among SICA member States, but has also extended this to support inte-gration of the post-2015 agendas. Another source of integration is that, in addition to CEPREDENAC, SICA also has regional organizations working on environ-ment and climate change, and water and climate. The three intergovernmental bodies that form the environmental subsystem of SICA have established a functioning mechanism with the purpose of avoid-ing competition and pursuing joint advocacy.
CEPREDENAC is financed by annual contribu-tions from member States, as well as significant resources via international cooperation. It is thus also an example of a regional focus for international
56 (ECOWAS and UNISDR 2018)57 (ECOWAS 2018)58 (Unidad Nacional para la Gestión del Riesgo de Desastres and UNISDR 2018)59 (UNISDR 2017c)60 (UNISDR 2017c)61 (VI Regional Platform for DRR in the Americas, Third High-level Meeting of Ministers and Authorities 2018); (UNISDR 2016)
62 (CDEMA 2013)63 (CDEMA 2014)64 (Coordination Center for the Prevention of Disasters in Central America 2010)65 (Sistema de la Integración Centroamericana 2019)66 (CEPREDENAC 2019)67 (Coordination Center for the Prevention of Disasters in Central America and World Bank 2014)
303

investment that can be utilized efficiently by an active regional organization to better support member States. This is especially important in a region where countries face high levels of common risk, and most are developing economies with relatively small popu-lations that would not have the national resources to develop such tools and resources independently.
South America
In South America, the four Andean Community member States of the Colombia, Ecuador, Peru and the Plurinational State of Bolivia have already adopted the Andean Strategy for Disaster Risk Management 2017–2030, which is in alignment with the Sendai Framework. It builds on the previ-ous 2005 strategy. The new strategy seeks to strengthen institutional capacities in its member States, to enhance DRM, reduction and preven-tion, and to support the alignment of disaster risk information systems. It is supported by the Andean Committee for Disaster Prevention and Response. It is also intended to support the formulation and implementation of policies; including national, regional and sectoral strategies and plans on DRM that promote sustainable development and social inclusion among Andean countries, as exemplified by the Andean Disaster Risk Management Strate-gy’s Implementation Plan 2019–2030 and its asso-ciated indicators. It thus addresses the broader 2015 agenda, while providing guidance and enhanc-ing the capacity of its members States to imple-ment the Sendai Framework priorities and goal as well as to meet Target E.
Within the Southern Common Market (MERCO-SUR), the technical intergovernmental DRR entity is the Meeting of Ministers and High Authorities on Comprehensive Disaster Risk Management. At the time of the development of this GAR, MERCOSUR was developing its five-year risk reduction strategy.
The two long-established subregional mecha-nisms in Central America and the Caribbean have adapted their cooperation and capacity-building to support Sendai Framework implementation. Within South America, the Andean member States have
established a new mechanism. These are very posi-tive developments, including as they do the member States in the region that are most exposed to hazards and disaster risk.
10.1.3 Arab States
Historically, the Arab region has been exposed to seismic activity.68 More recently, it has faced chal-lenges stemming from secondary risks linked to the displacement of people and migration trends, the spread of epidemics, food insecurity, conflict and civil unrest, rapid urbanization, environmental degra-dation and water scarcity.69
The Arab Strategy for Disaster Risk Reduction 2030 was adopted in January and subsequently endorsed by Heads of State in April 2018 at the Arab League Summit.70 The strategy is in align-ment with the Sendai Framework and SDGs, and focuses on a multisectoral approach to substan-tially reduce disaster risk in the Arab region by 2030.71 It is essentially a framework to foster progress in core agreed areas of implementa-tion, and to produce a detailed programme of work across three phases until 2030. These will be implemented with various levels of cooperation with humanitarian and development partners.72
An Extraordinary Session of the Arab Coordination Mechanism for Disaster Risk Reduction adopted the Phase I programme of work in January 2018.
A biennial matrix for 2019–2020 defining a road map of time-bound regional targets was also final-ized and adopted as an outcome document of the 2018 Africa-Arab Platform. That platform also adopted the Tunis Declaration on Disaster Risk Reduction.73
The League of Arab States (LAS) coordinates further action on implementation of the regional strategy. Together with its technical organizations, LAS mainstreams DRR measures into projects and technical assistance programmes across the Arab States.
304 Chapter 10

10.1.4 Asia and the Pacific
The Asia–Pacific region is highly exposed to hydrometeorological hazards as well as geophysical and human-made hazards. Although economically mixed, it has a high proportion of lower-income and develop-ing economies. Located within the “Pacific Ring of Fire”, many Asia–Pacific countries are confronted with persistent earthquake, tsunami and volcano risks.74 Hydrometeorological hazards, heightened by climate change, adversely affect social and economic development. The Asia–Pacific region tops the table in terms of frequency of occurrence and notwithstanding significant progress made in DRR, still accounts for half of the global disaster impacts with respect to mortality and affected people.75 It is therefore imperative to inte-grate DRR measures across development programmes and sectors, as well as in CCA.
The Prime Minister of Mongolia, Khurelsukh Ukhnaa, at the Asian Ministerial Conference for Disaster Risk Reduction (Source: UNDRR)
68 (Arab Strategy for Disaster Risk Reduction 2030 2018)69 (Arab Strategy for Disaster Risk Reduction 2030 2018)70 (LAS 2018)71 (Arab Strategy for Disaster Risk Reduction 2030 2018)
72 (Arab Strategy for Disaster Risk Reduction 2030 2018)73 (AU 2018)74 (APEC 2016)75 (AMCDRR 2018)
305

Asia
In June 2014, the sixth AMCDRR and IAP agreed to develop a regional plan for the post-2015 frame-work. The Asia Regional Plan for Implementation of the Sendai Framework for Disaster Risk Reduction 2015-2030 was then finalized and approved at the 2016 AMCDRR in India.
The Asia Regional Plan aims to provide: (a) broad policy direction to guide implementation of the Sendai Framework in the context of the 2030 sustainable development agendas in the region; (b) a long-term road map, spanning the 15-year horizon of the Sendai Framework outlining a chronological pathway for implementation of priorities to achieve seven global targets; and (c) a two-year action plan with specific activities that are prioritized based on the long-term road map and in line with the policy direction.76 The plan emphasizes that it seeks to guide and support the national imple-mentation of the Sendai Framework, not to replace national plans, and so it identifies priority regional activities “to support national and local actions, enhance exchange of good practice, knowledge and information among governments and stake-holders, in addition to strengthening regional coop-eration to support the implementation of the Sendai Framework.”
The first occasion to assess the implementa-tion of the Asia Regional Plan came at the July 2018 AMCDRR in Mongolia. A key outcome of that meeting was the current Action Plan 2018–2020. It highlights the main milestones to be realized as the creation of national platforms and national coor-dination mechanisms for DRR, and the assimila-tion of DRR in development plans. The action plan suggests enhancing the role of the Asia–Pacific Regional Coordination Mechanism to support coun-tries in advancing implementation of the Sendai Framework.77
Focusing on the economic development dimension, in 2015, APEC leaders formally adopted the APEC Disaster Risk Reduction Framework, centred on the phenomena of the “new normal”, which demon-strates the rising frequency, scale and range of
disasters and the ensuing disruption of interlinked production and supply chains.78 The framework is a blueprint for scaling up disaster-resilient econo-mies focused on inclusive and sustainable develop-ment. From this, the APEC Disaster Risk Reduction Action Plan was made to operationalize the APEC Framework, and was pledged in a 2015 Joint Minis-terial Statement. Its purpose is to enhance coopera-tion on DRR and it will be operationalized through APEC.79 The action plan comprises four DRR pillars, with specific areas for cooperation and activities, responsible partners, timelines and indicators.
The key Asian subregional intergovernmental organizations have long-standing mechanisms for regional cooperation on “disaster manage-ment”. While inconsistent with the terminology agreed by the OIEWG and endorsed by the United Nations General Assembly, disaster management is the preferred term in the region; it also encom-passes elements of DRR, more often described as mitigation.
The ASEAN Agreement on Disaster and Emer-gency Management (AADMER) entered into force in 2009. Its ongoing workplans emphasize disaster preparedness and response and also mitigation, but are not specifically aligned with the Sendai Frame-work.80 However, the new ASEAN agreement on economic cooperation, ASEAN 2025: Forging Ahead Together, has a key objective to establish, “a resil-ient community with enhanced capacity and capa-bility to adapt and respond to social and economic vulnerabilities, disasters, climate change as well as emerging threats and challenges (12.4).”81 ASEAN and the United Nations have developed the ASEAN-United Nations Joint Strategic Plan of Action on Disaster Management 2016–2020, the third itera-tion of this action plan.82 Together, these three ASEAN plans take a highly integrated approach to regional development planning and disaster management. However, while Sendai Framework implementation is noted in the AADMER Workplan and the Joint Strategic Plan of Action as an area for cooperation in disaster prevention and mitigation, it is not a central part of these plans, which are largely focused on disaster preparedness and response, and economic development.
306 Chapter 10

The South Asian Association for Regional Coop-eration (SAARC) also has a long-standing regional framework on disaster management,83 but so far has not agreed a specific mechanism to support member States’ implementation of the Sendai Framework.
Pacific
The Pacific Islands Forum Leaders meeting in 2012 agreed to develop a joint regional framework on climate change and DRM. This would supersede the two existing but distinct regional frameworks, namely the Pacific Islands Framework for Action on Climate Change and the Pacific Disaster Risk Reduction and Disaster Management Framework for Action, both of which concluded in 2015.
As noted above, FRDP was then developed, and endorsed at the Pacific Islands Forum Leaders meeting in 2016.84 This is the first regional frame-work of its kind. It provides high-level strategic guid-ance to Member States and a range of different stakeholder groups on how to enhance resilience to climate change and disasters, in ways that also contribute to sustainable development.
FRDP envisions a developed and sustainable future for the Pacific region’s people, societies, econo-mies, cultures and natural environments. It calls for significant collaborative efforts from local and regional stakeholders to reduce carbon-based economic development, unplanned urbanization, destruction of ecosystems, poverty, inequality, insti-tutional and capacity constraints, and fragmented action to strengthen resilience and sustainability and protect development gains.
FRDP is not prescriptive; rather, it suggests a set of priority actions to be used as appropriate by multi-stakeholder groups. Specific actions lean towards regional implementation, while others require further articulation at national level to ensure that context-specific priorities and needs are met.85
In 2018, at their meeting in Nauru, the Pacific Islands Forum Leaders reaffirmed their commit-ment to FRDP, recognizing “the value and impor-tance of a multisectoral approach to addressing climate change and its impacts. Leaders acknowl-edged the establishment of a regional risk gover-nance arrangement through the Pacific Resilience Partnership and the Pacific Resilience Partnership Taskforce.”86
To support implementation of FRDP and the overall integration of risk governance agenda, the Pacific Resilience Partnership was established by Pacific leaders in 2017 for an initial trial period of two years. The partnership works to strengthen coordi-nation and collaboration and has four main compo-nents that make up its governance structure: (a) a task force made up of 15 constituent groups (five positions for countries and territories, five for civil society and private sector, and five for regional organizations and development partners); (b) a support unit to support effective functioning of the task force; (c) a technical working group to support implementation of the three goals of FRDP; and (d) a Pacific resilience meeting that consolidates exist-ing regional meetings focused on climate change, disaster response, preparedness and risk reduction and opens the door to stronger engagement with the wider development community.
76 (AMCDRR 2016)77 (United Nations General Assembly 2018a)78 (APEC 2016)79 (APEC 2016)80 (ASEAN 2005); (ASEAN 2016a)81 (ASEAN Secreteriat 2015)
82 (ASEAN 2016b)83 (SAARC 2007); (SAARC Environment Ministers 2006)84 (SPC 2016)85 (SPC 2016)86 (DFAT 2018)
307

10.1.5 Europe and Central Asia
Much l ike other regions, Europe is exposed to a broad range of natural hazards such as earthquakes, drought, floods, storms, wildfire, avalanches and landslides, which persistently result in economic and human losses, as well as a range of technological hazards. In contradiction to its regional capacity, awareness of natural hazards and the existing knowledge base on DRR, data indi-cates that vulnerability to region-specific hazards is mounting.
EU DRM policies have laid the groundwork to imple-ment some of the Sendai Framework recommenda-tions, including those on ongoing civil protection, development cooperation and humanitarian aid action.87 For DRR within its civil protection system: “The EU’s modus operandi in the field of DRR is very much the EU’s footprint: it gathers its member States around a common policy, shows challenges that are shared by all the member States, points out that there is the need to solve these challenges together, and provides a set of answers in the form of guidelines, financial support, exchange of knowl-edge and experiences at national level.”88
The European Forum for Disaster Risk Reduction Roadmap 2015–2020 was developed to guide Europe’s implementation of the four priorities of action and seven global targets of the Sendai Framework, with the two identified priority areas of: (a) development or review of national- and local-level strategies for DRR, in line with Target E of the Sendai Framework, based on the building blocks of risk assessments and disaster loss databases and (b) integration of DRR into different sectors, espe-cially climate change and the environment.89
For its part, the EC has adopted the “Sendai Frame-work for Disaster Risk Reduction Action Plan [2016–2020]: A disaster risk-informed approach for all EU policies” to foster implementation of the Sendai Framework and other international agree-ments by supporting inclusion in EU policies. The action plan identifies, under each key area, a set of
measures that could underpin a more integrated risk-informed policy landscape in the EU.90 The key action plan implementation areas include: (a) building risk knowledge in EU policies, (b) using an all-of-society approach in DRM, (c) promoting EU risk-informed investments and (d) supporting the development of a holistic DRM approach.
The second CASC Sub Regional Platform held in 2018 had a subregional focus on DRR inte-grated with development planning.91 The platform approved a Plan of Action,92 a Roadmap for Cities93
and the Yerevan Declaration containing political commitments to implement the Sendai Framework. The declaration has a focus on reaching Target E by 2020, but aims to do so “in coherence with the 2030 Development Agenda including the Paris Agree-ment on climate change, NUA and other relevant instruments, and to recognize the importance of engaging with local governments to implement and invest in DRR.”94
308 Chapter 10

10.2 National enabling environments for integrated risk reduction
The subsequent chapters of this part focus on Member State practice in developing and imple-menting risk reduction strategies and plans at national and local levels, how these are estab-lished, how they interact with planning for devel-opment and CCA, and how they operate in urban settings and fragile contexts. This approach, and the extensive use of national and local case studies, recognizes that Member States have the primary role in implementing the Sendai Frame-work, the 2030 Agenda and the other post-2015 agreements. Before addressing the plans and strategies, it is useful to highlight some aspects of national systems of government, law, culture and risk perception that can either enable or hinder risk reduction, and therefore the development and effec-tive implementation of such plans. It is not possible to discuss these with any specificity at a global level, given the unique character of each country’s sociopolitical and physical environment and risk profile. However, some key national factors are identified in the Sendai Framework, as they were also in HFA, that are larger than the specific targets and indicators and yet are also necessary enablers to achieve those targets.
The targets and priorities of the Sendai Framework emphasize the importance of understanding risk better, by improving risk information through moni-toring, assessing, mapping and sharing (para. 14).95
Priority for action 1 on understanding disaster risk brings this into focus as a fundamental aspect of reducing risk and preventing risk creation (paras. 21–25). Also reiterated throughout the Sendai Framework, continuing strongly from HFA, is the importance of “strengthening disaster risk gover-nance and coordination across relevant institutions and sectors and the full and meaningful participa-tion of relevant stakeholders at appropriate levels” (para. 14). This is a concept captured more fully under Priority for action 2 on strengthening disas-ter risk governance to manage disaster risk (paras. 26–28). These two aspects of the Sendai Frame-work require constant interaction between the creation of information and its use to reduce risk across all of society, including that which accrues to the most vulnerable, and with the participation of relevant stakeholders. These are the aspects of the Sendai Framework most relevant to enabling the development of well-informed national and local DRR strategies and plans as required by Target E, and to implementing them effectively.
Two other principles that run through the Sendai Framework need a mention in this context. The first is the issue of integration with the other post-2015 global agendas. This is not for the sake of conceptual neatness, but because the international community expressed through this and the other global agreements, the realization that integrated risk reduction and management, or a systems-based approach, is the only way to attain sustain-able development in the face of disaster risk and climate change. The second is the issue of gender equality, more specifically empowering women in DRR, along with the broader notion of inclusiveness of people of all ages and abilities, as essential to understanding risk, risk perceptions and involving the whole community in deciding how to manage and reduce risk effectively. Youth and women
87 (EC 2016)88 (Morsut 2019)89 (EFDRR 2016)90 (EC 2016)91 (UNISDR 2018a)
92 (Plan of Action Implementation of the Sendai Framework for Disaster Risk Reduction 2015-2030 in Central Asia and South Caucasus Region 2016)93 (UNISDR 2015a)94 (Yerevan Declaration 2018)95 (United Nations 2015a)
309

become more of a focus when considering the Sendai Framework in light of the other agendas and the issues they address – SDG 5 on gender equal-ity and women’s empowerment for instance – and a heightened awareness of the need for intergenera-tional equity in responding to climate change and preventing the types of shocks that can have such a damaging and long-lasting impact on the health and well-being, education and employment opportuni-ties of young people.
10.2.1 Legal and institutional frameworks for disaster risk reduction and development
Risk reduction strategies and plans, reduction of risk in development planning and governmental support for CCA do not occur in a vacuum. Insti-tutional responsibility for developing, resourc-ing, implementing and being accountable for the
Workshop in Antigua and Barbuda (Source: UNDRR)
effectiveness of such strategies and plans is almost invariably set out in government laws, decrees and rules at national and local levels. Indeed, the specialist institutions for DRM and CCA are often created by legislation, or where they are part of ministerial mandates, they are subject to rules and policies made under the relevant legislation.96
Member States do not generally establish legisla-tion for DRR alone, and such an initiative would now run counter to the Sendai Framework’s approach
to integrated risk reduction, as well as to the emerging understanding of systemic risk eluci-dated in Chapter 2 of this GAR. DRR mandates are embedded within broader frameworks for DRR and management, and, importantly, in a range of sectoral laws that are not widely understood as risk management frameworks. These include: land zoning and land-use planning; building codes; environmental protection and anti-pollution laws, including environmental impact assessments of development projects; water resource management;
310 Chapter 10

96 (IFRC and UNDP 2014b)97 (IFRC and UNDP 2014b)98 (IFRC and UNDP 2014a)99 (IFRC 2016a)100 (ADPC 2017b)
101 (IFRC 2017)102 (IFRC 2015); (IFRC 2016b)103 (Neumayer and Plumper 2007)104 (Nishikiori et al. 2006) 105 (Santos-Burgoa et al. 2018)
solid and liquid waste management; and fisher-ies, wildlife and forests. In other words, relevant legal frameworks exist for almost all elements of the wider risk scope of the Sendai Framework. The nature of these mandates, the institutions they establish, the resources allocated, and the way they communicate and work together as a system, are the essential infrastructure for effective risk gover-nance to address systemic risk.97
Research shows that there are few cross-sectoral linkages, and often few opportunities for non-govern-mental stakeholders to participate in risk gover-nance through public institutions. Yet, these are fundamental to either enabling or creating barriers to effective and participatory risk management strate-gies at national and local levels. There is extensive research and practical tools available to Member States wishing to undertake assessments of their legal frameworks for effective DRR,98 including many specific country case studies.99 Further analysis is available for particular focus areas, such as the legal and institutional enabling environment for SME disaster resilience in Asia, which considers the exist-ing and additional needs for integration in the areas of DRM, CCA and business development.100
10.2.2 Inclusion and equality
The Sendai Framework calls for a people-centred, inclusive and non-discriminatory approach to DRR that pays special attention to people dispropor-tionately affected by disasters. It specifically notes the importance of involving “women, children and youth, persons with disabilities, poor people, migrants, indigenous peoples … and older persons in the design and implementation of policies, plans and standards.” (Para. 7).
It is well established that through direct and indi-rect losses to infrastructure, livelihoods and oppor-tunities, disasters compromise the capabilities of communities to lead a dignified life and realize their aspirations. They undermine sustainable oppor-tunities for development. Inclusion of all relevant stakeholders and principles of equality are there-fore essential to understand the way these systemic risks affect different groups within the population, and what to do about it. DRR needs to take account of a range of socioeconomic sources of vulner-ability, including age (children, youth and older persons), disability, ethnicity, poverty, and in circum-stances of gender inequality, women as a group.
Gender equality and empowerment
Women as a group are not intrinsically vulnerable, but differentiated gender roles and gender inequal-ity have shown that disasters often have greater socioeconomic impacts on women than on men,101 as well as higher risk of GBV.102 In some contexts, women have higher rates of death and injury,103 as observed in some populations affected by the 2004 Asian tsunami.104 This can however be very cultur-ally and context specific (e.g. in Hurricane Maria in Puerto Rico, men over the age of 65 had the highest mortality).105 An essential step in ensuring effective risk reduction is to engage women so that their experience of risk is a default input to global, regional, national and local strategies for risk reduc-tion, sustainable development and climate change. This is recognized in the Sendai Framework, and in greater detail in the 2030 Agenda through SDG 5 on gender equality and women’s empowerment. These goals are to be realized through increasing women’s participation and decision-making roles in the rele-vant institutions and processes.
311

SDG 5 aims to “to achieve gender equality and empower all women and girls.”106 Target 5.5 of SDG 5 is to “Ensure women’s full and effective partici-pation and equal opportunities for leadership at all levels of decision-making in political, economic and public life.” Its achievement will be measured by the quantitative indicators of: the proportion of seats held by women in national parliaments and local governments, and the proportion of women in managerial positions.107 National governments and legislatures are, of course, free to set higher targets; indeed, many do set targets on women’s participa-tion in government administration through their national development plans, but they also need to develop ways to implement them.
In light of SDG 5, the Regional Asia-Pacific Confer-ence on Gender and Disaster Risk Reduction issued clear recommendations – the Ha Noi Recommen-dations – on implementing the Sendai Framework to promote gender equality.108 Of particular rele-vance to risk governance, law and policy, the confer-ence recommended that governments:
Finally, the recommendations emphasize the need to “institutionalize” the leadership of women and diverse groups in disaster preparedness, response, recovery and reconstruction, and propose that at least 40% of the composition of national and local mechanisms responsible for developing disaster preparedness, response and recovery decisions must be made up of “women and diverse groups”.109
The careful analysis of the Sendai Framework by the Ha Noi Recommendations applying the lens of SDG 5, gives Member States some practical options to address representation of women in developing national and local risk reduction strate-gies, and to engage women in needs assessments. Both these elements can provide a fuller picture of the systemic risks faced by women due to gender inequality. Recognition of the differentiated impact of disasters and targeted actions is a prerequisite for an inclusive approach.
Protection of children and participation of young people
As discussed in Chapter 3 of this GAR, disasters affect individuals in different ways at different stages of their life cycle with compounding effects. While being a child does not define vulnerability, the ability of children and young people to cope when risk is realized can often be surpassed. Children are at increased risk of being separated from their parents, family members or carers during disasters; the cause of deep distress, such separation can have a severe and long-lasting negative effects on mental health and development. Unaccompanied and separated children may face greater risks to certain threats; threats that may include abduction, trafficking, sale, illegal adoption, sexual and GBV (including child prostitution and child marriage), physical violence and neglect have all been observed in the aftermath of disasters.110 Having risk reduction strategies that incorporate aspects of child protection can help to prevent and mitigate some of these impacts on children.
Children’s vulnerability profiles in the aftermath of a disaster are often correlated with increased
• Seek to understand risk, including by mandat-ing up-to-date national and local statistics disaggregated by sex, age and disability, as well as developing socioeconomic baselines to inform gender-responsive DRR;
• Conduct gender analysis of disaster risk to inform national and local policies, strategies and plans;
• Implement strong laws that mandate women’s par ticipation and leadership in decision-making and also create accountability for their implementation;
• Invest in social protection and social services that reduce gender inequali ty and other inequalities and enable at- risk groups of women and men to mitigate disaster risks and adapt to climate change;
• Implement security and protection interven-tions led by women to reduce current risks and prevent creation of new risks arising from gender-based discrimination and violence.
312 Chapter 10

106 (United Nations General Assembly 2015a)107 (United Nations Economic and Social Council 2017a)108 (UN Women and Viet Nam Central Steering Committee for Natural Disaster Prevention Control 2016)109 (IFRC 2017); (UN Women and Viet Nam Central Steering Committee for Natural Disaster Prevention Control 2016)110 (Uppard and Birnbaum 2017)
111 (UNICEF 2017) 112 (UNICEF 2015)113 (HelpAge International 2012) 114 (Matsuzaki, n.d.) 115 (Handicap International 2015)116 (Guadagno 2017)117 (United Nations General Assembly 2014a)
risk of disease and malnutrition, which may trigger interruption of schooling trajectories, ill-developed social and cognitive skills. These are highly likely to affect their capabilities to attain the skills neces-sary to achieve their full earning potential, and in turn send their children to school, etc. Worldwide evidence highlights that persistence of inequity in enrolment, attendance, learning outcomes and achievement based on gender, poverty, exposure to natural hazards, etc., are all determining factors in defining which children attend what kind of school and for how long.111 In addition, malnutrition in early childhood is likely to impair cognition; children who do not complete primary school are likely to earn less money in their first job than those with higher levels of education. In essence, children who are forced to drop out of school at an early stage, or who never enrol in school, will likely never attain the skills required for them to achieve their full earning potential.
The needs and interest of young adults are also of concern in the broader post-2015 agendas, particu-larly considering the potential impacts of climate change.112 Climate change, sustainable develop-ment and disaster risk all raise the compelling issue of how to ensure intergenerational equity. Engage-ment with young adults and ensuring they are repre-sented in planning and decision-making processes on risk reduction are important elements in ensur-ing their futures.
Groups with limited mobility and access to information
Very young children, older persons with limited mobil-ity113 and people with disabilities and their carers (most of whom are women) can be at a significant
disadvantage in disaster situations.114 Physical mobility issues can reduce their capacity to evacu-ate. Invisible disabilities such as hearing or sight impairment and intellectual disabilities can reduce people’s capacity to receive and understand risk reduction education, participate in drills, early warning and evacuation instructions, as well as to move around in chaotic circumstances.115 Prior planning, preparedness and risk reduction for these groups should be undertaken in a participatory fashion with the persons concerned or their advo-cates, to ensure that their needs are considered in advance, and that plans and strategies are effec-tively inclusive.
Access for the poorest and most marginalized groups
Other groups – that are commonly marginalized in community DRR, as well as during disasters – also have diverse skills and knowledge to contribute in planning for risk reduction. These include: migrants, who may have limited knowledge of local hazards, institutions and services and may not have social and family support networks, but may also bring new knowledge and skills from previous experi-ences;116 indigenous peoples, who may be socially or economically marginalized, but also hold tradi-tional knowledge of relevance to risk reduction;117 and the very poorest people, who may be housed in poor quality dwellings or informal settlements, but may also have developed numerous individual and communal survival and organizing skills.
The central message from the Sendai Framework on these issues is that equality and effectiveness in risk reduction is reached through inclusion of all stakeholders. When certain groups are omitted, the
313

strategies and plans that ensue are often less effec-tive. Ignoring or omitting the acquired experience of risk and disaster impacts of such groups, can result in impacts that are unequal, even discriminatory.
Inclusion and empowerment of women, vulner-able groups, people with disabilities and socially marginalized people within national frameworks of law, policy and institutions underpin effective risk reduction and uphold the all-of-society tenets of the Sendai Framework and “leave no one behind” prin-ciple of the 2030 Agenda.
10.3 Conclusions
Regional and national frameworks are important aspects of the enabling environment for successful risk reduction by Member States.
Regional intergovernmental organizations, regional platforms on DRR and new forms of partnership within global regions allow Member States and other stakeholders to pool resources and capaci-ties to support national and local risk reduction. They also provide mechanisms to focus on specific regional risks. The foregoing account indicates a high degree of engagement and activity at regional level to support implementation of the Sendai Framework. These processes are now at the stage, with strategies and mechanisms in place, where the focus can shift to practical support to Member States’ efforts in implementation, supplemented by regional and cross-border risk reduction efforts.
The primary responsibility for Sendai Framework implementation lies with the Member States. The broader national framework of laws, policies and institutions for risk reduction, development and action on climate change have a significant impact on States’ ability to formulate and imple-ment national and local strategies and plans on DRR, development and CCA. Such overarching frameworks are key in empowering and including
all stakeholders, establishing the basis for gender equality, and for including people and groups more exposed and more vulnerable to disaster impacts than the wider population.
The legislative, policy and institutional structures and processes that include the views and experi-ences of women and girls, people with disabilities, older persons, and for example, people from differ-ent ethnic or religious backgrounds, and which include protection measures for children, result in measures at national and local levels that allow a more equal and more effective reduction of risk.
These enabling frameworks can be understood as central components of national and local plans for DRR, development, CCA and the emerging inte-grated approaches to risk reduction, which are discussed in the following chapters.
314 Chapter 10

Chapter 11: National and local disaster risk reduction strategies and plans
The development of national and local DRR strategies and plans by 2020 is a dedicated target in the Sendai Framework (Target E). Compared with the other global targets, which are due by the end of the agreement in 2030, the 2020 deadline for DRR strategies and plans was established in recognition of their importance as enablers to reduce disaster risk and loss. This chapter complements the Sendai Framework monitoring data reported in Part II with examples of the challenges, lessons learned and emerging good practices at country level.
11.1 Sendai Framework monitoring data on Target E
As discussed in Part II above, the Sendai Frame-work monitoring system shows that 47 Member States reported on Target E in 2017 in relation to national strategies (Indicator E-1). This is a signifi-cant increase compared with 27 countries in 2016, but at 25% of the total falls well short of what is required by 2020. Of these, 6 countries reported that they have national DRR strategies in comprehen-sive alignment with the Sendai Framework, while
16 reported substantial-to-comprehensive align-ment, 15 moderate-to-substantial alignment, and 7 moderate alignment; 3 of the 47 reported limited or no alignment. However, using other sources of State self-reporting in addition to the formal SFM, the number is much higher. One hundred and three countries report having a national DRR strategy at some level of alignment, including 65 Member States that rated their alignment as above 50% (moderate to complete).118 This number is much more significant as it represents more than 50% of the United Nations Member States (Chapter 8 Target E: Progress on disaster risk reduction strate-gies for 2020. Indicator E-1).
118 (United Nations General Assembly 2018a)
315

Target E also has an indicator on local strate-gies (Indicator E-2). It requires countries to report on the proportion of their local governments that have local DRR strategies. SFM indicates that 42 countries reported on local strategies. Of these, 18 reported that all their local governments have local strategies aligned with their national such strate-gies, and 7 reported no local strategies (or none aligned with their national strategies) (Chapter 8 Target E: Progress on disaster risk reduction strate-gies for 2020. Indicator E-2).
Although the data on Target E thus remains partial, it indicates attention to the issue of align-ing national and local DRR strategies and plans with the Sendai Framework, as well as suggesting there is still some way to go to meet this target by 2020. That said, it is also important to recognize that these indicators are not designed to provide detail on the challenges countries face and what innovations and good practices they are developing to create the right enabling environment to reduce risk along the way to meeting the target. The essen-tial purpose of asking for national and local strate-gies to be developed and implemented in alignment with the Sendai Framework is to create the optimal enabling environment to enable the wide range of risks addressed in the Sendai Framework to be reduced. It is therefore important to look at the ways countries have tackled this issue.
11.2 The importance of national and local disaster risk reduction strategies and plans
National and local DRR strategies and plans are essential for implementing and monitor-ing a country’s risk reduction priorities by setting
implementation milestones, establishing the key roles and responsibilities of government and non-government actors, and identifying technical and financial resources.119 While strategies are a central element of a wider disaster risk governance system, to effectively implement policy, these strategies need to be supported by a well-coordinated institu-tional architecture, legislative mandates, political buy-in of decision makers, and human and financial capacities at all levels of society.
The Sendai Framework does not require countries to develop stand-alone DRR strategies and plans. However, it does ensure they have in place and implement national and local plans that do the job of supporting DRR in alignment with the Sendai Framework. Although there has been debate in the past about the merits of stand-alone or main-streamed DRR strategies, in practice, this binary notion is not especially helpful in applying the Sendai Framework requirements. Under Priority 2: Strengthening disaster risk governance to manage disaster risk, paragraph 27(a) highlights the need to “mainstream and integrate DRR within and across all sectors and review and promote the coher-ence and further development, as appropriate, of national and local frameworks of laws, regulations and public policies.” Paragraph 27(b) then advises Member States to “adopt and implement national and local DRR strategies and plans, across differ-ent timescales, with targets, indicators and time frames, aimed at preventing the creation of risk, the reduction of existing risk and the strengthening of economic, social, health and environmental resil-ience.” Paragraph 27(b) highlights the importance context in defining strategies and plans, and the significance of developing of nationally-determined targets and indicators by 2020. Paragraph 27(a) identifies the fundamental role of strategies and plans in achieving the goal of the Sendai Framework by 2030. This suggests that the precise form that a country chooses to pursue DRR at a strategic level is less important than the content and effectiveness of the strategies and plans in that country context.
In some cases, risk reduction may be integrated into broader national policy planning or sectoral risk management plans and strategies; indeed, this
316 Chapter 11

119 (UNISDR 2015e) 120 (UNDP 2019o)
121 (IFRC and UNDP 2014b); (IFRC and UNDP 2014a)
could meet the goal of integrating risk manage-ment and development planning. In contexts where awareness of DRR is emerging, stand-alone DRR strategies and plans can be used as an important advocacy tool to sensitize decision makers to take specific actions.120 But such strategies and plans should have among their objectives the integration of DRR into mid- and long-term planning processes, including climate risk management where these areas overlap.
In many country contexts, stand-alone DRR strate-gies and plans are needed because their objectives are not automatically addressed through national development or sectoral policy frameworks, or even within the systems established to manage disaster risk, many of which have traditionally focused atten-tion and resources on response.121 This is often, though not necessarily, the case in countries with
lower governance capacity where DRR strategies and plans compensate for risk management gaps in development or sectoral policies.
Clearly it is easier to point to and assess a single strategy, but this can also be in the form of a frame-work for integrated risk governance across sectors and ministries, addressing climate resilience and risk-informed socioeconomic development. In line with the Sendai Framework and 2030 Agenda, either mainstreamed or stand-alone risk reduction strat-egies should extend beyond the systems of civil protection or DRM and also include elements that are highly cross-sectoral in nature, such as urban risk management, land-use planning, river basin manage-ment, financial protection, public investment resil-ience regulations, preparedness and early warning, which cannot be addressed comprehensively through any individual sectoral strategy or plan.
Figure 11.1. DRR strategies and plans by 2020 aligned with the Sendai Framework and among national and local levels
(Source: UNDRR 2019)
317

DRR strategies, whether stand-alone, mainstreamed or a combination of both approaches, may also have a role in tempering market mechanisms, requiring public policy to address issues related to DRR as a “public good”. Public goods are under-provided by the market, are non-excludable and create externalities.122 For example, individuals and communities may not construct sufficiently robust levees if they do not consider that their flood protec-tion could help others, instead constructing levees that protect themselves only, which may even have a negative impact on those who live outside the embankments.123
Having in place subnational and local DRR strate-gies or plans that complement the national policy framework has been increasingly recognized over the past two decades as an important require-ment of a functioning risk governance system. The implementation of national DRR strategies hinges on the ability to translate and adapt the national priorities to local realities and needs. Local strate-gies or plans then allow for a much more nuanced territorial approach (local, subnational and national) that fosters accountability through direct engage-ment with a range of stakeholders who need to be involved to avoid creating new risk, to reduce risk behaviours or to have a voice as the main groups suffering the impacts of disaster events.124 The penetration of DRR strategies or plans down to the local level is likely to depend on the level of practi-cal decentralization, while the formal structure of government – centralized or federal – may or may not be a critical factor depending on the country context.125 As risk is not confined to any territorial or political division, it is also critical that DRR strate-gies or plans consider transboundary and regional solutions, such as basin- or ecosystems-based management, or arrangements that comprise multi-ple local government territories.
11.3 Aligning strategies and plans with the Sendai Framework
The Sendai Framework calls on national and local governments to adopt and implement these strate-gies and plans, across different timescales, and to include targets, indicators and time frames. They should aim to prevent the creation of risk, reduce existing risk and strengthen economic, social, health and environmental resilience. Importantly, Target E has also been reflected in two SDG indica-tors: (a) number of countries that adopt and imple-ment national DRR strategies in line with the Sendai Framework and (b) proportion of local governments that adopt and implement local DRR strategies in line with national DRR strategies.126
The Sendai Framework suggests several require-ments to be covered by DRR strategies, and these have been distilled into 10 criteria for monitoring (Box 11.1).
It is assumed that DRR strategies and plans that meet all 10 requirements will create the best condi-tions to substantially reduce disaster risk and losses in lives, livelihoods, health, economic, physi-cal, social, cultural and environmental assets. While all 10 criteria are important, a few stand out in terms of what is considered “new” about the Sendai Framework and its contribution to the global DRR policy agenda. These include a stronger focus on preventing the creation and accumulation of new risk, reducing existing risk, building the resilience of sectors, recovery, building back better and promot-ing policy coherence with SDGs and the Paris Agreement.
Policy coherence requires that national and local plans are aligned and designed for the context of the society and environment as defined by relevant hazards, high-priority risks and socioeconomic
318 Chapter 11

Box 11.1. Drawing from the Sendai Framework, the following 10 key elements should be covered by DRR strategies to be considered in alignment with the Sendai Framework
122 (Wilkinson, Steller and Bretton 2019); (Dianat et al. 2019) 123 (Wilkinson, Steller and Bretton 2019) 124 (Quental Coutinho, Henrique and Lucena 2019)
125 (Wilkinson et al. 2014)126 (United Nations General Assembly 2017c)127 (UNISDR 2017d)
setting. Hence, the selection of risk reduction targets and the balance of different types of measures will be situation specific and will also depend on the risk perception and risk tolerance of the society represented by decision makers.127 However, making a mere reference to other relevant policies and strategies is not sufficient to meet this requirement. Done in earnest, establishing policy coherence depends on identifying common actions and instruments in support of shared policy
(Source: UNDRR 2018)
objectives to reduce disaster risk or vulnerabilities, or to build resilience.
The 10 criteria recommended for assessing DRR strategies and plans against the Sendai Frame-work requirements are intended to ensure some consistency. But when the strategies or plans that have been endorsed since 2015 are compared, it is apparent that there is no “one size fits all”. Depend-ing on the national or local country context, DRR
i. Have different timescales, with targets, indicators and time frames
ii. Have aims at preventing the creation of risk
iii. Have aims at reducing existing risk
iv. Have aims at strengthening economic, social, health and environmental resilience
v. Address the recommendations of Priority 1, Understanding disaster risk: Based on risk knowledge and assessments to identify risks at the local and national levels of the technical, financial and administrative DRM capacity
vi. Address the recommendations of Priority 2, Strengthening disaster risk governance to manage disaster risk: Mainstream and integrate DRR within and across al l sectors with defining roles and responsibilities
vii. Address the recommendations of Priority 3, Investing in DRR for resilience: Guide to allocation of the necessary resources at all levels of administration for the devel-opment and the implementation of DRR strategies in all relevant sectors
viii. Address the recommendations of Priority 4, Enhancing disaster preparedness for effective response and to “Build Back Better” in recovery, rehabilitation and reconstruction: Strengthen disaster preparedness for response and integrate DRR response preparedness and devel-opment measures to make nations and communities resilient to disasters
ix. Promote policy coherence relevant to DRR such as sustainable development, poverty eradication and climate change, notably with SDGs and the Paris Agreement
x. Have mechanisms to follow-up, periodi-cally assess and publicly report on progress.
319

strategies can take a range of formats. Some coun-tries pursue them as stand-alone DRR strategies, and others take the route of a system of strategies across sectors linked by an overarching document or framework. There is also a wide range of differ-ent strategic and hazard- or sector-specific plans in place, for example:
The titles that countries select for their Sendai Framework aligned DRR strategies or plans can be revealing. While in some instances these may indi-cate context specificity and national priority, taken together they suggest greater similarity and conver-gence as compared with their predecessors under the HFA. For example: Master Plan for Disaster
Risk Reduction (Mozambique); Joint Action Plan on Climate Change and Disaster Risk Reduction (Tonga); National DRM Plan or Strategy (Argentina, Colombia, Georgia, Madagascar and Thailand); Action Plan on Disaster Risk Reduction (Myanmar); National Disaster Risk Management Framework (Zimbabwe); or National Strategy for Disaster Prevention, Response and Mitigation (Viet Nam). HFA equivalents often used language related to civil protection, preparedness and emergency manage-ment even though they addressed elements of DRR – Burkina Faso, Canada, Dominican Republic, Kyrgyzstan and Mali for example. Consequently, the title of the policy, strategy or plan may not be a true indicator of the degree to which disaster or climate risk reduction are addressed.
11.4 Lessons learned from the Hyogo Framework for Action and Sendai Framework
While the Sendai Framework monitoring require-ments for Target E set high standards for assess-ing compliance, there are also other criteria that viable DRR strategies or plans need to meet to achieve results. These observations are derived from country-level experiences, mostly during the HFA implementation period, since such information on recently endorsed strategies under the Sendai Framework is not yet available.
Country experience suggests that there needs to be room for flexibility to adjust, evolve and adapt to changing contexts and priorities for strategies or plans to remain relevant and implementable. Hence, regular revisions and updates are strongly recommended. In particular, this relates to the activity level, where real-world changes need to be
• In Norway, the National Disaster Risk Reduction Strategy is outlined in the Civil Protection and Emergency Planning White Paper128
• In the Russian Federation, the National Disas-ter Risk Reduction Strategy forms part of the national security strategy129
• In Luxembourg, which does not have a sepa-rate national strategy, DRR strategies are in place in specific sectors, as part of one or more combined strategies, such as with respect to flood risk management130
• In Kenya, the National Disaster Risk Manage-ment Pol icy 131 is complemented by the Kenya Vision 2030 Sector Plan for Drought R isk Management and Ending Drought Emergencies132
• In Angola, a twofold approach is adopted with a Strategic National Plan for Prevention and Disaster Risk Management, covering three of the Sendai Framework’s global priorities, and a National Preparedness, Contingency, Response and Recovery Plan, which covers the Sendai Framework’s fourth global priority
• In Costa Rica, it was decided to align to the Sendai Framework through the adoption of a National Risk Management Policy 2016–2030 that provides a broad multisectoral mandate and is complemented by five-year National Risk Management Plans
320 Chapter 11

128 (UNISDR 2017b)129 (UNISDR 2017b)130 (UNISDR 2017b)131 (Kenya 2009); (Kenya 2018)132 (Kenya 2013)133 (UNDP 2019l)134 (Chakrabarti 2019); (Djalante et al. 2017); (Daly et al. 2019); (UNDP 2019g)
135 (Bangladesh, Ministry of Disaster Management and Relief 2017); (Sri Lanka, Disaster Management Centre, Minis-try of Disaster Management 2017); (Omoyo Nyandiko and Omondi Rakama 2019)136 (Twigg 2015); (Wilkinson et al. 2017)137 (IFRC and UNDP 2014b); (Sands 2019)
reflected, such as in the case of making the switch from printed hazard maps to online information systems, as in Tajikistan.133 In addition, implementa-tion needs to be supported by financial and techni-cal resources, and operational guidelines and tools that are commensurate with the available capaci-ties and skills of those involved.
Implementation also benefits from having subna-tional and local strategies or plans in place that are linked with national DRR and development policy priorities. Good examples of this practice are known in India, Indonesia and Mozambique.134 Implemen-tation plans at different scales of governance can be either stand-alone, as in Bangladesh or Sri Lanka, or they can be integrated into local development plans as in Kenya.135 In some instances, countries pursue a hybrid solution where subnational DRR plans exist in parallel with local development plans that integrate risk considerations, as the below case study from Mozambique shows.
With regard to the process of drafting or developing DRR strategies or plans, there are now increasing calls for them to be grounded in a comprehensive “theory of change” that allows for a better under-standing about how beneficial, long-term change happens. This means that strategies and plans are produced through a process of reflection and dialogue among stakeholders, through which ideas about change are discussed alongside underlying assumptions of how and why change might happen as an outcome of different initiatives.136
The involvement of multiple stakeholders is already a key principle of the Sendai Framework, and essential when it comes to seeking agreement on and setting the DRR priorities at different levels of government. Ensuring active participation of
women, persons with disabilities, youth and other groups who may not automatically have a seat at the table is a prerequisite for ensuring that their needs are addressed, and their specific knowledge and skills accessed. Calls for the recognition of the right to participate in DRM decision-making, in line with the right to self-determination and access to information, are becoming more frequent.137 This will also require an understanding of the incentives, interests, institutions and power relations facing key stakeholders engaged in risk-reducing and risk-creating behaviours. Hence, understanding the political economy of DRR will be an essential step for insuring the involvement of all interest groups.
Ariel view of Bhutan(Source: Curt Carnemark/World Bank)
321

11.5 Good practices at national and local levels
11.5.1 Triggers to review or develop strategies
The most obvious impulse for countries to develop or revise their existing DRR strategies or plans is Target E. For example, Costa Rica, Montenegro and Sudan assessed their current strategies and concluded that they were out-dated and did not meet the requirements of the Sendai Framework and other international conventions.138 Kyrgyzstan and Madagascar identified the need for a new strat-egy that was able to better address changes in the internal and external environments, meet the prin-ciples of sustainable development and be part of the national development strategy.139 A working group was established within the National Platform, which led the drafting process of the strategy and implementation plan in 2016–2017, which was then approved in January 2018.140
In Kyrgyzstan, parliamentarians and heads of the Ministry of Emergency Situations and other State bodies participated in the Sendai conference in 2015. This was the impetus for the Government of Kyrgyzstan to instruct the Ministry of Emergency Situations and other State institutions to consider ways to implement the Sendai Framework. Having undertaken stakeholder consultations, the Ministry of Emergency Situations and the National Platform for Disaster Risk Reduction submitted a proposal for consideration by the government on the development of a new strategy. During 2016–2017, the National Platform led the drafting of the strategy and an imple-mentation plan; the National Disaster Risk Reduction Strategy was approved in in January 2018.141
Another important impulse has been the occurrence of major disaster events and the realization that
sustainable development is difficult to achieve in the face of the pervasive damage from disasters.142 For example, this was the case after the 2016 drought in Mozambique,143 and the 2017 floods in Chiapas, Mexico.144 In Argentina, a host of develop-ments following the 2015 floods in Buenos Aires Province paved the way for a DRM policy overhaul in line with the Sendai Framework, with support from the Federal Congress for Disaster Risk Reduc-tion and the National Congress for Disaster Risk Management, the passage of a new DRM law (No. 27287) in 2017 and a national plan in 2018.145
Another typical trigger for developing or reviewing DRR strategies or plans can be the enactment of new legislation. This has been the case in the Philip-pines during the HFA implementation period, where the 2010 Disaster Risk Reduction and Management Act tasked government with developing a compre-hensive DRM plan and framework. Also, the new DRM law (2015) in Argentina mandated the elabo-ration of a National Disaster Risk Reduction Plan.146 Strategies or plans can have a role in supporting the process of legal reform by providing details for the implementation of new and more ambitious laws. They can also extend the reach of out-dated laws by advancing the focus on DRR or requiring DRR to be integrated into development, as was the case in Nepal until the new Disaster Risk Management Act was endorsed in 2017.147
No matter what impels countries to align their strat-egies with the Sendai Framework, it is important that a self-sustaining process is initiated that can keep stakeholders motivated to keep the strategy alive over an extended period of time. This is partic-ularly important at times of infrequent disasters when the memory of devastating impacts is fading. Periods that are free from major disasters provide the best opportunities to focus efforts on reducing the accumulation of new risks while also tackling existing risks.
322 Chapter 11

138 (UNDP 2019d); (UNDP 2019j); (UNDP 2019m)139 (UNDP 2019f); (Andriamanalinarivo, Falyb and Randria-manalina 2019)140 (UNDP 2019l)141 (UNDP 2019f)142 (Maurizi et al. 2019)143 (UNDP 2019g)144 (Maurizi et al. 2019)145 (Argentina Civil Protection Agency 2019)
146 (Argentina Civil Protection Agency 2019)147 (IFRC and UNDP 2014b)148 (Jackson, Witt and McNamara 2019)149 (UNISDR 2017b)150 (Bureau de Recherches Géologiques et Minières et al. 2017)151 (Maurizi et al. 2019)152 (MIDIMAR 2015)153 (UNDP 2019p)
11.5.2 Foundations in assessment
Although it appears self-evident that risk analy-sis precedes priority setting and planning, it appears this is not yet common practice. Resource constraints often lead to short cuts when it comes to analysis; many strategies or plans therefore
In Europe and Central Asia, risk assessments and disaster loss databases have been identified as essential building blocks for the development and implementation of national and local strategies.149 Low-risk awareness is one of the main challenges,
identify risk and capacity assessments as a key output to be produced. This may be a fair and pragmatic solution, if indeed the assessments are conducted, and their results used to review or refine the original DRR strategy. While the importance of both local and scientific knowledge is usually highlighted in the assessment process, in practice, it appears that scientific knowledge tends to be preferred in formal strategies.148
not only when it comes to setting the right DRR priorities but also in implementing DRR strate-gies. Having access to risk information is there-fore an important first step. Haiti,150 Mexico,151 Rwanda152 and Uganda153 have made great strides
Ongoing infrastructure development in Egypt (Source: Tejas Patnaik/ UNDRR)
323

in understanding their risk profiles by developing national risk atlases, which provide a comprehen-sive assessment of existing risks at the national and local level in areas that are highly risk prone. The risk assessments and profiles are updated and expanded and are reportedly informing the ongoing process to align the respective DRR strategies and plans with the Sendai Framework.
In Colombia, the preparation of the National Disas-ter Risk Reduction Plan 2015–2030 was preceded by the development of a risk management index and a diagnostic of public expenditures for DRM in 2014.154 Tajikistan is another interesting example of a government making a deliberate effort to take into consideration emerging threats in developing a new strategy. The country’s increasing scale of indus-trialization and mining is expected to create new risks related to hazardous wastes and the growing volume of goods transported by road. These require risk management measurements that the Govern-ment of Tajikistan is not sufficiently familiar with. Also, so-called legacy threats from radioactive materials will require greater attention as they are technically complex and often beyond the means of local capacities.155
Namibia’s National Disaster Risk Management Policy from 2009 was revised in 2017, in line with the Sendai Framework. The subsequent Disas-ter Risk Management Framework and Action Plan (2017–2021) draws upon the findings and recom-mendations of a national capacity assessment facilitated by the United Nations system through the Capacity for Disaster Reduction Initiative and the United Nations Disaster Assessment and Coor-dination. The recommendations of the assessment were endorsed by the National DRM Committee in February 2017. Following the endorsement, a stake-holder consultation process has been rolled out at national and subnational levels to prioritize actions, assign responsibilities, and agree on budgetary and timeline requirements across institutions, sectors and governance levels.156 Other examples of DRR strategies and plans that were based on comprehensive cross-sectoral capacity assess-ment, include those of Côte d’Ivoire, Georgia, Ghana, Jordan, Sao Tome and Principe, and Serbia.157 In
Sudan, a SWOT (strength–weaknesses–oppor-tunities–threats) analysis laid the foundation for identifying gaps in the DRR policy framework and emphasized the need for the new strategy to better consider the local risk context.158
11.5.3 Engagement with stakeholders
Most plans have been developed through some form of collaborative multisector arrangement. Inter-agency working groups, often linked to a country’s National Platform for Disaster Risk Reduction, or inter-agency coordination mecha-nism, are usually guiding the process with repre-sentation from ministries, departments and other interested parties, such as NGOs, local govern-ments, academia and the United Nations, like in Guatemala, Kyrgyzstan, Montenegro and Peru.159 In Sudan, a dual mechanism of a task force and tech-nical committee provided oversight and strategic guidance.
However, broad engagement is not always a guar-antee for success. For example, in Tabasco, Mexico, the Civil Protection Master Plan of 2011 was devel-oped in a participatory process by representatives of all state government ministries under the leader-ship of the Ministry of Planning. Despite the politi-cal will this process had generated the plan was only partially implemented.160 This indicates that a range of other factors can influence the level of implementation.
There are also countries in which the national DRM authority spearheaded the drafting process, as was the case in Colombia,161 Costa Rica162 and Mozam-bique,163 by seeking inputs on the draft text through consultations in a subsequent step. The Ministry of Local Affairs and Environment was the driving force for the strategy development in Tunisia.
324 Chapter 11

Consultations, workshops and sector or focus group meetings are common features to many countries, although little information is available as to the quality of participation and access of various stakeholder groups, especially those who are “most left behind”. Some countries, such as Kyrgyzstan, also have a requirement to publish new policy instruments publicly for comments before finaliza-tion.166 Yet again, the ability of some stakeholder groups, especially the most vulnerable, to take part in such a process is questionable. Interestingly, countries in the Commonwealth of Independent States see value in the final strategies, and also appreciate the coordinated process to develop such strategies, building on national risk assessments, taking into account likely climate change scenarios, discussing and agreeing on priorities and making explicit linkages to SDGs.167
Apart from the difficulty in ensuring an all-inclusive process that is genuinely a whole-of-government and whole-of-society approach, a real challenge for
developing strategies and plans relates to the lack of awareness of decision makers who are involved in the process, and their lack of knowledge of DRR and its links to development. It is therefore advis-able to accompany DRR strategy and plan devel-opment with training and capacity-development support.
11.5.4 Policy coherence
Overcoming the siloed approaches and duplicative efforts in implementing DRR, climate change and sustainable development stands at the centre of the 2030 Agenda and is also ingrained in the Sendai Framework. In aspiring to tap into synergies among these interconnected policy and practice areas, and to overcome the related competition over resources and power, only a few countries have made good advances on this Sendai Framework requirement.
Case study: Awareness-raising in Tunisia resulted in stronger political commitment towards DRR
In Tunisia, a national debate on DRR started in 2012 thanks to the leadership of the Ministry of Local Affairs and Environment – the national focal point for HFA and the Sendai Framework. To back this debate with all stakeholders, the ministry carried out an analysis on the legal and institutional framework to identify gaps related to DRR. In addition, the ministry set up a database of disaster-related human and
asset losses over 30 years (1983–2013).164 These efforts led to awareness-raising of deci-sion makers about the development challenges emphasized by disaster risks. It also strength-ened political support for the elaboration and adoption of a national strategy for DRR and improved coordination of DRR at national and local levels.165
154 (Colombia 2015)155 (UNDP 2019l)156 (Namibia, Office of the Prime Minister, Directorate Disas-ter Risk Management 2017)157 (UNDP and UNISDR 2018)158 (UNDP 2019j)159 (CONRED 2019); (UNDP 2019f); (UNDP 2019m); (UNISDR 2019c); (United Nations 2014)
160 (Maurizi et al. 2019)161 (Colombia 2015)162 (UNDP 2019d)163 (UNDP 2019g)164 (UNISDR 2019a)165 (UNDP 2019o)166 (UNDP 2019f)167 (UNISDR 2017b)
325

168 (UNDP 2019m)169 (UNISDR 2017d)
170 (Tonga 2018)171 (Mozambique 2017)
building, which is anchored in SDGs and other rele-vant global and regional policy instruments. This is also highlighted as a national good practice case study in section 13.5.2. A key element of Tonga’s second plan, JNAP II, is a strong focus on the devel-opment of sectoral, cluster, community and outer island resilience plans that fully integrate climate resilience and practical on-the-ground adaptation, reduction of GHG emissions and DRR.170 Other countries’ DRR strategies and plans, such as those of Vanuatu and Madagascar, also take account of risks related to climate change. Other positive examples of policy integration, between DRR and CCA, are discussed in Chapter 13.
In Montenegro, the main hindrance noted during development and implementation of the strat-egy was that decision makers and stakeholders did not come with prior knowledge of the fields of DRR, SDGs and climate change, including how these areas interact.168 A spot check of several Sendai Framework aligned strategies and plans has revealed that this requirement is not, or only superfi-cially, met. As noted in section 10.1, and discussed further in section 13.5, this is not the case in the Pacific region. There, FRDP provides high-level strategic guidance to different stakeholder groups on how to enhance resilience to climate change and disasters, in ways that contribute to and are embedded in sustainable development. Under FRDP, Pacific Island governments are called to provide policy direction, incentivize funding to support implementation of coherence initiatives, ensure cross-sectoral collaboration and take measures to gauge progress.169 Tonga’s Joint National Action Plan (JNAP) on CCA and DRM (2018–2028) is one such example of a coherent approach to resilience
Box 11.2. Issues for countries to consider when seeking alignment among DRR and other policy arenas, derived from lessons learned and case studies
(Source: UNDRR 2017)
• Understanding the similarities and differ-ences among CCA, DRR, development objectives, processes and stakeholders.
• Establishing a common ground regarding rationale, objectives, and methodologies, instruments and terminologies.
• Clarifying the administrative set-up for developing CCA, DRR and development planning and agreement on who leads and participates in which mandate. Integrat-ing parts of the administrative set-up if possible.
• Establishing joint or joined-up monitoring and progress reporting of CCA, DRR and development planning.
• Ensuring that the coherence agenda is also pursued at the subnational and local levels.
• Identifying common action and instruments in support of shared policy objectives to reduce disaster risk.
326 Chapter 11

would also be useful to better understand the role of champions, political developments, administra-tive reforms, or the allocation of financing and the extent to which they foster or hinder coherence.
Additional research may be required to identify the specific factors that helped drive the policy alignment process in some countries. The global and regional policy agenda is certainly a support-ing factor, as discussed in Chapters 1 and 10. It
Another example of policy integration is Egypt’s National Disaster Risk Reduction Strategy, which
provides a strong rationale for coherence.
Case study: Policy coherence in Mozambique’s Master Plan for Disaster Risk Reduction 2017–2030
Case study: Policy coherence in Egypt’s National Strategy for Disaster Risk Reduction, 2017–2030
In Mozambique, the Disaster Risk Reduction Master Plan (2017–2030) is aligned with the climate change strategy, as well as with other development policy instruments, which have common mechanisms and indicators have been articulated for the strategies or plans.
Chapter 4 of the plan establishes the National Juridical Context and Public Policies, which articulates linkages with the country’s National Development Plan, the National Agenda 2025: Visão Estratégica de Nação, the National Climate Change Mitigation and Adaptation Strategy 2013–2025, as well as the Sustainable Development Objectives.
National Strategy for Disaster Risk Reduction (NSDRR) Courses for Action identify incorporat-ing DRR into sustainable development policies, particularly the Sustainable Development Strat-egy: Egypt’s Vision 2030, as one of the key focus areas. NSDRR also acknowledges that “disaster risk reduction is better addressed through devel-oping a clearly defined vision as well as specific plans, specializations and tasks and high-level coordination within and across sectors.”
At the level of actions, the plan presents concrete examples through the development of educational approaches integrating risk reduc-tion and CCA (Action 1.1.3), or the creation of mechanisms for ensuring that all projects and programmes relating to poverty reduc-tion, agriculture and rural development take into account access to water, environmen-tal considerations and contributions to the sustainable use of water (Action 2.3.1) as a way to reinforcing resilience.171
The strategy specifically identifies that envi-ronment, agriculture, water, energy, housing and infrastructure sectors are more pertinent for incorporating risk considerations due to their high vulnerability to disasters and under-scores the need for the government to work to mitigate the risks arising from them.
327

As mentioned above, the limited public and private investment in DRR has been a primary reason for the patchy implementation of DRR strategies. This has been the case during the HFA period, and appears to remain an issue also for Sendai Frame-work aligned strategies and plans as risk reduction priorities still compete against other government priorities over scarce resources, rather than being seen as enabling sustainable development and stable economic growth. The limited understanding of risk and how it interrelates with development are obvious culprits.176 But also, powerful disincentives
in countries’ risk governance systems hinder priori-tizing risk reduction. In Indonesia, for example, local governments rely on the national disaster fund and are reluctant to use their provincial budgets for the implementation of DRM.177 Other countries have established similar funds, such as the Mexican Federal Fund for the Prevention of Natural Disas-ters, providing a dedicated funding source for disaster prevention and a tool to central govern-ment to co-finance disaster prevention. The Fund Against the Effects of Natural Disaster in Morocco, under the auspices of the Ministry of the Interior,
Making Cities Resilient in action in Cilicap, Indonesia(Source: Tejas Patnaik, UNDRR)
11.5.5 Overcoming challenges in implementation
Many countries are faced with challenges when it comes to implementation of their DRR strate-gies or plans. The reasons are manifold.172 Some DRR strategies or plans are too general to guide concrete actions. Means of implementation, such as budgets, institutional arrangements, guidelines protocols and multisectoral agreements are not defined, or left for further development after the strategies’ approval.173 In other cases, strategies are
too ambitious and not aligned with existing capaci-ties. Weak managerial capacity for DRR, and low awareness of stakeholders involved in implemen-tation are the most common causes.174 As a result, strategies are not implemented, or only partially so. Therefore, Sudan proactively developed standard operating procedures and a DRR training manual that were adopted by government. Awareness-rais-ing campaigns were also conducted at the federal and state levels, which helped foster trust, under-standing and ownership among involved stakehold-ers.175 Such measures are essential, especially in contexts of insecurity, fragility and conflict.
328 Chapter 11

172 (Omoyo Nyandiko and Omondi Rakama 2019)173 (Amaratunga et al. 2019)174 (Subba 2019)175 (UNDP 2019j)176 (Subba 2019)177 (Give2Asia 2018)
178 (UNDP 2019l)179 (OECD 2017a)180 (OECD 2017a) (Alton, Mahul and Benson 2017)181 (Rozenberg and Fay 2019)182 (Rozenberg and Fay 2019)
is another dedicated tool to finance risk reduction through the State budget. They are usually referred to as being successful in broadening public finance for risk reduction but may carry the danger of over-reliance on these central funds at the expense of co-financing from subnational and sector budgets; noting that the former are usually more constrained than the more affluent sector budgets.
In Tajikistan, the lessons related to the lack of funding for implementing the country’s 2010–2015 DRR strategy led to a phased approach in which three-year plans are to be developed that underpin the new 2018–2030 strategy. In this process, the first year would identify funded and already ongoing actions. The second year would define actions and funding requirements for the following year, and so forth.178
Recommendations in a recent OECD report focus on the establishment of a financial strategy led by the Ministry of Finance or equivalent to support the implementation of DRR strategies and plans.179 The report also recommends assessing financial vulnerabilities, conducting comprehensive risk assessments, developing risk transfer markets and carefully managing the financial impacts from disasters. However, it falls short of explicit language that calls on members and partners to ensure that all investment is “risk informed”. The issue of public and private investment and disas-ter risk is critical as this is the “heavy-lifting” of risk reduction, and it is through investment that the public and private sectors either create new risk or reduce risk. Ex ante investments in risk reduction must be carefully weighted when considering the benefits of risk retention and risk transfer.180
The World Bank’s recent Beyond the Gap report takes the resource discussion to a new level,
advocating strongly for a systems approach that combines infrastructure investment and risk reduc-tion as a much more cost-effective means to manage risk, while also reducing risk from climate change.181 Its key messages include that: low- and middle-income countries can control spending on infrastructure for the same results through improved spending efficiency (with a spending range of between 2% and 8% of GDP); that maintaining infra-structure is central to longer-term efficiency; that with the right policy mix, low- and middle-income countries can achieve the infrastructure-related SDGs with investments of 4.5% of GDP and still be on track to limit climate change to 2°C; and that “infrastructure investment paths compatible with full decarbonization by the end of the century need not cost more than more-polluting alternatives.”182 The message is that risk-informed development is possible for low- and middle-income countries if infrastructure needs, risk reduction, and climate change mitigation and adaptation are all integrated into coherent and system-wide planning and spend-ing policies.
11.5.6 Local-level plans and their implementation
So far, there is little information available on the impact of Sendai Framework aligned strategies in reducing disaster risk on the ground, as most plans have been endorsed only recently, and monitoring and reporting on their implementation are still in progress. However, it has been observed that imple-mentation of national DRR strategies often does not penetrate to the local level. The results of a global survey of local DRR strategies show that among the local governments with DRR strategies, 27.4% have fully implemented the DRR strategies, while most
329

of the cities, accounting for 53.4%, have partially implemented their strategy and 19.2% have not yet started the implementation.183 The reason quoted by 46% of the respondents for incomplete imple-mentation of the strategy was the lack of financial resources, while 22% said it was due to changes in the government and priorities.184
Decentralized DRM systems are generally consid-ered more effective than top-down national approaches, which may enhance power structures at the top and draw the focus away from local concerns and initiatives. Decentralized approaches can contribute to inclusive DRM, a more success-ful identification of people needs, bottom-up plan-ning and empowerment of the local population. It is nevertheless crucial to ensure that DRR remains nationally driven to keep its profile a high priority on the political agenda, ensure countrywide and sectoral coordination, and warrant sufficient allo-cation of resources where necessary.185 Having a system of local strategies and plans that can address territorial DRR priorities and that are, at the same time, well aligned with national DRR and development policy and planning frameworks appears to be the most promising approach.
This has been the case in the province of Potenza186 in Italy, which outlined the #weResilient strat-egy aimed at pursuing territorial development through a structural combination of environmental sustainability, territorial safety and climate change contrasting policies. It presents a “structural” tool for analysing the needs and driving the choices of over 100 local governments and municipalities with a wide strategic point of view and a multilevel holis-tic approach.187 In Vanuatu, the decentralized DRM system was well laid out on paper, with international and local stakeholders working together. However, new NGO actors often found the operational gover-nance system opaque and proper channels elusive. Other factors limiting implementation include the human and physical geography, poor understanding of the causal factors of risk, community disputes and a perceived dependency on aid. It was also noted that while there are bottom-up and top-down approaches to DRM, top-down strategies were more prevalent and that more connection and continuity
between the DRR strategies and stakeholders at different levels was needed.188
Indonesia’s policy of decentralization of 1999 was reflected in the 2007 Disaster Management Law and resulted in the establishment of local disaster management agencies in provinces and districts throughout the country. However, due to gaps in technical knowledge or skills, local government staff struggle to develop DRR plans. Despite receiv-ing training, they are still unclear about what DRR means in practice and how to translate the national policy framework into concrete programmes.189 But there are also more promising reports of how local-level DRR action plans in Indonesia laid the foun-dation for the enactment of local DRM legislation, which had a positive effect on increasing financial allocations for DRR.190
In Bhutan, district disaster management and contingency plans (DMCPs)191 were developed in a bottom-up process and then integrated into the national level DMCP, covering around 50% of districts. The district plans were informed by local assessments of hazards, vulnerability and capac-ity, which were used to generate district-level risk profiles. The plans’ disaster reduction priorities address the four priorities for action of the Sendai Framework. An important aspect of the planning process was the identification of the necessary risk governance arrangements, including the identi-fication of key roles and responsibilities and train-ing of a cadre of newly appointed District Disaster Management Officers. In a next step, DMCPs are being integrated into the districts’ annual devel-opment plans and programmes to muster more support and buy-in for the plans from stakehold-ers.192 Linking local DRR strategies or plans with the development planning system appears to be a promising implementation mechanism that has received increasing traction. In Norway, most municipalities have DRR strategies integrated into local development plans with plans being coherent among local, municipal and national levels.193
330 Chapter 11

183 (Amaratunga et al. 2019)184 (Amaratunga et al. 2019)185 (Subba 2019)186 (Attolico and Smaldone 2019)187 (Attolico and Smaldone 2019)188 (Jackson, Wittand McNamara 2019)189 (Give2Asia 2018, 2)190 (Daly et al. 2019)191 (UNDP 2019b)
192 (UNDP 2019b)193 (UNISDR 2017b)194 (Planitz 2015)195 (Wilkinson, Steller and Bretton 2019)196 (UNDP 2019m)197 (UNDP 2019k)198 (Subba 2019)199 (Subba 2019)
11.5.7 Monitoring
Vague formulations and ambiguous assignment of DRR functions to broad stakeholder groups in DRR strategies can result in overlaps and gaps. This leaves organizations and individuals with an option to withdraw themselves from their responsibilities or to shift them to someone else, making it nearly impossible to hold organizations or individuals accountable for their action or inaction. Even when DRR strategies clearly spell out mandates and roles, the bottleneck may be a lack of awareness or train-ing of stakeholders regarding their roles.194 Agree-ment on assigned roles and responsibilities may require some negotiation in cases of competition over roles, or the reluctance to engage in certain functions that are seen to be too complex or less rewarding.195 To keep strategies at a sufficient strategic level, such detail could be fleshed out in supportive standard operating procedures or similar implementation plans.
When it comes to oversight and reporting on the implementation of DRR strategies and plans, there appears to be a growing number of countries that integrate such a provision. For example, Montene-gro specifies an obligation of the Ministry of Inte-rior to regularly report on implemented activities of all institutions involved.196 The DRR strategy of South Sudan features a dedicated section on Moni-toring, Evaluation, Accountability and Learning.197 In Mozambique, monitoring is part of a national mechanism for the follow-up of the country’s multi-year development plan. Other countries that feature some type of mechanism for follow-up include
Angola, Colombia, Costa Rica and Vanuatu.198 However, a spot check of 10 selected plans showed that only 5 featured follow-up mechanisms.
11.6 Conclusions
Governments have many instruments of public policy at their disposal that can be used to influence the risk-generating or risk-reducing behaviour of the general public, the private, public and voluntary sectors. DRR strategies and plans are only one such instrument, laws and regulations, public administra-tion, economic instruments and social services for example, can also determine the creation, accumu-lation or reduction of risk. Despite the development of such strategies over a span of two decades, it appears that national disaster risk governance systems are often still underdeveloped; this poses potentially a serious constraint on the implementa-tion of the Sendai Framework.199
Examination of the contents of strategies and plans reveals considerable gaps, especially regarding the newer elements introduced in the Sendai Frame-work, such as preventing risk creation, including targets and indicators, and guaranteeing monitoring and follow-up mechanisms. Surprisingly, some of the more established elements are also not consis-tently addressed in the strategies reviewed, such as clear roles and responsibilities, and methods to devise and deliver local strategies.
331

It is nevertheless encouraging to see that there is a growing number of countries which see the value of the process, and are making a greater effort to devise more inclusive and consultative approaches to discuss and agree on their DRR priorities.
At this stage, there is little to report on the level of implementation or impact of Sendai Framework aligned strategies, as many of them have been endorsed only in the last 12–18 months. But there are early indications that the challenges encoun-tered during the HFA decade still apply, despite many good practices and examples. With the 2020 target date fast approaching, and given the role of DRR strategies or plans as key enablers for reduc-ing disaster risk and losses, their development and implementation in line with the Sendai Framework needs to be made an urgent priority at country level.
332 Chapter 11

Chapter 12: Disaster risk reduction integrated in development planning and budgeting
12.1 The importance of integrating disaster risk reduction in development planning
Development can be a major driver of disaster risk, for example when it results in populations and economic assets being located in exposed geographic areas; in the accumulation of risk in urban areas due to rapid and unplanned develop-ments; when it places excessive strains on natural resources and ecosystems; and when it exacer-bates social inequalities if the income-generating
opportunities for some population groups is curtailed. Therefore, risk should be seen as a normal and inseparable part of economic activities and development, as something built into particular development pathways and practices, constructed through day-to-day decisions by those who have a stake in particular patterns of development. Disas-ter risk is thus a social construct conditioned by each society’s perceptions, needs, demands, deci-sions and practices.200
As presented in previous GARs and reiterated in this edition, it is time to cast off the notion that risk is exogenous to development, something that can be reduced simply by complementing development
200 (Lavell and Maskrey 2013)
333

with risk reduction measures.201 Integrating (also termed mainstreaming) risk reduction must be driven from within key development sectors to ensure that specific sectoral vulnerability can be assessed, and risk management institutionalized in the policymaking, planning, project cycle and invest-ment planning processes. The integration of DRR into development planning and budgeting is there-fore predominantly a governance process. It needs to ensure that development is risk informed to improve the safety of people and critical facilities, to protect the natural and built environment, and to build resilient livelihoods and economic activ-ity. Although risk governance is a multi-stakeholder task, governments have an exemplary role as risk avoiders providing public goods and services by refraining from actions that generate risk.202
The practical relationship between disaster risk and development therefore provides the core ratio-nale for integrating DRR into development planning and budgeting.203 However, the need to address the development-based drivers of risk, and the acceptance that disaster risk is a symptom of unsustainable maldevelopment, have yet to fully
permeate conventional DRR and development policy and practice.
Avoiding the creation and propagation of risks that occur through flawed development pathways, can best be addressed through prospective and correc-tive DRM measures; both of which require systems-based approaches to managing risk. Prospective measures to prevent or reduce risk creation can be combined with corrective DRM efforts that reduce the level of existing risk (e.g. through retro-fitting of critical infrastructure such as schools or hospitals). Compensatory risk management activi-ties also have a role in strengthening the social and economic resilience of individuals and societ-ies in the face of residual risk (the remaining risk that cannot be effectively eliminated), for example through preparedness, response and recovery activities, contingent credit, insurance and safety net programmes that are designed to help affected populations mitigate disasters or recover from their impacts. The Sendai Framework supports all of these approaches, but as part of a holistic approach, not as a set of alternatives or options.
Figure 12.1. The 2030 Agenda recognizes DRR as central to sustainable development
(Source: UNDRR 2019)
334 Chapter 12

201 (Lavell and Maskrey 2013); (Aysan and Lavell 2015); (UNDP 2017c)202 (Wilkinson, Steller and Bretton 2019)203 (UNDP 2017c)204 (United Nations General Assembly 1989)
205 (IDNDR 1994)206 (United Nations General Assembly 1999)207 (UNISDR 2017d); (Aysan and Lavell 2015)208 (UNISDR 2013b); (UNISDR 2015c)209 (United Nations 2015a)
As risk is increasingly multifaceted, integrating DRR into development planning and practice needs to consider multiple and intersecting threats. Risks associated with natural hazards can manifest in conjunction with man-made hazards, epidemics, conflict or economic shocks for example, which can interact, cascade and amplify impact across sectors, geographies and scales. Pursing integra-tion solely from a DRR angle is therefore unlikely to achieve the targets and indicators of the Sendai Framework and SDGs. There is agreement however that the realization of SDGs will depend on the successful implementation of the Sendai Frame-work and the Paris Agreement. Success therefore hinges on the ability of decision makers to realize risk-informed development, so driving integrated DRR approaches, different aspects of which can also be described as policy coherence, integrated risk governance and systemic risk reduction.
12.2 The Sendai Framework and integrating disaster risk reduction in development
12.2.1 Scope of the Sendai Framework
Integrating DRR into development planning and budgeting is not a new goal in global policy processes.
It was already part of the 1989 resolution on IDNDR,204 the 1994 Yokohama Strategy and Plan of Action,205 the 1999 ISDR,206 and of course HFA.207 HFA called for reducing underlying risk factors to address disaster risk in sectoral development planning and programmes as well as in post-disaster situations, yet the integration of DRR into policy and legal instruments remained at a nascent stage in most countries by the end of the HFA decade. Even where this had occurred, progress in implementation was limited according to HFA monitor reports.208
The Sendai Framework commits Member States to address DRR within the context of sustainable development and poverty eradication, and to inte-grate DRR into policies, plans, programmes and budgets at all levels. It states that effective DRM, addressing underlying risk drivers through risk-informed public and private investments, contrib-utes to sustainable development. It recognizes the importance of integrating DRR within and across all sectors of development to achieving disaster and climate risk-informed development.209
The Sendai Framework highlights several specific entry points that can be pursued to foster the inte-gration of DRR into development. For example, inclusive risk-informed decision-making that is based on the exchange and dissemination of disag-gregated data is included under the Sendai Frame-work principles. Priority for Action 2 recognizes that strengthening disaster risk governance is a means to foster collaboration and partnership across mechanisms and institutions for the implemen-tation of sustainable development. It specifically mentions that integrating DRR into development requires national and local frameworks of laws, regulations and public policies to define roles and responsibilities and to guide the public and private sectors. Priority for Action 3 calls for integrat-ing disaster risk assessments into land-use policy
335

development and implementation, including urban planning, land degradation assessments, and infor-mal and non-permanent housing, as well as into rural development planning and management of various ecosystems. Priority for Action 4 stresses the need to: (a) incorporate DRM into post-disaster recovery and rehabilitation processes; (b) facilitate the link between relief, rehabilitation and develop-ment; and (c) use opportunities during the recovery phase to develop capacities that reduce disaster risk, including through land-use planning, improving structural standards and others.210
Compared with HFA, the Sendai Framework places a much greater focus on the drivers of disaster risk, such as poverty, climate change, improper land-use planning, environmental degradation, weak building codes and governance, which also under-mine sustainable development. However, the calls to curb the creation of new risk through informed development practice and investment that priori-tizes long-term risk reduction are what truly sets the Sendai Framework apart from its predecessor. As discussed in section 11.5.5, the World Bank contends that such risk-informed development is possible in low- and middle-income countries – particularly in respect of infrastructure develop-ment – through more efficient spending based on system-wide policies.211
As elucidated in Part I of this GAR, the Sendai Framework also has a much wider scope in terms of the hazards it covers (natural, man-made, envi-ronmental, biological and technological) and the types of disasters (slow and fast-onset, extensive and intensive disasters), while also widening the spectrum of actors it includes.212 This is intended to facilitate integration of DRR practices into sectors in a way that is more conducive to the systems think-ing required for risk and loss to be reduced and resilience strengthened, and mobilize development actors as architects and vehicles of risk reduction. The Sendai Framework thus has the potential to simultaneously transform the risk landscape and facilitate accelerated achievement of the goals and targets of the climate change and SDG agendas.
12.2.2 Disaster risk reporting under the Sustainable Development Goals
Integration post-2015 is not unidirectional. All 46 Member States that presented voluntary national reviews of progress in achieving SDGs at the United Nations HLPF in 2018 included disaster-related information, with many highlighting the importance of implementing different risk reduction measures. These elements are reported differently by differ-ent countries. Some focused on identifying hazards, and others described their understanding and effort in implementing the Sendai Framework, relating their work on DRR to a specific SDG.
As discussed in Part II of this report, within the 2030 Agenda, SDGs 1, 11 and 13 include explicit risk reduction indicators for measuring prog-ress in achievement. However, with the scope of Sendai Framework hazards and risks ranging from the biological, to environmental, to technological processes and phenomena, many of the other goals are of relevance.213
This is propelling the development of integrated approaches, in implementation, monitoring and reporting. The Philippines and Mexico are harmo-nizing processes and methods to enable coherent implementation of the Sendai Framework, NUA, the Paris Agreement and the 2030 Agenda at the national level. The Department of the Interior and Local Government of the Philippines is harmonizing risk assessment approaches and planning guide-lines of different ministries, to provide clear guid-ance to local government units on the prioritization of measures and planning that take climate and disaster risks into consideration (e.g. in public build-ing codes). In Mexico, the Ministry of Finance and Public Credit is being supported to develop method-ologies and processes for prioritizing the projects that require an in-depth disaster risk analysis, and for integrating risk mitigation and CCA measures into prioritized projects. Additionally, Mexico is integrating the requirements of the Sendai Frame-work into the National Agenda for Sustainable Development.214
336 Chapter 12

210 (United Nations 2015a)211 (Rozenberg and Fay 2019)212 (United Nations 2015a)213 (UNISDR 2015f)214 (Steinich 2018)
215 (UNDP 2010)216 (SPC et al. 2016)217 (Aysan and Lavell 2015)218 (UNDP 2019h)219 (Lassa 2019); (Wilkinson, Steller and Bretton 2019); (Hamdan 2013)
12.3 Country experiences with integrating disaster risk reduction into development planning and budgeting
Integrating DRR into development strategies and plans is complex and highly context specific. Coun-tries are pursuing a range of different entry points in their quests to undertake risk-informed develop-ment, and there is no single blueprint plan. Instead, learning and sharing from experience, including from other cross-cutting issues, has been of great value. Mainstreaming is a dynamic process that aims to understand risk at the heart of develop-ment decisions in policymaking, planning, budget-ing, programming, implementation, monitoring and evaluation at national, sectoral and subnational levels, rather than seeing risk management as an add-on.215 Since development does not follow a linear path, it is important to be sufficiently flexible to seize the opportunity to undertake risk-informed development when and where the political economy is ripe.
DRR mainstreaming at the local and subna-tional levels encounters similar challenges and constraints as at the national level, but there are often more pronounced gaps in resources and capacities. For local-level mainstreaming efforts to be successful and take root, they are best
pursued as part of a wider national undertaking that spans all scales of government administration, several sectors and groups of stakeholders. Joint approaches in mainstreaming of related cross-cutting issues, such as DRR, climate adaptation and gender equality, are also likely to result in more cohesive and effective action.
Experiences with DRR mainstreaming vary consid-erably among countries with federal or centralized systems, and small or geographically dispersed countries. In many resource-constrained contexts, such as the Pacific Island countries, integrated approaches to DRR and climate adaptation have gained much traction (e.g. in the Framework for Resilient Development in the Pacific: An Integrated Approach to Address Climate Change and Disaster Risk Management).216 Some urge caution, warning of the risk of overburdening already strained capaci-ties.217 In Fiji, risk reduction was integrated within approaches mainstreaming the already familiar themes of gender and social inclusion. Familiar-ity with such mainstreaming approaches promoted acceptance of the concept by those involved, who could easily identify the people more affected by climate change and disaster.218
Several analyses of DRM and its relationship to development and overall governance suggest that as a general rule the higher the level of development in a country, the greater the progress made in incor-porating DRR into development pursuits.219
In the following sections of this chapter, country-level experience is examined according to the five entry points for integrating DRR into develop-ment planning and budgeting shown in Box 12.1. Although these are presented as separate entry points for analysis, they are, of course, interrelated.
337
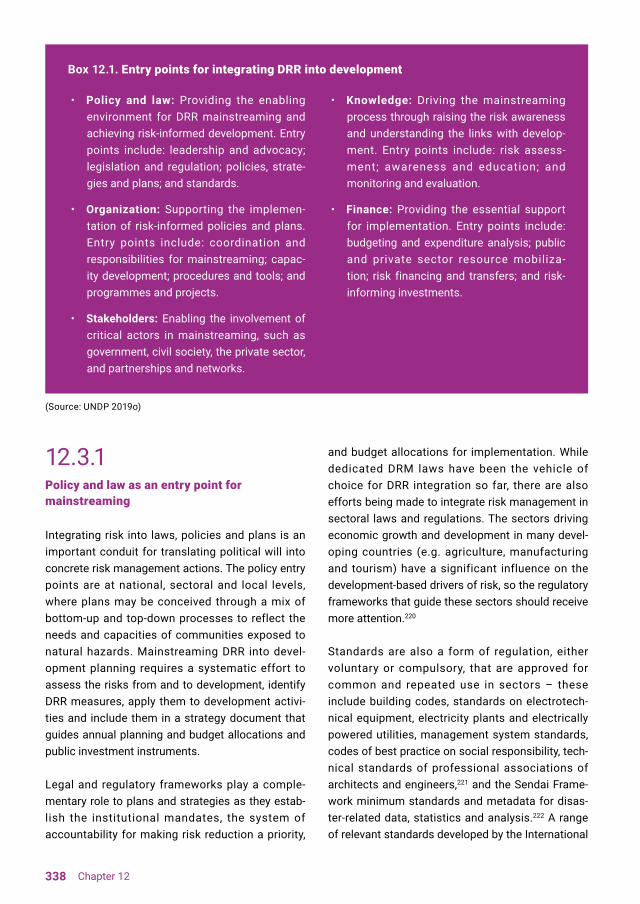
12.3.1 Policy and law as an entry point for mainstreaming
Integrating risk into laws, policies and plans is an important conduit for translating political will into concrete risk management actions. The policy entry points are at national, sectoral and local levels, where plans may be conceived through a mix of bottom-up and top-down processes to reflect the needs and capacities of communities exposed to natural hazards. Mainstreaming DRR into devel-opment planning requires a systematic effort to assess the risks from and to development, identify DRR measures, apply them to development activi-ties and include them in a strategy document that guides annual planning and budget allocations and public investment instruments.
Legal and regulatory frameworks play a comple-mentary role to plans and strategies as they estab-lish the institutional mandates, the system of accountability for making risk reduction a priority,
and budget allocations for implementation. While dedicated DRM laws have been the vehicle of choice for DRR integration so far, there are also efforts being made to integrate risk management in sectoral laws and regulations. The sectors driving economic growth and development in many devel-oping countries (e.g. agriculture, manufacturing and tourism) have a significant influence on the development-based drivers of risk, so the regulatory frameworks that guide these sectors should receive more attention.220
Standards are also a form of regulation, either voluntary or compulsory, that are approved for common and repeated use in sectors – these include building codes, standards on electrotech-nical equipment, electricity plants and electrically powered utilities, management system standards, codes of best practice on social responsibility, tech-nical standards of professional associations of architects and engineers,221 and the Sendai Frame-work minimum standards and metadata for disas-ter-related data, statistics and analysis.222 A range of relevant standards developed by the International
Box 12.1. Entry points for integrating DRR into development
(Source: UNDP 2019o)
• Policy and law: Providing the enabling environment for DRR mainstreaming and achieving risk-informed development. Entry points include: leadership and advocacy; legislation and regulation; policies, strate-gies and plans; and standards.
• Organization: Supporting the implemen-tation of risk-informed policies and plans. Entry points include: coordination and responsibilities for mainstreaming; capac-ity development; procedures and tools; and programmes and projects.
• Stakeholders: Enabling the involvement of critical actors in mainstreaming, such as government, civil society, the private sector, and partnerships and networks.
• Knowledge: Driving the mainstreaming process through raising the risk awareness and understanding the links with develop-ment. Entry points include: risk assess-ment; awareness and education; and monitoring and evaluation.
• Finance: Providing the essential support for implementation. Entry points include: budgeting and expenditure analysis; public and private sector resource mobiliza-tion; risk financing and transfers; and risk-informing investments.
338 Chapter 12

220 (IFRC and UNDP 2014b); (IFRC and UNDP 2014a)221 (Jachia 2014)222 (UNISDR 2018c)
223 (ISO 2018)224 (ISO 2019)225 (ISO 2019)
Organization for Standardization (ISO) also exist, including Environmental Management Systems (the ISO 14000 family of standards), the new ISO Risk Management Guidelines (ISO 31000:2018) and Societal Security Emergency Management (ISO 22320:2011), which includes risk manage-ment as an “integral part of business”.223 There are
standards indicate which SDGs they contribute to, and their use will require a high level of policy coher-ence and integrated implementation.
As sectoral standards are often market driven and developed to respond to requests from industry or
highly relevant new ISO standards under develop-ment under the category of “Sustainable cities and communities”, which are close to being launched. Sustainable cities and communities – indicators for resilient cities (ISO 37123)224 and Sustainable cities and communities – indicators for smart cities (ISO 37122)225 are the most relevant to urban DRR. These
consumer groups, governments or regional organi-zations and administrations, they tend to command a high degree of ownership, which facilitates compliance. Ultimately, political leadership and advocacy to create the political will to reduce risk must go hand in hand with self-regulation – through
Flooding in Philippines (Source: Mathias Eick EU/ECHO)
339

mechanisms such as standards and community leadership – to drive and eventually absorb the inte-gration approach.226
Country experiences
In Kenya, DRR was successfully integrated as a cross-cutting issue to be addressed in nine thematic areas and sectors in the Second and Third Medium Term Development Plans (2013–2017 and 2018–2022). A new National Disaster Risk Management Policy was approved in 2018 – which is currently being translated into an act of parlia-ment – demanding various sectors to integrate DRR into the sectoral planning process at national and subnational levels.227 The policy was initially cham-pioned by the Ministry of Planning, and then taken
on by the National Disaster Risk Reduction Plat-form, which has a wider representation from techni-cal ministries, academia, United Nations agencies and civil society. A key lesson from the Kenya expe-rience has been that high-level political goodwill is a prerequisite for success. The support of the Kenyan President for the Sendai Framework and the involve-ment of the Parliament and Senate by identifying focus politicians were key factors in the push for legislation.228
The five-year National Socio-economic Develop-ment Plan VIII (2016–2020) of Viet Nam, and the Philippines Development Plan (2017–2022) consider DRR as a main cross-cutting concern. Such integration will increasingly help to mobi-lize required financial resources for national and subnational government bodies to implement
Clean up work in Kisumu, Kenya (Source: Tejas Patnaik /UNDRR)
340 Chapter 12

226 (UNDP 2019o); (La Trobe and Davis 2005)227 (Kenya 2018) 228 (Omoyo Nyandiko and Omondi Rakama 2019)229 (Maeda, Shivakoti and Prabhakar 2019)230 (UNDP 2019o)231 (Maeda, Shivakoti and Prabhakar 2019)232 (UNDP 2019a)
233 (Costa Rica, Ministerio de la Presidencia 2019); (Costa Rica n.d.)234 (UNDP 2019e)235 (UNDP 2019p)236 (UNDP 2019g)237 (UNDP 2019c)
programmes and projects addressing DRR.229 In Tunisia, DRR, was for the first time, explicitly intro-duced in the five-year development plan for 2016–2020 under a chapter on green growth.230 Indonesia is another example of advanced DRR mainstream-ing practice, where the National Development Plan-ning Agency took the lead in integrating DRR into Indonesia’s Mid-Term Development Plan 2010–2014, as one of nine development priorities.231 The national DRM law in Armenia mandates all develop-ment processes in the country and all development sectors to integrate disaster risk considerations.232
The legal basis for DRR mainstreaming was also a decisive factor in Costa Rica, where the 2005 National Law on Emergencies and Risk Preven-tion considers DRM as a cross-cutting issue to all development practices, requiring that all institu-tions must plan and budget for disaster prevention and preparedness. As a consequence, an increas-ing number of public services in Costa Rica now carry out risk assessments and adopt measures to control risk. To date, 10 public policies related to planning and investment in different sectors (urban, rural and natural resource management) have benefited from DRR mainstreaming. The scope of integration is significant; they include: the National Development Plans for 2014–2018 and 2019–2022; the National Housing and Human Settlements Policy and Plan; the National Policy of Territorial Organization; the National Urban Devel-opment Policy; the National Wetlands Policy; the National Health Policy; the National Policy of Adap-tation to Climate Change; the National Public Invest-ment Plan; the National Water and Sanitation Policy; and the Risk Management Strategy of the Educa-tion Sector.233 Recognizing that municipalities have a particularly central role in risk management, the Government of Costa Rica also strongly advocates
integration of risk management into local planning instruments, rather than developing stand-alone local risk management plans.234
Uganda pursued the mainstreaming process through an integrated approach that encompassed DRR and climate adaptation into development plan-ning. Both issues are recognized in the Resilience and Disaster Risk Management Strategic Frame-work and Investment Program 2015, which will operationalize the country’s National Development Plan 2015–2020. DRR and CCA have also been integrated into Uganda’s National Building Control Regulations and the National Urban Policy, which reaches over 1.2 million people with its safety measures. In 2018, the National Development Plan was being reviewed to assess the impacts of disas-ters during its implementation period, which will provide recommendations for the development of the third National Development Plan.235
In Mozambique, DRR is considered an integral part of the National Strategy for Climate Change Adap-tation and Mitigation (2013–2025), which has 13 strategic actions that are expected to guide adapta-tion and DRR measures. Subsequent to the national plan, DRR and CCA have been mainstreamed into district planning and budgeting systems in the eight key sectors of agriculture, health, water, social protection, roads, the environment, meteorology and energy.236 Bosnia and Herzegovina also approached DRR and CCA mainstreaming in an integrated way by making it a mandatory part of the country’s stra-tegic planning process through its Law on Develop-ment Planning and Management.237 By using the existing development planning process for DRR integration that built on agreed methodologies and organizational frameworks, the issue is now main-streamed into 23 local and 8 cantonal development
341
strategies. The standard planning process was complemented by risk assessments and enforced with guidelines on DRR mainstreaming.238
Indonesia, the Philippines and the province of Potenza in Italy are also integrating resilience, DRR and CCA concepts into local development and land-use planning.239 However, experiences are mixed. For example, in Indonesia, the 2007 Disas-ter Management Law made subnational govern-ments at provincial, district and subdistrict levels responsible for DRR integration into development programmes, requiring them to allocate sufficient funding to do so. Pilot projects on DRR planning were implemented at the community level, which were expected to feed into village level develop-ment plans, which were to inform development planning processes at the subdistrict and district level. However, these efforts have had low rates of success due to limited involvement of executive and legislative bodies of district and subdistrict governments, etc.240 of the sectoral integration of DRR into development may have originated in the education and agriculture sectors. Madagascar has been one of the first countries to have integrated DRR into the education sector. In 2006, a student manual and a teacher’s guide on integrating DRR into the school curriculum were developed and are being updated. The Ministry of Education is also committed to strengthening the resilience of the education system and has established a depart-ment for DRM within the Directorate of Educational Planning. This has been complemented by capac-ity-building support for the Heads of the Regional Directorates of National Education.241
In a subsequent wave, other key development sectors have been selected for mainstreaming activities such as health, infrastructure, tourism, urban planning and housing. While numerous sectoral mainstreaming tools and guidelines have been developed, aside from the agricultural and infrastructure sectors, very few systematic analy-ses of the experiences and lessons learned have been carried out.242 One such study in South-ern Africa found that DRR mainstreaming across sectors appears to be generally low, except within climate change policy. Key sectors such as health
and education rarely refer to global, regional or national policy frameworks for DRR. Nonetheless, because of the nature of their mandate, health sector policies and strategies in Southern Africa implicitly incorporate risk reduction tools and activi-ties, undertaking risk assessments, prevention activities (for example, for malaria), conducting disease surveillance, early warning and emergency management.243
An interesting angle on sectoral mainstreaming has taken root in the agricultural sector in several coun-tries, where complementary planning processes on DRR, climate adaptation and agriculture are being promoted in a three-pronged approach that entails: (a) integrating DRR into agricultural sector plans; (b) designing dedicated DRR plans for the agricul-tural sector; and (c) prioritizing agricultural risk management practices in national DRR strategies and plans (case study countries included Belize, Cambodia, Democratic People’s Republic of Korea, Dominica, Guyana, Jamaica, Lao People’s Demo-cratic Republic, Nepal, Paraguay, Philippines, Saint Lucia, Saint Vincent and the Grenadines, Serbia and Zimbabwe).244 This is exemplified by the Coconut Risk Management and Mitigation Manual for the Pacific Region, and related training. Supported by an integrated planning approach and developed by the Pacific Community and development partners, it takes into account CCA, DRR and business continu-ity risk management in the production and market dimensions of this key industry for the region.245
Space for cross fertilization among different government planning processes on DRR must be created and timelines coordinated to ensure DRR take-up in the different planning documents that have pre-set time frames such as agricultural sector development plans. This highlights how planning for DRR in a sectoral context is not an isolated process; it should link to and complement other sectoral planning processes, such as those related to NAPs, NDCs or similar.246
342 Chapter 12

238 (UNDP 2019c)239 (Attolico and Smaldone 2019); (Maeda, Shivakoti and Prabhakar 2019)240 (Hillman and Sagala 2012)241 (Maeda, Shivakoti and Prabhakar 2019)242 (Koloffon and von Loeben 2019); (United Nations Economic Commission for Africa 2015); (UNDP 2018c)243 (United Nations Economic Commission for Africa 2015) 244 (Koloffon and von Loeben 2019) 245 (SPC Land Resources Division 2018)
246 (Koloffon and von Loeben 2019)247 (UNDP 2010)248 (Benson and Twigg 2007)249 (Lassa 2019); (Hyden, Court and Mease 2003)250 (UNDP 2010)251 (UNISDR 2015e)252 (UNISDR 2013a)253 (UNDP 2016a)254 (Nelson et al. 2010)255 (UNDP 2019c)
12.3.2 Organization as an entry point for mainstreaming
For DRR mainstreaming to take root, a change in organizational culture is required,247 as accom-panied by the institutionalization of risk manage-ment process in the procedures, tools and project management cycle of public and private sector organizations.248 Examples include risk screening tools for sector planners, or checklists in approval mechanisms that integrate risk. Such measures facilitate the implementation of risk-informed projects and programmes that build disaster and climate resilience. The organizational entry point for integrating DRR into development planning is signif-icantly determined by the organization’s broader institutional and governance challenges. Estab-lished bureaucratic procedures can be very chal-lenging to reform.249
A lack of personnel, expertise and capacity to opera-tionalize DRR mainstreaming has been a bottleneck in many countries, especially when the mainstream-ing process moves to the subnational level.250 It is of paramount importance that staff are aware of their roles and have the commensurate technical and management capacity to conduct their assigned risk management functions and drive the main-streaming process. To be effective, capacity devel-opment needs to move beyond traditional training approaches and support more sustained changes in behaviour.251 Other stakeholders (e.g. civil society, communities, the private sector and contractors) need to be equipped with mainstreaming know-how, in addition to public planners and sectoral staff.
The interdisciplinary nature of DRR demands that coordination and collaboration arrangements among a wide group of government and non-government stakeholders should be established with roles clarified. National Platforms for Disaster Risk Reduction or National Disaster Risk Reduction Committees should be go-to mechanisms, but have so far been only modestly effective in promoting DRR mainstreaming.252
Country experiences
While there are many mainstreaming tools and approaches,253 mainstreaming DRR effectively into planning processes and project cycles is still a chal-lenge resulting in scattered implementation of DRR measures. However, there is a growing number of countries that have made strides in this direction.
In Ghana, a Guidebook on Integrating Climate Change and Disaster Risk into National Develop-ment, Policies and Planning was already devel-oped in 2010. The guidebook suggests a five-step process to integrate CCA and DRR into the planning process at the district level, resulting in projects or programmes now being included within the district composite budgets.254 Bosnia and Herzegovina pursued DRR mainstreaming through the existing development planning process by way of agreed methodologies and organizational frameworks supported by DRR mainstreaming guidelines.255
In the ASEAN region, Member States have agreed on a “plan–do–check–act” (PDCA) cycle for DRR which incorporates climate change impacts consisting of five stages: institutional and policy
343
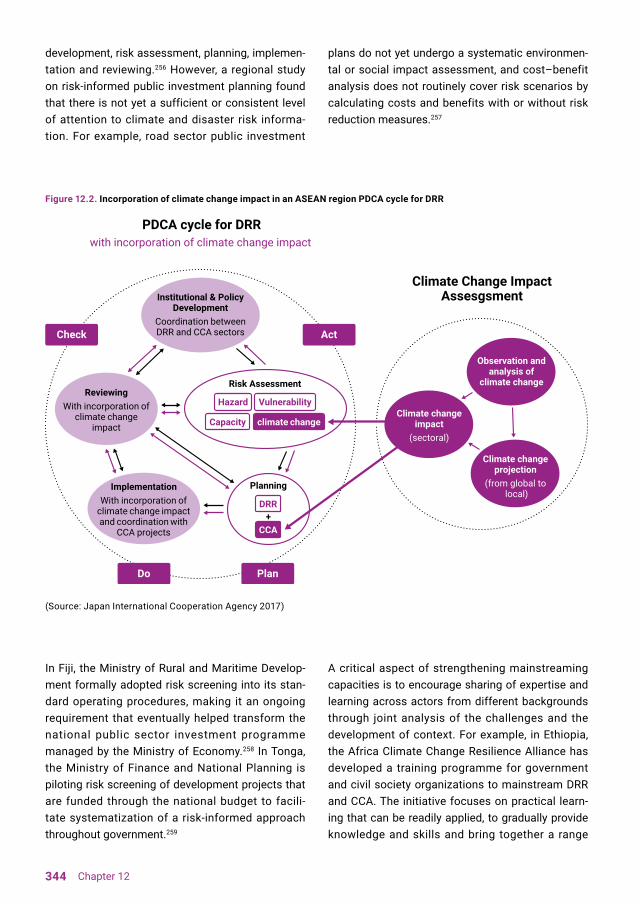
+
development, risk assessment, planning, implemen-tation and reviewing.256 However, a regional study on risk-informed public investment planning found that there is not yet a sufficient or consistent level of attention to climate and disaster risk informa-tion. For example, road sector public investment
In Fiji, the Ministry of Rural and Maritime Develop-ment formally adopted risk screening into its stan-dard operating procedures, making it an ongoing requirement that eventually helped transform the national public sector investment programme managed by the Ministry of Economy.258 In Tonga, the Ministry of Finance and National Planning is piloting risk screening of development projects that are funded through the national budget to facili-tate systematization of a risk-informed approach throughout government.259
plans do not yet undergo a systematic environmen-tal or social impact assessment, and cost–benefit analysis does not routinely cover risk scenarios by calculating costs and benefits with or without risk reduction measures.257
A critical aspect of strengthening mainstreaming capacities is to encourage sharing of expertise and learning across actors from different backgrounds through joint analysis of the challenges and the development of context. For example, in Ethiopia, the Africa Climate Change Resilience Alliance has developed a training programme for government and civil society organizations to mainstream DRR and CCA. The initiative focuses on practical learn-ing that can be readily applied, to gradually provide knowledge and skills and bring together a range
Figure 12.2. Incorporation of climate change impact in an ASEAN region PDCA cycle for DRR
(Source: Japan International Cooperation Agency 2017)
344 Chapter 12

of participants with different expertise and from a variety of agencies.260
In Uganda, a key starting point for integrated mainstreaming of DRR and adaptation at subdis-trict level was sharing good practice among local governments. District DRM committees headed by the Chief District Administrative Officer brought together stakeholders to discuss and understand the potential threats, hazards, disaster-prone areas and identification and mobilization of resources to implement DRR options. The discussions drew on information from Uganda’s damage and loss database that has 30 years of historical data. The capacity-development approach was also comple-mented by training local-level planning officials on the use of risk information in development planning.261
In Kenya, the DRR mainstreaming process was initially championed by the Director of Planning, who provided decisive leadership. A system-atic training programme on integrating DRR into development planning was implemented through the Ministry of Devolution and Planning. Partici-pants in the training included policymakers, plan-ning officers, DRR focal points from different line ministries, military and police officers, emergency service providers, civil society members, humanitar-ian workers and interested members of the public. Of particular note is the training of County Devel-opment Planning Officers from all 47 counties in Kenya, which was an important enabler of the inte-gration of DRR into the development plans of some counties.262
In Indonesia, the National Development Planning Agency offers two-week training for national and local government officials on integrating DRR and climate change concepts into local development
plans.263 Other examples of training at the local level are found in the agricultural sector in Indonesia, Myanmar and the Philippines, where farmers are provided with location-specific weather and rainfall forecasts, and are trained to use this information to increase crop yields.264
Establishing DRR focal points in sectoral depart-ments as a vehicle for advancing sectoral main-streaming has yielded mixed results globally. This has proved successful in a regional programme in the Pacific where full-time senior government posts were established in ministries – such as local government, agriculture, finance and plan-ning, and women’s affairs – in Fiji, the Solomon Islands, Tonga and Vanuatu.265 The posts were important for building in-house capacity to drive and sustain risk-informed development within subnational development planning. They also iden-tified existing and new development projects that were at risk from disaster or climate change, or that could inadvertently drive risk accumulation.266 In some cases, these posts resulted in new institu-tional arrangements for resilience, such as the Risk Resilience Unit embedded in Vanuatu’s Ministry of Agriculture. Most of these posts were permanently adopted within public service within a period of one to two years. Initial coaching through the regional programme is gradually being replaced by peer to peer networks that enable in-country and regional learning.
The expectation that National Disaster Risk Reduc-tion Platforms would be able to advance the DRR mainstreaming agenda has not materialized as hoped. For instance, a 2013 review showed that more than half of the national platforms surveyed did not address public investment or risk trans-fer options within their work. Only 35% assisted stakeholders with the integration of risk-sensitive
256 (Maeda et al. 2018); (Japan International Cooperation Agency 2017)257 (UNDP 2018c) 258 (UNDP 2019h)259 (Tonga 2018)260 (Twigg 2015)
261 (UNDP 2019p)262 (UNDP 2019e); (Omoyo Nyandiko and Omondi Rakama 2019)263 (Maeda, Shivakoti and Prabhakar 2019)264 (Maeda, Shivakoti and Prabhakar 2019)265 (UNDP 2019h); (Tonga 2018); (UNDP 2019i); (UNDP 2019q)266 (UNDP 2019h); (Tonga 2018); (UNDP 2019i)
345

analysis of public investment systems and the use of financial mechanisms to reduce or transfer risk.267 However, there are numerous examples of cross-agency collaboration in DRR mainstream-ing. One such example is in Ghana, where the inte-gration of DRR and climate adaptation into district development plans has become a collaborative effort of the Environmental Protection Agency, NDMO and the National Development Planning Commission. The process began with district and local assemblies validating the approach and was followed up by systematic training. Despite such progress, implementation in Ghana has been chal-lenged by limited funding at district level.268
Cross-sectoral coordination is also being strength-ened in the Philippines where the National Disaster Risk Reduction and Management Council and the Climate Change Commission have a memorandum of understanding for effective cooperation and collaboration.269 In Viet Nam, the General Depart-ment of Disaster Prevention and Control under the Ministry of Agriculture and Rural Development coor-dinates effectively with other departments in charge of management of flood risks, water resources, agriculture and forestry within the ministry.270 Yet some national DRM lead agencies – that have long fought for adequate status and resources – find it difficult to “relinquish power and resources” linked to DRR to other departments. This has restricted institutional and organizational change in some countries.271 Fiji, the Solomon Islands, Tonga and Vanuatu have all recognized that mainstream-ing requires: horizontal collaboration – by linking central with sectoral planners across key develop-ment sectors; vertical collaboration – by linking national with subnational and community levels; and diagonal collaboration – by linking sectors, including the private sector, with local and commu-nity levels.272
12.3.3 Knowledge as an entry point for mainstreaming
Knowledge is a critical component of any main-streaming process. The ability to make a strong case for the link between disaster risk and devel-opment and to provide the evidence base for risk-informed development hinges on having access to risk information and knowledge. This entry point also encompasses public education and aware-ness campaigns to build a common understanding of why mainstreaming is important, and to secure the buy-in of policymakers and other stakeholders to mobilize the resources and capacities needed. In addition, DRR knowledge should be integrated into the curricula of schools, universities, and public and professional training institutes. Formal education and training are key entry points for mainstreaming.
Knowledge related to risk assessment deserves special attention as the foundation for developing a shared vision of what needs to be done. Informa-tion on the nature and extent of hazards, vulnerabili-ties, and the magnitude and likelihood of potential damage and loss needs to expand from single-hazard to multi-risk assessments to capture the range of intersecting threats. For example, address-ing desertification and drought risk in Sudan needs solutions that take into consideration the factors that result in heightened competition over land and resources between settled cultivators and nomadic pastoralists.273
Integrating risk management into development decision-making and the roles of development actors requires a good appreciation of the wider development context, the political economy and how it supports or hinders DRR.274 As outlined above, effective mainstreaming of DRR requires a sustained commitment that needs to be nurtured over time. The ability to evaluate the impact of DRR integration through good monitoring and evalua-tion systems is therefore vital, albeit challenging, because measuring the avoided or reduced risk is not an easy task.275 Monitoring compliance with legal frameworks, including land-use regulations
346 Chapter 12

and building codes, can provide an insight into how DRR measures can make a difference. However, blurred lines of accountability between the many stakeholders involved often hampers such monitor-ing and compliance.276
Country experiences
In the ASEAN region, most countries have prepared hazard and risk maps for floods, storms and land-slides. However, the scale, including topographic data, often does not provide enough information for detailed quantitative risk assessment, land-use planning, evacuation planning and the design of prevention and mitigation measures.
Several countries are integrating climate change impacts when developing risk maps. For example, Indonesia, Malaysia, the Philippines, Singapore and Viet Nam are using climate data downscaled from global climate models for risk mapping and plan-ning for DRR and CCA. However, countries are also struggling to use this type of climate risk informa-tion due to the high level of uncertainty of global climate projections and a lack of standardized guidelines for incorporating the information into planning and implementation processes.277
Several countries have made impressive progress in the application of risk information in policy and planning processes. The Rwanda National Risk Atlas provides a comprehensive assessment of existing risks at the national and local level across the country’s 30 districts.278 The atlas features sex-disaggregated data on population exposure to risks related to earthquakes, landslides, storms
and drought. Since its launch in 2015, the risk atlas has shaped the government’s DRR agenda and has contributed to updating the national and district land-use master plans, the Rwanda Building Code and district development plans.279
Uganda has also recognized that building a credible risk knowledge base is a driving force for change at policy and local levels. Since 2013, the government has developed hazard, vulnerability and risk profiles for all of the country’s 112 districts. Apart from informing public investment decisions and national and local development planning, they also feed into contingency planning and preparedness measures. In 2017, the government further systemized its risk assessment work through the National Disas-ter Risk and Vulnerability Atlas, which will shape the second National Development Plan. The atlas focuses on seven major hydrometeorological and geological hazards, and is complemented by online and offline data-sharing mechanisms.280
Making hazard, land-use and vulnerability data freely accessible to increase awareness of policy-makers and citizens alike is a feature of Bosnia and Herzegovina’s Multi-Hazard Disaster Risk Analysis System, which maps high-risk areas using a GIS.281 This risk information has been applied in cost–benefit analysis to help make the economic ratio-nale for public and private sector investment in DRR and to support consideration of alternative interven-tions.282 In the ASEAN region, countries have yet to start quantitatively assessing the effects of DRR and CCA measures on economic performance.283 Countries participating in the Pacific Risk Resilience Programme are conducting risk governance needs assessments, which have been instrumental in
267 (UNISDR 2013a)268 (UNISDR 2017d)269 (Maeda et al. 2018)270 (Maeda et al. 2018) 271 (Aysan and Lavell 2015)272 (UNDP 2019h); (Tonga 2018); (UNDP 2019i); (UNDP 2019q)273 (Aysan and Lavell 2015)274 (UNDP 2019h)
275 (Aysan and Lavell 2015); (World Bank 2017); (Mitchell 2003)276 (Planitz 2015)277 (Maeda, Shivakoti and Prabhakar 2019)278 (MIDIMAR 2015)279 (UNDP 2017a)280 (UNDP 2019p)281 (UNDP 2018a)282 (UNDP 2019c)283 (Maeda, Shivakoti and Prabhakar 2019);
347

aligning the leadership at all levels in support of the respective countries’ risk reduction priorities.284 The programme also conducts risk assessments; these are not pursued as a stand-alone activity, but build on pre-existing community priorities, identifying the risks with the greatest potential impact as priorities for action.285
The spatial and temporal complexity of multiple hazards requires sector-specific risk assessments that can consider highly localized extensive risk, as well as a broader range of hazard types to which a particular sector may be exposed. Private utili-ties are often at the forefront when it comes to risk assessment and taking measures to protect their services. However, the information and know-how are rarely shared with other private or public sector entities.286
12.3.4 Stakeholders as an entry point for mainstreaming
Although governments have the primary respon-sibility to prevent and reduce risk, the Sendai Framework states what is well established, that DRR requires an all-of-society engagement and partnership if it is to be effective.287 Private sector investment has long surpassed that of the public sector, and with it the greater potential to generate risk.288 Likewise, actions and decisions at house-hold and community level can contribute to the accumulation of risk, although finding the means to meaningfully involve such stakeholders in risk management can be a hurdle. Government is also made up of a myriad of sectors and departments, interests, powers and knowledge bases that need to be well understood to be effectively deployed in the process. Decision makers, legislators and administrators at national, sectoral and local levels must also set the necessary regulations and exer-cise their coordination and oversight functions to ensure implementation and compliance. It is criti-cal that governments set the enabling environment and provide incentives for the engagement of other stakeholders in the risk management process.
Ultimately, such engagement promotes broader ownership and sustainability of mainstreaming efforts and related DRR measures.
As DRR mainstreaming needs to be driven from within the development sector, the proactive involvement of development actors is needed. Although national disaster management authori-ties have been indispensable for paving the way and advocating for mainstreaming, most countries have been able to make significant progress only after getting the full engagement of development, planning and finance ministries. This ensures a more holistic approach with explicit linkages to development planning and implementation at all levels. Involving a country’s development planning system helps to overcome obstacles linked to hori-zontal and vertical integration of DRR, as well as mainstreaming DRR more systematically by way of cooperative goal definition, planning and action. This ambition is a long-term, incremental process towards risk-informed development that requires strengthening incentive systems to cooperate with others on shared tasks. Since the role of many tradi-tional DRM institutions is still in need of support, a two-track approach is recommended that also helps consolidate and strengthen the legitimacy and accountability of national DRM authorities or civil protection agencies.
Communities play a key role in terms of their local knowledge, articulating social demands for DRR measures, and ultimately implementing these. Distinct attention must be placed on involving all members that make up a community, including women, youth, older persons, minority and margin-alized groups, and persons with disabilities. The mainstreaming process cannot be separated from gender and other social factors that determine vulnerabilities, capacities and exposure to natural hazards. Civil society organizations are indispens-able as intermediaries between government and communities, as service deliverers and as activists.
Within the private sector, some companies have been observed to go beyond social responsibil-ity considerations recognizing DRR as a means to ensure competitiveness and business continuity in
348 Chapter 12

the event of a disaster.289 But the short-term busi-ness focus of some companies and sectors still stands in the way of long-term sustainability in DRR. For example, maximizing income at the expense of fragile ecosystems is unfortunately still the norm in many sectors.290 Many businesses do not consider their exposure to risk, and face losses every year, even in high-income countries.291 However aware-ness is growing within governments and busi-ness sectors of the need to strengthen disaster and climate resilience of their own businesses and those of their suppliers, including SMEs. This has been notable in South-East Asia, particularly since the 2011 Bangkok floods.292
Other key stakeholders include academia and research institutions, as well as the media in terms of its role in fostering awareness, transparency, and influencing decision makers and the wider public, while noting that ill-informed media may also be harmful. Partnerships and networks can be effec-tive in bringing together multiple actors. Their respective comparative advantages, skills, experi-ences and resources can be pooled, and can help connect sectors and overcome institutional silos.
Country experiences
Lessons from mainstreaming DRR in the agricul-tural sector emphasize that the process must tran-scend government boundaries and involve other stakeholders such as academia, NGOs and people at risk such as farmers.293 In the Solomon Islands, for example, community knowledge hubs were initi-ated to improve communication between farming communities and government extension workers, thus providing a platform for regular information
exchange and training on climate resil ience crops.294
An interesting example of private sector involve-ment was pursued in Fiji’s Northern Division when one of the first risk-screened capital projects was implemented in the road sector. In addition to addressing the risks to, and from, the road project in each and every phase of the project manage-ment cycle, the contractors received targeted risk management instructions to fully understand the rationale behind risk-informed road construction. As this is one of many publicly financed initiatives, over time, this approach is expected to positively affect practice throughout the construction sector.295
In the municipalities of Paraná in Brazil, the Univer-sity Center for Studies and Research on Disasters has promoted the Making Cities Resilient (MCR) Campaign as a means to strengthen risk manage-ment capacities. The University Centre has started a network of 23 public and private sector institu-tions at state, federal and international level, called REDESASTRE. It is the first thematic network offi-cially established in Brazil to promote coopera-tion and scientific and technological exchange on reducing disaster risk. Thanks to its pluralistic composition, the network has proved a success and a valuable resource to over 80% of municipali-ties in Paraná seeking to promote resilience in their cities.296
284 (UNDP 2017b)285 (UNDP 2019h)286 (Sands 2019)287 (UNISDR 2015e)288 (UNISDR 2013b)289 (UNISDR 2015e)290 (UNISDR 2013b)291 (Sands 2019)
292 (ADPC 2017b); (Asia Pacific Economic Cooperation Secretariat 2013)293 (Koloffon and von Loeben 2019)294 (UNDP 2016b)295 (UNDP 2019h)296 (Pinheiro et al. 2019)
349

12.3.5 Finance as an entry point for mainstreaming
The issue of funding needs to be approached with an awareness of the scale of change required to move towards risk-informed sustainable develop-ment, and the challenges countries face where resources are scarce and everyday decisions must be made about where to spend precious budget allocations. Many countries report financial constraints as the main barrier to mainstreaming and that these explain the lack of progress in reduc-ing underlying risks nationally and locally.298 The low level of financing reflects a lack of overall means in many countries, but it also reflects perceptions and priorities of governments and donors on where investment should be made. Historically invest-ment that supports long-term resilience tends to lose out to investment focused on shorter-term goals. Amplifying long-standing arguments that risk reduction is a better public investment than disas-ter recovery and reconstruction, the World Bank provides evidence – in respect of infrastructure – of how resources can be optimized if spending
is undertaken strategically and from a systems perspective.299
Financing for prospective DRM can be pursued through development processes such as infra-structure investments through detailed engi-neering design and planning; this can entail little incremental expense (on average 4.5%), for as long as regulation is strong enough to mandate and monitor these requirements.300 Strengthening financial mechanisms for DRR remains important. So too, understanding the resources the public sector invests in risk reduction, and the relationship among earmarked budgets and allocations internal to ministerial or agency budgets. The latter is not always straightforward, as risk reduction measures are not always clearly labelled as such, take invest-ment in forestry management in areas exposed to high levels of landslide risk for example.
Having dedicated budget lines for DRR within sectoral budgets is one of the most promising approaches for integrating DRR in national and local budgetary systems. As an intermediate measure, it may be necessary to establish dedicated funds for
Water scarcity has been a persistent problem in the Ha’apai Islands, negatively affect-ing people’s health, crop yield and livestock productivity. It was therefore not surprising that community consultations to draw up risk-informed community development plans identified water supply as the top priority. Site selection, safe access to water at night for women, and accessibility of persons with disabilities and older persons were among some of the issues discussed and solutions identified.
The pool ing of technical and f inancial resources from a wide range of partners increased the purchasing power to obtain new water tanks and overcome the logistical
challenges of transporting equipment to isolated islands. Drawing upon local volun-teers and engineers ensured that capacity to implement and maintain the project was kept local. Low-technology equipment and training of village committees also helped strengthen the communities’ technical capacities to cope. As a result of this bottom-up mainstreaming initiative, the Ministry of Finance and National Planning has started to make decisions based on the community needs and priorities outlined in community development plans. The ministry has also started to pilot risk screening of devel-opment projects funded through the national budget in a top-down process that contrib-utes to further systematizing the risk-informed approach throughout government.297
Case study: Community-driven mainstreaming in the Ha’apai Islands, Tonga
350 Chapter 12

DRR, or to allocate a portion of such funds for risk reduction, as is done in the Philippines.
Dedicated funding has yielded good results in some countries, but may also be a disincentive for
While not a focus of this GAR, as noted in Chapter 10, risk transfer mechanisms are receiving increasing attention as a means to manage shocks incurred when residual risk is realized – risks that are not, or cannot be reduced through risk management
sectoral ministries and agencies to allocate their own resources, unless it is possible to trace their allocations through budget tagging, as the Philip-pines is doing for mainstreamed climate change expenditure.301
measures, or that may not be cost-effective to reduce further. Access to and deployment of disaster risk financing mechanisms is becoming an increasingly popular option for governments seeking to manage such risk, especially from large
297 (UNDP 2019n)298 (Aysan and Lavell 2015)299 (Rozenberg and Fay 2019)
300 (UNDP 2018c)301 (Alampay et al. 2017)302 (Philippines 2010a)
The Philippine Disaster Risk Reduction and Management Act 2010 (DRRM Act)302 has detailed provisions on risk reduction budgets:
Case study: Risk reduction budget in the Philippines
The Act (s.22) and the Implementing Rules and Regulations also authorize all government agencies to use a portion of their appropria-tions on DRRM projects in line with the National DRRM Council guidance and in coordination with the Department of Budget (Act s.5, Rule 19).
• Under the DRRM Act, the national budget for DRRM is appropriated under the annual General Appropriations Act, and is known as the National DRRM Fund. The amount must be approved by the President. The DRRM Act specifies that, of the amount appropri-ated for the National DRRM Fund, 30% is allocated as a Quick Response Fund for relief and recovery and the remaining 70% can be used for broader DRR, preparedness and recovery activities (Act s.22).
• The DRRM Act also requires local govern-ments to establish local DRRM funds by setting aside at least 5% of their revenue from regular sources, to support all types of DRRM activities:
о Of the Local DRRM Fund, 30% is automatically allocated as a Quick Response Fund for relief and recovery programmes.
о The remaining 70% can be used for pre-disaster measures. This Local DRRM Fund may also be used to pay premiums on calamity insurance (Act s.21).
• State budget for DRRM also includes the Office of Civil Defense annual budget allo-cation, provided for in the DRRM Act (s.23).
351

and infrequent events.303 Such mechanisms are made increasingly available through international and regional mechanisms, including a range of tailored insurance products for sovereign risk; as discussed in Chapter 8 in respect of Sendai Frame-work Target F on international cooperation, and in Chapter 10 on regional initiatives (see section 10.1).
As elucidated in previous GARs, engineering risk-informed investment by the private sector is argu-ably the key to effective risk reduction. There is important work to be done on how governments can create incentives to engage and mobilize the private sector more fully in this joint enterprise, for example through the lens of business continu-ity, or in encouraging risk-reducing behaviour in the capital markets – “green bonds” for climate-resil-ient investment that are subject to voluntary prin-ciples within the capital markets framework,304 for instance.
The featured case study prior to Part I of this GAR, on SME disaster resilience in the Philippines, illus-trates how in recognizing the benefits to efficient operations, the country’s major businesses have invested in disaster resilience of supply chains through the Philippine Disaster Resilience Founda-tion. This mechanism collaborates with the govern-ment to provide training on business continuity planning and capacity-building. The increasing use of public–private partnerships to build new infra-structure provides governments the opportunity to steer or incentivise investment that prevents the creation of new risk, thereby enhancing the quality and resilience of the built environment.305
Public resource allocation is influenced by compet-ing plans, policies and pressures that are present during the bureaucratic process of preparing budget proposals and the political process of approving them. This calls for careful analysis of the poten-tial to leverage resources to attract private, public and international finance (which is especially rele-vant for national disaster management authori-ties, climate services or similar). A shift is required in the determination of what constitutes a “good” investment. Investments that truly pursue the soci-etal sustainability and resilience outcomes of the
post-2015 agreements must consider the wider risks emanating from the interaction of human and ecological systems. Especially, as the conse-quences of failing to do so will have potentially more widespread and less foreseeable impacts, as interactions among social, ecological, economic and political systems intensify.
In summary, governments can choose from a range of financing options that include ex post measures such as tax increases, donor assistance, raising debt and budget reallocation. Other options include risk transfer, contingent financing and reserve funds. The potential of private sector invest-ment in risk reduction has yet to be harnessed. The conversation on how to achieve risk-informed development through more efficient investment of the available resources using a systems-based approach is only just beginning.
Country experiences
Governments are increasingly creating internal mechanisms to ensure public investment in new development is vetted for its risk-reducing or risk-generating impacts. Examples include the Minis-tries of Finance in Fiji, Peru, Tajikistan, Tonga and Uzbekistan, which have recognized the need to align public investment decisions more closely with a strong understanding of disaster risk and its potential economic impacts.306 The implementation of public investment rules in Costa Rica, Peru and the Plurinational State of Bolivia are good examples of how mainstreaming can go beyond pure declara-tions of intent.307
In general, budgetary allocations for DRR and CCA are found to be insufficient, and the funding gap between the plans and implementation is increas-ing. A study on the agricultural sector found that dedicated funding for DRR in agriculture was diffi-cult to obtain, unless this was backed by legislation or mandatory allocations for DRR across sectors. But there are exceptions, such as in the case of Cambodia; in 2017, the national budget indicated a considerable increase of the Ministry of Agri-culture’s budget for climate adaptation from $23
352 Chapter 12

million to $247 million, which directly contributed to flood control and drought management measures. In the ASEAN region, countries have taken initiatives to establish dedicated disaster funds to finance disaster prevention and climate adaptation. Also, national climate adaptation funds, such as the Indo-nesia Climate Change Trust Fund and the Philip-pine People’s Survival Fund, have promoted local adaptation and disaster resilience projects in water resources management, land, ecosystems conser-vation and EWSs.308
For subnational financing of DRR, the Government of Viet Nam piloted a mechanism to link DRR and climate adaptation plans to the annual provincial budget process and targets. The approach was rolled out in eight high-risk provinces and reached more than 8,000 people, of whom over 50% were women, and is now being scaled up in more than 1,700 communes.309 In Cuba, municipalities are inte-grating DRR into the investment planning process. Every public entity is legally obliged to include actions to reduce risk in its economic planning. The National Civil Defense authority carries out regular inspections, and when DRR is not fully integrated in the local investment planning, a mandatory action plan is recommended for implementation by munic-ipal governments within a certain time frame.310
As noted in the Philippines case study above, a mandated funding pool of 5% of local govern-ment budget for DRR and management activities in the Philippines has strengthened the capacity of local governments in prevention and mitigation measures.311 Indonesia also has a sophisticated legal framework that sets out the principles to ensure DRR is factored into national and regional budgets, as part of the overall disaster manage-ment funding structure. The complexity of the
system means that it is difficult to track and assess the budgeting and funding flows for DRR, and the actual investments in DRR are probably higher as many activities are “embedded” within other sectors and not identified as disaster management/DRR related.312 However, tracking of public expenditure on DRM is a useful exercise to review how public funds are spent by governments across sectors nationally and/or subnationally, and what was achieved as a result.
A Disaster Risk Management Public Expenditure and Institutional Review conducted by UNDP in Lao People’s Democratic Republic, Thailand and Viet Nam found that expenditure in support of DRM appeared to be low in relation to GDP and total budget expenditure in the three countries.313
However, estimated expenditure on DRM-related activities was higher than that estimated for climate change investments in a similar review on climate change expenditures in Thailand and Viet Nam. Expenditure on DRM-relevant activities was concen-trated in a small number of similar ministries and agencies across each of the three countries. These ministries included those responsible for agricul-ture, irrigation, natural resources, environment and construction. DRM-relevant expenditure that was specifically focused on activities related to DRM policy, community awareness, capacity-building, early warning and research, was very small and usually embedded as components in other projects and investments.
While its ability to support prospective risk manage-ment is under-optimized, leveraging the private re/insurance industry and capital markets can afford some degree of fiscal protection in disaster-prone economies. Examples of regional parametric insur-ance schemes were highlighted in section 10.1, but
303 (Alton, Mahul and Benson 2017)304 (International Capital Market Association 2019)305 (World Bank 2018)306 (UNDP 2019h); (UNISDR 2017d)307 (Bolivia (Plurinational State of) 2015); (UNDP 2019d); (Peru, Office of the Director-General of Public Investment, Ministry of Economics and Finance 2016)
308 (Maeda, Shivakoti and Prabhakar 2019)309 (Digregorio and Teufers 2019)310 (UNDP 2017a)311 (Maeda, Shivakoti and Prabhakar 2019); (Philippines 2010)312 (IFRC 2016a) 313 (Lavell et al. n.d.); (Abbott 2018)
353

national schemes are also emerging. Parametric insurance is a financing tool for governments to transfer their rising climate and disaster risk to the international insurance markets. It allows for fast payouts in the wake of disaster, triggered by agreed parameters, which are correlated with insured damages, financial losses or funding needs.
The introduction of the Turkish Catastrophe Insur-ance Pool in 2000 has resulted in 47% of dwellings having compulsory earthquake coverage.314 Other sovereign risk transfer options include Mexico’s Catastrophe (“CAT”) bonds, which allow the govern-ment to transfer a pool of disaster risk to the capital markets.315
In the Philippines, the parametric insurance scheme covers 25 provinces. Mexico’s committee for response to national disasters and emergencies (CADENA in its Spanish title) has established an agriculture pool that offers more traditional live-stock insurance and crop area-linked index insur-ance. For such financing mechanisms to work effectively, they need to be built on thorough national and regional level risk information. This is also the approach of the Risk Assessment and Financing Program in the South-West Indian Ocean, which is led by the Prime Minister's Office and the Ministry of Finance in Madagascar.316
12.4 Conclusions
The clear relationship between risk from natural and man-made hazards and risks to and from development is the core rationale for integrating DRR into development planning and budgeting. Unless nations accelerate their efforts to curb the development-based drivers of risk, sustainable development may not be possible, and certainly not achievable by 2030. However, recognition of the need to address these development-based risk drivers, and to accept that disaster impacts are an
indicator of unsustainable development, have yet to permeate conventional DRR and development policy and practice. As described previously in this GAR, especially in Chapter 2, this requires a new understanding of risk in the interactions between the environment and human-made systems, and a shift towards systems-based thinking in risk reduc-tion within mainstream policymaking at practice.
There has been some progress in DRR mainstream-ing through a range of entry points such as policy, organizations, knowledge, stakeholder engage-ment and finance. However, several key challenges remain. The capacities and skills to drive main-streaming and risk reduction processes over a suffi-cient length of time are still not adequate. Despite many innovative financing mechanisms and regu-latory advancements, bottlenecks persist in financ-ing the effort required to achieve the risk reduction goals that countries have set for themselves, includ-ing those enshrined in their global commitments under the Sendai Framework, Paris Agreement, 2030 Agenda and other global frameworks.
Setting the right incentives to engage key stakehold-ers in a meaningful way, including communities at risk and the private sector, is not a new challenge, but is one that requires genuine action. There are still gaps in generating and making accessible risk information, the related tools that are able to gener-ate disaggregated and geospatial data down to the lowest level of analysis, and also in understanding the vulnerability of human systems to cascading and systemic risk.
314 (UNDP 2018b)315 (International Capital Market Association 2019)316 (Andriamanalinarivo, Falyb and Randriamanalina 2019)
354 Chapter 12
13.1 Disaster and development risks from climate change
13.1.1 Risk from climate change is profound and urgent responses are needed
Current national commitments to reduce GHG emissions and otherwise mitigate global warming under the Paris Agreement will not contain global warming within 2°C above pre-industrial levels, let alone the preferred containment within 1.5°C. The IPCC SR1.5 projects that, based on Member States’
current NDCs, the climate system is heading off track into the territory of 2.9°C to 3.4°C warming.317 If this happens, it would take future hydrometeo-rological hazard extremes well outside the known range of current experience and alter the loss and damage equations and fragility curves of almost all known human and natural systems, placing them at unknown levels of risk. This would render current strategies for CCA and DRR, in most countries, virtually obsolete. It also means that it is no longer sufficient to address adaptation in isolation from development planning, and that sustainable socio-economic development, by definition, must include mitigation of global warming.
The IPCC SR1.5 and its Fifth Assessment Report (published in 2014)318 have also reiterated that
Chapter 13: Integration between disaster risk reduction and national climate change adaptation strategies and plans
317 (IPCC 2018)318 (IPCC 2014)
355
global warming triggers climate change effects that are not linear. This is based on multiple lines of evidence, including on observations already made in recent decades and on the projections of a range of different global climate models about future effects. So even if global warming is contained within the range of 1.5°C to 2°C, there will be very significant health and socioeconomic effects due to increasing average temperatures. In addition, and significantly for understanding and reducing risk, humanity now faces the current reality and the future prospect of more-extreme and much higher frequency “natural” hazards – extremes of cold to heat-waves, longer and more sustained drought, more intense and more frequent storm events, heavier rainfall and more flooding. This means that the line between DRR and CCA, if indeed such a line ever existed, is no longer possible to discern. Climate change is by no means the only source of disaster risk. As the foregoing parts of this GAR have emphasized, risks arise from a range of other natural, environmental, biological and technologi-cal hazards and drivers. Climate change is increas-ing the risk of disaster – amplifying existing risk and creating new risks including the direct conse-quences of a warming planet – with cascading consequences in the short, medium and long term.
In this sense, CCA can be characterized as essen-tially a subset of DRR. Climate mitigation can also be understood as a subset of development plan-ning.319 The main policy implication, within the risk framework of this GAR, is that at a minimum, CCA needs to be integrated with DRR, and that govern-ments need to move to a coherent policy approach that sees both of these risk reduction measures as integral to planning for sustainable development.
This situation has become much clearer since the Sendai Framework was agreed in 2015. There is also no obligation on Member States to divide their policy formulation and implementation according to the scope of different international agreements negoti-ated along thematic lines. Accordingly, this chapter is an account of a range of country policy practices on integration of CCA and DRR. It also gives some examples of fuller integration into development plan-ning and an exhortation to governments to explore
more fully the efficiency and effectiveness benefits of taking a systems-based approach to disaster and climate risk management.
13.1.2 International framework
As part of the processes and mechanisms under the 1992 UNFCCC,320 the Paris Agreement estab-lished a global goal on adaptation of enhanc-ing adaptive capacity, strengthening resilience and reducing vulnerability to climate change. It seeks to contribute to sustainable development and ensure an adequate adaptation response in the context of the temperature goal referred to in Article 2: “Holding the increase in the global average temperature to well below 2°C above pre-industrial levels and pursuing efforts to limit the temperature increase to 1.5°C above pre-industrial levels, recog-nizing that this would significantly reduce the risks and impacts of climate change.” 321
In the years before the Paris Agreement, during the climate negotiations, and since 2015, there has been considerable debate about the likely differences in impact between warming of 1.5°C and 2°C, focus-ing on the capacity and scope for adaptation. Since 1990, this debate has included a strong message from the Alliance of Small Island States322 that containment of warming within 1.5°C was essen-tial for socioeconomic survival of its members, and in many cases their physical existence, due to projected sea-level rise and other climate change impacts.323
As the United Nations body for assessing the science related to climate change, IPCC was created in 1988, to provide policymakers with regular scientific assessments on climate change, its implications and potential future risks, as well as to put forward adaptation and mitigation options. Its assessment reports, based on the work of a large network of experts globally, have long been familiar to policymakers in the fields of environ-mental protection and hydrometeorology.324 Its work is also now widely recognized as relevant to
356 Chapter 13

319 (Kelman 2015)320 (UNFCCC 1992)321 (United Nations 2015b)322 (Alliance of Small Island States 2019)323 (Thomas, Schleussner and Kumar 2018)324 (United Nations General Assembly 1988)
325 (IPCC 2014) 326 (IPCC 2012)327 (IPCC 2018)328 (Centre for Science and Environment 2018)329 (IPCC 2018; summary based on input from Wilfran Moufouma-Okia, IPCC)
policymakers concerned with the broader agendas of development planning and DRR.
The last major synthesis report of the IPCC, the Fifth Assessment Report, was published in 2014,325
and was informed by research undertaken for the 2012 Special Report on Managing the Risks of Extreme Events and Disasters to Advance Climate Change Adaptation.326 These remain current and relevant resources. The 2018 IPCC SR1.5 is signifi-cant in that it addresses the probable differences in impacts of global warming of 1.5°C compared with 2°C, specifically “in the context of strengthening the global response to the threat of climate change, sustainable development, and efforts to eradicate poverty.”327 It is a compelling new resource that makes it clear that addressing climate change mitigation and adaptation is an urgent global and national priority for DRR strategies as part of plan-ning for risk-informed socioeconomic develop-ment, in particular that containing global warming within 1.5°C will reduce the impacts significantly compared with 2°C warming.328 Relevant highlights of IPCC SR1.5 are considered here as an essential context for addressing questions of disaster and climate risk at national policy level.
13.1.3 Intergovernmental Panel on Climate Change Special Report 2018 – Global Warming of 1.5°C
The IPCC SR1.5 highlights that the global climate has already changed relative to the pre-industrial period and that these changes have affected organ-isms and ecosystems, as well as human systems and well-being.329 Human activities have already caused approximately 1.0°C of global warming above pre-industrial levels, which has led to multiple
observed changes including more extreme weather, frequent heat-waves in most land regions, increased frequency and intensity of heavy precipitation events, increased risk of drought in the Mediterranean region, rising sea levels and diminishing Arctic sea ice. If global warming continues at the current rate of 0.2°C per decade, the surface of the planet will warm by 1.5°C above pre-industrial levels between 2030 and 2052, provoking further non-linear change with potentially increasingly systemic consequences.
Future climate-related risks to health, livelihoods, food security, water supply, human security and economic growth depend on the rate, peak and duration of warming, but risks to natural and human systems are expected to be lower at 1.5°C than at 2°C of global warming. Future risks at 1.5°C of global warming will depend on the mitigation pathway and on the possible occurrence of a “tran-sient overshoot” (i.e. if the increase goes above 1.5°C but later returns to the 1.5°C level). The impacts on natural and human systems would be greater if mitigation pathways cause such a tempo-rary overshoot above 1.5°C warming and then return to 1.5°C later in the century, as compared with pathways that stabilize at 1.5°C without an over-shoot. That is, it is far preferable to ensure that the increase does not ever exceed 1.5°C warming. This would avoid climate change impacts on sustain-able development, and support efforts to eradicate poverty and reduce inequalities, if mitigation and adaptation synergies are maximized while trade-offs are minimized.
Some aspects of climate risk most relevant to adap-tation strategies at national level – and which also highlight the urgency of integrating climate change mitigation into all development strategies to avoid these risks eventuating in their more extreme forms – are highlighted in Box 13.1.
357

Box 13.1. IPCC SR1.5 – key climate risks relevant to national adaptation and risk reduction strategies
Extreme hazard events
• Limiting global warming to 1.5°C would limit risks of increases in heavy precipita-tion events on a global scale and in several regions, and reduce risks associated with water availability and extreme drought.
• Human exposure to increased flooding is projected to be substantially lower at 1.5°C than at 2°C of global warming, although projected changes create regionally differ-entiated risks.
Impacts on ecosystems and species important for human food and livelihoods
• Constraining global warming to 1.5°C, rather than to 2°C and higher, is projected to have many benefits for terrestrial and wetland ecosystems and for the preserva-tion of their services to humans.
• Risks for natural and managed ecosystems are higher on drylands than on humid lands.
• If global warming can be limited to 1.5°C, the impacts on biodiversity and ecosys-tems and on terrestrial, freshwater and coastal ecosystems are projected to be lower than at 2°C of global warming.
• Limit ing global warming to 1.5°C is projected to reduce risks to marine biodi-versity, fisheries and ecosystems, and their functions and services to humans, as illus-trated by recent changes to Arctic sea ice and warm-water coral reef ecosystems.
• Risks of local species losses and, conse-quently, risks of extinction are much less in a 1.5°C versus a 2°C warmer world.
Agriculture and fisheries
• Limiting global warming to 1.5°C, compared with 2°C, is projected to result in smaller net reductions in yields of maize, rice, wheat and potentially other cereal crops, particularly in sub-Saharan Africa, South-East Asia, and Central and South America.
• Reductions in projected food availability are larger at 2°C than at 1.5°C of global warming in the Sahel, Southern Africa, the Mediterranean, Central Europe and the Amazon.
• Fisheries and aquaculture are important to global food security but are already facing increasing risks from ocean warming and acidification. These risks are projected to increase at 1.5°C of global warming and affect key organisms such as fin fish and oysters, especially at low latitudes.
Human health
• Every extra bit of warming matters for human health, especially because warming of 1.5°C or higher increases the risk asso-ciated with long-lasting or irreversible changes.
• Lower risks are projected at 1.5°C than at 2°C for heat-related morbidity and mortality, and for ozone-related mortality if emissions that lead to ozone formation remain high.
• Urban heat islands often amplify the impacts of heat-waves in cities.
• Risks for some vector-borne diseases, such as malaria and dengue fever, are projected to increase with warming from 1.5°C to 2°C, including potential shifts in their geographic range.
(Source: IPCC SR1.5 2018)
358 Chapter 13

with present-day levels and increase further at 2°C, limiting adaptation opportunities and increasing loss and damage.
• Impacts associated with sea-level rise and changes to the salinity of coastal ground-water, increased flooding and damage to infrastructure are projected to be criti-cally important in vulnerable environments, such as small islands, low-lying coasts and deltas, at global warming of 1.5°C and 2°C.
• Projections of increased frequency of the most intense storms at 1.5°C and higher warming levels are a significant cause for concern, making adaptation a matter of survival. In the Caribbean islands for instance, extreme weather linked to tropical storms and hurricanes represent one of the largest risks facing nations. Non-economic damages include detr imental health impacts, forced displacement and destruc-tion of cultural heritages.
• Small-scale fisheries in tropical regions, which are acutely dependent on habitat provided by coastal ecosystems such as coral reefs, mangroves, seagrass and kelp forests, are expected to face growing risks at 1.5°C of warming because of loss of habitat.
Small islands
• Small islands are projected to experience multiple interrelated risks at 1.5°C of global warming, which will increase with warming of 2°C and higher levels. Climate hazards at 1.5°C are projected to be lower than those at 2°C.
• Long-term risks of coastal flooding and impacts on populations, infrastructure and assets, freshwater stress, and risks across marine ecosystems and critical sectors are projected to increase at 1.5°C compared
Regional differences in impacts
• Climate models anticipate robust regional climate differences within global warming. For instance, temperature increases in sub-Saharan Africa are projected to be higher than the global mean temperature increase.
• The differences in the risks among regions are also strongly influenced by local socio-economic conditions. Depending on future socioeconomic conditions, limiting global warming to 1.5°C, compared to 2°C, may reduce the proportion of the world’s popula-tion exposed to a climate-change-induced increase in water stress by up to 50%, although there is considerable variability among regions. Regions with particularly large benefits could include the Mediter-ranean and the Caribbean. However, socio-economic drivers are expected to have a greater influence on these risks than the changes in climate.
Economic growth
• Risks to global aggregated economic growth due to climate change impacts are projected to be lower at 1.5°C than at 2°C by the end of this century.
• The largest reductions in economic growth at 2°C compared to 1.5°C of warming are projected for low- and middle-income coun-tries and regions (the African continent, South-East Asia, Brazil, India and Mexico).
• Countries in the tropics and southern hemi-sphere subtropics are projected to expe-rience the largest impacts on economic growth due to climate change should global warming increase from 1.5°C to 2°C.
359

In response to the projected climate risks, the range of climate mitigation and adaptation actions that can be deployed in the short run are well known. These include: low-emission technologies, new infrastructure and energy efficiency measures in buildings, industry and transport; transformation of fiscal structures; reallocation of investments and human resources towards low-emission assets; sustainable land and water management; ecosys-tem restoration; enhancement of adaptive capaci-ties to climate risks and impacts; DRR; research and development; and mobilization of new, traditional and indigenous knowledge.
Strengthening the capacities for climate action of national and subnational authorities, civil society, the private sector, indigenous peoples and local communities can support the implementation of ambitious actions implied by limiting global warming to 1.5°C. International cooperation can provide an enabling environment for this to be achieved in all countries and for all people, in the context of sustainable development.
It is now clear that human health and welfare, national socioeconomic development in most coun-tries globally, and the global systems of food produc-tion and trade are likely to be affected negatively by climate change, even if global warming is contained within 1.5°C above pre-industrial levels. The extent and intensity of climatological hazards is also set to increase, leading to more risk of disasters, even under this most favourable scenario. To an extent, the whole discussion of integrated policy approaches is predicated on the belief that global warming will not exceed 2°C. If it does, the risks to all human systems and societies become incalculable based on present knowledge, and are likely to be catastrophic.
In this sense, effective climate change mitigation is now recognized as the foundation for sustainable development, CCA and DRR. However, the focus of this chapter is on integration of CCA and DRR, and the extent to which they can become part of coher-ent development policy in practice, based on the immediate short-term needs, and on a degree of optimism that global warming will be contained in the medium to long term.
The landscape for broader climate action is becom-ing increasingly clear. The following requires further exploration for the purposes of national and local risk governance in the context of this GAR: (a) the range of options and mechanisms for CCA, espe-cially in developing economies and the regions most vulnerable to the effects of climate change and (b) whether there are system efficiencies to be gained by integrating CCA and DRR, and ultimately combining all such risks into planning for risk-informed sustainable development.
360 Chapter 13

13.2 Synergies between climate change adaptation and disaster risk reduction
CCA and DRR efforts share the immediate common aim of building resilience of people, economies and natural resources to the impacts of extreme weather and climate change. But IPCC SR1.5 makes it clearer than ever that climate change may lead to changes in risk levels for non-climate hazards, including impacts on food security and human health due to cascading risks from higher tempera-tures, warmer seas, sea-level rise and others. As already described in the foregoing chapters of this GAR, the Sendai Framework requires policymakers to contemplate disaster risk from a multi-hazard perspective that includes the traditionally recog-nized natural hazards that lead to disasters, as well as a range of man-made and mixed hazards, espe-cially the newly included environmental, technologi-cal and biological hazards and risks,330 described in Part I of this GAR.
While DRR has a much wider scope than climato-logical hazards, CCA is also much more related to extreme hydrometeorological hazards and warmer temperatures than DRR. Chapter 2 of this GAR provided significant insights into how multiple risks cascade, and how complex systems generate and respond to shocks in ways that are not linear, making the impacts difficult to predict through traditional hazard-by-hazard monitoring, so that a systems-based approach is needed for effective risk management.
From a policy and governance perspective, climate and disaster risks present a significant degree of uncertainty in estimating potential impacts. This is due to the complex nature of the phenomena, as well as limitations in science and technology to understand projected events and how exposed people and assets will react, due to varied sources and types of vulnerability. However, understand-ing the commonalities and differences between DRR and CCA in each national context is important for policy coordination, especially if a decision is made to integrate DRR and CCA into one national or local strategy. In some cases, the two are also mainstreamed into risk-informed socioeconomic development planning; it is then essential not to lose sight of the full range of risks that need to be considered, and to include the short-, medium- and long-term timescales required for a systems-based approach.
The question of policy coordination, integration and synergies between CCA and DRR has national and international dimensions. At the national level, governments tend to mandate different depart-ments to deal with the two issues separately, with a few exceptions discussed in the following sections on country experiences. DRR is often assigned to national disaster management agencies, civil protection and response. Given its evolution as an environmental issue, climate change tends to be coordinated through ministries of the environment, in close coordination with finance and planning ministries. Having two departments lead the two agendas separately ensures high cabinet repre-sentation, especially in larger countries with more ministries. The downside is that, in some cases, coordination between these activities is limited. The source of financing is also a major factor in the degree of integration of the two issues, with differ-ent streams of international financing reinforcing silos at national level due to the funding criteria and compliance requirements.
330 (United Nations 2015a)
361

At the international level, Member States have agreed to different elements in terms of report-ing, funding and other mechanisms for their imple-mentation under the Paris Agreement and the Sendai Framework. As at the national level, the two agendas being governed by separate agreements and mechanisms ensure effective international representation. Decisions are in place to promote synergy and coherence in the implementation of the Paris Agreement and the Sendai Framework. The 2030 Agenda provides the common basis for coor-dinating the implementation of the two, as disasters and climate change have the potential to severely affect development efforts. As discussed in Part II of this GAR, practical coordination for international reporting is in the early stages, and Member States need to address very distinct reporting require-ments and funding streams for CCA and DRR. However, new initiatives do exist integrating CCA, climate change mitigation, DRR and sustainable development agendas.
In considering integrated approaches, Member States can also try to avoid some of the perhaps-artificial
divisions that occur in international agreements due to the negotiation process and established orga-nizational mandates. For example, one analysis is that the mentions of climate change in the Sendai Framework overemphasizes the hazard dimension of disaster risk, rather emphasizing an all-vulner-abilities and all-resilience approach that includes climate change and development.331 It may also be helpful in organizing institutional responsibili-ties at national level to think of CCA as a subset within DRR and climate change mitigation as a subset within sustainable development,332 even if the choice has been made to establish a separate legal or institutional framework to deal with climate change holistically.
Positive evidence of synergy is already seen in Member States’ reports on NDCs under the Paris Agreement. More than 50 countries referenced DRR or DRM as part of their NDC. Colombia and India made explicit references to the Sendai Framework in their NDCs.333
Figure 13.1. A systems-based approach to risk reduction: the Sendai Framework, 2030 Agenda and Paris Agreement call for policy integration of development, disaster and climate risk management
(Source: UNDDR 2019)
362 Chapter 13

13.3 Guidance and mechanisms for integrated climate change adaptation under the United Nations Framework Convention on Climate Change
13.3.1 Evolution of technical guidance on national adaptation plans
At the global level, specific goals and guidance for Member States to conduct CCA comes from UNFCCC, especially the Paris Agreement, as does an increasingly important stream of public interna-tional financing for CCA through the UNFCCC finan-cial mechanism, especially the Green Climate Fund (GCF).334
UNFCCC has a process to formulate and imple-ment NAPs, which was established in 2010 under the UNFCCC Cancun Adaptation Framework. These types of plans began in 2001 as an initiative only for the least developed countries to formulate NAPAs and thereby access the Least Developed Countries Fund. However, since 2010, there has been a shift to NAPs as a relevant tool for all developed and devel-oping countries.335 UNFCCC developed initial guide-lines for the formulation of NAPs in 2011, which outline four main elements and instruct countries
to lay the groundwork and address gaps, develop preparatory elements, establish implementation strategies, and report, monitor and review them on a regular basis.336
In 2012, the UNFCCC Least Developed Countries Expert Group developed technical guidelines for the process to formulate and implement NAPs.337 These are: (a) to reduce vulnerability to the impacts of climate change, by building adaptive capacity and resilience, and (b) to facilitate the integration of CCA in a coherent manner, into relevant new and existing policies, programmes and activities, in particular development planning processes and strategies, within all relevant sectors and at differ-ent levels, as appropriate.338
DRR is not explicitly mentioned in the initial guide-lines for NAPs/NAPAs, and they principally address climate-related hazards, typically drought, floods, sea-level rise and severe storms. However, recent and ongoing efforts by countries to develop NAPs and to undertake broad national and local adapta-tion planning according to their own needs assess-ments, provides a clear opportunity for countries to consider multiple risks in development decisions and accelerate the common goal of climate and disaster-resilient development.
Focusing on this opportunity, a supplement to NAP technical guidelines to countries was developed from a disaster risk angle in 2017 specifically dedi-cated to “promoting synergy with DRR in National Adaptation Plans”.339 In 2018, the UNFCCC Adapta-tion Committee considered a report from an expert meeting focusing on national adaptation goals/indicators and their relationship with SDGs and the Sendai Framework.340
The supplementary guidance aims to provide national authorities in charge of adaptation planning,
331 (Kelman 2015)332 (Kelman 2015)333 (UNFCCC 2017)334 (GCF 2019a)335 (UNFCCC 2012a)
336 (UNFCCC 2012a)337 (UNFCCC 2012b)338 (UNFCCC 2012a)339 (UNFCCC 2012b)340 (UNFCCC 2018)
363

as well as the many actors involved in adaptation, with practical advice on when and how to incorpo-rate DRR aspects in the adaptation planning process. It also aims to give DRM authorities a better under-standing of the NAP process, including advice on how they can contribute to and support its devel-opment, and to prompt central planning authorities such as ministries of planning and finance on how to use national adaptation planning in shaping resil-ient development.
13.3.2 Taking the next step – fully integrated development planning
Considering the commonalities in the approaches and requirements of integrating DRR and sustain-able resilient development in national CCA strate-gies such as NAP and NAPA processes, three major actions seem to be most conducive to success. Firstly, establishing a strong governance mecha-nism that involves all relevant stakeholders across disciplines, which helps avoid ineffective and inef-ficient action, communication and cooperation. Secondly, developing a central and accessible knowledge management platform and risk assess-ment system for CCA and DRR with a balanced combination of scientific and local knowledge, good practices, natural and social scientific data, and risk information. And lastly, redesigning funding schemes and mechanisms to support coher-ent CCA and DRR solutions encourages coopera-tion and coordination for efficient use of financial resources.341 The technical expert meeting on adap-tation in Bonn, Germany, in 2017 made recommen-dations to countries to bring DRR and CCA together to ensure sustainable development (Box 13.2).
13.3.3 National Adaptation Plan-Sustainable Development Goals Integrative Framework
To support the formulation of NAPs that integrate well with development planning, the UNFCCC Least
Developed Countries Expert Group developed the NAP-SDG Integrative Framework (iFrame) that facilitates integration of different entry points to planning by managing relationships between the entry points and the systems being managed. By focusing on the systems that are key to a coun-try’s development, it is possible to map to differ-ent drivers (climatic hazards for instance), as well as to sectors or ministries, specific SDGs, different spatial units, development themes or other frame-works such as the Sendai Framework. See Figure 13.2, which shows a sample collection of systems in the middle. These systems become the focus of assessment and subsequent planning and actions to address adaptation goals. The achievement of particular SDGs is ensured by safeguarding that all the necessary systems of governance relevant to that goal are included in the analysis and subse-quent action.
NAP-SDG iFrame is being tested in some countries. Early results indicate that this systems approach is effective at focusing on outputs and outcomes that would have the greatest impact on development dividends, while avoiding potential bias introduced when actors promote their interests over those of more essential systems. The approach also helps ensure multiple frameworks are addressed simultaneously. The approach has the potential to manage multiple and overlapping climatic factors or hazards, and should facilitate governance and synergy among different actors and ministries. The systems can be singular, as in the case of nexus approaches, or compound, to represent develop-ment themes such as food security, which would invariably include aspects of crop/food production, as well as other aspects of food availability, access and utilization. This approach lends itself to easy design and implementation of integrated models for the system to facilitate assessment of climate impacts and potential losses within a broader devel-opment framework. It also becomes easy to assess impacts of one or multiple interacting climatic drivers or hazards, as it is often the case that coun-tries may be faced with multiple hazards in a given year such as serious drought, flooding, shifting seasons and heat-waves.
364 Chapter 13
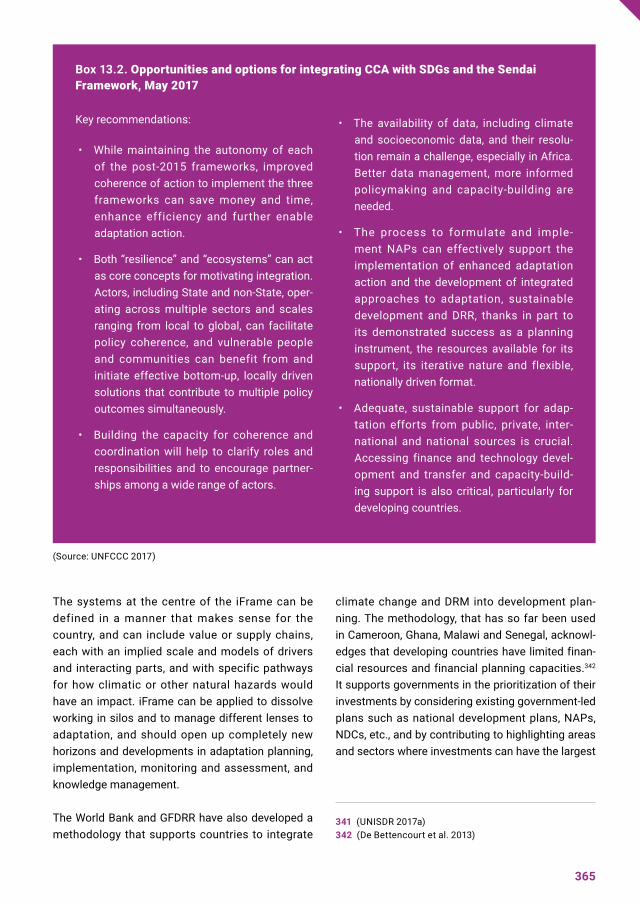
Box 13.2. Opportunities and options for integrating CCA with SDGs and the Sendai Framework, May 2017
(Source: UNFCCC 2017)
The systems at the centre of the iFrame can be defined in a manner that makes sense for the country, and can include value or supply chains, each with an implied scale and models of drivers and interacting parts, and with specific pathways for how climatic or other natural hazards would have an impact. iFrame can be applied to dissolve working in silos and to manage different lenses to adaptation, and should open up completely new horizons and developments in adaptation planning, implementation, monitoring and assessment, and knowledge management.
The World Bank and GFDRR have also developed a methodology that supports countries to integrate
climate change and DRM into development plan-ning. The methodology, that has so far been used in Cameroon, Ghana, Malawi and Senegal, acknowl-edges that developing countries have limited finan-cial resources and financial planning capacities.342 It supports governments in the prioritization of their investments by considering existing government-led plans such as national development plans, NAPs, NDCs, etc., and by contributing to highlighting areas and sectors where investments can have the largest
341 (UNISDR 2017a)342 (De Bettencourt et al. 2013)
Key recommendations:
• While maintaining the autonomy of each of the post-2015 frameworks, improved coherence of action to implement the three frameworks can save money and time, enhance efficiency and further enable adaptation action.
• Both “resilience” and “ecosystems” can act as core concepts for motivating integration. Actors, including State and non-State, oper-ating across multiple sectors and scales ranging from local to global, can facilitate policy coherence, and vulnerable people and communities can benefit from and initiate effective bottom-up, locally driven solutions that contribute to multiple policy outcomes simultaneously.
• Building the capacity for coherence and coordination will help to clarify roles and responsibilities and to encourage partner-ships among a wide range of actors.
• The availability of data, including climate and socioeconomic data, and their resolu-tion remain a challenge, especially in Africa. Better data management, more informed policymaking and capacity-building are needed.
• The process to formulate and imple-ment NAPs can effectively support the implementation of enhanced adaptation action and the development of integrated approaches to adaptation, sustainable development and DRR, thanks in part to its demonstrated success as a planning instrument, the resources available for its support, its iterative nature and flexible, nationally driven format.
• Adequate, sustainable support for adap-tation efforts from public, private, inter-national and national sources is crucial. Accessing finance and technology devel-opment and transfer and capacity-build-ing support is also critical, particularly for developing countries.
365

SECTORS
Agricultu
re
Water
Energy
Health
Economic
planning
etc.
CLIMATE H
AZARDS
Drought/arid
ity
Floods
Excess
ive ra
infall
Shifting se
asons
Temperature extremes
Heatwave
s
sea le
vel ri
se
Storms
SDGs
SDG2 Zero Hunger
SDG3 Health
SDG6 Clean water a
nd
sanita
tion
SDG7 Affordable and
clean energy
SDG9 Infra
stuctu
re
SDG11 Cities
SDG14 Oceans
SDG15 Ecosy
stems
LIVESTOCKPRODUCTION
URBAN WATER SYSTEM
UNDERGROUNDWATER POOL
TRANSPORTNETWORKS
SETTLEMENTS/HOUSING
CRITICAL PUBLIC/SERVICE
INSTALLATIONS
NATIONAL DEVELOPMENT
THEMES
Food secu
rity
Water secu
rity
Energy secu
rity
Livelih
oods and
employment
Human health and
well-being etc.
CROPPRODUCTION
STRATEGICFOOD RESERVES
FOODDISTRIBUTIONFISH
PRODUCTION
HYDRO ENERGYPRODUCTION
ENERGY GRIDSYSTEM
REGIONALPOWER POOL
RIVER BASINHYDROLOGY
RURAL WATERSYSTEM
SPATIAL UNITS
Community/vi
llage
Urban area/city
Municipality
Country le
vel
River b
asins
Region
ACTORS
Government d
epartments
Parastatals
Individual U
NITED NATIO
NS
agencies
multilateral d
evelopment b
anks
Bilateral a
gencies
Private se
ctor/S
ME
NGOs
community
based
organizatio
ns
Figure 13.2. Collection of sample national systems showing links to multiple entry point elements including SDGs, as part of NAP-SDG iFrame, being developed by the UNFCCC Least Developed Countries Expert Group
(Source: UNFCCC Least Developed Countries Expert Group)
366 Chapter 13

impact in building resilience while supporting the country’s development objectives. The method relies on an evidence-based participatory and iter-ative process among national and international climate scientists and economists, sectoral institu-tions, policymakers and civil society.
In addition to questions of process and financing, the content of DRR and adaptation plans is crucial, as are the mechanisms for their implementation. IPCC SR1.5 does not provide a comprehensive discussion of risk and adaptation options for all natural and human systems due to its scope, but it clearly illustrates key risks and adaptation options for ocean ecosystems and sectors. Adaptation options specific to national contexts, if carefully selected together with enabling conditions, will have benefits for sustainable development and poverty reduction with global warming of 1.5°C, although trade-offs are possible. Most adaptation needs will be lower for global warming of 1.5°C compared to 2°C. There is a wide range of adaptation options that can reduce the risks of climate change, though there are sectoral variations. There are also limits to adaptation and adaptive capacity for some human and natural systems at global warming of 1.5°C, with associated losses. Furthermore, if the 1.5°C threshold is breached, the possibilities to adapt will diminish as ecosystem services collapse. Unable to support current economic activity and human popu-lations, migration on a scale never before seen may be triggered from arid and semi-arid regions to low elevation coastal zones, building risk.
Many adaptation initiatives are currently occur-ring at local levels in response to observed and projected environmental changes as well as social and economic stresses. Recent studies have suggested that some of the climate adapta-tion actions are not sustainable, lack evaluation frameworks and hold potential for maladaptation. Utilizing indigenous and local knowledge and stake-holder engagement can aid the development of adaptation policies and broader sustainable devel-opment, along with more proactive and region-ally coherent adaptation plans and actions, and regional cooperation. But sometimes the approach needs to take a wider and more systemic view of
risk and adaptation. For example, synergies can be achieved across systemic transitions through several overarching adaptation options in rural and urban areas. Investments in health, social security, risk sharing and spreading are cost-effective adap-tation measures with high potential for scaling up. Social protection programmes, including cash and in-kind transfers to protect poor and vulnerable households from the impact of economic shocks, natural hazards and other crises, can also build generic adaptive capacity and reduce vulnerability when combined with a comprehensive climate risk management approach.
DRR and education-based adaptation to climate risks are critical for building adaptive capacity, but may have lower prospects for scaling up than some of the more system-wide adaptation approaches mentioned. As a process for designing, imple-menting and evaluating strategies, policies and measures to improve the understanding of risk, DRR is a tool that can be integrated with adaptation to reduce vulnerability. However, institutional, techni-cal and financial capacity challenges in front-line agencies often constitute constraints.
The following exploration of national and regional practices in integrated approaches to DRR and CCA therefore aims to identify some of the challenges, synergies found in practice and lessons learned from different approaches.
367

13.4 Selected country experiences with integrated climate and disaster risk reduction
13.4.1 Enabling legislation and institutions
The International Federation of Red Cross and Red Crescent Societies (IFRC), in collaboration with United Nations organizations and donors, has developed tools to support countries to strengthen their legal and policy frameworks for DRR and CCA. The Checklist on Law and Disaster Risk Reduction is a succinct and easy-to-use assess-ment tool that, by guiding a research and assess-ment process, helps countries identify strengths in legal frameworks. These are areas where greater focus is needed on implementation, as well as whether drafting or revision of legislation is neces-sary. Another relevant tool is the Law and Climate Change Toolkit. This is a global electronic resource designed for use by national governments, interna-tional organizations and experts engaged in assist-ing countries to implement national climate change laws.
To establish a strong governance mechanism, strat-egies benefit from an enabling legal framework which also applies to integrated DRR and CCA strat-egies. Recent reviews of DRR laws and regulations in various countries indicate that the integration of DRR and CCA into legal frameworks remains the exception rather than the rule.343 The trend in the countries reviewed has been to allocate responsibil-ity for the administration of CCA laws to ministries of environment, without requiring them to coordi-nate with DRM institutions, while DRM institutions are also not required to coordinate with Ministries of
Environment. Only more recently have some coun-tries, notably in the Pacific but also other regions, adopted a new model in which CCA and DRR are integrated with development planning and resource management legislation.
Examples of such integrated legal frameworks include Algeria, Mexico and Uruguay. In Algeria, the National Agency on Climate Change, based in the Ministry for the Environment, is responsible for mainstreaming CCA into development planning. However, as Algeria’s National Committee on Major Risks, established by law, is mandated to coordinate all activities on major risks, including implementa-tion mechanisms for CCA and DRM institutions, it provides an overarching coordination mechanism. The enabling law for this in Algeria is the 2004 Law on Prevention of Major Risks and Disaster Manage-ment. This legal and institutional framework has the potential to achieve a high level of CCA and DRR integration if implemented as planned.344
In Mexico, the General Climate Change Law of 2012 is supported by a special national climate change programme and an Inter-Ministerial Commission on Climate Change, which is a cross-sectoral coor-dination body formed by the heads of 14 federal ministries. In Uruguay, a special decree, the National Response to Climate Change and Variability, was passed in 2009. Implemented by the Ministry of Housing, Spatial Planning and the Environment, its purpose is to coordinate actions among all institu-tions relevant to achieving risk prevention in the whole territory.
13.4.2 Financing
Financing for adaptation and DRR is a key element for enhancing capacity and ensuring successful implementation. Although many countries have undertaken climate and disaster risk assessments, the systematic integration of these assessments into national financial and fiscal planning processes is still limited. This suggests a need to redesign funding schemes and mechanisms to encourage
368 Chapter 13

cooperation and coordination for efficient use of financial resources.
International public financing of CCA is now also a major resource and influence on national approaches. GCF was set up in 2010 by Parties to UNFCCC as part of the Convention’s financial mechanism to increase financial flows from developed countries to developing countries for mitigation and adapta-tion. It implements the financing provisions of the Paris Agreement (especially Article 9) aimed at keeping climate change well below 2°C by promot-ing low-emission and climate-resilient development, at the same time taking into account the needs of countries that are particularly vulnerable to climate change impacts.345 It is the most significant source of public international financing for national adapta-tion planning (through a range of instruments such as grants, concessional debt financing, equity and guarantees), with $5 billion already committed by early 2019 and over 100 country mitigation and/or adaptation projects under way through accredited partners.346
Many of the GCF adaptation projects integrate components that would often be seen as DRR or sustainable development. This indicates the extent of policy coherence or integrated risk governance that is already being made possible under this mechanism. Projects are explicitly documented in relation to the SDGs that they help to implement. The criteria include safeguards for indigenous peoples, gender mainstreaming and environmental and social safeguards. For example, a project just commenced in Namibia is on building resilience of communities living in landscapes threatened under climate change through an ecosystems-based adaptation approach (Project SAP006). It serves GCF results areas (health, food and water security; livelihoods of people and communities; and ecosys-tems and ecosystem services) as well as SDG 13 on climate action; SDG 14 on life below water; and
SDG 15 on life on land.347 In DRR terminology, this project is also about drought resilience. It is hoped that this clear move towards integrated risk gover-nance by GCF will encourage integrated project proposals from countries where disaster and climate risk have significant overlaps, either gener-ally or in specific regions or sectors.
13.4.3 Risk information
An integrated CCA/DRR policy, strategy or plan needs to be complemented by adequate, accessible and understandable risk information. Ideally, this is an available resource during the policy develop-ment stage, to help formulate objectives and goals, but joint risk assessments and ongoing information sharing are key elements of integrated strategies.
A study in Vanuatu identified a well-developed DRR operational governance structure comprising many government levels and non-governmental actors working together to implement top-down and bottom-up DRR strategies that contemplate CCA elements. Stakeholders in Vanuatu accept local and scientific risk knowledge to inform DRR policies, although scientific knowledge is still precedent for the development of formal instruments to reduce disaster risk.348
Several good practices in the United Kingdom of Great Britain and Northern Ireland have been identified. These include strong support for the assessment of flood and climate risk through the Adaptation Reporting Powers under the Climate Change Act, which encouraged key infrastructure institutions to consider the impacts of hazards such as flood and climate change on their business and the provision of key services. Additionally, the government encourages use of ecosystem-based
343 (IFRC and UNDP 2014b); (Picard 2018)344 (UNISDR 2013c)345 (GCF 2019a)
346 (GCF 2019a)347 (GCF 2019b)348 (Jackson, Witt and McNamara 2019)
369

approaches (e.g. sustainable urban drainage) and infrastructure that has the flexibility to be adapted in the future (e.g. the flood defence walls imple-mented in Morpeth, north-east England, which have been constructed so that they can be modified easily if required in the future).349
A Regional Initiative for the Assessment of the Impact of Climate Change on Water Resources and Socio-Economic Vulnerability in the Arab Region (RICCAR) assesses the impacts of climate change on freshwater resources in the Arab region and their implications for socioeconomic and envi-ronmental vulnerability. It does so through the application of scientific methods and consulta-tive processes involving communities in CCA and DRR. The initiative prepares an integrated assess-ment that links climate change impact assess-ment outputs to inform an integrated vulnerability assessment to climate change impacts, such as changes in temperature, precipitation and run-off, drought or flooding due to shifting rainfall patterns and extreme weather events.350 The RICCAR example shows that joint assessments and knowl-edge development involving two otherwise siloed communities of experts can help build a common
understanding of risk, which is the precondition for planning and budgeting.
13.4.4 National adaptation plans
Although NAPs are developed by many countries, the focus for UNFCCC monitoring is on develop-ing countries, and it maintains a public database of these, NAP Central. As at 31 March 2019, 13 NAPs from developing country Parties were devel-oped and submitted on NAP Central between 2015 and 2018, namely Brazil, Burkina Faso, Cameroon, Chile, Colombia, Ethiopia, Fiji, Kenya, Saint Lucia, Sri Lanka, State of Palestine, Sudan and Togo.351 All of these include aspects of DRR, providing scope for increased coherence between DRR and broader adaptation during the implementation of NAPs.
When evaluating the latest developing country examples of NAPs, which seem to have great potential for integration with DRR, a survey was conducted that showcases the following country experiences.
Rwanda integrates DRR into its NAP. Its NDC under the Paris Agreement lists early warning and community-based DRR as adaptation measures, and a guiding principle of the National Disaster Management Policy is to mainstream climate change into DRR.
The two thematic areas are managed through the Ministry of Disasters and Refugees, in charge of DRR, and the Ministry of Environ-ment, through the Rwanda Environment Management Authority, in charge of CCA. These institutions are key partners in DRR and CCA, and have adopted a multidisciplinary and multisectoral approach. The National Disas-ter Management Policy provides that all public
institutions in Rwanda should be involved in disaster management, and it allocated neces-sary resources to ensure that disaster manage-ment is fully incorporated and mainstreamed into plans.
Rwanda’s vulnerability to disasters and climate change is rooted in the reliance of most of its population on rain-fed subsistence farming practised on steep topography. Given the liveli-hood dependence on weather conditions, it is critical that climate change is mainstreamed to help guide interventions aimed at reducing vulnerability to potentially adverse impacts. The policy commits to ensuring that climate change is mainstreamed into all activities related to
Case study: Rwanda national adaptation plan
370 Chapter 13

disaster management using the East African Community regional climate change policy and the Rwanda Green Growth and Climate resil-ience strategy as a point of reference.
One of the 14 programmes of action in Rwan-da’s National Green Growth and Climate Resil-ience Strategy is dedicated to DRR from a health perspective and is entitled Disaster Management and Disease Prevention. The programme enables risk assessments, vulner-ability mapping and vector-borne disease surveillance; the establishment of an integrated EWS, and disaster response plans; the incorpo-ration of disaster and disease considerations into land-use, building and infrastructure regu-lations; and the employment of community-based DRR programmes designed around local environmental and economic conditions, to mobilize local capacity in emergency response and to reduce locally specific hazards.
The example of Rwanda shows that strong political leadership, based on the scien-tific evidence that livelihoods are affected by disaster risk and climate change, led to the development of a comprehensive gover-nance framework and the integration of DRR and CCA at different policy levels. As climate change and disaster management are classi-fied as cross-cutting issues in the top national economic development documents, all sector plans are required to include interventions for these issues as budget allocation follows the same guidelines. However, the main hinder-ing factor in implementation remains limited human and financial resources, which make it difficult to move from information exchange and coordination to coordinated action.
The Rwanda case illustrates the strong links between disaster and climate risk in an agrarian economy, and the potential for cascading risk to human health, to which it has responded with an integrated approach including multi-hazard risk assessments and institutional partnerships.
The example from the State of Palestine demon-strates a complex interaction among natural hazards, pressures of population growth and agriculture, fragile ecosystems, water scarcity and regional politics, requiring the systems-based approach it has taken towards assess-ing and managing disaster and climate risks to development.
349 (Clegg et al. 2019)350 (United Nations Economic and Social Commission for Western Asia 2017)
351 (UNFCCC 2019)
371

The State of Palestine is highly vulnerable to earthquakes, floods, landslides, drought and desertification, rapidly declining groundwa-ter resources and seawater intrusion. Water shortage is compounded by overexploitation of water resources and transboundary restric-tions. Recent drought events and high popula-tion growth have added pressure to its capacity to adapt. Pollution and environmental problems are also exacerbated by restrictions in access to and control over natural resources, such as fresh water and agricultural lands, which are key drivers for overgrazing, deforestation, soil erosion, land degradation and desertifica-tion. Environmental degradation of the coastal zone and solid waste disposal are becoming serious concerns in the Gaza Strip. These risks adversely affect the economy, society, environ-ment, health and other sectors. After assess-ing them holistically, the State of Palestine is making a shift from disaster management to risk management following a 2017 Ministerial Decree.
From the climate adaptation angle, the compre-hensive assessment for the 2016 NAP identi-fied a wide range of “highly vulnerable” issues in relation to water, agriculture and food that also affect the vulnerability of other sectors.352 The NAP assessment revealed that the complex political environment has implications on the State of Palestine’s adaptive capacities in relation to many sectors, which compound and aggravate climate vulnerabilities. Consulta-tions with the Environmental Quality Authority were then initiated to support the development of strategies for better embedding ecosystem-based DRR and CCA into policies to protect and manage the ecosystem and natural resource base of the country.
Two national committees provide platforms for coordination among government agencies and
other actors: the National Platform for Disaster Risk Reduction, chaired by the Prime Minister’s Office, and the National Committee for Climate Change, chaired by the Environment Quality Authority, which is also establishing a General Directorate for Climate Change and Disaster Risk Reduction.
The institutional and legal framework of the DRM system has been set by a national team of governmental agencies, advised by an inter-national advisory team, and there is a draft DRM law with the Prime Minister’s Office. The DRM framework forms part of the Disas-ter Management Policy that is included in the 2017–2022 National Policy Agenda. Prepara-tions for a risk analysis study and the develop-ment of a national DRM strategy were under way at the time of writing, with plans to develop a risk map during 2019.
Exploring what ecosystem services can contribute to CCA and DRR, the State of Pales-tine is developing a coherent set of policies, and there is ongoing work to establish units for CCA and DRR in the institutional set-up of the main relevant Palestinian institutions. Progress has been possible due to the existing politi-cal will and commitment. CCA, NAPs and the ecosystem–DRR–CCA nexus are well estab-lished in national policies, strategies and plans.
Hindering factors are restrictions on the control of natural resources, a lack of finan-cial resources and environmental education, low-level awareness of climate change risk and difficulty in implementation of integrated development programmes, especially in mobile Bedouin Communities. There are also issues of overlapping mandates among different Pales-tinian institutions, different sources of tradi-tional knowledge and culture, and limited data availability.
Case study: State of Palestine national adaptation plan
372 Chapter 13

The Chadian NAP includes a project on Community-Based Management of Climate Risks in Chad. By 2021, it aims to ensure that farms, fishing communities and small produc-ers, notably youth and women in targeted regions, use sustainable production systems that allow them to meet their needs, bring food to market and adopt a living environment that is more resilient to climate change and other environmental challenges.
As a Sahelian country, Chad suffers the adverse effects of climate change on all areas of activity of the population, particularly in rural communities. In recent years, there have been many extreme events (e.g. floods, drought and wildfires), as well as increasing land degrada-tion. The limited capacity of local populations to adapt to climate risks is the context for the project, which proposes ways to strengthen the capacities of local communities to adapt to climate change, as well as to develop financial mechanisms for adaptation.
The lead institution is the Ministry of Agri-culture, which will integrate outcomes into its plans and policies and will influence the debate on climate risk management in Chad. However, the Ministry of Environment, Water and Fisheries, the Ministry of Civil Aviation and National Meteorology, the Directorate for the Fight against Climate Change, the Microfinance private institution and civil society are also closely involved.
An interesting feature of the project is the focus on gender, strengthening women’s involvement in the CCA system. The project will provide women with regular access to infor-mation and credit for production. As women play a vital role in community-based produc-tion systems, this initiative will involve women in the implementation of all the project deliver-ables, ranging from access to information, to credit and microinsurance. The design of train-ing modules on climate risk management will enable women to benefit from current knowl-edge on CCA and risk management.
The promotion of financial risk transfer mecha-nisms to help rural households minimize losses and provide safety nets against climate shocks contributes to providing a more comprehensive approach to DRR and CCA integration.
The approach in Chad sees a national policy that is focused on community resilience and capacity-building for the disaster and climate risks that
Case study: Chad national adaptation plan
352 (State of Palestine 2016)
affect rural households directly, by recognizing and supporting the role of women in these communities as leaders and primary producers.
373
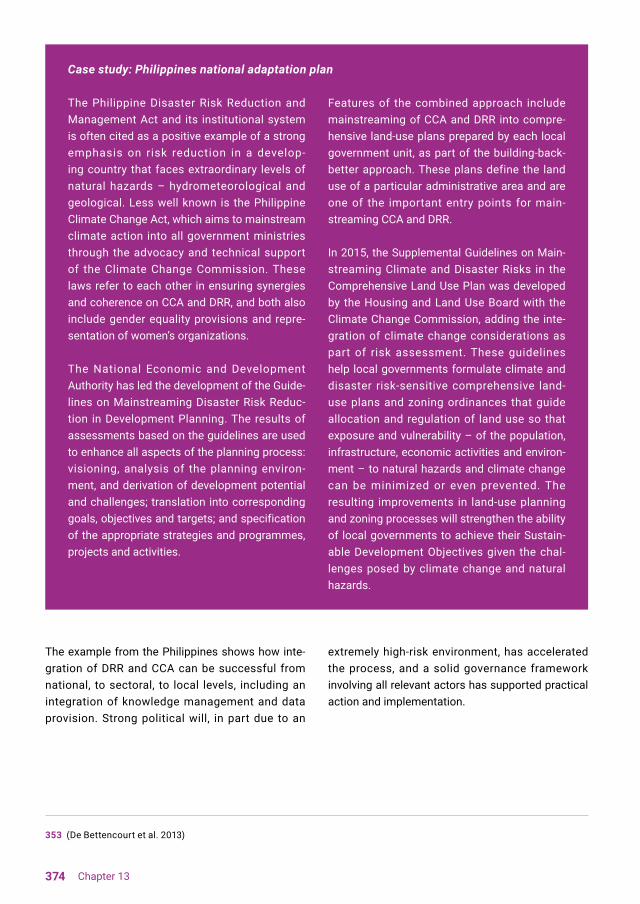
The Philippine Disaster Risk Reduction and Management Act and its institutional system is often cited as a positive example of a strong emphasis on risk reduction in a develop-ing country that faces extraordinary levels of natural hazards – hydrometeorological and geological. Less well known is the Philippine Climate Change Act, which aims to mainstream climate action into all government ministries through the advocacy and technical support of the Climate Change Commission. These laws refer to each other in ensuring synergies and coherence on CCA and DRR, and both also include gender equality provisions and repre-sentation of women’s organizations.
The National Economic and Development Authority has led the development of the Guide-lines on Mainstreaming Disaster Risk Reduc-tion in Development Planning. The results of assessments based on the guidelines are used to enhance all aspects of the planning process: visioning, analysis of the planning environ-ment, and derivation of development potential and challenges; translation into corresponding goals, objectives and targets; and specification of the appropriate strategies and programmes, projects and activities.
Features of the combined approach include mainstreaming of CCA and DRR into compre-hensive land-use plans prepared by each local government unit, as part of the building-back-better approach. These plans define the land use of a particular administrative area and are one of the important entry points for main-streaming CCA and DRR.
In 2015, the Supplemental Guidelines on Main-streaming Climate and Disaster Risks in the Comprehensive Land Use Plan was developed by the Housing and Land Use Board with the Climate Change Commission, adding the inte-gration of climate change considerations as part of risk assessment. These guidelines help local governments formulate climate and disaster risk-sensitive comprehensive land-use plans and zoning ordinances that guide allocation and regulation of land use so that exposure and vulnerability – of the population, infrastructure, economic activities and environ-ment – to natural hazards and climate change can be minimized or even prevented. The resulting improvements in land-use planning and zoning processes will strengthen the ability of local governments to achieve their Sustain-able Development Objectives given the chal-lenges posed by climate change and natural hazards.
The example from the Philippines shows how inte-gration of DRR and CCA can be successful from national, to sectoral, to local levels, including an integration of knowledge management and data provision. Strong political will, in part due to an
extremely high-risk environment, has accelerated the process, and a solid governance framework involving all relevant actors has supported practical action and implementation.
353 (De Bettencourt et al. 2013)
Case study: Philippines national adaptation plan
374 Chapter 13
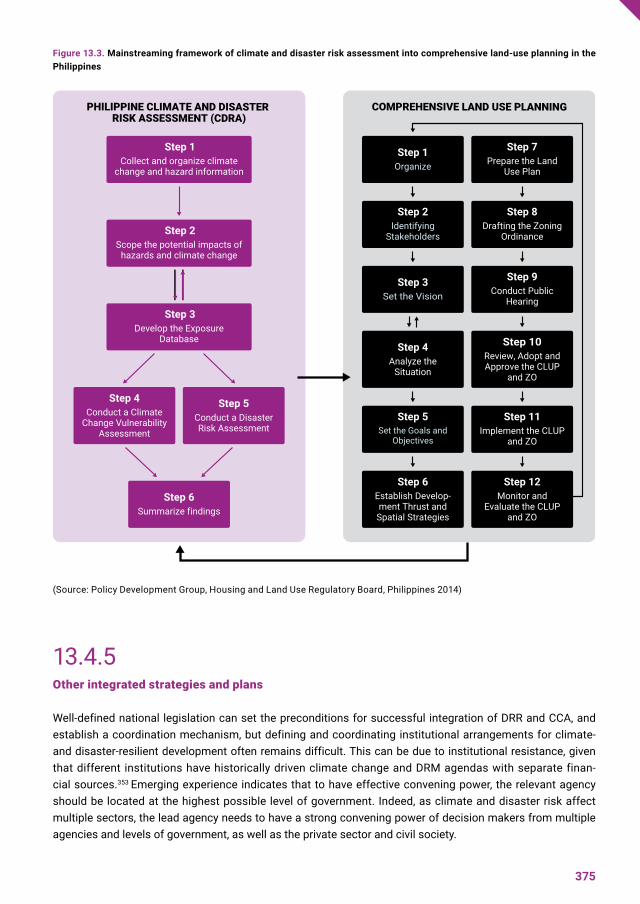
Figure 13.3. Mainstreaming framework of climate and disaster risk assessment into comprehensive land-use planning in the Philippines
(Source: Policy Development Group, Housing and Land Use Regulatory Board, Philippines 2014)
13.4.5 Other integrated strategies and plans
Well-defined national legislation can set the preconditions for successful integration of DRR and CCA, and establish a coordination mechanism, but defining and coordinating institutional arrangements for climate- and disaster-resilient development often remains difficult. This can be due to institutional resistance, given that different institutions have historically driven climate change and DRM agendas with separate finan-cial sources.353 Emerging experience indicates that to have effective convening power, the relevant agency should be located at the highest possible level of government. Indeed, as climate and disaster risk affect multiple sectors, the lead agency needs to have a strong convening power of decision makers from multiple agencies and levels of government, as well as the private sector and civil society.
375

The Mexico example shows that strong political will, based on an understanding of risk, can result in the establishment of an efficient governance mechanism, which can overcome capacity gaps and limited budget.
In addition to NAPs, which are tailored to the UNFCCC reporting structure and GCF, Member States of all levels of incomes and types of economic development are addressing climate and disaster risk as part of integrated national and local
policy and planning processes. For example, in Costa Rica, the National Disaster Risk Management Policy and the National Adaptation Policy adopted in 2017 were formulated with the participation of communities of practice and shared respon-sibilities in implementation. In Mozambique, as described in Chapter 11, the Disaster Risk Reduc-tion Master Plan (2017–2030) is aligned with the Climate Change Adaptation and Mitigation National Strategy, as well as with other policy instruments. In both these cases, common mechanisms and
Mexico has the General Law on Climate Change 2012, and the Special Climate Change Program 2014–2018, which is a planning instrument to establish climate adaptation and mitigation priorities.354 Through these mandates, DRR has been integrated into the formulation of the NAP and NDC of Mexico for the period 2020–2030.355 It has also been integrated into CCA strategies and plans through two programmes: the National Program Against Hydraulic Contin-gencies and the National Program Against Drought. These programmes are implemented by multiple institutions, coordinated by the Inter-Ministerial Commission for Attention of Droughts and Floods.
In Mexico, the actions selected to integrate DRR into adaptation plans include:
• Implementation of water reserves for envi-ronmental needs and to meet future water supply demand
• Development of algorithms for better measurement of the extent and distribution of water reserves in complex basins
• Drought EWS
• Establishment of risk reduction measures for the agricultural sector, including drought scenarios
• Fluvial restoration measures and hydrolog-ical-agroforestry restoration of watersheds
• Measures to improve drainage of linear infrastructures
• Flood prediction measures
• Insurance promotion
• Improvement of the hydrometeorological monitoring network, which reports in real time, and implementation of numerical flooding and drought models
Some conducive or hindering factors in the development and implementation of DRR-informed adaptation strategies or plans can be derived from the Mexico case. The strong polit-ical support of the federal government ensured that a strong governance mechanism for CCA with risk reduction components could be estab-lished. The use and availability of integrated flood and drought management concepts and modelling data allowed substantive develop-ment and integration. However, capacity gaps, such as the lack of sufficiently trained person-nel and low numbers of monitoring stations, related to budget and financing, represented hindering factors as insufficient communica-tion among participating institutions.
Case study: Mexico
376 Chapter 13

indicators have been articulated for the strategies or plans.
In Africa, Namibia has taken steps to integrate DRR with CCA priorities through the National Strategy for Mainstreaming Disaster Risk Reduction and Climate Change Adaptation (2017–2021). Several other countries’ strategies and plans establish links among DRR, climate change, health, environment or other developmental goals through the involvement of competent ministries or coordination mecha-nisms. However, such formulations appear to be too generic to lead to concrete joint or complemen-tary action and implementation. A study on Kenya points out that the roles of country governments and the National Drought Management Agency in support of resilience are complementary, but that there is little evidence to suggest they are working together in practice.356
Chapter 11 of this GAR observed that Chapter 4 of Mozambique’s Master Plan for Disaster Risk Reduc-tion 2017–2030, establishes the National Juridical Context and Public Policies, which articulates link-ages with the country’s National Development Plan, the National Agenda 2025: Visão Estratégica de Nação, the National Climate Change Mitigation and Adaptation Strategy 2013–2025, and the Sustain-able Development Objectives. The plan contains actions reinforcing resilience that range from the development of educational approaches integrat-ing risk reduction and CCA (Action 1.1.3), to the creation of mechanisms to ensure that all projects and programmes relating to poverty reduction, agri-culture and rural development take into account access to water, environmental considerations and contributions to the sustainable use of water (Action 2.3.1).357 At the time of writing, Mozam-bique was reeling from the passage of Cyclone Idai, which made landfall on 14 March, 2019. It flooded an area estimated at approximately 520
km2 with wind speeds of approximately 160 km/h, and caused extensive storm damage that was particularly severe in the city of Beira. Preliminary estimates cited at least 600 killed, more than 1.5 million people affected and hundreds of thousands of hectares of crops damaged. A post-disaster needs assessment was initiated on the 16 April. Hazards of the magnitude of Idai test the resilience and capacity to cope of any country. However, in due course, ex post evaluations of the root causes of loss and damage may indicate achievable oppor-tunities for reducing risk.
In 2011, Nepal developed a National Framework on Local Adaptation Plans for Action, in addition to its NAPA.358 Implementation has been a challenge, but recently, several government, non-government and international institutions have been focusing on activities related to climate adaptation for enhanc-ing the adaptation capacity of the most vulnerable. Water, health, sanitation, agriculture, biodiversity, food security and nutrition have been identified as the most vulnerable sectors to climate impacts, and are taken as priorities for providing support to local vulnerable people.359 Others have focused on the concept of climate-smart villages and an integrated approach to local level resilience.
Brazil directly referenced the Sendai Framework in its NAP.360 The Netherlands has developed a long-term planning vision for water management that considers climate change scenarios and has devel-oped integrated safety and adaptation policies to handle risk. Other countries (e.g. France, Spain and the United Kingdom of Great Britain and Northern Ireland) have collaborated with the private sector to install insurance and risk financing mechanisms based on public–private partnerships, while others such as Switzerland have enabled vertical collabo-ration with local governments by setting up a multi-level risk governance system.
354 (Mexico, Ministry of the Environment and Natural Resources 2014)355 (Mexico 2016)356 (Omoyo Nyandiko and Omondi Rakama 2019)357 (Information provided to UNDP by Government of Mozam-bique 2017)
358 (Nepal, Ministry of Environment 2010); (Nepal, Ministry of Forests and Environment 2018)359 (Dhakal, Wagley and Karki 2018)360 (Brazil, Ministry of Environment 2016); (Urrutia Vásquez et al. 2017)
377

13.5 Pacific region approach to integrated climate, disaster and development policy
13.5.1 Regional approach to support integration – Framework for Resilient Development in the Pacific
As noted in section 10.1 on regional approaches and in section 11.5 in relation to policy coherence, the Pacific region is leading the way, at regional and country levels, in integrating reduction of climate and disaster risk with development planning in FRDP.361
Although it is not prescriptive, FRDP suggests prior-ity actions to be used as appropriate by different multi-stakeholder groups, at regional and national levels, in sectors or other groupings as appropri-ate.362 Its implementation was also supported by the Pacific Resilience Partnership established by Pacific leaders in 2017 for an initial trial period of two years. The partnership works to strengthen coordination and collaboration, working with a multi-stakeholder task force, a support unit, techni-cal working groups and Pacific resilience meetings.
13.5.2 Pacific countries
Given the importance of climate-related disasters to the Pacific Islands, many countries of the region have developed JNAPs, action plans that consider DRM and CCA, since 2010. This process began well before the 2016 FRDP, which evolved at the regional level from national practice.
JNAPs normally reflect a recognition of the rela-tionship among development, disaster and climate risk and the role of environmental management in development and risk management.363 The Cook Islands, the Marshall Islands, Niue and Tonga repre-sent some of the countries that have developed and published their JNAPs, while Vanuatu has chosen an alternative route through national legislation and institutional restructuring to integrate DRR and CCA.
There are two broad approaches followed by Pacific Island countries regarding JNAPs and NAPs. One set of countries works on formulating NAPs explic-itly, with proposals and/or plans under way to access the GCF NAP formulation funding (e.g. Fiji, Tuvalu and Vanuatu). Another set of countries char-acterize their JNAPs as their NAPs (Cook Islands, Kiribati, Marshall Islands, Nauru, Niue, Palau and Tonga). The second group of countries is planning to use the GCF NAP formulation funding to revise or update CCA components of their JNAPs to ensure full coverage of the features of NAPs.
One country, Samoa, is applying its national devel-opment strategy as the overarching plan for devel-opment planning, climate change, DRR, SDGs, etc., all in one, with no separate plans for the different issues. Implementation of activities is coordinated through the country’s medium-term expenditure framework.364
The Cook Islands launched its second plan, JNAP2, in 2016, covering the period 2016–2020. This JNAP2 has nine sectoral strategies to ensure a safe, resilient and sustainable future. It aims at strengthening climate and disaster resilience to protect lives, livelihoods, economic, infrastruc-tural, cultural and environmental assets in the Cook Islands in a collaborative, sectoral approach. The Paris Agreement and Sendai Framework are men-tioned in the foreword, and there is a mapping of how both have informed JNAP.365
The Kiribati Joint Implementation Plan (KJIP) is being updated to complement the National Disaster Risk Management Plan and the National Framework for Climate Change and Climate Change Adap-tation.366 Among other things, the KJIP revision
378 Chapter 13

361 (SPC 2016)362 (SPC 2016)363 (Secretariat of the Pacific Regional Environment Programme 2013)364 (Samoa 2016)
365 (Cook Islands 2016) 366 (Kiribati, Office of Te Beretitenti 2013); (Kiribati 2012)367 (Vanuatu 2015); (Jackson, Witt and McNamara 2019); (UNDP 2019q)368 (Vanuatu 2017)
Honiara beach debris (Source: UNDDR)
responds to the gender equality policy imperative set out in the Paris Agreement.
The Marshall Islands is updating its JNAP 2014–2018. It has set the adoption of SDGs, the Paris Agreement (together with NDCs and NAPs) and the Sendai Framework as the national policy context and guiding principles for updating its JNAP. The country plans to align its National Framework for Resilience Reform with its NAP to ensure appropri-ate relevance to funding.
Vanuatu has integrated CCA and DRR institutions and policy development processes.367 The National Advisory Board on Climate Change and Disaster
Risk Reduction is jointly directed by the Vanuatu Meteorological and Geohazards Department and NDMO, and operates as Vanuatu’s principle policy, knowledge and coordination hub for all matters concerning climate change and DRR. This was set up before the new law that formalizes integration.368
379

Figure 13.4. Institutional arrangements for Tonga JNAP version 2
(Source: Tonga 2018)
Tonga was the first country in the region to develop its JNAP 2010–2015. This was conceived when Tonga was considering developing its Disaster Risk Management Action Plan under HFA, in conjunction with the regional DRM framework that was in place, the Pacific Disaster Risk Reduction and Disas-ter Management Framework for Action. At the same time, Tonga was developing its NAPA for climate change under UNFCCC and the Pacific Islands Framework for Action on Climate Change. An integrated approach to CCA and DRR made sense given community vulner-abilities and risk profiles of the archipelago, and was also the most efficient approach for capacity-constrained governments.
The experience of Tonga, together with other countries in the Pacific, helped prepare the way for the 2016 FRDP.
The approval of the Tonga Climate Change Policy in January 2016 triggered the review of JNAP 1 on climate change and DRM (2010–2015), and a second JNAP to 2028 was approved in May 2018.369 The second JNAP process also had clear roles for relevant stake-holders, led by the Department of Climate Change at the Ministry of Meteorology, Energy, Information, Disaster Management, Environ-ment, Climate Change and Communications, with support of a JNAP task force.
Case study: Tonga
380 Chapter 13

The Tonga case study demonstrates that policy and institutional integration is possible where there is a high degree of overlap between disaster and climate risk and obvious connections to national development. It also demonstrates that integration can be an efficient solution for a small government, when backed by strong governmental commitment to JNAP priorities thereby attracting long-term resource commitments from development partners.
13.6 Conclusions
Coordinated national policymaking for climate change adaptation and disaster risk reduction
Coordination can be achieved most effectively at the national level during the production of strate-gies and plans in support of development. CCA and DRR are both sufficiently flexible concepts to enable countries to develop and implement plans and strat-egies based on national circumstances and needs.
How countries report and produce plans in response to different multilateral agreements is a differ-ent issue; at times, such requirements can militate against integration. The international context also includes coordination of support that comes under
the different umbrellas based on the special require-ments of each source.
Coordinated national technical assessments and solutions for the full spectrum of risk
Risk assessments for climate change and disas-ters are often carried out by different teams, and are supported and guided by different agreements and bodies internationally. It must be recognized that although disaster and climate risk have significant overlap, there are also substantial aspects in which they do not coincide, and this is an important chal-lenge for integrated risk governance at national and local levels. However, in the realm of hydrometeoro-logical risk for example, a suite of applicable tools are available including those that address adapta-tion/risk reduction, either planned or contingent, and management of extremes and disaster losses. A country could choose to coordinate these aspects of CCA/DRR assessments, provided the assess-ments cover the dimensions and timescales rele-vant to each type of risk, from the present through to the medium and long terms.
However, as set out in Part I of this GAR, in fully inte-grated approaches under the Sendai Framework, assessments and solutions must also consider
369 (Tonga 2018)
JNAP is recognized as the summary of the country’s priorities regarding disaster risk and climate risk management. A high-profile docu-ment for the government and NGOs and part-ners, JNAPs are referred to by implementing ministries and NGOs refer to in their project pro-posals – notably for projects related to climate change – reflecting the efficacy of this gover-nance mechanism. The establishment of robust governance arrangements and approaches to integration, with dedicated technical resources
are key success factors in Tonga. A three-per-son JNAP Secretariat, for which human and financial resources have been made available, provides a focal point for activities identified for the JNAP Technical Committee, and is acknowl-edged as critical in the successful coordina-tion of JNAP in Tonga. While enduring external support by development partners is recognized as having been essential to ensure implementa-tion, these resources may not be sustainable in the long term.
381

risk from non-climate-related natural and man-made hazards and risks (especially geophysical and biological, technological and environmental), as well as cascading and systemic risks, including possible amplifying effects of climate change.
Integrated and coordinated activities – minimizing complexity and avoiding duplication
Many organizations have prepared supplemen-tary materials to NAP technical guidelines, to offer advice on how to promote synergy with other frame-works. A supplement that covers DRR issues is under development by UNDDR and UNFCCC in close collaboration with the Least Developed Countries Expert Group on Adaptation. It will provide options for countries to better coordinate their efforts at the national level when addressing DRR and CCA through NAPs.
There are other global frameworks and multilateral agreements that also entail actions which address CCA and DRR. For example, the NUA and regional frameworks – such as Africa 2063 – have areas of work that can be better integrated at the national level. A broader integrating framework, such as the NAP-SDG iFrame being developed by the UNFCCC Least Developed Countries Expert Group, may be suitable to support formulation and implementation of adaptation plans.
Global attempts to create synergies are commonly successful when coordination at regional, national and local levels is assured by a strong lead insti-tution with a robust coordination mandate. As DRR and CCA are issues that affect many sectors, isolated action is rarely successful, and real coher-ence can take place only if silos are broken at the level where implementation occurs.
Integration of disaster risk reduction and climate change adaptation into financial and budgetary instruments and frameworks
Many of the country cases cited illustrate the impor-tance of adequate capacities and resources for implementation. While a strong governance mecha-nism and accessible risk information are impera-tive for implementation, risk reduction remains aspirational unless it is translated into a budget-ary process. Instead of perpetuating institutional competition for separate resource streams, finan-cial instruments need to be made available that operate at the nexus between DRR and CCA and provide comprehensive financial resources. Financ-ing mechanisms still need to be adjusted to this paradigm.
Overall, the approach of integrating DRR into CCA plans seems to be most successful where hydrome-teorological disaster risks are most prominent, and the impact of climate change is felt most keenly. Integrated approaches may not be the right fit for all countries, but the potential for accelerating imple-mentation is significant, when there is political will.
382 Chapter 13

14.1 Significance of urban areas and local-level action in the 2030 Agenda
Developing urban resilience has been the subject of a global effort and is enshrined in a number of international frameworks – including the Sendai Framework, the 2030 Agenda and NUA – all of which recognize the importance of urban action by local and subnational governments to create inclu-sive, safe, resilient and sustainable human settle-ments.370 At the United Nations WCDRR in 2015,
local and subnational governments also commit-ted to adopting local DRR strategies and plans, targets, indicators and time frames, as outlined in the Sendai Declaration of Local and Subnational Governments. This agenda recognizes the role of local governments as the primary, responsible authority during disasters, emphasizing the need for greater international collaboration with local and subnational governments.371
The 2030 Agenda also recognized the importance of local-level action, particularly through SDG 11: To make cities and human settlements inclusive, safe, resilient and sustainable. The objectives of SDG 11 include: the enhancement by 2030 of inclusive
370 (United Nations 2015a)371 (Gencer and UNISDR 2017)
Chapter 14: Local disaster risk reduction strategies and plans in urban areas
383

and sustainable urbanization and capacities for participatory, integrated and sustainable human settlement planning; to reduce deaths, number of people affected and direct economic losses caused by disasters, in particular water-related disasters, by 2030 with a focus on protecting the poor and the most vulnerable; and by 2020 to substantially
The Paris Agreement also proposes a role for local governments. It welcomes the efforts of cities and local authorities, and invites them to “scale up their efforts and support actions to reduce emissions and/or to build resilience and decrease vulner-ability to the adverse effects of climate change and demonstrate these efforts.”373
NUA brings together all these frameworks by proposing implementable actions in urban areas. In particular, in its section on Environmentally Sustain-able and Resilient Urban Development, NUA recog-nizes that “urban centres worldwide, especially in developing countries, often have characteristics that make them and their inhabitants especially
increase the number of cities and human settle-ments adopting and implementing integrated policies and plans towards inclusion, resource effi-ciency, mitigation and adaptation to climate change, resilience to disasters and holistic DRM at all levels in line with the Sendai Framework.372
vulnerable to the adverse impacts of climate change and other natural and human-made hazards.” NUA calls for national urban policies that commit to “strengthening the resilience of cities and human settlements, including through the development of quality infrastructure and spatial planning, by adopt-ing and implementing integrated, age- and gender-responsive policies and plans, and ecosystem-based approaches in line with the Sendai Framework.”374 It also calls for mainstreaming data-informed DRR and management at all levels of government to reduce vulnerabilities and risk, and highlights that risk is present in areas of formal and informal settlements, including slums. An important element of NUA is that it aims to “enable households, communities,
Figure 14.1. Number of urban areas with populations over 750,000 affected by disasters (1985–2015)
(Source: Gencer and UNDDR 2017)
384 Chapter 14

372 (United Nations General Assembly 2015a)373 (United Nations General Assembly 2015b)374 (United Nations 2017b)375 (United Nations 2017b)
376 (UN-GGIM 2017)377 (Hardoy, Gencer and Winograd 2018)378 (Anton et al. 2016)
institutions, and services to prepare for, respond to, adapt to, and rapidly recover from the effects of hazards, including shocks or latent stresses.”375
The availability of relevant geospatial and statis-tical information can assist countries to better understand, formulate policies on, and manage risk and impacts. For this reason, the United Nations Committee of Experts on Global Geospatial Infor-mation Management has developed the Strategic Framework on Geospatial Information and Services for Disasters.376 This approach offers urban areas and cities options for strengthening risk gover-nance, enabling these localities to access and utilize nationally generated geospatial informa-tion as well as feeding local information back to the national level. This mitigates consistent chal-lenges regarding the provision of geospatial infor-mation and strengthens informed decision-making and monitoring, before, during and after hazardous events.
14.2 Opportunities and benefits of local disaster risk reduction strategies and plans
For a local DRR strategy to be fully aligned with the Sendai Framework, it should be coherent with all the above-mentioned global frameworks, as well as being integrated into the development agenda for the relevant urban area or local government, subnational or national territory. The importance
of taking local-level actions to reduce current risk, prevent risk creation and increase cities’ resilience, is affirmed by Member States in adopting the post-2015 global agreements. However, the reality is that integrated implementation is not consis-tently pursued across countries or within States and regions. Nor do many national urban policies employ systems-based approaches to urban risk reduction.
Mainstreaming DRR strategies in urban develop-ment plans comes with distinct challenges, but also generates opportunities for sustainable devel-opment, potentially bringing economic benefits. Impacts of disasters are most immediately and intensely felt at the local level. Hazards often occur and risk often manifests locally; thus many of the most effective tools to reduce exposure and vulner-ability, are executed at the local level; these include land-use regulations and enforcement of building codes, as well as basic environmental manage-ment and regulatory compliance that are essential for effective DRR. Governments and communities can best engage with each other and work together at the local level on DRR, but also in implement-ing sustainable development and environmental management.377
Some research suggests local governments are more likely to develop DRR strategies or undertake DRR and resilience building actions when these are absent or limited at national or regional govern-ment level. In an examination of climate-compatible development by subnational actors across Africa, Asia, and Latin America and the Caribbean by the Climate and Development Knowledge Network, it was found that “national governments may play a more passive role in creating enabling conditions through legal and policy frameworks that implic-itly support climate-compatible development or, at least, do not undermine it.”378 It is still critical that national and subnational governments put in place
385

and continuously upgrade, and enforce and incen-tivize, critical regulations, such as building and flood risk standards.
Productive interplay among different levels of government can be observed. For example, a review of DRM and climate resilience building in the United States of America over the last two decades found that the existence of multiple layers of government has “been an effective safety guard against any indi-vidual player’s potential unwillingness to undertake protective risk management or climate resilience building.” Where political will was lacking at state and regional levels, federal-level support combined with private sector initiatives and charitable foun-dations could make valuable progress, although “climate resilience building actions in the USA have been proven most effective at the city administra-tive level.”379
Successful initiatives at the local level can influence regional and even national level actions, creating a second or third wave of initiatives inspired by the original project.380 Evaluators of the United States Agency for International Development (USAID) Neighborhood Approach project across urban informal settlements in Latin America observed that some of the local projects funded by USAID generated multiplier effects at different levels. For example: a land tenure strategy in Jamaica that was defined by the NGO Habitat for Humanity is planned to be extended to the whole country and to involve other civil society organizations and institutions; an afforestation strategy for land-use management and DRR in Peru has been recognized internation-ally by FAO as good practice; and in Colombia, the Neighborhood Approach project reached out to the city’s communities and became part of an expanded municipal DRR approach.381
Local-level DRR actions can be triggered by a disas-ter event that provides “a window of opportunity” for resilience building. The aforementioned Neighbor-hood Approach project has observed that several emergencies triggered by El Niño in 2017 in north-ern Peru had actually facilitated the process of building disaster risk awareness in local authori-ties.382 A similar assessment was made for DRM
activities at the state level in India, where it was found that “[a] few States that encountered mega disasters have learnt from the catastrophes and developed systems and processes to deal with disasters”; however, “a few States that faced major disasters have not been so proactive in transform-ing the challenges into opportunities.”383 Hence, there are many other triggering factors and benefits for local governments to prioritize DRR and resil-ience as part of their development agenda.
Reducing disaster risk and building resilience can establish a leadership legacy; wherein strengthened trust in, and legitimacy of, local political structures and authority, and opportunities for decentral-ized competencies and optimization of resources, emerge. Developing sociocultural gains while simul-taneously reducing disaster losses and sustaining economic growth can provide positive assurance for investors. Developing more liveable communi-ties with balanced ecosystems, better urban plan-ning and design, and active citizen participation can create a successful platform for urban governance. Finally, the development of an expanded knowl-edge base with growing access to an expanding network of cities and partners committed to DRR can increase resilience through the exchange of practices, tools and expertise.384
A research project that highlights the fundamen-tals of successful collaborative networks and their relevance to developing the New Zealand Resil-ience Network underscores the significance of global networks to share knowledge and resources. Through an assessment of the level of resilience in the seven largest cities in New Zealand, it was found that the larger, more dynamic cities of New Zealand – which included two member cities of the Rockefeller 100 Resilient Cities Programme – were “well informed, have resilience plans and prioritized projects related to enhancing their resilience, and secured the financial, human, and other resources required.”385 While the study also noted that other small cities had more dispersed resilience initia-tives, some of these were rated as “robust and effective”.386 This once again demonstrates the importance of adopting flexible, context-specific approaches to local risk reduction, especially where
386 Chapter 14
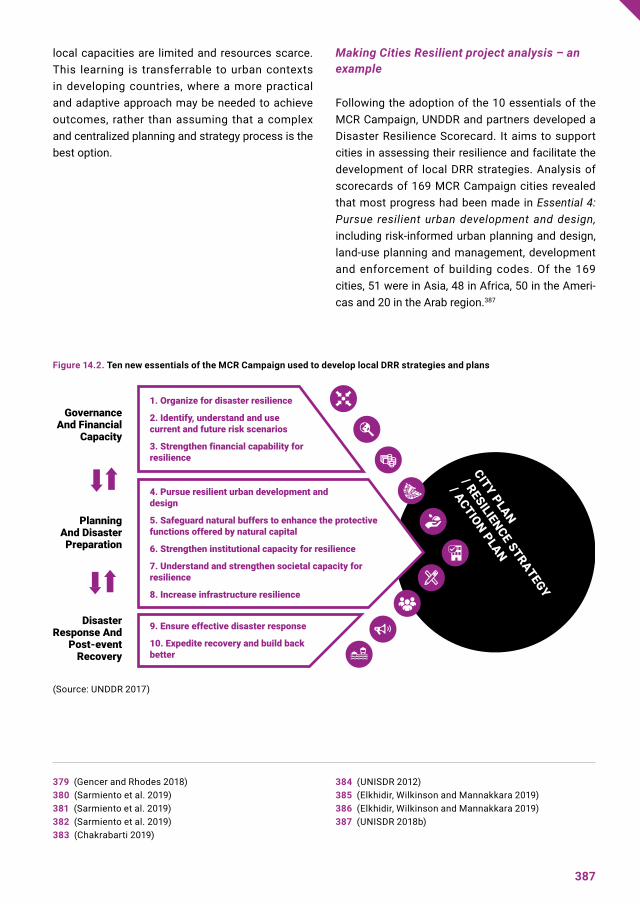
379 (Gencer and Rhodes 2018)380 (Sarmiento et al. 2019) 381 (Sarmiento et al. 2019) 382 (Sarmiento et al. 2019)383 (Chakrabarti 2019)
384 (UNISDR 2012)385 (Elkhidir, Wilkinson and Mannakkara 2019)386 (Elkhidir, Wilkinson and Mannakkara 2019)387 (UNISDR 2018b)
local capacities are limited and resources scarce. This learning is transferrable to urban contexts in developing countries, where a more practical and adaptive approach may be needed to achieve outcomes, rather than assuming that a complex and centralized planning and strategy process is the best option.
Making Cities Resilient project analysis – an example
Following the adoption of the 10 essentials of the MCR Campaign, UNDDR and partners developed a Disaster Resilience Scorecard. It aims to support cities in assessing their resilience and facilitate the development of local DRR strategies. Analysis of scorecards of 169 MCR Campaign cities revealed that most progress had been made in Essential 4: Pursue resilient urban development and design, including risk-informed urban planning and design, land-use planning and management, development and enforcement of building codes. Of the 169 cities, 51 were in Asia, 48 in Africa, 50 in the Ameri-cas and 20 in the Arab region.387
Figure 14.2. Ten new essentials of the MCR Campaign used to develop local DRR strategies and plans
(Source: UNDDR 2017)
387
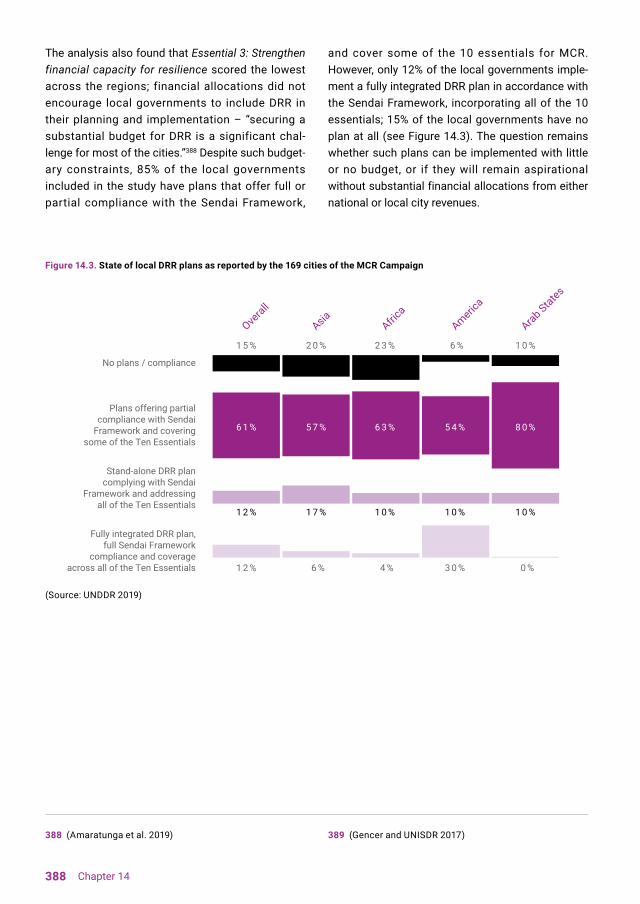
The analysis also found that Essential 3: Strengthen financial capacity for resilience scored the lowest across the regions; financial allocations did not encourage local governments to include DRR in their planning and implementation – “securing a substantial budget for DRR is a significant chal-lenge for most of the cities.”388 Despite such budget-ary constraints, 85% of the local governments included in the study have plans that offer full or partial compliance with the Sendai Framework,
and cover some of the 10 essentials for MCR. However, only 12% of the local governments imple-ment a fully integrated DRR plan in accordance with the Sendai Framework, incorporating all of the 10 essentials; 15% of the local governments have no plan at all (see Figure 14.3). The question remains whether such plans can be implemented with little or no budget, or if they will remain aspirational without substantial financial allocations from either national or local city revenues.
388 (Amaratunga et al. 2019) 389 (Gencer and UNISDR 2017)
Figure 14.3. State of local DRR plans as reported by the 169 cities of the MCR Campaign
(Source: UNDDR 2019)
388 Chapter 14

(Source: Gencer and UNDDR 2017)
14.3 Design, development and implementation challenges of local disaster risk reduction strategies and plans
As the above analysis shows, the percentage of cities with DRR plans that are fully compliant with the Sendai Framework and the 10 essentials of the MCR Campaign is still low. One of the reasons is that the provision of clear mandates regarding DRR is still a challenge for many local governments. Decentralization of powers and vertical integration of risk governance among national and local author-ities remains limited. This is compounded by a lack of tools to improve the quality of disaster-related decision-making; for systems analysis (simulation,
optimization and multi-objective analysis) for example. Officials charged with managing urban areas need a complete, holistic understanding of physical system dynamics of disaster-affected areas and adjacent regions. Equally, insights into the variables that govern the interactions among human (people and economy) and natural (water, land and air) systems, and the built environment (buildings, roads, bridges, etc.) in particular, are much sought after.
As regards the level of authority, capacities and responsibilities that local governments possess for activities related to the 10 essentials, only 46.7% of surveyed governments have full author-ity and capacity to undertake the 13 DRR actions identified at local level (see Box 14.1), 39.7% have partial powers (limited or distributed among other institutions) and 13.5% have no powers to under-take these actions.389 In many instances, local governments have partial or no responsibility to develop a city vision or strategic plan; 1 in 10 of those assessed had no responsibility whatsoever, rather the responsibility is divided among multiple institutions.
a. Developing a city vision or strategic plan with concepts of resilience
b. Establishing a single point of coordination for DRR
c. Undertaking risk analysis for multiple hazards
d. Developing financial planning for resilience
e. Developing and updating urban plans with up-to-date risk information
f. Updating building codes and standards and enforcing their use
g. Protecting, conserving and restoring eco-systems for resilience
h. Developing a critical infrastructure plan or strategy for resilience
i. Strengthening institutional capacity for resilience
j. Identifying and strengthening societal capacity for resilience
k. Developing a disaster management and/or emergency response plan and protocols
l. Developing or ensuring connections to EWSs
m. Developing a strategy for post-disaster recovery and reconstruction that ensures building back better
Box 14.1. DRR actions that indicate local government powers and capacities
389

Shared responsibilities for the development of a city vision or strategic plan is not uncommon. For example: in Sendai city (Japan), the national government and the prefectural governments share responsibilities for the city vision and plan; in Makati city (Metro Manila, Philippines), the local authority, metropolitan bodies and national govern-ment agencies share responsibilities for planning and development; and in Honduras and the Bolivar-ian Republic of Venezuela, the central government is the primary body responsible for the develop-ment of a city vision or strategic plan.390 From the city government perspective, this may be experi-enced as a lack of adequate powers at local level, as
Even where local governments have the relevant authority to develop DRR strategies or manage risk, limited capacities and resources hinder implemen-tation. For example, the capacity to update and enforce the use of building codes and undertake multi-hazard risk analysis is frequently lacking.392
emphasized in the Urban Climate Change Research Network Second Assessment Report on Climate Change and Cities, which pointed to important gaps between national policies and city government needs, particularly in small countries, where author-ity to intervene mostly lies at the national level.391
Figure 14.4 illustrates local governments’ overall authorities, capacities and responsibilities for DRR from the same study, demonstrating that the authority to plan for DRR, and even the legal authority to carry out the necessary actions, was not matched by the resources and capacities for implementation.
Climate-compatible development actions of subna-tional authorities suffer similar issues, where “there is often disparity between the need for political and financial authority, resources, and capacity to respond to climate-related challenges at the subna-tional level, and the actual power, resources, and
Figure 14.4. Local government authorities, capacities and responsibilities for DRR (% full authority, capacity and/or responsi-bility)
(Source: Gencer and UNDDR 2017)
390 Chapter 14

390 (Gencer and UNISDR 2017) 391 (Gencer et al. 2018)392 (Gencer et al. 2018) 393 (Anton et al. 2016) 394 (Anton et al. 2016) 395 (Anton et al. 2016)396 (Hardoy, Winograd and Gencer 2019)
397 (Hardoy, Winograd and Gencer 2019) 398 (Hardoy, Winograd and Gencer 2019)399 (Gencer et al. 2018)400 (Anton et al. 2016)401 (Gencer et al. 2018) 402 (Hardoy, Winograd and Gencer 2019); (Anton et al. 2016); (Gencer et al. 2018); (Maurizi et al. 2019)
capacity available”. This is commonly a function of partial or unclear devolution of power, a lack of clear delegation or vertical integration.393
Many local administrations do have clear author-ity for specific DRR actions that are part of long-established municipal activities, such as developing urban plans. However, for activities such as ecosys-tem preservation and restoration, which are tradi-tionally the responsibility of the environmental, regional or subnational authorities, legal authority for local governments tends to be limited.394
Lack of coordination among horizontal and vertical agencies and sectoral silos can therefore exacer-bate limitations on the powers of local governments to actively pursue DRR and resilience building. Such coordination is particularly important in addressing risks that span administrative and systems bound-aries – environmental risks for example – where effective cooperation is essential.395 In essence, tackling urban risk requires a systems thinking approach to risk governance. This is a challenge for most national and local administrations, as it requires new approaches and tools to support verti-cal and cross-sectoral integration.
Inadequate coordination and interactive stake-holder partnerships can impede knowledge acqui-sition and management in local governments. A project on Participatory Decision Making for Climate Resilient Development in three cities across Latin America found that there was adequate infor-mation and data available in the three cities to start carrying out vulnerability and risk assessments, despite prior assumptions to the contrary. The chal-lenge was that the information was held by differ-ent actors – government offices, academic and
research centres, and international organizations – and the difficulty lay in accessing data and infor-mation.396 There were conflicting regimes for data verification and often incompatible formats that made it difficult to share information among institu-tions and actors. Consequently, local governments could not access the technical capabilities to gener-ate and process the information they needed.397 In addition to information gaps, other impediments to local DRR actions include the lack of technical capacity and training, and difficulties in assembling the technical-political teams with the right profile to influence decision-making.398
Budgetary constraints represent the biggest chal-lenge to local DRR and climate adaptation. To overcome this obstacle, it is important to be able to demonstrate in each context that ex ante DRR is a better use of scarce resources than the alter-native of responding after damage and disruption occurs.399 Mobilizing private funding without the backing of national governments is still proving to be a major challenge for medium to small subna-tional entities.400 Investments that can reduce risk and increase adaptive capacity are often not priori-tized, while benefits may only show at a later stage and are thus heavily discounted.401 The creation of national and local urban policies including DRR are critical for long-term economic success, competi-tiveness and resilience. However, short mandates and recurrent elections, deadlines of political agendas and urgencies of daily management can militate against such long-term systems thinking. The common corollary being a lack of investment in strengthening technical and professional capaci-ties, and the failure to plan and work over the longer time frames required for resilient urban develop-ment planning.402
391

14.3.1 Disaster-risk-informed city vision and sustainable growth strategy
It is often in the aftermath of major disaster events that the impetus to adopt city-wide approaches to DRR become apparent, as was the case in New York City following Hurricane Sandy.
New York City’s vision provides the basis for coher-ent, convergent approaches pursuing sustainability, climate adaptation and resilience, and provides a road map for implementation of specific strategies and initiatives.
In 2013, after Hurricane Sandy, New York City released PlaNYC: A Stronger, More Resilient New York, which documented the lessons learned from Sandy, and developed a strat-egy to build back better and achieve resilience towards the impacts of climate change, includ-ing risk from rising sea levels and extreme weather events.403 In 2015, the city launched the latest city vision document, OneNYC: The Plan for a Strong and Just New York City, which was developed in partnership with the Rock-efeller 100 Resilient Cities project. OneNYC cites “sustainability” as a cornerstone, stating that New York City will be the most sustain-able big city in the world and a global leader in the fight against climate change. It also cites “resiliency”, ensuring that New York’s City’s neighbourhoods, economy and public services will be ready to withstand and emerge stronger from the impacts of climate change and other twenty-first century threats.
Within its vision of being a resilient city, New York City has made significant progress in terms of neighbourhood resilience. Since 2015, it has supported resilience and preparedness planning of community and faith-based orga-nizations and small businesses, and promoted
Case study: New York City
volunteer and civic engagement across the five boroughs, to address risks from heat-waves and rising temperatures. It has provided small businesses with training, technical assess-ments and preparedness grants to enhance their resilience. In terms of resilience of build-ings, since Hurricane Sandy, the city has led efforts to adapt the existing building stock to evolving climate risks through a multi-layered approach, including upgrading of physical systems in family homes and multifamily build-ings, changing zoning and land-use policy, working with FEMA to produce more accu-rate maps, and educating building owners about climate risk and mitigation options. The city continues to address Hurricane Sandy’s impacts on its infrastructure, protecting its power, transportation and water systems, while also addressing emerging risks, such as extreme rainfall, through resilient design. The city has also advanced numerous coastal defence projects since 2015. In coordination with community stakeholders, it has sought to deliver cutting-edge flood risk mitigation solu-tions that are integrated into the urban fabric of neighbourhoods and provide co-benefits such as recreational space wherever possible.
392 Chapter 14

14.3.2 Challenges and opportunities in developing disaster risk reduction strategies in different regions
To speak of the urban implies cities, and there is a wide range of characteristics that fall under this subject. These include administrative limits, size of population, density, contiguous urban areas and their socioeconomic interconnections, governance mechanisms and resources. For the post-2015 DRR agenda, there is no particular approach in the Sendai Framework, NUA, Paris Agreement or SDGs that contemplates the different conditions that exist in the broad spectrum of cities and city contexts. For NUA, the risk management regime considers cities with respect to income (low and high) and
does not consider the cities’ typology or the implica-tions of the size of the city and its population. These are critical conditions however for those developing countries that experience a steady increase in the size of small- and medium-sized cities.404
According to The World’s Cities in 2018 report, an overwhelming majority of the world’s cities have fewer than 5 million inhabitants. Among these, 598 cities have populations between 500,000 and 1 million; 467 cities have populations between 1 million and 5 million; 48 cities have populations between 5 million and 10 million; and 33 cities have more than 10 million inhabitants (megacities). The projected numbers for 2030 show an exponential increase: 710 cities are expected to have between 500,000 and 1 million inhabitants; 597 cities with 1 million to 5 million inhabitants; and 66 cities will
403 (Gencer and UNISDR 2017); (City of New York 2011); (City of New York 2018)
404 (Garschagen et al. 2018)
View of Mogadishu (Source: MDOGAN/Shutterstock.com)
393

have between 5 million and 10 million inhabitants, of which 13 will be located in Asia and 10 in Africa. The number of cities with more than 10 million inhabitants is projected to increase to 43.405
To understand the challenges and opportunities in developing DRR strategies, it is also important to recognize the significant differences in the char-acter of urban environments around the globe. For example, in the Arab and North Africa region, there is a growing number of large agglomerations with populations of more than 1 million people. These are expected to reach 18 by 2030, account-ing for 24% of the total population of 128 million people in the region.406 The urban context, and thus vulnerability and risk in the region, are defined by unique aspects of demographics, sociopolitical and economic development. Such aspects include the increased flows of refugees and migrants; the region has the largest global number of IDPs, at 17.3 million. Urban slums are not a signifi-cant feature in the Arab and North Africa region as a whole, but certain countries in North Africa have very high levels of informal settlement. For example, in Sudan, the share of the population living in poor informal settlements is 91.6%, in Mauritania, it is 79.7%, and in Somalia, it is 78.6%.407
Many of the cities in the Arab and North Africa region are subject to hydrometeorological and geophysical hazards. The complex nature of the evolving risk landscape is most articulated in coastal areas, which are particularly susceptible to flooding, as well as seismic and climate risks. Due to highly arid conditions, the region is one of the most vulnerable to climate change, putting cities at risk of water scarcity and extreme heat conditions. With these complex conditions, building resilience through developing strategies and plans to reduce
risk in the cities of the Arab and North Africa region has become more essential than ever.
A comparative analysis of 25 Arab region cities’ resilience assessments identified trends and inves-tigated challenges and opportunities for implement-ing the Sendai Framework in the Arab region at the local level.408 Of the 25 cities that participated in this study, 18 of them (72%) had a city master plan or relevant strategy in place that were in partial compliance with the Sendai Framework and cover-ing some of the 10 essentials. However, it was found that the “underlying risks of humanitarian crisis and disasters challenge the process of build-ing resilience in the Arab region, combined with the lack of coping capacities when faced with climate change, conflict, and displacement.”409
Another impediment to the development of DRR strategies and plans in the Arab and North Africa region is the lack of disaster-related data. City-wide hazard maps are often limited or do not exist, while updates on risk assessment are scarce and lack clear multi-hazard components, according to a recent assessment.410 This challenge is often linked to disaster risk governance, when the legal frame-work fails to require the maintenance and updating of disaster data. Given the complex risk environ-ment in the region, it is of paramount importance that urban DRR strategies are based on sound risk information, to ensure that implementation priori-tizes the most at-risk population and assets. These challenges must be addressed in the near term in relevant cities, if city master plans that already exist are to be successfully realized.
405 (UN DESA 2018a)406 (Eltinay and Harvey 2019); (UNDP 2018d)407 (UNDP 2018d)408 (Eltinay and Harvey 2019)409 (Eltinay and Harvey 2019)410 (Eltinay and Harvey 2019)
411 (Case study based on information from UN-Habitat City Resilience Profiling Programme; UN-Habitat n.d.)412 (Mozambique 2010); (Instituto Nacional de Estadística 2019)413 (UN News 2019)
394 Chapter 14

14.3.3 Collaborative, integrated and holistic resilience building
Resilience building is not something that can be undertaken effectively by local government authorities acting alone. The process undertaken in Maputo, Mozambique, illustrates the benefits to all of broad stakeholder and cross-sectoral engagement.
Mozambique is undergoing a process of rapid urbanization.411 While 32% of the nation’s population can be considered as living in “urban areas”, this percentage is projected to rise to 37% by 2020. By 2025, Mozambique is projected to be the fourth most-urban-ized country in sub-Saharan Africa, with 50% urban dwellers. The Mozambique National Statistics Institute puts the population of the capital Maputo at over 1.273 million people. This poses enormous challenges for the local government in its efforts to deliver basic services, provide food and improve the city’s infrastructure, which creates enormous vulner-abilities and exposure to risk.412
Maputo is the largest city in Mozambique and the main financial, corporate and commercial centre of the country. Located on the western shore of Maputo Bay, the city is close to the triple border of Mozambique, South Africa and Eswatini (formerly known as Swaziland). As a function of its location, exposure to natural hazards – notably flooding and cyclones – is high, and expected to worsen as climate change brings sea-level rise. Maputo was fortunate on this occasion to have avoided the loss and damage wrought by Cyclone Idai in March 2019 on the city of Beira and large areas to its west, where the vulnerabilities of the city and surrounding region were laid bare (see section 13.4.5).413
Changing rainfall patterns and the reduc-tion of river flows are expected to lead to the
decrease of soil water recharge and availabil-ity of surface water. Of the total population, 70% live in informal settlements, resulting in major urban challenges and widespread and entrenched vulnerabilities as a result of economic crises and unemployment.
In 2010, the World Bank and the National Disaster Management Institute identified Maputo Municipality as one of the most risk prone in Mozambique. Since then, the munici-pality has collaborated with international initiatives and programmes to better under-stand and tackle the various shocks, stress-ors and challenges in the city, especially those related to climate change. One of the flagship initiatives is the City Resilience Profiling Tool (CRPT), which was launched in 2017 and will continue through 2019, with the goal to better understand urban hazards, and their impacts on inhabitants and functionality through in-depth data collection, resilience analysis, identification of key actors and development of priority actions.
Through the metrics provided in CRPT, Maputo has been able to conduct an analysis of its data along a resilience baseline. The result is the city’s own “resilience profile”, which high-lights vulnerabilities, risks, data gaps and capacity bottlenecks. In Maputo, initial analy-sis has indicated that epidemics and pandem-ics such as malaria, natural hazard risks such as heat-waves, floods, drought and tropical cyclones, and environmental risks such as
Case study: Maputo, Mozambique
395

The resulting disaster resilience policy will be more easily integrated into existing urban development strategies and more readily implemented, because of the multi -stakeholder and cross-sectoral process.
Maputo’s approach to building city resilience is work in progress, but the highly engaged process has provided a strong base for a new policy, and has been successful in attracting resources and other necessary support to the local government.
coastal erosion are the most pressing for the city. Although these risks may not be “new” to the city, through CRPT, the city has an evidence base to support action and an in-depth under-standing of pressure points, stressors and key actors that should drive transformational and sustainable change.
By providing robust guidance and assis-tance in creating a policy to be called Actions for Resilience, the CRPT process is attract-ing resources and other support to the local government to improve decision-making and to contribute to long-term, resilience-based sustainable urban development.
To build on the stakeholder engagement developed throughout implementation, the Actions for Resilience will be finalized through a dialogue among city officials and relevant stakeholders. Furthermore, as the data collec-tion, analysis and diagnosis stages take into account ongoing plans, policies and programmes in the city, the resulting Actions for Resilience in Maputo will be more easily
integrated into existing urban development strategies as opposed to an isolated resilience action plan that might not be joined with other initiatives in the city. This process will allow integration with the Ecosystem Based Adap-tation Plan and the Metropolitan Transport Project, as well as relevant new policies, plans and agreements that are currently being devel-oped at the municipal level.
396 Chapter 14
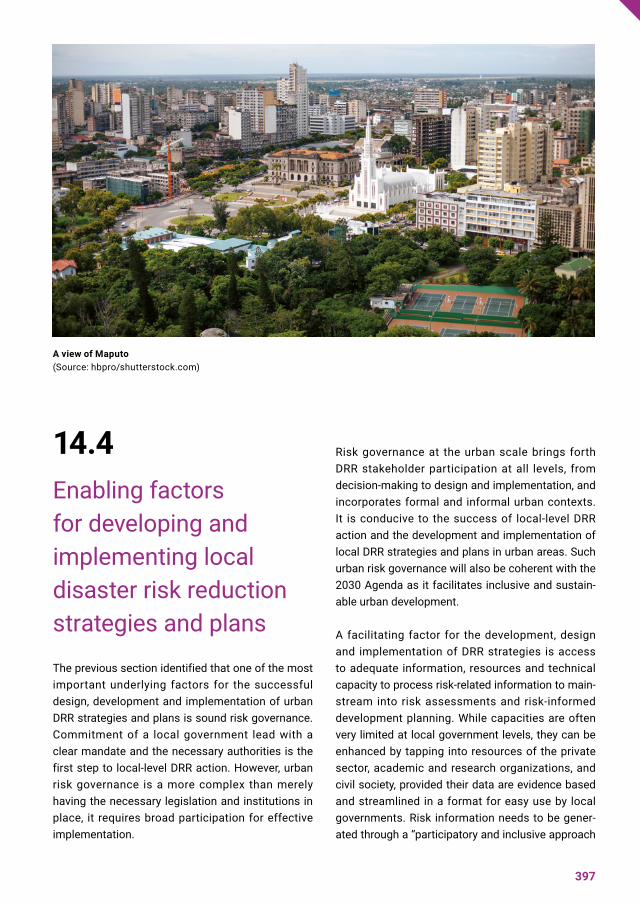
14.4 Enabling factors for developing and implementing local disaster risk reduction strategies and plans
The previous section identified that one of the most important underlying factors for the successful design, development and implementation of urban DRR strategies and plans is sound risk governance. Commitment of a local government lead with a clear mandate and the necessary authorities is the first step to local-level DRR action. However, urban risk governance is a more complex than merely having the necessary legislation and institutions in place, it requires broad participation for effective implementation.
Risk governance at the urban scale brings forth DRR stakeholder participation at all levels, from decision-making to design and implementation, and incorporates formal and informal urban contexts. It is conducive to the success of local-level DRR action and the development and implementation of local DRR strategies and plans in urban areas. Such urban risk governance will also be coherent with the 2030 Agenda as it facilitates inclusive and sustain-able urban development.
A facilitating factor for the development, design and implementation of DRR strategies is access to adequate information, resources and technical capacity to process risk-related information to main-stream into risk assessments and risk-informed development planning. While capacities are often very limited at local government levels, they can be enhanced by tapping into resources of the private sector, academic and research organizations, and civil society, provided their data are evidence based and streamlined in a format for easy use by local governments. Risk information needs to be gener-ated through a “participatory and inclusive approach
A view of Maputo (Source: hbpro/shutterstock.com)
397

in generating, improving and managing informa-tion” including risk-related geospatial information, which should be used by all entities engaged in DRM efforts.414
Another critical factor for the successful develop-ment and implementation of local DRR strategies and plans in urban areas is the strength of planning institutions and norms in that locality. The role of planning is indispensable for mainstreaming DRR into urban development plans. The aforementioned study of the USAID Neighborhood Approach project across informal settlements in Latin America found that it was the local governments that had the more comprehensive urban development capabilities that were most able to foster cross-sectoral inte-gration and to mainstream DRR practices in urban development.415
Various types and scales of urban plans, from terri-torial to land-use zoning, can help to protect envi-ronmentally sensitive areas, and hence increase resilience. They can: reduce disaster risk through better planned infrastructure and the creation of open spaces; reduce vulnerability through appropri-ate location of housing and other critical services; mitigate climate change by ensuring optimum use of energy and reducing GHG emissions; and improve resilience by ensuring upgrading and retro-fitting of poorly planned and constructed settle-ments, ideally through a participatory process that will ensure implementation and sustainability.416 Furthermore, the consideration of innovative plan-ning and design ideas such as urban green growth strategies, transit-oriented design, creative open and public space development, and the use of green and blue infrastructure can help to reduce risk in urban areas while improving living conditions and driving cities towards sustainable and resilient development.417
An example comes from China’s Sponge City Programme, which has established methods for flood risk reduction, water conservation, improved water quality and reduction of heat island effects by using ecological infrastructure. Run-off water volumes are reduced by preservation and restora-tion of green spaces over hard impervious surfaces, which also reduces day- and night-time tempera-tures. There are cultural, ecological and health benefits too, which all help to build community resilience.418
Implementation of risk-sensitive planning can help reduce the risk in established informal and slum settlements, and the provision of suitable land for housing for all income groups can also reduce the growth of informal settlements. Given the presence of informal settlements in many rapidly urbanizing cities, participatory slum-upgrading practices may be a prerequisite for DRR and resilience building in these areas if it is not immediately possible to offer suitable land, infrastructure, and services to meet the needs of populations moving from impover-ished rural economies, or as a result of conflict and crises.419
An enabling factor for local DRR strategies in urban areas is developing an understanding of emerg-ing risks, aided by developments in systems and systemic risk modelling, which allow the develop-ment of context-specific approaches in local DRR strategies and planning from neighbourhood to city and territorial level. Such approaches must be backed up by the enforcement and updating of national codes and standards as part of national urban policies.
414 (UN-GGIM 2017)415 (Sarmiento et al. 2019)416 (Johnson et al. 2015)417 (Bendimerad et al. 2015)
418 (Lenth 2016)419 (Bendimerad et al. 2015)420 (Hardoy, Winograd and Gencer 2019); (Hardoy, Gencer and Winograd 2018)
398 Chapter 14

14.4.1 Participatory development of strategies for climate-resilient and inclusive urban development
Climate-resilient and inclusive urban development that involves government, community and private sector actors can be effective in managing disaster risk and addressing governance issues in cities, as was the case in Santo Tomé, Argentina.
Santo Tomé in Argentina is a rapidly growing small- to medium-sized Latin American city. It is prone to natural hazards and the impacts of climate change and is attempting to implement climate-resilient and inclusive urban develop-ment to strengthen its resilience.420
Santo Tomé is located in the province of Santa Fe and is part of the Greater Santa Fe Metro-politan Area in Argentina. Within the last decade, the city has experienced rapid popula-tion growth of 12%, almost twice the provincial average, a rate that is expected to grow further by 2025. Due to its location at the mouth of the Salado River, the city is prone to flooding; most exposed are the city’s informal settlements. The city has developed a system of defences and pumps, which are reaching their limit in terms of protection. Urban growth without adequate risk planning and inadequate infra-structure and services has led to an increase in disaster risk in the city.
A diverse group of actors including local govern-ment representatives, hydraulic engineers, officials of public works and services, urban planning, social development, health and envi-ronment, as well as civil society organizations identified the need to develop a risk information system and improve communication among local actors. They also recommended advancing a DRM plan within the urban planning process, and in the expansion and completion of infra-structure and services so that they reduce risks.
Priority actions taken cover a diverse range. They include: the strengthening of the solid waste collection system to reduce the obstruc-tion of drains and environmental risks; educa-tion campaigns and capacity-building for local actors in DRM, climate change and resilience issues; improved flood control infrastructure, city mobility, water infrastructure and water management and the incorporation of green infrastructure options based on existing norms.
Case study: Santo Tomé, Argentina
and timescales. It involved a range of stakehold-ers, including local and national government, civil society, scientific and technical experts, communi-ties and students, as well as diverse implementa-tion activities, including participatory risk mapping, use of geospatial data and public education.
The case of San Tomé highlights the diversity of actors and scope of activities that may be needed when taking a systems-based approach to develop-ing and implementing an integrated urban resilience plan.
The case study of Dar es Salaam, United Repub-lic of Tanzania, that features prior to Part III, also highlights the importance of participatory approaches from a wide range of stakeholders to address urban risk across a range of sectors, levels
399

14.4.2 Downscaling local resilience and sustainable development through multiscale and multilevel holistic approaches
Support for greater city resilience can also be initiated at provincial level, as in the province of Potenza, Italy.
The example of the province of Potenza and its development of a Provincial Territorial Coordina-tion Master Plan, demonstrates how a large group of municipalities in a region with common risks and
challenges can achieve resource efficiencies and mutual capacity-building, using innovations such as clustering, and downscaled modelling from the provincial to city level.
The province of Potenza is an Italian Local Authority of super-municipal and subregional level. It comprises 100 municipalities in its terri-tory and is exposed to a variety of natural and technological hazards.421 In 2013, the province outlined the #weResilient strategy aimed at pursuing territorial development through a struc-tural combination of environmental sustainabil-ity, territorial safety and climate change policies.
A milestone in the #weResilient strategy is the Provincial Territorial Coordination Master Plan (2013). It has been delivered to the commu-nity as an important document for guiding and addressing governance of provincial territorial development and represents a “structural” tool for analysing needs and driving local govern-ments’ choices with a wide-area strategic point of view and a multiscale and multilevel holistic approach. A new concept of territorial gover-nance has been outlined that includes the struc-tural introduction of “resilience” to disasters and climate change into territorial development poli-cies and which are to be implemented through specific actions at local and urban levels.
A fundamental aspect of the #weResilient implementation strategy is to build on active participation of communities in local decision-making processes in territorial policies, and to
assist and support municipalities. This ensures that specific urban/local strategies and actions are integrated into the general framework of #weResilient on sustainable and resilient terri-torial development.
The signatory municipalities are committed to integrating more focused sustainable develop-ment and community resilience within urban planning and related actions, including in other relevant sectors. By downscaling the model proposed by the province of Potenza, and with its support, these municipalities are locally implementing a multi-stakeholder approach. This is based on the active involvement of local institutions, organizations and associations representing different professional and social categories, to give them the opportunity to become driving forces reducing disaster risk. These municipalities are engaged in clustering processes with key community actors across all sectors. They are also looking at working with the concept of social categories, experi-menting with the use of concrete plans/actions to transform different social groups into forces for developing and implementing safe and sustainable urban policies. Through these different techniques, the approach is one of local engagement to generate new models of urban planning that work from the bottom up.
Case study: Province of Potenza, Italy
400 Chapter 14

14.5
Conclusions
Given the complex and dynamic nature of urban risk, and especially given current projections for rapid urban growth in developing economies, a focus on urban areas and local-level action is central and urgent to achieve inclusive, resilient and sustainable communities as understood in the Sendai Framework, the 2030 Agenda, the Paris Agreement and NUA. These global frameworks give prominence to the importance of urban risk reduc-tion actions, and strategy and policy development. They reflect Member States’ clear understand-ing that, without risk-informed planning, human lives will be in danger, assets will be exposed and development gains will be lost, and that this risk is especially acute in urban areas. More than half the world’s population currently lives in urban environ-ments, a figure that is projected to grow dramati-cally in the coming decades. Unplanned urban development that is undertaken without appropriate commitment to transdisciplinary, multi-risk assess-ment and systems-based approaches in developing solutions could result in critical increases in vulner-ability and exposure to both existing and new risks.
There are sound socioeconomic and ecological reasons for national governments to create national urban policies that include support for the develop-ment and implementation of national and local risk reduction strategies and plans in urban areas. It is in the interests of local authorities to develop and implement local and urban DRR strategies that, in addition to context-specific benefits, also create a legacy of leadership based on trust and legiti-macy of the local political structures and author-ity, so that civil society, the private sector, scientific and technological institutions and development partners continue to engage. Local and urban DRR
strategies safeguard sociocultural gains, and can promote social equality (including along gender lines), substantially reducing losses and sustaining economic activity while assuring investors that the environment is safe and reliable.
Local strategies also present opportunities for decentralized competencies and optimization of often scarce resources. As seen earlier, cities with limited resources and capacity often ignore risk, but may do so once forced to confront the conse-quences of disaster. As has often been observed, disaster recovery may also present opportunities to integrate risk reduction in future development processes, as governments may use these situa-tions as “triggers to increase the understanding of the risks and to mainstream the DRM approach in different sectors of development.”422
Collaboration in global initiatives creates a knowl-edge base with a growing access to an expand-ing network of cities and partners committed to DRR and resilience building with the possibility of exchange of practices, tools and expertise.423 However, despite increased awareness and obvious benefits of developing local DRR strategies and plans, many cities are still not progressing signifi-cantly regarding design, development and imple-mentation of DRR actions.
Local governments experience a multitude of chal-lenges that hinder the advancement of DRR and resilience building. The lack of sufficient authority for city governments, inadequate budget allocations and limitations in technical capacity, are comment and prominently cited concerns. Mobilizing private funding without the backing of national govern-ments remains a major challenge for medium to small subnational entities.424
In terms of risk information gaps, the lack of coordi-nation among horizontal and vertical agencies and stakeholder partnerships, as well as sector silos,
423 (UNISDR 2012)424 (Anton et al. 2016)
421 (Attolico and Smaldone 2019)422 (Maurizi and Fontana 2019)
401

seems to be the greatest impediment to addressing the knowledge deficit and enhancing capacities for DRR in local governments. This must be overcome, not least at the critical stage of designing DRR strat-egies and action plans when sharing data is key.
One of the biggest challenges for local DRR is to make the investment case; to convincing national and local government authorities and communities faced with limited resources and competing needs that it pays to invest in risk reduction because recovery and reconstruction costs more. The short-term nature of political process and cycles compounds this dilemma.
To overcome some of these challenges, three main enabling factors have been identified that support the development and implementation of local and urban DRR strategies.
Sound urban risk governance: Governmental struc-tures, laws and policies need to support horizontal governance in providing stakeholder engagement and integration across sectors, within the city boundary and beyond with neighbouring counties and cities. This also applies to vertical governance that strengthens the downscaling of development efforts with international, regional and national enti-ties and frameworks. Such urban risk governance should incorporate formal and informal contexts, bring forth public participation at all levels starting from data collection, assessment and decision-making to facilitate context-relevant design and implementation of local DRR strategies and plans, particularly regarding issues that concern the most vulnerable populations. Such urban risk governance will also be coherent with other development frame-works as it facilitates inclusive and sustainable urban development. Local participation strategies can also advance capacity and resource gaps by the inclusion of academia and research, as well as private sectors, in the process of resilience building.
Sustained use and application of risk informa-tion: Evidence-based risk data needs to be easy to identify and locate by local governments, even if its collection is dispersed through different govern-mental entities, or located within the academic
or private sector. Ease of application in decision-making is also key; case studies have shown the success of generating geospatial data through participatory techniques and attaining such data in a streamlined manner in local government settings.
Risk-informed urban planning and develop-ment: This is found to be another indispensable enabling factor for the success of local DRR strat-egies and plans. The integration of hazard and risk information in urban planning, design and construction should be reinforced by relevant laws, regulations and guidelines, which should be updated on a regular basis. Risk-informed urban planning requires meaningful stakeholder partici-pation, particularly when urban development processes, such as those that fail to provide access to critical infrastructure and services, can increase the vulnerability of urban populations. In the rapidly developing urban regions of Africa, Asia and Latin America where the absolute number of residents of informal settlement are growing with populations moving in increasing numbers from impoverished rural economies, industrial relocation, conflicts and crises, there is a need to understand emerg-ing risk. This means involving the most vulnerable stakeholders in the planning processes, such as in participatory slum upgrading, and developing context-based approaches in local DRR strategies and planning, which may be applied at neighbour-hood, city and territorial levels. It is also increasingly understood that integrating ecological infrastruc-ture into resilient urban land-use planning has multiple benefits in reducing risk reduction, provid-ing a cleaner water supply, reducing peak summer temperatures, and improving health and well-being.
Sound urban risk governance frameworks informed and bolstered by more readily available and more easily applicable risk information – supported by emerging capabilities in systems and systemic risk modelling – will be of crucial importance to enable effective, context-specific design, development and implementation of local DRR strategies and plans. Such approaches to building resilience in urban areas can be transformative, empowering commu-nities and ensuring inclusive and sustainable urban development.
402 Chapter 14

15.1 Problem statement
The Sendai Framework definitively articulates the shift from managing disasters to managing risk. This provides a powerful impetus for the “tradi-tional” DRR community, seeking to redress practice that has for many years seen ex ante action articu-lating the complex risk drivers from which disasters materialize eclipsed by action responding to the manifestation of disasters. Translating this shift into informed, systems-based decision-making, investment and practice in all contexts and at all scales, and reflecting this in local to national strate-gies, is arguably the principal preoccupation of this community.
Growing understanding of the complex risk environ-ments in which disasters occur has raised ques-tions for DRR policymakers and practitioners who frequently operate in complex contexts, be this in relation to complex health crises,425 or natural hazard-related disasters in contexts of environ-mental or economic stress, or armed conflict,426 for example; or a combination of several or all of these. Contexts in which humanitarian response427 and DRR428 are implemented are therefore more compli-cated and challenging than is often acknowledged or represented in policy and programmatic docu-ments. This leads to questioning how to effectively
Chapter 15: Disaster risk reduction strategies in fragile and complex risk contexts
425 (Lo et al. 2017)426 (Peters and Peters 2018)427 (Hilhorst et al. 2019)428 (Harris, Keen, and Mitchell 2013); (Peters 2018)
403

design DRR strategies that adequately reflect and address the complexity of the context in which disaster risk manifests, and the diversity of disas-ters themselves.
The expanded remit of the Sendai Framework allows the DRR community to think beyond natural hazards and to engage with complex, systemic risk. This needs to be operationalized in combination with the other post-2015 frameworks, which include mechanisms, practitioners and tools better suited to dealing with other threats, hazards and shocks. In addition to those dealing with sustainable devel-opment, climate change, good urbanization and financing development, the New York Declaration for Refugees and Migrants represents an issue that is also closely related to disaster risk in fragile contexts; all of these operate alongside threat-specific frameworks at the national level. Calls for greater emphasis on coherence in implementation across the global frameworks feature prominently in discussions on resilience.429 And notable assess-ments seeking to better understand the complexity of risk have emerged, including for example OECD resilient systems analysis.430
15.2 Empirical examples of disaster risk reduction in fragile contexts
Multiple interacting risks within a system, or complex risk, are present within all contexts, and the manifestation of this complexity is unique to each specific context. At different times within a given context, different combinations of risks
may become more or less salient. For example, particular vulnerabilities in WASH systems may be expressed when health systems in a politically unstable country falter during a rainy season. Even within a given context, there are many ways that DRR can respond to the complex interplay among risks, which also points to the necessity of adaptive management. While complex systems are challeng-ing to address, much less understand, the applica-tion of a nuanced understanding of systemic risk to local to national DRR strategies provides for expanded opportunities to achieve the goals set forth in the Sendai Framework.
The following diverse set of examples from Bangla-desh, Iraq, Somalia and South Sudan show how disaster risks materialize and are managed in the context of new and emerging hazards and threats that comprise complex risk environments. While no context is simple, the examples are set in particu-larly complex situations, illustrating how DRR has been adapted to engage more fully with environ-mental, climatic, economic, social and political challenges, including conflict, environmental fragil-ity and climate change, political upheaval, human displacement, economic shocks and health crises. The examples are not exhaustive, neither do they reflect traditional representations of DRR strategies, but they do touch on aspects of DRR policies, strat-egies, frameworks and interventions that have been drawn from direct experiences of the DRR commu-nity. They illustrate how disaster risk has been constructed – and reduced.
A theme that runs through all the cases is the chal-lenge of conflict. Upsurges in violent conflict have been shown to slow, undermine or stall DRR strat-egies and their implementation. With little in the way of practical policy guidance on how to navigate changing conflict contexts, many countries find the legislative approval of DRR laws halted – as was the case for Fiji and Nepal.431 In other contexts, increased insecurity can lead to DRR programmes
429 (Peters et al. 2016)430 (OECD 2014a)431 (Wilkinson et al. 2017)
432 (Adapted from input from UNDP)433 (Case study adapted from input from GFDRR, IDMC and UNHCR)
404 Chapter 15

being temporarily suspended. This has been the case in the Central African Republic (CAR). The violent conflict and political crisis that began in 2013 has provoked humanitarian impacts that have led to large-scale human displacement, degradation of the education system, negative impacts on sani-tation and access to water, and food insecurity.
Due to the security situation in CAR, the implemen-tation of development projects and programmes has been temporarily suspended. Development partners have focused their attention and financ-ing on the emergency situation at hand. These factors have delayed the creation of strategies and policies for DRR, but in spite of these challenges, the CAR government has established a reflection committee focused on DRR whose primary mission is to coordinate activities and create a plan for a national strategy. The first draft of NSDRR has taken the current political crisis into account. Addi-tionally, armed conflict features among the types of risks and disasters mentioned in the strategy.
Finalizing, validating and implementing the national strategy depends on financing, which is sorely needed.432 As evidenced in CAR, despite the diffi-cult operating environment, advances in DRR in policy and practice, are feasible – as the cases below demonstrate.
15.2.1 Human displacement in the context of recurrent disasters and conflict
In Somalia, the forced movement of people, most of which results in internal displacement rather than cross-border flight, can be a cause and a consequence of disaster and conflict. The regular occurrence of drought- and flood-related disasters, and outbreaks of conflict regularly drive people to flee their homes, sometimes more than once, and Somalia consistently has very high levels of annual new displacement movements.
Somalia is a highly disaster-prone country. It is susceptible to drought, riverine and flash flood-ing, and with its long coastline, storms and cyclones coming in from the Gulf of Aden and the Indian Ocean. It has also been affected by decades of conflict and political instability and insecurity.433 This includes attacks by armed groups, such as al Shabaab, and clan violence that can erupt over scarce natural resources such as water points and grazing areas. Unique and highly impactful combinations of disaster and conflict have materialized in Somalia, shift-ing from year to year. These dynamic situations of complex risk have induced large-scale human displacement, which has added to the complex-ity of the country’s disaster risk and vulnerability.
As of July 2018, there were an estimated 2 .6 mi l l ion IDPs in Somal ia aga inst a backdrop of mult ifaceted confl icts and
intensified competition for resources due to climate-related disaster events. According to the UNHCR Protection and Return Monitoring Network, some 642,000 new internal displace-ments were recorded between January and July 2018, with flooding the primary reason for displacement in 43% of cases, followed by drought in 29% of cases and conflict in 26% of cases. However, it should be noted that while there is usually a primary reason, displacement occurs often as the result of a combination of risk drivers, including economic pressures. These mounting pressures ultimately trigger people to leave their homes. Displaced people living in poorly resourced displacement camps or informal settlements are more likely to be displaced again by disasters.
Somalia has endured several severe drought episodes in recent decades. In 2011, the worst
Case study: Somalia
405

drought in 60 years resulted in 260,000 deaths and affected 13 million people in the Horn of Africa. The drought combined with the political situation resulted in large-scale famine, and led to large-scale displacement, disruption of basic services and impoverishment. In early 2017, conditions in Somalia manifested as a major drought with high famine risk; half the popula-tion was made acutely food insecure. Almost 1.3 million new displacements were recorded in 2017 due to conflict and disasters, with 84% of IDPs citing drought-related reasons for their displacement. Thanks to a massive scale-up in humanitarian assistance, famine was averted, but it remains a looming risk in the future.
Humanitarian efforts have not been simple or straightforward. Large parts of the drought-affected rural areas in southern and central Somalia were controlled by al Shabaab and were inaccessible to the government and most humanitarian organizations and international actors. To assess drought impacts under these circumstances and guarantee the personal security of staff, humanitarian actors relied on remote assessment methods that combined remote-sensing technologies and social media analytics. This was combined with informa-tion received from partner networks and limited household surveys conducted by a field pres-ence in Somalia to determine the extent of drought impacts and humanitarian needs.
In addition to drought, Somalia is also highly affected by floods. Combined with conflict and insecurity, these have led to continued population displacement internally and across borders. In early 2018, widespread flash flood-ing in the Horn of Africa destroyed extensive areas of farmland, damaged health facilities, disrupted schools and destroyed more than 15,643 houses in Somalia. Among the areas suffering the impacts of flooding were over-crowded IDP settlements. Many of the thou-sands of people displaced in the Shabelle river basin in the south of Somalia were people who
had previously been displaced by drought and were living in makeshift shelters unable to withstand heavy rain. Flooding in these settle-ments further displaced people along riverine areas. The detrimental impacts of the flash floods on the Somali population also included rising cases of acute watery diarrhoea, cholera, contaminated drinking water and higher food prices. Tropical Cyclone Sagar, which struck the north of the country in May 2018, further inten-sified the already burgeoning humanitarian needs of the affected population.
Repeated disaster- and conflict-induced displacement in Somalia have led to an increase in urbanization, as large numbers of people relocate to urban centres to access humanitarian aid and other assistance. Demo-graphic shifts contribute new layers of risk by adding additional stress to already strained key sectors such as land, housing, health, educa-tion, water supply, sanitation and livelihood. Further, in Mogadishu, displaced persons arriv-ing in the city tend to live in informal settle-ments where they are susceptible to forced evictions, and subsequently face displacement anew. They are often displaced to still worse locations, creating a positive feedback loop of displacement and suffering. In response, drought assessment and recovery frameworks are increasingly including the urban sector as a priority area; according to some assessments, the urban sector accounted for the second-highest recovery needs after agriculture.434
Attempts have been made to model disas-ter displacement risk in the Horn of Africa. These show that socially created situations of vulnerability, along with the concentration of people in areas exposed to hazards, have a large impact on displacement risk. In fragile and conflict-affected settings, special atten-tion has been paid to create interventions align-ing short-term, urgent, life-saving assistance and protection of the most vulnerable with longer-term sustainable solutions for Somalia
406 Chapter 15
434 (Adapted from input from GFDRR)435 (UNISDR and Internal Displacement Monitoring Centre 2017)
436 (FEWS NET 2018)
to strengthen its resilience and address the root causes of underlying vulnerabilities. A comprehensive drought impact needs assess-ment (DINA) improved the understanding of the dynamics and drivers of recurrent emer-gencies, and a Recovery and Resilience Frame-work proposes long-term durable solutions for building the resilience of the drought-affected population.435
Somalia has recently taken steps to formal-ize DRR measures and is currently working on a NAP. It is also part of the IGAD Drought Disaster Resilience and Sustainability Initiative (IDDRSI), for the period of 2013 to 2027, and has its own national plan within this process. IDDRSI explores the interlinkages between disasters and conflict, in the context of drought and the impacts on traditional livelihoods. It also discusses forced displacement as a cause and consequence of this, across borders and within countries.
Somalia also relies on pre-existing networks and expertise already established in the country to formulate its DRR strategies.
Technical experts (e.g. agronomists, meteo-rologists, veterinarians and water engineers), funded by international organizations, have worked on issues related to drought and its effects on pastoralism and agriculture for many years. They have been using the knowl-edge of and working with communities and local governments, sometimes informally, for decades.436 There are also multiple exam-ples of cooperation between humanitarian and development organizations to: distrib-ute food and non-food items and cash; treat malnutrition among children and pregnant or lactating women; increase the availability of improved water by repairing and rehabilitating water points; promote good hygiene practices; provide water treatment materials; and distrib-ute livelihood inputs for agriculture, animal husbandry and riverine fishing. In addition, vulnerable communities are being supported to develop community-level drought preparedness and response plans.
Despite a complex situation of natural hazard risks and conflict-related displacement, Somalia contin-ues to work towards formal risk reduction plan-ning and climate change adaptation measures as essential tools to build and sustain socioeconomic
development. In doing so, i t also leverages networks of long-term humanitarian and devel-opment partners in the country, to build capacity, provide technical support and humanitarian assis-tance when needed.
407

Since August 2017, violence against Rohingya communities in Rakhine State, Myanmar, has resulted in 727,000 people437 – mostly women and children – fleeing their homes across the border to Cox’s Bazar District, Bangladesh.438 This exodus brings the total number of displaced Rohingya
population to about 919,000, vastly outnumber-ing the people living in the host communities. The displaced Rohingya population account for about one third of the total population in Cox’s Bazar, an area that was already densely populated and facing severe development challenges.439
Rohinggya Camps in Cox’s Bazar (Source: Mohammad Tauheed, Flickr)
The displaced Rohingya people in Cox’s Bazar, Bangladesh, are sheltered in makeshift settle-ments in extremely congested areas, including in the Kutupalong “mega-camp”, which quickly became the largest refugee camp in the world. The camps have minimal access to basic infra-structure and services, and are prone to natural hazards, especially cyclones, floods and land-slides. Setting up the camps has led to rapid deforestation, further increasing the vulnerability of the displaced Rohingya to the effects of mon-soon rains. Relocation of households most at
risk from landslides and flooding is under way, but there is insufficient suitable land available to accommodate even the highest-risk category of people.
An assessment of medium-term needs and a risk assessment identified priority investments to improve DRM and public service delivery to the displaced Rohingya population and host communities. These investments address health, education and emergency response. The Health Sector Support Project helped to further develop
Case study: Cox’s Bazar, Bangladesh
408 Chapter 15
437 (ISCG 2018)438 (International Organization for Migration 2018)439 (Adapted from input from GFDRR) 440 (Adapted from input from GFDRR)441 (Wake and Bryant 2018)
disease surveillance and outbreak response capacities of the Ministry of Health and Family Welfare. Activities to strengthen disease out-break response include vaccination campaigns and disease‐specific diagnosis and treatment services, as well as mechanisms for responding to the health impacts of possible disasters, such as the spread of cholera and diarrhoea as well as other water‐ and vector‐borne diseases and an increased risk of drowning and injuries associ-ated with storms and flooding.
Activities for the ongoing Reaching Out-of-School Children Project are specifically designed to ensure safe and equitable learning opportunities for all 300,000 crisis-affected chil-dren and youth in the region, including refugees and host communities. Interventions include the renovation of primary schools, procurement of learning materials, awareness-raising regarding GBV and promotion of psychosocial well-being activities to overcome the shock of violence and forced resettlement. In view of the high risk of disaster, the renovation work will include physi-cal measures to ensure safe learning environ-ments for children.
The Emergency Multi-Sector Rohingya Crisis Response Project aims to strengthen the capac-ity of the Government of Bangladesh to respond to the Rohingya crisis by improving access to basic services and building disaster and social resilience of the displaced Rohingya population. Project interventions include: improving access to clean water supply and sanitation; improv-ing access to multipurpose disaster shelters,
evacuation routes and disaster response capac-ity; improving public service infrastructure; strengthening GBV support services; implement-ing a community services and work programme to engage displaced Rohingya population in the delivery of small works and services in the camps; and institutional strengthening activities for government institutions responsible for man-aging the crisis.
In parallel, host communities in the Cox’s Bazar District are being supported through existing projects addressing: multipurpose disaster shel-ters that support disaster preparedness; improv-ing municipal governance and basic urban services in participating urban local bodies; sup-porting fiscal transfer systems; improving col-laborative forest management; and increasing benefits for forest-dependent communities.440
Project-based initiatives in Cox’s Bazar, while providing valuable support to affected com-munities, may be limited in their ability to secure longer-term risk reduction outcomes for affected communities, the host community of Cox’s Bazaar and the newly arrived Rohingya. The political sensitivities associated with issues such as permanent resettlement, citizenship and rights, from the perspective of the host States (Bangladesh and Myanmar), mean that international agencies have significant chal-lenges in supporting DRR responses. Support-ing responses that assure the dignity of affected populations, capitalizing on the resources and capacities of the refugees themselves are still more challenging.441
The Bangladesh Cox’s Bazar case study illustrates that there is not an easy solution to the broader risks facing residents of Cox’s Bazar. Continued governmental engagement and capacity will be essential to longer-term risk reduction. Incremen-tal gains can be made at the community level by supporting the host community and the newly arrived, and addressing the needs of the whole
community through education and social welfare initiatives.
409

The situation in South Sudan shows the impact of compounded risks to the population of natural hazards and armed conflict. Nonetheless, the government response is to continue to build
longer-term resilience, beginning with the most urgent disaster hazards and climate change impacts, while also meeting immediate humanitar-ian needs.
15.2.2 Reducing disaster risk with an arid and changing climate and the impacts of conflict
South Sudan is exposed to natural hazards such as drought, which often become disasters.442 Changes
in weather patterns and climatic shocks are particu-larly impactful in contexts like South Sudan where livelihoods are largely based on animal husbandry, agriculture, fishing and trade.443 South Sudan is also heavily affected by war and violence. South Sudan became independent from Sudan in 2011 after a 22-year civil war.
After only two years of peace, South Sudan’s post-conflict transition has been mired in politi-cal instability, power struggles and a new civil war since 2013. The combination of natural haz-ards and war has had dire consequences for the South Sudanese people. After experienc-ing years of drought and war, in April 2017, the United Nations declared that South Sudan was suffering from famine, which affected at least 100,000 people.444
Despite the protracted nature of conflict in South Sudan, State and non-State actors rec-ognize the need to build longer-term resilience while balancing the need to address more immediate humanitarian demands. South Sudan launched its National Adaptation Programme of Action in 2017, outlining its most urgent cli-mate adaptation needs. With this in place, State and non-State actors are now beginning dis-cussions about a road map to develop South Sudan’s NAPs to address longer-term CCA prior-ities. The national DRM policy, in its final stages,
recognizes the need to reduce disaster risks and adapt to a changing climate. In parallel to these policy processes, civil society is working with local communities to integrate CCA, DRR and ecosystem management approaches.445
This includes community-led wetland manage-ment practices to preserve necessary ecosystem services to mitigate the impacts of floods and drought. Similarly, a VCA tool is applied, which is typically used in non-conflict settings, to identify appropriate strategies to understand prevailing risks and inform the design of appropriate risk reduction measures.446 In addition, a report about the state of the environment was issued in mid-2018, which will guide the various government departments and non-State actors on sustainable management of the natural resources for DRR.447 Despite these efforts, more work is required to better understand how to support coherence and complementarity between climate and disaster resilience policy and programmes, including in ways that are conflict sensitive.
442 (Adapted from input from IFRC)443 (Overseas Development Institute and Humanitarian Prac-tice Network 2013)444 (IFRC 2018a)
445 (Wetlands International 2019)446 (IFRC 2018b)447 (UNEP 2018)448 (Adapted from input from UNDP)
Case study: South Sudan
410 Chapter 15

Extreme drought in Iraq has been brought about by environmental, development and political factors, with cascading consequences.448 Climate change has been intensifying drought and drying up water resources in the region, with the drought situation exacerbated by increased upstream water usage,
including new dams along the Euphrates and Tigris Rivers beyond Iraq’s borders. The flow of river water into Iraq has dropped by about 50% in recent decades, and is expected to decline by another 50% as upstream water usage and drought from climate change increase.
Case study: Hawr al-Huweizah, Iraq
The problem of drought in Hawr al-Huweizah, Iraq, has emerged recently, after water supplies from the Islamic Republic of Iran ceased and water flows from the Mashrah and Kahla Rivers reduced. They are fed by the Tigris River, which is under water stress due to reduced in-flows and increased abstraction. The Ahwar marsh-lands of southern Iraq, which were named as
UNESCO World Heritage Sites in 2016 due to their cultural history and unique natural charac-teristics, are among the ecosystems affected.
Drought and intense water scarcity in the country have led to an increase in desertifica-tion, a decline in green areas and agricultural land, and an increase in livestock mortality.
Mosques, houses and streets that were ruined during the war in Mosul (Source: Photographer RM / Shutterstock.com)
411
Agricultural production is expected to decrease signif icantly as pastures and f ields are degraded. The expected impacts on livelihoods have the potential to drive the rural Iraqi popula-tion to migrate to cities and urban communities as they seek alternative livelihood opportunities to generate household income. Adding to these challenges, the disruption of electrical power systems will have a direct impact on the avail-ability of electricity for households as well as industrial usage and infrastructural activities, such as sanitation. Without functioning sani-tation systems, the risk to the Euphrates and Tigris Rivers of contamination (from multiple types of waste) and decreasing water quality of already-scarce water resources, is high. Addi-tionally, scientists and environmentalists have warned of the possible collapse of the Mosul Dam, the largest dam in Iraq, and assessments have indicated that the overwhelming flooding that would ensue would lead to a severe loss of life.
Iraq’s security situation also plays into the complexity of risk factors facing the country, with armed attacks having destroyed cities throughout the country, leading to death and displacement of civilians from the northern regions to central and southern Iraq. This has affected the economic and social life of the population, including through destruction of civil and governmental buildings and the disruption of public services, especially those related to health and education. Reconstruction is hindered by chemical pollution from conflict, and around 7 million m3 of debris that must be transported and examined to ensure it is free of radiation or toxic chemical agents.449
Iraq has taken several measures specifi-cally to address drought and desertification. These measures include CCA activities, such as the implementation of an integrated water resources management (IWRM) system, and the use of modern irrigation methods, such as sprinkler irrigation and drip irrigation. The
country has taken measures to enforce envi-ronmental legislation related to water usage and consumption and increased the monitor-ing of its water, air and land resources through monitoring and control stations, including seismic monitoring stations, meteorological stations and radiation measurement stations.
Iraq has also made progress on actions related to DRR more broadly. DRR has been integrated into national development plans, and nation-ally appropriate disaster mitigation actions are obtaining approval for implementation. The priorities of the National Strategy for Disas-ter Management are based on the priorities of the Sendai Framework, but they employ measures specific to the priorities of action in Iraq, that is the environment, the climate, and the economic, social, cultural and political situation.450
Iraq’s National Disaster Risk Reduction Strat-egy describes the security context and includes actions to reduce security risk. In address-ing systemic risk, the national strategy also includes a variety of programmes and plans to combat poverty and enhance societal resilience to reduce the risk of disasters and cascading impacts. Communities at particular and persistent risk of disasters include commu-nities located near rivers, in close proximity to flood-prone dams, in low-lying areas prone to flooding during heavy rains, along seismically active zones and in areas affected by conflict. DRR activities include: awareness-raising; improvement and development of legislation and laws; formation of national committees and special forums on DRR; and regional and international cooperation in support of national and local plans and programmes.
412 Chapter 15

449 (Adapted from the Government of Iraq contribution via the UNISDR Regional Office for Arab States)
450 (Adapted from the Government of Iraq contribution via the UNISDR Regional Office for Arab States)
case studies above that are common to complex systems of risk. These themes include: the impor-tance of addressing a wide range of vulnerabili-ties where risks combine; considering particularly vulnerable persons and groups and engaging them in the risk reduction process; engaging long term across sectors and at multiple levels; and adapting to a rapidly changing and dynamic context.
15.3.1 Addressing a wide range of vulnerabilities where risks combine
DRR policies, strategies and projects operating in complex systems of risk must address a wider range of vulnerabilities than traditionally consid-ered in the purview of DRR, because these vulner-abilities interact to form disaster risks. For example, several of the case studies illustrated how disas-ter, conflict and human displacement interact to create systems of complex and cascading risk (also discussed in Chapter 2). In Somalia, sudden- and slow-onset hazards and events compounded by protracted conflict have led to continued popula-tion displacement internally and across borders. The IDMC Disaster Displacement Risk model for the Horn of Africa affirmed that socially created situa-tions of vulnerability along with the concentration of people in areas exposed to hazards have a large impact on displacement risk. In CAR, Iraq, and for the Rohingya population, the ongoing crises and repeated disasters have led to large-scale popula-tion displacement.
These population displacements, including people who are displaced more than once, present multi-ple challenges to DRR. Population shifts to already overcrowded IDP settlements, refugee camps and urban centres can overwhelm institutions and services that are already extended to or beyond capacity, particularly in situations of political
Iraq faces a challenging set of risks, notably drought and water scarcity, that are compounded by the direct impacts of armed attacks and the contaminated residue and social dislocation that result. It has taken these as the foci for its national strategy and risk reduction measures, addressing IWRM and the security context, as well as the envi-ronmental, climatic, social, cultural and political context. Reflecting the specificities of context, Iraq thus aims to address systemic risk through a range of socioeconomic measures that extend beyond the traditional concepts of DRR.
15.3 Implications of complexity for addressing disaster risk
The above case studies illustrate the complex nature of the interaction of natural hazard risks and other environmental, social, political and economic conditions and variables. These “wicked problems” are challenging to understand, in part because it is difficult and even unproductive to determine where a disaster risk begins and ends in a complex world. Isolating one factor – disaster risk – in a complex interaction is artificial, because people experience natural hazards combined with other conditions and from the vantage point of their vulnerabilities and capabilities. The case studies also illustrate how dif-ferent organizations focusing on DRR address com-plex risk in different ways; there is no single, correct approach to achieving DRR in complex risk contexts.
While complexity plays out in unique ways in each specific context, themes have emerged from the
413

instability or crisis. Cascading effects of disasters, conflict and displacement can lead to the deteriora-tion of education, sanitation, health, food and water systems, and services, potentially leading to health crises such as cholera or diarrhoea, and intensified competition and conflict over scarce resources. Such cascading impacts are symptomatic of the failure to address a sufficiently wide range of risks and vulnerabilities, and can deepen vulnerabilities and amplify or create new risk.
Several case studies indicate that a wider range of vulnerabilities must be addressed by DRR in these complex contexts. Examples include, programmes addressing underlying vulnerabilities associated with drought and famine in Somalia, or support to the Government of Bangladesh to build its capacity to respond to the Rohingya crisis through meeting immediate basic needs, as well as strengthen-ing the social resilience of the displaced Rohingya population.451
In Iraq, the National Disaster Risk Reduction Strat-egy addresses the persistent security threats facing the country, as well as risks stemming from floods, drought, and toxic and non-toxic remnants of the war, which create health risks and impede the extension of basic services. National and regional DRR policies across contexts must formally and explicitly recognize the interlinked risks of disasters, conflict and displacement with an eye to present and future conditions. Both current, and a range of likely future, conditions, should inform the design of immediate humanitarian and long-term develop-ment strategies.
In Afghanistan, another country facing complex risk, a multi-hazard risk assessment was completed in 2017. Afghanistan’s NSDRR recognizes that decades of conflict have undermined coping mech-anisms and protective capacity in the country. In addition to an assessment of risk from five differ-ent hazards (avalanche, earthquake, floods, drought and landslides), the vulnerability analysis section refers to years of conflicts as a factor that deter-mines the degradation status and higher vulnerabil-ity of infrastructure and public facilities.452 In CAR, the first draft of NSDRR has taken the political crisis
and its negative repercussions into account, explic-itly featuring armed conflict as a type of risk and disaster.
15.3.2 Considering particularly vulnerable persons and groups
In discussions about vulnerability (see Chapter 3 of this report), it is clear that individuals and groups experience unique combinations of risk and are thus in need of specific considerations. Groups that tend to have more concentrated vulnerability and critical needs include women and girls, youth and children, elderly, lesbian, gay, bisexual, transgender and intergender communities, disabled and differ-ently abled, and otherwise religiously, ethnically, socioeconomically, and geographically disempow-ered and marginalized groups. Providing assistance and support to the most vulnerable people and communities reduces the added vulnerability that can result from disaster impacts.453 In Afghanistan, socioeconomic inequalities are deepening, and this compounds disaster impacts and increases the vulnerability of particular groups. Afghanistan’s NSDRR commits to promoting equitable economic growth as well as to principles of social inclu-sion and environmental conservation as a way to address disaster risk for particularly vulnerable groups, in addition to targeted capacity-building activities.454
These needs are magnified in places affected by conflict, political instability and violence, where vulnerable groups also include large numbers of victims of violence and those at heightened risk of violence. Disaster and conflict often lead to a higher rate of GBV, putting women, girls and lesbian, gay, bisexual, transgender and intergender communities at heightened risk in these contexts.455 There are several examples of projects focused on address-ing violence-related vulnerabilities. In Bangladesh, a dedicated project has been designed to ensure safe and equitable learning opportunities for all 300,000 crisis-affected children and youth in the region, including refugees and host communities.
414 Chapter 15

451 (Adapted from input from GFDRR)452 (Afghanistan, State Ministry of Disaster Management and Humanitarian Affairs and Afghanistan National Disaster Manage-ment Authority 2018)453 (IFRC 2015); (Gaillard et al. 2017); (Gaillard, Gorman-Murray and Fordham 2017)
454 (Afghanistan, State Ministry of Disaster Management and Humanitarian Affairs and Afghanistan National Disaster Manage-ment Authority 2018)455 (IFRC 2015); (Gaillard et al. 2017); (Gaillard, Gorman-Murray and Fordham 2017)456 (GFDRR 2019)
Programming includes awareness-raising regard-ing GBV and promoting psychosocial activities to overcome the shock of violence and forced reset-tlement. In Somalia, GBV is addressed by combin-ing economic empowerment interventions for
Several of the case studies highlight the acute vulnerability of IDPs, refugees and host communi-ties to disaster risks. In Bangladesh for example, the displaced Rohingya people are sheltered in makeshift settlements with minimal access to basic infrastructure and services, which makes
women with integrated clinical, psychological and legal services for GBV survivors at the community level, as well as institutional strengthening and capacity-building.456
them particularly vulnerable to natural hazards such as cyclones, floods and landslides. The quick estab-lishment of makeshift shelters has caused defores-tation, further increasing vulnerability to the effects of monsoon rains; as evidence by flash flooding and landslides in 2018. Rains “caused over 130
People who carry water rest under a tree in the refugee camp in Baidoa, Somalia(Source: Mustafa Olgun/shutterstock.com)
415

landslides, damaged 3,300 shelters and affected 28,000 refugees” near Cox’s Bazar, with women the most at risk of disaster impacts.457 The emergency relocation of refugees affected by the flooding has been challenged by a lack of suitable available land. In other contexts of cross-border displacement, it was highlighted that newly arrived refugees in some contexts may be less adapted to their host coun-try’s climate, and they may face increased vulner-ability to weather extremes during their adjustment period.458
Where livelihoods are heavily dependent on stable ecosystems, DRR processes should include concerned communities in the analysis of vulner-ability and development of appropriate responses. In South Sudan, international actors are working with local communities to integrate CCA, DRR and ecosystem management approaches to preserve necessary ecosystem services and mitigate the impacts of floods and drought.459 In Bangla-desh, a sustainable forests and livelihood project for host communities is improving collaborative forest management and increases benefits for forest-dependent communities. In Somalia, vulner-able communities are being supported to develop community- level drought preparedness and response plans.460
15.3.3 Engaging long term across sectors and at multiple scales
Resolving systemic risk is not achieved quickly. It requires long-term engagement across sectors and at multiple levels. The probability that recur-rent emergencies will persist is high, even with well-planned and executed strategies. However, over time and with dedicated attention and often incremental action, complex disaster risks can be managed and reduced. Aligning DRR efforts with other international platforms, international and local humanitarian and development partners, the private sector, national and local governments, and local communities and governance structures provide opportunities to coordinate across sectors and at
multiple levels of governance. Coordinated, collab-orative action allows for organizations to play to their strengths and not extend beyond their own institutional capacity while also creating synergies and positive exchanges among actors. Harmo-nized efforts also lessen the possibility that differ-ent groups inadvertently duplicate efforts or fall short of meeting even immediate life-sustaining needs. Complexity demands that all actors must act together as partners on the front-line systemic risk reduction.
In the case of Bangladesh, a Joint Response Plan was prepared between the Government of Bangla-desh and development partners, and in Somalia, a DINA complemented rather than duplicated the Humanitarian Response Plan already in place. In Afghanistan, the National Afghanistan Strategy for Disaster Risk Reduction calls for DRR to be main-streamed into development planning, sectoral plans, capacity-building, CCA, livelihood security, gender mainstreaming, community empowerment, and response and recovery management. It aims to improve coherence and integration in efforts to reduce the risks posed by disasters, climate change, conflict and fragility, with other develop-ment imperatives, and places this at the centre of the pursuit of the achievement of the outcome and goals of the post-2015 international agreements and frameworks, including the SDGs.
The coordination among humanitarian and develop-ment actors in Somalia has resulted in data sharing, integrating lessons learned on improving efficiency, and ensuring that funds are not diverted from emer-gency needs.461 Likewise, new policies are particu-larly successful when they build upon pre-existing networks and expertise that are already estab-lished in the country, including international and local humanitarian organizations, technical experts and local governments. This coordination can be carried out in formal and informal capacities. In Afghanistan, shuras, or traditional informal commu-nity-based approaches to hearings and judgments, serve multiple purposes, such as providing assis-tance during disasters as well as local-level conflict resolution mechanisms.462 Conversely in the case of Iraq, more formal structures of cooperation,
416 Chapter 15
457 (OXFAM 2018)458 (IFRC and UNDP 2014b)459 (Wetlands International 2014)460 (GFDRR 2019)461 (GFDRR 2019)
462 (Afghanistan, State Ministry of Disaster Management and Humanitarian Affairs and Afghanistan National Disaster Management Authority 2018)463 (Adapted from input from GFDRR)464 (Adapted from input from GFDRR)
including established international coordination mechanisms and partnerships, are more likely to facilitate solutions to meeting the country’s needs for funding, technological capabilities and capacity-building.
15.3.4 Adapting to a rapidly changing and dynamic context
Situations of complex risk are inherently dynamic, and can change rapidly in unanticipated or unpre-dictable ways. Because risk within this perspective is understood as polycentric, no one risk takes prior-ity over the others. The removal of a specific risk may not fundamentally alter the system, and the manifestation of one risk has the potential to trigger other risks within the system. The speed of change, uncertainty surrounding that change and the multi-tude of possible changes in a complex context have particular implications on long-term engagement and the need to deliver on commitments and goals. In contexts affected by political instability and social unrest, security may suddenly and dramati-cally change the operational context, altering the ability to effectively design, plan, and implement strategies and programmes.
In Somalia, the environmental and security context rapidly evolved throughout implementation phases, necessitating flexible and adaptable program-ming.463 Ongoing attacks by armed groups and clan violence combined with drought- and flood-related disasters has necessitated shifts in programming. Becoming more adaptable through budgetary measures, such as merging the budget into a single-line item, allows for programmatic shifts between categories when certain activities were prohib-ited by a sudden change in the security situation.
Likewise, monitoring systems need to be based on target ranges rather than fixed targets to remain adaptable to rapidly changing environments. Tech-nology can be used in particularly insecure and dangerous operating contexts, for example in large parts of the drought-affected rural areas in southern Somalia which are controlled by al-Shabab militia and inaccessible for government counterparts and most humanitarian organizations.464 As presented in the case study in section 15.2, the use of remote assessment methods that combine remote-sensing technologies and social media analytics has been extremely useful. This information can then be combined with information received from partner networks and limited household surveys conducted by a vendor with field presence in Somalia.
Environmental conditions also have the capacity to deteriorate rapidly or to oscillate among extremes, particularly when combined with environmen-tal degradation and climate change impacts. For example, Somalia is vulnerable to flash floods and drought, both of which are connected to a suite of associated risks. In Bangladesh, the sudden and large-scale nature of the Rohingya refugee crisis led to deforestation and increased risk of flash flood-ing and landslides. The impacts of climate change, which increase the risk factors for extreme and unpredictable weather patterns and events, also contribute to environmental fragility. For example, in 2018 the Climate Centre (Red Cross Red Crescent) noted that Turkey is currently hosting approximately 3,400,000 Syrian refugees while at the same time experiencing its hottest summer in 47 years. Wide-spread heat-waves stretch humanitarian and health systems and point to the necessity of preparing institutions to reach the most vulnerable.
Infrastructural conditions may also cause a rapid change in complex risk. In Iraq, the Mosul Dam is located in the city of Mosul, which is highly affected
417

by conflict and at risk of collapsing. The tenuous security situation makes DRR activities more chal-lenging. If the dam were to fail, the security chal-lenges would have the potential to affect disaster response and recovery.
15.4 Conclusions
Disaster risks emanate from development path-ways, manifesting from the trade-offs inherent in development processes. In some ways, this has always been well recognized. What is new in today’s increasingly interconnected society is the diversity and complexity of threats and hazards, and the complex interaction among them, which result in “an unprecedented global creation of risks, often due to previous socioeconomic development trends interacting with existing and new develop-ment dynamics and emerging global threats.”465 There are distinct characteristics that need to be addressed and understood – aspects of intercon-nectivity, transboundary, transitional, transforma-tional elements and simultaneity – in addition to facets of intensity, duration, frequency and rate.466 But there are also opportunities that arise, as risks are merely a description of possible outcomes.467 The exploration of the multidimensional nature of risk is improving and garnering greater attention in efforts to understand and manage risk. Answering and addressing these challenges calls for a more systemic approach to acknowledging the complex threats, risks and opportunities facing and resulting from development.468
The expanded scope of the Sendai Framework is a starting point, and must be reflected in the breath of national and local DRR strategies. So should the risk-informed development approach called for in the Sendai Framework, through the systematic inte-gration of risk information across all sectoral plan-ning processes. Delivering DRR is possible in any context, but the scope of what is viable and appro-priate will change depending on the context. And for some, such as those affected by armed conflict and fragility, what this looks like is still to be learned.469 There remains a dearth of practical and policy advice on how to devise and implement DRR strat-egies for complex risk contexts, including where violent conflict forms part of the broader environ-ment in which DRR takes place. As such, this is an area that warrants further attention to attain Target E of the Sendai Framework.
Taking a broader and more nuanced approach to understanding how threats, hazards and shocks interact reflects the growing move towards utiliz-ing systems thinking, grappling with complex risk and engaging with uncertainty. In many respects, the DRR community is leading the way, as illustrated by the initiation of GRAF, for example. This will require adopting “good practice principles in risk-informed development” such as inclusive and trans-parent, phased and iterative, flexible and adaptive, continuous learning and reflection approaches.470 Making development choices that support develop-ment trajectories that harness benefits for reduced complex risk, avoid risk creation and better manage residual risk, must be the way forward.
465 (United Nations Economic and Social Commission for Western Asia 2017)466 (Opitz–Stapleton et al. 2019)467 (World Bank 2013)
468 (Opitz–Stapleton et al. 2019)469 (Harris, Keen and Mitchell 2013); (Peters 2018)470 (Opitz–Stapleton et al. 2019)
418 Chapter 15

Part III Conclusions and recommendations Conclusions
As Chapter 10 has illustrated, regional cooperation is key to knowledge-sharing and capacity-build-ing among countries with similar risk profiles and regional concerns, as well as to providing mecha-nisms for managing development funding and providing risk financing for their member coun-tries. Regional platforms for DRR and other innova-tive regional multi-stakeholder partnerships play an important role in DRR awareness and cooperation. Intergovernmental organizations in most hazard-prone regions have developed cooperation on DRM, but a more active promotion of regional and national risk reduction is a role they could take on more strongly, for example by focusing on: (a) regional risk assessment and reduction, (b) the needs of SIDS, small countries and least developed countries for practical support in building capacity and risk infor-mation systems, and (c) risk financing mechanisms.
The enabling environment at national level is essential to performing integrated risk gover-nance at national, subnational and community levels; addressing aspects of the authority of local governments to plan for, and carry out, essential DRR actions. This requires a review of the enabling legislation and the institutional frameworks, which often encourage working in silos rather than cross-sectorally and vertically from local to national levels. The enabling frameworks at national level are also the principal mechanism to ensure that the needs of vulnerable groups and the principles of equality and participation are integrated, especially for women and youth.
At national level, most countries identified in the research do not have coordination mechanisms among DRR, CCA and development planning. Some
examples have been given of Pacific countries where the institutional structures are being built across these areas, and reinforced at the regional level with the 2016 FRDP.
On the issue of creating DRR strategies and plans according to the principles of the Sendai Frame-work, there are many different approaches at national level, ranging from stand-alone plans and strategies to full mainstreaming into development plans (Chapter 11). Target E of the Sendai Frame-work does not necessarily require additional sepa-rate plans, but it does require countries to review existing DRR strategies in light of the Sendai Frame-work and ensure that local strategies dovetail with national level. Target E, to be met by 2020, is a small indication of what is required to accomplish the goal and outcome of the Sendai Framework. It is a stepping stone towards achieving this by 2030.
Integration of DRR into development planning strat-egies and frameworks at national level remains a challenge for many States (Chapter 12). Again, there are good examples of countries implement-ing this at national level, but so far, there has been insufficient time and information to deter-mine whether these measures are affecting the outcomes of development planning, in particular to prevent the creation of new risk.
Integration of DRR into CCA policies and plans at national level is a new endeavour for most coun-tries. The evidence gained from country practices is that it has not been undertaken by many countries so far (Chapter 13). Given the very threat to human-ity posed by climate change, it is imperative that a more integrated approach is adopted to adapt to and mitigate climate change, together with broader development efforts preventing the creation of new risk and reducing existing risk. It must also be recognized that there are particular challenges for countries where effort to reduce other disaster risks, for example geophysical risk, are considered of greater priority. As called for in the Sendai Frame-work, all countries must assure adequate attention to the reduction of natural and man-made hazards and related technological, biological and environ-mental hazards and risks.
419

A major challenge in integrating DRR with CCA and development planning is that faced by national and local governments in managing systemic risk in urban areas (Chapter 14). The dynamic, multidimen-sional nature of interrelating risks in urban areas require systemic approaches, that seek to under-stand the nature of interacting systems and adopt integrated risk governance adapted to the local context.
Fragile and complex contexts, especially where there is significant internal and cross-border migra-tion due to war, famine and social disruption, present a particular set of challenges for local and national risk reduction and for integrated risk gover-nance (Chapter 15). The risk context and landscape are constantly changing, demanding flexibility and agility from national and local level processes so as to be able to accommodate new and emerging risks.
Recommendations
The key recommendations arising from Part III are that integrated risk governance, or policy coherence, is the key to effective risk reduction at national and local levels, with the following issues highlighted:
• It is urgent that all Member States give atten-tion to establishing and aligning national and local DRR strategies with the Sendai Frame-work, not only because 2020 is fast approach-ing, but because these provide the foundation and enabling environment for so much of what is required to achieve the outcome, goal and targets of the Sendai Framework and the 2030 Agenda.
• Developments in climate science that were not available at the time of the development and adoption of the Sendai Framework in 2015, call for far greater urgency and ambition in our actions than was previously understood. This reinforces the need to treat risk as a systemic issue, taking into account short- and long-term time frames. Based on the findings of the
2018 IPCC SR1.5, make clear the need for DRR strategies to integrate CCA and mitigation centrally within risk reduction at national and local levels.
• Coherent and integrated national and local plans are also the means by which Member States can best meet combined commitments made under the 2030 Agenda, the Paris Agree-ment, AAAA, NUA, and other agreements of a thematic, sectoral or regional nature. The multi-dimensional nature of these commitments, and more importantly the underlying risks they address, require systems-based approaches, including in assessing needs and making national and local decisions about the most effective use of available resources.
• It is recommended that governments and national stakeholders, with strong engagement of the private sector and civil society down to community level, review national and local enabling frameworks for equitable and sus-tainable development, climate change and risk reduction. The objective is to identify the enablers and opportunities, as well as the bar-riers to integrated risk governance, which may come in the form of legislative mandates, insti-tutional structures, capacity, resources, social equality/vulnerability, gender roles, people’s awareness and habits of thinking about risk. This could also be described as an integrated risk governance assessment , taking into account multiple hazards (man-made, natural and mixed) and related risks, the way hazards, vulnerability and economic activity interacts with the environment and with each other within and among complex systems, and the need to adapt policy and implementation to enable sys-tems-based approaches to risk reduction.
420 Chapter 15

421

Risk-informed development in an urbanizing world422 Special Case Study

Fictional delta city of Drecca-Susdev –elements of integrated risk governance
(Source: UNDRR 2019)
423

• Floodplains and coastal foreshore are reserved for recreation, and for vegetation that absorbs flood waters or sea storm impacts
• Mechanical or built barriers reduce impact and/or divert flood waters or storm surges
2. EWSs:
• EWSs for flood and landslide risk based on weather forecasts, recorded rainfall and intensity, and for monitoring upstream river levels allow for flood mitigation through controlled dam releases, opening/closing of flood gates/levees around the city and evacuation response when needed
• EWSs for sea storms, hurricanes and/or tsunami, based on weather forecasts, seismic activity and other monitoring including regional/global systems allow for evacuation and use of mechanical barriers as needed
3. Health, housing and well-being:
• Medium- to high-density residential build-ings on safe land include social housing, comply with updated codes for relevant risks, have water and sanitation, have access to health, welfare and education facilities, and give access to fire and emer-gency services
• “Green infrastructure” gardens and trees cool the city, improve health and provide space for recreation and cultural pursuits
• Walking and cycling route networks improve safety and health, and reduce air pollution from vehicles
4. Water supply system:
• Multiple small dams give redundancy in water supply for farms and city, increasing drought resilience across the territory
• Potable water systems, pumps and treat-ment are flood-proofed
Managing complex risks while also governing the everyday aspects of life and encouraging socioeco-nomic development can seem remote and theo-retical. It can also be hard to imagine what success looks like in the face of so many demands. For this reason, this GAR offers an illustrated scenario of a fictional coastal delta city, Drecca-Susdev, which has taken a systems-based approach to managing risk. It is selective – it may even appear futuristic – but it is based on careful expert thought and is offered as an exercise of imagination towards “the future we want”.
Many coastal delta cities face seasonal flood risk, cyclonic wind and storm surge, and poten-tially seismic and tsunami risk. They are looking to a future of sea-level rise and increased weather extremes due to climate change, coupled with the socioeconomic challenges of rapid population growth, increased exposure and vulnerability, build-ing and construction, energy needs, risk of environ-mental pollution, pressures on waste management, water and food resources, transport and commu-nications systems, as well as the urgent global need to reduce GHG emissions to mitigate climate change. Meeting these challenges and moving towards risk-informed sustainable development requires an understanding of the interrelationships among systems and subsystems, within local area planning and risk governance, and aligned with national socioeconomic development planning.
The figure illustrates some elements of integrated risk governance in the fictional coastal delta city, Drecca-Susdev. These include:
1. Risk reduction for flood, landslides and sea inundation:
• Revegetation and/or engineering stabilizes landslide-prone areas
• Smaller more numerous dams reduce flood risk from dam failure
• Homes, businesses and sensitive infrastruc-ture are kept off flood plains and the coastal foreshore, or raised/adapted to seasonal flooding/storms and built to relevant codes
424 Special Case Study

8. Energy:
• Small-scale hydro-dams supply local areas, and link into the power grid
• Decentralized solar photovoltaics on city rooftops that heat, cool and power build-ings, and which include energy storage and charging for electrical vehicles, reduce the need for major new investment in power distribution and increase resilience to grid system failures
• Water is reused and recycled in the city, with a back-up energy source
5. Food supply system:
• Flood plains are preserved for crops that use seasonal flooding that also regenerates soil fertility
• Flow-of-the-river dams allow fish breeding
• Urban agriculture on balconies and roof-tops boosts access to fresh produce; high-density commercial aquaponics food production combines plant and fish nutrient needs to reduce ocean overfishing and agri-cultural nitrogen run-off
• Resilient transport and communications maintain local and regional food supply chains
6. Waste management and environmental protection:
• All storm water run-off and human and industrial refuse and effluent is treated so that clean water is released into the land and marine environments
• Recycling of materials is maximized
• Solid waste is managed city wide
7. Transport, communications and other infrastructure:
• Bridges and roads are elevated and built strong enough to withstand more-extreme weather events and sea-level rise
• Risk-assessed dedicated public transport is separate from the road system
• Disaster-proofed communications infra-structure increases resilience of all other city systems, including energy and supply chains
• Transport and communications systems are designed to reduce cyberrisk with flexible system responses and redundancy
425

Abbreviations and acronyms
AAAA
AADMER
AAL
ADB
ADPC
AIDS
AMCDRR
AMR
APEC
APP
ASEAN
AU
CAR
CASC
CCA
CCRIF
CDEMA
CDM
CRPT
DAC
DiD
DINA
DMCP
DRM
DRR
DRRM
EC
ECLAC
ECOWAS
EEA
EFFIS
EM-DAT
EO
ESA
ESCAP
EU
Addis Ababa Action Agenda
ASEAN Agreement on Disaster and Emergency Management
average annual loss
Asian Development Bank
Asian Disaster Preparedness Center
acquired immunodeficiency syndrome
Asian Ministerial Conference on Disaster Risk Reduction
antimicrobial resistance
Asia-Pacific Economic Cooperation
Asian Preparedness Partnership
Association of Southeast Asian Nations
African Union
Central African Republic
Central Asia and South Caucasus
climate change adaptation
Caribbean Catastrophe Risk Insurance Facility
Caribbean Disaster Emergency Management Agency
comprehensive disaster management
City Resilience Profiling Tool
Development Assistance Committee
defence in depth
drought impact needs assessment
disaster management and contingency plan
disaster risk management
disaster risk reduction
disaster risk reduction and management
European Commission
Economic Commission for Latin America and the Caribbean
Economic Community of West African States
European Economic Area
European Forest Fire Information System
Emergency Events Database
Earth observation
European Space Agency
Economic and Social Commission for Asia and the Pacific
European Union
cdxxvi Abbreviations and acronyms

Euratom
EWEA
EWS
FAIR
FAO
FDES
FEMA
FEWSNet
FRDP
GAR
GBD
GBV
GCF
GDP
GDPPC
GEM
GEO
GEOSS
GFDRR
GFP
GHG
GIS
GISRS
GPS
GRAF
GSHAP
GWIS
GWP
HFA
HIV
HLPF
IACRNE
IAEA
IAEG-SDG
IAP
IDDRSI
IDMC
IDNDR
IDP
IEAG
IFRC
IGAD
IHR
INES
INSAG
IPC
European Atomic Energy Community
Early Warning Early Action
early warning system
findable, accessible, interoperable and reusable
Food and Agricultural Organization of the United Nations
Framework for the Development of Environment Statistics
Federal Emergency Management Agency
Famine Early Warning System Network
Framework for Resilient Development in the Pacific
Global Assessment Report
global burden of disease
gender-based violence
Green Climate Fund
gross domestic product
gross domestic product per capita
Global Earthquake Model
Group on Earth Observations
Global Earth Observation System of Systems
Global Facility for Disaster Reduction and Recovery
Global Flood Partnership
greenhouse gas
geographic information system
Global Influenza Surveillance and Response System
global positioning system
Global Risk Assessment Framework
Global Seismic Hazard Assessment Program
Global Wildfire Information System
Global Water Partnership
Hyogo Framework for Action 2005–2015: Building the Resilience of Nations and Communities to Disasters
human immunodeficiency virus
High-Level Political Forum
Inter-Agency Committee on Radiological and Nuclear Emergencies
International Atomic Energy Agency
Inter-agency and Expert Group on Sustainable Development Goal Indicators
International Strategy for Disaster Reduction Asia Partnership
Intergovernmental Authority on Development Drought Disaster Resilience and Sustainability Initiative
Internal Displacement Monitoring Centre
International Decade for Natural Disaster Reduction
internally displaced person
Independent Expert Advisory Group
International Federation of Red Cross and Red Crescent Societies
Intergovernmental Authority on Development
International Health Regulation
International Nuclear and Radiological Event Scale
International Nuclear Safety Group
infection prevention and control
cdxxvii

IPCC
IPCC SR1.5
IRDR
IRGC
ISDR
ISIC
ISO
IT
IWRM
JNAP
JRC
KJIP
LAS
LPG
MBBF
MCR
MERCOSUR
MERS
MHEWS
MMLM
MSME
NAP
NAPA
NAP-SDG iFrame
NASA
NATECH
NDC
NDMO
NEA
NGO
NIDIS
NOAA
NSDRR
NSO
NUA
OCHA
ODA
OECD
OIEWG
PCGIR
PCRAFI
PDCA
PDNA
PDRF
PML
PTHA
PTRA
Intergovernmental Panel on Climate Change
Intergovernmental Panel on Climate Change special report Global Warming of 1.5°C
Integrated Research on Disaster Risk
International Risk Governance Council
International Strategy for Disaster Reduction
International Standard Industrial Classification
International Organization for Standardization
information technology
integrated water resources management
joint national action plan
Joint Research Centre
Kiribati Joint Implementation Plan
League of Arab States
liquefied petroleum gas
multiple breadbasket failure
Making Cities Resilient
Southern Common Market (South America)
Middle East respiratory syndrome
multi-hazard early warning system
Multiscalar Method for Landslide Mitigation
micro, small and medium enterprise
national adaptation plan
national adaptation plan of action
National Adaptation Plans and Sustainable Development Goals Integrative Framework
National Aeronautics and Space Administration
natural hazards triggering technological disasters
nationally determined contribution (under the Paris Agreement)
national disaster management organization
Nuclear Energy Agency
non-governmental organization
National Integrated Drought Information System
National Oceanic and Atmospheric Administration
National Strategy for Disaster Risk Reduction
national statistical office
New Urban Agenda
United Nations Office for the Coordination of Humanitarian Affairs
official development assistance
Organisation for Economic Co-operation and Development
Open-ended Intergovernmental Expert Working Group on indicators and terminology relating to disaster risk reduction
Central American Policy for Integrated Disaster Risk Management
Pacific Catastrophe Risk Assessment and Financing Initiative
plan–do–check–act
post disaster needs assessment
Philippine Disaster Resilience Foundation
probable maximum loss
probabilistic tsunami hazard assessment
probabilistic tsunami risk assessment
cdxxviii Abbreviations and acronyms

REC
RICCAR
RSBR
SAARC
SADC
SARS
SDG
Sendai Framework
SFM
SICA
SIDS
SME
SPEI
SPI
SPREP
TB
TMF
2030 Agenda
UN DESA
UNDP
UNECE
UNEP
UNESCO
UNFCCC
UN-GGIM
UN-Habitat
UNHCR
UNDRR / UNISDR
UNSCEAR
USAID
VCA
VISUS
WASH
WASP
WCDRR
WHO
WMO
WUI
YDSI
Yokohama Strategy
$
Regional Economic Commission
Regional Initiative for the Assessment of Climate Change Impacts on Water Resources and Socio-Economic Vulnerability in the Arab Region
risk-sensitive budget review
South Asian Association for Regional Cooperation
Southern African Development Community
severe acute respiratory syndrome
Sustainable Development Goal
Sendai Framework for Disaster Risk Reduction 2015–2030
Sendai Framework Monitor
Central American Integration System
small island developing States
small and medium enterprise
standardized precipitation-evapotranspiration index
standardized precipitation index
Secretariat of the Pacific Regional Environment Programme
tuberculosis
tailings management facility
Transforming our World: the 2030 Agenda for Sustainable Development
United Nations Department of Economic and Social Affairs
United Nations Development Programme
United Nations Economic Commission for Europe
United Nations Environment Programme
United Nations Educational, Scientific and Cultural Organization
United Nations Framework Convention on Climate Change
United Nations Committee of Experts on Global Geospatial Information Management
United Nations Human Settlements Programme
Office of the United Nations High Commissioner for Refugees
United Nations Office for Disaster Risk Reduction
United Nations Scientific Committee on the Effects of Atomic Radiation
United States Agency for International Development
vulnerability and capacity assessment
visual inspection for defining safety upgrading strategies
water, sanitation and hygiene
weighted anomaly of standardized precipitation
World Conference on Disaster Risk Reduction
World Health Organization
World Meteorological Organization
wildland urban interface
yearly drought severity index
Yokohama Strategy for a Safer World: Guidelines for Natural Disaster Prevention, Preparedness and Mitigation
United States dollar
cdxxix

Acknowledgements
GAR Advisory Board ChairMami Mizutori, Special Representative of the Secretary-General for Disaster Risk Reduction.
Board MembersDolika Banda, Africa Risk Capacity Ltd; Kelvin Berryman, GNS Science; Paula Caballero, Rare; Gilberto Camara, Group on Earth Observations (GEO) Secretariat; Rowan Douglas, Willis Towers Watson; Wadid Erian , League of Arab States and Cairo University; Jessica Fries , Accounting for Sustainability Project; Paolo Garonna, Italian Banking, Insurance and Finance Federation and Luiss G. Carli University; Heide Hackmann, International Council for Science; Peter Head , The Ecological Sequestration Trust ; Ronald Jackson , Caribbean Disaster Emergency Management Agency; Molly Jahn, University of Wisconsin-Madison; Patrick Kangwa , Cabinet Office, Government of the Republic of Zambia; Kamal Kishore, National Disaster Management Authority, Government of India; Allan Lavell, Latin American Social Science Faculty; Shuaib Lwasa , Makerere University; Malini Mehra , Globe International; Paloma Merodio, National Institute of Statistics and Geography, Federal Government of Mexico; Ngozi Okonjo-Iweala, Lazard Ltd and the Global Alliance for Vaccines and Immunization; Holly Ransom, Emergent; Aromar Revi, Indian Institute for Human Settlements; Juan Pablo Sarmiento, Florida International University ; Guido Schmidt-Traub , UN Sustainable Development Solutions Network; Youba Sokona, South Centre and Intergovernmental Panel on Climate Change (IPCC).
Coordinating lead authorMarc Gordon, UNDRR.
Part lead authorsAdam Fysh , UNDRR (Part I); Julio Serje , Sofia Palli , UNDRR (Part II); Rhea Katsanakis, UNDRR, Mary Picard, Humanitarian Consulting (Part III).
ContributorsLead authorsJonathan Abrahams, World Health Organization (WHO); Greg Bankoff, University of Hull; Sarah-Jane Cooper-Knock , University of Edinburgh; Federica Cotecchia , Politecnico di Bari; Paul Desanker, United Nations Framework Convention on Climate Change; Wadid Erian, Cairo University; Ebru Gencer, Center for Urban Disaster Risk Reduction and Resilience; Lesley Gibson, University of Edinburgh; Serkan Girgin , European Commission Joint Research Centre (EC JRC); Franziska Hirsch , United Nations Economic Commission for Europe (UNECE); Laura Hirst, University of Manchester; Ritsuko Yamazaki-Honda, UNDRR; Steve Jordan, Greater Manchester Fire and Rescue Service; Emilia Kopeć, KTH Royal Institute of Technology; Elisabeth Krausmann , EC JRC; Olvido Guzmán López-Ocón , Organisation for Economic Co-operation and Development Nuclear Energy Agency (OECD NEA); Stefano Lorito, Istituto Nazionale di Geofisica e Vulcanologia; Finn Løvholt , Norwegian Geotechnical Institute; Jacqueline McGlade, Maasai Mara University/University College London Institute for Global Prosperity; Wilfran Moufouma-Okia, IPCC Working Group 1 and Université Paris Saclay; Amos Necci, EC JRC; James Norris, GEO Secretariat; Katie Peters, Overseas Development Institute (ODI); Angelika Planitz , United Nations Development Programme (U NDP) ; Roger Pulwar t y , Nat ional Oceanic and Atmospheric Administration; David Rush, University of Edinburgh; Jesús San Miguel, EC JRC; John Schneider,
cdxxx Acknowledgements

Global Earthquake Model; Rahul Sengupta , UNDRR; Graham Spinardi, University of Edinburgh; John Twigg, ODI; Jürgen Vogt, EC JRC; Richard Walls, Stellenbosch University; Rebecca Wardle, UNECE; Scott Williams, EIT Climate-KIC; Maureen Wood, EC JRC.
Contributing authorsPaulo Barbosa , EC JRC; Michael Bartos , Australian National University; Nora Bateson, The Bateson Institute; Gregorio Belaunde, Risk Management Expert; Robert Bishop, The International Centre for Earth Simulation; Osvaldo Bottiglieri, Technical University of Bari; Pascale Bourassa , Canadian Nuclear Safety Commission; George Breyannis, EC JRC; Francesco Cafaro, Technical University of Bari; Carmelo Cammalleri, EC JRC; Marco Cometto, International Atomic Energy Agency; Christina Corbane, EC JRC; Silvia de Angeli, CIMA Foundation; Tom de Groeve, EC JRC; Fernanda Del Lama Soares, UNDRR Consultant; Kirsten Dunlop, EIT Climate-KIC; Luis Rolando Durán Vargas, UNDRR Consultant; Daniele Erlich , EC JRC; Aneta Florczyk , EC JRC; Karin Fueri, UNECE; Franz Gatweiler, Institute of Urban Environment, Chinese Academy of Sciences; Franziska Gaupp , International Institute for Applied Systems Analysis (IIASA); Tatiana Ghizzoni, CIMA Foundation; Georgios Giannopolous , EC JRC; Abel González , Argentine Academies of Environmental Sciences and of the Sea; Simona Guglielmi, Technical University of Bari; Peter Head, Ecological Sequestration Trust; Paul Henshaw, Global Earthquake Model; Stefan Hochrainer, IIASA; Molly Jahn, University of Wisconsin-Madison; Claudia Kamke , UNECE; Thomas Kemper, EC JRC; Ted Lazo, United States Nuclear Regulatory Commission; Rajeev Issar, UNDP; Joanne Linnerooth-Bayer, IIASA; Jieling Liu, Universidade de Lisboa; Piernicola Lollino, Research Institute for the Geo-Hydrological Protection; Shuaib Lwasa , Makerere University; Jeremy Marand, UNDRR Consultant; Montserrat Marin Ferrer, EC JRC; Dario Masante, ARCADIA SIT Srl; Michele Melchiorri, EC JRC; Gustavo Naumann, EC JRC; Michael Obersteiner, IIASA; Mario Ordaz, Universidad Nacional Autónoma de México; Marco Pagani , Global Earthquake Model; Laura E.R. Peters, Oregon State University; Rossella Petti, Technical University of Bari; Frederik Pischke , Global Water Partnership and World Meteorological Organization; Aromar Revi, Indian Institute for Human Settlements; Claudio Rossi, Istituto Superiore Mario Boella; Roberto Rudari, CIMA Foundation; Peter Salamon, EC JRC; Mario Salgado-Gálvez , Evaluación de Riesgos Naturales; Francesca Santaloia , Research Institute for the Geo-Hydrological Protection; Juan Pablo Sarmiento, Florida International University; Vitor Silva, Global Earthquake Model; Youba Sokona, South Centre and IPCC; Jonathan Spinoni, EC JRC; David Stevens, UNDRR; Vito Tagarelli, Technical University of Bari; Martha Teshome, UNDRR Consultant; Pierpaolo Tommasi, EC JRC; Costis Toregas,
George Washington University; Stefania Traverso, CIMA Foundation; Kathleen Van Heuverswyn , Katholieke Universiteit Leuven; Ximena Vasquez-Maignan, OECD NEA; Claudia Vitone, Technical University of Bari.
Peer review of contributing papersCoordinating organization: The University of Auckland; peer review coordination: Migel Estoque, JC Gaillard, Debby Paramitasari (The University of Auckland); UNDRR Coordination: Rhea Katsanakis, Chiara Menchise.
Design and productionCommunications and layout: Jeanet te Elswor th , S tephanie Doust Speck , UNDRR; content editing: Mary Picard; design concept: Earth Literacy Program (NPO); A XIS Inc.; editing: Caren Brown; graphics a n d i l l u s t r a t i o n s d eve l o p m e n t : J a m e s B r ow n , D e s i g n I s R E A L ; ove r a l l g u i d a n c e a n d e d i t o r i a l support: Mami Mizutori , Kirsi Madi, Ricardo Mena; printing: Imprimerie Centrale; production coordination and administrative support (UNDRR): Pascal Chaillet; procurement : Uni ted Nations Off ice at Geneva; references: Chiara Menchise, UNDRR Consultant , Victoria Triay Jimenez, UNDRR Intern; report layout: Takae Ooka, Pinkuneko Production.
GAR19 WebsiteDevelopment coordination (UNDRR): Jeanette Elsworth, Rhea Katsanakis, Fanny Langella, Revati Mani Badola, Chiara Menchise; dynamic graphic development: Natalia Reiter; online design and development: Whitespace S.A.
Financial resourcesUNDRR expresses its deep appreciation to all the donors that have supported its work, allowing production of the Global Assessment Report on Disaster Risk Reduction 2019.
cdxxxi

Aas, K. (2004). Modelling the Dependence Structure of Financial Assets: A Survey of Four Copulas. Norwegian Computing Centre. https://www.nr.no/files/samba/bff/SAMBA2204b.pdf.
Aas, K., C. Czado, A. Frigessi and H. Bakken (2009). Pair-Copula Constructions of Multiple Dependence. Insurance: Mathematics and Economics 44 (2). h t tp: // l ink inghub.e lsev ie r.c om /re t r ieve/p i i /S0167668707000194.
Abbott, D.F. (2018). Disaster Risk Management Public Expenditure and Institutional Reviews (DRM-PEIR) for Lao People’s Democratic Republic, Thailand and Viet Nam. UNDP. http://www.asia-pacific.undp.org/content/rbap/en/home/library/democratic_governance/drm-cpeir-lao-pdr-thailand-viet-nam.html.
ADB (2019). ADB’s Focus on Climate Change and Disaster Risk Management. Asian Development Bank. https://www.adb.org/themes/climate-change-disaster -risk-management/main.
Adelekan, I.O. (2010). Vulnerability of Poor Urban Coastal Communities to Flooding in Lagos, Nigeria. Environment and Urbanization 22 (2). http://journals.sagepub.com/doi/10.1177/0956247810380141.
ADPC (2017a). Asia Leadership Forum for Business Resilience. https://app.adpc.net/index.php/news/asian-leadership-forum-business-resilience.
(2017b). Strengthening Disaster and Climate Resilience of Small and Medium Enterprises in Asia. Philippines. http://www.adpc.net/sme-resilience-asia/download/PHI/IP_SR_philippines.pdf.
(2017c). Strengthening Disaster and Climate Resilience of Small and Medium Enterprises in Asia. Philippines - Roadmap for SME Resilience. http://www.adpc.net/sme-resilience-asia/download/PHI/IP_RM_Philippines.pdf.
(2017d). Strengthening Disaster and Climate Resilience of Small and Medium Enterprises in Asia. Regional Synthesis Report: Indonesia, Philippines, Thailand, Viet Nam. http://www.adpc.net/sme- resilience-asia/.
(2017e). Strengthening Disaster and Climate Resilience of Small and Medium Enterprises in Asia. Thailand. http://www.adpc.net/sme-resilience-asia/download/THA/IP_CR_Thailand.pdf.
(2 0 18) . E n g a g i n g t h e P r i va te S e c t o r i n Preparedness for Response - Experiences from the Asian Preparedness Partnership. https://app.
References
adpc.net/sites/default/files/public/publications/at tachments/APP%20documentation%20 -%20Engaging%20the%20private%20sector%20in%20preparedness%20for%20response.pdf.
ADPC and iPrepare Business Facility (2017). Strengthen-ing Disaster and Climate Resilience of Small and Medium Enterprises in Asia. Regional Synthesis Report: Indonesia, Philippines, Thailand, Viet Nam. http://www.adpc.net/sme-resilience-asia/.
Afghanistan, State Ministry of Disaster Management and Humanitarian Affairs, and Afghanistan National Disaster Management Authority (2018). Afghanistan Strategy for Disaster Risk Reduction in Line with the Sendai Framework for Disaster Risk Reduction (SFDRR).
African Development Bank (2018). African Economic Outlook 2018. https://www.afdb.org/fileadmin/uploads/afdb/Documents/Publications/African _Economic_Outlook_2018_-_EN.pdf.
African Insurance Organization (2018). Africa Insurance Barometer 2018. No. 3. Market Survey. https://pulse.schanz-alms.com/files/media/files/aac2 d1e0123a5b5f5df7008326f20a3a/Africa_Insurance _Barometer_WEB_E.pdf.
African Risk Capacity (2019). African Risk Capacity: Trans-forming Disaster Risk Management and Financing in Africa. www.africanriskcapacity.org/.
Agathangelou, A. and Transparency Task Force (2018). Ideas to Help Reduce the Chance of Another Global Financial Crisis. The House of Commons.
Agenda for Humanity (2019). Initiative GRAND BARGAIN. https://www.agendaforhumanity.org/initiatives/ 3861.
Alampay, E.A., D. Dela Torre, G. Eguia and X. Asuncion (2017). Reviewing Climate Change Expenditure Tagging in the Philippines with a Focus on Adaptation and Agricultural Investments (Policy Brief). Center for Local and Regional Governance, National College of Public Administration and Governance, and Oxfam.
Allan, R. and B. Soden (2008). Atmospheric Warming and the Amplification of Precipitation Extremes. Science 321 (5895). http://science.sciencemag.org/content/321/5895/1481.abstract.
Alliance of Small Island States (2019). http://aosis.org.Almeda, S. and I. Baysic-Pobre (2012). Micro, Small and
Medium Enterprises (MSMEs) in the Philippines: What We Know and What We Don’t Know. Social Science Research Network.
cdxxxii References

Alton, M.L., O. Mahul and C. Benson (2017). Assessing Financial Protection against Disasters: A Guidance Note on Conducting a Disaster Risk Finance Diagnostic. The World Bank . http://documents.worldbank.org/curated/en/102981499799989765/Assessing-financial-protection-against-disasters-a-guidance-note-on-conducting-a-disaster-risk-finance-diagnostic.
Alvarez, L. (2017). As Power Grid Sputters in Puerto Rico, Business Does Too. New York Times. https://www.nytimes.com/2017/11/15/us/puerto-rico-economy-jobs.html.
Amaratunga, D., P. Sridarran, R. Haigh, S. Bhatia and M. Pruksapong (2019). Reducing Risks and Building Resilience at the Local Level: A Global Review of Local DRR Strategies. GAR19 Contributing Paper, UNISDR.
Amazon (2019). Earth on AWS. Amazon Web Services Inc. https://aws.amazon.com/earth/.
AMCDRR (2016). Asia Regional Plan for Implementation of the Sendai Framework for Disaster Risk Reduction 2015-2030. https://www.unisdr.org/2016/amcdrr/wp-content/uploads/2016/11/FINAL-Asia-Regional-Plan-for-implementation-of-Sendai-Framework-05-November-2016.pdf.
(2018). Action Plan 2018-2020 of the Asia Regional Plan for Implementation of the Sendai Framework for Disaster Risk Reduction 2015-2030. https://www.preventionweb.net/files/56219_actionplan 20182020final.pdf.
Anderson, C. and A. Cowell (2018). Heat Wave Scorches Sweden as Wildfires Rage in the Arctic Circle. New York Times, 19 July 2018. https://www.nytimes.com/2018/07/19/world/europe/heat-wave-sweden-fires.html.
A n d r i a m a n a l i n a r i v o , R . R . , A . F. F a l y b a n d J . H . Randriamanalina (2019). Madagascar, a Country Resilient to the Effects of Hazards and Protected from Damage for Sustainable Development. GAR19 Contributing Paper, UNISDR.
Anton, B., M. Dupar, E. Gogoi, A. Cambray and A. Westerlind-Wigstroem (2016). Close to Home: Subnational Strategies for Climate Compatible Development. Climate and Development Knowledge Network. ht tps://cdkn.org/wp - content /uploads/2014/ 04/CDKN_ICLEI-Subnational-CCD-Strategies.pdf.
Aon Benfield Corporation and Impact Forecasting (2012). 2011 Thailand Floods Event Recap Report, Impact Forecasting – March 2012. http://thoughtleadership.aonbenfield.com/Documents/20120314_impact_forecasting_thailand_flood_event_recap.pdf.
APEC (2013). Small and Medium Enterprise Working Group (SMEWG).
(2014). Special Edition on SME Business Conti-nuity Planning in the Face of Disasters. APEC SME Monitor, No. 16.
(2015a). The 23rd APEC Economic Leaders’ Dec larat ion – Bui ld ing Inc lusive Economies , Building a Better World: A Vision for an Asia-Pacific
Community. https://www.mofa.go.jp/ecm/apec/page24e_000122.html.
(2015b). The APEC Iloilo Initiative: Growing Global MSMEs for Inclusive Development. https://www.apec.org/Meeting-Papers/Sectoral-Ministerial -Meetings/Small-and-Medium-Enterprise/2015_sme/Annex%20A.aspx.
(2016). APEC Disaster Risk Reduction Action Plan. https://www.apec-epwg.org/public/uploadfile/act/d20829852d84ae1cb0aba86b475e8f82.pdf.
Arab Strategy for Disaster Risk Reduction 2030 (2018). UNISDR. https://www.preventionweb.net/files/ 59464_asdrrreportinsidefinalforweb.pdf.
Argentina Civil Protection Agency (2019). Argentina Country Case Study for GAR 2019. UNDP.
ASEAN (2005). ASEAN Agreement on Disaster Management and Emergency Response. http://agreement.asean.org/media/download/20140119170000.pdf.
(2015). Strategic Action Plan for SME Development 2 016 -2 0 25 . h t t p s : //as e a n .o r g / w p - c o n te n t / uploads/2015/12/SAP-SMED-Final.pdf.
(2016a). AADMER Work Programme 2016-2020. (2016b). ASEAN-UN Joint Strategic Plan of Action
on Disaster Management 2016-2020. https://asean.org/storage/2017/12/ASEAN-UN-JSPADM-2016- 2020_final.pdf.
ASEAN Finance Ministers’ Meeting (2018). The Joint Statement of the Finance Ministers’ Meeting on the Establishment of the Southeast Asia Disaster Risk Insurance Facility (SEADRIF). https://www.google.com/url?sa=t&rct=j&q=&esrc=s&source=web&cd=2&cad=rja&uact=8&ved=2ahUKEwjEopelzp3gAhUnhaYKHdFHDXIQFjABegQICBAC&url=https%3A%2F%2Fwww.mof.go.jp%2Fenglish%2Finternational_policy%2Ffinancial_cooperation_in_asia%2F2018 0504_e.pdf&usg=AovVaw0hqCWWNVzrLliqIG1wJjDC.
ASEAN Secretariat (2015). ASEAN 2025: Forging Ahead Together. https://www.asean.org/wp-content/uploads/2015/12/ASEAN-2025-Forging-Ahead-Together-final.pdf.
Asia Pacific Economic Cooperation Secretariat (2013). Guidebook on SME Business Continuity Planning. https://www.apec.org/-/media/APEC/Publications/ 2013/9/Guidebook-on-SME-Business-Continuity-Planning/2013_sme_BCPBrochure.pdf.
Asian Disaster Preparedness Partnership (2019). Bill & Melinda Gates Foundation and Asian Disaster Preparedness Center (2019). https://app.adpc.net/.
Attolico, A. and R. Smaldone (2019). The Province of Potenza #weResilient Multiscale and Multilevel Holistic Approach in Downscaling Local Resilience and Sustainable Development: The Case of the Province of Potenza and Its Municipalities of Potenza and Pignola. GAR19 Contributing Paper, UNISDR.
AU (2004). Africa Regional Strategy for Disaster Risk Reduction. https://www.unisdr.org/files/4038_africaregionalstrategy1.pdf.
cdxxxiii

(2016). Programme of Action for the Imple-mentation of the Sendai Framework for Disaster Risk Reduction 2015-2030 in Africa. https://www.preventionweb.net/f i les/49455 _ poaforsendai implementationinafrica.pdf.
(2018). Africa-Arab Platform on Disaster Risk Reduction. Towards Disaster Risk- Informed and Inclusive Sustainable Development: Concept Note. UNISDR. https://www.unisdr.org/files/57759_africaarabplatformconceptnoteeng25j.pdf.
AU and UNISDR (2018). Tunis Declaration on Accelerating the Implementation of the Sendai Framework for Disaster Risk Reduction 2015-2030 and the Africa Regional Strategy for Disaster Risk Reduction. https://www.preventionweb.net/english/policies/v.php?id=62491&rid=1.
Aysan, Y. and A. Lavell (2015). Disaster Risk Governance during the HFA Implementation Period. UNISDR and UNDP. https://www.preventionweb.net/english/hyogo/gar/2015/en/bgdocs/UNDP,%202014a.pdf.
Baez, J.E., L. Lucchetti, M.E. Genoni and M. Salazar (2017). Gone with the Storm: Rainfall Shocks and Household Wellbeing in Guatemala. Journal of Development Studies 53 (8). https://www.tandfonline.com/doi/full/10.1080/00220388.2016.1224853.
Baffes, J. and T. Haniotis (2010). Placing the Recent Commodity Boom into Perspective. The World Bank.
Bailey, R., T.G. Benton, A. Challinor, J. Elliott, D. Gustafson, B. Hiller and A. Jones (2015). Extreme Weather and Resilience of the Global Food System. Final Project Report from the UK-US Taskforce on Extreme Weather and Global Food System Resilience. Global Food Security Programme.
Bangladesh, Ministry of Disaster Management and Relief (2017). National Plan for Disaster Management 2016-2020.
Bank for International Settlement (2018). Structural Changes in Banking after the Crisis. Committee on the Global Financial System, No. 60. https://www.bis.org/publ/cgfs60.pdf.
Baranzini, D., M. Wood, E. Krausmann and L. van Wijk (2018). Capacity Building Measures for Chemical Accident Prevention and Preparedness: Benchmark of EU Neighbourhood Countries. Journal of Disaster Risk Reduction 31.
Barkenbus, J.N. (2010). Eco-Driving: An Overlooked Climate Change Initiative. Energy Policy 38 (2). https://linkinghub.elsevier.com/retrieve/pii/S03014 21509007484.
Barker, L. (2016). From Meteorological to Hydrological Drought Using Standardised Indicators. Hydrology and Earth System Sciences. Hydrology and Earth System Sciences 20 (6).
Barredo, J.I. (2009). Normalised Flood Losses in Europe: 1970–2006. Natural Hazards and Earth System Sciences 9. ht tps://www.preventionweb.net/files/12207_normalisedfloodlossesEN.pdf.
Barthel, F. and E. Neumayer (2012). A Trend Analysis of Normalized Insured Damage from Natural Disasters. Climatic Change 113 (2). http://link.springer.com/10.1007/s10584-011-0331-2.
Bateson, N. (2018). Warm Data to Better Meet the Complex Risks of This Era. Norabateson (blog). https://norabateson.wordpress.com/2018/12/07/warm-data-to-better-meet-the-complex-risks-of-this-era/.
Bauer, D. (2014). Implications of Climate Change and Other Trends. In The Water-Energy Nexus: Chal lenges and Oppor tunit ies. United S tates Department of Energy.
Bayissa, Y., S. Maskey, T. Tadesse, J.S. van Andel, S. Moges, A. van Griensven and D. Solomatine (2018). Comparison of the Performance of Six Drought Indices in Characterizing Historical Drought for the Upper Blue Nile Basin, Ethiopia. Geosciences 8 (3).
Beck, U. (1999). World Risk Society. Polity Press.Behrens, J. and F. Dias (2015). New Computational
Methods in Tsunami Science. Phi losophical Transactions of the Royal Society A: Mathematical, Physical and Engineering Sciences 373 (2053). http://rsta.royalsocietypublishing.org/lookup/doi/ 10.1098/rsta.2014.0382.
Belmont Forum (2015). A Place to Stand: e-Infrastructures and Data Management for Global Change Research. ht tps://w w w.belmontforum.org/wp - content/uploads/2017/05/A _Place_to_Stand-Belmont_Forum_E-Infrastructures_ _Data_Management_CSIP.pdf
Beloglazov, A., M. Almashor, E. Abebe, J. Richter and K. Steer (2015). Simulation of Wildfire Evacuation with Dynamic Factors and Model Composition. https://be loglazov. info/papers/2016 - smpt- wi ldf i re -evacuation.pdf.
Below, R. and P. Wallemacq (2018). Annual Disaster Statistical Review 2017. Centre for Research on the Epidemiology of Disasters. https://www.cred.be/annual-disaster-statistical-review-2017.
Bendimerad, F., R. Jigyasu, A. Sjodin, G. Jain, L. Nadal, E. Gencer, V. Seva, et al. (2015). Guidance Note for Essential 4: Pursue Resilient Urban Development, Planning, and Design. Urban Planning Advisory Group. https://www.unisdr.org/campaign/resilient cities/home/index/Essential%20Four:%20Pursue% 20Resilient%20Urban%20Development%20and%20Design/?id=4.
Benson, C. (2016). Promoting Sustainable Development t h r o u g h D i s a s te r R i s k M a n a g e m e n t . A s i a n Development Bank. https://www.adb.org/publi cations/sustainable-development-through-disaster-risk-management.
Benson, C. and J. Twigg (2007). Tools for Mainstreaming Disaster R isk Reduction: Guidance Notes for D e ve l o p m e n t O r g a n i s a t i o n s . h t t p s : // w w w. preventionweb.net/files/1066_toolsformainstream ingDRR.pdf.
cdxxxiv References

Berger, N. and P. Elias (2018). California Takes Financial Wallop from Unrelenting Wildfires. AP News. https://apnews.com/c6df1fe03b91418b881f48a490863c49.
Bergstrand, K., B. Mayer, B. Brumback and Y. Zhang (2015). Assessing the Relationship Between Social Vulnerability and Community Resilience to Hazards. Social Indicators Research 122 (2). http://link.springer.com/10.1007/s11205-014-0698-3.
Berryman, K., L. Wallace, G. Hayes, P. Bird, K. Wang, R. Basili, T. Lay, et al. (2015). The GEM Faulted Earth Subduction Interface. Characterisation Project, Version 2.0. GEM Faulted Earth Project. http://www.nexus.globalquakemodel.org/gem-faulted-earth/posts.
Bevacqua, E., D. Maraun, I. Hobæk Haff, M. Widmann and M. Vrac (2017). Multivariate Statistical Modelling of Compound Events via Pair-Copula Constructions: Analysis of Floods in Ravenna (Italy). Hydrology and Earth System Sciences 21. http://www.hydrol-earth-syst-sci-discuss.net/hess-2016-652/.
Bird, P., D. Jackson, Y. Kagan, C. Kreemer and R. Stein (2015). GE AR1: A Global Ear thquake Activi ty Rate Model Constructed from Geodetic Strain Rates and Smoothed Seismic i t y. Bul let in of the Seismological Society of America 105 (5). https://pubs.geoscienceworld.org/bssa/article/ 105/5/2538-2554/332070.
Blumberg, L.H., M.A. Prieto, J.V. Diaz, M.J. Blanco, B. Valle, C. Pla and D.N. Durrheim (2018). The Preventable Tragedy of Diphtheria in the 21st Century. International Journal of Infectious Diseases 71. https://linkinghub.elsevier.com/retrieve/pii/S1201971218344102.
Boer, J. de, A. de Witt and H. Aiking (2016). Help the Climate, Change Your Diet: A Cross-Sectional Study on How to Involve Consumers in a Transition to a Low-Carbon Society. Appetite 98. https://linkinghub.elsevier.com/retrieve/pii/S0195666315301100.
Boisramé, G., S. Thompson, B. Collins and S. Stephens (2017). Managed Wildf i re Ef fects on Forest Resi l ience and Water in the S ie r ra Nevada. Ecosystems 20 (4). http://link.springer.com/10.1007 /s10021-016-0048-1.
Bolivia, Plurinational State of (2015). Decreto Supremo N° 2342. faolex.fao.org/docs/pdf/bol145341.pdf.
Bommer, J., R. Spence, M. Erdik, S. Tabuchi, N. Aydinoglu, E . Booth , D. del Re and O. Peterken (2002). Development of an Earthquake Loss Model for Turkish Catastrophe Insurance. Journal of Seismology 6 (3). https://doi.org/10.1023/A:102009 5711419.
Bonilla Garcia, A. and J. Gruat (2003). Social Protection: A Life Cycle Continuum Investment for Social Justice, Poverty Reduction and Sustainable Development. In te rnat ional L abour O rganizat ion . h t tps: //gsdrc.org/document- library/social -protection-a - l ife -cycle -continuum- investment-for-social -
jus t ic e - p ove r t y - re du c t ion - and - sus ta inab le -development/.
Brazi l , Ministr y of Environment (2016). National Adaptation Plan to Climate Change: Executive S u m ma r y. h t tp: //w w w.mma.gov.b r/ images/a r q u i v o / 8 0 18 2 / B O O K _ P N A _ E x e c u t i v e % 2 0Summary%20v4.pdf.
Brink, H.W. van den, G.P. Können, J.D. Opsteegh, G.J. van Oldenborgh and G. Burgers (2005). Estimating Return Periods of Extreme Events from ECMWF Seasonal Forecast Ensembles. International Journal of Climatology 25 (10). http://doi.wiley.com/10.1002/joc.1155.
Brooks, N. (2003). Vulnerability, Risk and Adaptation: A Conceptual Framework. Tyndall Centre Working Paper. https://www.researchgate.net/publication/ 200032746_Vulnerability_Risk_and_Adaptation_A_Conceptual_Framework.
Brooks, N., W.N. Adger and P.M. Kelly (2005). The Determinants of Vulnerabi l i t y and Adapt ive Capacity at the National Level and the Implications for Adaptation. Adaptation to Climate Change: Pe r s p e c t i ve s Ac r o s s S c a l e s 15 (2) . h t t p : //w w w.sciencedirect .com/science/ar t ic le/pi i/S0959378004000913.
Brown, S., R. Nicholls, C. Woodroffe, S. Hanson, J. Hinkel and A.S. Kebede (2013). Sea-Level Rise Impacts and Responses: A Global Perspective. Springer.
Brunner, P.H. and H. Rechberger (2002). Anthropogenic Metabol ism and Environmental Legacies. In Encyclopedia of Global Environmental Change. Volume 3. Causes and Consequences of Global Env i ronmental Change. Wi ley. h t tps: //pdfs .semanticscholar.org/b027/689951e76e966ad110ee33b7233adf7895eb.pdf.
Bureau de Recherches Géologiques et Minières, Comité Interministériel d’Aménagement du Territoire, The World Bank and GFDRR (2017). Atlas of Natural Threats in Haiti. http://ciat.gouv.ht/sites/default/files/articles/files/ATLAS%20HAITI%20FRENCH% 2005032017_LR.pdf.
Butterfield, H. (2007). The Origins of Modern Science 1300-1800. Free Press.
Cammalleri, C., F. Micale and J. Vogt (2015). A Novel Soil Moisture-Based Drought Severity Index (DSI) Combining Water Deficit Magnitude and Frequency. Hydrological Processes 30. https://doi.org/10.1002/hyp.10578.
Cammal le r i , C. , J. Vogt and P. Salamon (2017 ). Development of an Operational Low-Flow Index for Hydrological Drought Monitoring over Europe. Hydrological Sciences Journal 62 (3). https://doi.org/10.1080/02626667.2016.1240869.
Campbell, B.M., D.J. Beare, E.M. Bennett, J.M. Hall-Spencer, J.S.I. Ingram, F. Jaramillo, R. Ortiz, N. Ramankutty, J.A. Sayer and D. Shindell (2017). Agriculture Production as a Major Driver of the Earth
cdxxxv
System Exceeding Planetary Boundaries. Ecology and Society 22 (4). https://www.ecologyandsociety.org/vol22/iss4/art8/.
Carney, M. (2015). Breaking the Tragedy of the Horizon - Climate Change and Financial Stability. http://www.bankofengland.co.uk/speech/2015/breaking-the-tragedy-of-the-horizon-climate-change-and-financial-stability.
Car rão , H. , G. Naumann and P. Barbosa (2016). Mapping Global Patterns of Drought Risk: An Empirical Framework Based on Sub -National Estimates of Hazard, Exposure and Vulnerability. Global Environmental Change 39. ht tp://www. sciencedirect.com/science/article/pii/S095937 8016300565.
Caruso, G. and S. Miller (2015). Long Run Effects and Intergenerational Transmission of Natural Disasters: A Case Study on the 1970 Ancash Earthquake. Journal of Development Economics 117. https://linkinghub.elsevier.com/retrieve/pii/S0304387815000917.
Cascini, L., D. Peduto, G. Pisciotta, L. Arena, S. Ferlisi and G. Fornaro (2013). The Combination of DInSAR and Facility Damage Data for the Updating of Slow-Moving Landslide Inventory Maps at Medium Scale. Natural Hazards and Earth System Sciences 13 (6). https://www.nat-hazards-earth-syst-sci.net/13/1527/2013/.
CCRIF (2019). Caribbean Catastrophe Risk Insurance Facility. https://www.ccrif.org/.
CDEMA (2013). Model Comprehensive Disaster Manage-ment Law and Regulations. http://eird.org/americas/docs/model-cdm-legislation-and-regulations-2013.pdf.
(2014). Regional Comprehensive Disaster Management (CDM) Strategy and Programming Framework 2014-2024 (DRAFT). https://www.cdema. org/CDMStrategy2014-2024.pdf.
Centeno, M.A., M. Nag, T.S. Patterson, A. Shaver and A.J. Windawi (2015). The Emergence of Global Systemic Risk. Annual Review of Sociology 41 (1). http://www.annualreviews.org/doi/10.1146/annurev-soc-073014-112317.
Central American Council for Agriculture (2010). Central American Strategy for Rural Development. SICA.
Centre for Disease Control and Prevention (2019). Cost of the Ebola Epidemic. https://www.cdc.gov/vhf/ebola/history/2014-2016-outbreak/cost-of-ebola.html.
Centre for Research on the Epidemiology of Disasters (2018). EM - DAT The I nte rnat iona l D isaste rs Database. https://www.emdat.be/.
Centre for Science and Environment (2018). CSE Analyses the New IPCC Special Report on Global Warming of 1.5°C. https://www.cseindia.org/bihar-s-first-solid-waste-processing-site -to -convert-organic-waste-9055.
CEPREDENAC (2019). Contribuyendo con el Desarrollo Sostenible y Seguro de Centroamérica y República Dominicana. http://www.cepredenac.org/.
Chakrabarti, P.G.D. (2019). Measuring Disaster Risks and Resilience at Sub-National Level in India. GAR19 Contributing Paper, UNISDR.
Chan, M. (2019). Climate Change and Health (Video). NIH Videocasting and Podcasting. https://videocast.nih.gov/Summary.asp?File=14197&bhcp=1.
Chandler, R.J. (1974). Lias Clay: The Long-Term Stability of Cutting Slopes. Géotechnique 24 (1). http://www.icevirtuallibrary.com/doi/10.1680/geot.1974.24.1.21.
Chandler, R.J. and A.W. Skempton (1974). The Design of Permanent Cutting Slopes in Stiff Fissured Clays. Géotechnique 24 (4). http://www.icevirtuallibrary.com/doi/10.1680/geot.1974.24.4.457.
City of New York (2011). One New York. The Plan for a Strong and Just City. OneNYC Is New York City’s Plan to Become the Most Resilient, Equitable, and Sustainable City in the World. https://onenyc.cityof newyork.us/.
(2018). OneNYC 2018. Progress Report.Clarke, L., K. Blanchard, R. Maini, A. Radu, N. Eltinay,
Z. Zaidi and V. Murray (2018). Knowing What We Know – Reflections on the Development of Technical Guidance for Loss Data for the Sendai Framework for Disaster Risk Reduction. PLoS Currents Disasters. http://currents.plos.org/disasters/?p=36974.
Clegg, G., R. Haigh, A. Panda and N. Dias (2019). Integration of CCA and DRR for Flood Resilience: A Review of Good Practices from the United Kingdom. GAR19 Contributing Paper, UNISDR.
Coburn, A.W., G. Bowman, S.J. Ruffle, R. Foulser-Piggott, D. Ralph and M. Tuveson (2014). A Taxonomy of Threats for Complex Risk Management. Cambridge Risk Framework Series. https://www.jbs.cam.ac.uk/fileadmin/user_upload/research/centres/risk/downloads/crs-cambridge-taxonomy-threats-complex-risk-management.pdf.
Colombia (2015). Plan Nacional de Gestión del Riesgo de Desastres ‘una estrategia de desarrollo’ 2015-2025. http://portal.gestiondelriesgo.gov.co/Paginas/Plan-Nacional-Gestion-Riesgo-de-Desastres.aspx.
Communauté économique des États de l’Afrique de l’Ouest and ECOWAS (2006). ECOWAS Policy for Disaster Risk Reduction. https://www.prevention web.net/files/26398_4037ecowaspolicydrr1.pdf.
Conrad, V. (2018). Why so Many Medicines Are in Short Supply Months after Hurricane Maria. CBS News. https://www.cbsnews.com/news/why-so-many-medicines-arel-in-short-supply-after-hurricane-maria/.
CONRED (2019). Country Case Study for GAR 2019. UNDP.Cook, B.I., R.L. Miller and R. Seager (2009). Amplification
of the North American ‘Dust Bowl’ Drought through Human-Induced Land Degradation. Proceedings of the National Academy of Sciences 106 (13). http://www.pnas.org/content/106/13/4997.abstract.
cdxxxvi References

Cook Islands (2016). JNAP II - Are We Resilient? The Cook Islands 2nd Joint National Action Plan. https://www.pacificclimatechange.net/sites/default/files/documents/cok170758.pdf.
Coordination Center for the Prevention of Disasters in Central America (2010). Central American Policy on Comprehensive Disaster Risk Management - PCGIR. http://www.cepredenac.org/application/files/8614/7369/9655/PCGIR_Ingles.pdf.
Coordination Center for the Prevention of Disasters in Central America and The World Bank (2014). Plan Regional de Reducción de Riesgo de Desastres PRRD (2014-2019). http://www.cepredenac.org/application/files/8714/9866/7804/Plan_Regional_de_Reduccion_de_Riesgo_de_Desastres_PRRD_ 2014_-_2019.pdf.
Cornish, E. (2005). Futuring: The Exploration of the Future. World Future Society.
Costa, F., T.Z.W. Nang, C. Newhall, C. Widiwijayanti and E. Fajiculay (2019). WOVOdat -The Global Volcano Unrest Database Aimed at Improving Eruption Forecasts. GAR19 Contributing Paper, UNISDR.
Costa Rica (n.d.). Costa Rica - Progreso de Sendai.Costa Rica, Ministerio de la Presidencia (2019). Planes
Institucionales y Cumplimiento. http://transparencia. presidencia.go.cr/planes-y-cumplimiento/#14657 52770060-eac5281a-210d.
Cotecchia, F., F. Santaloia, P. Lollino, G. Mitaritonna and C. Vitone (2012). Applicazione Delle Linee Guida JTC-1 Secondo Un Approccio Multi-Scalare. Criteri Di Zonazione Della Suscettibilità e Della Pericolosità Da Frane Innescate Da Eventi Estremi (Piogge e Sisma).
Cotecchia, F., F. Santaloia, P. Lollino, C. Vitone, G. Pedone and O. Bottiglieri (2016). From a Phenomenological to a Geomechanical Approach to Landslide Hazard Analysis. European Journal of Environmental and Civil Engineering 20 (9). https://www.tandfonline.com/doi/full/10.1080/19648189.2014.968744.
Craglia, M., A. Annoni, A. Benczur, P. Bertoldi, P. Delipetrev, B. De Prato, G. Feijoo, et al. (2018). Artif icial Intelligence: A European Perspective. EUR 29425 EN. Pub l icat ions O f f ice of the E U. h t tps: //ec.europa.eu/jrc/en/publication/eur-scientific-and-technical-research-reports/artificial-intelligence- european-perspective.
Crawford, N., S. Haysom, J. Cosgrave and N. Walicki (2015). Protracted Displacement: Uncertain Paths to Self-Reliance in Exile. Humanitarian Policy Group and Overseas Development Institute. https://www. odi.org/sites/odi.org.uk/files/odi-assets/publications-opinion-files/9851.pdf.
Cruz, A.M., Y. Kajitani and H. Tatano (2015). Natech Disaster Risk Reduction: Can Integrated Risk Governance Help? In Risk Governance – The Articulation of Hazard, Politics and Ecology. Springer. ht tp://l ink.springer.com/10.1007/978-94 - 017- 9328-5_23.
Cruz, A.M., L.J. Steinberg, A.L. Vetere Arellano, J.P. Nordvik and F. Pisano (2004). State of the Art in Natech Risk Management. EC and UNISDR. https://www.unisdr.org/files/2631_FinalNatechState ofthe20Artcorrected.pdf.
Cutter, S.L., B.J. Boruff and W.L. Shirley (2003). Social Vulnerability to Environmental Hazards. Social Science Quarterly 84 (2). http://doi.wiley.com/ 10.1111/1540-6237.8402002.
D a l y , M . , T . F . F a t h a n i , M . G o l d s m i t h , E . A n a n t as a r i , I . S a t ya r n o , N . F o u r n i e r , K . B e r r y m a n , e t a l . ( 2 0 1 9 ) . D e v e l o p m e n t of DRR Action Plans for Local Government in Indonesia. GAR19 Contributing Paper, UNISDR.
Dang, H.H., P.F. Lanjouw and R. Swinkels (2017). Who Remained in Poverty, Who Moved Up, and Who Fell Down? In Poverty Reduction in the Course of African Development, M. Nissanke and M. Ndulo, eds. Oxford University Press. https://doi.org/10.1093/acprof:oso/9780198797692.003.0008.
Data Revolution Group (2019). A World That Counts - UN Data Revolution. http://www.undatarevolution.org/draft-report/.
Davies, G., J. Griffin, F. Løvholt, S. Glimsdal, C. Harbitz, H .K . Thio , S . Lor i to , e t a l . (2018). A G lobal P ro ba b i l i s t ic Tsu na mi H a za rd A ssess m e n t from Earthquake Sources. Geological Society, London , Special Publ ications 456 (1). ht tp://sp.lyellcollection.org/lookup/doi/10.1144/SP456.5.
De Bettencourt, U.M., T. Sofia, J.O. Ebinger, M. Fay, F. Ghesquiere, H. Gitay, J.K. Krausing, et al. (2013). Building Resilience. Integrating Climate and Disaster Risk into Development- the World Bank Group Experience: Main Report. 82648 v1. The World Bank. http://documents.worldbank.org/curated/en/762871468148506173/Main-report.
Dekens, J. and International Centre for Integrated Mountain Development (2007). Local Knowledge for Disaster Preparedness: A Literature Review. http://books.icimod.org/index.php/search/subject/12.
Devigne, C., P. Mouchon and B. Vanhee (2016). Impact of Soil Compaction on Soil Biodiversity – Does It Matter in Urban Context? Urban Ecosystems 19 (3). https:// web.a.ebscohost.com/abstract?direct=true&profile=ehost&scope=site&authtype=crawler&jrnl=10838155&AN=117790253&h=ccD3g7LgUWY%2fSm%2b6JVz1lS9wT95WZGoWifs6yPFW%2bLGfrCXbFzxr6Dlr67Jt82Oe9GJYksVE8QdKhX4D8KsTvQ%3d%3d&crl=f&resultNs=AdminWebAuth&resultLocal=ErrCrlNotAuth&crlhashurl=login.aspx%3fdirect%3dtrue%26profile%3dehost%26scope%3dsite%26authtype%3dcrawler%26jrnl%3d10838155%26AN%3d117790253.
DFAT (2018). For ty - Ninth Pacif ic Is lands Forum: Communiqué. Australian Department of Foreign Affairs and Trade. https://foreignminister.gov.au/releases/Pages/2018/mp_mr_180906a.aspx?w=E6pq%2FUhzOs%2BE7V9FFYi1xQ%3D%3D.
cdxxxvii

Dhakal, A., M. Wagley and M.B. Karki (2018). The Context of Climate Change and Adaptation Effort in Nepal. Divecha Centre for Climate Change, Indian Institute of Science. https://www.academia.edu/38294114/The_Context_of_Climate_Change_and_Adaptation_Efforts_in_Nepal?auto=bookmark.
Dianat, H., P. Williams, K. Maxwell, M.A. Yandar and S. Wilkinson (2019). From Indicators to Action: The Case of Auckland City Ten Essentials of Sendai Framework. GAR19 Contributing Paper, UNISDR.
Digregorio, M. and H.P. Teufers (2019). Connecting Businesses for Resilience – a Case in Vietnam. Unpublished.
Dilley, M. and V.F. Grasso (2016). Disaster Reduction, Loss and Damage Data , and the Pos t -2015 International Policy Agenda. Environmental Science & Policy 61.
Dilling, L., R. Morss and O. Wilhelmi (2017). Learning to Expect Surprise: Hurricanes Harvey, Irma, Maria, and Beyond. Journal of Extreme Events 4 (3). https://www.worldscientific.com/doi/abs/10.1142/S23457 37617710014.
Djalante, R., M. Garschagen, F. Thomalla and R. Shaw, eds. (2017). Disaster Risk Reduction in Indonesia. Progress, Challenges, and Issues. Disaster Risk Reduction. Springer International Publishing. https://doi.org/10.1007/978-3-319-54466-3.
Dokas, I., M. Statheropoulos and S. Karma (2007). Integration of Field Chemical Data in Initial Risk Assessment of Forest Fire Smoke. Science of The Total Environment 376 (1–3). https://www.civilprotection.gr/sites/default/gscp_uploads/stoten_2007.pdf.
Dominey - Howes, D. , P. Dunbar, J. Varner and M. Papathoma-Köhle (2010). Estimating Probable Maximum Loss from a Cascadia Tsunami. Natural Hazards 53 (1). http://link.springer.com/10.1007/s11069-009-9409-9.
Duguy, B., S. Paula, J.G. Pausas, J.A. Alloza, T. Gimeno and R.V. Vallejo (2013). Effects of Climate and Extreme Events on Wildf ire Regime and their Ecological Impacts. In Regional Assessment of Climate Change in the Mediterranean, A. Navarra and L. Tubiana, eds. Volume 2. Springer. https://doi.org/10.1007/978-94-007-5772-1_6.
Dutra, E., W. Pozzi, F. Wetterhall, F. Di Giuseppe, L. Magnusson, G. Naumann, P. Barbosa, J. Vogt and F. Pappenberger (2015). Global Meteorological Drought - Part 2: Seasonal Forecasts. Hydrology and Earth System Sciences 18.
EC (2000). Communication from the Commission – Safe Operation of Mining Activities: A Follow-up to Recent Mining Accidents. COM(2000)664 final. https://rel iefweb.int/repor t/hungar y/safe - operation -mining-activities-follow-recent-mining-accidents.
(2007). Drought Management Plan Report , Including Agricultural, Drought Indicators and Climate Change Aspects. Technical Report 2008 - 023. http://
ec.europa.eu/environment/water/quantity/pdf/dmp_report.pdf.
(2016). Action Plan on the Sendai Framework for Disaster Risk Reduction 2015-2030: A Disaster R isk- Informed Approach for A l l EU Pol ic ies . SWD(2016) 205 final/2. http://ec.europa.eu/echo/sites/echo-site/f iles/1_en_document_travail _ service_part1_v2.pdf.
(2019). Global Flood Partnership. https://gfp.jrc.ec.europa.eu/about-us.
ECOWAS (2018). ECOWAS Forum Urges Modernisation of Hydromet and Disaster Risk Management Services. From an ECOWAS of States to an ECOWAS of Peoples (2018). http://www.ecowas.int/ecowas-forum-urges-modernisation-of-hydromet-and-disaster- risk-management-services/.
E C O W A S a n d U N I S D R ( 2 0 1 8 ) . W o r k s h o p o n Understanding the Sendai Framework in Coherence with the SDGs in the ECOWAS Region: Towards the Development of Disaster Risk Reduction Strategies and Plans (Target E). Concept Note and Agenda. ht tps://www.preventionweb.net/f i les/62194 _finaldraftconceptnoteecowastargetew.pdf.
EFDRR (2016). European Forum for Disaster Risk Reduction 2015-2020 Roadmap for the Implementation of the Sendai Framework. https://www.preventionweb.net/files/48721_efdrrroadmap20152020anditsactions20.pdf.
Egypt (2017). National S trategy for Disaster Risk Reduction 2030. https://www.preventionweb.net/files/57333_egyptiannationalstrategyfordrrengli.pdf.
Elkhidir, E., S. Wilkinson and S. Mannakkara (2019). Developing an Urban City to City Collaboration Network for Improving Resilience in New Zealand. Unpublished.
El t inay, N. and M. Har vey (2019). Bui ld ing Urban Resilience in the Arab Region: Implementing the Sendai Framework for Disaster Risk Reduction 2015-2030 at the Local Level. GAR19 Contributing Paper, UNISDR.
Elvidge, C.D., K.E. Baugh, S.J. Anderson, P.C. Sutton and T. Ghosh (2012). The Night Light Development Index (NLDI): A Spatially Explicit Measure of Human Development from Satellite Data. Social Geography 7 (1). http://www.soc-geogr.net/7/23/2012/.
E n d e r s , W. a n d M .T. H o l t (2014). T h e Evo l v i n g Relationships between Agricultural and Energy Commodi t y Pr ices: A S hif t ing - Mean Vec tor Autoregressive Analysis. In The Economics of Food Price Volatility. University of Chicago Press.
Environment Agency (2012). Managing Flood Risk T h r o u g h Lo n d o n a n d t h e T h a m e s E s t u a r y. TE2100 Plan 27. OECD Working Papers on Public Governance. Thames Estuary 2100 Environment Agency. https://assets.publishing.service.gov.uk/government/uploads/system/uploads/attachment_data/file/322061/LIT7540_43858f.pdf.
cdxxxviii References

Erian, W., K. Bassem, A. Naji and I. Sanaa (2014). Effects of Drought and Land Degradation on Crop Losses in Africa and the Arab Region with Special Case Study on: Drought and Conflict in Syria.
Erian, W., B. Katlan and O. Babah (2011). Drought Vulnerabil ity in the Arab Region. Case Study - Drought in Syria. Ten Years of Scarce Water (2000 – 2010). Arab Center for the Studies of Arid Zones and Dry Lands and Secretariat of the International Strategy for Disaster Reduction. https://reliefweb.int /s i tes/re l ief web. int /f i les/resources/Ful l _Report_3074.pdf.
ESCAP (2017a). Leave No One Behind: Disaster Resilience for Sustainable Development. Asia-Pacific Disaster Repor t 2017. https://www.unescap.org/sites/default/files/1_Disaster%20Report%202017%20Low%20res.pdf.
(2017b). Disaster Risk Reduction and Resilience in the 2030 Agenda for Sustainable Development. E/ESCAP/CDR(5)/1.
(2017c). Leave No One Behind: Disaster Resilience for Sustainable Development. Asia-Pacific Disaster Report 2017.
(2018). Opportunities for Regional Cooperation in Disaster Risk Financing. https://www.google.com/url?sa=t&rct=j&q=&esrc=s&source=web&cd=2&cad=rja&uact=8&ved=2ahUKEwjEkrajzZ3gAhWjiqYKHS6QCK8QFjABegQICBAC&url=https%3A%2F%2Fwww.unescap.org%2Fsites%2Fdefault%2Ffiles%2FESCAP_Opportunities_Regional_Cooperation_DRF_2018.pdf&usg=AOvVaw3-FeDUB-CbKoaSZzO Yy3BJ.
Espey, J. (2017). Counting on the World. Sustainable Development Solutions Network Publication. http://unsdsn.org/wp-content/uploads/2017/09/sdsn-trends-counting-on-the-world-1.pdf.
EU (2012). Directive 2012/18/EU of the European Parliament and of the Council of 4 July 2012 on the Control of Major-Accident Hazards Involving Dangerous Substances, Amending and Subsequently Repealing Council Directive 96/82/EC. Official Journal of the European Union, 1971. https://eur-lex.europa.eu/eli/dir/2012/18/oj.
(2019). Copernicus. Europe’s Eyes on Earth. https://www.copernicus.eu/en/access-data/dias.
EU, Directorate-General for Research and Innovation, Directorate I - Cl imate Action and Resource Efficiency (2018). Final Report of the High-Level Panel of the European Decarbonisation Pathways Initiative. Publications Office of the EU. https://ec.europa.eu/info/sites/info/files/rec-18- 002-decarbonisation_booklet_27112018_0.pdf.
European Environment Agency (2013). Late Lessons from Early Warnings: Science, Precaution, Innovation; Summary.
Fakhruddin, B., V. Murray and R. Maini (2017). Disaster Loss Data in Monitoring the Implementation of
the Sendai Framework. International Council for Science, Integrated Research on Disaster Risk. ht tps://www.preventionweb.net/publications/view/53050.
FAO (2015a). Natural Capital Impacts in Agriculture. Suppor ting Bet ter Business Decision- Making. ht tp: //w w w.fao.org/f i leadmin/templates/nr/sustainability_pathways/docs/Natural_Capital_Impacts_in_Agriculture_final.pdf.
(2015b). The Impact of Natural Hazards and Disasters on Agriculture and Food Security and Nutri-tion: A Call for Action to Build Resilient Livelihoods.
(2015c). The Impacts of Disasters on Agriculture and Food Security. http://www.fao.org/3/a-i5128e.pdf.
(2017a). The Future of Food and Agriculture: Trends and Challenges.
(2017b). The Impact of Disasters and Crises on Agriculture and Food Security 2017. http://www.fao.org/3/I8656EN/i8656en.pdf.
(2018). The State of Food and Agriculture Completes the State of the World Set. http://www.fao.org/publications/highlights-detail/en/c/1157 519/.
Fearnley, C., A. Winson, J. Pallister and R. Tilling (2017). Volcano Crisis Communication: Challenges and Solutions in the 21st Century. In Observing the Volcano World, C. Fearnley, D. Bird, K. Haynes, W. McGuire and G. Jolly, eds. Springer. https://doi.org/10.1007/11157_2017_28.
FEMA (2017). Estimated Annualized Earthquake Losses for the United States. FEMA P-366. https://www.fema.gov/media- library-data/1497362829336-7831a863fd9c5490379b28409d541efe/FEMAP-366_2017.pdf.
FEWS NET (2018). Famine Early Warning Systems Network. Acute Food Insecurity: Near Term (January 2019). http://fews.net/.
Fink, A.H., T. Brücher, A. Krüger, G.C. Leckebusch, J.G. Pinto and U. Ulbrich (2004). The 2003 European Summer Heat waves and Drought –S ynoptic Diagnosis and Impacts. Weather 59 (8).
Firth, S. (2017). Making Sense of Complexity (Comic Strip). https://extranewsfeed.com/making-sense- of-complexity-ee78755d56b9.
Frank, A.B., M.G. Collins, S.A. Levin, A.W. Lo, J. Ramo, U. Dieckmann, V. Kremenyuk, et al. (2014). Dealing wi th Femtor isks in In te rnat ional Re lat ions. Proceedings of the National Academy of Sciences 111 (49). http://www.pnas.org/lookup/doi/10.1073/pnas.1400229111.
Frank, S., E. Schmid, P. Havlík , U.A. Schneider, H. Böttcher, J. Balkovič and M. Obersteiner (2015). The Dynamic Soil Organic Carbon Mitigation Potential of European Cropland. Global Environmental Change 35. https://linkinghub.elsevier.com/retrieve/pii/S095937801530025X.
cdxxxix

Fuller, P. (2018). Proceeedings of United Nations AMCDRR Conference. UNISDR. https://www.unisdr.org/archive/59138.
Gahalaut, K. and A. Hassoup (2012). Role of Fluids in the Earthquake Occurrence around Aswan Reservoir, Egypt: Aswan Seismicity. Journal of Geophysical Research: Solid Earth 117 (B2). http://doi.wiley.com/10.1029/2011JB008796.
Gaillard, J.C., A. Gorman-Murray and M. Fordham (2017). Sexual and Gender Minorities in Disaster. Gender, Place & Culture 24 (1). https://www.tandfonline.com/doi/full/10.1080/0966369X.2016.1263438.
Gaillard, J.C., K. Sanz, B.C. Balgos, S.N.M. Dalisay, A. Gorman-Murray, F. Smith and V. Toelupe (2017). Beyond Men and Women: A Critical Perspective on Gender and Disaster. Disasters 41 (3). http://doi.wiley.com/10.1111/disa.12209.
Gall, M., K.A. Borden and S.L. Cutter (2009). When Do Losses Count ? Bul le t in of the Ame r ican M e te o ro l o g i c a l S o c i e t y 9 0 (6) . h t tps : //d o i .org/10.1175/2008BAMS2721.1.
Garschagen, M., L. Porter, D. Satterthwaite, A. Fraser, R. Horne, M. Nolan, W. Solecki, E. Friedman, E. Dellas and F. Schreiber (2018). The New Urban Agenda: From Vision to Policy and Action. Planning Theory & Practice 19 (1). https://www.tandfonline.com/doi/abs/10.1080/14649357.2018.1412678.
Gatzweiler, F.W., Y.G. Zhu, A.V. Diez Roux, A. Capon, C. Donnelly, G. Salem, H.M. Ayad, et al. (2017). Advancing Health and Wellbeing in the Changing Urban Environment. Urban Health and Wellbeing. S pr inger. h t tp: // l ink .spr inger.com/10.10 07/ 978-981-10-3364-3.
GCF (2019a). About the Fund. https://www.greenclimate.fund/who-we-are/about-the-fund.
(2 019 b) . P r o j e c t S A P 0 0 6 , P r o j e c t s a n d Programmes. https://www.greenclimate.fund/what- we-do/projects-programmes#gcf-project.
GEM (2019). Global Earthquake Model Foundation. For a World That Is Resilient to Earthquakes. https://www.globalquakemodel.org/.
Gencer, E.A . (2013). The Interplay between Urban Development, Vulnerability, and Risk: A Case Study of the Istanbul Metropolitan Area. Springer.
Gencer, E.A., R. Folorunsho, M. Linkin, X. Wang, C.E. Natenzon, S. Wajih, N. Mani, et al. (2018). Disasters and Risk in Cities. In Climate Change and Cities: Second Assessment Report of the Urban Climate Change Research Network. Cambridge University Press. https://pubs.giss.nasa.gov/abs/ge05200z.html.
Gencer, E.A. and W. Rhodes (2018). Towards Climate Resilience in the USA: From Federal to Local Level Initiatives and Practices Since the 2000s. In Urban Disaster Resilience and Security: Addressing Risks in Societies. The Urban Book Series. Springer.
Gencer, E.A. and UNISDR (2017). Local Government Powers for Disaster Risk Reduction: A Study on
Local-Level Authority and Capacity for Resilience. UNISDR . ht tps: //w w w.unisdr.org/campaign/resil ientcities/assets/documents/guidelines/LG%20Powers%20for%20DRR_2017_Final_2017 0531.pdf.
GEO (2015). Value of Open Data Sharing. https://www.earthobservations.org/documents/dsp/20151130_the_value_of_open_data_sharing.pdf.
(2019a). GEOSS Portal. http://www.geoportal.org.
(2019b). Group on Earth Observations. http://www.earthobservations.org/index.php.
Geographic Area Coordination Centers (2019a). National Large Inc ident Year - to - Date Repor t . ht tps: //gacc.n i fc .gov/sacc/predic t ive/ in te l l igence/NationalLargeIncidentYTDReport.pdf.
(2019b). National Year-to-Date Report on Fires and Acres Burned. https://gacc.nifc.gov/sacc/predictive/intelligence/NationalYTDbyStateandAgency.pdf.
Gerber, N. and A . Mirzabaev (2017a). Benefits of Action and Costs of Inaction: Drought Mitigation and Preparedness – a Literature Review. No. 1. Integrated Drought Management Programme Working Paper. WMO and GWP. https://library.wmo.int/doc_num.php?explnum_id=3401.
(2017b). Benefits of Action and Costs of Inaction: Drought Mitigation and Preparedness—A Literature Review. In Drought and Water Crises: Integrating Science, Management and Policy, 95–126. CRC Press, Taylor & Francis.
GFDRR (2018a). Bringing Resilience to Scale. https://www.gfdrr.org/sites/default/files/publication/GFDRR%20AR%202018_WEB.pdf.
(2018b). Global Facility for Disaster Reduction and Recovery, Strategy 2018–2021: Bringing Resilience to Scale. https://www.gfdrr.org/sites/default/files/publication/gfdrr-strategy-2018%E2%80%932021.pdf#page=12.
(2018c). Machine Learning for Disaster Risk Management. The World Bank. https://www.gfdrr.org/sites/default/files/publication/181222_WorldBank_DisasterRiskManagement_Ebook_D6.pdf.
(2019). Somalia. GFDRR Progress to Date. https://www.gfdrr.org/en/somalia.
GFZ Helmholtz-Zentrum Potsdam (2019). The Global Se ismic Hazard Map Onl ine . ht tp://gmo.gfz- potsdam.de/.
Gilbert, C.L. (2010). How to Understand High Food Prices . Journal of Agricultural Economics 61 (2). https://onlinelibrary.wiley.com/doi/abs/10. 1111/j.1477-9552.2010.00248.x
Girgin, S. (2011). The Natech Events during the 17 August 1999 Kocaeli Earthquake: Aftermath and Lessons Learned. Natural Hazards and Ear th Systems Science 11.
Girgin, S. and E. Krausmann (2012). Rapid Natech Risk Assessment and Mapping Tool for Earthquakes:
cdxl References

Rapid-n. Chemical Engineering Transactions 26. http://www.aidic.it/cet/12/26/016.pdf.
(2016). Historical Analysis of U.S. Onshore Hazardous Liquid Pipeline Accidents Triggered by Natural Hazards. Journal of Loss Prevention in the Process Industries 40. https://linkinghub.elsevier.com/retrieve/pii/S0950423016300328.
Girgin, S., A. Necci and E. Krausmann (2019). Dealing with Cascading Risks in National Risk Assessment: The Case of Natech Accidents. International Journal of Disaster Risk Reduction 35. https://doi.org/10.1016/j.ijdrr.2019.101072.
Give2Asia (2018). Disaster Preparedness and Resilience: Indonesia. https://give2asia.org.
G l e i c k , P. H . (2 018) . Tr a n s i t i o n s to Fr e s hwa te r Sustainability. Proceedings of the National Academy of Sc iences 115 (36). h t tp: //w w w.pnas.org/content/115/36/8863.abstract.
Global A l l iance for Disaster R isk Reduction and Res i l ie nc e in the Edu c at ion S e c tor (2017 ). Comprehensive School Safety. A Global Framework in Support of The Global All iance for Disaster Risk Reduction and Resilience in the Education Sector and The Worldwide In i t iat ive for Safe School. UNISDR. ht tps://s3.amazonaws.com/inee-gadrrres/resouces/CSS-Framework-2017.pdf?mtime=20180730152450.
Global A l l iance for Urban Cr ises (2016). Forced Displacement in Urban Areas: What Needs to Be Done. https://www.rescue.org/sites/default /files/document/1079/forceddisplacementinurban areasweb2.pdf.
Global Energy Observatory, Google, KTH Royal Institute of Technology in Stockholm, Enipedia and World Resources Institute (2018). Global Power Plant Database.
Global Risk Financing Facil i t y (2019). The World Bank . ht tps: //w w w.wor ldbank .org/en/topic/d isas te r r is k ma nag e m e n t / b r ie f/g l o ba l - r is k - financing-facility.
G l o b a l Wa te r P a r t n e r s h i p C e n t r a l a n d E as te r n Europe (2015). Guidelines for the Preparation of Drought Management Plans. Development and Implementation in the Context of the EU Water Framework Directive.
Goldin, I. and T. Vogel (2010). Global Governance and Systemic Risk in the 21st Century: Lessons from the Financial Crisis: Governance and Systemic Risk. Global Policy 1 (1). https://onlinelibrary.wiley.com/doi/full/10.1111/j.1758-5899.2009.00011.x.
Golnaraghi, M., P. Nunn, R. Muir-Wood, J. Guin, D. Whitaker, J. Slingo, G. Asrar, et al. (2018). Managing Physical Climate Risk: Leveraging Innovations in Catastrophe Risk Modelling. Geneva Association. https://www.genevaassociation.org/research-topics/extreme-events-and-climate-risk/managing-physical-climate-risk%E2%80%94leveraging.
Google (2019). Google Earth Engine. A Planetary-Scale Platform for Ear th Science Data and Analysis. https://earthengine.google.com.
Gouveia , C.M. , R .M. Tr igo, S . Beguer ía and S.M. Vicente -Serrano (2017). Drought Impacts on Vegetation Activity in the Mediterranean Region: An Assessment Using Remote Sensing Data and Multi-Scale Drought Indicators. Global and Planetary Change 151. ht tps://l inkinghub.elsevier.com/retrieve/pii/S0921818116302363.
Grunewald , R . (20 05). Gasol ine Pr ices C l imb in Response to Hurricanes. Fedgazette. https://www.minneapolisfed.org/publications/fedgazet te/gasoline-prices-climb-in-response-to-hurricanes.
Guadagno, L. (2017). Migrants in Disaster Risk Reduction Practices for Inclusion. Migrants in Countries in Crisis Initiative. https://www.iom.int/sites/default/files/our_work/DOE/humanitarian_emergencies/transition-recovery/drr/Migrants-in-DRR.pdf.
Guha-Sapir, D., P. Hoyois, P. Wallemacq and R. Below (2017). Annual Disaster Statistical Review 2016: The Numbers and Trends. Centre for Research on the Epidemiology of Disasters. https://www.emdat.be/sites/default/files/adsr_2016.pdf.
Gunter, A. and R. Massey (2017). Renting Shacks: Tenancy in the Informal Housing Sector of the Gauteng Prov ince , South Afr ica . Bul let in of Geography. Socio-Economic Series 37 (37). http://content.sciendo.com/view/journals/bog/37/37/article-p25.xml.
Hales, S., S. Kovats, S. Lloyd and D. Campbell-Lendrum (2014). Quantitative Risk Assessment of the Effects of Climate Change on Selected Causes of Death, 2030s and 2050s. WHO.
Hallegatte, S., M. Bangalore, L. Bonzanigo, M. Fay, T. Kane, U.G. Narloch, J. Rozenberg and D.O. Treguer (2016). Shock Waves: Managing the Impacts of Climate Change on Poverty. Climate Change and Development Series. The World Bank. ht tp:// documents.worldbank.org/curated/en/260011486 755946625/Shock-waves-managing-the-impacts-of-climate-change-on-poverty.
Hallegatte, S., R. Maruyama and E. Jun (2018). The Last Mile: Delivery Mechanisms for Post-Disaster Finance. The World Bank. http://documents.worldbank.org/curated/en/813701537285938605/The-Last-Mile -Deliver y -Mechanisms-for-Post-Disaster- Finance.
Hallegatte, S., A. Vogt-Schilb, M. Bangalore and J. Rozenberg (2017). Unbreakable: Bui ld ing the Resi l ience of the Poor in the Face of Natural Disasters. Climate Change and Development. The World Bank. https://openknowledge.worldbank.org/handle/10986/25335.
Hallema, D.W., G. Sun, P.V. Caldwell, S.P. Norman, E.C. Cohen, Y. Liu, K. Bladon and S. McNulty (2018). Burned Forests Impact Water Supplies. Nature
cdxli

Communications 9 (1). https://doi.org/10.1038/s41467-018-03735-6.
Hamdan (2013). Retrospective Assessment of Progress in Disaster Risk Governance against the Hyogo Framework for Action – The Case of the Arab States Disaster Risk Management Centers. UNDP and UNISDR.
Handicap International (2015). Disability in Humanitarian Context: Views from Affected People and Field O r g a n i s a t i o n s . h t t p s : //d 3 n 8 a 8 p r o7 v h m x .cloudfront.net/handicapinternational/pages/1500/attachments/original/1449158243/Disability_in_humanitarian_context_2015_Study_ Advocacy.pdf?1449158243.
Haraguchi, M. and U. Lall (2015). Flood Risks and Impacts: A Case Study of Thailand’s Floods in 2011 and Research Questions for Supply Chain Decision Making. International Journal of Disaster Risk Reduction 14. https://linkinghub.elsevier.com/retrieve/pii/S2212420914000752.
Harari, Y.N. (2018). 21 Lessons for the 21st Century. First edition. Spiegel & Grau.
Hardoy, J., E. Gencer and M. Winograd (2018). Plani Cación Participativa Para La Resiliencia Al Clima En Ciudades de América Latina: Los Casos de Dosquebradas (Colombia), Santa Ana (El Salvador), y Santo Tomé (Argentina). https://www.crclatam.net/documentos/art%C3%ADculos/40-articulo-planificación-participativa-para-la-resiliencia-al-clima-en-ciudades-de-américa-latina-los-casos-de-dosquebradas-colombia-,-santa-ana-el-salvador-,-y-santo-tomé-argentina/file.html.
(2019). Par ticipatory Planning for Climate Resilient and Inclusive Urban Development in Latin America: Cities of Dosquebradas, Colombia; Santa Ana, El Salvador; and Santo Tomé, Argentina. Environment and Urbanization 31.https://journals.sagepub.com/doi/full/10.1177/0956247819825539 Harri, A., L.L. Nalley and D. Hudson (2009). The Relationship between Oil, Exchange Rates, and Commodity Prices. Journal of Agricultural and Applied Economics 41 (2). https://econpapers.repec.org/article/agsjoaaec/53095.htm.
Harris, K., D. Keen and T. Mitchell (2013). When Disasters and Conflicts Collide. Improving Links between Disaster Resi l ience and Conf l ict Prevention. Overseas Development Institute. https://www.odi.org/sites/odi.org.uk/files/odi-assets/publications-opinion-files/8228.pdf.
Hassan, R.M., R.J. Scholes, N. Ash and Millennium Ecosystem Assessment (Program), eds. (2005). Ecosystems and Human Well-Being: Current State and Trends: Findings of the Condition and Trends Working Group of the Mi l lennium Ecosystem A s s e s s m e n t . T h e M i l l e n n i u m E c o s y s t e m Assessment Series, v. 1. Island Press. https://www.millenniumassessment.org/en/Condition.html.
Hawkes, P. (2008). Joint Probabil i ty Analysis for Estimation of Extremes. Journal of Hydraulic Research 46 (2).
Health Effects Institute (2018). State of Global Air 2018. Special Report. https://www.stateofglobalair.org/sites/default/files/soga-2018-report.pdf.
Helbing, D. (2013). Globally Networked Risks and How to Respond. Nature 497 (7447). http://www.nature.com/doifinder/10.1038/nature12047.
H e l p A g e I n te r n a t i o n a l (2 012) . O l d e r P e o p l e i n Emergencies – Identifying and Reducing Risks. https://www.helpage.org/silo/files/older-people-in-emergencies--identifying-and-reducing-risks.pdf.
Heywood, V.H. (2017). Plant Conser vation in the Anthropocene – Challenges and Future Prospects. Plant Diversity 39 (6). https://linkinghub.elsevier.com/retrieve/pii/S2468265917300847.
Hilhorst , D., R. van Voorst , R. Mena, S. Melis and I . Despor tes (2019). Disaste r Response and Humanitarian Aid in Different Conflict Scenarios. GAR19 Contributing Paper, UNISDR.
Hillman, B. and S. Sagala (2012). Safer Communities through Disaster Risk Reduction (SC- DRR) in Development. Evaluation Report. UNDP. http://www.undp.org/content/undp/en/home/librarypage/crisis-prevention-and-recovery/safer-communities-through-disaster-risk-reduction--sc-drr--in-de.html.
Hisdal , H., L. Tallaksen, B. Clausen, E. Peters and G . G u s t a r d (2 0 0 4 ) . H y d r o l o g i c a l D r o u g h t Characteristics. In Hydrological Drought. Processes and Est imation Methods for S treamflow and Groundwater, L. Tallaksen and H. van Lanen, eds. Development in Water Science 48. Elsevier Science B.V.
Hlavinkaa, P., M. Trnkaa, D. Semerádováa, M. Dubrovskýa, Z. Žaluda and M. Možnýc (2009). Effect of Drought on Yield Variability of Key Crops in Czech Republic. Agricultural and Forest Meteorology 149 (3–4).
Hoddinott, J. and A. Quisumbing (2003a). Data Sources for Microeconometr ic R isk and Vulnerabi l i t y Assessments. https://www.researchgate.net/pub l icat ion /2 3859 4965 _ Data _ S ourc es _ for_Mic roe c onome tr ic _ R isk _ and _Vulne rab i l i t y_Assessments.
(2003b). Methods for Microeconometric Risk and Vulnerability Assessments. The World Bank, Social Protection Discussion Paper. http://documents.worldbank.org/curated/en/948651468780562854/Methods-for-microeconometric-risk-and-vulnerability-assessments.
Holzmann, R. and S.T. Jorgensen (2000). Social Risk Management : A New Conceptual Framework for Social Protection and Beyond. The World B a n k , S o c ia l P ro te c t io n D isc uss io n Pa p e r. h t t p : //d o c u m e n t s .w o r l d b a n k .o r g /c u r a t e d /en/932501468762357711/Social-risk-management-a-new-conceptual-framework-for-social-protection-
cdxlii References

and-beyond.Hoogeveen, J., T. Tesliuc, V. Vakis and S. Dercon (2003).
A Guide to the Analysis of Risk, Vulnerability and Vulnerable Groups. The World Bank and University of Oxford. http://siteresources.worldbank.org/INTSRM/Publications/20316319/RVA.pdf.
Hovland, I. (2009). The Food Crisis of 2008: Impact Assessment of IFPRI’s Communications Strategy. International Food Policy Research Institute. http://www.ifpri.org/cdmref/p15738coll2/id/29623/filename/29624.pdf.
Hudec, P. and O. Lukš (2004). Flood at Spolana a-s in August 2002. Loss Prevention Bulletin 180.
Hurk, B. van den, E. van Meijgaard, P. de Valk, K. van Heeringen and J. Gooijjer (2015). Analysis of a Compounding Surge and Precipitation Event in the Netherlands. Environmental Research Letters 10 (3). http://stacks.iop.org/1748-9326/10/i=3/a=035001.
Hurley, G. (2017). What Does ‘Risk-Informed’ Development Finance Really Look Like? https://www.undp.org/content/undp/en/home/blog/2017/6/13/What-does-a-risk-informed-approach-to-development-finance-really-look-like-.html.
Hyden, G., J. Court and K. Mease (2003). The Bureaucracy and Governance in 16 Developing Countries. World Governance Survey Discussion Paper 7. Overseas Development Institute. https://www.odi.org/sites/odi.org.uk/files/odi-assets/publications-opinion-files/4104.pdf.
IAEA (2006). Fundamental Safety Principles. SF-1. Safety Fundamentals. https://www-pub.iaea.org/MTCD/Publications/PDF/Pub1273_web.pdf.
(2010). Deterministic Safety Analysis for Nuclear Power Plants. SSG-2. Specific Safety Guide. http://w w w - pub. iaea.org/books/ IA E A Books/8233/Deterministic-Safety-Analysis-for-Nuclear-Power-Plants.
(2013). INES: The International Nuclear and Radiological Event Scale User ’s Manual. IAEA-INES-2009. ht tps://www-pub.iaea.org/MTCD/Publications/PDF/INES2013web.pdf.
(2014). The Use of the International Nuclear and Radiological Event Scale (INES) for Event Communication. https://www-pub.iaea.org/MTCD/Publications/PDF/INES_web.pdf.
(2015). The Fukushima Daiichi Accident: Report by the Director General. STI/PUB/1710. https://w w w- pub.iaea.org/MTCD/Publ ications/PDF/Pub1710-ReportByTheDG-Web.pdf.
(2016). Safety of Nuclear Power Plants: Design. SSR-2/1 (Rev. 1). Specific Safety Requirements. https://www-pub.iaea.org/MTCD/publications/PDF/Pub1715web-46541668.pdf.
(2017). Ensuring Robust National Nuclear Safety Systems — Institutional Strength in Depth. INSAG-27. http://www-pub.iaea.org/books/IAEABooks/11148/Ensuring-Robust-National-Nuclear-Safety-Systems-
Institutional-Strength-in-Depth. (2018). Climate Change and Nuclear Power
2018. Non-serial Publications. http://www-pub.iaea.org/books/IAEABooks/13395/Climate-Change- and-Nuclear-Power-2018.
IDDRSI (2014). Communique of the Second General Assembly Meeting: IGAD Drought Disaster Resilience and Sustainability Initiative (IDDRSI). https://igad.int/attachments/794_Final%20Communique%20o f % 2 0 s e c o n d % 2 0 I D D R S I % 2 0 P l a t f o r m % 2 0General%20Assembly%20Kampala%20(1).pdf.
IDNDR (1994). Yokohama Strategy and Plan of Action for a Safer World. https://www.unisdr.org/files/8241_doc6841contenido1.pdf.
IE AG (2014). A World That Counts , Mobil ising the Data Revolution for Sustainable Development, Independent Exper t Advisory Group on a Data Revolution. http://www.undatarevolution.org/wp-content/uploads/2014/11/A-World-That-Counts.pdf.
IFRC (2010). World Disasters Report 2010: Focus on Urban Risk. https://www.ifrc.org/Global/Publications/disasters/WDR/wdr2010/WDR2010-full.pdf.
(2015). Unseen, Unheard: Gender-Based Violence in Disasters Global Study. https://www.ifrc.org/Global/Documents/Secretariat/201511/1297700_GBV_in_Disasters_EN_LR2.pdf.
(2016a). Strengthening Law and Disaster Risk Reduction (DRR) in Indonesia. https://reliefweb.int/report/indonesia/strengthening-law-and-disaster-risk-reduction-drr-indonesia-checklist-assessment.
(2016b). Unseen , Unheard. Gender- Based Violence in Disasters. Asia-Pacific Case Studies. http://www.ifrc.org/Global/Publications/Gender% 20and%20Diversity/GBV%20in%20disasters%20AP%20report%20LR.pdf.
(2017). Effective Law and Policy on Gender Equality and Protection from Sexual and Gender-Based Violence in Disasters. https://media.ifrc.org/ifrc/wp-content/uploads/sites/5/2017/10/Gender-SGBV-Report_-Global-report.pdf.
(2018a). Africa Responding to Food Crisis. https://media.ifrc.org/ifrc/wp-content/uploads/sites/5/2018/02/201801-RegionalOnePager.pdf.
(2018b). Vulnerability and Capacity Assessment. https://www.ifrc.org/vca.
I F R C and U N D P (2014 a). C he c k l is t o n Law a n d Disaster Risk Reduction. https://www.ifrc.org/Global/Publications/IDRL/Publications/The%20C he c k l is t % 20 on% 20 law % 20 and% 20 D R R % 20Oct2015%20EN%20v4.pdf.
(2014b). Effective Law and Regulation for Disaster Risk Reduction: A Multi-Country Report. http://www.drr-law.org/resources/DRR-Report-full-version.pdf.
IGAD (2019). Drought Disaster and Resilience Initiative (IDDRSI) Strategy. http://resilience.igad.int/index.php/about-iddrsi/strategy.
cdxliii

Ikeuchi, H., Y. Hirabayashi, D. Yamazaki, S. Muis, P. Ward, H. Winsemius, M. Verlaan and S. Kanae (2017). Compound Simulation of Fluvial Floods and Storm Surges in a Global Coupled River-Coast Flood Model: Model Development and Its Application to 2007 Cyclone Sidr in Bangladesh: A Global Coupled River-Coast Flood Model. Journal of Advances in Modeling Earth Systems 9 (4). http://doi.wiley.com/10.1002/2017MS000943.
Insti tuto Nacional de Estadística (2019). Annual Statistics: Statistical Yearbook 2017. http://www.ine.gov.mz/.
Intergovernmental Coordination Group for the Indian Ocean Tsunami Warning and Mitigation System (2019). Indian Ocean Tsunami Warning and Mitigation S ys te m . I n te r g ove r n m e n ta l O c ea n o g r a p h ic C o m m i s s i o n Ts u n a m i P r o g r a m m e . h t t p : //www.ioc-tsunami.org/index.php?option=com_ content&view=article&id=8&Itemid=58&lang=en.
Internal Displacement Monitor ing Centre (2015). Global Overview 2015: People Internally Displaced by Conflict and Violence. http://www.internal -d isplacement .org/si tes/defaul t /f i les/ in l ine -files/20150506-global-overview-2015-en.pdf.
(2017). Global Report on Internal Displacement 2017. http://www.internal-displacement.org/global- report/grid2017/.
(2018). No Matter of Choice: Displacement in a Changing Cl imate . ht tp: //w w w.internal -displacement.org/sites/default/files/publications/documents/20181213-slow-onset-intro.pdf.
(2019). D isplacement Data: 2017 Internal Displacement Figures by Country. Global Internal Displacement Database. ht tp://www.internal -displacement.org/database/displacement-data.
International Capital Market Association (2019). Green, Social and Sustainability Bonds. https://www.icmagroup.org/green-social-and-sustainability-bonds/.
International Institute for Sustainable Development (2016). A FR P B u l le t i n : A Pu b l icat io n of the International Institute for Sustainable Development, Final Issue, 141 (8). https://www.preventionweb.net/files/49455_iisdenbconferencereporten.pdf.
International Monetary Fund (2019). World Economic Outlook Database. World Economic and Financial Surveys. https://www.imf.org/external/pubs/ft/weo/2018/02/weodata/index.aspx.
International Oceanographic Commission and UNESCO (2019). Indian Ocean Tsunami Information Center. http://iotic.ioc-unesco.org/.
International Organization for Migrat ion (2018). IOM Bangladesh: Rohingya Humanitarian Crisis Response. External Update. https://www.iom.int/sites/default/f i les/situation _ repor ts/f i le/bangladesh_sr_20180907-13.pdf.
International Resource Panel (2017). Assessing Global Resource Use: A Systems Approach to Resource
Efficiency and Pollution Reduction. UN Environment. http://www.resourcepanel.org/sites/default/files/documents/document/media/assessing_global_resource_use_amended_130318.pdf.
International Science Council (2018). Urban Health and Wellbeing. https://council.science/what-we-do/research-programmes/thematic-organizations/urban-health-wellbeing.
Intini, P., E. Ronchi, S.M.V. Gwynne and N. Bénichou (2017). A Review of Design Guidance on Wildland Urban Interface Fires. LUTVDG/TVBB 3213. Lund University, Department of Fire Safety Engineering. http://lup.lub.lu.se/search/ws/files/35069164/Report_3213.pdf.
IPBES (2018). Summary for Policymakers of the Regional Assessment Report on Biodiversity and Ecosystem Services for Africa of the Intergovernmental Science-Policy Platform on Biodiversity and Ecosystem Ser vices . In tergovernmental Sc ience - Pol icy Platform on Biodiversity and Ecosystem Services Secretar iat . ht tps: //w w w.ipbes.net /system/tdf/spm_africa_2018_digital.pdf?file=1&type= node&id=28397.
IPCC (2001). Climate Change 2001: Impacts, Adaptation, a n d Vu l n e r a b i l i t y. C o n t r i b u t io n of Wo r k i n g Group II to the Third Assessment Report of the Intergovernmental Panel on Climate Change. Volume 2. Cambridge University Press.
(2007). Climate Change 2007: Synthesis Report. Contribution of Working Groups I, II and III to the Fourth Assessment Report of the Intergovernmental Panel on Climate Change. https://www.ipcc.ch/assessment-report/ar4/.
(2012). Managing the Risks of Extreme Events and Disasters to Advance Climate Change Adaption: Special Report of the Intergovernmental Panel on Climate Change (Field, C.B., V. Barros, T.F. Stocker, D. Qin, D.J. Dokken, K.L. Ebi, M.D. Mastrandrea, K.J. Mach, G.-K. Plattner, S.K. Allen, M. Tignor and P.M. Midgley, eds.). Cambridge University Press. https://www.ipcc.ch/site/assets/uploads/2018/03/SREX_Full_Report-1.pdf.
(2014). Climate Change 2014: Synthesis Report. Contribution of Working Groups I, II and III to the Fifth Assessment Report of the Intergovernmental Panel on Climate Change. https://www.ipcc.ch/report/ar5/syr/.
(2018). Global Warming of 1.5°C. An IPCC Special Report on the Impacts of Global Warming of 1.5°C above Pre-Industrial Levels and Related Global Greenhouse Gas Emission Pathways, in the Context of Strengthening the Global Response to the Threat of Climate Change, Sustainable Development, and Efforts to Eradicate Poverty. https://www.ipcc.ch/sr15/.
(2019). Definition of Terms Used Within the DDC Pages. Data Distribution Centre. https://www.ipcc-data.org/guidelines/pages/glossary/glossary_r.html.
cdxliv References

IPCC, P. Zhai, H.O. Pörtner, D. Roberts, J. Skea, P.R. Shukla, A. Pirani, et al. (2018). Summary for Policy Makers: Global Warming of 1.5°C. In Global Warming of 1.5°C: An IPCC Special Report on the Impacts of Global Warming of 1.5°C above Pre-Industrial Levels and Related Global Greenhouse Gas Emission Pathways, in the Context of Strengthening the Global Response to the Threat of Climate Change, Sustainable Development, and Efforts to Eradicate Poverty. https://www.ipcc.ch/sr15/.
IRDR (2014). Peril Classification and Hazard Glossary. IRDR DATA Publication. No. 1. http://www.irdrinternational.org/wp-content/uploads/2014/04/IRDR_DATA-Project-Report-No.-1.pdf.
IRDR and ICSU (2014). Issue Brief: Disaster Risk Reduction and Sustainable Development . https://www.preventionweb.net/publications/view/35831.
IRGC (2015). Guidelines for Emerging Risk Governance. (2018). Guidelines for the Governance of Systemic
Risks. www.irgc.org.Irish Red Cross (2018). Disaster Displacement Information
Sheet. Centre for Criminal Justice and Human Rights. https://reliefweb.int/sites/reliefweb.int/files/resources/IDL-Information-Sheet-No.5-Disaster-Displacement-February-2018.pdf.
Irving, H.B. (1996). Children in Jeopardy. Can We Break the Cycle of Poverty? Yale University Press. https://eric.ed.gov/?id=ED402378.
ISCG (2018). Situation Report Rohingya Refugee Crisis. Cox’s Bazar. https://reliefweb.int/sites/reliefweb.int/files/resources/iscg_situation_report_27_sept_2018.pdf.
ISO (2018). Risk Management — Guidelines. https://www.iso.org/obp/ui/#iso:std:iso:31000:ed-2:v1:en.
(2019). ISO/FDIS 37122 Sustainable Cities and Communities - Indicators for Smart Cities. https://www.iso.org/standard/69050.html.
Jachia, L. (2014). Standards and Normative Mechanisms for Disaster Risk Reduction. UNISDR and UNECE. https://www.unisdr.org/we/inform/publications/ 49540.
Jackson, G., B. Witt and K.E. McNamara (2019). Conducive and Hindering Factors for Effect ive Disaster Risk Reduction in Emae Island, Vanuatu. GAR19 Contributing Paper, UNISDR.
Japan International Cooperation Agency (2017). One Against Disasters and Climate Risks: A Repository of Good Practices for Strengthening DRR and CCA Integration in ASEAN. Good Practices. https://pub.iges.or.jp/pub/one-against-disasters-and- climate-risks.
Johnson, C., R. Sliuzas, G. Jain, A. Cornaro, E. Gencer, S. Narang Suri, M. Gupta, R. Jigyasu and A. Sjodin (2015). 8 Frequently Asked Questions on Urban Planning and Disaster Risk Reduction. Urban Planning Advisory Group.
Johnston, F.H., S.B. Henderson, Y. Chen, J.T. Randerson, M. Marlier, R.S. DeFries, P. Kinney, D.M.J.S. Bowman
and M. Brauer (2012). Estimated Global Mortality Attributable to Smoke from Landscape Fires. Environmental Health Perspectives 120 (5). https://ehp.niehs.nih.gov/doi/10.1289/ehp.1104422.
Jones, K.E., N.G. Patel, M.A. Levy, A. Storeygard, D. Balk, J.L. Gittleman and P. Daszak (2008). Global Trends in Emerging Infectious Diseases. Nature 451. https://doi.org/10.1038/nature06536.
Juswanto, W. and S. Nugroho (2017). Promoting Disaster Risk Financing in Asia and the Pacific. Asian Development Bank Institute. https://www.adb.org/publications/promoting-disaster-risk-financing- asia-and-pacific.
Kahler, M. (2013). Economic Crisis and Global Governance: The Stability of a Globalized World. Procedia - Social and Behavioral Sciences 77. https://linkinghub.elsevier.com/retrieve/pii/S1877042813004990.
Karma, S., D. Emmanouloudi, S. Schismenos and M. Chalaris (2019). Challenges and Lessons Learned from Past Major Environmental Disasters Due to Technological or Wildland Urban Interface Fire Incidents. GAR19 Contributing Paper, UNISDR.
Kellett, J. and A. Caravani (2013). Financing Disaster Risk Reduction, a 20 Year Story of International Aid. Overseas Development Institute and GFDRR. h t tps: //w w w.odi .o rg /s i tes/odi .o rg .uk /f i les/odi-assets/publications-opinion-files/8574.pdf.
Kelman, I. (2015). Climate Change and the Sendai Framework for Disaster Risk Reduction. International Journal of Disaster Risk Science 6 (2). https://doi.org/10.1007/s13753-015-0046-5.
Kenya (2009). National Policy for Disaster Management. https://www.preventionweb.net/english/policies/v.php?id=60199&cid=90.
(2013). Sector Plan for Drought Risk Management and Ending Drought Emergencies. http://vision2030.go.ke/wp - content/uploads/2018/05/SECTOR-P L A N - F O R - D R O U G H T- R I S K- M A N AG E M E N T- 2013-2017.pdf.
(2018). National Disaster Risk Management Policy. http://www.president.go.ke/2018/05/29/press-release-cabinet-meeting-held-on-29th-may-2018/.
Kew, S.F., F.M. Selten, G. Lenderink and W. Hazeleger (2013). The Simultaneous Occurrence of Surge and Discharge Extremes for the Rhine Delta. Natural Hazards and Earth System Sciences Discussions 1 (1).
Kim, B. and S. Sarkar (2017). Impact of Wildfires on Some Greenhouse Gases Over Continental USA: A Study Based on Satellite Data. Remote Sensing of Environment 188. https://linkinghub.elsevier.com/retrieve/pii/S0034425716304266.
Kim, Y.D., Y.G. Kim, S.H. Lee, J.H. Kang and J. An (2009). Portable Fire Evacuation Guide Robot System. 2009 IEEE/RSJ International Conference on Intelligent Robots and Systems. IEEE. http://ieeexplore.ieee.org/document/5353970/.
cdxlv

Kinateder, M., E. Ronchi, D. Nilsson, M. Kobes, M. Müller, P. Pauli and A. Mühlberger (2014). Virtual Reality for Fire Evacuation Research. https://doi.org/10.13140/2.1.3380.9284.
Kiribati (2012). National Disaster Risk Management Plan. http://reliefweb.int/sites/reliefweb.int/files/resources/www.pacificdisaster.net_pdnadmin_data_original_KIR_2012_DRM_Plan.pdf.
Kir ibati , Office of Te Beretitenti (2013). National Framework for Climate Change and Climate Change Adaptation. http://www.president.gov.ki/wp-content/uploads/2014/08/National-Framework-for-Climate-Change-Climate-Change-Adaptation.pdf.
Klerk, W., H. Winsemius, W. van Verseveld, A. Bakker and F. Diermanse (2015). The Co-Incidence of Storm Surges and Extreme Discharges within the Rhine–Meuse Delta. Environmental Research Letters 10 (3). http://stacks.iop.org/1748-9326/10/i=3/a=035005?key=crossref.287111c9edc05af173da8af5e197a05b.
Klimek, P., M. Obersteiner and S. Thurner (2015). Systemic Trade Risk of Critical Resources. Science Advances 1 (10). http://advances.sciencemag.org/lookup/doi/10.1126/sciadv.1500522.
Knowles, S.G. (2013). A Review of ‘Flammable Cities: Urban Conflagration and the Making of the Modern World.’ Journal of the American Planning Association 79 (2). http://www.tandfonline.com/doi/abs/10.1080/01944363.2013.772475.
Koloffon, R. and S. von Loeben (2019). Disaster Risk Reduction and Agriculture Sector Interrelated Planning Processes Lessons Learnt. GAR19 Contributing Paper, UNISDR.
Kousky, C. (2016). Impacts of Natural Disasters on Children. The Future of Children 26 (1). https://doi.org/10.1353/foc.2016.0004.
Kovacevic, R.M., G.C. Pflug and A. Pichler (2015). Measuring and Managing Risk. In Investment Risk Management. Oxford University Press.
Krausmann, E. and D. Baranzini (2012). Natech Risk Reduction in the European Union. Journal of Risk Research 15 (8). http://www.tandfonline.com/doi/abs/10.1080/13669877.2012.666761.
Krausmann, E., A. Cruz and E. Salzano (2017). Natech Risk Assessment and Management: Reducing the Risk of Natural-Hazard Impact on Hazardous Installations. Elsevier.
Krausmann, E., A.M. Cruz and B. Affeltranger (2010). The Impact of the 12 May 2008 Wenchuan Earthquake on Industrial Facilities. Journal of Loss Prevention in the Process Industries 23 (2). https://linkinghub.elsevier.com/retrieve/pii/S0950423009001703.
Krausmann , E . , S . G i rg in and A . Necc i (2019) . Natural Hazard Impacts on Industry and Critical Infrastructure: Natech Risk Drivers and Risk Management Performance Indicators. International Journal of Disaster Risk Reduction.
Kreisberg, D., N. Carrasco, D. Jordy and A. Giardino (2018). Learning from Big Innovations in Small Island States. Understanding Risk Forum. https://understandrisk.org/innovations-in-small-island-states/.
Kuhn, T. (1962). The Structure of Scientific Revolutions. University of Chicago. https://projektintegracija.pravo.hr/_download/repository/Kuhn_Structure_of_Scientific_Revolutions.pdf.
Kunisawa, T. (2006). A Concrete Step for Building Public Electronic Archives of Reviewed Papers. In Open Access: Open Problems. Polimetrica. http://eprints.rclis.org/9656/1/OpenAccess.pdf.
La Trobe, S. and I . Davis (2005). Mainstreaming Disaster Risk Reduction: A Tool for Development Organizations. http://lib.riskreductionafrica.org/bitstream/handle/123456789/917/Mainstreaming %20disaster%20risk%20reduction.a%20tool%20 f o r % 2 0 d ev e l o p m e n t % 2 0 o rg a n i s a t i o n s . p d f ? sequence=1&isAllowed=y.
Lanen, H. van, J. Vogt, J. Andreu, H. Carrao, L. De Stefano, E. Dutra, L. Feyen, et al. (2017). Climatological Risk: Droughts. In Science for Disaster Risk Management 2017: Knowing Better and Losing Less, K. Poljanšek, M. Marín Ferrer, T. De Groeve and I. Clark, eds. Publications Office of the EU.
Lanier, J. (2013). Who Owns the Future? Simon & Schuster.LAS (2018). Regional Monitoring on Disaster Risk Reduction: Current Practices. Presented at the Advisory Meeting on the Regional Monitoring of the Implementation of the Sendai Framework, Bonn, Germany.
Lassa, J.A. (2019). Measuring Political Will: An Index of Commitment to Disaster Risk Reduction. Unpublished.
Lavell, A. and A. Maskrey (2013). The Future of Disaster Risk Management: An Ongoing Discussion. UNISDR and Latin American Social Science Faculty. https://www.unisdr.org/files/35715_thefutureofdisaster riskmanagement.pdf.
Lavell, A., Z. Stanton-Geddes, A. Perwaiz, N. Zapata Rondón and K. Kraft (n.d.). Disaster and Climate Risk-Sensitive Planning for Public Investment Decisions: Learning from Two Public-Sector Experiences of Lao PDR and Peru. https://understandrisk.org/wp-content/uploads/Disaster-and-Climate-Risk-Sensitive-Planning-for-Public-Investment-Decisions.pdf.
Leahy, S. (2018). Climate Change Impacts Worse than Expected, Global Report Warns. National Geographic, 10 July 2018. https://www.nationalgeographic.com/environment/2018/10/ipcc-report-climate-change-impacts-forests-emissions/.
Lenth, J. (2016). Practice and Reflections on the Ecological Infrastructure Construction in China. Landscape Architecture Frontiers 4 (5).
Lian, J.J., K. Xu and C. Ma (2013). Joint Impact of Rainfall and Tidal Level on Flood Risk in a Coastal City with a Complex River Network: A Case Study of Fuzhou
cdxlvi References

City, China. Hydrology and Earth System Sciences 17 (2). https://doi.org/10.5194/hess-17-679-2013.
Linnerooth-Bayer, J., A. Scolobig, S. Ferlisi, L. Cascini and M. Thompson (2016). Expert Engagement in Participatory Processes: Translating Stakeholder Discourses into Policy Options. Natural Hazards 81 (S 1) . h t t p : // l i n k . s p r i n g e r.c o m /10 .10 0 7/s11069-015-1805-8.
Lo, S.T.T., E.Y.Y. Chan, G.K.W. Chan, V. Murray, J. Abrahams, A. Ardalan, R. Kayano and J.C.W. Yau (2017). Health Emergency and Disaster Risk Management (Health-EDRM): Developing the Research Field within the Sendai Framework Paradigm. International Journal of Disaster Risk Science 8 (2). https://link.springer.com/article/10.1007/s13753-017-0122-0.
Loganathan, G., C. Kuo and J. Yannacconc (1987). Joint Probability Distribution of Streamflows and Tides in Estuaries. Hydrology Research 18 (4–5). https://iwaponline.com/hr/article/18/4-5/237-246/3353.
Logar, I. and J. van den Bergh (2013). Methods to Assess Costs of Drought Damages and Policies for Drought Mitigation and Adaptation: Review and Recommendations. Water Resources Management 27 (6). https://doi.org/10.1007/s11269-012-0119-9.
Lokshin, M. and T.A. Mroz (2013). Gender and Poverty: A Life Cycle Approach to the Analysis of the Dif fe rences in Gender Outcomes. The World Bank, Policy Research Working Paper. https://openknowledge.worldbank.org/handle/10986/ 18052.
Lollino, P., F. Cotecchia, G. Elia, G. Mitaritonna and F. Santaloia (2016). Interpretation of Landslide Mechanisms Based on Numerical Modelling: Two Case-Histories. European Journal of Environmental and Civil Engineering 20 (9). https://www.tandfonline.com/doi/full/10.1080/19648189.2014.985851.
Lucas, K., O. Renn, C. Jaeger and S. Yang (2018). Systemic Risks: A Homomorphic Approach on the Basis of Complexity Science. International Journal of Disaster Risk Science 9 (3). http://link.springer.com/10.1007/s13753-018-0185-6.
Lyon, B. and A. Barnston (2005). ENSO and the Spatial Extent of Interannual Precipitation Extremes in Tropical Land Areas. Journal of Climate 18 (23). https://doi.org/10.1175/JCLI3598.1.
Maeda, T., B.R. Shivakoti and S. Prabhakar (2019). An Assessment of Mainstreaming Climate Change Concerns into Institutions and Policies for Disaster Risk Reduction in ASEAN. GAR19 Contributing Paper, UNISDR.
Maeda, T., P.V.R.K. Sivapuram, B.R. Shivakoti and N. Genjida (2018). Project for Strengthening Institutional and Policy Framework on Disaster Risk Reduction (DRR) and Cl imate Change Adaptation (CCA) Integration. Final Report. Disaster Risk Reduction, Climate Change Adaptation. Japan International Cooperat ion Agency. https://pub. iges.o r. jp/
pub/project-strengthening - insti tutional -and - policy.
Mancini, F., C. Ceppi and G. Ritrovato (2008). Analisi Del Rischio Da Frana in Ambiente GIS: Il Caso Del Sub -Appennino Dauno (Puglia). 12th National Conference of ASITA, L’Aquila, Italy.
Marin Ferrer, M., A. Do Ó, K. Poljansek and A. Casajus Valles (2018). Disaster Damages and Loss Data for Policy. Publications Office of the EU. http://publications.jrc.ec.europa.eu/repository/bitstream/JRC110366/ddld4policy-proofreadreviewed.pdf.
Masih , A . (2018). An Enhanced Seismic Activ i t y Observed Due to Climate Change: Preliminary Results from Alaska. IOP Conference Series: Earth and Environmental Science 167. http://stacks.iop.org/1755-1315/167/i=1/a=012018?key=crossref.5f5bf13693f5c09d3a4fcd553bb66ea1.
Matsuzaki, J. (n.d.). Disability Inclusive DRR: Widening the Participation of Persons with Disabilities in the Post-2015 Framework for Disaster Risk Reduction. http://www.didrrn.net.
Maur i t ius (2016) . Maur i t ius Dec larat ion on the Implementation of the Sendai Framework in Africa. https://www.preventionweb.net/f i les/49455_mauritiusdeclarationenfinal.pdf.
Maurizi, V.F. and S.E. Fontana (2019). Building Capacity through Risk Communication Strategies in Santa Fe City, Argentina. GAR19 Contributing Paper, UNISDR.
Maurizi, V.F., L.M. Escalante Solís, G. Villalobos Sánchez, X. Moya García, A. Santis de la Torre, A.L. Quezadas Barahona and F.d.J. Colorado González (2019). Mainstreaming DRM into Sub-National and Local Development Policies in Southeast Mexico. GAR19 Contributing Paper, UNISDR.
Mckee, T., N. Doesken and J. Kleist (1993). The Relationship of Drought Frequency and Duration to Time Scales. Eighth Conference on Appl ied Cl imatology. http://www.droughtmanagement.info/literature/AMS_Relationship_Drought_Frequency_Duration_ Time_Scales_1993.pdf.
Mekong River Commission for Sustainable Development ( 2 0 1 8 ) . I n t e g ra t e d M a n a g e m e n t U n d e r w a y through Bilateral Cooperation. Mekong IWRMP Transboundary Projects. http://www.mrcmekong.o r g / a b o u t - m r c / m e k o n g - i n t e g r a t e d - w a t e r -resources-management-project/transboundary- projects-under-the-m-iwrmp/.
Melchiorri, M., M. Pesaresi, A. Florczyk, C. Corbane and T. Kemper (2019). Principles and Applications of the Global Human Settlement Layer as Baseline for the Land Use Efficiency Indicator—SDG 11.3.1. ISPRS International Journal of Geo-Information 8 (2). https://doi.org/10.3390/ijgi8020096.
M e r c y C o r p s ( 2 0 1 3 ) . R e s i l i e n c e , D e v e l o p m e n t a n d D i s a s t e r R i s k R e d u c t i o n . ht tp s : //w w w.m e r c y c o r p s . o r g / r e s e a r c h - r e s o u r c e s /resilience-development-and-disaster-risk-reduction.
cdxlvii

M exic o (2016). I n te nde d Nat io na l ly Dete rmi ne d Contribution. National Report Under the Paris Agreement . h t tps: //w w w4.unfccc. in t /s i tes/NDCStaging/Pages/Party.aspx?party=MEX.
Mexico, Ministry of the Environment and Natural Resources (2014). Special Climate Change Program 2014-2018. https://www.cakex.org/documents/special-climate-change-program-2014-2018-mexico.
Meyer, V., N. Becker, V. Markantonis, R. Schwarze, J. van den Bergh, L. Bouwer, P. Bubeck, et al. (2013). Review Article: Assessing the Costs of Natural Hazards-State of the Art and Knowledge Gaps. Natural Hazards and Earth System Sciences 13 (5). https://doi.org/10.5194/nhess-13-1351-2013.
MIDIMAR (2015). The National Risk Atlas of Rwanda. Government of Rwanda Publication. http://midimar.gov.rw/uploads/tx_download/National_Risk_Atlas_of_Rwanda_electronic_version.pdf.
Migliorini, M., J. Mihaljevic, J. Mysiak, L. Gooijer, A. Thieken, K. Meliksetian, J. Sjastad Hagen, et al. (2019). The Role of Data Interoperability in Disaster Risk Reduction: Barriers, Challenges and Regional Initiatives. GAR19 Contributing Paper, UNISDR.
Mitchell , T. (2003). An Operational Framework for Mainstreaming Disaster Risk Reduction. Benfield Hazard Research Centre, Disaster Studies Working Paper, 8. http://citeseerx.ist.psu.edu/viewdoc/download?doi=10.1.1.483.1125&rep=rep1&type=pdf.
Mora, M.G., J.A. Valcárcel, O.D. Cardona, L.G. Pujades, A.H. Barbat and G.A. Bernal (2015). Prioritizing Interventions to Reduce Seismic Vulnerability in School Facilities in Colombia. Earthquake Spectra 31 (4). http://earthquakespectra.org/doi/10.1193/ 040412EQS151T.
Morrissey, T.W. and K. Vinopal (2018). Center-Based Early Care and Education and Children’s School Readiness: Do Impacts Vary by Neighborhood Poverty? Developmental Psychology 54 (4). http://doi.apa.org/getdoi.cfm?doi=10.1037/dev0000470.
Morse, S.S., J.A.K. Mazet, M. Woolhouse, C.R. Parrish, D. Carroll , W.B. Karesh, C. Zambrana-Torrelio, W.I. Lipkin and P. Daszak (2012). Prediction and Prevention of the Next Pandemic Zoonosis. The Lancet 380 (9857). https://linkinghub.elsevier.com/retrieve/pii/S0140673612616845.
Morsut, C. (2019). The European Union’s Contribution to Sendai Implementation through the Civil Protection Policy and the EU Civil Protection Mechanism. Unpublished.
Mozambique (2010). Projecções Anuais da População Total, Urbana e Rural, dos Distritos da Cidade de Maputo 2007 – 2040. http://www.ine.gov.mz/estatisticas/estatisticas-demograficas-e-indicadores-sociais/populacao/projeccoes-da-populacao/projeccoes-2007-2040-maputo-cidade.pdf/at_download/file.
(2017). Mozambique: Plano Director Para a Redução Do Risco de Desastres 2017-2030. http://
portaldogoverno.gov.mz/por/Imprensa/Noticias/Governo-aprova-plano-director-para-reduzir-riscos-de-desastres-2017-2030.
Muis, S., M. Verlaan, H. Winsemius, J. Aerts and P. Ward (2016). A Global Reanalysis of Storm Surges and Extreme Sea Levels. Nature Communications 7 (1). http://www.nature.com/articles/ncomms11969.
Multihazard Mitigation Council (2005). Natural Hazard Mitigation Saves: An Independent Study to Assess the Future Savings from Mitigation Activities. National Institute of Building Sciences. Volume 1. Findings, Conclusions, and Recommendations. N a t i o n a l I n s t i t u t e o f B u i l d i n g S c i e n c e s . https://www.floods.org/PDF/MMC_Volume1_FindingsConclusionsRecommendations.pdf.
Murnane, R., S. Loughlin, T. Rossetto, V. Silva, A. Ali, C. Galasso, C. Giovando, et al. (2019). Extensible Data Schema for Multiple Hazards, Exposure and Vulnerability. GAR19 Contributing Paper, UNISDR.
Murray, V. (2018). Achieving Coherence between Data Policies for Reporting against the Sendai Framework and the Sustainable Development Goals. Research Brief. Trends Thematic Research Network on Data and Statistics. http://unsdsn.org/wp-content/uploads/2018/01/180123-trends-brief-disaster-data.pdf.
Murray, V., R. Maini, L. Clarke and N. Eltinay (2017). Coherence between the Sendai Framework, the SDGs, the Climate Agreement, New Urban Agenda and World Humanitarian Summit, and the Role of Science in Their Implementation. https://www.prevention web.net/publications/view/53049.
Nadimpalli , K., M. Edwards and D. Mullaly (2007). National Exposure Information System (NEXIS) for Australia: Risk Assessment Oppor tunities. I n t e r n a t i o n a l C o n g r e s s o n M o d e l l i n g a n d Simulation. Modelling and Simulation Society of Australia and New Zealand. Risk Research Group, Geoscience Australia. https://www.researchgate.net/publication/228906016_National_Exposure_Information_System_NEXIS_For_Australia_Risk_assessment_opportunities.
Namibia, Office of the Prime Minister, Directorate Disaster Risk Management (2017). Paving a Risk-Informed Pathway towards Prosperity. Namibia’s National Disaster Risk Management Framework. h t t p s : // w w w.c a d r i . n e t /s i te s /d e f a u l t / f i l e s /productsCountry/NAMIBIA-DDRM-Brochure.pdf.
Narayan, D., R. Chambers, M.K. Shah and P. Petesch (2 0 0 0) . Vo i c e s of t h e P o o r : C r y i n g o u t fo r Change. The World Bank. ht tp://documents.worldbank.org/curated/en/501121468325204794/Voices-of-the-poor-crying-out-for-change.
NASA (2019a). NASA Earth Exchange. https://nex.nasa.gov/nex/.
(2019b). SMAP Soil Moisture Active Passive. National Centers for Environmental Information (2018).
cdxlviii References

State of the Climate: Global Climate Report for June 2018. https://www.ncdc.noaa.gov/sotc/global/201806.
Naumann, G., L. Alfieri, K. Wyser, L. Mentaschi, R. Betts, H. Carrao, J. Spinoni, J. Vogt and L. Feyen (2018). Global Changes in Drought Conditions Under Different Levels of Warming. Geophysical Research Letters 45 (7). http://doi.wiley.com/10.1002/2017 GL076521.
Naumann, G., P. Barbosa, L. Garrote, A. Iglesias and J. Vogt (2014). Exploring Drought Vulnerability in Africa: An Indicator Based Analysis to Be Used in Early Warning Systems. Hydrology and Earth System Sciences 18 (5). https://www.hydrol-earth-syst-sci.net/18/1591/2014/.
Nazlioglu, S. and U. Soytas (2011). World Oil Prices and Agricultural Commodity Prices: Evidence from an Emerging Market. Energy Economics 33. https://linkinghub.elsevier.com/retrieve/pii/S01409883 10002008.
NEA (2016). Implementation of Defence in Depth at Nuclear Power Plants: Lessons Learnt from the Fukushima Daiichi Accident. Nuclear Regulation. OECD Publishing. http://www.oecd-ilibrary.org/nuclear-energy/implementation-of-defence- in-depth-at-nuclear-power-plants_9789264253001-en.
(2018a). The Full Costs of Electricity Provision. OECD Publishing. https://www.oecd-nea.org/ndd/pubs/2018/7298-full-costs-2018.pdf.
(2018b). Towards an All-Hazards Approach to Emergency Preparedness and Response: Lessons Learnt from Non-Nuclear Events. OECD Publishing. https://www.oecd- ilibrary.org/nuclear-energy/towards-an-all-hazards-approach-to-emergency-preparedness-and-response_9789264289031-en.
Necci, A., E. Krausmann, S. Girgin and NEA (2018). Emergency Planning and Response for Natech Accidents. In Towards an All-Hazard Approach to Emergency Preparedness and Response – Lessons Learnt from Non-Nuclear Events. No. 7308. OECD. https://www.researchgate.net/publication/322656 611_ Emergency_ planning _and _ response_for_Natech_accidents.
Nelson, J.A. (2015). Are Women Really More Risk-Averse than Men? A Re-Analysis of the Literature Using Expanded Methods: Women More Risk-Averse than Men. Journal of Economic Surveys 29 (3). https://onlinelibrary.wiley.com/doi/abs/10.1111/joes.12069.
Nelson, W., D. Naambuyi, O. Amoah, J. Antwi, S. Agbey and A. Boegriba (2010). Guidebook on Integrating Climate Change and Disaster Risk Reduction into National Development, Policies and Planning in Ghana. Environmental Protection Agency, Ghana. ht tp://www.gh.undp.org/content/dam/ghana/docs/Doc/Susdev/ U NDP_GH _ S US DE V_ A A P_Integrating%20Climate%20Change%20and%20D is as te r % 2 0 R is k % 2 0 R e d u c t i o n% 2 0 i n to% 2 0
National%20Development%20Policies%20and%20Planning%20in%20Ghana.pdf.
Nepal (2015). Nepal Disaster Report 2015. Ministry of Home Affairs and Disaster Preparedness Network Nepal. http://www.drrpor tal .gov.np/uploads/document/329.pdf.
Nepal, Ministry of Environment (2010). National Adaptation Programme of Action to Climate Change. https://unfccc.int/resource/docs/napa/npl01.pdf.
Nepal, Ministry of Forests and Environment (2018). Nepal’s National Adaptation Plan (NAP) Process: Reflecting on Lessons Learned and the Way Forward. NAP Global Network, Action on Climate Today and Practical Action Nepal. http://napglobalnetwork.org/wp-content/uploads/2018/07/napgn-en-2018-nepal-nap-process.pdf.
Neumayer, E. and T. Plumper (2007). The Gendered Nature of Natural Disasters: The Impact of Catastrophic Events on the Gender Gap in Life Expectancy, 1981-2002. Annals of the Association of American Geographers 97 (3). http://www.tandfonline.com/doi/abs/10.1111/j.1467-8306.2007. 00563.x.
Newhall, C., F. Costa, A. Ratdomopurbo, D. Venezky, C. Widiwijayanti, N. Win, K. Tan and E. Fajiculay (2017). WOVOdat - An Online, Growing Library of Worldwide Volcanic Unrest. Journal of Volcanology and Geothermal Research 345. https://linkinghub.elsevier.com/retrieve/pii/S0377027317302718.
Nishikiori, N., T. Abe, D.G.M. Costa, S.D. Dharmaratne, O. Kunii and K. Moji (2006). Who Died as a Result of the Tsunami? – Risk Factors of Mortality among Internally Displaced Persons in Sri Lanka: A Retrospective Cohort Analysis. BMC Public Health 6 (1). http://bmcpublichealth.biomedcentral.com/articles/10.1186/1471-2458-6-73.
Nussbaumer, S., Y. Schaub, C. Huggel and A. Walz (2014). Risk Estimation for Future Glacier Lake Outburst Floods Based on Local Land-Use Changes. Natural Hazards and Earth System Sciences 14 (6). https://www.nat-hazards-earth-syst-sci.net/14/1611/2014/.
OCHA (2011). Horn of Africa Drought Crisis. Situation Report No. 9. https://reliefweb.int/sites/reliefweb.int/files/resources/OCHA%20Regional%20Sitrep%20No.%209_%2011%20August%202011.pdf.
(2019). Global Humanitarian Overview 2019. https://www.unocha.org/sites/unocha/f i les/GHO2019.pdf.
OECD (2003a). Emerging Risks in the 21st Century. An Agenda for Action. http://www.oecd.org/futures/globalprospects/37944611.pdf.
(2003b). Guiding Principles for Chemical Accident Prevention, Preparedness and Response (2nd Ed.). No. 10. Series on Chemical Accidents. http://www.oecd.org/env/ehs/chemical-accidents/Guiding-principles-chemical-accident.pdf.
cdxlix

(2014a). Effective Public Investment Across Level of Government. http://www.oecd.org/cfe/regional-policy/Principles-Public-Investment.pdf.
(2014b). Recommendation of the Council on the Governance of Critical Risks. Meeting of the OECD Council at Ministerial Level. https://www.oecd.org/gov/risk/Critical-Risks-Recommendation.pdf.
(2015). Addendum Number 2 to the OECD Guiding Principles for Chemical Accident Prevention, Preparedness and Response (2nd Ed.) to Address Natural Hazards Triggering Technological Accidents (N AT EC H S). E N V/J M / M O N O (2015 )1. S e r ie s on Chemical Accidents No. 27. ht tps://www.preventionweb.net/publications/view/56421.
(2016). Mitigating Droughts and Floods in Agr icu l tu re . OECD S tudies on Water. ht tp: //www.oecd - i l ibrar y.org/agr icul ture -and -food/mitigating-droughts-and-floods-in-agriculture_ 9789264246744-en.
(2017a). Boosting Disaster Prevention through I n n ovat i ve R i s k G ove r n a n c e : I n s i g h ts f r o m Austria, France and Switzerland. OECD Reviews of R isk Management Pol ic ies. ht tps://w w w.oecd-ilibrary.org/governance/boosting-disaster-prevention-through-innovative-risk-governance_ 9789264281370-en.
(2017b). Nat io na l U rban Po l icy i n O EC D Countries. http://www.oecd.org/cfe/regional -policy/the-state-of-national-urban-policy-in-OECD-countries.pdf.
(2017c). Proposal to Establish a Policy Marker for Disaster Risk Reduction (DRR) in the OECD DAC Credi tor Repor t ing System (CRS). DCD/DAC / S TAT(2 0 17 ) 26 . h t t p : // w w w.o e c d .o r g /officialdocuments/publicdisplaydocumentpdf/?cote=DCD/DAC/STAT(2017)26&docLanguage=En.
(2018a). Assessing the Real Cost of Disasters: The Need for Better Evidence. OECD Reviews of R is k M a n a g e m e n t P o l i c i e s . h t tp s : //d o i .org/10.1787/9789264298798-en.
(2018b). Development Assistance Committee. http://www.oecd.org/dac/developmentassistance committeedac.htm.
(2018c). States of Fragility 2018. https://read.oecd-ilibrary.org/development/states-of-fragility- 2018_9789264302075-en#page1.
(2019). Insurance Indicators: Penetration. https://stats.oecd.org/Index.aspx?QueryId=25444.
OECD, JRC and EC (2008). Handbook on Constructing Composite Indicators. Methodology and User Guide. Social Policies and Data Series. http://www.oecd.org/sdd/42495745.pdf.
International Energy Agency (2018). World Energy Outlook 2018. OECD. https://www.oecd-ilibrary.org/energy/world-energy-outlook-2018_weo-2018-en.
OEIWG (2016). Technical Non-Paper on Indicators for Target F. UNISDR. https://www.preventionweb.net/
documents/oiewg/Technical%20non-paper%20on%20indicators%20for%20Target%20F.pdf.
Okude, A.S. and I.A. Ademiluyi (2006). Implications of the Changing Pattern of Land Cover of the Lagos Coastal Area of Nigeria. American-Eurasian Journal of Scientif ic Research 1 (1). ht tps://www.researchgate.net/publication/268206178_Impl ic at ions _ of_ the _ C hang ing _ Pat te r n _ of_Landcover_of_the_Lagos_Coastal_Area_of_Nigeria.
Omoyo Nyandiko, N. and S. Omondi Rakama. 2019. Mainstreaming D isaste r R isk Reduct ion and Adaptation Strategies into Sub National Development Frameworks: Status, Constraints and Opportunities in Kenya’s Four Arid and Semi-Arid (ASAL) Counties. Unpublished.
Open Data Cube (2019). An Open Source Geospatial Data Management and Analysis Platform. https://www.opendatacube.org.
Open Data Handbook (2019). What Is Open Data? http://opendatahandbook.org/guide/en/what-is-open- data/.
Opitz-Stapleton, S., R. Nadin, J. Kellett, A. Quevedo, M. Caldarone and K. Peters (2019). Risk- Informed Development: From Crisis to Resilience. Overseas Development Institute.
Orlowsky, B. and S. Seneviratne (2012). Elusive Drought: Uncertainty in Observed Trends and Short- and Long-Term CMIP5 Projections. Hydrology and Earth System Sciences Discussions 9 (12). http://www.hydrol-earth-syst-sci-discuss.net/9/13773/2012/.
Otkin, J., M. Svoboda, E. Hunt, T. Ford, M. Anderson, C. Hain and J. Basara (2018). Flash Droughts: A Review and Assessment of the Challenges Imposed by Rapid-Onset Droughts in the United States. Bulletin of the American Meteorological Society 99 (5). http://journals.ametsoc.org/doi/10.1175/BAMS-D- 17-0149.1.
Oulahen, G., L. Mortsch, K. Tang and D. Harford (2015). Unequal Vulnerability to Flood Hazards: ‘Ground Truthing’ a Social Vulnerabil i ty Index of Five Municipalities in Metro Vancouver, Canada. Annals of the Association of American Geographers 105 (3). http://www.tandfonline.com/doi/full/10.1080/00045608.2015.1012634.
Overseas Development Institute and Humanitarian Practice Network (2013). Humanitarian Exchange. Humanitarian Practice Network at ODI 57.
O x f a m (2 018) . R o h i n g ya R e f u g e e s U n p r e p a r e d as Monsoon Rains , F looding and Landsl ides Continue. https://www.oxfam.org/en/pressroom/pressreleases/2018- 06 -19/rohingya- refugees-unprepared-monsoon-rains-flooding-and.
Pacific Catastrophe Risk Assessment and Financing Initiative (2019). Pacific Risk Information System. OpenDRI Repository for the Pacific Region Providing Premier Risk-Related Geospatial Data Sets. Better Information for Smarter Investments. http://pcrafi.
cdl References

spc.int.Pacifici, M., W.B. Foden, P. Visconti, J.E.M. Watson,
S.H.M. Butchart, K.M. Kovacs, B.R. Scheffers, et al. (2015). Assessing Species Vulnerability to Climate Change. Nature Climate Change 5 (3). http://www.nature.com/articles/nclimate2448.
Page, S.E. (2015). What Sociologists Should Know About Complexity. Annual Review of Sociology 41 (1). http://www.annualreviews.org/doi/10.1146/annurev-soc-073014-112230.
Palmer, W. (1965). Meteorological Drought. Research Paper No. 45 , Uni ted S tates Depar tment of C omme rc e. h t tps : //w w w.researc hgate .ne t /publication/285600502_Meteorological_Drought_Research_Paper_No_45_1965_58_p.
Palmisano, F. (2011). Landslide Structural Vulnerability of Masonry Buildings. Polytechnic University of Bari.
Pan, E. and R. Karp (2005). Katrina and Oil Prices. Council on Foreign Relations. https://www.cfr.org/inter view/katrina-and-oil-prices.
Park, Y., A.M.S. Pradhan, U. Kim, Y.T. Kim and S. Kim (2016). Development and Application of Urban Landslide Vulnerability Assessment Methodology Ref le c t ing S oc ia l and Ec onomic Var iab les . Advances in Meteorology 2016 (4572498). http://www.hindawi.com/journals/amete/2016/4572498/.
PDRF (2019). Philippine Disaster Resilience Foundation. https://www.pdrf.org/.
Peduzzi, P., H. Dao, C. Herold and F. Mouton (2009). Assessing Global Exposure and Vulnerabil i ty towards Natural Hazards: The Disaster Risk Index. Natural Hazards and Earth System Science 9 (4). https://doi.org/10.5194/nhess-9-1149-2009.
Pereira , P. , A . Cerda , A . Jordan, V. Bolutiene, M. Pranskevicius, X. Ubeda and J. Mataix-Solera (2013). Spatio-Temporal Vegetation Recuperation after a Grassland Fire in Lithuania. Procedia Environmental Sciences 19. ht tps://linkinghub.elsevier.com/ retrieve/pii/S1878029613003654.
Peru, Office of the Director-General of Public Investment, Ministry of Economics and Finance (2016). General Guidelines for Public Investment Projects.
Pescaroli, G. and D. Alexander (2018). Understanding Compound, Interconnected , Interacting , and Cascading Risks: A Holistic Framework: A Holistic Framework for Understanding Complex Risks. Risk Analysis 38 (11). http://doi.wiley.com/10.1111/risa.13128.
Peters, K . (2018). Accelerating Sendai Framework Implementation in Asia. Disaster Risk Reduction in Contexts of Violence, Conflict and Fragility. Overseas Development Insti tute. ht tps://www.odi.org/publications/11153-accelerating-sendai-framework-implementation -asia - disaster- r isk- reduction -contexts-violence-conflict.
Peters, K. and L.E.R. Peters (2018). Disaster Risk Reduction and Violent Conflict in Africa and Arab
States. Implications for the Sendai Framework Priorities. Overseas Development Institute. https://www.odi.org/sites/odi.org.uk /f i les/resource -documents/12446.pdf.
Peters, K., L. Langston, T. Tanner and A. Bahadur (2016). Resil ience across the Post-2015 Frameworks: Towards Coherence? Overseas Development Institute. https://www.odi.org/sites/odi.org.uk/files/resource-documents/11006.pdf.
Philippines (2010a). Philippine Disaster Risk Reduction and Management Act of 2010. Republic Act No. 10121. https://www.lawphil.net/statutes/repacts/ra2010/ra_10121_2010.html.
(2010b). Executive Order No. 870 of 2010, Establishing the Reconstruction Monitoring and Evaluation System. https://www.officialgazette.gov.ph/2010/03/16/executive-order-no-870-s-2010/.
Philippines, Department of Trade and Industry (2017). M S M E S t a t i s t i c s . h t t p s : // w w w.d t i .g o v. p h /businesses/msmes/msme-resources.
Picard, M. (2018). Disaster Management, Risk Reduction and International Disaster Response Laws in the Commonwealth. Commonwealth Law Bul letin 43 (3–4). https://www.tandfonline.com/eprint/WVKCVxXmbWKBQbTGTZnQ/full.
Pinheiro, E.G., G. Cova, L. Frates Simiano, M. Noli da Fonseca and D. Stringari (2019). Redesastre: A Contribution from Paraná to the Management of Disaster Risk in Brazil. GAR19 Contributing Paper, UNISDR.
Plan of Action Implementation of the Sendai Framework for Disaster Risk Reduction 2015-2030 in Central Asia and South Caucasus Region (2016). UNISDR. ht tps://www.preventionweb.net/f i les/57668 _cascplanofactionforsendaiframeworki.pdf.
Planitz, A. (2015). Disaster Risk Governance and the Principles of Good Governance. In Disaster Risk Reduction for Economic Growth and Livelihood: Investing in Resilience and Development. Routledge. h t tp s : //w w w. r o u t l e d g e .c o m / D isas te r - R is k -Reduction-for-Economic-Growth-and-Livelihood-Investing - in/Davis -Yanagisawa- Georgieva/p/book/9781138825482.
Poledna, S. and S. Thurner (2016). Elimination of Systemic Risk in Financial Networks by Means of a Systemic Risk Transaction Tax. Quantitative Finance 16 (10). https://www.tandfonline.com/doi/full/10.1080/14697688.2016.1156146.
Potts, D.M., N. Kovacevic and P.R. Vaughan (1997). Delayed Collapse of Cut Slopes in Stif f Clay. Géotechnique 47 (5). http://www.icevirtuallibrary.com/doi/10.1680/geot.1997.47.5.953.
Pugh, D.T. (1987). Tides, Surges and Mean Sea Level—A Handbook for Engineers and Scientists. Geophysical Journal International 95 (3). https://academic.oup.com/gji/ar ticle - lookup/doi/10.1111/j.1365-246X.1988.tb06710.x.
cdli

Pulwarty, R. and R. Maia (2015). Adaptation Challenges in Complex Rivers Around the World: The Guadiana and the Colorado Bas ins . Water Resources Management 29 (2). http://link.springer.com/10.1007/s11269-014-0885-7.
Pulwarty, R. and M. Sivakumar (2014). Information Systems in a Changing Climate: Early Warnings and Drought Risk Management. Weather and Climate Extremes 3. ht tps:// l inkinghub.elsevier.com/retrieve/pii/S2212094714000218.
Pulwarty, R. and J. Verdin (2013). Crafting Early Warning Systems: The Case of Drought. In Measuring Vu l n e r a b i l i t y t o N a t u r a l H a z a r d s : To w a r d s Disaster Resi l ient Societ ies . United Nations University Press. https://www.researchgate.net/publication/285798408_Crafting_early_warning_information_systems_the_case_of_drought.
Puma, M.J., S. Bose, S.Y. Chon and B.I. Cook (2015). Assessing the Evolving Fragility of the Global Foodsystem. Environmental Research Let ters 10 (2). http://stacks.iop.org/1748-9326/10/i=2/a=024007?key=crossref.d345e1eb75f8addcbd02ee fe7ee6c482.
Quental Coutinho, R., H.M. Henrique and R. Lucena (2019). The C ha l le nge of R is k and D isaste r Governance: Institutional Vulnerability Evaluation and Good Practices of Non-Structural Actions in the Municipality of Jaboatão Dos Guararapes/PE - Brazil. GAR19 Contributing Paper, UNISDR.
Raleigh, C., J. Healy and J. Bredehoeft (1976). An Experiment in Earthquake Control at Rangely, Colorado. Science 191 (4233). http://www.sciencemag.org/cgi/doi/10.1126/science.191.4233.1230.
Ranger, N., A. Millner, S. Dietz, S. Fankhauser, A. Lopez and G. Ruta (2010). Adaptation in the UK: A Decision-Making Process. Grantham Research Institute on Climate Change and the Environment, Centre for Climate Change Economics and Policy. http://www.lse.ac.uk/GranthamInstitute/wp-content/uploads/2014/03/PB-Ranger-adaptation-UK.pdf.
Regional Integrated Multi-Hazard Early Warning System (2019). Regional Integrated Multi-Hazard Early Warning System for Africa and Asia. http://www.rimes.int/.
Renn, O. (2008). Risk Governance: Coping with Uncertainty in a Complex World. Earthscan Risk in Society Series.
Rittel, H.W.J. and M.M. Webber (1973). Dilemmas in a General Theory of Planning. Policy Sciences 4 (2). http://www.jstor.org/stable/4531523.
Robinne, F.N., M.A. Parisien and M. Flannigan (2016). Anthropogenic Influence on Wildfire Activity in Alberta, Canada. International Journal of Wildland Fire 25 (11). http://www.publish.csiro.au/?paper=WF 16058.
Roche, C., K. Thygesen and E. Baker (2017). Mine Tailings Storage: Safety is no Accident. A UNEP Rapid Response Assessment. UNEP and GRID-Arendal.
https://gridarendal-website-live.s3.amazonaws.com/production/documents/:s_document/371/original/RRA_MineTailings_lores.pdf?1510660693.
Rockström, J., O. Gaffney, J. Rogelj, M. Meinshausen, N. Nakicenovic and H.J. Schellnhuber (2017). A Roadmap for Rapid Decarbonization. Science 355 (6331). http://www.sciencemag.org/lookup/doi/10.1126/science.aah3443.
Rockström, J., W. Steffen, K. Noone, A. Persson, F.S. Chapin III, E. Lambin, T.M. Lenton, et al. (2009). Planetary Boundaries: Exploring the Safe Operating Space for Humanity. Ecology and Society 14. https://www.ecologyandsociety.org/vol14/iss2/art32/.
Ronchi, E., S. Gwynne, G. Rein, R. Wadhwani, P. Intini and A. Bergstedt (2017). E-Sanctuary: Open Multi-Physics Framework for Modelling Wildfire Urban Evacuation. https://www.nfpa.org/News-and-Research/Data-research-and-tools/Wildland-Urban-Interface/Open-Multi -Physics-Framework-for-Modelling-Wildfire-Urban-Evacuation.
Rosenzweig, C., W.D. Solecki, P. Romero-Lankao, S. Mehrotra, S. Dhakal, S. Ali Ibrahim and Urban Climate Change Research Network, eds. (2018). Climate Change and Cities: Second Assessment Report of the Urban Climate Change Research Network. Cambridge University Press.
Rozenberg, J. and M. Fay (2019). Beyond the Gap – How Countries Can Afford the Infrastructure They Need While Protecting the Planet. Sustainable I n f r a s t r u c t u r e . T h e W o r l d B a n k . h t t p s : //openknowledge.worldbank.org/handle/10986/31291.
Rush, D., G. Bankoff, G. Spinardi, L. Hirst, S. Jordan, J. Twigg, R. Walls and L. Gibson (2019). Fire Risk Reduction in an Urbanizing World. GAR19 Contributing Paper, UNISDR.
S and P Global Platts (2015). Platts World Electric Power Plants Database. http://www.platts.com/.
SAARC (2007). SAARC Comprehensive Framework on Disaster Management.
S A A RC Env i ronme nt Min is te rs (20 0 6). Disaste r Management in South Asia: A Comprehensive Regional Framework for Action 2006-2015.
SADC (2018a). Conference Communiqué: Accelerated C o l l a b o r a t i o n a n d P a r t n e r s h i p s f o r t h e Implementation of Disaster Risk Reduction for Sustainable Development in the SADC Region. ht tp: //w w w.ndmc.gov.za/Documents/ V1%20Communiqué-SADC%20DRR%20Conference%20March%202018_V3%201406.pdf.
(2018b). Regional Monitoring on Disaster Risk Reduction: Current Practices. Presented at the Advisory Meeting on the Regional Monitoring of the Implementation of the Sendai Framework, Bonn, Germany.
Saghaian, S.H. (2010). The Impact of the Oil Sector on Commodity Prices: Correlation or Causation? Journal of Agricultural and Applied Economics 42
cdlii References

(3). https://www.cambridge.org/core/product/identif ier/S1074070800003667/type/journal_ article.
Samoa (2016). Strategy for the Development of Samoa 2016/17-2019/20. http://extwprlegs1.fao.org/docs/pdf/sao165879.pdf.
(2018). Apia Outcome. Inter-Regional Meeting for the Mid-Term Review of the SAMOA Pathway Apia, Samoa. https://sustainabledevelopment.un.org/content/documents/21058Final_Samoa_Outcome.pdf.
Sample, I. (2017). Computer Says No: Why Making AIs Fair, Accountable and Transparent is Crucial. The Guardian. https://www.theguardian.com/science/2017/nov/05/computer-says-no -why-making-ais-fair-accountable-and-transparent-is-crucial.
Samuels, P. and N. Burt (2002). A New Joint Probability Appraisal of F lood Risk . Proceedings of the Institution of Civil Engineers - Water and Maritime Engineering 154 (2). http://www.icevirtuallibrary.com/doi/10.1680/wame.2002.154.2.109.
Sands, D. (2019). The State of Disaster Resilience of Small Businesses. GAR19 Contributing Paper, UNISDR.
Sands, P., A. El Turabi, P.A. Saynisch and V.J. Dzau (2016). Assessment of Economic Vulnerability to Infectious Disease Crises. The Lancet 388 (10058). ht tps:// l ink inghub.e lsevier.com/retr ieve/pi i/S0140673616305943.
Santaloia , F. , F. Cotecchia and C. V i tone (2012). Appl icazione De i Metod i Avanzat i A l Fronte Appenninico Apulo-Lucano: Analisi Di I Livello. Criteri Di Zonazione Della Suscettibilità e Della Pericolosità Da Frane Innescate Da Eventi Estremi (Piogge e Sisma).
Santos, V.J.E. and J.L. Leitmann (2016). Investing in Urban Resilience: Protecting and Promoting Development in a Changing World. The World Bank. http://documents.worldbank.org/curated/en/739421477305141142/Investing- in-urban-resi l ience-protect ing-and-promoting-development-in-a-changing-World.
Santos-Burgoa, C., J. Sandberg, E. Suárez, A. Goldman-Hawes, S. Zeger, A. Garcia-Meza, C.M. Pérez, et al. (2018). Differential and Persistent Risk of Excess Mortality from Hurricane Maria in Puerto Rico: A Time-Series Analysis. The Lancet Planetary Health 2 (11). https://doi.org/10.1016/S2542-5196 (18)30209-2.
Sarmiento, J.P., V. Sandoval, A. Atrieta, M. Lidth de Jeude, E. Mazariegos, E.D. Cardona, P. Ruiz, et al. (2019). Performance Evaluation in LAC Urban DRR Programming: The Neighborhood Approach. USAID.
Sarmiento, J.P. (2015). The Ebola Case & the New Disaster Risk Perspectives. Presented at the UK-US Social Responses to Emergencies. University of Miami Press.
Saulnier, D.D., R. Ismail, N.B. Mohamed, V. Murray, H.K. Green, C. Chhorvann and T.D. Waite (2019). Disaster
Risk Reduction: Why Do We Need Accurate Disaster Mortality Data to Strengthen Policy and Practice? GAR19 Contributing Paper, UNISDR.
Schinko, T. and R. Mechler (2017). Applying Recent Ins ights f rom Cl imate R isk Management to Operationalize the Loss and Damage Mechanism. Ecological Economics 136. https://linkinghub.elsevier.com/retrieve/pii/S0921800916307455.
Schippmann, U. (2006). A Comparison of Cultivation and Wild Collection of Medicinal and Aromatic Plants under Sustainability Aspects. In Medicinal and Aromatic Plants: Agricultural, Commercial, Ecological, Legal, Pharmacological, and Social Aspects, D. Leaman, D. Lange and A.B. Cunningham, eds. Volume 17. Wageningen UR Frontis Series. Springer.
Secretar iat of the Pacif ic Regional Environment Programme (2013). J NAP Deve lopme nt and Implementation in the Pacific: Experiences, Lessons and Way Forward. Secretariat of the Pacific Regional Environment Programme. https://www.sprep.org/attachments/Publications/CC/JNAP.pdf.
Sen, A. (2000). Development as Freedom. 1. Anchor Books.
Seneviratne, S., D. Lüthi, M. Litschi and C. Schär (2006). Land–Atmosphere Coupling and Climate Change in Europe. Nature 443 (7108). http://www.nature.com/doifinder/10.1038/nature05095.
Sepulcre-Canto, G., S. Horion, A. Singleton, H. Carrao and J. Vogt (2012). Development of a Combined Drought Indicator to Detect Agricultural Drought in Europe. Natural Hazards and Earth System Sciences 12 (11). https://www.nat-hazards-earth-syst-sci.net/12/3519/2012/.
Shakesby, R. (2011). Post-Wildfire Soil Erosion in the Mediterranean: Review and Future Research Directions. Earth-Science Reviews 105 (3–4). https:// l inkinghub.elsevier.com/retr ieve/pi i/S001282521100002X.
Sheffield, J. and E.F. Wood (2008). Global Trends and Variabil i ty in Soil Moisture and Drought Characteristics, 1950–2000, from Observation-Driven Simulations of the Terrestrial Hydrologic Cycle. Journal of Climate 21 (3). http://journals.ametsoc.org/doi/abs/10.1175/2007JCLI1822.1.
Shoji, G. and T. Nakamura (2017). Damage Assessment of Road Bridges Subjected to the 2011 Tohoku Pacific Earthquake Tsunami. Journal of Disaster Research 12 (1). https://doi.org/10.20965/jdr.2017.p0079.
Shughrue, C. and K.C. Seto (2018). Systemic Vulnerabilities of the Global Urban-Industrial Network to Hazards. Climatic Change 151 (2). ht tp://l ink.springer.com/10.1007/s10584-018-2293-0.
Shupp, R. and W. Arlington (2008). Risk Preference Differ-entials of Small Groups and Individuals. Economic Journal 118 (52). https://econpapers.repec.org/article/ecjeconjl/v_3a118_3ay_3a2008_3ai_3a525_3ap_3a258-283.htm.
cdliii

Silva, V., M. Pagani, J. Schneider and P. Henshaw (2019). Assessing Seismic Hazard and Risk Globally for an Earthquake Resilient World. GAR19 Contributing Paper, UNISDR.
Singh, P., A. Mishra and M. Imtiyaz (1991). Moisture Stress and the Water Use Efficiency of Mustard. Agricultural Water Management 20 (3). http://linking hub.elsevier.com/retrieve/pii/037837749190021A.
Sistema de la Integración Centroamericana (2019). SICA. https://www.sica.int/index.aspx.
Sobradelo, R., J. Martí, C. Kilburn and C. López (2015). Probabilistic Approach to Decision-Making under Uncertainty during Volcanic Crises: Retrospective Application to the El Hierro (Spain) 2011 Volcanic C r is is . Natu ra l Haza rds 76 (2). h t tps : //do i .org/10.1007/s11069-014-1530-8.
Soille, P., A. Burger, D. De Marchi, P. Kempeneers, D. Rodriguez, V. Syrris and V. Vasilev (2018). A Versatile Data-Intensive Computing Platform for Information Retrieval from Big Geospatial Data. Future Generation Computer Systems 81. https://www.sciencedirect.com/science/article/pii/S0167739X1730078X.
SPC (2016). Framework for Resilient Development in the Pacific: An Integrated Approach to Address Climate Change and Disaster Risk Management (FRDP): 2017-2030. http://www.pacificdisaster.net/dox/FRDP_2016_Resilient_Dev_pacific.pdf.
SPC Land Resources Division (2018). CIDP Programme Background. Coconut Industry Development for the Pacific. https://lrd.spc.int/coconut-industry- development-for-the-pacific.
SPC, SPREP, PIFS, UNDP, UNISDR and USP (2016). Framework for Resilient Development in the Pacific. An Integrated Approach to Address Climate Change and Disaster Risk Management (FRDP) 2017–2030. https://www.pacificmet.net/sites/default/files/inline -f i les/documents/WP%208.0%20Att%202-PRP%20Working%20Group%20Governance%20Paper%20clean%2016%20June.pdf.
Spinoni, J., G. Naumann, J. Vogt and P. Barbosa (2016). Meteorological Droughts in Europe: Events and Impacts , Past Trends and Future Projections. Publications Office of the EU.
Spinoni, J., J. Vogt, P. Barbosa, N. McCormick, G. Naumann and A. Dosio (2018). World Drought Projections Based on CORDEX Data. Geophysical Research Abstracts 20. EGU General Assembly.
Sri Lanka, Disaster Management Centre, Ministry of Disaster Management (2017). National Disaster Risk Management Plan 2018-2030 (First Draft). ht tp: //w w w.mobi l ise - projec t .org .uk /assets/p r e s e n t a t i o n s / S r i L a n k a / M r.% 2 0 N u wa n% 2 0Madawan%20Arachchi.pdf.
State of Palestine, Environment Quality Authority (2016). National Adaptation Plan (NAP) to Climate Change. https://www4.unfccc.int/sites/NAPC/D o c u m e n t s % 2 0 N A P/ N a t i o n a l % 2 0 R e p o r t s /
State%20of%20Palestine%20NAP.pdf.Steinich, M. (2018). Global Initiative on Disaster Risk
Management: Fostering Practical Coherence in a World of Global Agendas.
Subba , S . (2019). Role of Local Government and Implementation of MGNREGS in Landslide Risk Reduction in Himalayan Region: Evidences from Darjeeling- Sikkim Himalayan Region. Unpublished.
Suppasri, A., E. Mas, I. Charvet, R. Gunasekera, K. Imai, Y. Fukutani, Y. Abe and F. Imamura (2013). Building Damage Characteristics Based on Surveyed Data and Fragility Curves of the 2011 Great East Japan Tsunami. Natural Hazards 66 (2). ht tps://doi.org/10.1007/s11069-012-0487-8.
Sur ya , S.S. and S.L.N. Rao (2013). Lessons from Neurolathyrism: A Disease of the Past & the Future of Lathyrus Sativus (Khesari Dal). Indian Journal of Medical Research 138 (1). https://www.ncbi.nlm.nih.gov/pmc/articles/PMC3767245/.
Sustainable Development Solutions Network (2017). Counting on the World: Building Modern Data Systems for Sustainable Development. http://unsdsn.org/wp-content/uploads/2017/09/sdsn-trends-counting-on-the-world-1.pdf.
Svensson, C. and D. Jones (2002). Dependence between Extreme Sea Surge, River Flow and Precipitation in Eastern Britain. International Journal of Climatology 22 (10). http://doi.wiley.com/10.1002/joc.794.
(2004). Dependence between Sea Surge, River Flow and Precipitation in South and West Britain. Hydrology and Earth System Sciences 8 (5). http://www.hydrol-earth-syst-sci.net/8/973/2004/.
Svoboda, M. and B.A. Fuchs (2016). Handbook of Drought Indicators and Indices. Integrated Drought Management Programme, Integrated Drought Management Tools and Guidel ines Series 2. WMO and GWP. https://library.wmo.int/pmb_ged/wmo_1173_en.pdf.
Svoboda, M., D. LeComte, M. Hayes, R. Heim, K. Gleason, J. Angel, B. Rippey, et al. (2002). The Drought Monitor. Bulletin of the American Meteorological Society 83 (8). ht tp:// journals.ametsoc.org/doi/10.1175/1520-0477-83.8.1181.
Swiss Re (2019). Profitability in Non-Life Insurance: Mind the Gap. https://www.swissre.com/institute/research/sigma-research/sigma-2018-04.html.
Tallaksen, L. and H. van Lanen, eds. (2004). Hydrological Drought: Processes and Estimation Methods for Streamflow and Groundwater. Developments in Water Science 48. Elsevier.
Tánago, G., J. Urquijo, V. Blauhut, F. Villarroya and L. De Stefano (2016). Learning from Experience: A Systematic Review of Assessments of Vulnerability to Drought. Natural Hazards 80 (2). http://link.springer.com/10.1007/s11069-015-2006-1.
Tanner, T. , S. Surminski , E. Wilkinson, R. Reid , J. Rentschler and S. Rajput (2015a). The Triple
cdliv References

Dividend of Resil ience: Realizing Development Goals through the Multiple Benefits of Disaster Risk Management. GFDRR and Overseas Development Institute. https://www.odi.org/publications/9599-triple -dividend- resilience -development-goals-multiple-benefits-disaster-risk-management.
(2015b). The Triple Dividends of Resilience Building. Overseas Development Institute. https://www.odi.org/publications/9599-triple-dividend-resilience-development-goals-multiple-benefits-disaster-risk-management.
Task Force on Hemispheric Transport of Air Pollution (2010). Task Force on Hemispheric Transport of Air Pollution Acting within the Framework of the Convention on Long-Range. Informal Document No. 10 ECE/EB.AIR/2010/10. Convention on Long-Range Transboundary Air Pollution. UNECE. http://www. htap.org/publications/2010_report/2010_Final_Report/EBMeeting2010.pdf.
Terzaghi, K. (1950). Mechanisms of Landslides. Engineer-ing Geology. Geological Society of America.
The Economist Intelligence Unit Ltd. (2013). Hot Spots 2025: Benchmarking the Future Competitiveness of Cities. https://www.citigroup.com/citi/citiforcities/pdfs/hotspots2025.pdf.
The Nansen Initiative (2015). Agenda for the Protection of the Cross-Border Displaced Persons in the Context of Disasters and Climate Change. Volume I. Disaster-Induced Cross-Border Displacement. https://disasterdisplacement.org/wp-content/uploads/2014/08/EN_Protection_Agenda_Volume_I_-low_res.pdf.
Thomas, A., C.-F. Schleussner and M. Kumar (2018). Small Island Developing States and 1.5 °C. Regional Environmental Change 18 (8). https://doi.org/10. 1007/s10113-018-1430-7.
Timonina, A., S. Hochrainer-Stigler, G. Pflug, B. Jongman and R . Rojas (2015). S tructured Coupling of Probability Loss Distributions: Assessing Joint Flood Risk in Multiple River Basins: Structured Coupling of Probability Loss Distributions. Risk Analysis 35 (11). http://doi.wiley.com/10.1111/risa.12382.
Tonga (2018). Joint National Action Plan II on Climate Change and Disaster Risk Management (JNAP 2) 2018-2028. https://www.preventionweb.net/files/60141_tongajnap2final.pdf.
Toregas, C. and M. Santos (2019). Cybersecurity and its Cascading Effect on Societal Systems. GAR19 Contributing Paper, UNISDR.
Tosey, P., M. Visser and M.N.K. Saunders (2012). The Origins and Conceptualizations of ‘Triple-Loop’ Learning: A Critical Review. Management Learning 43 (3). http://journals.sagepub.com/doi/10.1177/ 1350507611426239.
Tsionis, G., M.L. Sousa, V. Palermo and R. Maio (2017). Framework for Resilience Analysis of EU Buildings. EUR 29053 EN. Publications Office of the EU. http://
publications.jrc.ec.europa.eu/repository/bitstream/JRC110165/d3_framework_for_resilience_analysis_of_eu_buildings_f(1).pdf.
Twigg, J. (2015). Disaster Risk Reduction. Good Practice Rev iew 9. O verseas Deve lopment Ins t i tu te . ht tps://goodpracticereview.org/wp - content /uploads/2015/10/GPR-9-web-string-1.pdf.
UN DESA (2008). International Standard Industrial Classi-fication of All Economic Activities. Review 4. Statisti-cal Papers. Series M, No. 4. https://unstats.un.org/unsd/publication/seriesm/seriesm_4rev4e.pdf.
(2017). Framework for the Development of Environment Statistics (FDES2013). Studies in Methods, Series M No. 92. United Nations Publication Sales No. 14.XVII.9. https://unstats.un.org/unsd/environment/fdes/FDES-2015-supporting-tools/FDES.pdf.
(2018a). 2018 Revision of the World Urbanization Prospects. https://www.un.org/development/desa/publications/2018-revision-of-world-urbanization-prospects.html.
(2018b). The World’s Cities in 2018. ST/ESA/SER.A/417. http://www.un.org/en/events/citiesday/assets/pdf/the _worlds _cities _ in _ 2018 _data _ booklet.pdf.
(2019). World Population Prospects 2017. https://population.un.org/wpp/Download/S tandard/Population/.
UN News (2019). ‘Revved up Climate Action’ Needed to Counter ‘Prolonged’ and Deadly Storms like Cyclone Idai: Guterres. https://news.un.org/en/story/2019/ 03/1035431.
UN Women and Viet Nam Central Steering Committee for Natural Disaster Prevention Control (2016). Ha Noi Recommendations for Action on Gender and Disaster Risk Reduction. http://bit.ly/2iDnf4D.
UNDP (2004). Reducing Disaster Risk. A Challenge for Development. https://www.undp.org/content/undp/en/home/librarypage/crisis-prevention-and-recovery/reducing-disaster-risk- -a-challenge-for-development.html.
(2010). Mainstreaming Disaster Risk Reduction into Development at the National Level – A Practical Framework.
(2014). Human Development Report 2014. http://hdr.undp.org/sites/default/files/hdr14-report-en-1.pdf.
(2016a). Review of Climate Change Adaptation and D isaste r R isk Reduct ion Mainstreaming Frameworks, Guidelines and Toolkits.
(2016b). Risk-Informed Development. A Tool for Mainstreaming Disaster Risk Reduction and Climate Change Adaptation into Development.
(2016c). Social Vulnerability Assessment Tools for Climate Change and DRR Programming. https://www.adaptation-undp.org/sites/default/f iles/resources/social_vulnerability05102017_0.pdf.
(2017a). 10 Things to Know: Disaster and Climate
cdlv

Risk Governance in UNDP. http://www.undp.org/content/undp/en/home/librarypage/climate-and-disaster- resilience -/10 -things-to -know-about-disaster-risk-governance.html.
(2017b). Pacific Risk Resilience Programme. Annual Report. http://pacific-prrp.org/wp-content/uploads/2017/08/PRRP-AR-FINAL-Web.compressed.pdf.
(2017c). UNDP Guidance Note on Risk-Informed D eve l o p m e n t f o r M A P S M i s s i o n s : S e c u r i n g Development Gains from Disaster Risks and Climate Change Impacts.
(2018a). Disaster Risk Analysis System - DRAS. http://dras.undp.ba/.
(2018b). Disaster Risk Reduction Financing. Regional Workshop Report. http://www.eurasia.undp.org/content/dam/rbec/docs/internal/1018-DRR-Financing-Workshop-Report.pdf.
(2018c). R isk Informed Publ ic Investment Planning in Cambodia, Lao People’s Democratic Republic, Myanmar - Regional Synthesis Report.
(2018d). The Arab Cities Resilience Report. www.arabstates.undp.org/content/rbas/en/home/publications.html.
(2019a). Armenia Country Case Study on Stand-Alone DRR Strategies and Plans, for GAR19.
(2019b). Bhutan Country Case Study on DRR Strategies and Plans.
(2019c). Bosnia and Herzegovina Country Case Study on DRR Integrated in Development Strategies and Plans, for GAR19.
(2019d). Costa Rica Country Case Study on Stand-Alone DRR Strategies and Plans, for GAR19.
(2019e). Kenya Country Case Study on DRR Integrated in Development Strategies and Plans, for GAR19.
(2019f). Kyrgyz Republic Country Case Studies on the Development of National DRR Strategies and Plans Aligned with the Sendai Framework, for GAR19.
(2019g). Mozambique Country Case Study for GAR19.
(2019h). Nasolo Vil lage , Fi j i Country Case Study on Enhanced Income Security through a Risk Informed Farm Road, for GAR19.
(2019i). Solomon Islands Country Case Study for GAR 2019.
(2019j). Sudan Country Case Study for GAR19. (2019k). Sudan National Disaster Risk Reduction
Strategy (2016-2030). (2019l). Tajikistan Country Case Study on Stand-
Alone DRR Strategies and Plans, for GAR19. (2019m). The Case Study of Montenegro. (2019n). Tonga Country Case Study on Develop-
ment of DRR Strategies in Fragile Contexts, for GAR19. (2019o). Tunisia Country Case Study for GAR19. (2019p). Uganda Country Case Study on Integra-
tion of Hazard, Vulnerability and Risk Information
into National and Sub National Level Plans and Plan-ning Processes, for GAR19.
(2019q). Vanuatu Country Case Study for GAR19.UNDP and UNISDR (2018). Spot Check Sendai Aligned
DRR Strategies and Plans.UNEP (2016). Radiation Effects and Sources: What Is Radiation?
What Does Radiation Do to Us? Where Does Radiation Come From? http://www.un-ilibrary.org/public-health/radiation-effects-and-sources_b1749f17-en.
(2017). Towards a Pollution-free Planet. UNEP/EA3/25. https://papersmart.unon.org/resolution/uploads/25_19october.pdf.
(2018). South Sudan. First State of Environment and Outlook Report 2018. https://wedocs.unep.org/bitstream/handle/20.500.11822/25528/SouthSudan_SoE2018.pdf?sequence=1&isAllowed=y.
(2019). Global Environment Outlook GEO-6. Healthy Planet, Healthy People. https://wedocs.unep.org/bitstream/handle/20.500.11822/27539/GEO6_2019.pdf?sequence=1&isAllowed=y.
U N E P a n d I n t e r n a t i o n a l Fu n d f o r A g r i c u l t u r a l Development (2013). Smallholders, Food Security, and the Environment. http://wedocs.unep.org/bitstream/handle/20.500.11822/8127/-Small%20Holders%20%2c%20food%20security%20and%20the%20environment-2013SmallholderReport_e_WEB.pdf?sequence=3&isAllowed=y.
UNEP and OCHA (2000). The Cyanide Spill at Baia Mare, Romania. Before, During and After. http://archive.rec.org/REC/Publications/CyanideSpill/ENGCyanide. pdf.
UNESCO (2016). UN World Water Assessment Programme (WWAP) Highlights: Reporting Period January 2015-May 2016. 2016/SC/WWAP/AN/1. https://unesdoc.unesco.org/ark:/48223/pf0000245229.
UNFCCC (1992). FCCC/INFORMAL/84. https://unfccc.int/resource/docs/convkp/conveng.pdf.
(2012a). FCCC/CP/2011/9/Add.1. ht tps://unfccc.int/files/adaptation/cancun_adaptation_framework/national_adaptation_plans/application/pdf/decision_5_cp_17.pdf.
(2012b). National Adaptation Plans. Technical Guidelines for the National Adaptation Plan Process. http://unfccc.int/files/adaptation/cancun_adaptation_framework/application/pdf/naptechguidelines_eng_high__res.pdf.
(2016). FCCC/CP/2015/10/Add.1. ht tps://www.un.org/en/development/desa/population/migration/generalassembly/docs/globalcompact/FCCC_CP_2015_10_Add.1.pdf.
(2017). Opportunities and Options for Integrating Climate Change Adaptation with the Sustainable Development Goals and the Sendai Framework for Disaster Risk Reduction 2015–2030. FCCC/TP/2017/3. https://www.preventionweb.net/publications/view/55605.
(2018). AC/2018/13. https://unfccc.int/sites/
cdlvi References

default/files/resource/ac14_indicators.pdf. (2019). National Adaptation Plans. NAPs from
Developing Countries. https://www4.unfccc.int/sites/NAPC/Pages/national-adaptation-plans.aspx.
UN-GGIM (2015). Future Trends in Geospatial Information Management: The Five to Ten Year Vision – Second Edition. http://ggim.un.org/ggim_20171012/docs/meetings/GGIM5/Future%20Trends%20in%20Geospatial%20Information%20Management%20%20the%20five%20to%20ten%20year%20vision.pdf.
(2017). Strategic Framework on Geospatial Information and Services for Disasters.
UN-Habitat (2015). Slum Almanac 2015/2016. https://unhabitat.org/slum-almanac-2015-2016/.
(2019). Urban Resilience Hub. http://urban resiliencehub.org/city-profile/maputo/.
UNICEF (2015). Unless We Act Now: The Impact of Climate Change on Children. http://www.unicef.org/publications/files/Unless_we_act_now_The_impact_of_climate_change_on_children.pdf.
(2017). Multiple Indicator Cluster Surveys (MICS). Statistics and Monitoring. https://www.unicef.org/statistics/index_24302.html.
Unidad Nacional para la Gestión del Riesgo de Desastres and UNISDR (2018). Sexta Plataforma Regional Para La Reducción Del Riesgo de Desastres En Las Américas: Hacia Una Región Menos Vulnerable, Con Comunidades Más Resilientes. http://eird.org/pr18/docs/nota-conceptual-pr18.pdf.
UNISDR (2004). Living with Risk: A Global Review of Disaster Reduction Initiatives. https://www.unisdr.org/files/657_lwr1.pdf.
(2006). Developing Early Warning Systems: A Checklist. Third International Conference on Early Warning from Concept to Action.
(2009). Global Assessment Report on Disaster Risk Reduction 2009. https://www.preventionweb.net/english/hyogo/gar/report/documents/GAR_Prelims_2009_eng.pdf.
(2011a). Drought Risks. In Global Assessment Report on Disaster Risk Reduction 2011. http://www.zaragoza.es/contenidos/medioambiente/onu/128-eng-ed2011-sum.pdf.
(2011b). Global Assessment Report on Disaster Risk Reduction 2011. Revealing Risk: Redefining Development. http://www.preventionweb.net/english/hyogo/gar/2011/en/home/download.html.
(2012). How to Make Cities More Resilient: A Handbook for Local Government Leaders. https://www.unisdr.org/files/26462_handbookfinalonlineversion.pdf.
(2013a). Findings of the Review of National Platforms for Disaster Risk Reduction 2012‐2013. https://www.preventionweb.net/publications/view/ 35266.
(2013b). Global Assessment Report on Disaster Risk Reduction 2013. From Shared Risk to Shared Value – The Business Case for Disaster Risk Reduction.
https://www.preventionweb.net/english/hyogo/gar/2013/en/home/GAR_2013/GAR_2013_2.html.
(2013c). Making Algeria Resilient Achieving Disaster Risk Reduction in the Arab States: Good Practice Country Brief. https://www.preventionweb.net/files/32443_unisdralgeriafinal.pdf.
(2014). Urban Risk Reduction and Resilience. https://www.unisdr.org/files/37966_finalwp3.pdf.
(2015a). Consolidated Recommendations for a Regional Roadmap and Plan of Action on Local Resil ience Building in Central Asia and South Caucasus. https://www.preventionweb.net/files/57668_roadmapcasc2015eng.pdf.
(2015b). Global Assessment Repor t 2015. Making Development Sustainable: The Future of Disaster Risk Management. .
(2015c). UNISDR Working Papers on Public Investment Planning and Financing Strategy for Disaster Risk Reduction: Review of Mauritius.
(2015d). Working Papers on Public Investment Planning and Financing Strategy for Disaster Risk Reduction. https://www.unisdr.org/we/inform/publications/43524.
(2015e). Working Papers on Public Investment Planning and Financing Strategy for Disaster Risk Reduction: Review of Madagascar. https://www.unisdr.org/files/43522_2.reviewofmadagascar.pdf.
(2015f). Working Papers on Public Investment Planning and Financing Strategy for Disaster Risk Reduction: Review of Seychelles. https://www.preventionweb.net/english/hyogo/gar/2015/en/gar-pdf/UNISDR_Working_Papers_on_Publ ic_Investment_Planning_and_Financing_Strategy_for_Disaster_Risk_Reduction_Review_of_Seychelles.pdf.
(2015g). Working Papers on Public Investment Planning and Financing Strategy for Disaster Risk Reduction: Review of South-West Indian Ocean Region. https://www.preventionweb.net/files/43526_southwest.pdf.
(2015h). Disaster Risk Reduction and Resilience in the 2030 Agenda for Sustainable Development.
(2016). Asuncion Declaration. Guidelines towards a Regional Action Plan for the Implementation of the Sendai Framework 2015-2030. https://www.preventionweb.net/files/49235_asunciondeclaration 2016.pdf.
(2017a). DRR4NAP: Integrating Disaster Risk Reduction into National Adaptation Planning. https://www.unisdr.org/we/inform/events/55715.
(2017b). EFDRR Survey on Sendai Framework Implementation in Europe. ht tp://efdrr turkey.org/upload/f i les/Documents/EFDRR- Sur vey -Report-20170224.pdf.
(2017c). Regional Action Plan for the Implemen-tation of the Sendai Framework for Disaster Risk Reduction 2015–2030 in the Americas. https://www.
cdlvii

preventionweb.net/files/52286_americasregional actionplaneng.pdf.
(2017d). Think Piece: National Disaster Risk Reduction Strategy Requirements (Draft). https://www.unisdr.org/files/globalplatform/591f087f114d0Think_Piece_National_DRR_Strategy_Final_Draft_May19.pdf.
(2017e). Words into Action Guidelines: National Disaster Risk Assessment, Direct and Indirect Economic Impact. https://www.unisdr.org/files/ 52828_deconomicimpact%5B1%5D.pdf.
(2018a). 2nd Central Asia and South Caucasus Sub Regional Platform for Disaster Risk Reduction. https://www.preventionweb.net/files/57668_casc 2018forum.pdf.
(2018b). Disaster Displacement: How to Reduce Risk, Address Impacts and Strengthen Resilience. https://reliefweb.int/sites/reliefweb.int/f iles/resources/58821_disasterdisplacement05a.pdf.
(2018c). Making Cities Resilient Report 2018. (2018d). Technical Guidance for Monitoring
and Reporting on Progress in Achieving the Global Targets of the Sendai Framework for Disaster Risk Reduction. https://www.unisdr.org/files/54970_techguidancefdigitalhr.pdf.
(2018e). Words into Action Guideline: Man-Made/Technological Hazards. https://www.unisdr.org/ we/inform/publications/54012.
(2019a). DesInventar. https://www.desinventar.net/DesInventar/inv/resultstab.jsp.
(2019b). HFA National Progress Query Tool. https://www.preventionweb.net/applications/hfa/qbnhfa/home.
(2019c). Peru. Countries, Territories and National Platforms. ht tps://www.unisdr.org/par tners/countries/per.
UNISDR and Internal Displacement Monitoring Centre (2017). Reducing Displacement Risk in the Greater Horn of Africa: A Baseline for Future Work. http://www.internal-displacement.org/sites/default/files/publications/documents/201709-af-greater-horn-of-africa-drr.pdf.
United Nations (2007). Hyogo Framework for Action 2005-2015: Building the Resilience of Nations and Communities to Disasters. UNISDR. https://www.unisdr.org/files/1037_hyogoframeworkforactionenglish.pdf.
(2014). Informe. Análisis de La Implementación de La Gestión Del Riesgo de Desastres En El Perú. http://onu.org.pe/wp-content/uploads/2014/08/Análisis-de-la-implementación-de-la-Gestión-del-Riesgo-de-Desastres-en-el-Perú.pdf.
(2015a). Addis Ababa Action Agenda. https://sustainabledevelopment.un.org/index.php?page=view&type=400&nr=2051&menu=35.
(2015b). Sendai Framework for Disaster Risk Reduction (2015-2030). https://www.unisdr.org/we/inform/publications/43291. https://www.unisdr.
org/we/coordinate/sendai-framework. (2015c). The Paris Agreement. https://unfccc.
int/process-and-meetings/the-paris-agreement/the-paris-agreement.
(2015d). Transforming Our World: The 2030 Agenda for Sustainable Development. https://sustainable development.un.org/post2015/transformingourworld.
(2016a). IPBES/4/3. https://www.actu-environne ment.com/media/pdf/news-26331-synthese-ipbes-decideurs-pollinisateurs.pdf.
(2016b). The New Urban Agenda. http://habitat3.org/the-new-urban-agenda/.
(2017a). Disaster-Related Data for Sustainable Development Sendai Framework Data Readiness Review 2017 Global Summary Report. https://www.unisdr.org/files/53080_entrybgpaperglobal summaryreportdisa.pdf.
(2017b). New Urban Agenda. A/RES/71/256*. ht tp://habitat3.org/wp-content/uploads/NUA- English.pdf.
(2017c). Global Land Outlook, First Edition. United Nations Convention to Combat Desertification. h t tp s : //w w w.u n c c d . i n t /s i te s/d efa u l t / f i l e s/documents/2017-09/GLO_Full_Report_low_res.pdf.
(2018). Implementation of the Sendai Framework for Disaster Risk Reduction 2015–2030. A/73/268.
(2019a). The Sustainable Development Goals Report 2018. https://unstats.un.org/sdgs/report/ 2018/overview/.
(2019b). World Economic Situation and Prospects 2019. https://www.un.org/development/desa/dpad/ wp-content/uploads/sites/45/WESP2019_BOOK-web.pdf.
Uni ted Nations Commit tee of E xper ts on Global Geospatial Information Management (2017). Strategic Framework on Geospatial Information and Services for Disasters. http://ggim.un.org/documents/UN - GGIM _ S trategic _ Framework _Disasters_final.pdf.
United Nations Economic and Social Council (2017a). Report of the Inter-Agency and Expert Group on Sustainable Development Goal Indicators. E /CN.3/2017/2, Annex III. https://unstats.un.org/sdgs/indicators/official%20revised%20list%20of%20global%20sdg%20indicators.pdf.
(2017b). E/CN.3/2018/2. https://undocs.org/E/CN.3/2018/2.
(2018a). E/2018/L.15. https://undocs.org/E/ 2018/L.15.
(2018b). E/CN.5/2018/3. https://undocs.org/E/CN.5/2018/3.
(2019). E/2019/24-E/CN.3/2019/37. https://unstats.un.org/unsd/statcom/50 th - session/documents/Report-on-the-50th-session-draft-E.pdf.
United Nations Economic Commission for Afr ica (2015). Assessment Report on Mainstreaming and Implementing Disaster Risk Reduction in Southern
cdlviii References

Africa. ht tps://www.uneca.org/sites/default/files/uploaded-documents/Natural_Resource_Management/drr/drr_southern-africa_eng_fin.pdf.
United Nations Economic and Social Commission for Western Asia (2017). Arab Climate Change Assessment Report. https://www.unescwa.org/sites/www.unescwa.org/files/publications/files/riccar-main-report-2017-english_0.pdf.
United Nations General Assembly (1987). A/RES/42/169. h t tps : //w w w.u n .o rg /do c u me n ts/ga /res/42 /a42r169.htm.
(1988). A /RES/43/53. ht tp://www.un.org/documents/ga/res/43/a43r053.htm.
(1989). A/RES/44/236. http://www.un.org/documents/ga/res/44/a44r236.htm.
(1999). A/54/497. https://www.unisdr.org/files/resolutions/N9931443.pdf.
(2000). A/RES/54/219. https://undocs.org/A/RES/54/219.
(2014a). A/HRC/27/66. https://undocs.org/A/HRC/27/66.
(2014b). A/RES/69/15. https://undocs.org/A/RES/69/15.
(2015a). A/RES/69/283. https://www.un.org/en/development/desa/population/migration/generalassembly/docs/globalcompact/A_RES_69_ 283.pdf.
( 2 0 15 b ) . A / R E S / 6 9 / 3 13 . h t t p : // w w w .un.org /ga /search/v iew_ doc.asp?symbol=A /RES/69/313&Lang=E.
(2015c). A/RES/70/1. http://www.un.org/ga/search/view_doc.asp?symbol=A/RES/70/1&Lang=E.
(2015d). Adoption of a Protocol, Another Legal Instrument, or an Agreed Outcome with Legal Force under the Convention Applicable to all Parties. Durban Platform for Enhanced Action (Decision 1/CP.17). FCCC/CP/2015/L.9/Rev.1. https://undocs.org/FCCC/CP/2015/L.9/Rev.1.
(2016a). A/70/709. https://undocs.org/A/70 /709.
(2016b). Sustainable Development: Disaster Risk Reduction. A/71/644. https://www.preventionweb.net/files/50683_oiewgreportenglish.pdf.
( 2 0 1 6 c ) . R e p o r t o f t h e O p e n - E n d e d Intergovernmental Expert Working Group on Indicators and Terminology Relating to Disaster Risk Reduction. A/71/644. h t tps : //www.prevent ionweb.net/files/50683_oiewgreportenglish.pdf.
(2017a). A/RES/71/225. https://undocs.org/A/RES/71/225.
(2017b). A/RES/71/256*. https://undocs.org/A/RES/71/256.
(2017c). A/RES/71/313. https://unstats.un.org/ sdgs/indicators/Global%20Indicator%20Framework_ A.RES.71.313%20Annex.pdf.
(2018a). A/73/268. https://www.unisdr.org/files/resolutions/N1824255-en.pdf.
(2018b). A/RES/72/217. https://undocs.org/fr/A/RES/72/217.
United Nations Secretary-General (2018). Secretary-General’s Video Message: An Alert for the World - 1 January 2018. https://www.un.org/sg/en/content/sg/statement/2017-12-31/secretary-general ’s -video-message-alert-world-1-january-2018-scroll.
United Nations Statistics Division (2019). National Accounts - Analysis of Main Aggregates (AMA). https://unstats.un.org/unsd/snaama/Index.
UNSCEAR (2014). Sources, Effects and Risks of Ionizing Radiation: United Nations Scientific Committee on the Effects of Atomic Radiation: UNSCEAR 2013 Report to the General Assembly with Scientific Annexes.
(2015). Sources, Effects and Risks of Ionizing Radiation, United Nations Scientific Committee on the Effects of Atomic Radiation: UNSCEAR 2012 Report to the General Assembly, with Scientific Annexes A and B. https://www.un-ilibrary.org/public-health/sources-effects-and-risks-of-ionizing-radiation-unscear-2012-report_2ed43f39-en.
U p pa r d , S . a n d L . B i r n bau m (2017 ). To o l k i t o n Unaccompanied and Separated Children. Inter-Agency Working Group on Unaccompanied and Separated Chi ld ren. ht tps: //resourcecentre.save thechi ld ren .ne t /node/12 207/pdf/ too ls -web-2017-0322.pdf.
Urrutia Vásquez, C., Colombia, Departamento Nacional de Planeación, Ministerio de Ambiente y Desarrollo Sostenible and Instituto Internacional para el Desarrollo Sustentable (2017). Asamblea Plan Nacional de Adaptación Al Cambio Climatico: Avanzando Juntos En La Implementación Del PNACC. http://napglobalnetwork.org/wp-content/uploads/2017/06/colombia-in-country-support-program-nap-assembly-report.pdf.
Vanuatu (2015). Vanuatu Climate Change and Disaster Risk Reduction Policy 2016-2030. Secretariat of the Pacific Community. http://www.lse.ac.uk/GranthamInstitute/wp-content/uploads/laws/8239.pdf.
(2017). Meteorology, Geological Hazards and Climate Change Act No. 25 of 2016. http://www.ilo.org/dyn/natlex/docs/ELECTRONIC/105148/128518/F-500801273/VUT105148.pdf.
Vervoort, J.M., P.K. Thornton, P. Kristjanson, W. Förch, P.J. Ericksen, K. Kok, J.S.I. Ingram, et al. (2014). Challenges to Scenario-Guided Adaptive Action on Food Security under Climate Change. Global Environmental Change 28. https://linkinghub.elsevier.com/retrieve/pii/S0959378014000387.
VI Regional Platform for Disaster Risk Reduction in the Americas (2018). Cartagena Declaration. VI Regional Platform for Disaster Risk Reduction in the Americas. Third High-level Meeting of Ministers and Authorities. http://eird.org/pr18/eng/index.html.
cdlix

Vicente-Serrano, S., S. Beguería and J. López-Moreno (2009). A Multiscalar Drought Index Sensitive to Global Warming: The Standardized Precipitation Evapotranspiration Index. Journal of Climate 23 (7). https://doi.org/10.1175/2009JCLI2909.1.
Vidili , M. (2018). Why We Must Engage Women and Children in Disaster Risk Management. The World Bank. http://blogs.worldbank.org/sustainablecities/why-engaging-women-and-children-disaster-risk-management-matters-and-how-it-makes-difference.
Vliet , M. van, J. Sheffield, D. Wiberg and E. Wood (2016). Impacts of Recent Drought and Warm Years on Water Resources and Electricity Supply Worldwide. Environmental Research Letters 11 (12). http://stacks.iop.org/1748-9326/11/i=12/a=124021?key=crossref.fe8bf630221dcb9684ebf68 a1a51870c.
Wake, C. and J. Bryant (2018). Capacity and Complemen-tarity in the Rohingya Response in Bangladesh. Over-seas Development Institute. https://www.odi.org/sites/odi.org.uk/files/resource-documents/12554.pdf.
Wallemacq, P., R. Below and D. McLean (2018). Economic Losses, Poverty & Disasters: 1998-2017. UNISDR and Centre for Research on the Epidemiology of Disasters. https://www.unisdr.org/we/inform/publications/61119.
Walsh, B.J. and S. Hallegatte (2019). Measuring Natural Risks in the Philippines: Socioeconomic Resilience and Wellbeing Losses. Policy Research Working Paper WPS 8723. The World Bank. http://documents.worldbank.org/curated/en/482401548966120315/Measur ing - Natural - R isks - in - the - Phi l ippines -Socioeconomic-Resilience-and-Wellbeing-Losses.
Watson, C., A. Caravani, T. Mitchell, J. Kellett and K. Peters (2015). Financing for Reducing Disaster Risk, 10 Things to Know. Overseas Development Institute and UNDP. https://www.odi.org/sites/odi.org.uk/files/odi-assets/publications-opinion-files/9480.pdf.
Watts, N., W.N. Adger, P. Agnolucci, J. Blackstock, P. Byass, W. Cai, S. Chaytor, et al. (2015). Health and Climate Change: Policy Responses to Protect Public Health. The Lancet 386 (10006). https://linkinghub.elsevier.com/retrieve/pii/S0140673615608546.
Wei, B., G.-W. Su, W.-H. Qi, L. Sun, Y. Wu and Y.-F. Jin (2017). The Livelihood Vulnerability of Rural Household in The Earthquake-Stricken Area of Ning’er, Yunnan Province. Seismology and Geology 39. https://doi.org/10.3969/j.issn.0253-4967.2017.01.012.
Wetlands International (2014). Kinaite Catchment. Environmental Risk Assessment and Ecosystem Mapping Protracted Crisis Horn of Africa (PCHA) – South Sudan. Acacia Water. https://www.wetlands.org/publications/environmental-risk-assessment-e c osys te m - ma p pin g - so u th - su da ns - k ina i te -catchment/.
(2019). UNFCCC COP24: Action on Wetlands to Adhere to Paris Agreement Goals. https://www.wetlands.org/event/agenda-unfccc -wetlands- climate-resilience/.
Whitmee, S., A. Haines, C. Beyrer, F. Boltz, A.G. Capon, B. Ferreira de Souza Dias, A. Ezeh, et al. (2015). Safeguarding Human Health in the Anthropocene Epoch: Report of The Rockefeller Foundation–Lancet Commission on Planetary Health. The Lancet 386 (10007). ht tps://linkinghub.elsevier.com/ retrieve/pii/S0140673615609011.
WHO (2010). Pandemic (H1N1) 2009. Emergencies Preparedness, Response. http://www.who.int/csr/disease/swineflu/en/.
(2014). World Health Statistics 2014. https://apps.who.int/iris/bitstream/handle/10665/112738/9789240692671_eng.pdf?sequence=1.
(2015). Global Action Plan on Antimicrobial Resistance. http://www.wpro.who.int/entity/drug_resistance/resources/global_action_plan_eng.pdf.
(2016). International Health Regulations (2005). Third edition.
(2 0 17 ) . P l a g u e O u t b r e a k M a d a g a s c a r. External Situation Report 14. http://apps.who.i n t / i r i s / b i t s t r e a m / h a n d l e / 10 6 6 5 / 2 5 9 5 5 6 /Ex-PlagueMadagascar04122017.pdf;jsessionid=DC39FA07B78DAC951A4D35E54D879158?sequence=1.
(2018a). Chemical Releases Caused by Natural Hazard Events and Disasters: Information for Public Health Authorities. https://reliefweb.int/report/world/chemical-releases-caused-natural-hazard-events-and-disasters-information-public-health.
(2018b). Cholera Situation in Yemen, November 2018. ht tp://applications.emro.who.int/docs/EMROPub_2018_EN_20770.pdf?ua=1.
(2018c). Drinking-Water. https://www.who.int/news-room/fact-sheets/detail/drinking-water.
(2019). Zika Virus. https://www.who.int/news- room/fact-sheets/detail/zika-virus.
Wilhite, D., ed. (2005). Drought and Water Crises: Science, Technology, and Management Issues. CRC Press, Taylor & Francis.
Wilhite, D. (2014). National Drought Management Policy Guidelines: A Template for Action. Integrated Drought Management Programme Tools and Guidelines Series 1. WMO and GWP. https://library.wmo.int/pmb_ged/wmo_1164_en.pdf.
Wilhite, D. and R. Pulwarty (2017). Drought and Water Crises: Lessons Drawn, Some Lessons Learned, and the Road Ahead. In Drought and Water Crises: Integrating Science, Management and Policy, 2nd ed. CRC Press, Taylor & Francis.
Wilhite, D., M. Sivakumar and R. Pulwar ty (2014). Managing Drought Risk in a Changing Climate: The Role of National Drought Policy. Weather and Climate Extremes 3. ht tps:// l inkinghub.elsevier.com/ retrieve/pii/S2212094714000164.
cdlx References

Wilkinson, E., E. Comba, K. Peters, K. Peters and E. Comba (2014). Disaster Risk Governance: Unlocking Progress and Reducing Risk. Overseas Development Institute and UNDP. http://www.undp.org/content/undp/en/home/librarypage/crisis-prevention-and-recovery/disaster- risk-governance -unlocking-progress- and-reducing-risk.html.
Wilkinson, E., R. Steller and R. Bretton (2019). Making Effective Use of International and Transnational Policy Frameworks and National Risk Mitigation Instruments to Implement the Sendai Framework for Disaster Risk Reduction. GAR19 Contributing Paper, UNISDR.
Wilkinson, E., J. Twigg, L. Weingärtner and K. Peters (2017). Delivering Disaster Risk Reduction by 2030: Pathways to Progress. Overseas Development Institute. https://www.odi.org/sites/odi.org.uk/files/ resource-documents/11532.pdf.
Winsemius, H., L. Van Beek, B. Jongman, P. Ward and A. Bouwman (2013). A Framework for Global River Flood Risk Assessments. Hydrology and Earth System Sciences 17 (5). https://www.hydrol-earth-syst-sci.net/17/1871/2013/.
Winson, A.E.G., F. Costa, C.G. Newhall and G. Woo (2014). An Analysis of the Issuance of Volcanic Alert Levels during Volcanic Crises. Journal of Applied Volcanology 3 (1). https://doi.org/10.1186/s13617-014-0014-6.
Wisner, B., P. Blaikie, T. Cannon and I. Davis (1994). AT RISK: Natural Hazards, People’s Vulnerability and Disasters. Taylor & Francis. https://www.taylorfrancis.com/books/9780203428764.
WMO (2017). Multi -Hazard Early Warning Systems: A Checklist. ht tps://library.wmo.int/doc_num.php?explnum_id=4463.
(2018). Climate Risk and Early Warning Systems Initiative Expands its Coverage. https://public.wmo.int/en/media/news/climate-risk-and-early-warning-systems-initiative-expands-its-coverage.
Wong, J.C. (2018). Hospitals Face Critical Shortage of IV Bags Due to Puerto Rico Hurricane. The Guardian. ht tps://www.theguardian.com/us-news/2018/jan/10/hurricane-maria-puerto-rico-iv-bag-shortage-hospitals.
Wood, M., L. Allford, Z. Gyenes and M. Hailwood (2017). Technological Risks: Chemical Releases. In Science for Disaster Risk Management 2017: Knowing Better and Losing Less. EU.
Wood, M. and L. Fabbri (2019). Challenges and Opportu-nities in Assessing Global Performance in Reducing Chemical Accident Risk. International Journal of Disaster Risk Reduction.
World Bank (2012). Turn Down the Heat: Why a 4°C Warmer World Must Be Avoided. http://documents.worldbank.org/curated/en/865571468149107611/Turn-down-the-heat-why-a-4-C-warmer-world-must-be-avoided.
(2013). World Development Report 2014: Risk and Opportunity - Managing Risk for Development. The World Bank. https://doi.org/10.1596/978-0-8213- 9903-3.
(2016). 2014-2015 West Africa Ebola Crisis: Impact Update. http://pubdocs.worldbank.org/en/297531463677588074/Ebola-Economic-Impact-and-Lessons-Paper-short-version.pdf.
(2017). Evaluation of Resi l ience - Bui ld ing Operations. Operational Guidance Paper for Project Task Teams. Resilience Monitoring and Evaluation (ReM&E). http://documents.worldbank.org/curated/en/669941506093754016/pdf/119937-WP-PUBLIC-P155632-68P-ReMEEvaluationGuidanceFinal.pdf.
(2018). Procuring Infrastructure Public-Private Partnerships Report 2018: Assessing Government Capability to Prepare, Procure and Manage PPPs.
(2019a). GDP per Capita (Current US$). https://data.worldbank.org/indicator/NY.GDP.PCAP.CD? year_high_desc=true.
(2019b). IGAD - Building Disaster Resilience to Disasters through Risk Management and Climate Change Adaptation. http://projects.worldbank.org/P 154403?lang=en.
World Economic Forum (2018). The Global Risks Report 2018, 13th Edition. http://www3.weforum.org/docs/WEF_GRR18_Report.pdf.
World Wide Fund for Nature (2018). Living Planet Report 2018: Aiming Higher. https://www.connect4climate.org/publication/living-planet-report-2018-aiming- higher-wwf.
Yan, Z.Y., P.S. Spencer, Z.X. Li, Y.M. Liang, Y.F. Wang, C.Y. Wang and F.M. Li (2006). Lathyrus Sativus (Grass Pea) and its Neurotoxin ODAP. Phytochemistry 67 (2). https://linkinghub.elsevier.com/retrieve/pii/S0031942205005492.
Yamazaki , D., S. Kanae, H. Kim and T. Oki (2011). A Physically Based Description of Floodplain Inundation Dynamics in a Global River Routing Model: Floodplain Inundation Dynamics. Water Resources Research 47 (4). http://doi.wiley.com/10. 1029/2010WR009726.
Ye r e v a n D e c l a r a t i o n (2 0 18) . U N I S D R . h t t p s : //w w w . p r e v e n t i o n w e b . n e t / f i l e s / 5 7 6 6 8 _finalyerevandeclarationeng26.06.181.pdf.
Zaki, A.M., S. van Boheemen, T.M. Bestebroer, A.D.M.E. Osterhaus and R.A.M. Fouchier (2012). Isolation of a Novel Coronavirus from a Man with Pneumonia in Saudi Arabia. New England Journal of Medicine 367 (19). http://www.nejm.org/doi/abs/10.1056/NEJM oa1211721.
Zapata Martí, R. and B. Madrigal (2009). Economic Impact of Disasters: Evidence from DALA Assessments by ECLAC in Latin America and the Caribbean. Serie Estudios y Perspectivas 117. ECLAC Subregional Office. https://www.cepal.org/en/publications/4900-e c o no mic - im pac t - d isas te r s - ev id e n c e - da la -
cdlxi

assessments-eclac-latin-america-and.Zhang, H., G. Hegerl, S. Seneviratne, R. Stewart, F. Zwiers
and L. Alexander (2017). WCRP Grand Challenge: Understanding and Predicting Weather and Climate Extremes. World Climate Research Programme.
Zheng, F., S. Westra, M. Leonard and S. Sisson (2014). Modeling Dependence between Extreme Rainfall and Storm Surge to Estimate Coastal Flooding Risk. Water Resources Research 50 (3). http://doi.wiley.com/10.1002/2013WR014616.
Zscheischler, J., S. Westra, B. Hurk, S. Seneviratne, P. Ward, A. Pitman, A. AghaKouchak, et al. (2018). Future Climate Risk from Compound Events. https://doi.org/10.1038/s41558-018-0156-3.
cdlxii References

cdlxiii

Abassa (2012). Radiation Hotspot in Kashiwa. https://en.wikipedia.org/wiki/File:Radiation_hotspot_in_Kashiwa_02.JPG.
Abassi, United Nations photograph/Logan (2008). Haiti Woman Takes Refuge from Tropical Storm Hanna. https://www.unmultimedia.org/photo/index.jsp.
Adelekan, I .O. (2010). Vulnerability of Poor Urban Coastal Communities to Flooding in Lagos, Nigeria. Environment and Urbanization 22 (2). http://journals.sagepub.com/doi/10.1177/0956247810380141.
Alvarez, L. (2017). As Power Grid Splutters in Puerto Rico, Business Does Too. New York Times. https://www.nytimes.com/2017/11/15/us/puerto-rico-economy-jobs.html.
Barkenbus, J.N. (2010). Eco-Driving an Overlooked Climate Change Initiative. Energy Policy 38 (2). ht tps:// l ink inghub.e lsevier.com/retr ieve/pi i/S0301421509007484.
Boer, J., A. de Witt and H. Aiking (2016). Help the Climate, Change your Diet: A Cross-Sectional Study on How to Involve Consumers in a Transition to a Low-Carbon Society. Appetite 98. https://linkinghub.elsevier.com/retrieve/pii/S0195666315301100.
Brakenridge, G.R. and A.J. Kettner (2017). DFO Flood Event 4510. Edited by Dartmouth Flood Observatory. University of Colorado. 31 August. https://ucsusa.maps.arcgis.com/apps/MapJournal/index.html?appid=1e958eff5c3e45a983e52ad523c2ffdd#detail.
British Columbia Wildfire Service (2018). B.C. Wildfires Stretch Firefighters and Evacuation Centers. https://www.macleans.ca/news/canada/b-c-wildfires-stretch-firefighters-and-evacuation-centres.
Brockhausen/UNDP, Silke von (2015). UNDP’s Response to Cyclone Pam - Vanuatu. 27 March. https://www.flickr.com/photos/unitednationsdevelopmentprogramme /17051098639/in/photolist-rYq4zu-rYKkzi-rjcmYN-sfXzVp-sgczRT-sgKYDj-rYq4uj-sfRy9w-sg9H2g-rjcGfx-rYrb53-rWSqnF-seBPiC-rjoQmF-sdUw9Q-rYCmVu-sgS3MX-sfXzpz-sfXzDn-sdHnTo-rj1dSE-rjUDb5-rYraMQ-sf8Ba.
Brown, R.R., A. Deletic and T.H.F. Wong (2015). How to Catalyse Collaboration. INTERDISCIPLINARITY, Nature special issue 525. https://www.nature.com/
Box and figure sources
polopoly_fs/1.18343!/menu/main/topColumns/topLeftColumn/pdf/525315a.pdf.
Buck, S.T. (photographer) (2010). Tent City Vancouver - Reflection. 26 February. https://www.flickr.com/photos/sallybuck/6313310256/.
California Fire Service (2019). Incident Information. http://cdfdata.fire.ca.gov/incidents/.
Carnemark, C. (2016). Aerial View of Bhutan. http://secure.worldbank.org/photolibrary/servlet/main?contentMDK=90013037&simsearch=bhutan&piPK=50040281&startIndex=1&theSitePK=265652&pagePK=50040282&menuPK=148507&imgfilename=BT001S06.
Centre for Research on Epidemiology of Disasters (2018). EM-DAT The International Disasters Database. https://www.emdat.be/.
Conrad, V. (2018). Why so Many Medicines Are in Short Supply Months after Hurricane Maria. CBS News. https://www.cbsnews.com/news/why-so-many-medicines-arel- in-short-supply-after-hurricane-maria/.
Cotecchia, F., P. Lollino, C. Vitone, G. Pedone and O. Bottiglieri (2017). From Phenomenological to Geomechanical Approach to Landslide Hazard Analysis. European Journal of Environmental and Civil Engineering 20 (9). https://www.tandfonline.com/doi/full/10.1080/19648189.2014.968744.
Dogan, M. (2014). View of Mogadishu, Mogadishu is the Capital City of Somalia. 30 September. https://www.shutterstock.com/image-photo/mogadishu-somalia-sep-30-2014-view-1272752812?src=nNZks9ECKlMNkvTJrVMOvg-1-75.
Douglas, K. (2005). The Amazing Adaptability of the Human Species. 12 December. https://www.flickr.com/photos/good_day/72887727/in/photolist-7oFD3-7ryYW-7ryYX-7oJqQ-7oJqN-7oJqP-7oFD6-7oFD5-7oFD9-7oFD4-7oFD7.
EC (2019). Testing the Degree of Urbanisation at the Global Level: Country Summary of Honduras. https://ghsl.jrc.ec.europa.eu/documents/cfs01/V2/CFS_Honduras.pdf.
Eick, M., EU/ECHO (2012). Philippines: Providing Help Beyond the Headlines. 17 March. https://www.flickr.com/photos/69583224@N05/7020047887.
cdlxiv Box and figure sources
ESA (2010). Gulf of Mexico Oil Spill Seen from Space. 5 October. http://www.esa.int/spaceinimages/I mag es/2010/10/G u l f_ of_ M ex ic o _ o i l _ s p i l l _ seen_from_space.
ESA (2017). Tracking Aerosols from California’s Fires. 18 December. https://phys.org/news/2017-12-image-tracking-aerosols-california.html.
(2019). Iraq Flood. 1 February. http://www.esa.int/spaceinimages/Images/2019/02/Iraq_flood.
Frank, A.B., M. Goud Collins, M. Clegg, U. Dieckmann, V.A. Kremenyuk, A.V. Kryazhumskiy, J. Linnerooth-Bayer, et al. (2012). Security in the Age of Systemic Risk: Strategies, Tactics and Options for Dealing with Femtorisks and Beyond. International Institute for Applied Systems Analysis. http://pure.iiasa.ac.at/id/eprint/10264/.
Frank, A.B., M. Goud Collins, S.A. Levin, A.W. Lo, J. Ramo, U. Diekmann, V. Kremenyuk, et al. (2014). Dealing with Femtorisks in International Relations. Proceedings of the National Academy of Sciences 111.
Gaupp, F. (2019). International Institute for Applied Systems Analysis.
GEM (2018). Global Earthquake Model Foundation. For a World That is Resilient to Earthquakes. https://www.globalquakemodel.org/.
Gencer, E.A. and UNISDR (2017). Local Government Powers for Disaster Risk Reduction: A Study on Local-Level Authority and Capacity for Resilience. UNISDR. https://www.unisdr.org/campaign/resilientcities /assets/documents/guidelines/LG%20Powers%20for%20DRR_2017_Final_20170531.pdf.
HBPro (n.d.). A View of Maputo the Capital of Mozambique, Africa. ht tps://www.shutterstock.com/image-photo/view-maputo-capital-mozambique-africa-10 6 9 8 6 5 0 8 7 ? s r c = wA s v O G B i G 4 u x B E U 3 Fm bZnQ-1-4.
Helbing, D. (2013). Globally Networked Risks and How to Respond. Nature 497. https://www.nature.com/articles/nature12047.
IAEA (2006). Fundamental Safety Principles. Safety Fundamentals No. SF-1. https://www-pub.iaea.org/MTCD/Publications/PDF/Pub1273_web.pdf.
(2019). The Use of the International Nuclear and Radiological Event Scale (INES) for Event Communication.
IRGC (2018). Guidelines for the Governance of System Risks. www.irgc.org.
Jahn, M. (2015). Topological Map of Risk Through Time.Jamin, J.-Y. (2012). Traditional Shallow Well, Gumsalasa,
Ethiopia. Water Alternatives. 18 October. https://w w w.f l i c k r.c o m /p h o to s/wa te r_ a l te r na t i ve s /26552035448/.
Japan International Cooperation Agency (2017). One Against Disasters and Climate Risks: A Repository of Good Practices for Strengthening DRR and CCA Integration in ASEAN. https://pub.iges.or.jp/pub/one-against-disasters-and-climate-risks.
Krausmann, E., A. Necci and S. Girgin (2019). Dealing with Cascading Multi -Hazard Risks in National Risk Assessment: The Case of Natech Accidents. International Journal of Disaster Risk Reduction 35. https://doi.org/10.1016/j.ijdrr.2019.101072.
Le Minh, F. (photographer) (2007). Tsunami, Chile Iquique. 31 December. https://www.flickr.com/photos/16972775@N02/2149755771/in/photolist- 4gY4uF-7vYLf5-7vVne2-7b3qYW-7vYJAf-2a1v8RZ-6jTAdH-6vJfMJ-6jJU5W-6jBWBN-6jxL82-6vDZ4K-6jK37J - 6jJTtS - 6jBcdf-7vVngv- 6jxLk8 - 6jBc3q-6jTMAi-rZQzf-sMrxA-cW2b3A-agUa9w-aDDzXS-9T7cKB-cNjXXQ-7vUE6c-.
Lipponnen, A . (2018). Theewaterskloof Dam Near Cape Town in South Africa. 10 February. https://commons.wikimedia.org/wiki/File:Theewaterskloof_Dam_2018_02_10_(28425520089).jpg.
Maddiot, P. and C. Jimonet (2014). European Radiation Protection Course: Basics. EDP Sciences.
Masson-Delmotte, P., P. Zhai, H.O. Portner, D. Roberts, J. Skea, P.R. Shukla, A. Pirani, et al. (2015). Special Report: Global Warming of 1.5°. IPCC. https://www.ipcc.ch/sr15/.
NASA (2010). Night Lights from the ISS. 11 November. https://www.esa.int/spaceinimages/Images/2010/ 11/Night_lights_from_the_ISS.
NASA (2017). Smoke Spreads Across the U.S. and Canadian West. Image by Jeff Schmaltz. 2 August. https://earthobservatory.nasa.gov/images/90695/smoke-spreads-across-the-us-and-canadian-west.
NASA Earth Observatory (2017). Fire in Ventura County, California. Images by Joshua Stevens using modified Copernicus Sentinel data processed by ESA. 7 December. https://www.nasa.gov/image-feature/fire-in-ventura-county-california.
National Centers for Environmental Information National Oceanic and Atmospheric Administration (2019). Natural Hazards. https://www.ngdc.noaa.gov/nndc/struts/results?bt_0=&st_0=&type_8=EXACT&query_8=None+Selected&op_14=eq&v_14=&st_1=&bt_2=&st_2=&bt_1=&bt_10=&st_10=&ge_9=&le_9=&bt_3=&st_3=&type_19=EXACT&query_19=None+Selected&op_17=eq&v_17=&bt_20=&st_20=&bt_13=&st_13=&bt_16=&st_16=&bt_6=&st_6=&ge_21=&le_21=&bt_11=&st_11=&ge_22=&le_22=&d=7&t=101650&s=70.
Nussbaumer, S., Y. Schaub, C. Huggel and A. Waltz (2014). Risk Estimation for Future Glacier Lake Outburst Floods Based on Local Land-Use Changes. Natural Hazards and Earth System Sciences 14 (6). https://www.nat-hazards-earth-syst-sci.net/14/1611/2014/.
Okude, A.S. and I.A. Ademiluyi (2006). Implications of the Changing Pattern of Land Cover of the Lagos Costal Area of Nigeria. American-Eurasian Journal of Scientific Research 1 (1). https://www.researchgate.net/publication/268206178_Implications_of_the_Changing_Pattern_of_Landcover_of_the_Lagos_Coastal_Area_of_Nigeria.
cdlxv

Olgun, M. (2017). People who Carry Water Rest Under a Tree in the Refugee Camp - Baidoa, Somalia. March. ht tps://www.shut terstock.com/image -photo/ baidoa-somalia-march-2017-people-who-1100529 911?src=ksFVpPtZuvAe9yYJOTXSSg-1-17.
Padao, I.C. (2014). Climate and Disaster Risk Assessment (CDRA) Overview (Presentation). Housing and Land Use Regulatory Board. https://designingresilience.ph/wp-content/uploads/CDRA-Overview.pdf.
Patnaik , T./UNISDR (2018). Ongoing Infrastructure Development in Egypt.
(2018). Clean up Work in Kisumu, Kenya. (2019). Making Cities Resilient in Action in
Cilicap. PDRF and ADPC (2016). Impact of Super Typhoon Meranti
in the Province of Batanes. (2018). Presentation during the Train for Business
Resilience Course. Ramani Huria (2016). Participatory Mapping to Establish
Historical Flood Extent at the Tandale Ward Executive Office, Dar es Salaam in April 2006. https://creative commons.org/licenses/by-sa/2.0/.
(2018). Flooding near Jangwani Bridge, Dar es Salaam, on 15 April 2018. https://creativecommons.org/licenses/by-sa/2.0/.
RM (photographer) (2019). Old Mosul of Iraq (Nineveh), Mosques, Houses and Streets that Were Ruined During the War in Mosil. People Live in Worrying Houses under Debris. 22 March. https://www.shutterstock.com/image-photo/old-mosul-iraq-nineveh-mosques-houses-1369965374?src=dG3UzUlAbNaysJOFwPuXOw-1-25.
Rush, D., G. Bankoff, G. Spinardi, L. Hirst, J. Jordan, J. Twigg, R. Walls, et al. (2019). Fire Risk Reduction in an Urbanizing World. GAR19 Contributing Paper, UNISDR.
Sendado Federal Rogério Alves/TV Senado (2015). Bento Rodr igues , Mar iana , Minas Gerais . 19 Nove mbe r. h t tps: //w w w.f l ick r.com /photos/ ag e n c iase nad o/2 273 075 3698/ in /p h oto l is t - ACD49w-eavPLr-eavPQv-eavPRi-eavPKR-eaBugE-mHZdDw-B5SVCF-C3hMrp-B5MgPW-BZZbJW-B S G q N j - B 6 3 mW P - B A j N b h - B V 1j a k - C 3 s e w n -BZZbho-BtWoPr-BSRT9Y-BV1jvv-B8euyh-BSRTb1- AvsQGQ-BtWoQD-B63n6B-BAjMSm-2fte.
Tauheed, M. (2018). Rohingya Camps in Cox’s Bazar. 6 July. https://www.flickr.com/photos/12342805@N00/44371087742/in/album-72157697677028572/.
Tonga (2018). Joint National Action Plan II on Climate Change and Disaster Risk Management (JNAP 2) 2018-2028. https://www.preventionweb.net/files/60141_tongajnap2final.pdf.
UNAIDS (2019). http://aidsinfo.unaids.org/.UNDP (2019). Tunisia Country Case Study for GAR19.UNDP Colombia (2013). Adaptation Fund Project Site
Visit to Colombia. 12 February. https://www.flickr.com/photos/adaptation-fund/45409853221/in/
photolist-2cbHniP-2aMSAAc-2cbHmUx-Nqtz7x-2aMSzKK-NqtyRn-2aMSyCp-2aMSyzD-2aMSxWV-2c7aSEo-2b5Eg2d-2b5EfGq-2c7aS2u-29qavfU-2b5Ecjy-29qastG-2b5EbDq-2b5EbeC-29qarSm-29qarGb-2b5EaVw-29qarus-2b5EaFo-29.
UN Environment (2016). Radiation Effects and Sources: What is Radiation? What Does Radiation Do to Us? Where Does Radiation Come From? http://www.un-ilibrary.org/public -health/radiation-effects- and-sources_b1749f17-en.
UNFCCC (2017). Opportunities and Options for Integrating Climate Change Adaptation with the Sustainable Development Goals and the Sendai Framework for Disaster Risk Reduction 2015-2030. http://unfccc.int/files/adaptation/groups_committees/adaptation_committee/application/pdf/techpaper_adaptation.pdf.
UNISDR (2017). MSSP Antigua & Barbuda. 5 December. https://www.flickr.com/photos/isdr/24981697968/in/album-72157688073455612/.
(2018). AFARP_Media Winners. 13 October. https://www.flickr.com/photos/isdr/45574196054/in/album-72157674470714537/.
(2018). AMCDRR 2018. 3 July. https://www.flickr.com/photos/isdr/45065946104/in/album-72157701 864104241/.
(2018). Honiara Beach Debris. 1 March. https://www.flickr.com/photos/isdr/31906948228/in/album-72157700103231372/.
(2019). DesInventar. https://www.desinventar.net/DesInventar/inv/resultstab.jsp.
UNISDR, F. Pischke and R. Stefanski (2018). Building Drought Resil ience to Reduce Pover ty. http://w w w.droughtmanagement . info/wp - content /uploads/2017/05/12a_Pischke.pdf.
United Nations Population Fund (2011). Afghanistan Census: Enumerator at Work in Bamyan District. 10 September. https://www.flickr.com/photos/unfpa/13610982294/.
United Nations Programme on HIV/AIDS (2018). Miles to Go: Closing Gaps, Breaking Barriers, Righting Injustices. http://www.unaids.org/sites/default/files/media_asset/miles-to-go_en.pdf.
Vila, R. (2015). The End of a Fishing Day. Tanji Shore - The Gambia. October. https://www.flickr.com/photos/rvilav/22589499174/in/photolist-Aqa66G.
Vogt, J.V., G. Naumann, D. Masante, J. Spinoni, C. Cammalleri , W. Erian, F. Pischke, et al. (2018). Drought Risk Assessment and Management: A Conceptual Framework. Publications Office of the EU. https://ec.europa.eu/jrc/en/publication/drought-risk-assessment-and-management.
von Bertalanffy, L. (1968). General System Theory: Foundations, Development, Applications. George Braziller.
cdlxvi Box and figure sources
WHO (2018a). Managing Epidemics: Key Facts about Major Deadly Diseases. 2 May. https://t.co/rSlugdEczj.
(2018b). Zika Virus. 20 July. https://www.who.int/news-room/fact-sheets/detail/zika-virus.
(2019). https://www.who.int/gho/hiv/en/.Wilkinson, M.D., M. Dumontier and B. Mons (2019).
The FAIR Guiding Principles for Scientific Data Management and Stewardship. Scientific Data 3. https://doi.org/10.1038/sdata.2016.18.
Wong, J.C. (2018). Hospitals Face Critical Shortage of IV Bags Due to Puerto Rico Hurricane. The Guardian. https://www.theguardian.com/us-news/2018/jan/10/hurricane-maria-puerto-rico-iv-bag-shortage-hospitals.
Wood, M. and L. Fabbri (2019). Challenges and Opportu-nities in Assessing Global Performance in Reduc-ing Chemical Accident Risk. International Journal of Disaster Risk Reduction.
World Bank (2011). Flooding in Jakarta. 17 January. https://www.flickr.com/photos/worldbank/8775283782/in/album-72157634086023459/.
(2016). 2014-2015 West Africa Ebola Crisis: Impact Update. World Bank. ht tp://pubdocs.worldbank.org/en/297531463677588074/Ebola-Economic - Impact- and - Lessons - Paper - shor t-version.pdf.
World Economic Forum (2016). Understanding Systemic Cyber Risk.
World Nuclear Association (2018). Nuclear Radiation and Health Effects. June. http://www.world-nuclear.org/information-library/safety-and-security/radiation-and-health/nuclear-radiation-and-health-effects.aspx .
Zaian (2018). A Portion of Theewaterskloof Dam, Close to Empty in 2018, Showing Tree Stumps and Sand Usually Submerged by the Water of the Dam. 11 March. https://commons.wikimedia.org/w/index.php?curid=67250848.
cdlxvii


Related Documents