IDB.41/3-PBC.29/3 United Nations Industrial Development Organization Distr.: General 10 April 2013 Original: English V.13-82483 (E) 070513 080513 *1382483* For reasons of economy, this document has been printed in a limited number. Delegates are kindly requested to bring their copies of documents to meetings. Industrial Development Board Forty-first session Vienna, 24-27 June 2013 Item 4 (a) of the provisional agenda Report of the External Auditor for 2012 Programme and Budget Committee Twenty-ninth session Vienna, 22-24 May 2013 Item 3 of the provisional agenda Report of the External Auditor for 2012 Report of the External Auditor on the accounts of the United Nations Industrial Development Organization for the financial year 1 January to 31 December 2012 * Contents Page LETTER OF TRANSMITTAL .................................................... 4 ACRONYMS/ABBREVIATIONS ................................................. 5 I. INTRODUCTION .............................................................. 7 II. AUDIT FINDINGS AND RECOMMENDATIONS ................................... 8 Internal Controls ............................................................... 8 Presentation of Financial Statements ............................................... 8 Employee Benefits Liabilities .................................................... 10 IPSAS Implementation .......................................................... 11 Status of Budget Utilization ...................................................... 11 Contributions from the Member States ............................................. 12 __________________ * The report of the External Auditor is reproduced in the form in which it was received by the Secretariat. The present document has not been edited.

Welcome message from author
This document is posted to help you gain knowledge. Please leave a comment to let me know what you think about it! Share it to your friends and learn new things together.
Transcript
IDB.41/3-PBC.29/3
United Nations Industrial Development Organization
Distr.: General 10 April 2013 Original: English
V.13-82483 (E) 070513 080513
*1382483*
For reasons of economy, this document has been printed in a limited number. Delegates are kindly requested to bring their copies of documents to meetings.
Industrial Development Board Forty-first session Vienna, 24-27 June 2013 Item 4 (a) of the provisional agenda Report of the External Auditor for 2012
Programme and Budget Committee Twenty-ninth session Vienna, 22-24 May 2013 Item 3 of the provisional agenda Report of the External Auditor for 2012
Report of the External Auditor on the accounts of the United Nations Industrial Development Organization for the financial year 1 January to 31 December 2012*
Contents Page
LETTER OF TRANSMITTAL . . . . . . . . . . . . . . . . . . . . . . . . . . . . . . . . . . . . . . . . . . . . . . . . . . . . 4
ACRONYMS/ABBREVIATIONS . . . . . . . . . . . . . . . . . . . . . . . . . . . . . . . . . . . . . . . . . . . . . . . . . 5
I. INTRODUCTION . . . . . . . . . . . . . . . . . . . . . . . . . . . . . . . . . . . . . . . . . . . . . . . . . . . . . . . . . . . . . . 7
II. AUDIT FINDINGS AND RECOMMENDATIONS . . . . . . . . . . . . . . . . . . . . . . . . . . . . . . . . . . . 8
Internal Controls . . . . . . . . . . . . . . . . . . . . . . . . . . . . . . . . . . . . . . . . . . . . . . . . . . . . . . . . . . . . . . . 8
Presentation of Financial Statements . . . . . . . . . . . . . . . . . . . . . . . . . . . . . . . . . . . . . . . . . . . . . . . 8
Employee Benefits Liabilities . . . . . . . . . . . . . . . . . . . . . . . . . . . . . . . . . . . . . . . . . . . . . . . . . . . . 10
IPSAS Implementation . . . . . . . . . . . . . . . . . . . . . . . . . . . . . . . . . . . . . . . . . . . . . . . . . . . . . . . . . . 11
Status of Budget Utilization . . . . . . . . . . . . . . . . . . . . . . . . . . . . . . . . . . . . . . . . . . . . . . . . . . . . . . 11
Contributions from the Member States . . . . . . . . . . . . . . . . . . . . . . . . . . . . . . . . . . . . . . . . . . . . . 12
__________________
* The report of the External Auditor is reproduced in the form in which it was received by the Secretariat. The present document has not been edited.
2 V.13-82483
IDB.41/3 PBC.29/3
Verification of Amounts Due to the Member States . . . . . . . . . . . . . . . . . . . . . . . . . . . . . . . . . . . 13
HRM Function . . . . . . . . . . . . . . . . . . . . . . . . . . . . . . . . . . . . . . . . . . . . . . . . . . . . . . . . . . . . . . . . . 14
SAP Implementation . . . . . . . . . . . . . . . . . . . . . . . . . . . . . . . . . . . . . . . . . . . . . . . . . . . . . . . . . . . . 14
UNIDO Emergency Preparedness . . . . . . . . . . . . . . . . . . . . . . . . . . . . . . . . . . . . . . . . . . . . . . . . . 17
Project and Portfolio Management. . . . . . . . . . . . . . . . . . . . . . . . . . . . . . . . . . . . . . . . . . . . . . . . . 20
Procurement . . . . . . . . . . . . . . . . . . . . . . . . . . . . . . . . . . . . . . . . . . . . . . . . . . . . . . . . . . . . . . . . . . . 21
Operations in the Field . . . . . . . . . . . . . . . . . . . . . . . . . . . . . . . . . . . . . . . . . . . . . . . . . . . . . . . . . . 23
Internal Oversight Services (IOS) . . . . . . . . . . . . . . . . . . . . . . . . . . . . . . . . . . . . . . . . . . . . . . . . . 24
Verification of Physical Assets . . . . . . . . . . . . . . . . . . . . . . . . . . . . . . . . . . . . . . . . . . . . . . . . . . . . 26
Fraud and Cash Write-Offs . . . . . . . . . . . . . . . . . . . . . . . . . . . . . . . . . . . . . . . . . . . . . . . . . . . . . . . 26
Ex-Gratia Payments . . . . . . . . . . . . . . . . . . . . . . . . . . . . . . . . . . . . . . . . . . . . . . . . . . . . . . . . . . . . 26
Compliance of the External Audit Report for the Year 2011 . . . . . . . . . . . . . . . . . . . . . . . . . . . . 26
Annexes
A Details of Projects without Terminal Reports . . . . . . . . . . . . . . . . . . . . . . . . . . . . . . . . . . . . . . . . 27
B Details of Project Revisions without Progress Reports . . . . . . . . . . . . . . . . . . . . . . . . . . . . . . . . 28
C Follow-Up of the Recommendations Made in the Previous External Audit Reports . . . . . . . . . 30
I. FINANCIAL STATEMENTS FOR THE YEAR ENDED 31 DECEMBER 2012 . . . . . . . . . . . 33
Report by the Director General . . . . . . . . . . . . . . . . . . . . . . . . . . . . . . . . . . . . . . . . . . . . . . . . . . . 33
Major segments and joint venture consolidation chart for the year 2012 . . . . . . . . . . . . . . . . . . 37
Responsibility for financial statements and certification . . . . . . . . . . . . . . . . . . . . . . . . . . . . . . . 38
Statement 1: Statement of financial position as at 31 December 2012 . . . . . . . . . . . . . . . . . . . . 39
Statement 2: Statement of financial performance for year ended 31 December 2012 . . . . . . . . 40
Statement 3: Statement of changes in net assets for year ended 31 December 2012 . . . . . . . . . 41
Statement 4: Cash flow statement for year ended 31 December 2012 . . . . . . . . . . . . . . . . . . . . 42
Statement 5: Statement of comparison of budget and actual amounts for year ended 31 December 2012 . . . . . . . . . . . . . . . . . . . . . . . . . . . . . . . . . . . . . . . . . . . . . . . . . . . . . . . . . . . . . 43
Notes to the financial statements . . . . . . . . . . . . . . . . . . . . . . . . . . . . . . . . . . . . . . . . . . . . . . . . . . 44
II. ANNEXES PRESENTED IN ACCORDANCE WITH UNITED NATIONS SYSTEM ACCOUNTING STANDARDS FOR THE YEAR ENDED 31 DECEMBER 2012 (UNAUDITED) . . . . . . . . . . . . . . . . . . . . . . . . . . . . . . . . . . . . . . . . . . . . . . . . . . . . . . . . . . . . . . . . 82
Annex I (a) General Fund: Status of appropriations by major object of expenditure for the year 2012 as at 31 December 2012 . . . . . . . . . . . . . . . . . . . . . . . . . . . . . . . . . . . . 83
V.13-82483 3
IDB.41/3PBC.29/3
Annex I (b) General Fund: Status of appropriations by major programme for the year 2012 as at 31 December 2012 . . . . . . . . . . . . . . . . . . . . . . . . . . . . . . . . . . . . . . . . . . . . . 84
Annex I (c) Operational Budget: Status of appropriations by major object of expenditure for year 2012 as at 31 December 2012 . . . . . . . . . . . . . . . . . . . . . . . . . . . . . . . . . 85
Annex I (d) Operational Budget: Status of appropriations by major programme for the year 2012 as at 31 December 2012 . . . . . . . . . . . . . . . . . . . . . . . . . . . . . . . . . . . . 86
Annex I (e) Status of assessed contributions to the regular budget (in euros) as at 31 December 2012 . . . . . . . . . . . . . . . . . . . . . . . . . . . . . . . . . . . . . . . . . . . . . . . . . 87
Annex I (f) Status of advances to the Working Capital Fund as at 31 December 2012 . . . . 94
Annex II (a) Summary of transactions on sub-accounts of the Industrial Development Fund for the year as at 31 December 2012 — euro-based . . . . . . . . . . . . . . . . . . . . . . 99
Annex II (b) Summary of transactions on sub-accounts of the Industrial Development Fund for the year as at 31 December 2012 — dollar-based . . . . . . . . . . . . . . . . . . . . . 100
Annex III (a) Summary of technical cooperation activities financed by trust funds for the year as at 31 December 2012 — euro-based . . . . . . . . . . . . . . . . . . . . . . . . . . . . 102
Annex III (b) Summary of technical cooperation activities financed by trust funds for the year as at 31 December 2012 — dollar-based . . . . . . . . . . . . . . . . . . . . . . . . . . . 104
4 V.13-82483
IDB.41/3 PBC.29/3
Office of the Auditor-General of Pakistan
Constitution Avenue Islamabad
No. 49-IR/UNIDO/C-XXI
Dated: 25 April, 2013
The President of the Industrial Development Board United Nations Industrial Development Organization Vienna International Centre P.O. Box 300 A-1400 Vienna Austria
Excellency,
I have the honour to present to the 41st session of the Industrial Development Board, through the 29th session of the Programme and Budget Committee, my report and opinion on the Financial Statements of the United Nations Industrial Development Organization for the year ended 31 December 2012.
In transmitting my report I wish to advise that in accordance with the United Nations Industrial Development Organization’s Financial Regulations, I have given the Director General the opportunity to comment on my report. The response of the Director General has appropriately been reflected in my report.
Yours sincerely,
[Signed]
(Muhammad Akhtar Buland Rana)
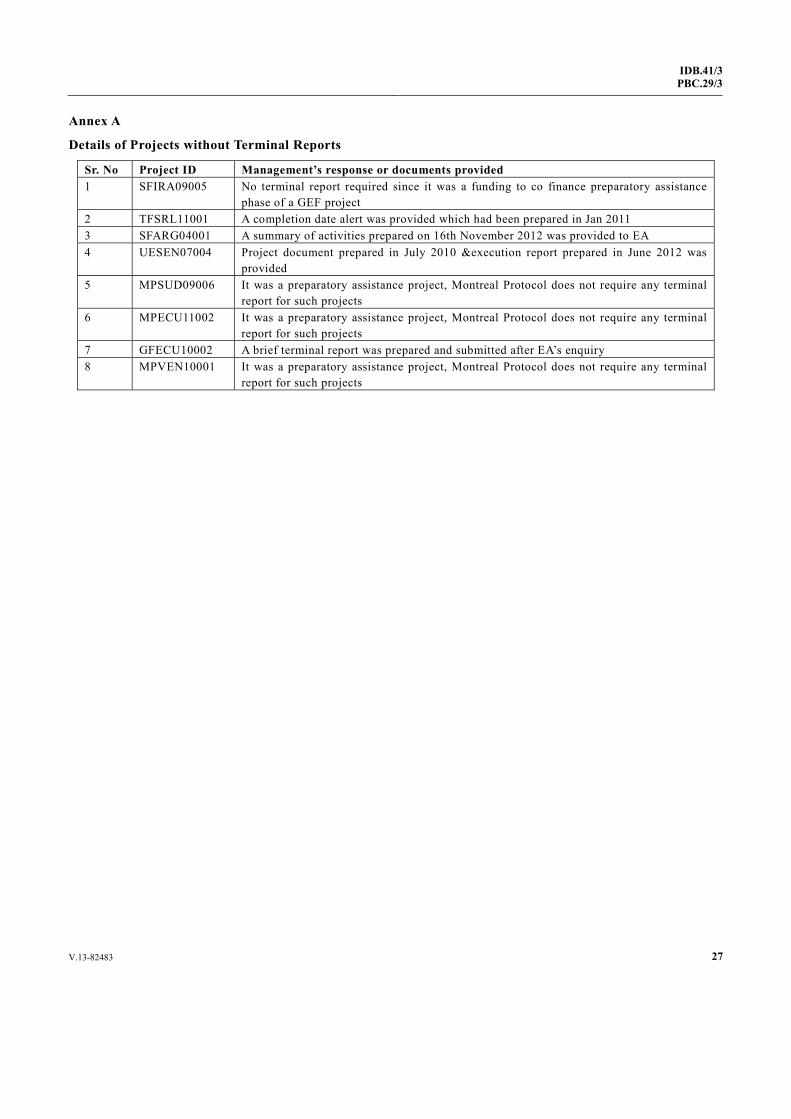
V.13-82483 5
IDB.41/3PBC.29/3
ACRONYMS/ABBREVIATIONS
AG Advisory Group AMC Programme Approval and Monitoring Committee ASP Austria Security Plan BCP Business Continuity Planning BMS Buildings Management Services BPR Business Process Re-engineering CMI Change Management Initiative CMP Crisis Management Plan COG Culture Operational Group DG Director General DI Declaration of Interest ECM Enterprise Content Management ERM Enterprise Risk Management ERP Enterprise Resource Planning EVA Evaluation Group FD Financial Disclosure FPCS Financial Performance Control System GC General Conference GEF Global Environment Facility HRM Human Resource Management HRMF Human Resource Management Framework IAEA International Atomic Energy Agency IAG Internal Audit Group IAS International Accounting Standard ICM Information and Communications Management ICT Information and Communications Technology IDB Industrial Development Board IIA Institute of Internal Auditors ILOAT Administrative Tribunal of International Labour Organization INTOSAI International Organization of Supreme Audit Institutions IOS Office of Internal Oversight Services IPPF International Professional Practices Framework IPSAS International Public Sector Accounting Standards ISA International Standards on Auditing ISMS Information Security Management System ISSAI International Standards for Supreme Audit Institutions JAB Joint Appeals Board JIU Joint Inspection Unit
6 V.13-82483
IDB.41/3 PBC.29/3
KMC Knowledge Management and Collaboration LDC Least Developed Countries MD Managing Director MRRF Common Funds for Major Repairs and Replacements MTPF Medium-Term Programme Framework MRS Management Response Sheet NBRP New Business Review Panel OCOR Office for Change and Organizational Renewal OMD Office of the Managing Director OSL Bureau for Organizational Strategy and Learning OSS Operational Support Services PAC Programme Appraisal Committee PAD Project Allotment Document PCOR Programme for Change and Organizational Renewal PMICS Performance Management and Inventory Control System PPE Property, Plant and Equipment PPM Portfolio and Project Management PSM Programme Support and General Management RBM Results-Based Management RFO Regional and Field Operations Branch SOP Statement of Position STC Screening and Technical Review Committee TC Technical Cooperation ULO Un-liquidated Obligation UNGM United Nations Global Marketplace UNODC United Nations Office on Drugs and Crime UNIDO United Nations Industrial Development Organization UNOV United Nations Office in Vienna UNSAS United Nations System Accounting Standards UNSSS United Nations Security and Safety Section UR UNIDO Representative VBO Vienna-Based Organisations VIC Vienna International Centre VPN Virtual Private Network
V.13-82483 7
IDB.41/3PBC.29/3
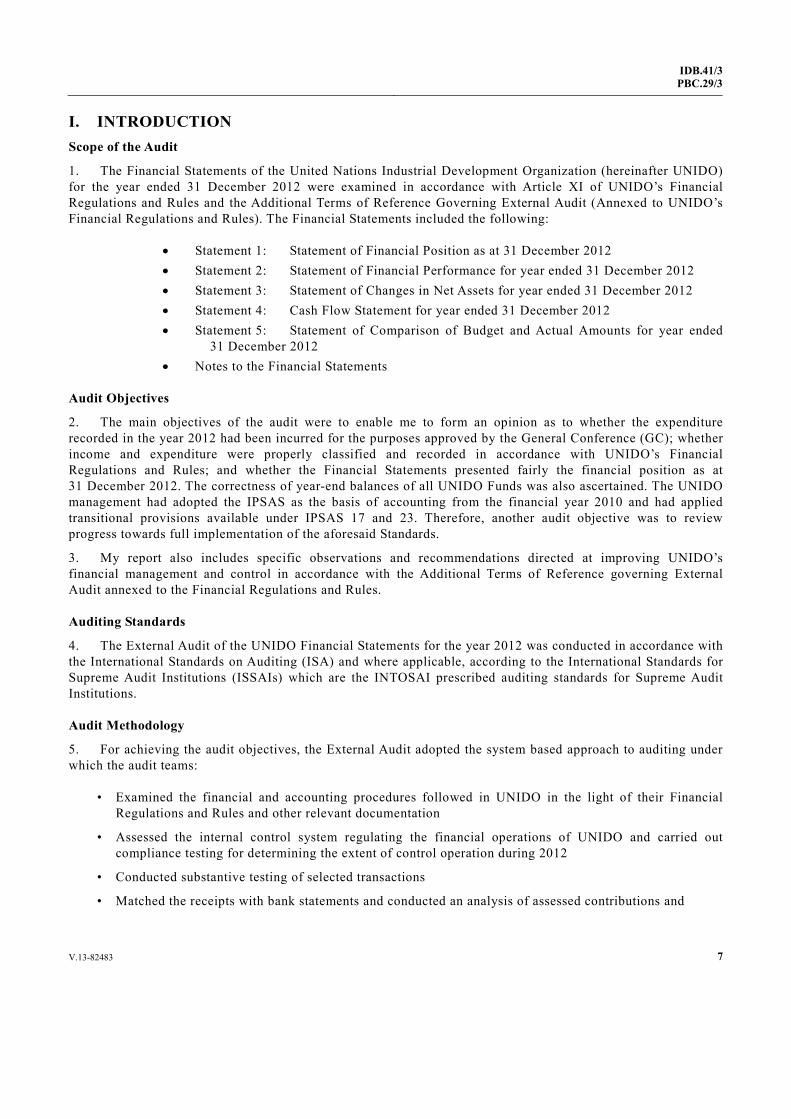
I. INTRODUCTION
Scope of the Audit
1. The Financial Statements of the United Nations Industrial Development Organization (hereinafter UNIDO) for the year ended 31 December 2012 were examined in accordance with Article XI of UNIDO’s Financial Regulations and Rules and the Additional Terms of Reference Governing External Audit (Annexed to UNIDO’s Financial Regulations and Rules). The Financial Statements included the following:
• Statement 1: Statement of Financial Position as at 31 December 2012 • Statement 2: Statement of Financial Performance for year ended 31 December 2012 • Statement 3: Statement of Changes in Net Assets for year ended 31 December 2012 • Statement 4: Cash Flow Statement for year ended 31 December 2012 • Statement 5: Statement of Comparison of Budget and Actual Amounts for year ended
31 December 2012 • Notes to the Financial Statements
Audit Objectives
2. The main objectives of the audit were to enable me to form an opinion as to whether the expenditure recorded in the year 2012 had been incurred for the purposes approved by the General Conference (GC); whether income and expenditure were properly classified and recorded in accordance with UNIDO’s Financial Regulations and Rules; and whether the Financial Statements presented fairly the financial position as at 31 December 2012. The correctness of year-end balances of all UNIDO Funds was also ascertained. The UNIDO management had adopted the IPSAS as the basis of accounting from the financial year 2010 and had applied transitional provisions available under IPSAS 17 and 23. Therefore, another audit objective was to review progress towards full implementation of the aforesaid Standards.
3. My report also includes specific observations and recommendations directed at improving UNIDO’s financial management and control in accordance with the Additional Terms of Reference governing External Audit annexed to the Financial Regulations and Rules.
Auditing Standards
4. The External Audit of the UNIDO Financial Statements for the year 2012 was conducted in accordance with the International Standards on Auditing (ISA) and where applicable, according to the International Standards for Supreme Audit Institutions (ISSAIs) which are the INTOSAI prescribed auditing standards for Supreme Audit Institutions.
Audit Methodology
5. For achieving the audit objectives, the External Audit adopted the system based approach to auditing under which the audit teams:
• Examined the financial and accounting procedures followed in UNIDO in the light of their Financial Regulations and Rules and other relevant documentation
• Assessed the internal control system regulating the financial operations of UNIDO and carried out compliance testing for determining the extent of control operation during 2012
• Conducted substantive testing of selected transactions
• Matched the receipts with bank statements and conducted an analysis of assessed contributions and

8 V.13-82483
IDB.41/3 PBC.29/3
• Carried out the analytical review of a number of contracts and substantial transactions related to creation of assets and liabilities.
6. My audit included a substantive examination of the year-end balances in UNIDO Funds.
7. The audit was conducted by various audit teams including the teams that carried out compliance with authority audits of UNIDO field offices.
Reporting
8. My audit teams held discussions with the relevant UNIDO staff in the Headquarters and field offices. The audit teams interacted with the staff nominated as focal persons for audit and issued queries to the concerned branches. The audit findings take into account the management’s viewpoint as communicated to the audit teams. In accordance with the normal practice, my audit teams also provided UNIDO with a Management Letter, setting out the detailed findings arising from their examination at the UNIDO Headquarters and the field offices. UNIDO’s response to the Management Letter has been appropriately reflected in my report. I have noted UNIDO’s response to the audit findings regarding the operations in the field offices of UNIDO for subsequent monitoring.
9. Observations on matters, which in my opinion, should be brought to the attention of the Member States, are set out in the following paragraphs of this report.
Overall Results
10. My report includes a number of observations and recommendations. My audit teams recorded additional findings in the Management Letter to the management. None of these matters materially affected my audit opinion on the UNIDO’s Financial Statements; and, notwithstanding the observations in this report, my audit revealed no weaknesses or errors that I considered material to the accuracy, completeness and validity of the Financial Statements as a whole. Accordingly, I have placed an unqualified opinion on UNIDO’s Financial Statements for the period ended 31 December 2012.
II. AUDIT FINDINGS AND RECOMMENDATIONS
Internal Controls
11. As a result of the compliance testing of the internal controls, the External Audit concluded that a reasonably designed internal control system was in place in UNIDO to ensure completeness, occurrence, measurement, regularity and disclosure in the Financial Statements for the year 2012.
Presentation of Financial Statements
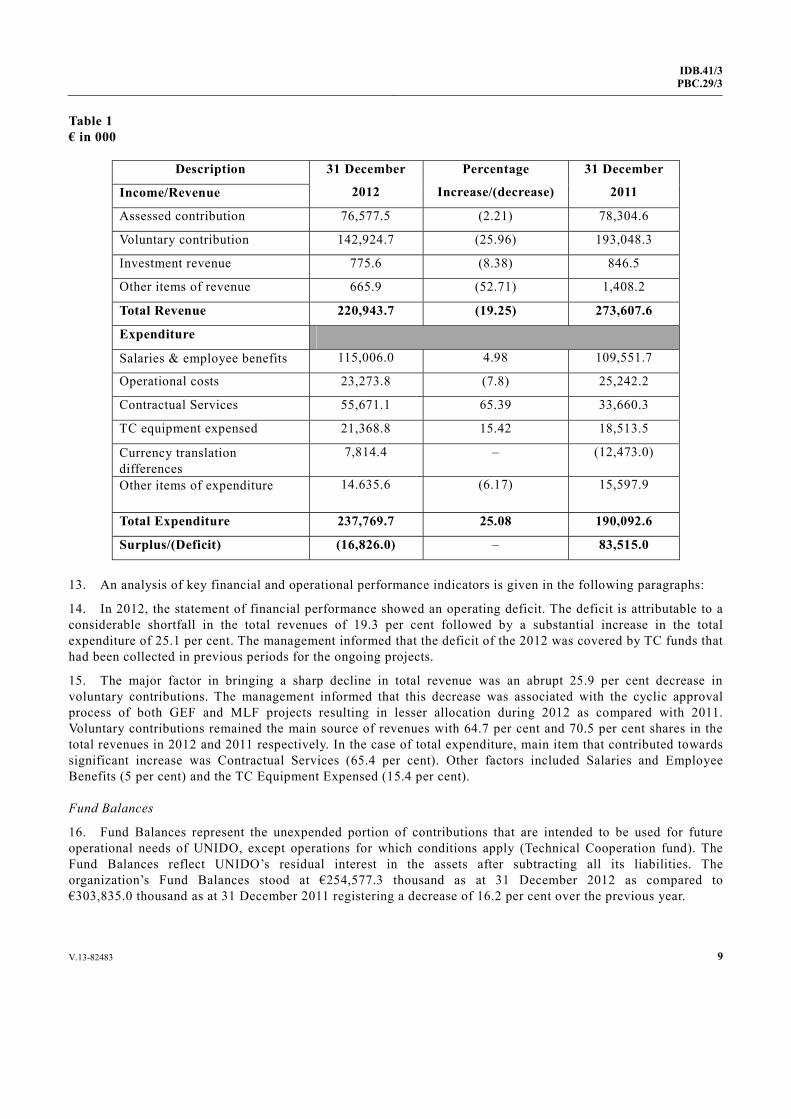
12. The year 2012 was the third year after the implementation of International Public Sector Accounting Standards (IPSAS) in 2010. Accordingly, the Financial Statements for 2012 were also presented on the IPSAS format and provided comparative figures for the two years. The working results for UNIDO are given in the following table:
V.13-82483 9
IDB.41/3PBC.29/3
Table 1 € in 000
Description 31 December
2012
Percentage
Increase/(decrease)
31 December
2011 Income/Revenue
Assessed contribution 76,577.5 (2.21) 78,304.6
Voluntary contribution 142,924.7 (25.96) 193,048.3
Investment revenue 775.6 (8.38) 846.5
Other items of revenue 665.9 (52.71) 1,408.2
Total Revenue 220,943.7 (19.25) 273,607.6
Expenditure
Salaries & employee benefits 115,006.0 4.98 109,551.7
Operational costs 23,273.8 (7.8) 25,242.2
Contractual Services 55,671.1 65.39 33,660.3
TC equipment expensed 21,368.8 15.42 18,513.5
Currency translation differences
7,814.4 – (12,473.0)
Other items of expenditure 14.635.6 (6.17) 15,597.9
Total Expenditure 237,769.7 25.08 190,092.6
Surplus/(Deficit) (16,826.0) – 83,515.0
13. An analysis of key financial and operational performance indicators is given in the following paragraphs:
14. In 2012, the statement of financial performance showed an operating deficit. The deficit is attributable to a considerable shortfall in the total revenues of 19.3 per cent followed by a substantial increase in the total expenditure of 25.1 per cent. The management informed that the deficit of the 2012 was covered by TC funds that had been collected in previous periods for the ongoing projects.
15. The major factor in bringing a sharp decline in total revenue was an abrupt 25.9 per cent decrease in voluntary contributions. The management informed that this decrease was associated with the cyclic approval process of both GEF and MLF projects resulting in lesser allocation during 2012 as compared with 2011. Voluntary contributions remained the main source of revenues with 64.7 per cent and 70.5 per cent shares in the total revenues in 2012 and 2011 respectively. In the case of total expenditure, main item that contributed towards significant increase was Contractual Services (65.4 per cent). Other factors included Salaries and Employee Benefits (5 per cent) and the TC Equipment Expensed (15.4 per cent).
Fund Balances
16. Fund Balances represent the unexpended portion of contributions that are intended to be used for future operational needs of UNIDO, except operations for which conditions apply (Technical Cooperation fund). The Fund Balances reflect UNIDO’s residual interest in the assets after subtracting all its liabilities. The organization’s Fund Balances stood at €254,577.3 thousand as at 31 December 2012 as compared to €303,835.0 thousand as at 31 December 2011 registering a decrease of 16.2 per cent over the previous year.
10 V.13-82483
IDB.41/3 PBC.29/3
17. UNIDO’s total commitments (note 20) which included purchase orders and contracts, contracted but not delivered at year-end, were €132,688.8 thousand as at 31 December 2012 as compared to €109,184.9 thousand as at 31 December 2011 showing an increase of 21.5 per cent over the previous year. Although commitments are not recognized as expense in IPSAS compliant financial statements yet they reflect potential claims on the resources of the organization. The above figures show that commitments went up to almost half of the Fund Balances in 2012 whereas these were quite less than one-third of the Fund Balances in 2011. Almost two-third (62.2 per cent) of the commitments relates to the Montreal Protocol Projects and Global Environment Facility, positively reflecting an increase in project related activities.
Cash and Cash Equivalents
18. The total Cash and Cash Equivalents went down (8.7 per cent) to €414,513.7 thousand as at 31 December 2012 from €454,437.0 thousand as at 31 December 2011. Term deposits shrank to €349,044.8 thousand at 31 December 2012 from €418,462.2 thousand at 31 December 2011, a decrease of 16.6 per cent. Interest bearing accounts and term deposits yielded interest at an annual average rate of 0.32 per cent and 0.35 per cent for euro and US$ respectively (2011: 1.17 per cent and 0.33 per cent). The sharp decline in the rate of interest brought the interest revenue down to €775.6 thousand in 2012 from €846.5 thousand in 2011 i.e. a decrease of 8.4 per cent.
19. The management informed that the decline was a consequence of the prevailing conditions on the financial market, over which UNIDO had no influence.
Accounts Receivables from non-exchange transactions
20. Accounts Receivables (current) from non-exchange transactions, before allowance for doubtful debts, rose to €216,506.1 thousand as at 31 December 2012 from €212,998.1 thousand as at 31 December 2011, recording an increase of 1.64 per cent.
21. Assessed Contributions Receivable (current) due from the Member States came down by 6.7 per cent to €92,537.8 thousand in 2012 from €99,278.4 thousand in 2011 while the non-current portion of the outstanding contributions also went down to €6,553.9 thousand as at 31 December, 2012 from €10,200.4 thousand as at 31 December, 2011. This shows the efforts being made by the Member States in servicing their financial obligations.
22. Voluntary Contributions Receivable from the Member States, however, witnessed an upward trend increasing by 8 per cent to €119,868.2 thousand as at 31 December 2012 from €110,981.3 thousand as at 31 December 2011. The management intimated that the outstanding receipt of voluntary contributions were no delays but rather the consequence of agreed upon cash transfer schedules.
Overall Comment on the Financial Statements
23. Figures in the first draft Financial Statements, provided to the External Auditor as scheduled on 15 March 2013, were generally accurate except that the financial impact of a member state leaving UNIDO was not reflected in the Note 16.1 – Assessed Contributions to the Financial Statements. The management has made necessary correction in the final Financial Statements.
Employee Benefits Liabilities
24. The long-term employee benefits liabilities went up to €182,860.9 thousand as at 31 December 2012 from €137,171.5 thousand as at 31 December 2011, registering an increase of 33.3 per cent. Consequently, the negative Regular Budget general fund balance stood at €123,761.6 thousand as at 31 December 2012 as compared to negative balance of €106,551.9 thousand as at 31 December 2011, showing a further decline of general fund balance by 16.1 per cent.
V.13-82483 11
IDB.41/3PBC.29/3
25. The management clarified that the reason for the increase was the result of the actuarial study, which had to apply less favourable parameters in the light of the performance of the financial markets.
26. As a result of the recommendation of the External Audit in its report in 2010, the 39th session of Industrial Development Board (IDB) vide its decision IDB.39/Dec.2, requiring UNIDO “to study the feasibility of appropriate financing of a liability system to be addressed in a comprehensive manner by the informal working group that would provide guidance on the future liabilities of the organization”. The External Audit considers that the results of this activity should have been finalized by now and shared with audit. The management responded that the guidance from the Working Group was still awaited.
IPSAS Implementation
Transitional Provisions under IPSAS 17 and 23
27. UNIDO had invoked the following transitional provisions in 2010, permitted on first time adopting IPSAS:
• Five-year transitional period, allowed under IPSAS 17 Property, Plant and Equipment (PPE) for recognizing the PPE class “Buildings” and for TC PPE;
• Three-year transitional provision, allowed under IPSAS 23 Revenue from non-exchange transactions for measuring revenue for pre-2010 voluntary contributions.
The management was asked to provide an update on progress made in respect of the above-mentioned items.
28. The management replied that as regards IPSAS17, all PPE (incl. TC) were recognized in SAP system since 1.1.2013 and as regards IPSAS 23, all agreements (grants) had been migrated in SAP since 1.1.2013 and revenue was being recognized accordingly, based on the total value of agreement and conditionality (if any).
29. The subsequent audit teams shall review the progress in this regard.
IPSAS 24: Presentation of Budget Information in Financial Statements
30. IPSAS 24 requires that when the Financial Statements and the budget are not prepared on a comparable basis, a statement comparing budget and actual amounts be prepared. The Statement 5 of the Financial Statements of UNIDO compares budget and actual amounts of the financial period under report. In the Statement 5, the actual amounts are presented on a comparable basis to the budget and are reconciled to the actual amounts presented in the main Financial Statements, separately identifying any accounting basis, timing and entity differences as explained in note 18 to the Financial Statements. As recommended by the previous External Audit team, the management has revised the format of Statement 5 accordingly.
Status of Budget Utilization
31. The External Audit carried out an analysis of the budget utilization by the organization. Transition to the IPSAS basis of accounting required annual preparation of accounts, while the budget of UNIDO was authorized for a biennium. UNIDO divides its budget in almost equal parts for each year of the biennium.
12 V.13-82483
IDB.41/3 PBC.29/3
32. The status of budget utilization for the year 2012 as compared to 2011 was as under:
Table 2 € in 000
2012 2011 Gross
Budget Total
ExpenditureUnutilized
amount (Per cent)
Gross Budget
Total Expenditure
Unutilized amount
(Per cent) Staff costs 65,171.4 59,902.2 5,269.2
(8.09) 71,074.1 61,182.1 9,892.9
(13.92) Office travel 2,412.5 1,405.9 1,006.6
(41.72) 2,097.1 1,813.7 283.4
(13.51) Operating costs 14,541.0 12,014.1 2526.9
(17.38) 16,888.9 14,976.2 1,912.7
(11.33) Information and communication technology
2,838.4 1,564.7 1,273.7 (44.87)
3,227.8 2,587.4 640.4 (19.84)
Regular program of TC and special resources of Africa
7,002.7 6,166.7 836 (11.94)
9,215.0 8,915.4 299.7 (3.25)
Total 91,966.0 81,053.6 10,912.4 (11.9)
102,502.9 89,474.8 13,028.1 (12.71)
33. Figures of the above table indicate in keeping with the trend, the overall budget utilization further improved as compared to 2011. During 2012, the amount of unutilized budget came down from €13,028.1 thousand in 2011 to €10,912.4 in 2012. As usual, the staff costs remained the major cost component of the budgets in both the years (70.87 per cent in 2012 and 71.12 per cent in 2011).
Contributions from the Member States
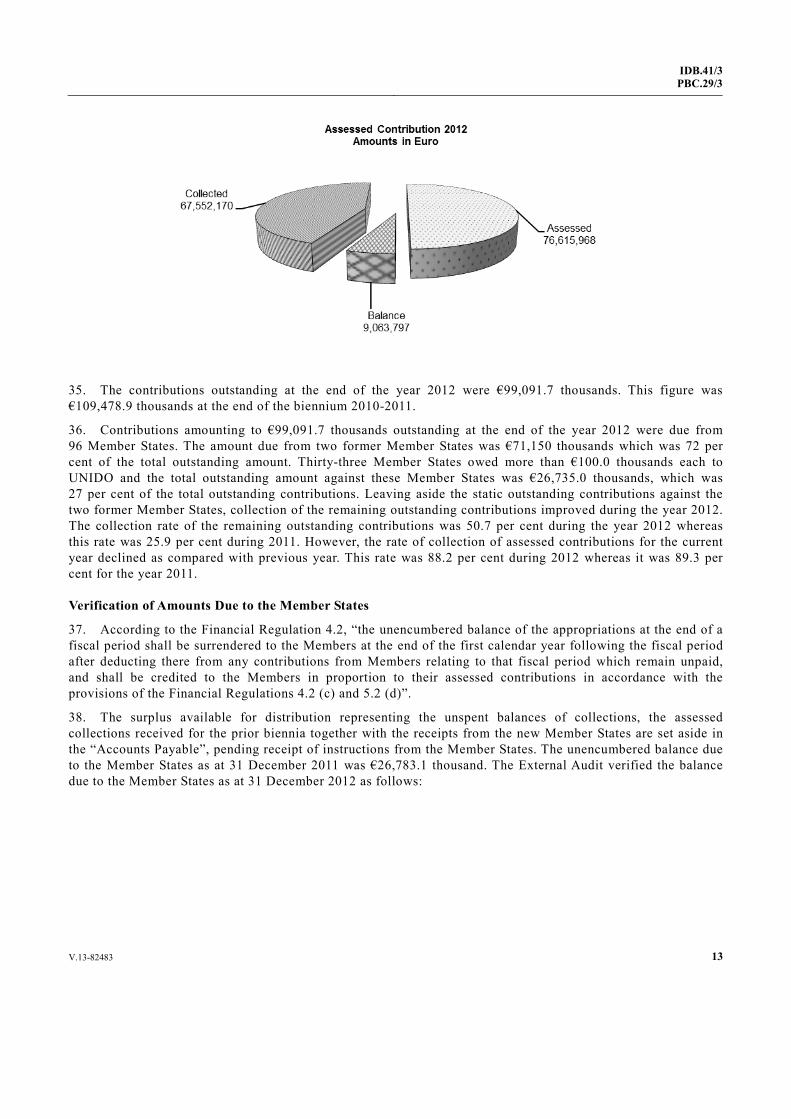
34. The annual contributions from the Member States for 2012 were assessed at €76,616.0 thousands against which €67,552.2 thousands were collected leaving a shortfall of €9,063.8 thousands. The following table and pie chart indicate the assessed and collected contributions during the years 2012 and 2011:
Table 3 € in 000
Year 2012 Year 2011 Contributions assessed
76,616.0 78,304.6
Contributions collected
67,552.2 71,069.3
Balance 9,063.8 7,235.3
V.13-82483 13
IDB.41/3PBC.29/3
35. The contributions outstanding at the end of the year 2012 were €99,091.7 thousands. This figure was €109,478.9 thousands at the end of the biennium 2010-2011.
36. Contributions amounting to €99,091.7 thousands outstanding at the end of the year 2012 were due from 96 Member States. The amount due from two former Member States was €71,150 thousands which was 72 per cent of the total outstanding amount. Thirty-three Member States owed more than €100.0 thousands each to UNIDO and the total outstanding amount against these Member States was €26,735.0 thousands, which was 27 per cent of the total outstanding contributions. Leaving aside the static outstanding contributions against the two former Member States, collection of the remaining outstanding contributions improved during the year 2012. The collection rate of the remaining outstanding contributions was 50.7 per cent during the year 2012 whereas this rate was 25.9 per cent during 2011. However, the rate of collection of assessed contributions for the current year declined as compared with previous year. This rate was 88.2 per cent during 2012 whereas it was 89.3 per cent for the year 2011.
Verification of Amounts Due to the Member States
37. According to the Financial Regulation 4.2, “the unencumbered balance of the appropriations at the end of a fiscal period shall be surrendered to the Members at the end of the first calendar year following the fiscal period after deducting there from any contributions from Members relating to that fiscal period which remain unpaid, and shall be credited to the Members in proportion to their assessed contributions in accordance with the provisions of the Financial Regulations 4.2 (c) and 5.2 (d)”.
38. The surplus available for distribution representing the unspent balances of collections, the assessed collections received for the prior biennia together with the receipts from the new Member States are set aside in the “Accounts Payable”, pending receipt of instructions from the Member States. The unencumbered balance due to the Member States as at 31 December 2011 was €26,783.1 thousand. The External Audit verified the balance due to the Member States as at 31 December 2012 as follows:
14 V.13-82483
IDB.41/3 PBC.29/3
€ in 000
Unencumbered balance brought forward 01 January 2012 26,783.1 Add: Collection of contributions from previous period 8,581.5 Less: Applied to assessments, retained for TC activities or refunded to Member States (25,014.0) Balance due to Member States as at 31 December 2012 10,350.6
HRM Function
Training and Impact Analysis
39. The organization’s most important resource is the knowledge and skills of its staff. UNIDO had been organizing trainings for staff to prepare them for implementing the Program for Change and Organizational Renewal (PCOR) and change management initiatives. The External Audit noted that impact of these trainings was not being properly assessed. In the absence of this, the effectiveness of training could not be adequately gauged based on which the quality of training interventions be improved. The management informed that the process of impact analysis was in progress.
40. The External Audit recommends that the impact assessment may be made a continuous process.
41. The management accepted the recommendation. The subsequent audit teams shall review the compliance.
Internal control in HRM
42. According to Staff Rule 106.19 (c), staff members in receipt of a language allowance may be required to undergo further tests at intervals of not less than five years in order to demonstrate their continued proficiency in the use of two or more official languages. In response to External Audit’s enquiry, a list of staff drawing language allowances was provided. It was requested to confirm whether necessary tests required under Staff Rule 106.19(c) were conducted or not. The management intimated that there were no cases to report under Rule 106.19 (c).
43. The management replied that the audit recommendation would entail financial and administrative implications. The proficiency examinations were being administered by the UN for which UNIDO was required to pay registration and other administrative fees for each UNIDO participant in the exams (in 2012 the total fee was EUR 210 per person per exam). As stipulated in the staff rule, we need to limit such re-testing.
44. The external Audit maintains that either Staff Rule 106.19(c) be complied with or the said Staff Rule be get deleted from competent authority.
SAP Implementation
45. Introduction of SAP as an ERP system is an essential element of the PCOR and is considered to be the major enabler in achieving the management objectives under PCOR. The ERP was implemented in four releases, as follows: Release 1: Portfolio and Project Management (PPM) from January 2012; Release 2: Human Capital Management (HCM) from January 2012; Release 3: Finance, Procurement, Travel Management and Logistics: gradually being rolled out from January 2013; Release 4: Knowledge Management and Collaboration (KMC), in conjunction with the above releases.
46. The SAP PPM module is to cater for UNIDO’s Core Business/TC activities. This release was envisaged to lay the foundation for effective monitoring and results-based reporting. The module had a first go-live in July 2011. The system was finalized by the end of the year 2011 and was rolled out to all staff in January 2012.

V.13-82483 15
IDB.41/3PBC.29/3
The External Audit reviewed the Knowledge Management and Collaboration (KMC) aspects and project monitoring and evaluation associated with PPM. The observations are given in the following paragraphs.
Result Based Management and Reporting in the PPM module of SAP
47. In ‘ERP Implementation for UNIDO’ (Appendix 2 – Terms of Reference) under the sub-process “Outputs” for PPM, it was provided that, “this sub-process includes the setting-up of the project infrastructure and managing delivery of the inputs and activities in line with the approved detailed work-plan. The progress will be reported along with outputs against the budget and work-plan … This includes monitoring and evaluating the outputs to achieve the overall project or service outcome.” To facilitate achieving this objective, the PPM module in SAP was provided with a structure in which outputs and outcome for projects could be recorded for using them to monitor, evaluate and report the progress of the project against the planned outputs and outcomes.
48. The External Audit selected a sample of seven ongoing and six recently completed projects to review the implementation of this feature of the PPM module and observed the following:
• The output and outcome fields for the selected projects were found blank. In the absence of such information, it was not possible to ascertain from the SAP system whether various qualitative and quantitative objectives of the projects had been achieved or not.
• The administrative directives for carrying out independent evaluation of the projects through SAP were issued in December 2012, that is, almost twelve months after the full roll out of the PPM module.
49. The External Audit is of the view that UNIDO has been pursuing the concept of Result Based Management (RBM) since 2008 as one of the major objectives of PCOR. In this regard, the project information captured in the PPM module is the major enabler for result based monitoring and reporting of the projects. As such delays in full utilization of the functionalities provided by PPM would result in delayed realization of the full benefits of result based monitoring and reporting. Such delays would also hamper timely removal of shortcomings in the modules that can only be identified when the system is in use for a reasonable period of time.
50. The management replied that conversion of all ongoing projects to the new logframe structure started in late 2011 to ensure that information on all ongoing projects was adequately captured in the PPM module following the RBM principles. In this connection, a major challenge had been to convert the legacy project information from the input-based budgeting i.e. budget lines structure into the RBM output-based structure. As this complex exercise also required consultation with donors and recipient countries, it was taking longer than anticipated to fully complete. In addition, new dashboard reporting tools were rolled-out to staff at large in October 2012. The tools, which retrieve substantive information on UNIDO’s Core Business/TC activities from the PPM module, were made available internally, and staff was advised to complete and/or correct the project-related information in the system on a regular basis. Their supervisors had also been encouraged to follow-up on this exercise.
51. The subsequent audit teams shall continue to review the progress in this regard.
Underutilization of Collaboration Functionality of KMC
52. In ‘ERP Implementation for UNIDO’ (Appendix 2 – Terms of Reference) under ‘Release 4: Knowledge Management and Collaboration’, the ERP implementation was supposed to provide a generic online collaboration module that would support teams of UNIDO staff together with external stakeholders to jointly create and edit documents, hold online discussions and submit documents to other processes. To serve this purpose, the Collaboration Rooms (cRooms) were to be provided in the system. The cRooms were supposed to act as “virtual project rooms” for groups or teams where the working environment is extended to meet the needs of any distributed project team. The introduction of the online collaboration rooms was intended to facilitate cross-organizational teamwork and communication and improve knowledge and information sharing.
16 V.13-82483
IDB.41/3 PBC.29/3
53. In this context, a dedicated cRoom was automatically created for every project in the Project and Portfolio Management (PPM) module to store project related documents with folders on the respective stages of the project cycle (identify, design, implement and assess). Bodies involved in the project approval process (e.g. the New Business Review Panel (NBRP), Screening and Technical Review Committee (STC), Advisory Group (AG) and Programme Approval and Monitoring Committee (AMC) were also supposed to move from their traditional procedures to the cRooms.
54. The External Audit examined the utilization of cRooms for sampled projects and observed that the functionality of cRooms had not been properly utilized. Upon enquiry, the management informed that, “The system has not reached to this level of cRoom utilization yet. Although UNIDO installed cRoom facility along with PPM during the Release 1 last year, functionalities available from cRoom are largely awaiting proper introduction, needing a focused approach and assignment of responsibility for implementation on the UNIDO side. SAP’s support in this area has been very limited as well. Therefore, while the facility is there, we have so far been unable to explore the full potentials of the system in the past year or so. In the meantime, negotiation between UNIDO and SAP on the new facility, Open Text, is ongoing, which in essence suspended the efforts on cRoom development.”
55. The External Audit reviewed the documentation relating to using Open Text in place of cRooms. In the documents, the management identified following issues for the underutilization of cRooms;
• Process Issues
i. Lack of Training
ii. Naming Convention
• Technical Issues
i. Search
ii. PPM, missing linkage
iii. External access to cRooms
iv. ERP-Connection, missing object links
v. Document Management and collaboration support for decision and approval process.
56. Regarding technical issues, the management was of the view that, although these could be addressed by the standard solution, this option would require extensive customization and that fulfilling the requirements, with a major part delivered by Custom Development, would increase the risk for instability and follow up efforts. Therefore, new architecture, i.e., KMC (Portal) replacement with extended ECM by Open Text, had been considered as the solution. This solution entailed revision of landscape of KM and setting up a new KM project.
57. The External Audit, given the nature of the technical issues identified by the management, is of the view that these issues should have been identified during the architecture planning of the original KMC concept. A realization of needs at such a later stage required a complete overhaul of the original KMC landscape. This, in turn, would increase cost of the solution and delay the implementation of the KMC concept. It was further observed that the issue of lack of training would need management’s attention even after the technical issues have been resolved.
58. The management replied that after the blueprinting exercise and initial implementation, it was realized that the solution would not fully meet UNIDO’s requirements. For instance, as part of the blueprinting exercise, the need to automatically extract metadata from PPM for documents attached to a project was documented and specified. However, this then was not implemented due to “high cost”. Similarly, a user-level integration of documents attached in the back-end system, e.g. contracts, was blueprinted but SAP could not propose a technical solution. Furthermore, SAP was unable to provide a practical solution for granting access to selected
V.13-82483 17
IDB.41/3PBC.29/3
documents for external parties such as Permanent Missions. Because of the multiple shortcomings of the implementation, Release 4 could not attain the status of being fully in production, and consequently UNIDO did not roll out a full documentation and training programme.
59. During 2011 and 2012, SAP conducted a detailed analysis on the strategic and operational levels to ensure the KMC solution would satisfy UNIDO’s requirements for Releases 1, 2 and 3. Following this analysis and intensive negotiations, SAP and UNIDO had agreed on a new landscape based on Open Text, expected to be fully delivered by September 2013. This solution would meet UNIDO’s requirements for the years to come, including for communities of practice and other types of collaboration forums.
60. The External Audit recommends that:
I. In order to realize the concept of RBM, the management may like to develop strategy to fill in all project related information in the PPM module before making the new projects operational. Timelines may also be defined to enter the related information for all ongoing projects.
II. The management may like to carry out a study as to why realistic need assessment could not be made at the conception stage of KMC. This would help in making use of lessons learnt in future handling of such comprehensive projects like ERP implementation under PCOR.
III. Trainings and user manuals may be given due attention if the extended ECM by Open Text is implemented.
Management’s Response
61. All new projects since early 2012 were following the RBM principles. For the ongoing projects, an exercise started in late 2011 to convert old projects into new RBM-based projects, including the logframe structure, outcomes, outputs, key performance indicators, risks and mitigating measures, etc.
62. During audit the external audit observed that related information was not being captured in the PPM. Subsequent External Audit teams will continue to review progress in this regard.
UNIDO Emergency Preparedness
63. Emergency preparedness refers to business continuity planning and contingency planning which are elements of a system of internal controls that is established to manage availability of critical processes in the event of interruption. The ultimate goal of the process is to be able to respond to incidents that may impact people, operations and ability to deliver mission critical business activities.
64. The Crisis Management Plan of UNIDO states, ‘For a crisis management plan to be effective, safeguard the staff and preserve the organization’s mission critical functions, it must be comprehensive, up-to-date and well-rehearsed.’ The External Audit reviewed the Crisis Management Plan of UNIDO, Programme Support and General Management (PSM) Divisional Business Continuity Plan and Information and Communication Management (ICM) Business Continuity Plan.
Crisis Management Plan of UNIDO
65. The UNIDO Crisis Management Plan (CMP) was derived from the United Nations Security Plan for Austria and the United Nations Office in Vienna (UNOV)/United Nations Office on Drugs and Crime (UNODC) CMP and was implemented in 2007. It sets out the policies and organizational arrangements for managing a crisis at the Vienna International Centre. It identifies preventative measures that have to be in place prior to a crisis as well as effective responses to be taken in the event of a crisis at varying levels of severity. The External Audit observed the following:
18 V.13-82483
IDB.41/3 PBC.29/3
• Report regarding periodic review of CMP was not available whereas the plan required the Managing Director PSM Division to continuously assess and, as necessary, revise the CMP so as to ensure that it remained relevant, up-to-date and compatible with the UN Security Plan for Austria.
• The digitalization of all essential information relating to active staff members and operations of UNIDO had not been done. This was required by the Plan as the immediate preventive measure.
66. In this regard, the management informed that UNIDO CMP was an integrated part of the Austria Security Plan (ASP) and that United Nations Security and Safety Section (UNSSS) had been conducting annual security risk assessment to decide whether any change was warranted in the ASP. Since the security situation in Austria had been stable, there was no need to make changes in ASP and UNIDO CMP and prepare the review report. The last update was done in 2011 by reviewing the list of staff involved in the implementation of UNIDO CMP.
67. The External Audit is of the view that the stable security situation may not warrant changes in the structure of the CMP, however, the effectiveness of this plan could only be established through repeated rehearsals of procedures. The lessons learnt from the rehearsals may result in identifying areas of improvement in the CMP.
68. The management replied that while it was clear that the effectiveness of the plan could only be tested through rehearsals, however, live rehearsal of the entire plan would imply a shut-down of the organization, which would not be affordable. An alternative could be to undertake theoretical rehearsals periodically, especially at times of massive restructuring implying movements of a lot of staff.
69. The External Audit is of the view that the rehearsals may be carried out to the extent envisaged in the UNIDO CMP and, if required, necessary revisions be made in the CMP in the light of experience of the rehearsals.
Programme Support and General Management Divisional Business Continuity Plan (BCP)
70. The External Audit reviewed the BCP of the Programme Support and General Management Division and noted the following:
• The BCP was being updated once in two years with last update in 2011. Under “Identification of key personnel and contact information”, 45 per cent data cells (277 out of 620) regarding Mobile and Home phone numbers were blank. Moreover, two employees (ID Number 558075 on page 29 and ID Number 8132497 on page 40) had inactive status in the HR database of UNIDO. These shortcomings would adversely affect the effective emergency response. The management agreed to make the corrections in the updated BCP.
• The BCP prescribed certain training requirements including simulation exercises for off-site operations in the form of dry-run workshops that were not conducted. Such shortcomings may negatively impact the preparedness for disaster.
• The PSM/OMD had not conducted a scanning of historic documents in line with the Business Continuity Plan. The management informed that the PSM/OMD had introduced an electronic archiving system. The office also sorted out all the old archives in order to enable scanning of the documents in the future but due to resource constraints, the scanning job was not executed. Such a compromise increases the risk of UNIDO losing institutional memory in case of disaster.
71. The management replied that the cost implication of the simulation exercise would have to be carefully studied before embarking upon an exercise that could reveal itself beyond the financial capacity of the organization. However, the management would take steps to implement to the extent feasible and within available resources.
72. The External Audit is of the view that simulation exercise needs to be carried out to the extent planned in the BCP otherwise the BCP be amended accordingly.
V.13-82483 19
IDB.41/3PBC.29/3
Information and Communication Management (ICM) Business Continuity Plan
73. To enable UNIDO to continue its mission critical activities in the event of a disaster, UNIDO needs all financial, personnel, contractual and project data to be stored in a secure offsite location outside Vienna International Centre (VIC) (a temporary computing venue for operations). Hence the Business Continuity Plan of ICM defines the mission-critical IT functions of UNIDO that should continue in an emergency or crisis situation and the means by which these functionalities and data are to be preserved. The ICM Business Continuity Plan was adopted on 20th November 2007. After reviewing the Plan, the External Auditors observed the following:
• The description of the existing IT infrastructure of the UNIDO was outdated;
• Backup and restore procedures plus off-site storage procedures were not reviewed by the Chief and Operations Group Leader on yearly basis as required by the plan;
• BCP required that the testing of the Plan be carried out as agreed by the Chief and Operations Group Leader but the same had not been done since 2007.
74. Upon enquiry, the management agreed that the IT infrastructure given in the UNIDO ICM Business Continuity Plan was outdated. The management also informed that formal reports had not been created as a result of the review of backup and restore procedures plus off-site storage procedures. However, as a consequence of the reviews, acquisition(s) to update the ICT offsite infrastructure were in progress. New Virtual Private Network (VPN) appliances had been acquired to match the upgraded line speeds and, as part of the PCOR project, a server compatible with HQ SAP infrastructure was being acquired. Regarding testing of the Plan, the management deemed it judicious to defer the new BCP Plan until the establishment of the ERP environment at the offsite facility.
75. The External Audit is of the view that emergency situations arise without warning and only adequate preparedness can mitigate the damage caused due to an untoward event. In the light of aforementioned shortcomings, the UNIDO is carrying on with an untested BCP based on outdated information. This, in turn, means that the ICM function is not adequately prepared to deal with an emergency. Should an occasion arise, the outdated ICM Business Continuity Plan would not be able to handle the situation as the new BCP is yet to be finalized, adopted, tested and implemented for which the management has not drawn any timelines for this purpose.
76. The External Audit recommends that:
I. Management may like to consider identifying areas requiring improvement in the UNIDO CMP in the light of the experience of rehearsals carried out on the security procedures.
II. The Management may like to take necessary and timely measures to complete the key personnel related data and update the PSM Divisional BCP as and when status of any of the key personnel changes. Moreover, the requirements of simulation exercises and scanning may be fulfilled.
III. The management may like to fix the timelines for new ICM BCP implementation at the earliest. Meanwhile it is essential that the existing ICM BCP may be updated and kept operational to cater for any untoward event.
Management’s Response
77. The management disagreed with the recommendation to update and keep operational the ICM BCP of 2007 in the interim.
78. The External Audit is of the view that the management has not yet decided about the timelines for preparing a new ICM BCP. As such by not agreeing to update and keep operational the ICM BCP of 2007 in the interim, the management has opted to remain without adequate emergency preparedness during this
20 V.13-82483
IDB.41/3 PBC.29/3
period. The audit again recommends that a minimum level of emergency preparedness needs to be maintained during this undefined interim period.
Project and Portfolio Management
Terminal Reporting
79. According to Director General’s administrative instruction DG AI.9, the project managers will prepare Terminal Reports on completion of projects for submission to the final tripartite review meetings.
80. The External Audit observed from a sample of eight projects completed in 2012 that the Terminal Reports were not prepared.
81. The management responded in four cases that these were preparatory assistance projects which do not require terminal reports while, in case of one project, a completion date alert prepared in June 2011 was provided, a summary of activities prepared in November 2012 was submitted in another case, a brief terminal report was provided in another case and in one case, a project document and execution report were provided (details are at Annex A). This shows that terminal reports were either not prepared or prepared on improper format.
82. The External Audit recommends that the instructions of the TC Guidelines be observed and proper terminal reports be drawn so that the achievement of the project’s objectives is assessed against project activities, outputs and outcomes. This would also facilitate informed decision making for the future.
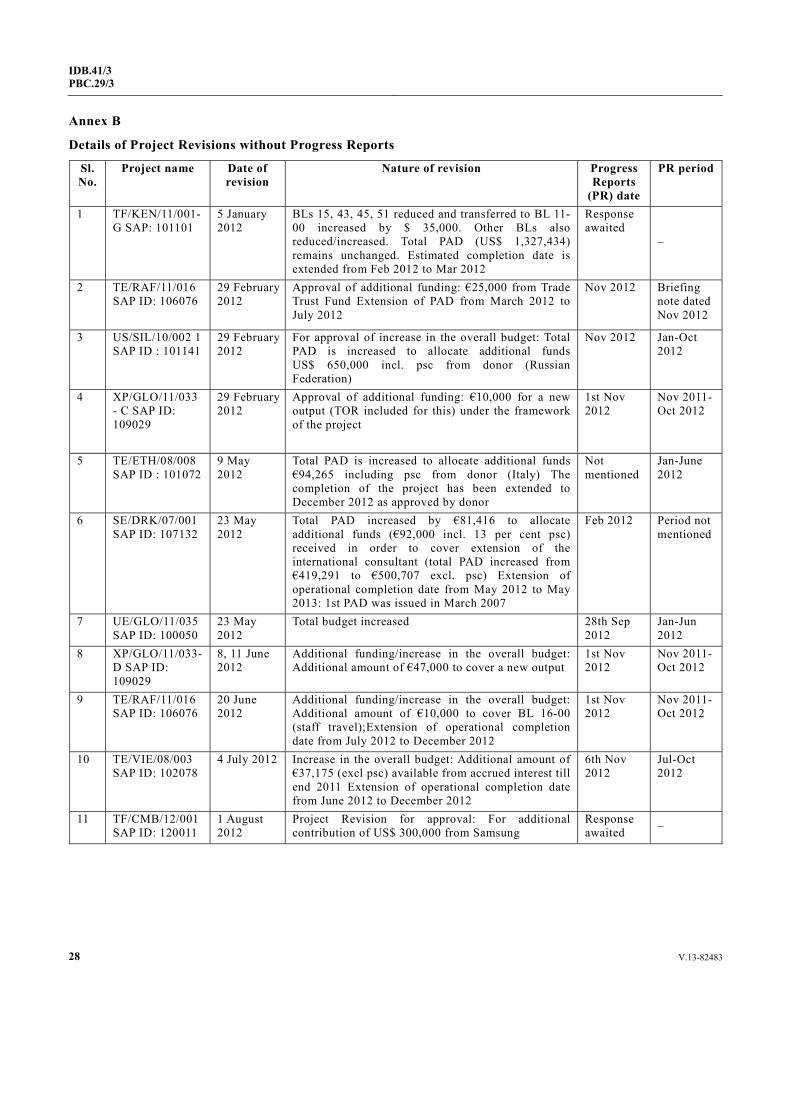
Project Extensions/Revisions
83. PR 06.04.01(a) 3 of TC Guidelines requires preparation of progress as well as evaluation reports for the projects which need extensions. For all projects with budgets exceeding €1 million, independent evaluations would also be conducted.
84. External Auditors observed from a sample of 15 revisions made in 2012 that the revisions in projects included changes in duration, budget/cost and scope of the projects (details at Annex B). In only three of these cases, progress reports were prepared before the revision of projects, while management did not provide any information in the case of three projects which were revised. The information provided for the remaining nine cases showed that the progress reports were prepared after revisions were approved in projects.
85. During audit, the management informed that self-evaluations were not conducted in relation to these revisions and that none of the revisions was made in relation to a new project phase or concerning a budget increase that made the total project budget exceed €1 million.
86. The External Audit is of the view that in the aforementioned cases, as projects were being extended or entering a new phase, there was a need for progress reports and evaluation summary notes as per PR 06.04.01(a) 3 of TC Guidelines irrespective of the fact that total project budget may or may not exceed €1 million.
87. The management replied that EVA never received any self-evaluation reports and the office had no capacity to review them.
88. The External Audit emphasises that the provisions of the TC guidelines be complied with.
Monitoring System of Project Implementation
89. According to PR 06.00.00 of TC Guidelines, project monitoring and self-evaluation was necessary to provide progress towards the achievement of project outcomes, outputs and objectives and to highlight any problem areas to the main stakeholders and the UNIDO management.
V.13-82483 21
IDB.41/3PBC.29/3
90. The External Audit reviewed the project monitoring system on a sample of ongoing projects both at headquarters and field offices in Bangladesh and Lebanon. The management was asked to provide information regarding implementation status of these projects showing physical progress vis-à-vis the stated expenditure.
91. The management stated that the project implementation data was not available in the Financial Performance Control System (FPCS)/Agresso and that only the Allotment Holder/Project Manager would be in the position to provide such information. However in the future, once the project portfolio was managed via SAP, access to such information would be available.
92. The External Audit observed that the present portfolio management system does not allow an arrangement to watch expenditure matching with activities at any point in time which is very important for proper monitoring of the ongoing projects.
93. The management responded that the new PPM dashboard reporting tools introduced in 2012 allow for such monitoring.
94. The subsequent audit team shall review the effectiveness of the new PPM dashboard in this regard.
Procurement
95. The External Audit reviewed and analysed the procurement function on the basis of a sample of transactions. The significant audit findings in this area were as under:
96. A UNDP Suspended/Removed/Reinstated Vendor Report – 21 September 2012 revealed that a total of 187 vendors of different countries were barred from participating in UN related procurements. It was learnt that Procurement Services Unit did not have any explicit procedures for reviewing prohibited vendors. As a precaution, the list of barred vendors was uploaded on UNIDO Intranet.
97. The External Audit recommends need for including sufficient checks in the ERP to prevent the prohibited vendors from taking part in UNIDO procurements.
98. The management replied that as part of the SRM roll-out, the list would be subject to review against the vendor data contained in the vendor master data.
99. The subsequent audit teams shall review the progress in this regard.
100. The breakdown of complaints received in IOS during the years 2011 and 2012 revealed that a number of complaints pertaining to corruption (including procurement frauds) were not being disposed of. The percentage of cases pending disposal at the end of 2011 and 2012 was 75 per cent and 69 per cent of the cases received in the period, respectively. The maximum date of pendency was 2007 and 2008 at the end of 2011 and 2012 respectively, which still needs improvement.
101. The External Audit recommends review of the Policy on Fraud Awareness and Prevention issued in 2005 to incorporate procedures for speedy disposal of complaints.
102. The management replied that the revised Policy on Fraud Awareness and Prevention was published on 21 February 2013. The Paragraph 54 of the Investigation Guidelines provided a mechanism in the form of Advisory Report (including recommendations and recommendation follow-up). IOS issued one such Advisory Report in 2012, with recommendations linking lessons learnt in a fraud case to controls in decentralized procurement.
103. The subsequent audit teams shall review the progress in this regard.
104. The procurement checklist available on the UNIDO Intranet makes it binding on the authorized official to complete and submit this checklist with the Statement of Award. Review of sampled Statement of Awards showed that procurement checklist was not attached with half of the sampled awards, increasing risk of miss-procurement.
22 V.13-82483
IDB.41/3 PBC.29/3
105. The External Audit recommends that submission of the said checklist be ensured and this may be made part of the revised Procurement Manual.
106. The management agreed with the recommendation of the External Audit. However, the management informed that many of the steps/tasks contained in the original checklist document had become redundant as they had been replaced with SRM-supported functionalities.
107. The subsequent audit teams shall review the progress regarding SRM-supported functionalities.
108. Article 9.7, Chapter II, of the Procurement Manual states that the Procurement Official concerned shall in all cases document the award in the Statement of Award indicating that it has been made in accordance with the applicable Financial Rules.
109. During scrutiny of a sample of decentralized procurements, it was observed with regard to a sub contract in UNIDO project number FMEGY09006-2101-2012 with M/s Growing Green SLU that the Statement of Award was without any documentary evidence that could justify that there was a genuine exigency of the activity and time constraint for the issuance of invitations.
110. When enquired, the management explained that the company was the only available provider of the technical consultancy and there was time constraint as the project could not be postponed for the next year 2013. Nevertheless, the management failed to provide any documentary evidence in support of their clarification. The External Audit is of the view that Statement of Award was issued without carefully scrutinizing the mandatory documents.
111. The External Audit recommends that the Statement of Award may be issued after meeting all the requirements of Article 9.7, Chapter II, of the Procurement Manual.
112. Rule 14.3 of the Procurement Manual states that the write-off or disposal of all property which is either surplus to the needs of UNIDO or unserviceable due to obsolescence, normal wear and tear or loss, shall be processed in line with the provisions of Financial Rule 109.1.10 and the UNIDO Property Management Manual. While the Property Survey Board (PSB) is responsible for notifying to the MD/PSM any shortages and damages to supplies, equipment or other property that come to light as a result of stock-taking or an inventory check.
113. The External Audit reviewed the list of 50 assets written off by the Property Survey Board (PSB) during 2012. The management informed that the instructions issued by the PSB in various cases were sent to respective officials in Headquarters and Field/Regional Offices of UNIDO after conclusion of the PSB meetings. The External Audit observed that such mechanism was not adequate.
114. The External Audit recommends devising and implementing a monitoring mechanism to ensure compliance of the recommendations and instructions issued by the PSB.
115. The management replied that the monitoring and control undertaken by GES comprised of bi-annual email follow up with the project managers/field offices in order to verify the physical inventory, as well as ensure that the items written off had taken place. However, in certain cases, particularly field offices, answers were not received in a timely manner. The Secretary of the PSB shared the results of the Board, after the approval of the MD/PSM, with the respective staff of PSM/OSS/GES for follow up, which they did. In future, PSM/OSS/GES would introduce an automatic quarterly reminder system to follow up on the cases - rather than twice a year. These reminders might also be copied automatically to the Director of Regional Offices as well as the Chief of the respective country programmes. This would facilitate better monitoring and control. As for assets written off at H.Q., since these were easier to monitor and control, they had been attended to in a timely manner by PSM/OSS/GES.
116. The subsequent audit teams shall review the progress in this regard.
117. In Para 3.7 (i) of the External Audit Report, 2008, it was observed that procurement in UNIDO was being made without any procurement plan. Since then, the issue is being raised but the customary stance taken by the
V.13-82483 23
IDB.41/3PBC.29/3
management is that since they are moving on to SAP, it will be catered for in SAP. As the procurement module of SAP is operational, the External Audit recommends that the Procurement Manual be revised to ensure procurement planning.
118. In response to the query of the External Audit, the management informed that Procurement Services Unit/OSS would make the required amendments in the Manual by December 2012. The External Audit sought the response of management on the following points:
• When was the testing phase of the Procurement Module of SAP completed?
• Whether the Procurement Module of SAP is fully operational now?
• Whether the Procurement Manual has been amended to incorporate all the features of the Procurement Module of SAP?
119. The management’s reply was, “The procurement module of SAP, Supplier Relationship Management (SRM), was subject to a limited roll-out on 21 January 2013. UAT1 test phase was conducted in October 2012. UAT2 in November 2012. UAT3 is ongoing, due to the fact that not all functionalities have yet been handed over by SAP Austria to UNIDO and the tests continue to be performed at this stage prior to handing over new solutions to the production system. Significant efforts were made to incorporate the new Procurement processes and setup during the revision exercise of the new draft procurement manual. Kindly note that the manual will be supported by a SRM/MM portal which is a living document, ranked between the SRM/MM module and the manual, and will provide the operational guidance to users on how to operate the SRM functionalities. The draft manual was meant for an internal consultation exercise. All feedback received is currently in the process of being reviewed with the expectation that the manual will be finalized soon.” The management also informed that the procurement plan functionality was not part of the limited roll-out in January 2013 but would be handed over shortly.
120. The External Audit recommends expediting the finalization of the procurement manual in line with the SRM/MM portal of SAP.
121. The management replied that an implementation plan had been agreed with SAP for all the remaining items to be implemented by June 2013.
122. The subsequent audit teams shall review the progress in this regard.
Operations in the Field
123. To review the working of the UNIDO Field Offices, the External Audit teams visited two selected Offices of UNIDO viz. UNIDO Desk Office Dhaka, Bangladesh and Regional Office, Beirut, Lebanon. The following are the observations noticed in the field offices during audit which require attention of the management:
124. The financial matters of the Desk Office (DO) are being handled by the Regional Office India while the operational activities of projects are also being monitored by RO India. The Country Head is not involved in the operational implementation of the projects.
125. The External Audit recommends that there should be a clear description of functions and responsibilities of the Desk Office. Adequate financial powers may be delegated and proper role in operational activities be given. The status of the Desk Office may be upgraded so that it can play a proactive role in identifying new areas of activities for UNIDO in Bangladesh.
126. The management replied that the Head of UNIDO Operations (HUO) was very much involved in the monitoring on site in the country of TC projects. The office plays a proactive role in identifying new areas. Increasing the financial, implementation and status would require increasing the resources of the HUO.
24 V.13-82483
IDB.41/3 PBC.29/3
127. The External Audit recommends that the management may like to consider necessary decentralization of administrative/financial powers to the DO.
128. According to Rule 109.1.6 of Financial Rules and Regulations, complete and accurate record of supplies, equipment and other property purchased, received, issued, transferred, sold or otherwise disposed of and remaining on hand shall be maintained. While under Rule 109.1.9, physical inventories shall be taken of such assets at least once during a fiscal period.
129. During review of assets available at the Project Office of Better Works and Standards Programme (BEST), the External Audit observed that coding of the assets was not carried out at all. Physical inventories were also not taken on yearly basis.
130. The External Audit recommends that the assets may be coded according to the assets codes issued by the HQ and physical stock taking of inventories be taken regularly on yearly basis.
131. The management replied that the monitoring and control undertaken by GES comprised of bi-annual e-mail follow up with the project managers/field offices in order to verify the physical inventory in the field. Currently, physical inventory exercise in the field was dependent on written responses received. It was envisaged that with the introduction of the new ERP system, barcode readers would be procured for the field offices as well as H.Q., in order to ensure uniform codification, and facilitate physical stock inventories, by the respective staff in the field offices as well.
132. The subsequent audit teams shall review the progress in this regard.
133. During review of the Re-tie Bangladesh project, it was observed that the completion date of Re-tie Bangladesh was 4th February, 2012 whereas it was operationally closed on 4th November, 2012 with an overall delay of nine months. The project has yet to be financially closed. In the case of the BEST project, the mid-term evaluation was not carried out as required under the Rules.
134. The management replied that EU was the decision maker of Mid Term evaluation. However, Mid Term evaluation for BEST project was conducted for three weeks started from February 24, 2013.
135. The subsequent audit teams shall review the progress in this regard.
Internal Oversight Services (IOS)
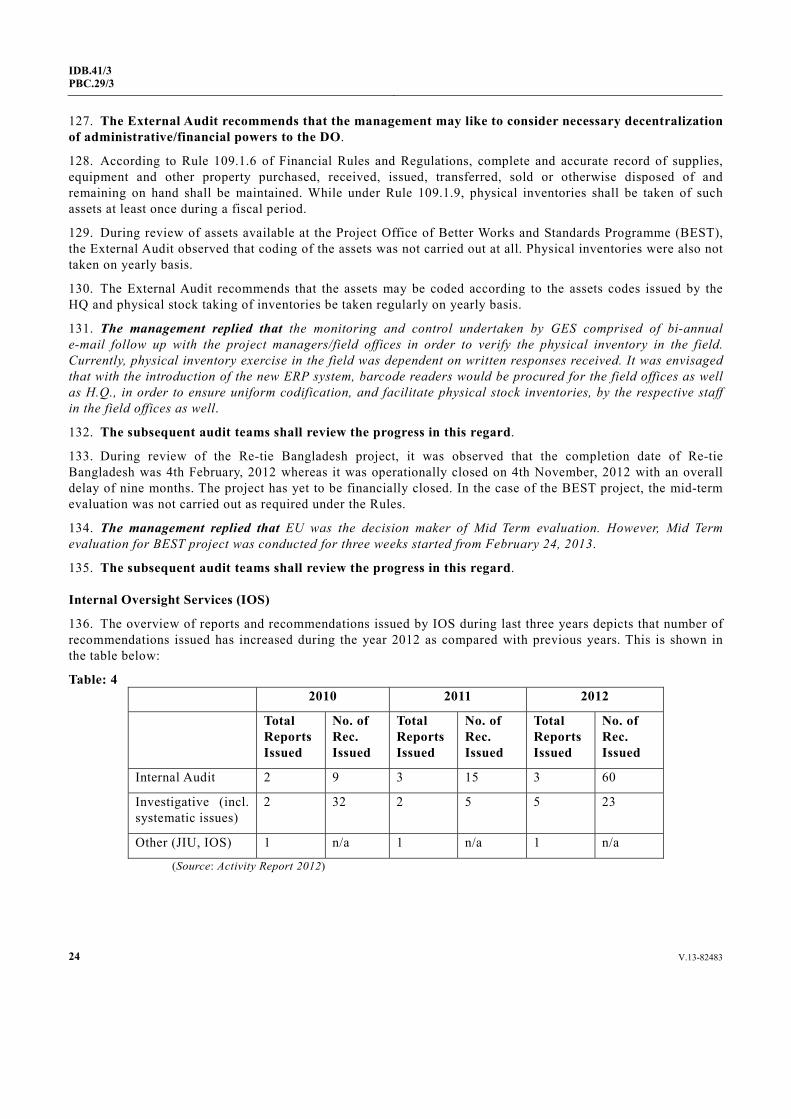
136. The overview of reports and recommendations issued by IOS during last three years depicts that number of recommendations issued has increased during the year 2012 as compared with previous years. This is shown in the table below:
Table: 4 2010 2011 2012
Total Reports Issued
No. of Rec. Issued
Total Reports Issued
No. of Rec. Issued
Total Reports Issued
No. of Rec. Issued
Internal Audit 2 9 3 15 3 60
Investigative (incl. systematic issues)
2 32 2 5 5 23
Other (JIU, IOS) 1 n/a 1 n/a 1 n/a
(Source: Activity Report 2012)
V.13-82483 25
IDB.41/3PBC.29/3
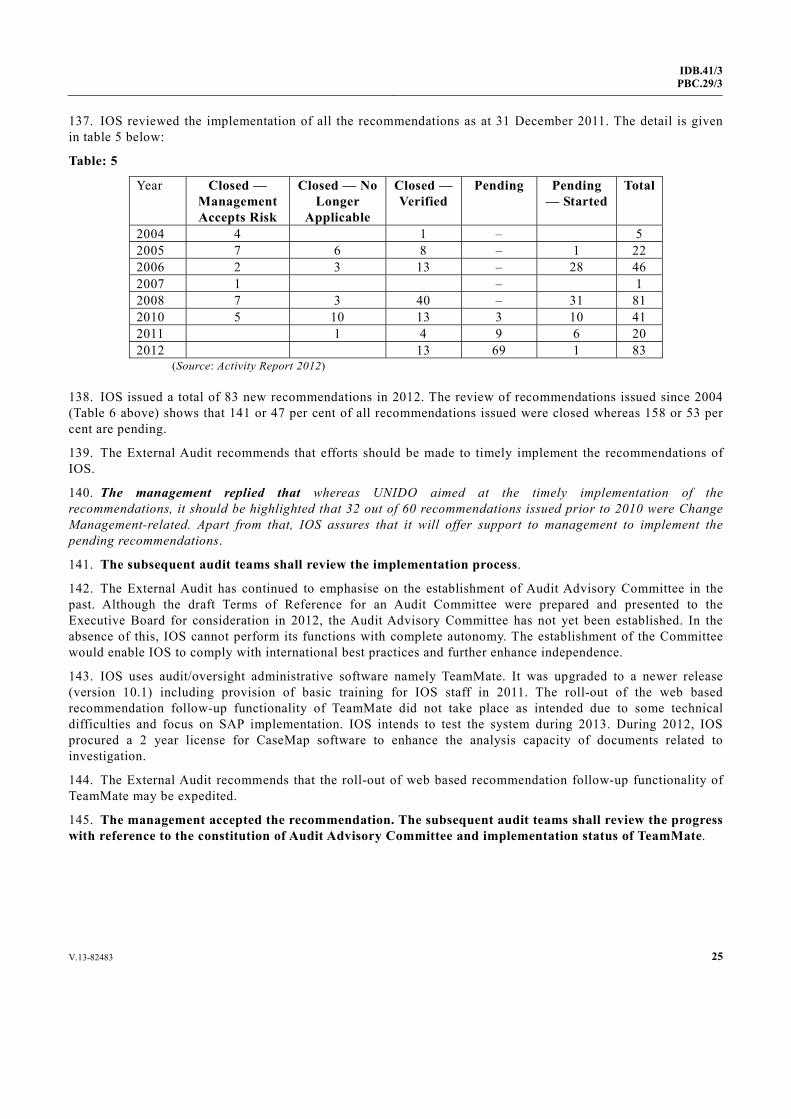
137. IOS reviewed the implementation of all the recommendations as at 31 December 2011. The detail is given in table 5 below:
Table: 5
Year Closed — Management Accepts Risk
Closed — No Longer
Applicable
Closed — Verified
Pending Pending — Started
Total
2004 4 1 – 5 2005 7 6 8 – 1 22 2006 2 3 13 – 28 46 2007 1 – 1 2008 7 3 40 – 31 81 2010 5 10 13 3 10 41 2011 1 4 9 6 20 2012 13 69 1 83
(Source: Activity Report 2012)
138. IOS issued a total of 83 new recommendations in 2012. The review of recommendations issued since 2004 (Table 6 above) shows that 141 or 47 per cent of all recommendations issued were closed whereas 158 or 53 per cent are pending.
139. The External Audit recommends that efforts should be made to timely implement the recommendations of IOS.
140. The management replied that whereas UNIDO aimed at the timely implementation of the recommendations, it should be highlighted that 32 out of 60 recommendations issued prior to 2010 were Change Management-related. Apart from that, IOS assures that it will offer support to management to implement the pending recommendations.
141. The subsequent audit teams shall review the implementation process.
142. The External Audit has continued to emphasise on the establishment of Audit Advisory Committee in the past. Although the draft Terms of Reference for an Audit Committee were prepared and presented to the Executive Board for consideration in 2012, the Audit Advisory Committee has not yet been established. In the absence of this, IOS cannot perform its functions with complete autonomy. The establishment of the Committee would enable IOS to comply with international best practices and further enhance independence.
143. IOS uses audit/oversight administrative software namely TeamMate. It was upgraded to a newer release (version 10.1) including provision of basic training for IOS staff in 2011. The roll-out of the web based recommendation follow-up functionality of TeamMate did not take place as intended due to some technical difficulties and focus on SAP implementation. IOS intends to test the system during 2013. During 2012, IOS procured a 2 year license for CaseMap software to enhance the analysis capacity of documents related to investigation.
144. The External Audit recommends that the roll-out of web based recommendation follow-up functionality of TeamMate may be expedited.
145. The management accepted the recommendation. The subsequent audit teams shall review the progress with reference to the constitution of Audit Advisory Committee and implementation status of TeamMate.
26 V.13-82483
IDB.41/3 PBC.29/3
Verification of Physical Assets
146. The management had carried out physical verification of assets during 2012 as required vide paragraph 4.9.1 of the UNIDO Property Management Manual. The External Audit conducted a sample based physical verification of PPE and found the assets in their respective places.
Fraud and Cash Write-Offs
147. Management reported to the External Audit cases of assets write-off amounting to €18,492 during the year 2012.
Ex-Gratia Payments
148. In terms of UNIDO Financial Regulations 9.3, the Director- General may make such ex-gratia payments as he deems to be necessary in the interest of the Organization. A statement of such payments shall be submitted with the final and interim accounts.
149. The management reported that during 2012 no ex-gratia payment was made.
Compliance of the External Audit Report for the Year 2011
150. Our review of the compliance of the External Audit Report for the year 2011 is at Annex C.
Acknowledgement
151. The External Audit is thankful to Management and staff of UNIDO for the cooperation and assistance during audit.
[Signed]
April 25, 2013
(Muhammad Akhtar Buland Rana) Auditor-General of Pakistan
External Auditor
V.13-82483 27
IDB.41/3PBC.29/3
Annex A
Details of Projects without Terminal Reports
Sr. No Project ID Management’s response or documents provided 1 SFIRA09005 No terminal report required since it was a funding to co finance preparatory assistance
phase of a GEF project 2 TFSRL11001 A completion date alert was provided which had been prepared in Jan 2011 3 SFARG04001 A summary of activities prepared on 16th November 2012 was provided to EA 4 UESEN07004 Project document prepared in July 2010 &execution report prepared in June 2012 was
provided 5 MPSUD09006 It was a preparatory assistance project, Montreal Protocol does not require any terminal
report for such projects 6 MPECU11002 It was a preparatory assistance project, Montreal Protocol does not require any terminal
report for such projects 7 GFECU10002 A brief terminal report was prepared and submitted after EA’s enquiry 8 MPVEN10001 It was a preparatory assistance project, Montreal Protocol does not require any terminal
report for such projects
28 V.13-82483
IDB.41/3 PBC.29/3
Annex B
Details of Project Revisions without Progress Reports
Sl. No.
Project name Date of revision
Nature of revision Progress Reports
(PR) date
PR period
1 TF/KEN/11/001-G SAP: 101101
5 January 2012
BLs 15, 43, 45, 51 reduced and transferred to BL 11-00 increased by $ 35,000. Other BLs also reduced/increased. Total PAD (US$ 1,327,434) remains unchanged. Estimated completion date is extended from Feb 2012 to Mar 2012
Response awaited
–
2 TE/RAF/11/016 SAP ID: 106076
29 February 2012
Approval of additional funding: €25,000 from Trade Trust Fund Extension of PAD from March 2012 to July 2012
Nov 2012 Briefing note dated Nov 2012
3 US/SIL/10/002 1 SAP ID : 101141
29 February 2012
For approval of increase in the overall budget: Total PAD is increased to allocate additional funds US$ 650,000 incl. psc from donor (Russian Federation)
Nov 2012 Jan-Oct 2012
4 XP/GLO/11/033 - C SAP ID: 109029
29 February 2012
Approval of additional funding: €10,000 for a new output (TOR included for this) under the framework of the project
1st Nov 2012
Nov 2011-Oct 2012
5 TE/ETH/08/008 SAP ID : 101072
9 May 2012
Total PAD is increased to allocate additional funds €94,265 including psc from donor (Italy) The completion of the project has been extended to December 2012 as approved by donor
Not mentioned
Jan-June 2012
6 SE/DRK/07/001 SAP ID: 107132
23 May 2012
Total PAD increased by €81,416 to allocate additional funds (€92,000 incl. 13 per cent psc) received in order to cover extension of the international consultant (total PAD increased from €419,291 to €500,707 excl. psc) Extension of operational completion date from May 2012 to May 2013: 1st PAD was issued in March 2007
Feb 2012 Period not mentioned
7 UE/GLO/11/035 SAP ID: 100050
23 May 2012
Total budget increased 28th Sep 2012
Jan-Jun 2012
8 XP/GLO/11/033-D SAP ID: 109029
8, 11 June 2012
Additional funding/increase in the overall budget: Additional amount of €47,000 to cover a new output
1st Nov 2012
Nov 2011-Oct 2012
9 TE/RAF/11/016 SAP ID: 106076
20 June 2012
Additional funding/increase in the overall budget: Additional amount of €10,000 to cover BL 16-00 (staff travel);Extension of operational completion date from July 2012 to December 2012
1st Nov 2012
Nov 2011-Oct 2012
10 TE/VIE/08/003 SAP ID: 102078
4 July 2012 Increase in the overall budget: Additional amount of €37,175 (excl psc) available from accrued interest till end 2011 Extension of operational completion date from June 2012 to December 2012
6th Nov 2012
Jul-Oct 2012
11 TF/CMB/12/001 SAP ID: 120011
1 August 2012
Project Revision for approval: For additional contribution of US$ 300,000 from Samsung
Response awaited –
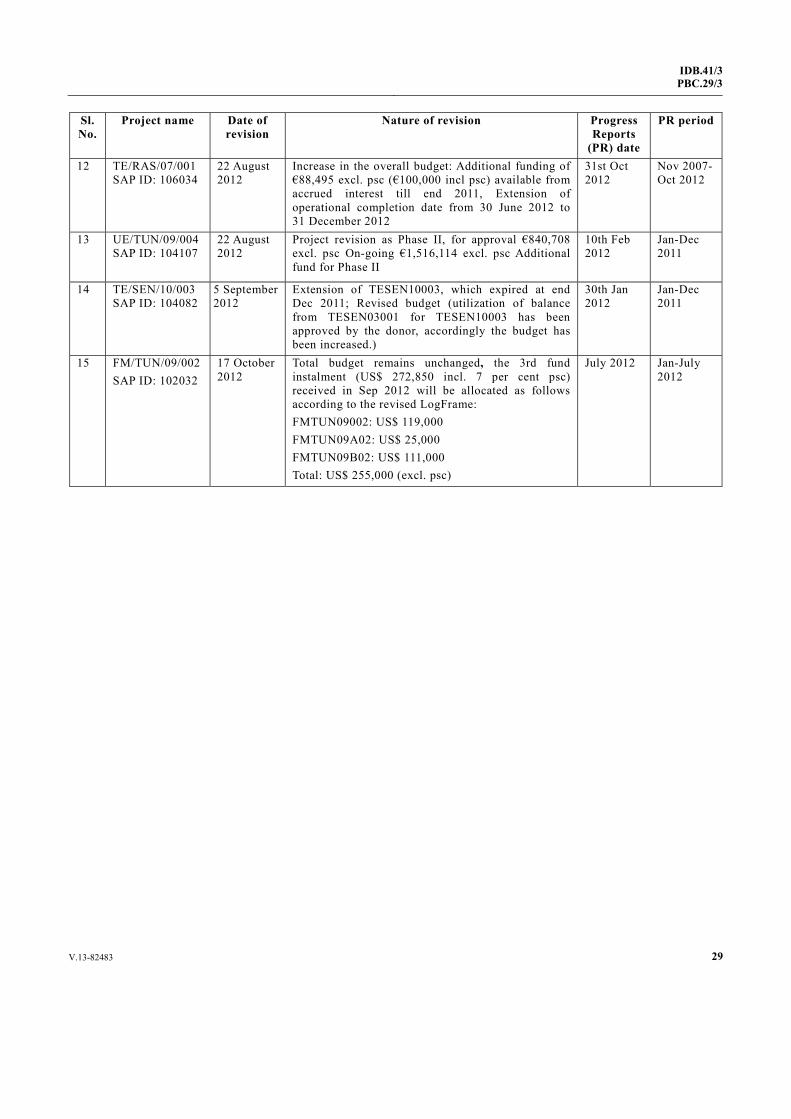
V.13-82483 29
IDB.41/3PBC.29/3
Sl. No.
Project name Date of revision
Nature of revision Progress Reports
(PR) date
PR period
12 TE/RAS/07/001 SAP ID: 106034
22 August 2012
Increase in the overall budget: Additional funding of €88,495 excl. psc (€100,000 incl psc) available from accrued interest till end 2011, Extension of operational completion date from 30 June 2012 to 31 December 2012
31st Oct 2012
Nov 2007-Oct 2012
13 UE/TUN/09/004 SAP ID: 104107
22 August 2012
Project revision as Phase II, for approval €840,708 excl. psc On-going €1,516,114 excl. psc Additional fund for Phase II
10th Feb 2012
Jan-Dec 2011
14 TE/SEN/10/003 SAP ID: 104082
5 September 2012
Extension of TESEN10003, which expired at end Dec 2011; Revised budget (utilization of balance from TESEN03001 for TESEN10003 has been approved by the donor, accordingly the budget has been increased.)
30th Jan 2012
Jan-Dec 2011
15 FM/TUN/09/002 SAP ID: 102032
17 October 2012
Total budget remains unchanged, the 3rd fund instalment (US$ 272,850 incl. 7 per cent psc) received in Sep 2012 will be allocated as follows according to the revised LogFrame: FMTUN09002: US$ 119,000 FMTUN09A02: US$ 25,000 FMTUN09B02: US$ 111,000 Total: US$ 255,000 (excl. psc)
July 2012 Jan-July 2012
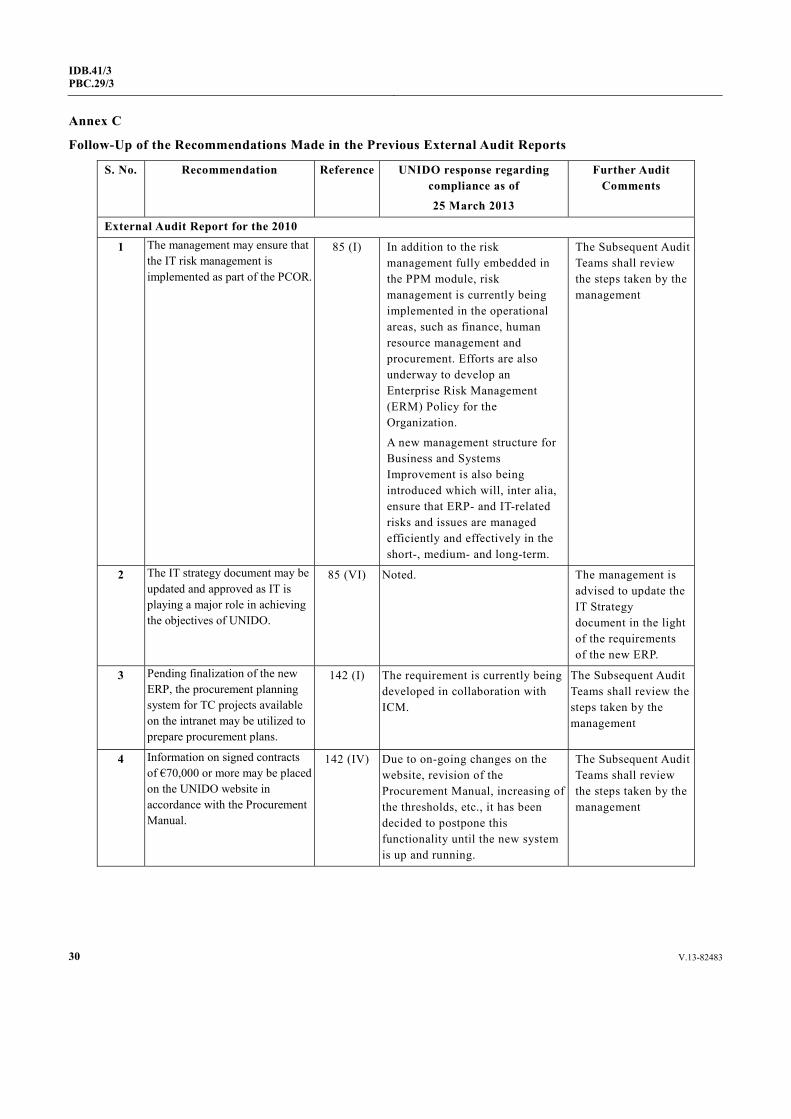
30 V.13-82483
IDB.41/3 PBC.29/3
Annex C
Follow-Up of the Recommendations Made in the Previous External Audit Reports
S. No. Recommendation Reference UNIDO response regarding compliance as of
25 March 2013
Further Audit Comments
External Audit Report for the 2010
1 The management may ensure that the IT risk management is implemented as part of the PCOR.
85 (I) In addition to the risk management fully embedded in the PPM module, risk management is currently being implemented in the operational areas, such as finance, human resource management and procurement. Efforts are also underway to develop an Enterprise Risk Management (ERM) Policy for the Organization.
A new management structure for Business and Systems Improvement is also being introduced which will, inter alia, ensure that ERP- and IT-related risks and issues are managed efficiently and effectively in the short-, medium- and long-term.
The Subsequent Audit Teams shall review the steps taken by the management
2 The IT strategy document may be updated and approved as IT is playing a major role in achieving the objectives of UNIDO.
85 (VI) Noted. The management is advised to update the IT Strategy document in the light of the requirements of the new ERP.
3 Pending finalization of the new ERP, the procurement planning system for TC projects available on the intranet may be utilized to prepare procurement plans.
142 (I) The requirement is currently being developed in collaboration with ICM.
The Subsequent Audit Teams shall review the steps taken by the management
4 Information on signed contracts of €70,000 or more may be placed on the UNIDO website in accordance with the Procurement Manual.
142 (IV) Due to on-going changes on the website, revision of the Procurement Manual, increasing of the thresholds, etc., it has been decided to postpone this functionality until the new system is up and running.
The Subsequent Audit Teams shall review the steps taken by the management

V.13-82483 31
IDB.41/3PBC.29/3
S. No. Recommendation Reference UNIDO response regarding compliance as of
25 March 2013
Further Audit Comments
5 The new ERP may be configured in such a manner that the information on all the vital statistics of contracts, including information on advance payments, is easily available from the system.
142 (V) The requirement has been captured in the reporting functionalities of the system and the report is currently being developed
The Subsequent Audit Teams shall review the steps taken by the management
External Audit Report for the 2011
6 The management completes the review of firewall policies, firewall audits and penetration tests at the earliest.
71(iii) In progress. No further action. An external company has been engaged and is optimizing the Firewall environment. Penetration testing has been budgeted for 2013.
The Subsequent Audit Teams shall review the steps taken by the management
7 ‘Scheduled’ data restoration exercises and not ‘need basis’ restoration of partial data may be undertaken till capacity issues are resolved.
71(iv) Completed. No further action. Sufficient capacity has been installed for restoration of entire backed up data.
The Subsequent Audit Teams shall review the results of data restoration exercise.
8 The management may poll all the production servers on regular intervals to ensure that all production servers receive latest updates. Subsequent audit teams shall monitor progress.
71(v) Completed. No further action. Production servers are standardized on RedHat Enterprise Linux.
The Subsequent Audit Teams shall review the steps taken by the management
9 The minimum log review requirements may be identified after risk analysis and bare minimum log management may be initiated till the capacity constraints are addressed.
71(vi) Completed. No further action. Necessary log management is being performed.
The Subsequent Audit Teams shall review the steps taken by the management
10 The management may make an in-depth review of the entire evaluation process to ascertain the reasons for declining rates of acceptance and implementation of recommendations by the project management.
105(iv) RECOMMENDATION IMPLEMENTED
(to the extend it was accepted by UNIDO management)
UNIDO response to issues raised by External Auditor: - Director General called for a meeting and invited ODG/EVA to give a presentation to UNIDO management on issues raised by External Auditor (June 2012);
The Subsequent Audit Teams shall review the steps taken by the management
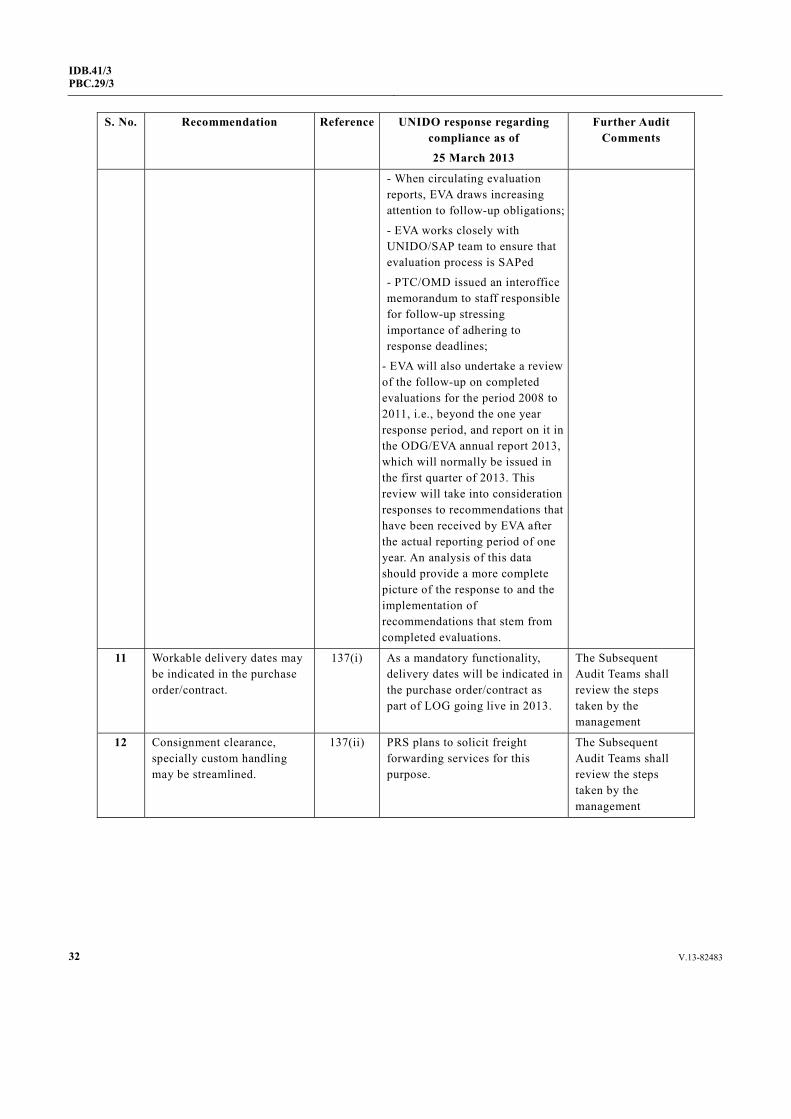
32 V.13-82483
IDB.41/3 PBC.29/3
S. No. Recommendation Reference UNIDO response regarding compliance as of
25 March 2013
Further Audit Comments
- When circulating evaluation reports, EVA draws increasing attention to follow-up obligations;
- EVA works closely with UNIDO/SAP team to ensure that evaluation process is SAPed
- PTC/OMD issued an interoffice memorandum to staff responsible for follow-up stressing importance of adhering to response deadlines;
- EVA will also undertake a review of the follow-up on completed evaluations for the period 2008 to 2011, i.e., beyond the one year response period, and report on it in the ODG/EVA annual report 2013, which will normally be issued in the first quarter of 2013. This review will take into consideration responses to recommendations that have been received by EVA after the actual reporting period of one year. An analysis of this data should provide a more complete picture of the response to and the implementation of recommendations that stem from completed evaluations.
11 Workable delivery dates may be indicated in the purchase order/contract.
137(i) As a mandatory functionality, delivery dates will be indicated in the purchase order/contract as part of LOG going live in 2013.
The Subsequent Audit Teams shall review the steps taken by the management
12 Consignment clearance, specially custom handling may be streamlined.
137(ii) PRS plans to solicit freight forwarding services for this purpose.
The Subsequent Audit Teams shall review the steps taken by the management

V.13-82483 33
IDB.41/3PBC.29/3
ANNEX I
FINANCIAL STATEMENTS FOR THE YEAR ENDED 31 DECEMBER 2012
Report by the Director General
1. I am pleased to present the financial statements prepared under IPSAS and in accordance with Article X of the financial regulations, for the year 2012.
2. The General Conference, at its twelfth session, approved the adoption of the International Public Sector Accounting Standards (IPSAS) by UNIDO effective 1 January 2010, as part of the United Nations system-wide adoption of these Standards (GC.12/Dec.14 refers) and since then, UNIDO’s financial statement are in compliance with IPSAS.
3. As permitted when IPSAS was first adopted, two transitional provisions allowed under IPSAS for (i) recognizing property, plant and equipment (IPSAS 17) for project PPE (technical cooperation PPE) and for the PPE class “buildings” and (ii) measuring revenue from non-exchange transactions for pre-2010 voluntary contributions (IPSAS 23), were used. They are expiring in 2014 and 2012, respectively.
Assessed contributions
4. The financial implementation of the approved programme and budgets is dependent on the actual level of cash resources available during the year, including the timing of payment of assessed contributions. Actual assessed contributions received and the amounts assessed in accordance with General Conference decisions with comparative figures for the previous years are shown below in millions of euros.
2012 2011 2010 2009 € % € % € % € %
Assessed contributions receivable 76.6 100.0 78.3 100.0 78.3 100.0 77.3 100.0 Assessed contributions received 67.5 88.2 69.9 89.3 74.2 94.7 73.4 94.9 Shortfall in collections 9.1 11.8 8.4 10.7 4.1 5.3 3.9 5.1
5. The rate of collection of assessed contributions for the year 2012 was 88.2 per cent, which is lower than for the year 2011 (89.3 per cent). The accumulated outstanding assessed contributions at year-end was €27.9 million, excluding an amount of €71.2 million due from former Member States, leading to a decrease from 2011 (€38.3 million). Annex I (e) provides details of status of assessed contributions. Four Member States are making payments under payment plan agreements. Brazil paid three instalments under the five-year payment plan, reducing the amount of its outstanding contributions from €16.4 million to €9.8 million. Ukraine already made two instalments and Costa Rica, one full and one partial. Moldova paid six out of ten instalments. Without a payment plan, Mexico fully paid its outstanding contributions in the amount of €11.7 million and its 2012 assessed contribution. The number of Member States without voting rights was 37 in December 2012 whereas in December 2011 it was 36. I would strongly encourage those Member States having difficulties in meeting their obligations to consider the option of a payment plan.
Performance based on budget basis
6. The adoption of IPSAS has changed the basis of preparing the Organization’s financial statements to full accrual; however, in the United Nations system as a whole there has been no change to the programme and budget preparation methodology. Consequently, IPSAS 24, Presentation of Budget Information, requires that a Statement of Comparison of Budget and Actual amounts (Statement 5) is included in the financial statements, based on budget basis.
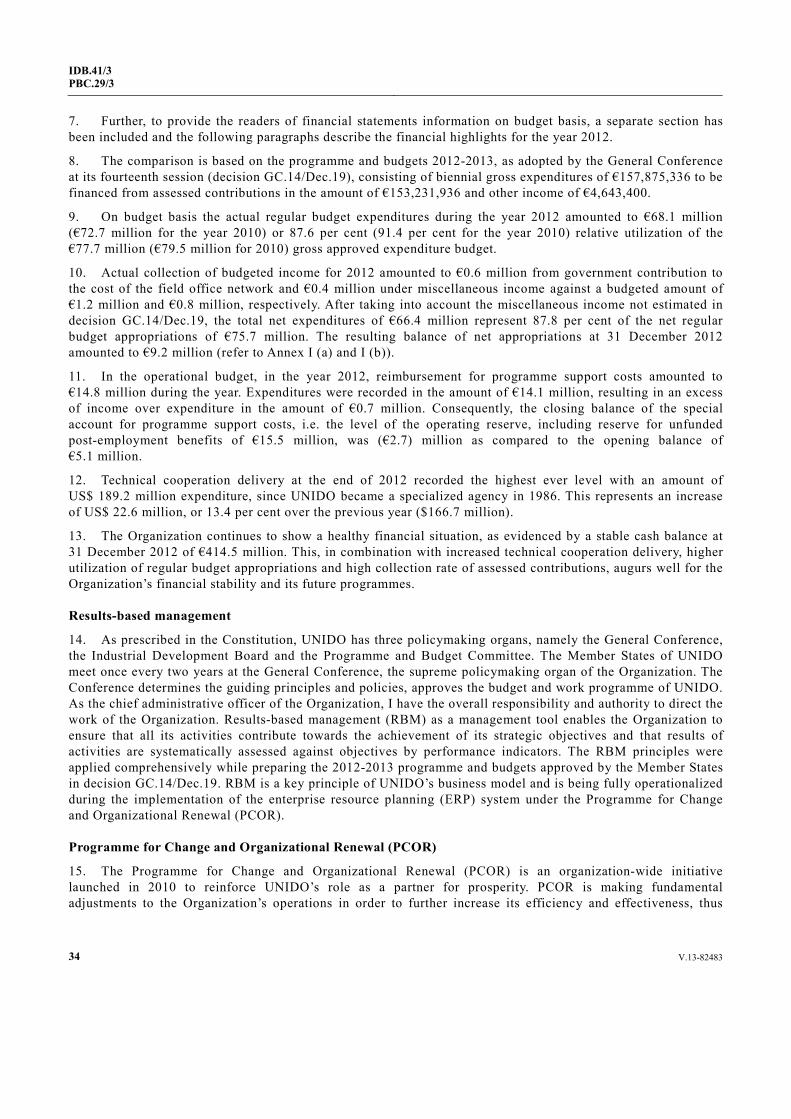
34 V.13-82483
IDB.41/3 PBC.29/3
7. Further, to provide the readers of financial statements information on budget basis, a separate section has been included and the following paragraphs describe the financial highlights for the year 2012.
8. The comparison is based on the programme and budgets 2012-2013, as adopted by the General Conference at its fourteenth session (decision GC.14/Dec.19), consisting of biennial gross expenditures of €157,875,336 to be financed from assessed contributions in the amount of €153,231,936 and other income of €4,643,400.
9. On budget basis the actual regular budget expenditures during the year 2012 amounted to €68.1 million (€72.7 million for the year 2010) or 87.6 per cent (91.4 per cent for the year 2010) relative utilization of the €77.7 million (€79.5 million for 2010) gross approved expenditure budget.
10. Actual collection of budgeted income for 2012 amounted to €0.6 million from government contribution to the cost of the field office network and €0.4 million under miscellaneous income against a budgeted amount of €1.2 million and €0.8 million, respectively. After taking into account the miscellaneous income not estimated in decision GC.14/Dec.19, the total net expenditures of €66.4 million represent 87.8 per cent of the net regular budget appropriations of €75.7 million. The resulting balance of net appropriations at 31 December 2012 amounted to €9.2 million (refer to Annex I (a) and I (b)).
11. In the operational budget, in the year 2012, reimbursement for programme support costs amounted to €14.8 million during the year. Expenditures were recorded in the amount of €14.1 million, resulting in an excess of income over expenditure in the amount of €0.7 million. Consequently, the closing balance of the special account for programme support costs, i.e. the level of the operating reserve, including reserve for unfunded post-employment benefits of €15.5 million, was (€2.7) million as compared to the opening balance of €5.1 million.
12. Technical cooperation delivery at the end of 2012 recorded the highest ever level with an amount of US$ 189.2 million expenditure, since UNIDO became a specialized agency in 1986. This represents an increase of US$ 22.6 million, or 13.4 per cent over the previous year ($166.7 million).
13. The Organization continues to show a healthy financial situation, as evidenced by a stable cash balance at 31 December 2012 of €414.5 million. This, in combination with increased technical cooperation delivery, higher utilization of regular budget appropriations and high collection rate of assessed contributions, augurs well for the Organization’s financial stability and its future programmes.
Results-based management
14. As prescribed in the Constitution, UNIDO has three policymaking organs, namely the General Conference, the Industrial Development Board and the Programme and Budget Committee. The Member States of UNIDO meet once every two years at the General Conference, the supreme policymaking organ of the Organization. The Conference determines the guiding principles and policies, approves the budget and work programme of UNIDO. As the chief administrative officer of the Organization, I have the overall responsibility and authority to direct the work of the Organization. Results-based management (RBM) as a management tool enables the Organization to ensure that all its activities contribute towards the achievement of its strategic objectives and that results of activities are systematically assessed against objectives by performance indicators. The RBM principles were applied comprehensively while preparing the 2012-2013 programme and budgets approved by the Member States in decision GC.14/Dec.19. RBM is a key principle of UNIDO’s business model and is being fully operationalized during the implementation of the enterprise resource planning (ERP) system under the Programme for Change and Organizational Renewal (PCOR).
Programme for Change and Organizational Renewal (PCOR)
15. The Programme for Change and Organizational Renewal (PCOR) is an organization-wide initiative launched in 2010 to reinforce UNIDO’s role as a partner for prosperity. PCOR is making fundamental adjustments to the Organization’s operations in order to further increase its efficiency and effectiveness, thus
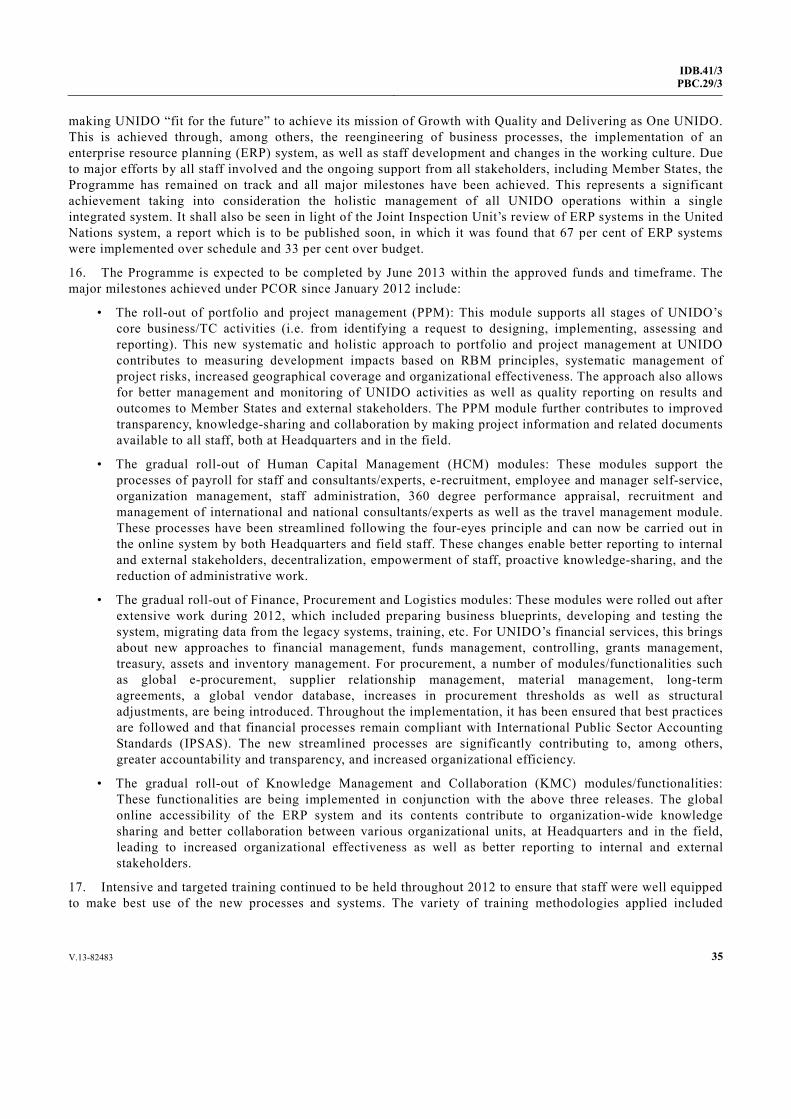
V.13-82483 35
IDB.41/3PBC.29/3
making UNIDO “fit for the future” to achieve its mission of Growth with Quality and Delivering as One UNIDO. This is achieved through, among others, the reengineering of business processes, the implementation of an enterprise resource planning (ERP) system, as well as staff development and changes in the working culture. Due to major efforts by all staff involved and the ongoing support from all stakeholders, including Member States, the Programme has remained on track and all major milestones have been achieved. This represents a significant achievement taking into consideration the holistic management of all UNIDO operations within a single integrated system. It shall also be seen in light of the Joint Inspection Unit’s review of ERP systems in the United Nations system, a report which is to be published soon, in which it was found that 67 per cent of ERP systems were implemented over schedule and 33 per cent over budget.
16. The Programme is expected to be completed by June 2013 within the approved funds and timeframe. The major milestones achieved under PCOR since January 2012 include:
• The roll-out of portfolio and project management (PPM): This module supports all stages of UNIDO’s core business/TC activities (i.e. from identifying a request to designing, implementing, assessing and reporting). This new systematic and holistic approach to portfolio and project management at UNIDO contributes to measuring development impacts based on RBM principles, systematic management of project risks, increased geographical coverage and organizational effectiveness. The approach also allows for better management and monitoring of UNIDO activities as well as quality reporting on results and outcomes to Member States and external stakeholders. The PPM module further contributes to improved transparency, knowledge-sharing and collaboration by making project information and related documents available to all staff, both at Headquarters and in the field.
• The gradual roll-out of Human Capital Management (HCM) modules: These modules support the processes of payroll for staff and consultants/experts, e-recruitment, employee and manager self-service, organization management, staff administration, 360 degree performance appraisal, recruitment and management of international and national consultants/experts as well as the travel management module. These processes have been streamlined following the four-eyes principle and can now be carried out in the online system by both Headquarters and field staff. These changes enable better reporting to internal and external stakeholders, decentralization, empowerment of staff, proactive knowledge-sharing, and the reduction of administrative work.
• The gradual roll-out of Finance, Procurement and Logistics modules: These modules were rolled out after extensive work during 2012, which included preparing business blueprints, developing and testing the system, migrating data from the legacy systems, training, etc. For UNIDO’s financial services, this brings about new approaches to financial management, funds management, controlling, grants management, treasury, assets and inventory management. For procurement, a number of modules/functionalities such as global e-procurement, supplier relationship management, material management, long-term agreements, a global vendor database, increases in procurement thresholds as well as structural adjustments, are being introduced. Throughout the implementation, it has been ensured that best practices are followed and that financial processes remain compliant with International Public Sector Accounting Standards (IPSAS). The new streamlined processes are significantly contributing to, among others, greater accountability and transparency, and increased organizational efficiency.
• The gradual roll-out of Knowledge Management and Collaboration (KMC) modules/functionalities: These functionalities are being implemented in conjunction with the above three releases. The global online accessibility of the ERP system and its contents contribute to organization-wide knowledge sharing and better collaboration between various organizational units, at Headquarters and in the field, leading to increased organizational effectiveness as well as better reporting to internal and external stakeholders.
17. Intensive and targeted training continued to be held throughout 2012 to ensure that staff were well equipped to make best use of the new processes and systems. The variety of training methodologies applied included
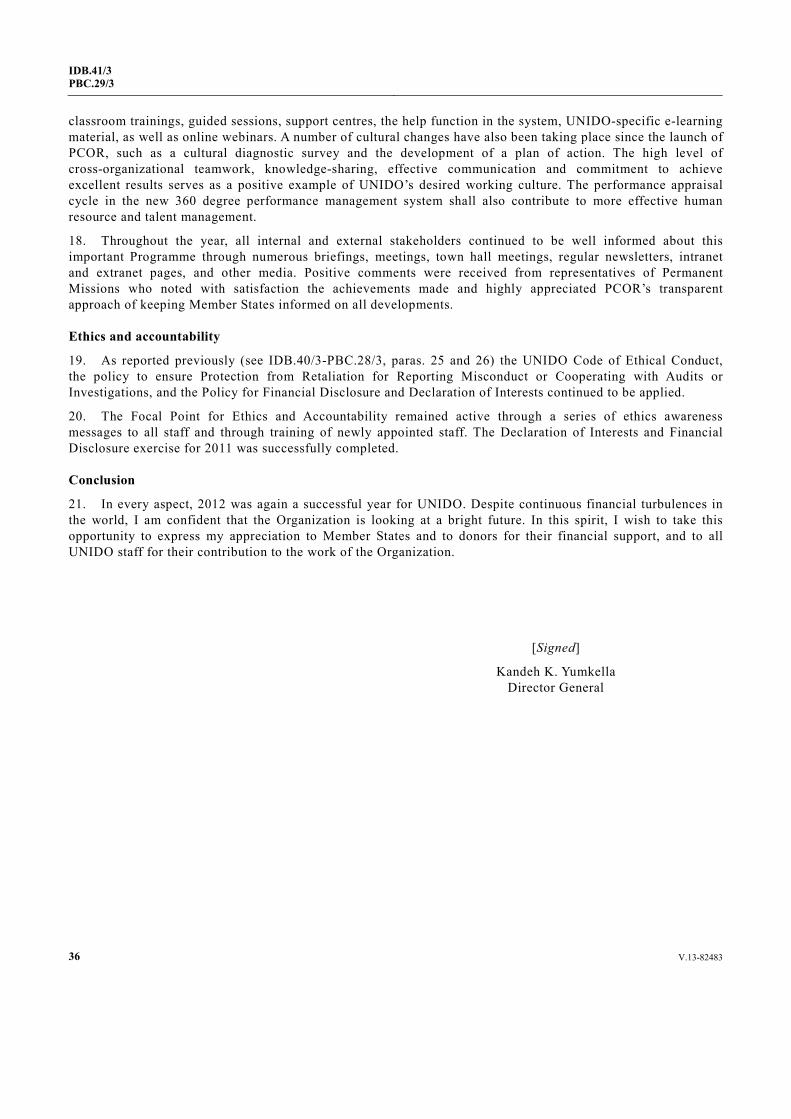
36 V.13-82483
IDB.41/3 PBC.29/3
classroom trainings, guided sessions, support centres, the help function in the system, UNIDO-specific e-learning material, as well as online webinars. A number of cultural changes have also been taking place since the launch of PCOR, such as a cultural diagnostic survey and the development of a plan of action. The high level of cross-organizational teamwork, knowledge-sharing, effective communication and commitment to achieve excellent results serves as a positive example of UNIDO’s desired working culture. The performance appraisal cycle in the new 360 degree performance management system shall also contribute to more effective human resource and talent management.
18. Throughout the year, all internal and external stakeholders continued to be well informed about this important Programme through numerous briefings, meetings, town hall meetings, regular newsletters, intranet and extranet pages, and other media. Positive comments were received from representatives of Permanent Missions who noted with satisfaction the achievements made and highly appreciated PCOR’s transparent approach of keeping Member States informed on all developments.
Ethics and accountability
19. As reported previously (see IDB.40/3-PBC.28/3, paras. 25 and 26) the UNIDO Code of Ethical Conduct, the policy to ensure Protection from Retaliation for Reporting Misconduct or Cooperating with Audits or Investigations, and the Policy for Financial Disclosure and Declaration of Interests continued to be applied.
20. The Focal Point for Ethics and Accountability remained active through a series of ethics awareness messages to all staff and through training of newly appointed staff. The Declaration of Interests and Financial Disclosure exercise for 2011 was successfully completed.
Conclusion
21. In every aspect, 2012 was again a successful year for UNIDO. Despite continuous financial turbulences in the world, I am confident that the Organization is looking at a bright future. In this spirit, I wish to take this opportunity to express my appreciation to Member States and to donors for their financial support, and to all UNIDO staff for their contribution to the work of the Organization.
[Signed]
Kandeh K. Yumkella Director General
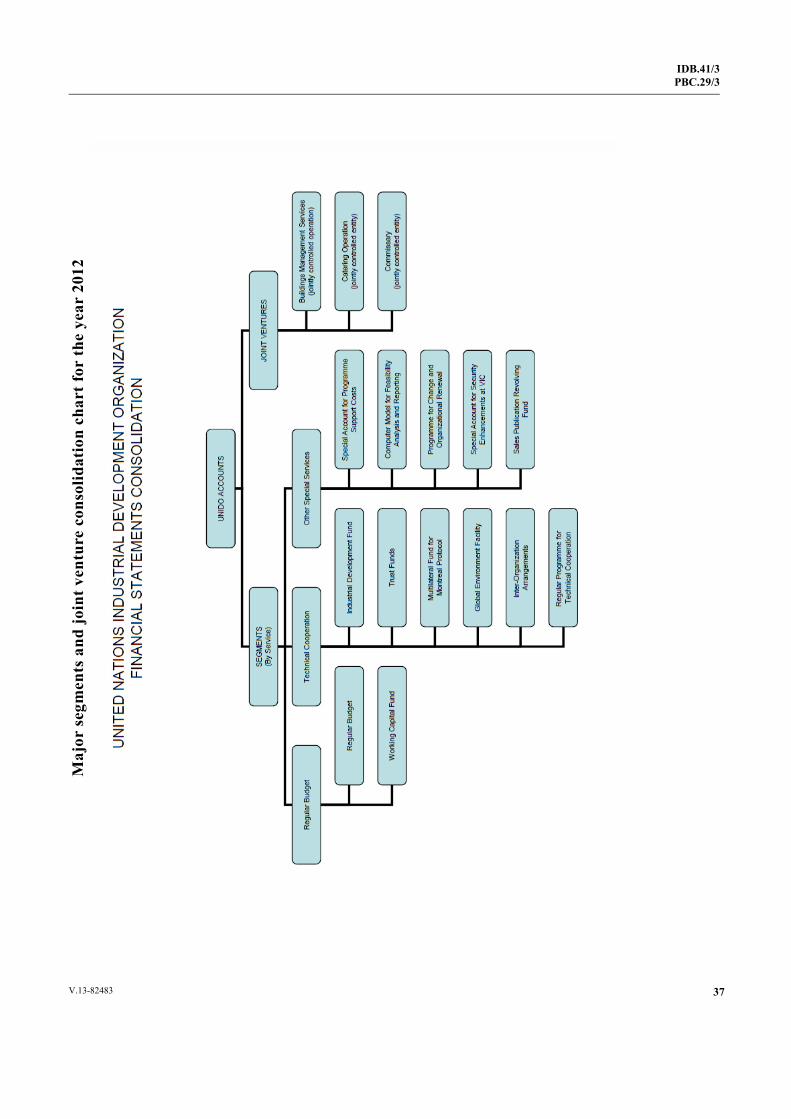
IDB.41/3PBC.29/3
37V.13-82483
Maj
or s
egm
ents
and
join
t ven
ture
con
solid
atio
n ch
art f
or th
e ye
ar 2
012
38 V.13-82483
IDB.41/3 PBC.29/3
UNITED NATIONS INDUSTRIAL DEVELOPMENT ORGANIZATION
FINANCIAL STATEMENTS FOR THE YEAR ENDED 31 DECEMBER 2012
Responsibility for financial statements and certification
The Director General of the United Nations Industrial Development Organization is responsible for the preparation and integrity of the financial statements and the External Auditor’s responsibility is to express an opinion on the statements.
The financial statements have been prepared in accordance with the International Public Sector Accounting Standards and Article X of the Financial Regulations of UNIDO and have used appropriate accounting policies, consistently applied and supported by reasonable and prudent judgements and Management’s best estimates.
The Organization maintains systems of internal accounting controls, policies and procedures to manage risks and ensure the reliability of financial information, the safeguarding of assets and to identify possible irregularities.
The internal control systems and financial records are subject to reviews by the Office of Internal Oversight Services and the External Auditor during their respective audits and the Management objectively reviews the recommendations made by them for further improving the internal control framework of the Organization.
All material transactions have been properly charged in the accounting records and are properly reflected in the appended financial statements and accompanying notes. The statements disclose with reasonable accuracy the financial position of the Organization and of funds held in trust by it, the results of their operations and the changes in their financial position.
[Signed]
Peter Ulbrich Director, Financial Services Branch
[Signed]
Kandeh K. Yumkella Director General
Vienna, 31 March 2013
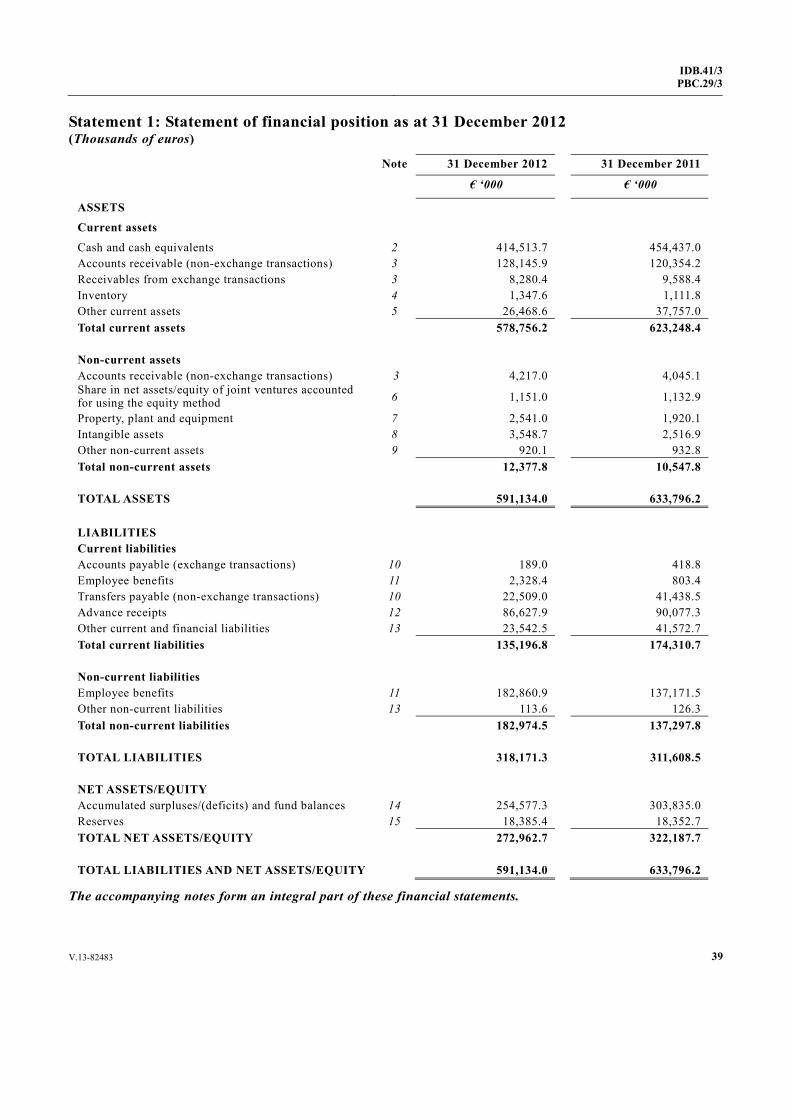
V.13-82483 39
IDB.41/3PBC.29/3
Statement 1: Statement of financial position as at 31 December 2012 (Thousands of euros)
Note 31 December 2012 31 December 2011
€ ‘000 € ‘000
ASSETS
Current assets
Cash and cash equivalents 2 414,513.7 454,437.0 Accounts receivable (non-exchange transactions) 3 128,145.9 120,354.2 Receivables from exchange transactions 3 8,280.4 9,588.4 Inventory 4 1,347.6 1,111.8 Other current assets 5 26,468.6 37,757.0 Total current assets 578,756.2 623,248.4 Non-current assets Accounts receivable (non-exchange transactions) 3 4,217.0 4,045.1 Share in net assets/equity of joint ventures accounted for using the equity method 6 1,151.0 1,132.9
Property, plant and equipment 7 2,541.0 1,920.1 Intangible assets 8 3,548.7 2,516.9 Other non-current assets 9 920.1 932.8 Total non-current assets 12,377.8 10,547.8 TOTAL ASSETS 591,134.0 633,796.2 LIABILITIES Current liabilities Accounts payable (exchange transactions) 10 189.0 418.8 Employee benefits 11 2,328.4 803.4 Transfers payable (non-exchange transactions) 10 22,509.0 41,438.5 Advance receipts 12 86,627.9 90,077.3 Other current and financial liabilities 13 23,542.5 41,572.7 Total current liabilities 135,196.8 174,310.7 Non-current liabilities Employee benefits 11 182,860.9 137,171.5 Other non-current liabilities 13 113.6 126.3 Total non-current liabilities 182,974.5 137,297.8 TOTAL LIABILITIES 318,171.3 311,608.5 NET ASSETS/EQUITY Accumulated surpluses/(deficits) and fund balances 14 254,577.3 303,835.0 Reserves 15 18,385.4 18,352.7 TOTAL NET ASSETS/EQUITY 272,962.7 322,187.7 TOTAL LIABILITIES AND NET ASSETS/EQUITY 591,134.0 633,796.2
The accompanying notes form an integral part of these financial statements.
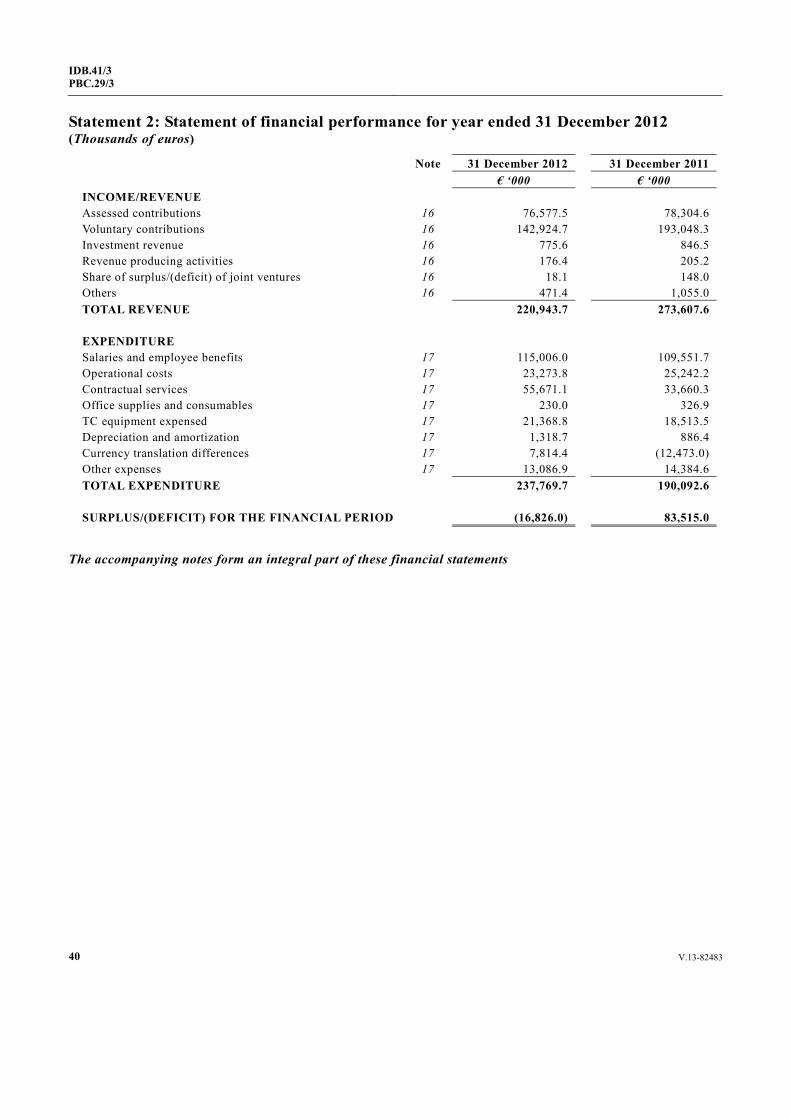
40 V.13-82483
IDB.41/3 PBC.29/3
Statement 2: Statement of financial performance for year ended 31 December 2012 (Thousands of euros)
Note 31 December 2012 31 December 2011 € ‘000 € ‘000 INCOME/REVENUE Assessed contributions 16 76,577.5 78,304.6 Voluntary contributions 16 142,924.7 193,048.3 Investment revenue 16 775.6 846.5 Revenue producing activities 16 176.4 205.2 Share of surplus/(deficit) of joint ventures 16 18.1 148.0 Others 16 471.4 1,055.0 TOTAL REVENUE 220,943.7 273,607.6 EXPENDITURE Salaries and employee benefits 17 115,006.0 109,551.7 Operational costs 17 23,273.8 25,242.2 Contractual services 17 55,671.1 33,660.3 Office supplies and consumables 17 230.0 326.9 TC equipment expensed 17 21,368.8 18,513.5 Depreciation and amortization 17 1,318.7 886.4 Currency translation differences 17 7,814.4 (12,473.0) Other expenses 17 13,086.9 14,384.6 TOTAL EXPENDITURE 237,769.7 190,092.6 SURPLUS/(DEFICIT) FOR THE FINANCIAL PERIOD (16,826.0) 83,515.0
The accompanying notes form an integral part of these financial statements
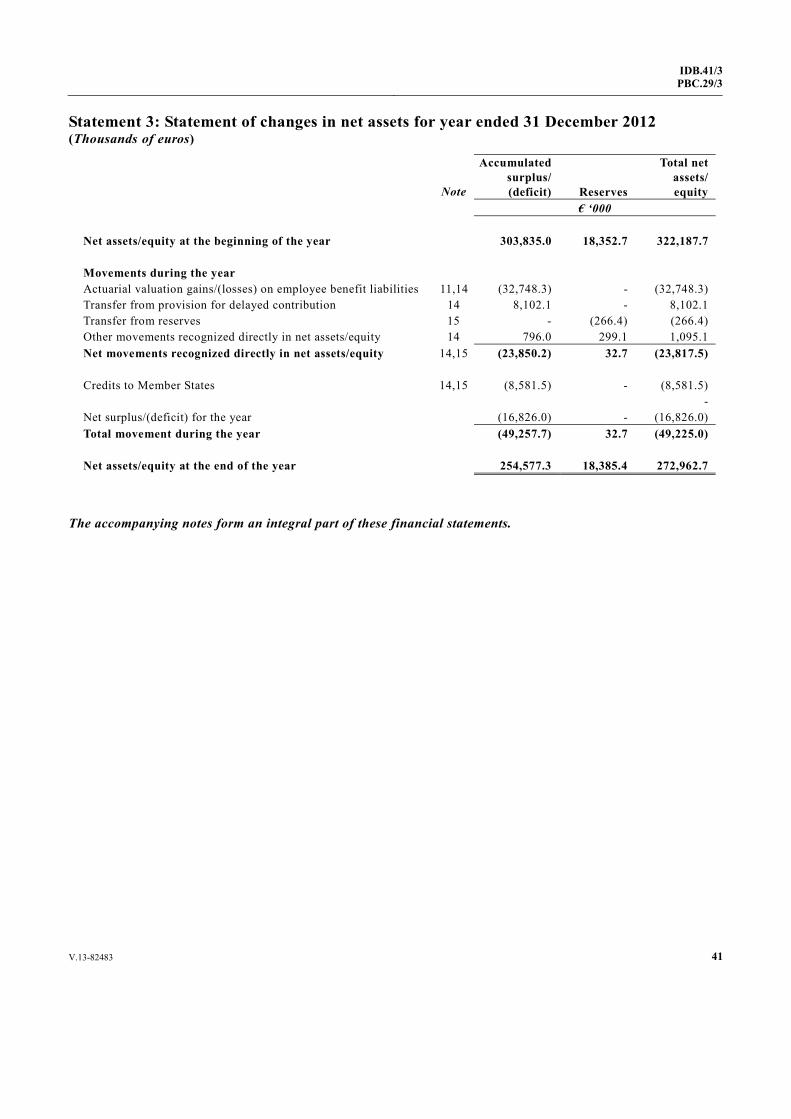
V.13-82483 41
IDB.41/3PBC.29/3
Statement 3: Statement of changes in net assets for year ended 31 December 2012 (Thousands of euros)
Note
Accumulated surplus/(deficit) Reserves
Total net assets/equity
€ ‘000 Net assets/equity at the beginning of the year 303,835.0 18,352.7 322,187.7 Movements during the year Actuarial valuation gains/(losses) on employee benefit liabilities 11,14 (32,748.3) - (32,748.3) Transfer from provision for delayed contribution 14 8,102.1 - 8,102.1 Transfer from reserves 15 - (266.4) (266.4) Other movements recognized directly in net assets/equity 14 796.0 299.1 1,095.1 Net movements recognized directly in net assets/equity 14,15 (23,850.2) 32.7 (23,817.5) Credits to Member States 14,15 (8,581.5) - (8,581.5) - Net surplus/(deficit) for the year (16,826.0) - (16,826.0) Total movement during the year (49,257.7) 32.7 (49,225.0) Net assets/equity at the end of the year 254,577.3 18,385.4 272,962.7
The accompanying notes form an integral part of these financial statements.

42 V.13-82483
IDB.41/3 PBC.29/3
Statement 4: Cash flow statement for year ended 31 December 2012 (Thousands of euros)
Note 31 December 2012 31 December 2011 € ‘000 € ‘000 Cash flows from operating activities Surplus/(deficit) for the period (16,826.0) 83,515.0 Foreign-exchange holding (gains)/losses on cash and cash equivalents
6,709.4
(8,767.9)
Depreciation and amortization 7,8 1,318.7 886.4 Increase/(decrease) in provision for delay in collection of contributions 3
(8,102.1)
(4,530.7)
Valuation gains/(losses) on employee benefit liabilities 11 (32,748.3) (8,208.5) (Increase)/decrease in inventories 4 (235.8) (12.5) (Increase)/decrease in receivables 3 1,446.5 (32,884.5) (Increase)/decrease in other assets 5 11,301.1 30,062.4 Increase/(decrease) in advance receipts 12 (3,449.4) 13,561.3 Increase/(decrease) in accounts payable 10 (19,159.3) 14,581.7 Increase/(decrease) in employee benefits 11 47,214.4 14,344.8 Increase/(decrease) in other liabilities and provisions 13 (18,042.9) (30,249.9) (Gains)/losses on sale of property, plant and equipment 7 115.2 232.3 (Investment/Interest income) 6,16 (793.7) (994.5) Movements in reserves and provisions 14,15 8,941.5 (1,269.6) Other movements (10.6) (8.3)
Net cash flows from operating activities (22,321.3) 70,257.5 Cash flows from investing activities Purchase of property, plant and equipment (PPE) 7 (1,359.4) (946.7) Purchase of intangible assets 8 (1,736.8) (1,171.6) Proceeds from sale of PPE 7 9.5 - Cash flow from investments interest 16 775.6 846.4
Net cash flows from investing activities (2,311.1) (1,271.9) Cash flows from financing activities Credits to Member States 14 (8,581.5) (15,998.2)
Net cash flows from financing activities (8,581.5) (15,998.2) Net increase/(decrease) in cash and cash equivalents (33,213.9) 52,987.4 Cash and cash equivalents at beginning of the financial period 454,437.0 392,681.7 Foreign-exchange holding gains/(losses) on cash and cash equivalents
(6,709.4)
8,767.9
Cash and cash equivalents at the end of the financial period 2 414,513.7 454,437.0
The accompanying notes form an integral part of these financial statements.
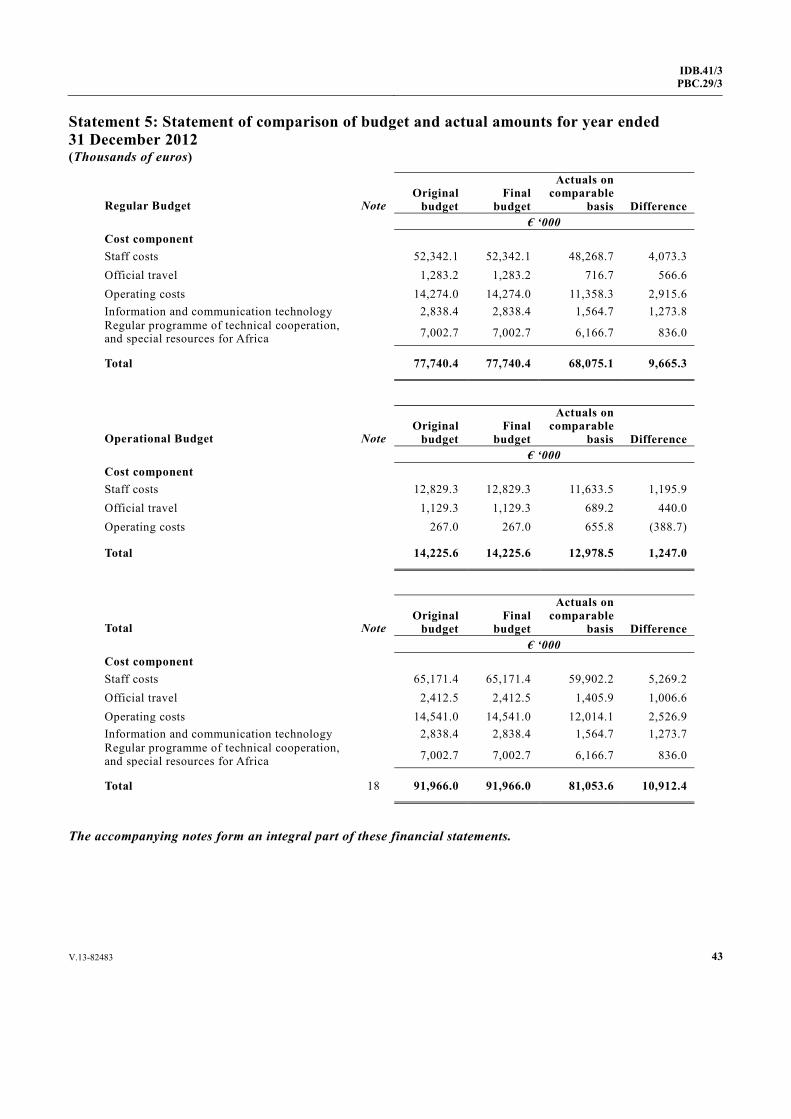
V.13-82483 43
IDB.41/3PBC.29/3
Statement 5: Statement of comparison of budget and actual amounts for year ended 31 December 2012 (Thousands of euros)
Regular Budget Note Original
budget Final
budget
Actuals on comparable
basis Difference € ‘000 Cost component Staff costs 52,342.1 52,342.1 48,268.7 4,073.3 Official travel 1,283.2 1,283.2 716.7 566.6 Operating costs 14,274.0 14,274.0 11,358.3 2,915.6 Information and communication technology 2,838.4 2,838.4 1,564.7 1,273.8 Regular programme of technical cooperation, and special resources for Africa
7,002.7 7,002.7 6,166.7 836.0
Total 77,740.4 77,740.4 68,075.1 9,665.3
Operational Budget Note Original
budget Final
budget
Actuals on comparable
basis Difference € ‘000 Cost component Staff costs 12,829.3 12,829.3 11,633.5 1,195.9 Official travel 1,129.3 1,129.3 689.2 440.0 Operating costs 267.0 267.0 655.8 (388.7)
Total 14,225.6 14,225.6 12,978.5 1,247.0
Total Note Original
budget Final
budget
Actuals on comparable
basis Difference € ‘000 Cost component Staff costs 65,171.4 65,171.4 59,902.2 5,269.2 Official travel 2,412.5 2,412.5 1,405.9 1,006.6 Operating costs 14,541.0 14,541.0 12,014.1 2,526.9 Information and communication technology 2,838.4 2,838.4 1,564.7 1,273.7 Regular programme of technical cooperation, and special resources for Africa
7,002.7 7,002.7 6,166.7 836.0
Total 18 91,966.0 91,966.0 81,053.6 10,912.4
The accompanying notes form an integral part of these financial statements.
44 V.13-82483
IDB.41/3 PBC.29/3
Notes to the financial statements
Note 1: Accounting policies
Reporting entity
1.1 The United Nations Industrial Development Organization (UNIDO) was established in 1966 by United Nations General Assembly resolution 2152 (XXI) and became a specialized agency of the United Nations in 1985 with the entering into force of its Constitution. The primary objective of the Organization is the promotion of sustainable industrial development in developing countries and countries with economies in transition. The Organization currently has 172 Member States.
1.2 UNIDO has three governing bodies: the General Conference, the Industrial Development Board and the Programme and Budget Committee. All three are anchored in the Constitution of the Organization, which was adopted in 1979.
1.3 The General Conference, which comprises all Member States of UNIDO, determines the guiding principles and policies of the Organization, and approves its budget and work programme. Every four years, the General Conference appoints the Director General. The General Conference also elects the members of the Industrial Development Board and of the Programme and Budget Committee.
1.4 The Industrial Development Board, which comprises 53 members, reviews the implementation of the work programme, the regular and operational budgets, and makes recommendations on policy matters, including the appointment of the Director General. The Board meets once per year (decision IDB.39/Dec.7(f)).
1.5 The Programme and Budget Committee consisting of 27 members is a subsidiary organ of the Board, and meets once a year. The Committee assists the Board in the preparation and examination of the work programme, the budget and other financial matters.
1.6 UNIDO channels its technical cooperation activities into three thematic priority areas — poverty reduction through productive activities, trade capacity-building and environment and energy. In addition, it engages in a number of cross-cutting activities, especially in promoting South-South cooperation for industrial development, partnerships with international financial institutions and the private sector, special programme for the least developed countries and strategic industrial research and statistical services.
1.7 The segments sections in the notes provide further details on how these core activities are managed and financed.
Basis of preparation
1.8 The financial statements of UNIDO are maintained in accordance with Article X of the Financial Regulations of UNIDO, as adopted by the General Conference and in conformity with the International Public Sector Accounting Standards (IPSAS). Accordingly, the financial statements are prepared on the accrual basis of accounting. Where IPSAS is silent concerning any specific matter, the appropriate International Financial Reporting Standards (IFRS) and International Accounting Standards (IAS) are applied.
1.9 UNIDO senior management has made an assessment of the entity’s ability to continue as a going concern and it notes no material uncertainties related to events or conditions which may cast significant doubt. The going-concern concept in accounting is an assumption that a business will continue to exist for the foreseeable future. Therefore, these financial statements are prepared on a going-concern basis, and the accounting policies have been applied consistently throughout the reporting period.
V.13-82483 45
IDB.41/3PBC.29/3
1.10 These consolidated financial statements include financial statements of UNIDO and joint venture entities of Catering and Commissary and joint venture operations of Building Management Services and other common services.
Measurement basis
1.11 The financial statements are prepared using the historic cost convention except for certain investments and assets, which are carried at fair value according to the requirement of the applicable IPSAS standards.
Reporting period
1.12 The financial period for the preparation of annual financial statements in accordance with IPSAS is the calendar year starting from 1 January 2012 and ending on 31 December 2012.
Currency and basis for conversion
1.13 The functional and presentation currency of UNIDO is euro. All values in the financial statements are in thousands of euro (€’000), unless stated otherwise.
Translation and conversion of currencies
1.14 Transactions, including non-monetary items, in currencies other than euro are converted to euros using the applicable United Nations Operational Rates of Exchange (UNORE) at the deemed date of the transaction.
1.15 Monetary assets and liabilities denominated in foreign currencies are converted into euro at the period end UNORE.
1.16 Foreign exchange gains and losses resulting from the settlement of foreign currency transactions and from the translation at period end exchange rates of monetary assets and liabilities denominated in foreign currencies are recognized in the statement of financial performance.
Use of estimates
1.17 The financial statements necessarily include amounts based on estimates and assumptions by management’s best knowledge of current events and actions. Estimates include, but are not limited to: fair value of donated goods, defined benefit pension and other post-employment benefit obligations, amounts for litigations, financial risk on accounts receivable, accrued charges, contingent assets and liabilities; and degree of impairment on inventories, property, plant and equipment, and intangibles. Actual results could differ from those estimates. Material changes in estimates are reflected in the period in which they become known.
Transitional provisions
1.18 As permitted on first time adoption of IPSAS, the following transitional provisions allowed under IPSAS have been applied.
(i) Five-year transitional period, allowed under IPSAS 17 for recognizing property, plant and equipment, for project PPE (Technical Cooperation PPE) and for the PPE class “Buildings”;
(ii) Three-year transitional provision, allowed under IPSAS 23 for measuring revenue from non-exchange transactions for pre-2010 voluntary contributions.
1.19 UNIDO has not applied the following new IPSAS that have been issued, but are not yet effective: IPSAS 28 — Financial Instruments: Presentation, IPSAS 29 — Financial Instruments: Recognition and Measurement and IPSAS 30 — Financial Instruments: Disclosures. The Standards on Financial Instruments will replace IPSAS 15: Financial Instruments: Disclosure and Presentation; they establish principles for recognizing and measuring
46 V.13-82483
IDB.41/3 PBC.29/3
financial assets and financial liabilities, principles for presenting financial instruments as liabilities or net asset/equity, principles for off-setting financial assets and financial liabilities, and requirements for disclosure.
1.20 The Standards are required for application for reporting periods beginning on or after 1 January 2013. On initial application of the Standards, the expected impact on financial statements is minimal, due to limited usage of financial instruments by UNIDO.
Revenue
Exchange revenue
1.21 Revenue from the sale of goods, such as sales of publications and the Computer Model for Feasibility Analysis and Reporting (COMFAR) is recognized when the significant risks and rewards of ownership of the goods are transferred to the purchaser.
1.22 Revenue from the provision of services is recognized in the financial period, in which the service is rendered according to the estimated stage of completion of that service, provided that the outcome can be estimated reliably.
Interest revenue
1.23 Interest income is recognized on a time-proportion basis as it accrues, taking into account the effective yield on the asset.
Non-exchange revenue
Assessed contributions
1.24 Revenue from assessed contributions from Member States to the regular budget is recognized at the beginning of the year to which the assessment relates. The revenue amount is determined based on programme and budgets and billed to Member States according to scale of assessment approved by the General Conference.
Voluntary contributions
1.25 Revenue from voluntary contributions that include restrictions on their use is recognized upon the signing of a binding agreement between UNIDO and the donor providing the contribution. Revenue from voluntary contributions that include conditions on their use, including obligation to return of funds to the contributing entity if such conditions are not met, is recognized as the conditions are satisfied. Until such conditions are met, present obligation is recognized as a liability.
1.26 Voluntary contributions and other revenue, which are not supported by binding agreements, are recognized as revenue when received.
Goods-in-kind
1.27 Goods-in-kind contributions are recognized at their fair value and goods and corresponding revenue is recognized immediately if no condition is attached. If conditions are attached, a liability is recognized, until such conditions are met and present obligation is satisfied. Revenue is recognized at fair value, measured as of the date the donated assets are acquired.
Services-in-kind
1.28 Services-in-kind contributions will not be recognized in the financial statements as revenue. The nature and type of services will be disclosed in the notes to the financial statements.
V.13-82483 47
IDB.41/3PBC.29/3
Expenses
1.29 Expenses arising from the purchase of goods and services are recognized at the point that the supplier has performed its contractual obligations, which is when the goods and services are received and accepted by UNIDO. This process may occur in stages for some service contracts. Also, all other expenses resulting from a consumption of assets or incurrence of liabilities that result in decreases in net assets/equity during the reporting period are recognized.
Assets
Cash and cash equivalents
1.30 Cash and cash equivalents are held at nominal value and include cash on hand and short-term highly liquid time deposits held with financial institutions.
Receivables and advances
1.31 Receivables and advances are recognized initially at nominal value. Allowances for estimated irrecoverable amounts are recognized for receivables and advances when there is objective evidence that the asset is impaired, whereby the impairment losses are recognized in the statement of financial performance.
Financial instruments
1.32 UNIDO uses only non-derivative financial instruments as part of its normal operations. These financial instruments consist mainly of bank accounts, time deposits, call accounts, accounts receivable and accounts payable.
1.33 All financial instruments are recognized in the statement of financial position at their fair values. The historical cost-carrying amount of receivables and payables subject to normal trade credit terms, approximates the fair value of the transaction.
Financial risks
1.34 UNIDO has instituted prudent risk management policies and procedures in accordance with its financial regulations and rules. UNIDO may make both short- and long-term investments of moneys not needed for immediate requirements. All long-term investments must receive recommendation of an Investment Committee before such investments are made. In the normal course of business, UNIDO is exposed to a variety of financial risks, such as market risk (foreign currency exchange and interest rate), and counterparty risks. UNIDO does not use any hedging instruments to hedge risk exposures.
Currency risk: UNIDO receives contributions from member countries and donors partly in currencies other than the currency of the expenditures and is therefore exposed to foreign currency exchange risk arising from fluctuations of currency exchange rates.
Interest rate risk: UNIDO deposits its funds only in short-term fixed interest accounts, and therefore has no significant interest rate risk exposure.
Credit risk: UNIDO has no significant exposure to credit risk because its contributing member countries and donors are generally of high credit standing.
Counter-party risk: UNIDO has its cash deposited with various banks and is therefore exposed to the risk that a bank defaults in its obligation towards the Organization. However, UNIDO has policies that limit the amount of exposure to any one financial institution.
48 V.13-82483
IDB.41/3 PBC.29/3
Inventories
1.35 Inventories are stated at cost, except where inventories are acquired through a non-exchange transaction, where their cost is measured at their fair value as at the date of acquisition. Costs are assigned using the first-in, first-out (FIFO) basis for interchangeable items of inventory, and using specific identification for non-interchangeable items of inventory. A provision for impairment is recorded in the statement of financial performance in the year in which the inventory is determined to be impaired.
1.36 As the value of office supplies, publications and reference material used are not material; they are expensed on purchase in the statement of financial performance.
Property, plant and equipment
1.37 Initial recognition of regular budget PPE, including Buildings Management and Catering Services assets, are stated at cost as at the date of acquisition for each asset class. Subsequent carrying amount of PPE is at cost less accumulated depreciation and any recognized impairment losses. A capitalization threshold of €600 has been set for PPE.
1.38 Donated assets are valued at fair value as at the date of acquisition. Heritage assets are not recognized.
1.39 Impairment reviews are undertaken for PPE on a yearly basis.
1.40 Straight-line depreciation method is applied over the asset’s estimated useful life to determine the annual depreciation charge, which is recognized in the statement of financial performance.
The estimated useful lives for each class of PPE are as follows:
Class Estimated useful lives (years)
Vehicles 3-10 Communications and IT equipment 3-7 Furniture and fixtures 5-12 Machinery 4-15 Buildings 5-50 Land No depreciation Leasehold improvements Shorter of lease term or useful life
Intangible assets
1.41 Intangible assets are stated at cost less accumulated amortization and any impairment loss. Intangible assets in UNIDO comprise mainly of software.
1.42 Where an intangible asset is acquired at no cost (gift, donation) or for nominal cost, the fair value of the asset as of the date of acquisition is used.
1.43 The following criteria shall also be met for an item to be recognized as an intangible asset: (a) An estimated useful life of more than one year; and (b) cost of the asset exceeding €1,700, except for internally developed software where a minimum development cost is set at €25,000, excluding research and maintenance costs, which are expensed when incurred.
V.13-82483 49
IDB.41/3PBC.29/3
1.44 Amortization is provided over the estimated useful life using the straight-line method. The estimated useful lives for intangible asset classes are as follows:
Class Estimated useful life (years)
Software acquired externally 6 Software internally developed 6 Copyrights 3
Leases
1.45 Lease agreements entered into in field offices are classified as operating leases and the lease payments made are charged to the statement of financial performance as expense, on a straight-line basis over the period of the lease.
Interests in joint ventures
1.46 A joint venture is a contractual arrangement whereby UNIDO and one or more parties undertake an economic activity that is subject to joint control. Joint venture activities are classified into three different forms:
(i) For jointly controlled operations where UNIDO is the operator, UNIDO recognizes in its financial statements the assets it controls, the liabilities and expenses it incurs. Where another organization is the operator, the expense and liability recognition of UNIDO is limited to the agreed billing arrangements;
(ii) For jointly controlled assets, UNIDO recognizes its share of the asset and any associated depreciation;
(iii) For jointly controlled entities, UNIDO applies the equity method of accounting. The investment in the jointly controlled entity is initially recognized at cost, and the carrying amount is increased or decreased to recognize the UNIDO share of the surplus or deficit of the jointly controlled entity for each reporting period. The UNIDO share of that surplus or deficit of the jointly controlled entity is recognized in the statement of financial performance of UNIDO.
1.47 These general purpose financial statements include applicable share of the joint ventures, entities and operations established by a memorandum of understanding concerning the allocation of the common services at Vienna International Centre (VIC) entered into by the Vienna-based organizations in 1977. The common services include Catering, Buildings Management, Commissary and other services. UNIDO is party to a joint venture arrangement with the United Nations (UN), International Atomic Energy Agency (IAEA) and Preparatory Commission for the Comprehensive Nuclear Test-Ban-Treaty Organization (CTBTO) on the VIC premises and common service activities.
Liabilities
Accounts payable and other financial liabilities
1.48 Accounts payable and other financial liabilities are recognized initially at nominal value, that best estimates the amount required to settle the obligation at the reporting date.
Employee benefit liabilities
Short-term employee benefits
1.49 Short-term employee benefits comprise wages, salaries, allowances, paid sick leave and maternity leave. Short-term employee benefits are due to be settled within 12 months after the end of the period in which the
50 V.13-82483
IDB.41/3 PBC.29/3
employees render the related service and are measured at their nominal value based on accrued entitlements at current rates of pay.
Post-employment benefits
1.50 Post-employment benefits are employee benefits (other than termination benefits) that are payable after completion of employment.
1.51 Post-employment benefits at UNIDO comprise defined benefit plans, comprising of pension plan — United Nations Joint Staff Pension Fund (UNJSPF), After-Service Health Insurance (ASHI), repatriation grants and end-of-service allowances, along with costs related to separation entitlements for travel and shipment of household effects.
1.52 The post-employment benefit obligations are calculated by independent actuaries using the projected unit credit method. The present value of the obligation is determined by discounting the estimated future payment required to settle the obligation resulting from employee service rendered in the current and prior periods, using interest rates of high quality corporate bonds for the corresponding maturity years.
1.53 Actuarial gains and losses are recognized on the reserve method in the period in which they occur, and shown as a separate item in the statement of changes in net assets/equity.
Other long-term employee benefits
1.54 Other long-term employee benefits that are largely payable beyond 12 months, such as commutation of annual leave are calculated on the same actuarial basis as post-employment benefits and actuarial gains and losses are recognized immediately.
United Nations Joint Staff Pension Fund
1.55 UNIDO is a member organization participating in the UNJSPF, which was established by the United Nations General Assembly to provide retirement, death, disability and related benefits. The Pension Fund is a funded, multi-employer defined benefit plan. As specified by Article 3(b) of the Regulations of the Fund, membership in the Fund shall be open to the specialized agencies and to any other international, intergovernmental organization which participates in the common system of salaries, allowances and other conditions of service of the United Nations and the specialized agencies.
1.56 The plan exposes participating organizations to actuarial risks associated with the current and former employees of other organizations participating in the Fund, with the result that there is no consistent and reliable basis for allocating the obligation, plan assets, and costs to individual organizations participating in the plan. UNIDO, in line with the other participating organizations in the Fund, is not in a position to identify its share of the underlying financial position and performance of the plan with sufficient reliability for accounting purposes, and hence has treated this plan as if it were a defined contribution plan in line with the requirements of IPSAS 25. Contributions to the plan during the financial period are recognized as expenses in the statement of financial performance.
Provisions and contingent liabilities
1.57 Provisions are recognized for contingent liabilities when UNIDO has a present legal or constructive obligation as a result of past events, it is more likely than not that an outflow of resources will be required to settle that obligation, and the amount can be reliably estimated. The amount of the provision is the best estimate of the expenditure required to settle the present obligation at the reporting date. The estimate is discounted where the effect of the time value of money is material.
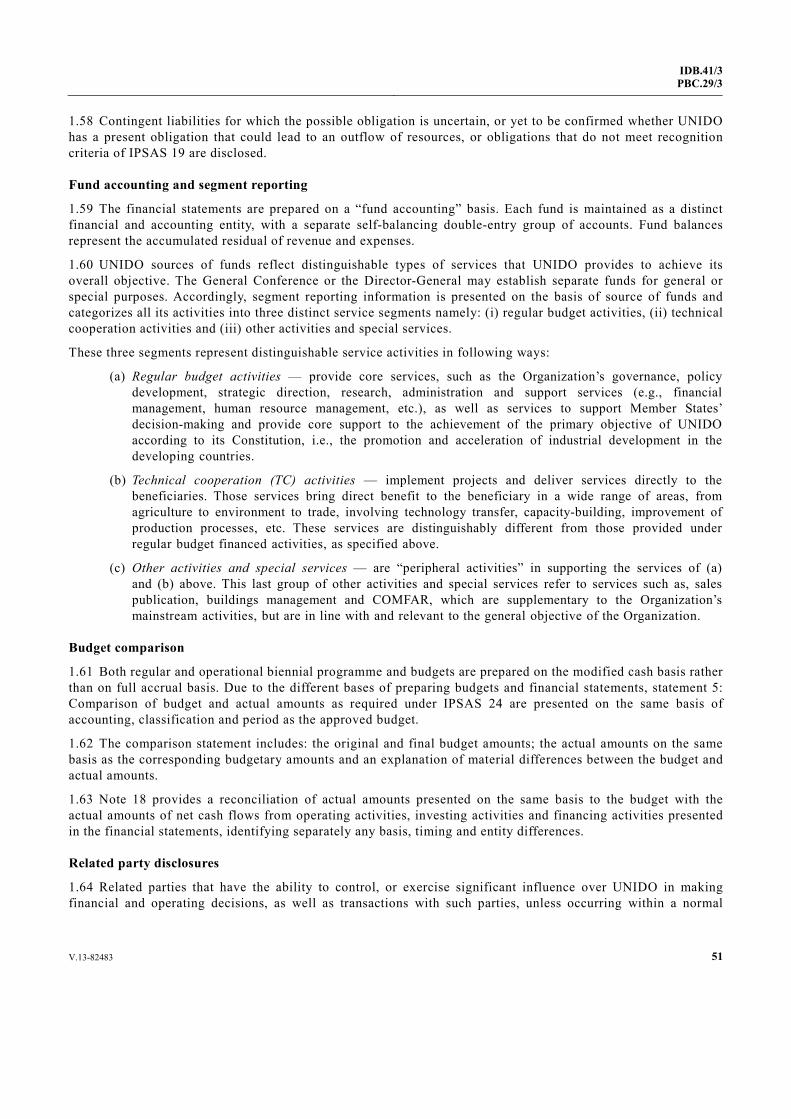
V.13-82483 51
IDB.41/3PBC.29/3
1.58 Contingent liabilities for which the possible obligation is uncertain, or yet to be confirmed whether UNIDO has a present obligation that could lead to an outflow of resources, or obligations that do not meet recognition criteria of IPSAS 19 are disclosed.
Fund accounting and segment reporting
1.59 The financial statements are prepared on a “fund accounting” basis. Each fund is maintained as a distinct financial and accounting entity, with a separate self-balancing double-entry group of accounts. Fund balances represent the accumulated residual of revenue and expenses.
1.60 UNIDO sources of funds reflect distinguishable types of services that UNIDO provides to achieve its overall objective. The General Conference or the Director-General may establish separate funds for general or special purposes. Accordingly, segment reporting information is presented on the basis of source of funds and categorizes all its activities into three distinct service segments namely: (i) regular budget activities, (ii) technical cooperation activities and (iii) other activities and special services.
These three segments represent distinguishable service activities in following ways:
(a) Regular budget activities — provide core services, such as the Organization’s governance, policy development, strategic direction, research, administration and support services (e.g., financial management, human resource management, etc.), as well as services to support Member States’ decision-making and provide core support to the achievement of the primary objective of UNIDO according to its Constitution, i.e., the promotion and acceleration of industrial development in the developing countries.
(b) Technical cooperation (TC) activities — implement projects and deliver services directly to the beneficiaries. Those services bring direct benefit to the beneficiary in a wide range of areas, from agriculture to environment to trade, involving technology transfer, capacity-building, improvement of production processes, etc. These services are distinguishably different from those provided under regular budget financed activities, as specified above.
(c) Other activities and special services — are “peripheral activities” in supporting the services of (a) and (b) above. This last group of other activities and special services refer to services such as, sales publication, buildings management and COMFAR, which are supplementary to the Organization’s mainstream activities, but are in line with and relevant to the general objective of the Organization.
Budget comparison
1.61 Both regular and operational biennial programme and budgets are prepared on the modified cash basis rather than on full accrual basis. Due to the different bases of preparing budgets and financial statements, statement 5: Comparison of budget and actual amounts as required under IPSAS 24 are presented on the same basis of accounting, classification and period as the approved budget.
1.62 The comparison statement includes: the original and final budget amounts; the actual amounts on the same basis as the corresponding budgetary amounts and an explanation of material differences between the budget and actual amounts.
1.63 Note 18 provides a reconciliation of actual amounts presented on the same basis to the budget with the actual amounts of net cash flows from operating activities, investing activities and financing activities presented in the financial statements, identifying separately any basis, timing and entity differences.
Related party disclosures
1.64 Related parties that have the ability to control, or exercise significant influence over UNIDO in making financial and operating decisions, as well as transactions with such parties, unless occurring within a normal
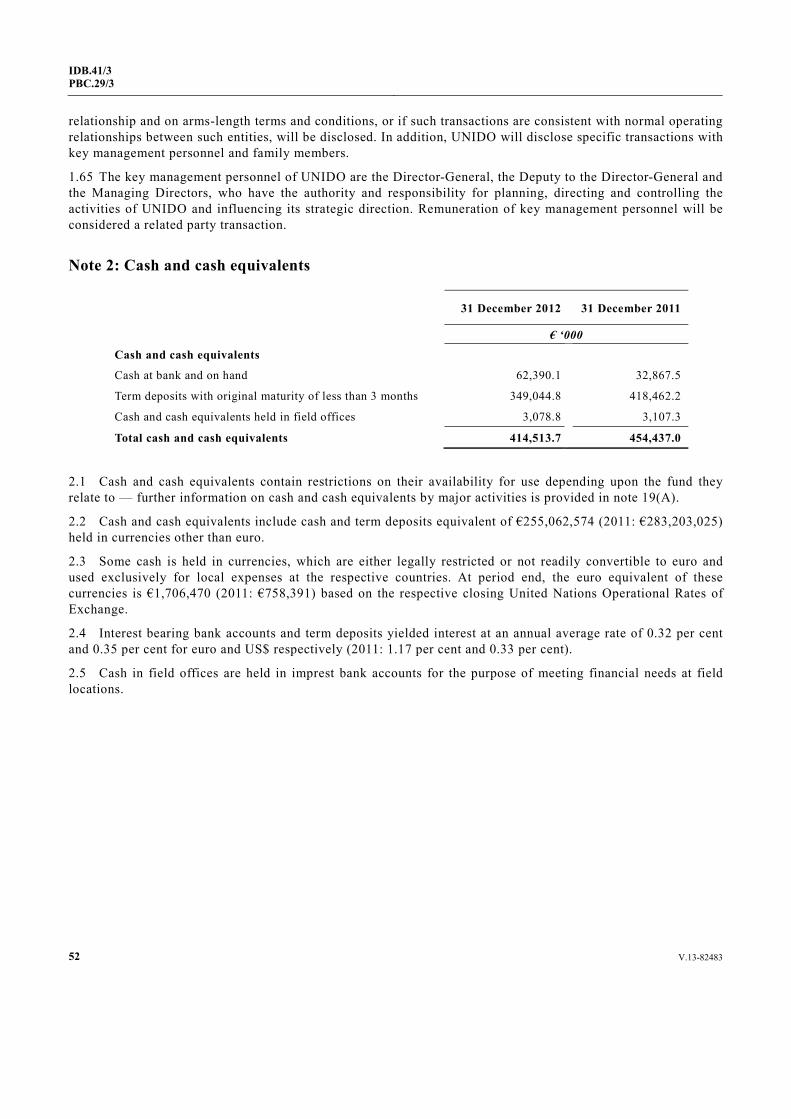
52 V.13-82483
IDB.41/3 PBC.29/3
relationship and on arms-length terms and conditions, or if such transactions are consistent with normal operating relationships between such entities, will be disclosed. In addition, UNIDO will disclose specific transactions with key management personnel and family members.
1.65 The key management personnel of UNIDO are the Director-General, the Deputy to the Director-General and the Managing Directors, who have the authority and responsibility for planning, directing and controlling the activities of UNIDO and influencing its strategic direction. Remuneration of key management personnel will be considered a related party transaction.
Note 2: Cash and cash equivalents
31 December 2012 31 December 2011
€ ‘000 Cash and cash equivalents
Cash at bank and on hand 62,390.1 32,867.5
Term deposits with original maturity of less than 3 months 349,044.8 418,462.2
Cash and cash equivalents held in field offices 3,078.8 3,107.3
Total cash and cash equivalents 414,513.7 454,437.0
2.1 Cash and cash equivalents contain restrictions on their availability for use depending upon the fund they relate to — further information on cash and cash equivalents by major activities is provided in note 19(A).
2.2 Cash and cash equivalents include cash and term deposits equivalent of €255,062,574 (2011: €283,203,025) held in currencies other than euro.
2.3 Some cash is held in currencies, which are either legally restricted or not readily convertible to euro and used exclusively for local expenses at the respective countries. At period end, the euro equivalent of these currencies is €1,706,470 (2011: €758,391) based on the respective closing United Nations Operational Rates of Exchange.
2.4 Interest bearing bank accounts and term deposits yielded interest at an annual average rate of 0.32 per cent and 0.35 per cent for euro and US$ respectively (2011: 1.17 per cent and 0.33 per cent).
2.5 Cash in field offices are held in imprest bank accounts for the purpose of meeting financial needs at field locations.
V.13-82483 53
IDB.41/3PBC.29/3
Note 3: Accounts receivable
Current 31 December 2012 31 December 2011
€ ‘000
Receivable from non-exchange transactions Due from Member States – assessed contribution 92,537.8 99,278.4 Due from Member States – other 98.0 96.6 Voluntary contributions receivable 119,868.2 110,981.3 VAT and other taxes recoverable 4,002.1 2,641.8 Total accounts receivable before allowance 216,506.1 212,998.1 Allowance for doubtful accounts (88,360.2) (92,643.9)
Net accounts receivable from non-exchange transactions
128,145.9 120,354.2
Receivable from exchange transactions Receivables from United Nations organizations 5,796.7 4,125.5 Receivables – other 3,207.5 6,186.7 Allowance for doubtful accounts (723.8) (723.8) Net accounts receivable from exchange transactions 8,280.4 9,588.4
Non-current 31 December 2012 31 December 2011
€ ‘000 Receivable from non-exchange transactions Due from Member States – assessed contribution 6,553.9 10,200.4 Allowance for doubtful accounts (2,336.9) (6,155.3) Total receivable from non-exchange transactions 4,217.0 4,045.1
3.1 Accounts receivable are shown net of adjustments related to doubtful accounts. Allowance for uncollected assessed contributions is based on historical experience and is estimated at the following percentages of outstanding contributions receivable. No allowance has been made for voluntary contributions receivable.
Assessed contributions outstanding for: 2012 2011
% % More than 6 years 100 100 Between 4 and 6 years 80 80 Between 2 and 4 years 60 60 Between 1 and 2 years 30 30
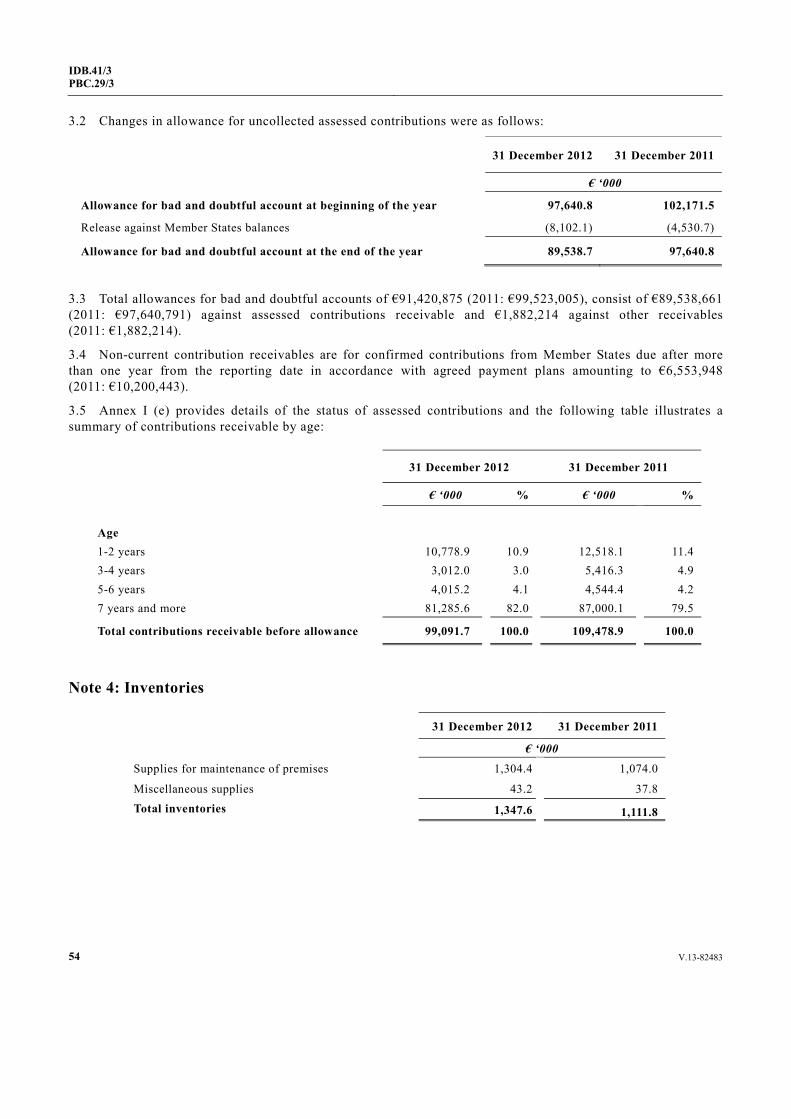
54 V.13-82483
IDB.41/3 PBC.29/3
3.2 Changes in allowance for uncollected assessed contributions were as follows:
31 December 2012 31 December 2011
€ ‘000
Allowance for bad and doubtful account at beginning of the year 97,640.8 102,171.5
Release against Member States balances (8,102.1) (4,530.7)
Allowance for bad and doubtful account at the end of the year 89,538.7 97,640.8
3.3 Total allowances for bad and doubtful accounts of €91,420,875 (2011: €99,523,005), consist of €89,538,661 (2011: €97,640,791) against assessed contributions receivable and €1,882,214 against other receivables (2011: €1,882,214).
3.4 Non-current contribution receivables are for confirmed contributions from Member States due after more than one year from the reporting date in accordance with agreed payment plans amounting to €6,553,948 (2011: €10,200,443).
3.5 Annex I (e) provides details of the status of assessed contributions and the following table illustrates a summary of contributions receivable by age:
31 December 2012 31 December 2011
€ ‘000 % € ‘000 %
Age 1-2 years 10,778.9 10.9 12,518.1 11.4 3-4 years 3,012.0 3.0 5,416.3 4.9 5-6 years 4,015.2 4.1 4,544.4 4.2 7 years and more 81,285.6 82.0 87,000.1 79.5
Total contributions receivable before allowance 99,091.7 100.0 109,478.9 100.0
Note 4: Inventories
31 December 2012 31 December 2011
€ ‘000
Supplies for maintenance of premises 1,304.4 1,074.0
Miscellaneous supplies 43.2 37.8 Total inventories 1,347.6 1,111.8
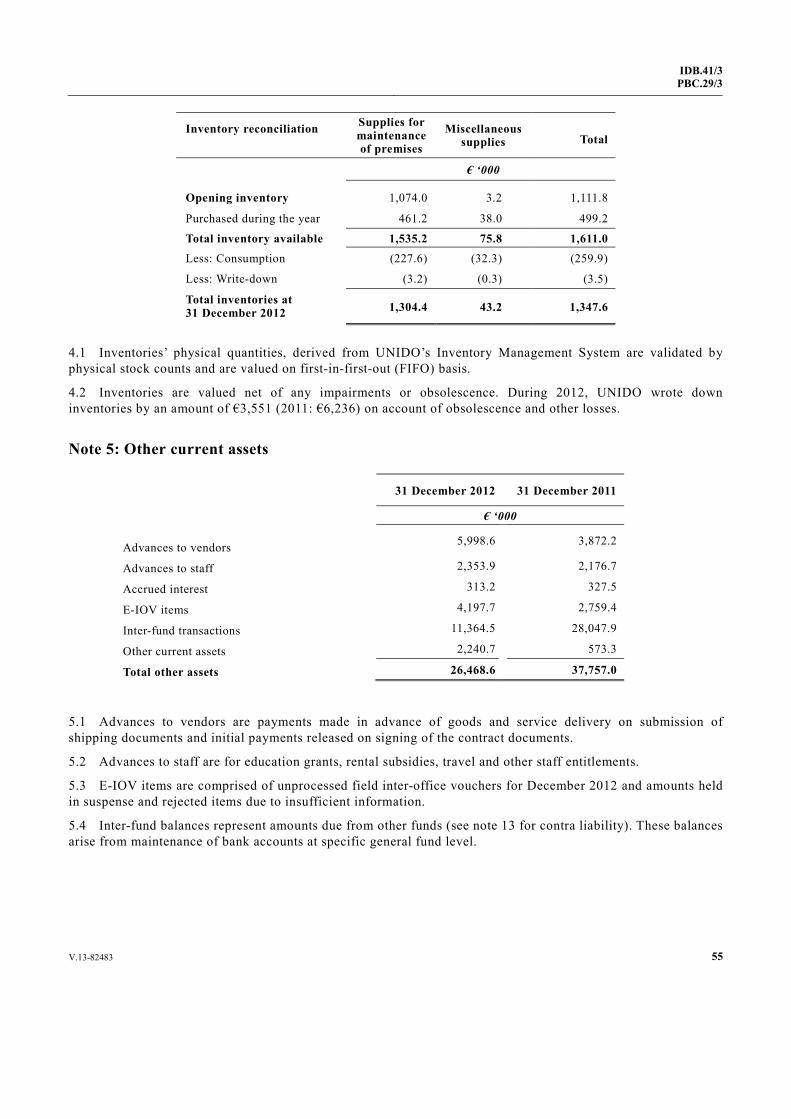
V.13-82483 55
IDB.41/3PBC.29/3
Inventory reconciliation
Supplies for maintenance of premises
Miscellaneous supplies Total
€ ‘000
Opening inventory 1,074.0 3.2 1,111.8
Purchased during the year 461.2 38.0 499.2
Total inventory available 1,535.2 75.8 1,611.0 Less: Consumption (227.6) (32.3) (259.9)
Less: Write-down (3.2) (0.3) (3.5)
Total inventories at 31 December 2012 1,304.4 43.2 1,347.6
4.1 Inventories’ physical quantities, derived from UNIDO’s Inventory Management System are validated by physical stock counts and are valued on first-in-first-out (FIFO) basis.
4.2 Inventories are valued net of any impairments or obsolescence. During 2012, UNIDO wrote down inventories by an amount of €3,551 (2011: €6,236) on account of obsolescence and other losses.
Note 5: Other current assets
31 December 2012 31 December 2011
€ ‘000
Advances to vendors 5,998.6 3,872.2
Advances to staff 2,353.9 2,176.7
Accrued interest 313.2 327.5
E-IOV items 4,197.7 2,759.4
Inter-fund transactions 11,364.5 28,047.9
Other current assets 2,240.7 573.3
Total other assets 26,468.6 37,757.0
5.1 Advances to vendors are payments made in advance of goods and service delivery on submission of shipping documents and initial payments released on signing of the contract documents.
5.2 Advances to staff are for education grants, rental subsidies, travel and other staff entitlements.
5.3 E-IOV items are comprised of unprocessed field inter-office vouchers for December 2012 and amounts held in suspense and rejected items due to insufficient information.
5.4 Inter-fund balances represent amounts due from other funds (see note 13 for contra liability). These balances arise from maintenance of bank accounts at specific general fund level.
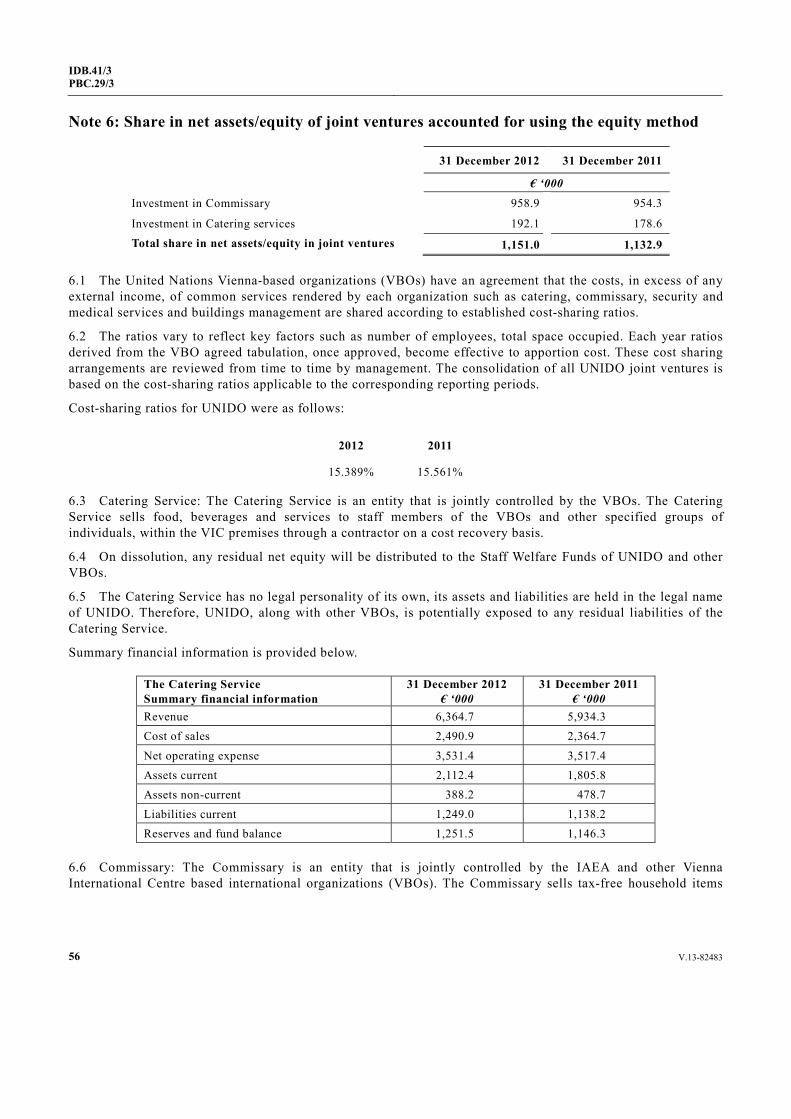
56 V.13-82483
IDB.41/3 PBC.29/3
Note 6: Share in net assets/equity of joint ventures accounted for using the equity method
31 December 2012 31 December 2011
€ ‘000 Investment in Commissary 958.9 954.3
Investment in Catering services 192.1 178.6 Total share in net assets/equity in joint ventures 1,151.0 1,132.9
6.1 The United Nations Vienna-based organizations (VBOs) have an agreement that the costs, in excess of any external income, of common services rendered by each organization such as catering, commissary, security and medical services and buildings management are shared according to established cost-sharing ratios.
6.2 The ratios vary to reflect key factors such as number of employees, total space occupied. Each year ratios derived from the VBO agreed tabulation, once approved, become effective to apportion cost. These cost sharing arrangements are reviewed from time to time by management. The consolidation of all UNIDO joint ventures is based on the cost-sharing ratios applicable to the corresponding reporting periods.
Cost-sharing ratios for UNIDO were as follows:
2012 2011
15.389% 15.561%
6.3 Catering Service: The Catering Service is an entity that is jointly controlled by the VBOs. The Catering Service sells food, beverages and services to staff members of the VBOs and other specified groups of individuals, within the VIC premises through a contractor on a cost recovery basis.
6.4 On dissolution, any residual net equity will be distributed to the Staff Welfare Funds of UNIDO and other VBOs.
6.5 The Catering Service has no legal personality of its own, its assets and liabilities are held in the legal name of UNIDO. Therefore, UNIDO, along with other VBOs, is potentially exposed to any residual liabilities of the Catering Service.
Summary financial information is provided below.
The Catering Service Summary financial information
31 December 2012 € ‘000
31 December 2011 € ‘000
Revenue 6,364.7 5,934.3 Cost of sales 2,490.9 2,364.7 Net operating expense 3,531.4 3,517.4 Assets current 2,112.4 1,805.8 Assets non-current 388.2 478.7 Liabilities current 1,249.0 1,138.2 Reserves and fund balance 1,251.5 1,146.3
6.6 Commissary: The Commissary is an entity that is jointly controlled by the IAEA and other Vienna International Centre based international organizations (VBOs). The Commissary sells tax-free household items

V.13-82483 57
IDB.41/3PBC.29/3
for personal consumption to staff members of (VBOs) and other specified groups of individuals on a cost recovery basis.
6.7 On dissolution, any residual net equity is distributed to the Staff Welfare Funds of the IAEA and other VBOs based on the proportion of sales to respective VBOs’ staff members over the five years preceding dissolution.
6.8 The Commissary has no legal personality of its own, its assets and liabilities are held in the legal name of the IAEA. The IAEA is therefore potentially exposed to any residual liabilities of the Commissary.
Summary financial information is provided below.
The Commissary Summary financial information
31 December 2012 € ‘000
31 December 2011 € ‘000
Revenue 29,130.4 28,007.6
Cost of sales 23,902.7 23,152.9
Net operating expense 4,161.1 3,815.4
Assets current 16,404.8 14,923.8
Assets non-current 477.2 457.3
Liabilities current 2,685.2 2,227.3
Liabilities non-current 7,966.0 6,979.8
Equity 6,230.9 6,174.1
6.9 Buildings Management Services: The Buildings Management Services are responsible for the operation and management of the physical plant of the VIC premises. UNIDO is assigned to be the operating agency of the service with decision-making capacity over financial and operating policies resting with the Committee of Common Services comprising the respective representatives of the VBO’s. Therefore the Service is considered as a joint operation with joint control shared among all VBOs. BMS has no legal status of its own. Its assets and liabilities are held in the name of UNIDO.
6.10 VBOs have been making annual contribution to the BMS fund according to the approved ratio as described in paragraph 6.1, with exceptions of reimbursement for ad hoc projects, which are of cost-recovery nature. While the residual interest of VBOs in BMS is not defined in any document and neither is the mode of distribution of such interest upon dissolution of the fund, since the operation is carried out in the principle of no-gain-no-loss basis, balances of VBOs’ contributions net of expenses are recognized as deferral, pending release for services to be delivered in future (ref. to note 12.4).
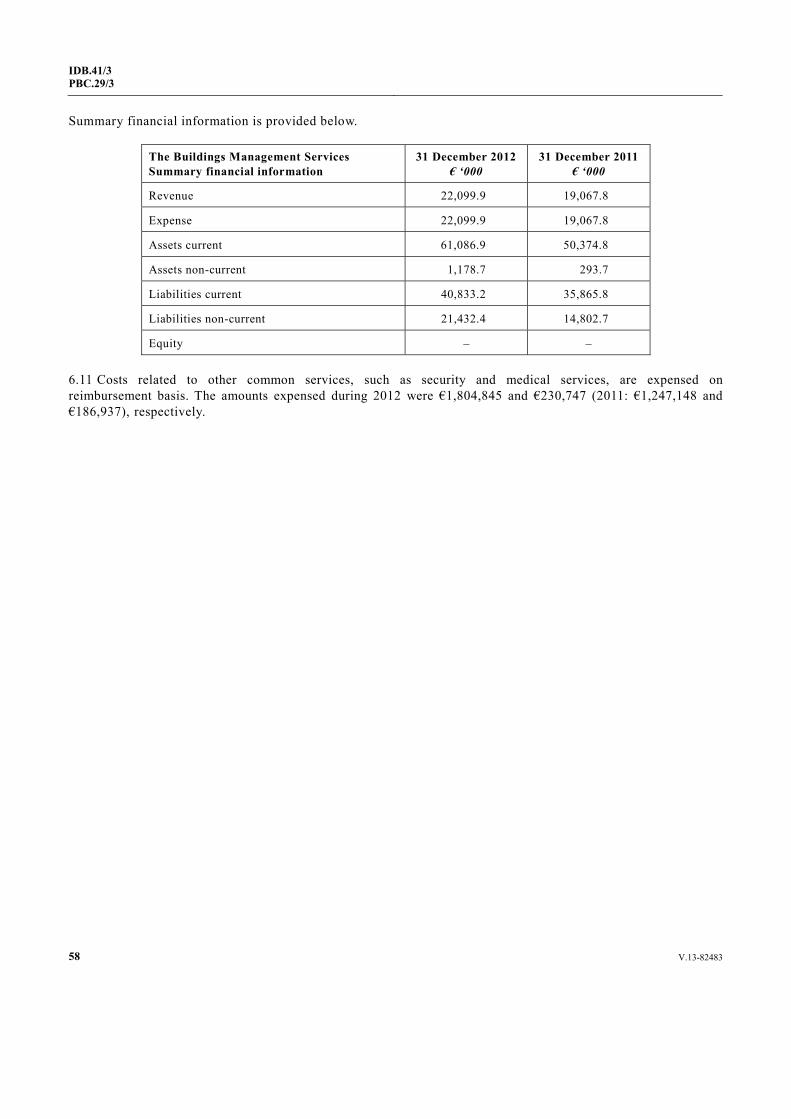
58 V.13-82483
IDB.41/3 PBC.29/3
Summary financial information is provided below.
The Buildings Management Services Summary financial information
31 December 2012 € ‘000
31 December 2011 € ‘000
Revenue 22,099.9 19,067.8
Expense 22,099.9 19,067.8
Assets current 61,086.9 50,374.8
Assets non-current 1,178.7 293.7
Liabilities current 40,833.2 35,865.8
Liabilities non-current 21,432.4 14,802.7
Equity – –
6.11 Costs related to other common services, such as security and medical services, are expensed on reimbursement basis. The amounts expensed during 2012 were €1,804,845 and €230,747 (2011: €1,247,148 and €186,937), respectively.
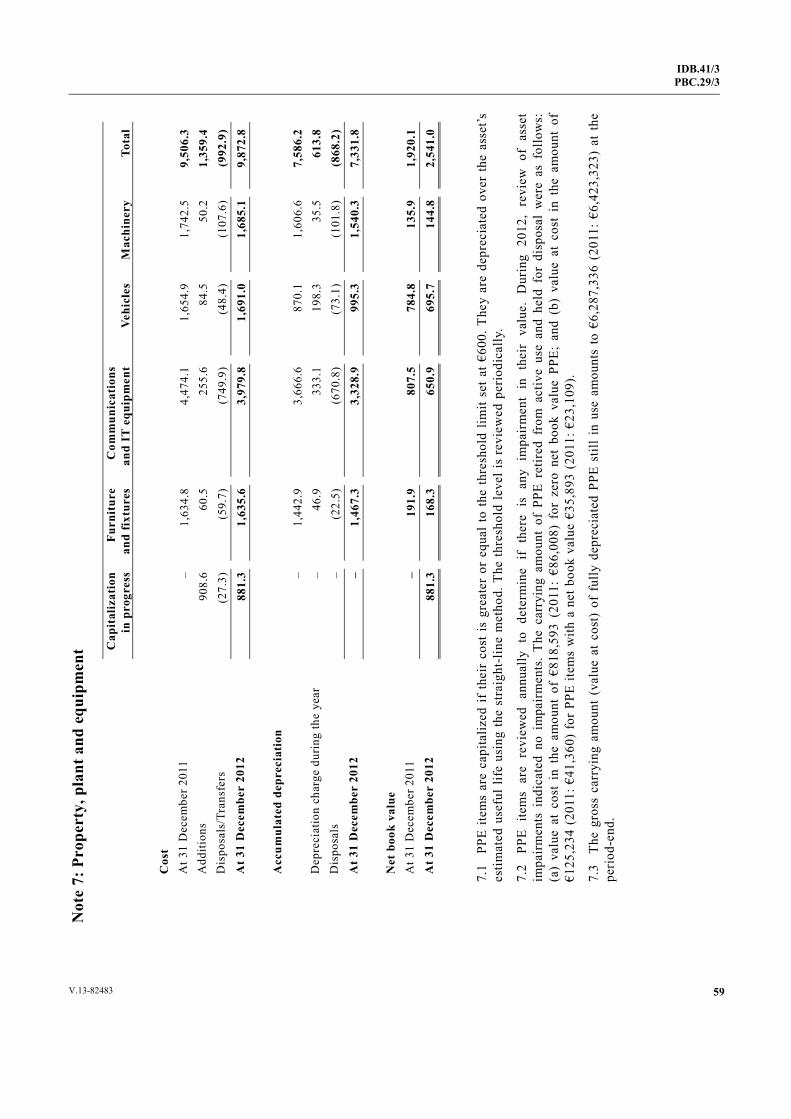
IDB.41/3PBC.29/3
59V.13-82483
Not
e 7:
Pro
pert
y, p
lant
and
equ
ipm
ent
C
apit
aliz
atio
n in
pro
gres
s Fu
rnit
ure
and
fixt
ures
C
omm
unic
atio
ns
and
IT e
quip
men
t Ve
hicl
es
Mac
hine
ry
Tota
l
Cos
t
At 3
1 D
ecem
ber 2
011
– 1,
634.
8
4,47
4.1
1,65
4.9
1,74
2.5
9,50
6.3
Add
ition
s 90
8.6
60.5
25
5.6
84.5
50
.2
1,35
9.4
Dis
posa
ls/T
rans
fers
(2
7.3)
(5
9.7)
(7
49.9
)(4
8.4)
(107
.6)
(992
.9)
At 3
1 D
ecem
ber
2012
88
1.3
1,63
5.6
3,97
9.8
1,69
1.0
1,68
5.1
9,87
2.8
A
ccum
ulat
ed d
epre
ciat
ion
–
1,44
2.9
3,
666.
6 87
0.1
1,60
6.6
7,58
6.2
Dep
reci
atio
n ch
arge
dur
ing
the
year
–
46.9
33
3.1
198.
3 35
.5
613.
8 D
ispo
sals
–
(22.
5)
(670
.8)
(73.
1)(1
01.8
)(8
68.2
) A
t 31
Dec
embe
r 20
12
– 1,
467.
3 3,
328.
9 99
5.3
1,54
0.3
7,33
1.8
N
et b
ook
valu
e
A
t 31
Dec
embe
r 201
1 –
191.
9 80
7.5
784.
8 13
5.9
1,92
0.1
At 3
1 D
ecem
ber
2012
88
1.3
168.
3 65
0.9
695.
7 14
4.8
2,54
1.0
7.
1 PP
E ite
ms
are
capi
taliz
ed if
thei
r co
st i
s gr
eate
r or
equ
al to
the
thre
shol
d lim
it se
t at €
600.
The
y ar
e de
prec
iate
d ov
er th
e as
set’s
es
timat
ed u
sefu
l life
usi
ng th
e st
raig
ht-l
ine
met
hod.
The
thre
shol
d le
vel i
s re
view
ed p
erio
dica
lly.
7.2
PPE
item
s ar
e re
view
ed a
nnua
lly t
o de
term
ine
if th
ere
is a
ny i
mpa
irm
ent
in t
heir
val
ue.
Dur
ing
2012
, re
view
of
asse
t im
pair
men
ts i
ndic
ated
no
impa
irm
ents
. Th
e ca
rryi
ng a
mou
nt o
f PP
E re
tired
fro
m a
ctiv
e us
e an
d he
ld f
or d
ispo
sal
wer
e as
fol
low
s:
(a)
valu
e at
cos
t in
the
am
ount
of
€818
,593
(20
11:
€86,
008)
for
zer
o ne
t bo
ok v
alue
PPE
; an
d (b
) va
lue
at c
ost
in t
he a
mou
nt o
f €1
25,2
34 (
2011
: €41
,360
) fo
r PP
E ite
ms
with
a n
et b
ook
valu
e €3
5,89
3 (2
011:
€23
,109
).
7.3
The
gros
s ca
rryi
ng a
mou
nt (
valu
e at
cos
t) o
f fu
lly d
epre
ciat
ed P
PE s
till
in u
se a
mou
nts
to €
6,28
7,33
6 (2
011:
€6,
423,
323)
at
the
peri
od-e
nd.
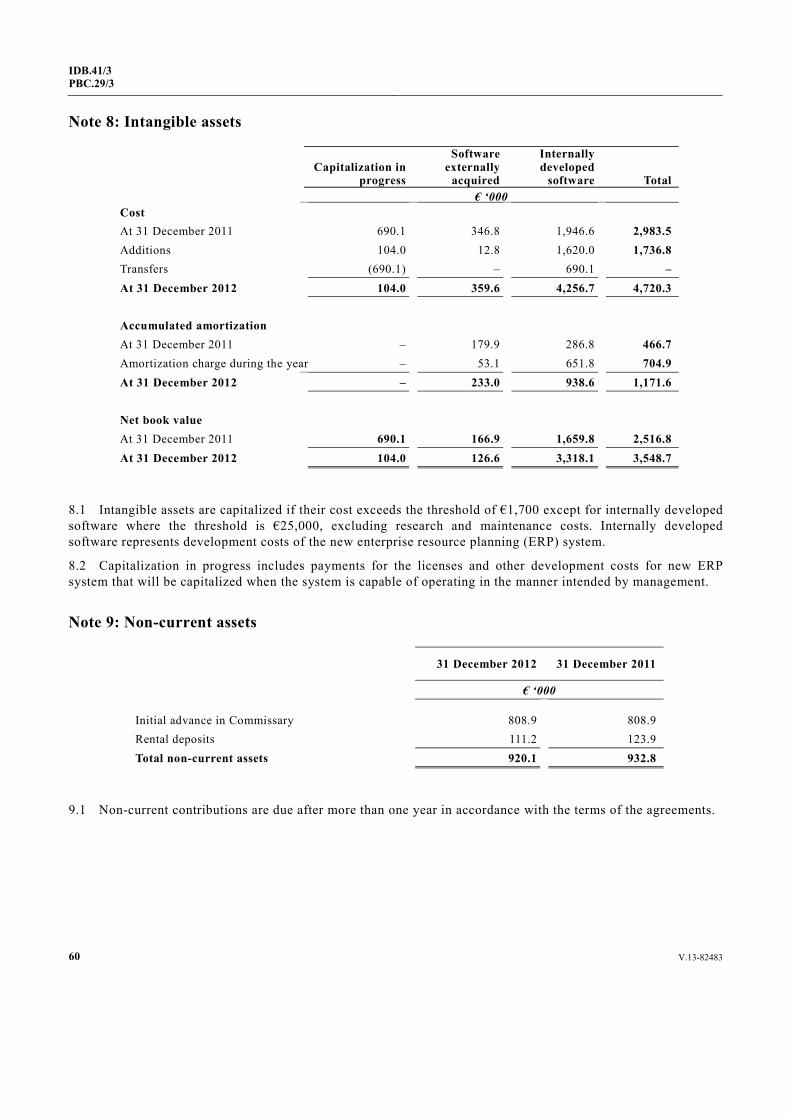
60 V.13-82483
IDB.41/3 PBC.29/3
Note 8: Intangible assets
Capitalization in
progress
Software externally
acquired
Internally developed
software Total € ‘000Cost At 31 December 2011 690.1 346.8 1,946.6 2,983.5 Additions 104.0 12.8 1,620.0 1,736.8 Transfers (690.1) – 690.1 – At 31 December 2012 104.0 359.6 4,256.7 4,720.3 Accumulated amortization At 31 December 2011 – 179.9 286.8 466.7 Amortization charge during the year – 53.1 651.8 704.9 At 31 December 2012 – 233.0 938.6 1,171.6 Net book value At 31 December 2011 690.1 166.9 1,659.8 2,516.8 At 31 December 2012 104.0 126.6 3,318.1 3,548.7
8.1 Intangible assets are capitalized if their cost exceeds the threshold of €1,700 except for internally developed software where the threshold is €25,000, excluding research and maintenance costs. Internally developed software represents development costs of the new enterprise resource planning (ERP) system.
8.2 Capitalization in progress includes payments for the licenses and other development costs for new ERP system that will be capitalized when the system is capable of operating in the manner intended by management.
Note 9: Non-current assets
31 December 2012 31 December 2011
€ ‘000
Initial advance in Commissary 808.9 808.9 Rental deposits 111.2 123.9 Total non-current assets 920.1 932.8
9.1 Non-current contributions are due after more than one year in accordance with the terms of the agreements.
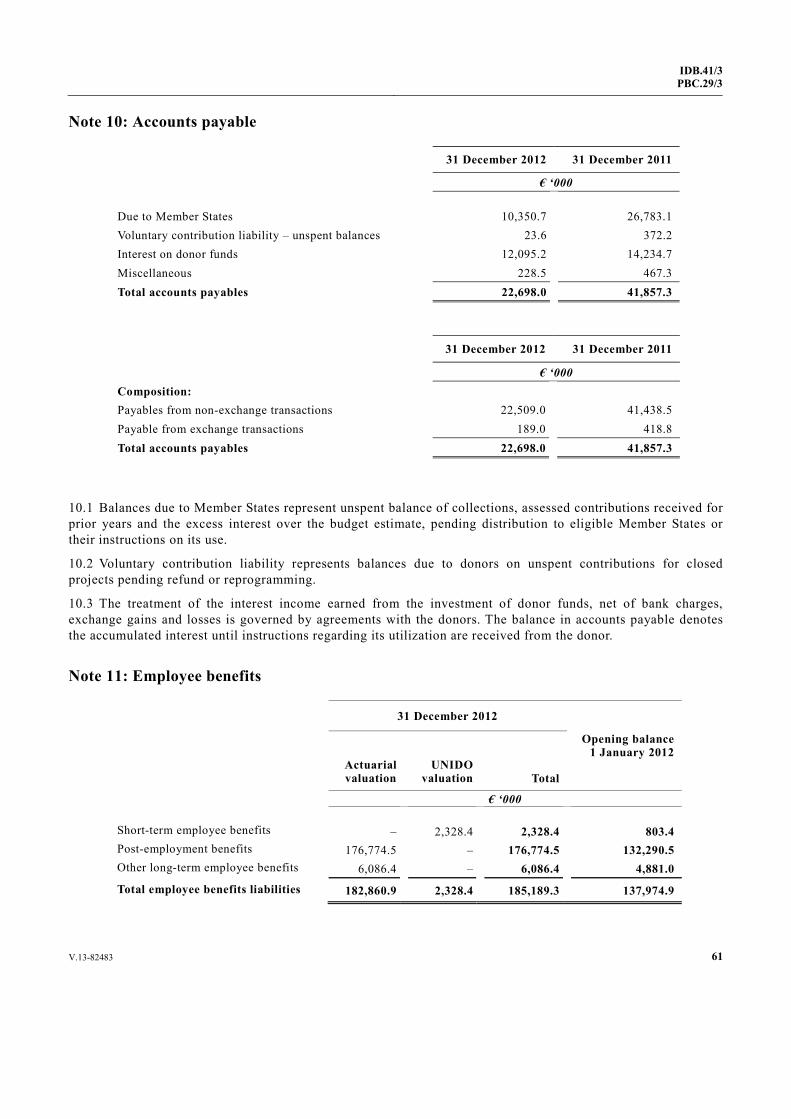
V.13-82483 61
IDB.41/3PBC.29/3
Note 10: Accounts payable
31 December 2012 31 December 2011
€ ‘000 Due to Member States 10,350.7 26,783.1 Voluntary contribution liability – unspent balances 23.6 372.2 Interest on donor funds 12,095.2 14,234.7 Miscellaneous 228.5 467.3 Total accounts payables 22,698.0 41,857.3
31 December 2012 31 December 2011
€ ‘000 Composition: Payables from non-exchange transactions 22,509.0 41,438.5 Payable from exchange transactions 189.0 418.8 Total accounts payables 22,698.0 41,857.3
10.1 Balances due to Member States represent unspent balance of collections, assessed contributions received for prior years and the excess interest over the budget estimate, pending distribution to eligible Member States or their instructions on its use.
10.2 Voluntary contribution liability represents balances due to donors on unspent contributions for closed projects pending refund or reprogramming.
10.3 The treatment of the interest income earned from the investment of donor funds, net of bank charges, exchange gains and losses is governed by agreements with the donors. The balance in accounts payable denotes the accumulated interest until instructions regarding its utilization are received from the donor.
Note 11: Employee benefits
31 December 2012
Opening balance 1 January 2012
Actuarial valuation
UNIDO valuation Total
€ ‘000 Short-term employee benefits – 2,328.4 2,328.4 803.4 Post-employment benefits 176,774.5 – 176,774.5 132,290.5 Other long-term employee benefits 6,086.4 – 6,086.4 4,881.0
Total employee benefits liabilities 182,860.9 2,328.4 185,189.3 137,974.9
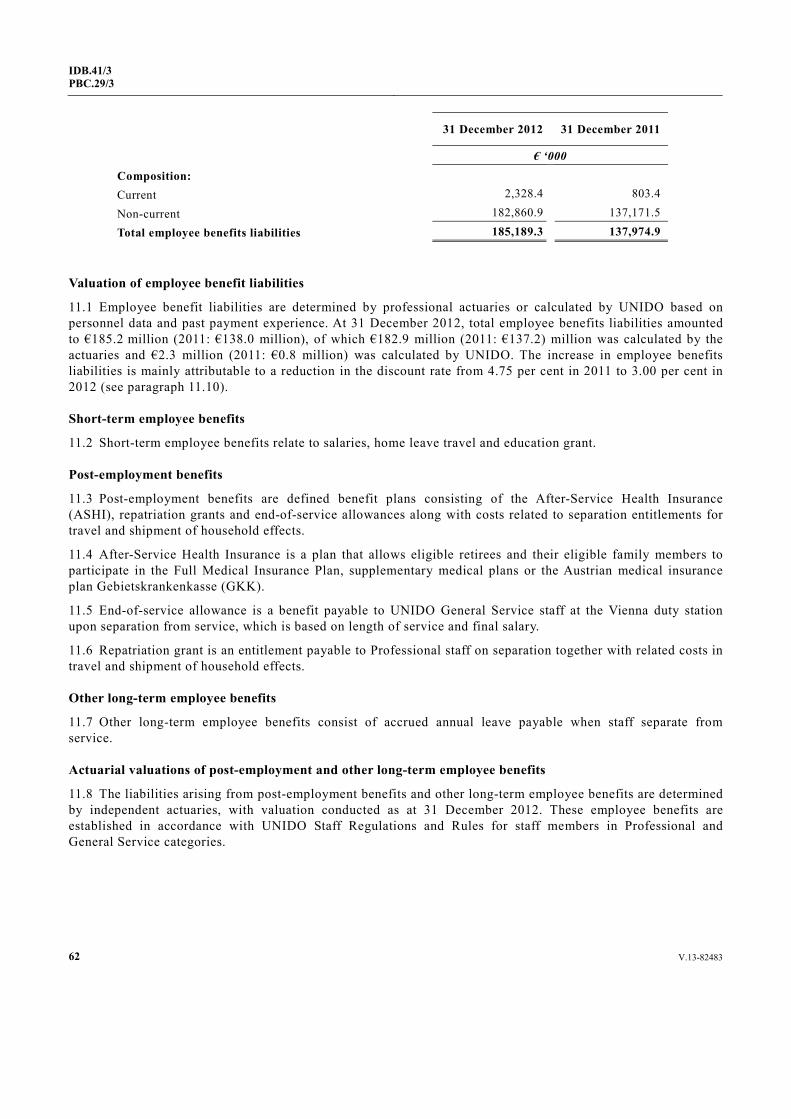
62 V.13-82483
IDB.41/3 PBC.29/3
31 December 2012 31 December 2011
€ ‘000
Composition: Current 2,328.4 803.4
Non-current 182,860.9 137,171.5
Total employee benefits liabilities 185,189.3 137,974.9
Valuation of employee benefit liabilities
11.1 Employee benefit liabilities are determined by professional actuaries or calculated by UNIDO based on personnel data and past payment experience. At 31 December 2012, total employee benefits liabilities amounted to €185.2 million (2011: €138.0 million), of which €182.9 million (2011: €137.2) million was calculated by the actuaries and €2.3 million (2011: €0.8 million) was calculated by UNIDO. The increase in employee benefits liabilities is mainly attributable to a reduction in the discount rate from 4.75 per cent in 2011 to 3.00 per cent in 2012 (see paragraph 11.10).
Short-term employee benefits
11.2 Short-term employee benefits relate to salaries, home leave travel and education grant.
Post-employment benefits
11.3 Post-employment benefits are defined benefit plans consisting of the After-Service Health Insurance (ASHI), repatriation grants and end-of-service allowances along with costs related to separation entitlements for travel and shipment of household effects.
11.4 After-Service Health Insurance is a plan that allows eligible retirees and their eligible family members to participate in the Full Medical Insurance Plan, supplementary medical plans or the Austrian medical insurance plan Gebietskrankenkasse (GKK).
11.5 End-of-service allowance is a benefit payable to UNIDO General Service staff at the Vienna duty station upon separation from service, which is based on length of service and final salary.
11.6 Repatriation grant is an entitlement payable to Professional staff on separation together with related costs in travel and shipment of household effects.
Other long-term employee benefits
11.7 Other long-term employee benefits consist of accrued annual leave payable when staff separate from service.
Actuarial valuations of post-employment and other long-term employee benefits
11.8 The liabilities arising from post-employment benefits and other long-term employee benefits are determined by independent actuaries, with valuation conducted as at 31 December 2012. These employee benefits are established in accordance with UNIDO Staff Regulations and Rules for staff members in Professional and General Service categories.
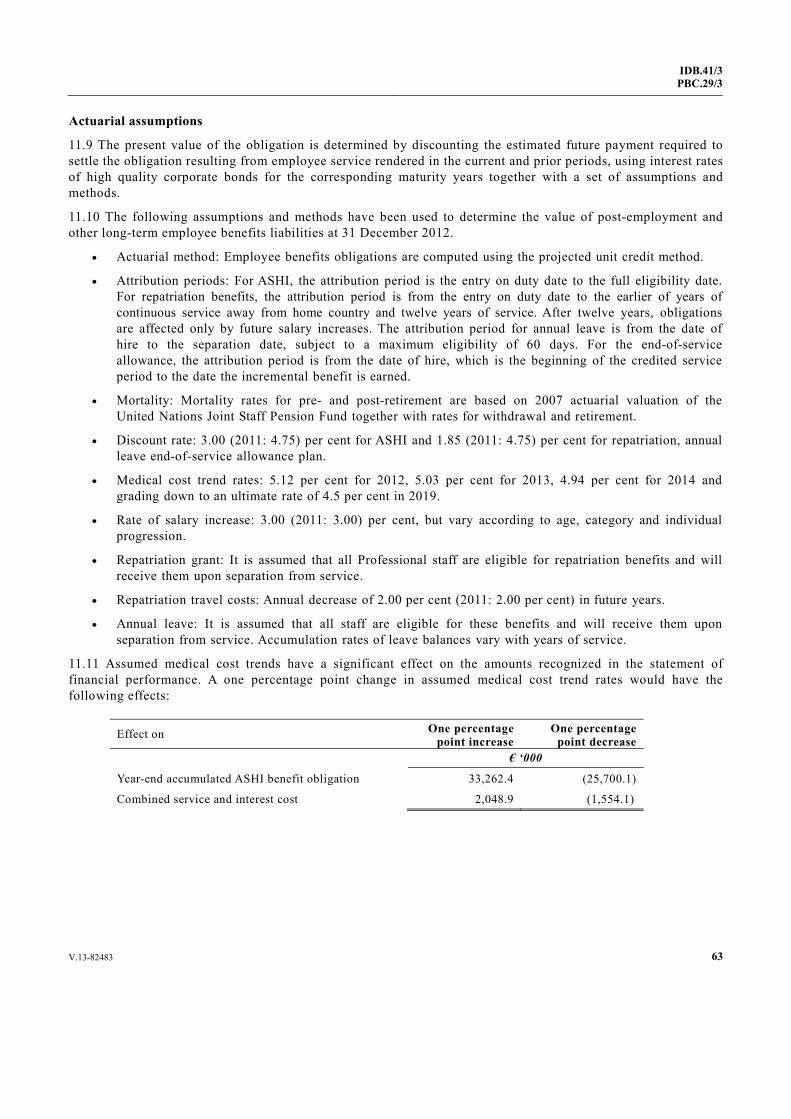
V.13-82483 63
IDB.41/3PBC.29/3
Actuarial assumptions
11.9 The present value of the obligation is determined by discounting the estimated future payment required to settle the obligation resulting from employee service rendered in the current and prior periods, using interest rates of high quality corporate bonds for the corresponding maturity years together with a set of assumptions and methods.
11.10 The following assumptions and methods have been used to determine the value of post-employment and other long-term employee benefits liabilities at 31 December 2012.
• Actuarial method: Employee benefits obligations are computed using the projected unit credit method.
• Attribution periods: For ASHI, the attribution period is the entry on duty date to the full eligibility date. For repatriation benefits, the attribution period is from the entry on duty date to the earlier of years of continuous service away from home country and twelve years of service. After twelve years, obligations are affected only by future salary increases. The attribution period for annual leave is from the date of hire to the separation date, subject to a maximum eligibility of 60 days. For the end-of-service allowance, the attribution period is from the date of hire, which is the beginning of the credited service period to the date the incremental benefit is earned.
• Mortality: Mortality rates for pre- and post-retirement are based on 2007 actuarial valuation of the United Nations Joint Staff Pension Fund together with rates for withdrawal and retirement.
• Discount rate: 3.00 (2011: 4.75) per cent for ASHI and 1.85 (2011: 4.75) per cent for repatriation, annual leave end-of-service allowance plan.
• Medical cost trend rates: 5.12 per cent for 2012, 5.03 per cent for 2013, 4.94 per cent for 2014 and grading down to an ultimate rate of 4.5 per cent in 2019.
• Rate of salary increase: 3.00 (2011: 3.00) per cent, but vary according to age, category and individual progression.
• Repatriation grant: It is assumed that all Professional staff are eligible for repatriation benefits and will receive them upon separation from service.
• Repatriation travel costs: Annual decrease of 2.00 per cent (2011: 2.00 per cent) in future years.
• Annual leave: It is assumed that all staff are eligible for these benefits and will receive them upon separation from service. Accumulation rates of leave balances vary with years of service.
11.11 Assumed medical cost trends have a significant effect on the amounts recognized in the statement of financial performance. A one percentage point change in assumed medical cost trend rates would have the following effects:
Effect on One percentage point increase
One percentage point decrease
€ ‘000
Year-end accumulated ASHI benefit obligation 33,262.4 (25,700.1)
Combined service and interest cost 2,048.9 (1,554.1)
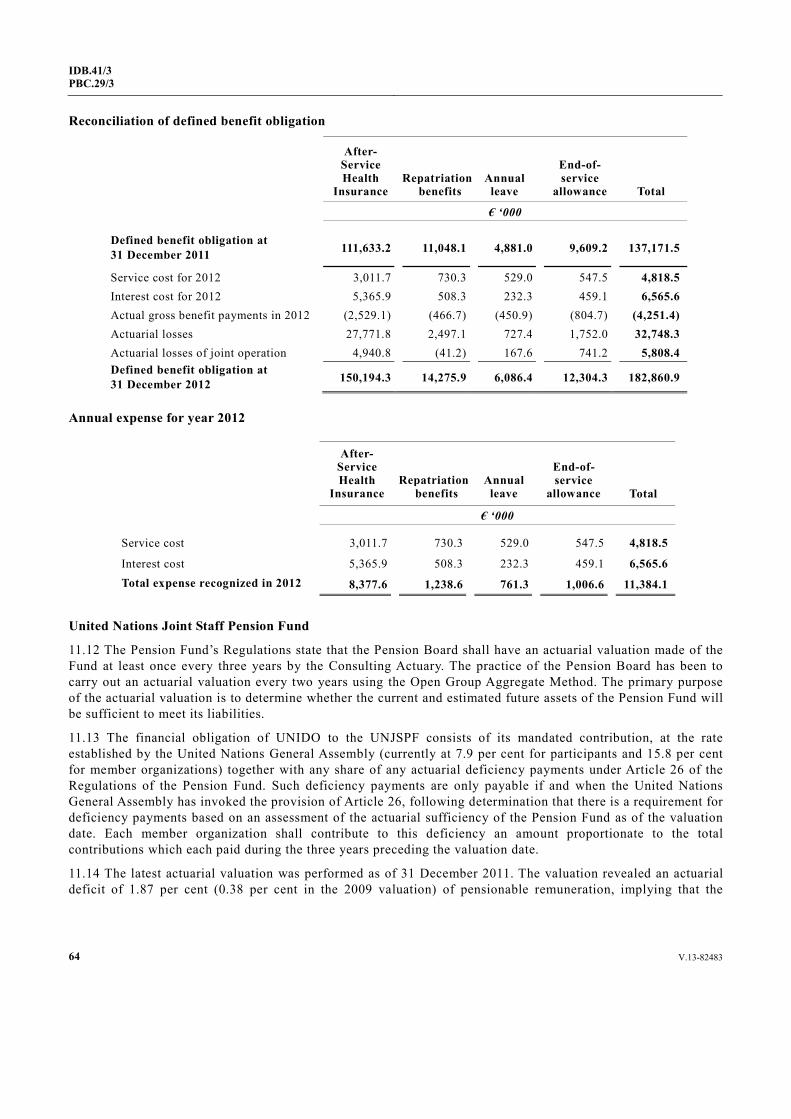
64 V.13-82483
IDB.41/3 PBC.29/3
Reconciliation of defined benefit obligation
After-Service Health
Insurance Repatriation
benefits Annual
leave
End-of- service
allowance Total
€ ‘000
Defined benefit obligation at 31 December 2011 111,633.2 11,048.1 4,881.0 9,609.2 137,171.5
Service cost for 2012 3,011.7 730.3 529.0 547.5 4,818.5 Interest cost for 2012 5,365.9 508.3 232.3 459.1 6,565.6 Actual gross benefit payments in 2012 (2,529.1) (466.7) (450.9) (804.7) (4,251.4) Actuarial losses 27,771.8 2,497.1 727.4 1,752.0 32,748.3 Actuarial losses of joint operation 4,940.8 (41.2) 167.6 741.2 5,808.4 Defined benefit obligation at 31 December 2012 150,194.3 14,275.9 6,086.4 12,304.3 182,860.9
Annual expense for year 2012
After-Service Health
Insurance Repatriation
benefits Annual
leave
End-of- service
allowance Total
€ ‘000
Service cost 3,011.7 730.3 529.0 547.5 4,818.5
Interest cost 5,365.9 508.3 232.3 459.1 6,565.6 Total expense recognized in 2012 8,377.6 1,238.6 761.3 1,006.6 11,384.1
United Nations Joint Staff Pension Fund
11.12 The Pension Fund’s Regulations state that the Pension Board shall have an actuarial valuation made of the Fund at least once every three years by the Consulting Actuary. The practice of the Pension Board has been to carry out an actuarial valuation every two years using the Open Group Aggregate Method. The primary purpose of the actuarial valuation is to determine whether the current and estimated future assets of the Pension Fund will be sufficient to meet its liabilities.
11.13 The financial obligation of UNIDO to the UNJSPF consists of its mandated contribution, at the rate established by the United Nations General Assembly (currently at 7.9 per cent for participants and 15.8 per cent for member organizations) together with any share of any actuarial deficiency payments under Article 26 of the Regulations of the Pension Fund. Such deficiency payments are only payable if and when the United Nations General Assembly has invoked the provision of Article 26, following determination that there is a requirement for deficiency payments based on an assessment of the actuarial sufficiency of the Pension Fund as of the valuation date. Each member organization shall contribute to this deficiency an amount proportionate to the total contributions which each paid during the three years preceding the valuation date.
11.14 The latest actuarial valuation was performed as of 31 December 2011. The valuation revealed an actuarial deficit of 1.87 per cent (0.38 per cent in the 2009 valuation) of pensionable remuneration, implying that the
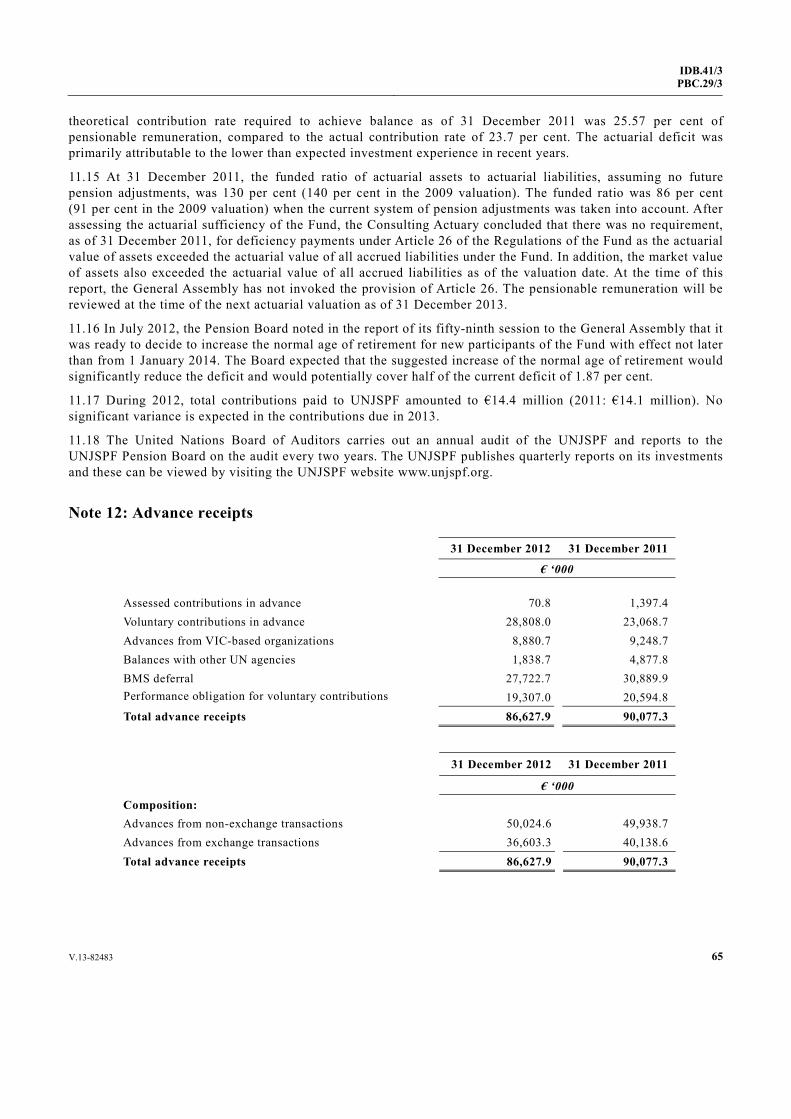
V.13-82483 65
IDB.41/3PBC.29/3
theoretical contribution rate required to achieve balance as of 31 December 2011 was 25.57 per cent of pensionable remuneration, compared to the actual contribution rate of 23.7 per cent. The actuarial deficit was primarily attributable to the lower than expected investment experience in recent years.
11.15 At 31 December 2011, the funded ratio of actuarial assets to actuarial liabilities, assuming no future pension adjustments, was 130 per cent (140 per cent in the 2009 valuation). The funded ratio was 86 per cent (91 per cent in the 2009 valuation) when the current system of pension adjustments was taken into account. After assessing the actuarial sufficiency of the Fund, the Consulting Actuary concluded that there was no requirement, as of 31 December 2011, for deficiency payments under Article 26 of the Regulations of the Fund as the actuarial value of assets exceeded the actuarial value of all accrued liabilities under the Fund. In addition, the market value of assets also exceeded the actuarial value of all accrued liabilities as of the valuation date. At the time of this report, the General Assembly has not invoked the provision of Article 26. The pensionable remuneration will be reviewed at the time of the next actuarial valuation as of 31 December 2013.
11.16 In July 2012, the Pension Board noted in the report of its fifty-ninth session to the General Assembly that it was ready to decide to increase the normal age of retirement for new participants of the Fund with effect not later than from 1 January 2014. The Board expected that the suggested increase of the normal age of retirement would significantly reduce the deficit and would potentially cover half of the current deficit of 1.87 per cent.
11.17 During 2012, total contributions paid to UNJSPF amounted to €14.4 million (2011: €14.1 million). No significant variance is expected in the contributions due in 2013.
11.18 The United Nations Board of Auditors carries out an annual audit of the UNJSPF and reports to the UNJSPF Pension Board on the audit every two years. The UNJSPF publishes quarterly reports on its investments and these can be viewed by visiting the UNJSPF website www.unjspf.org.
Note 12: Advance receipts
31 December 2012 31 December 2011
€ ‘000 Assessed contributions in advance 70.8 1,397.4 Voluntary contributions in advance 28,808.0 23,068.7 Advances from VIC-based organizations 8,880.7 9,248.7 Balances with other UN agencies 1,838.7 4,877.8 BMS deferral 27,722.7 30,889.9 Performance obligation for voluntary contributions 19,307.0 20,594.8 Total advance receipts 86,627.9 90,077.3
31 December 2012 31 December 2011
€ ‘000 Composition: Advances from non-exchange transactions 50,024.6 49,938.7 Advances from exchange transactions 36,603.3 40,138.6 Total advance receipts 86,627.9 90,077.3

66 V.13-82483
IDB.41/3 PBC.29/3
12.1 Assessed contributions received from Member States against future year’s assessment are reflected in advance receipts account. Voluntary contributions in advance represent funds received from donors awaiting programming for specific project activities.
12.2 Advance from VIC-based organizations include funds received for special work programmes carried out by BMS at the VIC.
12.3 Balances with other United Nations agencies include Service and Project Clearing Accounts held with UNDP and other United Nations related projects implemented by UNIDO.
12.4 The fund balances held in Buildings Management Services’ special account, reclassified under IPSAS joint venture classification, are reflected in the BMS deferral account (ref. note 6).
12.5 Voluntary contributions received with conditions on their use are held in a liability account until the discharge of performance obligation, as stipulated in the agreements.
Note 13: Other liabilities
31 December 2012 31 December 2011
€ ‘000 Unrealized exchange gain/loss 2,431.1 2,431.1
Accruals for goods/services received-but-not-paid 7,812.2 8,752.3
Inter-fund transactions 11,364.5 28,047.9
Other liabilities 1,934.7 2,341.4
Long-term guarantees – bank/rent deposit 113.6 126.3
Total other liabilities 23,656.1 41,699.0
31 December 2012 31 December 2011
€ ‘000 Composition: Current 23,542.5 41,572.7 Non-current 113.6 126.3
Total other liabilities 23,656.1 41,699.0
13.1 Exchange gains represent the remaining balance of realized gains arising from the revaluation of euro denominated cash and term deposits held by trust funds, prior to the introduction of euro management of technical cooperation projects in 2004.
13.2 Accruals are liabilities for goods and services that have been received or provided to UNIDO during the period and which have not been invoiced or formally agreed with the suppliers.
13.3 Inter-fund balances represent amounts due to other funds (see note 5 for contra asset). These balances arise from maintenance of bank accounts at specific general fund level.
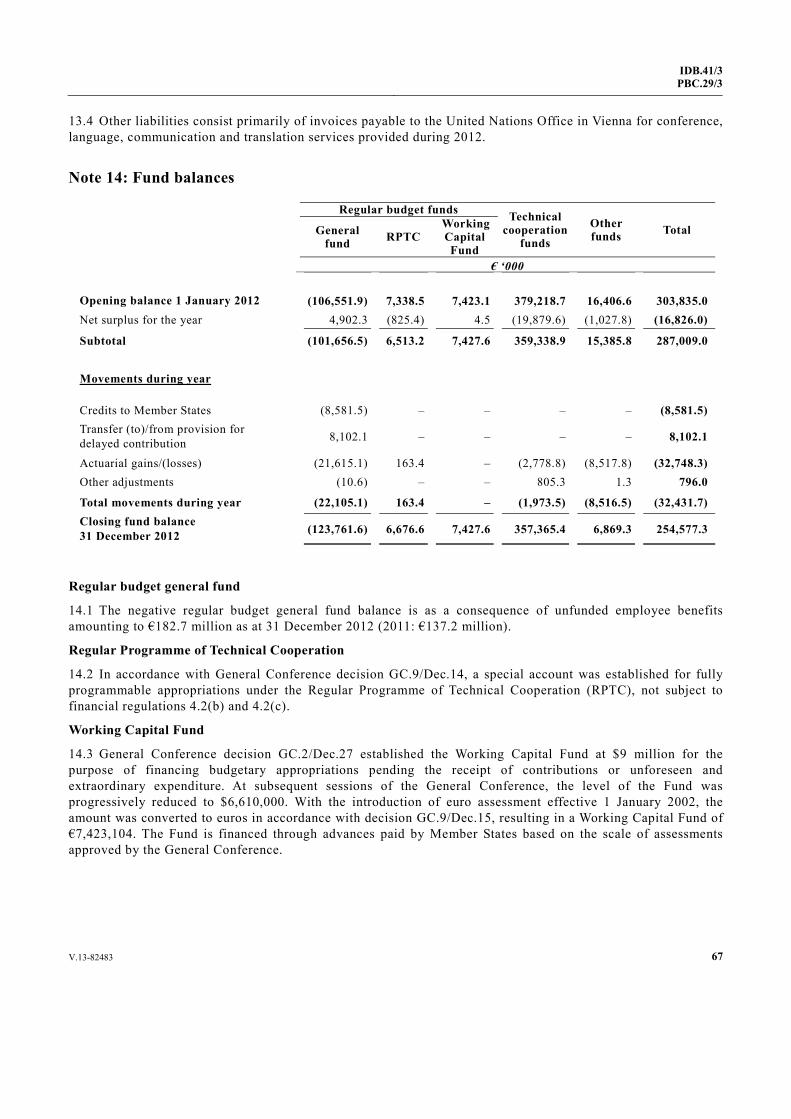
V.13-82483 67
IDB.41/3PBC.29/3
13.4 Other liabilities consist primarily of invoices payable to the United Nations Office in Vienna for conference, language, communication and translation services provided during 2012.
Note 14: Fund balances
Regular budget funds Technical cooperation
funds
Other funds Total General
fund RPTC Working Capital Fund
€ ‘000
Opening balance 1 January 2012 (106,551.9) 7,338.5 7,423.1 379,218.7 16,406.6 303,835.0 Net surplus for the year 4,902.3 (825.4) 4.5 (19,879.6) (1,027.8) (16,826.0)
Subtotal (101,656.5) 6,513.2 7,427.6 359,338.9 15,385.8 287,009.0 Movements during year
Credits to Member States (8,581.5) – – – – (8,581.5) Transfer (to)/from provision for delayed contribution 8,102.1 – – – – 8,102.1
Actuarial gains/(losses) (21,615.1) 163.4 – (2,778.8) (8,517.8) (32,748.3) Other adjustments (10.6) – – 805.3 1.3 796.0
Total movements during year (22,105.1) 163.4 – (1,973.5) (8,516.5) (32,431.7) Closing fund balance 31 December 2012 (123,761.6) 6,676.6 7,427.6 357,365.4 6,869.3 254,577.3
Regular budget general fund
14.1 The negative regular budget general fund balance is as a consequence of unfunded employee benefits amounting to €182.7 million as at 31 December 2012 (2011: €137.2 million).
Regular Programme of Technical Cooperation
14.2 In accordance with General Conference decision GC.9/Dec.14, a special account was established for fully programmable appropriations under the Regular Programme of Technical Cooperation (RPTC), not subject to financial regulations 4.2(b) and 4.2(c).
Working Capital Fund
14.3 General Conference decision GC.2/Dec.27 established the Working Capital Fund at $9 million for the purpose of financing budgetary appropriations pending the receipt of contributions or unforeseen and extraordinary expenditure. At subsequent sessions of the General Conference, the level of the Fund was progressively reduced to $6,610,000. With the introduction of euro assessment effective 1 January 2002, the amount was converted to euros in accordance with decision GC.9/Dec.15, resulting in a Working Capital Fund of €7,423,104. The Fund is financed through advances paid by Member States based on the scale of assessments approved by the General Conference.
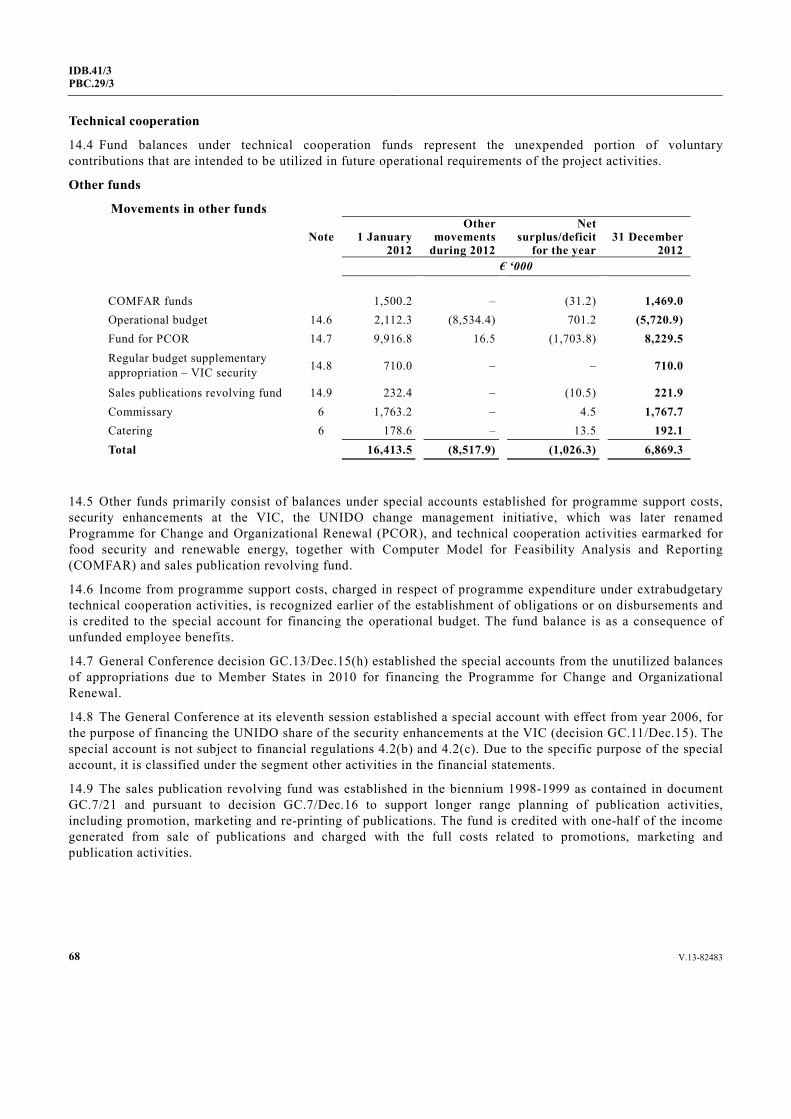
68 V.13-82483
IDB.41/3 PBC.29/3
Technical cooperation
14.4 Fund balances under technical cooperation funds represent the unexpended portion of voluntary contributions that are intended to be utilized in future operational requirements of the project activities.
Other funds
Movements in other funds
Note 1 January 2012
Other movements
during 2012
Net surplus/deficit
for the year 31 December
2012 € ‘000 COMFAR funds 1,500.2 – (31.2) 1,469.0 Operational budget 14.6 2,112.3 (8,534.4) 701.2 (5,720.9) Fund for PCOR 14.7 9,916.8 16.5 (1,703.8) 8,229.5 Regular budget supplementary appropriation – VIC security 14.8 710.0 – – 710.0
Sales publications revolving fund 14.9 232.4 – (10.5) 221.9 Commissary 6 1,763.2 – 4.5 1,767.7 Catering 6 178.6 – 13.5 192.1 Total 16,413.5 (8,517.9) (1,026.3) 6,869.3
14.5 Other funds primarily consist of balances under special accounts established for programme support costs, security enhancements at the VIC, the UNIDO change management initiative, which was later renamed Programme for Change and Organizational Renewal (PCOR), and technical cooperation activities earmarked for food security and renewable energy, together with Computer Model for Feasibility Analysis and Reporting (COMFAR) and sales publication revolving fund.
14.6 Income from programme support costs, charged in respect of programme expenditure under extrabudgetary technical cooperation activities, is recognized earlier of the establishment of obligations or on disbursements and is credited to the special account for financing the operational budget. The fund balance is as a consequence of unfunded employee benefits.
14.7 General Conference decision GC.13/Dec.15(h) established the special accounts from the unutilized balances of appropriations due to Member States in 2010 for financing the Programme for Change and Organizational Renewal.
14.8 The General Conference at its eleventh session established a special account with effect from year 2006, for the purpose of financing the UNIDO share of the security enhancements at the VIC (decision GC.11/Dec.15). The special account is not subject to financial regulations 4.2(b) and 4.2(c). Due to the specific purpose of the special account, it is classified under the segment other activities in the financial statements.
14.9 The sales publication revolving fund was established in the biennium 1998-1999 as contained in document GC.7/21 and pursuant to decision GC.7/Dec.16 to support longer range planning of publication activities, including promotion, marketing and re-printing of publications. The fund is credited with one-half of the income generated from sale of publications and charged with the full costs related to promotions, marketing and publication activities.
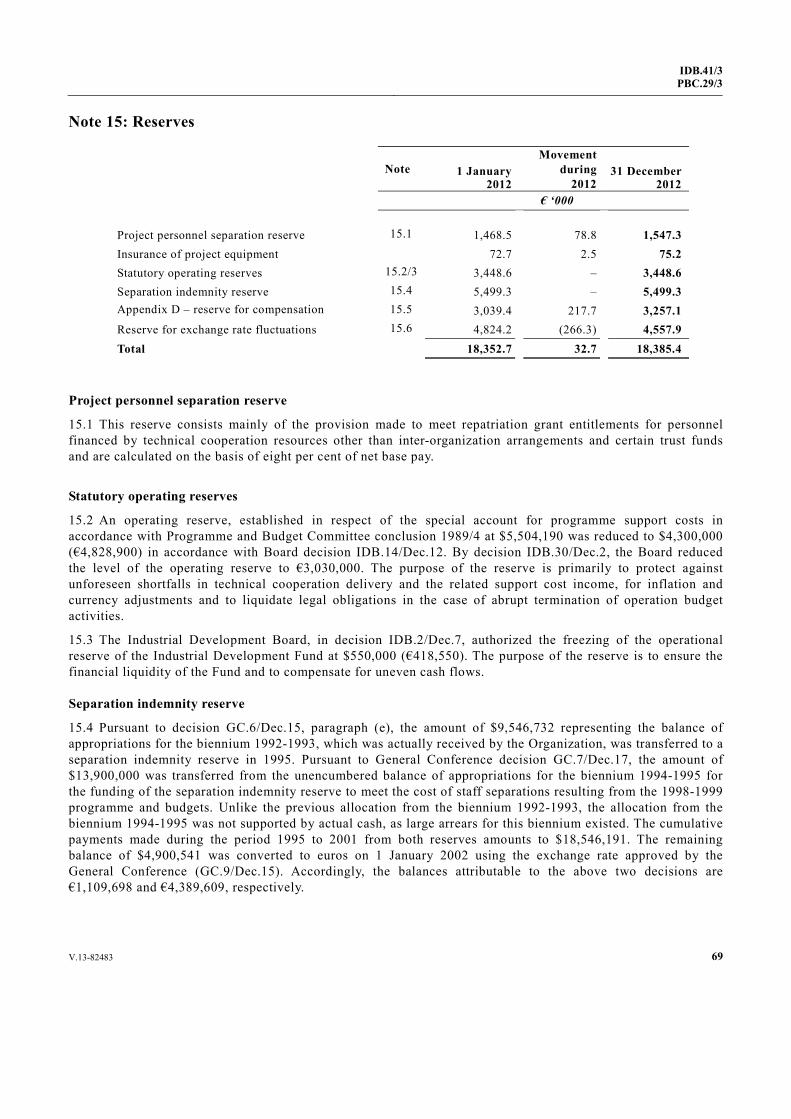
V.13-82483 69
IDB.41/3PBC.29/3
Note 15: Reserves
Note 1 January 2012
Movement during
2012 31 December
2012 € ‘000 Project personnel separation reserve 15.1 1,468.5 78.8 1,547.3 Insurance of project equipment 72.7 2.5 75.2 Statutory operating reserves 15.2/3 3,448.6 – 3,448.6 Separation indemnity reserve 15.4 5,499.3 – 5,499.3 Appendix D – reserve for compensation 15.5 3,039.4 217.7 3,257.1 Reserve for exchange rate fluctuations 15.6 4,824.2 (266.3) 4,557.9 Total 18,352.7 32.7 18,385.4
Project personnel separation reserve
15.1 This reserve consists mainly of the provision made to meet repatriation grant entitlements for personnel financed by technical cooperation resources other than inter-organization arrangements and certain trust funds and are calculated on the basis of eight per cent of net base pay.
Statutory operating reserves
15.2 An operating reserve, established in respect of the special account for programme support costs in accordance with Programme and Budget Committee conclusion 1989/4 at $5,504,190 was reduced to $4,300,000 (€4,828,900) in accordance with Board decision IDB.14/Dec.12. By decision IDB.30/Dec.2, the Board reduced the level of the operating reserve to €3,030,000. The purpose of the reserve is primarily to protect against unforeseen shortfalls in technical cooperation delivery and the related support cost income, for inflation and currency adjustments and to liquidate legal obligations in the case of abrupt termination of operation budget activities.
15.3 The Industrial Development Board, in decision IDB.2/Dec.7, authorized the freezing of the operational reserve of the Industrial Development Fund at $550,000 (€418,550). The purpose of the reserve is to ensure the financial liquidity of the Fund and to compensate for uneven cash flows.
Separation indemnity reserve
15.4 Pursuant to decision GC.6/Dec.15, paragraph (e), the amount of $9,546,732 representing the balance of appropriations for the biennium 1992-1993, which was actually received by the Organization, was transferred to a separation indemnity reserve in 1995. Pursuant to General Conference decision GC.7/Dec.17, the amount of $13,900,000 was transferred from the unencumbered balance of appropriations for the biennium 1994-1995 for the funding of the separation indemnity reserve to meet the cost of staff separations resulting from the 1998-1999 programme and budgets. Unlike the previous allocation from the biennium 1992-1993, the allocation from the biennium 1994-1995 was not supported by actual cash, as large arrears for this biennium existed. The cumulative payments made during the period 1995 to 2001 from both reserves amounts to $18,546,191. The remaining balance of $4,900,541 was converted to euros on 1 January 2002 using the exchange rate approved by the General Conference (GC.9/Dec.15). Accordingly, the balances attributable to the above two decisions are €1,109,698 and €4,389,609, respectively.
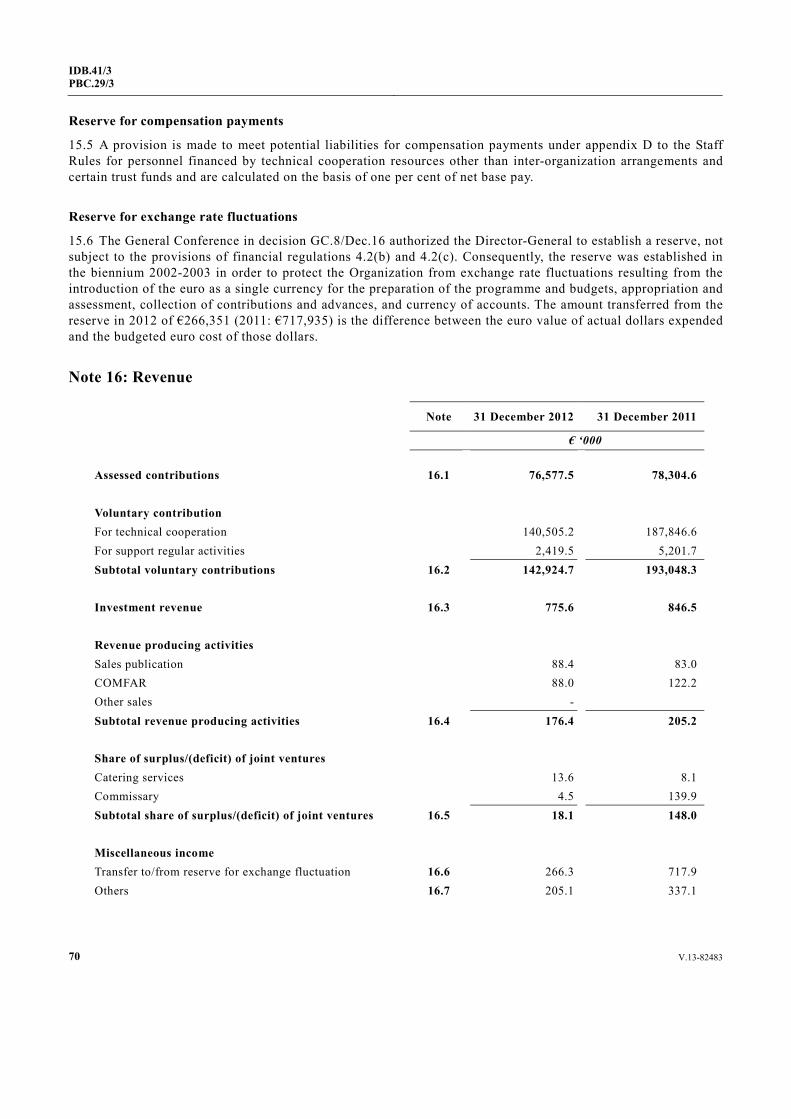
70 V.13-82483
IDB.41/3 PBC.29/3
Reserve for compensation payments
15.5 A provision is made to meet potential liabilities for compensation payments under appendix D to the Staff Rules for personnel financed by technical cooperation resources other than inter-organization arrangements and certain trust funds and are calculated on the basis of one per cent of net base pay.
Reserve for exchange rate fluctuations
15.6 The General Conference in decision GC.8/Dec.16 authorized the Director-General to establish a reserve, not subject to the provisions of financial regulations 4.2(b) and 4.2(c). Consequently, the reserve was established in the biennium 2002-2003 in order to protect the Organization from exchange rate fluctuations resulting from the introduction of the euro as a single currency for the preparation of the programme and budgets, appropriation and assessment, collection of contributions and advances, and currency of accounts. The amount transferred from the reserve in 2012 of €266,351 (2011: €717,935) is the difference between the euro value of actual dollars expended and the budgeted euro cost of those dollars.
Note 16: Revenue
Note 31 December 2012 31 December 2011
€ ‘000 Assessed contributions 16.1 76,577.5 78,304.6 Voluntary contribution For technical cooperation 140,505.2 187,846.6 For support regular activities 2,419.5 5,201.7 Subtotal voluntary contributions 16.2 142,924.7 193,048.3 Investment revenue 16.3 775.6 846.5 Revenue producing activities Sales publication 88.4 83.0 COMFAR 88.0 122.2 Other sales - Subtotal revenue producing activities 16.4 176.4 205.2 Share of surplus/(deficit) of joint ventures Catering services 13.6 8.1 Commissary 4.5 139.9 Subtotal share of surplus/(deficit) of joint ventures 16.5 18.1 148.0 Miscellaneous income Transfer to/from reserve for exchange fluctuation 16.6 266.3 717.9 Others 16.7 205.1 337.1

V.13-82483 71
IDB.41/3PBC.29/3
Note 31 December 2012 31 December 2011
€ ‘000 Subtotal miscellaneous income 471.4 1,055.0 TOTAL REVENUE 220,943.7 273,607.6
16.1 The General Conference approved an amount of €153,231,936 for the regular budget for the biennium 2012-2013 (decision GC.14/Dec.14), which is financed from assessed contributions by Member States. Accordingly, €76,577,468 representing one-half of the amounts was assessed, reduced by adjustment in scales for rescinding Member State of €38,500. In accordance with financial regulation 5.5(c), payments made by a Member State are credited first to the Working Capital Fund and then to the contributions due, in the order in which the Member State was assessed.
16.2 Voluntary contributions are recognized upon the signing of a binding agreement between UNIDO and the donor, provided there are no conditions limiting the use of funds. Decrease in 2012 is mainly attributable to the reduced projects phasing in 2012 by donors.
16.3 Investment revenue represents interest earned and accrued on the short-term deposits held with financial institutions.
16.4 Income from revenue-producing activities consists of sales of publications and the Computer Model for Feasibility Analysis and Reporting (COMFAR) as well as cost recovery for technical services.
16.5 The UNIDO share of net surplus on the operations of Catering and Commissary is recognized based on the cost-sharing formula of the VBOs’ for common services, as referred to in note 6.
16.6 This represents the amount transferred from the reserve for exchange rate fluctuations for 2012 due to a euro deficit on actual dollar spending against budgeted rate (see note 15.6).
16.7 Refunds of expenditure charged to previous fiscal periods, commissions from travel agents, CTBTO support costs and other sundry credits are treated as miscellaneous income.
Contributions in kind
16.8 Services in kind estimated at €1,406,191 (2011: €1,179,163) were received mainly from Member States in support of UNIDO projects and field office operations during the year. The amount is measured at fair value. They are not recognized in the face of the financial statements as UNIDO has elected as such in accordance with IPSAS 23. The nature and type of major classes of services in kind received are as follows:
31 December 2012 31 December 2011
€ ‘000
Contribution for the use of:
Office space 969.2 784.5
Furniture and fixtures 7.6 13.8
Communication and IT equipment 9.2 17.6
Vehicles 48.9 42.9
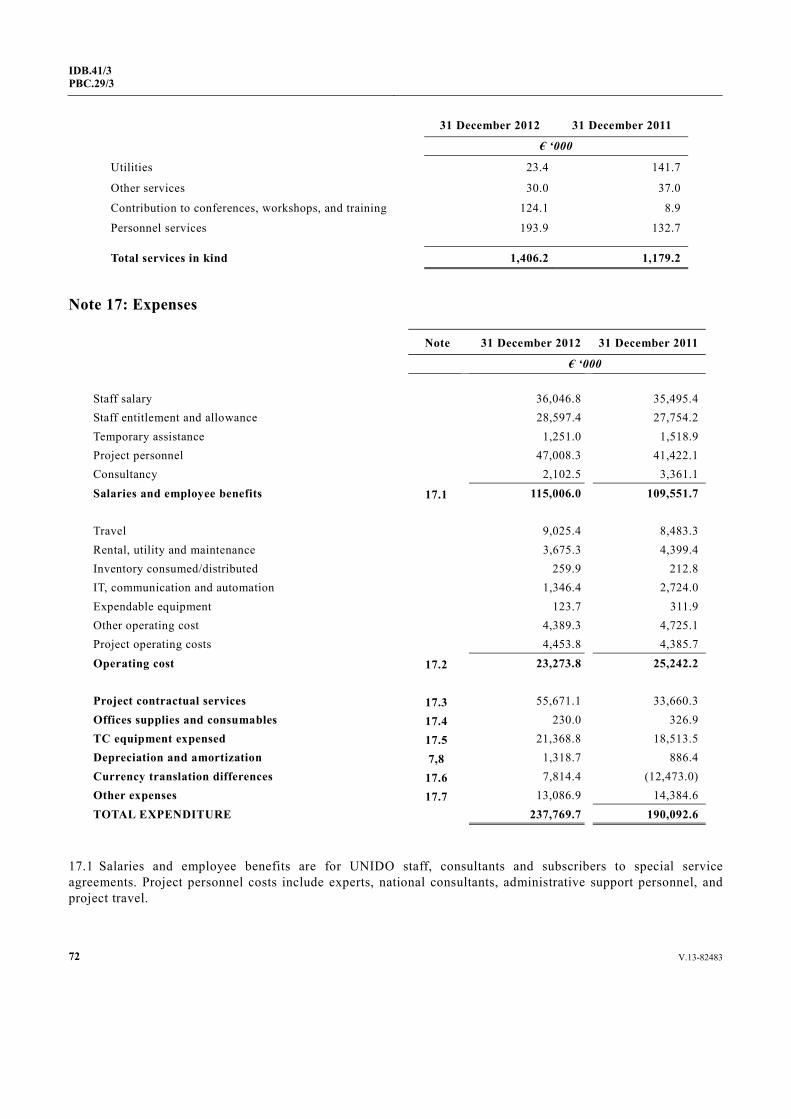
72 V.13-82483
IDB.41/3 PBC.29/3
31 December 2012 31 December 2011
€ ‘000
Utilities 23.4 141.7
Other services 30.0 37.0
Contribution to conferences, workshops, and training 124.1 8.9
Personnel services 193.9 132.7
Total services in kind 1,406.2 1,179.2
Note 17: Expenses
Note 31 December 2012 31 December 2011
€ ‘000 Staff salary 36,046.8 35,495.4 Staff entitlement and allowance 28,597.4 27,754.2 Temporary assistance 1,251.0 1,518.9 Project personnel 47,008.3 41,422.1 Consultancy 2,102.5 3,361.1 Salaries and employee benefits 17.1 115,006.0 109,551.7 Travel 9,025.4 8,483.3 Rental, utility and maintenance 3,675.3 4,399.4 Inventory consumed/distributed 259.9 212.8 IT, communication and automation 1,346.4 2,724.0 Expendable equipment 123.7 311.9 Other operating cost 4,389.3 4,725.1 Project operating costs 4,453.8 4,385.7 Operating cost 17.2 23,273.8 25,242.2 Project contractual services 17.3 55,671.1 33,660.3 Offices supplies and consumables 17.4 230.0 326.9 TC equipment expensed 17.5 21,368.8 18,513.5 Depreciation and amortization 7,8 1,318.7 886.4 Currency translation differences 17.6 7,814.4 (12,473.0) Other expenses 17.7 13,086.9 14,384.6 TOTAL EXPENDITURE 237,769.7 190,092.6
17.1 Salaries and employee benefits are for UNIDO staff, consultants and subscribers to special service agreements. Project personnel costs include experts, national consultants, administrative support personnel, and project travel.

V.13-82483 73
IDB.41/3PBC.29/3
17.2 Operating costs include travel, utilities, field office operations, United Nations system jointly financed activities, information technology and communication as well as contributions to common services at the VIC.
17.3 Project contractual services represent subcontracts entered into for project implementation activities. Increase in 2012 is mainly attributable to the implementation of projects approved in previous years.
17.4 Office supplies and consumables include cost of goods and services used exclusively by UNIDO in regular budget and technical cooperation activities.
17.5 The expenses for TC equipment are machinery and equipment purchased for technical cooperation projects during the year.
17.6 Currency translation differences, primarily from revaluation of non-euro bank balances, assets and liabilities at the end of the period and revaluation of the balance of voluntary contributions receivable, are mainly attributable to a decrease in the year-end US dollar/euro exchange rate from 0.774 in 2011 to 0.754 in 2012.
17.7 Other expenses include fellowships and training related to projects and costs related to governing body meetings for conference, language, translation, documentation, etc.
Note 18: Statement of comparison of budget and actual amounts
18.1 The budgets and accounts of UNIDO are prepared using a different basis. The statement of financial position, statement of financial performance, statement of changes in net assets and statement of cash flow are prepared on a full accrual basis using a classification based on the nature of expenses in the statement of financial performance, whereas the statement of comparison of budget and actual amounts (statement 5) is prepared on a modified cash basis of accounting.
18.2 As required under IPSAS 24, the actual amounts presented on a comparable basis to the budget shall, where the financial statements and the budget are not prepared on a comparable basis, be reconciled to the actual amounts presented in the financial statements, identifying separately any basis, timing and entity differences. There may also be differences in formats and classification schemes adopted for presentation of financial statements and the budget.
18.3 Basis differences occur when the approved budget is prepared on a basis other than the accounting basis, as stated in paragraph 18.1 above.
18.4 Timing differences occur when the budget period differs from the reporting period reflected in the financial statements. There are no timing differences for UNIDO for purposes of comparison of budget and actual amounts.
18.5 Entity differences occur when the budget omits programmes or entities that are part of the entity for which the financial statements are prepared.
18.6 Presentation differences are due to differences in the format and classification schemes adopted for presentation of statement of cash flow and statement of comparison of budget and actual amounts.
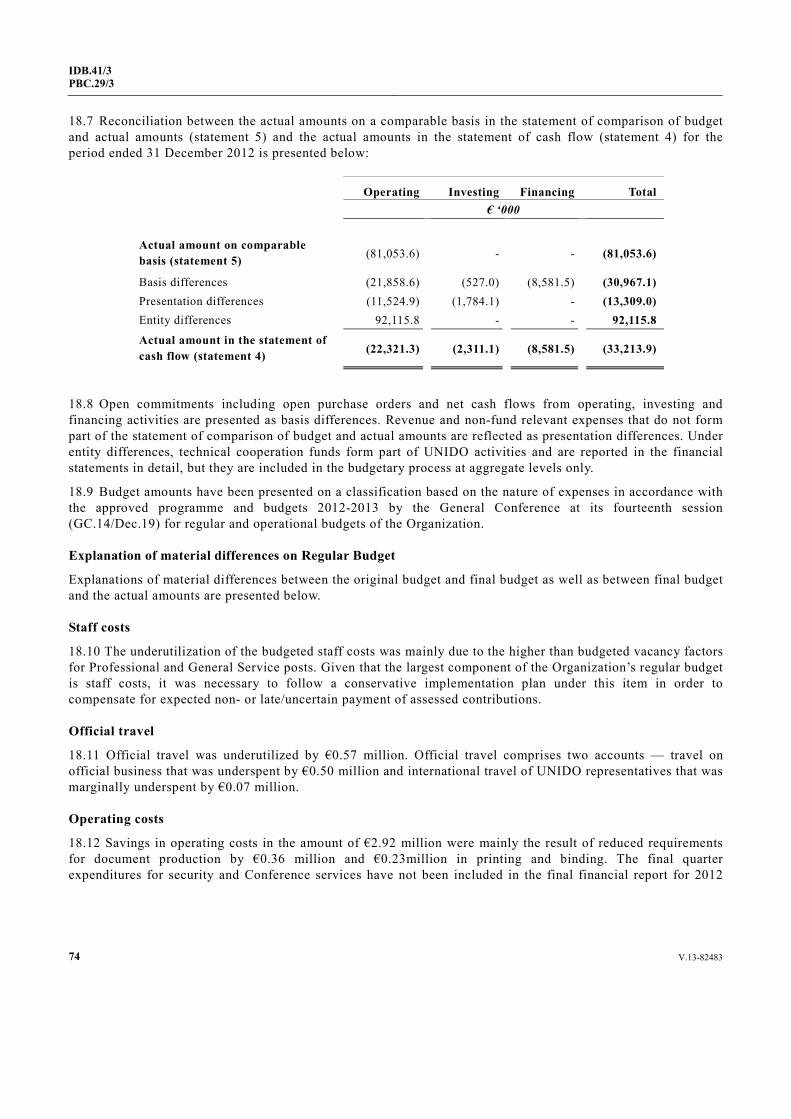
74 V.13-82483
IDB.41/3 PBC.29/3
18.7 Reconciliation between the actual amounts on a comparable basis in the statement of comparison of budget and actual amounts (statement 5) and the actual amounts in the statement of cash flow (statement 4) for the period ended 31 December 2012 is presented below:
Operating Investing Financing Total € ‘000 Actual amount on comparable basis (statement 5) (81,053.6) - - (81,053.6)
Basis differences (21,858.6) (527.0) (8,581.5) (30,967.1) Presentation differences (11,524.9) (1,784.1) - (13,309.0) Entity differences 92,115.8 - - 92,115.8
Actual amount in the statement of cash flow (statement 4) (22,321.3) (2,311.1) (8,581.5) (33,213.9)
18.8 Open commitments including open purchase orders and net cash flows from operating, investing and financing activities are presented as basis differences. Revenue and non-fund relevant expenses that do not form part of the statement of comparison of budget and actual amounts are reflected as presentation differences. Under entity differences, technical cooperation funds form part of UNIDO activities and are reported in the financial statements in detail, but they are included in the budgetary process at aggregate levels only.
18.9 Budget amounts have been presented on a classification based on the nature of expenses in accordance with the approved programme and budgets 2012-2013 by the General Conference at its fourteenth session (GC.14/Dec.19) for regular and operational budgets of the Organization.
Explanation of material differences on Regular Budget
Explanations of material differences between the original budget and final budget as well as between final budget and the actual amounts are presented below.
Staff costs
18.10 The underutilization of the budgeted staff costs was mainly due to the higher than budgeted vacancy factors for Professional and General Service posts. Given that the largest component of the Organization’s regular budget is staff costs, it was necessary to follow a conservative implementation plan under this item in order to compensate for expected non- or late/uncertain payment of assessed contributions.
Official travel
18.11 Official travel was underutilized by €0.57 million. Official travel comprises two accounts — travel on official business that was underspent by €0.50 million and international travel of UNIDO representatives that was marginally underspent by €0.07 million.
Operating costs
18.12 Savings in operating costs in the amount of €2.92 million were mainly the result of reduced requirements for document production by €0.36 million and €0.23million in printing and binding. The final quarter expenditures for security and Conference services have not been included in the final financial report for 2012
V.13-82483 75
IDB.41/3PBC.29/3
hence a high balance of unspent appropriations in Joint Translation services of €0.38 million, €0.48 million in Security and Safety services and €0.10 million in Common interpretation services.
Information and communication technology
18.13 The marginal underutilization of €1.27 million of information and communication technology resources is due to the reduction in usage of both communication equipment by €0.55 million and the office automation budget by €0.46 million. This surplus was partially offset by increases in IT consultancy of €0.31 million and in external computer costs of €0.05 million.
Regular Programme of Technical Cooperation and Special Resources for Africa
18.14 Regular Programme of Technical Cooperation resources were administered under the special account created for the purpose to which the full appropriation has been transferred. An underutilization of €0.84 million was recognized under the Special Resources for Africa.
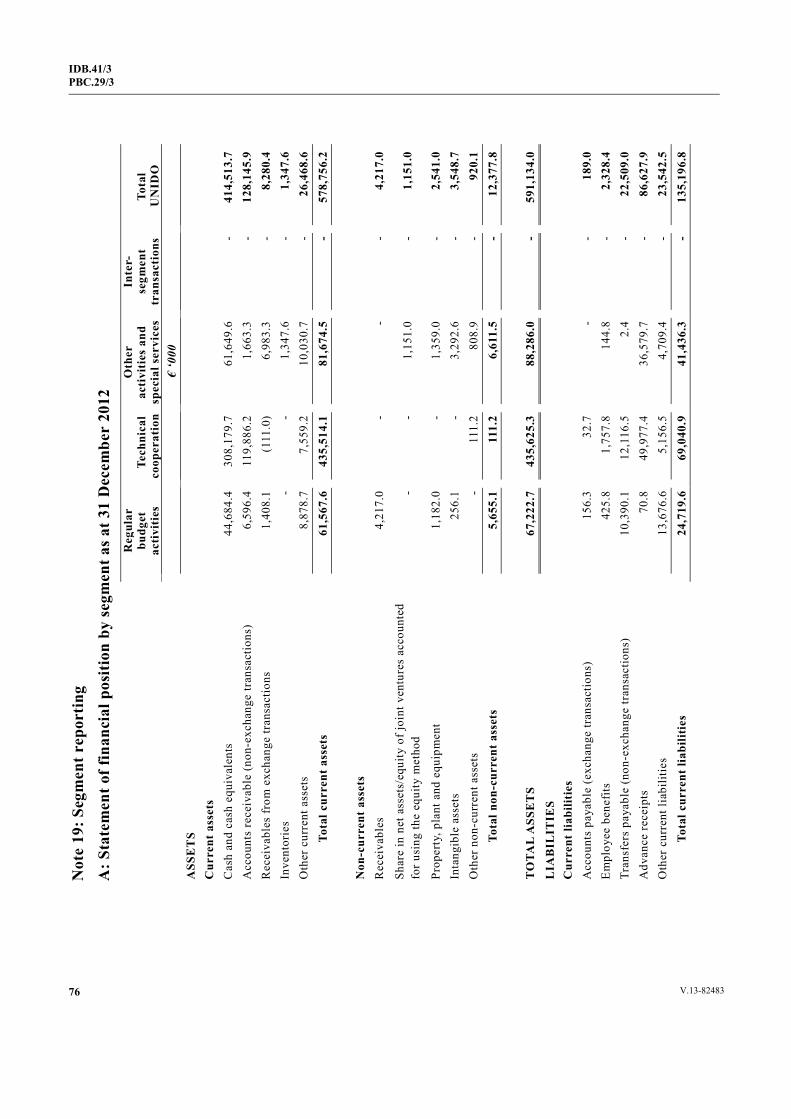
IDB.41/3 PBC.29/3
76 V.13-82483
N
ote
19: S
egm
ent r
epor
ting
A
: Sta
tem
ent o
f fin
anci
al p
ositi
on b
y se
gmen
t as
at 3
1 D
ecem
ber
2012
Reg
ular
bu
dget
ac
tivi
ties
Te
chni
cal
coop
erat
ion
Oth
er
acti
viti
es a
nd
spec
ial s
ervi
ces
Inte
r-se
gmen
t tr
ansa
ctio
ns
Tota
l U
NID
O
€ ‘0
00
ASS
ET
S
Cur
rent
ass
ets
C
ash
and
cash
equ
ival
ents
44
,684
.4
308,
179.
7 61
,649
.6
-41
4,51
3.7
Acc
ount
s re
ceiv
able
(non
-exc
hang
e tr
ansa
ctio
ns)
6,59
6.4
119,
886.
2 1,
663.
3 -
128,
145.
9 R
ecei
vabl
es fr
om e
xcha
nge
tran
sact
ions
1,
408.
1 (1
11.0
)6,
983.
3 -
8,28
0.4
Inve
ntor
ies
--
1,34
7.6
-1,
347.
6 O
ther
cur
rent
ass
ets
8,87
8.7
7,55
9.2
10,0
30.7
-
26,4
68.6
To
tal c
urre
nt a
sset
s 61
,567
.6
435,
514.
1 81
,674
.5
-57
8,75
6.2
Non
-cur
rent
ass
ets
R
ecei
vabl
es
4,21
7.0
--
-4,
217.
0
Shar
e in
net
ass
ets/
equi
ty o
f joi
nt v
entu
res
acco
unte
d fo
r usi
ng th
e eq
uity
met
hod
--
1,15
1.0
-1,
151.
0
Prop
erty
, pla
nt a
nd e
quip
men
t 1,
182.
0 -
1,35
9.0
-2,
541.
0 In
tang
ible
ass
ets
256.
1 -
3,29
2.6
-3,
548.
7 O
ther
non
-cur
rent
ass
ets
-11
1.2
808.
9 -
920.
1
To
tal n
on-c
urre
nt a
sset
s 5,
655.
1 11
1.2
6,61
1.5
-12
,377
.8
TO
TAL
ASS
ET
S 67
,222
.7
435,
625.
3 88
,286
.0
-59
1,13
4.0
LIA
BIL
ITIE
S
Cur
rent
liab
iliti
es
Acc
ount
s pa
yabl
e (e
xcha
nge
tran
sact
ions
) 15
6.3
32.7
-
-18
9.0
Em
ploy
ee b
enef
its
425.
8 1,
757.
8 14
4.8
-2,
328.
4 Tr
ansf
ers
paya
ble
(non
-exc
hang
e tr
ansa
ctio
ns)
10,3
90.1
12
,116
.5
2.4
-22
,509
.0
Adv
ance
rece
ipts
70
.8
49,9
77.4
36
,579
.7
-86
,627
.9
Oth
er c
urre
nt li
abili
ties
13,6
76.6
5,
156.
5 4,
709.
4 -
23,5
42.5
To
tal c
urre
nt li
abili
ties
24
,719
.6
69,0
40.9
41
,436
.3
-13
5,19
6.8
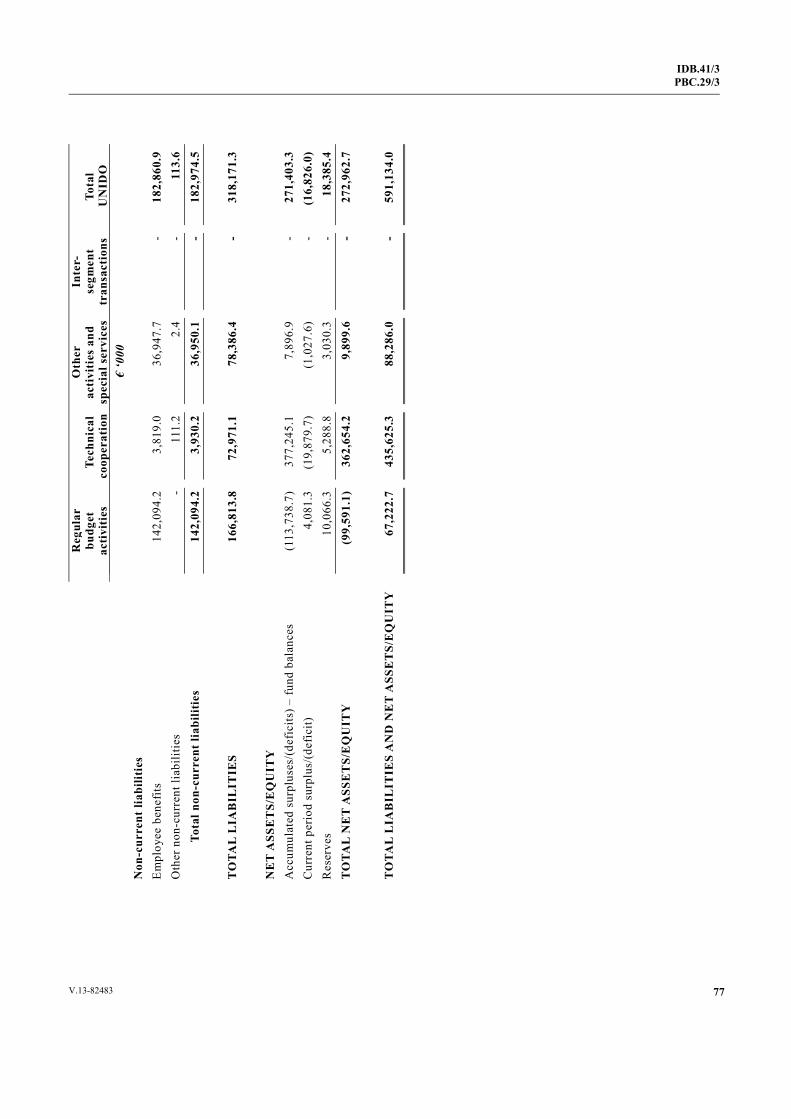
IDB.41/3PBC.29/3
77V.13-82483
Reg
ular
bu
dget
ac
tivi
ties
Te
chni
cal
coop
erat
ion
Oth
er
acti
viti
es a
nd
spec
ial s
ervi
ces
Inte
r-se
gmen
t tr
ansa
ctio
ns
Tota
l U
NID
O
€ ‘0
00
Non
-cur
rent
liab
iliti
es
E
mpl
oyee
ben
efits
14
2,09
4.2
3,81
9.0
36,9
47.7
-
182,
860.
9 O
ther
non
-cur
rent
liab
ilitie
s -
111.
2 2.
4 -
113.
6
To
tal n
on-c
urre
nt li
abili
ties
14
2,09
4.2
3,93
0.2
36,9
50.1
-
182,
974.
5
T
OTA
L L
IAB
ILIT
IES
166,
813.
8 72
,971
.1
78,3
86.4
-
318,
171.
3
N
ET
ASS
ET
S/E
QU
ITY
Acc
umul
ated
sur
plus
es/(
defi
cits
) – fu
nd b
alan
ces
(113
,738
.7)
377,
245.
1 7,
896.
9-
271,
403.
3 C
urre
nt p
erio
d su
rplu
s/(d
efic
it)
4,08
1.3
(19,
879.
7)(1
,027
.6)
-(1
6,82
6.0)
R
eser
ves
10,0
66.3
5,
288.
8 3,
030.
3 -
18,3
85.4
T
OTA
L N
ET
ASS
ET
S/E
QU
ITY
(9
9,59
1.1)
362,
654.
2 9,
899.
6 -
272,
962.
7
TO
TAL
LIA
BIL
ITIE
S A
ND
NE
T A
SSE
TS/
EQ
UIT
Y
67,2
22.7
43
5,62
5.3
88,2
86.0
-
591,
134.
0
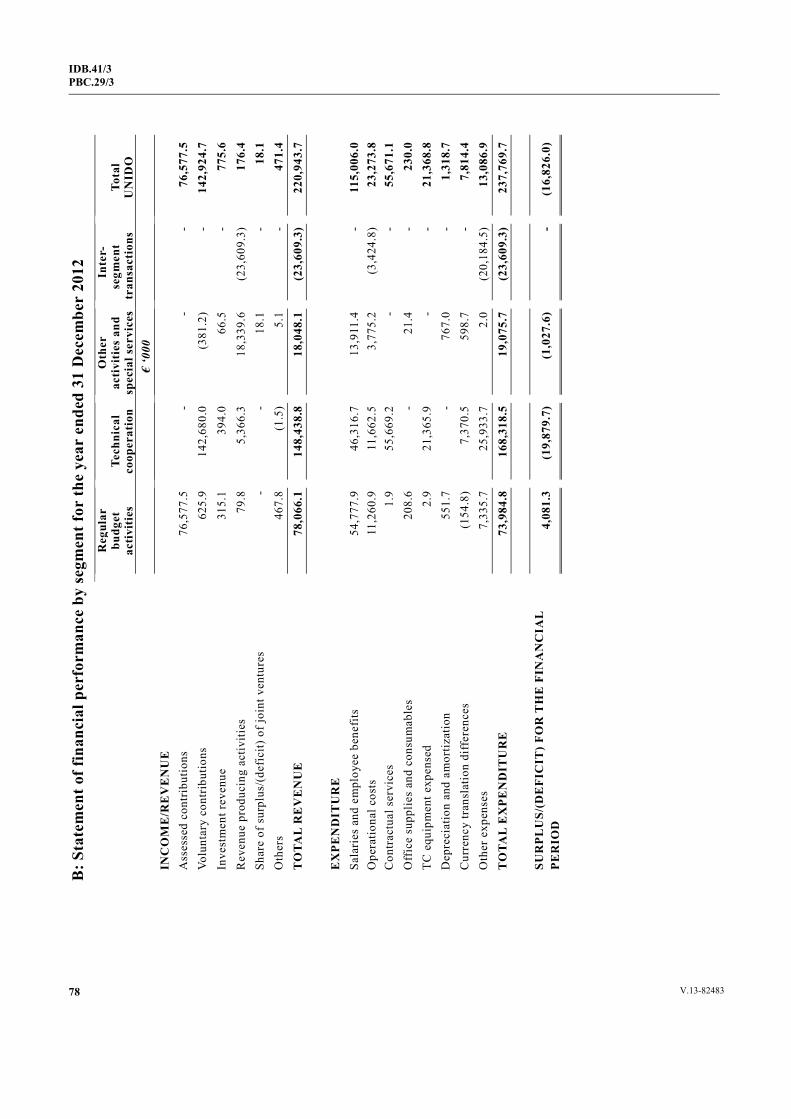
IDB.41/3 PBC.29/3
78 V.13-82483
B
: Sta
tem
ent o
f fin
anci
al p
erfo
rman
ce b
y se
gmen
t for
the
year
end
ed 3
1 D
ecem
ber
2012
Reg
ular
bu
dget
ac
tivi
ties
Tech
nica
l co
oper
atio
n
Oth
er
acti
viti
es a
nd
spec
ial s
ervi
ces
Inte
r-se
gmen
t tr
ansa
ctio
nsTo
tal
UN
IDO
€
‘000
IN
CO
ME
/RE
VE
NU
E
A
sses
sed
cont
ribu
tions
76
,577
.5
--
-76
,577
.5
Volu
ntar
y co
ntri
butio
ns
625.
9 14
2,68
0.0
(381
.2)
-14
2,92
4.7
Inve
stm
ent r
even
ue
315.
1 39
4.0
66.5
-
775.
6 R
even
ue p
rodu
cing
act
iviti
es
79.8
5,
366.
3 18
,339
.6
(23,
609.
3)17
6.4
Shar
e of
sur
plus
/(de
fici
t) o
f joi
nt v
entu
res
-
-18
.1
-18
.1
Oth
ers
467.
8 (1
.5)
5.1
-47
1.4
TO
TAL
RE
VE
NU
E
78,0
66.1
14
8,43
8.8
18,0
48.1
(2
3,60
9.3)
220,
943.
7
E
XPE
ND
ITU
RE
Sala
ries
and
em
ploy
ee b
enef
its
54,7
77.9
46
,316
.7
13,9
11.4
-
115,
006.
0 O
pera
tiona
l cos
ts
11,2
60.9
11
,662
.5
3,77
5.2
(3,4
24.8
)23
,273
.8
Con
trac
tual
ser
vice
s 1.
9 55
,669
.2
--
55,6
71.1
O
ffic
e su
pplie
s an
d co
nsum
able
s 20
8.6
-21
.4
-23
0.0
TC e
quip
men
t exp
ense
d 2.
9 21
,365
.9
--
21,3
68.8
D
epre
ciat
ion
and
amor
tizat
ion
551.
7 -
767.
0 -
1,31
8.7
Cur
renc
y tr
ansl
atio
n di
ffer
ence
s (1
54.8
)7,
370.
5 59
8.7
-7,
814.
4 O
ther
exp
ense
s 7,
335.
7 25
,933
.7
2.0
(20,
184.
5)13
,086
.9
TO
TAL
EX
PEN
DIT
UR
E
73,9
84.8
16
8,31
8.5
19,0
75.7
(2
3,60
9.3)
237,
769.
7
SU
RPL
US/
(DE
FIC
IT) F
OR
TH
E F
INA
NC
IAL
PER
IOD
4,
081.
3 (1
9,87
9.7)
(1,0
27.6
)-
(16,
826.
0)
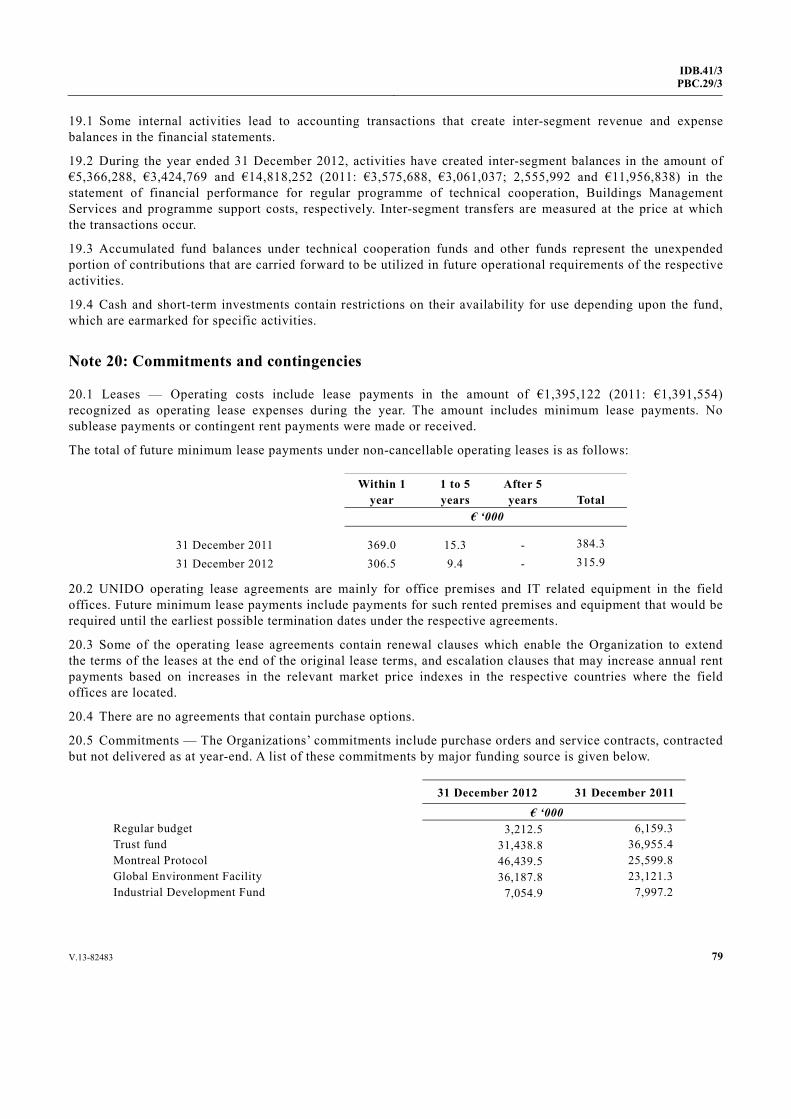
V.13-82483 79
IDB.41/3PBC.29/3
19.1 Some internal activities lead to accounting transactions that create inter-segment revenue and expense balances in the financial statements.
19.2 During the year ended 31 December 2012, activities have created inter-segment balances in the amount of €5,366,288, €3,424,769 and €14,818,252 (2011: €3,575,688, €3,061,037; 2,555,992 and €11,956,838) in the statement of financial performance for regular programme of technical cooperation, Buildings Management Services and programme support costs, respectively. Inter-segment transfers are measured at the price at which the transactions occur.
19.3 Accumulated fund balances under technical cooperation funds and other funds represent the unexpended portion of contributions that are carried forward to be utilized in future operational requirements of the respective activities.
19.4 Cash and short-term investments contain restrictions on their availability for use depending upon the fund, which are earmarked for specific activities.
Note 20: Commitments and contingencies
20.1 Leases — Operating costs include lease payments in the amount of €1,395,122 (2011: €1,391,554) recognized as operating lease expenses during the year. The amount includes minimum lease payments. No sublease payments or contingent rent payments were made or received.
The total of future minimum lease payments under non-cancellable operating leases is as follows:
Within 1 year
1 to 5 years
After 5 years Total
€ ‘000 31 December 2011 369.0 15.3 - 384.3
31 December 2012 306.5 9.4 - 315.9
20.2 UNIDO operating lease agreements are mainly for office premises and IT related equipment in the field offices. Future minimum lease payments include payments for such rented premises and equipment that would be required until the earliest possible termination dates under the respective agreements.
20.3 Some of the operating lease agreements contain renewal clauses which enable the Organization to extend the terms of the leases at the end of the original lease terms, and escalation clauses that may increase annual rent payments based on increases in the relevant market price indexes in the respective countries where the field offices are located.
20.4 There are no agreements that contain purchase options.
20.5 Commitments — The Organizations’ commitments include purchase orders and service contracts, contracted but not delivered as at year-end. A list of these commitments by major funding source is given below.
31 December 2012 31 December 2011
€ ‘000 Regular budget 3,212.5 6,159.3 Trust fund 31,438.8 36,955.4 Montreal Protocol 46,439.5 25,599.8 Global Environment Facility 36,187.8 23,121.3 Industrial Development Fund 7,054.9 7,997.2
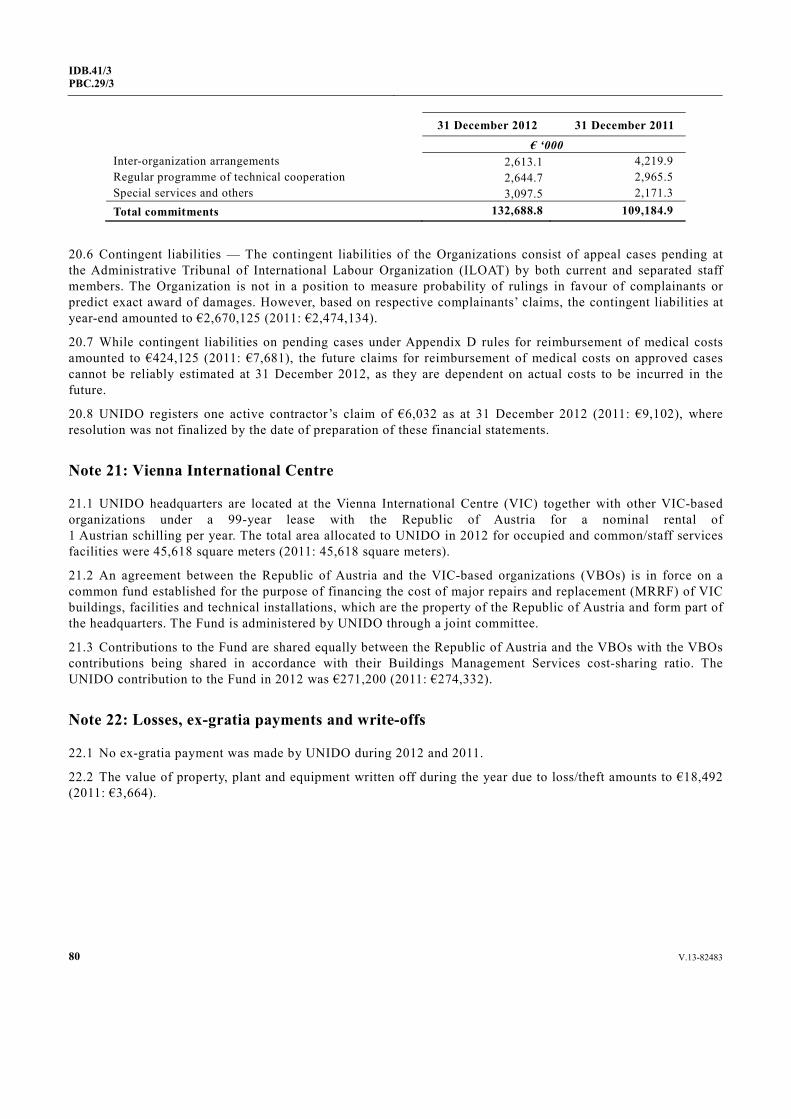
80 V.13-82483
IDB.41/3 PBC.29/3
31 December 2012 31 December 2011
€ ‘000 Inter-organization arrangements 2,613.1 4,219.9 Regular programme of technical cooperation 2,644.7 2,965.5 Special services and others 3,097.5 2,171.3 Total commitments 132,688.8 109,184.9
20.6 Contingent liabilities — The contingent liabilities of the Organizations consist of appeal cases pending at the Administrative Tribunal of International Labour Organization (ILOAT) by both current and separated staff members. The Organization is not in a position to measure probability of rulings in favour of complainants or predict exact award of damages. However, based on respective complainants’ claims, the contingent liabilities at year-end amounted to €2,670,125 (2011: €2,474,134).
20.7 While contingent liabilities on pending cases under Appendix D rules for reimbursement of medical costs amounted to €424,125 (2011: €7,681), the future claims for reimbursement of medical costs on approved cases cannot be reliably estimated at 31 December 2012, as they are dependent on actual costs to be incurred in the future.
20.8 UNIDO registers one active contractor’s claim of €6,032 as at 31 December 2012 (2011: €9,102), where resolution was not finalized by the date of preparation of these financial statements.
Note 21: Vienna International Centre
21.1 UNIDO headquarters are located at the Vienna International Centre (VIC) together with other VIC-based organizations under a 99-year lease with the Republic of Austria for a nominal rental of 1 Austrian schilling per year. The total area allocated to UNIDO in 2012 for occupied and common/staff services facilities were 45,618 square meters (2011: 45,618 square meters).
21.2 An agreement between the Republic of Austria and the VIC-based organizations (VBOs) is in force on a common fund established for the purpose of financing the cost of major repairs and replacement (MRRF) of VIC buildings, facilities and technical installations, which are the property of the Republic of Austria and form part of the headquarters. The Fund is administered by UNIDO through a joint committee.
21.3 Contributions to the Fund are shared equally between the Republic of Austria and the VBOs with the VBOs contributions being shared in accordance with their Buildings Management Services cost-sharing ratio. The UNIDO contribution to the Fund in 2012 was €271,200 (2011: €274,332).
Note 22: Losses, ex-gratia payments and write-offs
22.1 No ex-gratia payment was made by UNIDO during 2012 and 2011.
22.2 The value of property, plant and equipment written off during the year due to loss/theft amounts to €18,492 (2011: €3,664).
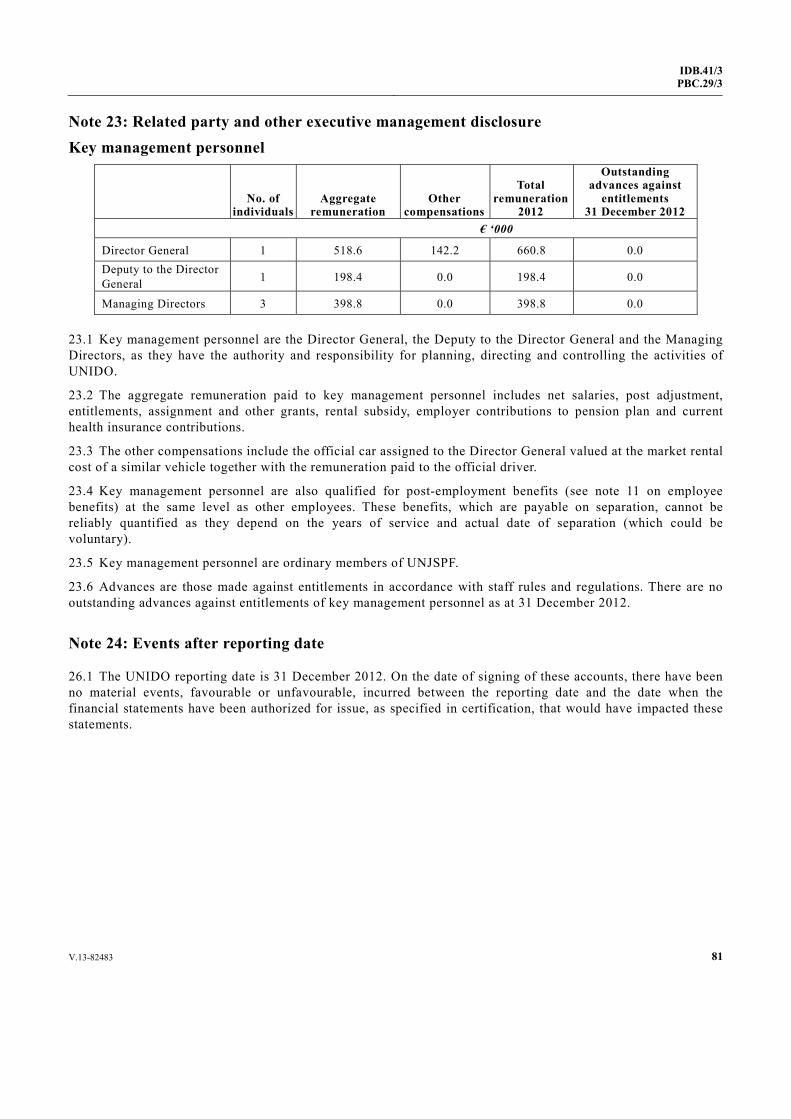
V.13-82483 81
IDB.41/3PBC.29/3
Note 23: Related party and other executive management disclosure
Key management personnel
No. of
individuals Aggregate
remuneration Other
compensations
Total remuneration
2012
Outstanding advances against
entitlements 31 December 2012
€ ‘000
Director General 1 518.6 142.2 660.8 0.0 Deputy to the Director General 1 198.4 0.0 198.4 0.0
Managing Directors 3 398.8 0.0 398.8 0.0
23.1 Key management personnel are the Director General, the Deputy to the Director General and the Managing Directors, as they have the authority and responsibility for planning, directing and controlling the activities of UNIDO.
23.2 The aggregate remuneration paid to key management personnel includes net salaries, post adjustment, entitlements, assignment and other grants, rental subsidy, employer contributions to pension plan and current health insurance contributions.
23.3 The other compensations include the official car assigned to the Director General valued at the market rental cost of a similar vehicle together with the remuneration paid to the official driver.
23.4 Key management personnel are also qualified for post-employment benefits (see note 11 on employee benefits) at the same level as other employees. These benefits, which are payable on separation, cannot be reliably quantified as they depend on the years of service and actual date of separation (which could be voluntary).
23.5 Key management personnel are ordinary members of UNJSPF.
23.6 Advances are those made against entitlements in accordance with staff rules and regulations. There are no outstanding advances against entitlements of key management personnel as at 31 December 2012.
Note 24: Events after reporting date
26.1 The UNIDO reporting date is 31 December 2012. On the date of signing of these accounts, there have been no material events, favourable or unfavourable, incurred between the reporting date and the date when the financial statements have been authorized for issue, as specified in certification, that would have impacted these statements.
82 V.13-82483
IDB.41/3 PBC.29/3
II. ANNEXES PRESENTED IN ACCORDANCE WITH UNITED NATIONS SYSTEM ACCOUNTING STANDARDS FOR THE
YEAR ENDED 31 DECEMBER 2012 (UNAUDITED)

IDB.41/3PBC.29/3
83V.13-82483
Ann
ex I
(a)
Gen
eral
Fun
d: S
tatu
s of a
ppro
pria
tions
by
maj
or o
bjec
t of e
xpen
ditu
re fo
r th
e ye
ar 2
012
as a
t 31
Dec
embe
r 20
12
(In
thou
sand
s of e
uros
)
Maj
or o
bjec
t of e
xpen
ditu
re
Ori
gina
l ap
prop
riat
ion
Disb
urse
men
ts
duri
ng 2
012
Unl
iqui
date
d ob
ligat
ions
as
at 3
1/12
/12
Tot
al
expe
nditu
re
Bal
ance
of
appr
opri
atio
ns
Sala
ries a
nd c
omm
on st
aff c
osts
52
,342
.1
47,7
09.4
55
9.4
48,2
68.7
4,
073.
3 O
ffici
al tr
avel
1,
283.
2 67
3.6
43.0
71
6.7
566.
6 O
pera
ting
cost
s 14
,274
.0
10,0
95.6
1,
262.
7 11
,358
.3
2,91
5.6
Info
rmat
ion
and
com
mun
icat
ion
tech
nolo
gy
2,83
8.4
1,13
6.3
428.
4 1,
564.
7 1,
273.
8 R
PTC
and
SR
A a
ctiv
ities
7,
002.
7 5,
813.
9 35
2.8
6,16
6.7
836.
0 T
OT
AL
A
77,7
40.4
65
,428
.8
2,64
6.3
68,0
75.1
9,
665.
3
Inco
me
A
ctua
l in
com
e A
ccru
ed
inco
me
Tot
al
inco
me
Shor
tfal
l/ (s
urpl
us)
Reg
iona
l Pro
gram
me
1,20
9.0
606.
7
606.
7 60
2.3
Mis
cella
neou
s Inc
ome
1. E
stim
ated
in G
C.1
3/D
ec.1
4 84
9.2
390.
4
390.
4 45
8.8
2.
Not
est
imat
ed in
GC
.13/
Dec
.14
6
34.8
634
.8
(634
.8)
TO
TA
L B
2,
058.
2 1,
631.
9
1,63
1.9
426.
3
T
OT
AL
A-B
75
,682
.2
63,7
96.9
2,
646.
3 66
,443
.2
9,23
9.0
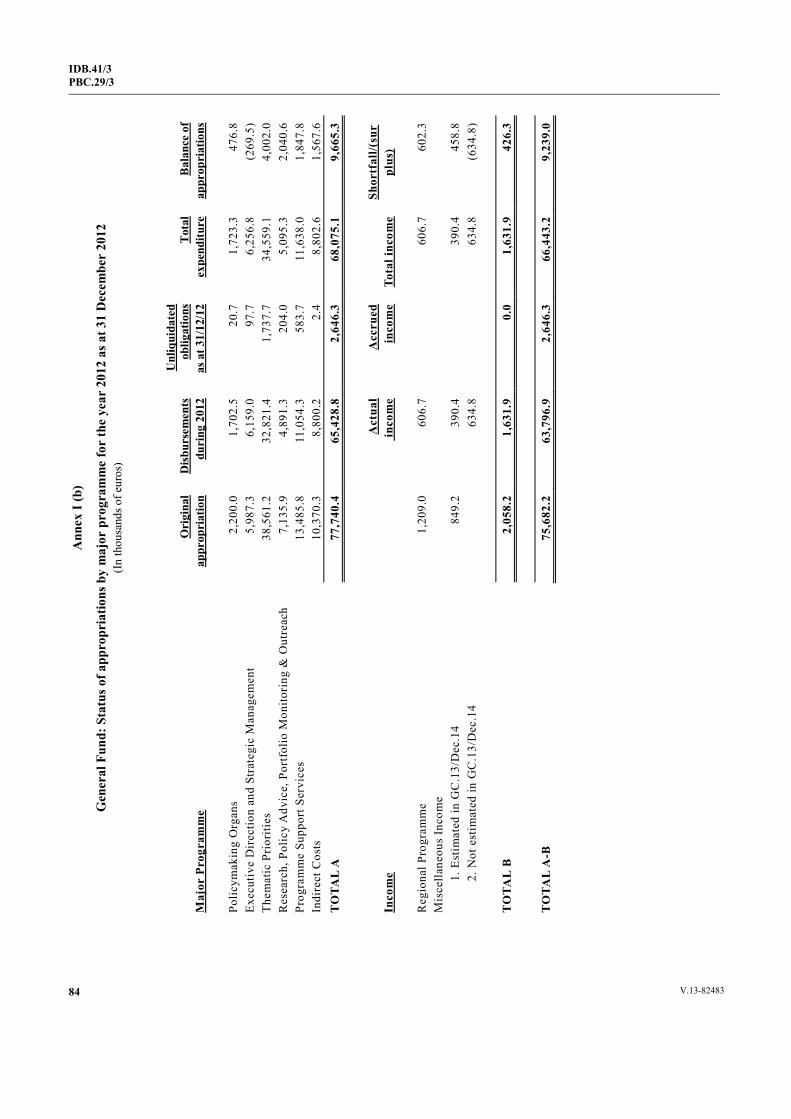
IDB.41/3 PBC.29/3
84 V.13-82483
Ann
ex I
(b)
Gen
eral
Fun
d: S
tatu
s of a
ppro
pria
tions
by
maj
or p
rogr
amm
e fo
r th
e ye
ar 2
012
as a
t 31
Dec
embe
r 20
12
(In
thou
sand
s of e
uros
)
Maj
or P
rogr
amm
e O
rigi
nal
appr
opri
atio
n D
isbur
sem
ents
du
ring
201
2
Unl
iqui
date
d ob
ligat
ions
as
at 3
1/12
/12
Tot
al
expe
nditu
re
Bal
ance
of
appr
opri
atio
ns
Polic
ymak
ing
Org
ans
2,
200.
0 1,
702.
5 20
.7
1,72
3.3
476.
8
Exec
utiv
e D
irec
tion
and
Stra
tegi
c M
anag
emen
t 5,
987.
3 6,
159.
0 97
.7
6,25
6.8
(269
.5)
Them
atic
Pri
oriti
es
38,5
61.2
32
,821
.4
1,73
7.7
34,5
59.1
4,
002.
0
Res
earc
h, P
olic
y A
dvic
e, P
ortf
olio
Mon
itori
ng &
Out
reac
h 7,
135.
9 4,
891.
3 20
4.0
5,09
5.3
2,04
0.6
Pr
ogra
mm
e Su
ppor
t Ser
vice
s 13
,485
.8
11,0
54.3
58
3.7
11,6
38.0
1,
847.
8
Indi
rect
Cos
ts
10,3
70.3
8,
800.
2 2.
4 8,
802.
6 1,
567.
6
TO
TAL
A
77,7
40.4
65
,428
.8
2,64
6.3
68,0
75.1
9,
665.
3
Inco
me
A
ctua
l in
com
e A
ccru
ed
inco
me
Tota
l inc
ome
Shor
tfal
l/(su
rpl
us)
Reg
iona
l Pro
gram
me
1,20
9.0
606
.7
6
06.7
60
2.3
M
isce
llane
ous
Inco
me
1. E
stim
ated
in G
C.1
3/D
ec.1
4 84
9.2
390
.4
3
90.4
45
8.8
2. N
ot e
stim
ated
in G
C.1
3/D
ec.1
4
634
.8
6
34.8
(6
34.8
)
T
OTA
L B
2,
058.
2 1,
631.
9 0.
0 1,
631.
9 42
6.3
TO
TAL
A-B
75
,682
.2
63,7
96.9
2,
646.
3 66
,443
.2
9,23
9.0

IDB.41/3PBC.29/3
85V.13-82483
Ann
ex I
(c)
Ope
ratio
nal b
udge
t: S
tatu
s of a
ppro
pria
tions
by
maj
or o
bjec
t of e
xpen
ditu
re fo
r ye
ar 2
012
as a
t 31
Dec
embe
r 20
12
(In
thou
sand
s of e
uros
)
Maj
or o
bjec
t of e
xpen
ditu
re
Ori
gina
l ap
prop
riat
ion
Disb
urse
men
ts
duri
ng 2
012
Unl
iqui
date
d ob
ligat
ions
as
at 3
1/12
/12
Tot
al
expe
nditu
re
Bal
ance
of
appr
opri
atio
ns
Sala
ries
and
com
mon
sta
ff c
osts
12
,829
.4
11,4
99.9
13
3.5
11,6
33.5
1,
195.
9 O
ffic
ial T
rave
l 1,
129.
3 59
5.2
94.1
68
9.3
440.
0 O
pera
ting
Cos
ts
267.
0 54
9.3
106.
5 65
5.8
(388
.8)
Fiel
d N
etw
ork
Ope
ratin
g C
osts
0.
0 0.
0 0.
0 0.
0 0.
0 T
OTA
L A
14
,225
.7
12,6
44.4
33
4.1
12,9
78.5
1,
247.
2
Inco
me
A
ctua
l in
com
e A
ccru
ed
inco
me
Tota
l in
com
e Sh
ortf
all/(
sur
plus
)
R
egio
nal P
rogr
amm
e
Mis
cella
neou
s Inc
ome
1. E
stim
ated
in G
C.1
3/D
ec.1
4 24
.6
35.
0
35.
0 (1
0.4)
2. N
ot e
stim
ated
in G
C.1
3/D
ec.1
4
(598
.7)
(5
98.7
) 59
8.7
TO
TA
L B
24
.6
(563
.7)
(5
63.7
) 58
8.3
TO
TA
L A
-B
14,2
01.1
13
,208
.1
334.
1 13
,542
.2
658.
9

IDB.41/3 PBC.29/3
86 V.13-82483
Ann
ex I
(d)
Ope
ratio
nal b
udge
t: S
tatu
s of a
ppro
pria
tions
by
maj
or p
rogr
amm
e fo
r th
e ye
ar 2
012
as a
t 31
Dec
embe
r 20
12
(In
thou
sand
s of e
uros
)
Maj
or P
rogr
amm
e O
rigi
nal
appr
opri
atio
n D
isbur
sem
ents
du
ring
201
2
Unl
iqui
date
d ob
ligat
ions
as
at 3
1/12
/12
Tot
al
expe
nditu
re
Bal
ance
of
appr
opri
atio
ns
Polic
ymak
ing
Org
ans
42
.7
18.2
0.
0 18
.2
24.5
Ex
ecut
ive
Dir
ectio
n an
d St
rate
gic
Man
agem
ent
136.
2 15
9.4
0.0
159.
4 (2
3.2)
Th
emat
ic P
rior
ities
11
,353
.0
10,0
46.2
33
4.1
10,3
80.3
97
2.7
R
esea
rch,
Pol
icy
Adv
ice,
Por
tfol
io M
onito
ring
& O
utre
ach
600.
9 40
8.4
0.0
408.
4 19
2.5
Pr
ogra
mm
e Su
ppor
t Ser
vice
s 2,
092.
9 2,
012.
3 0.
0 2,
012.
3 80
.6
TO
TAL
A
14,2
25.7
12
,644
.4
334.
1 12
,978
.5
1,24
7.2
Inco
me
A
ctua
l in
com
e A
ccru
ed
inco
me
Tota
l inc
ome
Shor
tfal
l/(su
rpl
us)
Reg
iona
l Pro
gram
me
M
isce
llane
ous
Inco
me
1. E
stim
ated
in G
C.1
3/D
ec.1
4 24
.6
35.
0
35.0
(1
0.4)
2. N
ot e
stim
ated
in G
C.1
3/D
ec.1
4
(598
.7)
(5
98.7
) 59
8.7
T
OTA
L B
24
.6
(563
.7)
0.0
(563
.7)
588.
3
TO
TAL
A-B
14
,201
.1
13,2
08.1
33
4.1
13,5
42.2
65
8.9

IDB.41/3PBC.29/3
87V.13-82483
Ann
ex I
(e)
Stat
us o
f ass
esse
d co
ntri
buti
ons
to th
e re
gula
r bu
dget
(in
euro
s) a
s at
31
Dec
embe
r 20
12
Mem
ber
Stat
es
Scal
e %
Con
trib
utio
ns p
ayab
le
Cre
dits
and
col
lect
ions
in 2
012
Con
trib
utio
ns o
utst
andi
ng
Tot
al
outs
tand
ing
Prio
r bie
nniu
m
Cur
rent
bi
enni
um
Prio
r bie
nniu
m
Cur
rent
bi
enni
um
Prio
r bie
nniu
m
Cur
rent
bi
enni
um
Afg
hani
stan
0.
006
709
4,
163
70
9
4,16
3
-
-
- A
lban
ia
0.01
4 -
9,
714
-
1,
493
-
8,
221
8,
221
Alg
eria
0.
195
-
135,
304
-
13
5,30
4
-
-
- A
ngol
a
0.01
0 8,
692
6,
939
8,
692
6,
939
-
-
-
Arg
entin
a
0.43
7 2,
209,
628
30
3,22
1
125,
059
-
2,
084,
569
30
3,22
1
2,38
7,79
0 A
rmen
ia
0.00
7 91
3,19
5
4,85
7
4,60
8
-
908,
587
4,
857
91
3,44
4 A
ustr
ia
1.29
5 -
89
8,56
0
-
898,
560
-
-
-
Aze
rbai
jan
0.
023
118,
546
15
,959
118,
546
15
,959
-
-
- B
aham
as
0.02
7 -
18
,734
-
5,62
3
-
13,1
11
13
,111
B
ahra
in
0.05
9 -
40
,938
-
40,9
38
-
-
-
Ban
glad
esh
0.
010
-
6,93
9
-
2,55
0
-
4,38
9
4,38
9 B
arba
dos
0.
012
54
8,
326
54
3,05
2
-
5,27
4
5,27
4 B
elar
us
0.06
4 -
44
,408
-
44,4
08
-
-
-
Bel
gium
1.
636
-
1,13
5,16
9
-
1,13
5,16
9
-
-
- B
eliz
e
0.00
1 3,
649
69
4
3,64
9
694
-
-
-
Ben
in
0.00
5 50
4
3,46
9
504
29
7
-
3,17
2
3,17
2 B
huta
n
0.00
1 -
69
4
-
694
-
-
-
Bol
ivia
(Plu
rina
tiona
l S
tate
of)
0.
011
24,8
29
7,
633
1,
331
-
23
,498
7,63
3
31,1
31
Bos
nia
and
Her
zego
vina
0.
021
-
14,5
71
-
14
,571
-
-
- B
otsw
ana
0.
027
-
18,7
34
-
18
,734
-
-
- B
razi
l 2.
452
14,6
86,4
48
1,
701,
366
6,
625,
793
-
8,
060,
655
1,
701,
366
9,
762,
021
Bul
gari
a
0.05
8 -
40
,244
-
40,2
44
-
-
-
Bur
kina
Fas
o
0.00
4 -
2,
775
-
2,
775
-
-
-
Bur
undi
0.
001
45,3
05
69
4
7
-
45,2
98
69
4
45,9
92
Cam
bodi
a
0.00
5 -
3,
469
-
3,
469
-
-
-
Cam
eroo
n
0.01
7 11
,980
11,7
96
2,
937
-
9,
043
11
,796
20,8
39
Cap
e Ve
rde
0.
001
52,0
75
69
4
7
-
52,0
68
69
4
52,7
62
Cen
tral
Afr
ican
Rep
ublic
0.
001
117,
511
69
4
7
-
117,
504
69
4
118,
198
Cha
d
0.00
3 10
0,61
8
2,08
2
-
-
100,
618
2,
082
10
2,70
0 C
hile
0.
359
-
249,
099
-
24
8,32
4
-
775
77
5 C
hina
4.
853
-
3,36
7,34
6
-
3,36
7,34
6
-
-
- C
olom
bia
0.
219
-
151,
957
-
15
1,95
7
-
-
-
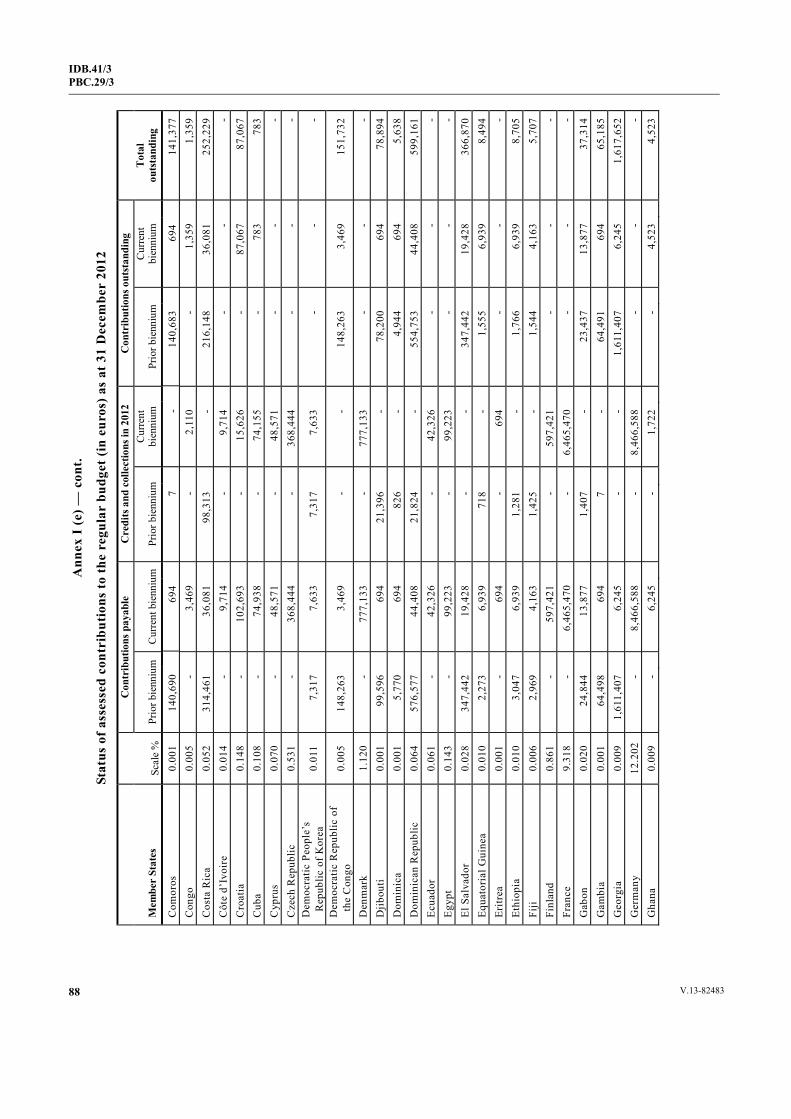
IDB.41/3 PBC.29/3
88 V.13-82483
Ann
ex I
(e) —
con
t.
Stat
us o
f ass
esse
d co
ntri
buti
ons
to th
e re
gula
r bu
dget
(in
euro
s) a
s at
31
Dec
embe
r 20
12
Mem
ber
Stat
es
Scal
e %
Con
trib
utio
ns p
ayab
le
Cre
dits
and
col
lect
ions
in 2
012
Con
trib
utio
ns o
utst
andi
ng
Tot
al
outs
tand
ing
Prio
r bie
nniu
m
Cur
rent
bie
nniu
m
Prio
r bie
nniu
m
Cur
rent
bi
enni
um
Prio
r bie
nniu
m
Cur
rent
bi
enni
um
Com
oros
0.
001
140,
690
69
4
7
-
140,
683
69
4
141,
377
Con
go
0.00
5 -
3,
469
-
2,
110
-
1,
359
1,
359
Cos
ta R
ica
0.05
2 31
4,46
1
36,0
81
98
,313
-
216,
148
36
,081
252,
229
Côt
e d’
Ivoi
re
0.01
4 -
9,
714
-
9,
714
-
-
-
Cro
atia
0.
148
-
102,
693
-
15
,626
-
87,0
67
87
,067
C
uba
0.10
8 -
74
,938
-
74,1
55
-
78
3
783
Cyp
rus
0.07
0 -
48
,571
-
48,5
71
-
-
-
Cze
ch R
epub
lic
0.53
1 -
36
8,44
4
-
368,
444
-
-
-
Dem
ocra
tic P
eopl
e’s
R
epub
lic o
f Kor
ea
0.01
1 7,
317
7,
633
7,
317
7,
633
-
-
-
Dem
ocra
tic R
epub
lic o
f t
he C
ongo
0.
005
148,
263
3,
469
-
-
14
8,26
3
3,46
9
151,
732
Den
mar
k 1.
120
-
777,
133
-
77
7,13
3
-
-
- D
jibou
ti 0.
001
99,5
96
69
4
21,3
96
-
78
,200
694
78
,894
D
omin
ica
0.00
1 5,
770
69
4
826
-
4,
944
69
4
5,63
8 D
omin
ican
Rep
ublic
0.
064
576,
577
44
,408
21,8
24
-
55
4,75
3
44,4
08
59
9,16
1 Ec
uado
r 0.
061
-
42,3
26
-
42
,326
-
-
- Eg
ypt
0.14
3 -
99
,223
-
99,2
23
-
-
-
El S
alva
dor
0.02
8 34
7,44
2
19,4
28
-
-
34
7,44
2
19,4
28
36
6,87
0 Eq
uato
rial
Gui
nea
0.01
0 2,
273
6,
939
71
8
-
1,55
5
6,93
9
8,49
4 Er
itrea
0.
001
-
694
-
69
4
-
-
- Et
hiop
ia
0.01
0 3,
047
6,
939
1,
281
-
1,
766
6,
939
8,
705
Fiji
0.00
6 2,
969
4,
163
1,
425
-
1,
544
4,
163
5,
707
Finl
and
0.86
1 -
59
7,42
1
-
597,
421
-
-
-
Fran
ce
9.31
8 -
6,
465,
470
-
6,
465,
470
-
-
-
Gab
on
0.02
0 24
,844
13,8
77
1,
407
-
23
,437
13,8
77
37
,314
G
ambi
a 0.
001
64,4
98
69
4
7
-
64,4
91
69
4
65,1
85
Geo
rgia
0.
009
1,61
1,40
7
6,24
5
-
-
1,61
1,40
7
6,24
5
1,61
7,65
2 G
erm
any
12.2
02
-
8,46
6,58
8
-
8,46
6,58
8
-
-
- G
hana
0.
009
-
6,24
5
-
1,72
2
-
4,52
3
4,52
3
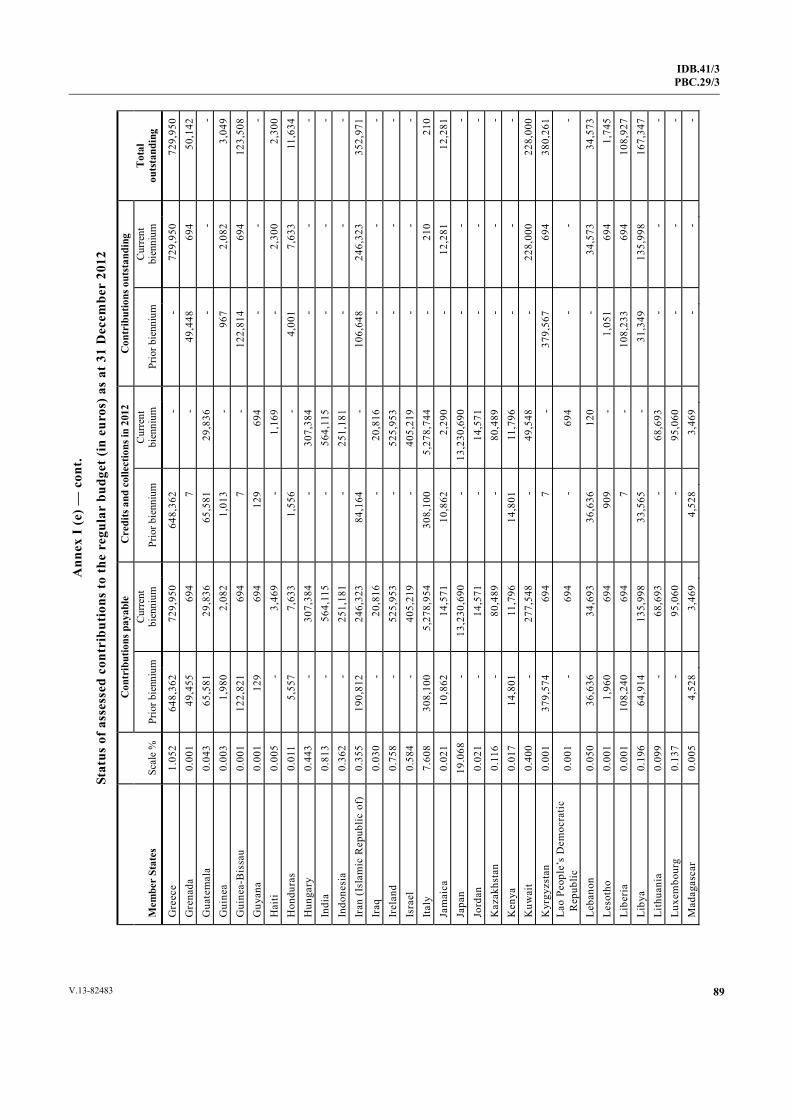
IDB.41/3PBC.29/3
89V.13-82483
Ann
ex I
(e) —
con
t.
Stat
us o
f ass
esse
d co
ntri
buti
ons
to th
e re
gula
r bu
dget
(in
euro
s) a
s at
31
Dec
embe
r 20
12
Mem
ber
Stat
es
Scal
e %
Con
trib
utio
ns p
ayab
le
Cre
dits
and
col
lect
ions
in 2
012
Con
trib
utio
ns o
utst
andi
ng
Tot
al
outs
tand
ing
Prio
r bie
nniu
m
Cur
rent
bi
enni
um
Prio
r bie
nniu
m
Cur
rent
bi
enni
um
Prio
r bie
nniu
m
Cur
rent
bi
enni
um
Gre
ece
1.05
2 64
8,36
2
729,
950
64
8,36
2
-
-
729,
950
72
9,95
0 G
rena
da
0.00
1 49
,455
694
7
-
49
,448
694
50
,142
G
uate
mal
a 0.
043
65,5
81
29
,836
65,5
81
29
,836
-
-
- G
uine
a 0.
003
1,98
0
2,08
2
1,01
3
-
967
2,
082
3,
049
Gui
nea-
Bis
sau
0.00
1 12
2,82
1
694
7
-
12
2,81
4
694
12
3,50
8 G
uyan
a 0.
001
129
69
4
129
69
4
-
-
- H
aiti
0.00
5 -
3,
469
-
1,
169
-
2,
300
2,
300
Hon
dura
s 0.
011
5,55
7
7,63
3
1,55
6
-
4,00
1
7,63
3
11,6
34
Hun
gary
0.
443
-
307,
384
-
30
7,38
4
-
-
- In
dia
0.81
3 -
56
4,11
5
-
564,
115
-
-
-
Indo
nesi
a 0.
362
-
251,
181
-
25
1,18
1
-
-
- Ir
an (
Isla
mic
Rep
ublic
of)
0.
355
190,
812
24
6,32
3
84,1
64
-
10
6,64
8
246,
323
35
2,97
1 Ir
aq
0.03
0 -
20
,816
-
20,8
16
-
-
-
Irel
and
0.75
8 -
52
5,95
3
-
525,
953
-
-
-
Isra
el
0.58
4 -
40
5,21
9
-
405,
219
-
-
-
Italy
7.
608
308,
100
5,
278,
954
30
8,10
0
5,27
8,74
4
-
210
21
0 Ja
mai
ca
0.02
1 10
,862
14,5
71
10
,862
2,29
0
-
12,2
81
12
,281
Ja
pan
19.0
68
-
13,2
30,6
90
-
13
,230
,690
-
-
- Jo
rdan
0.
021
-
14,5
71
-
14
,571
-
-
- K
azak
hsta
n 0.
116
-
80,4
89
-
80
,489
-
-
- K
enya
0.
017
14,8
01
11
,796
14,8
01
11
,796
-
-
- K
uwai
t 0.
400
-
277,
548
-
49
,548
-
228,
000
22
8,00
0 K
yrgy
zsta
n 0.
001
379,
574
69
4
7
-
379,
567
69
4
380,
261
Lao
Peop
le’s
Dem
ocra
tic
Rep
ublic
0.
001
-
694
-
69
4
-
-
-
Leba
non
0.05
0 36
,636
34,6
93
36
,636
120
-
34
,573
34,5
73
Leso
tho
0.00
1 1,
960
69
4
909
-
1,
051
69
4
1,74
5 Li
beri
a 0.
001
108,
240
69
4
7
-
108,
233
69
4
108,
927
Liby
a 0.
196
64,9
14
13
5,99
8
33,5
65
-
31
,349
135,
998
16
7,34
7 Li
thua
nia
0.
099
-
68,6
93
-
68
,693
-
-
- Lu
xem
bour
g 0.
137
-
95,0
60
-
95
,060
-
-
- M
adag
asca
r 0.
005
4,52
8
3,46
9
4,52
8
3,46
9
-
-
-
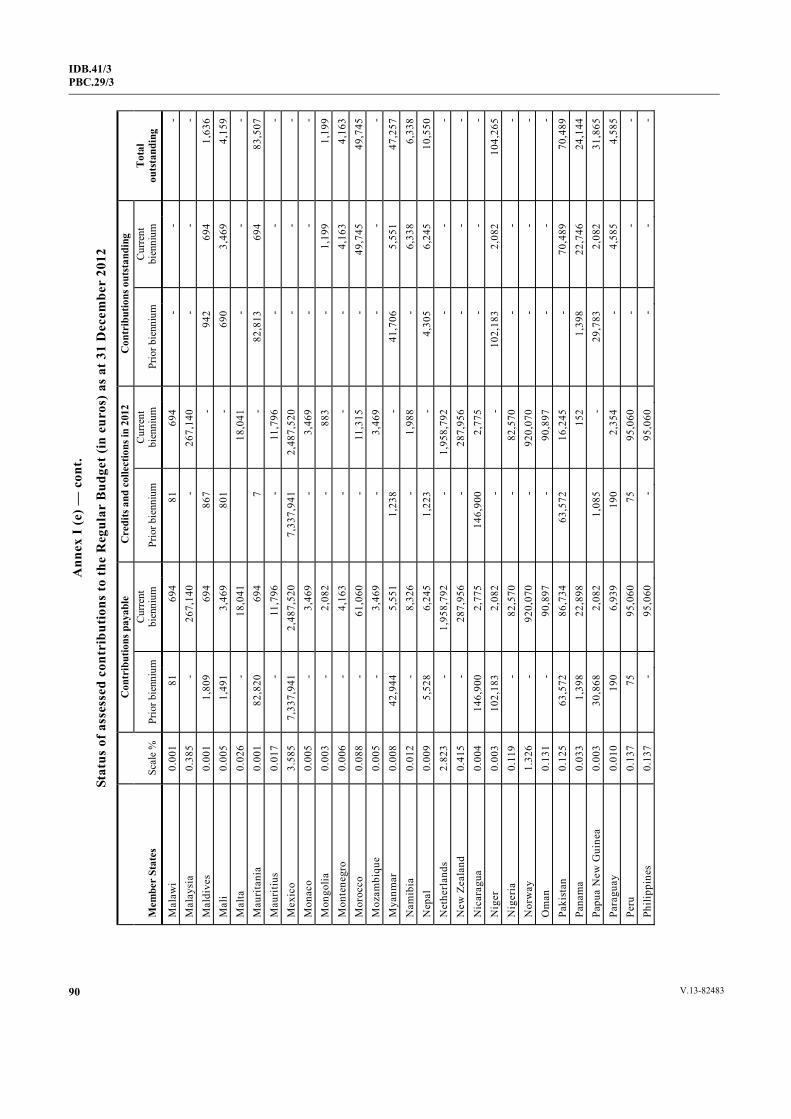
IDB.41/3 PBC.29/3
90 V.13-82483
Ann
ex I
(e) —
con
t.
Stat
us o
f ass
esse
d co
ntri
butio
ns to
the
Reg
ular
Bud
get (
in e
uros
) as
at 3
1 D
ecem
ber
2012
Mem
ber
Stat
es
Scal
e %
Con
trib
utio
ns p
ayab
le
Cre
dits
and
col
lect
ions
in 2
012
Con
trib
utio
ns o
utst
andi
ng
Tot
al
outs
tand
ing
Prio
r bie
nniu
m
Cur
rent
bi
enni
um
Prio
r bie
nniu
m
Cur
rent
bi
enni
um
Prio
r bie
nniu
m
Cur
rent
bi
enni
um
Mal
awi
0.00
1 81
694
81
694
-
-
-
Mal
aysi
a 0.
385
-
267,
140
-
26
7,14
0
-
-
- M
aldi
ves
0.00
1 1,
809
69
4
867
-
94
2
694
1,
636
Mal
i 0.
005
1,49
1
3,46
9
801
-
69
0
3,46
9
4,15
9 M
alta
0.
026
-
18,0
41
18
,041
-
-
- M
auri
tani
a 0.
001
82,8
20
69
4
7
-
82,8
13
69
4
83,5
07
Mau
ritiu
s 0.
017
-
11,7
96
-
11
,796
-
-
- M
exic
o 3.
585
7,33
7,94
1
2,48
7,52
0
7,33
7,94
1
2,48
7,52
0
-
-
- M
onac
o 0.
005
-
3,46
9
-
3,46
9
-
-
- M
ongo
lia
0.00
3 -
2,
082
-
88
3
-
1,19
9
1,19
9 M
onte
negr
o 0.
006
-
4,16
3
-
-
-
4,16
3
4,16
3 M
oroc
co
0.08
8 -
61
,060
-
11,3
15
-
49
,745
49,7
45
Moz
ambi
que
0.00
5 -
3,
469
-
3,
469
-
-
-
Mya
nmar
0.
008
42,9
44
5,
551
1,
238
-
41
,706
5,55
1
47,2
57
Nam
ibia
0.
012
-
8,32
6
-
1,98
8
-
6,33
8
6,33
8 N
epal
0.
009
5,52
8
6,24
5
1,22
3
-
4,30
5
6,24
5
10,5
50
Net
herl
ands
2.
823
-
1,95
8,79
2
-
1,95
8,79
2
-
-
- N
ew Z
eala
nd
0.41
5 -
28
7,95
6
-
287,
956
-
-
-
Nic
arag
ua
0.00
4 14
6,90
0
2,77
5
146,
900
2,
775
-
-
-
Nig
er
0.00
3 10
2,18
3
2,08
2
-
-
102,
183
2,
082
10
4,26
5 N
iger
ia
0.11
9 -
82
,570
-
82,5
70
-
-
-
Nor
way
1.
326
-
920,
070
-
92
0,07
0
-
-
- O
man
0.
131
-
90,8
97
-
90
,897
-
-
- Pa
kist
an
0.12
5 63
,572
86,7
34
63
,572
16,2
45
-
70
,489
70,4
89
Pana
ma
0.03
3 1,
398
22
,898
152
1,
398
22
,746
24,1
44
Papu
a N
ew G
uine
a 0.
003
30,8
68
2,
082
1,
085
-
29
,783
2,08
2
31,8
65
Para
guay
0.
010
190
6,
939
19
0
2,35
4
-
4,58
5
4,58
5 Pe
ru
0.13
7 75
95,0
60
75
95,0
60
-
-
-
Phili
ppin
es
0.13
7 -
95
,060
-
95,0
60
-
-
-
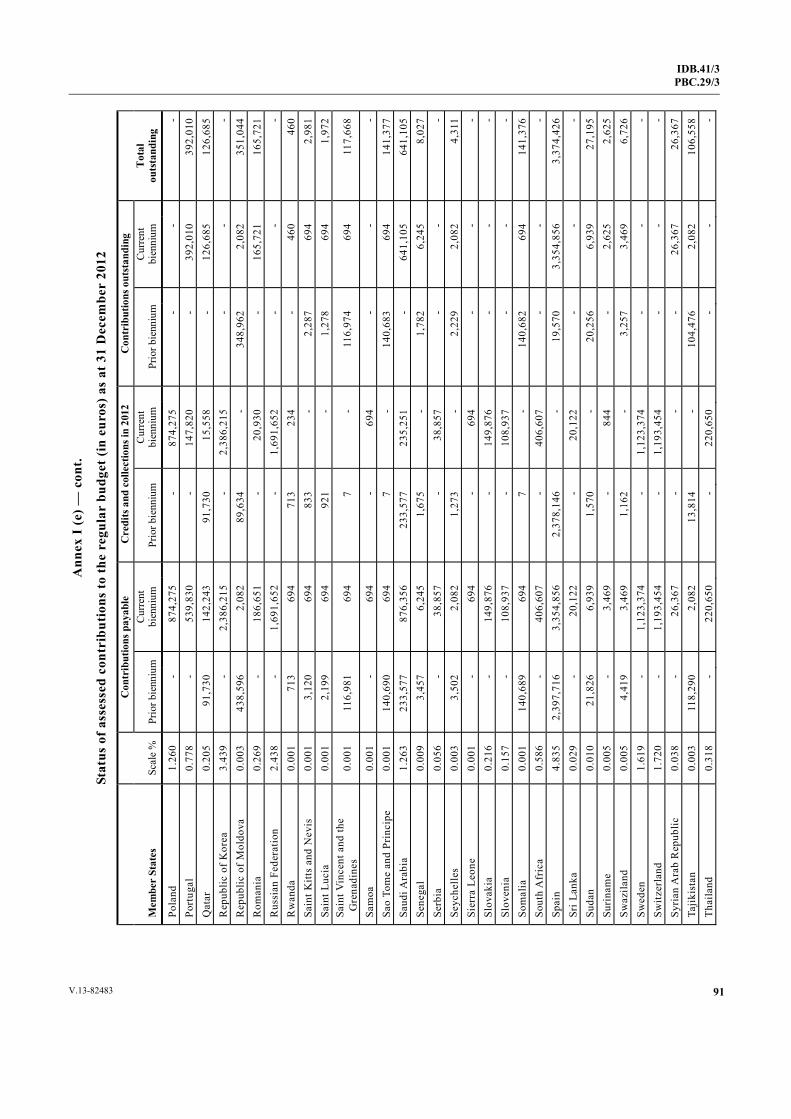
IDB.41/3PBC.29/3
91V.13-82483
Ann
ex I
(e) —
con
t.
Stat
us o
f ass
esse
d co
ntri
buti
ons
to th
e re
gula
r bu
dget
(in
euro
s) a
s at
31
Dec
embe
r 20
12
Mem
ber
Stat
es
Scal
e %
Con
trib
utio
ns p
ayab
le
Cre
dits
and
col
lect
ions
in 2
012
Con
trib
utio
ns o
utst
andi
ng
Tot
al
outs
tand
ing
Prio
r bie
nniu
m
Cur
rent
bi
enni
um
Prio
r bie
nniu
m
Cur
rent
bi
enni
um
Prio
r bie
nniu
m
Cur
rent
bi
enni
um
Pola
nd
1.26
0 -
87
4,27
5
-
874,
275
-
-
-
Port
ugal
0.
778
-
539,
830
-
14
7,82
0
-
392,
010
39
2,01
0 Q
atar
0.
205
91,7
30
14
2,24
3
91,7
30
15
,558
-
126,
685
12
6,68
5 R
epub
lic o
f Kor
ea
3.43
9 -
2,
386,
215
-
2,
386,
215
-
-
-
Rep
ublic
of M
oldo
va
0.00
3 43
8,59
6
2,08
2
89,6
34
-
34
8,96
2
2,08
2
351,
044
Rom
ania
0.
269
-
186,
651
-
20
,930
-
165,
721
16
5,72
1 R
ussi
an F
eder
atio
n 2.
438
-
1,69
1,65
2
-
1,69
1,65
2
-
-
- R
wan
da
0.00
1 71
3
694
71
3
234
-
46
0
460
Sain
t Kitt
s an
d N
evis
0.
001
3,12
0
694
83
3
-
2,28
7
694
2,
981
Sain
t Luc
ia
0.00
1 2,
199
69
4
921
-
1,
278
69
4
1,97
2 Sa
int V
ince
nt a
nd th
e G
rena
dine
s 0.
001
116,
981
69
4
7
-
116,
974
69
4
117,
668
Sam
oa
0.00
1 -
69
4
-
694
-
-
-
Sao
Tom
e an
d Pr
inci
pe
0.00
1 14
0,69
0
694
7
-
14
0,68
3
694
14
1,37
7 Sa
udi A
rabi
a 1.
263
233,
577
87
6,35
6
233,
577
23
5,25
1
-
641,
105
64
1,10
5 Se
nega
l 0.
009
3,45
7
6,24
5
1,67
5
-
1,78
2
6,24
5
8,02
7 Se
rbia
0.
056
-
38,8
57
-
38
,857
-
-
- Se
yche
lles
0.00
3 3,
502
2,
082
1,
273
-
2,
229
2,
082
4,
311
Sier
ra L
eone
0.
001
-
694
-
69
4
-
-
- Sl
ovak
ia
0.21
6 -
14
9,87
6
-
149,
876
-
-
-
Slov
enia
0.
157
-
108,
937
-
10
8,93
7
-
-
- So
mal
ia
0.00
1 14
0,68
9
694
7
-
14
0,68
2
694
14
1,37
6 So
uth
Afr
ica
0.58
6 -
40
6,60
7
-
406,
607
-
-
-
Spai
n 4.
835
2,39
7,71
6
3,35
4,85
6
2,37
8,14
6
-
19,5
70
3,
354,
856
3,
374,
426
Sri L
anka
0.
029
-
20,1
22
-
20
,122
-
-
- Su
dan
0.01
0 21
,826
6,93
9
1,57
0
-
20,2
56
6,
939
27
,195
Su
rina
me
0.00
5 -
3,
469
-
84
4
-
2,62
5
2,62
5 Sw
azila
nd
0.00
5 4,
419
3,
469
1,
162
-
3,
257
3,
469
6,
726
Swed
en
1.61
9 -
1,
123,
374
-
1,
123,
374
-
-
-
Switz
erla
nd
1.72
0 -
1,
193,
454
-
1,
193,
454
-
-
-
Syri
an A
rab
Rep
ublic
0.
038
-
26,3
67
-
-
-
26
,367
26,3
67
Tajik
ista
n 0.
003
118,
290
2,
082
13
,814
-
104,
476
2,
082
10
6,55
8 Th
aila
nd
0.31
8 -
22
0,65
0
-
220,
650
-
-
-
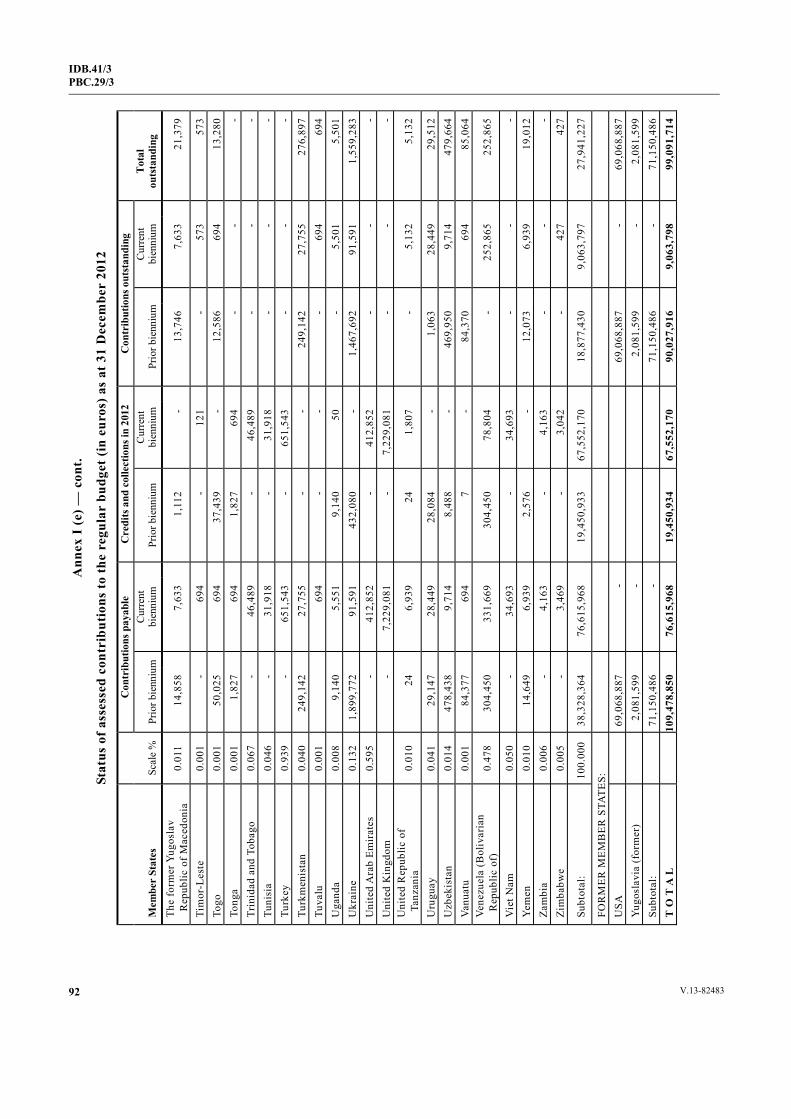
IDB.41/3 PBC.29/3
92 V.13-82483
Ann
ex I
(e) —
con
t.
Stat
us o
f ass
esse
d co
ntri
buti
ons
to th
e re
gula
r bu
dget
(in
euro
s) a
s at
31
Dec
embe
r 20
12
Mem
ber
Stat
es
Scal
e %
Con
trib
utio
ns p
ayab
le
Cre
dits
and
col
lect
ions
in 2
012
Con
trib
utio
ns o
utst
andi
ng
Tot
al
outs
tand
ing
Prio
r bie
nniu
m
Cur
rent
bi
enni
um
Prio
r bie
nniu
m
Cur
rent
bi
enni
um
Prio
r bie
nniu
m
Cur
rent
bi
enni
um
The
form
er Y
ugos
lav
Rep
ublic
of M
aced
onia
0.
011
14,8
58
7,
633
1,
112
-
13
,746
7,63
3
21,3
79
Tim
or-L
este
0.
001
-
694
-
12
1
-
573
57
3 To
go
0.00
1 50
,025
694
37
,439
-
12,5
86
69
4
13,2
80
Tong
a 0.
001
1,82
7
694
1,
827
69
4
-
-
- Tr
inid
ad a
nd T
obag
o 0.
067
-
46,4
89
-
46
,489
-
-
- Tu
nisi
a 0.
046
-
31,9
18
-
31
,918
-
-
- Tu
rkey
0.
939
-
651,
543
-
65
1,54
3
-
-
- Tu
rkm
enis
tan
0.04
0 24
9,14
2
27,7
55
-
-
24
9,14
2
27,7
55
27
6,89
7 Tu
valu
0.
001
694
-
-
-
69
4
694
Uga
nda
0.00
8 9,
140
5,
551
9,
140
50
-
5,50
1
5,50
1 U
krai
ne
0.13
2 1,
899,
772
91
,591
432,
080
-
1,
467,
692
91
,591
1,55
9,28
3 U
nite
d A
rab
Emir
ates
0.
595
-
412,
852
-
41
2,85
2
-
-
- U
nite
d K
ingd
om
-
7,
229,
081
-
7,
229,
081
-
-
-
Uni
ted
Rep
ublic
of
Tan
zani
a 0.
010
24
6,
939
24
1,80
7
-
5,13
2
5,13
2
Uru
guay
0.
041
29,1
47
28
,449
28,0
84
-
1,
063
28
,449
29,5
12
Uzb
ekis
tan
0.01
4 47
8,43
8
9,71
4
8,48
8
-
469,
950
9,
714
47
9,66
4 Va
nuat
u 0.
001
84,3
77
69
4
7
-
84,3
70
69
4
85,0
64
Vene
zuel
a (B
oliv
aria
n R
epub
lic o
f)
0.47
8 30
4,45
0
331,
669
30
4,45
0
78,8
04
-
25
2,86
5
252,
865
Vie
t Nam
0.
050
-
34,6
93
-
34
,693
-
-
- Ye
men
0.
010
14,6
49
6,
939
2,
576
-
12
,073
6,93
9
19,0
12
Zam
bia
0.00
6 -
4,
163
-
4,
163
-
-
-
Zim
babw
e 0.
005
-
3,46
9
-
3,04
2
-
427
42
7
Subt
otal
: 10
0.00
0 38
,328
,364
76,6
15,9
68
19
,450
,933
67,5
52,1
70
18
,877
,430
9,06
3,79
7
27,9
41,2
27
FOR
MER
MEM
BER
STA
TES:
U
SA
69
,068
,887
-
69,0
68,8
87
- 69
,068
,887
Yu
gosl
avia
(for
mer
)
2,08
1,59
9
-
2,08
1,59
9 -
2,08
1,59
9
Subt
otal
:
71,1
50,4
86
-
71
,150
,486
-
71,1
50,4
86
T O
T A
L
10
9,47
8,85
0
76,6
15,9
68
19
,450
,934
67,5
52,1
70
90
,027
,916
9,06
3,79
8
99,0
91,7
14
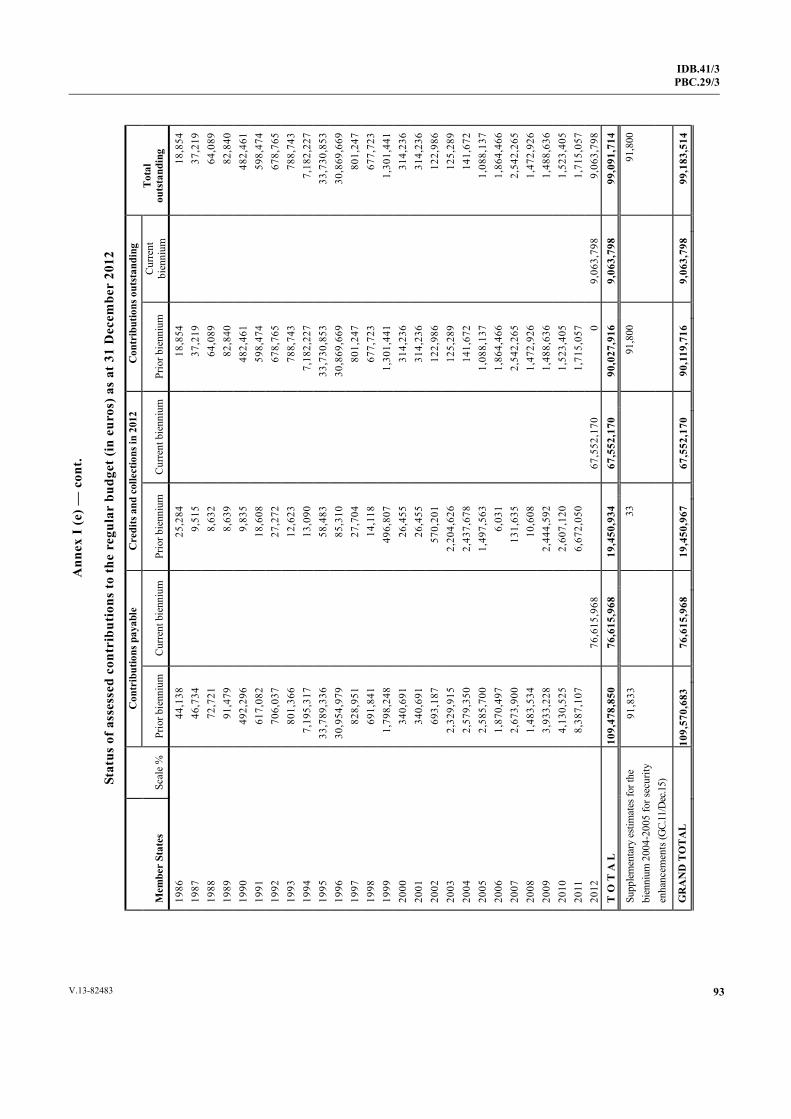
IDB.41/3PBC.29/3
93V.13-82483
Ann
ex I
(e) —
con
t.
Stat
us o
f ass
esse
d co
ntri
buti
ons
to th
e re
gula
r bu
dget
(in
euro
s) a
s at
31
Dec
embe
r 20
12
Mem
ber
Stat
es
Scal
e %
Con
trib
utio
ns p
ayab
le
Cre
dits
and
col
lect
ions
in 2
012
Con
trib
utio
ns o
utst
andi
ng
Tot
al
outs
tand
ing
Prio
r bie
nniu
m
Cur
rent
bie
nniu
m
Prio
r bie
nniu
m
Cur
rent
bie
nniu
m
Prio
r bie
nniu
m
Cur
rent
bi
enni
um
1986
44,1
38
25,2
84
18
,854
18,8
54
1987
46,7
34
9,51
5
37,2
19
37
,219
19
88
72
,721
8,
632
64
,089
64,0
89
1989
91,4
79
8,63
9
82,8
40
82
,840
19
90
49
2,29
6
9,83
5
482,
461
48
2,46
1 19
91
61
7,08
2
18,6
08
59
8,47
4
598,
474
1992
706,
037
27
,272
678,
765
67
8,76
5 19
93
80
1,36
6
12,6
23
78
8,74
3
788,
743
1994
7,19
5,31
7
13,0
90
7,
182,
227
7,
182,
227
1995
33,7
89,3
36
58,4
83
33
,730
,853
33,7
30,8
53
1996
30,9
54,9
79
85,3
10
30
,869
,669
30,8
69,6
69
1997
828,
951
27
,704
801,
247
80
1,24
7 19
98
69
1,84
1
14,1
18
67
7,72
3
677,
723
1999
1,79
8,24
8
496,
807
1,
301,
441
1,
301,
441
2000
340,
691
26
,455
314,
236
31
4,23
6 20
01
34
0,69
1
26,4
55
31
4,23
6
314,
236
2002
693,
187
57
0,20
1
122,
986
12
2,98
6 20
03
2,
329,
915
2,
204,
626
12
5,28
9
125,
289
2004
2,57
9,35
0
2,43
7,67
8
141,
672
14
1,67
2 20
05
2,
585,
700
1,
497,
563
1,
088,
137
1,
088,
137
2006
1,87
0,49
7
6,03
1
1,86
4,46
6
1,86
4,46
6 20
07
2,
673,
900
13
1,63
5
2,54
2,26
5
2,54
2,26
5 20
08
1,
483,
534
10
,608
1,47
2,92
6
1,47
2,92
6 20
09
3,
933,
228
2,
444,
592
1,
488,
636
1,
488,
636
2010
4,13
0,52
5
2,60
7,12
0
1,52
3,40
5
1,52
3,40
5 20
11
8,
387,
107
6,
672,
050
1,
715,
057
1,
715,
057
2012
76,6
15,9
68
67
,552
,170
0
9,06
3,79
8 9,
063,
798
T O
T A
L
10
9,47
8,85
076
,615
,968
19
,450
,934
67
,552
,170
90
,027
,916
9,
063,
798
99,0
91,7
14
Supp
lem
enta
ry e
stim
ates
for t
he
bien
nium
200
4-20
05 fo
r sec
urity
en
hanc
emen
ts (G
C.11
/Dec
.15)
91,8
33
33
91,8
00
91
,800
GR
AN
D T
OT
AL
10
9,57
0,68
3
76,6
15,9
68
19
,450
,967
67,5
52,1
70
90
,119
,716
9,06
3,79
8
99,1
83,5
14
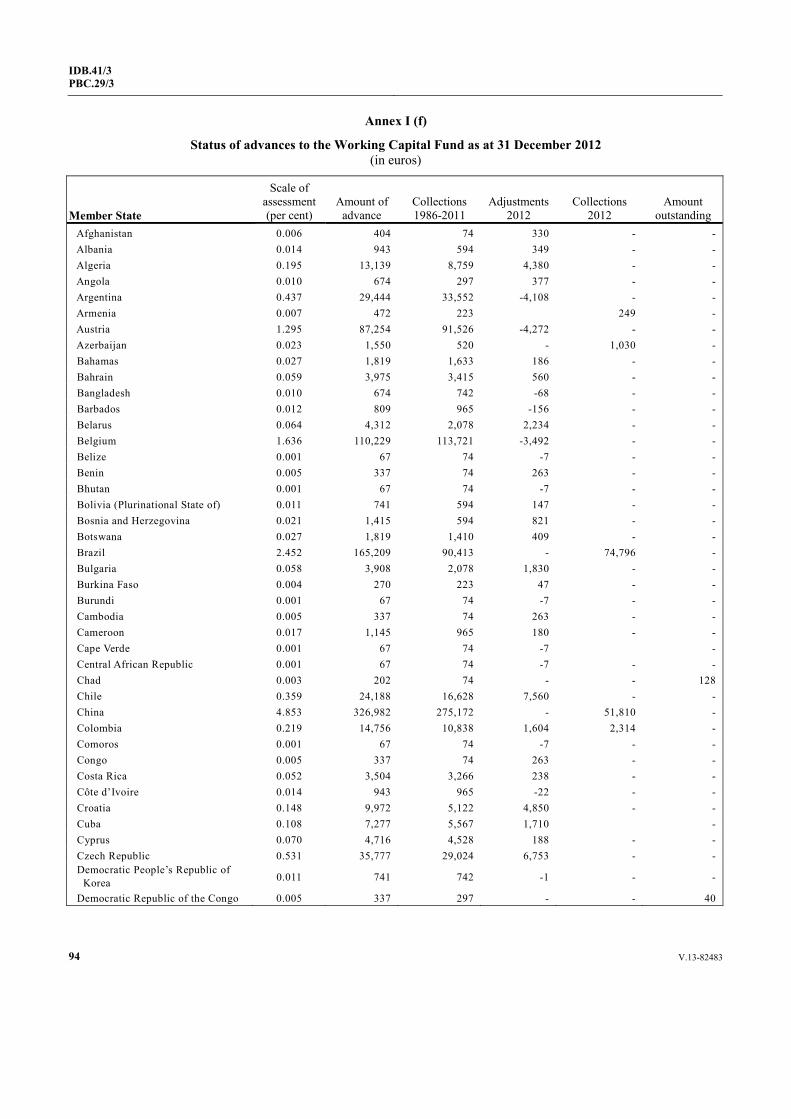
94 V.13-82483
IDB.41/3 PBC.29/3
Annex I (f)
Status of advances to the Working Capital Fund as at 31 December 2012 (in euros)
Member State
Scale of assessment (per cent)
Amount ofadvance
Collections 1986-2011
Adjustments2012
Collections 2012
Amount outstanding
Afghanistan 0.006 404 74 330 - - Albania 0.014 943 594 349 - - Algeria 0.195 13,139 8,759 4,380 - - Angola 0.010 674 297 377 - - Argentina 0.437 29,444 33,552 -4,108 - - Armenia 0.007 472 223 249 - Austria 1.295 87,254 91,526 -4,272 - - Azerbaijan 0.023 1,550 520 - 1,030 - Bahamas 0.027 1,819 1,633 186 - - Bahrain 0.059 3,975 3,415 560 - - Bangladesh 0.010 674 742 -68 - - Barbados 0.012 809 965 -156 - - Belarus 0.064 4,312 2,078 2,234 - - Belgium 1.636 110,229 113,721 -3,492 - - Belize 0.001 67 74 -7 - - Benin 0.005 337 74 263 - - Bhutan 0.001 67 74 -7 - - Bolivia (Plurinational State of) 0.011 741 594 147 - - Bosnia and Herzegovina 0.021 1,415 594 821 - - Botswana 0.027 1,819 1,410 409 - - Brazil 2.452 165,209 90,413 - 74,796 - Bulgaria 0.058 3,908 2,078 1,830 - - Burkina Faso 0.004 270 223 47 - - Burundi 0.001 67 74 -7 - - Cambodia 0.005 337 74 263 - - Cameroon 0.017 1,145 965 180 - - Cape Verde 0.001 67 74 -7 - Central African Republic 0.001 67 74 -7 - - Chad 0.003 202 74 - - 128 Chile 0.359 24,188 16,628 7,560 - - China 4.853 326,982 275,172 - 51,810 - Colombia 0.219 14,756 10,838 1,604 2,314 - Comoros 0.001 67 74 -7 - - Congo 0.005 337 74 263 - - Costa Rica 0.052 3,504 3,266 238 - - Côte d’Ivoire 0.014 943 965 -22 - - Croatia 0.148 9,972 5,122 4,850 - - Cuba 0.108 7,277 5,567 1,710 - Cyprus 0.070 4,716 4,528 188 - - Czech Republic 0.531 35,777 29,024 6,753 - - Democratic People’s Republic of Korea 0.011 741 742 -1 - -
Democratic Republic of the Congo 0.005 337 297 - - 40
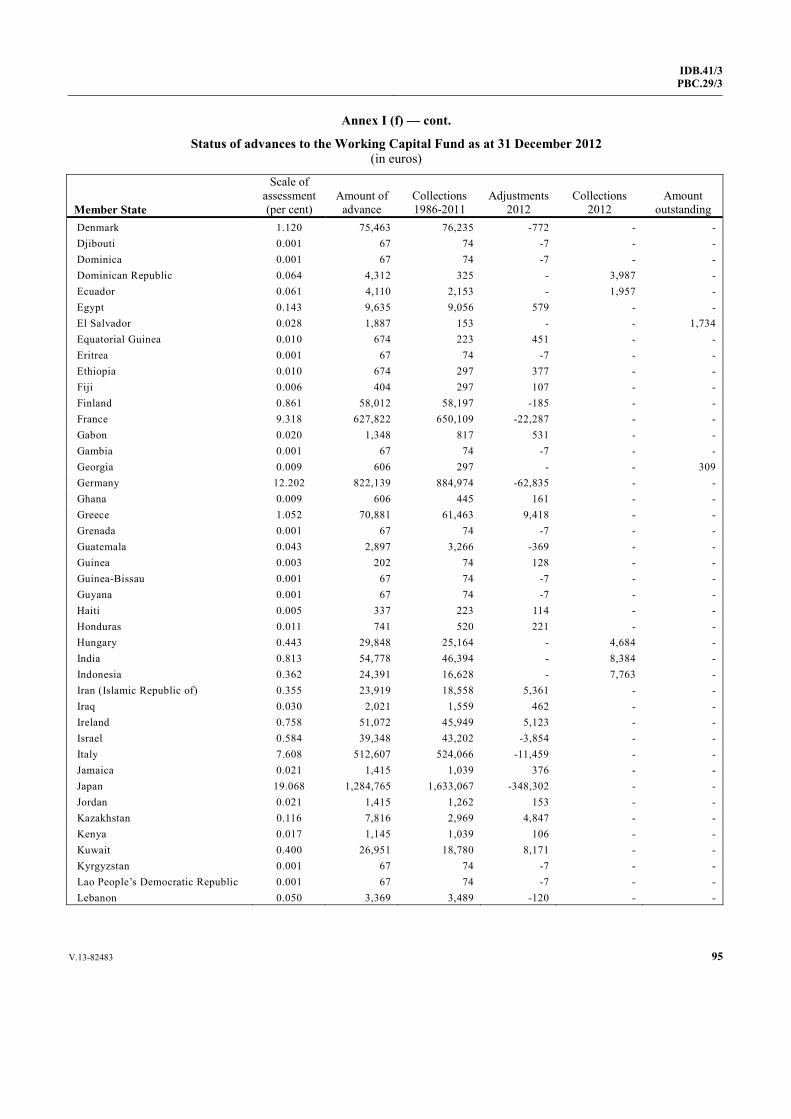
V.13-82483 95
IDB.41/3PBC.29/3
Annex I (f) — cont.
Status of advances to the Working Capital Fund as at 31 December 2012 (in euros)
Member State
Scale of assessment (per cent)
Amount ofadvance
Collections 1986-2011
Adjustments2012
Collections 2012
Amount outstanding
Denmark 1.120 75,463 76,235 -772 - - Djibouti 0.001 67 74 -7 - - Dominica 0.001 67 74 -7 - - Dominican Republic 0.064 4,312 325 - 3,987 - Ecuador 0.061 4,110 2,153 - 1,957 - Egypt 0.143 9,635 9,056 579 - - El Salvador 0.028 1,887 153 - - 1,734 Equatorial Guinea 0.010 674 223 451 - - Eritrea 0.001 67 74 -7 - - Ethiopia 0.010 674 297 377 - - Fiji 0.006 404 297 107 - - Finland 0.861 58,012 58,197 -185 - - France 9.318 627,822 650,109 -22,287 - - Gabon 0.020 1,348 817 531 - - Gambia 0.001 67 74 -7 - - Georgia 0.009 606 297 - - 309 Germany 12.202 822,139 884,974 -62,835 - - Ghana 0.009 606 445 161 - - Greece 1.052 70,881 61,463 9,418 - - Grenada 0.001 67 74 -7 - - Guatemala 0.043 2,897 3,266 -369 - - Guinea 0.003 202 74 128 - - Guinea-Bissau 0.001 67 74 -7 - - Guyana 0.001 67 74 -7 - - Haiti 0.005 337 223 114 - - Honduras 0.011 741 520 221 - - Hungary 0.443 29,848 25,164 - 4,684 - India 0.813 54,778 46,394 - 8,384 - Indonesia 0.362 24,391 16,628 - 7,763 - Iran (Islamic Republic of) 0.355 23,919 18,558 5,361 - - Iraq 0.030 2,021 1,559 462 - - Ireland 0.758 51,072 45,949 5,123 - - Israel 0.584 39,348 43,202 -3,854 - - Italy 7.608 512,607 524,066 -11,459 - - Jamaica 0.021 1,415 1,039 376 - - Japan 19.068 1,284,765 1,633,067 -348,302 - - Jordan 0.021 1,415 1,262 153 - - Kazakhstan 0.116 7,816 2,969 4,847 - - Kenya 0.017 1,145 1,039 106 - - Kuwait 0.400 26,951 18,780 8,171 - - Kyrgyzstan 0.001 67 74 -7 - - Lao People’s Democratic Republic 0.001 67 74 -7 - - Lebanon 0.050 3,369 3,489 -120 - -
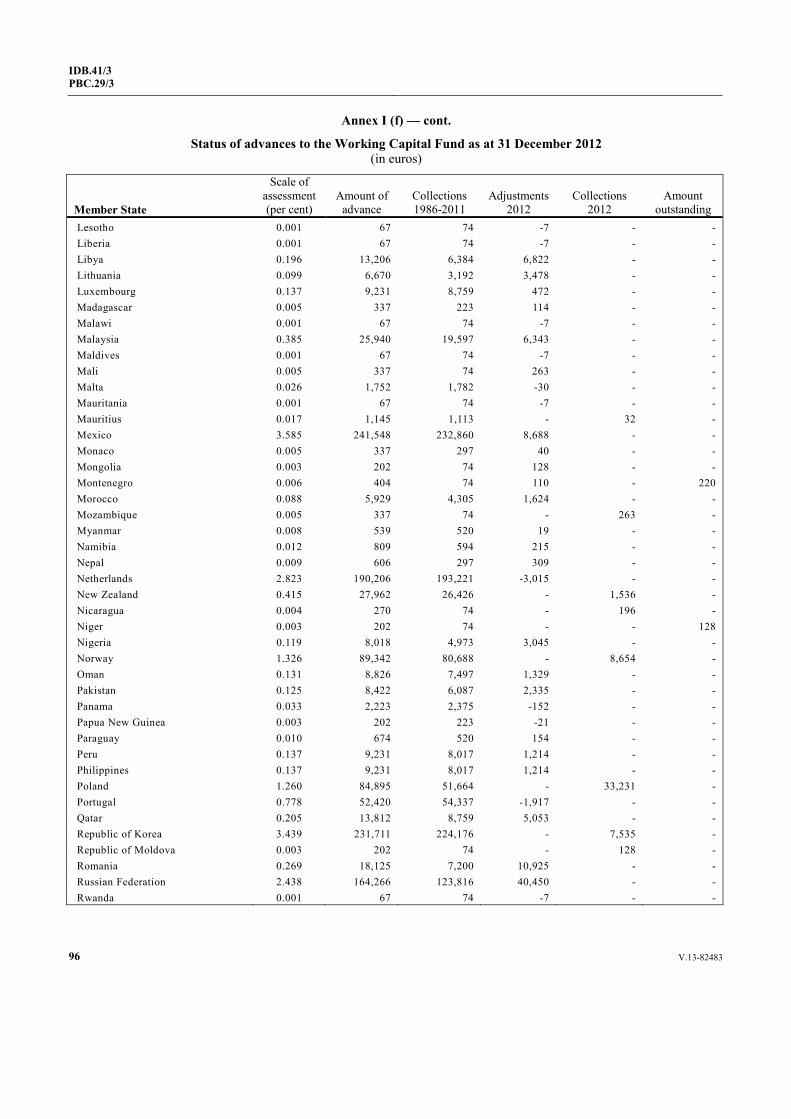
96 V.13-82483
IDB.41/3 PBC.29/3
Annex I (f) — cont.
Status of advances to the Working Capital Fund as at 31 December 2012 (in euros)
Member State
Scale of assessment (per cent)
Amount ofadvance
Collections 1986-2011
Adjustments2012
Collections 2012
Amount outstanding
Lesotho 0.001 67 74 -7 - - Liberia 0.001 67 74 -7 - - Libya 0.196 13,206 6,384 6,822 - - Lithuania 0.099 6,670 3,192 3,478 - - Luxembourg 0.137 9,231 8,759 472 - - Madagascar 0.005 337 223 114 - - Malawi 0.001 67 74 -7 - - Malaysia 0.385 25,940 19,597 6,343 - - Maldives 0.001 67 74 -7 - - Mali 0.005 337 74 263 - - Malta 0.026 1,752 1,782 -30 - - Mauritania 0.001 67 74 -7 - - Mauritius 0.017 1,145 1,113 - 32 - Mexico 3.585 241,548 232,860 8,688 - - Monaco 0.005 337 297 40 - - Mongolia 0.003 202 74 128 - - Montenegro 0.006 404 74 110 - 220 Morocco 0.088 5,929 4,305 1,624 - - Mozambique 0.005 337 74 - 263 - Myanmar 0.008 539 520 19 - - Namibia 0.012 809 594 215 - - Nepal 0.009 606 297 309 - - Netherlands 2.823 190,206 193,221 -3,015 - - New Zealand 0.415 27,962 26,426 - 1,536 - Nicaragua 0.004 270 74 - 196 - Niger 0.003 202 74 - - 128 Nigeria 0.119 8,018 4,973 3,045 - - Norway 1.326 89,342 80,688 - 8,654 - Oman 0.131 8,826 7,497 1,329 - - Pakistan 0.125 8,422 6,087 2,335 - - Panama 0.033 2,223 2,375 -152 - - Papua New Guinea 0.003 202 223 -21 - - Paraguay 0.010 674 520 154 - - Peru 0.137 9,231 8,017 1,214 - - Philippines 0.137 9,231 8,017 1,214 - - Poland 1.260 84,895 51,664 - 33,231 - Portugal 0.778 52,420 54,337 -1,917 - - Qatar 0.205 13,812 8,759 5,053 - - Republic of Korea 3.439 231,711 224,176 - 7,535 - Republic of Moldova 0.003 202 74 - 128 - Romania 0.269 18,125 7,200 10,925 - - Russian Federation 2.438 164,266 123,816 40,450 - - Rwanda 0.001 67 74 -7 - -
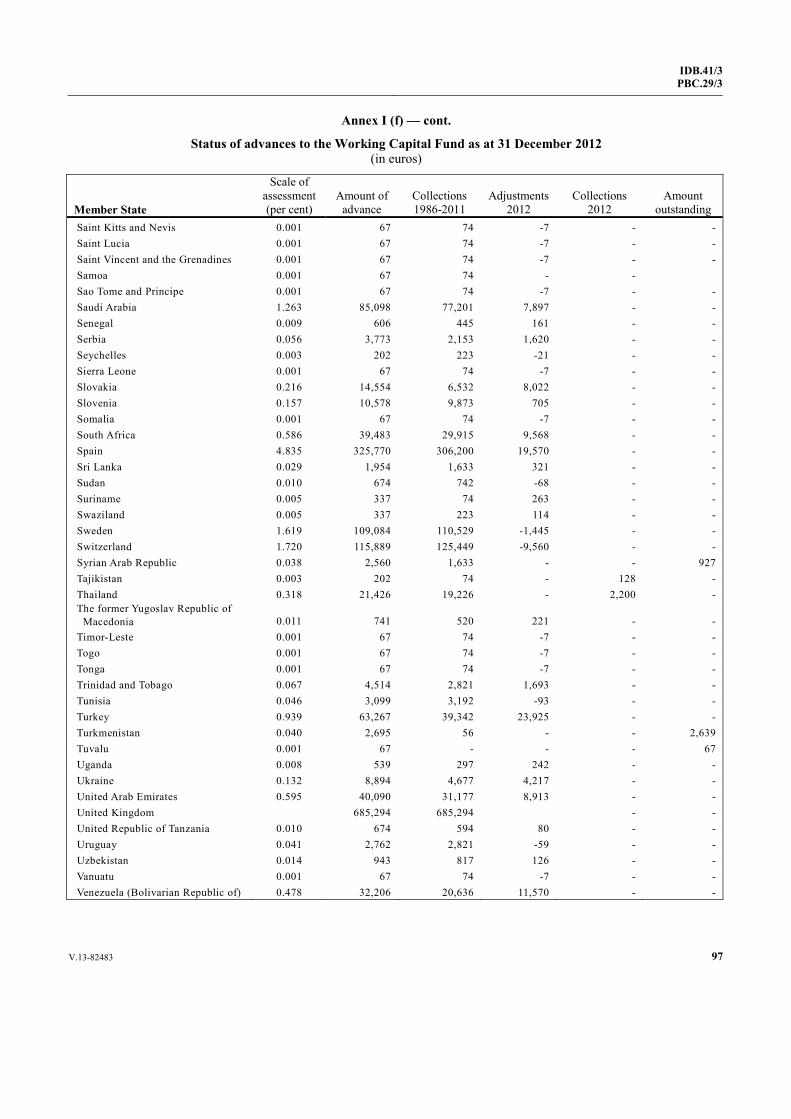
V.13-82483 97
IDB.41/3PBC.29/3
Annex I (f) — cont.
Status of advances to the Working Capital Fund as at 31 December 2012 (in euros)
Member State
Scale of assessment (per cent)
Amount ofadvance
Collections 1986-2011
Adjustments2012
Collections 2012
Amount outstanding
Saint Kitts and Nevis 0.001 67 74 -7 - - Saint Lucia 0.001 67 74 -7 - - Saint Vincent and the Grenadines 0.001 67 74 -7 - - Samoa 0.001 67 74 - - Sao Tome and Principe 0.001 67 74 -7 - - Saudi Arabia 1.263 85,098 77,201 7,897 - - Senegal 0.009 606 445 161 - - Serbia 0.056 3,773 2,153 1,620 - - Seychelles 0.003 202 223 -21 - - Sierra Leone 0.001 67 74 -7 - - Slovakia 0.216 14,554 6,532 8,022 - - Slovenia 0.157 10,578 9,873 705 - - Somalia 0.001 67 74 -7 - - South Africa 0.586 39,483 29,915 9,568 - - Spain 4.835 325,770 306,200 19,570 - - Sri Lanka 0.029 1,954 1,633 321 - - Sudan 0.010 674 742 -68 - - Suriname 0.005 337 74 263 - - Swaziland 0.005 337 223 114 - - Sweden 1.619 109,084 110,529 -1,445 - - Switzerland 1.720 115,889 125,449 -9,560 - - Syrian Arab Republic 0.038 2,560 1,633 - - 927 Tajikistan 0.003 202 74 - 128 - Thailand 0.318 21,426 19,226 - 2,200 - The former Yugoslav Republic of Macedonia 0.011 741 520 221 - - Timor-Leste 0.001 67 74 -7 - - Togo 0.001 67 74 -7 - - Tonga 0.001 67 74 -7 - - Trinidad and Tobago 0.067 4,514 2,821 1,693 - - Tunisia 0.046 3,099 3,192 -93 - - Turkey 0.939 63,267 39,342 23,925 - - Turkmenistan 0.040 2,695 56 - - 2,639 Tuvalu 0.001 67 - - - 67 Uganda 0.008 539 297 242 - - Ukraine 0.132 8,894 4,677 4,217 - - United Arab Emirates 0.595 40,090 31,177 8,913 - - United Kingdom 685,294 685,294 - - United Republic of Tanzania 0.010 674 594 80 - - Uruguay 0.041 2,762 2,821 -59 - - Uzbekistan 0.014 943 817 126 - - Vanuatu 0.001 67 74 -7 - - Venezuela (Bolivarian Republic of) 0.478 32,206 20,636 11,570 - -
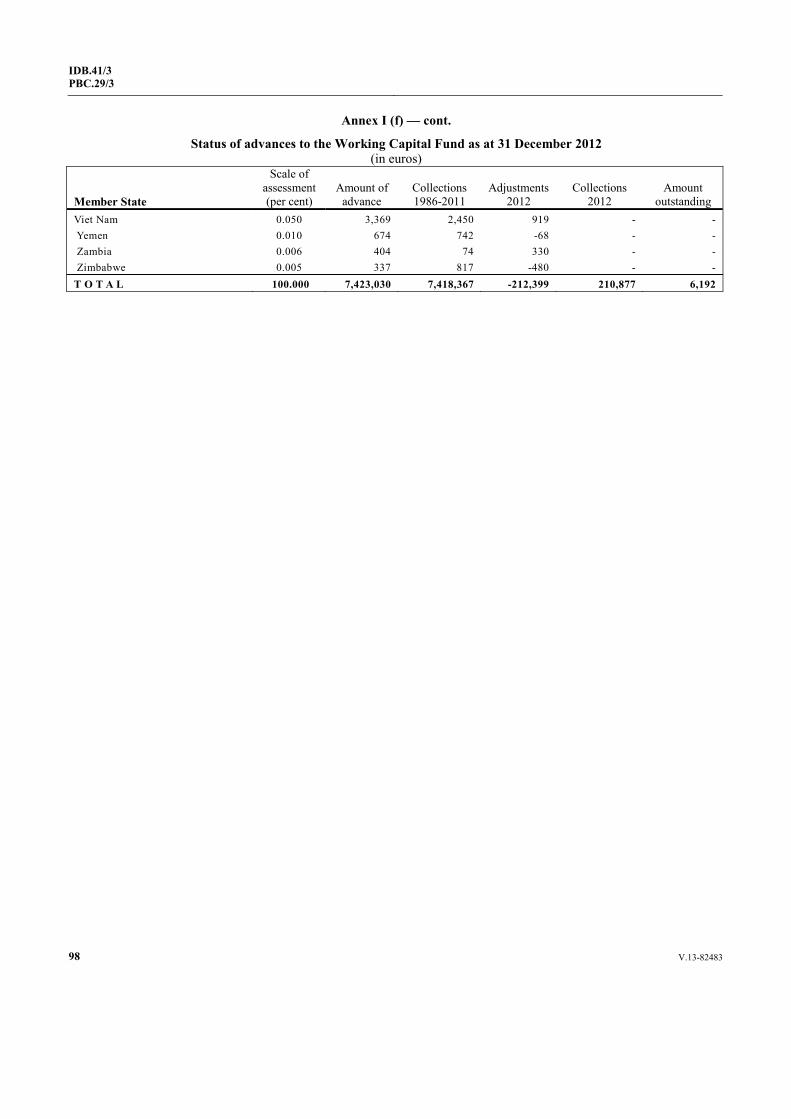
98 V.13-82483
IDB.41/3 PBC.29/3
Annex I (f) — cont.
Status of advances to the Working Capital Fund as at 31 December 2012 (in euros)
Member State
Scale of assessment (per cent)
Amount ofadvance
Collections 1986-2011
Adjustments2012
Collections 2012
Amount outstanding
Viet Nam 0.050 3,369 2,450 919 - - Yemen 0.010 674 742 -68 - - Zambia 0.006 404 74 330 - - Zimbabwe 0.005 337 817 -480 - - T O T A L 100.000 7,423,030 7,418,367 -212,399 210,877 6,192

IDB.41/3PBC.29/3
99V.13-82483
Ann
ex I
I (a
)
Sum
mar
y of
tran
sact
ions
on
sub-
acco
unts
of t
he I
ndus
tria
l Dev
elop
men
t Fun
d
for
the
year
as
at 3
1 D
ecem
ber
2012
— e
uro-
base
d (i
n eu
ros)
Fu
nd b
alan
ce a
t 01
/01/
2012
C
ash
rece
ived
in
201
2 E
xpen
ditu
res
2012
M
isce
llane
ous i
ncom
e in
clud
ing
gene
ral p
ool
inte
rest
Fund
bal
ance
as a
t 31
/12/
2012
Gen
eral
-pur
pose
con
vert
ible
1,
973,
600
0 0
0 1,
973,
600
Age
nce
Wal
lonn
e à
l’Ex
port
atio
n 10
5,58
1 0
-5
0 10
5,58
6 A
ustr
ia C
lean
er P
rodu
ctio
n 1,
144,
326
314,
847
524,
359
0 93
4,81
4 A
ustr
ia
4,64
1,42
3 80
0,00
0 1,
137,
088
0 4,
304,
335
Aus
tria
n D
evel
opm
ent A
genc
y 85
4,29
2 33
3,07
6 60
7,21
3 0
580,
155
Aus
tria
n M
inis
try
of A
gric
ultu
re, F
ores
try,
En
viro
nmen
t and
Wat
er M
anag
emen
t 52
,242
22
,600
-1
,890
0
76,7
33
Cze
ch R
epub
lic
2,37
9 46
,963
15
5 0
49,1
87
Finl
and
1,31
9,28
5 13
,654
65
5,33
1 0
677,
609
Fran
ce
737,
363
1,00
3,34
1 50
6,88
1 0
1,23
3,82
4 Fr
ance
, Min
istr
y of
Agr
icul
ture
15
8,83
8 6,
015
71,6
83
0 93
,170
G
erm
any
0 2,
337,
586
0 0
2,33
7,58
6 G
reec
e 1,
886
0 0
0 1,
886
Hun
gary
18
,844
62
,032
-1
1 0
80,8
87
Ital
y 2,
859,
560
1,82
5,36
0 1,
181,
761
336
3,50
3,49
5 Lu
xem
bour
g 12
7,51
3 1,
160
89,6
35
0 39
,037
N
amib
ia
348
0 0
0 34
8 Po
land
3,
185
243,
745
0 0
246,
930
Port
ugal
92
,051
84
3 0
0 92
,894
Sl
oven
ia
480,
428
278,
069
216,
886
0 54
1,61
0 Sp
ain
1,34
3,43
0 60
,000
49
7,38
7 0
906,
043
Switz
erla
nd
4,26
5,47
1 3,
474,
257
1,29
0,98
0 0
6,44
8,74
8 U
nenc
umbe
red
bala
nces
- In
tegr
ated
pr
ogra
mm
es a
nd c
ount
ry s
ervi
ce fr
amew
ork
activ
ities
37,0
38
1,39
3 -1
2,49
1 0
50,9
22
Une
ncum
bere
d ba
lanc
es -
Mill
enni
um
Dev
elop
men
t Goa
ls
15,2
50
172
-0
0 15
,423
Une
ncum
bere
d ba
lanc
es -
Post
-cri
sis
situ
atio
n 17
0,24
2 1,
560
0 0
171,
802
Und
efin
ed
634
-982
0
0 -3
48
Tota
l spe
cial
-pur
pose
con
vert
ible
18
,431
,609
10
,825
,692
6,
764,
962
336
22,4
92,6
75
GR
AN
D T
OTA
L
20,4
05,2
09
10,8
25,6
92
6,76
4,96
2 33
6 24
,466
,275
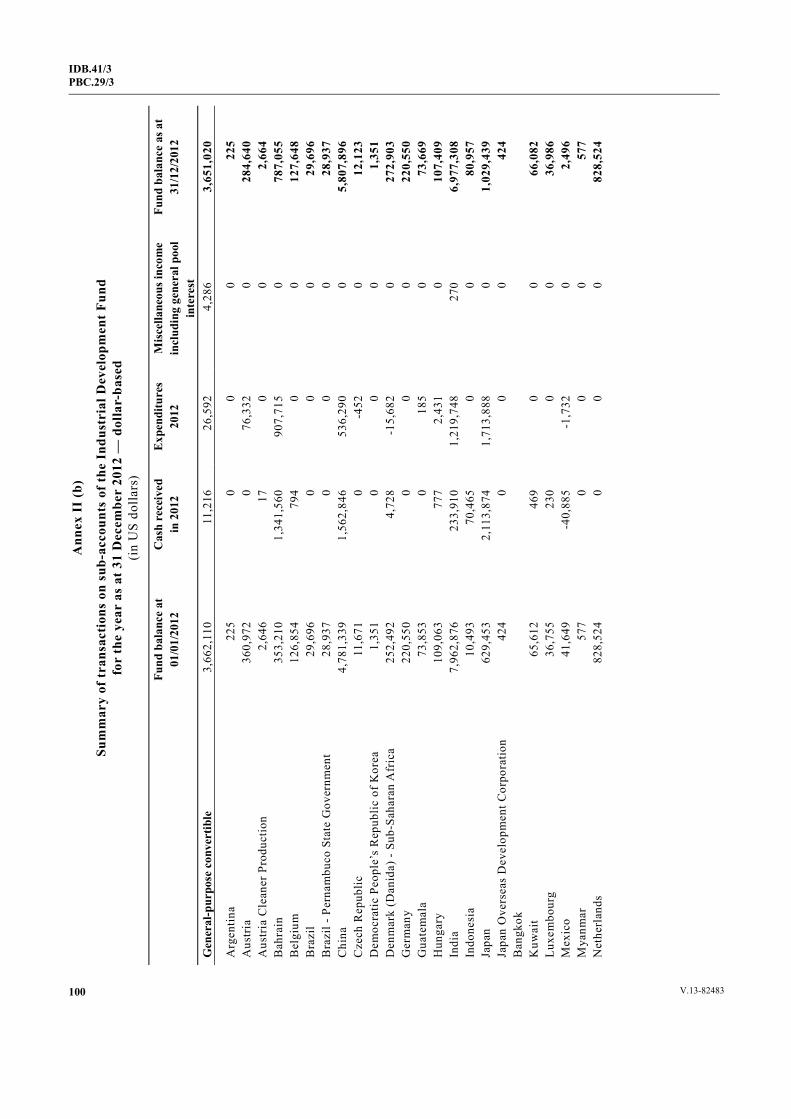
IDB.41/3 PBC.29/3
100 V.13-82483
Ann
ex I
I (b
)
Sum
mar
y of
tran
sact
ions
on
sub-
acco
unts
of t
he I
ndus
tria
l Dev
elop
men
t Fun
d
for
the
year
as
at 3
1 D
ecem
ber
2012
— d
olla
r-ba
sed
(in
US
dolla
rs)
Fu
nd b
alan
ce a
t 01
/01/
2012
C
ash
rece
ived
in
201
2 E
xpen
ditu
res
2012
M
isce
llane
ous i
ncom
e in
clud
ing
gene
ral p
ool
inte
rest
Fund
bal
ance
as a
t 31
/12/
2012
Gen
eral
-pur
pose
con
vert
ible
3,
662,
110
11,2
16
26,5
92
4,28
6 3,
651,
020
Arg
entin
a 22
5 0
0 0
225
Aus
tria
36
0,97
2 0
76,3
32
0 28
4,64
0 A
ustr
ia C
lean
er P
rodu
ctio
n 2,
646
17
0 0
2,66
4 B
ahra
in
353,
210
1,34
1,56
0 90
7,71
5 0
787,
055
Bel
gium
12
6,85
4 79
4 0
0 12
7,64
8 B
razi
l 29
,696
0
0 0
29,6
96
Bra
zil -
Per
nam
buco
Sta
te G
over
nmen
t 28
,937
0
0 0
28,9
37
Chi
na
4,78
1,33
9 1,
562,
846
536,
290
0 5,
807,
896
Cze
ch R
epub
lic
11,6
71
0 -4
52
0 12
,123
D
emoc
ratic
Peo
ple’
s R
epub
lic o
f Kor
ea
1,35
1 0
0 0
1,35
1 D
enm
ark
(Dan
ida)
- Su
b-Sa
hara
n A
fric
a 25
2,49
2 4,
728
-15,
682
0 27
2,90
3 G
erm
any
220,
550
0 0
0 22
0,55
0 G
uate
mal
a 73
,853
0
185
0 73
,669
H
unga
ry
109,
063
777
2,43
1 0
107,
409
Indi
a 7,
962,
876
233,
910
1,21
9,74
8 27
0 6,
977,
308
Indo
nesi
a 10
,493
70
,465
0
0 80
,957
Ja
pan
629,
453
2,11
3,87
4 1,
713,
888
0 1,
029,
439
Japa
n O
vers
eas
Dev
elop
men
t Cor
pora
tion
Ban
gkok
42
4 0
0 0
424
Kuw
ait
65,6
12
469
0 0
66,0
82
Luxe
mbo
urg
36,7
55
230
0 0
36,9
86
Mex
ico
41,6
49
-40,
885
-1,7
32
0 2,
496
Mya
nmar
57
7 0
0 0
577
Net
herl
ands
82
8,52
4 0
0 0
828,
524
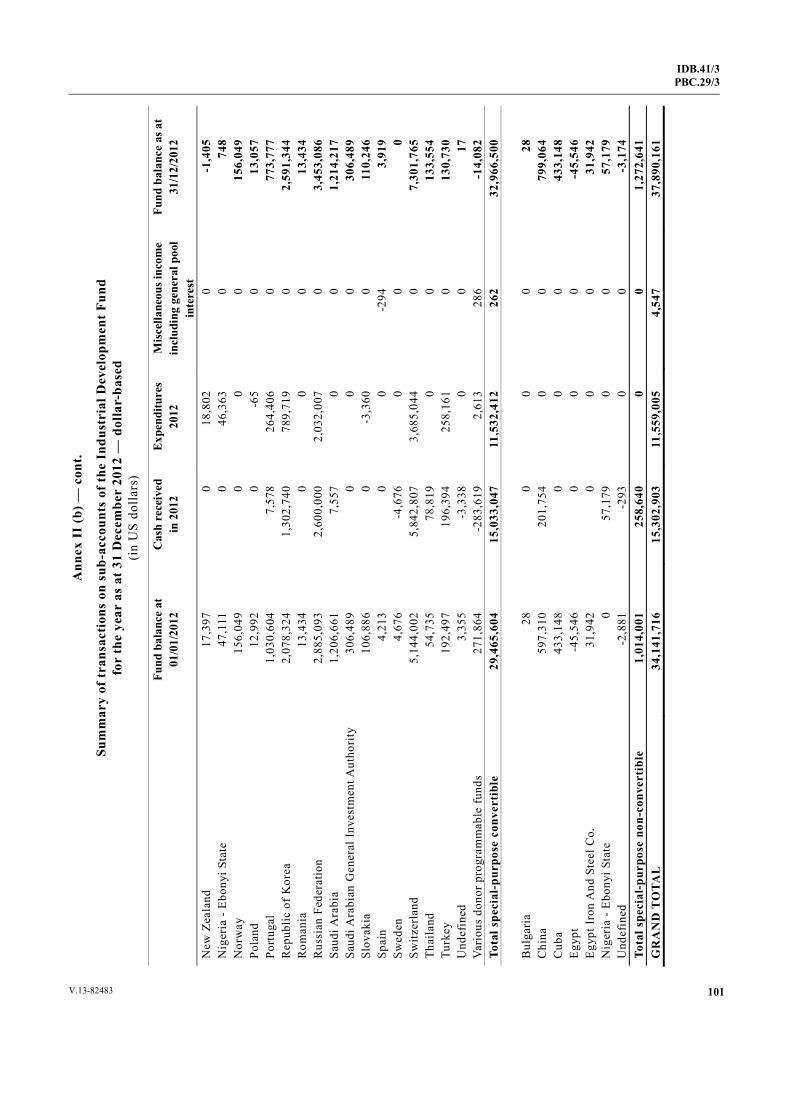
IDB.41/3PBC.29/3
101V.13-82483
Ann
ex I
I (b
) — c
ont.
Sum
mar
y of
tran
sact
ions
on
sub-
acco
unts
of t
he I
ndus
tria
l Dev
elop
men
t Fun
d
for
the
year
as
at 3
1 D
ecem
ber
2012
— d
olla
r-ba
sed
(in
US
dolla
rs)
Fu
nd b
alan
ce a
t 01
/01/
2012
C
ash
rece
ived
in
201
2 E
xpen
ditu
res
2012
M
isce
llane
ous i
ncom
e in
clud
ing
gene
ral p
ool
inte
rest
Fund
bal
ance
as a
t 31
/12/
2012
New
Zea
land
17
,397
0
18,8
02
0 -1
,405
N
iger
ia -
Ebon
yi S
tate
47
,111
0
46,3
63
0 74
8 N
orw
ay
156,
049
0 0
0 15
6,04
9 Po
land
12
,992
0
-65
0 13
,057
Po
rtug
al
1,03
0,60
4 7,
578
264,
406
0 77
3,77
7 R
epub
lic o
f Kor
ea
2,07
8,32
4 1,
302,
740
789,
719
0 2,
591,
344
Rom
ania
13
,434
0
0 0
13,4
34
Rus
sian
Fed
erat
ion
2,88
5,09
3 2,
600,
000
2,03
2,00
7 0
3,45
3,08
6 Sa
udi A
rabi
a 1,
206,
661
7,55
7 0
0 1,
214,
217
Saud
i Ara
bian
Gen
eral
Inve
stm
ent A
utho
rity
30
6,48
9 0
0 0
306,
489
Slov
akia
10
6,88
6 0
-3,3
60
0 11
0,24
6 Sp
ain
4,21
3 0
0 -2
94
3,91
9 Sw
eden
4,
676
-4,6
76
0 0
0 Sw
itzer
land
5,
144,
002
5,84
2,80
7 3,
685,
044
0 7,
301,
765
Thai
land
54
,735
78
,819
0
0 13
3,55
4 Tu
rkey
19
2,49
7 19
6,39
4 25
8,16
1 0
130,
730
Und
efin
ed
3,35
5 -3
,338
0
0 17
Va
riou
s do
nor p
rogr
amm
able
fun
ds
271,
864
-283
,619
2,
613
286
-14,
082
Tota
l spe
cial
-pur
pose
con
vert
ible
29
,465
,604
15
,033
,047
11
,532
,412
26
2 32
,966
,500
B
ulga
ria
28
0 0
0 28
C
hina
59
7,31
0 20
1,75
4 0
0 79
9,06
4 C
uba
433,
148
0 0
0 43
3,14
8 Eg
ypt
-45,
546
0 0
0 -4
5,54
6 Eg
ypt I
ron
And
Ste
el C
o.
31,9
42
0 0
0 31
,942
N
iger
ia -
Ebon
yi S
tate
0
57,1
79
0 0
57,1
79
Und
efin
ed
-2,8
81
-293
0
0 -3
,174
To
tal s
peci
al-p
urpo
se n
on-c
onve
rtib
le
1,01
4,00
1 25
8,64
0 0
0 1,
272,
641
GR
AN
D T
OTA
L
34,1
41,7
16
15,3
02,9
03
11,5
59,0
05
4,54
7 37
,890
,161

102 V.13-82483
IDB.41/3 PBC.29/3
Annex III (a)
Summary of technical cooperation activities financed by trust funds for the year as at 31 December 2012 — euro-based
(in euros)
Description Fund balance at 01/01/2012
Contributions received, interest
and miscellaneous income 2012
Expenditures 2012
Fund balance as at
31/12/2012
Projects financed by recipient Governments
Cameroon 65,983 0 0 65,983 Cape Verde 13,930 0 0 13,930 Croatia 7,199 0 -2,653 9,852 Iran (Islamic Republic of) 1,450 0 -341 1,791 Israel 0 127,488 0 127,488 Kenya 7,869 0 2,963 4,906 Congo 350,105 304,898 249,876 405,127 Democratic People’s Republic of Korea 65,544 92,000 86,883 70,661 South Africa 2,556,192 323,633 1,937,087 942,738 Sudan 118,183 0 19,854 98,329 Syrian Arab Republic 374,663 423,386 168,112 629,937 Thailand 266 0 0 266 Subtotal 3,561,384 1,271,405 2,461,781 2,371,008 Associate Experts and JPOs Austria 91,095 -24,034 51,372 15,689 Germany 198,577 203,065 196,666 204,976 Subtotal 289,672 179,031 248,038 220,665
Projects financed by donor Governments Australia -1,773 0 0 -1,773 Belgium 227 0 0 227 European Union 6,158,053 10,745,603 13,537,092 3,366,564 European Union Commission 960 0 0 960 European Union Seventh Framework Programme 508,536 0 85,867 422,669
European Union, Côte d’Ivoire 0 1,435,321 514,922 920,399 European Union, Haiti 0 425,000 0 425,000 European Union, Mozambique 0 1,646,880 115,222 1,531,658 European Union, Ukraine 180,000 0 163,940 16,060 Finland 44,564 0 -3,620 48,184 France 471,802 398,579 -297,672 1,168,053 Germany 708,150 1,270,710 1,540,205 438,655 Trust fund trade 2,162,288 538,193 535,469 2,165,012 Trust fund for increased food security through agribusiness and agro-industry promotion 1,057,437 668,523 568,121 1,157,839 Trust fund for renewable energy for productive activities 395,726 547,175 210,981 731,920
Trust Fund for Youth Employment 0 288,136 0 288,136 Trust Fund for Latin America and the Caribbean 0 513,505 0 513,505
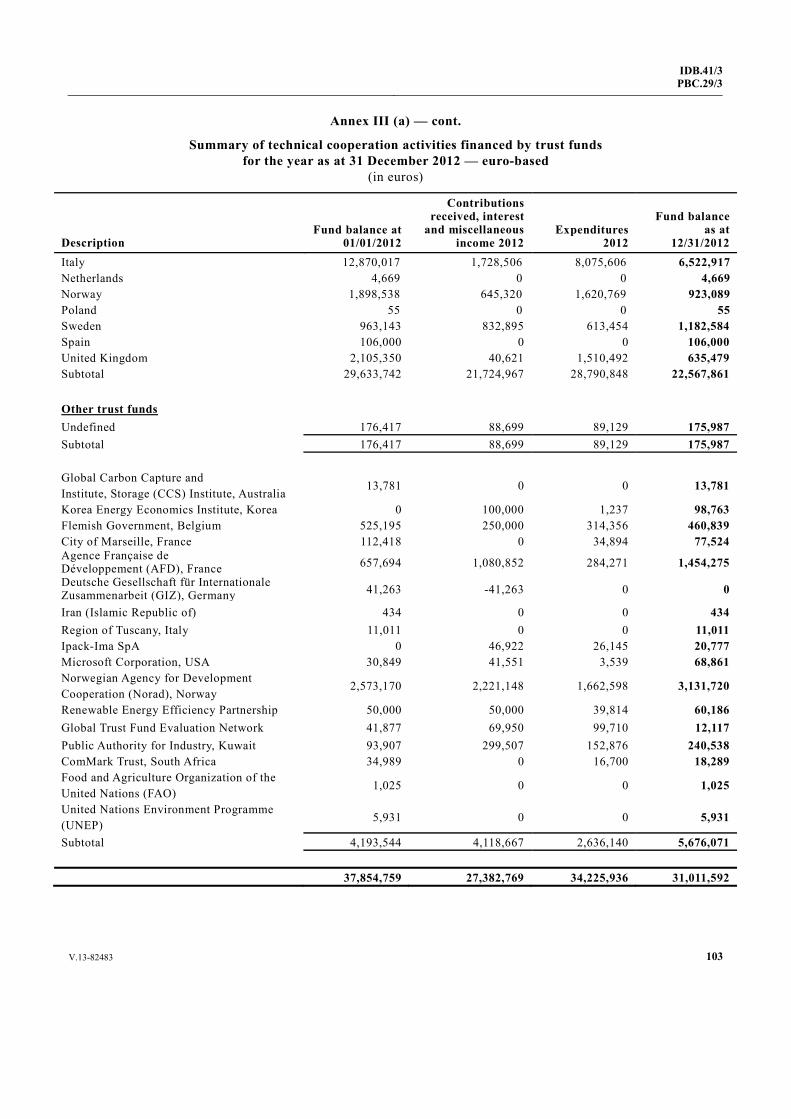
V.13-82483 103
IDB.41/3PBC.29/3
Annex III (a) — cont.
Summary of technical cooperation activities financed by trust funds for the year as at 31 December 2012 — euro-based
(in euros)
Description Fund balance at
01/01/2012
Contributions received, interest
and miscellaneous income 2012
Expenditures 2012
Fund balance as at
12/31/2012 Italy 12,870,017 1,728,506 8,075,606 6,522,917 Netherlands 4,669 0 0 4,669 Norway 1,898,538 645,320 1,620,769 923,089 Poland 55 0 0 55 Sweden 963,143 832,895 613,454 1,182,584 Spain 106,000 0 0 106,000 United Kingdom 2,105,350 40,621 1,510,492 635,479 Subtotal 29,633,742 21,724,967 28,790,848 22,567,861 Other trust funds Undefined 176,417 88,699 89,129 175,987 Subtotal 176,417 88,699 89,129 175,987 Global Carbon Capture and Institute, Storage (CCS) Institute, Australia
13,781 0 0 13,781
Korea Energy Economics Institute, Korea 0 100,000 1,237 98,763 Flemish Government, Belgium 525,195 250,000 314,356 460,839 City of Marseille, France 112,418 0 34,894 77,524 Agence Française de Développement (AFD), France 657,694 1,080,852 284,271 1,454,275 Deutsche Gesellschaft für Internationale Zusammenarbeit (GIZ), Germany 41,263 -41,263 0 0
Iran (Islamic Republic of) 434 0 0 434 Region of Tuscany, Italy 11,011 0 0 11,011 Ipack-Ima SpA 0 46,922 26,145 20,777 Microsoft Corporation, USA 30,849 41,551 3,539 68,861 Norwegian Agency for Development Cooperation (Norad), Norway
2,573,170 2,221,148 1,662,598 3,131,720
Renewable Energy Efficiency Partnership 50,000 50,000 39,814 60,186 Global Trust Fund Evaluation Network 41,877 69,950 99,710 12,117 Public Authority for Industry, Kuwait 93,907 299,507 152,876 240,538 ComMark Trust, South Africa 34,989 0 16,700 18,289 Food and Agriculture Organization of the United Nations (FAO)
1,025 0 0 1,025
United Nations Environment Programme (UNEP)
5,931 0 0 5,931
Subtotal 4,193,544 4,118,667 2,636,140 5,676,071 37,854,759 27,382,769 34,225,936 31,011,592

104 V.13-82483
IDB.41/3 PBC.29/3
Annex III (b)
Summary of technical cooperation activities financed by trust funds for the year as at 31 December 2012 — dollar-based
(in US dollars)
Description Fund balance at 01/01/2012
Contributions received,
interest and miscellaneous
income 2012 Expenditures
2012
Fund balance as at
12/31/2012 Projects financed by recipient Governments Algeria 26,029 0 0 26,029 Argentina 361,894 0 0 361,894 Armenia 0 20,000 1,348 18,652 Burundi 1,014 0 999 15 Bolivia (Plurinational State of) 12,460 0 0 12,460 Brazil 149,904 0 0 149,904 Bulgaria 7,104 0 0 7,104 Chad 722,656 0 647,213 75,443 Cameroon 282,200 239,604 278,356 243,448 Colombia 334,138 13,292 321,529 25,901 China 829,055 1,465,759 1,127,233 1,167,581 Ecuador 12,934 0 0 12,934 Egypt -79 0 0 -79 Ethiopia 2,699 0 -407 3,106 Gabon 19,235 0 14,880 4,355 Guinea 0 282,092 0 282,092 Honduras 2,958 0 0 2,958 India 932,550 350,035 146,177 1,136,408 Indonesia 8,612 0 0 8,612 Iran (Islamic Republic of) 168,214 0 -4,617 172,831 Iran-Organization for Investment, Economic and Technical Assistance of Iran (Islamic Republic of)
52,112 0 0 52,112
Iraq 22,028 0 0 22,028 Kenya 7,994 0 0 7,994 Lebanon 10,574 0 -487 11,061 Libya - Benghazi Development Centre 8,093 0 0 8,093 Libya - General Pipe Company Benghazi 2,700 0 0 2,700 Libya - Industrial Research Centre of Libya 10,049 0 0 10,049 Libya - Secretariat of Strategic Industry 53,081 0 0 53,081 Madagascar 95,672 0 0 95,672 Mexico 599,471 0 4,019 595,452 Nigeria 951,467 5,468,685 266,589 6,153,563 Oman 11,311 0 0 11,311 Pakistan 30,186 0 0 30,186 Panama 10,057 0 0 10,057
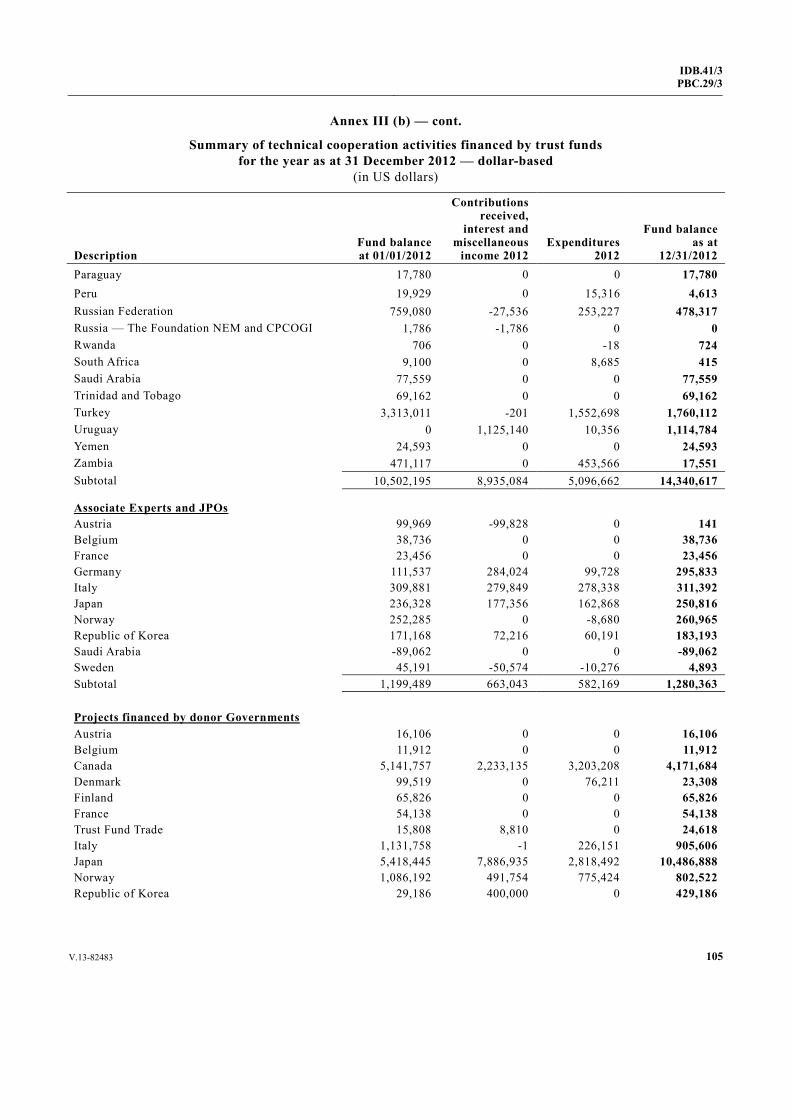
V.13-82483 105
IDB.41/3PBC.29/3
Annex III (b) — cont.
Summary of technical cooperation activities financed by trust funds for the year as at 31 December 2012 — dollar-based
(in US dollars)
Description Fund balance at 01/01/2012
Contributions received,
interest and miscellaneous
income 2012 Expenditures
2012
Fund balance as at
12/31/2012 Paraguay 17,780 0 0 17,780 Peru 19,929 0 15,316 4,613 Russian Federation 759,080 -27,536 253,227 478,317 Russia — The Foundation NEM and CPCOGI 1,786 -1,786 0 0 Rwanda 706 0 -18 724 South Africa 9,100 0 8,685 415 Saudi Arabia 77,559 0 0 77,559 Trinidad and Tobago 69,162 0 0 69,162 Turkey 3,313,011 -201 1,552,698 1,760,112 Uruguay 0 1,125,140 10,356 1,114,784 Yemen 24,593 0 0 24,593 Zambia 471,117 0 453,566 17,551 Subtotal 10,502,195 8,935,084 5,096,662 14,340,617 Associate Experts and JPOs Austria 99,969 -99,828 0 141 Belgium 38,736 0 0 38,736 France 23,456 0 0 23,456 Germany 111,537 284,024 99,728 295,833 Italy 309,881 279,849 278,338 311,392 Japan 236,328 177,356 162,868 250,816 Norway 252,285 0 -8,680 260,965 Republic of Korea 171,168 72,216 60,191 183,193 Saudi Arabia -89,062 0 0 -89,062 Sweden 45,191 -50,574 -10,276 4,893 Subtotal 1,199,489 663,043 582,169 1,280,363 Projects financed by donor Governments Austria 16,106 0 0 16,106 Belgium 11,912 0 0 11,912 Canada 5,141,757 2,233,135 3,203,208 4,171,684 Denmark 99,519 0 76,211 23,308 Finland 65,826 0 0 65,826 France 54,138 0 0 54,138 Trust Fund Trade 15,808 8,810 0 24,618 Italy 1,131,758 -1 226,151 905,606 Japan 5,418,445 7,886,935 2,818,492 10,486,888 Norway 1,086,192 491,754 775,424 802,522 Republic of Korea 29,186 400,000 0 429,186
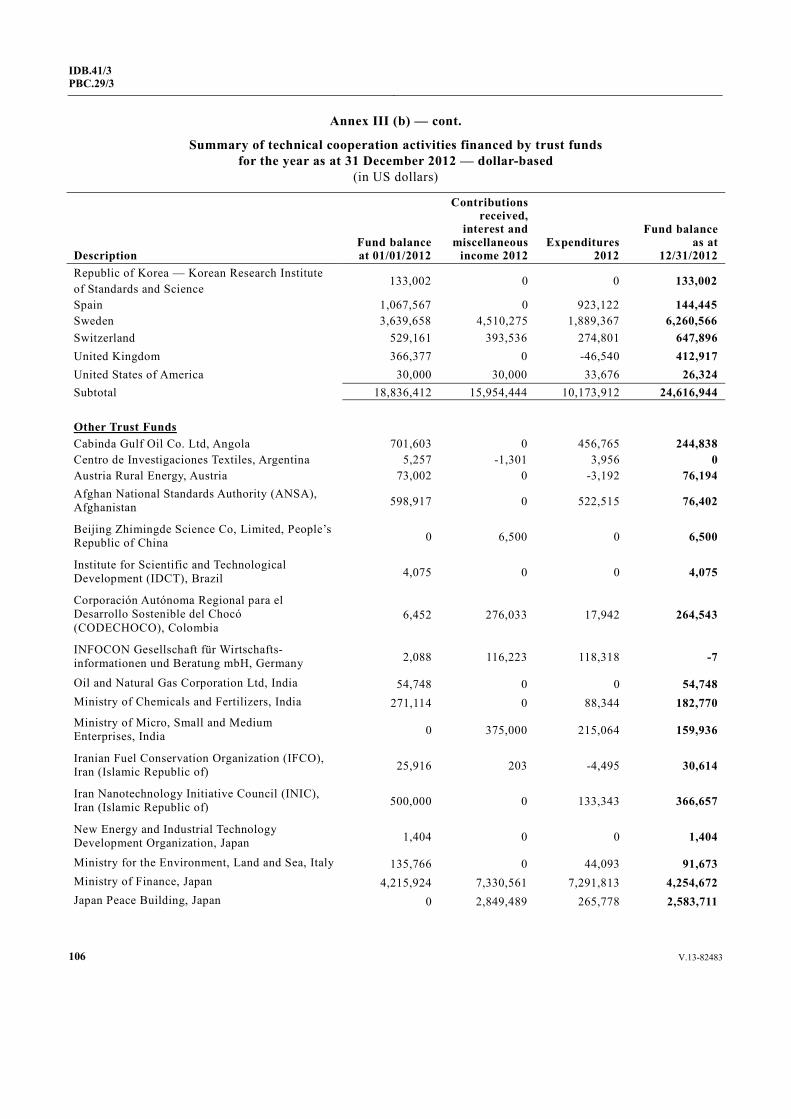
106 V.13-82483
IDB.41/3 PBC.29/3
Annex III (b) — cont.
Summary of technical cooperation activities financed by trust funds for the year as at 31 December 2012 — dollar-based
(in US dollars)
Description Fund balance at 01/01/2012
Contributions received,
interest and miscellaneous
income 2012 Expenditures
2012
Fund balance as at
12/31/2012 Republic of Korea — Korean Research Institute of Standards and Science
133,002 0 0 133,002
Spain 1,067,567 0 923,122 144,445 Sweden 3,639,658 4,510,275 1,889,367 6,260,566 Switzerland 529,161 393,536 274,801 647,896 United Kingdom 366,377 0 -46,540 412,917 United States of America 30,000 30,000 33,676 26,324 Subtotal 18,836,412 15,954,444 10,173,912 24,616,944 Other Trust Funds Cabinda Gulf Oil Co. Ltd, Angola 701,603 0 456,765 244,838 Centro de Investigaciones Textiles, Argentina 5,257 -1,301 3,956 0 Austria Rural Energy, Austria 73,002 0 -3,192 76,194 Afghan National Standards Authority (ANSA), Afghanistan 598,917 0 522,515 76,402
Beijing Zhimingde Science Co, Limited, People’s Republic of China 0 6,500 0 6,500
Institute for Scientific and Technological Development (IDCT), Brazil 4,075 0 0 4,075
Corporación Autónoma Regional para el Desarrollo Sostenible del Chocó (CODECHOCO), Colombia
6,452 276,033 17,942 264,543
INFOCON Gesellschaft für Wirtschafts-informationen und Beratung mbH, Germany 2,088 116,223 118,318 -7
Oil and Natural Gas Corporation Ltd, India 54,748 0 0 54,748 Ministry of Chemicals and Fertilizers, India 271,114 0 88,344 182,770 Ministry of Micro, Small and Medium Enterprises, India 0 375,000 215,064 159,936
Iranian Fuel Conservation Organization (IFCO), Iran (Islamic Republic of) 25,916 203 -4,495 30,614
Iran Nanotechnology Initiative Council (INIC), Iran (Islamic Republic of) 500,000 0 133,343 366,657
New Energy and Industrial Technology Development Organization, Japan 1,404 0 0 1,404
Ministry for the Environment, Land and Sea, Italy 135,766 0 44,093 91,673 Ministry of Finance, Japan 4,215,924 7,330,561 7,291,813 4,254,672 Japan Peace Building, Japan 0 2,849,489 265,778 2,583,711
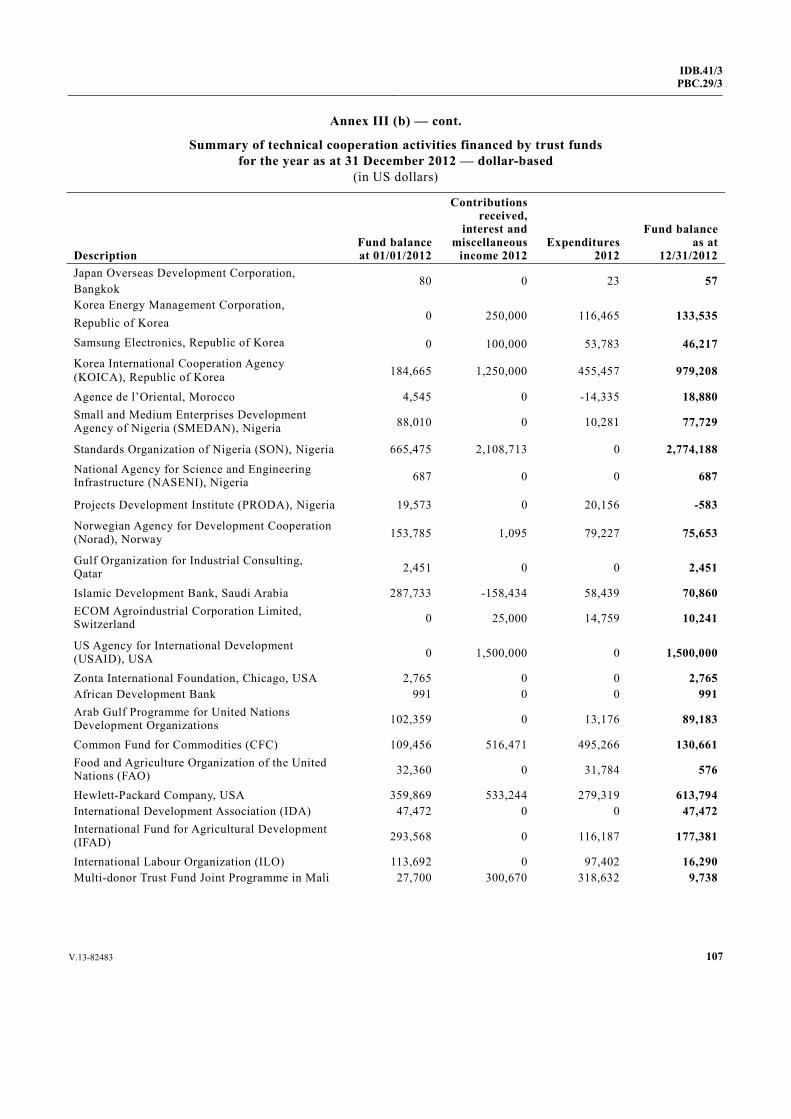
V.13-82483 107
IDB.41/3PBC.29/3
Annex III (b) — cont.
Summary of technical cooperation activities financed by trust funds for the year as at 31 December 2012 — dollar-based
(in US dollars)
Description Fund balance at 01/01/2012
Contributions received,
interest and miscellaneous
income 2012 Expenditures
2012
Fund balance as at
12/31/2012 Japan Overseas Development Corporation, Bangkok
80 0 23 57
Korea Energy Management Corporation, Republic of Korea 0 250,000 116,465 133,535
Samsung Electronics, Republic of Korea 0 100,000 53,783 46,217 Korea International Cooperation Agency (KOICA), Republic of Korea 184,665 1,250,000 455,457 979,208
Agence de l’Oriental, Morocco 4,545 0 -14,335 18,880 Small and Medium Enterprises Development Agency of Nigeria (SMEDAN), Nigeria 88,010 0 10,281 77,729
Standards Organization of Nigeria (SON), Nigeria 665,475 2,108,713 0 2,774,188 National Agency for Science and Engineering Infrastructure (NASENI), Nigeria 687 0 0 687
Projects Development Institute (PRODA), Nigeria 19,573 0 20,156 -583
Norwegian Agency for Development Cooperation (Norad), Norway 153,785 1,095 79,227 75,653
Gulf Organization for Industrial Consulting, Qatar 2,451 0 0 2,451
Islamic Development Bank, Saudi Arabia 287,733 -158,434 58,439 70,860 ECOM Agroindustrial Corporation Limited, Switzerland 0 25,000 14,759 10,241
US Agency for International Development (USAID), USA 0 1,500,000 0 1,500,000
Zonta International Foundation, Chicago, USA 2,765 0 0 2,765 African Development Bank 991 0 0 991 Arab Gulf Programme for United Nations Development Organizations 102,359 0 13,176 89,183
Common Fund for Commodities (CFC) 109,456 516,471 495,266 130,661 Food and Agriculture Organization of the United Nations (FAO) 32,360 0 31,784 576
Hewlett-Packard Company, USA 359,869 533,244 279,319 613,794 International Development Association (IDA) 47,472 0 0 47,472 International Fund for Agricultural Development (IFAD) 293,568 0 116,187 177,381
International Labour Organization (ILO) 113,692 0 97,402 16,290 Multi-donor Trust Fund Joint Programme in Mali 27,700 300,670 318,632 9,738
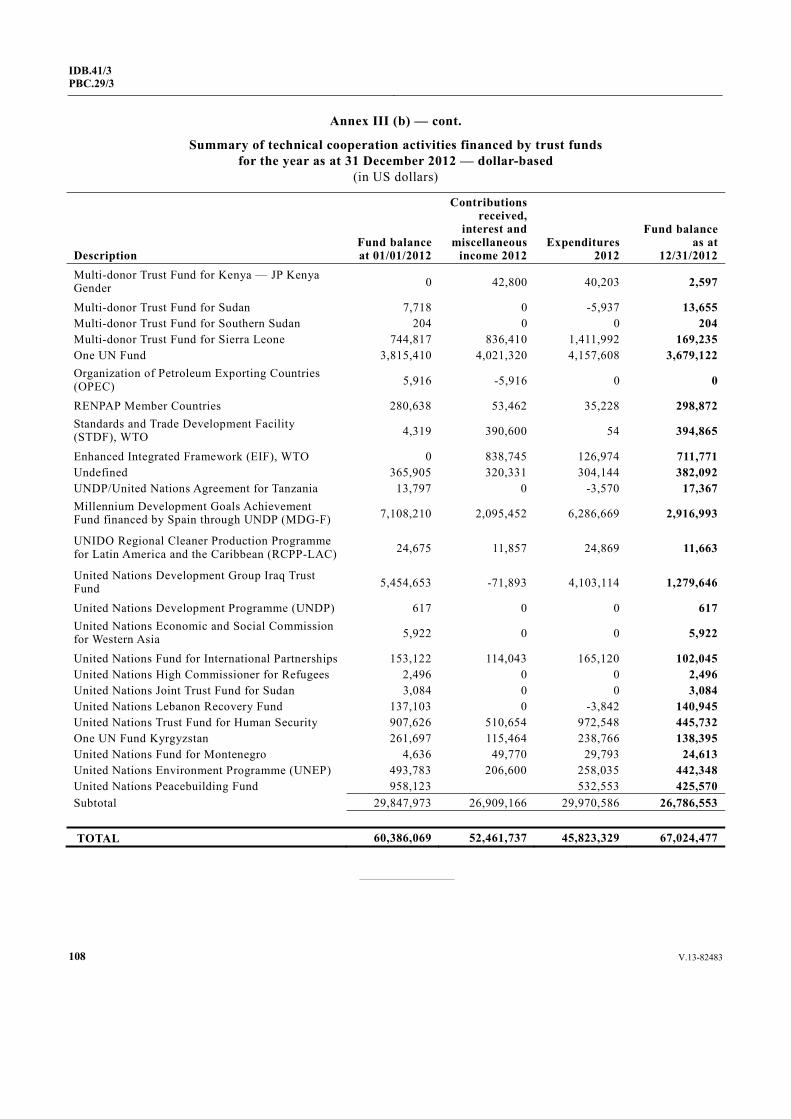
108 V.13-82483
IDB.41/3 PBC.29/3
Annex III (b) — cont.
Summary of technical cooperation activities financed by trust funds for the year as at 31 December 2012 — dollar-based
(in US dollars)
Description Fund balance at 01/01/2012
Contributions received,
interest and miscellaneous
income 2012 Expenditures
2012
Fund balance as at
12/31/2012 Multi-donor Trust Fund for Kenya — JP Kenya Gender 0 42,800 40,203 2,597
Multi-donor Trust Fund for Sudan 7,718 0 -5,937 13,655 Multi-donor Trust Fund for Southern Sudan 204 0 0 204 Multi-donor Trust Fund for Sierra Leone 744,817 836,410 1,411,992 169,235 One UN Fund 3,815,410 4,021,320 4,157,608 3,679,122 Organization of Petroleum Exporting Countries (OPEC) 5,916 -5,916 0 0
RENPAP Member Countries 280,638 53,462 35,228 298,872 Standards and Trade Development Facility (STDF), WTO 4,319 390,600 54 394,865
Enhanced Integrated Framework (EIF), WTO 0 838,745 126,974 711,771 Undefined 365,905 320,331 304,144 382,092 UNDP/United Nations Agreement for Tanzania 13,797 0 -3,570 17,367 Millennium Development Goals Achievement Fund financed by Spain through UNDP (MDG-F) 7,108,210 2,095,452 6,286,669 2,916,993
UNIDO Regional Cleaner Production Programme for Latin America and the Caribbean (RCPP-LAC) 24,675 11,857 24,869 11,663
United Nations Development Group Iraq Trust Fund 5,454,653 -71,893 4,103,114 1,279,646
United Nations Development Programme (UNDP) 617 0 0 617 United Nations Economic and Social Commission for Western Asia 5,922 0 0 5,922
United Nations Fund for International Partnerships 153,122 114,043 165,120 102,045 United Nations High Commissioner for Refugees 2,496 0 0 2,496 United Nations Joint Trust Fund for Sudan 3,084 0 0 3,084 United Nations Lebanon Recovery Fund 137,103 0 -3,842 140,945 United Nations Trust Fund for Human Security 907,626 510,654 972,548 445,732 One UN Fund Kyrgyzstan 261,697 115,464 238,766 138,395 United Nations Fund for Montenegro 4,636 49,770 29,793 24,613 United Nations Environment Programme (UNEP) 493,783 206,600 258,035 442,348 United Nations Peacebuilding Fund 958,123 532,553 425,570 Subtotal 29,847,973 26,909,166 29,970,586 26,786,553 TOTAL 60,386,069 52,461,737 45,823,329 67,024,477
Related Documents