i United International University Internship report on Ratio Analysis Of Prime Bank Limited Prepared For Dr. Salma Karim Professor of Accounting School of Business & Economics United International University Prepared by Muhammed Faisal Karim ID: 111-142-307 Program: BBA, Major: Accounting School of Business & Economics United International University Date of Submission: 16-02-2020

Welcome message from author
This document is posted to help you gain knowledge. Please leave a comment to let me know what you think about it! Share it to your friends and learn new things together.
Transcript

i
United International University
Internship report on
Ratio Analysis
Of
Prime Bank Limited
Prepared For
Dr. Salma Karim
Professor of Accounting
School of Business & Economics
United International University
Prepared by
Muhammed Faisal Karim
ID: 111-142-307
Program: BBA, Major: Accounting
School of Business & Economics
United International University
Date of Submission: 16-02-2020

i
Letter of Transmittal
Date: 16/02/2020
Dr. Salma Karim
Professor of Accounting
School of Business & Economics
United International University
Subject: Submission of internship report on “Ratio Analysis of Prime Bank Limited”.
Madam,
I am glad to inform you that I have completed my internship report on “Ratio Analysis of
Prime Bank Limited” which you have assigned me in order to get a clear understanding
about the financial position of Prime Bank Limited. I have tried my level best to gather all
kinds of relevant information, which could give overall concept of this report. I hope that
it will meet expected standard. I have enjoyed a lot while preparing the report and gained
essential knowledge about the subject.
Therefore, I hope that the report would find itself to be satisfactory and appealing in your
mind. I strongly feel that I have gained enough experience which helped me to enhance
my skills and personality in the professional field. I am grateful to you for guiding and
providing me the essential information and suggestions for completing this report. I am
submitting this report for your kind attentiveness and thanking you for your continuous
help and counseling.
Sincerely yours,
Muhammed Faisal Karim
ID: 111-142-307
School of Business & Economics
United International University
……………………..

ii
Supervisor’s Certification
This is to certify that the internship report on “Ratio Analysis of Prime Bank Limited”
is prepared by Muhammed Faisal Karim, ID No.: 111-142-307 as a partial requirement of
Bachelor of Business Administration (BBA) degree from the School of Business &
Economics, United International University.
The report can be accepted in terms of quality and form as directed by the university
authority.
............................
Dr. Salma Karim
Professor of Accounting
School of Business & Economics
United International University

iii
Acknowledgements
First of all, I would like to take the opportunity to express my heartfelt gratitude to
Almighty Allah for giving me the opportunity to complete the report within the designated
time.
I am expressing my cordial thanks to our honorable supervisor, Dr. Salma Karim,
Professor of Accounting, School of Business & Economics, United International
University, for assigning me such an interesting topic.
I would also like to thank my respected faculties of the School of Business & Economics,
United International University, who provided me with the opportunity to work beside
them and guided me to develop my skills in the professional field.
My recognitions are due to a multitude of people who have immensely supported and
helped me with this study. Regardless of the fact of having enormous responsibilities, they
supported me by providing their valuable time and adequate information.
I would like to thank my classmates and fellow students for cooperating and supporting
me.
I would also, lastly but above all, like to thank all the faculties of United International
University, who helped and supported me through their bunch of information and
experience.

iv
Abstract
This report is prepared based on financial performance analysis of Prime Bank Limited.
The main objective of the report is to analyze and discuss the financial performance
analysis of Prime Bank Limited. To calculate different types of ratios of Prime Bank
Limited, to identify the areas of concern and to make some recommendations the basis of
findings are also the objectives of this report. The report is analytical in nature which
briefly reveals the analysis of the financial performance of Prime Bank Limited. Annual
reports of Prime Bank Limited were the major secondary data sources in this aspect. This
study has been conducted by collecting data for the period of last five years (2014-2018).
Prime Bank Limited is setting new level in the field in the time of unstable economic
conditions.

v
Index
SL Particulars Page No.
Letter of Transmittal i
Supervisor’s Certification ii
Acknowledgements iii
Abstract iv
1 Introduction 1
2 Literature Review 2-3
3 Objectives of the Study 3
4 Methodology of the Study 3
5 Financial Ratios 4-13
6 Findings and Analysis 14-15
7 Recommendations 16
8 Conclusion 17
9 References 18

1
1. Introduction
Ratio Analysis is one of the most important tools in accounting which help firms to
identify their strengths and weaknesses. It is as old as accounting concept and easy to
understand and calculate. It generally helps the stakeholders to make future decisions. The
importance and purpose of ratio analysis is to analyze or evaluate the financial
performance of the firm in terms of profitability, risk, efficiency and solvency. They can
determine the operating performance and analyze their company growth. It also helps
firms in identifying their financial risks. The firms can understand how much it is
depending on external capital and whether they are capable to pay back the debt using
their own capital with the help of these financial ratios like debt service coverage ratio
(DSCR), leverage ratio , interest coverage ratio etc. It helps firms and their stakeholders to
compare the ratio of their company with another over a period of time. The ratios can also
be compared to the firm’s previous ratio which helps to analyze whether they made any
progress over the past few years. The use of ratios can help a business to better understand
their way of tracking their day to day expenses or whether they are experiencing any cash
flow problems. It can also help them to analyze the productivity rate based on the number
of staffs employed. They can check how quickly they can turn their stock into a sale; they
can also observe their customers’ payment habits based on the terms of payment they have
set.
Moreover managers and analysts can find a trend and use it for future forecasting which
can also be used for making important decisions by external stakeholders, e.g. investors. It
is one of the easiest ways to hold the relationship between various elements and helps in
understanding the financial statements. Every stakeholder can easily understand it and can
determine or take decision that would be best for future investment. It is very important to
access the performance of the firms by analyzing its asset management, liquidity,
profitability, and efficiency ratios. All of these ratio analyses are widely used for making
important decisions and future forecasting.
The technique of ratio analysis is a very useful tool for analyzing the financial
performance of a firm. But it has some constraints which must be kept in mind before
exploring such analysis. Financial statements provide prior information and do not
consider current conditions which are not useful in predicting the future. Firms use
different accounting policies regarding charging depreciation, valuation of inventories etc.
which can make the accounting ratios and accounting data of two firms non-comparable.
Window-dressing is another limitation which means the firms are presenting the financial
statements in such a way which will show a better financial position than what it actually
is. Firms provide the value of fixed assets in financial statement at cost only and it does
not consider the changes in price level which makes comparison difficult.

2
2. Literature Review
Literature review refers to the collection of the various information relating to the present
study. It considers the researches of the previous researchers which are related to the
present research. Here are the reviews of some previous researches related to the present
study:
Manish Mittal and Arunna Dhademade (2005) stated that they found higher profitability is
the only major variable for evaluating the performance of banking sector from the
shareholders viewpoint. The banks should strike a balance between social and commercial
objectives. They also found that most of the public sector banks are less when profitable
compared to private sector banks. Foreign banks are dominating in terms of net
profitability. The earning of private sector banks is higher based on non-interest income
because these banks offer more and more fee based services to corporate sector or
business houses. Therefore public sector banks need to provide similar services to compete
with private sector banks.
Alexiou and Sofoklis (2009) stated that two profitability indicators are used as the
determinants of bank profitability in Greece including Return on Assets and Return on
equity, while the proposed determinants of profitability include credit risk, bank size,
liquidity, bank productivity, bank efficiency, annual inflation rate, interest rate, GDP
growth, private consumption and bank capitalization.
Medhat Tarawneh (2006) stated financial performance is a measured variable and it can be
calculated by Return on Assets (ROA) and the targeted income size. The independent
variables are assets management measured by asset usage ratio, the size of banks which
can be estimated by total assets of banks (Operating income divided by total assets) and
operational efficiency can be estimated by the operating efficiency ratio (total operating
expenses divided by net income).
Fernando Ferreng (2012) stated it is generally agreed that recent economic crisis
reinforced worldwide competition among financial institution. This competition has direct
impact on how banks can achieve their objectives and deal with their customers.
Performance evaluation of banks is the essential obligation for improving bank’s
performance. Bank’s success and profitability depends comprehensively on the bank’s
branch financial performance.
Davydenko (2011) stated that the profitability in Ukraine is measured by return on assets,
while the proposed determinants of profitability are divided into bank-specific
determinants, industry-specific determinants and macroeconomics determinants. Bank

3
capitalization, bank risk, bank size, cost management, liquidity, loan to total assets ratio,
and deposits to total assets ratio are used as the bank-specific determinants, industry-
specific variables include bank concentration and foreign ownership, inflation, exchange
rate and financial crisis are three macroeconomic variables which are supposed to
influence the bank profitability in Ukraine. Fixed effect, random effect and GMM
(Generalized Method of Moments) estimator are used as the econometric technique, the
results from the estimations show that bank profitability is significantly and negatively
affected by bank risk, expenses and the volume of deposit and positively affected by
capitalization.
Nutan Troke and P K Pachorkar (2012) stated that the proportion of other income in the
total income is higher for private sector bank compared to public sector banks. Public
sector bank relies on intent income for their efficiency and performance. The operational
efficiency is better of private sector banks compared to public sector banks. Private sector
bank uses their assets quality better compared to public sector banks.
3. Objectives of the Report
The purpose of the report is to analyze ratio analysis of Prime Bank Limited. The report
was conducted to accomplish the following specific objectives:
To calculate the financial ratios
To analyze and discuss the ratios
To identify the areas of concern
To make some recommendations on the basis of findings
4. Methodology of the Report
This report is analytical in nature which briefly reveals the ratio analysis of Prime Bank
Limited. It has been conducted by collecting secondary data. Annual reports of Prime
Bank Limited were used as the major secondary data source in this aspect. This study has
been conducted by collecting data for the period of last five years (2014-2018) using the
following sources:
Annual Report of Prime Bank Limited.
Official Website.
Books, paper and publications.
4
1.17
1.07
1.12
1 1.02
2014 2015 2016 2017 2018
Current Ratio
5. Financial Ratios
A. Current Ratio
The current ratio which is one of the most commonly used financial ratios helps to
calculate the firm’s potential to meet its short term obligations. The greater the ratio the
better the liquidity position of the firm. The standard of current ratio is 2:1. It is expressed
as:
Current Ratio =
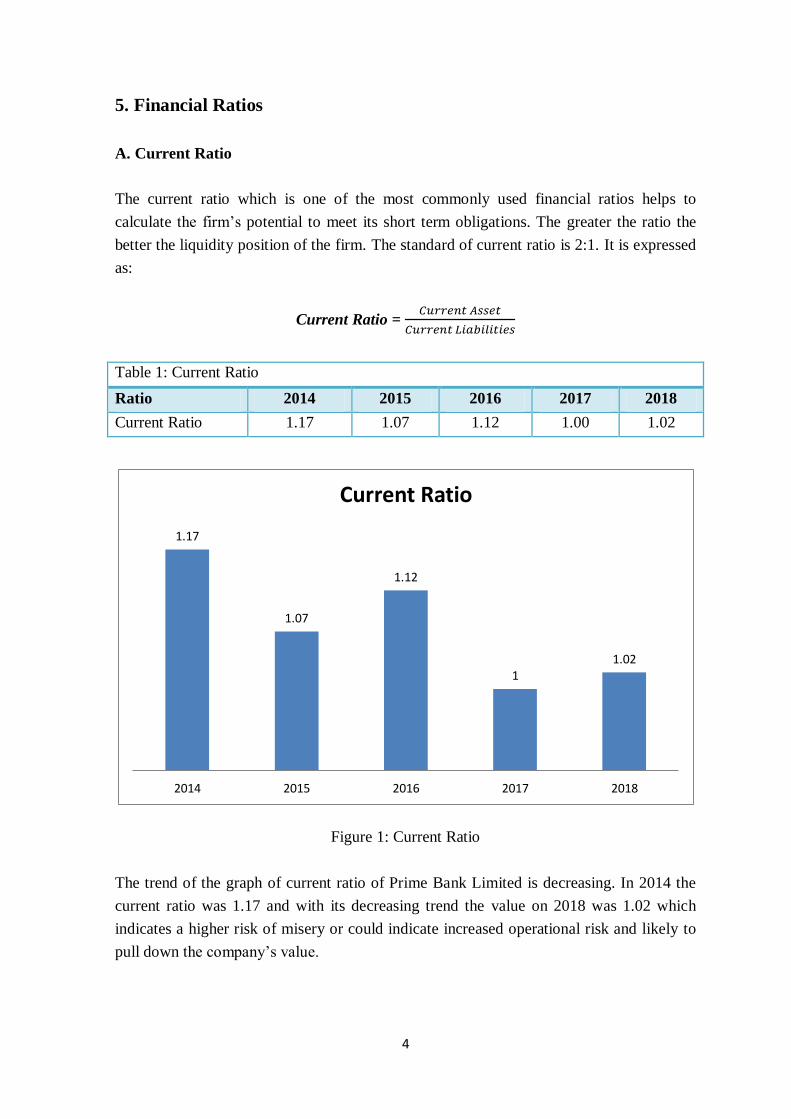
Table 1: Current Ratio
Ratio 2014 2015 2016 2017 2018
Current Ratio 1.17 1.07 1.12 1.00 1.02
Figure 1: Current Ratio
The trend of the graph of current ratio of Prime Bank Limited is decreasing. In 2014 the
current ratio was 1.17 and with its decreasing trend the value on 2018 was 1.02 which
indicates a higher risk of misery or could indicate increased operational risk and likely to
pull down the company’s value.

5
9.99
10.96
10.24
9.63 9.78
2014 2015 2016 2017 2018
Debt Ratio
B. Debt Ratio
The debt ratio is calculated to measure the range of financial leverage which is defined as
total assets provided by the firm’s creditors.
Debt ratio =
Table 2: Debt Ratio
Ratio 2014 2015 2016 2017 2018
Debt Ratio 9.99 10.96 10.24 9.63 9.78
Figure 2: Debt Ratio
Prime Bank Limited’s debt ratio is fluctuating as it increased in 2015 from 9.99 to 10.96.
It gradually decreases to 9.63 in 2017 but again it increased to 9.78 which indicate that a
huge percentage of the company’s financing asset is from debt. Generally a lower ratio is
better.

6
48.29
51.08
52.11
55.98 55.93
2014 2015 2016 2017 2018
Cost Income Ratio
C. Cost Income Ratio
It calculates the operating efficiency by measuring the percent of the total operating
income which the firm spend to operate their daily activities. It is calculated as follows:
Cost Income Ratio =
Table 3: Cost Income Ratio
Ratio 2014 2015 2016 2017 2018
Cost Income Ratio 48.29 51.08 52.11 55.98 55.93
Figure 3: Cost Income Ratio
Cost to income ratio has an upward trend which means that costs are rising at a higher rate
than income, which could suggest that the company is not focusing in minimizing the cost.
In 2017 the cost to income ratio of Prime Bank Limited is high. So we can say that the
operating efficiency of the Prime Bank Limited is not good. That means they are not able
to minimize their operating cost, day by day it is getting high.

7
269218 267322
272224
281275
293901
2014 2015 2016 2017 2018
Total Asset Turnover Ratio
D. Total Asset Turnover Ratio
The total asset turnover suggests the efficiency of a firm in using all its assets to generate
income.
Total Asset Turnover =
Table 4: Total Asset Turnover Ratio
Ratio 2014 2015 2016 2017 2018
Total Asset
Turnover Ratio
269218 267322 272224 281275 293901
Figure 4: Total Asset Turnover Ratio
The total asset turnover ratio is following an upward trend. Their total asset turnover is
lowest in 2015 but it is highest in 2018. This shows that Prime Bank Limited is using its
assets more efficiently to generate operating income.

8
6157
5906
5757
5373
5719
2014 2015 2016 2017 2018
Operating Profit Margin
E. Operating Profit Margin
The operating profit margin means the exact profits earned on each dollar sales. A higher
ratio is more preferable by the stockholders. The operating profit margin is calculated as
follows:
Operating Profit Margin =
Table 6: Operating Profit Margin
Ratio 2014 2015 2016 2017 2018
Operating Profit
Margin
6157 5906 575 5373 5719
Figure 5: Operating Profit Margin
The operating profit margin is following a downward trend from 2014 to 2017 but in 2018
it is going upwards. In 2014 the value was 6157 and in 2017 it was 5373 but in 2018 it
increased to 5719 which indicates that from 2014 to 2017 the company was unable to
generate enough income from their operations to pay for their variable costs and fixed
costs. But in 2018 they managed to increase their income over operating expenses.

9
1.91
0.86
2.2
2.56
3.63
2014 2015 2016 2017 2018
Net Profit Margin
F. Net Profit Margin
The net profit margin is calculated as the percentage of each dollar sales remaining after
all expenses have been deducted including tax. The higher ratio is considered to be better.
It is commonly used by the firms to measure the firm’s success with respect to earnings on
sales.
Net Profit Margin =
Table 7: Net Profit Margin
Ratio 2014 2015 2016 2017 2018
Net Profit Margin 1.91 0.86 2.02 2.56 3.63
Figure 6: Net Profit Margin
Here, net profit margin is following an upward trend. The lowest value was 0.86 in 2015
and the highest value was 3.63 in 2018 which means that the company is more efficient at
generating sales into actual profit.

10
0.91
0.8 0.81
0.38
0.73
2014 2015 2016 2017 2018
Return on Asset
G. Return on Asset
The return on asset calculates the overall effectiveness of management in generating
profits with the available assets. It is often called the firm’s return on total assets. The
higher the ratio is better.
Return on Asset =
Table 8: Return on Asset
Ratio 2014 2015 2016 2017 2018
Return on Asset 0.91 0.80 0.81 0.38 0.73
Figure 7: Return on Asset
The bank’s return on asset was following a downward trend till 2017. The highest value
was 0.91 in 2014 and lowest value was 0.38 in 2017 but it changes upwards to 0.73 in
2018 which indicates that its earning capacity has increased from 2017 but it is still lower
than 2014. Thus it can be said that the proportion of their earning is not increasing year by
year regularly.

11
10.08
8.41 8.49
4.24
8.6
2014 2015 2016 2017 2018
Return on Equity
H. Return on Equity
The return on equity calculates the return earned on the investment of the owner.
Generally, higher return is considered better.
Return on Equity =
Table 9: Return on Equity
Ratio 2014 2015 2016 2017 2018
Return on Equity 10.08 8.41 8.49 4.24 8.60
Figure 8: Return on Equity
The return on equity ratio was declining from 2014 to 2018. That was decreased from
2014 to 2015 and 2017-2018.It is not preferable for the firm. So, the management should
try to increase the return on equity though, the return has slightly increased in 2016 from
2015.

12
2.11
1.89 1.94
0.94
1.93
2014 2015 2016 2017 2018
Earnings per Share
I. Earnings per Share
The firm’s earnings per share is generally presented in the interest of the potential
stockholders and management. The Earnings per share constitutes the number of dollars
earned on behalf of each outstanding share of common stock. The earnings per share are
calculated as follows:
Earnings per Share =
Table 10: Earnings per Share
Ratio 2014 2015 2016 2017 2018
Earnings per Share 2.11 1.89 1.94 0.94 1.93
Figure 9: Earnings per Share
The bar chart shows that, EPS is highest in 2018 and there is a downward trend in EPS
from year 2014 to 2017. But Prime Bank Limited has managed to increase their EPS as we
can see in the bar chart. The value has not changes much from 2014 to 2016 but it was
lowest in 2017 and increased in 2018 which is still lower than 2014.

13
8.43 8.71 8.31
29.3
9.21
2014 2015 2016 2017 2018
Price Earnings Ratio
J. Price Earnings Ratio
The price or earning (P/E) ratio is commonly used to evaluate the investor evaluation of
share value. It shows how much the investors are eager to pay for each taka of the firm’s
earnings. The investors’ confidence is greater when the firm’s P/E ratio is higher. The
price Earning (P/E) ratio is calculated as follows:
Price Earnings Ratio =
Table 11: Price Earnings Ratio
Ratio 2014 2015 2016 2017 2018
Price Earnings
Ratio
8.43 8.71 8.31 29.30 9.21
Figure 10: Price Earnings Ratio
It calculates the level of price that the investors are paying for per taka of earnings offered
by the bank. From the graph we can see that in year 2017 the investors paid maximum
amount of price for per unit of earnings in which the bank issued its share in the market. In
2017 to 2018 it is decrease. This is not good a sign for the Bank.

14
6. Findings and Analysis
It is common that the company would have certain problems while operating such
organization. There are few problems explained from the study of this report. They are:
The trend of the graph of current ratio of Prime Bank Limited is decreasing. In
2014 the current ratio was 1.17 and with its decreasing trend the value on 2018 was
1.02 which indicates a higher risk of misery or could indicate increased operational
risk and likely to pull down the company’s value. In general a current ratio greater
than 1 or 2:1 suggests that the company has enough financial resources to remain
secure in paying off the short-term liabilities. As we can see that the current ratio
of Prime Bank limited has a decreasing trend it may soon have a current ratio
below 1 which means the company might not have enough current assets on hand
to meet its short-term obligations.
Prime Bank Limited’s debt ratio is fluctuating as it increased in 2015 from 9.99 to
10.96. It gradually decreases to 9.63 in 2017 but again it increased to 9.78 which
indicate that a huge percentage of the company’s financing asset is from debt.
Generally a lower ratio is better. A value of 1 or less in debt ratios shows good
financial health of a company. It means the company has high risk of being
bankrupt since too much debt can lead to a heavy debt repayment burden.
Cost to income ratio has an upward trend which means that costs are rising at a
higher rate than income, which could suggest that the company is not focusing in
minimizing the cost. The operating efficiency of Prime Bank Limited is not good
and that means they are not able to minimize their operating cost which is
increasing day by day. Generally the lower the cost/income ratio is, the more
profitable it should be.
The total asset turnover ratio is following an upward trend. Its total asset turnover
is lowest in 2015 but it is highest in 2018. This shows that Prime Bank Limited is
using its assets more efficiently to generate operating income.
The operating profit margin follows a downward trend from 2014 to 2017 but in
2018 it is going upwards. In 2014 the value was 6,157 and in 2017 it was 5,373 but
in 2018 it increased to 5,719 which indicates that from 2014 to 2017 the company
was unable to generate enough income from their ongoing operations to pay for

15
their variable costs and fixed costs. But in 2018 they managed to increase their
income over operating expenses.
The net profit margin is following an upward trend. The lowest value was 0.86 in
2015 and the highest value was 3.63 in 2018 which means that the company is
more efficient at generating sales into actual profit.
The bank’s return on asset was following a downward trend till 2017. The highest
value was 0.91 in 2014 and lowest value was 0.38 in 2017 but it changes upwards
to 0.73 in 2018 which indicates that its earning capacity has increased from 2017
but it is still lower than 2014. Thus it can be said they are unable to increase their
income year by year regularly.
The return on equity ratio has decreased over the year from 2014 to 2018. Though
return on equity has increased moderately in 2016 from preceding year, still it is
significantly varies from that of in 2018. Most analysts consider that an ROE in the
range of 15% to 20% to be beneficial for purposes of investment. Since all the
values of Prime Bank Limited, over the years, has been less than 15% it shows that
the company is not productively using the investments of equity investors to make
additional profits and to return the profits to investors at an attractive level.
The earnings per share of Prime Bank Limited is following a decreasing trend. The
value has not changes much from 2014 to 2016 but it was lowest in 2017 and
increased in 2018 which is still lower than 2014. A higher value of earnings per
share is always better than a lower ratio because it shows the company is more
profitable and has the potential to distribute profits to its shareholders.
The Price earnings ratio of Prime Bank Limited haven’t changed much from 2014
to 2016 but in 2017 it had an abnormal change as its value suddenly increased to
29.3 from 8.31, it may happen because the management might have manipulated it
with specific accounting techniques. A higher value indicates constructive future
presentation and investors will be willing to pay more for this company’s shares.

16
7. Recommendations
There are few recommendations provided below for the previously mentioned problems:
As the current ratio of Prime Bank Limited was decreasing year to year. So, it
should try to increase this ratio by paying off current liabilities, sell off
unproductive assets and increase current assets by raising shareholder’s fund etc.
As we have already seen that a huge percentage of the company’s financing asset
is from debt. But the risk of the company is decreasing as it is following
downwards trend. So they should continue what they are doing.
Their cost to income ratio has an upwards trend which is not a good sign. So, they
should try to reduce operating expenses such as reduce labor costs and increase
operating sales.
Prime Bank Limited’s total asset turnover had an increasing trend which means
they were efficiently using their assets to generate income. So, they should follow
what they were doing.
Prime Bank Limited can improve their operating profit margin by increasing sales
to achieve cost-effectiveness through economies of scale and lowering production
costs while at the same time bringing in extra revenue.
The return on asset has a downward trend which can be improved by increasing
revenue, reducing expenses and reducing assets cost.
The return on equity ratio is following downward trend which is not good, the
management should work hard to increase the return linked with equity by
increasing profit margins, using more financial leverage, improving asset turnover
and distributing idle cash etc.

17
8. Conclusion
Prime Bank Limited is setting new standards in the banking arena in the time of turbulent
economic conditions. As a major aspect of the long haul money related change and
modernization plan of the administration, the bank had been changed over into an open
constrained organization. Bank is a budgetary middle person that gathers cash as store
from inert segment for example family unit by giving enthusiasm against store and prepare
this cash into beneficial area for example industry, horticulture, producing from by
gathering enthusiasm against advance. The contrast between premium cost and premium
increase is the bank's principle benefit. In banking language it is called spread. Without a
bank a financial advancement can't be envisioned. The prime bank one of the leading
banks in our country that also plays a vital role in games. Prime bank collect deposit by
providing different types attracting deposit product and provide loan by offering different
types of investment product.
From the trend analysis Prime Bank Limited equity ratio, asset turnover, P/E ratio earning
capacity and interest ratio are fluctuating year by year and this indicates unsatisfactory
position but its leverage ratio shows the reduction of financial risk. Over the years Prime
Bank Limited has made a well- built position through its range of activities. Its number of
clients, amount of deposit and investment money is increasing day by day. To face the
competition the bank should think to stare new services and to take different types of
marketing strategy to get more customers in this competition market of banking. It can be
said that, Prime Bank Limited Is growing fast and its contribution in our economy is also
considerable. I hope that Prime Bank Limited will widen its services by expanding its
products and branch all over the country. I sincerely hope that with the gradual and
successful globalization of Islamic banking coupled with growing awareness of the people
about its financial and social benefits makes it clear that the this decade is going to be the
decade of Prime Bank Limited.

18
References
Price Earnings P/E Ratio. (2019). Retrieved 02 11, 2020, from My Accounting Courses:
www.myaccountingcourse.com
Altman, E. (1968). The Jornal of Finance. “Financial Ratios, Discriminate Analysis and
the Prediction of Corporate Bankruptcy”, 589.
Chandra, P. (1995). Investment Game. The Investment Game, New Delhi, Mc Graw Hill
Publishing Co. Ltd., 172.
George, F. (2002). Pearson Education Pte, Ltd, Singapore 2nd Edition. “Financial
Statement Analysis”.
Hossain, M. M. (n.d.). The University Studies Vol. ii No.2. “Measurement of Effectiveness
of Prime Bank Limited”.
Limited, P. B. (2011). Prime Bank Limited. Retrieved 11 19, 2019, from Prime Bank:
https://www.primebank.com.bd/index.php/home/financial_reports
Ohlson, J. (1980). “Financial Ratios and the Probabilitistic Prediction of Bankruptcy”. 61-
80.
Shãrmâ, M. (2018, 03 01). 03_litreature review.pdf. Retrieved 02 11, 2020, from
SCRIBD: https://www.scribd.com/document/372705290/03-litreature-review-pdf
Related Documents