United Energy Demand Response Project Performance Report - Milestone 7 10.06.20 Document No. G00924 - 7

Welcome message from author
This document is posted to help you gain knowledge. Please leave a comment to let me know what you think about it! Share it to your friends and learn new things together.
Transcript

y
United Energy Demand Response Project Performance Report - Milestone 7 | 10.06.20 1
United Energy Demand Response Project Performance Report - Milestone 7
10.06.20 Document No. G00924 - 7

United Energy Demand Response Project Performance Report - Milestone 7 | 10.06.20 2
This page intentionally blank
This Activity received funding from ARENA as part of ARENA's Advancing Renewables Programme -Demand Response.
The views expressed herein are not necessarily the views of the Australian Government, and the Australian Government does not accept responsibility for any information or advice contained herein.

United Energy Demand Response Project Performance Report - Milestone 7 | 10.06.20 3
Contents
1. Summary ................................................................................................................................ 4
2. Testing Demand Response Reserve Capability ...................................................................... 5
2.1. Seventh test – 26th November 2019 ........................................................................... 5
3. Lessons Learnt from Field Works............................................................................................ 7
3.1. Over-voltage alarms generated by zone substation bus supervision relays ................. 7
3.2. Loss of ancillary power supply at zone substation....................................................... 9
3.3. Over-voltage and under-voltage warning alarms ....................................................... 10
3.4. Discrepancies on maximum transformer winding temperature readings .................... 10
3.5. High-voltage customers complaints .......................................................................... 11
3.6. Excessive number of tap changes performed by zone substation transformers ......... 12
3.7. Zone substation transformer OLTC low-tension supply isolation ............................... 13
3.8. Voltage hunting due to settings of circulating current operating mode ....................... 16
4. Impact of DVMS Operation on Life of On-Load Tap Changers .............................................. 18
5. Knowledge Sharing Activities ................................................................................................ 24
6. Glossary of Terms ................................................................................................................ 25
7. Appendix A – Maximum Oil and Winding Temperature Readings for Zone Substation Transformers ........................................................................................................................ 26
8. Appendix B – Circulating Current Operating Mode of Voltage Regulating Relays .................. 29
9. Appendix C – Modified Permissible Circulating Current and Voltage Bandwidth Settings to Minimise Hunting .................................................................................................................. 31
10. Appendix D – Monthly Tap Operations of Zone Substation Transformers Prior to and Post Implementing the DVMS ....................................................................................................... 33

United Energy Demand Response Project Performance Report - Milestone 7 | 10.06.20 4
1. Summary
This document is the United Energy Demand Response Project Performance Report for the ARENA Advancing
Renewables Programme – Demand Response programme (RB006). It fulfils an obligation under the Knowledge
Sharing Plan to provide an update on the status of the delivery of the Dynamic Voltage Management System
(DVMS) rollout project including sharing of results and lessons learnt.
This report documents the major achievements of the project since the release of the last milestone report. These
achievements include completion of:-
1) AEMO tests to confirm United Energy’s demand response reserve capability for the last period;
2) Summary of issues and their resolutions identified during installation and operation of the DVMS; and
3) Knowledge sharing activities relating to the findings of the project during the period.
To minimise duplication of content, this report should be read as a continuation of the milestone 1, 2, 3, 4, 5 and 6
reports.
Any parties interested in discussing the contents of this report directly with United Energy are encouraged to contact
United Energy at [email protected].
The milestone reports are available on United Energy’s website.

United Energy Demand Response Project Performance Report - Milestone 7 | 10.06.20 5
2. Testing Demand Response Reserve Capability
United Energy (UE) undertook a summer 2019 period demand response test with AEMO. The objectives of the
tests were to i) confirm UE’s demand response reserve capability achieves the required 30MW for RERT, and ii)
ensure the ITT (Invitation to Tender) and activation communication channels were operating correctly and acted on
within the required period of time of 30 minutes and 10 minutes, respectively.
2.1. Seventh test – 26th November 2019
AEMO called a seventh test with UE on 26th November 2019 for a 2-hour period starting 1300 market time for a
capability of 30MW.
Figure 1 shows the high-frequency sampling rate measurements of the total demand included in UE’s demand
response portfolio, before, during and after the test.
Figure 1 Test on 26th November 2019 showing demand response due to voltage reduction (2.5 hour
window)
Activation of the demand response by way of voltage reduction is evident in the time before the event start date
(1300 market time) with demand falling from 785MW at 1255 to around 755MW at 1300. Therefore, the coincident
time demand reduction achieved in the first interval is 785MW – 755MW = 30MW. Subsequent intervals also
achieved demand reductions of at least 30MW.
Deactivating the demand response was undertaken by restoring network voltages which occurred from 1500 market
time with demand rising from 745MW at 1500 to around 775MW at 1505. Therefore, the coincident time demand
reduction in the final period is 775MW – 745MW = 30MW.
In summary, high-speed SCADA measurements (presented above) provide evidence that UE delivered at least the
required 30MW of demand response capability for all half-hour periods and that the communication process to
receive and accept the ITT, and the subsequent activation of the demand response reserve capability have been
successfully demonstrated.
Figure 2 illustrates the relativity of the demand response performance to the total demand levels on the UE network
during the entire day on which the test was conducted.

United Energy Demand Response Project Performance Report - Milestone 7 | 10.06.20 6
Figure 2 Test on 26th November 2019 showing demand response due to voltage reduction (24 hour
window)

United Energy Demand Response Project Performance Report - Milestone 7 | 10.06.20 7
3. Lessons Learnt from Field Works
To implement the DVMS project, a technical scope of works was developed to upgrade (existing DR-T3 to new DR-
E3) or install new (A. Eberle REG-D) voltage regulation relays (VRRs) at all zone substations (total 47) within the
UE distribution network, and to configure the SCADA communications to achieve the DVMS functionality.
The below sections summarise the issues which were identified and rectified/being rectified during the
commissioning and operation of the DVMS at different zone substations. It should be noted that this milestone
report includes the major issues only.
3.1. Over-voltage alarms generated by zone substation bus
supervision relays
Traditionally, on hot days when the demand on the network increases, some customers in particular the ones
located at end of the low-voltage (LV) circuits receive under-voltages due to the voltage drop along the supplying
circuits. As a result, the DVMS using the feedback from all AMI meters supplied by the zone substation will send a
command to select a higher voltage set-point of the VRRs at the zone substation.
This results in selecting the highest voltage set-point by the DVMS for majority of 11kV and 6.6kV zone substations.
The highest voltage set-points, Dynamic Voltage Level 1, for 11kV and 6.6kV zone substations are set to 11.66kV
(11kV +6%) and 7.00kV (6.6 +6%), respectively.
Whenever a 11kV or 6.6kV zone substation is operating at Dynamic Voltage Level 1, bus over-voltage alarms are
likely to be triggered because of the combined effects of:
Voltage regulation bandwidth (typically 1%);
Phase unbalances (typically 0.5%);
Measurement accuracy of bus supervision relays (typically 0.5%); and
Measurement discrepancies between the two or three low-tension bus voltage transformers (VTs)
(typically 0.5%).
Hence, this caused a larger number of over-voltage alarms received during the 2018/9 summer. These nuisance
alarms caused inconvenience and confusion for the Network Control Centre (NCC) and needed to be minimised.
Proposed solution
Prior to implementing the DVMS, the over-voltage settings of bus supervision relays for 11kV and 6.6kV zone
substations were set to +6% of float voltage setting rather than +7% of the nominal voltage as summarised in Table
1.
Table 1: Over-voltage settings of bus supervision relays
Zone Substation
Prior to DVMS Post DVMS
Float Voltage
Bus
Supervision
OV Set-Point
Float Voltage
Existing
Supervision
OV Set-Point
Proposed
Supervision
OV Set-Point
Beaumaris
(BR) 11.40kV 12.08kV 11.44kV 11.77kV 12.00kV
Bentleigh
(BT) 11.65kV 12.35kV 11.44kV 11.77kV 12.00kV
Bulleen
(BU) 11.30kV 11.98kV 11.20kV 11.77kV 12.00kV

United Energy Demand Response Project Performance Report - Milestone 7 | 10.06.20 8
Zone Substation
Prior to DVMS Post DVMS
Float Voltage
Bus
Supervision
OV Set-Point
Float Voltage
Existing
Supervision
OV Set-Point
Proposed
Supervision
OV Set-Point
Burwood
(BW) 11.32kV 12.00kV 11.22kV 11.77kV 12.00kV
Caulfield
(CFD) 11.50kV 12.19kV 11.28kV 11.77kV 12.00kV
Cheltenham
(CM) 11.50kV 12.19kV 11.35kV 11.77kV 12.00kV
Elsternwick
(EL) 11.30kV 11.98kV 11.26kV 11.77kV 12.00kV
East Malvern
(EM) 11.36kV 12.04kV 11.24kV 11.77kV 12.00kV
Elwood
(EW) 11.35kV 12.03kV 11.30kV 11.77kV 12.00kV
Gardiner
(K) 11.50kV 12.19kV 11.44kV 11.77kV 12.00kV
Mentone
(M) 11.15kV 11.82kV 11.10kV 11.77kV 12.00kV
Moorabbin
(MR) 11.40kV 12.08kV 11.24kV 11.77kV 12.00kV
North Brighton
(NB) 11.50kV 12.19kV 11.44kV 11.77kV 12.00kV
Oakleigh
(OAK) 11.44kV 12.13kV 11.30kV 11.77kV 12.00kV
Oakleigh East
(OE) 11.44kV 12.13kV 11.24kV 11.77kV 12.00kV
Ormond
(OR) 11.50kV 12.19kV 11.44kV 11.77kV 12.00kV
Surrey Hills
(SH) 6.92kV 7.26kV 6.88kV 7.06kV 7.26kV
Sandringham
(SR) 11.60kV 12.30kV 11.45kV 11.77kV 12.00kV
West Doncaster
(WD) 11.50kV 12.19kV 11.35kV 11.77kV 12.00kV

United Energy Demand Response Project Performance Report - Milestone 7 | 10.06.20 9
Since the overwhelming majority of the 11kV zone substations had had voltage regulation set-points (float voltages)
greater than 11.31kV prior to the DVMS, therefore it was proposed to relax the over-voltage supervision set-point
to +9% of the nominal voltage which would be 12kV. The proposed over-voltage set-point of 12kV was no higher
than the previous values. The only exceptions were BU, EL and M zone substations, which would see slight increase
in over-voltage set-points.
For the 6.6kV zone substation (SH) it was proposed to deploy the over-voltage set-point of 7.26kV which had
previously applied to the bus supervision relays. This set-point is equal to 10% of the nominal voltage of 6.6kV.
Relaxing the over-voltage supervision set-points to +9% (for the 11kV zone substations) and 10% (for the 6.6kV
zone substation) has resulted in reducing most, if not all, the nuisance over-voltage alarms that have been received
on hot days.
3.2. Loss of ancillary power supply at zone substation
After conducting demand reduction test on North Brighton zone substation (NB), both station normal and standby
supply phase failure relays tripped due to selecting a low voltage set-point by the DVMS and the entire station
service ancillary power supplies went off supply. The first action taken for investigation of this issue was to check
the tap positions of the station services transformers and also the settings of the station normal and standby supply
phase failure relays. As a result of this investigation, it was decided to tap up both station services transformers by
one tap (2.5% = 6.25V) to increase the voltage level supplied to the station normal and standby supply phase failure
relays. However, this action did not prevent the relays from tripping when the DVMS was operating in demand
reduction mode. As the next step, the applied settings to the station normal and standby supply phase failure relays
were tested and one of the relays was found faulty which was replaced with a new one. In order to ensure operating
the DVMS in demand response mode would not cause any relays tripping, the below instructions were proposed to
be followed:
Place the analog switch for Umax[V] at 260V for both normal and standby phase failure relays;
Adjust the analog switch for Umin [%Umax] in such a way that both normal and standby phase failure
relays operate at 216V with a tolerance of ±0.5V; and
The other settings of the relays shall be remained unchanged.
Figure 3 shows the normal and standby supply phase failure relays installed at NB zone substation.
Figure 3 Normal and standby supply phase failure relays at Brighton zone substation (NB)

United Energy Demand Response Project Performance Report - Milestone 7 | 10.06.20 10
The proposed settings were successfully tested on the relays and since applying the new settings on the station
normal and standby supply phase failure relays, operating the DVMS in demand reduction mode has not caused
any issues for NB zone substation.
3.3. Over-voltage and under-voltage warning alarms
The NCC received a large number of voltage-related warning alarms for some zone substations when the DVMS
was commissioned. These alarms were triggered on percentages above nominal voltages (±5%) rather than the
previous float voltages. The warning alarms were problematic when the DVMS was switched off or operating during
high-demand periods when the voltage on the network was boosted. Therefore, it was concluded that there was no
value in using such alarms for a voltage that was well within the Victorian Electricity Distribution Code limits and the
alarms were removed from SCADA. The SCADA over/under operating alarms are still operational.
Figure 4 shows some of the over-voltage warning alarms received by a zone substation prior to removing them
from SCADA.
Figure 4 Numerous over-voltage warning alarms received post commissioning the DVMS in a UE’s zone
substation
3.4. Discrepancies on maximum transformer winding temperature
readings
After upgrading the existing DRMCC-T3 with DR-E3 relays, it was noticed that some of the maximum transformer
winding temperature readings for the zone substations did not match anymore and there was a high level of
discrepancies between the values. Further investigation revealed that some default settings were applied to the
Notes Field
Time
System Date/Time Description State Priority Type Categor
y
Originat
or
Area
False 08/08/2018 21:23:43.000 #3 22/6.6kV Trans R-W Phase Voltage 6.94 kV [In Alarm List at 08/08/2018 21:23:43] Over Warning Limit Analog Warning alarmAbnormal point dataproc Electricity
False 08/08/2018 21:20:43.146 #3 22/6.6kV Trans R-W Phase Voltage 6.94 kV Over Warning Limit Analog Warning alarmAbnormal point dataproc Electricity
False 08/08/2018 19:52:07.293 #3 22/6.6kV Trans R-W Phase Voltage 7.03 kV Over Warning Limit Analog Warning alarmAbnormal point dataproc Electricity
False 08/08/2018 19:52:05.280 #2 22/6.6kV Trans R-W Phase Voltage 7.03 kV Over Warning Limit Analog Warning alarmAbnormal point dataproc Electricity
False 08/08/2018 17:46:07.040 #3 22/6.6kV Trans R-W Phase Voltage 7.01 kV Over Warning Limit Analog Warning alarmAbnormal point dataproc Electricity
False 08/08/2018 17:45:18.518 #2 22/6.6kV Trans R-W Phase Voltage 7.00 kV Over Warning Limit Analog Warning alarmAbnormal point dataproc Electricity
False 08/08/2018 15:16:32.000 #2 22/6.6kV Trans R-W Phase Voltage 6.98 kV [In Alarm List at 08/08/2018 15:16:32] Over Warning Limit Analog Warning alarmAbnormal point dataproc Electricity
False 08/08/2018 15:13:32.408 #3 22/6.6kV Trans R-W Phase Voltage 7.00 kV Over Warning Limit Analog Warning alarmAbnormal point dataproc Electricity
False 08/08/2018 15:13:32.408 #2 22/6.6kV Trans R-W Phase Voltage 6.98 kV Over Warning Limit Analog Warning alarmAbnormal point dataproc Electricity
False 08/08/2018 14:39:48.000 #3 22/6.6kV Trans R-W Phase Voltage 6.98 kV [In Alarm List at 08/08/2018 14:39:48] Over Warning Limit Analog Warning alarmAbnormal point dataproc Electricity
False 08/08/2018 14:39:36.000 #2 22/6.6kV Trans R-W Phase Voltage 6.97 kV [In Alarm List at 08/08/2018 14:39:36] Over Warning Limit Analog Warning alarmAbnormal point dataproc Electricity
False 08/08/2018 14:36:48.614 #3 22/6.6kV Trans R-W Phase Voltage 6.98 kV Over Warning Limit Analog Warning alarmAbnormal point dataproc Electricity
False 08/08/2018 14:36:36.506 #2 22/6.6kV Trans R-W Phase Voltage 6.97 kV Over Warning Limit Analog Warning alarmAbnormal point dataproc Electricity
False 08/08/2018 12:09:04.825 #3 22/6.6kV Trans R-W Phase Voltage 7.02 kV Over Warning Limit Analog Warning alarmAbnormal point dataproc Electricity
False 08/08/2018 12:08:46.382 #2 22/6.6kV Trans R-W Phase Voltage 6.96 kV Over Warning Limit Analog Warning alarmAbnormal point dataproc Electricity
False 08/08/2018 11:06:47.927 #3 22/6.6kV Trans R-W Phase Voltage 6.97 kV Over Warning Limit Analog Warning alarmAbnormal point dataproc Electricity
False 08/08/2018 09:05:41.000 #3 22/6.6kV Trans R-W Phase Voltage 6.97 kV [In Alarm List at 08/08/2018 09:05:41] Over Warning Limit Analog Warning alarmAbnormal point dataproc Electricity
False 08/08/2018 09:05:39.000 #2 22/6.6kV Trans R-W Phase Voltage 6.95 kV [In Alarm List at 08/08/2018 09:05:39] Over Warning Limit Analog Warning alarmAbnormal point dataproc Electricity
False 08/08/2018 09:02:41.724 #3 22/6.6kV Trans R-W Phase Voltage 6.97 kV Over Warning Limit Analog Warning alarmAbnormal point dataproc Electricity
False 08/08/2018 09:02:39.711 #2 22/6.6kV Trans R-W Phase Voltage 6.95 kV Over Warning Limit Analog Warning alarmAbnormal point dataproc Electricity
False 08/08/2018 06:49:33.841 #3 22/6.6kV Trans R-W Phase Voltage 7.01 kV Over Warning Limit Analog Warning alarmAbnormal point dataproc Electricity
False 08/08/2018 06:49:33.841 #2 22/6.6kV Trans R-W Phase Voltage 7.01 kV Over Warning Limit Analog Warning alarmAbnormal point dataproc Electricity
False 08/08/2018 06:12:43.000 #2 22/6.6kV Trans R-W Phase Voltage 6.95 kV [In Alarm List at 08/08/2018 06:12:43] Over Warning Limit Analog Warning alarmAbnormal point dataproc Electricity
False 08/08/2018 06:09:43.259 #2 22/6.6kV Trans R-W Phase Voltage 6.95 kV Over Warning Limit Analog Warning alarmAbnormal point dataproc Electricity
False 08/08/2018 05:06:48.000 #2 22/6.6kV Trans R-W Phase Voltage 6.94 kV [In Alarm List at 08/08/2018 05:06:48] Over Warning Limit Analog Warning alarmAbnormal point dataproc Electricity
False 08/08/2018 05:06:46.000 #3 22/6.6kV Trans R-W Phase Voltage 6.94 kV [In Alarm List at 08/08/2018 05:06:46] Over Warning Limit Analog Warning alarmAbnormal point dataproc Electricity
False 08/08/2018 05:03:48.720 #2 22/6.6kV Trans R-W Phase Voltage 6.94 kV Over Warning Limit Analog Warning alarmAbnormal point dataproc Electricity
False 08/08/2018 05:03:46.707 #3 22/6.6kV Trans R-W Phase Voltage 6.94 kV Over Warning Limit Analog Warning alarmAbnormal point dataproc Electricity
False 07/08/2018 22:47:48.000 #2 22/6.6kV Trans R-W Phase Voltage 6.95 kV [In Alarm List at 07/08/2018 22:47:48] Over Warning Limit Analog Warning alarmAbnormal point dataproc Electricity
False 07/08/2018 22:44:48.883 #2 22/6.6kV Trans R-W Phase Voltage 6.95 kV Over Warning Limit Analog Warning alarmAbnormal point dataproc Electricity
False 07/08/2018 20:02:40.000 #2 22/6.6kV Trans R-W Phase Voltage 6.95 kV [In Alarm List at 07/08/2018 20:02:40] Over Warning Limit Analog Warning alarmAbnormal point dataproc Electricity
False 07/08/2018 19:59:40.331 #2 22/6.6kV Trans R-W Phase Voltage 6.95 kV Over Warning Limit Analog Warning alarmAbnormal point dataproc Electricity
False 07/08/2018 17:58:10.000 #2 22/6.6kV Trans R-W Phase Voltage 6.95 kV [In Alarm List at 07/08/2018 17:58:10] Over Warning Limit Analog Warning alarmAbnormal point dataproc Electricity
False 07/08/2018 17:55:10.207 #2 22/6.6kV Trans R-W Phase Voltage 6.95 kV Over Warning Limit Analog Warning alarmAbnormal point dataproc Electricity
False 07/08/2018 17:22:52.000 #2 22/6.6kV Trans R-W Phase Voltage 6.95 kV [In Alarm List at 07/08/2018 17:22:52] Over Warning Limit Analog Warning alarmAbnormal point dataproc Electricity
False 07/08/2018 17:19:52.432 #2 22/6.6kV Trans R-W Phase Voltage 6.95 kV Over Warning Limit Analog Warning alarmAbnormal point dataproc Electricity
False 07/08/2018 11:59:36.960 #2 22/6.6kV Trans R-W Phase Voltage 7.03 kV Over Warning Limit Analog Warning alarmAbnormal point dataproc Electricity
False 07/08/2018 07:11:42.758 #3 22/6.6kV Trans R-W Phase Voltage 6.99 kV Over Warning Limit Analog Warning alarmAbnormal point dataproc Electricity
False 07/08/2018 07:11:42.758 #2 22/6.6kV Trans R-W Phase Voltage 7.00 kV Over Warning Limit Analog Warning alarmAbnormal point dataproc Electricity
False 07/08/2018 06:52:24.419 #3 22/6.6kV Trans R-W Phase Voltage 6.98 kV Over Warning Limit Analog Warning alarmAbnormal point dataproc Electricity
False 07/08/2018 06:50:43.546 #2 22/6.6kV Trans R-W Phase Voltage 6.97 kV Over Warning Limit Analog Warning alarmAbnormal point dataproc Electricity
False 07/08/2018 05:13:58.000 #3 22/6.6kV Trans R-W Phase Voltage 6.97 kV [In Alarm List at 07/08/2018 05:13:58] Over Warning Limit Analog Warning alarmAbnormal point dataproc Electricity
False 07/08/2018 05:13:53.000 #2 22/6.6kV Trans R-W Phase Voltage 6.97 kV [In Alarm List at 07/08/2018 05:13:53] Over Warning Limit Analog Warning alarmAbnormal point dataproc Electricity
False 07/08/2018 05:10:58.082 #3 22/6.6kV Trans R-W Phase Voltage 6.97 kV Over Warning Limit Analog Warning alarmAbnormal point dataproc Electricity
False 07/08/2018 05:10:54.057 #2 22/6.6kV Trans R-W Phase Voltage 6.97 kV Over Warning Limit Analog Warning alarmAbnormal point dataproc Electricity
False 07/08/2018 04:42:21.422 #3 22/6.6kV Trans R-W Phase Voltage 6.97 kV Over Warning Limit Analog Warning alarmAbnormal point dataproc Electricity
False 07/08/2018 04:42:21.422 #2 22/6.6kV Trans R-W Phase Voltage 6.97 kV Over Warning Limit Analog Warning alarmAbnormal point dataproc Electricity
False 06/08/2018 22:36:41.000 #3 22/6.6kV Trans R-W Phase Voltage 6.94 kV [In Alarm List at 06/08/2018 22:36:41] Over Warning Limit Analog Warning alarmAbnormal point dataproc Electricity
False 06/08/2018 22:34:34.000 #2 22/6.6kV Trans R-W Phase Voltage 6.94 kV [In Alarm List at 06/08/2018 22:34:34] Over Warning Limit Analog Warning alarmAbnormal point dataproc Electricity

United Energy Demand Response Project Performance Report - Milestone 7 | 10.06.20 11
DR-E3 units instead of specific specifications of the transformers. Applying the transformer settings solved this
issue.
Figure 5 shows the readings for maximum oil and winding temperatures of two zone substation transformers prior
to and post implementing the DVMS. As this figure shows, there were some discrepancies after upgrading the DR-
E3 relays. All of the identified reading discrepancies were resolved.
Figure 5 Readings for maximum oil and winding temperatures of two zone substation transformers prior
to and post implementing the DVMS
The investigation outcomes on readings of maximum oil and winding temperatures for some other zone substation
transformers are given in Section 7.
3.5. High-voltage customers complaints
Part of the DVMS trial in order to study the impact of dynamically regulating the voltage, in particular under-voltages,
on high-voltage (HV) customers, all of the HV feeders supplied by Clarinda zone substation (CDA) were modelled
in PSS/SINCAL as described in the milestone #2 report. According to the modelling results, in a peak demand day
Vsp7 (the lowest dynamic voltage set-point) was the only voltage-set-point that would cause under-voltages received
by the HV customer. However, this voltage set-point is not defined for peak demand days. Therefore, it was
concluded that rolling out the proposed dynamic voltage set-points onto the UE’s zone substations would not cause
any under-voltage issues for HV customers.
However, as a result of switching the DVMS from power quality mode to demand response mode during peak
demand times, some HV customers contacted the NCC and informed UE that they received under-voltages and
consequently, their protection devices either tripped or alarms. This occurred due to lack of UE’s visibility on the
supplying voltage levels to these customers given the absence of smart meters at these sites. While the DVMS
takes the feedback from the AMI meters located adjacent to HV customers into account to generate voltage set-
points for the supplying zone substation, some investigation were undertaken to ensure such HV customers would
not receive any non-compliant voltages. After reviewing the voltage measurements captured by customers’
monitoring devices, it was found that the received voltages were within the Code limits as shown in Figure 6.

United Energy Demand Response Project Performance Report - Milestone 7 | 10.06.20 12
Figure 6 Voltage readings by HV customers’ monitoring devices during demand reduction mode of UE’s
DVMS
Therefore, it was suggested to the impacted customers to revisit their protection settings and set them to alarm only
when the voltage excursions go beyond the limits of the Victorian Electricity Distribution Code. Also, to assist those
customers, some adjustments were applied onto the network analytics platform (NAP) voltage threshold settings
(maximum and minimum). Since then, UE did not receive any customer complaints in this regard.
3.6. Excessive number of tap changes performed by zone
substation transformers
It was noticed that the number of tap changes for some zone substations increased after commissioning the new
relays under the DVMS rollout. After analysing the data, it was found that the number of tap changes did not match
with the number of recommendations from the NAP which were generated to change the voltage set-points.
Therefore, the field investigation commenced and it was revealed that this issue was on the contaminated OLTCs1
contactors for the zone substations at which the VRRs have been replaced with A. Eberle REG-D units.
Some of these zone substations also received a large number of OLTC master control failed alarms. After analysing
the relay logs, it was concluded that there was no general design issue and most likely the root cause of this issue
would be the contaminated contacts of the tap changers. The initial plan was to clean the contacts of the OLTCs
and monitor the results over a couple of weeks. This solution improved the situation and no or few number of OLTC
master control failed alarms received after completing the maintenance. However, after a few weeks these alarms
were raised again and also the number of tap changes were increased significantly.
Whilst the root cause could be traced to dirty wiper contacts at the OLTC to position resistance chain, it was noted
that prior to installing A. Eberle REG-D relays, in many of the old VRR arrangements, a TPT-194 transducer was
used to convert tap position resistance into 4-20mA used by the OLTC RTU2.
One option of the TPT-194 was a 3-wire connection to the tap position resistor chain that had been the connection
arrangement previously used at the question zone substations. This was in contrast to the recommended A. Eberle
REG-D connection, where all possible connections only used two of the three terminals at the resistance chain.
Another potential issue with the A. Eberle REG-D relay was that the output voltage was limited to 10V max, whereas
the TPT-194 output voltage was 20V max or 50V max (depending on option chosen).
Therefore, it was proposed to trial the 3-wire connection of the TPT-194 at Sandringham zone substation (SR) in
order to prove that this arrangement would give resultant measured voltage which was largely unaffected by the
presence of wiper contact resistance. This transducer is shown in Figure 7.
1 OLTC = On-Load Tap Changer. 2 RTU = Remote Terminal Unit.

United Energy Demand Response Project Performance Report - Milestone 7 | 10.06.20 13
Figure 7 Tap position transducer proposed for zone substation with A. Eberle REG-D voltage-regulating
relays installed
After trialling this arrangement, it was observed that the issues at SR zone substation were resolved. As a result, it
is planned to implement this arrangement on the zone substations that experience excessive number of tap changes
and also OLTC master control failed alarms.
Therefore, the following works have been proposed to address these issues:
Upgrade the transformer tap position circuit via a transducer upgrade on the power transformers across
the zone substations managed by the A. Eberle REG-D VRRs.
The transducer needs to be A.P.C.S. type with the exact model to be selected by Service Provider as part
of detailed design. Where a different transducer type is required, the Service Provider shall propose an
alternative and seek endorsement from UE prior to proceeding with procurement and finalisation of the
design. The upgraded tap position indicator (TPI) circuit shall be immune from electrical noise and not be
susceptible to indicating incorrect/spurious/phantom/erroneous tap positions.
It is expected that by completing the above works, the numerous ‘phantom’ OLTC operations which in turn has
flooded the NCC with ‘out of step’ and ‘master control fail’ alarms as well as driving unnecessary tap changes on
the parallel transformers will be mitigated. These issues are generating costly fault callouts, more frequent
maintenance of OLTC equipment as well as potentially limiting our ability to participate in the RERT events.
3.7. Zone substation transformer OLTC low-tension supply
isolation
As part of the DVMS rollout project, majority of the zone substations which utilised legacy MD3311 OLTC RTU for
low-tension bus voltage regulation were upgraded to a voltage regulation scheme based on A. Eberle REG-D relays.
In the previous MD3311-based voltage regulation scheme, an OLTC isolation switch was provided on the OLTC
control panel in the control room for each transformer for the purposes of isolating the 400VAC and 230VAC supply
into the OLTC mechanism box. The tap-change-in-progress (TCIP) contact in the OLTC mechanism box was wetted
with AC supply. The OLTC isolation switch allowed the OLTC mechanism box to be safely isolated for maintenance
works. The tap position resistor circuit was supplied at 20VDC or 50VDC (depending on the zone substation) and
it was not isolated by the OLTC isolation switch. Figure 8 shows the OLTC isolation switches which were used by
the legacy MD3311 OLTC RTUs.

United Energy Demand Response Project Performance Report - Milestone 7 | 10.06.20 14
Figure 8 OLTC isolation switches utilised by legacy MD3311 OLTC RTUs
In the new A. Eberle REG-D-based voltage regulation scheme, an OLTC isolation switch is no longer provided.
However, all 400VAC and 230VAC supply in the OLTC mechanism box can still be isolated via dedicated miniature
circuit breakers (MCBs) either in the VRR cubicle or at the main 400VAC board. The TCIP contact is now wetted
by the 110V or 240V station DC supply.
For safe isolation of the OLTC mechanism box, the agreed interim solution was to switch off the 110V/240 VDC
MCB supplying the A. Eberle REG-D relay, which would also remove the DC wetting supply on the TCIP contact.
Until the permanent solution is implemented, this interim procedure will be followed.
A consequence of switching off the supply to the A. Eberle relay was that other A. Eberle relays in the zone
substation would switch from automatic to manual voltage regulation mode as they would see the A. Eberle REG-
D relay was no longer communicating (i.e. ELAN error). This means that UE NCC would have to perform manual
voltage control for other transformers still in service whilst maintenance was being carried out on one transformer.

United Energy Demand Response Project Performance Report - Milestone 7 | 10.06.20 15
This issue as well the ones described in Section 3.6 were costly to manage and could introduce risk of transformer
failure as alarms and operations were less reliable and may be ignored. Therefore, UE has proposed to arrest these
issues as far as reasonably practicable (AFAP) to ensure UE meets its regulatory obligations in the best interest of
the business and customers. Therefore, the below works have been proposed for implementation:
Installation of dedicated MCBs to provide a practical and safe means of VRR OLTC equipment DC circuit
isolation issue for the impacted power transformer:
MCBs shall be selected for DC voltage and suitably rated for the application.
MCBs shall be graded with upstream circuit protection (either MCB or fuse).
For applications with the A. Eberle REG-D VRR, the MCB shall be located within the protection
panel in the zone substation control room.
For applications with the Dynamic Ratings DR-E3 VRR (where required), the MCB shall be
located within the protection cubicle mounted on the transformer.
Alternative locations for the new MCB may be required on a case by case basis but shall be
discussed as part of the single-line diagram (SID) process and COM3 review so as to ensure the
intended requirements are met and all stakeholders are satisfied.
Installation of dedicated panel mounted ‘CB maintenance’ switches to provide a simple and safe means
for fitters and operators to isolate the circuit breaker status changes from the VRR scheme during circuit
breaker maintenance. These switches are required at all zone substations on transformer incomer and
bus-tie circuit breakers:
Switches shall be suitably rated for the application.
The switch shall be Santon type with the exact model to be selected by Service Provider as part
of the detailed design process. Where a different switch type is proposed, the Service Provider
shall seek endorsement from UE prior to proceeding with procurement and finalisation of the
design.
For applications with the A. Eberle REG-D VRR, the switches shall be located on the protection
panel in the zone substation control room.
For applications with the Dynamic Ratings DR-E3 VRR (where required), the switches shall be
located within the protection cubicle mounted on the transformer.
Alternative locations for the new switches may be identified or deem more suitable on a case by
case basis but shall be discussed as part of the SID process and COM review so as to ensure
the intended requirements are met and all stakeholders are satisfied.
The status of these new switches shall not be provided to the NCC via SCADA.
Each new switch shall be labelled ‘XXX CB Maintenance’ where XXX shall be the circuit breaker
designation, for example ‘#1 TR 22kV’, ‘1-2 22kV BT’, etc.
A training package shall be developed by the Service Provider and presented to UE’s incumbent
faults/maintenance contractor such that fitters, operators, testers and other personnel understand the
purpose and correct operation of the new MCBs and switches. Any relevant field procedures shall be
updated.
A similar awareness package shall be developed by the Service Provider and presented to UE’s NCC and
Asset Management staff.
The proposed MCB for OLTC isolation switch is shown in Figure 9.
3 COM = Constructability, Operability & Maintainability.

United Energy Demand Response Project Performance Report - Milestone 7 | 10.06.20 16
Figure 9 A miniature circuit breaker used as an OLTC isolation switch
3.8. Voltage hunting due to settings of circulating current operating
mode
Further investigation on the excessive number of zone substation transformer tap changes revealed that the inverse
time curve applied to the A. Eberle REG-D relays using circulating current mode was not well-suited (too fast) as
shown in Figure 10. This operating mode is described in Section 8.
Figure 10 Excessive number of tap changes due to fast inverse time curve of circulating current operating
mode of voltage regulating relays
After preliminary investigation, the project team decided to trial a slower curve at 4 zone substations. The trial
outcomes confirmed reducing the frequency of tap changes as shown in Figure 11.

United Energy Demand Response Project Performance Report - Milestone 7 | 10.06.20 17
Figure 11 Reduced number of tap changes post applying slower inverse time curve onto voltage
regulating relays operating in circulating current mode
Therefore, the new slow curve was implemented onto additional zone substations that were using circulating current
mode. The modified settings for one of the transformers are given in detail in Section 9.
United Energy Demand Response Project Performance Report - Milestone 7 | 10.06.20 18
4. Impact of DVMS Operation on Life of On-Load Tap
Changers
This section of the report evaluates the impact of dynamic voltage regulation on the lifetime of zone substation
transformer OLTCs. In order to conduct this evaluation, the numbers of tap operations prior to (CY2017) and post
(CY2019) implementation of the DVMS technology are taken into consideration.
Table 2 summarises the average daily number of tap operations for different zone substations in the 2017 and 2019
calendar years. The average daily numbers of tap operations for different months of these two years are given in
Section 10.
Table 2: Average daily number of zone substation transformer tap changes prior to and post implementing the DVMS
ZSS CY2017 CY2019 Change Rate
Beaumaris (BR) 10 11 7%
Bentleigh (BT) 11 11 2%
Box Hill (BH) 17 13 -26%
Bulleen (BU) 6 10 54%
BW (BW) 10 9 -13%
Carrum (CRM) 10 15 60%
Caulfield (CFD) 11 11 1%
Cheltenham (CM) 11 14 27%
Clarinda (CDA) 12 13 10%
Dandenong (DN) 12 19 55%
Dandenong South (DSH) 14 22 54%
Dandenong Valley (DVY) 11 17 51%
Doncaster (DC) 9 23 165%
Dromana (DMA) 13 14 3%
East Burwood (EB) 13 20 54%
East Malvern (EM) 11 9 -15%
Elsternwick (EL) N/A 9 N/A
Elwood (EW) 12 11 -7%
Frankston (FTN) 15 15 0%

United Energy Demand Response Project Performance Report - Milestone 7 | 10.06.20 19
ZSS CY2017 CY2019 Change Rate
Frankston South (FSH) 7 12 59%
Gardiner (K) 13 12 -9%
Glen Waverley (GW) 13 20 52%
Hastings (HGS) 10 17 74%
Heatherton (HT) 11 19 76%
Keysborough (KBH) 13 10 -20%
Langwarrin (LWN) 13 21 61%
Lyndale (LD) 16 18 13%
Mentone (M) 20 16 -20%
Moorabbin (MR) 17 19 15%
Mordialloc (MC) 15 10 -30%
Mornington (MTN) 14 32 132%
Mulgrave (MGE) 14 10 -27%
Noble Park (NP) 12 14 20%
North Brighton (NB) 12 22 76%
Notting Hill (NO) 10 11 5%
Nunawading (NW) 11 21 93%
Oakleigh (OAK) 10 19 82%
Oakleigh East (OE) N/A 35 N/A
Ormond (OR) 10 15 55%
Rosebud (RBD) 20 17 -13%
Sandringham (SR) 10 21 99%
Sorrento (STO) 13 13 -2%
Springvale (SV) 11 18 56%
Springvale South (SS) 11 13 25%
Springvale West (SVW) 15 19 24%

United Energy Demand Response Project Performance Report - Milestone 7 | 10.06.20 20
ZSS CY2017 CY2019 Change Rate
Surrey Hills (SH) 10 10 0%
West Doncaster (WD) 8 24 208%
AVERAGE 12 16 32%
According to Table 2, operation of the DVMS has resulted in additional tap operations by an average of 32%. This
is mainly due to the impact of solar PV systems during day times at which the DVMS needs to change the voltage
set-points at zone substations. The average daily tap operations are also demonstrated in a graphical format in
Figure 12.
Figure 12 Average daily number of zone substation transformer tap changes prior to and post
implementing the DVMS
It should be noted that UE is still resolving some of the issues related to the excessive number of tap changes and
this has impacted the figures demonstrated in section.
In order to calculate the maintenance costs associated with additional number of tap changes due to the DVMS
operation, the below assumptions are taken into consideration here. It should be noted that the below assessment
is a high-level analysis and more detailed investigations need to be conducted to estimate the cost associated with
the DVMS operation.
Average number of tap changes for a zone substation transformer (without DVMS in service):
25,000 per 4 years = > 6,250 (25,000/4) per year = > 17 (6,250/365) per day.
Service cost associated with OLTC operation:
$20,000 per 4 years = > $5,000 ($20,000/4) per year = > $14 ($5,000/365) per day.
Maintenance cost for each tap operation:
$0.80 ($14/17).
Cost to replace a zone substation transformer4:
$2.2m.
Total number of tap changes for a zone substation transformer over its lifetime (without DVMS in service):
4 NPV is not considered here.

United Energy Demand Response Project Performance Report - Milestone 7 | 10.06.20 21
500,000.
Number of services for a zone substation transformer over its lifetime:
20 (500,000/25,000).
Cost of each tap operation for a zone substation transformer over its lifetime:
$4.40 ($2.2m/500,000).
Total cost estimated for each additional tap operation:
$5.20 ($0.80+$4.40).
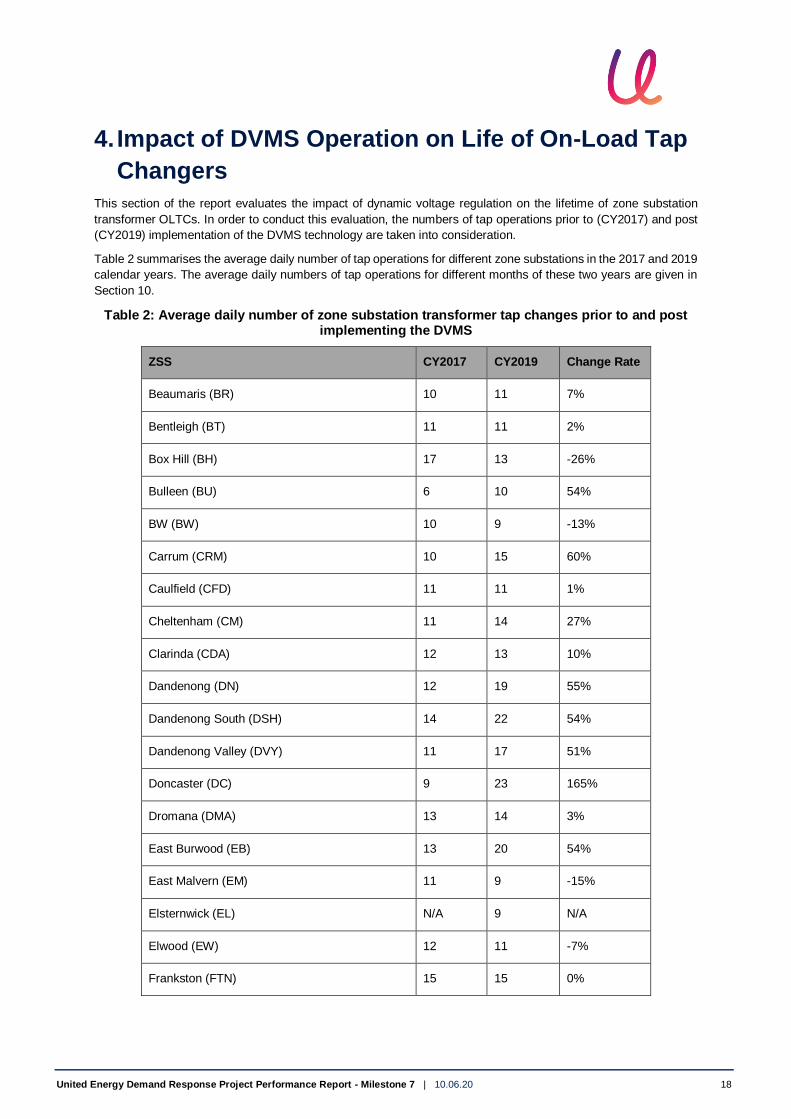
Table 3 summarises the financial impact of the DVMS technology on zone substation transformers.
Table 3: Estimated financial impact of DVMS operation on zone substation transformers
ZSS CY2017 CY2019 Estimated Additional Cost
Beaumaris (BR) 10 11 $1,898
Bentleigh (BT) 11 11 $0
Box Hill (BH) 17 13 -$7,592
Bulleen (BU) 6 10 $7,592
BW (BW) 10 9 -$1,898
Carrum (CRM) 10 15 $9,490
Caulfield (CFD) 11 11 $0
Cheltenham (CM) 11 14 $5,694
Clarinda (CDA) 12 13 $1,898
Dandenong (DN) 12 19 $13,286
Dandenong South (DSH) 14 22 $15,184
Dandenong Valley (DVY) 11 17 $11,388
Doncaster (DC) 9 23 $26,572
Dromana (DMA) 13 14 $1,898
East Burwood (EB) 13 20 $13,286
East Malvern (EM) 11 9 -$3,796
Elsternwick (EL) N/A 9 N/A
Elwood (EW) 12 11 -$1,898
Frankston (FTN) 15 15 $0
Frankston South (FSH) 7 12 $9,490
United Energy Demand Response Project Performance Report - Milestone 7 | 10.06.20 22
ZSS CY2017 CY2019 Estimated Additional Cost
Gardiner (K) 13 12 -$1,898
Glen Waverley (GW) 13 20 $13,286
Hastings (HGS) 10 17 $13,286
Heatherton (HT) 11 19 $15,184
Keysborough (KBH) 13 10 -$5,694
Langwarrin (LWN) 13 21 $15,184
Lyndale (LD) 16 18 $3,796
Mentone (M) 20 16 -$7,592
Moorabbin (MR) 17 19 $3,796
Mordialloc (MC) 15 10 -$9,490
Mornington (MTN) 14 32 $34,164
Mulgrave (MGE) 14 10 -$7,592
Noble Park (NP) 12 14 $3,796
North Brighton (NB) 12 22 $18,980
Notting Hill (NO) 10 11 $1,898
Nunawading (NW) 11 21 $18,980
Oakleigh (OAK) 10 19 $17,082
Oakleigh East (OE) N/A 35 N/A
Ormond (OR) 10 15 $9,490
Rosebud (RBD) 20 17 -$5,694
Sandringham (SR) 10 21 $20,878
Sorrento (STO) 13 13 $0
Springvale (SV) 11 18 $13,286
Springvale South (SS) 11 13 $3,796
Springvale West (SVW) 15 19 $7,592
Surrey Hills (SH) 10 10 $0

United Energy Demand Response Project Performance Report - Milestone 7 | 10.06.20 23
ZSS CY2017 CY2019 Estimated Additional Cost
West Doncaster (WD) 8 24 $30,368
TOTAL 199,655 275,210 $309,374
According to Table 3, an additional annual cost of $310k is estimated due to operating the DVMS. It should be
noted that a number of factors contribute to this additional cost such as the age and type of OLTCs. For example,
the associated tap operation cost for a transformer built in 1960 will be higher than that for a 2020 zone substation
transformer.

United Energy Demand Response Project Performance Report - Milestone 7 | 10.06.20 24
5. Knowledge Sharing Activities
Since the last milestone report, UE has participated in the following events and shared the learnings of this project
with the broader industry:
ARENA Insights Forum in Melbourne on 21st November 2019.
ARENA Year 2 Programme for DVMS Demand Response Workshop between Oakley Greenwood and UE
on 17th January 2020.
CitiPower/Powercor and UE Future Network Workshop – Enable a Network that Meets Customer’s Needs
on 6th March 2020.
ARENA Demand Response Post-Summer Roundtable on 25th March 2020.
Updated the knowledge sharing webpage on the UE website for the purposes of sharing our project
performance reports and provided input into the ARENA knowledge sharing insights website content.

United Energy Demand Response Project Performance Report - Milestone 7 | 10.06.20 25
6. Glossary of Terms
The following terms are referenced within this document:
Term Description
AEMO Australian Energy Market Operator
AMI Advanced Metering Infrastructure (Smart Meters)
ARENA Australian Renewable Energy Agency
DR Demand Response
DVMS Dynamic Voltage Management System
HV High Voltage
LV Low Voltage
MW Mega Watt
NAP Network Analytics Platform
NCC Network Control Centre
NEM National Electricity Market
OLTC On-Load Tap Changer
PV Photo-voltaic
RERT Reliability and Emergency Reserve Trader
RMIT Royal Melbourne Institute of Technology
SCADA Supervisory Control and Data Acquisition
UE United Energy
VRR Voltage Regulating Relay

United Energy Demand Response Project Performance Report - Milestone 7 | 10.06.20 26
7. Appendix A – Maximum Oil and Winding
Temperature Readings for Zone Substation
Transformers
Dandenong Zone Substation (DN) – Transformer #1
Langwarrin Zone Substation (LWN) – Transformer #3

United Energy Demand Response Project Performance Report - Milestone 7 | 10.06.20 27
Springvale South Zone Substation (SS) – Transformer #1
West Doncaster Zone Substation (WD) – Transformer #2 and #3

United Energy Demand Response Project Performance Report - Milestone 7 | 10.06.20 28
Noble Park Zone Substation (NP) – Transformer #2

United Energy Demand Response Project Performance Report - Milestone 7 | 10.06.20 29
8. Appendix B – Circulating Current Operating Mode
of Voltage Regulating Relays
The zone substation transformers are configured to operate in parallel via circulating current (∆ISinφ) method.
Circulating current method of parallel control of transformers allows OLTCs to independently tap, adjusting the
output voltage and minimising the circulating current (ICIRC) in the parallel group.
The parallel scheme is achieved in the REG-D relays by use of the E-LAN communications between the REG-D’s
and the Paragramer function as shown below:
The Paragramer function monitors the status of the circuit breakers and bus ties to determine which transformers
are connected in parallel. Transformers that are not in parallel will be in independent mode. It should be noted that
within a circulating current parallel group, individual transformers can be on different taps – this is not a problem!
REG-D ∆ISinφ settings are:
Transformer group list for all units on the parallel program;
Permissible Icirc;
Parallel program activation;
Number of transformers; and
Permissible difference of taps.
In order to have the circulating current operating mode performing correctly, the below considerations need to be
taken into account:
All regulators must have the same firmware to ensure correct parallel functionality.
E-LAN connection between all regulators must be established for communications across the ELAN.

United Energy Demand Response Project Performance Report - Milestone 7 | 10.06.20 30
Paragramer feature must be enabled in the REG-D to show the transformers single-line diagram on the
display.
REG-D relays must be added to the group list to ensure regulators function correctly in parallel scheme.
Logbook will give indication of time stamped events such as PG_CB (incomer circuit breaker) status which
are useful for diagnostic/fault finding conditions.
Ensure the current transformer (CT) inputs have the correct polarity (which can show the correct value of
circulating current).

United Energy Demand Response Project Performance Report - Milestone 7 | 10.06.20 31
9. Appendix C – Modified Permissible Circulating
Current and Voltage Bandwidth Settings to
Minimise Hunting
Parameter Configuration/Setting Details
System/Device
Parameter Perm. Icirc set to 67A
Station ID: A: for #1 Transformer
Device Name: TRANS1 for #1 Transformer.
Basic Values/Basic
Set-Point Value:
1: Reference Voltage = Vfloat = 22.30kV = 111.5Vs
2: Voltage Reduction for Emergency Stage 1 = 3% of Vfloat = 22.30kV x 0.97 =
21.63kV = 108.155Vs
3: Voltage Reduction for Emergency Stage 2 = 5% of Vfloat = 22.30kV x 0.95 =
21.19kV = 105.925Vs
Time Behaviour:
Time Program: 00:INTEGRAL
Time Factor: 2.3
Bandwidth: 2.2% (0.88 x %TAP) – Note: %TAP = 2.5% (Raise = 109.05Vs, Lower =
113.95Vs)
This will provide a delay of 69s @ 2.2% Deviation, 38s @ 4% Deviation, 25.3s @
6% Deviation, 15.2s @10% Deviation.
Parallel Operation
Program: 01:dI x sin(φ)
Group List: Member-01:A (#1 Trans)
Group List: Member-02:B (#2 Trans)
Group List: Member-03:C (#3 Trans)
Program-Activation: 3 Transformer (3 Transformers in Group).
Current Influence Way of Current Influence: None
Tap Changer
Maximum Time TC in Operation: 15 sec
Inverse Tap Changer: No
Tap Limiter: Minimum Tap Position = 1; Maximum Tap Position = 9
Tap Limiter: 00:OFF.
CT/VT Configuration
Voltage: 00:L1L2 (Red-White Phase Volts)
VTR: 200 (22kV/110V)
Current: 00:L2 (White Phase Current)
CTR: 120 (600/5)

United Energy Demand Response Project Performance Report - Milestone 7 | 10.06.20 32
Parameter Configuration/Setting Details
Nominal Current Value: 5A.
Functions U-Nominal = 110V
Block: 00:OFF.
Limits
Inhibit High: 126.5V = 115% = 25.3kV (Prevents all tapping)
Over-Voltage: 10% = 22 x 1.1 = 24.2kV(Prevents Tap Up)
Under-Voltage: -10% = 22 x 0.9 = 19.8kV(Prevents Tap Down)
Inhibit Low: -15% = 22 x 0.85 = 18.7kV(Prevents all tapping)
Overcurrent: 210% = 600A x 2.1 = 1260A
Time Delays
Inhibit High: 2 sec
Over-Voltage: 0 sec
Under-Voltage: 0 sec
Inhibit Low: 2 sec
Overcurrent: 0 sec.
Dynamic Voltage Set-Point
Levels (To be set in H-
Code)
Dynamic Voltage Level 1 - 1.06pu = 116.6Vs = 23.32kV
Dynamic Voltage Level 2 - 1.04pu = 114.4Vs = 22.88kV
Dynamic Voltage Level 3 - 1.02pu = 112.2Vs = 22.44kV
Dynamic Voltage Level 4 - 1.00pu = 110.0Vs = 22.00kV
Dynamic Voltage Level 5 - 0.98pu = 107.8Vs = 21.56kV
Dynamic Voltage Level 6 - 0.96pu = 105.6Vs = 21.12kV
Dynamic Voltage Level 7 - 0.94pu = 103.4Vs = 20.68kV
Dynamic Voltage Level Timeout = 30 min.
Designer Comments
Perm Icirc changed from 50A to 67A
Bandwidth changed from 2% to 2.2%
To maintain the same inverse time curve, Time Factor changed from 2.5 to
T1/30/BW = 150/30/2.2 = 2.3 for 2.2% bandwidth.
United Energy Demand Response Project Performance Report - Milestone 7 | 10.06.20 33
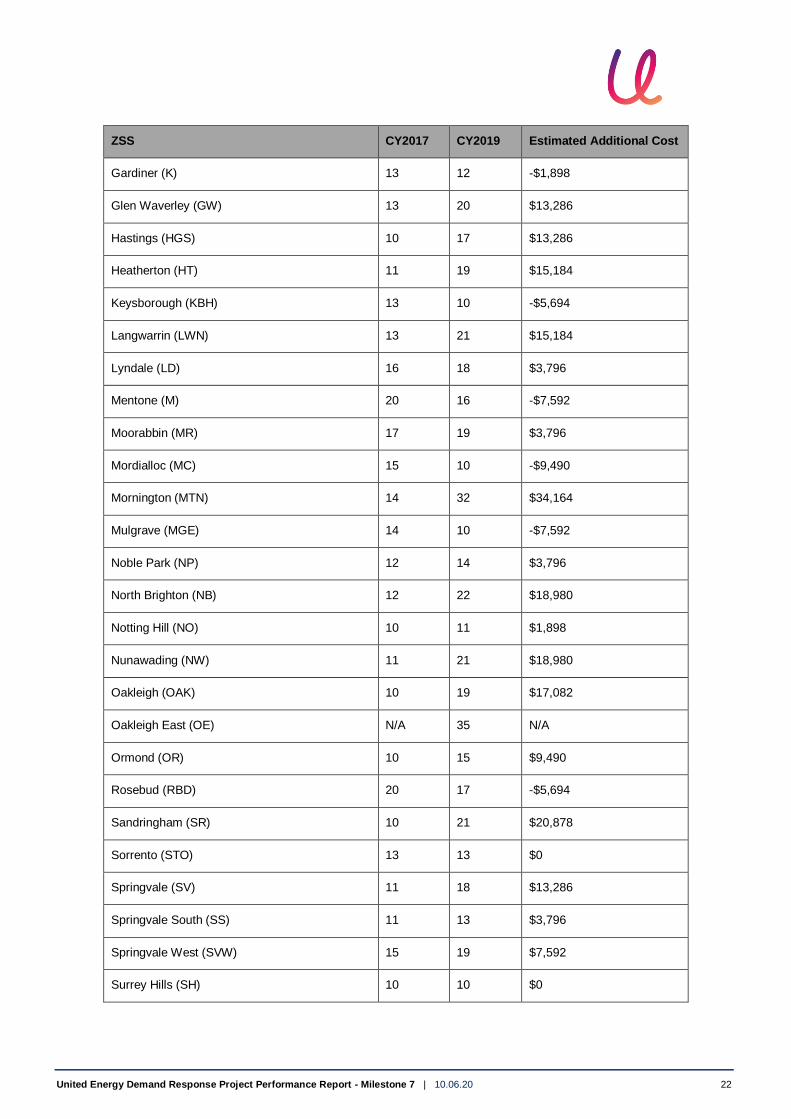
10. Appendix D – Monthly Tap Operations of Zone
Substation Transformers Prior to and Post
Implementing the DVMS
Table 4: Average daily numbers of zone substation transformer tap changes in CY2017 (prior to implementing the DVMS)
ZSS Jan Feb Mar Apr May Jun Jul Aug Sep Oct Nov Dec
BR 11 14 12 7 10 11 12 10 9 8 11 9
BT 12 14 12 7 11 12 12 12 9 8 10 8
BH 20 25 22 11 16 17 14 19 18 16 18 14
BU 7 10 9 4 4 6 7 7 6 5 6 5
BW 12 11 12 7 8 8 9 12 12 11 11 11
CRM 9 10 10 8 10 11 11 10 10 6 11 9
CFD 17 16 14 9 14 13 12 5 9 8 10 9
CM 13 15 13 7 10 11 10 10 9 10 11 10
CDA 13 13 14 9 11 16 10 10 10 9 12 12
DN 12 16 14 9 11 11 12 12 11 12 15 12
DSH 9 12 11 8 8 8 7 8 20 18 39 22
DVY 8 12 12 11 11 9 14 12 10 11 12 10
DC 9 11 11 5 8 9 12 12 9 7 8 6
DMA 13 15 14 10 12 16 16 15 14 10 13 11
EB 19 17 14 8 12 13 14 11 11 10 14 11
EM 14 13 12 7 9 10 9 11 11 12 11 12
EL N/A N/A N/A N/A N/A N/A N/A N/A N/A N/A N/A N/A
EW 12 15 14 9 9 12 13 10 10 10 14 11
FTN 14 18 18 11 15 18 19 16 15 11 16 13
FSH 8 8 8 5 7 8 10 8 8 6 7 6
K 16 20 19 10 11 12 13 11 12 10 14 13

United Energy Demand Response Project Performance Report - Milestone 7 | 10.06.20 34
ZSS Jan Feb Mar Apr May Jun Jul Aug Sep Oct Nov Dec
GW 17 17 14 9 12 14 14 13 12 11 14 11
HGS 10 10 11 7 8 10 12 11 10 8 9 8
HT 12 16 12 7 11 11 11 10 9 9 11 9
KBH 13 16 14 10 12 13 14 13 12 11 13 10
LWN 12 14 15 10 13 16 16 15 14 8 14 11
LD 16 15 14 13 15 15 18 16 16 16 18 16
M 22 20 16 14 15 16 27 26 18 16 31 25
MR 16 22 19 12 17 19 19 19 15 13 18 14
MC 18 20 15 12 14 15 15 14 13 13 15 13
MTN 13 13 14 10 13 17 18 16 15 10 14 13
MGE 12 17 16 10 12 15 16 14 15 13 14 12
NP 14 16 15 10 10 13 11 11 10 9 12 10
NB 11 16 14 14 10 14 13 13 11 9 14 10
NO 14 13 12 6 8 9 10 10 9 9 12 10
NW 13 15 14 8 9 10 9 11 12 11 11 10
OAK 14 12 11 7 8 10 9 11 10 11 12 11
OE N/A N/A N/A N/A N/A N/A N/A N/A N/A N/A N/A N/A
OR 12 11 11 7 8 9 8 9 10 11 11 11
RBD 22 22 20 16 20 20 23 20 21 17 21 20
SR 12 14 12 7 10 11 12 11 9 8 11 8
STO 20 20 19 14 14 14 12 10 10 8 9 7
SV 13 15 14 9 9 13 11 10 9 9 11 12
SS 12 15 14 9 10 11 10 9 9 9 11 9
SVW 16 20 20 12 13 16 14 14 14 13 18 15
SH 11 10 10 8 8 11 10 10 11 9 9 10
WD 7 11 7 4 7 8 9 10 9 10 7 6
United Energy Demand Response Project Performance Report - Milestone 7 | 10.06.20 35
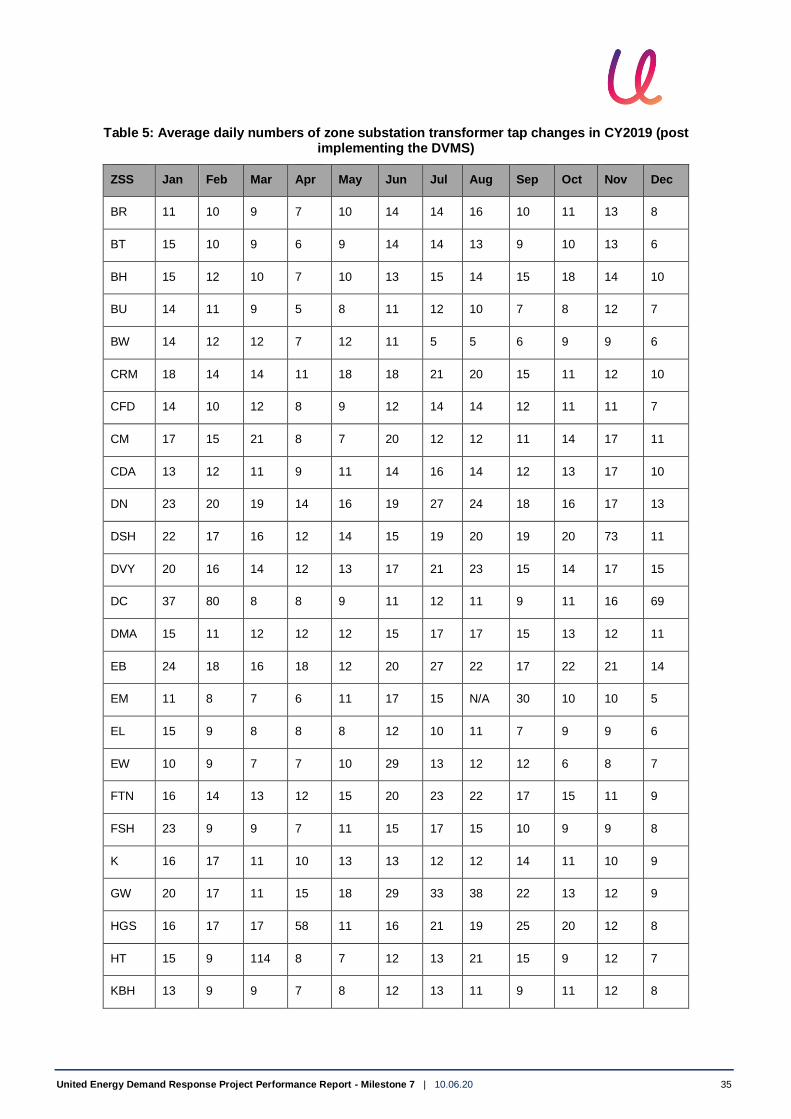
Table 5: Average daily numbers of zone substation transformer tap changes in CY2019 (post implementing the DVMS)
ZSS Jan Feb Mar Apr May Jun Jul Aug Sep Oct Nov Dec
BR 11 10 9 7 10 14 14 16 10 11 13 8
BT 15 10 9 6 9 14 14 13 9 10 13 6
BH 15 12 10 7 10 13 15 14 15 18 14 10
BU 14 11 9 5 8 11 12 10 7 8 12 7
BW 14 12 12 7 12 11 5 5 6 9 9 6
CRM 18 14 14 11 18 18 21 20 15 11 12 10
CFD 14 10 12 8 9 12 14 14 12 11 11 7
CM 17 15 21 8 7 20 12 12 11 14 17 11
CDA 13 12 11 9 11 14 16 14 12 13 17 10
DN 23 20 19 14 16 19 27 24 18 16 17 13
DSH 22 17 16 12 14 15 19 20 19 20 73 11
DVY 20 16 14 12 13 17 21 23 15 14 17 15
DC 37 80 8 8 9 11 12 11 9 11 16 69
DMA 15 11 12 12 12 15 17 17 15 13 12 11
EB 24 18 16 18 12 20 27 22 17 22 21 14
EM 11 8 7 6 11 17 15 N/A 30 10 10 5
EL 15 9 8 8 8 12 10 11 7 9 9 6
EW 10 9 7 7 10 29 13 12 12 6 8 7
FTN 16 14 13 12 15 20 23 22 17 15 11 9
FSH 23 9 9 7 11 15 17 15 10 9 9 8
K 16 17 11 10 13 13 12 12 14 11 10 9
GW 20 17 11 15 18 29 33 38 22 13 12 9
HGS 16 17 17 58 11 16 21 19 25 20 12 8
HT 15 9 114 8 7 12 13 21 15 9 12 7
KBH 13 9 9 7 8 12 13 11 9 11 12 8

United Energy Demand Response Project Performance Report - Milestone 7 | 10.06.20 36
ZSS Jan Feb Mar Apr May Jun Jul Aug Sep Oct Nov Dec
LWN 25 19 19 15 20 26 31 28 21 18 18 15
LD 20 15 15 13 13 18 29 26 17 17 16 13
M 21 17 15 13 12 19 21 18 13 17 19 12
MR 22 18 15 13 17 23 26 24 17 19 23 14
MC 13 10 12 8 9 11 11 11 10 11 11 7
MTN 29 22 22 31 37 37 55 41 30 29 31 19
MGE 11 8 9 6 8 11 17 16 11 10 8 7
NP 32 10 9 7 16 15 16 12 11 12 15 11
NB 27 21 20 17 22 23 23 24 19 24 24 17
NO 18 12 10 9 9 10 12 12 8 11 10 8
NW 25 22 20 14 20 25 26 24 20 21 22 15
OAK 28 22 20 14 15 19 22 22 17 20 19 14
OE N/A N/A N/A N/A 2 15 20 18 9 146 14 17
OR 13 25 25 7 14 16 26 14 8 10 11 10
RBD 18 14 15 13 16 24 26 24 18 16 14 12
SR 17 108 16 8 9 13 15 18 15 17 13 7
STO 14 9 12 10 12 15 18 18 14 11 10 9
SV 19 15 14 13 17 20 24 18 15 20 22 14
SS 15 11 8 8 10 13 13 10 13 17 25 16
SVW 23 17 16 14 16 21 23 26 15 20 23 15
SH 25 9 6 5 5 10 10 9 4 6 12 11
WD 17 10 10 10 28 75 89 11 9 10 10 9
Related Documents