© 2013 International Monetary Fund July 2013 IMF Country Report No. 13/240 July 29, 2012 January 29, 2001 January 29, 2001 January 29, 2001 January 29, 2001 United Arab Emirates: Selected Issues This paper on the United Arab Emirates was prepared by a staff team of the International Monetary Fund as background documentation for the periodic consultation with the member country. It is based on the information available at the time it was completed on June 27, 2013. The views expressed in this document are those of the staff team and do not necessarily reflect the views of the government of the United Arab Emirates or the Executive Board of the IMF. The policy of publication of staff reports and other documents by the IMF allows for the deletion of market-sensitive information. Copies of this report are available to the public from International Monetary Fund Publication Services 700 19 th Street, N.W. Washington, D.C. 20431 Telephone: (202) 623-7430 Telefax: (202) 623-7201 E-mail: [email protected] Internet: http://www.imf.org International Monetary Fund Washington, D.C.

Welcome message from author
This document is posted to help you gain knowledge. Please leave a comment to let me know what you think about it! Share it to your friends and learn new things together.
Transcript
© 2013 International Monetary Fund July 2013 IMF Country Report No. 13/240
July 29, 2012 January 29, 2001 January 29, 2001 January 29, 2001 January 29, 2001
United Arab Emirates: Selected Issues This paper on the United Arab Emirates was prepared by a staff team of the International Monetary Fund as background documentation for the periodic consultation with the member country. It is based on the information available at the time it was completed on June 27, 2013. The views expressed in this document are those of the staff team and do not necessarily reflect the views of the government of the United Arab Emirates or the Executive Board of the IMF. The policy of publication of staff reports and other documents by the IMF allows for the deletion of market-sensitive information.
Copies of this report are available to the public from
International Monetary Fund Publication Services 700 19th Street, N.W. Washington, D.C. 20431
Telephone: (202) 623-7430 Telefax: (202) 623-7201 E-mail: [email protected] Internet: http://www.imf.org
International Monetary Fund
Washington, D.C.

UNITED ARAB EMIRATES SELECTED ISSUES AND STATISTICAL APPENDIX Approved By Alfred Kammer
Prepared By Zsofia Arvai, Ananthakrishnan Prasad, Kentaro Katayama, Ozgur Demirkol, and Cornelius Fleischhaker, all Middle East and Central Asia Department
CONTENTS I. MACROPRUDENTIAL POLICY IN THE UNITED ARAB EMIRATES __________________ 3 A. Introduction ______________________________________________________________________ 3
THE RATIONALE FOR MACROPRUDENTIAL POLICY IN THE UAE AND THE GCC ________________________________________________________________________ 4
THE INSTITUTIONAL FRAMEWORK FOR MACROPRUDENTIAL POLICY _____________ 8 A. International Experience __________________________________________________________ 9
B. Institutional Setup in the UAE for Macroprudential Policy ________________________ 10
THE SELECTION OF MACROPRUDENTIAL INSTRUMENTS _________________________ 11 A. The Main Types of Macroprudential Instruments ________________________________ 11
B. The Current Macroprudential Toolkit in the UAE __________________________________ 13
POLICY RECOMMENDATIONS ________________________________________________________ 14 A. Putting in Place the Institutional and Legal Framework __________________________ 14
B. Strengthening the Macroprudential Analysis _____________________________________ 14
C. Choosing the Appropriate Macroprudential Instruments ________________________ 15
CONCLUSION __________________________________________________________________________ 22 II. CONTAINING RISKS IN THE GOVERNMENT RELATED ENTERPRISE SECTOR ___ 26 A. Introduction ______________________________________________________________________ 26
B. Progress with GRE Debt Restructuring Since 2011 _______________________________ 27
C. Trends in GRE Debt and Select Financial Indicators ______________________________ 29
D. Safeguarding the Financial System from GRE Risk _______________________________ 34
E. Improving the Overall GRE Framework ___________________________________________ 35
F. The Way Forward for Improving Corporate Governance _________________________ 41
CONCLUSION __________________________________________________________________________ 42
June 27, 2013

UNITED ARAB EMIRATES
2 INTERNATIONAL MONETARY FUND
ANNEX I. Current Macroprudential Instruments in the GCC _____________________________________ 23
REFERENCES ___________________________________________________________________________ 24 BOXES I.1. The 2003–08 GCC Credit and Asset Price Boom, the Impact of the Global Crisis and the Policy Response____________________________________________________________ 6 I.2. Property Market Regulatory Measures in Selected Countries ________________________ 19 II.1. Major GRE Restructuring Deals _____________________________________________________ 28 TABLES I.1. Selected Financial Soundness Indicators ______________________________________________ 5 I.2. Cross-Country Experience of Institutional Set-up for Macroprudential Policies ______ 10 I.3. Macroprudential Instruments ________________________________________________________ 12 II.1. Dubai: Maturing Bonds and Syndicated Loans ______________________________________ 31 II.2. Abu Dhabi: Maturing Bonds, Syndicated and Bilateral Loans _______________________ 32 II.3. Dubai GREs: Selected Financial Indicators ___________________________________________ 33 II.4. Dubai Selected Corporate Governance Practice Indicators __________________________ 39 II.5. Abu Dhabi: Selected Corporate Governance Practice Indicators ____________________ 40 STATISTICAL TABLES 1. Oil and Gas Production, Exports, and Prices, 2004–12 ________________________________ 45 2. Consolidated Government Finances, 2004–12 ________________________________________ 46 3. Federal Government Financial Operations, 2004–12 __________________________________ 47 4. Abu Dhabi Fiscal Operations, 2004–12 ________________________________________________ 48 5. Abu Dhabi Development Expenditures, 2004–12 _____________________________________ 49 6. Abu Dhabi Government Domestic Aid, Grants, Subsidies and other Transfers, 2007–12 ___________________________________________________________ 49 7. Dubai Government Operations, 2004–12 _____________________________________________ 50 8. Summary Accounts of the Central Bank, 2004–12 _____________________________________ 51 9. Balance Sheets of Commercial Banks, 2004–12 _______________________________________ 52 10. Banking System Structure, 2004–12 _________________________________________________ 53 11. Sectoral Loan Concentration, 2004–121 _____________________________________________ 54 12. Financial Sector Indicators, 2004–12 _________________________________________________ 55 13. Banking System Profitability, 2004–12 _______________________________________________ 56
UNITED ARAB EMIRATES
INTERNATIONAL MONETARY FUND 3
I. MACROPRUDENTIAL POLICY IN THE UNITED ARAB EMIRATES
A. Introduction
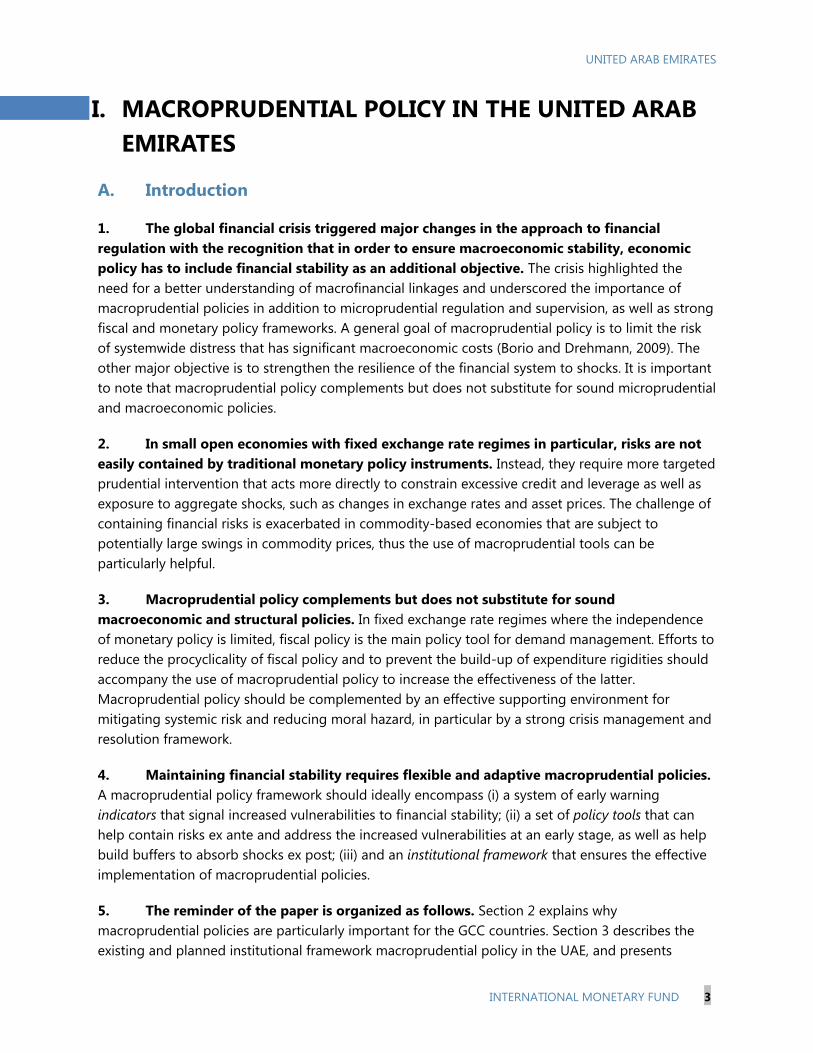
1. The global financial crisis triggered major changes in the approach to financial regulation with the recognition that in order to ensure macroeconomic stability, economic policy has to include financial stability as an additional objective. The crisis highlighted the need for a better understanding of macrofinancial linkages and underscored the importance of macroprudential policies in addition to microprudential regulation and supervision, as well as strong fiscal and monetary policy frameworks. A general goal of macroprudential policy is to limit the risk of systemwide distress that has significant macroeconomic costs (Borio and Drehmann, 2009). The other major objective is to strengthen the resilience of the financial system to shocks. It is important to note that macroprudential policy complements but does not substitute for sound microprudential and macroeconomic policies.
2. In small open economies with fixed exchange rate regimes in particular, risks are not easily contained by traditional monetary policy instruments. Instead, they require more targeted prudential intervention that acts more directly to constrain excessive credit and leverage as well as exposure to aggregate shocks, such as changes in exchange rates and asset prices. The challenge of containing financial risks is exacerbated in commodity-based economies that are subject to potentially large swings in commodity prices, thus the use of macroprudential tools can be particularly helpful.
3. Macroprudential policy complements but does not substitute for sound macroeconomic and structural policies. In fixed exchange rate regimes where the independence of monetary policy is limited, fiscal policy is the main policy tool for demand management. Efforts to reduce the procyclicality of fiscal policy and to prevent the build-up of expenditure rigidities should accompany the use of macroprudential policy to increase the effectiveness of the latter. Macroprudential policy should be complemented by an effective supporting environment for mitigating systemic risk and reducing moral hazard, in particular by a strong crisis management and resolution framework.
4. Maintaining financial stability requires flexible and adaptive macroprudential policies. A macroprudential policy framework should ideally encompass (i) a system of early warning indicators that signal increased vulnerabilities to financial stability; (ii) a set of policy tools that can help contain risks ex ante and address the increased vulnerabilities at an early stage, as well as help build buffers to absorb shocks ex post; (iii) and an institutional framework that ensures the effective implementation of macroprudential policies.
5. The reminder of the paper is organized as follows. Section 2 explains why macroprudential policies are particularly important for the GCC countries. Section 3 describes the existing and planned institutional framework macroprudential policy in the UAE, and presents

UNITED ARAB EMIRATES
4 INTERNATIONAL MONETARY FUND
international examples. Section 4 provides a wide range of macroprudential instruments as discussed in the emerging literature on these instruments, and describes the current macroprudential toolkit in the UAE. Section 5 presents policy recommendations. Section 6 concludes.
THE RATIONALE FOR MACROPRUDENTIAL POLICY IN THE UAE AND THE GCC 6. Several characteristics of the economy, financial sector and the economic policy framework of GCC countries in general, and the UAE in particular, make macroprudential policy a particularly relevant policy tool. The reliance on hydrocarbon resources in the context of volatile of hydrocarbon prices (Dubai’s notable achievements in diversifying its economy notwithstanding), limited monetary policy independence in light of the Dirham’s peg to the US dollar, a history of procyclical fiscal policy, the importance of real estate as a major asset class for investment, underdeveloped financial markets providing limited risk management tools, and shortcomings in crisis resolution frameworks all underline the importance of macroprudential policy to limit systemic risk in the financial system.
7. Being largely commodity exporters, GCC economies are prone to pro-cyclical systemic risk in the financial system (Table 1). During periods of high hydrocarbon prices, the external balance strengthens significantly, which customarily results in credit and asset prices booms (Box 1). Although it is a very important tool for macroeconomic management, due to the significant time lag and expenditure rigidities, fiscal policy has not been a flexible tool to prevent credit booms and the build-up of systemic risk in the UAE and in some GCC countries, in fact procyclical fiscal policy was an important contributor to credit booms. As increased hydrocarbon revenues are channeled into the domestic economy lifting GDP growth, demand for credit is increasing in the private sector. Favorable economic prospects make the financial sector keen to lend, leading to higher domestic credit growth and easier access to external financing.
20
40
60
80
100
120
140
0
10
20
30
40
50
2003
M1
2003
M6
2003
M11
2004
M4
2004
M9
2005
M2
2005
M7
2005
M12
2006
M5
2006
M10
2007
M3
2007
M8
2008
M1
2008
M6
2008
M11
2009
M4
2009
M9
2010
M2
2010
M7
2010
M12
2011
M5
2011
M10
2012
M3
2012
M8
GCC credit growth (yoy) Oil prices (RHS)
Oil Prices and Credit Growth, 2003–12(Percent) (U.S. dollars per barrel)
Sources: Bloomberg, country authorities.
0
20
40
60
80
100
120
140
40
50
60
70
80
90
100
110
120
2005
M12
2006
M4
2006
M8
2006
M12
2007
M4
2007
M8
2007
M12
2008
M4
2008
M8
2008
M12
2009
M4
2009
M8
2009
M12
2010
M4
2010
M8
2010
M12
2011
M4
2011
M8
2011
M12
2012
M4
2012
M8
2012
M12
GCC 200 index Oil prices (RHS)
Oil Prices and Stock Index, 2005–12(Index) (U.S. dollars per barrel)
Source: Bloomberg.

UNITED ARAB EMIRATES
INTERNATIONAL MONETARY FUND 5
Table I.1. Selected Financial Soundness Indicators
Capital Adequacy Ratio 2005 2006 2007 2008 2009 2010 2011 2012 Last data
Bahrain 26.9 22.0 21.0 18.1 19.6 19.9 19.9 19.3 Dec-12
Kuwait 21.1 20.2 19.3 15.6 16.7 18.9 18.5 Dec-11
Oman 18.5 17.2 15.8 14.7 15.5 15.8 15.9 15.4 Jun-12
Qatar 24.8 14.3 13.5 15.5 16.1 16.1 20.6 21.1 Jun-12
Saudi Arabia 17.8 21.9 20.6 16.0 16.5 17.1 17.4 Dec-11United Arab Emirates1
17.4 16.6 14.4 13.0 19.9 20.7 20.0 20.6 Dec-12
NPLs to Loans22005 2006 2007 2008 2009 2010 2011 2012
Bahrain 5.8 4.8 6.0 2.3 3.9 5.1 4.9 5.8 Dec-12
Kuwait 4.1 4.6 3.8 6.8 11.5 8.9 7.3 Dec-11
Oman 7.0 4.6 3.2 2.1 2.7 2.9 2.4 2.5 Jun-12
Qatar 4.3 2.2 1.5 1.2 1.7 2.0 1.7 1.8 Jun-12
Saudi Arabia 1.9 2.0 2.1 1.4 3.3 3.0 2.3 Dec-11United Arab Emirates1
8.3 6.3 2.9 2.3 4.3 5.6 7.2 8.7 Dec-12
Provisioning Rate 2005 2006 2007 2008 2009 2010 2011 2012
Bahrain 67.7 68.5 74.0 84.0 60.3 58.0 60.4 53.1 Dec-12
Kuwait 47.4 47.2 29.0 38.3 33.9 29.5 Dec-11
Oman 97.4 109.6 111.8 127.3 104.0 110.3 120.6 118.2 Jun-12
Qatar 84.3 94.3 90.7 83.2 84.5 85.1 86.3 89.3 Jun-12
Saudi Arabia 202.8 182.3 142.9 153.3 89.8 115.7 132.8 11-DecUnited Arab Emirates1,3
95.7 98.2 100.0 102.6 85.0 89.0 90.0 85.0 Dec-12
Return on Assets 2005 2006 2007 2008 2009 2010 2011 2012
Bahrain 2.1 2.1 1.2 1.3 1.2 1.1 1.2 1.2 Dec-12
Kuwait 3.3 2.7 3.3 0.8 0.7 1.2 1.1 Dec-11
Oman 2.3 2.3 2.1 1.7 2.1 1.6 1.7 1.9 Jun-12
Qatar 4.3 3.7 3.6 2.9 2.6 2.6 2.7 2.5 Jun-12
Saudi Arabia 3.4 4.0 2.8 2.3 2.0 1.8 1.9 2.1 Jul-12United Arab Emirates1
2.7 1.4 1.5 1.4 1.4 1.3 1.5 1.5 Dec-12
1 UAE: Local banks only.2 Figures are not comparable as methodologies to measure NPLs vary from one country to the other.3 Specific and general provisions.
Source: Country authorities.

UNITED ARAB EMIRATES
6 INTERNATIONAL MONETARY FUND
Box I.1. The 2003–08 GCC Credit and Asset Price Boom, the Impact of the Global Crisis and
the Policy Response The 2003–08 oil price boom led to large fiscal and external balance surpluses, buoyant economic activity, rising consumer and investor confidence in the GCC countries.1 Abundant liquidity fueled credit growth, inflation, and asset price increases. During this period, real annual average credit growth of the GCC banks was 23 percent, which led to increasing bank leverage and almost doubling the ratio of private sector credit to non-oil GDP to 122 percent by end-2008. In some GCC countries, credit growth went largely into construction and real estate lending, fuelling a real estate boom, and some countries experienced an increase in lending for the purchase of securities. The GCC stock markets posted 22–60 percent gains in 2007. In some countries, notably the U.A.E., speculative investments contributed to marked increases in real estate prices. These developments took place notwithstanding the fact that GCC countries implemented several measures of macroprudential nature to limit credit growth (see Section V).
While most of this credit growth was financed by domestic deposits, banks’ foreign liabilities increased, partly related to banks’ issuance of foreign-currency denominated medium-term notes to address asset-liability maturity mismatches. However, banks also used short-term speculative foreign deposits to finance their lending, exacerbating maturity mismatches and creating a refinancing risk on their balance sheets. On the corporate sector side, the boom was associated with a rise in leverage, increasing the sector’s vulnerability to funding availability and cost.
The credit and asset price boom came to an abrupt end as the global financial crisis hit the GCC in late 2008. As the global deleveraging process took hold, and oil prices and production fell, the GCC’s external and fiscal surpluses declined markedly, stock and real estate markets plunged, credit default swap (CDS) spreads on sovereign debt widened, and external funding for the financial and corporate sectors tightened.
Decisive policy actions by the authorities have helped moderate the effect of the crisis. These actions included the infusion of liquidity into the financial system through repos by central banks, and direct liquidity injections via the placement of long-term deposits by the government, provision of deposit guarantees and capital injections to banks, and, as preemptive measures, tightening of prudential norms for general lending and in particular for lending to real estate and for investment in equity.
The experience of the GCC countries during the crisis brought home the importance of expanding central banks’ traditional mandate to better incorporate financial stability as a complementary objective.
________________________________ 1 For a detailed account of the impact of the global financial crisis and policy responses in the GCC, see Khamis et al.
(2010).
8. The fixed exchange rate and persistent structural liquidity surpluses in upswings add to the difficulties to manage aggregate demand and contain credit expansion. The exchange rate peg, and the open capital account allow limited room to deviate from US interest rates. Monetary policy is further constrained by limited liquidity management capabilities, as liquidity forecasting is in its infancy and central banks’ liquidity management relies
0
2
4
6
8
0
2
4
6
8
Jan-04 Jan-05 Jan-06 Jan-07 Jan-08 Jan-09 Jan-10 Jan-11 Jan-12
3-month Interbank Rate Federal Funds Target Rate
United Arab Emirates: Domestic and U.S. Interbank Rates, 2004–12(Percent)
Sources: Bloomberg, EDSS.
UNITED ARAB EMIRATES
INTERNATIONAL MONETARY FUND 7
primarily on reserve requirements and standing facilities (Certificate of Deposit) for liquidity absorption. Reserve requirement is an inflexible tool for liquidity management, and a standing facility is a passive instrument where the amount of liquidity absorbed is driven by the banks and not the central bank. In addition, the monetary transmission mechanism is constrained by the shallow nature of money markets in these countries.
9. Domestic fixed income markets are undeveloped, limiting the range of risk management tools and assets for investment. Given the persistent fiscal and external surpluses and accumulated savings, there is no need at the level of consolidated government to issue debt to finance the budget. The lack of liquid local currency money and bond markets, as well as derivative markets limit the interest rate and liquidity risk management tools for the financial sector.
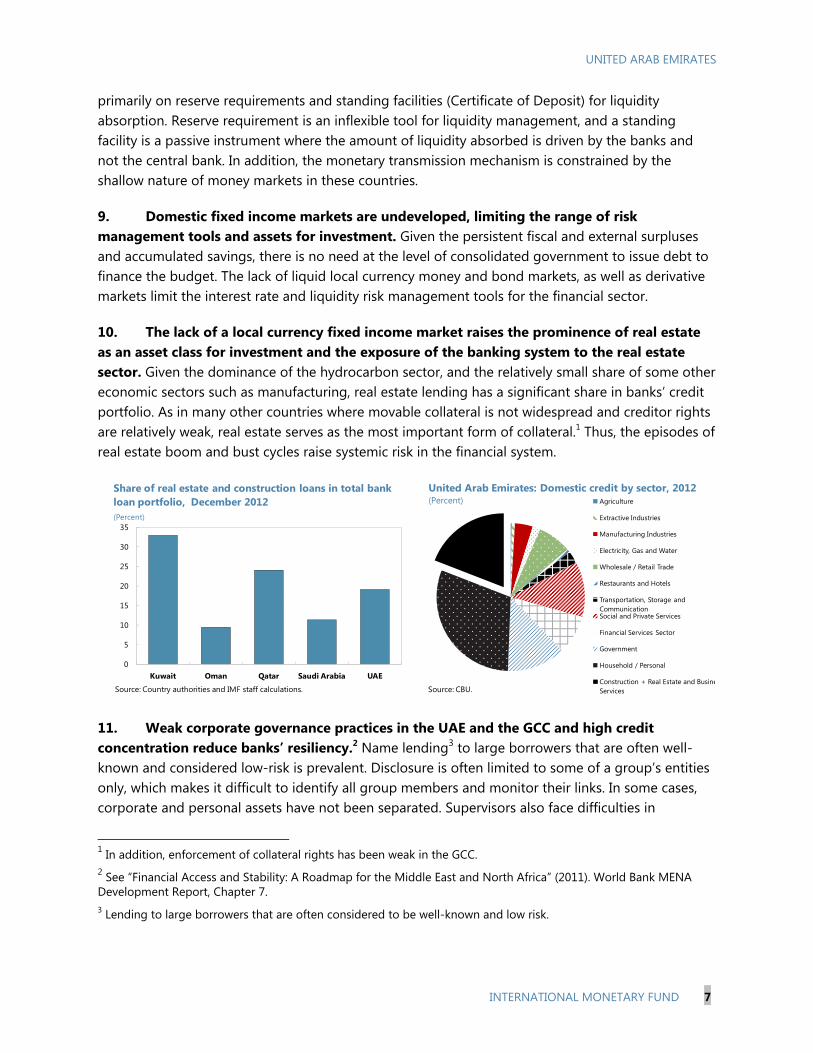
10. The lack of a local currency fixed income market raises the prominence of real estate as an asset class for investment and the exposure of the banking system to the real estate sector. Given the dominance of the hydrocarbon sector, and the relatively small share of some other economic sectors such as manufacturing, real estate lending has a significant share in banks’ credit portfolio. As in many other countries where movable collateral is not widespread and creditor rights are relatively weak, real estate serves as the most important form of collateral.1 Thus, the episodes of real estate boom and bust cycles raise systemic risk in the financial system.
0
5
10
15
20
25
30
35
Kuwait Oman Qatar Saudi Arabia UAE
Share of real estate and construction loans in total bank loan portfolio, December 2012(Percent)
Source: Country authorities and IMF staff calculations.
Agriculture
Extractive Industries
Manufacturing Industries
Electricity, Gas and Water
Wholesale / Retail Trade
Restaurants and Hotels
Transportation, Storage and CommunicationSocial and Private Services
Financial Services Sector
Government
Household / Personal
Construction + Real Estate and BusineServices
United Arab Emirates: Domestic credit by sector, 2012(Percent)
Source: CBU.
11. Weak corporate governance practices in the UAE and the GCC and high credit concentration reduce banks’ resiliency.2 Name lending3 to large borrowers that are often well-known and considered low-risk is prevalent. Disclosure is often limited to some of a group’s entities only, which makes it difficult to identify all group members and monitor their links. In some cases, corporate and personal assets have not been separated. Supervisors also face difficulties in
1 In addition, enforcement of collateral rights has been weak in the GCC. 2 See “Financial Access and Stability: A Roadmap for the Middle East and North Africa” (2011). World Bank MENA Development Report, Chapter 7. 3 Lending to large borrowers that are often considered to be well-known and low risk.

UNITED ARAB EMIRATES
8 INTERNATIONAL MONETARY FUND
identifying risk from multiple, unconsolidated exposures to private conglomerates. The region’s weak corporate governance practices and financial disclosure make it hard to track ultimate beneficiaries of loans on a consolidated basis.
12. Preventing the build-up of systemic risk is all the more important in the absence of effective crisis resolution frameworks and insolvency regimes. The experience of “no banks are allowed to fail” leads to the understanding of an (implicit) full guarantee on deposits, thus undermining market discipline. In the case of insolvency regimes, the main reason for the lack of effectiveness appears to be inefficient enforcement and implementation.4 Court processes tend to be slow, formalistic and bureaucratic, while procedures are expensive, drawn out and inefficient, and recovery rates are low. Qatar, UAE and Saudi Arabia report very low usage of their bankruptcy systems.
THE INSTITUTIONAL FRAMEWORK FOR MACROPRUDENTIAL POLICY 13. The institutional architecture is a core element of macroprudential policy.5 Institutional arrangements will be shaped in no small part by country-specific circumstances, so that there can be no “one size fits all”, and international best practices are yet to emerge. However, there appear to be two (possibly overlapping) key elements in this architecture: an authority with a clear mandate for macroprudential policy; and a formal mechanism of coordination or consultation across policies aimed at financial stability.
14. Mandate. The need to identify an authority that oversees systemic risks and decides or recommends policy actions reflects: (i) the need for clarity of responsibility for containing systemic risk, with appropriate incentives to act; (ii) the need for clarity of responsibility over policy instruments; and (iii) the complexity of identifying and monitoring systemic risk, given the breadth of analyses required and the underlying data needs. Such an authority could be a body (e.g., a committee or council) or institution (e.g., a central bank, supervisory agency); and an existing or a new one.
15. Coordination. The need for coordination arises because macroprudential policy interacts with other policies, as noted above. It may take an institutional form, such as committee or council, or other forms, such as a requirement for the macroprudential authority to be consulted or offer advice on key decisions affecting the financial system. Coordination is especially important when formal authority over tools affecting specific sources of systemic risk rests with bodies other than the macroprudential authority.
4 See Uttamchandani, M. (2010) “No Way Out: The Lack of Efficient Insolvency Regimes in the MENA Region.” World Bank Policy Research Working Paper 5609, World Bank, Washington, DC. 5 This section draws predominantly on International Monetary Fund, 2011, “Macroprudential Policy: An Organizing Framework.” Washington DC.

UNITED ARAB EMIRATES
INTERNATIONAL MONETARY FUND 9
A. International Experience
16. The results of a recent IMF survey confirm a variety of existing institutional set-ups related to financial stability and macroprudential policy in its member countries.6 Examples of institutional models that can be observed in practice include the following (Table 2):
A model where a specific institution (and its board) is given a macroprudential mandate; this is often accompanied by a coordinating committee, involving the treasury; coordination can also take place through other mechanisms, such as a requirement to consult;
A model where a single institution is tasked with carrying out macroprudential policy
(analytical and operational), but the decisions are taken by some attached policy committee; sometimes such a body also plays the role of a coordinating committee;
A model where an independent committee or council fulfils the role of macroprudential authority; usually, due to its composition, it plays a coordinating role too; there can be multiple institutions contributing to the decision-making process of such committee, as well as policy implementation.
17. However, there are some general lessons that can translate into basic guidance based on international experience:
The central bank should play an important role in macroprudential policy.
Complex and fragmented regulatory and supervisory structures are unlikely to be conducive to effective mitigation of risks to the system as a whole.
Participation of the treasury is useful, but a dominant role poses important risks.
Systemic risk prevention and crisis management are different policy functions that should be supported by separate arrangements.
18. In a number of advanced economies, in particular in Europe, countries are integrating prudential functions into the central bank. Some countries have adopted some form of “twin peaks” model, leaving conduct-of-business and securities market supervision as a responsibility of a separate agency (The Netherlands, Belgium, France, the United Kingdom, and the United States). Ireland has opted for a stronger form of integration where all supervision of markets and institutions is conducted by the central bank. Moreover, a number of countries, including the United Kingdom and the United States are creating dedicated policy-making committees, such as the Financial Policy Committee (FPC), chaired by the Governor of the Bank of England, and the Financial Stability Oversight Council (FSOC), chaired by the United States Treasury.
6 This section draws predominantly on International Monetary Fund, 2011, “Institutional Models for Macroprudential Policy”, Staff Discussion Note, Washington DC.

UNITED ARAB EMIRATES
10 INTERNATIONAL MONETARY FUND
19. In emerging market countries, changes in the institutional setup also typically feature a new macroprudential committee. In Chile, Mexico, and Turkey recently established committees are chaired by the Minister of Finance (Treasury). By contrast in Asia, Malaysia established a financial stability committee in 2009 within the central bank structure, chaired by the central bank Governor—as did Thailand in 2008.
Table I.2. Cross-Country Experience of Institutional Set-up for Macroprudential Policies
Country Committee Ownership on Mandate
European Union European Systemic Risk Board Under ECB, includes members from national treasuries.
United Kingdom Financial Policy Committee Chaired by Bank of England, with a member from Treasury.
Belgium The Committee for Systemic Risks and System-relevant Financial Institutions
Autonomous body chaired by Governor of National Bank of Belgium with Ministry of Finance as invitee.
Malaysia Financial Stability Executive Committee Mandated by central bank law and Chaired by Bank Negara.
United States Financial Stability Oversight Council Independent committee mandated by 2010 Dodd-Frank Act, chaired by Treasury.
Mexico Financial Stability Council Independent committee set by Presidential Decree, chaired by Ministry of Finance.
Chile Financial Stability Council Independent committee chaired Ministry of Finance with Governor of central bank only an invitee.
Uruguay Financial Stability Committee Independent committee chaired by Ministry of Finance; includes Governor of the central bank.
Australia Council of Financial Regulators Coordinating structure chaired by Governor of Reserve Bank of Australia, includes Treasury.
Source: IMF Staff, IMF 2011b, Jacome at al. (2012).
B. Institutional Setup in the UAE for Macroprudential Policy
20. There are multiple regulators for the financial system in the UAE. The Central Bank of the UAE regulates the banking system. Of the three stock exchanges in the country the Dubai Financial Market (DFM) and the Abu Dhabi Securities Exchange (ADX) are both governed and regulated by the Securities and Commodities Authority (SCA). The third, NASDAQ Dubai, located in Dubai International Financial Centre (DIFC), is governed by an independent regulator called the Dubai Financial Services Authority (DFSA). The insurance sector is regulated by the Insurance Authority established in 2008.

UNITED ARAB EMIRATES
INTERNATIONAL MONETARY FUND 11
21. While the CBU has established a Banking Stability Committee, currently it has no authority to include financial institutions outside the banking system in its macroprudential surveillance. Responsibility for systemic risk mitigation is divided between the Banking Stability Committee which is ultimately responsible for any action taken, and the Financial Stability Unit which provides the analysis, and proposes regulatory reforms to address identified risks. Currently, the central bank has no powers to access information collected by other regulators. There are no formal arrangements for information sharing among regulators, it is only done on a voluntary basis between the CBU and the SCA.
22. The new UAE federal strategy gives the central bank the responsibility to oversee financial stability. The authorities are considering legislation governing the supervision of the financial sector to meet the demands of UAE’s new financial markets and modernize the regulatory framework. The draft law on the Regulation of the Financial Services Sector in the UAE and associated amendments to a number of federal laws could signal a move towards a twin peak model of financial supervision.
THE SELECTION OF MACROPRUDENTIAL INSTRUMENTS
A. The Main Types of Macroprudential Instruments
23. A wide range of instruments and measures have been proposed for use as macroprudential tools in the literature. Without being exhaustive, Table 3 provides a taxonomy of the various tools that can be potentially useful for macroprudential purposes depending on the nature of the risk to financial stability.
24. The macroprudential toolkit encompasses instruments aimed at containing risks ex ante and absorbing shocks ex post. Most instruments, including various risk management methodologies, financial reporting practices, funding liquidity standards, collateral arrangements, risk concentration limits, and compensation schemes, are designed to prevent the build-up of risks to dangerous levels. Some of the instruments such as certain elements of the supervisory review (Pillar 2) and profit redistribution restrictions are aimed at addressing the increased vulnerabilities at an early stage. Finally, there are instruments whose role is to help absorb the shocks ex post and limit the damage to the financial sector and the real economy. These instruments include various insurance mechanisms and policies to manage failure and resolution.
25. Some of the instruments imply sophisticated methodologies whereas others can be introduced in simpler environments and are less data-intensive. For example, risk measures calibrated through the cycle and certain accounting methodologies assume that macroeconomic and financial data are available across several credit cycles which is not the case for GCC countries. Nevertheless, the concept of smoothing through the cycle is useful even in the absence of sufficient data, and more basic rules-of-thumb type instruments can be contemplated.

UNITED ARAB EMIRATES
12 INTERNATIONAL MONETARY FUND
Table I.3. Macroprudential Instruments
1. Risk measurement methodologies Examples
By banks Risk measures calibrated through the cycle or to the cyclical trough
By supervisors Cyclical conditionality in supervisory ratings of firms; Develop measures of systemic vulnerability (e.g. commonality of exposures and risk profiles, intensity of inter-firm linkages) as basis for calibration of prudential tools; Communication of official assessments of systemic vulnerability and outcomes of macro stress tests;
2. Financial reporting
Accounting standards Use of less procyclical accounting standards; dynamic provisions
Prudential filters Adjust accounting figures as a basis for calibration of prudential tools; Prudential provisions as add-on to capital; smoothing via moving averages of such measures; time-varying target for provisions or for maximum provision rate
Disclosures Disclosures of various types of risk (e.g. credit, liquidity), and of uncertainty about risk estimates and valuations in financial reports or disclosures
3. Regulatory capital
Pillar 1 Systemic capital surcharge; Reduce sensitivity of regulatory capital requirements to current point in the cycle and with respect to movements in measured risk; Introduce cycle-dependent multiplier to the point-in-time capital figure; Increased regulatory capital requirements for particular exposure types (higher risk weights than on the basis of Basel II, for macroprudential reasons)
Pillar 2 Link of supervisory review to state of the cycle
4. Funding liquidity standards Cyclically-dependent funding liquidity requirements; Concentration limits; FX lending restrictions; FX reserve requirements; currency mismatch limits; open FX position limits
5. Collateral arrangements Time-varying Loan-to-value (LTV) ratios; Conservative maximum loan-to-value ratios and valuation methodologies for collateral; Limit extension of credit based on increases in asset values; Through-the-cycle margining
6. Risk concentration limits Quantitative limits to growth of individual types of exposures; (Time-varying) interest rate surcharges to particular types of loans
7. Compensation schemes Guidelines linking performance-related pay to ex ante longer-horizon measures of risk; back-loading of pay-offs; Use of supervisory review process for enforcement
8. Profit distribution restrictions Limit dividend payments in good times to help build up capital buffers in bad times
9. Insurance mechanisms Contingent capital infusions; Pre-funded systemic risk insurance schemes financed by levy related to bank asset growth beyond certain allowance; Pre-funded deposit insurance with premia sensitive to macro (systemic risk) in addition to micro (institution specific) parameters
10. Managing failure and resolution Exit management policy conditional on systemic strength; Trigger points for supervisory intervention stricter in booms than in periods of systemic distress.
Source: Galati and Moessner (2011).

UNITED ARAB EMIRATES
INTERNATIONAL MONETARY FUND 13
B. The Current Macroprudential Toolkit in the UAE
26. Despite the absence of formalized legal and institutional frameworks for financial stability, the CBU has been using several macroprudential instruments. The UAE and the other GCC countries implemented a number of macroprudential tools before the global financial crisis, especially in order to contain retail lending, but these measures often came late in the credit boom. Their toolkit includes instruments that are recommended in recent reform proposals, such as limits on debt service–to–income ratios, loan-to-deposit ratios (LTD), and sectoral concentration. Annex I provides an overview of the major macroprudential instruments currently in use in the GCC.
27. Capital and provisioning. As for capital requirement and provisioning, although most countries have established a fixed ratio for general provisions, similarly to the other GCC countries, the UAE has not introduced dynamic or countercyclical measures. The CBU is increasing the general provisioning requirement gradually to 1.5 percent by 2014.
28. Personal (retail) loan regulation. Personal lending regulation assumes macroprudential significance because of its high share in total lending (30 percent of domestic credit of local banks) and the moral hazard problem related to debt bailout expectations of nationals.7 In addition to the macroprudential objective, personal lending regulation is also motivated by consumer protection. CBU Regulation “Regarding Bank Loans & Services Offered to Individual Customers” came into effect as of 1 May, 2011. It is aimed at protecting banks by regulating lending and encouraging banks to carry out proper due diligence on their potential borrowers. The regulation allows individual customers to borrow only up to 20 times their salary or monthly income with a maximum period of loan repayment at 48 months, and requires that repayment installments not exceed 50 percent of the borrower’s gross salary or any regular income. As the federal credit bureau becomes operational, banks will have a better grasp of the full extent of an individual exposure to enforce cap on monthly installments.
29. Liquidity regulation. Currently, the Advances to Stable Resources Ratio (ASRR) is the only regulatory ratio related to liquidity.8 The ratio is capped at 100 percent. New liquidity regulation will be introduced in line with Basel III liquidity requirements and timeline.
30. Real estate exposure. There is a limit on banks’ lending for the purpose of constructing commercial or residential buildings to 20 percent of their deposits. This is a narrow definition of exposure, and does not cover all exposures to real estate, e.g., loans for the purchase of existing buildings, and equity investments in real estate development companies. Nevertheless, the CBU monitors banks’ real estate exposure in a comprehensive way for macroprudential purposes.
7 The UAE set up an AED10bn (USD2.7bn) debt settlement fund to clear defaulted debts of its citizens in 2011, but to date there has only been limited utilization. 8 The ASRR is similar to loan-to-deposit ratios which are common in the region. The range of ratios varies from 60 percent in Bahrain to 90 percent in Qatar.

UNITED ARAB EMIRATES
14 INTERNATIONAL MONETARY FUND
31. New LTV regulation. Following consultations with the banking sector, the CBU is preparing regulation related to mortgage lending, including caps on loan-to-value and debt-service-to-income ratios. The new regulation is expected to come into force in 2013.
32. Loan concentration limits on GREs and emirate governments. The CBU has also proposed regulation on loan concentration limits on GREs and emirate governments after extensive consultation with the banks. The regulation is envisaged to impose limits on GREs and emirate governments on both individual and aggregate basis as a percentage of the bank’s capital. The regulation is yet to come into force.
POLICY RECOMMENDATIONS 33. There is scope to better understand, identify and mitigate spillovers through the financial sector, and in particular to build up appropriate buffers and to limit excessive leveraging and credit booms in good times. The CBU has, over the years, taken a large number of measures of macroprudential nature. However, these instruments have been used as microprudential instruments and they have not been applied from a systemic point of view.
A. Putting in Place the Institutional and Legal Framework
34. The existing macroprudential policies have so far been implemented by the CBU without a formal framework and adequate legal backing. Drawing on work in international fora, it would be desirable to develop a more formal and transparent macroprudential institutional and policy framework, notably with respect to the mandate for financial stability, coordination framework, definition of objectives, the elaboration of analytical methods, and the policy toolkit.
35. The forthcoming federal financial services law should appropriately assign the formal mandate to oversee financial stability to the CBU. The central bank can bring the expertise and incentives to the task of mitigating systemic risks. Alongside, a formal coordination framework with the different regulatory agencies in the UAE is essential to identify systemic risks, reduce regulatory overlaps and gaps and mitigate risks. As a way to institutionalize macroprudential policy, the establishment of the Financial Stability Committee within the CBU is an important step. Going forward, it would be important to design an institutional structure, preferably with legal backing, that incorporates members from the CBU, the Ministry of Finance, and other regulatory agencies. Furthermore, it has to be ensured that the Financial Stability Unit responsible for macroprudential analysis and the preparation of regulatory proposals has adequate resources.
B. Strengthening the Macroprudential Analysis
36. The macroprudential framework should be supported by an effective early warning system (EWS) to identify and monitor systemic risks. The EWS involves consolidating quantitative work with qualitative insight, informed by the views of policymakers, market participants, analysts and academics. Quantitatively, the EWS should be based on timely, disaggregated, and high
UNITED ARAB EMIRATES
INTERNATIONAL MONETARY FUND 15
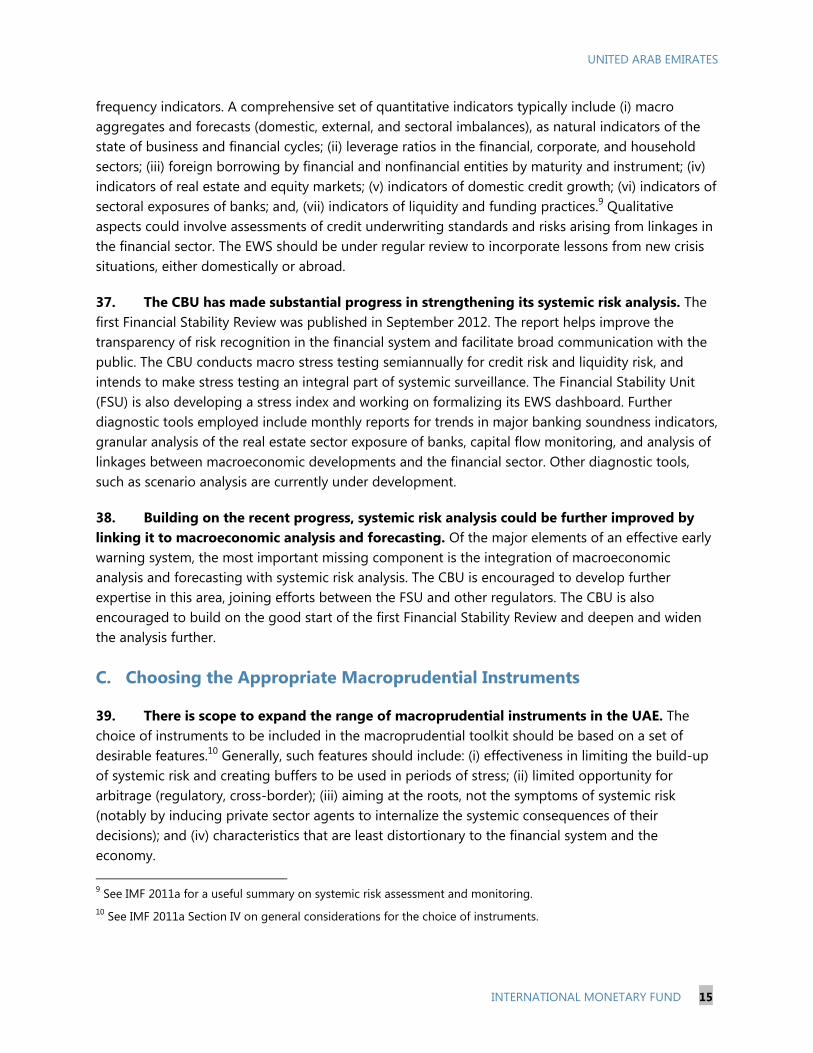
frequency indicators. A comprehensive set of quantitative indicators typically include (i) macro aggregates and forecasts (domestic, external, and sectoral imbalances), as natural indicators of the state of business and financial cycles; (ii) leverage ratios in the financial, corporate, and household sectors; (iii) foreign borrowing by financial and nonfinancial entities by maturity and instrument; (iv) indicators of real estate and equity markets; (v) indicators of domestic credit growth; (vi) indicators of sectoral exposures of banks; and, (vii) indicators of liquidity and funding practices.9 Qualitative aspects could involve assessments of credit underwriting standards and risks arising from linkages in the financial sector. The EWS should be under regular review to incorporate lessons from new crisis situations, either domestically or abroad.
37. The CBU has made substantial progress in strengthening its systemic risk analysis. The first Financial Stability Review was published in September 2012. The report helps improve the transparency of risk recognition in the financial system and facilitate broad communication with the public. The CBU conducts macro stress testing semiannually for credit risk and liquidity risk, and intends to make stress testing an integral part of systemic surveillance. The Financial Stability Unit (FSU) is also developing a stress index and working on formalizing its EWS dashboard. Further diagnostic tools employed include monthly reports for trends in major banking soundness indicators, granular analysis of the real estate sector exposure of banks, capital flow monitoring, and analysis of linkages between macroeconomic developments and the financial sector. Other diagnostic tools, such as scenario analysis are currently under development.
38. Building on the recent progress, systemic risk analysis could be further improved by linking it to macroeconomic analysis and forecasting. Of the major elements of an effective early warning system, the most important missing component is the integration of macroeconomic analysis and forecasting with systemic risk analysis. The CBU is encouraged to develop further expertise in this area, joining efforts between the FSU and other regulators. The CBU is also encouraged to build on the good start of the first Financial Stability Review and deepen and widen the analysis further.
C. Choosing the Appropriate Macroprudential Instruments
39. There is scope to expand the range of macroprudential instruments in the UAE. The choice of instruments to be included in the macroprudential toolkit should be based on a set of desirable features.10 Generally, such features should include: (i) effectiveness in limiting the build-up of systemic risk and creating buffers to be used in periods of stress; (ii) limited opportunity for arbitrage (regulatory, cross-border); (iii) aiming at the roots, not the symptoms of systemic risk (notably by inducing private sector agents to internalize the systemic consequences of their decisions); and (iv) characteristics that are least distortionary to the financial system and the economy. 9 See IMF 2011a for a useful summary on systemic risk assessment and monitoring. 10 See IMF 2011a Section IV on general considerations for the choice of instruments.
UNITED ARAB EMIRATES
16 INTERNATIONAL MONETARY FUND
Capital and provisioning
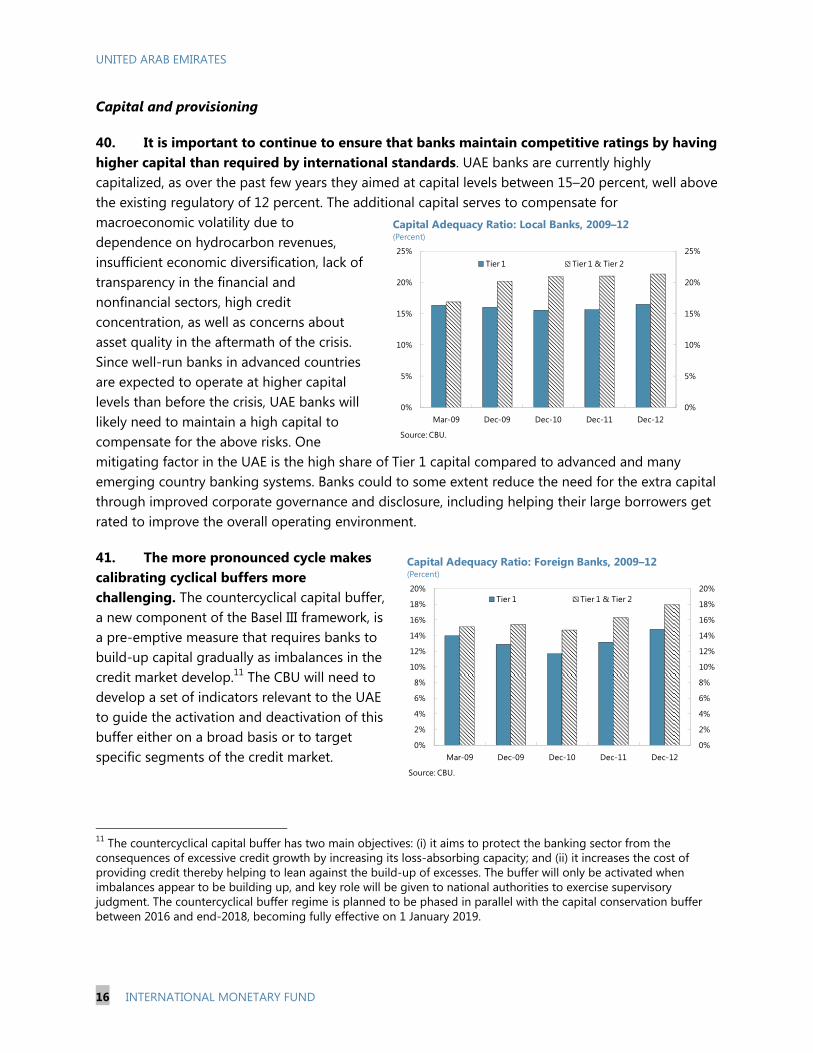
40. It is important to continue to ensure that banks maintain competitive ratings by having higher capital than required by international standards. UAE banks are currently highly capitalized, as over the past few years they aimed at capital levels between 15–20 percent, well above the existing regulatory of 12 percent. The additional capital serves to compensate for macroeconomic volatility due to dependence on hydrocarbon revenues, insufficient economic diversification, lack of transparency in the financial and nonfinancial sectors, high credit concentration, as well as concerns about asset quality in the aftermath of the crisis. Since well-run banks in advanced countries are expected to operate at higher capital levels than before the crisis, UAE banks will likely need to maintain a high capital to compensate for the above risks. One mitigating factor in the UAE is the high share of Tier 1 capital compared to advanced and many emerging country banking systems. Banks could to some extent reduce the need for the extra capital through improved corporate governance and disclosure, including helping their large borrowers get rated to improve the overall operating environment.
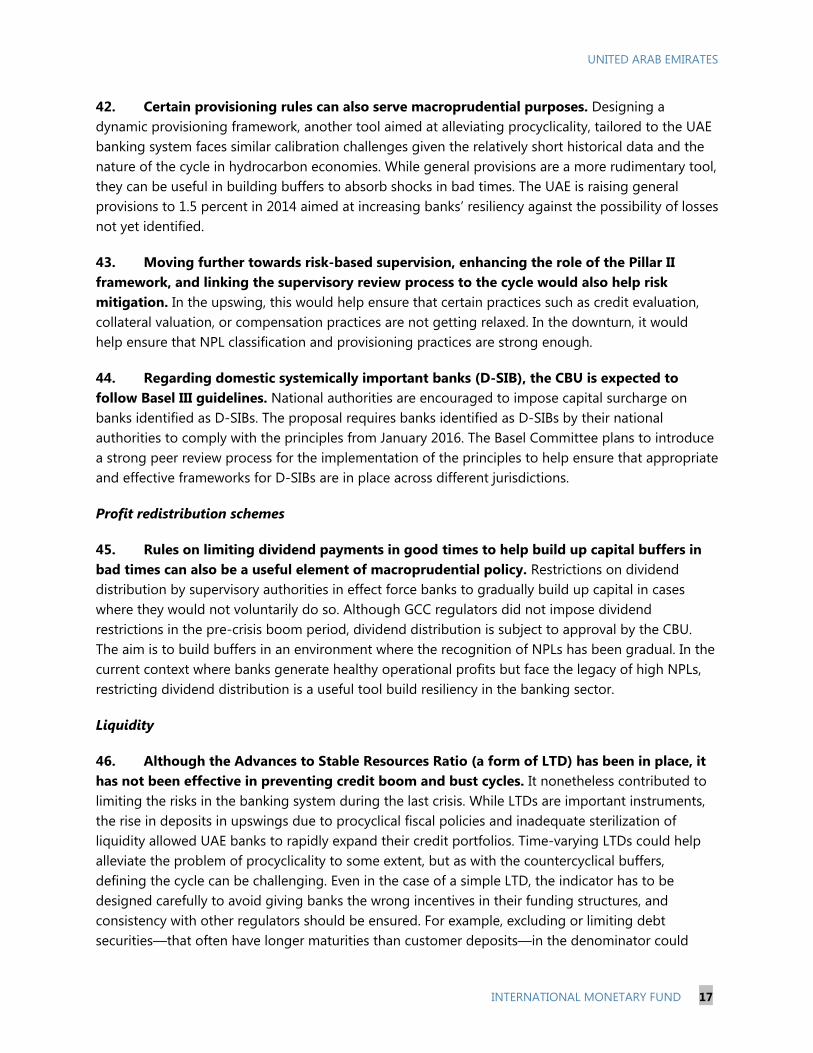
41. The more pronounced cycle makes calibrating cyclical buffers more challenging. The countercyclical capital buffer, a new component of the Basel III framework, is a pre-emptive measure that requires banks to build-up capital gradually as imbalances in the credit market develop.11 The CBU will need to develop a set of indicators relevant to the UAE to guide the activation and deactivation of this buffer either on a broad basis or to target specific segments of the credit market.
11 The countercyclical capital buffer has two main objectives: (i) it aims to protect the banking sector from the consequences of excessive credit growth by increasing its loss-absorbing capacity; and (ii) it increases the cost of providing credit thereby helping to lean against the build-up of excesses. The buffer will only be activated when imbalances appear to be building up, and key role will be given to national authorities to exercise supervisory judgment. The countercyclical buffer regime is planned to be phased in parallel with the capital conservation buffer between 2016 and end-2018, becoming fully effective on 1 January 2019.
0%
5%
10%
15%
20%
25%
0%
5%
10%
15%
20%
25%
Mar-09 Dec-09 Dec-10 Dec-11 Dec-12
Tier 1 Tier 1 & Tier 2
Capital Adequacy Ratio: Local Banks, 2009–12(Percent)
Source: CBU.
0%
2%
4%
6%
8%
10%
12%
14%
16%
18%
20%
0%
2%
4%
6%
8%
10%
12%
14%
16%
18%
20%
Mar-09 Dec-09 Dec-10 Dec-11 Dec-12
Tier 1 Tier 1 & Tier 2
Capital Adequacy Ratio: Foreign Banks, 2009–12(Percent)
Source: CBU.
UNITED ARAB EMIRATES
INTERNATIONAL MONETARY FUND 17
42. Certain provisioning rules can also serve macroprudential purposes. Designing a dynamic provisioning framework, another tool aimed at alleviating procyclicality, tailored to the UAE banking system faces similar calibration challenges given the relatively short historical data and the nature of the cycle in hydrocarbon economies. While general provisions are a more rudimentary tool, they can be useful in building buffers to absorb shocks in bad times. The UAE is raising general provisions to 1.5 percent in 2014 aimed at increasing banks’ resiliency against the possibility of losses not yet identified.
43. Moving further towards risk-based supervision, enhancing the role of the Pillar II framework, and linking the supervisory review process to the cycle would also help risk mitigation. In the upswing, this would help ensure that certain practices such as credit evaluation, collateral valuation, or compensation practices are not getting relaxed. In the downturn, it would help ensure that NPL classification and provisioning practices are strong enough.
44. Regarding domestic systemically important banks (D-SIB), the CBU is expected to follow Basel III guidelines. National authorities are encouraged to impose capital surcharge on banks identified as D-SIBs. The proposal requires banks identified as D-SIBs by their national authorities to comply with the principles from January 2016. The Basel Committee plans to introduce a strong peer review process for the implementation of the principles to help ensure that appropriate and effective frameworks for D-SIBs are in place across different jurisdictions.
Profit redistribution schemes
45. Rules on limiting dividend payments in good times to help build up capital buffers in bad times can also be a useful element of macroprudential policy. Restrictions on dividend distribution by supervisory authorities in effect force banks to gradually build up capital in cases where they would not voluntarily do so. Although GCC regulators did not impose dividend restrictions in the pre-crisis boom period, dividend distribution is subject to approval by the CBU. The aim is to build buffers in an environment where the recognition of NPLs has been gradual. In the current context where banks generate healthy operational profits but face the legacy of high NPLs, restricting dividend distribution is a useful tool build resiliency in the banking sector.
Liquidity
46. Although the Advances to Stable Resources Ratio (a form of LTD) has been in place, it has not been effective in preventing credit boom and bust cycles. It nonetheless contributed to limiting the risks in the banking system during the last crisis. While LTDs are important instruments, the rise in deposits in upswings due to procyclical fiscal policies and inadequate sterilization of liquidity allowed UAE banks to rapidly expand their credit portfolios. Time-varying LTDs could help alleviate the problem of procyclicality to some extent, but as with the countercyclical buffers, defining the cycle can be challenging. Even in the case of a simple LTD, the indicator has to be designed carefully to avoid giving banks the wrong incentives in their funding structures, and consistency with other regulators should be ensured. For example, excluding or limiting debt securities—that often have longer maturities than customer deposits—in the denominator could
UNITED ARAB EMIRATES
18 INTERNATIONAL MONETARY FUND
discourage banks to extend the maturities of their liabilities. One approach is to design a loan-to-deposit ratio using varying weights for deposits of different maturities.
47. While the CBU is expected to follow the new Basel III liquidity requirements, there will likely be challenges in developing market liquidity. The Basel III criteria for high quality liquid assets are ill-suited to GCC countries where domestic debt markets are underdeveloped. Moreover, the net stable funding requirement means that banks need to match the stability of their funding and the maturity of their assets more closely. In the UAE context, this could mean more retail deposits, issuing long-term liabilities or cutting back on long duration assets. This creates a tension given the absence of domestic term funding markets, and the demand for longer-term lending, e.g., mortgages, infrastructure, SME investment.
48. The Basel III liquidity requirements should give an impetus to domestic debt market development. It has to be noted, however, that developing liquid debt markets in emerging economies with fiscal surplus has been challenging. In the GCC, Qatar and Kuwait have been making efforts to develop their domestic government securities market, but it will take time before they reach sufficient depth and liquidity. The UAE has yet to make concerted efforts at domestic debt market development, including passing the long-awaited Public Debt Law, and designing a strategy for market development in the context of the federal structure. In the meantime, however, the CBU is putting in place the necessary infrastructure, including a central securities depository.
49. Funding risks related to capital inflows need to be contained. While foreign exchange risk has traditionally not been a major concern in the GCC given their strong external positions, funding risk can become a concern in countries experiencing a rapid build-up of foreign liabilities that may involve significant maturity mismatches, as it indeed was the case in the UAE in the run-up to the crisis. There is a need to limit the build-up of liquidity risk related to short-term foreign borrowings channeled into funding medium- and long-term domestic lending. Potential measures to limit foreign funding risks include higher reserves required for short-term foreign liabilities and limits on foreign currency lending. Liquidity requirements aimed at matching the maturity of liabilities with the maturity of their assets more closely can be calibrated specifically to target foreign liabilities.
Collateral arrangements
50. Appropriately calibrated and time-varying loan-to-value ratios for real estate lending and debt-service-to-income ratios for lending to individuals could be a useful part of the macroprudential toolkit in the UAE. As the recent high credit growth and asset price boom-bust episode shows, containing personal and real estate lending is crucial to protect the financial system and can help prevent overheating.
51. The recent experience of Hong Kong SAR and Singapore illustrates the use of LTVs and debt-to-income ratios (DTI) as macroprudential instruments to contain property lending and price growth (see Box 2.). In the case of Hong Kong SAR, faced with the onset of a credit-asset price cycle centered on the property sector, the authorities have introduced several measures since 2009 tightening the LTV and DTI ratios, raising the Special Stamp Duty (SSD) on properties resold within a

UNITED ARAB EMIRATES
INTERNATIONAL MONETARY FUND 19
certain timeframe, as well as increasing public land supply to the market.12 Similarly, Singapore used an escalating series of macroprudential measures, primarily tightening the LTV and DTI ratios and SSD requirements to combat property lending and price increases. These measures seem to have been effective such that price growth slowed sharply in late 2011, although exogenous factors also likely contributed.
Box I.2. Property Market Regulatory Measures in Selected Countries
A number of economies have used macroprudential policies in recent years to protect their financial systems from stress induced by volatile asset prices, particularly in the property market.
Empirical Studies. There is some international evidence that the use of loan-to-value (LTV) caps decelerates property price growth, and both LTV and debt-to-income (DTI) caps slow property lending growth. Ahuja and Nabar (2011) find that the use of LTVs appears to strengthen bank capital buffers and bank performance in economies with pegged exchange rates and currency boards, while lowering NPLs in the broader sample. Comparing the subset of fixed exchange rates and currency boards against the broader sample, they find that such instruments are used more frequently in the first group. In the broader sample, interest rate tools can also be deployed to control credit aggregates which could explain why the reliance on LTV and DTI instruments appears to be smaller.
Hong Kong. With the currency board ruling out an independent monetary policy, the Hong Kong authorities have to rely on macroprudential measures to contain the property market boom. Faced with a credit-asset price cycle since 2009, the authorities have introduced several changes to policies, concerning LTV and DTI cap. The aggressive tightening of LTV ceilings has caused average new residential mortgage LTV ratio to decline steadily in 2011. Another important strategy has been to increase public land sales for ensuring adequate supply and managing house price inflation expectation. In addition, the authorities have also imposed transactions taxes, a Special Stamp Duty (SSD), to discourage speculative short term trading of residential properties. Although past measures have reduced transaction volumes and created significant buffers in the financial system, house prices have continued to rise. A continued run-up in house prices has led to another round of tightening measures for the local property market in February 2013, including (i) a further rise in SSD for all transactions, (ii) a further tightening of mortgage underwriting standards, and (iii) a lower LTV cap on commercial properties, and so forth. The empirical analysis for the Hong Kong suggests that the residential property price inflation appears to fall only around 2 years after the change in the LTV ratios and a tightening of LTV limits appears to have little effect on total mortgage lending. The challenge is to calibrate their macroprudential tools in combination with land sale policy.
Singapore. While the objective of monetary policy framework in Singapore is to maintain price stability by managing the nominal exchange rate, Singapore authorities consider that capital flow and asset prices considerations are best managed with macroprudential tools. An escalating series of macroprudential measures was introduced during 2009−12, focusing on both domestic and foreign buyers of real estate. Since 2009, LTV cap has been lowered from 90 percent to 40 percent in some cases, and SSD has been repeatedly extended and increased. These measures were effective such that price growth slowed sharply in late 2011, although exogenous factors also likely contributed.
12Ahuja and Nabar (2011).

UNITED ARAB EMIRATES
20 INTERNATIONAL MONETARY FUND
52. The CBU should stand ready to adjust the parameters of personal lending regulation and loan-to-value ratios in response to the state of the cycle. Although mortgage lending is currently nascent in the UAE and the residential real estate market is largely a cash market, setting appropriate limits on LTVs and adjusting them to property market conditions becomes important as mortgage lending picks up. The CBU should carefully monitor the interaction of mortgage lending and the real estate sector, and tighten the LTV regulation or introduce new measures as needed.
53. Caps on LTVs for commercial properties are equally important in the UAE context. Commercial properties suffered a larger price decline in the UAE countries after 2008 compared to residential real estate, reflecting the overinvestment in this segment. Of the GCC countries only Qatar imposed a limit on LTV for real estate finance other than to individuals. Other countries such as Hong Kong have also imposed and tightened LTV caps on commercial properties.
Risk concentration limits
54. Well-calibrated and strictly enforced risk concentration limits can help contain the build-up of excessive exposure to certain sectors or borrower groups. Early warning systems developed for macroprudential purposes should be used to help identify potential sectors where limits can help prevent the build-up of excessive exposure.
55. A risk concentration limit on real estate exposure is an important tool to contain excessive lending to the sector. While internationally the focus has been mainly to cap LTVs for individual mortgages to contain banks’ risk exposure to the real estate sector, this approach is not sufficient in the UAE. The low share of residential real estate transactions financed by mortgages, and the importance of lending to developers for both residential and commercial purposes raises the importance of caps on real estate exposure. Limits on real estate exposure have been employed by all GCC countries other than Kuwait. Nevertheless, several GCC countries experienced episodes of real estate boom-bust cycles in recent years indicating that the existing regulations were insufficient or not enforced strictly. Real estate exposure and property price increase were high in the run-up to the global financial crisis in the UAE, Qatar and Kuwait in particular. The subsequent sharp decline in real estate prices indicates that there is scope to improve the calibration of real estate exposure limits and to strengthen enforcement.
56. Special consideration is needed to define real estate exposure appropriately. To prevent excessive lending to the sector, the definition should encompass all finance activities related to the purchase and construction of buildings in which the bank depends on real estate or real estate collateral as a source of repayment. E.g., Qatar has prudently broadened the definition of real estate exposure in 2011 to include all real estate-related activities. The definition also includes finance granted for purposes other than real estate, where the bank depends on real estate or real estate collaterals as source of repayments. While this conservative definition helps contain real estate exposure, it restricts banks’ ability to expand lending to certain sectors such as SMEs where real estate is overwhelmingly used as collateral. Developing movable collateral frameworks could help mitigate this problem. Real estate regulation should ensure a level playing field between

UNITED ARAB EMIRATES
INTERNATIONAL MONETARY FUND 21
Shariah-compliant and conventional banks, taking into account the special characteristics of the former group.13
57. Large exposure limits to individual borrowers and borrower groups also need to be redefined and more strictly enforced in some cases. High credit concentration, a common phenomenon in GCC banking systems, is partly due to the importance of large government-related entities (GRE) in the development model of some GCC countries, the UAE in particular. Lending by UAE banks to GREs contributed to asset quality problems and a wave of loan restructuring deals in the aftermath of the global financial crisis, and the ensuing debt overhang and high NPLs are weighing on the banking sector’s ability to resume healthy lending activity. The proposed regulation on loan concentration limits on GREs and emirate governments is aimed at preventing the build-up of undue exposure of banks to these entities.
Compensation schemes
58. While ill-designed compensation schemes do not seem to have been among the chief causes of systemic risk in the GCC, the international experience suggests that the design of remuneration packages requires attention. Guidelines linking performance-related pay to ex ante longer-horizon measures of risk and back-loading of pay-offs can help reduce incentives to focus on short-term profits. In countries like the UAE where expatriate employees dominate the workforce, high staff fluctuation may give rise to excessive risk taking that could be curtailed by appropriately designed compensation packages.
Structural issues supporting macroprudential policy
59. Finally, the effectiveness of macroprudential policies can be greatly enhanced by strengthening the supporting environment for mitigating systemic risk and reducing moral hazard. Credit reporting systems with positive information that allow assessing the indebtedness and creditworthiness of individual and corporate borrowers are essential. Although there has been considerable progress in establishing the federal credit bureau in the UAE, it is yet to be made operational. The insolvency regime needs to be modernized, and passing the pending Insolvency Law would be key in this respect. A well-designed crisis management and resolution framework would be essential. International experience suggests that key elements include explicit but limited amount deposit guarantee or insurance,14 well-defined coordination and information sharing framework between various supervisory authorities, and clear mechanisms for funding resolution. As a final point, improving corporate governance and disclosure standards, as well as risk management practices in the financial sector is of utmost importance to mitigate systemic risk in the GCC.
13 The exposure of Shariah-compliant banks in the GCC to real estate has been high, and unlike conventional banks, they are allowed to hold equity-like real estate exposures in their balance sheet. 14 See Al-Jafari, M. and Walker, D. (2011) “Deposit Insurance in the MENA Region” World Bank MENA Financial Flagship Paper.
UNITED ARAB EMIRATES
22 INTERNATIONAL MONETARY FUND
CONCLUSION 60. Macroprudential policy can play an important role in the UAE to mitigate systemic risk in the financial sector. The special characteristics of the economy, the reliance on volatile hydrocarbon revenues, limited monetary policy independence in light of the peg to the US dollar, the risk of procyclical fiscal policy, and an open capital account pose challenges to the central bank to maintain financial stability. Furthermore, banks are strongly interconnected with GREs through ownership and financial linkages. This interconnectedness, coupled with non-transparent corporate governance structures and practices, makes managing the evolution of interconnected leverage challenging, and could give rise to systemic risks.
61. The CBU has already taken several measures in its quest for strengthening the macroprudential framework. Publishing its first Financial Stability Review in 2012 was an important step highlighting the importance of macroprudential policy. The analytical toolkit is being upgraded, and several regulatory measures, including on credit concentration limits on emirate governments and GREs, as well as on mortgage lending, are awaiting implementation. To build on this progress, the development of a more formal and transparent macroprudential institutional and policy framework would be desirable: it should entail assigning the mandate for financial stability, and defining a coordination framework, objectives, analytical methods, and the policy toolkit. The adoption of the draft Financial Services Law would provide an opportunity to establish the legal base for an improved macroprudential policy framework.
62. While the CBU already has many of the tools that can help address vulnerabilities at an early stage, as well as help build buffers to absorb shocks ex post, there is scope for refining them. In the area of building and maintaining buffers, the UAE has been relying strongly on high capitalization of banks. This would be usefully complemented by an enhanced role for Pillar II, a further move towards risk-based supervision, and linking the supervisory review process to the cycle. The CBU’s practice of restricting dividend distribution has also been helpful in building buffers, and should continue to be part of the toolkit. The CBU is also appropriately focusing on the instruments to reduce liquidity risks, and has been proactively developing the regulation to comply with Basel III requirements. For macroprudential purposes, designing time-varying LTDs could be given consideration to alleviate procyclicality. To help with liquidity management, the development of the domestic debt market would be essential, and efforts need to be stepped up in this area.
63. The proposed new mortgage and loan concentration limits on GREs and emirate governments would be welcome additions to the macroprudential toolkit. As international experience shows, appropriately calibrated and time-varying loan-to-value ratios for real estate lending and debt-service-to-income ratios for lending to individuals, possibly in conjunction with some other measures such as transaction levies, can help mitigate the risk of property market booms. Similarly, concentration limits on activities and/or borrowers where excessive risk build-up is a potential problem, such as the real estate sector or GREs in the UAE context, can help reduce the exposure and vulnerability of the banking system.

Annex I. Current Macroprudential Instruments in the GCC BAHRAIN KUWAIT OMAN QATAR SAUDI ARABIA U.A.E
Countercyclical capital requirements No No No No SAMA has encouraged Saudi banks to increase their capital on a countercyclical basis. During the period 2003-2007, capital of the banking system increased 2.5 times; between 1992 to 1997 the capital of banks rose by 100%
No
General provisions Discretionary provision requirement.
Fixed level: 1% of cash items &0.5% of non cash items
Fixed level: 2% of the outstanding performing 'personal loans' and 1% of outstanding performing 'other loans.'
Yes. 1.5% Fixed level: 1% Gradually being raised to 1.5% of of credit risk weighted assets that do not have a specific provision against them.
Dynamic provisioning No No No No No NoLeverage ratios (capital to assets) Yes. 5% for retail banks and 10%
for wholesale banksNo No No Yes. [Deposit /(Capital +Reserve)] Not to
exceed 15 times. No
Reserve requirements on bank deposits Yes. 5% of total deposits. No Yes. 5% of deposits. Yes. 4.75%. Yes. 7% on demand deposits. 4% on time and saving deposits.
Yes. 14% for demand deposits; 1% for time deposits
Limits on real estate exposure Yes. 30% cap on real estate lending of banks as share of total bank lending.
No Yes. 60% of the bank net worth or 60% of all time and savings deposits other than government and inter-bank deposits, whichever is higher.
Yes. For conventional banks, real estate lending not to exceed 150% of bank's capital and reserves (Tier 1). For Islamic banks, investment in real estates should not exceed 25% of the bank's capital and reserves.
Yes Yes. 20% of deposits. Current definition of real estate exposure: loans for the construction of commercial and residential buildings.
Limits on other sectoral exposure No No Yes. Limits on personal loans: 35% of total credit effective June 2014. Housing Loans: 15% of total credit Non Residents: 2.5% of bank's local net worth, Aggregate Non-resident exposure: 20% of bank's local net worth
Banks may not provide customers with any finance for the purposes oftrading in securities
Yes. SAMA, at its own discretion, may place a limit on individual banks whereby their retail loan portfolio may not exceeda specified percentage of its total loans.
Regulation pending on large exposure limits for aggregate exposure to local governments and government-related entities.
Loan-to-value (LTVs) ratios No limit (business practice is around 80%)
Residential housing loans are eligible for the preferential risk weight of 75% if LTV is lower than 90%.
No limit (business practice is around 80%)
70% for individuals, 60% for commercial companies
Yes. For mortgage and real estate finance companies the regulations impose an LTV of 70%.
Regulation on differentiated LTVs for nationals and expatriates, as well as for first and second properties is pending.
Debt/Loan-to-income (DTI/LTIs) ratios Yes. Maximum debt service ratio of 50% of monthly salary.
Yes. Total monthly repayments should not exceed 40% of borrower salary and 30% of income for pensioners.
Yes.Maximum 50% of individuals's net salary with a maximum tenor of 10 years for non-housing personal loans, and 60% of net salary upto a tenor of 25 years for housing loans.
Yes. Credit to individuals capped at 50% of monthly salary and allowances, not to exceed QR 2.5 million per person.
Yes. Total monthly repayments (for both personal loans and credit cards) should not exceed 33% of a borrower's salary.
Yes. Borrowing limits for personal loans: (i) 20 times of salary or monthly income; (ii) loan tenor of 48 months (iii) debt-service ratio of 50 percent of the borrower’s monthly salary.
Limits on loan-to-deposit ratios Yes. A voluntary 60-65% for most banks and 70-75% for those without large investments outside loans.
Yes. 80%, but relaxed to 85% in response to liquidity pressures during global financial crisis.
Yes. 87.5% Yes. 90% for credit ratio (loan-to-deposit ratio). Yes. 85%. Yes. Max 100% for the Advances to Stable Resources Ratio.
Ceiling on credit or credit growth No Yes, temporary credit growth limits as of 2011
No No No, but credit growth is an important indicator followed by SAMA on a monthly basis; especially credit to the private sector.
No
Liquidity requirements Yes. 25%, Liquid assets/total assets
Yes. 18%, Liquid assets /domestic currency customer deposits.
Yes. Limit of 15% for negative mismatches in one year time bands.
Yes. 100%, Current assets / liabilities weighted by liquidity characteristics
Yes. 20%, Liquid assets/deposits. Basel III-type regulation is pending.
Caps on foreign currency lending No No Yes. Lending to non-residents in foreign currency abroad is limited to 5% of net worth.
FX loans can only be extended to borrowers with foreign currency cash flows.
No No
Limits on foreign exchange positions No No Yes Foreign currency liabilities cannot exceed foreign currency assets.
No Up to banks' internal risk management systems
Limits on exposure concentration (individual large exposure, % of total capital)
Yes. 15% of regulatory capital. Yes. 15%. Yes 15% of bank's net worth for a single borrower.
Yes. Max limit of credit facilities to a single borrowing group is 20% of bank capital and reserves. Total credit facilities granted to all customers and their borrower groups, at 10% or more of bank's capital and reserves, must not exceed 600% of bank'scapital and reserves.Total credit facilities granted to related parties must not exceed 100% ofbank's capital and reserves.
Yes, the legal limit is 25%. In practice the limit is 15%.
Yes. 25% for commercial public sector entities, 7% for private sector and individuals
Sources: Country authorites and IMF staff
UN
ITED ARAB EM
IRATES
INTERN
ATION
AL MO
NETARY FU
ND
23

UNITED ARAB EMIRATES
24 INTERNATIONAL MONETARY FUND
References
Ahuja, A. and Nabar, M., 2011, “Safeguarding Banks and Containing Property
Booms: Cross-Country Evidence on Macroprudential Policies and Lessons from Hong Kong SAR” IMF WP/11/284.
Al-Jafari, M. and Walker, D., 2011, “Deposit Insurance in the MENA Region” World Bank MENA Financial Flagship Paper.
Borio, Claudio, and Mathias Drehmann, 2009, “Towards an Operational Framework for Financial Stability: “Fuzzy” Measurement and its Consequences,” BIS Working Paper No. 284 (June).
Charap, J., 2011, “Macroprudential Policy in Kuwait”. IMF Article IV Selected Issues Paper
Crowe C., G. Dell'Ariccia, D. Igan, and P. Rabanal. 2011. “Policies for Macrofinancial Stability: Options to Deal with Real Estate Booms”. IMF Staff Discussion Note.
Edy, M., 2012, “Macroprudential supervision and the role of central banks”, Remarks to the Regional Policy Forum on Financial Stability and Macroprudential Supervision, Financial Stability Institute and the China Banking Regulatory Commission, Beijing, 28 September 2012.
European Central Bank, 2010,.”New quantitative measures of systemic risk”. In: Financial Stability Review December 2010.
Fitch, 2009, “GCC Banks: Risks from Retail Lending” GCC Special Report.
Galati, G. and R. Moessner, 2011, “Macroprudential Policy – A Literature Review”, BIS Working Paper, No. 337.
International Monetary Fund, 2011a, “Macroprudential Policy: An Organizing Framework.” Washington DC.
International Monetary Fund, 2011b, “Institutional Models for Macroprudential Policy”, Staff Discussion Note, Washington DC.
International Monetary Fund, Article IV Consultation Reports of GCC Countries, 2010-12.
International Monetary Fund, 2013a, “The Interaction of Monetary and Macroprudential Policies”. IMF Policy Papers.
International Monetary Fund, 2013b, “The Interaction of Monetary and Macroprudential Policies – Background Paper”. IMF Policy Papers.

UNITED ARAB EMIRATES
INTERNATIONAL MONETARY FUND 25
Jacome, L., Nier, E., and Imam, P., 2012, “Building Blocks for Effective Macroprudential Policies in Latin America: Institutional Considerations”, IMF Working paper WP/12/183, Washington DC.
Maino, R., Imam, P. and Ojima, Y., 2013, “Macroprudential Policies for a Resource Rich Economy: The Case of Mongolia” IMF WP/13/18.
Sensenbrenner, G., 2010, “Implications of Basel III for GCC Regulators and Banks”. Manuscript.
Uttamchandani, M., 2010, “No Way Out: The Lack of Efficient Insolvency Regimes in the MENA Region.” World Bank Policy Research Working Paper 5609, World Bank, Washington, DC.
World Bank, 2011, “Financial Access and Stability: A Roadmap for the Middle East and North Africa” World Bank MENA Development Report.
UNITED ARAB EMIRATES
INTERNATIONAL MONETARY FUND 26
II. CONTAINING RISKS IN THE GOVERNMENT RELATED ENTERPRISE SECTOR
A. Introduction
1. Government-related entities (GREs) have contributed substantially to economic diversification. The economy is dominated by a web of commercial corporations, financial institutions, and investment arms, related to the Government of Dubai (GD) and the Government of Abu Dhabi (GAD).1 These companies have been instrumental in the economic development and diversification strategies of Dubai and Abu Dhabi.
2. GREs have also been a source of vulnerability for the UAE economy. GREs were substantially involved in the boom-and-bust cycle of the mid-2000s, and the resolution of the 2009 crisis has illustrated the risk that large-scale GRE debt, even where not explicitly guaranteed, may end up on the government balance sheet.
3. The 2009 Dubai World debt standstill announcement prompted a wave of debt restructurings in the UAE. The combination of substantial short-term borrowing by highly leveraged GREs in Dubai, the price correction in the real estate market, and maturity mismatches forced Dubai World (DW), a major Dubai GRE, to seek a debt standstill in November 2009. The DW debt restructuring led to an increase in Dubai sovereign debt, with spillovers to the banking sector and financial markets. Several other GREs have completed debt restructuring in Dubai and Abu Dhabi since then, while others have still not completed the process.
4. Despite the progress in debt restructuring and more proactive management of debt rollovers in recent years, GREs continue to pose significant risk to the economy. Staff analysis has highlighted that persistently high GRE debt and weaknesses in GRE transparency and corporate governance in Dubai pose risk to financial stability, act as a drag on lending to the private sector, and contribute to substantial contingent liability to the Government of Dubai. The UAE’s GREs are also strongly interconnected with banks through ownership and financial linkages. The interconnectedness coupled with nontransparent corporate governance structures and practices makes managing the evolution of interconnected leverage challenging, which could raise systemic risks.
5. Past staff advice emphasized that mitigating GRE risks should be a key policy priority. Staff stressed the desirability of a comprehensive strategy aimed at completing the restructuring of GRE debt, and communicating the authorities’ strategy on GRE debt refinancing. Containing GRE risks going forward calls for limits on overall GRE borrowing by emirate, developing a GRE risk management framework, and reporting contingent liabilities arising from GREs in the fiscal accounts.
1 See “Risks posed by Government-related entities in the United Arab Emirates,” Selected Issues Paper Chapter (2011).

UNITED ARAB EMIRATES
INTERNATIONAL MONETARY FUND 27
GRE governance also needs to be improved, including by clarifying ownership, government support strategy, and delineating commercial and noncommercial operations carried by the GREs. Finally, better information disclosure about GRE financial accounts would improve investor confidence and ultimately translate into lower funding costs.
6. The remainder of the chapter is organized as follows. Section B briefly describes the recent progress with GRE debt restructuring. Section C presents trends in GRE debt in Abu Dhabi and Dubai, and selected financial indicators for Dubai’s GREs. Section D focuses on measures to safeguard the financial system from GRE risk. Section E takes stock of the current state of the debt management framework and the corporate governance of GREs. Finally, Section F provides recommendations for improving corporate governance.
B. Progress with GRE Debt Restructuring Since 2011
7. Following the debt standstill announcement in November 2009, completing the Dubai World restructuring took nearly a year, and was finalized in October 2010. The restructuring plan covered US$24.9 billion of debt, of which US$14.4 billion was owed to some 90 domestic and foreign banks and the remaining US$10.5 billion to the government of Dubai.2 Banks provided maturity extensions and interest reductions, and the government of Dubai converted its claim into equity acting through the Dubai Financial Support Fund (DFSF). Moreover, the government (again, through the DFSF) provided US$8 billion new equity to Nakheel (DW’s real estate development subsidiary), and converted its existing US$1.2 billion debt into equity.
8. While Abu Dhabi also underwent a major real estate price correction, its impact on the emirate’s GREs has been limited. The most important impact has been on Aldar, the emirate’s flagship property developer. The company received substantial support from the Government of Abu Dhabi in several steps. In early 2011, Aldar sold some of its major assets, including the Formula One circuit on Yas Island, and the Ferrari World theme park to the government, and received a $5.2 billion rescue package through the Government of Abu Dhabi. In late 2011, Aldar received further support through a Dh16.8 billion ($4.6 billion) transaction. This agreement involved a package of property sales, transfers and reimbursements between Aldar and the Government of Abu Dhabi. These transactions lowered Aldar’s debt burden and improved its liquidity profile. Aldar merged with Sorouh, another Abu Dhabi GRE in the property development sector in June 2013.
2 See Box 1 on the Dubai Debt Restructuring in the 2011 IMF Article IV report.

UNITED ARAB EMIRATES
28 INTERNATIONAL MONETARY FUND
Box II.1. Major GRE Restructuring Deals Several other GREs have also completed debt restructuring in the last three years following the Dubai World debt restructuring. These finalized debt restructuring transactions of nonfinancial GREs amounted to about $8.5 billion. The most important restructuring deals are as follows:1
Nonfinancial GREs:
Dubai Holding Commercial Operations Group (hospitality, retail and development arm of Dubai Holding): $555 million loan extension by five years. The restructuring was finalized in December 2010.
Dubai Aerospace (aircraft leasing, services, and maintenance): $800 million loan extension by four years. Deal finalized in March 2011.
Dubai Holding (one of Dubai’s main holding companies, owned by the Ruler of Dubai): $1.16 billion loan extension by five years. Deal finalized in August 2011.
Dubai International Capital (private equity firm with an international portfolio of diverse assets, parent company is Dubai Holding): $2.5 billion loan extended by three and five years. Restructuring period ended in April 2012.
Dubai Drydocks (ship-building and repair firm, parent company is Dubai World): $2.2 billion restructuring by five-year loan extension and longer-term profit participation notes. Restructuring finalized in August 2012 under Decree 57 of the Dubai World Tribunal that was set up in 2009 to deal with disputes related to Dubai World restructuring.
Limitless (property developer with local and international projects, parent company originally Dubai World, following the restructuring owned by Dubai government): $1.2 billion loan extension. Restructuring finalized in October 2012.
Financial sector:
Insolvent Dubai Bank (originally owned by Dubai Holding) was merged into Emirates National Bank of Dubai in October 2011.
Tamweel (Islamic mortgage company) was taken over by Dubai Islamic Bank, its majority shareholder, in the first quarter of 2013.
Major remaining problem companies:
Dubai Group (private equity company with financial services focus and a portfolio of regional and international assets, owned by Dubai Holding): $6 billion bank debt is in the final stages of restructuring.
Zabeel Investments (private equity company owned by Dubai’s ruling family): $1.2 billion bank debt restructuring still under negotiation.
Amlak (Islamic mortgage provider, partly owned by Emaar properties): Over $2 billion loan restructuring is under negotiation. _______________________________________________________________________________________________________ 1 See Exotix Credit Research Snap: Dubai Inc’s bank debt restructurings: some indigestion, but 2/3 complete (April 19, 2012) for more details and a summary assessment of restructurings up to April 2012.
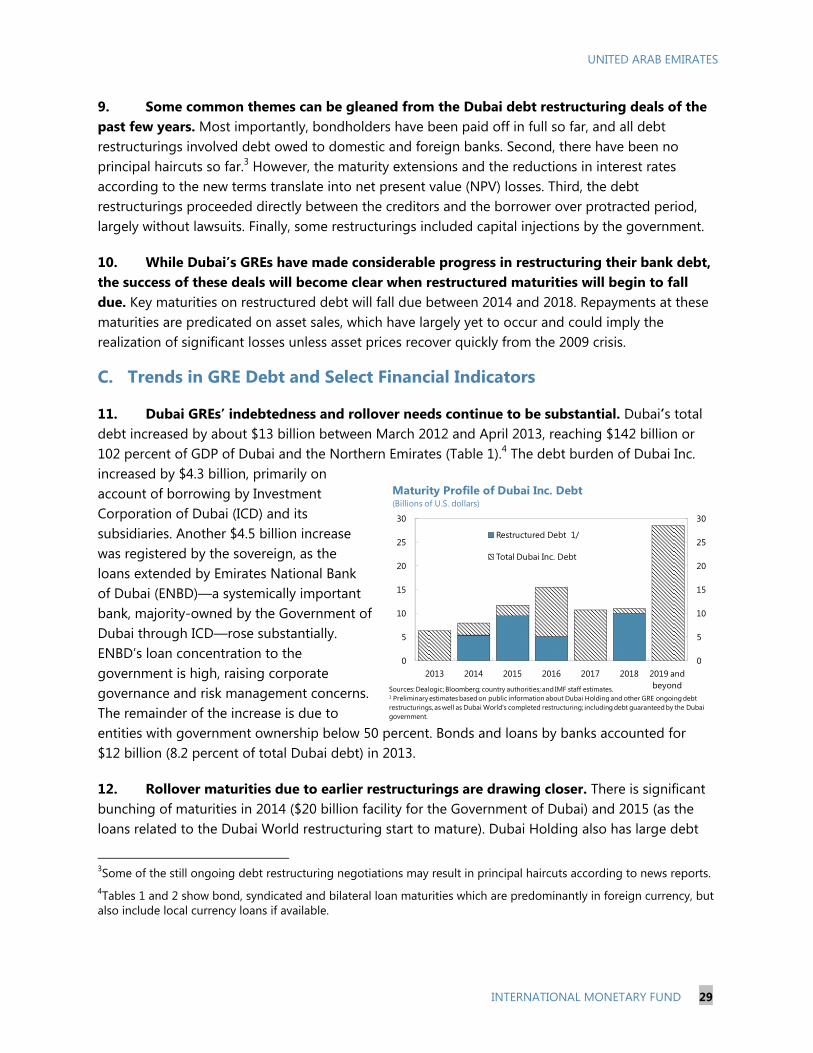
UNITED ARAB EMIRATES
INTERNATIONAL MONETARY FUND 29
0
5
10
15
20
25
30
0
5
10
15
20
25
30
2013 2014 2015 2016 2017 2018 2019 and beyond
Restructured Debt 1/
Total Dubai Inc. Debt
Sources: Dealogic; Bloomberg; country authorities; and IMF staff estimates.1 Preliminary estimates based on public information about Dubai Holding and other GRE ongoing debt restructurings, as well as Dubai World's completed restructuring; including debt guaranteed by the Dubai government.
Maturity Profile of Dubai Inc. Debt (Billions of U.S. dollars)
9. Some common themes can be gleaned from the Dubai debt restructuring deals of the past few years. Most importantly, bondholders have been paid off in full so far, and all debt restructurings involved debt owed to domestic and foreign banks. Second, there have been no principal haircuts so far.3 However, the maturity extensions and the reductions in interest rates according to the new terms translate into net present value (NPV) losses. Third, the debt restructurings proceeded directly between the creditors and the borrower over protracted period, largely without lawsuits. Finally, some restructurings included capital injections by the government.
10. While Dubai’s GREs have made considerable progress in restructuring their bank debt, the success of these deals will become clear when restructured maturities will begin to fall due. Key maturities on restructured debt will fall due between 2014 and 2018. Repayments at these maturities are predicated on asset sales, which have largely yet to occur and could imply the realization of significant losses unless asset prices recover quickly from the 2009 crisis.
C. Trends in GRE Debt and Select Financial Indicators
11. Dubai GREs’ indebtedness and rollover needs continue to be substantial. Dubai’s total debt increased by about $13 billion between March 2012 and April 2013, reaching $142 billion or 102 percent of GDP of Dubai and the Northern Emirates (Table 1).4 The debt burden of Dubai Inc. increased by $4.3 billion, primarily on account of borrowing by Investment Corporation of Dubai (ICD) and its subsidiaries. Another $4.5 billion increase was registered by the sovereign, as the loans extended by Emirates National Bank of Dubai (ENBD)—a systemically important bank, majority-owned by the Government of Dubai through ICD—rose substantially. ENBD’s loan concentration to the government is high, raising corporate governance and risk management concerns. The remainder of the increase is due to entities with government ownership below 50 percent. Bonds and loans by banks accounted for $12 billion (8.2 percent of total Dubai debt) in 2013.
12. Rollover maturities due to earlier restructurings are drawing closer. There is significant bunching of maturities in 2014 ($20 billion facility for the Government of Dubai) and 2015 (as the loans related to the Dubai World restructuring start to mature). Dubai Holding also has large debt
3Some of the still ongoing debt restructuring negotiations may result in principal haircuts according to news reports. 4Tables 1 and 2 show bond, syndicated and bilateral loan maturities which are predominantly in foreign currency, but also include local currency loans if available.

UNITED ARAB EMIRATES
30 INTERNATIONAL MONETARY FUND
repayments coming up in 2014 and 2016. Although Dubai’s operating environment improved markedly, these large rollovers, particularly for the GREs, could still prove challenging.
13. Abu Dhabi’s sovereign and GRE debt is moderate as a percentage of GDP and has declined since last year. Abu Dhabi’s total debt declined by about $3.6 billion to $104.7 billion or 43 percent of Abu Dhabi’s estimated 2012 GDP (Table 2). Abu Dhabi sovereign’s share in total debt declined to 7 percent from 10 percent last year. Abu Dhabi Water and Electricity Authority (ADWEA) and International Petroleum Investment Company (IPIC) account for the lion’s share of GRE debt with 22 percent and 32 percent of total, respectively. Abu Dhabi banks’ debt represents about 9 percent of total Abu Dhabi debt.
14. Selected financial indicators for those Dubai GREs for which information is available generally show improvement (Table 3).5 While a number of entities were reporting losses in 2010, as of end-2012 all entities are profitable, most of them with increased returns relative to previous years. The recovery is most pronounced in real estate where profits have returned after some significant losses in recent years. Dubai Holding Commercial Operations Group that showed deep losses in 2010, in particular, improved its profitability ratios significantly. While profitability has increased for most GREs, it has come down in some cases where it had been relatively high previously (e.g. Emirates Airline). Debt ratios are mostly stable or falling, while debt-to-equity ratios are more mixed but also slightly down in the aggregate. Real estate companies’ ratios indicate deleveraging, whereas companies in the transport and financial services show a more mixed trend. However, for many key GREs, financial reports are not publically available, rendering an assessment of the overall financial performance of Dubai’s GREs impossible (Table 4).
5The table includes the main Dubai GREs for which financial ratios were publicly available.

UNITED ARAB EMIRATES
INTERNATIONAL MONETARY FUND 31
Table II.1. Dubai: Maturing Bonds and Syndicated Loans 1/ 2/
As of April, 2013 Debt Type 2013 2014 2015 2016 2017 Beyond Unallocated Total
Government of Dubai3
Bonds 0 21,931 500 1,000 600 1,900 25,931Loans 100 103 56 293 1,250 32 1,834Total 100 22,034 556 1,293 1,850 1,932 27,765
Dubai, other sovereign4 Loans domestic 21,464 21,464Total 21,464 21,464
Investment Corporation of Dubai and subsidiariesBonds 1,327 608 164 3,717 1,573 4,217 11,607Loans 1,497 93 510 2,862 150 5,649 10,761Total 2,824 701 674 6,579 1,723 9,867 22,368
Dubai World and subsidiaries, NakheelBonds 0 350 3,200 0 1,500 3,522 8,572Loans 1,046 350 6,516 1,614 3,698 11,808 25,031Total 1,046 700 9,716 1,614 5,198 15,329 33,603
Dubai Holding and subsidiariesBonds 93 973 0 0 984 0 2,050Loans 44 3,600 0 5,955 0 0 9,599Total 136 4,573 0 5,955 984 0 11,648
Other Dubai Inc.5
Bonds 871 200 1,325 500 0 1,500 4,396Loans 1,528 1,800 0 855 2,816 2,782 9,781Total 2,399 2,000 1,325 1,355 2,816 4,282 14,177
Total Dubai Inc. 6,405 7,974 11,715 15,503 10,722 29,478 81,796
Total Dubai Debt 6,505 30,008 12,271 16,796 12,572 31,410 21,464 131,026
Dubai Inc. (less than 50% government ownership)6
Bonds 599 0 500 500 800 1,720 4,119Loans 699 450 0 3,642 0 2,550 7,340Total 1,298 450 500 4,142 800 4,270 11,460
7,804 30,458 12,771 20,938 13,372 35,680 21,464 142,486
In percent of Dubai and NE 2012 GDP 5.6 21.7 9.1 14.9 9.5 25.4 15.3 101.5
Memorandum items:Restructured debt 0 5,400 9,450 5,100 0 10,000 29,950Government guaranteed7 1,366 581 606 642 955 2,606 6,756Total Government of Dubai including guarantees 1,466 22,615 1,162 1,935 2,805 4,538 34,521Of total debt: bonds and loans by banks 1,427 608 614 2,500 3,715 2,805 11,668
Sources: Dealogic, Zawya, Bloomberg, Dubai authorities, and IMF staff estimates.
1 Excluding bilateral bank loans and accounts payable, except for the sovereign.2 Regardless of residency of debt holders.3 Includes syndicated and bilateral loans.4 Emirates National Bank of Dubai related party lending.5 Includes DEWA, DIFC, DAE, Borse Dubai, ICD and others.6 Dubai GREs with government ownership below 50% (Emaar, DIB, CBD).7 Mainly ICD holding level and DEWA debt, in addition to the government's.
(In millions of U.S. dollars)
Total, including GREs with minortity ownership

UNITED ARAB EMIRATES
32 INTERNATIONAL MONETARY FUND
Table II.2. Abu Dhabi: Maturing Bonds, Syndicated and Bilateral Loans
As of June 30, 2012 Debt Type 2013 2014 2015 2016 Beyond Total
Government of Abu DhabiBonds 0 1,500 0 0 1,500 3,000Loans 396 385 388 390 1,838 3,397Guarantees 150 150 150 150 600 1,200Total 546 2,035 538 540 3,938 7,597
Abu Dhabi Investment Council1
Bonds 365 1,933 1,303 1,225 1,702 6,528Loans 2,046 0 0 881 0 2,927Total 2,411 1,933 1,303 2,106 1,702 9,455
Abu Dhabi Water & Electricity Authority2
Bonds 1,950 1,200 0 1,000 4,117 8,267Loans 1,169 1,106 1,081 1,171 10,046 14,573Total 3,119 2,306 1,081 2,171 14,163 22,840
EtihadBonds 0 0 0 0 0 0Loans 314 325 337 349 1,991 3,316Total 314 325 337 349 1,991 3,316
International Petroleum Investment Company Bonds 400 0 1,000 3,512 8,392 13,304Loans 9,429 4,578 2,834 925 1,596 19,362Total 9,829 4,578 3,834 4,437 9,988 32,666
Mubadala Development Company3
Bonds 0 1,243 0 743 1,528 3,514Loans 1,325 488 1,033 370 3,517 6,733Total 1,325 1,731 1,033 1,113 5,045 10,247
Tourism and Development Investment CompanyBonds 0 2,000 0 0 0 2,000Loans 600 80 0 0 0 680Total 600 2,080 0 0 0 2,680
Other Abu Dhabi Inc.4
Bonds 0 0 0 0 0 0Loans 1,935 945 481 467 673 4,501Total 1,935 945 481 467 673 4,501
Total Abu Dhabi Inc. 19,533 13,898 8,069 10,643 33,562 85,705
Total Abu Dhabi debt 20,079 15,933 8,607 11,183 37,500 93,302
Abu Dhabi Inc. (less than 50% government ownership)5
Bonds 1,021 1,250 0 1,357 500 4,128Loans 0 3,394 2,261 1,228 383 7,267Total 1,021 4,644 2,261 2,585 883 11,394
Total, including GREs with minortity ownership 21,100 20,577 10,868 13,768 38,383 104,696
In percent of Abu Dhabi 2012 GDP 8.6 8.4 4.5 5.6 15.7 42.9
Memorandum items:Of total debt: bonds and loans by banks 2,412 1,933 1,302 2,106 1,702 9,455
Sources: Dealogic, Zawya, Bloomberg, Abu Dhabi authorities, and Fund staff estimates.
1 Includes ADCB, NBAD, UNB.2 Includes TAQA & US$6.6 billion non-recourse debt for IWPP.3 Includes Dolphin, EMAL.4 Includes ADPC, GHC, ADNEC.5 Below 50 percent government-owned entities; includes Aldar, FGB, NCCC, Sorouh, ADIB.
(In millions of U.S. dollars)

UN
ITED ARAB EM
IRATES
Table II.3. Dubai GREs: Selected Financial Indicators
INTERN
ATION
ALM
ON
ETARYFU
ND
33
Sector Q4 2012 Q4 2010 Q4 2012 Q4 2010 Q4 2012 Q4 2010 Q4 2012 Q4 2010 Q4 2012 Q4 2010
Dubai Holding Commercial Operations Group1 Financial Services 100% 0.83 0.84 6.09 6.69 0.04 0.02 0.3% 0.2% 2.5% 1.9%DP World Transport 80% 0.38 0.49 0.77 1.23 0.19 0.13 3.6% 2.1% 7.2% 5.4%Emirates Airline2 Transport 100% 0.68 0.64 2.47 2.06 0.03 0.08 2.0% 6.5% 7.3% 20.8%Emirates NBD Financial Services 56% 0.88 0.88 7.46 7.50 0.28 0.21 0.8% 0.8% 7.0% 7.0%Emirates Islamic Bank Financial Services 100% 0.93 0.91 13.43 10.51 0.11 0.07 0.2% 0.2% 3.1% 2.2%Union Properties Real Estate 48% 0.64 0.73 2.26 2.73 0.11 -0.53 1.9% -10.3% 6.9% -38.7%Emaar Properties Real Estate 31% 0.46 0.50 0.87 1.00 0.26 0.20 3.5% 3.9% 6.5% 7.9%Dubai Islamic Bank Financial Services 30% 0.89 0.89 8.84 8.54 0.29 0.15 1.2% 0.6% 12.1% 6.0%Tamweel Financial Services 57% 0.79 0.79 3.76 3.60 0.13 0.05 0.7% 0.3% 3.2% 1.2%Deyaar Development Company Real Estate 43% 0.40 0.49 0.68 0.96 0.07 -1.03 0.6% -38.0% 1.0% -74.6%Commercial Bank of Dubai Financial Services 20% 0.83 0.85 4.78 5.55 0.51 0.42 2.2% 2.1% 12.5% 14.0%Dubai Investments Financial Services 12% 0.31 0.35 0.48 0.59 0.13 0.29 2.5% 5.7% 3.8% 9.5%Dubai Financial Market3 Financial Services 80% 0.03 0.06 0.03 0.06 1.11 1.37 0.5% 1.0% 0.5% 1.0%
Total 0.79 0.79 3.95 4.00 0.10 0.07 1.3% 0.9% 6.4% 4.8%Total excluding-DHCOG 0.78 0.78 3.75 3.73 0.10 0.08 1.4% 1.1% 6.7% 5.1%Real Estate 0.48 0.54 0.94 1.17 0.22 -0.11 3.0% -2.3% 6.0% -5.0%1 latest available is Q4 20112 latest available is Q1 2012 compared to Q1 2010 3 latest available is Q3 2012 compared to Q3 2010
Select Financial Ratios as of Q4 2012 (or latest availible)Debt Ratio Debt-Equity Ratio Profit Margins ROA ROEGovernment
Ownership

UNITED ARAB EMIRATES
34 INTERNATIONAL MONETARY FUND
D. Safeguarding the Financial System from GRE Risk
15. The CBU has implemented several measures since the 2009 crisis to better assess and contain GRE risk in the financial system:
The CBU issued new regulations to harmonize loan classification and provisioning practices across banks, and to move toward forward-looking provisioning.6 Before the crisis it was difficult to compare the adequacy of provisioning under the International Financial Reporting Standard (IFRS). To complement IFRS, the central bank issued in 2010 new loan classification and provisioning guidelines to help ensure greater uniformity across banks and increase the banks’ forward looking general provisions. In addition, general provisions are being raised to 1.5 percent by 2014.
The central bank has limited dividend distribution in recent years to ensure that banks are amply capitalized. The aim is to build buffers in an environment where the recognition of NPLs has been gradual. In the current context where banks generate healthy operational profits but face the legacy of high NPLs, restricting dividend distribution continues to be a useful tool to build resiliency in the banking sector.
The CBU has made substantial progress in strengthening its systemic risk analysis, including related to GRE risk. The CBU conducts macro stress testing semiannually for credit risk, predominantly based on GRE credit risk scenarios, and intends to make stress testing an integral part of systemic surveillance.
16. Swift implementation of the planned new concentration limits on GRE lending would further strengthen the banking system. The CBU postponed the implementation of new prudential norms for aggregate limits on bank lending to Emirati governments and GREs. The planned regulations should be issued as soon as possible, including with a view to safeguarding banks from taking undue additional exposure to GREs. Regulation should include transition paths for banks that will not be realistically able to meet the new concentration limits immediately. In addition, imposing higher capital charges and introducing forward provisioning on exposures to risky GREs would further mitigate risks to the banking system.
17. An in-depth diagnostic of bank governance would help improve corporate governance practices in the banking sector. The prevalence of government control of local banks that are heavily involved in lending to GREs, as well as concentration risk in some banks, highlights the potential for governance issues. Good governance complements effective supervision and is integral to the implementation of the risk-based approach to oversight.
__________________________________ 6 See “Ensuring Financial Sector Stability in the United Arab Emirates,” Selected Issues Paper Chapter (2011).

UNITED ARAB EMIRATES
INTERNATIONAL MONETARY FUND 35
E. Improving the Overall GRE Framework
Debt Management Framework
18. The framework for the management of sovereign debt has improved markedly in Abu Dhabi. Abu Dhabi set up an office for debt management in 2009, and the Debt Management Office (DMO) received final approval from the Cabinet in 2012. Debt management decisions follow the public debt policy guidelines developed by the office. The current guidelines indicate a total debt/GDP ceiling of approx. 40-45 percent, encompassing public debt, explicit sovereign guarantees, and implicit guarantees to strategically important state-owned enterprises (SOE) as announced by the government. The policy also stipulates a ceiling on the annual increase in net debt of five percent. Abu Dhabi’s current sovereign credit rating is AA by Standard and Poor’s and Fitch, and Aa2 by Moody’s. Abu Dhabi is considering issuing local currency debt to establish a dirham yield curve. A benchmark dirham yield curve would facilitate domestic debt market development, and thus help reduce UAE firms’ reliance on foreign funding and provide an alternative to borrowing from the domestic banking sector, especially for long-term funds.
19. Abu Dhabi has publicly announced its full support for the emirate’s most important SOEs. Currently, four Abu Dhabi SOEs have been announced to enjoy government support due to their strategic importance to Abu Dhabi’s economy: Tourism Development and Investment Company (TDIC), Mubadala Development Company, International Petroleum Investment Company (IPIC) and Abu Dhabi National Energy Company (TAQA).7 The government controls the activities of these companies through the Board of Directors appointed by the government, each of which includes key members of Abu Dhabi’s Executive Council.
20. While in a less formalized manner, Dubai’s sovereign debt management framework has also improved. Dubai Department of Finance (DoF) created a dedicated team for managing sovereign debt issuance and guarantees. The DoF makes public sovereign debt data along with specific details about all explicit guarantees issued by the government. While Dubai regularly issues sovereign bonds, its debt issues remain unrated by credit rating agencies. Dubai does not currently have plans to establish a local currency yield curve.
21. The progress in the GRE debt management framework has been more uneven, with Abu Dhabi achieving more transparency than Dubai. Abu Dhabi has made notable progress in monitoring and disseminating GRE debt and other financial data through its debt management office. The DMO centralizes decisions regarding GRE borrowing if any entity requires a government guarantee. GREs have to develop sound projections and a deleveraging plan to qualify for support for debt issuance. Currently, only the four major state-owned enterprises—Mubadala, TDIC, IPIC and Taqa—borrow internationally. Abu Dhabi’s GREs are required to operate on a commercial basis, and
_________________________________ 7 The announcement is available at www.tdic.ae.
UNITED ARAB EMIRATES
36 INTERNATIONAL MONETARY FUND
report their financial information according to International Financial Reporting Standards. Abu Dhabi aims at achieving investment grade for its GREs on a standalone basis.
22. The transparency of financial conditions, debt stocks and maturity profiles of Dubai’s GREs continues to be inadequate for an assessment of the sector’s financial health and associated macroeconomic risks. While the Supreme Fiscal Committee plays a major role in monitoring GRE debt and approving new borrowing, there is no official information on either the aggregate amount or the maturity profile of the indebtedness of Dubai’s GREs. Thus, the overall financial position and potential future financing requirements of Dubai’s GREs may not be fully identified. The financial accounts of publicly listed GREs are available individually, but information on unlisted GREs is selective, and in the case of several major GREs it is scarce or not available.
23. The Dubai government has pointed out that Dubai GREs are not backed by a sovereign guarantee, but it may provide support to strategic GREs on a case-by-case basis. Other than the contingent liabilities under the guarantees declared by the government (Table 1), Dubai does not publish a list of GREs to be supported by the government. The government highlighted that certain strategic GREs have significant borrowings which are not direct obligations of the Government. If any of these entities are unable to, or are potentially unable to, fulfill their debt obligations, the Government, although not legally obliged to do so and without any obligation whatsoever, may at its sole discretion decide to extend such support as it may deem suitable, and based on such terms as it may deem suitable, to any such entities in order to allow them to meet their debt obligations.8
24. Building on this, Dubai should establish a full debt management office. Once the federal public debt law is enacted, the Dubai government also intends to pass its own law in compliance with the federal debt law and formally set up a debt management office. This office should be tasked with implementing a proper risk management framework entailing effective identification, assessment, monitoring, and reporting of contingent liabilities arising from GREs.
Current State of Corporate Governance in the UAE
25. GREs face distinct challenges in terms of corporate governance given their dominant role in the UAE economy. GREs have been major drivers of growth and development in the last couple of decades and their business model supported the rapid expansion of the economy. This business model, however, has been put to the test by the recent debt restructuring operations, which highlighted a need for change in GREs’ corporate governance practices. A move towards better corporate governance, particularly for well established mature GREs, including in real estate, hospitality and finance, involves better corporate disclosure, structured decision making, and improved internal control mechanisms.
_________________________________ 8 See the base prospectus for Dubai Department of Finance Sukuk issued in January 17, 2013.

UNITED ARAB EMIRATES
INTERNATIONAL MONETARY FUND 37
26. The UAE’s recent corporate governance reforms mostly focused on listed private sector enterprises and did not apply to many GREs. In the wake of 2009 crisis, the authorities introduced a new corporate governance code which applied to all joint stock companies and institutions listed on the Abu Dhabi Securities Exchange and the Dubai Financial Market.9 The companies were required to comply with the new code by April 2010, which set high standards of corporate governance based on best international practice. The new code entails changes in the board structure with introduction of independent board members, requires formation of different committees including an audit committee, brings in strict internal control systems and an annual report on corporate governance practices to the regulatory body. The new corporate governance code, however, does not apply to companies that are wholly owned by the federal or local governments. The companies partly owned by the federal and local governments could also be exempted by the regulatory agency from the application of certain parts of the code. Moreover, the code does not apply to financial institutions regulated by the central bank, which had its own corporate governance regulation for banks. Other important steps for strengthening corporate governance were the introduction of corporate governance guidelines for small and medium-sized enterprises in Dubai and drafting of a corporate governance code for the real estate sector, the first of its kind, in 2011 by the Dubai Real Estate Regulatory Agency.
27. Recognizing the need for moving towards better corporate governance practices in GREs, the authorities have taken some initial steps. Hawkamah, the Institute for Corporate Governance, a regional initiative of the Dubai International Financial Centre (DIFC), the Organisation for Economic Co-operation and Development (OECD) and World Bank’s International Financial Corporation (IFC), launched a project to improve corporate governance of state-owned enterprises in Middle East and North Africa in 2008.10 In 2010, the government of Abu Dhabi established a governance committee to supervise development and adoption of governance concepts and frameworks in the public sector.11 Abu Dhabi also set up the Office of State Owned Enterprises in 2012 to coordinate and monitor activities of its GREs and upgrade their corporate governance. Dubai overhauled the executive boards of many GREs in the wake of 2009 crisis, and installed a new set of board of directors with key government officials’ representation on the board (DW, Nakheel, Dubai Drydocks, JAFZA, DIFC, Limitless, ENBD, NIB, DREC). Dubai also strengthened the role of the Supreme Fiscal Committee in GREs’ decision making process. In addition, the federal government adopted a decree in 2011 to raise corporate governance standards in federal government related enterprises.
______________________________ 9 Linklaters (2010). 10 Hertog (2012) 11 Norton Rose (2011)
UNITED ARAB EMIRATES
38 INTERNATIONAL MONETARY FUND
28. Corporate governance practices are generally more advanced in listed nonfinancial GREs. These GREs publish their externally audited financial accounts regularly and some of them have internal audit units (Tables 4 and 5).12 While many of them publish corporate governance reports, adoption of other good corporate governance practices like audit and risk management committees and non-executive board members seem to be uneven, particularly in large real estate developers. Moreover, related party disclosure in many of the GREs remains limited by international standards.13
29. Better corporate governance practices are needed in unlisted GREs to limit the risks to the sovereign balance sheet. In the UAE, particularly in Dubai, most unlisted GRE annual reports are not published, including audited balance sheets and income statements even though many of these enterprises are externally audited and have good financial reporting systems. Information on off-balance sheet liabilities is often unavailable and so are data about overall activity, employment and investment. Some of these GREs, however, started to share more information after 2009 crisis as their large financing needs pushed them to issue corporate bonds, requiring release of key financial information to investors. Overseas expansion of GREs also played a role in more information disclosure and progress in adoption of good corporate governance practices. Looking ahead, a better framework including improved transparency and disclosure, better regulation and a revamped board structure could help limit risks taken by these enterprises.
_______________________________________ 12 Momany and Pillai (2012) p. 16 found that all UAE companies listed on Abu Dhabi Securities Exchange in investment and finance, real estate, energy and telecommunication sectors present their financial information on their websites. Their study also suggests that companies’ corporate governance mechanisms also play an important role in internet financial reporting. 13 Alkafaji (2012), p 12, suggest that top 10 UAE public companies by market capitalization do not have sufficient disclosure to fully meet international accounting standards.

UNITED ARAB EMIRATES
INTERNATIONAL MONETARY FUND 39
Table II.4. Dubai Selected Corporate Governance Practice Indicators
Listed Financial Report Externally Audited
Internal Audit Function
Chair Separate from CEO
Non-Executive Board
Members
Specialized Committees
Corporate Governance
Code
Corporate Governance Report
Dubai Holding -- -- Yes -- No -- -- -- --
Dubai Holding Commercial Operations Group Yes Quarterly Yes Yes No -- -- -- --
Dubai Properties Group -- -- -- Yes Yes Yes Audit, Risk -- --
Jumeirah Group -- -- -- -- No -- -- -- --
Tatweer -- -- -- -- No -- -- -- --
TECOM Investments -- -- -- Yes Yes Yes Audit, Risk -- --
Dubai Holding Investment Group -- -- -- -- No -- -- -- --
Dubai Group -- -- -- Yes No -- Audit, Risk -- --
Dubai International Capital -- -- -- -- Yes -- -- -- --
Dubai World -- -- -- -- Yes Yes Audit, Risk -- --
Drydocks World -- -- -- -- No -- -- -- --
Economic Zones World -- -- -- -- Yes -- -- -- --
Jebel Ali Free Zone -- -- -- -- Yes -- -- -- --
Istithmar World -- -- -- -- Yes Yes -- -- --
Limitless -- -- -- -- Yes -- -- -- --
Nakheel Yes No1 -- -- Yes -- -- -- --
Ports and Free Zone World -- -- -- -- No -- -- -- --
Dubai Maritime City -- -- -- -- Yes -- -- -- --
DP World Yes Semi-Annualy Yes Yes Yes Yes Audit Yes Yes
Investment Corporation of Dubai -- -- -- -- Yes -- -- --Dnata -- -- Yes -- No -- -- --
Dubai Aluminum Company -- -- -- -- Yes -- Audit & Risk -- --
Dubai Duty Free -- -- -- -- Yes -- -- --
Dubai Electricity and Water Authority (DEWA) -- -- -- -- Yes -- -- --
Dubai World Trade Centre -- -- -- -- Yes -- -- --
Emirates Airline -- Quarterly Yes -- No -- -- --
Emirates National Oil Company -- -- -- Yes -- Audit -- --
Emirates NBD Yes Quarterly Yes Yes Yes Yes Audit & Risk -- --
Emirates Islamic Bank Yes Quarterly Yes -- Yes -- -- -- --
Union Properties Yes Quarterly Yes -- Yes -- -- -- Yes (Arabic only)
Cleveland Bridge and Engeneering Middle East -- -- -- -- Yes -- -- -- --
Dubai Cable Company -- -- -- -- Yes -- -- -- --
National Bonds Corporation -- -- Yes Yes Yes -- -- -- --
Emaar Properties Yes Quarterly Yes -- Yes -- -- Yes Yes
Amlak Finance Yes No2 Yes -- Yes -- -- --
Dubai Islamic Bank Yes Quarterly Yes Yes Yes Yes Audit Yes --
Tamweel Yes Quarterly Yes -- Yes -- -- -- --
Deyaar Development Company Yes Quarterly Yes -- Yes -- -- Yes Yes
Noor Investment Group -- -- -- -- Yes -- -- -- --
Commercial Bank of Dubai Yes Quarterly Yes -- Yes -- -- -- --
Dubai Investments Yes Quarterly Yes Yes Yes Yes Audit -- Yes
Borse Dubai -- -- Yes -- No -- -- -- --
Dubai Financial Market Yes Quarterly Yes -- Yes -- -- -- --
Dubai Aerospace Entreprise -- -- -- -- Yes -- -- -- --
Emirates Investment and Development Company -- -- Yes -- Yes -- -- -- --
Dubai International Finance Centre -- -- -- -- Yes -- -- -- --
Sources: Zawya, company websites. 1 No published financial statements since June 2010. 2 No published financial statements since September 2011.

UNITED ARAB EMIRATES
40 INTERNATIONAL MONETARY FUND
Table II.5. Abu Dhabi: Selected Corporate Governance Practice Indicators
Listed Financial Report Externally Audited
Internal Audit
Function
Chair Separate from CEO
Non-Executive
Board Members
Specialized Committees
Corporate Governance
CodeCorporate
Governance Report Abu Dhabi Airports Company (ADAC) -- -- -- -- Yes -- -- -- --
Abu Dhabi Investment Council (ADIC) -- -- Yes Yes Yes -- Audit, Due Diligence
Yes Yes
Al Hilal Bank -- Annually Yes Yes Yes Yes Audit, Risk, Corporate Governance
Yes Yes
Abu Dhabi Investment Company -- -- Yes Yes Yes -- Audit -- --National Bank of Abu Dhabi Yes Quarterly Yes Yes -- -- -- --Abu Dhabi Commercial Bank Yes Quarterly Yes Yes Yes Yes Audit, Risk,
Governance Yes Yes
Union National Bank Yes Quarterly Yes -- Yes -- -- -- --Abu Dhabi National Chemicals Company -- -- -- Yes -- -- -- --Abu Dhabi Aviation Yes Quarterly Yes Yes No Yes Risk and Audit Yes YesAbu Dhabi National Insurance Company Yes Quarterly Yes -- Yes -- -- -- Yes (Arabic only) Al Ain Ahlia Insurance Company Yes Quarterly Yes -- Yes -- -- -- Yes (Arabic only) Abu Dhabi National Hotels Yes Quarterly Yes -- Yes -- -- -- Yes (Arabic only) Emirates Insurance Company Yes Quarterly Yes Yes Yes Yes Audit, Risk
ManagementYes Yes
Abu Dhabi Islamic Bank Yes Quarterly Yes -- Yes -- -- -- --Sorouh Real Estate Company Yes Quarterly Yes Yes Yes -- Audit -- Yes (Arabic only) National Corporation for Tourism and Hotels Yes Quarterly Yes -- Yes -- -- -- Yes (Arabic only)
Abu Dhabi National Exhibition Company (ADNEC) -- -- -- -- Yes -- -- -- --Abu Dhabi Ports Company (ADPC) -- -- -- -- Yes -- Audit -- --Abu Dhabi Water and Electricity Authority (ADWEA) -- -- -- -- Yes -- -- --
Abu Dhabi National Energy Company (TAQA) Yes Quarterly Yes Yes Yes -- Audit -- --Etihad Airways -- -- -- Yes Yes Yes Audit -- --Senaat General Holding Corporation -- -- Yes -- Yes -- -- -- --International Petroleum Investment Company (IPIC) -- Annually Yes -- Yes -- -- -- --Mubadala Development Company -- Annually Yes -- Yes -- -- Yes --
Abu Dhabi Aircraft Technology -- -- -- -- Yes -- -- -- --Abu Dhabi Future Energy Company -- -- -- -- Yes -- -- -- --Advance Technology Investment Company -- -- -- -- Yes -- -- -- --Al Taif Technical Services -- -- -- -- Yes -- -- -- --Al Yah Satellite Communications Company -- -- -- -- Yes -- -- -- --Injazat Data Systems -- -- -- -- Yes -- -- -- --Abu Dhabi Finance -- -- -- -- Yes -- -- -- --Dolphin Energy Limited -- -- -- Yes Yes -- -- -- --LeasePlan Emirates -- -- -- -- Yes Yes -- -- --Emirates Aluminum Company -- -- -- -- Yes Yes -- -- --Emirates Ship Investment Company -- -- -- -- Yes -- -- -- --Abu Dhabi Ship Building Company Yes Quarterly Yes Yes Yes Yes Audit Yes YesAgility Abu Dhabi Company -- -- -- -- Yes -- -- -- --Dunia Finance -- -- Yes Yes Yes -- Audit, Risk -- --Abu Dhabi Terminals -- -- -- -- Yes -- -- -- --Al Maabar International Investments -- -- -- -- Yes -- -- -- --Emirates Integrated Telecommunications Company Yes Quarterly Yes Yes Yes Yes Audit Yes Yes Aldar Properties Yes Qarterly Yes Yes Yes -- Audit Yes Yes (Arabic only) Waha Capital Yes Qarterly Yes Yes Yes -- Audit -- --National Central Cooling Company (TABREED) Yes Qarterly Yes -- Yes Yes Audit -- Yes First Gulf Bank Yes -- -- -- Yes -- Audit, Risk -- --
Tourism Development and Investment Company (TDIC) -- Annually -- -- Yes -- -- -- --
Sources: Zawya, company websites.

UNITED ARAB EMIRATES
INTERNATIONAL MONETARY FUND 41
F. The Way Forward for Improving Corporate Governance
30. The OECD Guidelines in Corporate Governance of State-owned Enterprises (the Guidelines) could help design a better corporate governance framework in GREs.14Some principles in the Guidelines such as having clear mandates have long been practiced by GREs and underpinned their success in the past. Implementation of other principles of the Guidelines, where applicable, can improve GREs’ performance, decision-making process and risk management practices by their emphasis on strengthened board structures, transparency and disclosure and effective regulatory framework. Some of these issues were also identified as priorities for the GCC state-owned enterprises in a recent study by the OECD.15
31. Strengthening the role and structure of boards as a collective decision making body is a key priority. The Guidelines stipulate that boards should be strong, have the necessary authority, competencies and objectivity to carry out their function of strategic guidance and monitoring of management, and be held accountable for their actions to owners. The Guidelines also emphasize that the boards should be composed so that they can exercise objective and independent judgment. Against this backdrop, GRE boards appear more passive than boards in other advanced countries.16 At the same time, they have few independent directors, and board members are from a small circle representing both political leadership and senior technocrats closely related to them. In such a setting, the chairman of the board who is often from the political leadership, becomes the de facto decision maker in the board, weakening the collective decision making function of the board. Also, in many cases, board members have several other responsibilities in other GREs or in government in different capacities, preventing them from fully focusing on their work in a particular GRE.
32. Another important priority is to increase transparency and disclosure of GREs, including reporting of risks. GREs already implement several recommendations of the Guidelines regarding disclosure and transparency. Many GREs have high-quality accounting standards, their internal audit functions are in place, and their accounts are externally audited. However, much of this information is kept within the enterprise and not shared with public. The disclosure, if required, is often kept at a statutory minimum and not comprehensive. The Guidelines recommend the disclosure of financial and non-financial information, as well as material information on all matters, highlighting significant room for improvement for the GREs. Reporting of material risks is particularly important in the GRE context. The Guidelines recognize that inadequate reporting of material risk factors could lead to inappropriate strategic decisions and unexpected financial losses
________________________________ 14 OECD (2005), The OECD Guidelines in Corporate Governance of State-owned Enterprises Guidelines cover the following areas: (i) Ensuring an Effective Legal and Regulatory Framework for State-owned Enterprises; (ii) the State Acting as an Owner; (iii) Equitable Treatment of Shareholders; (iv) Relations with Stakeholders; (v) Transparency and Disclosure; (vi) The Responsibilities for the Boards of State-owned Enterprises. 15 Hertog (2012), The study cites “improving transparency and accountability, preparing listings of minority stakes in some state-owned enterprises, consolidating state-owned enterprises ownership under professional management, reproducing successful ownership experiences under state-owned enterprises” as priorities for the GCC countries. 16 Hertog (2012), p. 81.

UNITED ARAB EMIRATES
42 INTERNATIONAL MONETARY FUND
when enterprises undertake ambitious strategies without clearly identifying related risks. Likewise, GREs should report on any financial assistance, including guarantees, received from state and any material transaction with related entities.
33. Competition policy and market regulation are other challenges for improving corporate governance. The Guidelines emphasize the creation of a level playing field for private sector companies competing with state-owned enterprises in terms of regulation and access to finance, and separation of the state’s role as owner and market regulator. The UAE has a well developed regulatory capacity in mature industries like telecom and banking which could effectively address competition and market access issues. In other industries, the regulatory capacity needs to be developed to ensure a level playing field for private sector companies, including equal level of access to inputs, finance and infrastructure.17 In addition, GREs continue to enjoy privileged access to finance because of a perception of implicit sovereign guarantees (which persists despite the sovereigns’ repeated “no further bailouts” messages). Against this background, efforts should focus on ensuring equal access to finance for GREs and private sector companies, particularly through the public sector related resources.18
CONCLUSION 34. The UAE’s GREs have contributed substantially to economic diversification, but they have also been a source of vulnerability for the economy. Dubai’s GREs have been instrumental in the emirate becoming a hub for retail and wholesale trade, as well as a major tourism and real estate investment destination for the wider region. Likewise, Abu Dhabi’s GREs are crucial to the emirate’s economic diversification strategy, focusing primarily on petrochemicals, financial services, aviation, renewable energy, and cultural tourism. At the same time, many GREs, particularly in Dubai, were deeply involved in the boom-and-bust cycle of the mid-2000s, and their debt, even when not explicitly guaranteed, ended up on the government balance sheet. Dubai’s GREs have made considerable progress in restructuring their bank debt, nevertheless, the success of these deals will become clear only when restructured maturities will begin to fall due.
35. While the framework for the management of sovereign debt has improved markedly in both emirates, more progress is needed in GRE debt management, particularly in Dubai. Abu Dhabi set up an office for debt management in 2009, and the Dubai Department of Finance (DoF) created a dedicated team for managing sovereign debt issuance and guarantees. While the Supreme Fiscal Committee now plays a major role in monitoring Dubai’s GRE debt and approving new borrowing, official information on their financial conditions and debt is lacking.
________________________________ 17 Hertog (2012), p. 77 18 Hertog (2012), p. 86

UNITED ARAB EMIRATES
INTERNATIONAL MONETARY FUND 43
36. Recognizing that GREs face distinct challenges in terms of corporate governance, the authorities have taken some initial steps, but better practices are needed in unlisted GREs in particular, to limit the risks on the sovereign balance sheet. Abu Dhabi established a governance committee to supervise development and adoption of governance frameworks in the public sector, and also set up the Office of State Owned Enterprises. Dubai overhauled the executive boards of many GREs in the wake of 2009 crisis, and strengthened the role of the Supreme Fiscal Committee in GREs’ decision making process. However, for most unlisted GREs, particularly in Dubai, annual reports are not published, including audited balance sheets and income statements. Looking ahead, a better framework including improved transparency and disclosure, better regulation, and a revamped board structure could help limit risks taken by these enterprises.
UNITED ARAB EMIRATES
44 INTERNATIONAL MONETARY FUND
References
Alkafaji, Yass, 2012, “The Influence of Culture on Accounting Disclosures: the Case of the UAE,” Available at SSRN 2155123, http://papers.ssrn.com/sol3/papers.cfm?abstract_id=2155123 Exotix, 2012, “Credit Research Snap: Dubai Inc’s Bank Debt Restructurings: Some Indigestion, But 2/3 Complete,” April 19, 2012. Hertog, Steffen, 2012, “How the GCC did it: Formal and informal governance of successful public enterprise in the Gulf Co-operation Council countries,” Towards New Arrangements for State Ownership in the Middle East and North Africa, OECD, pp 71–92 Linklaters, 2010, Briefing Note UAE Corporate Governance Regime, http://www.linklaters.com/Publications/20100228/Pages/Index.aspx Momany, Munther Talal, Pillai, Rekha, 2013, “Internet Financial Reporting in UAE-Analysis and Implications.” http://www.wbiconpro.com/106-Munder.pdf. Norton Rose, 2011, Corporate Governance for UAE Companies, http://www.nortonrosefulbright.com/knowledge/publications/54327/corporate-governance- for-uae-companies OECD, 2005, OECD Guidelines on Corporate Governance of State-Owned Enterprises, OECD Publishing

Statistical Appendix
Table 1. United Arab Emirates: Oil and Gas Production, Exports, and Prices, 2004–12
2004 2005 2006 2007 2008 2009 2010 2011 2012
Oil production
Crude oil, incld condensates 2.66 2.68 2.89 2.80 2.84 2.52 2.57 2.81 2.90
Crude oil 2.33 2.38 2.60 2.53 2.57 2.32 2.31 2.55 2.64
Abu Dhabi 2.17 2.24 2.46 2.42 2.49 2.24 2.23 2.47 2.56
Dubai, Sharjah, and Ras Al Khaimah 0.16 0.14 0.14 0.11 0.08 0.08 0.08 0.08 0.08
Condensates 0.33 0.30 0.29 0.27 0.27 0.20 0.26 0.26 0.26
Refinery output 0.56 0.54 0.59 0.57 0.56 0.57 0.57 0.48 0.57
Oil and product exports 2.47 2.46 2.65 2.53 2.58 2.19 2.25 2.38 2.42
Crude oil & condensates 2.19 2.21 2.43 2.36 2.42 2.09 2.15 2.28 2.31
Abu Dhabi 2.01 2.05 2.27 2.23 2.33 2.00 2.06 2.19 2.22
Dubai, Sharjah, and Ras Al Khaimah 0.16 0.14 0.14 0.11 0.08 0.08 0.08 0.08 0.08
Condensates 0.02 0.02 0.02 0.02 0.01 0.01 0.01 0.01 0.01
Refined products 0.28 0.25 0.22 0.17 0.16 0.10 0.10 0.10 0.11
Natural gas production 46.30 47.80 49.00 50.40 50.20 48.80 51.30 51.70 58.21
LNG exports 7.41 7.50 7.77 7.72 7.57 7.70 7.98 7.55 7.74
NGL exports 12.86 13.24 13.57 12.50 12.41 12.80 18.90 25.50 26.59
Domestic gas consumption 40.20 42.10 43.40 49.20 59.50 59.10 60.80 62.90 67.32
Oil and product exports 34,027 49,307 62,935 65,682 91,446 59,571 66,769 99,572 103,593
Crude oil & condensates 29,875 43,867 57,230 60,819 85,428 54,125 60,089 90,641 93,971
Abu Dhabi 27,602 40,845 53,574 57,679 82,210 51,819 57,344 87,880 91,149
Dubai and others 2,046 2,619 3,191 2,727 2,736 2,032 2,493 2,493 2,548
Condensates 227 403 465 413 482 274 252 268 274
Refined products 4,152 5,440 5,705 4,863 6,018 5,446 6,680 8,930 9,622
LNG and NGL exports 4,773 5,771 7,165 8,145 11,546 8,577 7,870 12,030 14,487
LNG exports 1,506 1,601 2,047 2,511 4,567 3,395 3,309 4,539 4,965
NGL exports 3,267 4,170 5,118 5,634 6,979 5,182 4,561 7,492 9,522
Total hydrocarbon exports 38,800 55,078 70,100 73,827 102,992 68,148 74,639 111,602 118,080
Memorandum item:
Average UAE oil export prices 36.3 53.6 63.5 70.4 96.3 62.8 77.0 109.6 112.0
Sources: ADNOC; and Fund staff estimates.
(In U.S. dollars per barrel)
(In million barrels per day)
(In billion cubic meters)
(In millions of U.S. dollars)
(In millions of U.S. dollars)

UNITED ARAB EMIRATES
46 INTERNATIONAL MONETARY FUND
Table 2. United Arab Emirates: Consolidated Government Finances, 2004–12*
Est.
2004 2005 2006 2007 2008 2009 2010 2011 2012
Total revenue 128,926 205,263 283,046 320,118 451,382 253,479 312,817 439,574 494,867
Hydrocarbon1 98,947 153,689 216,457 231,925 360,487 172,315 233,621 361,652 395,873
Nonhydrocarbon 29,980 51,574 66,589 88,193 90,895 81,164 79,196 77,922 98,994
Customs 3,040 3,852 4,687 8,101 8,686 8,546 8,062 9,920 11,106
Profit transfers 3,322 4,624 5,660 12,701 5,228 4,033 5,089 7,339 7,549
Income tax2 320 420 1,093 842 1,190 1,340 1,113 1,093 1,347
Fees and charges 7,044 14,998 13,566 9,719 24,051 24,803 26,157 23,293 25,289
Investment income3 8,550 19,046 31,208 39,230 28,433 19,730 15,738 12,181 25,165
Other 7,703 8,634 10,374 17,600 23,307 22,712 23,037 24,096 28,538
Total expenditure and grants 97,331 105,631 128,675 168,130 255,014 375,929 331,724 387,608 373,104
Current expenditure 82,482 85,694 107,744 127,813 168,176 209,146 225,471 253,676 274,473
Wages and salaries4 15,990 15,915 18,138 21,003 29,001 33,248 31,136 32,092 34,822
Goods and services 28,326 25,453 25,330 36,455 49,179 68,216 36,614 40,597 38,970
Abu Dhabi "federal services"5 23,760 22,784 25,349 31,285 45,552 55,924 72,739 80,413 79,679
Subsidies and transfers 12,335 19,353 37,035 36,425 41,154 46,034 41,004 55,474 75,567
Interest payments 298 238 1 0 347 1,596 2,087 2,239 2,292
Other 1,773 1,951 1,891 2,646 2,943 4,129 41,891 42,861 43,143
Development expenditure 15,064 14,042 11,606 17,271 31,485 45,548 35,446 38,959 30,283
Loans and equity (net) -812 4,880 8,953 20,793 51,794 117,948 68,193 89,388 66,312
Foreign grants6 597 1,015 372 2,252 3,559 3,287 2,613 5,585 2,036
Abu Dhabi 597 1,015 372 2,129 3,485 3,096 2,603 5,538 1,992
Federal 0 0 0 123 74 191 10 47 44
Overall balance (consolidated)* 31,596 99,632 154,371 151,988 196,367 -122,450 -18,907 51,966 121,763
(In percent of GDP) 5.8 15.0 18.9 16.0 16.9 -13.1 -1.8 4.1 8.8
Nonhydrocarbon balance -67,351 -54,057 -62,086 -79,937 -164,120 -294,765 -252,528 -309,686 -274,110
(In percent of GDP) -12.4 -8.1 -7.6 -8.4 -14.2 -31.5 -23.9 -24.2 -19.8
(In percent of nonhydrocarbon GDP) -17.5 -12.4 -12.2 -12.8 -22.5 -43.1 -34.9 -39.9 -32.5
Nonhydrocarbon balance (excluding investment income) -75,901 -73,104 -93,294 -119,167 -192,553 -314,495 -268,266 -321,867 -299,275
(In percent of GDP) -14.0 -11.0 -11.4 -12.6 -16.7 -33.6 -25.4 -25.1 -21.6
(In percent of nonhydrocarbon GDP) -19.7 -16.8 -18.3 -19.0 -26.3 -46.0 -37.1 -41.4 -35.5
Memorandum items:
Hydrocarbon share of revenue (percent) 76.7 74.9 76.5 72.4 79.9 68.0 74.7 82.3 80.0
Sources: Federal government; Emirate finance departments; and Fund staff estimates.
* Consolidated accounts of the federal government, Abu Dhabi, Dubai and Sharjah: GFSM 1986 classification.1 Includes Fund estimates of revenues from other government entities operating in the oil and gas sector.2 Taxes on profit of foreign banks. Income taxes on gas companies are included under hydrocarbon revenues.3 Fund staff estimates.4 Excludes military wages and salaries.5 Largely military and internal security expenditures paid by Abu Dhabi but not in the federal accounts.6 Intragovernmental grants are netted out in the consolidated fiscal accounts.
(Millions of U.A.E. dirhams)

UNITED ARAB EMIRATES
INTERNATIONAL MONETARY FUND 47
Table 3. United Arab Emirates: Federal Government Financial Operations, 2004–12*
Est.2004 2005 2006 2007 2008 2009 2010 2011 2012
Total revenue and grants 22,016 24,939 30,387 34,541 42,802 42,280 39,799 40,864 41,633
Revenues 9,018 11,426 16,286 20,146 26,610 26,780 27,728 27,427 25,574
Enterprise profits1 2,011 2,687 2,853 11,231 3,409 3,263 3,204 5,964 6,235
Other fees and charges 7,007 8,740 13,433 8,915 23,201 23,517 24,524 21,463 19,339
Grants from Emirates 12,998 13,512 14,101 14,395 16,192 15,500 12,071 13,437 16,059
Abu Dhabi 11,798 12,312 12,901 13,195 14,992 14,300 11,471 11,937 14,559
Cash contributions 5,619 6,171 6,779 7,119 9,857 9,743 7,398 7,398 10,861
Federal services26,179 6,141 6,122 6,076 5,135 4,557 4,073 4,539 3,698
Foreign grants on federal account2 0 0 0 0 0 0 0 0 0
Dubai 1,200 1,200 1,200 1,200 1,200 1,200 600 1,500 1,500
Total expenditure and grants 22,533 23,289 28,551 27,800 39,781 41,338 39,592 43,787 42,297
Current expenditures 21,693 22,082 25,605 25,461 36,572 38,563 37,178 37,873 39,937
Wages and salaries 7,998 8,158 8,997 9,387 13,854 15,253 13,187 13,355 14,460
Goods and services (by ministries) 9,902 9,997 9,184 9,448 11,730 11,722 14,530 11,093 11,936
Subsidies and transfers 3,793 3,928 7,424 6,626 10,988 11,587 9,460 13,425 13,541
Development expenditures 715 533 466 920 1,041 1,139 1,159 1,467 1,196
Equity positions 125 674 2,480 1,296 2,094 1,446 1,245 4,400 1,120
Domestic 125 674 2,480 1,296 2,094 1,446 945 4,400 1,120
Foreign grants 0 0 0 123 74 191 10 47 44
Overall balance -516 1,649 1,836 6,740 3,021 943 207 -2,923 -664
Memorandum items:
Abu Dhabi federal services3 23,760 22,784 25,349 31,285 45,552 55,924 72,739 80,413 76,488
Sources: Ministry of Finance; Abu Dhabi Department of Finance.
* GFSM 1986 classification.1 Dividends and payouts by Etisalat and other enterprises, including the Central Bank.2 Amount budgeted by federal government, but outlays are made by Abu Dhabi.3 Mainly military and internal security expenditures not included in the federal accounts.
(Millions of U.A.E. dirhams)

UNITED ARAB EMIRATES
48 INTERNATIONAL MONETARY FUND
Table 4. United Arab Emirates: Abu Dhabi Fiscal Operations, 2004–12*
Est.2004 2005 2006 2007 2008 2009 2010 2011 2012
Total revenue 80,238 132,206 191,833 213,237 305,680 147,117 192,164 281,432 324,150
Hydrocarbon revenue 67,978 104,279 157,125 168,274 269,586 121,775 169,128 261,490 288,713
Crude oil royalties and taxes 64,345 99,699 151,118 162,557 259,227 116,817 162,089 251,220 278,219
Income taxes1 3,633 4,580 6,007 5,717 10,359 4,958 7,038 10,270 10,494
Nonhydrocarbon 12,260 27,927 34,708 44,963 36,094 25,342 23,036 19,942 35,437
Customs 710 635 748 1,427 1,817 1,954 1,392 2,261 3,250
Investment income2 8,550 19,046 31,208 39,230 28,433 19,730 15,738 12,181 25,165
Other 3,000 2,039 2,752 4,306 5,844 3,658 5,906 5,500 7,022
Total expenditure and grants 74,015 79,828 92,310 121,737 187,313 263,804 260,174 318,351 295,867
Current expenditures 50,659 52,503 65,243 81,581 105,431 138,996 159,053 183,920 196,926
Wages and salaries 3,169 3,169 3,236 4,813 5,861 6,006 5,446 5,793 6,051
Goods and services 12,822 12,396 13,591 22,387 32,027 48,929 14,729 21,580 15,599
Federal services3 23,760 22,784 25,349 31,285 45,552 55,924 72,739 80,413 79,679
Water and electricity 3,636 318 0 0 0 0 0 0 0
Subsidies and transfers 7,272 13,836 23,066 23,096 21,784 27,597 25,658 35,276 54,018
Interest payments 0 0 1 0 207 540 877 890 877
Unallocated expenditures 40,481 39,968 40,702
Development expenditures 11,898 9,792 7,321 5,041 13,211 27,635 23,763 29,030 20,136
Water and electricity 2,147 3,002 2,428 1,902 2,300 4,154 3,274 3,018 101
Other 9,751 6,790 4,893 3,139 10,911 23,481 20,489 26,012 20,035
Loans and equity (net) -937 4,206 6,473 19,497 49,700 79,777 63,276 87,926 62,254
Domestic 3,025 4,813 8,798 19,218 50,410 80,686 63,418 88,055 63,666
Loans (net) 1,527 1,607 2,759 10,377 38,070 44,835 18,185 62,096 44,566
Transfers to Dubai 0 0 0 0 0 12,129 11,000 9,923 0
Equity (net) 1,498 3,206 6,039 8,841 12,340 23,722 34,233 16,036 19,100
Foreign loans -3,962 -607 -2,325 279 -710 -909 -142 -129 -1,412
Grants 12,395 13,327 13,273 15,618 18,971 17,396 14,082 17,475 16,551Cash contributions to federal government 5,619 6,171 6,779 7,119 9,857 9,743 7,406 7,398 10,861
Federal services4 6,179 6,141 6,122 6,076 5,135 4,557 4,073 4,539 3,698
Foreign grants on federal account4 0 0 0 294 494 0 0 0 0
Foreign grants5 597 1,015 372 2,129 3,485 3,096 2,603 5,538 1,992
Overall balance 6,223 52,378 99,523 91,500 118,367 -116,687 -68,010 -36,919 28,283
Source: Abu Dhabi Department of Finance.
* GFSM 1986 classification.1 Income taxes are entirely from ADGAS and GASCO.2 Fund staff estimates; not included in finance department accounts.3 Mainly defense and security outlays; not included in the federal accounts.4 Outlays made by Abu Dhabi, but included in the federal accounts.5 Foreign grants on Abu Dhabi account.
(Millions of U.A.E. dirhams)
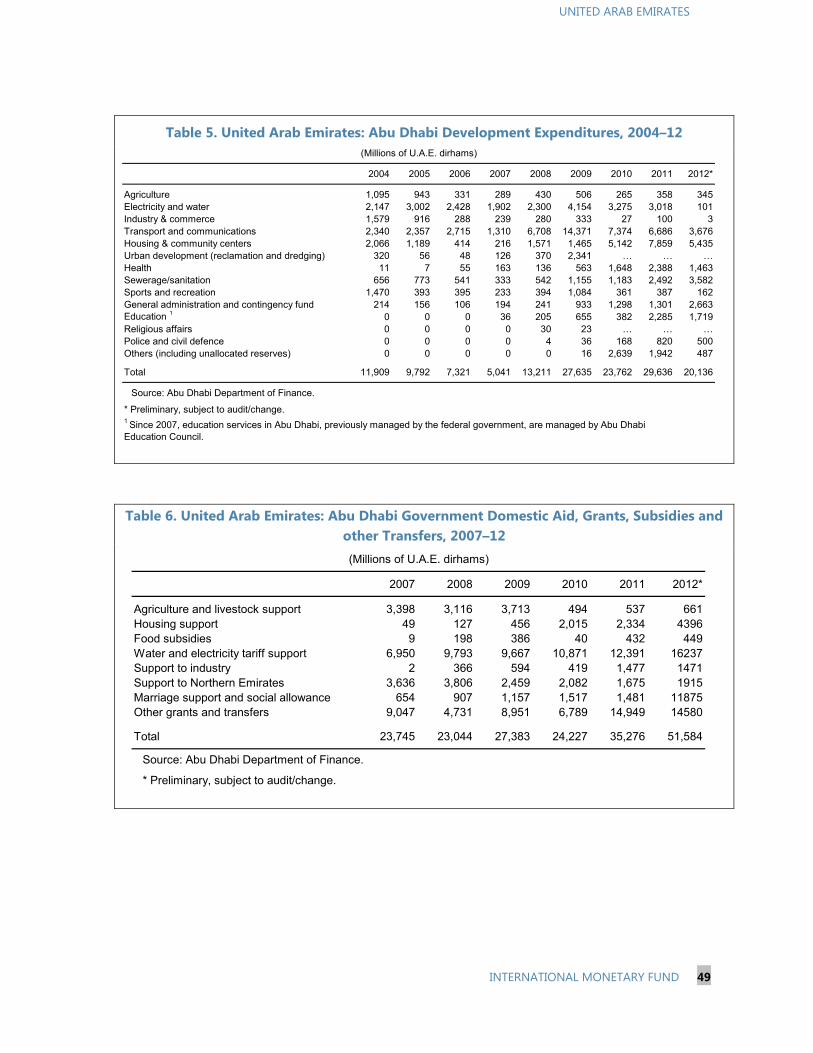
UNITED ARAB EMIRATES
INTERNATIONAL MONETARY FUND 49
Table 5. United Arab Emirates: Abu Dhabi Development Expenditures, 2004–12
Table 6. United Arab Emirates: Abu Dhabi Government Domestic Aid, Grants, Subsidies and other Transfers, 2007–12
2004 2005 2006 2007 2008 2009 2010 2011 2012*
Agriculture 1,095 943 331 289 430 506 265 358 345Electricity and water 2,147 3,002 2,428 1,902 2,300 4,154 3,275 3,018 101Industry & commerce 1,579 916 288 239 280 333 27 100 3Transport and communications 2,340 2,357 2,715 1,310 6,708 14,371 7,374 6,686 3,676Housing & community centers 2,066 1,189 414 216 1,571 1,465 5,142 7,859 5,435Urban development (reclamation and dredging) 320 56 48 126 370 2,341 … … …Health 11 7 55 163 136 563 1,648 2,388 1,463Sewerage/sanitation 656 773 541 333 542 1,155 1,183 2,492 3,582Sports and recreation 1,470 393 395 233 394 1,084 361 387 162General administration and contingency fund 214 156 106 194 241 933 1,298 1,301 2,663Education 1 0 0 0 36 205 655 382 2,285 1,719Religious affairs 0 0 0 0 30 23 … … …Police and civil defence 0 0 0 0 4 36 168 820 500Others (including unallocated reserves) 0 0 0 0 0 16 2,639 1,942 487
Total 11,909 9,792 7,321 5,041 13,211 27,635 23,762 29,636 20,136
Source: Abu Dhabi Department of Finance.
(Millions of U.A.E. dirhams)
* Preliminary, subject to audit/change.1 Since 2007, education services in Abu Dhabi, previously managed by the federal government, are managed by Abu Dhabi Education Council.
2007 2008 2009 2010 2011 2012*
Agriculture and livestock support 3,398 3,116 3,713 494 537 661Housing support 49 127 456 2,015 2,334 4396Food subsidies 9 198 386 40 432 449Water and electricity tariff support 6,950 9,793 9,667 10,871 12,391 16237Support to industry 2 366 594 419 1,477 1471Support to Northern Emirates 3,636 3,806 2,459 2,082 1,675 1915Marriage support and social allowance 654 907 1,157 1,517 1,481 11875Other grants and transfers 9,047 4,731 8,951 6,789 14,949 14580
Total 23,745 23,044 27,383 24,227 35,276 51,584
Source: Abu Dhabi Department of Finance.
* Preliminary, subject to audit/change.
(Millions of U.A.E. dirhams)

UNITED ARAB EMIRATES
50 INTERNATIONAL MONETARY FUND
Table 7. United Arab Emirates: Dubai Government Operations, 2004–12*
Est.2004 2005 2006 2007 2008 2009 2010 2011 2012
Total revenue 11,978 16,900 19,831 25,605 32,618 40,554 40,868 42,614 34,349
Tax revenue 2,415 3,317 4,630 6,838 7,604 7,132 7,057 7,987 8,385
Customs 2,095 2,897 3,537 5,996 6,414 5,792 5,944 6,894 7,038Income tax1 320 420 1,093 842 1,190 1,340 1,113 1,093 1,347
Nontax revenue 9,563 13,583 15,201 18,767 25,014 33,422 33,811 34,627 25,964
Oil and gas 4,213 5,902 6,259 6,770 8,495 4,703 5,014 5,477 5,586Enterprise profits2 1,311 1,937 2,807 1,470 1,819 770 1,885 1,375 1,314
Transfers from Abu Dhabi 0 0 0 0 0 12,129 11,000 9,923 0
Other 4,039 5,744 6,135 10,527 14,700 15,820 15,912 17,852 19,064
Total expenditure 10,543 12,426 17,324 26,501 38,138 90,218 49,093 42,046 38,103
Current 7,836 8,510 14,024 16,384 22,607 26,665 24,968 26,426 27,930
Wages and salaries 3,390 3,933 5,137 5,906 8,168 10,369 10,886 11,200 11,658Goods and services3 2,413 2,178 1,926 3,983 5,073 6,748 6,555 7,197 7,881Subsidies and transfers4 1,207 1,469 6,411 5,168 7,582 5,753 5,357 5,730 6,379
Interest payments 298 238 0 0 141 1,056 1,210 1,349 1,415
Other 528 692 550 1,327 1,643 2,739 960 950 597
Development 1,507 2,716 2,100 8,917 14,331 13,499 8,852 7,135 5,735
Loans and equity (net) 0 0 0 0 0 48,854 14,673 6,985 2,938
Dubai Financial Support Fund 48,854 14,673 6,985 2,938
Grants
Contribution to federal government 1,200 1,200 1,200 1,200 1,200 1,200 600 1,500 1,500
Overall balance 1,435 4,474 2,507 -896 -5,520 -49,664 -8,225 568 -3,754
Source: Dubai Department of Finance.
* GFSM 1986 classification.1 Taxes on foreign banks.2 Includes DUBAL, DUGAS, Emirates Airlines, Jebel Ali, and other public enterprises.3 Includes interest and amortization on some bank loans.4 Excludes Water and Electricity, which is settled in an off-budget account.
(Millions of U.A.E. dirhams)

UNITED ARAB EMIRATES
INTERNATIONAL MONETARY FUND 51
Table 8. United Arab Emirates: Summary Accounts of the Central Bank, 2004–12
End of Period 2004 2005 2006 2007 2008 2009 2010 2011 2012
Foreign assets 68,566 78,184 102,721 285,974 113,546 93,672 120,501 136,624 172,916
Claims on banks 37,309 39,727 57,739 184,368 83,307 89,768 48,169 59,487 66,731
Loans and investments 29,564 36,909 43,299 98,857 29,576 37 68,418 72,301 94,986
Other 1 516 1,021 1,295 2,467 156 70 115 507 6,746
SDR holdings 20 35 45 50 63 3,115 3,061 3,055 3,060
IMF reserve position 1,157 492 343 232 444 682 738 1,274 1,393
Net claims on government -1,157 1,933 282 -232 54,573 106,051 105,992 97,448 88,800
Claims 0 2,425 625 0 55,000 106,725 106,725 98,725 90,193
Less: IMF reserve position 1,157 492 343 232 427 674 733 1,277 1,393
Claims on private nonbanks 2 68 64 59 53 49 56 46 42 42
Claims on commercial banks 0 0 0 0 23,794 6,725 1,421 1,620 513
Unclassified assets 182 190 216 204 1,865 556 4,043 1,585 2,942
Total assets/liabilities 67,659 80,371 103,278 285,999 193,827 207,060 232,003 237,319 265,213
Foreign liabilities3 568 1,177 1,313 1,404 1,235 3,794 3,691 3,190 3,230
Reserve money 38,789 44,314 54,177 92,077 121,728 113,795 112,360 131,900 143,845
Currency outside banks 15,778 17,522 21,837 25,942 36,967 37,217 38,560 41,591 45,615
Cash held by banks 2,714 3,511 4,995 5,730 8,360 8,363 9,215 10,496 12,158
Banks' deposits 20,297 23,281 27,345 60,405 76,401 68,215 64,585 79,813 86,072
Certificates of deposit 15,977 21,033 32,322 173,577 47,183 71,453 94,002 80,407 95,400
Government deposits 4 10,620 12,124 13,651 15,932 20,863 15,935 15,331 599 273
Capital and reserves 1,560 1,560 1,560 1,560 1,500 1,500 1,500 17,152 18,077
Unclassified liabilities 145 163 255 1,449 1,318 583 5,119 4,071 4,388
Source: Central Bank of the United Arab Emirates.
* Preliminary.1 Mainly gold, valued at cost.2 Staff loans.3 Includes SDR allocations.4 Mainly foreign currency deposits.
(Millions of U.A.E. dirhams)

UNITED ARAB EMIRATES
52 INTERNATIONAL MONETARY FUND
Table 9. United Arab Emirates: Balance Sheets of Commercial Banks, 2004–121
End of Period 2004 2005 2006 2007 2008 2009 2010 2011 2012
Reserves 23,011 26,791 32,340 66,135 84,761 76,578 73,800 90,309 97,652
Cash 2,714 3,511 4,995 5,730 8,360 8,363 9,215 10,496 12,158
Deposits with central bank 20,297 23,280 27,345 60,405 76,401 68,215 64,585 79,813 85,494
Foreign assets 126,108 175,028 231,938 196,897 203,386 208,157 233,513 248,876 306,555
Claims on government 31,776 42,055 55,183 69,379 85,181 112,530 121,868 122,931 143,425
Claims on public sector enterprises 2 13,884 24,797 33,002 45,385 56,064 77,259 87,581 119,852 132,954
Claims on private nonbanks 204,727 290,239 385,730 530,737 777,141 786,495 792,030 819,112 832,535
Claims on nonbank financial institutions 6,612 15,243 32,362 55,208 97,940 94,350 99,708 92,716 100,109
Central bank certificates of deposit 15,977 21,033 32,322 173,577 47,183 71,453 94,002 80,407 95,400
Unclassified assets 10,451 13,317 21,677 40,080 44,293 67,475 76,646 78,966 83,871
Total assets/liabilities 432,546 608,503 824,554 1,177,398 1,395,949 1,494,297 1,579,148 1,653,169 1,792,501
Monetary deposits 65,040 86,927 98,183 155,723 171,171 186,265 194,401 222,505 253,558
Quasi-monetary deposits 161,424 219,615 279,274 384,038 466,172 517,136 553,427 561,662 563,201
Foreign currency 62,496 73,804 96,307 91,007 120,210 123,001 130,264 144,094 139,278
Local currency 98,928 145,811 182,967 293,031 345,962 394,135 423,163 417,568 423,923
Foreign liabilities 3 48,793 85,215 177,688 320,970 282,599 251,086 271,699 289,808 315,379
Government deposits 51,274 79,179 93,680 114,579 198,298 192,614 183,162 174,809 219,541
Government lending funds 18 17 16 16 5,622 13 13 13 13
Credit from central bank 25 26 8 2 25,260 6,776 4,314 1,484 2,567
Capital and reserves 52,463 78,132 104,089 130,882 165,569 244,031 273,038 280,791 298,814
Provision 29,768 30,964 33,183 20,788 25,269 41,454 53,121 68,517 82,564
Unclassified liabilities 23,741 28,428 38,433 50,400 55,989 96,376 99,094 122,097 139,428
Source: Central Bank of the United Arab Emirates.1 Excluding accounts of the restricted license bank.2 Commercial enterprises with significant government ownership, including Dubai Aluminum Company, Dubai Gas Company, Abu Dhabi National.
Oil Company, other oil and gas companies owned by Abu Dhabi, and cement companies established by several Emirate governments.3 Includes commercial prepayments.
(Millions of U.A.E. dirhams)

UNITED ARAB EMIRATES
INTERNATIONAL MONETARY FUND 53
Table 10. United Arab Emirates: Banking System Structure, 2004–12
2004 2005 2006 2007 2008 2009 2010 2011 2012
Number of:
Banks 46 46 46 48 52 52 53 52 54
Private 31 31 31 33 35 36 37 37 38
Local 6 6 6 7 7 7 7 7 7
Foreign 25 25 25 26 28 29 30 30 31
State-owned 15 15 15 15 17 16 16 16 16
Banks
Islamic 4 4 4 6 8 8 8 8 8
Non-Islamic 42 42 42 42 44 44 45 45 46
Branches of foreign banks 111 111 111 111 117 125 133 133 137
Concentration
Banks1 13 11 11 11 11 10 10 10 10
Assets share
Banks 100.0 100.0 100.0 100.0 100.0 100.0 100.0 100.0 100.0
Private commercial 36.1 35.8 36.4 38.2 36.8 35.5 34.6 35.9 34.1
Local 12.6 14.1 14.5 15.6 16.3 16.6 15.9 15.6 14.9
Foreign 23.5 21.8 21.9 22.6 20.6 18.9 18.6 20.3 19.2
State-owned 63.9 64.2 63.6 61.8 63.2 64.5 65.4 64.1 65.9
Banks 100.0 100.0 100.0 100.0 100.0 100.0 100.0 100.0 100.0
Islamic 9.9 11.9 14.0 14.2 15.7 16.0 16.8 15.6 16.0
Non-Islamic 90.1 88.1 86.0 85.8 84.3 84.0 83.2 84.4 84.0
Deposits share
Banks 100.0 100.0 100.0 100.0 100.0 100.0 100.0 100.0 100.0
Private commercial 38.8 38.5 40.1 39.9 37.7 37.2 35.0 36.2 33.1
Local 13.8 14.9 15.6 16.7 16.6 17.2 16.2 16.0 15.2
Foreign 25.0 23.7 24.5 23.2 21.1 20.0 18.7 20.2 17.9
State-owned 61.2 61.5 59.9 60.1 62.3 62.8 65.0 63.8 66.9
Banks 100.0 100.0 100.0 100.0 100.0 100.0 100.0 100.0 100.0
Islamic 13.3 13.8 16.0 17.1 18.1 18.7 18.8 18.0 18.0
Non-Islamic 86.7 86.2 84.0 82.9 81.9 81.3 81.2 82.0 82.0
Source: Central Bank of the United Arab Emirates.
1 Number of institutions with 75 percent of total assets.
(Percent)
(Percent)

UNITED ARAB EMIRATES
54 INTERNATIONAL MONETARY FUND
Table 11. United Arab Emirates: Sectoral Loan Concentration, 2004–121
2004 2005 2006 2007 2008 2008 2009 2010 2011 2012
Agriculture 0.3 0.3 0.3 0.3 0.3 0.3 0.1 0.1 0.1 0.2
Mining and quarrying 1.2 1.1 1.2 1.2 1.1 1.3 0.7 0.7 2.8 2.1
Manufacturing 5.5 5.0 5.1 5.4 5.1 4.9 4.6 4.7 4.6 4.5
Electricity, gas, and water 3.7 3.0 2.3 1.9 2 2.2 2.6 2.5 2.2 1.9
Construction (excluding mortgages) 8.5 6.9 4.8 3.4 3.9 6.8 6.6 6.1 5.4 7.9
Trade 28.1 24.1 19.6 16.4 15.6 13.4 10.5 10.0 10.6 10.3
Transportation, storage, and communication 2.8 3.0 4.1 3.4 2.5 2.7 2.9 2.7 2.6 3.2
Financial institutions (excluding banks)21.4 2.1 3.9 5.7 6.3 7.9 9.0 8.5 7.3 7.2
Government 11.8 11.1 10.1 9.0 8.6 7.8 9.6 9.8 10.3 11.8
Services 7.3 9.0 11.8 14.4 14.6 15.9 14.2 14.1 14.9 13.4
Real estate mortgage loans 4.4 5.0 6.6 7.1 6.6 6.1 6.5 6.6 6.3 4.7
Personal loans
Business 14.8 19.9 18.6 17.0 18.2 17.3 17.9 18.8 18.9 17.5
Consumption 9.3 7.7 6.6 6.7 6.7 7.3 6.9 6.8 6.5 7.9
Others 1.0 1.8 5.0 8.1 8.5 6.1 7.9 8.6 7.5 7.4
Total 100.0 100.0 100.0 100.0 100.0 100.0 100.0 100.0 100.0 100.0
Source: Central Bank of the United Arab Emirates.
1Excludes overseas branches.2 Includes Abu Dhabi Investment Council (ADIC) and Abu Dhabi Investment Authority (ADIA).
(Percent of total credit)
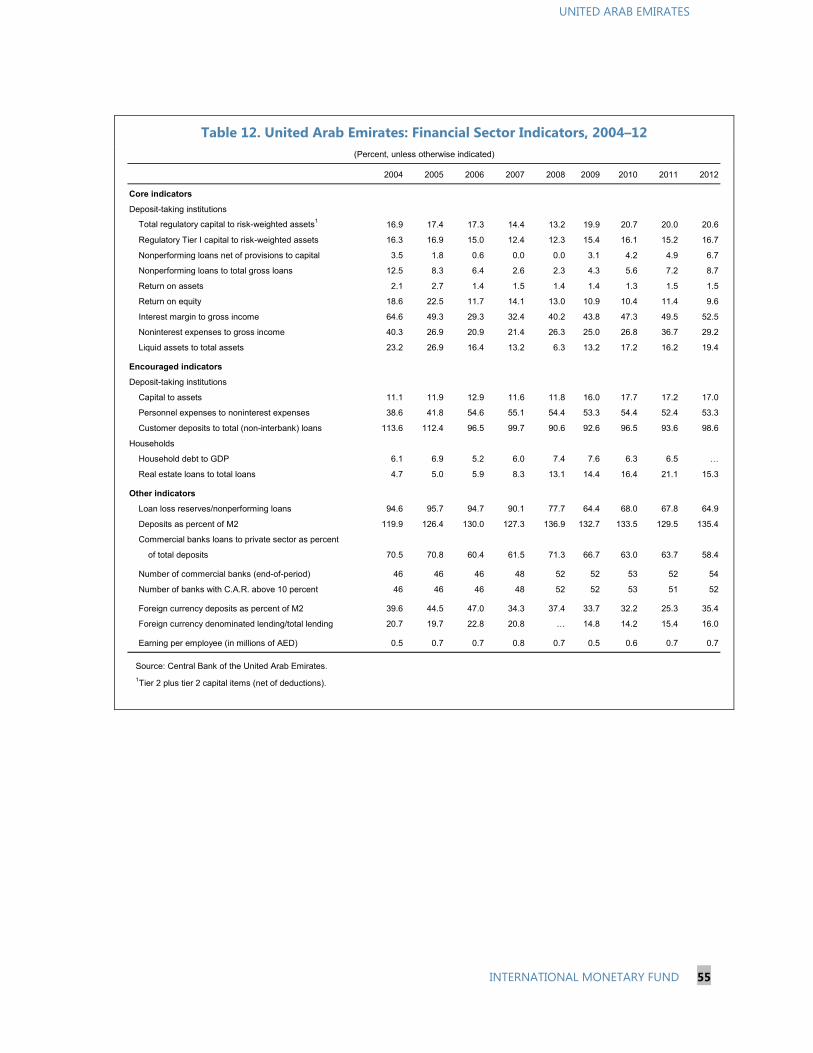
UNITED ARAB EMIRATES
INTERNATIONAL MONETARY FUND 55
Table 12. United Arab Emirates: Financial Sector Indicators, 2004–12
2004 2005 2006 2007 2008 2009 2010 2011 2012
Core indicators
Deposit-taking institutions
Total regulatory capital to risk-weighted assets116.9 17.4 17.3 14.4 13.2 19.9 20.7 20.0 20.6
Regulatory Tier I capital to risk-weighted assets 16.3 16.9 15.0 12.4 12.3 15.4 16.1 15.2 16.7
Nonperforming loans net of provisions to capital 3.5 1.8 0.6 0.0 0.0 3.1 4.2 4.9 6.7
Nonperforming loans to total gross loans 12.5 8.3 6.4 2.6 2.3 4.3 5.6 7.2 8.7
Return on assets 2.1 2.7 1.4 1.5 1.4 1.4 1.3 1.5 1.5
Return on equity 18.6 22.5 11.7 14.1 13.0 10.9 10.4 11.4 9.6
Interest margin to gross income 64.6 49.3 29.3 32.4 40.2 43.8 47.3 49.5 52.5
Noninterest expenses to gross income 40.3 26.9 20.9 21.4 26.3 25.0 26.8 36.7 29.2
Liquid assets to total assets 23.2 26.9 16.4 13.2 6.3 13.2 17.2 16.2 19.4
Encouraged indicators
Deposit-taking institutions
Capital to assets 11.1 11.9 12.9 11.6 11.8 16.0 17.7 17.2 17.0
Personnel expenses to noninterest expenses 38.6 41.8 54.6 55.1 54.4 53.3 54.4 52.4 53.3
Customer deposits to total (non-interbank) loans 113.6 112.4 96.5 99.7 90.6 92.6 96.5 93.6 98.6
Households
Household debt to GDP 6.1 6.9 5.2 6.0 7.4 7.6 6.3 6.5 …
Real estate loans to total loans 4.7 5.0 5.9 8.3 13.1 14.4 16.4 21.1 15.3
Other indicators
Loan loss reserves/nonperforming loans 94.6 95.7 94.7 90.1 77.7 64.4 68.0 67.8 64.9
Deposits as percent of M2 119.9 126.4 130.0 127.3 136.9 132.7 133.5 129.5 135.4
Commercial banks loans to private sector as percent
of total deposits 70.5 70.8 60.4 61.5 71.3 66.7 63.0 63.7 58.4
Number of commercial banks (end-of-period) 46 46 46 48 52 52 53 52 54
Number of banks with C.A.R. above 10 percent 46 46 46 48 52 52 53 51 52
Foreign currency deposits as percent of M2 39.6 44.5 47.0 34.3 37.4 33.7 32.2 25.3 35.4
Foreign currency denominated lending/total lending 20.7 19.7 22.8 20.8 … 14.8 14.2 15.4 16.0
Earning per employee (in millions of AED) 0.5 0.7 0.7 0.8 0.7 0.5 0.6 0.7 0.7
Source: Central Bank of the United Arab Emirates.
1Tier 2 plus tier 2 capital items (net of deductions).
(Percent, unless otherwise indicated)
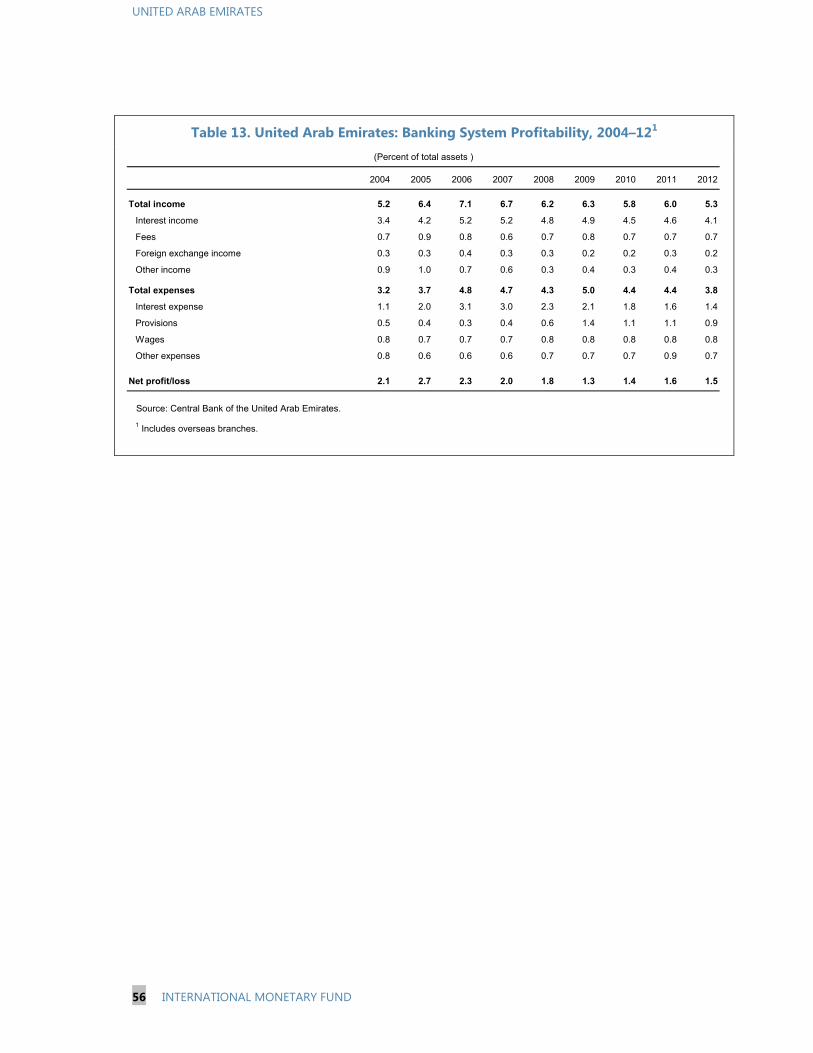
UNITED ARAB EMIRATES
56 INTERNATIONAL MONETARY FUND
Table 13. United Arab Emirates: Banking System Profitability, 2004–121
2004 2005 2006 2007 2008 2009 2010 2011 2012
Total income 5.2 6.4 7.1 6.7 6.2 6.3 5.8 6.0 5.3
Interest income 3.4 4.2 5.2 5.2 4.8 4.9 4.5 4.6 4.1
Fees 0.7 0.9 0.8 0.6 0.7 0.8 0.7 0.7 0.7
Foreign exchange income 0.3 0.3 0.4 0.3 0.3 0.2 0.2 0.3 0.2
Other income 0.9 1.0 0.7 0.6 0.3 0.4 0.3 0.4 0.3
Total expenses 3.2 3.7 4.8 4.7 4.3 5.0 4.4 4.4 3.8
Interest expense 1.1 2.0 3.1 3.0 2.3 2.1 1.8 1.6 1.4
Provisions 0.5 0.4 0.3 0.4 0.6 1.4 1.1 1.1 0.9
Wages 0.8 0.7 0.7 0.7 0.8 0.8 0.8 0.8 0.8
Other expenses 0.8 0.6 0.6 0.6 0.7 0.7 0.7 0.9 0.7
Net profit/loss 2.1 2.7 2.3 2.0 1.8 1.3 1.4 1.6 1.5
Source: Central Bank of the United Arab Emirates.
1 Includes overseas branches.
(Percent of total assets )
Related Documents