1 | P a g e National Sugar Institute, Kanpur Unit Wise Descriptions of Effluent treatment 1:- Screening

Welcome message from author
This document is posted to help you gain knowledge. Please leave a comment to let me know what you think about it! Share it to your friends and learn new things together.
Transcript

1 | P a g e
National Sugar Institute, Kanpur
Unit Wise Descriptions of Effluent treatment
1:- Screening
2 | P a g e
National Sugar Institute, Kanpur
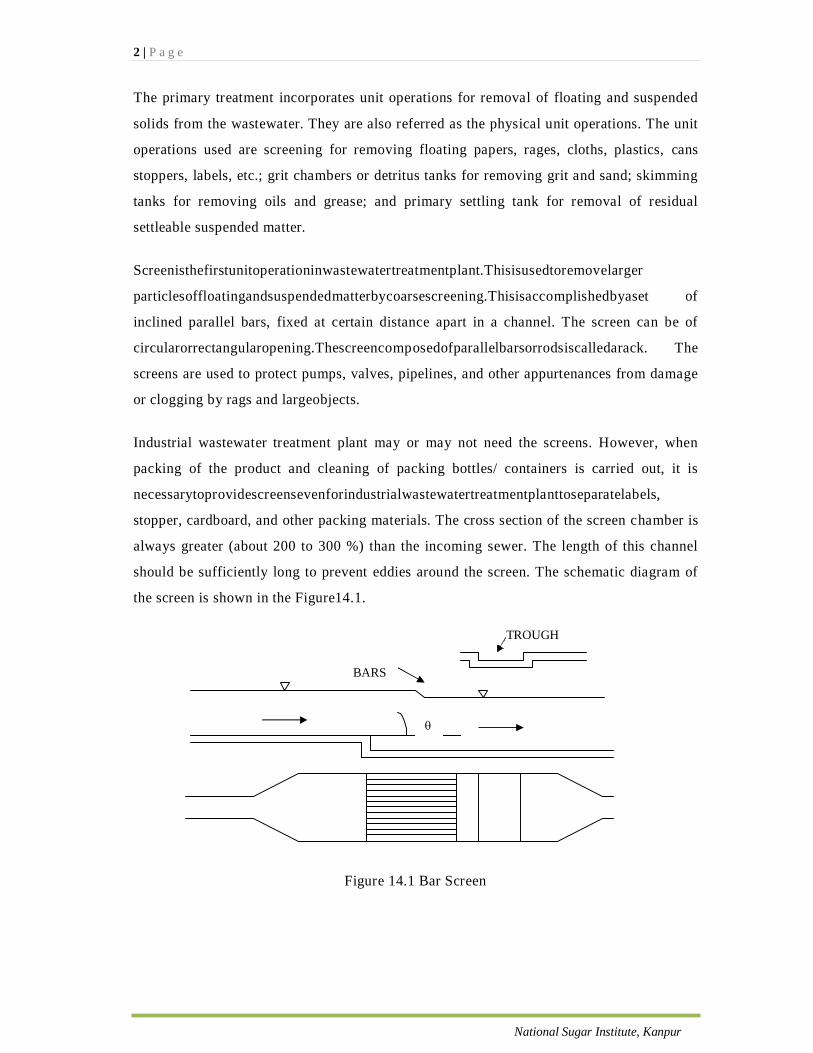
TROUGH
BARS
The primary treatment incorporates unit operations for removal of floating and suspended
solids from the wastewater. They are also referred as the physical unit operations. The unit
operations used are screening for removing floating papers, rages, cloths, plastics, cans
stoppers, labels, etc.; grit chambers or detritus tanks for removing grit and sand; skimming
tanks for removing oils and grease; and primary settling tank for removal of residual
settleable suspended matter.
Screenisthefirstunitoperationinwastewatertreatmentplant.Thisisusedtoremovelarger
particlesoffloatingandsuspendedmatterbycoarsescreening.Thisisaccomplishedbyaset of
inclined parallel bars, fixed at certain distance apart in a channel. The screen can be of
circularorrectangularopening.Thescreencomposedofparallelbarsorrodsiscalledarack. The
screens are used to protect pumps, valves, pipelines, and other appurtenances from damage
or clogging by rags and largeobjects.
Industrial wastewater treatment plant may or may not need the screens. However, when
packing of the product and cleaning of packing bottles/ containers is carried out, it is
necessarytoprovidescreensevenforindustrialwastewatertreatmentplanttoseparatelabels,
stopper, cardboard, and other packing materials. The cross section of the screen chamber is
always greater (about 200 to 300 %) than the incoming sewer. The length of this channel
should be sufficiently long to prevent eddies around the screen. The schematic diagram of
the screen is shown in the Figure14.1.
Figure 14.1 Bar Screen
3 | P a g e
National Sugar Institute, Kanpur
14.1 Types ofScreens
Screenscanbebroadlyclassifieddependingupontheopeningsizeprovidedascoarsescreen (bar
screens) and fine screens. Based on the cleaning operation they are classified as manually
cleaned screens or mechanically cleaned screens. Due to need of more and more
compacttreatmentfacilitiesmanyadvancementinthescreendesignarecomingup.
14.1.1 CoarseScreen
Itisusedprimarilyasprotectivedeviceandhenceusedasfirsttreatmentunit.Commontype of these
screens are bar racks (or bar screen), coarse woven-wire screens, and comminutors. Bar
screens are used ahead of the pumps and grit removal facility. This screen can be manually
cleaned or mechanically cleaned. Manually cleaned screens are used in small treatment
plants. Clear spacing between the bars in these screens may be in the range of 15 mm to
40mm.
14.1.2 Grinder orComminutor
It is used in conjunction with coarse screens to grind or cut the screenings. They utilize
cutting teeth (or shredding device) on a rotating or oscillating drum that passes through
stationary combs (or disks). Object of large size are shredded when it will pass through the
thin opening of size 0.6 to 1.0 cm. Provision of bye pass to this device should always be
made.
14.1.3 FineScreen
Finescreensaremechanicallycleanedscreensusingperforatedplates,wovenwirecloths,or very
closely spaced bars with clear openings of less than 20 mm, less than 6 mm typical.
Commonlytheseareavailableintheopeningsizerangingfrom0.035to6mm.Finescreens are used
for pretreatment of industrial wastewaters and are not suitable for sewage due to clogging
problems, but can be used after coarse screening. Fine screens are also used to remove
solids from primary effluent to reduce clogging problem of tricklingfilters. Various types of
microscreens have been developed that are used to upgrade effluent quality from secondary
treatment plant. Fine screen can be fixed or static wedge-wire type, drum type, step type
and centrifugal screens. Fixed or static screens are permanently set in vertical, inclined, or
horizontal position and must be cleaned by rakes, teeth or brushes. Movable screens are
cleaned continuously while in operation. Centrifugal screens utilize the rotating screens that
separate effluent and solids areconcentrated.
4 | P a g e
National Sugar Institute, Kanpur
14.1.4 Types of Medium and FineScreens
Inclined (fixed): These are flat, cage, or disk type screens meant for removal of smaller
particles. These are provided with opening of 0.25 to 2.5 mm. They are used for primary
treatment of industrial effluents.
Band: It consists of an endless perforated band that passes over upper and lower sprocket.
Brushes are installed to remove the material retained over the screen. Water jet can be used
to flush the debris. Opening size of 0.8 to 2.5 mm is provided in this screen. They are used
for primary treatment of industrial effluents.
Drum Screen or strainer: It consists of rotating cylinder that has screen covering the
circumferential area of the drum. The liquid enters the drum axially and moves radially out.
Thesolidsdepositedareremovedbyajetofwaterfromthetopanddischargedintoatrough. The
micro-strainers have very fine size screens and are used to polish secondary effluent or
remove algae from the effluent of stabilization ponds. Opening size of 1 to 5 mm and 0.25
to2.5mmisusedforprimarytreatmentandopeningsizeof6to40µmisusedforpolishing treatment
of secondaryeffluents.
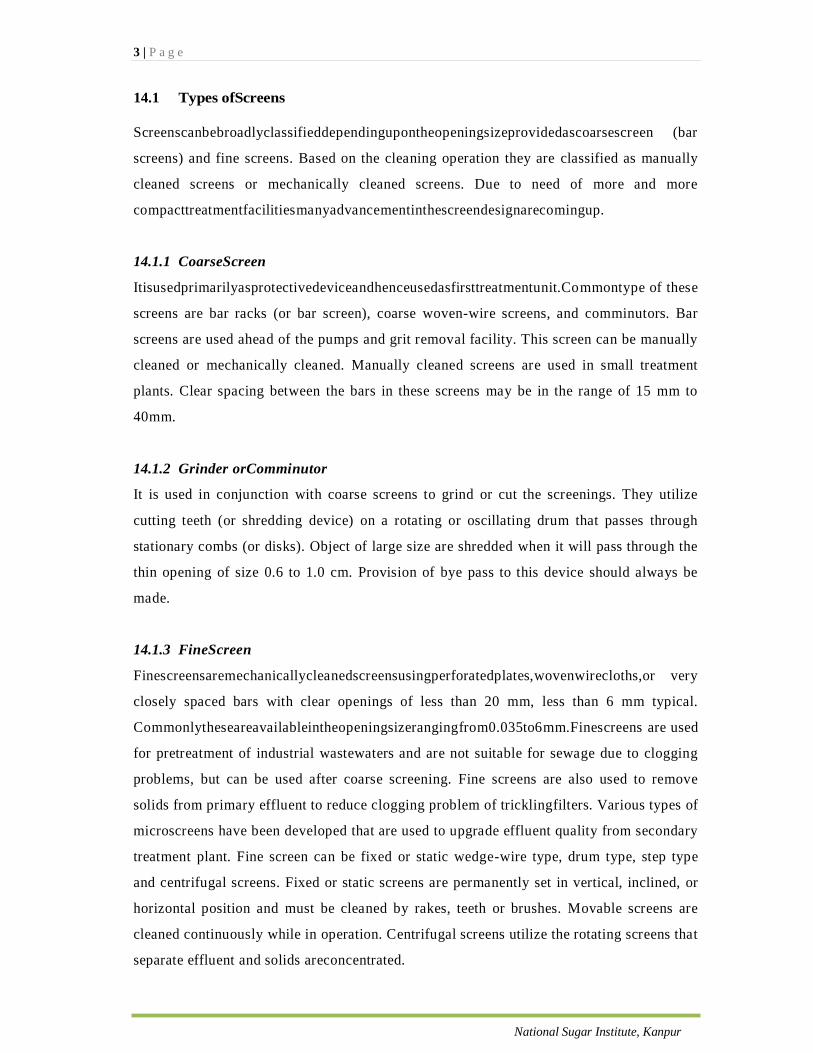
14.2 ScreenChamber
Itconsistsofrectangularchannel.Floorofthechannelisnormally7to15cmlowerthanthe invert of
the incoming sewer. Bed of the channel may be flat or made with desired slope. This
channel is design to avoid deposition of grit and other materials in to it. Sufficient
straightapproachlengthshouldbeprovidedtoassureuniformdistributionofscreeningsover the
entire screen area. At least two bar racks, each designed to carry peak flow, must be
provided. Arrangement of stopping the flow and draining the channel should be made for
routinemaintenance.Theentrancestructureshouldhaveasmoothtransitionordivergenceto
avoidexcessiveheadlossanddepositionofsolids(Figure14.2).Effluentstructureshouldbe
havinguniformconvergence.Theeffluentfromtheindividualrackmaybecombinedorkept
separate asnecessary.
5 | P a g e
Effluent
Gate closed
Gate closed Gate closed
Figure 14.2 Double chamber bar screen and influent and effluentarrangement
14.3 Requirements and Specifications for Design of BarScreen
1. The velocity of flow ahead of and through a screen varies materially and affects its
operation. Lower the velocity through the screen, the greater is the amount of screening
that would be removed. However, at lower velocity greater amount of solids would be
deposited at the bottom of the screenchannel.
2. Approach velocity of wastewater in the screening channel shall not fall below a self
cleansing velocity of 0.42 m/sec or rise to a magnitude at which screenings will be
dislodged from thebars.
The suggested approach velocity is 0.6 to 0.75 m/sec for the grit bearing
wastewaters. Accordingly the bed slope of the channel should be adjusted to
develop thisvelocity.
6 | P a g e
National Sugar Institute, Kanpur
Thesuggestedmaximumvelocitythroughthescreenis0.3m/secataverageflow for
hand cleaned bar screens and 0.75 m/sec at the normal maximum flow for
mechanically cleaned bar screen (Rao and Dutta, 2007). Velocity of 0.6 to 1.2
m/secthroughthescreenopeningforthepeakflowgivessatisfactoryresult.
3. Head losses due to installation of screens must be controlled so that back water will not
cause the entrant sewer to operate under pressure. Head loss through a bar rack can be
calculated by using Kirchmer’sequation:
h = β (W/b)4/3hvSinθ (1)
where, h = head loss,m
β = Bar shapefactor
= 2.42 for sharp edge rectangular bars
= 1.83 for rectangular bars with semicircular upstream
= 1.79 for circular bars
= 1.67 for rectangular bars with both u/s and d/s faces as semicircular.
W = Width of bars facing the flow, m
b =Clearspacingbetweenthebars,m
hv = Velocity head of flow approaching the bars,m
= V2/2g
V =geometricmeanoftheapproachvelocity,m/sec
θ =Angleofinclinationofthebarswithhorizontal.
Usuallyacceptedpracticeistoprovidelossofheadof0.15mbutthemaximumlossofhead with the
clogged hand cleaned screen should not exceed 0.3 m. For mechanically cleaned
screen,theheadlossisspecifiedbythemanufacturer,anditcanbebetween150to600mm.
The head loss through the cleaned or partially clogged flat bar screen can also be calculated
using following formula:
h = 0.0729 (V2–v2) (2)
Where, h = loss of head,m
V = velocity through the screen, m/sec
v = velocity before the screen, m/sec
The head loss through the fine screen can be calculated as:
7 | P a g e
National Sugar Institute, Kanpur
h=(1/(2g.Cd))(Q/A)2 (3)
Where, g = gravity acceleration (m/sec2); Cd is coefficient of discharge = 0.6 for clean rack;
Qisdischargethroughscreen(m3/sec);andAiseffectiveopensubmergedarea(m2).
4. Theslopeofthehandcleanedscreenshouldbeinbetween30to60owithhorizontal.The
mechanicallycleanedbarscreensaregenerallyerectedalmostvertical;howevertheangle with
the horizontal can be in the range 45 to85o.
5. The submerged area of the surface of the screen, including bars and opening should be
about 200% of the cross sectional area of the incoming sewer for separate system, and
300% for the combinedsystem.
6. The clear spacing between the bars may be in the range of 15 mm to 75 mm in case of
mechanicallycleanedbarscreen.However,forthemanuallycleanedbarscreentheclear
spacing used is in the range 25 mm to 50 mm. Bar Screens with opening between 75 to
150mmareusedaheadofrawsewagepumping.Forindustrialwastewatertreatmentthe
spacing between the bars could be between 6 mm and 20mm.
7. Thewidthofbarsfacingtheflowmayvaryfrom5mmto15mm,andthedepthmayvary from 25
mm to 75 mm. Generally bars with size less than 5 mm x 25 mm are not used.
Thesebarsareweldedtogetherwithplatefromdownstreamsidetoavoiddeformation.
14.4 Quantities ofScreening
The quantity of screening varies depending on the type of rack or screen used as well as
sewer system (combined or separate) and geographic location. Quantity of screening removed
by bar screen is 0.0035 to 0.0375 m3/ 1000 m3 of wastewater treated (Typical value = 0.015
m3/1000 m3 of wastewater) (Metcalf & Eddy, 2003). In combined system, the quantity of
screening increases during storm and can be as high as 0.225 m3/1000 m3of wastewater. For
industrial wastewaters quantity of the screening depends on the characteristics of the
wastewater beingtreated.
14.5 Disposal ofScreenings
Screening can be discharged to grinders or disintegrator pumps, where they are ground and
returnedtothewastewater.Screeningscanbedisposedoffalongwithmunicipalsolidwaste
onsanitarylandfill.Inlargesewagetreatmentplant,screeningscanbeincinerated.Forsmall
wastewatertreatmentplant,screeningsmaybedisposedoffbyburialontheplantsite.

8 | P a g e
National Sugar Institute, Kanpur
y
θ
Example: 1
Designabarscreenchamberforaveragesewageflow20MLD,minimumsewageflowof12 MLD
and maximum flow of 30MLD.
Solution: 1. Averageflow = 20MLD
= 0.231 m3/Sec
MaximumFlow = 30MLD
= 0.347 m3/Sec
Minimumflow = 12MLD
= 0.139m3/Sec
2. Assume manual cleaning and angle of inclination of bars with horizontal as 30o.
Assumesizeofbars9mmx50mm,9mmfacingtheflow.Aclearspacingof30mm between
the bars isprovided.
3. Assumevelocityofflownormaltoscreenas0.3m/secataverageflow.
4. Net submerged area of the screen openingrequired
= 0.231m3/Sec = 0.77m2 0.3 m/sec
Assumevelocityofflownormaltothescreenas0.75m/secatmaximumflow,hence net
submerged area of screenopening
0.347m3/Sec = 0.46m2 0.75 m/sec
Provide net submerged area = 0.77 m2
5. Gross submerged area of thescreen
When‘n’numbersofbarsareusedtheratioofopeningtothegrosswidthwillbe
[(n+1)30]/[(n+1)30+9xn]≈0.77(for20to30numberof
bars)
Therefore gross submerged area of thescreen 0.77 /0.77= x 1 m2
6. Thesubmergedverticalcrosssectionalareaofthescreen
= 1.0 x Sin 30 = 0.5 m2
Sin 30 = x/Y
This is equal to c/s area of screen chamber, therefore velocity of flow in screen chamber

9 | P a g e
National Sugar Institute, Kanpur
= 0.231 / 0.5 = 0.462 m/sec
This velocity is greater than the self cleansing velocity of 0.42 m/sec
7. Provide 30 numbers of bars. The gross width of the screen chamber willbe:
= 30 x 0.009 + 31 x 0.03 = 1.2 m
Therefore, liquid depth at average flow = 0.5 / 1.2 = 0.416 m
Provide free board of 0.3 m
Hence,totaldepthofthescreen=0.416+0.3=0.716m,say0.75m
Thus,thesizeofthechannel=1.2m(width)x0.75m(depth)
8. Calculation for bedslope:
R = A/P = (0.416 x 1.2) / (2 x 0.416 + 1.2)
= 0.246 m
Now, V = (1/n) R2/3 S1/2
S1/2 = V.n / R2/3
= 0.462 x 0.013 / (0.246)2/3
S1/2 = 0.0153
Therefore bed slope is nearly 1 in 4272 m
9. Headlossthroughthescreen,h,whenscreenisnotclogged.
h = β (W/b)4/3hv Sin θ
= 2.42 (9/30)4/3 [(0.462)2/(2 x 9.81)] Sin 30
= 2.65 x 10⁻³ m = 0.00265 m = 2.65 mm
Forhalfcloggedscreen,theheadlosscanbeworkedoutusingopeningwidthashalf Thus,
b = 30/2 = 15mm
And h = 6.67 x 10⁻³ m = 6.67 mm < 150 mm
However, provide 150 mm drop of after screen.
Ifthisheadlossisveryexcessive,thiscanbereducedbyprovidingbarswithroundededges at
upstream, or by reducing width of bars to 6 to 8 mm, or by slight reduction in velocity.
Exceptforthechangeinshapeofbarsinothercasesthechanneldimensionswillchange.
For minimum flow and maximum flow, the depth of flow can be worked out using
Manning’sformulausingknowndischarge,andcheckforvelocityunderboththesecases,as
selfcleansingandnon-scouring,respectively,andalsodepthofflowatmaximumdischarge.
10 | P a g e
National Sugar Institute, Kanpur
Questions
1. Describe types of screens used in wastewatertreatment.
2. Discussclassificationofscreensandstateapplicationofeachclass.
3. With schematic describe how double chamber bar screen channels can be arranged?
For what discharge each of them will bedesigned?
4. Describe design guidelines for the barracks.
5. Determine head loss through a bar screen when it is 50% clogged. The approach
velocity of wastewater in the channel is 0.6 m/sec, velocity of flow through the clear
rackis0.8m/sec.Clearopeningareainthescreenis0.2m2.Considerflowcoefficient for
clogged bar rack as0.6.
Answer:
Q 5: Head loss through a bar screen when it is 50% clogged = 0.187 m
2:- Grit Chamber
2 | P a g e
National Sugar Institute, Kanpur
II
IV
H III Vo
Vc
I
Grit chamber is the second unit operation used in primary treatment of wastewater and it is
intended to remove suspended inorganic particles such as sandy and gritty matter from the
wastewater. This is usually limited to municipal wastewater and generally not required for
industrial effluent treatment plant, except some industrial wastewaters which may have grit.
The grit chamber is used to remove grit, consisting of sand, gravel, cinder, or other heavy
solids materials that have specific gravity much higher than those of the organic solids in
wastewater. Grit chambers are provided to protect moving mechanical equipment from
abrasion and abnormal wear; avoid deposition in pipelines, channels, and conduits; and to
reducefrequencyofdigestercleaning.Separateremovalofsuspendedinorganicsolidsingrit
chamber and suspended organic solids in primary sedimentation tank is necessary due to
differentnatureandmodeofdisposalofthesesolids.Gritcanbedisposedoffafterwashing,
toremovehighersizeorganicmattersettledalongwithgritparticles;whereas,thesuspended
solidssettledinprimarysedimentationtank,beingorganicmatter,requiresfurthertreatment
beforedisposal.
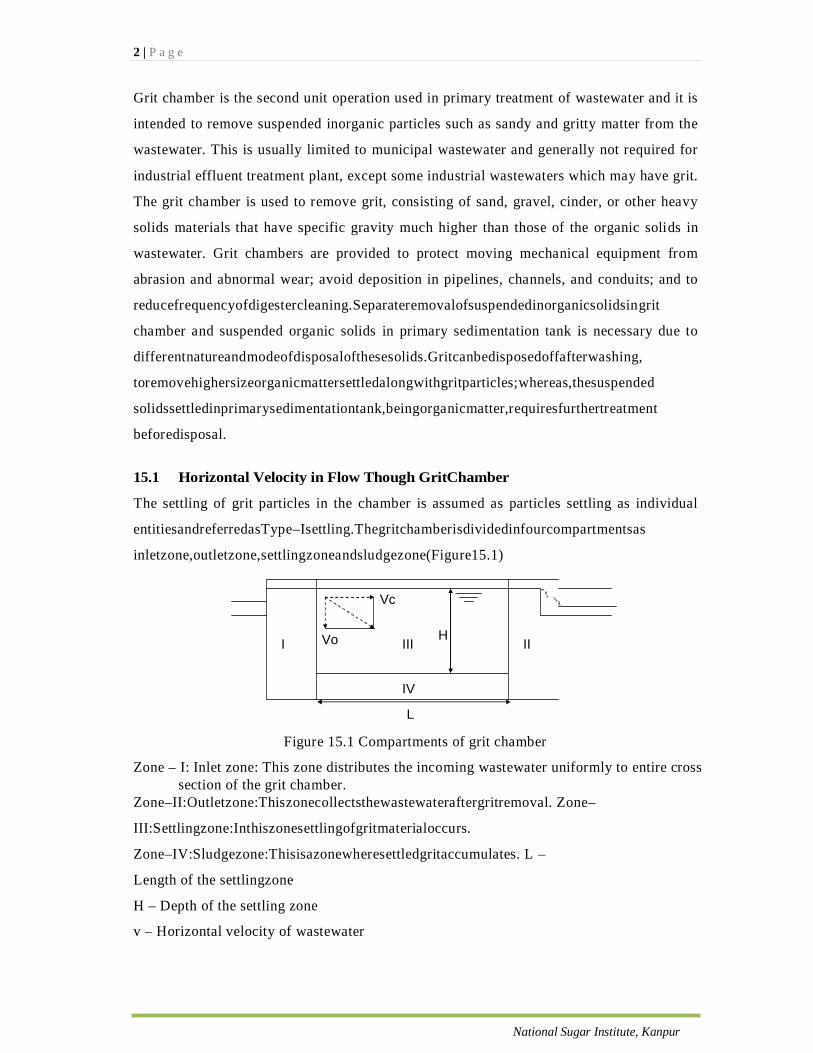
15.1 Horizontal Velocity in Flow Though GritChamber
The settling of grit particles in the chamber is assumed as particles settling as individual
entitiesandreferredasType–Isettling.Thegritchamberisdividedinfourcompartmentsas
inletzone,outletzone,settlingzoneandsludgezone(Figure15.1)
L
Figure 15.1 Compartments of grit chamber
Zone – I: Inlet zone: This zone distributes the incoming wastewater uniformly to entire cross section of the grit chamber.
Zone–II:Outletzone:Thiszonecollectsthewastewateraftergritremoval. Zone–
III:Settlingzone:Inthiszonesettlingofgritmaterialoccurs.
Zone–IV:Sludgezone:Thisisazonewheresettledgritaccumulates. L –
Length of the settlingzone
H – Depth of the settling zone
v – Horizontal velocity of wastewater
3 | P a g e
National Sugar Institute, Kanpur
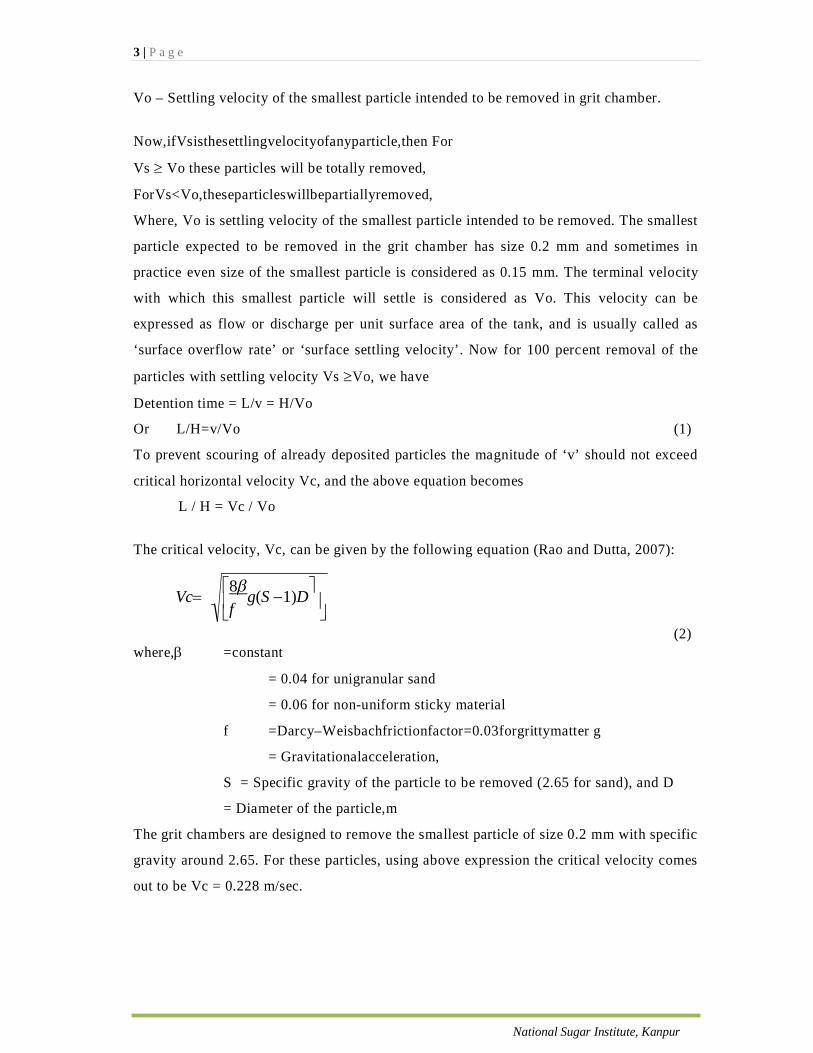
Vo – Settling velocity of the smallest particle intended to be removed in grit chamber.
Now,ifVsisthesettlingvelocityofanyparticle,then For
Vs Vo these particles will be totally removed,
ForVs<Vo,theseparticleswillbepartiallyremoved,
Where, Vo is settling velocity of the smallest particle intended to be removed. The smallest
particle expected to be removed in the grit chamber has size 0.2 mm and sometimes in
practice even size of the smallest particle is considered as 0.15 mm. The terminal velocity
with which this smallest particle will settle is considered as Vo. This velocity can be
expressed as flow or discharge per unit surface area of the tank, and is usually called as
‘surface overflow rate’ or ‘surface settling velocity’. Now for 100 percent removal of the
particles with settling velocity Vs Vo, we have
Detention time = L/v = H/Vo
Or L/H=v/Vo (1)
To prevent scouring of already deposited particles the magnitude of ‘v’ should not exceed
critical horizontal velocity Vc, and the above equation becomes
L / H = Vc / Vo
The critical velocity, Vc, can be given by the following equation (Rao and Dutta, 2007):
Vc
(2) where, =constant
= 0.04 for unigranular sand
= 0.06 for non-uniform sticky material
f =Darcy–Weisbachfrictionfactor=0.03forgrittymatter g
= Gravitationalacceleration,
S = Specific gravity of the particle to be removed (2.65 for sand), and D
= Diameter of the particle,m
The grit chambers are designed to remove the smallest particle of size 0.2 mm with specific
gravity around 2.65. For these particles, using above expression the critical velocity comes
out to be Vc = 0.228 m/sec.
8g(S 1)D
f
4 | P a g e
R
15.2 Settling Velocity of theParticles
Settling velocity of any discrete particle depends on its individual characteristics and also on
the characteristics of the fluid. Assuming particles to be spherical, the settling velocity of any
particle, Vs, can be given by the followingformula:
Vs
(3) where,CD = Newton’s dragcoefficient
24 R
3 0.34
for 0.3 < R < 104
= 24/R, when R <0.3
R = Reynold’s Number =Vs.D/
= Kinematic viscosity of thefluid
For the value of R < 0.3, CD = 24/R and the above equation becomes (Stoke’s Law)
Vs gS 1D2
18 (4)
For the value of R > 0.3, the value of Vs should be worked out by trial and error.
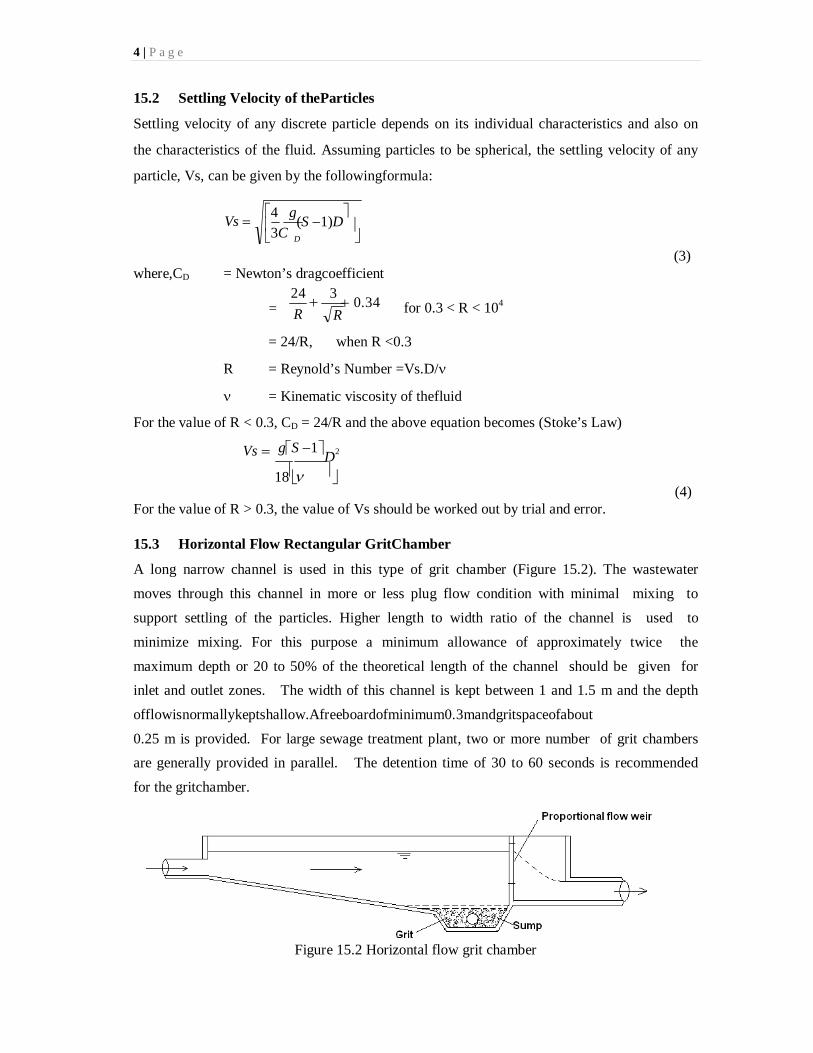
15.3 Horizontal Flow Rectangular GritChamber
A long narrow channel is used in this type of grit chamber (Figure 15.2). The wastewater
moves through this channel in more or less plug flow condition with minimal mixing to
support settling of the particles. Higher length to width ratio of the channel is used to
minimize mixing. For this purpose a minimum allowance of approximately twice the
maximum depth or 20 to 50% of the theoretical length of the channel should be given for
inlet and outlet zones. The width of this channel is kept between 1 and 1.5 m and the depth
offlowisnormallykeptshallow.Afreeboardofminimum0.3mandgritspaceofabout
0.25 m is provided. For large sewage treatment plant, two or more number of grit chambers
are generally provided in parallel. The detention time of 30 to 60 seconds is recommended
for the gritchamber.
Figure 15.2 Horizontal flow grit chamber
4 3C D
g(S 1)D
=
5 | P a g e
15.4 Control of Velocity Through the GritChamber
Withvariationinsewageflowreceivedattreatmentplant,itisimportantthatvelocityofthe
wastewater in the grit chamber should be maintained nearly constant. Otherwise when flow
is lower, deposition of not only inorganic solids but also organic solids will occur in grit
chamber due to lowering of velocity. With flow higher than average, when the velocity will
exceedthecriticalvelocity,scouringofalreadydepositedgritparticleswilloccurleadingto failure
of performance. Hence for proper functioning, the velocity should not be allowed to change
in spite of change in flow in the grit chamber. This can be achieved by provision of
proportional weir (Figure 15.3) or Parshall flume (Figure 15.4) at the outlet end of grit
chamber.Theshapeoftheopeningbetweentheplatesofaproportionalweirismadeinsuch a way
that the discharge is directly proportional to liquid depth in grit chamber. As a result
thevelocityofwaterinthechamberwillremainconstantforallflowconditions.
The discharge through proportional weir can be given by the following equation (Rao and
Dutta, 2007):
Q a
C.b2ag.H
3
where, Q = Discharge, m3/sec1 (5)
C=constant,0.61forsymmetricalsharpedgedweir a =
25 to 35 mm as shown in the Figure15.3.
b = base width of the weir
H = Height of water above the crest of weir
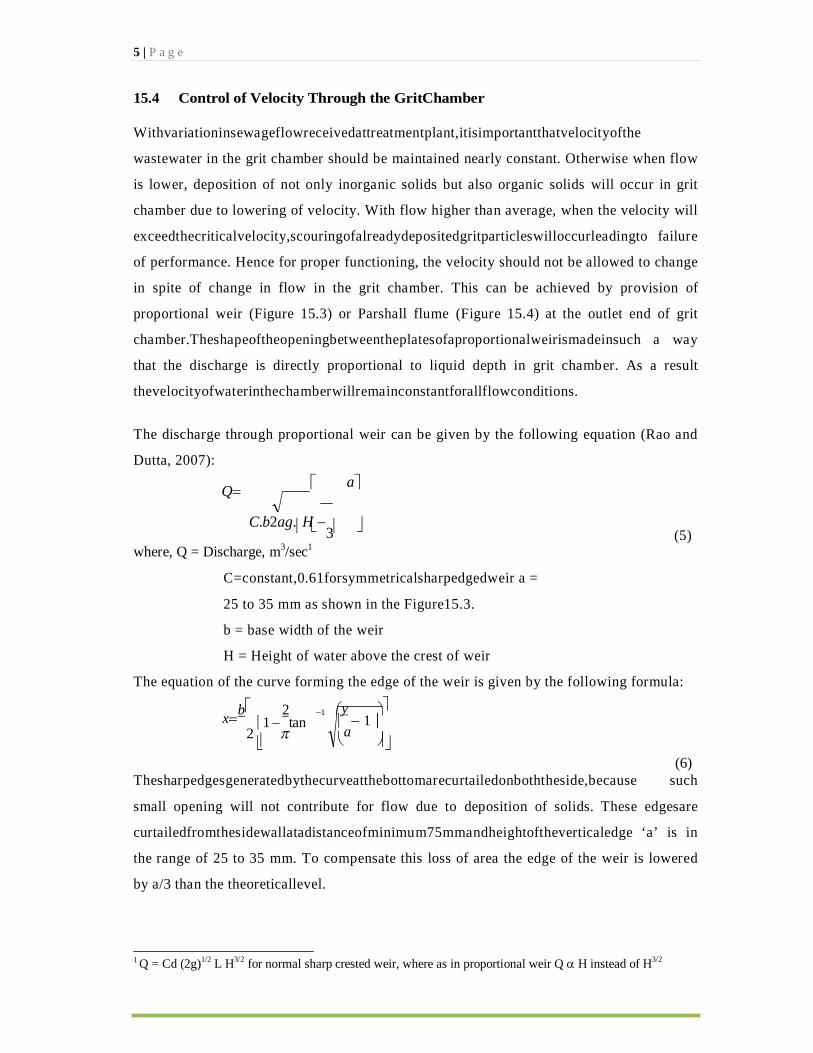
The equation of the curve forming the edge of the weir is given by the following formula:
xb 2 1 y
2 1
tan
a 1
(6)
Thesharpedgesgeneratedbythecurveatthebottomarecurtailedonboththeside,because such
small opening will not contribute for flow due to deposition of solids. These edgesare
curtailedfromthesidewallatadistanceofminimum75mmandheightoftheverticaledge ‘a’ is in
the range of 25 to 35 mm. To compensate this loss of area the edge of the weir is lowered
by a/3 than the theoreticallevel.
1 Q = Cd (2g)1/2 L H3/2 for normal sharp crested weir, where as in proportional weir Q H instead of H3/2
6 | P a g e
Figure 15.3. Proportional Weir
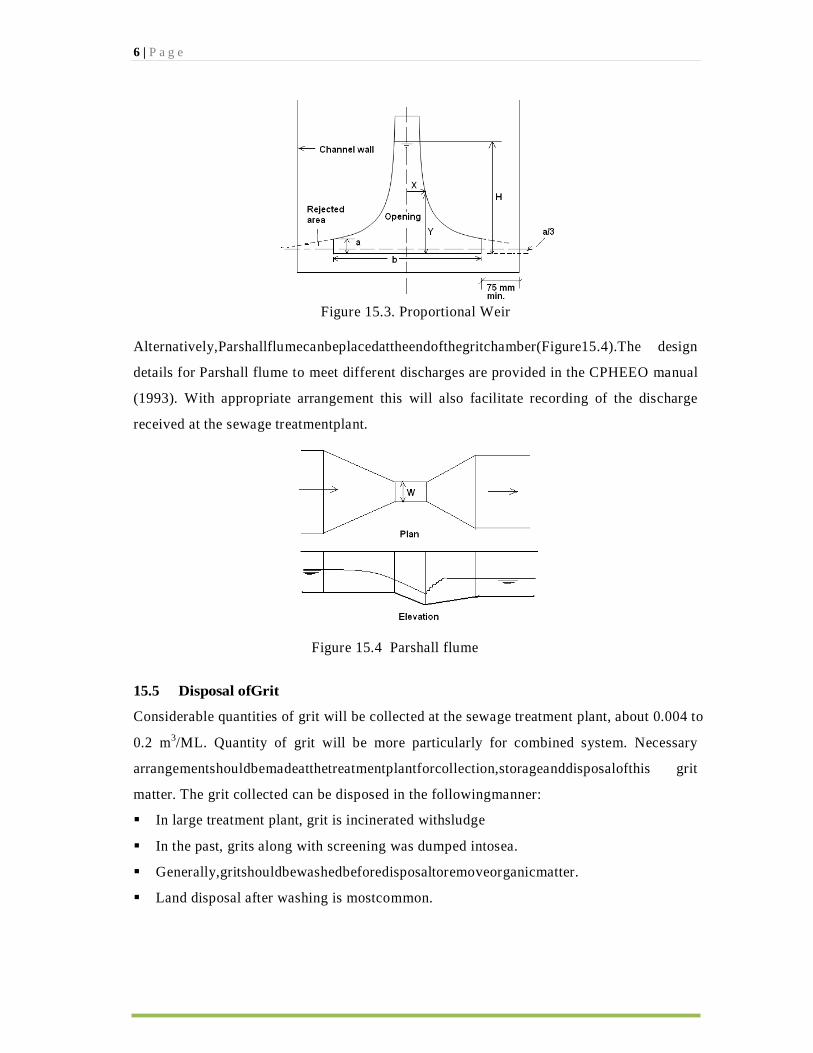
Alternatively,Parshallflumecanbeplacedattheendofthegritchamber(Figure15.4).The design
details for Parshall flume to meet different discharges are provided in the CPHEEO manual
(1993). With appropriate arrangement this will also facilitate recording of the discharge
received at the sewage treatmentplant.
Figure 15.4 Parshall flume
15.5 Disposal ofGrit
Considerable quantities of grit will be collected at the sewage treatment plant, about 0.004 to
0.2 m3/ML. Quantity of grit will be more particularly for combined system. Necessary
arrangementshouldbemadeatthetreatmentplantforcollection,storageanddisposalofthis grit
matter. The grit collected can be disposed in the followingmanner:
In large treatment plant, grit is incinerated withsludge
In the past, grits along with screening was dumped intosea.
Generally,gritshouldbewashedbeforedisposaltoremoveorganicmatter.
Land disposal after washing is mostcommon.
7 | P a g e
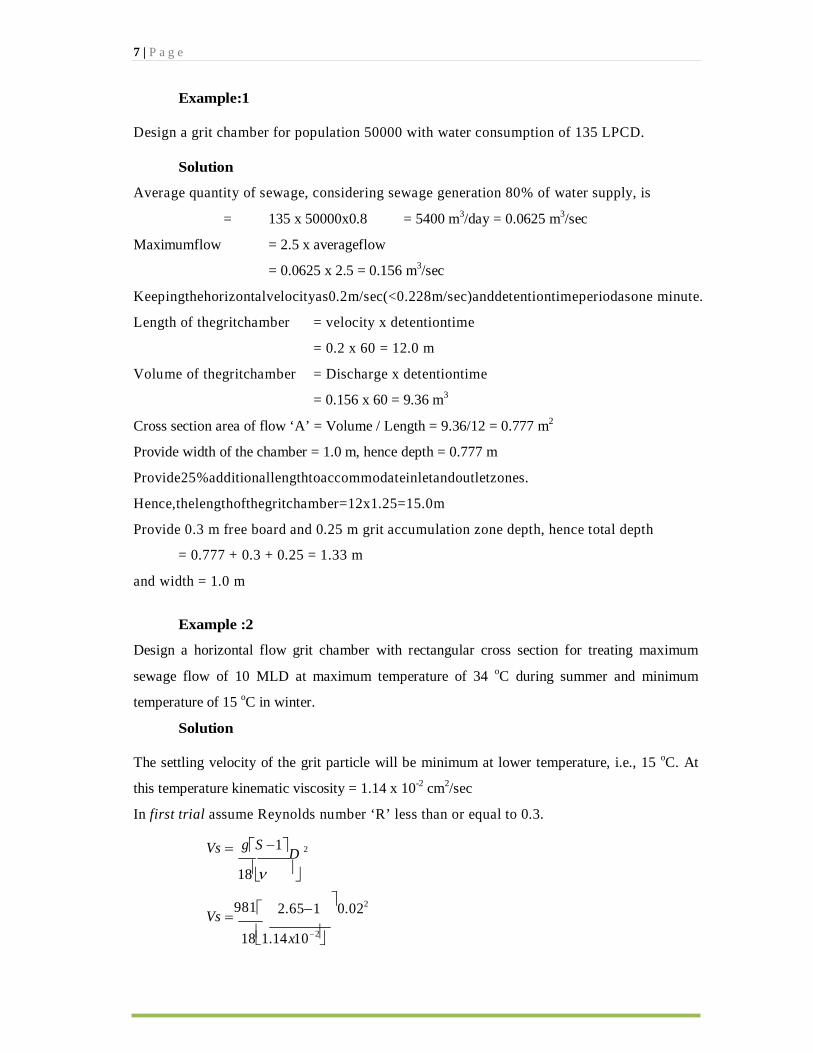
Example:1
Design a grit chamber for population 50000 with water consumption of 135 LPCD.
Solution
Average quantity of sewage, considering sewage generation 80% of water supply, is
= 135 x 50000x0.8 = 5400 m3/day = 0.0625 m3/sec
Maximumflow = 2.5 x averageflow
= 0.0625 x 2.5 = 0.156 m3/sec
Keepingthehorizontalvelocityas0.2m/sec(<0.228m/sec)anddetentiontimeperiodasone minute.
Length of thegritchamber = velocity x detentiontime
= 0.2 x 60 = 12.0 m
Volume of thegritchamber = Discharge x detentiontime
= 0.156 x 60 = 9.36 m3
Cross section area of flow ‘A’ = Volume / Length = 9.36/12 = 0.777 m2
Provide width of the chamber = 1.0 m, hence depth = 0.777 m
Provide25%additionallengthtoaccommodateinletandoutletzones.
Hence,thelengthofthegritchamber=12x1.25=15.0m
Provide 0.3 m free board and 0.25 m grit accumulation zone depth, hence total depth
= 0.777 + 0.3 + 0.25 = 1.33 m
and width = 1.0 m
Example :2
Design a horizontal flow grit chamber with rectangular cross section for treating maximum
sewage flow of 10 MLD at maximum temperature of 34 oC during summer and minimum
temperature of 15 oC in winter.
Solution
The settling velocity of the grit particle will be minimum at lower temperature, i.e., 15 oC. At
this temperature kinematic viscosity = 1.14 x 10⁻² cm2/sec
In first trial assume Reynolds number ‘R’ less than or equal to 0.3.
Vs gS 1D 2
18
Vs 981
2.651 0.022
181.14x10²

8 | P a g e
8g(S 1)D
f
= 3.15 cm/sec
Reynolds Number R = v.D/ = 3.15 x 0.02 / 1.14 x 10-2
= 5.53 > 0.3
Therefore, Vs is not equal to 3.15 cm/sec because the equation for Vs is valid only for R <
0.3. Using Vs = 3.15 cm/sec, calculate R and CD and then again Vs till it converges.
Subsequent Trial
Vs = 2.4 cm/sec
R = 2.4 x 0.02 /(1.14 x 10-2) = 4.21
CD = 24 4.21
3
4.21 0.34
= 7.50
From equation
Vs
Vs = 2.4 cm/sec Hence, O.K. (2074 m/d)
Now for = 0.06, f = 0.03, and D = 0.02 cm
Vc
Vc
= 22.76 cm/sec
Now Q = 10 MLD = 0.116 m3/sec
Therefore, C/S Area A = Q/V = 0.116/0.227 = 0.51
m2Ifwidthof1misprovided,thedepthrequired=0.51m
Provide total depth = 0.51 + 0.3 (free board) + 0.25 (space for grit accumulation)
= 1.06 Say 1.1 m
Now Vo/Vc = H/L =2.4/22.7
ThereforetheoreticallengthL=22.7x0.51/2.4=4.824m Provide 2 m
extra length for inlet andoutlet
Therefore total length = 2 + 4.824 = 6.824 m say 6.9 m
Total working volume = 0.51 x 6.9 x 1 = 3.52 m3
Hence, Overall detention time = 3.52 / 0. 116 = 30.34 sec (within 30 to 60 seconds)
4 981 (2.651)0.02 37.50
8x0.06 981(2.65 1)0.02 0.03

2 | P a g e
3:- Primary Sedimentation Tank
3 | P a g e
After grit removal in grit chamber, the wastewater containing mainly lightweight organic
matter is settled in the primary sedimentation tank (PST). Due to involvement of many
unknown parameters under settling of light weight, sticky, and non regular shaped particles,
theclassicallawsofsedimentationasapplicableingritremovalarenotvalidandthissettling
iscalledasflocculantsettling.Theprimarysedimentationtankgenerallyremoves30to40%
ofthetotalBODand50to70%ofsuspendedsolidsfromtherawsewage.Theflowthrough velocity
of 1 cm/sec at average flow is used for design with detention period in the range of
90to150minutes.Thishorizontalvelocitywillbegenerallyeffectiveforremovaloforganic
suspendedsolidsofsizeabove0.1mm.Effluentweirsareprovidedattheeffluentendofthe
rectangular tanks, and around the periphery in the circular tanks. Weir loading less than 185
m3/m.d is used for designing effluent weir length (125 to 500 m3/m.d). Where primary
treatment follows secondary treatment, higher weir loading rates can be used. The sludge
collection hopper is provided near the centre in circular tank and near the influent end in
rectangular tanks. A baffle is provided ahead of the effluent weir for removal of floating
matter.Thisscumformedonthesurfaceisperiodicallyremovedfromthetankmechanically
ormanually.
16.1 Analysis of Flocculant Settling
Particlesinrelativelydiluteconcentrationwithsmallersizesometimeswillnotactasdiscrete
particles(asthegritparticlesbehaveingritchamber)buttheseparticleswillcoalesceduring
sedimentation. As flocculation occurs, the size of the particle increases and it settles faster.
The magnitude of flocculation will depend upon the opportunity for contact between the
particles, which depends upon overflow rate, temporal mean velocity gradient in the system
(representing mixing) and concentration and size of the particles. Although, settling rate of
particleisindependentofdepthofbasin,thebasindepthwilldecideliquiddetentiontimein
thetankandsufficientdepthshouldbeprovidedforsettlingtoseparateitfromsludgesettled
zone.Theeffectofthesevariablesonsettlingcanonlybedeterminedbysedimentationtests,
andclassicallawsofsedimentationarenotapplicable,duetochangeincharacteristicsofthe
particle during settling. Settling column is used to determine the settling characteristics of
thesuspensionofflocculantparticles.Acolumnwithdiameterof15cmandheightof3.0m can give
satisfactory results, with 5 to 6 ports provided over the height for sampling. The height of
the tank should be ideally equal to side water depth of the settling tank for proper results.
4 | P a g e
The solution containing suspended solids should be added in the column in such a way that
uniform distribution of solid particles occur from top to bottom. Settling should takes place
under quiescent conditions. It is important to maintain uniform temperature throughout the
experimental column to avoid convection currents. At various time intervals, samples are
withdrawnfromtheportsandanalyzedforsuspendedsolids.Percentageremovalofsolidsis
calculated for each sample analyzed and is plotted as a number (%) against time and depth.
Thecurveofequalpercentageremovalisdrawnbetweentheplottedpoints.
Theefficiencyofthesedimentationtank,withrespecttosuspendedsolidsandBODremoval, is
affected by thefollowing:
Eddy currents formed by the inertia of incomingfluid,
Windinducedturbulencecreatedatthewatersurfaceoftheuncoveredtanks,
Thermal convectioncurrents,
Coldorwarmwatercausingtheformationofdensitycurrentsthatmovesalongthe
bottom of the basin,and
Thermal stratification in hotclimates.
Because of the above reasons the removal efficiency of the tank and detention time has
correlation R = t/(a+b.t), where ‘a’ and ‘b’ are empirical constants, ‘R’ is expected removal
efficiency, and ‘t’ is nominal detention time.
To account for the non optimum conditions encountered in the field, due to continuously
wastewater coming in and going out of the sedimentation tank, due to ripples formed on the
surface of the water because of wind action, etc., the settling velocity (overflow rate)
obtained from the column studies are often multiplied by a factor of 0.65 to 0.85, and the
detention time is multiplied by a factor of 1.25 to 1.50. This will give adequate treatment
efficiency in the field conditions as obtained under laboratory test.
Example: 1
Thesettlingtestwasperformedinthesettlingcolumnofheight2.5m.Fournumbersofports were
provided to the column at the height of 0.5 m from bottom. Samples were collected from
these ports at every 30 min and the results obtained are plotted in the Figure 16.1.
Determine the overall removal of solids after 1.0 h ofsettling.

5 | P a g e
30 60 90 120 150
Time of sampling, min
Figure16.1.Resultsofthesettlingcolumnstudy
0.5 m
Solution
Percentage removal = ∆ h1x (R1 + R2) + ∆ h2 x (R2 + R3) + ∆ h3x (R3 + R4) + ∆ h4 x (R4 + R5) h5 2 h5 2 h5 2 h5 2
For curve shown in the Figure 16.1, the computation will be
∆ h1x (R1 + R2) = 0.34(100+80)/(2.5 x 2) = 12.24% h5 2
∆ h2 x (R2 + R3) = 0.16 (80 + 70)/(2.5 x 2) = 4.8% h5 2
∆ h3x (R3 + R4) = 0.66 (70 + 60)/(2.5 x 2) = 17.16% h5 2
∆ h4 x (R4 + R5) = 1.34 (60 + 50)/(2.5 x 2) = 29.48% h5 2
Therefore, total removal under quiescent settling condition is 63.68%. To achieve this
removal the detention time recommended in settling tank is 1 x 1.5 = 1.5 h.
16.2 Recommendation for Design of Primary SedimentationTank
Primarysedimentationtankscanbecircularorrectangulartanks(Figure16.2)designedusing
average dry weather flow and checked for peak flow condition. The numbers of tanks are
determined by limitation of tank size. Two tanks in parallel are normally used to facilitate
maintenanceofanytank.Thediameterofcirculartankmayrangefrom3to60m(upto45m typical)
and it is governed by structural requirements of the trusses which supportsscrapper
Heig
ht o
f col
umn
∆h1
∆h2
∆ h3
40%
50% 60%
80%
∆ h4 70%

6 | P a g e
in case of mechanically cleaned tank. Rectangular tank with length 90 m are in use, but
usually length more than 40 m is not preferred. Width of the tank is governed by the size of
the scrappers available for mechanically cleaned tank. The depth of mechanically cleaned
tank should be as shallow as possible, with minimum 2.15 m. The average depth of the tank
used in practice is about 3.5 m. In addition, 0.25 m for sludge zone and 0.3 to 0.5 m free
board is provided. The floor of the tank is provided with slope 6 to 16 % (8 to 12 % typical)
for circular tank and 2 to 8% for rectangular tanks. The scrappers are attached to rotating
arms in case of circular tanks and to endless chain in case of rectangular tanks. These
scrappers collect the solids in a central sump and the solids are withdrawn regularly in
circular tanks. In rectangular tanks, the solids are collected in the sludge hoppers at the
influent end, and are withdrawn at fixed time intervals. The scrapper velocity of 0.6 to 1.2
m/min (0.9 m/min typical) is used in rectangular tank and flight speed of 0.02 to 0.05 rpm
(0.03 typical) is used in circular tank.
Inletsforbothrectangularandcirculartanksaretobedesignedtodistributetheflowequally
acrossthecrosssection.Scumremovalarrangementisprovidedaheadoftheeffluentweirin all the
PST. The surface overflow rate of 40 m3/m2.d (in the range 35 to 50 m3/m2.d) is used for
design at average flow. At peak flow the surface overflow rate of 80 to 120 m3/m2.d could
be used when this PST is followed by secondary treatment. Lower surface settling rates are
used when waste activated sludge is also settled in the PST along with primary solids. In
this case the surface overflow rate of 24 to 32 m3/m2.d and 48 to 60 m3/m2.d are
usedforaverageandpeakflowconditions,respectively.Theweirloadingratelessthan185 m3/m.d
is used for designing effluent weir length (in the range 125 to 500 m3/m.d). Weir loading
rate up to 300 m3/m.d is acceptable under peak flow condition. Higher weir loading can be
acceptable when primary treatment is followed by secondary treatment. As such the weir
loading rate has very less impact on the overall performance of sewage treatment plant
when secondary treatment is provided after primary treatment. The detention time in PST
could be as low as 1 h to maximum of 2.5 h. Providing detention time of 1.5 to 2.5 h at
average flow is a commonpractice.
To avoid resuspension (scouring) of settled particles, horizontal velocities through the PST
should be kept sufficiently low. Following equation by Camp can be used to calculate the
critical velocity, Vc, which is the horizontal velocity that will just produce scour (m/sec).
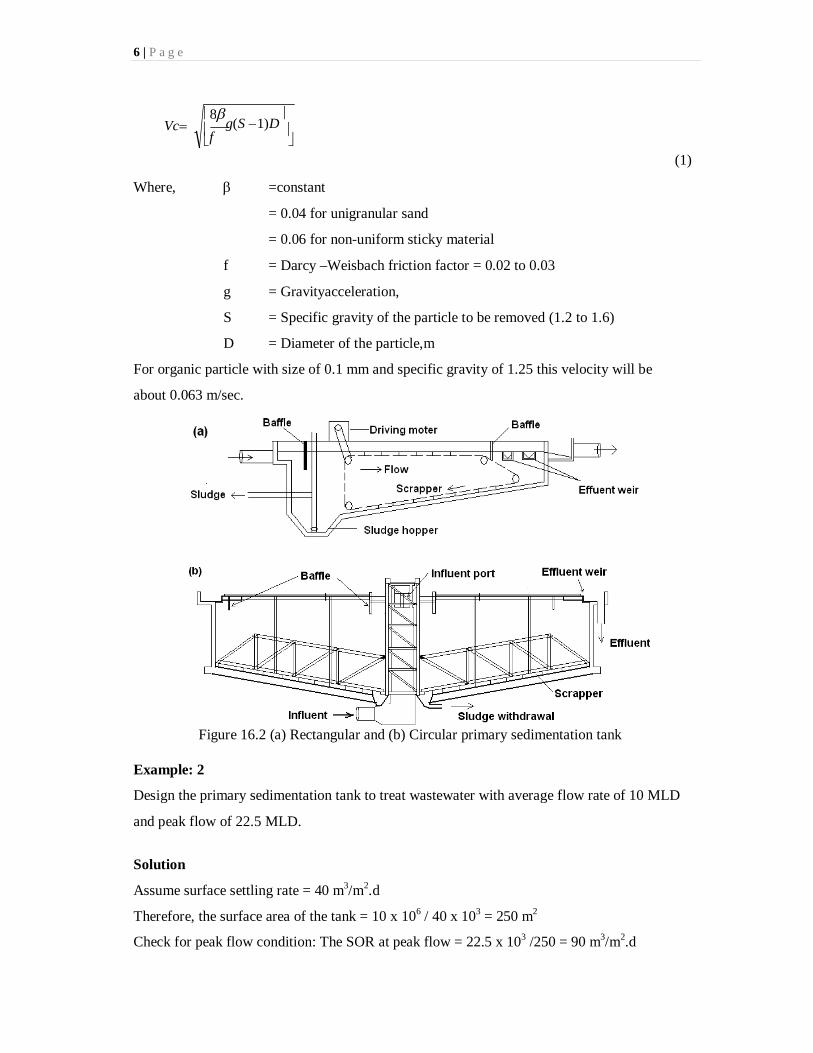
6 | P a g e
Vc
(1)
Where, =constant
= 0.04 for unigranular sand
= 0.06 for non-uniform sticky material
f = Darcy –Weisbach friction factor = 0.02 to 0.03
g = Gravityacceleration,
S = Specific gravity of the particle to be removed (1.2 to 1.6)
D = Diameter of the particle,m
For organic particle with size of 0.1 mm and specific gravity of 1.25 this velocity will be
about 0.063 m/sec.
Figure 16.2 (a) Rectangular and (b) Circular primary sedimentation tank
Example: 2
Design the primary sedimentation tank to treat wastewater with average flow rate of 10 MLD
and peak flow of 22.5 MLD.
Solution
Assume surface settling rate = 40 m3/m2.d
Therefore, the surface area of the tank = 10 x 106 / 40 x 103 = 250 m2
Check for peak flow condition: The SOR at peak flow = 22.5 x 10³ /250 = 90 m3/m2.d
8g(S 1)D
f
7 | P a g e
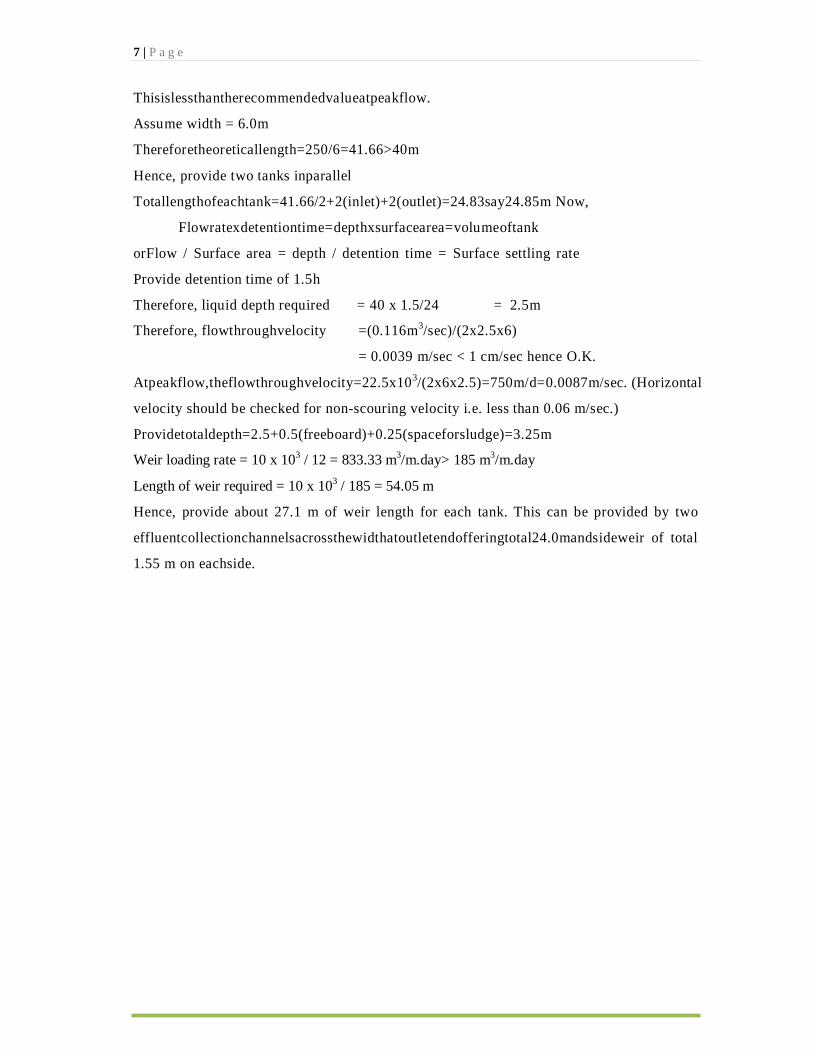
Thisislessthantherecommendedvalueatpeakflow.
Assume width = 6.0m
Thereforetheoreticallength=250/6=41.66>40m
Hence, provide two tanks inparallel
Totallengthofeachtank=41.66/2+2(inlet)+2(outlet)=24.83say24.85m Now,
Flowratexdetentiontime=depthxsurfacearea=volumeoftank
orFlow / Surface area = depth / detention time = Surface settling rate
Provide detention time of 1.5h
Therefore, liquid depth required = 40 x 1.5/24 = 2.5m
Therefore, flowthroughvelocity =(0.116m3/sec)/(2x2.5x6)
= 0.0039 m/sec < 1 cm/sec hence O.K.
Atpeakflow,theflowthroughvelocity=22.5x10³/(2x6x2.5)=750m/d=0.0087m/sec. (Horizontal
velocity should be checked for non-scouring velocity i.e. less than 0.06 m/sec.)
Providetotaldepth=2.5+0.5(freeboard)+0.25(spaceforsludge)=3.25m
Weir loading rate = 10 x 103 / 12 = 833.33 m3/m.day> 185 m3/m.day
Length of weir required = 10 x 103 / 185 = 54.05 m
Hence, provide about 27.1 m of weir length for each tank. This can be provided by two
effluentcollectionchannelsacrossthewidthatoutletendofferingtotal24.0mandsideweir of total
1.55 m on eachside.
8 | P a g e
Questions
1. Describe flocculantsettling.
2. What is the purpose of providing primary sedimentation tank in wastewater
treatment?WhatistheexpectedBODandSSremovalisprimarysedimentationtank?
3. What are the parameters which will govern performance ofPSTs?
4. Describe design guidelines for primary sedimentationfacilities.
5. DesigncircularandrectangularPSTfortreatmentof4MLDofaveragesewageflow with
peaking factor of2.
Answer:
Q. 5. Assume surface settling rate = 40 m3/m2.d; Forrectangulartank:Width=5m,Length=24.0m,Liquiddepth=2.5mtwotanks. Forcirculartank:Provide11.5mdiametertwotankswithsidewaterdepthof2.5m.
4:- Other Primary Treatment Systems
2 | P a g e
Other pretreatment operation such as equalization, skimming tanks, flocculation and pre-
aeration are used sometimes. However, for sewage treatment, equalization, flocculation and
pre-aerationaregenerallynotusedinconventionaltreatmentplants,butthesecanbeusedin case of
industrial wastewatertreatment.
17.1 Equalization
For sewage treatment plant of large capacity the variation in the sewage flow received at
sewagetreatmentplantofcentralizedsystemisnotthatpronouncedandequalizationmaynot be
required in this case. However, for sewage treatment plant of small community, where
wastewater flow rate considerably vary with time, and for industrial wastewater treatment
plants, where wastewater flow and characteristic varies with time, equalization becomes
essential to obtain proper performance of the treatment plant by avoiding shock loading
(hydraulicandorganic)tothesystems.Duetopossibilityofvariationinflowratereceivedat
treatment plant, there may be deterioration in performance of the treatment plant than the
optimum value. To facilitate maintenance of uniform flow rate in the treatment units, flow
equalization is used. This helps in overcoming the operational problems caused by flow
variationandimprovesperformanceofthetreatmentplant.Flowequalizationisprovidedfor
dampeningofflowratevariationssothataconstantornearlyconstantflowrateisachieved.
The equalization can also be provided for dampening the fluctuation in pollutant
concentrationintheincomingwastewatertoavoidshockloadingonthetreatmentsystem;to
provide continuous feeding to the treatment system when the wastewater generation is
intermittent; to control pH fluctuations or to control toxic concentration in the feed to the
biological reactor. Equalization can also be used to control the discharge of industrial
effluent in to the sanitarysewers.
Equalizationcanbeoftwotypes:
a) Inline: Where all flow passes through equalizationbasin
b) Off-line:Inthis,theflowaboveaveragedailyflowisdivertedtoequalizationbasin.The
pumping is minimized in this case but amount of pollutant concentration damping is
considerablyreduced.
LocationofEqualization:Locationofequalizationbasinafterprimarytreatmentandbefore
biologicaltreatmentisappropriate.Thisarrangementconsiderablyreducesproblemofsludge
andscumintheequalizationbasin.Iftheequalizationbasinisplacedbeforeprimary
3 | P a g e
treatment, it must be provided with sufficient mixing to prevent solids deposition and
concentrationvariations,andaerationtopreventodourproblem.Mostcommonlysubmerged or
surface aerators with power level of approximately 0.003 to 0.004 KW/m3 are used. In
diffused air mixing, air requirement of 3.74 m3/m3 (air flow rate to water flow rate) is used
(Eckenfelder,2000).
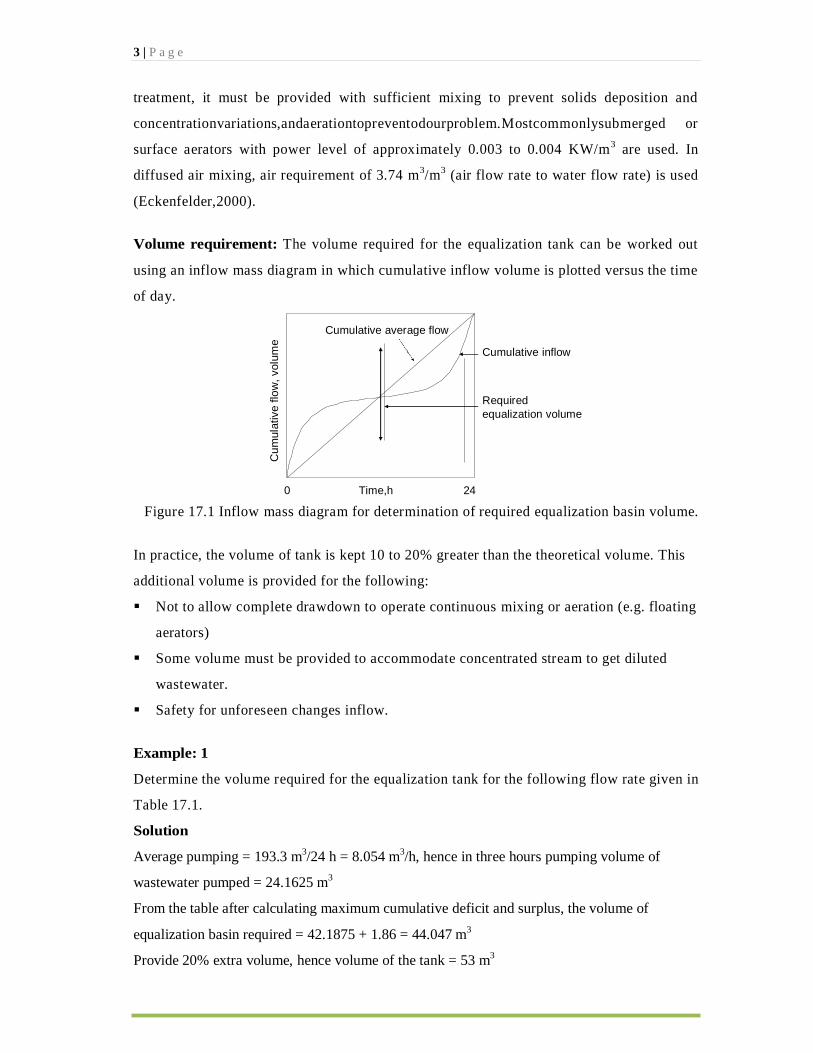
Volume requirement: The volume required for the equalization tank can be worked out
using an inflow mass diagram in which cumulative inflow volume is plotted versus the time
of day.
Cumulative inflow
Required equalization volume
0 Time,h 24
Figure 17.1 Inflow mass diagram for determination of required equalization basin volume.
In practice, the volume of tank is kept 10 to 20% greater than the theoretical volume. This
additional volume is provided for the following:
Not to allow complete drawdown to operate continuous mixing or aeration (e.g. floating
aerators)
Some volume must be provided to accommodate concentrated stream to get diluted
wastewater.
Safety for unforeseen changes inflow.
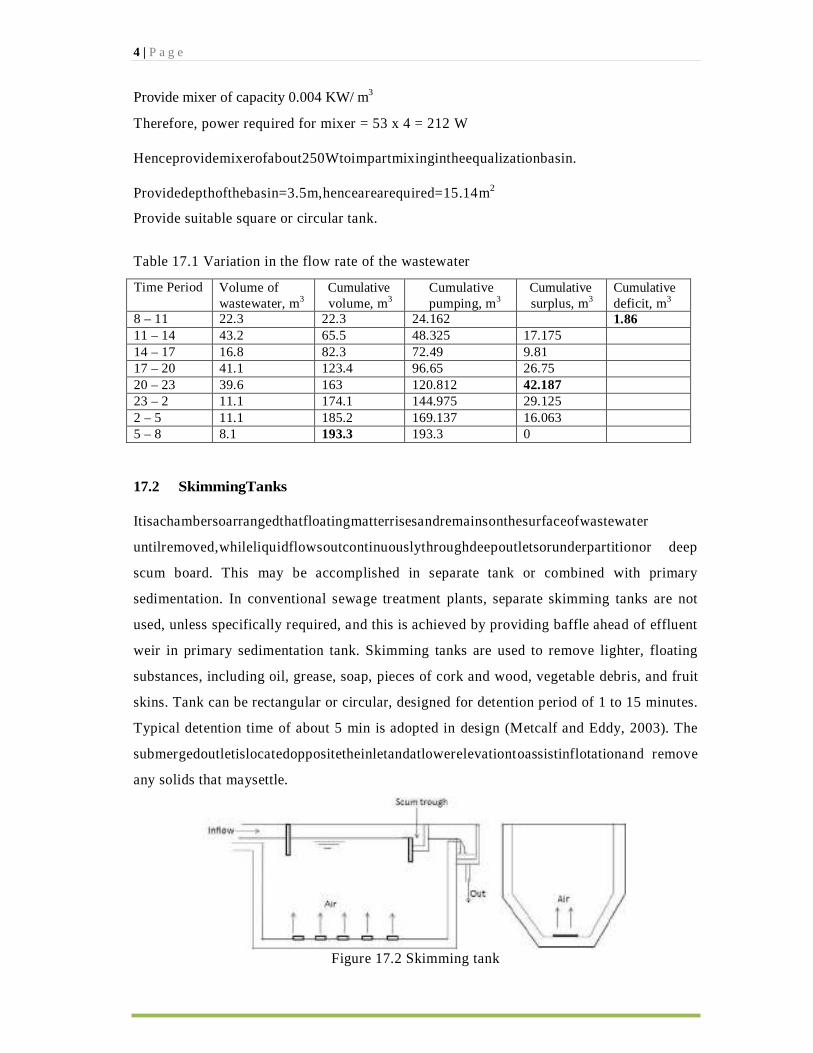
Example: 1
Determine the volume required for the equalization tank for the following flow rate given in
Table 17.1.
Solution
Average pumping = 193.3 m3/24 h = 8.054 m3/h, hence in three hours pumping volume of
wastewater pumped = 24.1625 m3
From the table after calculating maximum cumulative deficit and surplus, the volume of
equalization basin required = 42.1875 + 1.86 = 44.047 m3
Provide 20% extra volume, hence volume of the tank = 53 m3
Cumulative average flow
Cum
ulat
ive
flow
, vol
ume
4 | P a g e
Provide mixer of capacity 0.004 KW/ m3
Therefore, power required for mixer = 53 x 4 = 212 W
Henceprovidemixerofabout250Wtoimpartmixingintheequalizationbasin.
Providedepthofthebasin=3.5m,hencearearequired=15.14m2
Provide suitable square or circular tank.
Table 17.1 Variation in the flow rate of the wastewater
Time Period Volume of wastewater, m3
Cumulative volume, m3
Cumulative pumping, m3
Cumulative surplus, m3
Cumulative deficit, m3
8 – 11 22.3 22.3 24.162 1.86 11 – 14 43.2 65.5 48.325 17.175
14 – 17 16.8 82.3 72.49 9.81
17 – 20 41.1 123.4 96.65 26.75
20 – 23 39.6 163 120.812 42.187
23 – 2 11.1 174.1 144.975 29.125
2 – 5 11.1 185.2 169.137 16.063
5 – 8 8.1 193.3 193.3 0
17.2 SkimmingTanks
Itisachambersoarrangedthatfloatingmatterrisesandremainsonthesurfaceofwastewater
untilremoved,whileliquidflowsoutcontinuouslythroughdeepoutletsorunderpartitionor deep
scum board. This may be accomplished in separate tank or combined with primary
sedimentation. In conventional sewage treatment plants, separate skimming tanks are not
used, unless specifically required, and this is achieved by providing baffle ahead of effluent
weir in primary sedimentation tank. Skimming tanks are used to remove lighter, floating
substances, including oil, grease, soap, pieces of cork and wood, vegetable debris, and fruit
skins. Tank can be rectangular or circular, designed for detention period of 1 to 15 minutes.
Typical detention time of about 5 min is adopted in design (Metcalf and Eddy, 2003). The
submergedoutletislocatedoppositetheinletandatlowerelevationtoassistinflotationand remove
any solids that maysettle.
Figure 17.2 Skimming tank

5 | P a g e
17.3 Flocculation
Flocculation is not commonly used for sewage treatment; however, it may be required in
treatment of industrial wastewater where organic matter is present in high concentration in
colloidal form. Presence of such solids will increase the oxygen demand in aerobic
wastewater treatment system, and may disturb the performance of anaerobic reactor like
UASBreactor,duetopresenceoffinelydividedsuspendedsolidswhichmaynotsettlewell in the
reactor to undergo digestion. If flocculation is used, it is provided before the primary
sedimentationtank.
Flocculation is provided with the objective to form flocs from the finely divided matter.
Mixing can be mechanical or air agitation type without any chemical addition. Provision of
flocculationcanincreaseremovalofSSandBODinprimarysedimentationtankandhelpin
increasing efficiency of secondary sedimentation tank after biological treatment. It can be
accomplishedinseparatetankorinconduitsconnectingthetreatmentunitsorcombinationoffloccu
lator and clarifiers. In mechanical or air agitation flocculation systems, it is common
practicetotapertheenergyinputsothattheflocsformedwillnotbebrokenastheyleavethe
flocculator. Detention time of 20 to 60 min (typical 30 min) is used in design of the
flocculator (Metcalf and Eddy, 2003). In case of mechanical mixing, maximum speed at
periphery for the paddles induced flocculation with adjustable speed is 0.4 – 1.0 m/sec
(typical 0.6 m/sec). For air agitation flocculation with tube diffusers, air supply is generally
in the range of 0.6 – 1.2 m3/ML.
17.4 Pre-aeration
Pre-aeration is sometimes used prior to primary sedimentation to improve treatability, to
provide grease separation, odour control, grit removal, flocculation and more importantly to
promote uniform distribution of suspended solids. This can be achieved by increasing
detention time in aerated grit chamber (d.t. = 3 to 5 min) instead of separate tank. Using
aeratedchannelsforwastewaterdistributiontoprimarysedimentationtankcanhelpuniform
distribution of solids and also keeping solids in suspension at all flow rates. Airrequirement
for pre-aeration varies from 0.02 to 0.05 m3/min.m length of channel (Metcalf and Eddy,
2003). When separate pre-aeration basin is used, detention time of 10 to 40 min and tank
depthof3to5mcanbeadopted.Theairrequirementforthepre-aerationbasinwillbe0.75
– 3.0 m3/ m3.
6 | P a g e
Questions
1. Describeequalization. Under what circumstances this isprovided? How the
volume of the equalization basin isestimated?
2. What will be ideal location for the equalization basin in wastewater treatment
plant? Give justification for suggestedlocation.
3. Drawschematicoftheskimmingtankandexplainthepurposeofprovidingitand how
removal of pollutant occurs in thistank.
4. Whataretheadvantagesofprovidingflocculationandpre-aerationtowastewater?
5:- Secondary Treatment
2 | P a g e
Secondary treatment of the wastewater could be achieved by chemical unit processes such as
chemical oxidation, coagulation-flocculation and sedimentation, chemical precipitation, etc. or
by employing biological processes (aerobic or anaerobic) where bacteria are used as a catalyst
for removal of pollutant. For removal of organic matter from the wastewater, biological
treatment processes are commonly used all over the world. Hence, for the treatment of
wastewater like sewage and many of the agro-based industries and food processing industrial
wastewaters the secondary treatment will invariably consist of a biological reactor either in
single stage or in multi stage as per the requirements to meet the dischargenorms.
18.1 BiologicalTreatment
The objective of the biological treatment of wastewater is to remove organic matter from the
wastewater which is present in soluble and colloidal form or to remove nutrients such as nitrogen
and phosphorous from the wastewater. The microorganisms (principally bacteria) are used to
convert the colloidal and dissolved carbonaceous organic matter into various gases and into cell
tissue. Cell tissue having high specific gravity than water can be removed in settling tank.
Hence, complete treatment of the wastewater will not be achieved unless the cell tissues are
removed. Biological removal of degradable organics involves a sequence of steps including mass
transfer, adsorption, absorption and biochemical enzymatic reactions. Stabilization of organic
substances by microorganisms in a natural aquatic environment or in a controlled environment of
biological treatment systems is accomplished by two distinct metabolic processes: respiration
and synthesis, also called as catabolism and anabolism,respectively.
Respiration: A portion of the available organic or inorganic substrate is oxidized by the bio-
chemical reactions, being catalyzed by large protein molecules known as enzymes produced by
microorganism to liberate energy. The oxidation or dehydrogenation can takes place both in
aerobic and anaerobic conditions. Under aerobic conditions, the oxygen acts as the final electron
acceptor for the oxidation. Under anaerobic conditions sulphates, nitrates, nitrites, carbon
dioxide and organic compounds acts as an electron acceptor. Metabolic end products of the
respiration are true inorganics like CO2, water, ammonia, andH2S.
3 | P a g e
The energy derived from the respiration is utilized by the microorganisms to synthesize new
protoplasm through another set of enzyme catalyzed reactions, from the remaining portion of the
substrate. The heterotrophic microorganisms derive the energy required for cell synthesis
exclusively through oxidation of organic matter and autotrophic microorganisms derive the
energy for synthesis either from the inorganic substances or from photosynthesis.
The energy is also required by the microorganisms for maintenance of their life activities. In the
absence of any suitable external substrate, the microorganisms derive this energy through the
oxidation of their own protoplasm. Such a process is known as endogenous respiration (or
decay). The metabolic end products of the endogenous respiration are same as that in primary
respiration.
The metabolic processes in both aerobic and anaerobic processes are almost similar, the yield of
energy in an aerobic process, using oxygen as electron acceptor, is much higher than in
anaerobic condition. This is the reason why the aerobic systems liberates more energy and thus
produce more new cells than the anaerobicsystems.
Catabolism and Anabolism: The most important mechanism for the removal of organic material
in biological wastewater treatment system is by bacterial metabolism. Metabolism refers to the
utilization of the organic material, either as a source of energy or as a source for the synthesis of
cellular matter. When organic material is used as an energy source, it is transferred into stable
end products, a process known as catabolism. In the process of anabolism the organic material is
transformed and incorporated into cell mass. Anabolism is an energy consuming process and it
is only possible if catabolism occurs at the same time to supply the energy needed for the
synthesis of the cellular matter. Thus, the processes of catabolism and anabolism are
interdependent and occursimultaneously.
18.2 Principles of Biological WastewaterTreatment
Under proper environmental conditions, the soluble organic substances of the wastewater are
completely destroyed by biological oxidation; part of it is oxidized while rest is converted into
biological mass, in the biological reactors. The end products of the metabolisms are either gas or
liquid; and on the other hand the synthesized biological mass can flocculate easily and it can be
4 | P a g e
easily separated out in clarifiers. Therefore, the biological treatment system usually consists of
(1) a biological reactor, and (2) a sedimentation tank, to remove the produced biomass called as
sludge.
The growth of microorganisms and the rate at which the substrate will be utilized with respect to
time will depend on the type of the reactor employed and environmental conditions. This can be
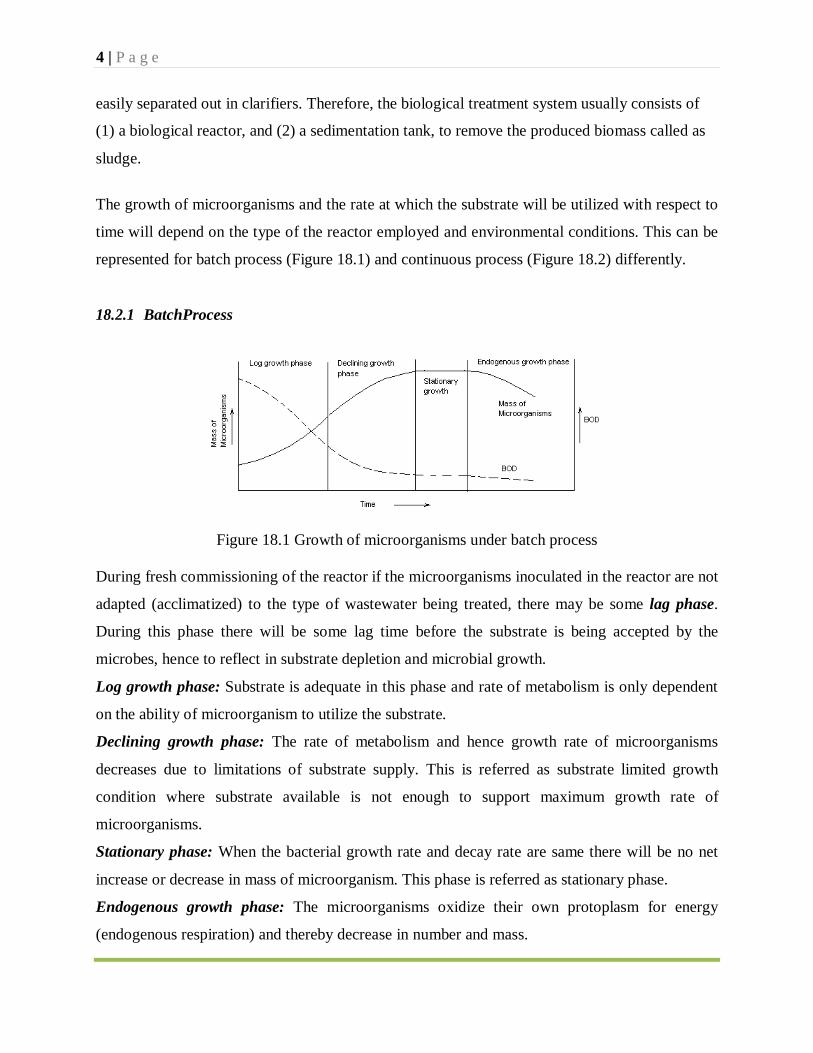
represented for batch process (Figure 18.1) and continuous process (Figure 18.2) differently.
18.2.1 BatchProcess
Figure 18.1 Growth of microorganisms under batch process
During fresh commissioning of the reactor if the microorganisms inoculated in the reactor are not
adapted (acclimatized) to the type of wastewater being treated, there may be some lag phase.
During this phase there will be some lag time before the substrate is being accepted by the
microbes, hence to reflect in substrate depletion and microbial growth.
Log growth phase: Substrate is adequate in this phase and rate of metabolism is only dependent
on the ability of microorganism to utilize the substrate.
Declining growth phase: The rate of metabolism and hence growth rate of microorganisms
decreases due to limitations of substrate supply. This is referred as substrate limited growth
condition where substrate available is not enough to support maximum growth rate of
microorganisms.
Stationary phase: When the bacterial growth rate and decay rate are same there will be no net
increase or decrease in mass of microorganism. This phase is referred as stationary phase.
Endogenous growth phase: The microorganisms oxidize their own protoplasm for energy
(endogenous respiration) and thereby decrease in number and mass.
5 | P a g e
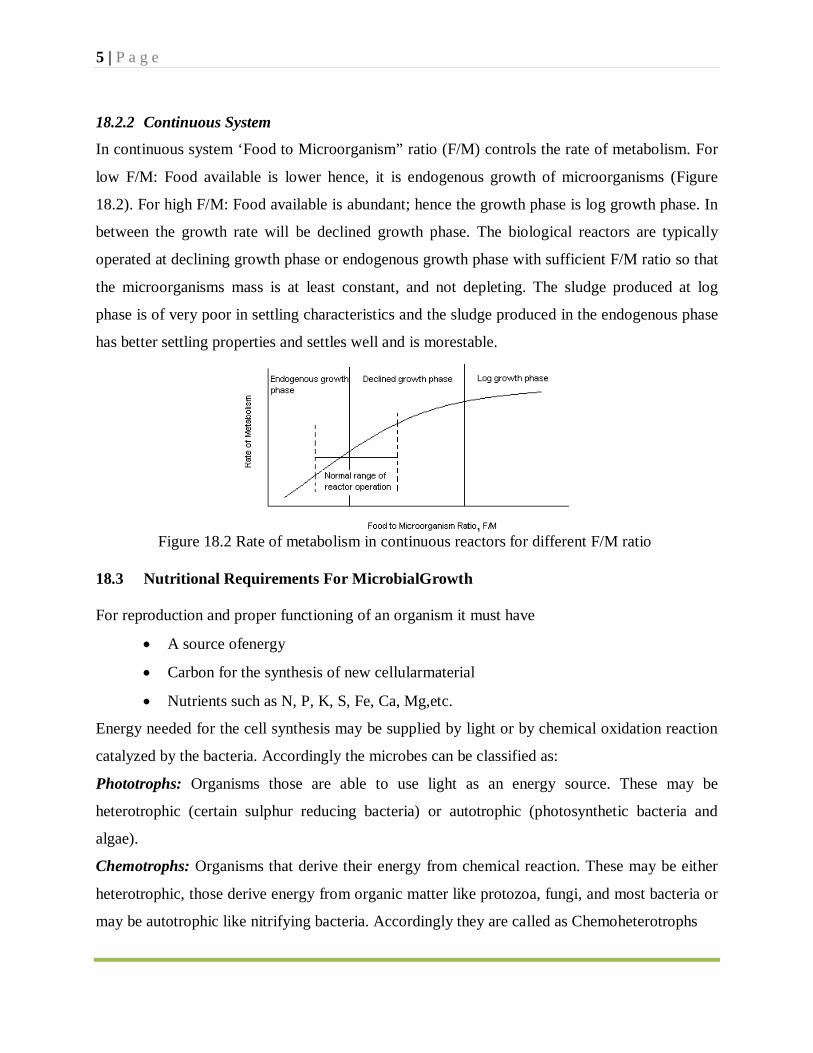
18.2.2 Continuous System
In continuous system ‘Food to Microorganism” ratio (F/M) controls the rate of metabolism. For
low F/M: Food available is lower hence, it is endogenous growth of microorganisms (Figure
18.2). For high F/M: Food available is abundant; hence the growth phase is log growth phase. In
between the growth rate will be declined growth phase. The biological reactors are typically
operated at declining growth phase or endogenous growth phase with sufficient F/M ratio so that
the microorganisms mass is at least constant, and not depleting. The sludge produced at log
phase is of very poor in settling characteristics and the sludge produced in the endogenous phase
has better settling properties and settles well and is morestable.
Figure 18.2 Rate of metabolism in continuous reactors for different F/M ratio
18.3 Nutritional Requirements For MicrobialGrowth
For reproduction and proper functioning of an organism it must have
A source ofenergy
Carbon for the synthesis of new cellularmaterial
Nutrients such as N, P, K, S, Fe, Ca, Mg,etc.
Energy needed for the cell synthesis may be supplied by light or by chemical oxidation reaction
catalyzed by the bacteria. Accordingly the microbes can be classified as:
Phototrophs: Organisms those are able to use light as an energy source. These may be
heterotrophic (certain sulphur reducing bacteria) or autotrophic (photosynthetic bacteria and
algae).
Chemotrophs: Organisms that derive their energy from chemical reaction. These may be either
heterotrophic, those derive energy from organic matter like protozoa, fungi, and most bacteria or
may be autotrophic like nitrifying bacteria. Accordingly they are called as Chemoheterotrophs
6 | P a g e
(those derive energy from oxidation of organic compounds) and chemoautotrophs (those obtain
energy from oxidation of reduced inorganic compounds such as ammonia, nitrite, sulphide).
Source of Carbon: The source of carbon for synthesis of new cell could be organic matter (used
by heterotrophs) or carbon dioxide (used by autotrophs).
Nutrient and growth factor requirement: The principal inorganic nutrients required by
microorganisms are N, S, P, K, Mg, Ca, Fe, Na, Cl, etc. Some of the nutrients are required in
trace amount (very small amount) such as, Zn, Mn, Mo, Se, Co, Ni, Cu, etc. In addition to
inorganic nutrients, organic nutrients may also be required by some organisms and they are
known as ‘growth factors’. These are compounds needed by an organism as precursors or
constituents of organic cell material that cannot be synthesized from other carbon sources.
Requirements of these nutrients differ from organism to organism. For aerobic processes
generally minimum COD:N:P ratio of 100:10:1-5 is maintained. In case of anaerobic treatment
minimum COD:N:P ratio of 350:5:1 is considered essential. The nutrient requirement is lower
for anaerobic process due to lower growth rate of microorganisms as compared to aerobic
process. While treating sewage external macro (N, P, K, S) and micro (trace metals) nutrients
addition is not necessary; however incase of industrial effluent treatment, external addition of
these may be required depending upon the characteristics of thewastewater.
18.4 Types of MicrobialMetabolism
Aerobic microorganisms: When molecular oxygen is used as terminal electron acceptor in
respiratory metabolism it is referred as aerobic respiration. The organisms that exist only when
there is molecular oxygen supply are called as obligately aerobic.
Anoxic microorganisms: For some respiratory microorganisms oxidized inorganic compounds
such as sulphate, nitrate and nitrite can function as electron acceptors in absence of molecular
oxygen; these are called as anoxic microorganisms.
Obligately anaerobic: These are the microorganisms those generate energy by fermentation and
can exist in absence of oxygen.
Facultative anaerobes: These microorganisms have ability to grow in absence or presence of
oxygen. These can be divided in two types: (a) True facultative anaerobes: those can shift from
fermentative to aerobic respiratory metabolism, depending on oxygen available or not; (b)
7 | P a g e
Aerotolerant anaerobes: these follow strictly fermentative metabolism and are insensitive if
oxygen is present in the system.
18.5 Types of BiologicalReactors
Depending upon availability of oxygen or other terminal electron acceptor the biological reactors
are classified as aerobic, anaerobic, anoxic or facultative process. Depending on how the
bacteria are growing in the reactors they can be classified as (a) suspended growth process:
where bacteria are grown in suspension in the reactor without providing any media support such
as activated sludge process, and (b) attached growth process: where microorganism growth
occurs as a biofilm formed on the media surface provided in the reactor such as trickling filters.
This media could be made from rocks or synthetic plastic media offering very high surface area
per unit volume. The media could be stationary in the reactor, as in trickling filter, which is
called as fixed film reactor or it could be moving media as used in moving bed bioreactor
(MBBR). Hybrid reactors are becoming popular these days which employ both suspended
growth as well as attached growth in the reactor to improve biomass retention and substrate
removal kinetics such as submerged aerobic filters(SAF).
8 | P a g e
Questions
1. Why aerobic processes produce more sludge as compared to anaerobicprocess?
2. With the help of figure explain how the rate of metabolism and hence the growth
phase will vary with changes in food to microorganisms ratio in case of continuously
feed biologicalreactor.
3. Explain nutritional requirements for bacterialmetabolism.
4. Describe the types of microbial metabolism used in wastewatertreatment.
6:- Aerobic Secondary Treatment of Wastewater
2 | P a g e
19.1 Activated SludgeProcess
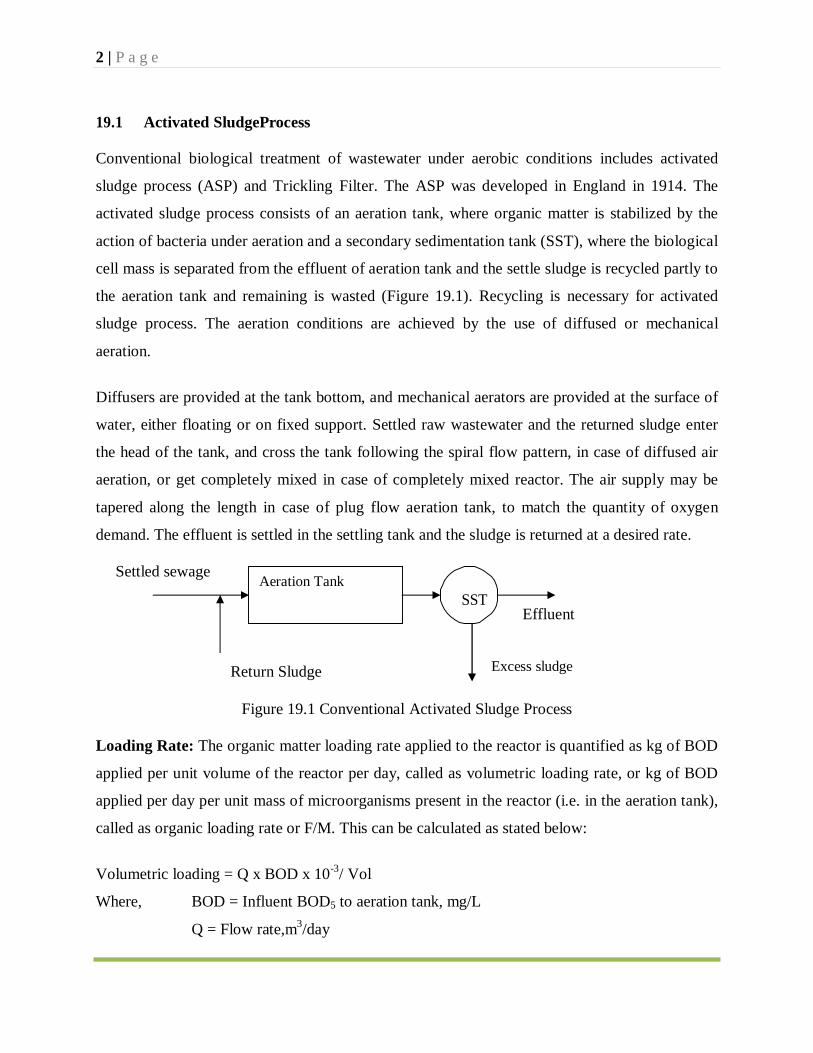
Conventional biological treatment of wastewater under aerobic conditions includes activated
sludge process (ASP) and Trickling Filter. The ASP was developed in England in 1914. The
activated sludge process consists of an aeration tank, where organic matter is stabilized by the
action of bacteria under aeration and a secondary sedimentation tank (SST), where the biological
cell mass is separated from the effluent of aeration tank and the settle sludge is recycled partly to
the aeration tank and remaining is wasted (Figure 19.1). Recycling is necessary for activated
sludge process. The aeration conditions are achieved by the use of diffused or mechanical
aeration.
Diffusers are provided at the tank bottom, and mechanical aerators are provided at the surface of
water, either floating or on fixed support. Settled raw wastewater and the returned sludge enter
the head of the tank, and cross the tank following the spiral flow pattern, in case of diffused air
aeration, or get completely mixed in case of completely mixed reactor. The air supply may be
tapered along the length in case of plug flow aeration tank, to match the quantity of oxygen
demand. The effluent is settled in the settling tank and the sludge is returned at a desired rate.
Settled sewage
Return Sludge
SST Effluent
Excess sludge
Figure 19.1 Conventional Activated Sludge Process
Loading Rate: The organic matter loading rate applied to the reactor is quantified as kg of BOD
applied per unit volume of the reactor per day, called as volumetric loading rate, or kg of BOD
applied per day per unit mass of microorganisms present in the reactor (i.e. in the aeration tank),
called as organic loading rate or F/M. This can be calculated as stated below:
Volumetric loading = Q x BOD x 10-3/ Vol
Where, BOD = Influent BOD5 to aeration tank, mg/L
Q = Flow rate,m3/day
Aeration Tank
3 | P a g e
Vol. = Volume of aeration Tank, m3
Organic Loading Rate, F/M = Q x BOD / (V x Xt)
Where, Xt = MLVSS concentration in the aeration tank, mg/L
The F/M ratio is the main factor controlling BOD removal. Lower F/M values will give higher
BOD removal. The F/M can be varied by varying MLVSS concentration in the aeration tank.
Solid Retention Time (SRT) or Mean Cell Residence Time (MCRT): The performance of the
ASP in terms of organic matter removal depends on the duration for which the microbial mass is
retained in the system. The retention of the sludge depends on the settling rate of the sludge in
the SST. If sludge settles well in the SST proper recirculation of the sludge in aeration tank is
possible, this will help in maintaining desired SRT in the system. Otherwise, if the sludge has
poor settling properties, it will not settle in the SST and recirculation of the sludge will be
difficult and this may reduce the SRT in the system. The SRT can be estimated as statedbelow:
SRT = kg of MLVSS inaerationTank
(kg of VSS wasted per day + kg of VSS lost in effluent perday)
Generally, the VSS lost in the effluent are neglected as this is very small amount as compared to
artificial wasting of sludge carried out from the sludge recycle line or from aeration tank.
Sludge Volume Index: The quantity of the return sludge is determined on volumetric basis. The
sludge volume index (SVI) is the volume of the sludge in mL for one gram of dry weight of
suspended solids (SS), measured after 30 minutes of settling. The SVI varies from 50 to 150
mL/ g of SS. Lower SVI indicates better settling ofsludge.
Quantity of Return Sludge: Usually solid concentration of about 1500 to 3000 mg/L (MLVSS
80% of MLSS) is maintained for conventional ASP and 3000 to 6000 mg/L for completely
mixed ASP. Accordingly the quantity of return sludge is determined to maintain this
concentration. The sludge return ratio is usually 20 to 50%. The F/M ratio is kept as 0.2 to 0.4
for conventional ASP and 0.2 to 0.6 for completely mixedASP.

4 | P a g e
Sludge Bulking: The sludge which does not settle well in sedimentation tank is called as bulking
sludge. It may be due to either (a) the growth of filamentous microorganisms which do not allow
desirable compaction; or (b) due to the production of non-filamentous highly hydrated biomass.
There are many reasons for sludge bulking. The presence of toxic substances in influent,
lowering of temperature, insufficient aeration, and shock loading can also cause sludge bulking.
Proper supply of air and proper design to maintain endogenous growth phase of metabolism will
not produce bulking of sludge. The sludge bulking can be controlled by restoring proper air
supply, eliminating shock loading to the reactor, or by increasing temperature of the wastewater
or by small hypochlorite dosing to the return sludge line to avoid the growth of filamentous
hygroscopic microorganisms.
Mixing Conditions: The aeration tank can be of plug flow type or completely mixed type. In the
plug flow tank, the F/M and oxygen demand will be highest at the inlet end of the aeration tank
and it will then progressively decrease. In the completely mix system, the F/M and oxygen
demand will be uniform throughout the tank.
Flow Scheme: Sewage addition may be done at a single point at the inlet end of the tank or it
may be at several points along the aeration tank. The sludge return is carried out from the
underflow of the settling tank to the aeration tank. The sludge wastage can be done from return
sludge line or from aeration tank itself. Sludge wasting from the aeration tank will have better
control over the process, however higher sludge waste volume need to be handled in this case
due to lower concentration as compared to when wasting is done from underflow of SST. The
compressed air may be applied uniformly along the whole length of the tank or it may be tapered
from the head of the aeration tank to itsend.
19.1.1 Aeration inASP
Aeration units can be classifiedas:
1) Diffused AirUnits 2) Mechanical AerationUnits 3) Combined Mechanical and diffused airunits.
5 | P a g e
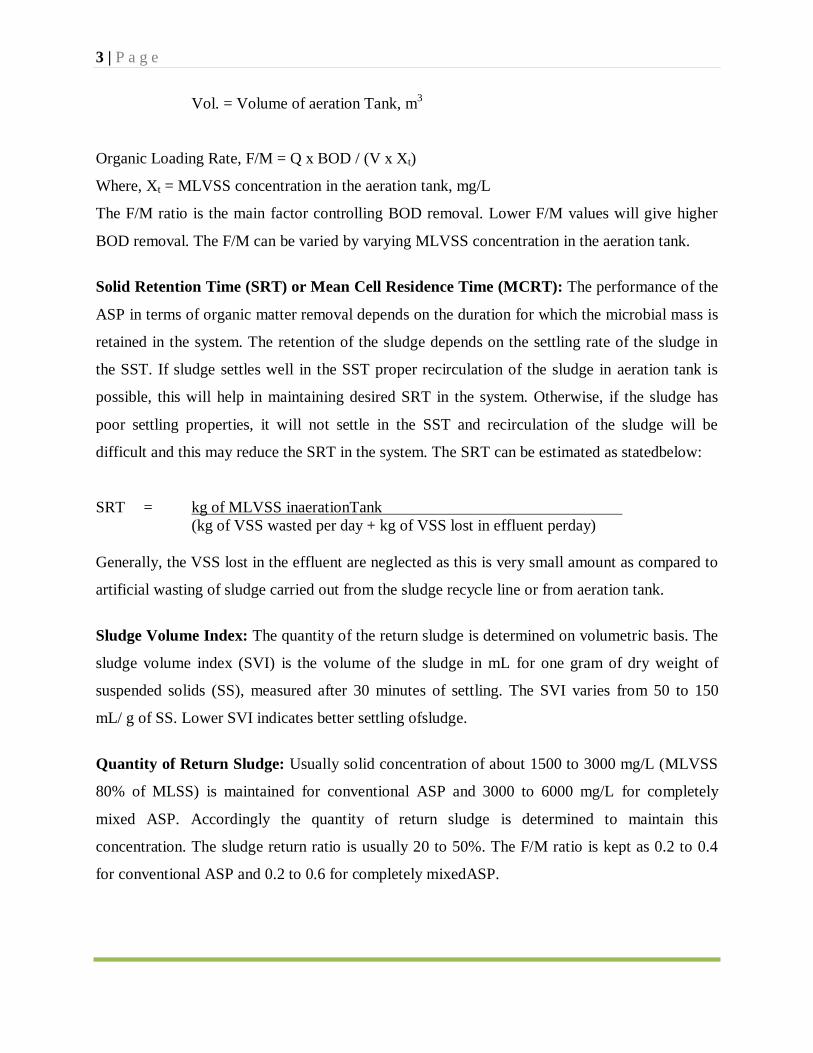
19.1.1.1 Diffused air aeration
In diffused air aeration, compressed air is blown through diffusers. The tanks of these units are
generally in the form of narrow rectangular channels. The air diffusers are provided at the
bottom of tank. The air before passing through diffusers must be passed through air filter to
remove dirt. The required pressure is maintained by means of aircompressors.
Figure 19.2.Typical air diffusers arrangement
Types of air diffusers
a) Jet diffusers: These diffusers give direct stream of air in the form of jet downward and
strike against a small bowl kept just below the nozzle of the jet. The air flashes over the
surface of the bowl and escapes in the form of finebubbles.
b) Porous diffusers: Manufactured in the form of tubes and plates from grains of crushed
quartz, aluminum oxide or carbon fused to form a porous structure. These are tile shaped
or tubular shape. 10 to 20 % area of the tank is covered with porous tiles. The supply of
air is done through pipeline laid in the floor of the tank and is controlled by the valves.
Depending upon the size of the air bubbles these can be classified as fine or medium
bubble diffused-air aerationdevice.
In common practice, porous dome type air diffusers of 10 to 20 cm diameter are used. These are
directly fixed on the top of C.I. main pipes laid at the bottom of the aeration tanks. These are
cheap in initial as well as maintenance cost.
Air Supply: Normally air is supplied under pressure of 0.55 to 0.7 kg/cm2. The quantity of air
supplied varies from 1.25 to 9.50 m3/m3 of sewage depending on the strength of the sewage to be
treated and degree of treatment desired. The oxygen transfer capacity of the aerators depends on
the size of air bubbles, for fine bubble oxygen transfer capabilities of aeration device is 0.7 to 1.4
6 | P a g e
kg O2/KW.h. For medium bubble it is 0.6 to 1.0 kg O2/KW.h, and for coarse bubble it is 0.3 to
0.9 kg O2/KW.h.
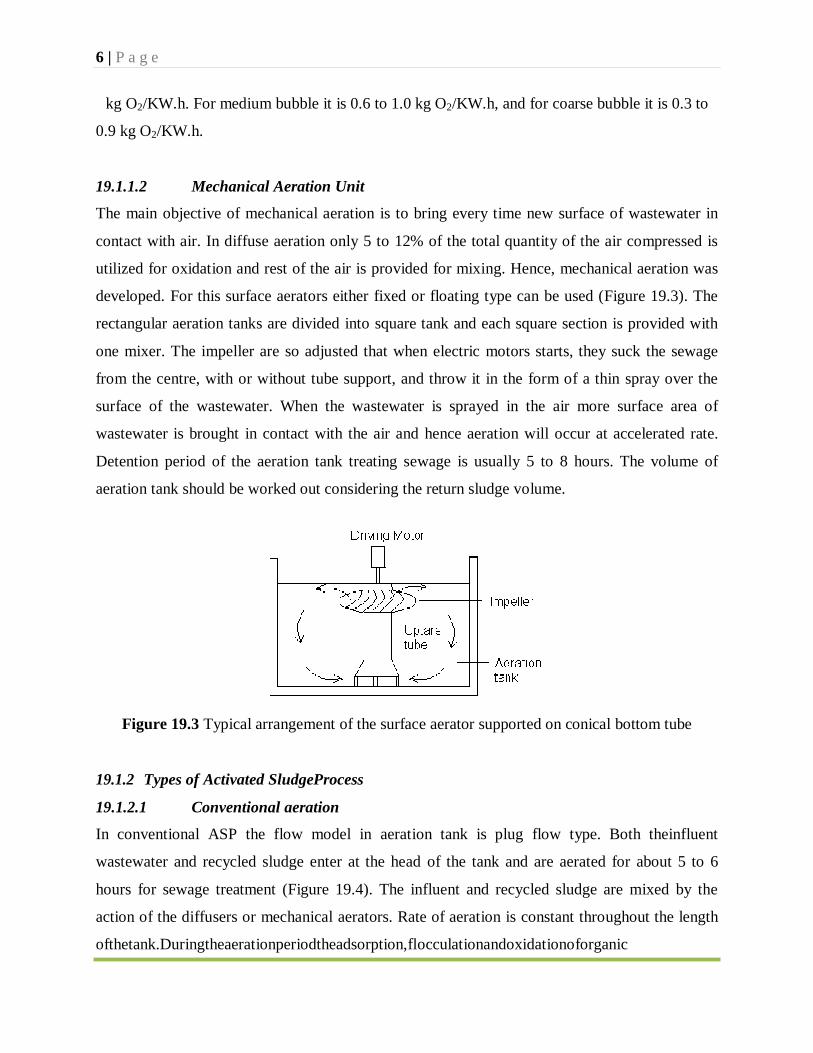
19.1.1.2 Mechanical Aeration Unit
The main objective of mechanical aeration is to bring every time new surface of wastewater in
contact with air. In diffuse aeration only 5 to 12% of the total quantity of the air compressed is
utilized for oxidation and rest of the air is provided for mixing. Hence, mechanical aeration was
developed. For this surface aerators either fixed or floating type can be used (Figure 19.3). The
rectangular aeration tanks are divided into square tank and each square section is provided with
one mixer. The impeller are so adjusted that when electric motors starts, they suck the sewage
from the centre, with or without tube support, and throw it in the form of a thin spray over the
surface of the wastewater. When the wastewater is sprayed in the air more surface area of
wastewater is brought in contact with the air and hence aeration will occur at accelerated rate.
Detention period of the aeration tank treating sewage is usually 5 to 8 hours. The volume of
aeration tank should be worked out considering the return sludge volume.
Figure 19.3 Typical arrangement of the surface aerator supported on conical bottom tube
19.1.2 Types of Activated SludgeProcess
19.1.2.1 Conventional aeration
In conventional ASP the flow model in aeration tank is plug flow type. Both theinfluent
wastewater and recycled sludge enter at the head of the tank and are aerated for about 5 to 6
hours for sewage treatment (Figure 19.4). The influent and recycled sludge are mixed by the
action of the diffusers or mechanical aerators. Rate of aeration is constant throughout the length
ofthetank.Duringtheaerationperiodtheadsorption,flocculationandoxidationoforganic

7 | P a g e
Influent
Sludge recirculation
Aeration Tank
SST
Effluent
Influent
Sludge recirculation
SST Aeration Tank Sludge waste
Effluent
matter takes place. The F/M ratio of 0.2 to 0.4 kg BOD/kg VSS.d and volumetric loading rate of
0.3 to 0.6 kg BOD/m3.d is used for designing this type of ASP. Lower mixed liquor suspended
solids (MLSS) concentration is maintained in the aeration tank of the order of 1500 to 3000
mg/L and mean cell residence time of 5 to 15 days is maintained. The hydraulic retention time
(HRT) of 4 to 8 h is required for sewage treatment. Higher HRT may be required for treatment
of industrial wastewater having higher BOD concentration. The sludge recirculation ratio is
generally in the range of 0.25 to0.5.
Figure 19.4 Conventional activated sludge process
19.1.2.2 Tapered Aeration
In plug flow type aeration tank BOD load is maximum at the inlet and it reduces as wastewater
moves towards the effluent end. Hence, accordingly in tapered aeration maximum air is applied
at the beginning and it is reduced in steps towards end, hence it is called as tapered aeration
(Figure 19.5). By tapered aeration the efficiency of the aeration unit will be increased and it will
also result in overall economy. The F/M ratio and volumetric loading rate of 0.2 to 0.4 kg
BOD/kg VSS.d and 0.3 to 0.6 kg BOD/m3.d, respectively, are adopted in design. Other design
recommendation are mean cell residence time of 5 to 15 days, MLSS of 1500 to 3000 mg/L,
HRT of 4 to 8 h and sludge recirculation ratio of 0.25 to 0.5. Although, the design loading rates
are similar to conventional ASP, tapered aeration gives betterperformance.

8 | P a g e
Figure 19.5 Tapered aeration activated sludge process
19.1.2.3 Stepaeration
If the sewage is added at more than one point along the aeration channel, the process is called as
step aeration (Figure 19.6). This will reduce the load on returned sludge. The aeration is uniform
throughout the tank. The F/M ratio and volumetric loading rate of 0.2 to 0.4 kg BOD/kg VSS.d
and 0.6 to 1.0 kg BOD/m3.d, respectively, are adopted in design. Other design recommendation
are mean cell residence time of 5 to 15 days, MLSS of 2000 to 3500 mg/L, HRT of 3 to 5 h and
sludge recirculation ratio of 0.25 to 0.75. In step aeration the design loading rates are slightly
higher than conventional ASP. Because of reduction of organic load on the return sludge it gives
better performance.
Figure 19.6 Step aeration activated sludge process
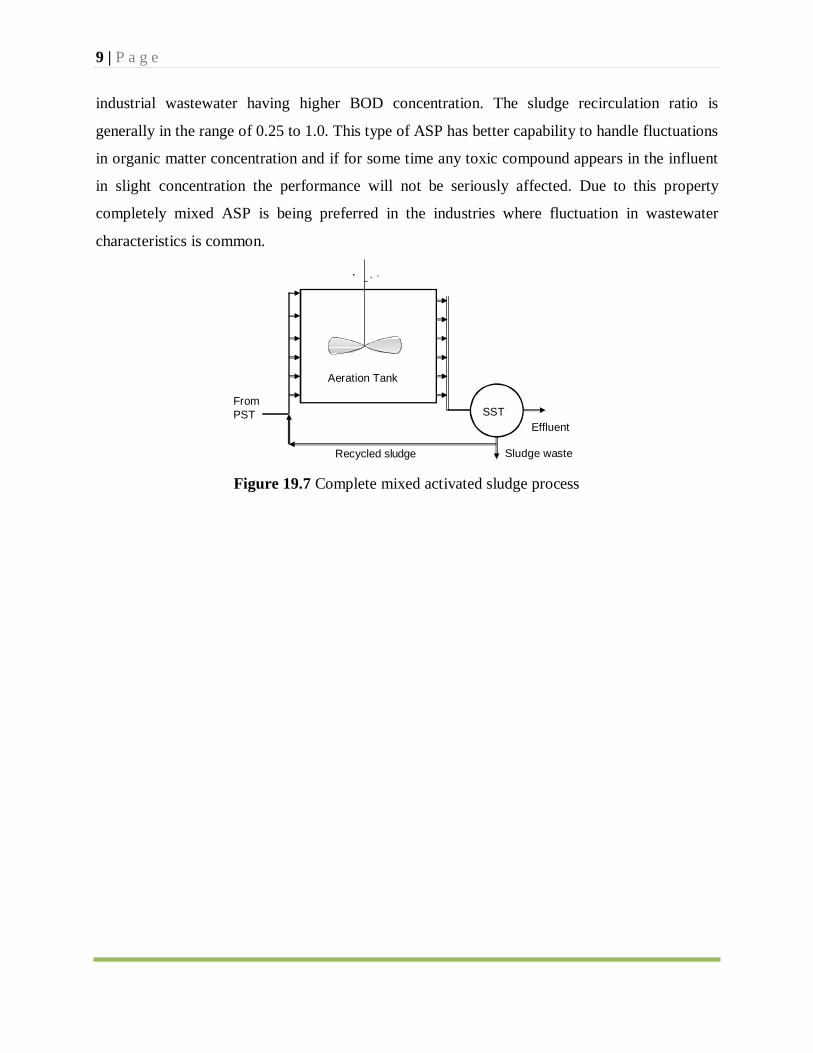
19.1.2.4 Completelymixed
In this type of aeration tank completely mixed flow regime is used. The wastewater is distributed
along with return sludge uniformly from one side of the tank and effluent is collected at other
end of the tank (Figure 19.7). The F/M ratio of 0.2 to 0.6 kg BOD/kg VSS.d and volumetric
loading of 0.8 to 2.0 kg BOD/m3.d is used for designing this type of ASP. Higher mixed liquor
suspended solids (MLSS) is maintained in the aeration tank of the order of 3000 to 6000 mg/L
and mean cell residence time of 5 to 15 days is maintained. The hydraulic retention time (HRT)
of3to5hisrequiredforsewagetreatment.HigherHRTmayberequiredfortreatmentof
Influent
Sludge recirculation
Aeration Tank
SST
Effluent
9 | P a g e
industrial wastewater having higher BOD concentration. The sludge recirculation ratio is
generally in the range of 0.25 to 1.0. This type of ASP has better capability to handle fluctuations
in organic matter concentration and if for some time any toxic compound appears in the influent
in slight concentration the performance will not be seriously affected. Due to this property
completely mixed ASP is being preferred in the industries where fluctuation in wastewater
characteristics is common.
From PST
Aeration Tank
Recycled sludge
SST
Effluent
Sludge waste
Figure 19.7 Complete mixed activated sludge process

2 | P a g e
7:- Aerobic Secondary Treatment of Wastewater (Contd.)
3 | P a g e
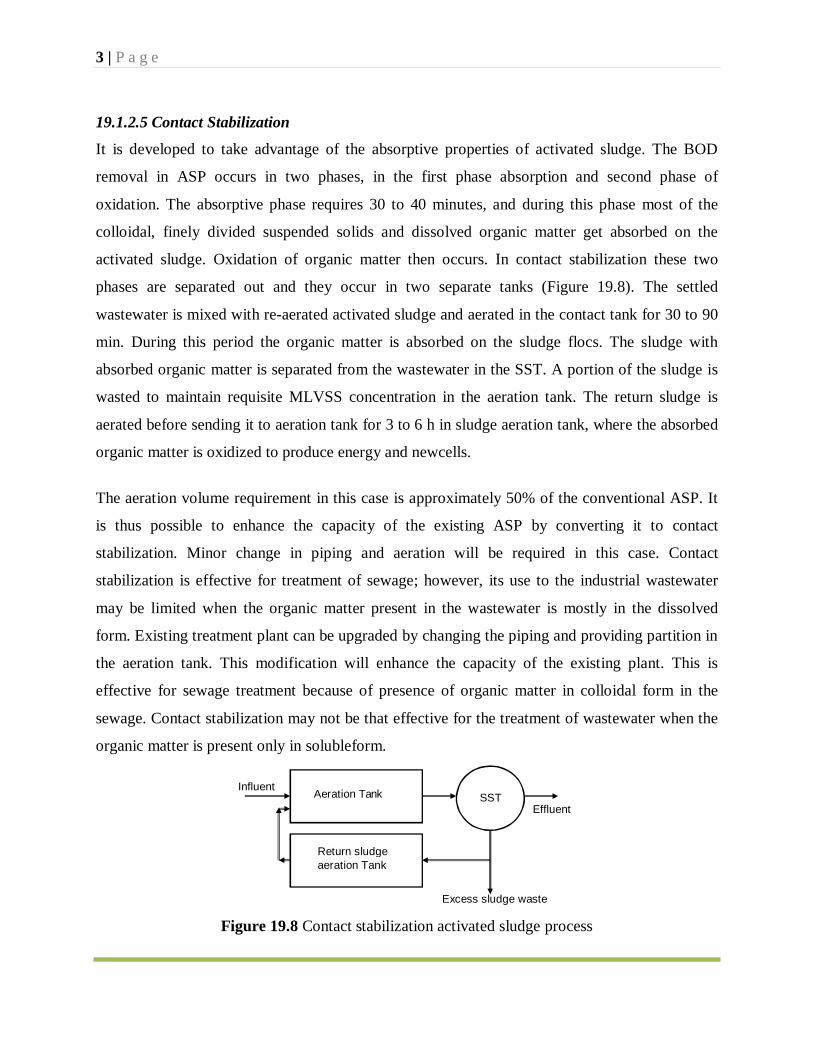
19.1.2.5 Contact Stabilization
It is developed to take advantage of the absorptive properties of activated sludge. The BOD
removal in ASP occurs in two phases, in the first phase absorption and second phase of
oxidation. The absorptive phase requires 30 to 40 minutes, and during this phase most of the
colloidal, finely divided suspended solids and dissolved organic matter get absorbed on the
activated sludge. Oxidation of organic matter then occurs. In contact stabilization these two
phases are separated out and they occur in two separate tanks (Figure 19.8). The settled
wastewater is mixed with re-aerated activated sludge and aerated in the contact tank for 30 to 90
min. During this period the organic matter is absorbed on the sludge flocs. The sludge with
absorbed organic matter is separated from the wastewater in the SST. A portion of the sludge is
wasted to maintain requisite MLVSS concentration in the aeration tank. The return sludge is
aerated before sending it to aeration tank for 3 to 6 h in sludge aeration tank, where the absorbed
organic matter is oxidized to produce energy and newcells.
The aeration volume requirement in this case is approximately 50% of the conventional ASP. It
is thus possible to enhance the capacity of the existing ASP by converting it to contact
stabilization. Minor change in piping and aeration will be required in this case. Contact
stabilization is effective for treatment of sewage; however, its use to the industrial wastewater
may be limited when the organic matter present in the wastewater is mostly in the dissolved
form. Existing treatment plant can be upgraded by changing the piping and providing partition in
the aeration tank. This modification will enhance the capacity of the existing plant. This is
effective for sewage treatment because of presence of organic matter in colloidal form in the
sewage. Contact stabilization may not be that effective for the treatment of wastewater when the
organic matter is present only in solubleform.
Excess sludge waste
Figure 19.8 Contact stabilization activated sludge process
Influent Aeration Tank SST
Effluent
Return sludge aeration Tank
4 | P a g e
19.1.2.6 Extended Aeration
In extended aeration process, low organic loading rate (F/M) and long aeration time is used to
operate the process at endogenous respiration phase of the growth curve. Since, the cells undergo
endogenous respiration, the excess sludge generated in this process is low and the sludge can
directly be applied on the sand drying beds where aerobic digestion and dewatering of the sludge
occurs. The primary sedimentation can be eliminated when extended aeration process is used to
simplify the operation of sludge handling. This type of activated sludge process is suitable for
small capacity plant, such as package sewage treatment plant or industrial wastewater treatment
plant of small capacity of less than 3000 m3/day. This process simplifies the sludge treatment
and separate sludge thickening and digestion is not required. The aeration tank in this case is
generally completely mixedtype.
Lower F/M ratio of 0.05 to 0.15 kg BOD/kg VSS.d and volumetric loading of 0.1 to 0.4 kg
BOD/m3.d is used for designing extended aeration ASP. Mixed liquor suspended solids (MLSS)
concentration of the order of 3000 to 6000 mg/L and mean cell residence time of 20 to 30 days is
maintained. Higher mean cell residence time is necessary to maintain endogenous growth phase
of microorganisms. The hydraulic retention time (HRT) of 18 to 36 h is required. The sludge
recirculation ratio is generally in the range of 0.75 to 1.5.
19.1.2.7 The Oxidation ditch
It is particular type of extended aeration process, where aeration tank is constructed in the ditch
shape (oval shape) as shown in the Figure 19.9. The aeration tank consists of a ring shaped
channel 1.0 to 1.5 m deep and of suitable width forming a trapezoidal or rectangular channel
cross-section. An aeration rotor, consisting of Kessener brush, is placed across the ditch to
provide aeration and wastewater circulation at velocity of about 0.3 to 0.6 m/s.
The oxidation ditch can be operated as intermittent with fill and draw cycles consisting of (a)
closing inlet valve and aerating the wastewater for duration equal to design detention time, (b)
stopping aeration and circulation device and allowing the sludge to settle down in the ditchitself,
(c)Openingtheinletandoutletvalveallowingtheincomingwastewatertodisplacetheclarified
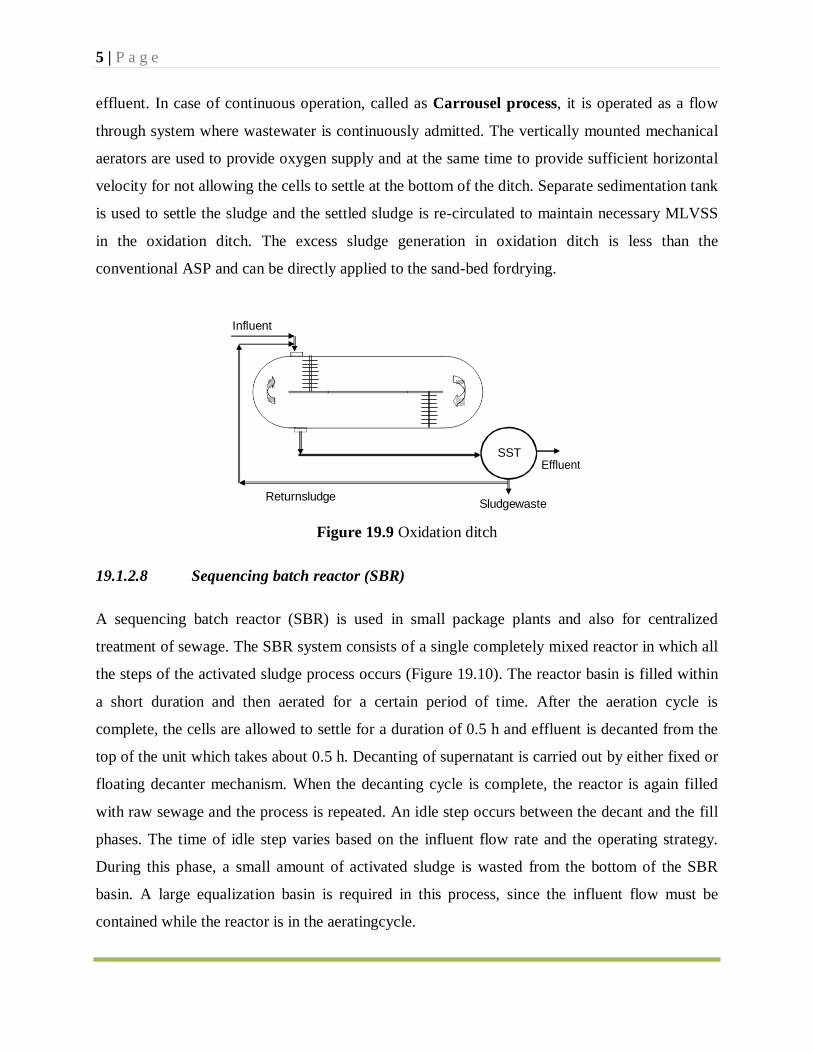
5 | P a g e
SST Effluent
effluent. In case of continuous operation, called as Carrousel process, it is operated as a flow
through system where wastewater is continuously admitted. The vertically mounted mechanical
aerators are used to provide oxygen supply and at the same time to provide sufficient horizontal
velocity for not allowing the cells to settle at the bottom of the ditch. Separate sedimentation tank
is used to settle the sludge and the settled sludge is re-circulated to maintain necessary MLVSS
in the oxidation ditch. The excess sludge generation in oxidation ditch is less than the
conventional ASP and can be directly applied to the sand-bed fordrying.
Influent
Returnsludge Sludgewaste
Figure 19.9 Oxidation ditch
19.1.2.8 Sequencing batch reactor (SBR)
A sequencing batch reactor (SBR) is used in small package plants and also for centralized
treatment of sewage. The SBR system consists of a single completely mixed reactor in which all
the steps of the activated sludge process occurs (Figure 19.10). The reactor basin is filled within
a short duration and then aerated for a certain period of time. After the aeration cycle is
complete, the cells are allowed to settle for a duration of 0.5 h and effluent is decanted from the
top of the unit which takes about 0.5 h. Decanting of supernatant is carried out by either fixed or
floating decanter mechanism. When the decanting cycle is complete, the reactor is again filled
with raw sewage and the process is repeated. An idle step occurs between the decant and the fill
phases. The time of idle step varies based on the influent flow rate and the operating strategy.
During this phase, a small amount of activated sludge is wasted from the bottom of the SBR
basin. A large equalization basin is required in this process, since the influent flow must be
contained while the reactor is in the aeratingcycle.

6 | P a g e
Substrate added
Aeration
Air off
Air off Effluent
Figure 19.10 Operation cycles of sequencing batch reactor
This process is popular because entire process uses one reactor basin. In areas where there is a
limited amount of space, treatment takes place in a single basin instead of multiple basins,
allowing for a smaller footprint. In the effluent low total-suspended-solid values of less than 10
mg/L can be achieved consistently through the use of effective decanters that eliminate the need
for a separate clarifier. The treatment cycle can be adjusted to undergo aerobic, anaerobic and
anoxic conditions in order to achieve biological nutrient removal, including nitrification,
denitrification and some phosphorus removal.
19.1.3 Limitations ofASP
For treatment of wastewater with high organic matter concentration, say if the resulting COD
concentration in the aeration tank after dilution is in few thousands mg/L, then it will produce
biomass of about 50% of the COD concentration. With original biomass concentration plus the
generated biomass, the total biomass concentration in the system will be higher. This may pose
the difficulty of operating ASP such as uniform aerating the system at such high biomass
concentration, and settling and recirculation of the sludge. Hence, this process is not
recommended for first stage treatment of high concentrated organic wastewaters.
19.1.4 Kinetics of the Bacterial Growth in Activated SludgeProcess
During oxidation of organic matter in ASP following reaction occurs
COHNS + O2+nutrients CO2 + NH3 + C5H7O2N + Other products (organicmatter) (bacteria) (new cell)
Step 5: Idle Step3:Settle Step 4:Decant Step 2: Reaction Step 1: Fill
Air off / on
Sludge wasted
Air on/off
7 | P a g e
ƒ 0
m
Under endogenous respiration the reaction is
C5H7O2N +5O2 5CO2 + 2H2O + NH3 +energy (cell) (bacteria) 113 160
The above equation for endogenous respiration tells that for 1 unit mass of cell 160/113 = 1.42
times oxygen is required.
The biomass is the matter of interest rather than the number of organisms for the mixed cultures
in the activated sludge process. The rate of biomass increase during the log growth phase is
directly proportional to the initial biomass concentration, which is represented by the following
first order equation
dX= µX (1) dt
Where dX= growth rate of biomass(g/m3.d) dt
X = biomass concentration (g/m3)
µ = specific growth rate constant (d-1). It is the mass of the cells produced per
unit mass of the cells present per unit time
If the biomass concentration is Xo, at time t = 0, then integrating Eq. (1),
X dX X0 X
lnX
X0
= ƒt µ dt
=µt
X =X0 eµt (2)
The exponential growth rate of the bacteria (Eq. 2) occurs as long as there is no change in the
biomass composition or environmental condition.
Monod (1949) showed experimentally that the biomass growth rate is a function of biomass
concentration and limiting nutrient concentration. The Monod’s equation for biomass growth rate
is expressed as
µ =µ SKs +S
(3)
8 | P a g e
d
Where S = limiting substrate concentration(g/m3)
µm = maximum biomass growth rate (d-1)
Ks = half saturation constant, i.e. substrate concentration at one half maximum
growth rate (concentration of S when µ = µ m/2, g/m3)
Eq. (3) assumes only the growth of the microorganisms. However, there is simultaneous die-off
of microorganisms. Therefore, an endogenous decay is used to take account of die-off. Hence,
Eq. (1) becomes
dX= µX — k X dt
dX= ( µm S )X—kdX (4) dt Ks + S
Where kd = endogenous decay rate (d-1). The kd value is in the range of 0.04 to 0.075 per
day, typically 0.06 per day.
If all the substrate (organic food, S) could be converted to biomass, then the substrate utilization
rate is
—dS dt
=
dXdt
(5)
However, all the substrates cannot be converted to biomass because of catabolic reaction i.e.,
energy generation from oxidation of biomass is must for supporting anabolic reaction (biomass
synthesis) in the conversion process. Therefore, a yield coefficient (Y < 1) is introduced such that
the substrate utilization rate is higher than the biomass growth rate.
— dS = 1 dX
(6) dt Fdt
— dS= 1µNSX
(7) dt F kC +S
Where Y = yield coefficient i.e., fraction of substrate converted to biomass, (g/m3 of
biomass) / (g/m3 of substrate). The value of Y typically varies from 0.4 to 0.8
mg VSS/mg BOD (0.25 to 0.4 mg VSS/mg COD) in aerobicsystems.

2 | Page
8:- Aerobic Secondary Treatment Of Wastewater (Contd.)
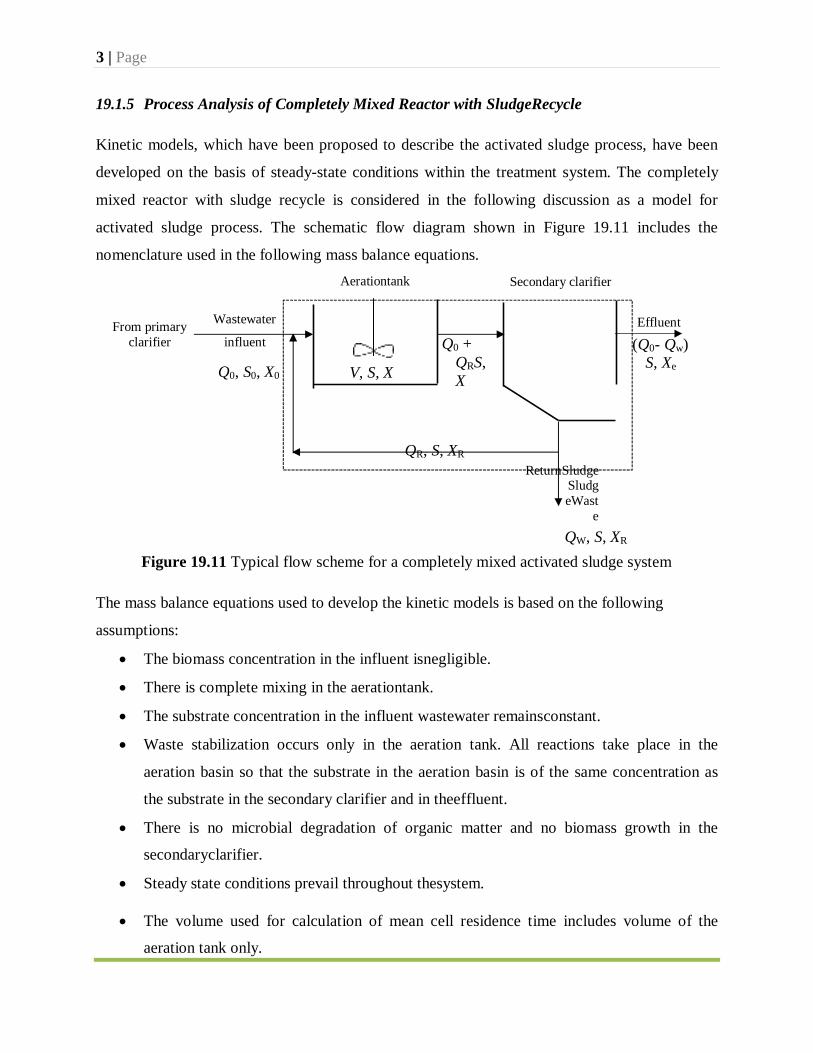
3 | Page
19.1.5 Process Analysis of Completely Mixed Reactor with SludgeRecycle
Kinetic models, which have been proposed to describe the activated sludge process, have been
developed on the basis of steady-state conditions within the treatment system. The completely
mixed reactor with sludge recycle is considered in the following discussion as a model for
activated sludge process. The schematic flow diagram shown in Figure 19.11 includes the
nomenclature used in the following mass balance equations.
Aerationtank Secondary clarifier
From primary clarifier
Wastewater
influent
Q0, S0, X0
V, S, X
Q0 +
QRS, X
Effluent
(Q0- Qw) S, Xe
QR, S, XR ReturnSludge
SludgeWast
e
QW, S, XR
Figure 19.11 Typical flow scheme for a completely mixed activated sludge system
The mass balance equations used to develop the kinetic models is based on the following
assumptions:
The biomass concentration in the influent isnegligible.
There is complete mixing in the aerationtank.
The substrate concentration in the influent wastewater remainsconstant.
Waste stabilization occurs only in the aeration tank. All reactions take place in the
aeration basin so that the substrate in the aeration basin is of the same concentration as
the substrate in the secondary clarifier and in theeffluent.
There is no microbial degradation of organic matter and no biomass growth in the
secondaryclarifier.
Steady state conditions prevail throughout thesystem.
The volume used for calculation of mean cell residence time includes volume of the
aeration tank only.

4 | Page
(8)
(9)
O O
Biomass mass balance
A mass balance for the microorganisms in the completely mixed reactor (Figure 19.11) can be
written as follows:
Net rate of change in biomass inside the system boundary
Rate at which
= biomass enters in - the system
Rate at which biomass leaves
the system
(8)
The above mass balance statement can be simplified to
Accumulation = Inflowof biomass
Netgrowth + ofbiomass
- Outflow of biomass
(9)
It is assumed that steady state condition prevails in the system; hence accumulation of biomass in
the system will be zero. Therefore:
Influent biomass
+ Biomass production
Effluent = biomass
Wasted biomass
(10) (10)
Q X + VdX dt
= (QO— QW) Xe+QWXR (11)
where Q0 = Influent flow rate(m3/d)
X0 = Influent biomass concentration (g/m3)
V = Volume of the aeration basin (m3)
QW = Flow rate of waste sludge(m3/d)
Xe = Effluent biomass concentration (g/m3)
XR = Biomass concentration in the return sludge (g/m3)
It is assumed that the biomass concentration in the influent wastewater and in the effluent from
the clarifier is negligible, i.e., X0 = Xe = 0. Therefore, Eq. 11 becomes
V dX
dt
= QWXR (12)
Substituting Eq. 4 in Eq. 12,
+
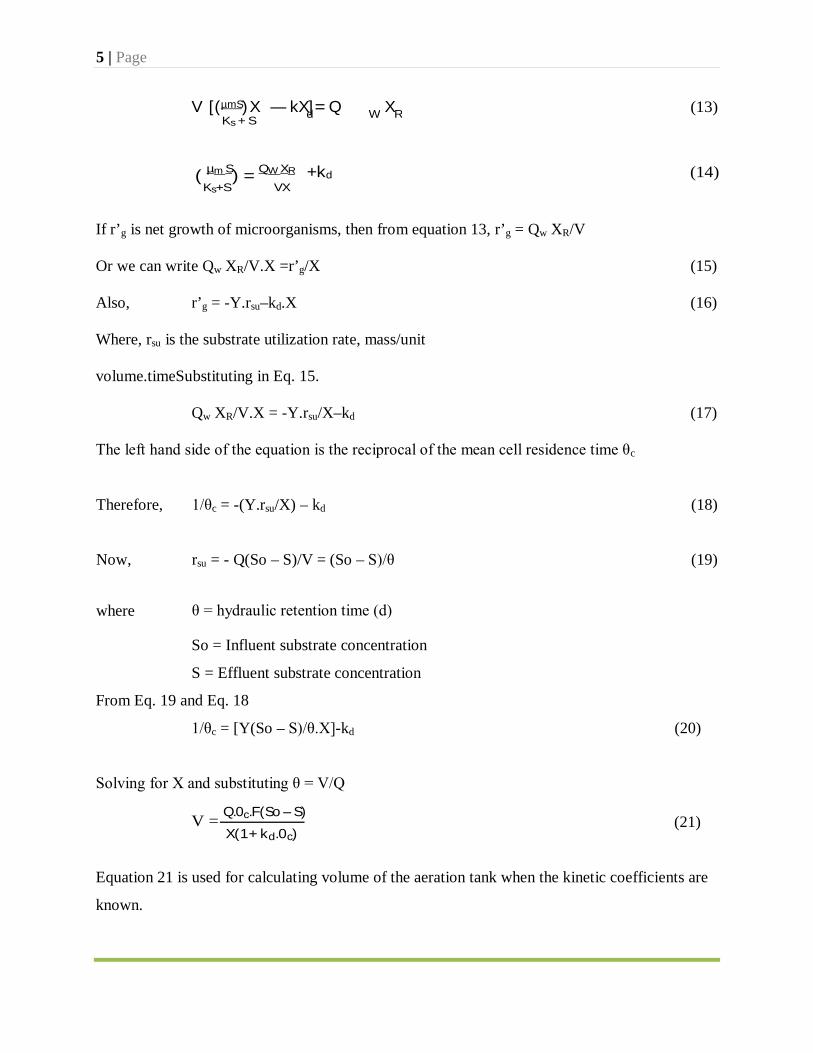
5 | Page
d W R V [(µmS)X — kX]= Q X (13) Ks + S
( µm S) = QW XR +kd (14) Ks+S VX
If r’g is net growth of microorganisms, then from equation 13, r’g = Qw XR/V
Or we can write Qw XR/V.X =r’g/X (15)
Also, r’g = -Y.rsu–kd.X (16)
Where, rsu is the substrate utilization rate, mass/unit
volume.timeSubstituting in Eq. 15.
Qw XR/V.X = -Y.rsu/X–kd (17)
The left hand side of the equation is the reciprocal of the mean cell residence time θc
Therefore, 1/θc = -(Y.rsu/X) – kd (18)
Now,
where
rsu = - Q(So – S)/V = (So – S)/θ
θ = hydraulic retention time (d)
(19)
So = Influent substrate concentration
S = Effluent substrate concentration
From Eq. 19 and Eq. 18
1/θc = [Y(So – S)/θ.X]-kd (20)
Solving for X and substituting θ = V/Q
V = Q.0c.F(So – S) X(1+ kd.0c)
(21)
Equation 21 is used for calculating volume of the aeration tank when the kinetic coefficients are
known.
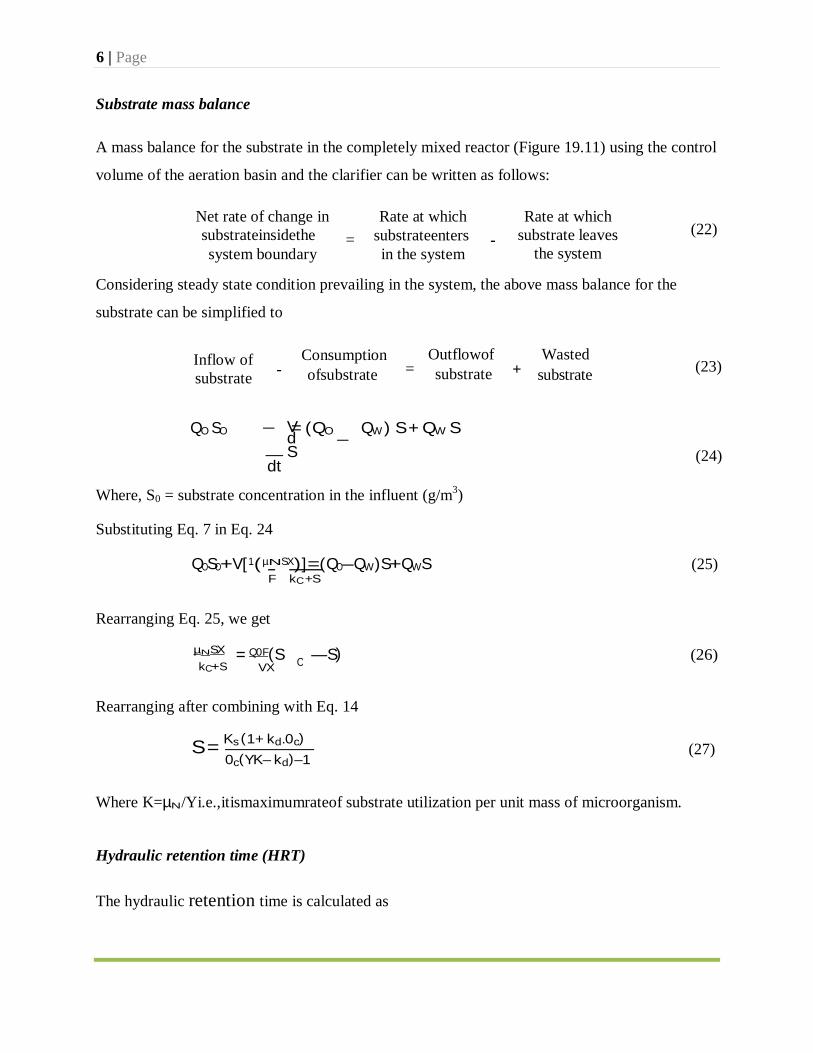
6 | Page
(22)
(23)
O
Substrate mass balance
A mass balance for the substrate in the completely mixed reactor (Figure 19.11) using the control
volume of the aeration basin and the clarifier can be written as follows:
Net rate of change in substrateinsidethe = system boundary
Rate at which substrateenters - in the system
Rate at which substrate leaves
the system
(22)
Considering steady state condition prevailing in the system, the above mass balance for the
substrate can be simplified to
Inflow of substrate
Consumption - ofsubstrate
Outflowof = substrate
Wasted + substrate
(23)
QO SO — VdS
dt
= (QO —
QW ) S + QW S
(24)
Where, S0 = substrate concentration in the influent (g/m3)
Substituting Eq. 7 in Eq. 24
QOSO+V[1(µNSX)]=(QO—QW)S+QWS (25) F kC +S
Rearranging Eq. 25, we get
µNSXkC+S
= Q0F(S —S) (26) VX
Rearranging after combining with Eq. 14
S = Ks (1+ kd.0c) 0c(YK– kd)–1
(27)
Where K=µN/Yi.e.,itismaximumrateof substrate utilization per unit mass of microorganism.
Hydraulic retention time (HRT)
The hydraulic retention time is calculated as
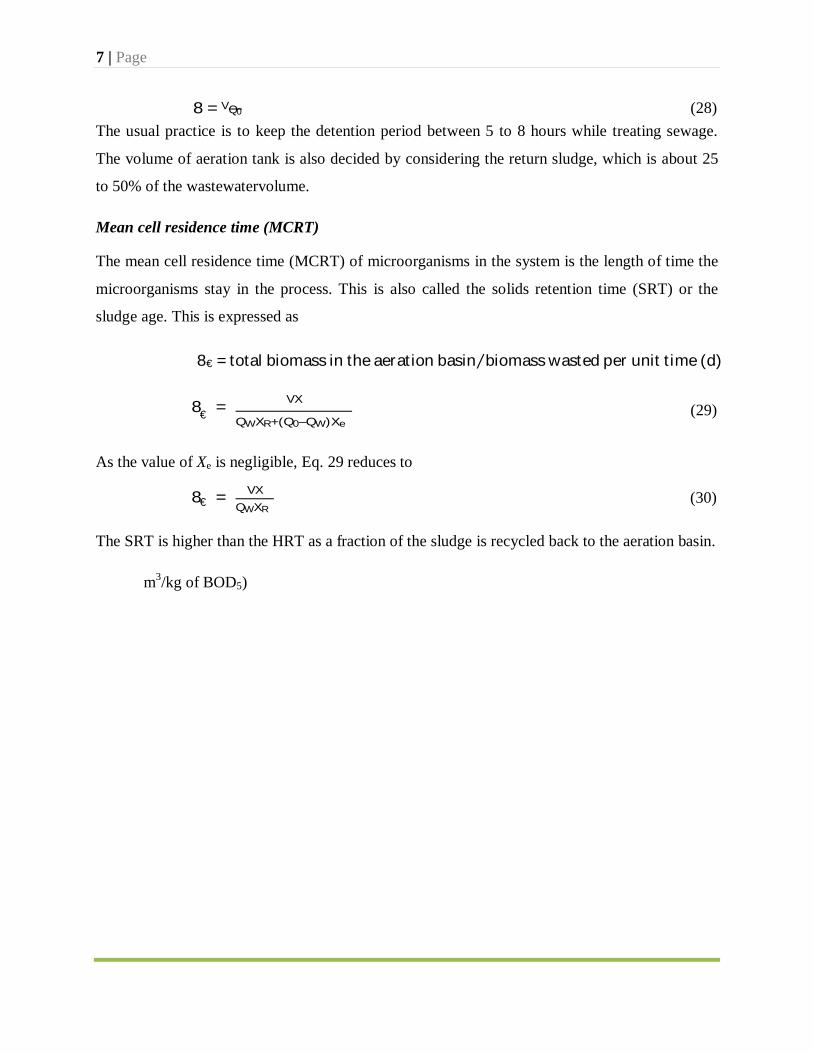
7 | Page
€
€
8 = VQ0 (28)
The usual practice is to keep the detention period between 5 to 8 hours while treating sewage.
The volume of aeration tank is also decided by considering the return sludge, which is about 25
to 50% of the wastewatervolume.
Mean cell residence time (MCRT)
The mean cell residence time (MCRT) of microorganisms in the system is the length of time the
microorganisms stay in the process. This is also called the solids retention time (SRT) or the
sludge age. This is expressed as
8€ = total biomass in the aeration basin⁄biomass wasted per unit time (d)
8 = VX
QWXR+(Q0–QW)Xe (29)
As the value of Xe is negligible, Eq. 29 reduces to
8 = VX QWXR
(30)
The SRT is higher than the HRT as a fraction of the sludge is recycled back to the aeration basin.
m3/kg of BOD5)

2 | Page
9:- Aerobic Secondary Treatment Of Wastewater (Contd.)
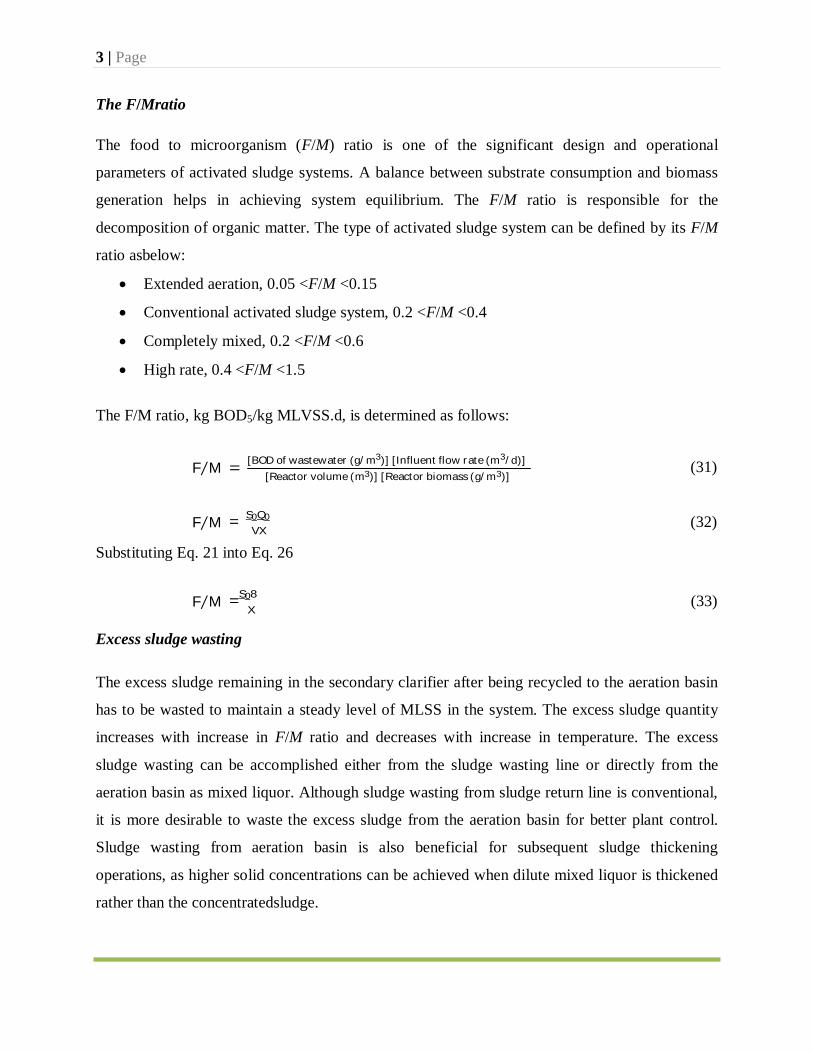
3 | Page
The F/Mratio
The food to microorganism (F/M) ratio is one of the significant design and operational
parameters of activated sludge systems. A balance between substrate consumption and biomass
generation helps in achieving system equilibrium. The F/M ratio is responsible for the
decomposition of organic matter. The type of activated sludge system can be defined by its F/M
ratio asbelow:
Extended aeration, 0.05 <F/M <0.15
Conventional activated sludge system, 0.2 <F/M <0.4
Completely mixed, 0.2 <F/M <0.6
High rate, 0.4 <F/M <1.5
The F/M ratio, kg BOD5/kg MLVSS.d, is determined as follows:
F⁄M [BOD of wastewater (g/m3)] [Influent flow rate (m3/d)] [Reactor volume (m3)] [Reactor biomass (g/m3)]
(31)
F⁄M = S0Q0
VX (32)
Substituting Eq. 21 into Eq. 26
F⁄M =S08 X
(33)
Excess sludge wasting
The excess sludge remaining in the secondary clarifier after being recycled to the aeration basin
has to be wasted to maintain a steady level of MLSS in the system. The excess sludge quantity
increases with increase in F/M ratio and decreases with increase in temperature. The excess
sludge wasting can be accomplished either from the sludge wasting line or directly from the
aeration basin as mixed liquor. Although sludge wasting from sludge return line is conventional,
it is more desirable to waste the excess sludge from the aeration basin for better plant control.
Sludge wasting from aeration basin is also beneficial for subsequent sludge thickening
operations, as higher solid concentrations can be achieved when dilute mixed liquor is thickened
rather than the concentratedsludge.
=
4 | Page
The excess sludge generation under steady state may be estimated from Eq. 29 or from following
equation:
Ps= YobcQ0(S0— S)x10–3 (34)
Where, Px = net waste activated sludge produced each day, kg/d
Yobs = Observed sludge yield = Y/(1 + kd. θc)
Sludge recycling
The MLSS concentration in the aeration tank is controlled by the sludge recirculation rate and
the sludge settleability and thickening in the secondary clarifier. The recirculation ratio is
estimated as stated below considering the mass of microorganisms entering aeration tank and
leaving the aerationtank:
QR= X Q XR–X
(35)
Where, QR is recycle rate, Q is the flow rate of wastewater, X is MLVSS in aeration tank, and XR
is VSS concentration in return sludge. The sludge setteleability is determined by sludge volume
index (SVI). If it is assumed that sedimentation of suspended solids in laboratory is similar to
that in the secondary clarifier, then XR = (VSS/SS ratio)106/SVI. Values of SVI between 50 and
150 mL/g indicate good settling of the suspended solids. The XR value may not be taken as more
than 10000 g/m3 unless separate thickeners are provided to concentrate the settled solids or
secondary clarifier is designed to have a highervalue.
Oxygen requirement
Oxygen is used as an electron acceptor in the energy metabolism of the aerobic heterotrophic
microorganisms present in the activated sludge process. Oxygen is required in the activated
sludge process for oxidation of the influent organic matter along with cell growth and
endogenous respiration of the microorganisms. The aeration equipments must be capable of
maintaining a dissolved oxygen level of about 2 mg/L in the aeration basin while providing
thorough mixing of the solid and liquid phase.
5 | Page
ƒ
ƒ
The oxygen requirement for an activated sludge system can be estimated by knowing the
ultimate BOD of the wastewater and the amount of biomass wasted from the system each day
(Metcalf and Eddy, 2003). If all the substrate removed by the microorganisms is totally oxidized
for energy purpose, then the total oxygen requirement is calculatedas:
Total O2 requirement (g) = Q(S0 – S) (35)
d ƒ
Where f = ratio of BOD5 to ultimateBOD
But, all the substrate oxidized is not used for energy. A portion of the substrate is utilized for
synthesis of new biomass. As it is assumed that the system is under steady state condition, there
is no accumulation of biomass and the amount of biomass produced is equal to the amount of
biomass wasted. Therefore, the equivalent amount of substrate synthesized to new biomass is not
oxidized in the system and exerts no oxygen demand. The oxygen requirement for oxidizing 1
unit of biomass = 1.42 units. The oxygen requirement for oxidation of biomass produced as a
result of substrate utilization is required to be subtracted from the theoretical oxygen requirement
given by Eq. 35 to get the actual oxygenrequirement.
Total O2 requirement (g/d) = Q(S0 – S)- 1.42QWXR (36)
The above equations (Eq. 36) do not account for nitrification oxygen requirements. The
carbonaceous oxygen requirement is only considered in these equations. When nitrification has
to be considered, the oxygen requirement willbe:
Total O2 requirement (g/d) = Q(S0 – S)- 1.42 QWXR + 4.57 Q(No – N)
Where, No is the influent TKN concentration, mg/L, N is the effluent TKN concentration, mg/L
and 4.57 is the conversion factor for amount of oxygen required for complete oxidation of TKN.
The air supply in aeration tank must be adequate to:
Satisfy the BOD of thewastewater
Satisfy the endogenous respiration of themicroorganisms
Provide adequate mixing (15 to 30 KW/103 m3) to keep biomass insuspension.
6 | Page
Maintain minimum DO of 1 to 2 mg/L throughout the aerationtank.
Typical air requirement for conventional ASP is 30 to 55 m3/kg of BOD removed. For fine air
bubble diffusers it is 24 to 36 m3/kg of BOD removed. For extended aeration ASP the air
requirement is higher of the order of 75 to 115 m3/kg of BOD removed. To meet the peak
demand the safety factor of 2 should be used while designing aerationequipment.
Example:1
Design a complete mixed activated sludge process aeration tank for treatment of 4 MLD sewage
having BOD concentration of 180 mg/L. The effluent should have soluble BOD of 20 mg/L or
less. Consider the following:
MLVSS/MLSS = 0.8
Return sludge SS concentration = 10000 mg/L
MLVSS in aeration tank = 3500 mg/L
Mean cell residence time adopted in design is 10 days
Solution
a) Treatment efficiency based on solubleBOD
η = (180 – 20)*100/180 = 88.89%
b) Calculation of reactor volume, Q = 4 MLD = 4000 m3/d, Y = 0.5 mg/mg, kd = 0.06 per day
V = Q.0c.F((So –S)
X(1+ kd.0c)
Therefore,
V = 4000 x 10 x 0.5 (180 – 20)
3500(1+ 0.06 x 10)
= 571.43 m3
c) CalculateHRT
θ = V/Q = 571.43 * 24 / 4000 = 3.43 h (within 3 to 5 h)
d) Check for F/M
F⁄M = Q.S0= 4000 * 180/(571.43 * 3500) = 0.36 kg BOD/kg VSS.d (within 0.2 – 0.6) V X
7 | Page
€
ƒ
e) Check for volumetricloading
= Q . So /V = 4000 * 180 * 10-3/571.43 = 1.26 kg BOD/m3.d (within 0.8 to 2.0)
f) Quantity of sludgewaste
Yobs = Y/(1 + kd . θc) = 0.5/(1 + 0.06*10) = 0.3125 mg/mg
Therefore, mass of volatile waste activated sludge
Ps = Yobc Q0(S0 — S) x 10–3 = 0.3125 * 4000 (180 – 20) * 10-3
= 200 kg VSS/day
Therefore, mass of sludge based on total SS = 200/0.8 = 250 kg SS/d
g) Sludge waste volume based on mean cell residencetime
8 = VX QWXR
= 571.43 * 3500 / (Qw * 10000*0.8) = 10 days
Hence, Qw = 25.0 m3/d (when wasting is done from the recycled line of SST)
h) Estimation of recirculation ratio
3500 (Q + QR) = 8000QR
Therefore, QR/Q = 0.78
i) Estimation of airrequirement
Total O2 requirement (g/d) = Q(S0 – S)
- 1.42 QWXR
kg of oxygen required = [(4000(180 – 20) * 10-3)/0.68] - 1.42 * 25 * 8000 * 10-3
= 657.17 Kg O2/d
j) Volume of air required, considering air contain 23% oxygen by weight and density of air 1.201
kg/m3
= 657.17/(1.201 * 0.23) = 2379.1 m3/d
Considering oxygen transfer efficiency of 8%, the air required = 2379.1/0.08 = 29738.34 m3/d
= 20.65 m3/min
Considering safety factor of 2, the air requirement is = 2 x 20.65 = 41.30 m3/min
8 | Page
k) Check for airvolume
Air requirement per unit volume = 29738.34/ 4000 = 7.44 m3/m3
(Within the limit of 3.75 to 15 m3/m3)
Air requirement per kg of BOD5 = 29738.34/ [(180-20) * 4000 * 10-3] = 46.46 m3/kg of
BOD5 (within the limit of 30 to 55 m3/kg of BOD5)
10 : Aerobic Secondary Treatment Of Wastewater (Contd.)
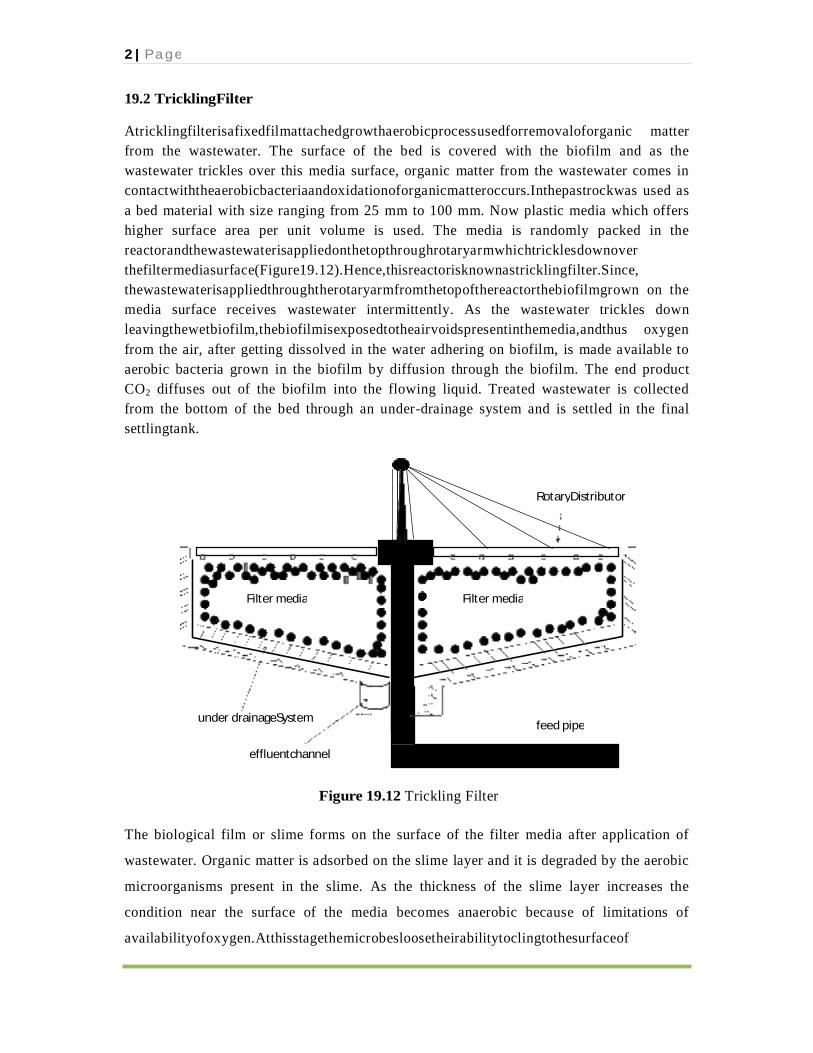
2 | P a g e
RotaryDistributor
Filter media Filter media
under drainageSystem feed pipe
effluentchannel
19.2 TricklingFilter
Atricklingfilterisafixedfilmattachedgrowthaerobicprocessusedforremovaloforganic matter from the wastewater. The surface of the bed is covered with the biofilm and as the wastewater trickles over this media surface, organic matter from the wastewater comes in contactwiththeaerobicbacteriaandoxidationoforganicmatteroccurs.Inthepastrockwas used as a bed material with size ranging from 25 mm to 100 mm. Now plastic media which offers higher surface area per unit volume is used. The media is randomly packed in the reactorandthewastewaterisappliedonthetopthroughrotaryarmwhichtricklesdownover thefiltermediasurface(Figure19.12).Hence,thisreactorisknownastricklingfilter.Since, thewastewaterisappliedthroughtherotaryarmfromthetopofthereactorthebiofilmgrown on the media surface receives wastewater intermittently. As the wastewater trickles down leavingthewetbiofilm,thebiofilmisexposedtotheairvoidspresentinthemedia,andthus oxygen from the air, after getting dissolved in the water adhering on biofilm, is made available to aerobic bacteria grown in the biofilm by diffusion through the biofilm. The end product CO2 diffuses out of the biofilm into the flowing liquid. Treated wastewater is collected from the bottom of the bed through an under-drainage system and is settled in the final settlingtank.
Figure 19.12 Trickling Filter
The biological film or slime forms on the surface of the filter media after application of
wastewater. Organic matter is adsorbed on the slime layer and it is degraded by the aerobic
microorganisms present in the slime. As the thickness of the slime layer increases the
condition near the surface of the media becomes anaerobic because of limitations of
availabilityofoxygen.Atthisstagethemicrobesloosetheirabilitytoclingtothesurfaceof

3 | P a g e
the media and the slime layer gets detached and washed out along with flowing liquid. This
phenomenoniscalledas‘sloughing’.Soonafterthesloughingthenewslimelayerformation starts.
Hence secondary sedimentation tank (SST) is provided to settle this washed out biomass.
SST can be circular or rectangular tanks designed such that the overflow rate at peak flow
should not exceed 50m3/m2.d.
Diameter of the trickling filter depends on the mechanical equipments used for spraying the
wastewater.Diametermorethan12mforsinglefilterunitiscommon.Rotaryarmrotatesas a result
of jet action as the wastewater exit the distributor to get sprayed horizontally on the filter
bed; hence, external power is not required for rotation of the arm. However, for
tricklingfilterofsmalldiameter(lessthan6m)powerdrivenrotaryarmmaybeprovided.A number
of commercial packing media are available. These include vertical-flow random packed
and cross flow media made of rock, polygrid, plastic media or asbestos sheets. In order to
avoid filter plugging, a maximum specific surface area of 100 m2/m3 is recommended for
carbonaceous wastewater treatment and up to 300 m2/m3 for nitrification, because of slow
growth rate of nitrifiers. Overall performance of the trickling filter depends upon the
hydraulic and organic loading rate, wastewater pH, operating temperature and availability
of air through natural draft within the pores, and mean time of contact of wastewater with
biofilm,etc.
Mean time of contact of liquid with the filter surface is related to the filter depth, hydraulic
loadingrateandnatureoffilterpacking.Thiscontacttimecanbeestimatedas(Eckenfelder, 2000):
T=C.D/Qn (37)
WhereT=meandetentiontime,D=depthoffilterbed,Qisthehydraulicloadingm3/m2.d, C and n
are constant related to specific surface area and configuration of the packing. Mean
retention time increases considerably (up to 4 times) with formation of biofilm as compared
to new filtermedia.
Based on hydraulic and organic loadings, the trickling filters may be classified as (1) Low
rate trickling filter (Figure 19.13a) and (2) High rate trickling filter (Figure 19.13b).
Recirculation is employed in high rate filters to improve efficiency. The recirculation helps
in providing seeding to the filter bed and also dilutes the strong wastewater. Dilution is the
major objective behind the recirculation.
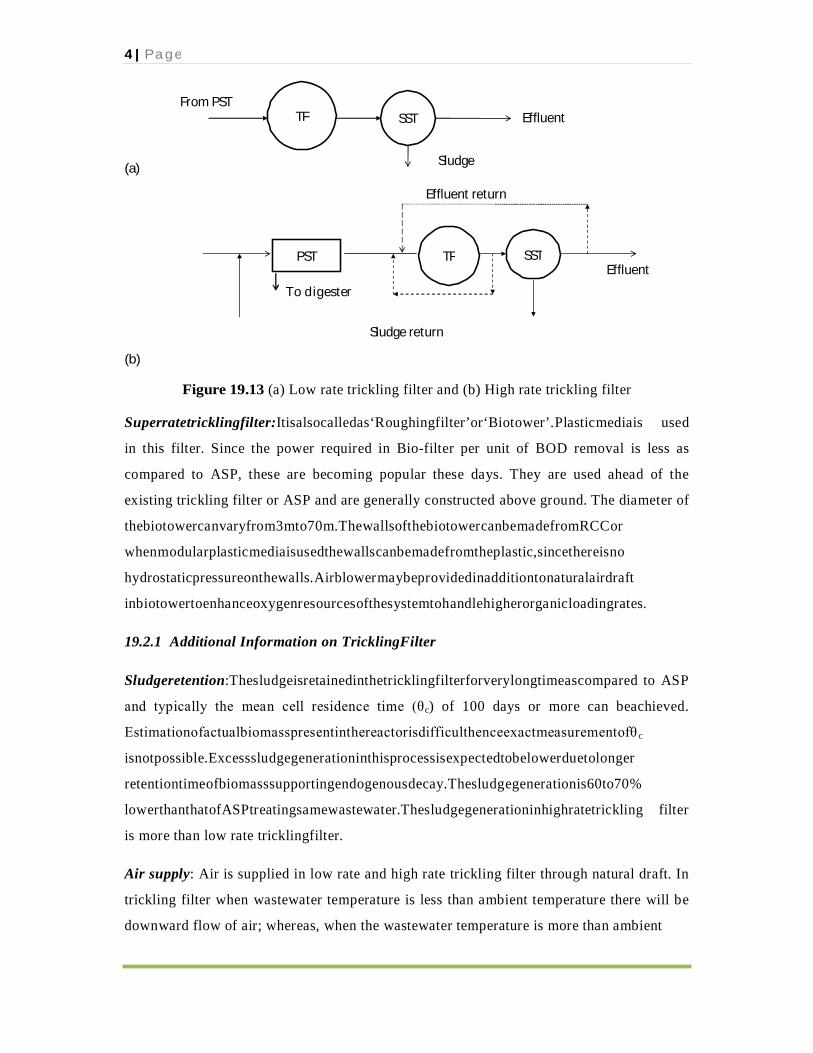
4 | P a g e
TF SST Effluent
To digester
PST
From PST TF SST Effluent
(a)
(b)
Sludge
Effluent return
Sludge return
Figure 19.13 (a) Low rate trickling filter and (b) High rate trickling filter
Superratetricklingfilter:Itisalsocalledas‘Roughingfilter’or‘Biotower’.Plasticmediais used
in this filter. Since the power required in Bio-filter per unit of BOD removal is less as
compared to ASP, these are becoming popular these days. They are used ahead of the
existing trickling filter or ASP and are generally constructed above ground. The diameter of
thebiotowercanvaryfrom3mto70m.ThewallsofthebiotowercanbemadefromRCCor
whenmodularplasticmediaisusedthewallscanbemadefromtheplastic,sincethereisno
hydrostaticpressureonthewalls.Airblowermaybeprovidedinadditiontonaturalairdraft
inbiotowertoenhanceoxygenresourcesofthesystemtohandlehigherorganicloadingrates.
19.2.1 Additional Information on TricklingFilter
Sludgeretention:Thesludgeisretainedinthetricklingfilterforverylongtimeascompared to ASP
and typically the mean cell residence time (θc) of 100 days or more can beachieved.
Estimationofactualbiomasspresentinthereactorisdifficulthenceexactmeasurementofθ c
isnotpossible.Excesssludgegenerationinthisprocessisexpectedtobelowerduetolonger
retentiontimeofbiomasssupportingendogenousdecay.Thesludgegenerationis60to70%
lowerthanthatofASPtreatingsamewastewater.Thesludgegenerationinhighratetrickling filter
is more than low rate tricklingfilter.
Air supply: Air is supplied in low rate and high rate trickling filter through natural draft. In
trickling filter when wastewater temperature is less than ambient temperature there will be
downward flow of air; whereas, when the wastewater temperature is more than ambient
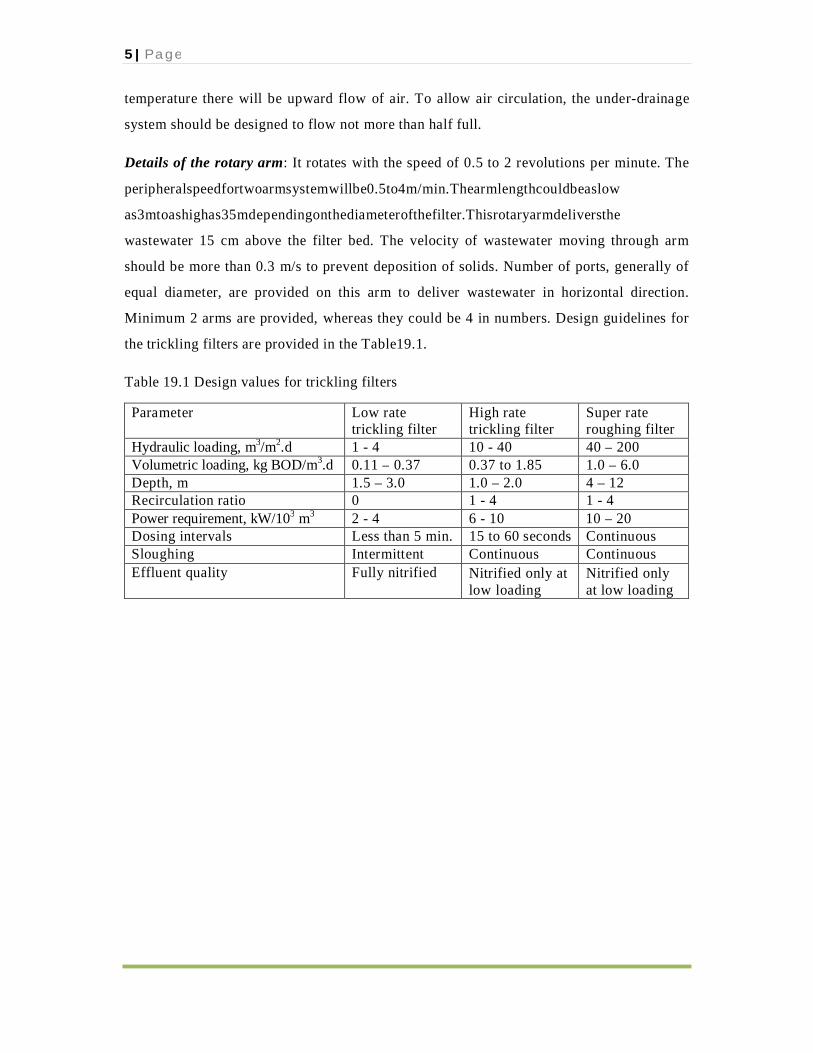
5 | P a g e
temperature there will be upward flow of air. To allow air circulation, the under-drainage
system should be designed to flow not more than half full.
Details of the rotary arm: It rotates with the speed of 0.5 to 2 revolutions per minute. The
peripheralspeedfortwoarmsystemwillbe0.5to4m/min.Thearmlengthcouldbeaslow
as3mtoashighas35mdependingonthediameterofthefilter.Thisrotaryarmdeliversthe
wastewater 15 cm above the filter bed. The velocity of wastewater moving through arm
should be more than 0.3 m/s to prevent deposition of solids. Number of ports, generally of
equal diameter, are provided on this arm to deliver wastewater in horizontal direction.
Minimum 2 arms are provided, whereas they could be 4 in numbers. Design guidelines for
the trickling filters are provided in the Table19.1.
Table 19.1 Design values for trickling filters
Parameter Low rate trickling filter
High rate trickling filter
Super rate roughing filter
Hydraulic loading, m3/m2.d 1 - 4 10 - 40 40 – 200 Volumetric loading, kg BOD/m3.d 0.11 – 0.37 0.37 to 1.85 1.0 – 6.0 Depth, m 1.5 – 3.0 1.0 – 2.0 4 – 12 Recirculation ratio 0 1 - 4 1 - 4 Power requirement, kW/103 m3 2 - 4 6 - 10 10 – 20 Dosing intervals Less than 5 min. 15 to 60 seconds Continuous Sloughing Intermittent Continuous Continuous Effluent quality Fully nitrified Nitrified only at
low loading Nitrified only at low loading
Related Documents