Unit Planning Strategies Archdiocesan In-Service March 21, 2017

Welcome message from author
This document is posted to help you gain knowledge. Please leave a comment to let me know what you think about it! Share it to your friends and learn new things together.
Transcript

Unit Planning Strategies
Archdiocesan In-Service March 21, 2017

Objectives
1. Describe the basic structure of an effective unit plan.
2. Write lesson plan objectives from brainstormed content and skill topics.
3. Organize lesson plans as a progressive narrative to help students master the unit goal.
Rationale
Choosing instructional activities to help students master the unit goal can be overwhelming and intimidating. Using backward design to structure a unit leads to strong units that always have the end goal in mind.
Background
Basic Structure of Effective Unit Plan ○ Acquire and Integrate phase (3-5 lessons)
○ Traditional Assessment ○ Extend and Refine phase (1-3 lessons)
○ Using Knowledge Meaningfully phase (usually 1 lesson, sometimes omitted, sometimes coincides with PA)
○ Performance Assessment

Methodology
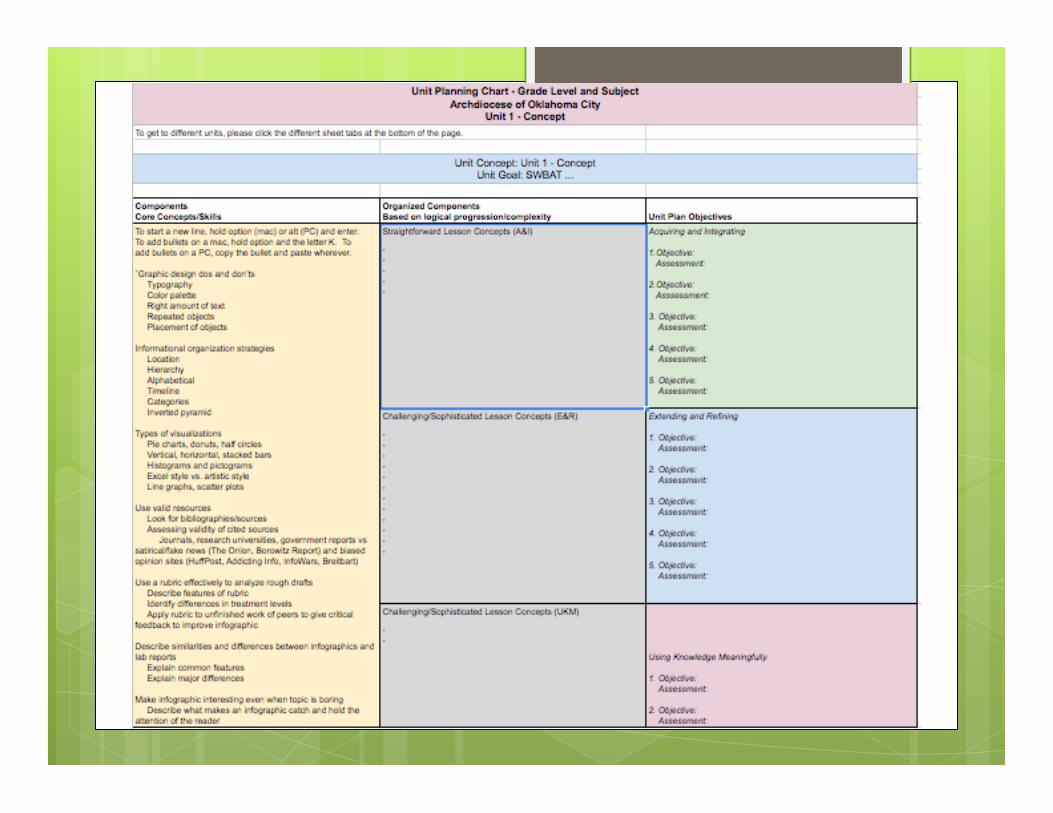
Start with Unit Concept and Unit Goal
Original Unit Concept: Interpreting Infographics
Original Unit Goal: SWBAT critically evaluate a variety of graphical resources to defend a position on a topic.

Methodology
Ask yourself, “What will the students do to prove to me that they have mastered this topic?” ○ Write an essay to defend a topic, citing information from
infographics? ○ Reason about validity of information found online? ○ Use a rubric to systematically assess information? ○ Be able to make their own infographic?
Methodology
Modify Unit Goal, if needed ○ More important at this age to focus on simple analysis
of information, not on complex defense of information ○ Justification: ACT and PSAT will be encountered
before AP-style DBQs ○ Not all students in MOS will take AP classes, but all
will take ACT and PSAT ○ Therefore: Unit Goal modified to SWBAT create
infographic to express information from an experiment.

Methodology
Choose performance assessment task ○ Unit Goal is SWBAT create an infographic from an
experiment ○ Narrow focus: should be able to be completed
independently and individually IN CLASS. ○ PA: Create an infographic with at least three data
visualizations to convey information from an experiment we have done previously this year.

Methodology
Brainstorm every skill necessary for a student to be able to create a good infographic ○ Graphic design dos and don’ts ○ Informational organization strategies ○ Types of visualizations ○ Use valid resources ○ Use a rubric effectively to analyze rough drafts ○ Describe similarities and differences between infographics and lab
reports ○ Make infographic interesting even when topic is boring ○ Describe common characteristics of infographics

Methodology
Break those skills down into even smaller steps ○ Graphic design dos and don’ts
○ Typography ○ Color palette ○ Right amount of text ○ Repeated objects ○ Placement of objects
Methodology
Brainstorm every skill necessary for a student to be able to create a good infographic ○ Informational organization strategies
○ Location ○ Hierarchy ○ Alphabetical ○ Timeline ○ Categories ○ Inverted pyramid
Methodology
Brainstorm every skill necessary for a student to be able to create a good infographic ○ Types of visualizations
○ Pie charts, donuts, half circles ○ Vertical, horizontal, stacked bars ○ Histograms and pictograms ○ Excel style vs. artistic style ○ Line graphs, scatter plots
Methodology
Brainstorm every skill necessary for a student to be able to create a good infographic ○ Use valid resources
○ Look for bibliographies/sources ○ Assessing validity of cited sources
○ Journals, research universities, government reports vs ○ satirical/fake news (The Onion, Borowitz Report) and biased
opinion sites (HuffPost, Addicting Info, InfoWars, Breitbart)
Methodology
Brainstorm every skill necessary for a student to be able to create a good infographic ○ Use a rubric effectively to analyze rough drafts
○ Describe features of rubric ○ Identify differences in treatment levels ○ Apply rubric to unfinished work of peers to give critical feedback to
improve infographic

Methodology
Brainstorm every skill necessary for a student to be able to create a good infographic ○ Describe similarities and differences between infographics and lab
reports ○ Explain common features ○ Explain major differences

Methodology
Brainstorm every skill necessary for a student to be able to create a good infographic
○ Make infographic interesting even when topic is boring ○ Describe what makes an infographic catch and hold the attention of the
reader ○ Apply strategies for appeal, comprehension, and retention to creating
own infographic
Methodology
Brainstorm every skill necessary for a student to be able to create a good infographic ○ Describe common characteristics of infographics
○ Visual ○ Content ○ Knowledge ○ Appeal ○ Comprehension ○ Retention
Organization
Use a T-chart or template to organize skills in a narrative ○ Loosely divide skills into basic and advanced categories ○ Basic skills will become Acquire and Integrate phase ○ Advanced skills become Extend and Refine phase ○ Very advanced/direct application = Using Knowledge
Meaningfully phase Choose where to place formative and summative assessments ○ Traditional assessment after A&I phase ○ PA after E&R or UKM phase ○ Formative assessments after every 1-2 LPs

Limitations ○ What looks awesome on paper doesn’t always translate
to real classroom ○ Authentic assessment of unit structure vital to culture of
continuous improvement ○ Revise LPs ○ Revise Unit Goal ○ Revise assessment instruments
Related Documents