Unit Hydrographs (Streamflow Estimation) Transforming the Runoff from Rainfall

Welcome message from author
This document is posted to help you gain knowledge. Please leave a comment to let me know what you think about it! Share it to your friends and learn new things together.
Transcript

Unit Hydrographs
(Streamflow Estimation)
Transforming the Runoff from Rainfall

Unit Hydrograph Theory
Moving water off of the watershed…
A mathematical concept (based on linearity)
Linear in nature

Some History behind Unit Hydrograph Theory
Sherman – 1932(first to propose the concept of ‘Unit Hydrograph’)
Horton - 1933
Wisler & Brater - 1949 - “the hydrograph of surface runoff resulting from a relatively short, intense rain, called a unit storm.”
The runoff hydrograph may be “made up” of runoff that is generated as flow through the soil (Black, 1990).

Lag time
Time of concentration
Duration of
excess precip.
Base flow
Duration
Lag Time
Time of Concentration
Rising Limb
Recession Limb (falling
limb)
Peak Flow
Time to Peak (rise time)
Recession Curve
Separation
Base flow
Unit Hydrograph Components
Time Base

Methods of Developing UH’s
From Streamflow Data
Synthetically
Snyder (for CEE4420 – just know the formula for
calculating lag and concentration times that are in the Gupta book
SCS
Time-Area (Clark, 1945)
“Fitted” Distributions

Unit Hydrograph
The hydrograph of direct runoff that results from 1-inch
(or 1 unit) of excess precipitation spread uniformly in
space and time over a watershed for a given duration.
The key points :
1-inch of EXCESS precipitation
Spread uniformly over space - evenly over the watershed
Uniformly in time - the excess rate is constant
over the time interval
There is a given duration pertaining to the storm – NOT the duration of flow!

Derived Unit Hydrograph
0.0000
100.0000
200.0000
300.0000
400.0000
500.0000
600.0000
700.0000
0.00
00
0.16
00
0.32
00
0.48
00
0.64
00
0.80
00
0.96
00
1.12
00
1.28
00
1.44
00
1.60
00
1.76
00
1.92
00
2.08
00
2.24
00
2.40
00
2.56
00
2.72
00
2.88
00
3.04
00
3.20
00
3.36
00
3.52
00
3.68
00
Baseflow
Surface
Response
Note: The baseflow
shown here (and
separated in next slide) was identified using a
different graphical
method). For the course
– keep the baseflow
separation simple to ‘flat rate deduction’ or the N=Ad0.2 approach)

Derived Unit Hydrograph
0.0000
100.0000
200.0000
300.0000
400.0000
500.0000
600.0000
700.0000
0.0000 0.5000 1.0000 1.5000 2.0000 2.5000 3.0000 3.5000 4.0000
Total
Hydrograph
Surface
Response
Baseflow

Using a UH • Remember what we covered in class last time on how to predict direct
runoff from a storm of given duration and depth of excess precipitation
provided you knew the UH for the same duration of the storm:
“The direct runoff from a 2 hour storm with 2 units of excess rainfall shall be twice as much as the direct runoff from a 2 hour storm with 1 unit of
excess rainfall”
Storm Hydrograph (4 inches vs 2 inches)
0
50
100
150
200
250
300
350
400
0 5 10 15 20 25 30
Time
Flo
w

Changing the Duration of UH
Very often, it will be necessary to change the duration of the unit
hydrograph. Storms occur in all shapes (rainfall amount) and sizes
(durations)
The most common method of altering the duration of a unit hydrograph
is by the S-curve method.
The S-curve method involves continually lagging a unit hydrograph by its duration and adding the ordinates.
For the present example, the 6-hour unit hydrograph is continually
lagged by 6 hours and the ordinates are added.
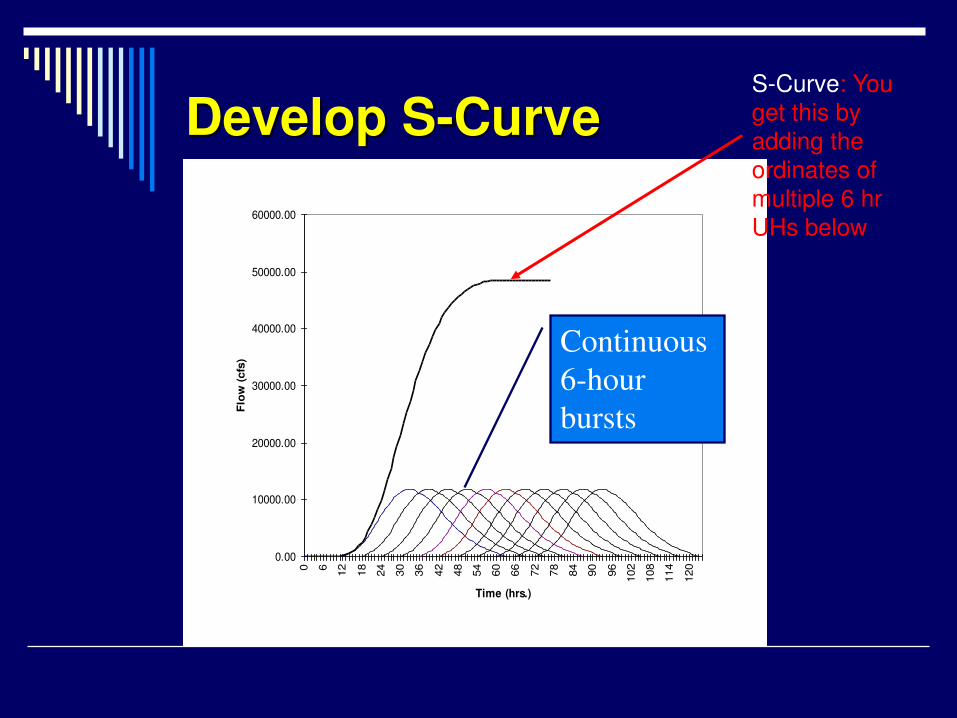
Develop S-Curve
0.00
10000.00
20000.00
30000.00
40000.00
50000.00
60000.00
0 6
12
18
24
30
36
42
48
54
60
66
72
78
84
90
96
102
108
114
120
Time (hrs.)
Flo
w (
cfs
)
Continuous
6-hour
bursts
S-Curve: You
get this by
adding the
ordinates of
multiple 6 hr
UHs below

Convert to 1-Hour Duration
1. To arrive at a 1-hour UH from a given 6 hour UH, two S-curves are lagged by 1 hour from each other and the difference between the two lagged S-curve (ordinates) is calculated for every timestep.
2. However, because the S-curve was formulated from unit hydrographs having a 6 hour duration of uniformly distributed precipitation, the hydrograph resulting from the subtracting the two S-curves will be the result of 1/6 of an inch of precipitation.
3. Thus the ordinates of the newly created 1-hour DR hydrograph in step 1must be multiplied by 6 in order to be a true unit hydrograph to get the final 1 hr UH.
4. The 1-hour UH should have a higher peak which occurs earlier than the 6-hour unit hydrograph. Does this make sense ? You are having the same amount of excess rainfall but in a shorter period so the storm is more intense and hence creates runoff faster.
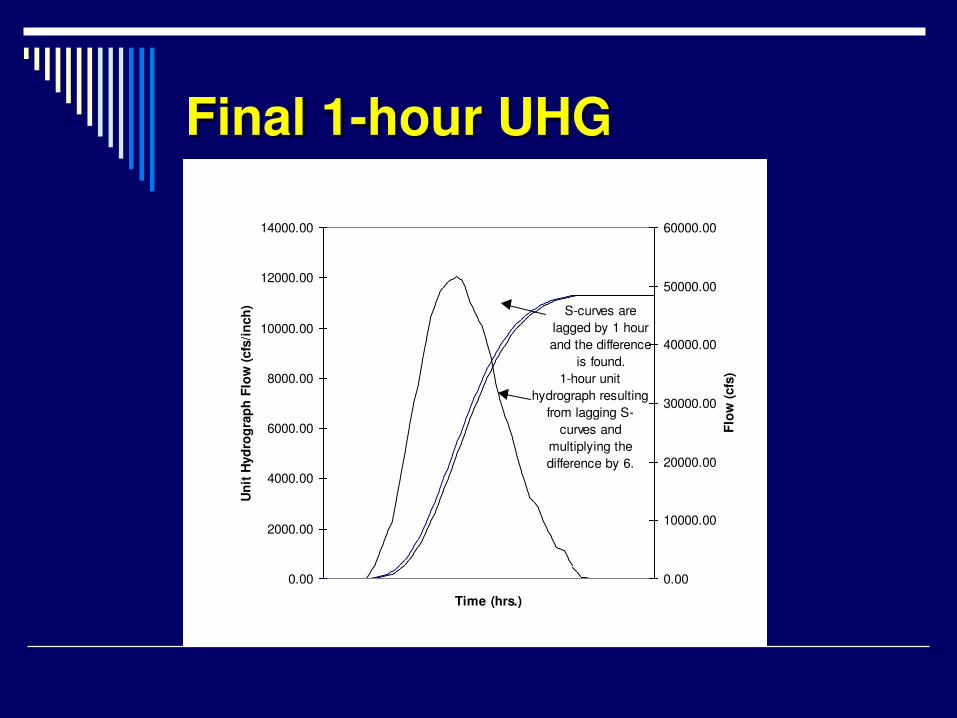
Final 1-hour UHG
0.00
2000.00
4000.00
6000.00
8000.00
10000.00
12000.00
14000.00
Time (hrs.)
Un
it H
yd
rog
rap
h F
low
(cfs
/in
ch
)
0.00
10000.00
20000.00
30000.00
40000.00
50000.00
60000.00
Flo
w (
cfs
)
S-curves are
lagged by 1 hour
and the difference
is found.
1-hour unit
hydrograph resulting
from lagging S-
curves and
multiplying the
difference by 6.

Steps for Changing duration of UH
Suppose you are asked to change the duration of a given 2 hour UH to a 6 hour UH. Let tr=2hr (original duration) and trb=6hr (required duration).
1. First lag a minimum of tb/tr number of 2 hour UHs. So suppose, tb (time base of
flow) is 12 hours, then in this case you should lag at least 12/2=6 2 hour UHs.
Round off this number to the nearest higher integer.
2. Next, add all the ordinates as a function of time. You should get an S-type shape
where the flow will reach a steady-state and saturated value. In exam, step#1 is
very handy to save time. And the moment you get your highest flow value, that
can be your S-curve peak value that you can maintain from thereafter.
3. Now lag two S-curves (derived in step#2) by duration trb (6 hour). And then subtract the ordinates.
4. Step #3 will give you a DRH for a trb duration storm. Multiply the ordinates by
tr/trb to get your 6 hour UH from the given 2 hr UH.

Synthetic UHs
Snyder (this is good
enough for course)
SCS
Time-area

Snyder
Since peak flow and time of peak flow are two of the most
important parameters characterizing a unit hydrograph, the
Snyder method employs factors defining these parameters,
which are then used in the synthesis of the unit graph (Snyder,
1938).
The parameters are Cp, the peak flow factor, and Ct, the lag
factor.
The basic assumption in this method is that basins which have
similar physiographic characteristics are located in the same
area will have similar values of Ct and Cp.
Therefore, for ungaged basins, it is preferred that the basin be
near or similar to gaged basins for which these coefficients can
be determined.

Basic Relationships
3.0)(catLAG
LLCt
5.5LAG
duration
tt
)(25.0.. durationdurationaltLAGlagalt
tttt
83 LAG
base
tt
LAG
p
peak
t
ACq
640

Significance of Unit
Hydrograph
Watersheds response to a given amount
of excess precipitation is just a multiplier
of the unit hydrograph
Use unit hydrograph as a basis to
determine the storm hydrograph from
any given rainfall distribution

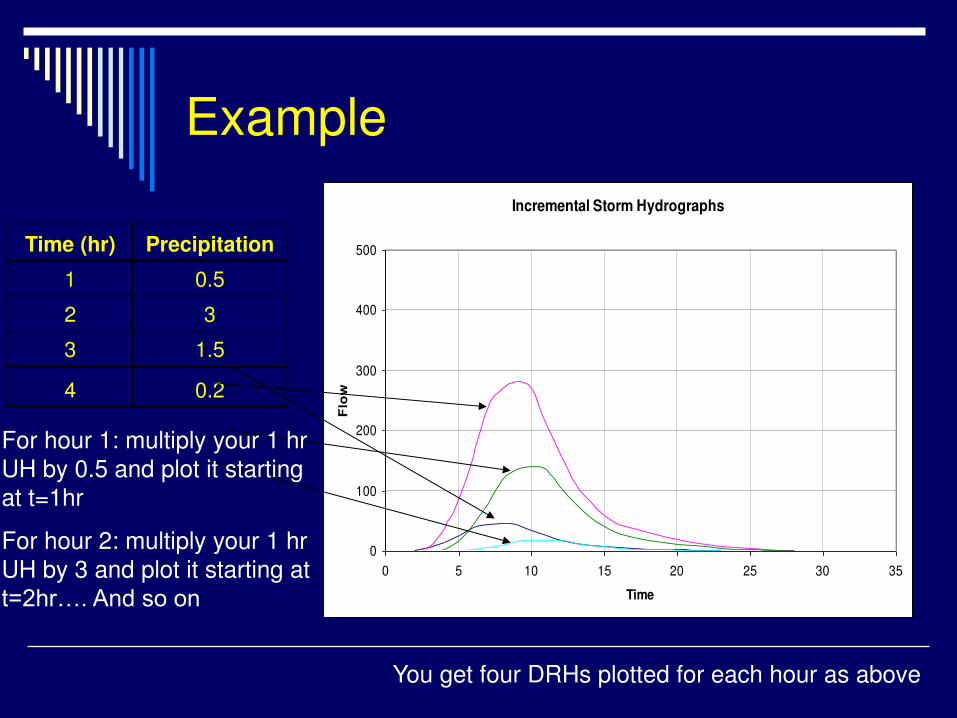
Example
Given the following rainfall distribution
The watershed will respond as follows
Time Precipitation
1 0.5
2 3
3 1.5
4 0.2
Example
Incremental Storm Hydrographs
0
100
200
300
400
500
0 5 10 15 20 25 30 35
Time
Flo
w
Time (hr) Precipitation
1 0.5
2 3
3 1.5
4 0.2
For hour 1: multiply your 1 hr
UH by 0.5 and plot it starting
at t=1hr
For hour 2: multiply your 1 hr
UH by 3 and plot it starting at
t=2hr…. And so on
You get four DRHs plotted for each hour as above

Example
Incremental + Final Storm Hydrograph
0
100
200
300
400
500
0 5 10 15 20 25 30 35
Time
Flo
w
Now add all your
ordinates to get the
final DRH – shown
here by the tallest
DRH.
This is the DRH you
will get from the
storm of 4 hours with
variable intensity
Related Documents