July 25, 2014 Unit 9, Professional Engineers 2014 Salary Survey California Department of Human Resources Office of Financial Management and Economic Research Salary Survey Unit 1515 S Street, North Building, Suite 400 Sacramento, California 95811

Welcome message from author
This document is posted to help you gain knowledge. Please leave a comment to let me know what you think about it! Share it to your friends and learn new things together.
Transcript

July 25, 2014
Unit 9, Professional Engineers
2014 Salary Survey
California Department of Human Resources Office of Financial Management and Economic Research Salary Survey Unit
1515 S Street, North Building, Suite 400 Sacramento, California 95811
Attachment 2
Unit 9, Professional Engineers 2014 Salary Survey Page 2
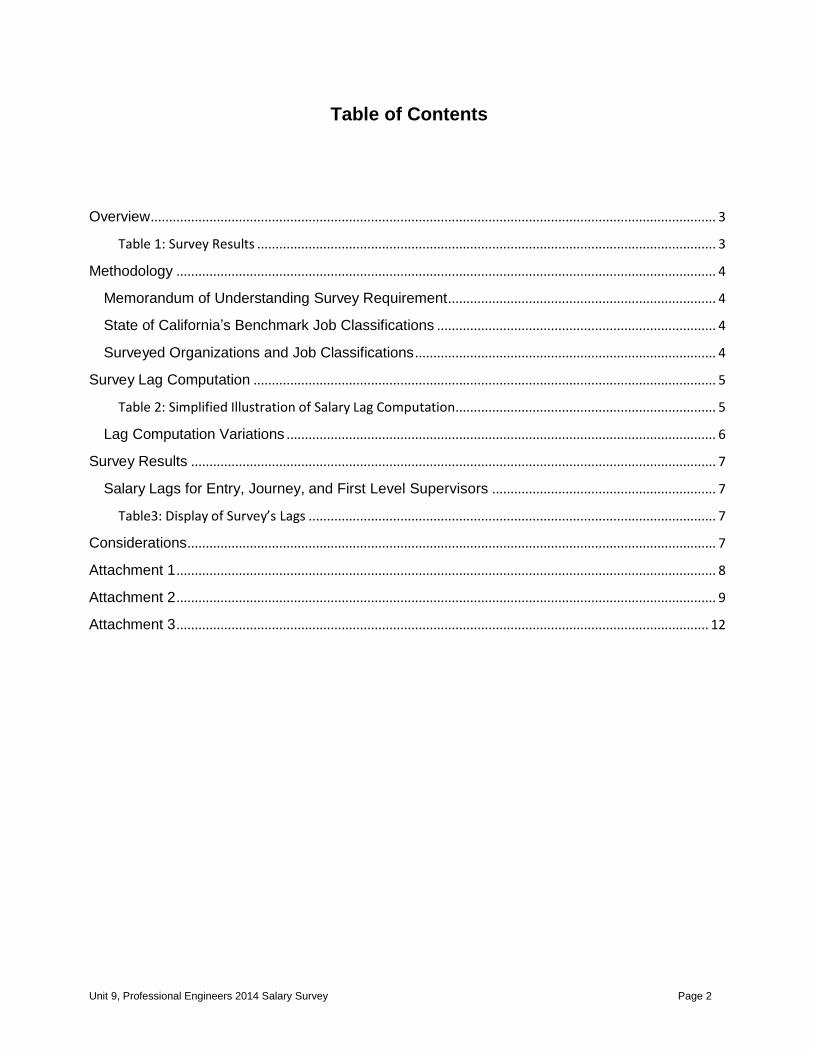
Table of Contents
Overview .......................................................................................................................................................... 3
Table 1: Survey Results ............................................................................................................................. 3
Methodology ................................................................................................................................................... 4
Memorandum of Understanding Survey Requirement ......................................................................... 4
State of California’s Benchmark Job Classifications ............................................................................ 4
Surveyed Organizations and Job Classifications .................................................................................. 4
Survey Lag Computation .............................................................................................................................. 5
Table 2: Simplified Illustration of Salary Lag Computation ....................................................................... 5
Lag Computation Variations ..................................................................................................................... 6
Survey Results ............................................................................................................................................... 7
Salary Lags for Entry, Journey, and First Level Supervisors ............................................................. 7
Table3: Display of Survey’s Lags ............................................................................................................... 7
Considerations ................................................................................................................................................ 7
Attachment 1 ................................................................................................................................................... 8
Attachment 2 ................................................................................................................................................... 9
Attachment 3 ................................................................................................................................................. 12

Attachment 2
Unit 9, Professional Engineers 2014 Salary Survey Page 3
Overview
This salary survey report is prepared by the Department of Human Resources as required by the
Memorandum of Understanding (MOU) between the state and the Professional Engineers in
California Government, the Union which represents employees in Bargaining Unit 9.
Pursuant to legislation, the Department has completed the 2014 Unit 9 salary survey. Although
the current MOU requires this survey to be completed, it also states that salary increases
“shall not be provided during the term of this MOU” to Unit 9 employees as a result of a lag in the
survey.
The survey results indicate that the state lags behind in maximum base pay for its engineers. The
table below shows the lag for each working level.
Table 1: Survey Results
Level of Work State Lag
Entry Level 7.2%
Journey Level 3.0%
First Level Supervisor 3.7%

Attachment 2
Unit 9, Professional Engineers 2014 Salary Survey Page 4
Methodology
Memorandum of Understanding Survey Requirement
This salary survey was initiated and completed based on the requirements of the MOU effective
July 2, 2003 through July 2, 2008. Article 3.1 of that MOU contained the survey requirements and
components to the survey whereby over time the parties had agreed to a specific methodology.
Attachment 1 displays Article 3.1 in the current MOU (effective July 2, 2013 through July 1, 2015).
By the terms of the current MOU, the surveyed agencies and benchmark comparisons may only
be changed upon mutual agreement between the Department and the Union.
MOU, Article 3.1, requires the Department to:
Annually survey the same 18 public agencies and 10 University of California campuses
using the same job classifications in the December 2002 survey.
Calculate the salary lead or lag based on the weighted average of salaries of employees in
the surveyed organizations’ classifications.
State of California’s Benchmark Job Classifications
For this survey, the required three benchmarks for the state are:
Entry Level — Transportation Engineer (Civil) Range B
Journey Level — Transportation Engineer (Civil) Range D
First Level Supervisor — Senior Transportation Engineer, Caltrans
Surveyed Organizations and Job Classifications
Attachment 2 displays the surveyed organizations, their surveyed job classifications, and the
minimum and maximum salaries of those job classifications.

Attachment 2
Unit 9, Professional Engineers 2014 Salary Survey Page 5
Survey Lag Computation
There are two parts to the survey lag computation. The first part weights the maximum salary of
each surveyed organization (excluding state employee counts) by the total number of engineers in
the comparable class in the surveyed organizations. This is done separately for the entry level,
journey level and first level supervisor categories. This results in three weighted average
maximum salaries for the surveyed organizations; one for entry level, one for journey level, and
one for first level supervisor.
The second part of the lag computation compares the weighted average salary for the surveyed
organizations with the maximum salary of the state benchmark engineer class. The percentage
difference is the salary lag. A separate lag is computed for entry, journey, and first level
supervisors.
To illustrate how the lag is calculated the table below uses fictitious salary and incumbent counts
for two fictitious survey organizations.
Table 2: Simplified Illustration of Salary Lag Computation
Notes:
1. Calculation is $826,640/158 2. Calculation is $5,232 less 5,000 divided by $5,000, rounded to one decimal
Surveyed Organization
Entry Level Maximum
Salary A
No. of Engineers in Survey Class
B
Product = A x B
Organization A $5,346 132 $705,672
Organization B $6,268 26 $162,968
Total 158 $826,640
Weighted Average Salary $5,2321
State of California Salary $5,000
State Salary Lag $232
State Salary Lag Percent 4.6%2
Attachment 2
Unit 9, Professional Engineers 2014 Salary Survey Page 6
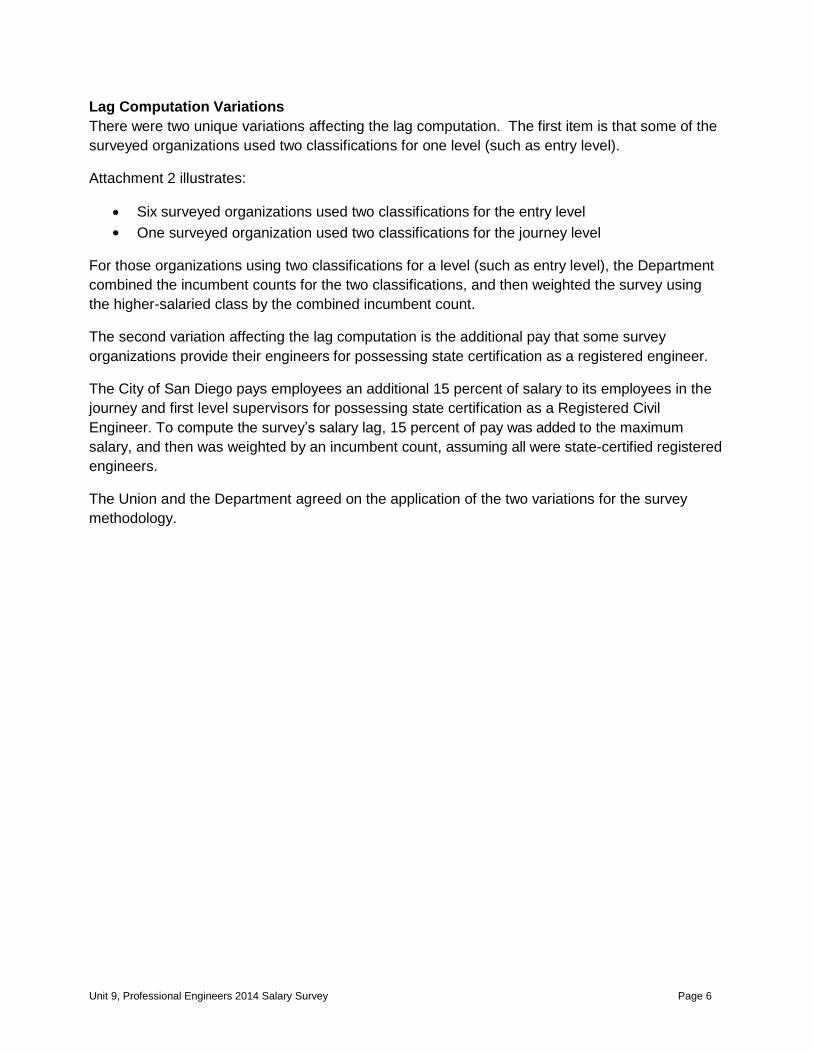
Lag Computation Variations
There were two unique variations affecting the lag computation. The first item is that some of the
surveyed organizations used two classifications for one level (such as entry level).
Attachment 2 illustrates:
Six surveyed organizations used two classifications for the entry level
One surveyed organization used two classifications for the journey level
For those organizations using two classifications for a level (such as entry level), the Department
combined the incumbent counts for the two classifications, and then weighted the survey using
the higher-salaried class by the combined incumbent count.
The second variation affecting the lag computation is the additional pay that some survey
organizations provide their engineers for possessing state certification as a registered engineer.
The City of San Diego pays employees an additional 15 percent of salary to its employees in the
journey and first level supervisors for possessing state certification as a Registered Civil
Engineer. To compute the survey’s salary lag, 15 percent of pay was added to the maximum
salary, and then was weighted by an incumbent count, assuming all were state-certified registered
engineers.
The Union and the Department agreed on the application of the two variations for the survey
methodology.

Attachment 2
Unit 9, Professional Engineers 2014 Salary Survey Page 7
Survey Results
Salary Lags for Entry, Journey, and First Level Supervisors
Based on the survey data, the results are displayed in the following table for the state’s three
surveyed benchmark job classifications.
Table3: Display of Survey’s Lags
Level of Work
Entry Level
Journey Level
First Level Supervisor
State Benchmark Classification
Transportation Engineer (Civil) Range B
Transportation Engineer (Civil) Range D
Senior Transportation Engineer,
Caltrans
Lag for State 7.2% 3.0% 3.7%
Attachment 3 provides the detail on the lag computations.
These three lag percentages have not resulted in salary increases. As agreed upon in the current
MOU, rank and file civil service job classifications of Bargaining Unit 9 are not automatically
entitled to salary increases to compensate for any salary disparity (or “lag”) between Unit 9
salaries and benchmark comparisons used in this survey.
Considerations
Pursuant to legislation (Chapter 391, Statutes of 2013) and the MOU, the Department is required
to complete a salary survey comparing three state classifications to similar classifications in 28
public jurisdictions, including 10 UC campuses. The MOU states that salary increases based on
the survey results will not be provided during the term of this contract. Therefore, this survey
does not reflect the actual cost of increasing Unit 9 salaries, and it also does not take into
consideration the total impact that such increases would have on the related supervisory and
managerial classifications.

Attachment 2
Unit 9, Professional Engineers 2014 Salary Survey Page 8
Attachment 1
Salary Survey Text from
Unit 9 Memorandum
Of Understanding
(2013-2015)
ARTICLE 3
SALARIES AND COMPENSATION 3.1 Salary Parity for Unit 9
The State and PECG will continue to complete the salary survey of Unit 9. This survey will include
the Professional Engineer Benchmarks that utilize the California public agencies and the
University of California included in the department’s survey dated December 2002, and the local
agency classifications and salary range matches contained therein. The salary survey for those
classifications and agencies shall be current data. The agencies and classifications included in the
survey shall only be changed upon agreement between CalHR and PECG.
Salary Methodology:
A. All steps in each salary range shall be increased by the same percentage. The salary for
intermediate classifications in ranges between the Entry and Supervisory levels shall be based on
prorating or interpolating the salaries.
B. All salary increases shall be rounded to the nearest dollar. In no event shall salaries be
reduced as a result of this provision. CalHR and PECG may negotiate salaries above the
minimum level on any general, regional, specialty, classification, department, or other basis they
choose to agree upon.
C. Salaries for Unit 9 employees shall be increased as appropriate to correspond to the timing of
the salaries received by local agency employees included in the survey.
By mutual agreement CalHR and PECG can meet to discuss benchmarks and methodologies.
Beginning with the January 2013 salary survey, the calculation of the salary lead or lag for Unit 9
employees shall be based on weighted average salaries of employees in the classifications in the
following surveyed agencies listed in the below chart.
Notwithstanding the above provisions, salary increases pursuant to this section shall not be
provided during the term of this MOU.

Unit 9, Professional Engineers 2014 Salary Survey Page 9
Attachment 2
List of Surveyed Organizations and Entry Level
Classifications for 2014 Unit 9 Salary Survey
Organization Entry Level Min Max
STATE OF CALIFORNIA Transportation Engineer
A/B $4,608 $6,601
Alameda County Junior Engineer $5,606 $6,477
Contra Costa County Engineer - Entry $5,077 $6,034
Fresno County Engineer II $4,810 $6,151
Los Angeles County C.E Assistant
Sr. C.E. Assistant $5,114 $5,114
$6,018 $6,353
Orange County Junior Civil Engineer $5,432 $6,217
Riverside County Junior Engineer
Assistant Engineer $4,395 $4,914
$6,229 $6,967
Sacramento County Asst. Civil Engineer Lvl 1
Asst. Civil Eng. Lvl 2 $4,642 $5,585
$5,117 $7,127
San Bernardino County A/E Project Manager I $4,767 $6,088
San Diego County Assistant Engineer $4,945 $6,382
Santa Clara County Assistant Civil Engineer $6,099 $7,416
SF City/County Junior Engineer
Assistant Engineer $5,834 $7,833
$7,092 $8,630
City of Fresno Engineer I $4,119 $4,972
City of Los Angeles Civil Engineer Associate I $5,712 $7,096
City of Oakland Assistant Engineer, Lvl 1 $5,208 $6,393
City of Riverside Assistant Engineer $5,428 $6,599
City of Sacramento Junior Engineer
Assistant Civil Engineer $4,164 $5,079
$5,859 $7,146
City of San Diego Junior Engineer
Assistant Engineer $4,181 $4,839
$5,063 $5,830
City of San Jose Engineer I $5,295 $6,699
University of California, Berkeley Engineer, Assistant N/A N/A
University of California, Davis Engineer, Assistant $4,024 $7,243
University of California, Irvine Engineer, Assistant $3,867 $6,225
University of California, Los Angeles Engineer, Assistant $3,921 $7,745
University of California, Merced Engineer, Assistant N/A N/A
University of California, Riverside Engineer, Assistant $3,679 $7,543
University of California, San Diego Engineer, Assistant $3,509 $6,270
University of California, Santa Cruz Engineer, Assistant $3,917 $7,050
University of California, Santa Barbara Engineer, Assistant $3,980 $7,174
University of California, San Francisco Engineer, Assistant $4,742 $8,442

Unit 9, Professional Engineers 2014 Salary Survey Page 10
Attachment 2
List of Surveyed Organizations and Journey Level
Classifications for 2014 Unit 9 Salary Survey
Organization Journey Level Min Max
STATE OF CALIFORNIA Transportation
Engineer D $6,897 $8,630
Alameda County Associate Civil
Engineer $7,656 $9,303
Contra Costa County Engineer - Project $6,983 $8,098
Fresno County Senior Engineer $6,164 $7,650
Los Angeles County Assoc. Civil Engineer
Civil Engineer $6,773 $7,550
$8,414 $9,379
Orange County Civil Engineer $7,504 $8,597
Riverside County Associate Civil
Engineer $5,761 $8,169
Sacramento County Associate Civil
Engineer $7,120 $8,657
San Bernardino County A/E Project Manager II $5,521 $7,053
San Diego County Civil Engineer $6,243 $7,672
Santa Clara County Associate Civil
Engineer $7,274 $8,841
SF City/County Associate Engineer $7,664 $9,315
City of Fresno Professional Engineer $5,819 $7,052
City of Los Angeles Civil Engineer $7,731 $9,607
City of Oakland Civil Engineer $7,033 $8,635
City of Riverside Associate Engineer $6,271 $8,404
City of Sacramento Associate Civil
Engineer $6,164 $8,674
City of San Diego Associate Engineer $6,407 $7,737
City of San Jose Associate Engineer $6,434 $8,147
University of California, Berkeley Engineer, Associate N/A N/A
University of California, Davis Engineer, Associate $4,866 $8,759
University of California, Irvine Engineer, Associate $4,683 $7,540
University of California, Los Angeles Engineer, Associate $4,743 $9,348
University of California, Merced Engineer, Associate N/A N/A
University of California, Riverside Engineer, Associate $4,451 $9,128
University of California, San Diego Engineer, Associate $4,227 $7,896
University of California, Santa Cruz Engineer, Associate $4,792 $8,625
University of California, Santa Barbara Engineer, Associate $4,814 $8,659
University of California, San Francisco Engineer, Associate $5,758 $10,242

Unit 9, Professional Engineers 2014 Salary Survey Page 11
Attachment 2
List of Surveyed Organizations and First Level Supervisor
Classifications for 2014 Unit 9 Salary Survey
Organization First Level Supervisor
Min Max
STATE OF CALIFORNIA Sr. Transportation
Engineer $8,122 $10,166
Alameda County Supervising Civil
Engineer $8,918 $10,843
Contra Costa County Associate Civil Engineer $6,176 $8,104
Fresno County Supervising Engineer $6,779 $8,411
Los Angeles County Senior Civil Engineer $8,414 $10,454
Orange County Senior Civil Engineer $8,597 $9,857
Riverside County Senior Civil Engineer $6,581 $9,334
Sacramento County Senior Civil Engineer $8,488 $9,358
San Bernardino County A/E Project Manager III $6,087 $7,783
San Diego County Senior Civil Engineer $7,225 $8,878
Santa Clara County Senior Civil Engineer $8,518 $10,380
SF City/County Senior Engineer $10,268 $12,480
City of Fresno Supervising
Professional Engineer $6,606 $8,011
City of Los Angeles Senior Civil Engineer $9,092 $11,296
City of Oakland Civil Engineer,
Supervisor $8,645 $10,614
City of Riverside Principal Engineer $8,057 $11,901
City of Sacramento Supervising Engineer $7,484 $11,226
City of San Diego Senior Civil Engineer $7,384 $8,929
City of San Jose Senior Engineer $7,826 $9,901
University of California, Berkeley Engineer, Senior N/A N/A
University of California, Davis Engineer, Senior $5,356 $9,641
University of California, Irvine Engineer, Senior $5,150 $8,333
University of California, Los Angeles Engineer, Senior $5,221 $10,301
University of California, Merced Engineer, Senior $4,709 $8,817
University of California, Riverside Engineer, Senior $4,899 $10,270
University of California, San Diego Engineer, Senior $5,161 $10,048
University of California, Santa Cruz Engineer, Senior $5,333 $9,600
University of California, Santa Barbara Engineer, Senior $5,299 $9,541
University of California, San Francisco Engineer, Senior $6,317 $11,250

Unit 9, Professional Engineers 2014 Salary Survey Page 12 Page 12
Attachment 3
Department of Human Resources Computation of Weighted Average Salary and Lag for 2014 Unit 9 Salary Survey
April 1, 2014
Entry Level Journey Level First Level Supervisor
A B C D E F G H I J
Jurisdiction Salary
Maximum
# of
Inc.
Cal. Of
Weighted Avg.
Max = B*C
Salary
Maximum
# of
Inc.
Cal. Of
Weighted Avg.
Max = E*F
Salary
Maximum
# of
Inc.
Cal. Of
Weighted Avg.
Max = H*I
Alameda County $6,477 0 $0 $9,303 10 $93,028 $10,843 4 $43,372
Contra Costa County $6,034 0 $0 $8,098 4 $32,392 $8,104 7 $56,728
Fresno County $6,151 1 $6,151 $7,650 7 $53,550 $8,411 2 $16,822
Los Angeles County $6,353 93 $590,829 $9,379 348 $3,263,892 $10,454 98 $1,024,492
Orange County $6,217 0 $0 $8,597 36 $309,492 $9,857 26 $256,282
Riverside County $6,967 10 $69,670 $8,169 8 $65,352 $9,334 7 $65,338
Sacramento County $7,127 86 $612,922 $8,657 90 $779,130 $9,358 47 $439,826
San Bernardino County $6,088 2 $12,176 $7,053 3 $21,159 $7,783 1 $7,783
San Diego County $6,382 14 $89,348 $7,672 42 $322,224 $8,878 22 $195,316
Santa Clara County $7,416 9 $66,744 $8,841 19 $167,979 $10,380 6 $62,280
SF City/County $8,630 213 $1,838,190 $9,315 251 $2,338,065 $12,480 117 $1,460,160
City of Fresno $4,972 3 $14,916 $7,052 14 $98,728 $8,011 3 $24,033
City of Los Angeles $7,096 13 $92,248 $9,607 63 $605,241 $11,296 30 $338,880
City of Oakland $6,393 0 $0 $8,635 19 $164,065 $10,614 4 $42,456
City of Riverside $6,599 5 $32,995 $8,404 5 $42,020 $11,901 8 $95,208
City of Sacramento $7,146 10 $71,460 $8,674 21 $182,154 $11,226 11 $123,486
City of San Diego $5,830 209 $1,218,470 $7,737 89 $688,611 $8,929 47 $419,644
City of San Jose $6,699 0 $0 $8,147 101 $822,847 $9,901 26 $257,426
UC - Berkeley $0 0 $0 $0 0 $0 $0 0 $0
UC - Davis $7,243 0 $0 $8,759 3 $26,277 $9,641 3 $28,923
UC - Irvine $6,225 0 $0 $7,540 0 $0 $8,333 1 $8,333
UC - Los Angeles $7,745 13 $100,685 $9,348 3 $28,044 $10,301 3 $30,903
UC - Merced $0 0 $0 $0 0 $0 $8,817 0 $0
UC - Riverside $7,543 0 $0 $9,128 0 $0 $10,270 1 $10,270
UC - San Diego $6,270 1 $6,270 $7,896 6 $47,378 $10,048 1 $10,048
UC - Santa Cruz $7,050 7 $49,350 $8,625 1 $8,625 $9,600 8 $76,800
UC - Santa Barbara $7,174 3 $21,522 $8,659 3 $25,977 $9,541 1 $9,541
UC - San Francisco $8,442 3 $25,326 $10,242 1 $10,242 $11,250 0 $0
695 $4,919,272 1,147 $10,196,471 484 $5,104,351
Weighted Average $7,078 $8,890 $10,546
State of California $6,601 $8,630 $10,166
State Lag - $$$ $477 $260 $380
State Lag - % 7.2% 3.0% 3.7%
Related Documents