79 IC Engine Testing UNIT 7 IC ENGINE TESTING Structure 7.1 Introduction Objectives 7.2 Performance Measurements 7.3 Basic Parameters 7.3.1 Measurement of Speed 7.3.2 Fuel Consumption Measurement 7.3.3 Measurement of Air Consumption 7.3.4 Measurement of Exhaust Smoke 7.4 Measurement of Exhaust Emission 7.5 Measurement of Brake Power 7.6 Measurement of Friction Horse Power 7.7 Blowby Loss 7.8 Performance of SI Engines 7.9 Performance of CI Engines 7.10 Summary 7.11 Key Words 7.12 Answers to SAQs 7.1 INTRODUCTION At a design and development stage an engineer would design an engine with certain aims in his mind. The aims may include the variables like indicated power, brake power, brake specific fuel consumption, exhaust emissions, cooling of engine, maintenance free operation etc. The other task of the development engineer is to reduce the cost and improve power output and reliability of an engine. In trying to achieve these goals he has to try various design concepts. After the design the parts of the engine are manufactured for the dimensions and surface finish and may be with certain tolerances. In order verify the designed and developed engine one has to go for testing and performance evaluation of the engines. Thus, in general, a development engineer will have to conduct a wide variety of engine tests starting from simple fuel and air-flow measurements to taking of complicated injector needle lift diagrams, swirl patterns and photographs of the burning process in the combustion chamber. The nature and the type of the tests to be conducted depend upon various factors, some of which are: the degree of development of the particular design, the accuracy required, the funds available, the nature of the manufacturing company, and its design strategy. In this chapter, only certain basic tests and measurements will be considered. Objectives After studying this unit, you should be able to • understand the performance parameters in evaluation of IC engine performance, • calculate the speed of IC engine, fuel consumption, air consumption, etc., • evaluate the exhaust smoke and exhaust emission, and • differentiate between the performance of SI engine and CI engines.

Welcome message from author
This document is posted to help you gain knowledge. Please leave a comment to let me know what you think about it! Share it to your friends and learn new things together.
Transcript

79
IC Engine Testing UNIT 7 IC ENGINE TESTING
Structure
7.1 Introduction
Objectives
7.2 Performance Measurements
7.3 Basic Parameters
7.3.1 Measurement of Speed
7.3.2 Fuel Consumption Measurement
7.3.3 Measurement of Air Consumption
7.3.4 Measurement of Exhaust Smoke
7.4 Measurement of Exhaust Emission
7.5 Measurement of Brake Power
7.6 Measurement of Friction Horse Power
7.7 Blowby Loss
7.8 Performance of SI Engines
7.9 Performance of CI Engines
7.10 Summary
7.11 Key Words
7.12 Answers to SAQs
7.1 INTRODUCTION
At a design and development stage an engineer would design an engine with certain aims
in his mind. The aims may include the variables like indicated power, brake power,
brake specific fuel consumption, exhaust emissions, cooling of engine, maintenance free
operation etc. The other task of the development engineer is to reduce the cost and
improve power output and reliability of an engine. In trying to achieve these goals he has
to try various design concepts. After the design the parts of the engine are manufactured
for the dimensions and surface finish and may be with certain tolerances. In order verify
the designed and developed engine one has to go for testing and performance evaluation
of the engines.
Thus, in general, a development engineer will have to conduct a wide variety of engine
tests starting from simple fuel and air-flow measurements to taking of complicated
injector needle lift diagrams, swirl patterns and photographs of the burning process in
the combustion chamber. The nature and the type of the tests to be conducted depend
upon various factors, some of which are: the degree of development of the particular
design, the accuracy required, the funds available, the nature of the manufacturing
company, and its design strategy. In this chapter, only certain basic tests and
measurements will be considered.
Objectives
After studying this unit, you should be able to
• understand the performance parameters in evaluation of IC engine
performance,
• calculate the speed of IC engine, fuel consumption, air consumption, etc.,
• evaluate the exhaust smoke and exhaust emission, and
• differentiate between the performance of SI engine and CI engines.

80
Applied Thermal
Engineering
7.2 PERFORMANCE PARAMETERS
Engine performance is an indication of the degree of success of the engine performs its
assigned task, i.e. the conversion of the chemical energy contained in the fuel into the
useful mechanical work. The performance of an engine is evaluated on the basis of the
following :
(a) Specific Fuel Consumption.
(b) Brake Mean Effective Pressure.
(c) Specific Power Output.
(d) Specific Weight.
(e) Exhaust Smoke and Other Emissions.
The particular application of the engine decides the relative importance of these
performance parameters.
For Example : For an aircraft engine specific weight is more important whereas for an
industrial engine specific fuel consumption is more important.
For the evaluation of an engine performance few more parameters are chosen and the
effect of various operating conditions, design concepts and modifications on these
parameters are studied. The basic performance parameters are the following :
(a) Power and Mechanical Efficiency.
(b) Mean Effective Pressure and Torque.
(c) Specific Output.
(d) Volumetric Efficiency.
(e) Fuel-air Ratio.
(f) Specific Fuel Consumption.
(g) Thermal Efficiency and Heat Balance.
(h) Exhaust Smoke and Other Emissions.
(i) Specific Weight.
Power and Mechanical Efficiency
The main purpose of running an engine is to obtain mechanical power.
• Power is defined as the rate of doing work and is equal to the product
of force and linear velocity or the product of torque and angular
velocity.
• Thus, the measurement of power involves the measurement of force
(or torque) as well as speed. The force or torque is measured with the
help of a dynamometer and the speed by a tachometer.
The power developed by an engine and measured at the output shaft is called the
brake power (bp) and is given by,
2
60
π=
NTbp . . . (7.1)
where, T is torque in N-m and N is the rotational speed in revolutions per minute.
The total power developed by combustion of fuel in the combustion chamber is,
however, more than the bp and is called indicated power (ip). Of the power
developed by the engine, i.e. ip, some power is consumed in overcoming the
friction between moving parts, some in the process of inducting the air and
removing the products of combustion from the engine combustion chamber.

81
IC Engine Testing Indicated Power
It is the power developed in the cylinder and thus, forms the basis of
evaluation of combustion efficiency or the heat release in the cylinder.
60
= imp LANkIP
where, pm = Mean effective pressure, N/m2,
L = Length of the stroke, m,
A = Area of the piston, m2,
N = Rotational speed of the engine, rpm (It is N/2 for four stroke
engine), and
k = Number of cylinders.
Thus, we see that for a given engine the power output can be measured in
terms of mean effective pressure.
The difference between the ip and bp is the indication of the power lost in
the mechanical components of the engine (due to friction) and forms the
basis of mechanical efficiency; which is defined as follows :
Mechanical efficiency bp
ip= . . . (7.2)
The difference between ip and bp is called friction power (fp).
fp ip bp= − . . . (7.3)
∴ Mechanical efficiency ( )
bp
bp fp=
+ . . . (7.4)
Mean Effective Pressure and Torque
Mean effective pressure is defined as a hypothetical/average pressure which is
assumed to be acting on the piston throughout the power stroke. Therefore,
60×
=m
ipp
LANk . . . (7.5)
where, Pm = Mean effective pressure, N/m2,
Ip = Indicated power, Watt,
L = Length of the stroke, m,
A = Area of the piston, m2,
N = Rotational speed of the engine, rpm (It is N/2 for four stroke engine),
and
k = Number of cylinders.
If the mean effective pressure is based on bp it is called the brake mean effective
pressure (bmep Pmb replace ip by bp in Eq. 5.5), and if based on ihp it is called
indicated mean effective pressure (imep). Similarly, the friction mean effective
pressure (fmep) can be defined as,
fmap imep bmep= − . . . (7.6)
The torque is related to mean effective pressure by the relation
2
60
NTbp
π= . . . (7.7)
60
imp LANkiP =
82
Applied Thermal
Engineering
By Eq. (5.5),
2
. . .60 60
NT Nkbemp A L
π =
or, ( . . . )
2
bemp A L kT =
π . . . (7.8)
Thus, the torque and the mean effective pressure are related by the engine size.
A large engine produces more torque for the same mean effective pressure. For
this reason, torque is not the measure of the ability of an engine to utilize its
displacement for producing power from fuel. It is the mean effective pressure
which gives an indication of engine displacement utilization for this conversion.
Higher the mean effective pressure, higher will be the power developed by the
engine for a given displacement.
Again we see that the power of an engine is dependent on its size and speed.
Therefore, it is not possible to compare engines on the basis of either power or
torque. Mean effective pressure is the true indication of the relative performance
of different engines.
Specific Output
Specific output of an engine is defined as the brake power (output) per unit of
piston displacement and is given by,
Specific outputbp
A L=
×
= Constant × bmep × rpm . . . (7.9)
• The specific output consists of two elements – the bmep (force)
available to work and the speed with which it is working.
• Therefore, for the same piston displacement and bmep an engine
operating at higher speed will give more output.
• It is clear that the output of an engine can be increased by increasing
either speed or bmep. Increasing speed involves increase in the
mechanical stress of various engine parts whereas increasing bmep
requires better heat release and more load on engine cylinder.
Volumetric Efficiency
Volumetric efficiency of an engine is an indication of the measure of the degree to
which the engine fills its swept volume. It is defined as the ratio of the mass of air
inducted into the engine cylinder during the suction stroke to the mass of the air
corresponding to the swept volume of the engine at atmospheric pressure and
temperature. Alternatively, it can be defined as the ratio of the actual volume
inhaled during suction stroke measured at intake conditions to the swept volume
of the piston.
Volumetric efficiency, ηv
= Mass of charge actually sucked in
Mass of charge corresponding to the cylinder intake and conditionsP T . . . (5.10)
The amount of air taken inside the cylinder is dependent on the volumetric
efficiency of an engine and hence puts a limit on the amount of fuel which can be
efficiently burned and the power output.
For supercharged engine the volumetric efficiency has no meaning as it comes out
to be more than unity.
83
IC Engine Testing Fuel-Air Ratio (F/A)
Fuel-air ratio (F/A) is the ratio of the mass of fuel to the mass of air in the fuel-air
mixture. Air-fuel ratio (A/F) is reciprocal of fuel-air ratio. Fuel-air ratio of the
mixture affects the combustion phenomenon in that it determines the flame
propagation velocity, the heat release in the combustion chamber, the maximum
temperature and the completeness of combustion.
Relative fuel-air ratio is defined as the ratio of the actual fuel-air ratio to that of
the stoichiometric fuel-air ratio required to burn the fuel supplied. Stoichiometric
fuel-air ratio is the ratio of fuel to air is one in which case fuel is completely
burned due to minimum quantity of air supplied.
Actual fuel Air ratio
Relative fuel-air ratio, =Stoichiometric fuel Air ratio
RF−
− . . . (7.11)
Brake Specific Fuel Consumption
Specific fuel consumption is defined as the amount of fuel consumed for each unit
of brake power developed per hour. It is a clear indication of the efficiency with
which the engine develops power from fuel.
Brake specific fuel consumption (bsfc) Actual fuel Air ratio
Stoichiometric fuel Air ratio
−=
−. . . (7.12)
This parameter is widely used to compare the performance of different engines.
Thermal Efficiency and Heat Balance
Thermal efficiency of an engine is defined as the ratio of the output to that of the
chemical energy input in the form of fuel supply. It may be based on brake or
indicated output. It is the true indication of the efficiency with which the chemical
energy of fuel (input) is converted into mechanical work. Thermal efficiency also
accounts for combustion efficiency, i.e., for the fact that whole of the chemical
energy of the fuel is not converted into heat energy during combustion.
Brake thermal efficiencyf v
bp
m C=
× . . . (7.13)
where, Cv = Calorific value of fuel, kJ/kg, and
mf = Mass of fuel supplied, kg/sec.
• The energy input to the engine goes out in various forms – a part is in
the form of brake output, a part into exhaust, and the rest is taken by
cooling water and the lubricating oil.
• The break-up of the total energy input into these different parts is
called the heat balance.
• The main components in a heat balance are brake output, coolant
losses, heat going to exhaust, radiation and other losses.
• Preparation of heat balance sheet gives us an idea about the amount
of energy wasted in various parts and allows us to think of methods to
reduce the losses so incurred.
Exhaust Smoke and Other Emissions
Smoke and other exhaust emissions such as oxides of nitrogen, unburned
hydrocarbons, etc. are nuisance for the public environment. With increasing
emphasis on air pollution control all efforts are being made to keep them as
minimum as it could be.
Smoke is an indication of incomplete combustion. It limits the output of an engine
if air pollution control is the consideration.

84
Applied Thermal
Engineering
Exhaust emissions have of late become a matter of grave concern and with the
enforcement of legislation on air pollution in many countries; it has become
necessary to view them as performance parameters.
Specific Weight
Specific weight is defined as the weight of the engine in kilogram for each brake
power developed and is an indication of the engine bulk. Specific weight plays an
important role in applications such as power plants for aircrafts.
7.3 BASIC MEASUREMENTS
The basic measurements to be undertaken to evaluate the performance of an engine on
almost all tests are the following :
(a) Speed
(b) Fuel consumption
(c) Air consumption
(d) Smoke density
(e) Brake horse-power
(f) Indicated horse power and friction horse power
(g) Heat going to cooling water
(h) Heat going to exhaust
(i) Exhaust gas analysis.
In addition to above a large number of other measurements may be necessary depending
upon the aim of the test.
7.3.1 Measurement of Speed
One of the basic measurements is that of speed. A wide variety of speed measuring
devices are available in the market. They range from a mechanical tachometer to digital
and triggered electrical tachometers.
The best method of measuring speed is to count the number of revolutions in a given
time. This gives an accurate measurement of speed. Many engines are fitted with such
revolution counters.
A mechanical tachometer or an electrical tachometer can also be used for measuring the
speed.
The electrical tachometer has a three-phase permanent-magnet alternator to which a
voltmeter is attached. The output of the alternator is a linear function of the speed and is
directly indicated on the voltmeter dial.
Both electrical and mechanical types of tachometers are affected by the temperature
variations and are not very accurate. For accurate and continuous measurement of speed
a magnetic pick-up placed near a toothed wheel coupled to the engine shaft can be used.
The magnetic pick-up will produce a pulse for every revolution and a pulse counter will
accurately measure the speed.
7.3.2 Fuel Consumption Measurement
Fuel consumption is measured in two ways :
(a) The fuel consumption of an engine is measured by determining the volume
flow in a given time interval and multiplying it by the specific gravity of the
fuel which should be measured occasionally to get an accurate value.
(b) Another method is to measure the time required for consumption of a given
mass of fuel.

85
IC Engine Testing Accurate measurement of fuel consumption is very important in engine testing work.
As already mentioned two basic types of fuel measurement methods are :
• Volumetric type
• Gravimetric type.
Volumetric type flowmeter includes Burette method, Automatic Burrette flowmeter and
Turbine flowmeter.
Gravimetric Fuel Flow Measurement
The efficiency of an engine is related to the kilograms of fuel which are consumed
and not the number of litres. The method of measuring volume flow and then
correcting it for specific gravity variations is quite inconvenient and inherently
limited in accuracy. Instead if the weight of the fuel consumed is directly
measured a great improvement in accuracy and cost can be obtained.
There are three types of gravimetric type systems which are commercially
available include Actual weighing of fuel consumed, Four Orifice Flowmeter, etc.
7.3.3 Measurement of Air Consumption
One can say the mixture of air and fuel is the food for an engine. For finding out the
performance of the engine accurate measurement of both is essential.
In IC engines, the satisfactory measurement of air consumption is quite difficult because
the flow is pulsating, due to the cyclic nature of the engine and because the air a
compressible fluid. Therefore, the simple method of using an orifice in the induction
pipe is not satisfactory since the reading will be pulsating and unreliable.
All kinetic flow-inferring systems such as nozzles, orifices and venturies have a square
law relationship between flow rate and differential pressure which gives rise to severe
errors on unsteady flow. Pulsation produced errors are roughly inversely proportional to
the pressure across the orifice for a given set of flow conditions. The various methods
and meters used for air flow measurement include
(a) Air box method, and
(b) Viscous-flow air meter.
7.3.4 Measurement of Exhaust Smoke
All the three widely used smokemeters, namely, Bosch, Hartridge, and PHS are basically
soot density (g/m3) measuring devices, that is, the meter readings are a function of the
mass of carbon in a given volume of exhaust gas.
Hartridge smokemeter works on the light extinction principle.
The basic principles of the Bosch smokemeter is one in which a fixed quantity of
exhaust gas is passed through a fixed filter paper and the density of the smoke stains on
the paper are evaluated optically. In a recent modification of this type of smokemeter
units are used for the measurement of the intensity of smoke stain on filter paper.
In Von Brand smokemeter which can give a continuous reading a filter tape is
continuously moved at a uniform rate to which the exhaust from the engine is fed. The
smoke stains developed on the filter paper are sensed by a recording head. The single
obtained from the recording head is calibrated to give smoke density.
7.4 MEASUREMENT OF EXHAUST EMISSION
Substances which are emitted to the atmosphere from any opening of the exhaust port of
the engine are termed as exhaust emissions. If combustion is complete and the mixture is

86
Applied Thermal
Engineering
stoichiometric the products of combustion would consist of carbon dioxide (CO2) and
water vapour only.
However, there is no complete combustion of fuel and hence the exhaust gas consists of
variety of components, the most important of them are carbon monoxide (CO), unburned
hydrocarbons (UBHC) and oxides of nitrogen (NOx). Some oxygen and other inert gases
would also be present in the exhaust gas.
Over the decade numerous devices have been developed for measuring these various
exhaust components. A brief discussion of some of the more commonly used instruments
is given below.
7.4.1 Flame Ionization Detector (FID)
The schematic diagram of a flame ionization detector burner is shown in Figures 7.1(a)
and (b) shows burner.
}Collector load
Burner load
Air in
Sampleflame
Sample
(Mg + N + O )2 2 (Mg + O + N )2 2} }
(Air) (Air)
flame flame
(a) (b)
(Mg + N + O )2 2
(a) (b)
Figure 7.1 : Flame Ionization Detector Burner
The working principle of this burner is as follows: A hydrogen-air flame contains a
negligible amount of ions. However, if even trace amounts of an organic compound such
as HC are introduced into the flame, a large number of ions are produced. If a polarized
voltage is applied across the burner jet and an adjacent collector, an ion migration will
produce a current proportional to the number of ions and thus to the HC concentration
present in the flame.
The output of the FID depends on the number of carbon atoms passing through the flame
in a unit time. Doubling the flow velocity would also double the output. Hexane (C6H14)
would give double the output of propane (C3H8). Therefore, FID output is usually
referred to a standard hydrocarbon, usually as ppm of normal hexane.
Presences of CO, CO2, NOx, water and nitrogen in the exhaust have to effect on the FID
reading. Oxygen slightly affects the reading of FID.
FID analyzer is a rapid, continuous and accurate method of measuring HC in the exhaust
gas. Concentration as low as 1 ppb can be measured.
7.4.2 Spectroscopic Analyzers
• A spectrum shows the light absorbed as a function of wavelength
(or frequency).
• Each compound shows a different spectrum for the light absorbed.
• All the spectroscopic analyzers work on the principle that the quantity of
energy absorbed by a compound in a sample cell is proportional to the
concentration of the compound in the cell. There are two types of
spectroscopic analyzers.

87
IC Engine Testing Dispersive Analyzers
These analyzers use only a narrow dispersed frequency of light spectrum to
analyze a compound. These are usually not use for exhaust emission
measurements.
Non-Dispersive Infra-red (NDIR) Analyzers
In the NDIR analyzer the exhaust gas species being measuring is used to detect
itself. This is done by selective absorption. The infrared energy of a particular
wavelength or frequency is peculiar to a certain gas in that the gas will absorb the
infracted energy of this wavelength and transmit and infrared energy of other
wavelengths. For example, the absorption band for carbon monoxide is between
4.5 and 5 microns. So the energy absorbed at this wavelength is an indication of
the concentration of CO in the exhaust gas.
Chopper
Sample Lin
Cell
Sam
ple
Cell
Refe
rence C
ell
Detector
Recordersignal
Control unit
Component of Interest
Other molecules
Samples crep
InfraredSource
Diaphragmdistended
Figure 7.2 : Schematic of Non-dispersive Infra-red Analyzer (NDIR)
The NDIR analyzer as shown in Figure 7.2 consists of two infrared sources, interrupted
simultaneously by an optical chopper. Radiation from these sources passes in parallel
paths through a reference cell and a sample cell to opposite side of a common detector.
The sample cell contains the compounds to be analyzed, whereas this compound is not
present in the reference cell. The latter is usually filled with an inert gas, usually
nitrogen, which does not absorb the infrared energy for the wavelength corresponding to
the compound being measured. A closed container filled with only the compound to be
measured works as a detector.
The detector is divided into two equal volumes by a thin metallic diaphragm. When the
chopper blocks the radiation, the pressure in both parts of the detector is same and the
diagram remains in the neutral position. As the chopper blocks and unblocks the
radiation, the radiant energy from one source passes through the reference cell
unchanged whereas the sample cell absorbs the infrared energy at the wavelength of the
compound in cell. The absorption is proportional to the concentration of the compound
to be measured in the sample cell. Thus unequal amounts of energy are transmitted to the
two volumes of the detector and the pressure differential so generated causes movement
of the diaphragm and a fixed probe, thereby generating an a.c., displayed on a meter. The
signal is a function of the concentration of the compound to be measured.
The NDIR can accurately measure CO, CO2 and those hydrocarbons which have clear
infrared absorption peaks. However, usually the exhaust sample to be analyzed contains
other species which also absorb infrared energy at the same frequency. For example, an
NDIR analyzer sensitized to n-hexane for detection of HC responds equally well to other
paraffin HC but not to olefins, acetylenes or aromatics. Therefore, the reading given by
such analyzer is multiplied by 1.8 to correct it to the total UBHC as measured by an FID
analyzer in the same exhaust stream.
7.4.3 Gas Chromatography
Gas chromatography is first a method of separating the individual constituents of a
mixture and then a method of assured their concentration. After separation, each
88
Applied Thermal
Engineering
compound can be separately analyzed for concentration. This is the only method by
which each component existing in an exhaust sample can be identified and analyzed.
However, it is very time consuming and the samples can be taken only in batches. Gas
chromatograph is primarily a laboratory tool.
In addition to the above methods such as mass spectroscopy, chemiluminescent
analyzers, and electrochemical analyzer are also used for measuring exhaust emissions.
7.5 MEASUREMENT OF BRAKE POWER
The brake power measurement involves the determination of the torque and the angular
speed of the engine output shaft. The torque measuring device is called a dynamometer.
Dynamometers can be broadly classified into two main types, power absorption
dynamometers and transmission dynamometer.
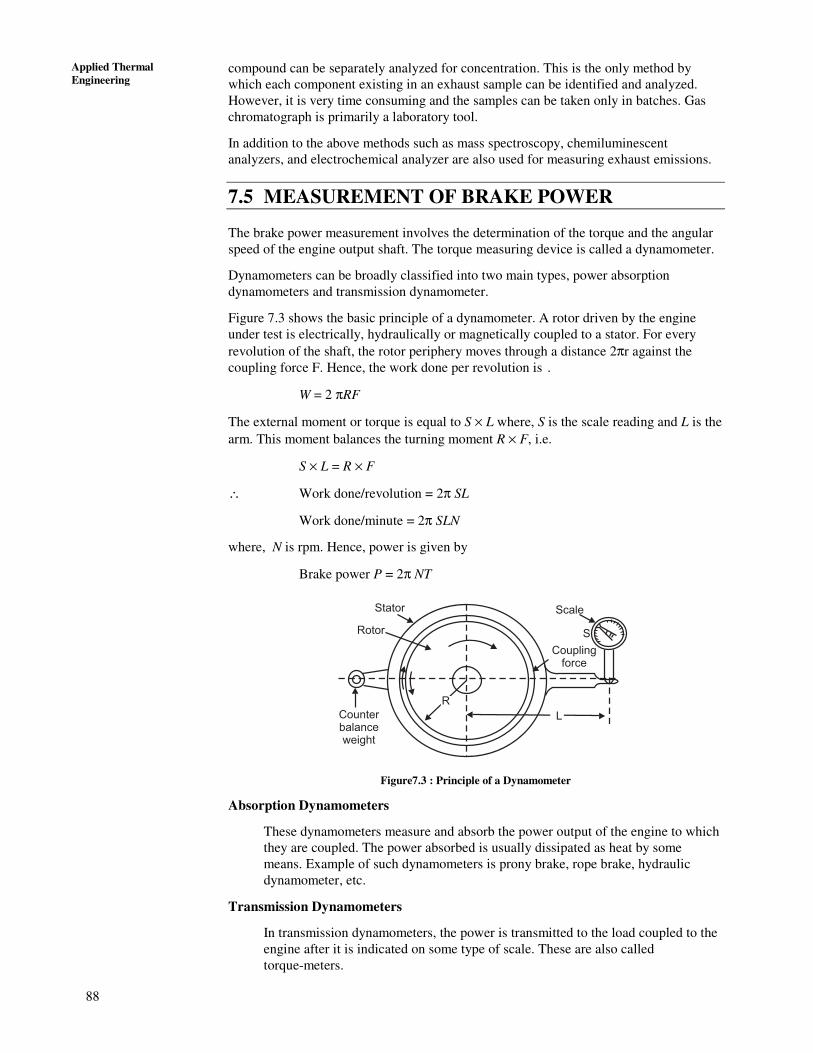
Figure 7.3 shows the basic principle of a dynamometer. A rotor driven by the engine
under test is electrically, hydraulically or magnetically coupled to a stator. For every
revolution of the shaft, the rotor periphery moves through a distance 2πr against the
coupling force F. Hence, the work done per revolution is .
W = 2 πRF
The external moment or torque is equal to S × L where, S is the scale reading and L is the
arm. This moment balances the turning moment R × F, i.e.
S × L = R × F
∴ Work done/revolution = 2π SL
Work done/minute = 2π SLN
where, N is rpm. Hence, power is given by
Brake power P = 2π NT
Scale
S
Couplingforce
Stator
Rotor
Counterbalanceweight
L
R
Figure7.3 : Principle of a Dynamometer
Absorption Dynamometers
These dynamometers measure and absorb the power output of the engine to which
they are coupled. The power absorbed is usually dissipated as heat by some
means. Example of such dynamometers is prony brake, rope brake, hydraulic
dynamometer, etc.
Transmission Dynamometers
In transmission dynamometers, the power is transmitted to the load coupled to the
engine after it is indicated on some type of scale. These are also called
torque-meters.
89
IC Engine Testing 7.5.1 Absorption Dynamometers
These include Prony brake type, Rope brake type, and Hydraulic type.
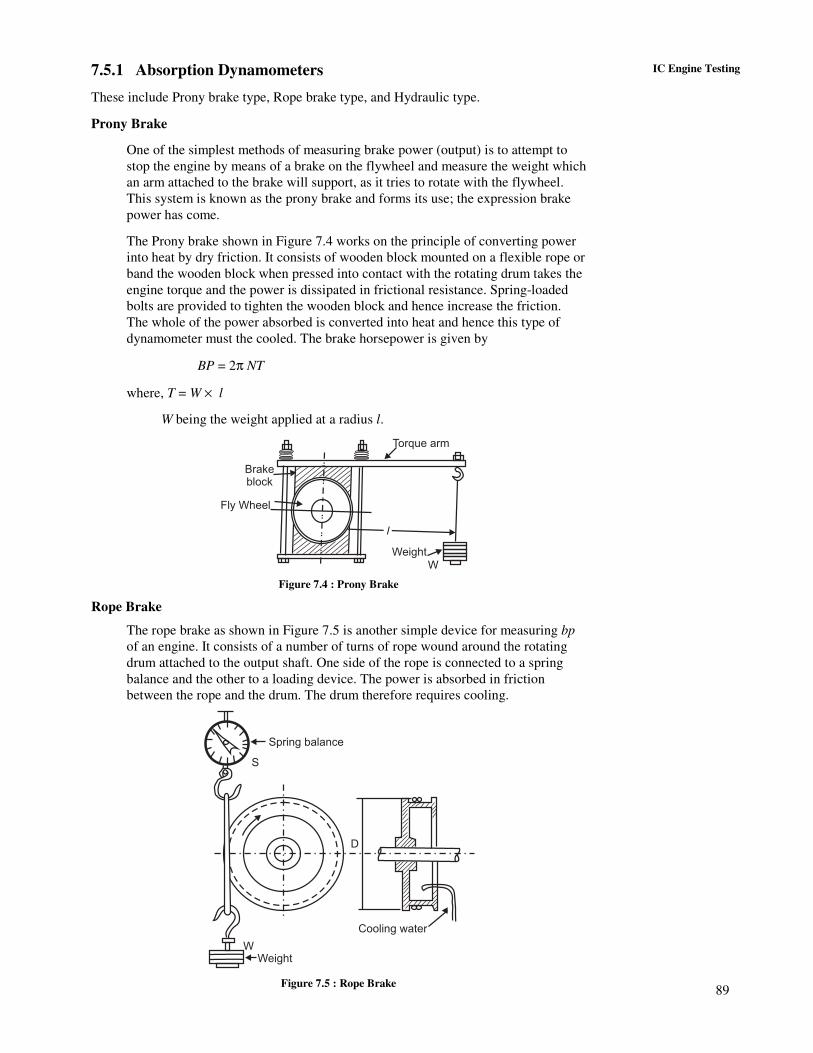
Prony Brake
One of the simplest methods of measuring brake power (output) is to attempt to
stop the engine by means of a brake on the flywheel and measure the weight which
an arm attached to the brake will support, as it tries to rotate with the flywheel.
This system is known as the prony brake and forms its use; the expression brake
power has come.
The Prony brake shown in Figure 7.4 works on the principle of converting power
into heat by dry friction. It consists of wooden block mounted on a flexible rope or
band the wooden block when pressed into contact with the rotating drum takes the
engine torque and the power is dissipated in frictional resistance. Spring-loaded
bolts are provided to tighten the wooden block and hence increase the friction.
The whole of the power absorbed is converted into heat and hence this type of
dynamometer must the cooled. The brake horsepower is given by
BP = 2π NT
where, T = W × l
W being the weight applied at a radius l.
Torque arm
l
WeightW
Brakeblock
Fly Wheel
Figure 7.4 : Prony Brake
Rope Brake
The rope brake as shown in Figure 7.5 is another simple device for measuring bp
of an engine. It consists of a number of turns of rope wound around the rotating
drum attached to the output shaft. One side of the rope is connected to a spring
balance and the other to a loading device. The power is absorbed in friction
between the rope and the drum. The drum therefore requires cooling.
Spring balance
S
WWeight
D
Cooling waterCooling water
Figure 7.5 : Rope Brake

90
Applied Thermal
Engineering
Rope brake is cheap and easily constructed but not a very accurate method
because of changes in the friction coefficient of the rope with temperature.
The bp is given by
bp = π DN (W − S)
where, D is the brake drum diameter, W is the weight in Newton and S is the
spring scale reading.
Hydraulic Dynamometer
Hydraulic dynamometer shown in Figure 7.6 works on the principle of dissipating
the power in fluid friction rather than in dry friction.
• In principle its construction is similar to that of a fluid flywheel.
• It consists of an inner rotating member or impeller coupled to the
output shaft of the engine.
• This impeller rotates in a casing filled with fluid.
• This outer casing, due to the centrifugal force developed, tends to
revolve with the impeller, but is resisted by a torque arm supporting
the balance weight.
• The frictional forces between the impeller and the fluid are measured
by the spring-balance fitted on the casing.
• The heat developed due to dissipation of power is carried away by a
continuous supply of the working fluid, usually water.
• The output can be controlled by regulating the sluice gates which can
be moved in and out to partially or wholly obstruct the flow of water
between impeller, and the casing.
Torus Rotor Stator
Trunnion bearing
Shaft bearing
Main shaft
Pedestal
Torus flowGap width
Figure 7.6 : Hydraulic Dynamometer
Eddy Current Dynamometer
The working principle of eddy current dynamometer is shown in Figure 7.7.
It consists of a stator on which are fitted a number of electromagnets and a rotor
disc made of copper or steel and coupled to the output shaft of the engine. When
the rotor rotates eddy currents are produced in the stator due to magnetic flux set
up by the passage of field current in the electromagnets. These eddy currents are
dissipated in producing heat so that this type of dynamometer also requires some
cooling arrangement. The torque is measured exactly as in other types of

91
IC Engine Testing absorption dynamometers, i.e. with the help of a moment arm. The load is
controlled by regulating the current in the electromagnets.
The following are the main advantages of eddy current dynamometers :
(a) High brake power per unit weight of dynamometer.
(b) They offer the highest ratio of constant power speed range
(up to 5 : 1).
(c) Level of field excitation is below 1% of total power being handled by
dynamometer, thus, easy to control and programme.
(d) Development of eddy current is smooth hence the torque is also
smooth and continuous under all conditions.
(e) Relatively higher torque under low speed conditions.
(f) It has no intricate rotating parts except shaft bearing.
(g) No natural limit to size-either small or large.
Field
Stator
Rotor
Figure 7.7 : Eddy Current Dynamometer
Swinging Field d.c. Dynamometer
Basically, a swinging field d.c. dynamometer is a d.c. shunt motor so supported on
trunnion bearings to measure there action torque that the outer case and filed coils
tend to rotate with the magnetic drag. Hence, the name swinging field. The torque
is measured with an arm and weighing equipment in the usual manner.
Many dynamometers are provided with suitable electric connections to run as
motor also. Then the dynamometer is reversible, i.e. works as motoring as well as
power absorbing device.
• When used as an absorption dynamometer it works as a d.c. generator
and converts mechanical energy into electric energy which is
dissipated in an external resistor or fed back to the mains.
• When used as a motoring device an external source of d.c. voltage is
needed to drive the motor.
The load is controlled by changing the field current.
7.5.2 Fan Dynamometer
It is also an absorption type of dynamometer in that when driven by the engine it absorbs
the engine power. Such dynamometers are useful mainly for rough testing and running-
in. The accuracy of the fan dynamometer is very poor. The power absorbed is
determined by using previous calibration of the fan brake.
7.5.3 Transmission Dynamometers
Transmission dynamometers, also called torque meters, mostly consist of a set of
strain-gauges fixed on the rotating shaft and the torque is measured by the angular
deformation of the shaft which is indicated as strain of the strain gauge. Usually, a four
92
Applied Thermal
Engineering
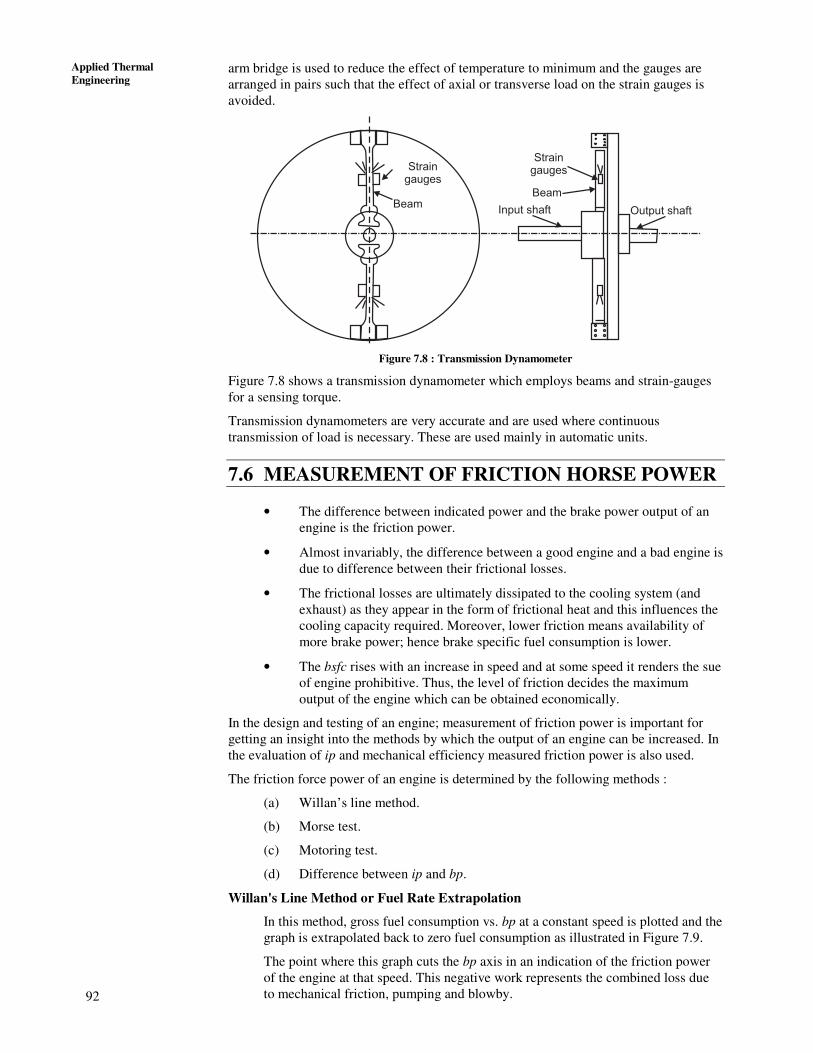
arm bridge is used to reduce the effect of temperature to minimum and the gauges are
arranged in pairs such that the effect of axial or transverse load on the strain gauges is
avoided.
Straingauges
Input shaft
Straingauges
Output shaftBeam
Beam
Figure 7.8 : Transmission Dynamometer
Figure 7.8 shows a transmission dynamometer which employs beams and strain-gauges
for a sensing torque.
Transmission dynamometers are very accurate and are used where continuous
transmission of load is necessary. These are used mainly in automatic units.
7.6 MEASUREMENT OF FRICTION HORSE POWER
• The difference between indicated power and the brake power output of an
engine is the friction power.
• Almost invariably, the difference between a good engine and a bad engine is
due to difference between their frictional losses.
• The frictional losses are ultimately dissipated to the cooling system (and
exhaust) as they appear in the form of frictional heat and this influences the
cooling capacity required. Moreover, lower friction means availability of
more brake power; hence brake specific fuel consumption is lower.
• The bsfc rises with an increase in speed and at some speed it renders the sue
of engine prohibitive. Thus, the level of friction decides the maximum
output of the engine which can be obtained economically.
In the design and testing of an engine; measurement of friction power is important for
getting an insight into the methods by which the output of an engine can be increased. In
the evaluation of ip and mechanical efficiency measured friction power is also used.
The friction force power of an engine is determined by the following methods :
(a) Willan’s line method.
(b) Morse test.
(c) Motoring test.
(d) Difference between ip and bp.
Willan's Line Method or Fuel Rate Extrapolation
In this method, gross fuel consumption vs. bp at a constant speed is plotted and the
graph is extrapolated back to zero fuel consumption as illustrated in Figure 7.9.
The point where this graph cuts the bp axis in an indication of the friction power
of the engine at that speed. This negative work represents the combined loss due
to mechanical friction, pumping and blowby.

93
IC Engine Testing The test is applicable only to compression ignition engines.
1.3
1.2
1.1
1.0
0.9
0.8
0.7
0.6
0.5
0.4
0.3
0.2
0.1
–2 –1 0 1 2 3 4 5 6 7 8 9 10
–2 0 2 4 6 8 10 12 14 16 18 20
Fu
el F
low
Ra
te (
Gra
m/S
ec.)
Jacket water temperature = 50 Crpm = 1400
o
Frictionin torque
Engine torque, kg-m.
Figure 7.9 : Willan’s Line Method
• The main drawback of this method is the long distance to be
extrapolated from data measured between 5 and 40% load towards
the zero line of fuel in put.
• The directional margin of error is rather wide because of the graph
which may not be a straight line many times.
• The changing slope along the curve indicates part efficiencies of
increments of fuel. The pronounced change in the slope of this line
near full load reflects the limiting influence of the air-fuel ratio and of
the quality of combustion.
• Similarly, there is a slight curvature at light loads. This is perhaps due
to difficulty in injecting accurately and consistently very small
quantities of fuel per cycle.
• Therefore, it is essential that great care should be taken at light loads
to establish the true nature of the curve.
• The Willan’s line for a swirl-chamber CI engine is straighter than that
for a direct injection type engine.
• The accuracy obtained in this method is good and compares favorably
with other methods if extrapolation is carefully done.
Morse Test
The Morse test is applicable only to multicylinder engines.
• In this test, the engine is first run at the required speed and the output
is measured.
• Then, one cylinder is cut out by short circuiting the spark plug or by
disconnecting the injector as the case may be.
• Under this condition all other cylinders ‘motor’ this cut-out cylinder.
The output is measured by keeping the speed constant at its original
value.
• The difference in the outputs is a measure of the indicated horse
power of the cut-out cylinder.
• Thus, for each cylinder the ip is obtained and is added together to
find the total ip of the engine.

94
Applied Thermal
Engineering
The ip of n cylinder is given by
ipn = bpn + fp . . . (7.17)
ip for (n − 1) cylinders is given by
ipn – 1 = bpn – 1 + fp . . . (7.18)
Since, the engine is running at the same speed it is quite reasonable to assume that
fhp remains constant.
From Eqs. (7.17) and (7.18), we see that the ihp of the nth cylinder is given by
(ip) nth = bpn − bpn – 1 . . . (7.19)
and the total ip of the engine is,
hpn = Σ (ihp) nth . . . (7.20)
By subtracting bpn from this, fp of the engine can be obtained.
This method though gives reasonably accurate results and is liable to errors due to
changes in mixture distribution and other conditions by cutting-out one cylinder.
In gasoline engines, where there is a common manifold for two or more cylinders
the mixture distribution as well as the volumetric efficiency both change. Again,
almost all engines have a common exhaust manifold for all cylinders and cutting-
out of one cylinder may greatly affect the pulsations in exhaust system which may
significantly change the engine performance by imposing different back pressures.
Motoring Test
• In the motoring test, the engine is first run up to the desired speed by its
own power and allowed to remain at the given speed and load conditions for
some time so that oil, water, and engine component temperatures reach
stable conditions.
• The power of the engine during this period is absorbed by a swinging field
type electric dynamometer, which is most suitable for this test.
• The fuel supply is then cut-off and by suitable electric-switching devices the
dynamometer is converted to run as a motor to drive for ‘motor’ the engine
at the same speed at which it was previously running.
• The power supply to the motor is measured which is a measure of the fhp of
the engine. During the motoring test the water supply is also cut-off so that
the actual operating temperatures are maintained.
• This method, though determines the fp at temperature conditions very near
to the actual operating temperatures at the test speed and load, does, not
give the true losses occurring under firing conditions due to the following
reasons.
(a) The temperatures in the motored engine are different from those in a firing
engine because even if water circulation is stopped the incoming air cools
the cylinder. This reduces the lubricating oil temperature and increases
friction increasing the oil viscosity. This problem is much more sever in
air-cooled engines.
(b) The pressure on the bearings and piston rings is lower than the firing
pressure. Load on main and connecting road bearings are lower.
(c) The clearance between piston and cylinder wall is more (due to cooling).
This reduces the piston friction.
(d) The air is drawn at a temperature less than when the engine is firing because
it does not get heat from the cylinder (rather loses heat to the cylinder).
This makes the expansion line to be lower than the compression line on the
p-v diagram. This loss is however counted in the indicator diagram.

95
IC Engine Testing (e) During exhaust the back pressure is more because under motoring
conditions sufficient pressure difference is not available to impart gases the
kinetic energy is necessary to expel them from exhaust.
Motoring method, however, gives reasonably good results and is very suitable for
finding the losses due to various engine components. This insight into the losses
caused by various components and other parameters is obtained by progressive
stripping-off of the under progressive dismantling conditions keeping water and
oil circulation intact. Then the cylinder head can be removed to evaluate, by
difference, the compression loss. In this manner piston ring, piston etc. can be
removed and evaluated for their effect on overall friction.
Difference between ip and bp
(a) The method of finding the fp by computing the difference between ip, as
obtained from an indicator diagram, and bp, as obtained by a dynamometer,
is the ideal method. However, due to difficulties.
(b) In obtaining accurate indicator diagrams, especially at high engine speeds,
this method is usually only used in research laboratories. Its use at
commercial level is very limited.
Comments on Methods of Measuring fp
• The Willan’ line method and Morse tests are very cheap and easy to
conduct.
• However, both these tests give only an overall idea of the losses whereas
motoring test gives a very good insight into the various causes of losses and
is a much more powerful tool.
• As far as accuracy is concerned the ip – bp method is the most accurate if
carefully done.
• Motoring method usually gives a higher value for fhp as compared to that
given by the Willian’s line method.
7.7 BLOWBY LOSS
Blowby is the escape of unburned air-fuel mixture and burned gases from the
combustion chamber, past the piston rings, and into the crank-case. High blowby is quite
harmful in that it results in higher ring temperatures and contamination of lubricating oil.
7.8 PERFORMANCE OF SI ENGINES
The performance of an engine is usually studied by heat balance-sheet. The main
components of the heat balance are :
• Heat equivalent to the effective (brake) work of the engine,
• Heat rejected to the cooling medium,
• Heat carried away from the engine with the exhaust gases, and
• Unaccounted losses.
The unaccounted losses include the radiation losses from the various parts of the engine
and heat lost due to incomplete combustion. The friction loss is not shown as a separate
item to the heat balance-sheet as the friction loss ultimately reappears as heat in cooling
water, exhaust and radiation.

96
Applied Thermal
Engineering
Radiation, incomplete combustion etc.
Exhaust
Engine set atfull throttle
Coolant
Useful work
0
20
40
60
80
100
1000 2000 3000 4000 5000 6000
Energ
y %
Engine speed in rpm
Figure 7.10 : Heat Balance Vs. Speed for a Petrol Engine at Full Throttle
The following Table 7.1 gives the approximate percentage values of various losses in SI
and CI engines.
Table7.1 : Components of Heat Balance in Percent at Full Load
Engine
Type
Brake Load
Efficiency %
Heat Rejected
to Cooling
Water %
Heat Rejected
through Exhaust
Gases %
Unaccounted Heat %
SI 21-28 12-27 30-55 3-55 (including incomplete
combustion loss 0-45)
CI 29-42 15-35 25-45 21-0 (including incomplete
combustion loss 0-5)
Figure 7.10 shows the heat balance for a petrol engine run at full throttle over its speed
range. In SI engines, the loss due to incomplete combustion included on unaccounted
form can be rather high. For a rich mixture (A/F ratio = 12.5 to 13) it could be 20%.
Figure 7.11 shows the heat balance of uncontrolled Otto engine at different loads.
0 20 40 60 80
20
40
60
80
100
Exhaust
Cooling
Engine friction
Accessories
Pumpingwork
Propulsionenergy
Energ
y s
upplie
d
Waste
d E
nerg
yU
sefu
l w
ork
Speed mph
Figure 7.11 : Uncontrolled Otto Engine
Figure 7.12 shows the brake thermal efficiency, indicated thermal efficiency, mechanical
efficiency and specific fuel consumption for the above SI engine.

97
IC Engine Testing 100
80
60
40
20
0
1000 2000 3000 4000 5000 6000
400
350
300
250
200
Sp
eci
fic f
ue
l co
nsu
mp
tion
,g
/bh
p-h
r.
Engine speed rpm
Mechanical efficiency
Specific fuelconsumption
Indicated thermal efficiency
Brake thermal efficiency
Effic
ien
cy %
Figure 7.12 : Efficiency and Specific Fuel Consumption Vs.
Figure 7.13 shows the ip, bp, fp (by difference) brake torque, brake mean effective
pressure and brake specific fuel consumption of a high compression ratio (9) automotive
SI engine at full or Wide Open Throttle (W.O.T.).
Speed for a Petrol Engine at Full Throttle
2
280
240
200
160
120
80
40
01000 2000 3000 4000 5000 6000 7000
0.20
0.25
0.30
30
35
40
45
Speed (rpm)
Ho
rse
po
we
r
bm
ep. kgf/cm 10
8
6
bmep
Extrapolateh
ihp
bhp
bhp
Peak bhip
Peak ihp
Brake torque
fhp
bsfc
bsfc
C
kg
f/b
hp
-hr.
To
rqu
e,
kg
f-m
v
Figure 7.13 : Variable Speed Test of Automotive SI Engine at Full Throttle (CR = 9)
Referring to the Figure 7.10 through Figure 7.13 the following conclusions can be
drawn :
(a) At full throttle the brake thermal efficiency at various speeds varies from
20 to 27 percent, maximum efficiency being at the middle speed range.
(b) The percentage heat rejected to coolant is more at lower speed (≈ 35
percent) and reduces at higher speeds (≈ 25 percent). Considerably more
heat is carried by exhaust at higher speeds.
(c) Torque and mean effective pressure do not strongly depend on the speed of
the engine, but depend on the volumetric efficiency and friction losses.
Maximum torque position corresponds with the maximum air charge or
minimum volumetric efficiency position.
Torque and mep curves peak at about half that of the brake-power.

98
Applied Thermal
Engineering
Note : If size (displacement) of the engine were to be doubled, torque
would also double, but mean effective pressure (mep) is a ‘specific’ torque,
a variable independent of the size of the engine.
(d) High power arises from the high speed. In the speed range before the
maximum power is obtained, doubling the speed doubles the power.
(e) At low engine speed the friction power is relatively low and bhp is nearly as
large as ip (Figure 7.13). As engine speed increases, however, fp increases
at continuously greater rate and therefore bp reaches a peak and starts
reducing even though ip is rising. At engine speeds above the usual
operating range, fp increases very rapidly. Also, at these higher speeds ip
will reach a maximum and then fall off. At some point, ip and fp will be
equal, and bp will then drop to zero.
Performance of SI Engine at Constant Speed and Variable Load
The performance of SI engine at constant speed and variable loads is different
from the performance at full throttle and variable speed. Figure 7.14 shows the
heat balance of SI engine at constant speed and Figure 7.14 variable load. The
load is varied by altering the throttle and the speed is kept constant by resetting the
dynamometer.
Closing the throttle reduces the pressure inside the cylinders but the temperature is
affected very little because the air/fuel ratio is substantially constant, and the gas
temperatures throughout the cycle are high. This results in high loss to coolant at
low engine load. This is reason of poor part load thermal efficiency of the SI
engine compared with the CI engine.
• At low loads the efficiency is about 10 percent, rising to about
25 percent at full load.
• The loss to coolant is about 60 percent at low loads and 30 percent at
full load.
• The exhaust temperature rises very slowly with load and as mass flow
rate of exhaust gas is reduced because the mass flow rate of fuel into
the engine is reduced, the percentage loss to exhaust remains nearly
constant (about 21% at low loads to 24% at full load).
• Percentage loss to radiation increases from about 7% at loads or 20%
at full load.
7.9 PERFORMANCE OF CI ENGINES
The performance of a CI engine at constant speed variable load is shown in Figure 7.15.
• As the efficiency of eth CI engine is more than the SI engine the total losses
are less. The coolant loss is more at low loads and radiation, etc. losses are
more at high loads.
• The bmep, bp and torque directly increase with load, as shown in
Figure 7.16. Unlike the SI engine bhp and bmep are continuously raising
curves and are limited only by the load. The lowest brake specific fuel
consumption and hence the maximum efficiency occurs at about 80 percent
of the full load.
Figure 7.17 shows the performance curves of variable speed GM 7850 cc. four cycle V-6
Toro-flow diesel engine. The maximum torque value is at about 70 percent of maximum
speed compared to about 50 percent in the SI engine. Also, the bsfc is low through most
of the speed range for the diesel engine and is better than the SI engine.

99
IC Engine Testing
Radiation etc.
Exhaust
Coolant
Useful work
0
20
40
60
80
100
Engine speed N = 2500 rpm
En
erg
y %
5 10 15 20 25
Brake horsepower
Figure 7.14 : Heat Balance Vs. Load for a Petrol Engine
Radiation, etc.
Exhaust
Useful work
0
20
40
60
80
100
Coolant
Exhaust
10 20 30 40 50
Brake horsepower
En
erg
y %
Engine speed N = 1200 rpm
Figure 7.15 : Heat Balance Vs. Load for a CI Engine
450
400
350
300
250
200
180
8
6
4
2
00 20 40 60 80 100
Engine speed - 1500 rpm
Torque
Exhausttemperature
bsfc
bhe
bmep
Bore - 135 mm
Stroke - 165 mm
Load %
Bra
ke m
ean e
ffective p
ressure
,kg f /cm
2
Bra
ke s
pecific
fuel consum
ption
gm
/ b
hp input
80
60
40
20
200
150
100
50
0
Pow
er
outp
ut, b
hp
Torq
ue, kg/m
700
600
500
400
300
200
Exhaust gas tem
pera
ture
Co
Figure 7.16 : Performance Curves of a Six Cylinder Four-stroke Cycle
Automotive Type CI Engine at Constant Speed

100
Applied Thermal
Engineering
160
120
80
Bra
ke h
ors
epow
er
Torque
bhp
bsfc
45
40
35
kg/m
Engine, rpm
800 2000 3200
40
180
160
140 gm
/bhp-h
r.
Figure 7.17 : Performance Curves of GM-four Cycle Toro-flow Diesel Engine
Example 7.1
A gasoline engine works on Otto cycle. It consumes 8 litres of gasoline per hour
and develops power at the rate of 25 kW. The specific gravity of gasoline is 0.8
and its calorific value is 44000 kJ/kg. Find the indicated thermal efficiency of the
engine.
Solution
Heat liberated at the input
= m Cv
0.8
860 60
= ××
6.4
3600=
Power at the input 6.4
44000 kW3600
= ×
ith
Output power
Input powerη =
25
6.4 44000
3600
=×
25 3600
0.31966.4 44000
×= =
×
or, = 31.96%
Example 7.2
A single cylinder engine operating at 2000 rpm develops a torque of 8 N-m.
The indicated power of the engine is 2.0 kW. Find loss due to friction as the
percentage of brake power.
101
IC Engine Testing Solution
Brake power 2 2 2000 8
60000 60000
π × π × ×= =
NT
= 1.6746 kW
Friction power = 2.0 − 1.6746
= 0.3253
% loss 0.3253
1002
= ×
% loss = 16.2667%
Example 7.3
A diesel engine consumes fuel at the rate of 5.5 gm/sec. and develops a power of
75 kW. If the mechanical efficiency is 85%. Calculate bsfc and isfc. The lower
heating value of the fuel is 44 MJ/kg.
Solution
kW heat input
kW heat outputbsec =
v f
v
C mC bsfc
P
×= = ×
5.55
0.074 g/kWs75
bsfc = =
= 0.074 × 10⁻³
kg/kWs
Cv = 44 MJ/kg = 44 × 103 kJ/kg
bsec = bsfc × Cv = 44 × 103 × 0.074 × 10
−3 = 3.256
isec = bsec × ηn = 3.256 × 0.85
isec = 2.7676.
Example 7.4
Find the air-fuel ratio of a 4-stroke, 1 cylinder, air cooled engine with fuel
consumption time for 10 cc as 20.0 sec. and air consumption time for 0.1 m3 as
16.3 sec. The load is 16 kg at speed of 3000 rpm. Also find brake specific fuel
consumption in g/kWh and thermal brake efficiency. Assume the density of air as
1.175 kg/m3 and specific gravity of fuel to be 0.7. The lower heating value of fuel
is 44 MJ/kg and the dynamometer constant is 5000.
Solution
Air consumption 30.11.175 7.21 10 kg/s
16.3
−= × = ×
Fuel consumption 310 10.7 0.35 10 kg/s
20 1000
−= × × = ×
Air-fuel ratio 3
3
7.21 1020.6
0.35 10
−
−
×= =
×
Power output (P) Dynamometer constant
WN=
16 3000
9.6 kW5000
×= =

102
Applied Thermal
Engineering
Fuel consumption (h/hr)
Power outputbsfc =
30.35 10 3600 1000
9.6
−× × ×=
bsfc = 131.25 g/kWh
3
9.6100
0.35 10 44000−= =
× ×
ηbth = 62.3377
Example 7.5
A six-cylinder, gasoline engine operates on the four-stroke cycle. The bore of each
cylinder is 80 mm and the stroke is 100 mm. The clearance volume per cylinder is
70 cc. At the speed of 4100 rpm, the fuel consumption is 5.5 gm/sec.
[or 19.8 kg/hr.) and the torque developed is 160 Nm.
Calculate : (i) Brake power, (ii) The brake mean effective pressure, (iii) Brake
thermal efficiency if the calorific value of the fuel is 44000 kJ/kg and (iv) The
relative efficiency on a brake power basis assuming the engine works on the
constant volume cycle r = 1.4 for air.
Solution
2 2 4100 16068.66
60000 60000
NTbp
π × π × ×= = =
6000bm
bpP
LAn K
×=
2
68.66 60000
41000.1 (0.08) 6
4 2
×=
π× × × ×
= 6.66 × 10⁵ Pa
Pbm = 6.66 bar
68.66 3600100 29.03%
19.8 43000bth
f v
bp
m C
×η = = × =
× ×
Compression ratio, s d
d
V Vr
V
+=
2 28 10 502.65 cc4 4
sV D Lπ π
= = × × =
502.65 70
70r
+=
r = 8.18
Air-standard efficiency, otto 0.4
1 11 1 0.56858
2.3179(8.18)η = − = − =
Relative efficiency, 0.2903
100 51.109%0.568
relη = × =
bthf v
bp
m Cη =
×

103
IC Engine Testing
119.82 60100
4.444000
10
×= ×
×
ηbth = 37.134%
Volume flow rate of air at intake condition.
3
5
6 287 3005.17 m /min
1 10a
× ×= =
×
Swept volume per minute,
2
4sV D L n K
π=
2 4500(0.1) 0.9 9
4 2
π= × × × ×
= 127.17 m3/min.
Volumetric efficiency, 5.17
100127.17
vη = ×
4.654%vη =
Air-fuel ratio, 6.0
13.640.44
A
F= =
Example 7.6
A gasoline engine is specified to be 4-stroke and four-cylinder. It has a bore of
80 mm and a stroke of 100 mm. On test it develops a torque of 75 Nm when
running at 3000 rpm. If the clearance volume in each cylinder is 60 cc the relative
efficiency with respect to brake thermal efficiency is 0.5 and the calorific value of
the fuel is 42 MJ/kg; determine the fuel consumption in kg/hr. and the brake mean
effective pressure.
Solution
Swept volume, 2 4 30.08 0.1 5.024 10 m /cylinder4
sV−π
= = × = ×
= 502.4 cc/cylinder
Compression ratio502.4 + 60
= 9.37360
=
Air-standard efficiency 0.4
1= 1 = 0.5914
(9.373)−
ηbth = Relative η × Air-standard η
= 0.5 × 0.5914
= 0.2954
2 3000 7523.55 kW
60000bp
× π × ×= =
Heat supplied 23.55
79.64 kJ/s0.2957
= =
Fuel consumption 79.64 3600
6.8264 kg/hr42000
×= =
104
Applied Thermal
Engineering
60000bm
s
PP
V n K
×=
5 2
4
23.55 600004.6875 10 N/m
30005.024 10 4
2
−
×= = ×
× × ×
= 4.6875 bar
Example 7.7
A six-cylinder, four-stroke engine gasoline engine having a bore of 90 mm and
stroke of 100 mm has a compression ratio 8. The relative efficiency is 60%. When
the indicated specific fuel consumption is 3009 g/kWh. Estimate (i) The calorific
value of the fuel and (ii) Corresponding fuel consumption given that imep is
8.5 bar and speed is 2500 rpm.
Solution
Air-standard efficiency 1 0.4
1 1= 1 = 1 = 0.5647
8rr
−− −
Thermal efficiencyRelative efficiency =
Air-standard efficiency
Indicated thermal efficiency = 0.6 × 0.5647 = 0.3388
1
=ithsfc vi C
η×
1 3600
0.3 0.3388v
ith sfc
Ci
= =η × ×
Cv = 35417.035 kJ/kg
=60000
imP LAnKip
5 2 25008.5 10 0.1 0.09 6
4 2 67.6 kW60000
π× × × × × ×
= =
Fuel consumption = isfc × ip = 0.3 × 67.6
ip = 20.28 kg/h.
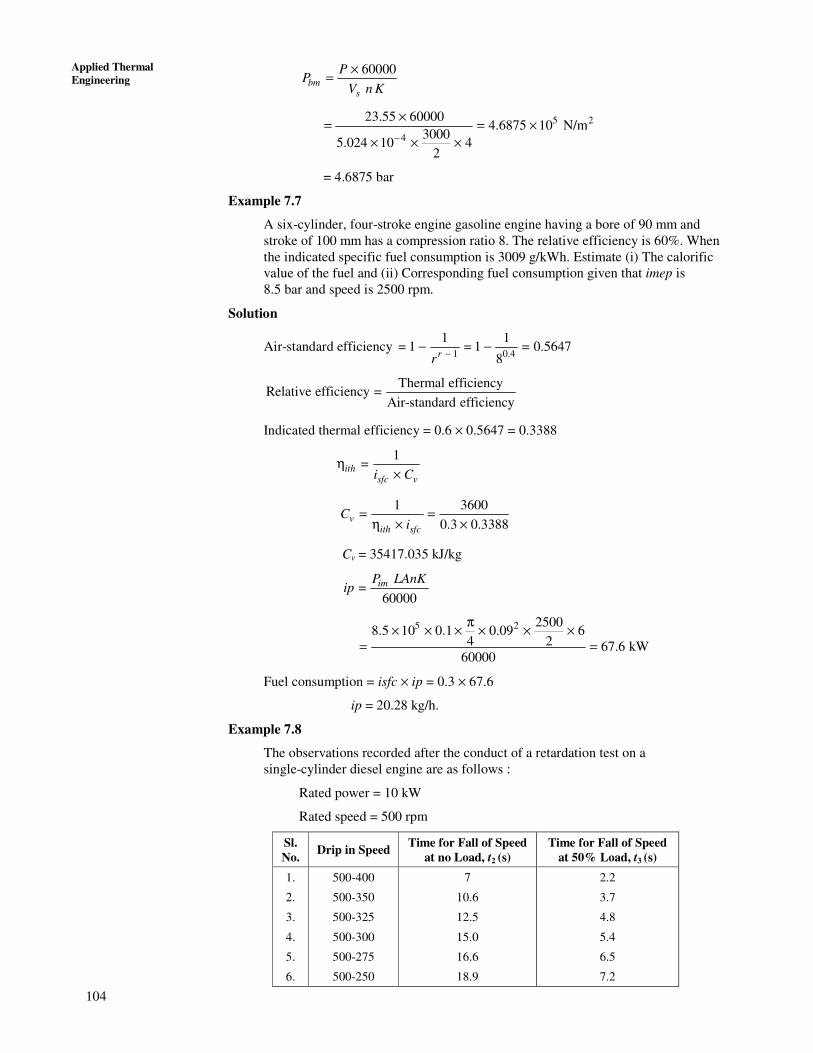
Example 7.8
The observations recorded after the conduct of a retardation test on a
single-cylinder diesel engine are as follows :
Rated power = 10 kW
Rated speed = 500 rpm
Sl.
No. Drip in Speed
Time for Fall of Speed
at no Load, t2 (s)
Time for Fall of Speed
at 50% Load, t3 (s)
1.
2.
3.
4.
5.
6.
500-400
500-350
500-325
500-300
500-275
500-250
7
10.6
12.5
15.0
16.6
18.9
2.2
3.7
4.8
5.4
6.5
7.2

105
IC Engine Testing Solution
First we draw a graph of drop in speed versus time taken for the drop.
300
200
100
010 20 30
time (s)
Dro
p in
sp
ee
d(r
pm
)
50%
load
No
load
t
3.4 8.3
t3 2
Figure 7.18 : Speed Vs Time
2
=60000
π NTP
Full load torque, 60000 10 60000
= 191.083 Nm2 2 500
PT
N
× ×= =
π × π ×
Torque at half load, T1/2 = 95.5415 Nm
From graph :
Time for the fall of 100 rpm at no load, t2 = 8.3 sec.
Time for the fall of same 100 rpm at half load, t3 = 3.4 sec.
3
2 3
=f
tT
t t×
−Torque at 50% load
31/ 2
2 3
3.4= 95.5415 66.294 Nm
(8.3 3.4)
tT
t t× = × =
− −
Friction power 2 2 500 66.294
3.469 kW60000 60000
fN Tπ π × ×= = =
10
100 74.24%10 3.469
m
bp
bp fpη = = × =
+ +
Example 7.9
A 4-cylinder, 4-stroke cycle engine having cylinder diameter 100 mm and stroke
120 mm was tested at 1600 rpm and the following readings were obtained.
Fuel consumption = 0.27 litres/minute, Specific gravity fuel = 0.74,
B.P. = 31.4 kW, Mechanical efficiency = 80%, Calorific value of fuel
= 44000 kJ/kg.
Determine :
(i) bsfc,
(ii) imep, and
(iii) Brake thermal efficiency.
106
Applied Thermal
Engineering
Solution
D = 100 mm = 0.1 m
L = 120 mm = 0.12 m
ηm = 80% = 0.8
(i) Brake Specific Fuel Consumption (bsfc) :
0.27 0.74 60
0.38174 kJ/kW.hr31.4
× ×= =
(ii) Indicated Power :
.2 60
impn P L A NI P
× × × ×=
×
20.12 (0.1) 1600. 4
2 60
imp
m
n PB P
π× × × × ×
=η ×
∴ 31.4
4 0.012566370.8
impP= × ×
∴ Pimep = 780.85 kN/m2
(iii) Brake Thermal Efficiency :
Brake power
Heat suppliedbthη =
31.4
100 21.43%0.27 0.74
4400060
= × =×
×
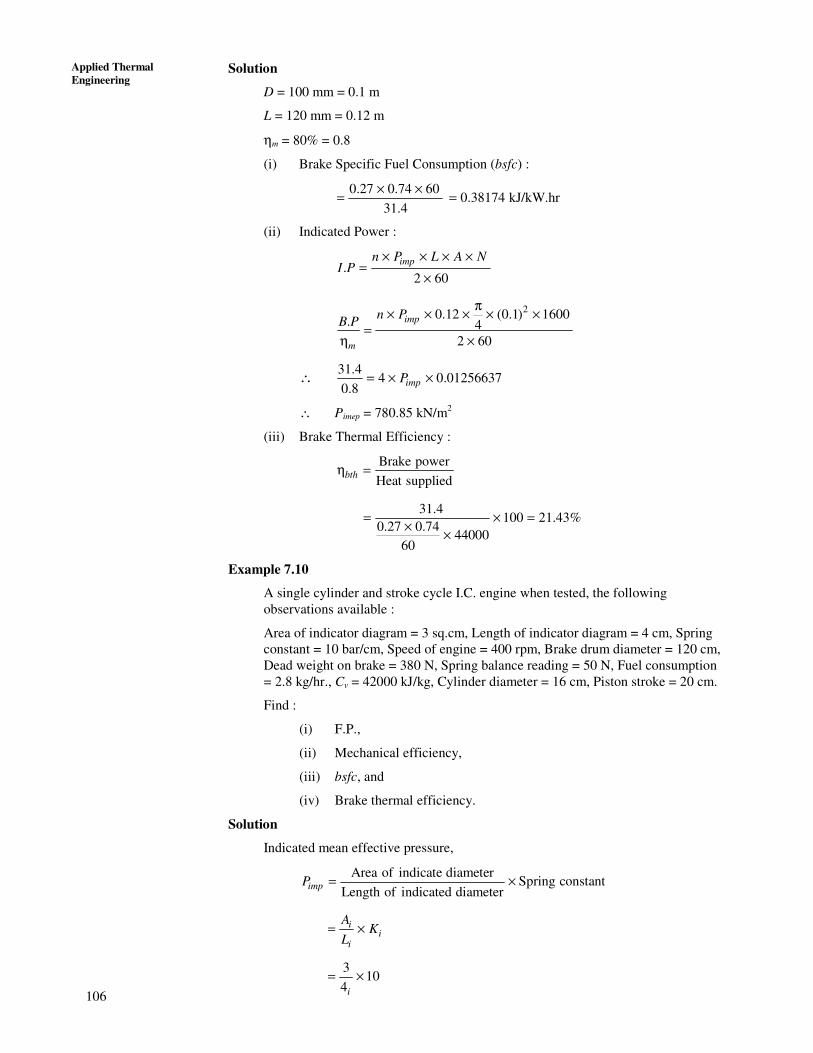
Example 7.10
A single cylinder and stroke cycle I.C. engine when tested, the following
observations available :
Area of indicator diagram = 3 sq.cm, Length of indicator diagram = 4 cm, Spring
constant = 10 bar/cm, Speed of engine = 400 rpm, Brake drum diameter = 120 cm,
Dead weight on brake = 380 N, Spring balance reading = 50 N, Fuel consumption
= 2.8 kg/hr., Cv = 42000 kJ/kg, Cylinder diameter = 16 cm, Piston stroke = 20 cm.
Find :
(i) F.P.,
(ii) Mechanical efficiency,
(iii) bsfc, and
(iv) Brake thermal efficiency.
Solution
Indicated mean effective pressure,
Area of indicate diameter
Spring constantLength of indicated diameter
impP = ×
ii
i
AK
L= ×
3
104i
= ×

107
IC Engine Testing Pimep = 7.5 bar . . . (1)
Indicated power .60
impP L A NI P
× × ×= =
5 27.5 10 0.2 (0.16) 4004 10.05 kW
60 2
π× × × ×
= =×
. . . (2)
Brake Power
2 ( )2 2.
60 60
bN W S
NTB P
π −π
= = =
2 400 (380 50) 1.2
. 8.294 W60 2
B Pπ × −
= × = . . . (3)
(i) Frictional Power = F.P. = I.P. − B.P.
= 10.05 − 8.294
= 1.756 kW
(ii) Mechanical Efficiency . 8.294
100 82.53%. . 10.05
m
B P
I Pη = = × =
(iii) Brake Specific Fuel Consumption (bsfc) :
2.8
0.3376 kg/kW.hr8.294
= =
(iv) Brake Thermal Efficiency (ηbth
)
. 8.294
100 25.39%2.8Heat supplied
420003600
B P= = × =
×
Example 7.11
A six-cylinder 4-stroke petrol engine having a bore of 90 mm and stroke of
100 mm has a compression ratio of 7. The relative efficiency with reference to
indicated thermal efficiency is 55% when indicated mean specific fuel
consumption is 0.3 kg/kWh. Estimate the calorific value of the fuel and fuel
consumption in kg/hr. Given that indicated mean effective pressure is 8.5 bar and
speed is 2500 r.p.m.
Solution
Number of cylinders = n1 = 6, L = 100 mm = 0.1 m
d = 90 mm = 0.09 m, r = 7 (P.U. May 2006)
ηr = 55% = 0.55 [based on indicated thermal efficiency]
isfc = 0.3 kg/kWh
Pmi = 8.5 bar
N = 2500 rpm
1.60000
impP A L NI P n
× × ×= ×
where, 2500
12502 2
Nn = = = strokes/mm [for 4 stroke engine]
2
4A d
π=
108
Applied Thermal
Engineering
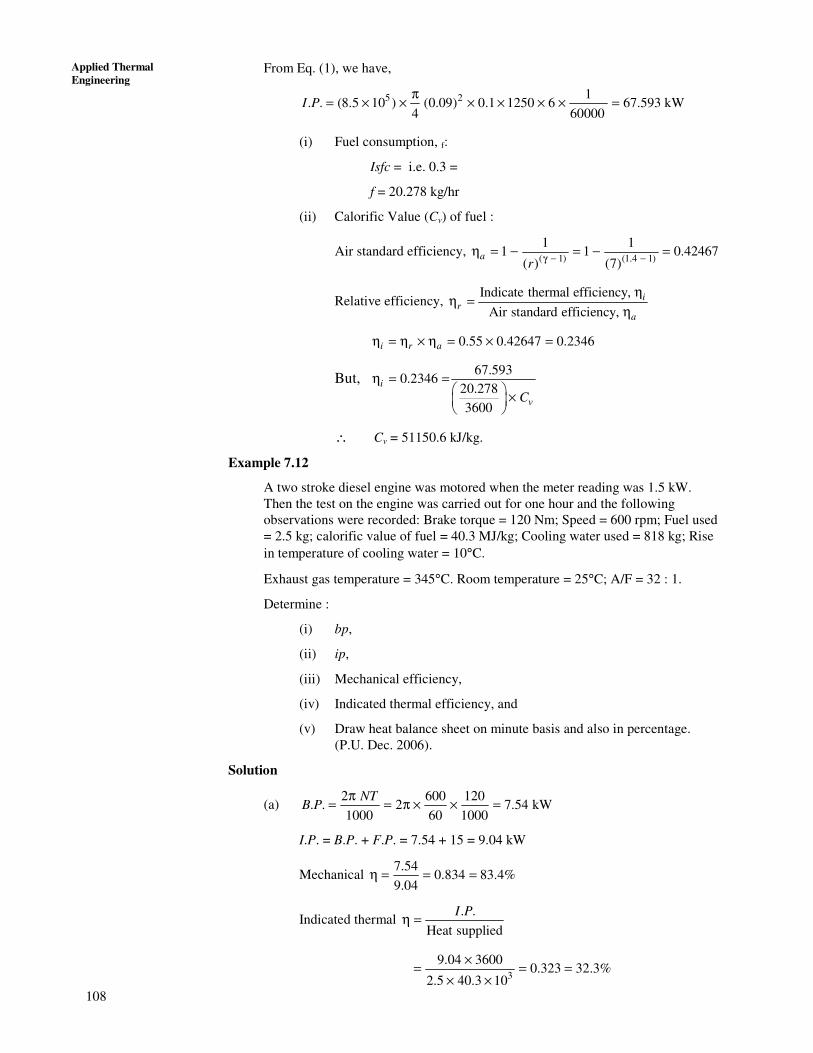
From Eq. (1), we have,
5 2 1. . (8.5 10 ) (0.09) 0.1 1250 6 67.593 kW
4 60000I P
π= × × × × × × =
(i) Fuel consumption, f:
Isfc = i.e. 0.3 =
f = 20.278 kg/hr
(ii) Calorific Value (Cv) of fuel :
Air standard efficiency, ( 1) (1.4 1)
1 11 1 0.42467
( ) (7)a
rγ − −
η = − = − =
Relative efficiency, Indicate thermal efficiency,
Air standard efficiency,
ir
a
ηη =
η
0.55 0.42647 0.2346i r aη = η × η = × =
But, 67.593
0.234620.278
3600
i
vC
η = =
×
∴ Cv = 51150.6 kJ/kg.
Example 7.12
A two stroke diesel engine was motored when the meter reading was 1.5 kW.
Then the test on the engine was carried out for one hour and the following
observations were recorded: Brake torque = 120 Nm; Speed = 600 rpm; Fuel used
= 2.5 kg; calorific value of fuel = 40.3 MJ/kg; Cooling water used = 818 kg; Rise
in temperature of cooling water = 10°C.
Exhaust gas temperature = 345°C. Room temperature = 25°C; A/F = 32 : 1.
Determine :
(i) bp,
(ii) ip,
(iii) Mechanical efficiency,
(iv) Indicated thermal efficiency, and
(v) Draw heat balance sheet on minute basis and also in percentage.
(P.U. Dec. 2006).
Solution
(a) 2 600 120
. . 2 7.54 kW1000 60 1000
NTB P
π= = π × × =
I.P. = B.P. + F.P. = 7.54 + 15 = 9.04 kW
Mechanical 7.54
0.834 83.4%9.04
η = = =
Indicated thermal . .
Heat supplied
I Pη =
3
9.04 36000.323 32.3%
2.5 40.3 10
×= = =
× ×
109
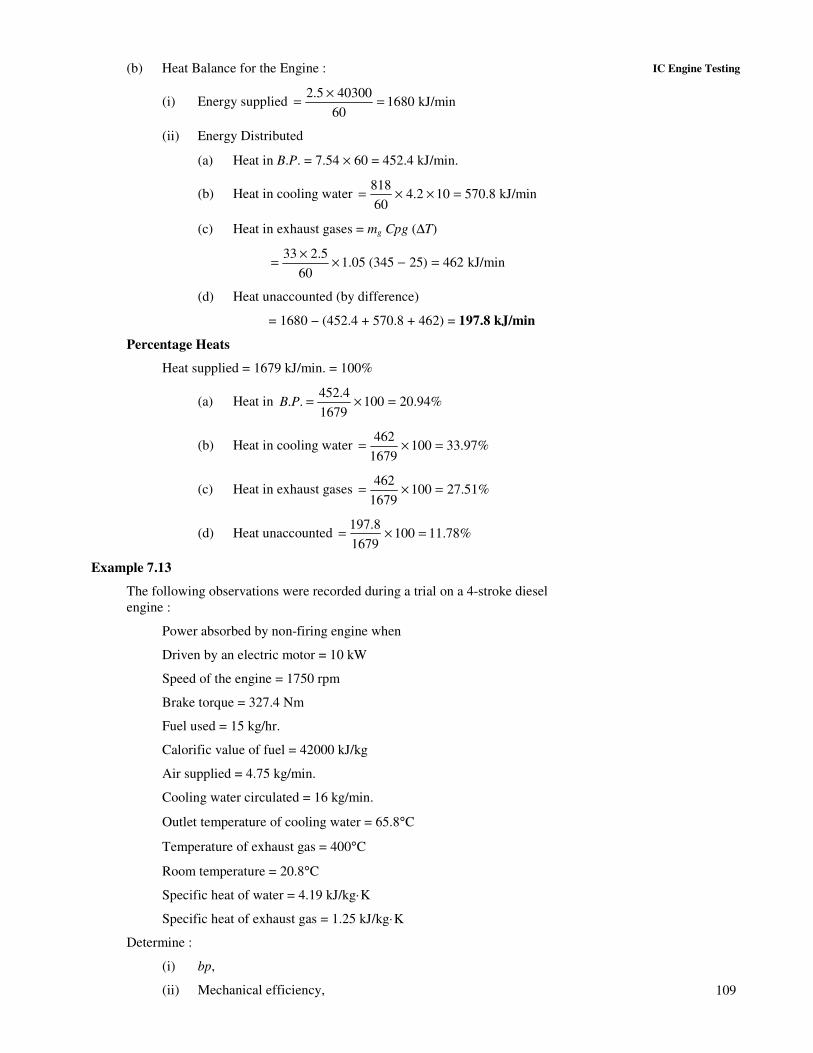
IC Engine Testing (b) Heat Balance for the Engine :
(i) Energy supplied 2.5 40300
1680 kJ/min60
×= =
(ii) Energy Distributed
(a) Heat in B.P. = 7.54 × 60 = 452.4 kJ/min.
(b) Heat in cooling water 818
4.2 10 570.8 kJ/min60
= × × =
(c) Heat in exhaust gases = mg Cpg (∆T)
33 2.5
1.05 (345 25) 462 kJ/min60
×= × − =
(d) Heat unaccounted (by difference)
= 1680 − (452.4 + 570.8 + 462) = 197.8 kJ/min
Percentage Heats
Heat supplied = 1679 kJ/min. = 100%
(a) Heat in 452.4
. . 100 20.94%1679
B P = × =
(b) Heat in cooling water 462
100 33.97%1679
= × =
(c) Heat in exhaust gases 462
100 27.51%1679
= × =
(d) Heat unaccounted 197.8
100 11.78%1679
= × =
Example 7.13
The following observations were recorded during a trial on a 4-stroke diesel
engine :
Power absorbed by non-firing engine when
Driven by an electric motor = 10 kW
Speed of the engine = 1750 rpm
Brake torque = 327.4 Nm
Fuel used = 15 kg/hr.
Calorific value of fuel = 42000 kJ/kg
Air supplied = 4.75 kg/min.
Cooling water circulated = 16 kg/min.
Outlet temperature of cooling water = 65.8°C
Temperature of exhaust gas = 400°C
Room temperature = 20.8°C
Specific heat of water = 4.19 kJ/kg·K
Specific heat of exhaust gas = 1.25 kJ/kg·K
Determine :
(i) bp,
(ii) Mechanical efficiency,

110
Applied Thermal
Engineering
(iii) bsfc,
(iv) Draw up heat balance sheet on kW basis.
Solution
(i) Brake Power (b.p.) :
31750. . 2 2 327.4 10 60.01 kW
60b p NT
−= π = × π × × × =
(ii) Mechanical Efficiency (ηm) :
. .
. .m
b p
i pη =
But, i.p. = b.p. + f.p.
f.p. = 10 kW
Given that power absorbed by non-firing engine when driven by electric
motor. This is frictional power.
This type of testing is done in a motoring test which is used to calculate the
frictional power of an engine.
Hence, f.p. = 10 kW
∴ i.p. = b.p. + f.p.
= 60.01 + 10
∴ i.p. = 70.01 kW
∴ 60.01
0.8571 85.71%70.01
mη = = =
(iii) bsfc : Brake Specific Fuel Consumption :
∴ / . 15
0.25 kg/kW.hr. . 60.01
f hrmbsfc
b p= = =
(iv) Heat Balance Sheet in kW basis :
(i) Power supplied by fuel = mf × Cv
15
42000 175 kW3600
= × =
(ii) Brake power = 60.01 kW
(iii) Power to cooling water = mw Cpw ∆T
16
4.19 ( )60
o inT T= × × −
To = 65.8 + 273 = 338.8 K
Tin = 20.8 + 273 = 293.8 K
Power lost to cooling water = 50.28 kW
(iv) Power to exhaust = mE CPE ∆T
Here, mass of exhaust gases
mE = ma + mf
4.75 15
0.0833 kg/s60 3600
= + =
111
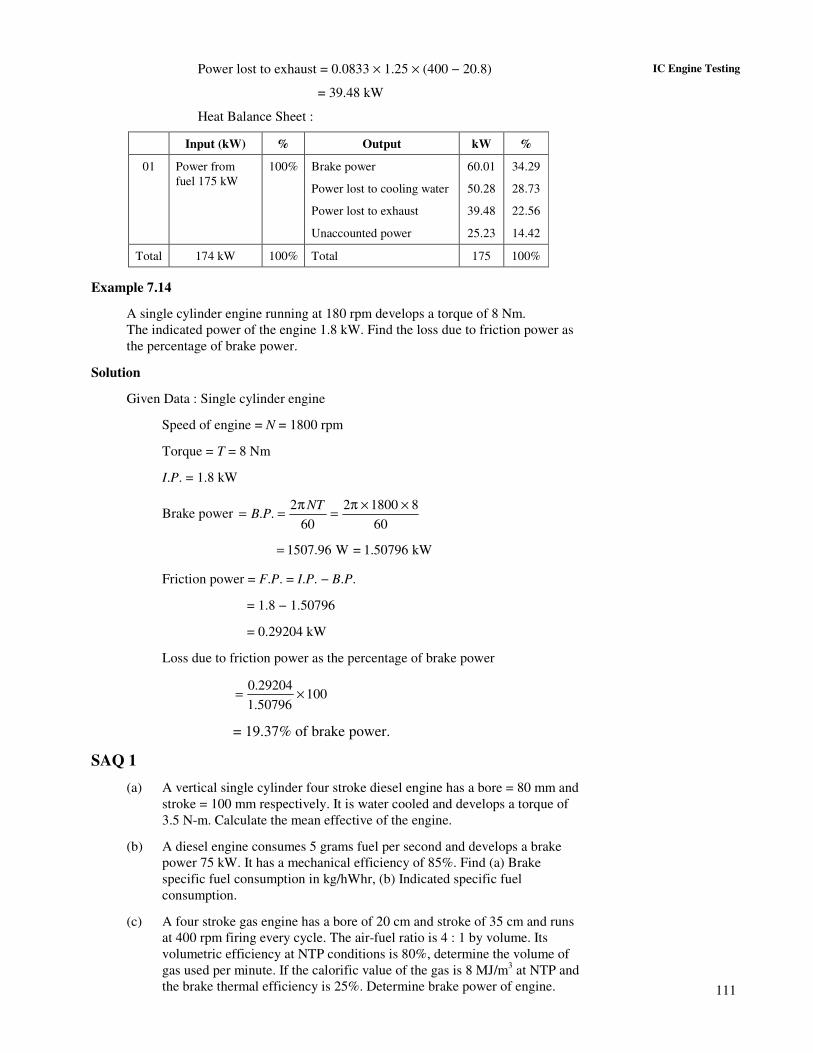
IC Engine Testing Power lost to exhaust = 0.0833 × 1.25 × (400 − 20.8)
= 39.48 kW
Heat Balance Sheet :
Input (kW) % Output kW %
01 Power from
fuel 175 kW
100% Brake power
Power lost to cooling water
Power lost to exhaust
Unaccounted power
60.01
50.28
39.48
25.23
34.29
28.73
22.56
14.42
Total 174 kW 100% Total 175 100%
Example 7.14
A single cylinder engine running at 180 rpm develops a torque of 8 Nm.
The indicated power of the engine 1.8 kW. Find the loss due to friction power as
the percentage of brake power.
Solution
Given Data : Single cylinder engine
Speed of engine = N = 1800 rpm
Torque = T = 8 Nm
I.P. = 1.8 kW
Brake power 2 2 1800 8
. .60 60
NTB P
π π × ×= = =
1507.96 W = 1.50796 kW=
Friction power = F.P. = I.P. − B.P.
= 1.8 − 1.50796
= 0.29204 kW
Loss due to friction power as the percentage of brake power
0.29204
1001.50796
= ×
= 19.37% of brake power.
SAQ 1
(a) A vertical single cylinder four stroke diesel engine has a bore = 80 mm and
stroke = 100 mm respectively. It is water cooled and develops a torque of
3.5 N-m. Calculate the mean effective of the engine.
(b) A diesel engine consumes 5 grams fuel per second and develops a brake
power 75 kW. It has a mechanical efficiency of 85%. Find (a) Brake
specific fuel consumption in kg/hWhr, (b) Indicated specific fuel
consumption.
(c) A four stroke gas engine has a bore of 20 cm and stroke of 35 cm and runs
at 400 rpm firing every cycle. The air-fuel ratio is 4 : 1 by volume. Its
volumetric efficiency at NTP conditions is 80%, determine the volume of
gas used per minute. If the calorific value of the gas is 8 MJ/m3 at NTP and
the brake thermal efficiency is 25%. Determine brake power of engine.
112
Applied Thermal
Engineering
(d) The following readings are taken during a test of a four-cylinder, two stroke
gasoline engine. Diameter = 10 cm, Stroke = 15 cm, Speed = 1700 rpm,
Area of positive loop of the indicator diagram = 5.75 sq.cm; Area of the
negative loop of the indicator diagram = 0.25 cm2; Length of indicator
diagram = 5.5 cm, Spring constant = 4.0 bar/cm. Find the indicated power
of the engine.
(e) A four cylinder engine running at 1250 rpm delivers 21 kW power. The
average torque when one cylinder was cut is 110 N-m. The calorific value
of the fuel is 43 MJ/hr. The engine uses 360 gms of gasoline per kWh. Find
indicated thermal efficiency.
SAQ 2
(a) An 8-cylinder, four stroke engine of bore 10 cm and 9 cm stroke has a
compression ratio of 7 is 4500 rpm on a dynamometer which has 54 cm
arm. During a 10 minutes test the dynamometer scale beam reading was
48 kg and the engine consumed 4.4 kg of gasoline having a calorific value
of 44000 kJ/kg. Air at 27°C temperature and 1 bar pressure was supplied to
the carburetor at the rate of 6 kg/min. Find (i) the brake power delivered.
(ii) The brake mean effective pressure, (iii) The brake specific fuel
consumption, (iv) The brake specific air consumption, (v) The brake
thermal efficiency, (vi) The volumetric efficiency, (vii) The air-fuel ratio.
(b) In a test for four-cylinders, four-stroke engine has a diameter of 100 mm,
stroke = 120 mm, speed of engine = 1800 rpm, fuel consumption of
0.2 kg/min, calorific value of fuel is 44000 kJ/kg. Difference in tension on
either side of brake pulley = 40 kg, Brake circumference is 300 cm. If the
mechanical efficiency is 90%. Calculate (i) Brake-thermal efficiency,
(ii) Indicated thermal efficiency, (iii) Indicated mean effective pressure and
(iv) Brake specific fuel consumption.
(c) A 4-stroke cycle gas engine has a bore of 20 cm and a stroke of 35 cm.
The compression ratio is given to be 8. In a test on the engine the indicated
mean effective pressure is 5 bar, the air to gas ratio is 6 : 1 and the calorific
value of the gas is 12 MJ/m3 at NTP. At the beginning of the compression
stroke the temperature is 77°C and pressure is 0.98 bar. Neglecting residual
gases, determine the indicated power, the thermal efficiency and the relative
efficiency of the engine at 250 rpm.
(d) An indicator diagram taken from a single-cylinder, four-stroke CI engine
has a length of 100 mm and an area 2000 mm2. The indicator pointer
deflects a distance of 10 mm for pressure increment of 2 bar in the cylinder.
If the bore and stroke of the engine cylinder are both 100 mm and the
engine speed is 1200 rpm. Calculate the mean effective pressure and the
indicated power. If the mechanical efficiency is 85%. What is the brake
power developed?
(e) A gasoline engine working on 4-stroke develops a brake power of 22 kW.
A Morse test was conducted on this engine and the brake power (kW)
obtained when each cylinder was made inoperative by short circuiting. The
spark plugs are 14.9, 14.3, 14.8 and 14.5 respectively. The test was
conducted at constant speed. Find the indicated power, mechanical
efficiency and bmep when all the cylinders are firing. The bore of engine is
80 mm and stroke is 90 mm. The engine is running at 3000 rpm.

113
IC Engine Testing 7.10 SUMMARY
Let us summarise what we have learnt in this unit. In this unit, we have understood in
detail about IC engine testing. In evaluation of engine performance, certain basic
parameters, we chosen and we studies about measurement of fuel consumption, air
consumption, etc. Measurements of exhaust smoke as well as exhaust emission where
also highlighted. Lastly performance of SI engine and CI engine were discussed.
7.11 KEY WORDS
Engine Performance : It is a indication of the degree of success with
which it does its assigned job, i.e. conversion of
chemical energy contained in the fuel into the
useful mechanical work.
Power : Power is defined as the rate of doing work.
Indicated Power : The total power developed by combustion of fuel
in the combustion chamber.
Mean Effective Pressure : It is defined as hypothetical pressure which is
thought to be acting on the piston throughout the
power stroke.
Volumetric Efficiency : It is defined as the ratio of actual volume to the
charge drawn in during the suction stroke to the
swipt volume of the piston.
Fuel Air Ratio : It is the ratio of the mass of fuel to the mass of air
in the fuel air mixture.
7.12 ANSWERS TO SAQs
SAQ 1
(a) 2
60000 60000
bm nP LANTP
π= =
22
2 2 16
4 2
bmn
NT NT TP
NLA D LL D
π π= = =
π× ×
5
2
16 22.55.875 10 Pa
(0.08) 0.1
×= = ×
×
= 5.875 bar
45
2
6 1010 bar
4 2
bm
PP
ND L
−× ×= =
π
5
2
4 6000010
1500(0.08) 0.1
4 2
−×= ×
π× × ×
4 5
2
24 10 4 2 106.369 bar
(0.08) 0.1 1500
−× × × ×= =
π × × ×

114
Applied Thermal
Engineering
460000 4 6 1025.477 Nm
2 2 3.14 1500
PT
N
× × ×= = =
π × ×
(b) 5
0.066 g/kWs75
fmbsfc
pb= = =
0.066
3600 0.24 kg/kWh1000
g= × =
misfc bsfc= × η
0.24 0.85 0.204 kg/kWh= × =
(c) Swept volume, 2
4sV D L
π=
220 254
π= × ×
= 7853.93 cc
Total charge taken in per cycle
0.8 7853.98cV = ×
= 6.2832 × 10⁻³
m3
Volume of gas used per minute
36.2832 10 400
4 1 2gV
−×= ×
+
= 0.25133 m3 at NTP/min.
Heat input = 8000 × 0.25133 = 2010.64 kJ/min
th Heat inputbp = η ×
0.25 2010.64
60
×=
bp = 8.377 kW
(d) Net area of diagram = 5.75 − 0.25
= 5.5 cm2
Average height of the diagram 5.5
1 cm5.5
= =
Pim = Average height of the diagram × spring constant
= 1 × 4 = 4 bar
60000
= im nP L Aip
5 24 10 0.15 0.1 1700 44
60000
π× × × × × ×
=
ip = 53.38 kW.

115
IC Engine Testing (e) Average bp for 3 cylinders
2
60000
NTπ=
2 1250 110
60000
π × ×=
= 14.39 kW
Average ip with 1 cylinder = 21 − 14.39
= 6.608 kW
Total input = 4 × 6.608 = 26.433 kW
21
36026.433
bpisfc bsfc
ip= × = ×
= 286.006 ≈ 286 g/kWh
Fuel combustion 3600 1000
isfc ip×=
×
286 26.433
3600 1000
×=
×
= 2.099 × 10⁻³
kg/sec.
ithf v
ip
m Cη =
×
3
26.433100
2.009 10 43000−= ×
× ×
ηith = 29.29%
SAQ 2
(a) 2 2 4500 48 0.54 9.81
119.82 kW60000 60000
NTbp
π π × × × ×= = =
5
2
6000 119.82 600005.653 10 Pa
45000.09 (0.1) 8
4 2
mep
bpb
LAn K
× ×= = = ×
π× × ×
bmep = 5.653 bar
4.460
10
119.82bsfc
×
=
bfsc = 0.2203 kg/kWh
6 603.004 kg/kWh
119.82bsfc
×= =
(b) 2 2 2
60000 60000 60000
NT NWR WN Rbp
π π π= = =
40 9.81 1800 3
35.316 kW60000
× × ×= =
35.316 60100 24.079%
0.2 44000bth
f v
bp
m C
×η = × × =
× ×

116
Applied Thermal
Engineering
24.079100 100 26.75%
0.9
bthith
m
ηη = × = × =
η
5
2
35.3166000 600000.8 6.94 10 Pa
18000.12 (0.1) 4
4 2
m
bp
imepLAn K
× ×η
= = = ×π
× × ×
imep = 6.94 bar
0.2 600.339 kg/kWh
35.316sfcb
×= =
(c) Swept volume, 2 220 35 10990 cc4 4
sV D Lπ π
= = × × =
Volume of gas in cylinder 1
1
1
VA
F
= ×
+
1
8 1 810990
1 5 8 1 5
ss s
VV V V
r= + = = × ×
− +
Since, the residual gases are to be neglected; one can assume a volumetric
efficiency of 100%.
Normal pressure = 1 bar
1 1
1 WorkingNTP
P VPV
T T
=
Volume of gas at NTP condition 273
1953.7 0.98 1493.4 cc350
= × × =
Heat added = 1493.4 × 10−6
× 12 × 103
= 17.92 kJ/cycle
5 6 2505 10 10990 10
2 11.44 kW60000 60000
im sP Vip
−× × × ×× η
= = =
100Heat added (in kW)
ith
ipη = ×
11.44
100 30.66%250
17.922 60
= × =
××
Air-standard efficiency 0.4
11 0.5647
8= − =
Relative efficiency 0.3066
100 54.29%0.5467
= × =
(d) Mean height of the indicator diagram 2000
20 mm100
= =
Mean effective pressure 20
2 4 bar10
= × =

117
IC Engine Testing Indicated power,
60000
imP LAnip =
5 2 12004 10 0.1 0.1
4 2 3.14 kW60000
π× × × × ×
= =
3.14 0.85 2.669 kWmbp ip= × η = × =
(e) ip1 = bp1234 − bp234
= 22 − 14.9 = 7.1 kW
ip2 = bp1224 − bp134
= 22 − 14.3 = 7.7 kW
ip3 = bp1234 − bp124
= 22 − 14.8 = 7.2 kW
ip4 = bp1234 − bp123
= 22 − 14.5 = 7.5 kW
ip1 + ip2 + ip3 + ip4 = ip1234 = 7.1 + 7.7 + 7.2 + 7.5
= 29.5 kW
22= 100 74.57
29.5wη × =
60000=bm
bpP
AnK
×
∠
5
2
22 600004.8665 10 Pa
30000.09 (0.08) 4
4 2
×= = ×
π× × × ×
Pbm = 4.8655 bar.
Related Documents