m.openup.org/1/6-5-7-2 Unit 5, Lesson 7: Using Diagrams to Represent Multiplication Let’s use area diagrams to find products. 7.1: Estimate the Product For each of the following products, choose the best estimate of its value. Be prepared to explain your reasoning. 1. 1.40 14 140 2. 5.6 56 560 3. 1.66 16.6 166 4. 6.5 65 650 7.2: Connecting Area Diagrams to Calculations with Whole Numbers 1. Here are three ways of finding the area of a rectangle that is 24 units by 13 units. ◦ ◦ ◦ ◦ ◦ ◦ ◦ ◦ ◦ ◦ ◦ ◦ GRADE 6 MATHEMATICS NAME DATE PERIOD Unit 5: Arithmetic in Base Ten Lesson 7: Using Diagrams to Represent Multiplication 1

Welcome message from author
This document is posted to help you gain knowledge. Please leave a comment to let me know what you think about it! Share it to your friends and learn new things together.
Transcript

m.openup.org/1/6-5-7-2
Unit 5, Lesson 7: Using Diagrams to RepresentMultiplicationLet’s use area diagrams to find products.
7.1: Estimate the Product
For each of the following products, choose the best estimate of its value. Be prepared toexplain your reasoning.
1.
1.4014140
2.
5.656560
3.
1.6616.6166
4.
6.565650
7.2: Connecting Area Diagrams to Calculations with WholeNumbers
1. Here are three ways of finding the area of a rectangle that is 24units by 13 units.
◦◦◦
◦◦◦
◦◦◦
◦◦◦
GRADE 6 MATHEMATICS
NAME DATE PERIOD
Unit 5: Arithmetic in Base Ten Lesson 7: Using Diagrams to RepresentMultiplication
1

GRADE 6 MATHEMATICS
NAME DATE PERIOD
Unit 5: Arithmetic in Base Ten Lesson 7: Using Diagrams to RepresentMultiplication
2

Discuss with your partner:
a. What do the diagrams have in common? How are they alike?
b. How are they different?
c. If you were to find the area of a rectangle that is 37 units by 19 units, which ofthe three ways of decomposing the rectangle would you use? Why?
2. You may be familiar with different ways to write multiplication calculations. Here aretwo ways to calculate 24 times 13.
Discuss with your partner:
a. In Calculation A, how are each of the partial products obtained? For instance,where does the 12 come from?
b. In Calculation B, how are the 72 and 240 obtained?
c. Look at the diagrams in the first question. Which diagram corresponds toCalculation A? Which one corresponds to Calculation B?
d. How are the partial products in Calculation A and the 72 and 240 in Calculation Brelated to the numbers in the diagrams?
GRADE 6 MATHEMATICS
NAME DATE PERIOD
Unit 5: Arithmetic in Base Ten Lesson 7: Using Diagrams to RepresentMultiplication
3

3. Use the two following methods to find the product of 18 and 14, then compare thevalues obtained.
b. Here is a rectangle that is 18 units by 14 units. Find its area, in square units bydecomposing it. Show your reasoning.
4. Compare the values of that you obtained using the two methods. If they arenot the same, check your work.
a. Calculate numerically.
GRADE 6 MATHEMATICS
NAME DATE PERIOD
Unit 5: Arithmetic in Base Ten Lesson 7: Using Diagrams to RepresentMultiplication
4

m.openup.org/1/6-5-7-37.3: Connecting Area Diagrams to Calculations withDecimals
1. You can use area diagrams to represent products of decimals.Here is an area diagram that represents .
c. Find the value of . Show your reasoning.
2. Here are two ways of calculating . Analyze the calculations and discussthe following questions with a partner.
a. In Calculation A, where does the 0.12 and other partial products come from? InCalculation B, where do the 0.72 and 2.4 come from?
b. In each calculation, why are the numbers below the horizontal line alignedvertically the way they are?
a. Find the region thatrepresents .Label it with its area of 0.12.
b. Label each of the otherregions with theirrespective areas.
GRADE 6 MATHEMATICS
NAME DATE PERIOD
Unit 5: Arithmetic in Base Ten Lesson 7: Using Diagrams to RepresentMultiplication
5

3. Find the product of by drawing and labeling an area diagram. Show yourreasoning.
4. Show how to calculate using numbers without a diagram. Be prepared toexplain your reasoning. If you are stuck, use the examples in a previous question tohelp you.
Are you ready for more?
How many hectares is the property of your school? How many morgens is that?
7.4: Using the Partial Products Method
1. Label the area diagram to represent and to find that product.
a. Decompose each number into its base-ten units (ones, tenths, etc.) and writethem in the boxes on each side of the rectangle.
b. Label Regions A, B, C, and D with their areas. Show your reasoning.
GRADE 6 MATHEMATICS
NAME DATE PERIOD
Unit 5: Arithmetic in Base Ten Lesson 7: Using Diagrams to RepresentMultiplication
6
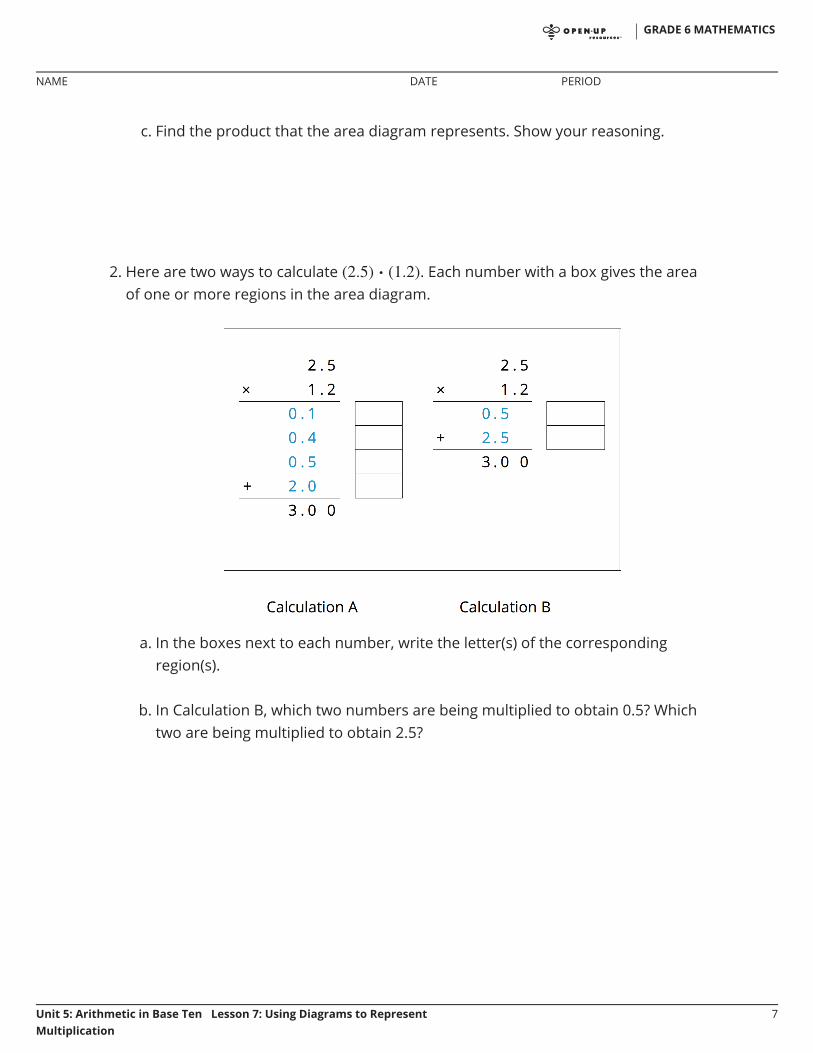
c. Find the product that the area diagram represents. Show your reasoning.
2. Here are two ways to calculate . Each number with a box gives the areaof one or more regions in the area diagram.
a. In the boxes next to each number, write the letter(s) of the correspondingregion(s).
b. In Calculation B, which two numbers are being multiplied to obtain 0.5? Whichtwo are being multiplied to obtain 2.5?
GRADE 6 MATHEMATICS
NAME DATE PERIOD
Unit 5: Arithmetic in Base Ten Lesson 7: Using Diagrams to RepresentMultiplication
7

Lesson 7 Summary
Suppose that we want to calculate the product of two numbers that are written in baseten. To explain how, we can use what we know about base-ten numbers and areas ofrectangles.
Here is a diagram of a rectangle whose side lengths are 3.4 units and 1.2 units. Its area, insquare units, is the product
. To calculate this product and find the area of the rectangle, we candecompose each side length into its base-ten units, and
, decomposing the rectangle into four smaller sub-rectangles.
We can rewrite the product and expand it twice:
In the last expression, each of the four terms is called a partial product. Each partialproduct gives the area of a sub-rectangle in the diagram. The sum of the four partialproducts gives the area of the entire rectangle.
We can show the horizontal calculations above as two vertical calculations.
GRADE 6 MATHEMATICS
NAME DATE PERIOD
Unit 5: Arithmetic in Base Ten Lesson 7: Using Diagrams to RepresentMultiplication
8

GRADE 6 MATHEMATICS
NAME DATE PERIOD
Unit 5: Arithmetic in Base Ten Lesson 7: Using Diagrams to RepresentMultiplication
9

The vertical calculation on the left is an example of the partial products method. Itshows the values of each partial product and the letter of the corresponding sub-rectangle. Each partial product gives an area:
A is 0.2 unit by 0.4 unit, so its area is 0.08 square unit.B is 3 unit by 0.2 unit, so its area is 0.6 square unit.C is 0.4 unit by 1 unit, so its area is 0.4 square unit.D is 3 units by 1 unit, so its area is 3 square units.The sum of the partial products is , so the area of the rectangle is4.08 square units.
The calculation on the right shows the values of two products. Each value gives acombined area of two sub-rectangles:
The combined regions of A and B have an area of 0.68 square units; 0.68 is the valueof .The combined regions of C and D have an area of 3.4 square units; 3.4 is the value of
.The sum of the values of two products is , so the area of the rectangle is4.08 square units.
•••••
•
•
•
GRADE 6 MATHEMATICS
NAME DATE PERIOD
Unit 5: Arithmetic in Base Ten Lesson 7: Using Diagrams to RepresentMultiplication
10

Unit 5, Lesson 7: Using Diagrams to RepresentMultiplication
1. Here is a rectangle that has been partitioned into four smaller rectangles.
2. Here is an area diagram that represents .
b. What is the area of the 3.1 by 1.4 rectangle?
3. Draw an area diagram to find . Label and organize your work so that it can be followedby others.
4. Find each product. Show your reasoning.
For each expression, choose a sub-rectangle whose area, in square units,matches the expression.
a.b.c.d.
a. Find the areas of sub-rectangles Aand B.
GRADE 6 MATHEMATICS
NAME DATE PERIOD
Unit 5: Arithmetic in Base Ten Lesson 7: Using Diagrams to RepresentMultiplication
1

5. Complete the calculations so that each shows the correct sum or difference.
(from Unit 5, Lesson 3)
6. Diego bought 12 mini muffins for $4.20.
a. b.
a. At this rate, how much would Diego pay for4 mini muffins?
b. How many mini muffins could Diego buywith $3.00? Explain or show your reasoning.If you get stuck, consider using the table.
number ofmini muffins
price indollars
12 4.20
GRADE 6 MATHEMATICS
NAME DATE PERIOD
Unit 5: Arithmetic in Base Ten Lesson 7: Using Diagrams to RepresentMultiplication
2

(from Unit 2, Lesson 12)
GRADE 6 MATHEMATICS
NAME DATE PERIOD
Unit 5: Arithmetic in Base Ten Lesson 7: Using Diagrams to RepresentMultiplication
3
Related Documents


![WELCOME [stjohnscollege.edu.in] · presenting numeric data through Pictograms, Cartograms, Bar Diagrams & Pie Diagrams etc. It is the most attractive and appealing way to represent](https://static.cupdf.com/doc/110x72/608d0c25a1be2d7edf31f2e2/welcome-presenting-numeric-data-through-pictograms-cartograms-bar-diagrams.jpg)