UNIT 3: Waste Management 4/24/07

UNIT 3: Waste Management 4/24/07. Waste management Nothing can ever be “thrown away” In the US, urban areas produce 640 million kg of solid waste each.
Dec 18, 2015
Welcome message from author
This document is posted to help you gain knowledge. Please leave a comment to let me know what you think about it! Share it to your friends and learn new things together.
Transcript

UNIT 3:Waste Management
4/24/07

Waste management
• Nothing can ever be “thrown away”
• In the US, urban areas produce 640 million kg of solid waste each day– =1.6 sq. km of land to a depth of 3 m.

Waste management
• Three basic approaches:– A) dilute and disperse– B) concentrate and contain– C) reduce, recycle and reuse
Integrated waste management:Complex management strategies including source
reduction, recycling, composting, landfill, incineration that is designed for the specific needs of communities and environments

Waste management
Types of waste:1) Sewage
2) “normal” solid waste
3) Hazardous chemical waste & radioactive waste that cannot be disposed of in Class III landfills

Wastewater TreatmentWastewater TreatmentMimics natural processes in wetlands
1) Remove solids2) Digest organic matter through
Aerobic bacteriaAnaerobic bacteria
3) Wetland plants trap and concentrate pollutants
4) Sediment provides natural filters5) Also provides a habitat

Basically a four-step process
1) settle the solids
2) let bacteria consume the organic waste
3) filter
4) disinfect (possibly)

Wastewater TreatmentWastewater Treatment• Rural areas:
– Septic tank disposal systems
• Urban areas:– Centralized water-treatment plants &
sewer system• Primary treatment• Secondary treatment• Advanced treatment


Primary Wastewater Treatment
Removes about 30-40% of pollutantsA. Screening
Removes grit (stones, sand, large particles)
B. SedimentationRemaining particulate matter settles out to form a
mud called “sludge”
C. Discharge or go on to next stage of treatment

Secondary Treatment
• Removes 90% of pollutants
A. Waste water pumped through an Aeration tankAerobic bacteria digest more organics
B. Sedimentation TankMore sludge settles out
Sludge sent to a digesterAnerobic bacteria digest more organics
Methane produced

Secondary Treatment
C. Disinfection of wastewaterChlorineOzone
D. Discharge into surface waters or disposal wells or on to Advanced Treatment
Note: Secondary does NOT remove all nutrients, heavy metals, solvents and pesticides

Advanced Treatment
• Removes 95% of the pollutants• Targets nutrients, heavy metals, and synthetic
chemicals• Treated wastewater can be used as reclaimed water• Techniques vary:
– Filters– Chemical treatment


Where does the sludge go?Where does the sludge go?• 50-100 grams per person per day• Sludge handling/disposal accounts for 25-50% of the cost
– Sludge treatment:-
• Convert organics to a stable form• Remove liquid to reduce volume• Destroy harmful organisms• Produce useful byproducts
– soil

Sewage Treatment Sewage Treatment in San Diego & The in San Diego & The
International BorderInternational Border
San Diego System:
2 million people
over 550 square miles
190 million gallons a day
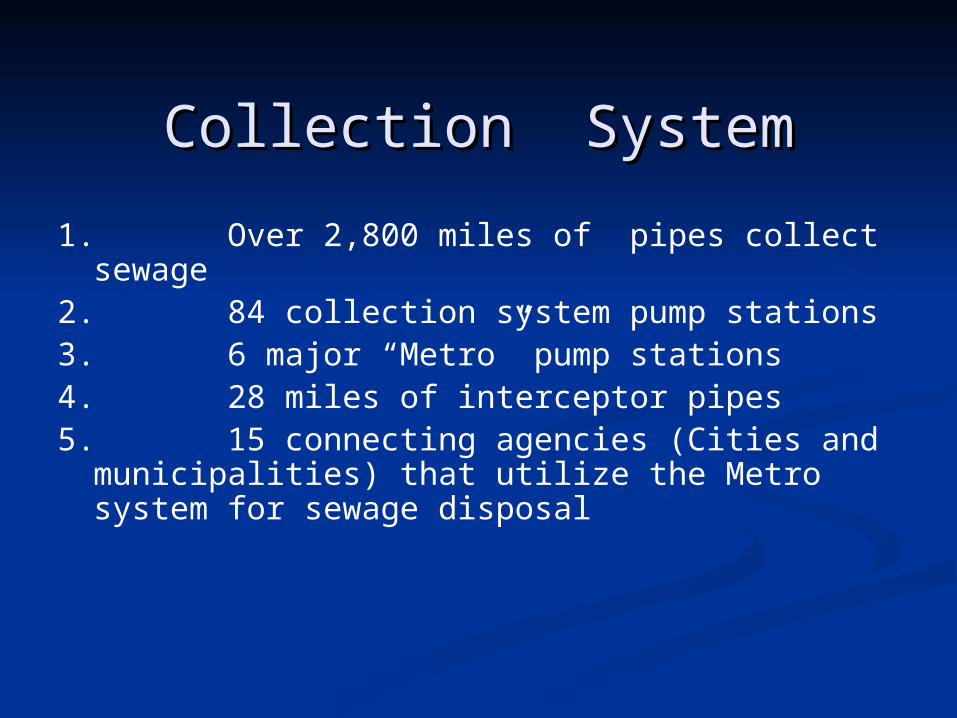
Collection SystemCollection System
1. Over 2,800 miles of pipes collect sewage2. 84 collection system pump stations3. 6 major “Metro” pump stations4. 28 miles of interceptor pipes5. 15 connecting agencies (Cities and municipalities) that
utilize the Metro system for sewage disposal

Treatment System
1. Point Loma Treatment Plant (Advanced Primary treatment) 240 MGD Capacity.
2. North City Water Reclamation Plant, 30 MGD
3. South Bay Water Reclamation Plant, 15 MGD
4. San Pasqual Aqua Culture Plant, 1 MGD
5. Metro Biosolids Center. (Biosolids/Sludge processing)

QuickTime™ and aTIFF (Uncompressed) decompressor
are needed to see this picture.

Point Loma Point Loma Wastewater Wastewater
Treatment PlantTreatment Plant
QuickTime™ and aTIFF (Uncompressed) decompressor
are needed to see this picture.
QuickTime™ and aTIFF (Uncompressed) decompressor
are needed to see this picture.

SAN DIEGO AREA SEWERAGE HISTORYSAN DIEGO AREA SEWERAGE HISTORY
1935: discharging nine million gallons of raw sewage through 22 outfalls. Nine of these empty into San Diego Bay.
1943 :first primary treatment plant at 32nd Street and Harbor Drive with a capacity of 14 million gallons a day (MGD).
1950: Original 32nd Street expanded to 40 MGD capacity. Pollution in San Diego Bay continues

SAN DIEGO AREA SEWERAGE HISTORYSAN DIEGO AREA SEWERAGE HISTORY
1960:Water pollution in San Diego caused by sewage worst ever seen. Santee to the east is operating a state of the art reclamation plant.
1963: Metro system is put into operation. One primary treatment plant at Point Loma with a capacity of 88 MGD. Treated wastewater discharged 3 miles offshore into the Pacific Ocean.
1972: Northern areas of the city (Sorrento Valley, Poway and Del Mar) connect into the Metro system Clean Water Act is passed requiring San Diego to covert to secondary treatment by 1975.

SAN DIEGO AREA SEWERAGE HISTORYSAN DIEGO AREA SEWERAGE HISTORY
1976: After studies for proposed secondary treatment and determining that primary treatment was effective, San Diego pursued a waiver for secondary treatment.
1984: Waiver application still in process. San Diego studies natural waste treatment and completes the “Accelerated Projects” which was an expansion and improvement of the wastewater system to compensate for increased growth. Otay Water District opens a new water reclamation plant.
1988: Subsequent lawsuits by the State and EPA.

SAN DIEGO AREA SEWERAGE HISTORYSAN DIEGO AREA SEWERAGE HISTORY
1995 : Court battle concluded. San Diego receives a waiver for secondary treatment. Point Loma will continue to treat sewage at the advanced primary level. Treated effluent is discharged 5 miles offshore in 350 feet below the surface.
1998: Over 1 billion dollars in improvements to San Diego’s system completed. North City Reclamation Plant and Metro Biosolids Center put into operation. Point Loma Treatment Plant capacity increased to 240 MGD.

SAN DIEGO AREA SEWERAGE HISTORYSAN DIEGO AREA SEWERAGE HISTORY
2002: South Bay Water Reclamation Plant put into operation. Canyon sewage spills plague city and secondary treatment waiver issue resurfaces causing concern.

South Bay Water Reclamation Plant 2411 Dairy Mart Road

Sewage flow and pollution do not Sewage flow and pollution do not respect international bordersrespect international borders
Border IssuesBorder Issues

Mesa/canyon topographyMesa/canyon topography

Tijuana River WatershedTijuana River Watershed

Tijuana RiverTijuana River


Population GrowthPopulation Growth
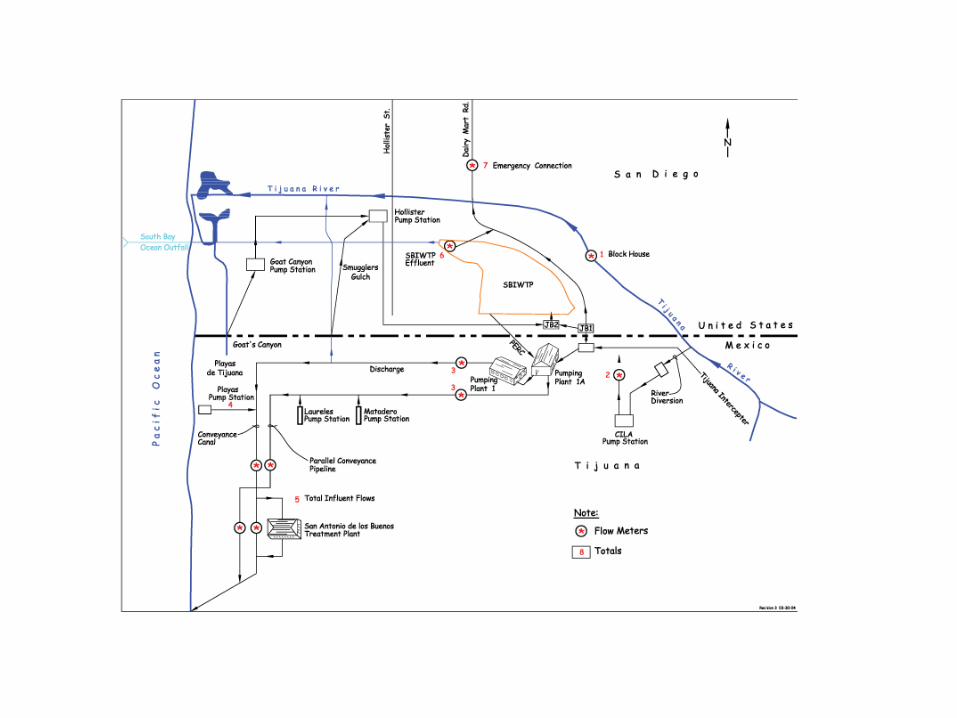
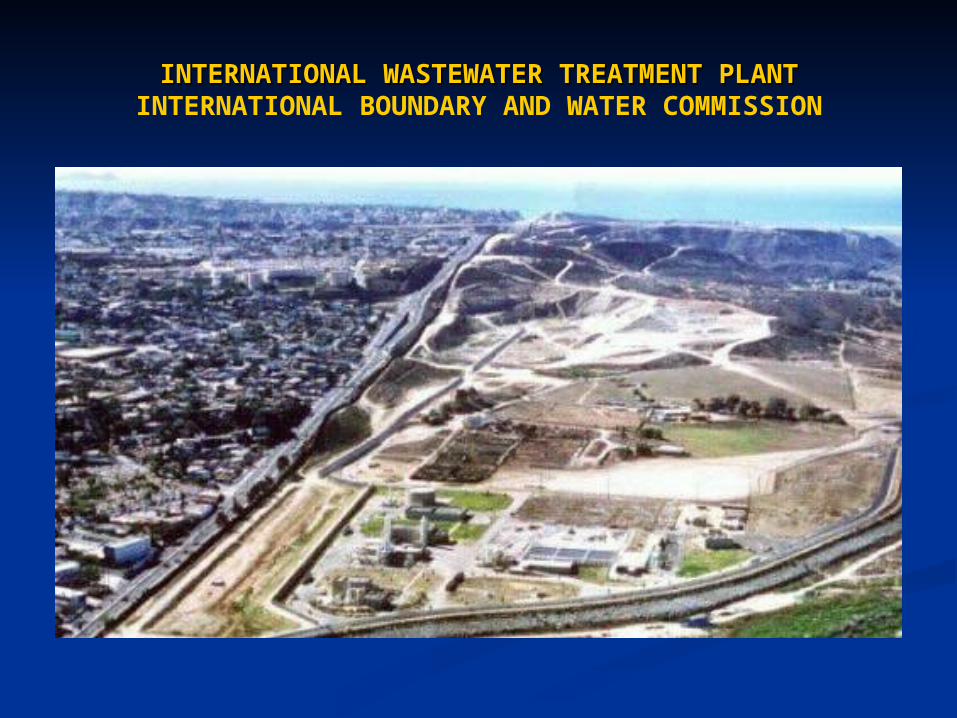
INTERNATIONAL WASTEWATER TREATMENT PLANTINTERNATIONAL WASTEWATER TREATMENT PLANTINTERNATIONAL BOUNDARY AND WATER COMMISSION

Financing the San Diego PlantFinancing the San Diego Plant
U.S. federal government U.S. federal government $239 million $239 million
Mexico Mexico $16 million $16 million
City of San Diego City of San Diego $88-$140 million $88-$140 million
State of California State of California $5.3 million$5.3 million

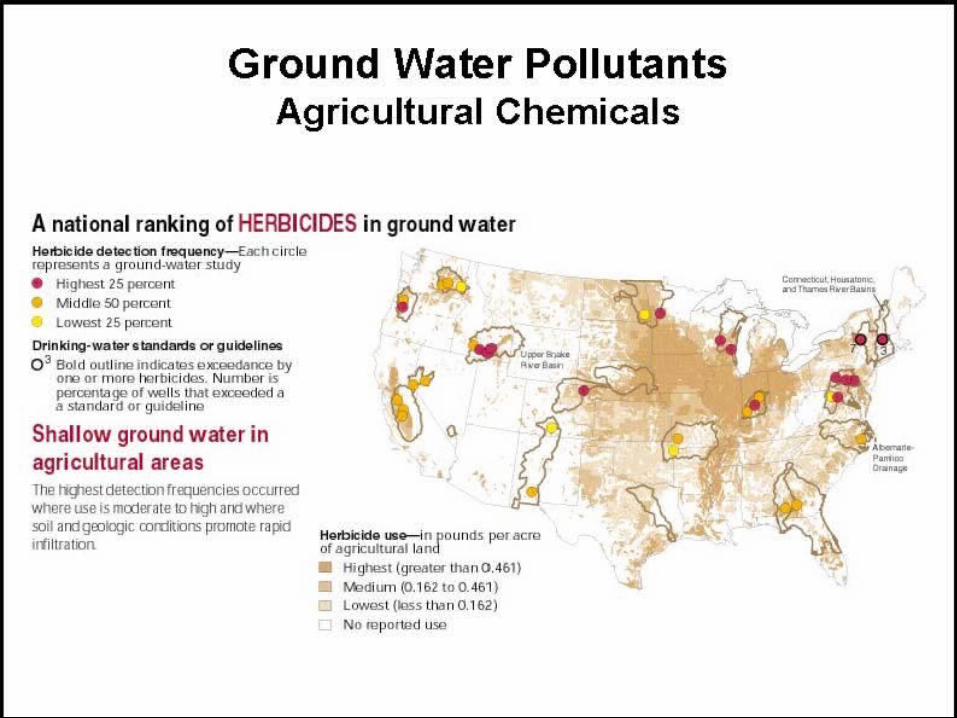
Groundwater Pollution and Treatment
•Saltwater intrusion More than half of the world’s population lives in or
near the coastal zones GW pollution from saltwater intrusion is not a
local isolated problem Causes major water supply problems in NY, FL, CA Case History: Long Island


12_T01

GW Treatment


What is MTBE?(methyl tertiary butyl ether)
• A gas additive contaminating drinking water

History of MTBE?
• 1970 MTBE replaced lead in gasoline
• Clean Air Act of 1990 mandated MTBE in gas
• 4.5 billion gallons of MTBE have been used each year
• Discovered health risks in 1997

Health Risks of MTBE
• Dizziness
• Rashes
• Swelling
• Respiratory problems
• Diarrhea
• Caused cancer in research rats and mice
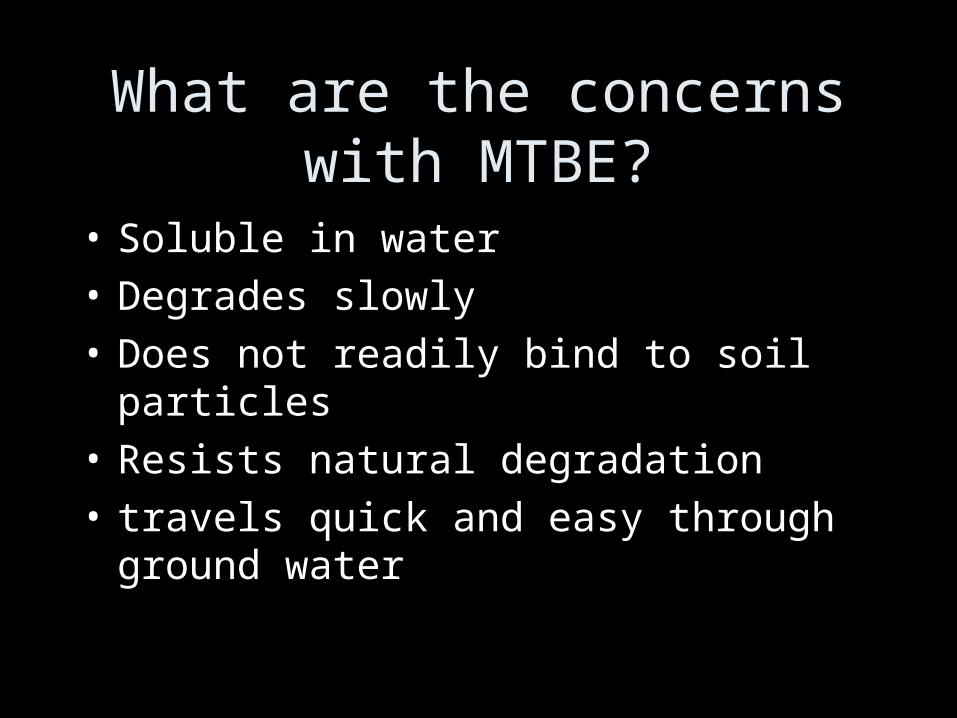
What are the concerns with MTBE?
• Soluble in water
• Degrades slowly
• Does not readily bind to soil particles
• Resists natural degradation
• travels quick and easy through ground water

Concentration of MTBE?
• For every 10 gallons of gas there is 1 gallon of MTBE
• 1 cup of MTBE contaminate a reservoir 360ft wide, 15ft deep holding 5 million gallons of water
Related Documents