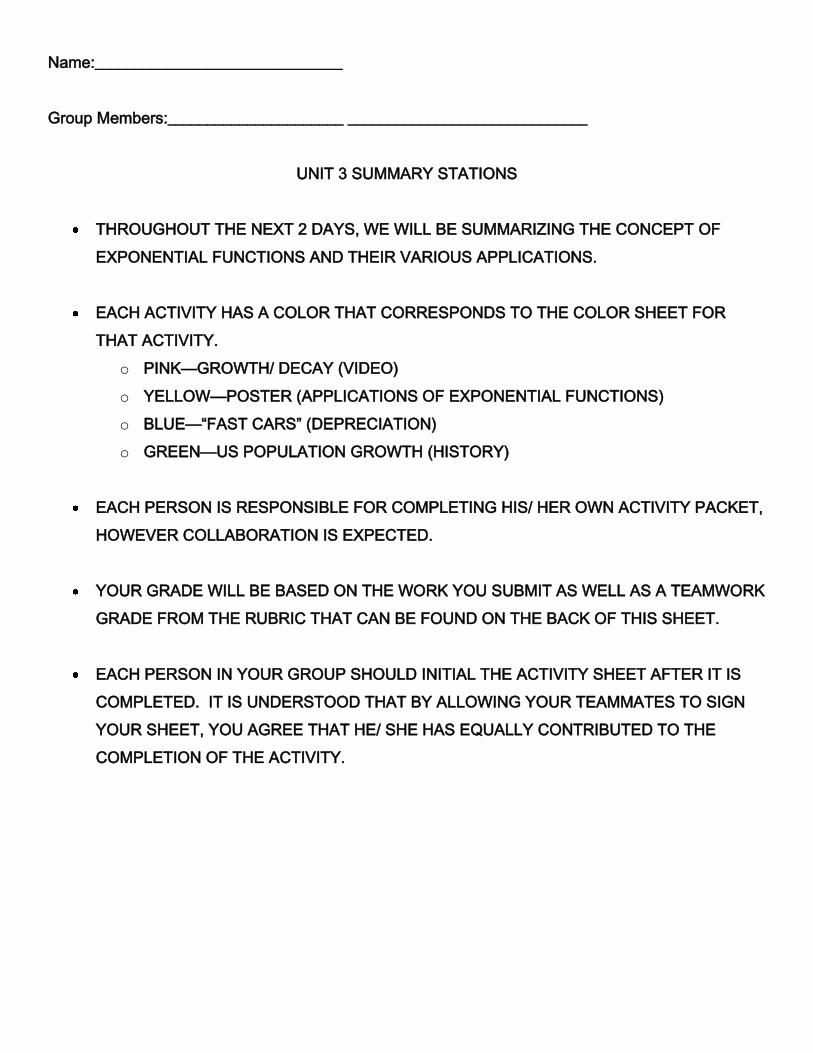
Name:_______________________________ Group Members:______________________ ______________________________ UNIT 3 SUMMARY STATIONS THROUGHOUT THE NEXT 2 DAYS, WE WILL BE SUMMARIZING THE CONCEPT OF EXPONENTIAL FUNCTIONS AND THEIR VARIOUS APPLICATIONS. EACH ACTIVITY HAS A COLOR THAT CORRESPONDS TO THE COLOR SHEET FOR THAT ACTIVITY. o PINK—GROWTH/ DECAY (VIDEO) o YELLOW—POSTER (APPLICATIONS OF EXPONENTIAL FUNCTIONS) o BLUE—“FAST CARS” (DEPRECIATION) o GREEN—US POPULATION GROWTH (HISTORY) EACH PERSON IS RESPONSIBLE FOR COMPLETING HIS/ HER OWN ACTIVITY PACKET, HOWEVER COLLABORATION IS EXPECTED. YOUR GRADE WILL BE BASED ON THE WORK YOU SUBMIT AS WELL AS A TEAMWORK GRADE FROM THE RUBRIC THAT CAN BE FOUND ON THE BACK OF THIS SHEET. EACH PERSON IN YOUR GROUP SHOULD INITIAL THE ACTIVITY SHEET AFTER IT IS COMPLETED. IT IS UNDERSTOOD THAT BY ALLOWING YOUR TEAMMATES TO SIGN YOUR SHEET, YOU AGREE THAT HE/ SHE HAS EQUALLY CONTRIBUTED TO THE COMPLETION OF THE ACTIVITY.

Welcome message from author
This document is posted to help you gain knowledge. Please leave a comment to let me know what you think about it! Share it to your friends and learn new things together.
Transcript
Name:_______________________________
Group Members:______________________ ______________________________
UNIT 3 SUMMARY STATIONS
THROUGHOUT THE NEXT 2 DAYS, WE WILL BE SUMMARIZING THE CONCEPT OF
EXPONENTIAL FUNCTIONS AND THEIR VARIOUS APPLICATIONS.
EACH ACTIVITY HAS A COLOR THAT CORRESPONDS TO THE COLOR SHEET FOR
THAT ACTIVITY.
o PINK—GROWTH/ DECAY (VIDEO)
o YELLOW—POSTER (APPLICATIONS OF EXPONENTIAL FUNCTIONS)
o BLUE—“FAST CARS” (DEPRECIATION)
o GREEN—US POPULATION GROWTH (HISTORY)
EACH PERSON IS RESPONSIBLE FOR COMPLETING HIS/ HER OWN ACTIVITY PACKET,
HOWEVER COLLABORATION IS EXPECTED.
YOUR GRADE WILL BE BASED ON THE WORK YOU SUBMIT AS WELL AS A TEAMWORK
GRADE FROM THE RUBRIC THAT CAN BE FOUND ON THE BACK OF THIS SHEET.
EACH PERSON IN YOUR GROUP SHOULD INITIAL THE ACTIVITY SHEET AFTER IT IS
COMPLETED. IT IS UNDERSTOOD THAT BY ALLOWING YOUR TEAMMATES TO SIGN
YOUR SHEET, YOU AGREE THAT HE/ SHE HAS EQUALLY CONTRIBUTED TO THE
COMPLETION OF THE ACTIVITY.

Math Groupwork – Team Assessment Form
Names ____________________________________________________________________ Block ____ Date _____________________
Group Assignment ___________________________________________________________
Check the appropriate box. Provide evidence where possible.
2 1 0 Evidence
Everyone participates and shares in the discussion process. Students are working together and communication is interactive.
The group is supportive of its individual members. All members are active participants and encouraged to share ideas.
Group members often ask questions for clarification of elaboration.
The group discussion stays on topic or on directly related issues.
The group is energetic and enthusiastic without being a disruption to other groups.
Totals
What was the best thing about the way this group worked together? ______________
______________________________________________________________________
______________________________________________________________________
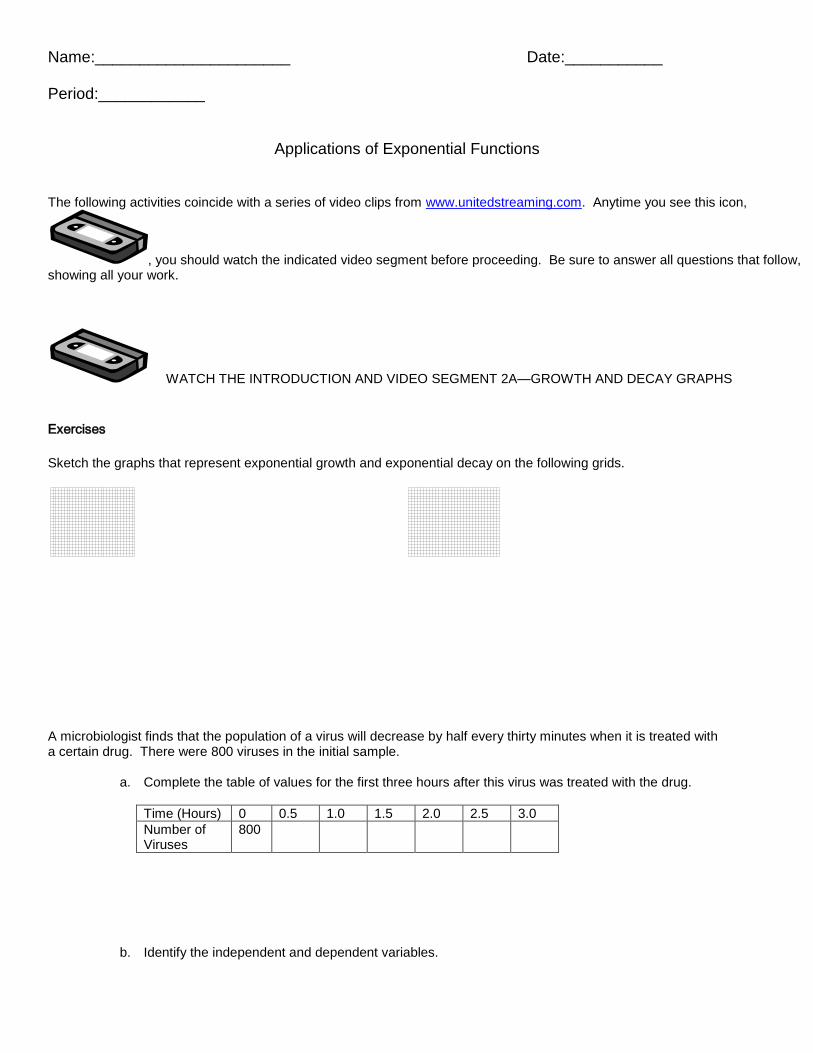
Name:______________________ Date:___________ Period:____________
Applications of Exponential Functions The following activities coincide with a series of video clips from www.unitedstreaming.com. Anytime you see this icon,
, you should watch the indicated video segment before proceeding. Be sure to answer all questions that follow, showing all your work.
WATCH THE INTRODUCTION AND VIDEO SEGMENT 2A—GROWTH AND DECAY GRAPHS
Exercises
Sketch the graphs that represent exponential growth and exponential decay on the following grids.
A microbiologist finds that the population of a virus will decrease by half every thirty minutes when it is treated with a certain drug. There were 800 viruses in the initial sample.
a. Complete the table of values for the first three hours after this virus was treated with the drug.
Time (Hours) 0 0.5 1.0 1.5 2.0 2.5 3.0
Number of Viruses
800
b. Identify the independent and dependent variables.
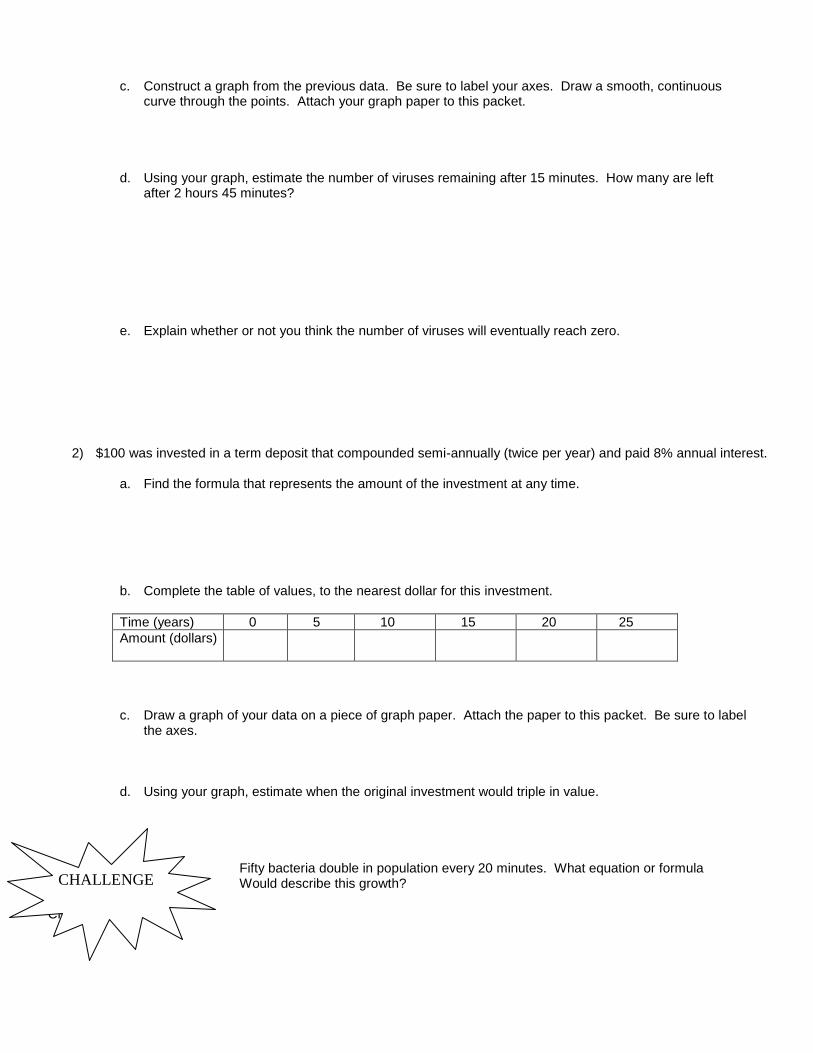
c. Construct a graph from the previous data. Be sure to label your axes. Draw a smooth, continuous curve through the points. Attach your graph paper to this packet.
d. Using your graph, estimate the number of viruses remaining after 15 minutes. How many are left after 2 hours 45 minutes?
e. Explain whether or not you think the number of viruses will eventually reach zero.
2) $100 was invested in a term deposit that compounded semi-annually (twice per year) and paid 8% annual interest.
a. Find the formula that represents the amount of the investment at any time.
b. Complete the table of values, to the nearest dollar for this investment.
Time (years) 0 5 10 15 20 25
Amount (dollars)
c. Draw a graph of your data on a piece of graph paper. Attach the paper to this packet. Be sure to label the axes.
d. Using your graph, estimate when the original investment would triple in value.
Fifty bacteria double in population every 20 minutes. What equation or formula Would describe this growth?
CHALLENGE
CHALLENGE
WATCH VIDEO SEGMENT 2B—GROWTH AND DECAY EQUATIONS
3) Write an equation for the amount an investment will be worth if $1200 is invested at 10% annual interest compounded quarterly.
4) The world population reached 5.4 billion in 1992 and was increasing at a rate of 1.6% each year. If this rate of growth is maintained, write an equation expressing the predicted population as functions of the number of years since 1992. (Hint: 1992 represents your initial value!)
5) For every meter a diver descends beneath the surface, the light intensity is reduced by 3%. Express the
percent of surface light present at any given depth as a function of the depth. 6) As river water passes through a filter, 10% of the unwanted matter is removed. Express the percent, P, of
unwanted matter remaining as a function of the number, n, of filters used.
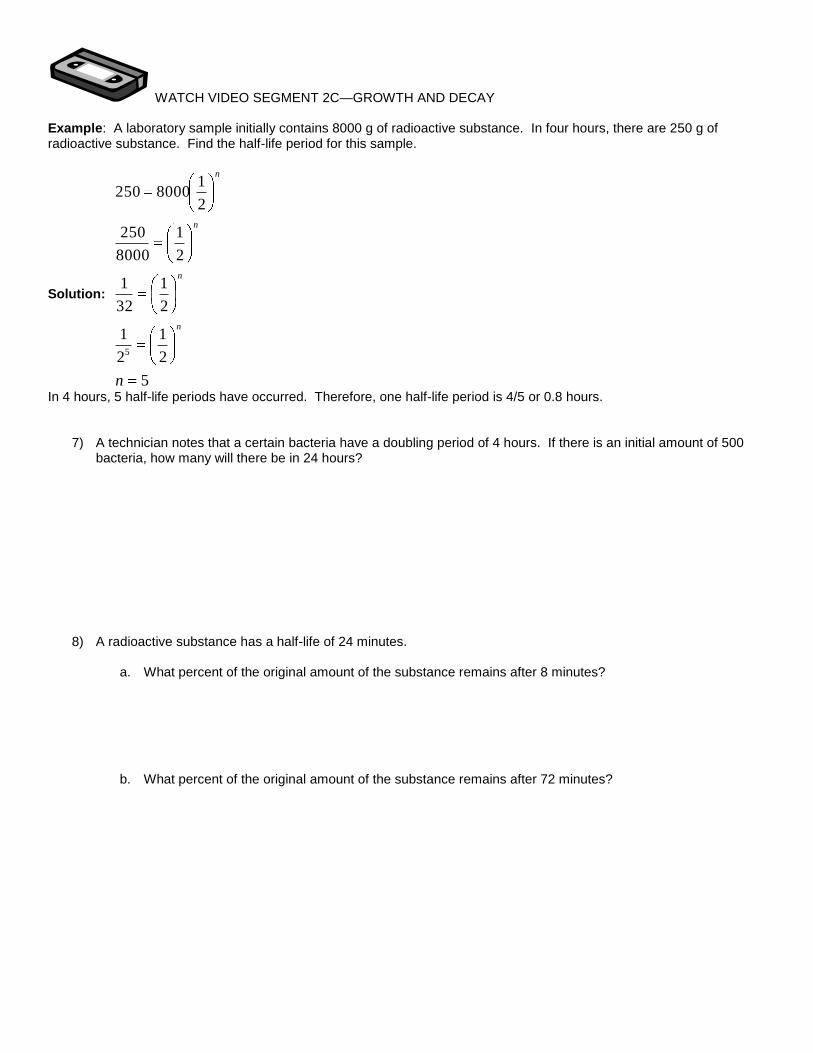
WATCH VIDEO SEGMENT 2C—GROWTH AND DECAY Example: A laboratory sample initially contains 8000 g of radioactive substance. In four hours, there are 250 g of radioactive substance. Find the half-life period for this sample.
Solution:
5
2
1
2
1
2
1
32
1
2
1
8000
250
2
18000250
5
n
n
n
n
n
In 4 hours, 5 half-life periods have occurred. Therefore, one half-life period is 4/5 or 0.8 hours.
7) A technician notes that a certain bacteria have a doubling period of 4 hours. If there is an initial amount of 500 bacteria, how many will there be in 24 hours?
8) A radioactive substance has a half-life of 24 minutes.
a. What percent of the original amount of the substance remains after 8 minutes?
b. What percent of the original amount of the substance remains after 72 minutes?
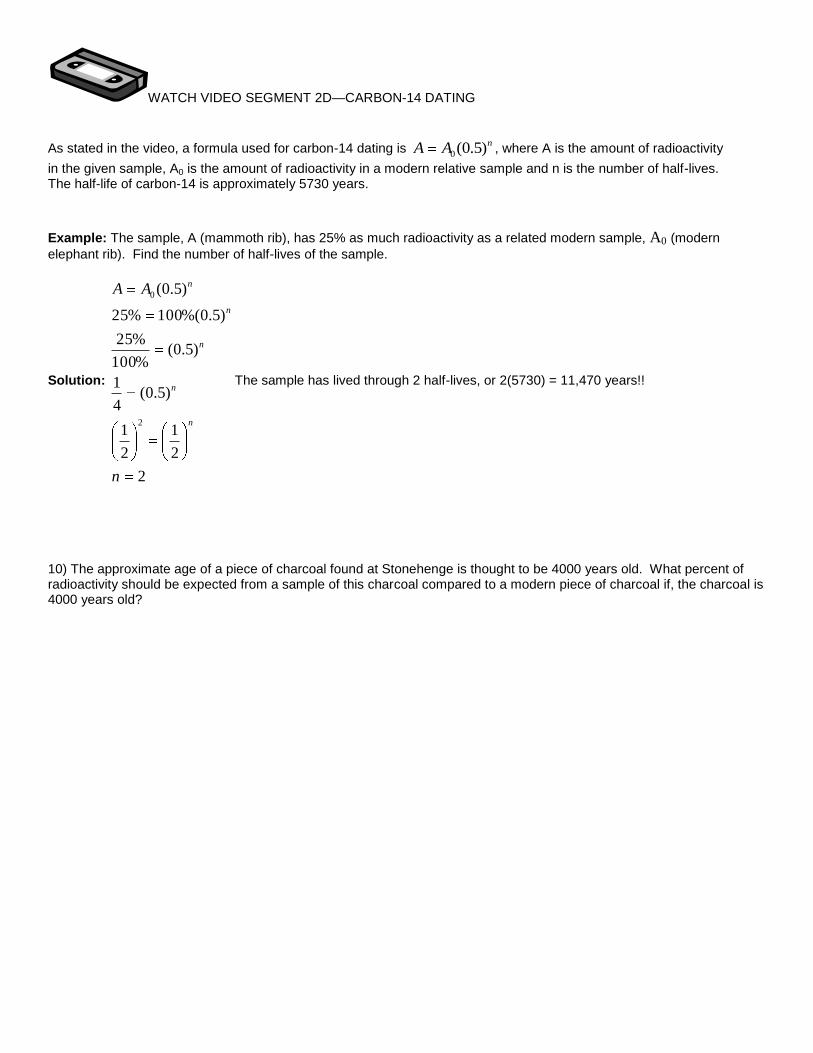
WATCH VIDEO SEGMENT 2D—CARBON-14 DATING
As stated in the video, a formula used for carbon-14 dating is nAA )5.0(0
, where A is the amount of radioactivity
in the given sample, A0 is the amount of radioactivity in a modern relative sample and n is the number of half-lives. The half-life of carbon-14 is approximately 5730 years.
Example: The sample, A (mammoth rib), has 25% as much radioactivity as a related modern sample, A0 (modern
elephant rib). Find the number of half-lives of the sample.
Solution:
2
2
1
2
1
)5.0(4
1
)5.0(%100
%25
)5.0%(100%25
)5.0(
2
0
n
AA
n
n
n
n
n
The sample has lived through 2 half-lives, or 2(5730) = 11,470 years!!
10) The approximate age of a piece of charcoal found at Stonehenge is thought to be 4000 years old. What percent of radioactivity should be expected from a sample of this charcoal compared to a modern piece of charcoal if, the charcoal is 4000 years old?
Name:___________________ Date:_____________
APPLICATIONS OF EXPONENTIAL FUNCTIONS
AT THIS STATION, YOU WILL BE CREATING A POSTER TO SUMMARIZE VARIOUS
APPLICATIONS OF EXPONENTIAL GROWTH AND DECAY. ALL OF THE REQUIREMENTS ARE
LISTED BELOW. A RUBRIC FOR YOUR POSTER GRADE IS ALSO INCLUDED.
1) COMPLETE FX 89 & 90 IN YOUR NOTEBOOKS. HAVE THESE SOLUTIONS CHECKED
PRIOR TO MOVING FORWARD WITH THE POSTER.
2) EACH MEMBER OF THE GROUP IS RESPONSIBLE FOR ONE PART OF PROBLEM FX 87.
YOU WILL DO A MINI-PRESENTATION TO THE OTHER MEMBERS OF YOUR GROUP ON HOW
YOU ARRIVED AT YOUR SOLUTION. YOU ARE RESPONSIBLE FOR POSTING YOUR
SOLUTION ON YOUR TEAM POSTER.
POSTER REQUIREMENTS: (1 point each)
1) Find the time unit for your problem (days, weeks, years, etc.)
2) State the appropriate multiplier. Be sure to show your work if any calculations
are required for that multiplier.
3) Identify the initial value.
4) Write the exponential equation that represents your problem.
5) Sketch a graph, identifying key points.
BE SURE TO PUT YOUR NAME WITH THE PROBLEM YOU COMPLETED ON THE POSTER.
** Please note: There are 6 parts to the problem. Each person is responsible for 5 points. This
makes the poster worth a total of 30 points!
FAST CARS—WHAT’S THE VALUE?
FX 117—As soon as you drive a new car off the dealer’s lot the car is worth less
than what you paid for it. This is called depreciation; so, you will sell it for less
than the price that you paid for it. Some cars depreciate more than others (that
is, at different rates), but most cars depreciate. On the other hand, some older
cars actually increase in value. This is called appreciation.
Suppose you have the following choices for a car purchase:
1) 1999 Mazda Miata for $19,800—depreciates at 22% per year
2) 1996 Honda Civic EX for $16,500—depreciates at 18% per year
3) 1967 Ford Mustang for $4000 that is appreciating at 10% per year
Use the information given above to complete the questions that follow.
A) Clearly identify the multiplier for each vehicle above. Be sure to show/
explain how you arrived at your answer.
B) Make a table that shows the value of each car after a given amount of
time. Be sure to include the purchase price (initial value) and the
value for the first 10 years.
C) Write a function for each car that indicates the value of the car in year
“n”. Be sure to label the function with the name of the car.
D) Graph each of your functions on the same set of axes. Be sure to label
and scale the axes appropriately. Label each graph with the name of
the car.
E) When is the value of the Miata and Civic the same? How can you
identify this on your graph?
F) Which of the cars is worth the most after 4 years? How can you tell
from your graph? Which car is worth the most after 5 years? After 10
years?
G) Describe when someone would choose to buy the Miata over the Civic.
Who would be most likely to purchase the Mustang? Which car would
you buy? Why?
Name:________________ Date;________________________ Period:________________ Exponential Function Web Investigation
US POPULATION GROWTH: 1790-1990
WHAT TO DO:
Using the resources provided below, find the total US population for every decade from 1790 to 1990.
Plot the data and determine the exponential function to fit your data
Calculate the percent increase in population for each decade and plot the data as a line graph.
Determine the three decades showing significant changes in the growth trend, and research historical causes for the changes.
TOOLS:
Graphing calculator
Computer
Graph paper
Ruler
Pencil
WEB RESOURCES
US Census Bureau— http://www.census.gov/population/www/censusdata/hiscendata.html
Select #2, Urban and Rural populations
USA: Outline of American History
http://odur.let.rug.nl/~usa/H/1994/index.htm
An excellent site to begin research into the historical, social, and economic reasons for the breaks in the
growth of the population.
STEPS TO FOLLOW
1) Obtain the population figures for every decade from 1790-1990 from the US Census Bureau. 2) Record your data in a table using Microsoft Excel. Be sure to label your columns with a heading. 3) Plot your data on a hand-drawn scatter plot. Clearly label the x axis with your independent variable and the y axis
with your dependent variable. 4) Draw a smooth “curve of best fit” through your points. Find the equation of the exponential function that matches
your curve. ])()([ nGIVnt Be sure to show all your work to find the equation.
5) Calculate the percent increase in total population for each decade using your calculator and the formula:
increasefigureprevious
figurepreviousfigurerecent %100
) () (
6) Record your percent increase data in a new column on your spreadsheet. 7) Using Microsoft Excel, create a line graph that shows the percent increase over time. The year should be
independent, the percent dependent. 8) Determine the three decades that show the greatest changes in growth trends. (Note: these do not have to be
increases!) 9) Research historical causes for these trend changes using the Outline of American History. Be sure to properly
document any resources used in your research.

SUBMIT
A copy of your scatter plot with the equation included.
All work needed to find the equation, neatly written with all steps shown.
Percent Increase calculations.
Spreadsheet and line graph saved to my teacher folder.
Paragraph (minimum 4-5 sentences) describing the decades of major growth changes and potential causes.
Related Documents