Unit 2- Curve Sketching WORKBOOK MCV4U Name:

Welcome message from author
This document is posted to help you gain knowledge. Please leave a comment to let me know what you think about it! Share it to your friends and learn new things together.
Transcript

Unit 2- Curve Sketching
WORKBOOK
MCV4U
Name:


W1 – Increasing / Decreasing Unit 2 MCV4U Jensen 1) Use critical numbers and the first derivative test to determine when the function is increasing or decreasing. a) 𝑓(𝑥) = 𝑥3 + 3𝑥2 + 1 b) 𝑓(𝑥) = 𝑥5 − 5𝑥4 + 100 c) 𝑓(𝑥) = 3𝑥4 + 4𝑥3 − 12𝑥2

d) 𝑓(𝑥) = (2𝑥 − 1)2(𝑥2 − 9) 2) Suppose that 𝑓(𝑥) is a differentiable function with the given derivative. Determine the values of 𝑥 for which 𝑓(𝑥) is increasing and decreasing. a) 𝑓′(𝑥) = (𝑥 − 1)(𝑥 + 2)(𝑥 + 3) b) 𝑓′(𝑥) = 𝑥2 + 2𝑥 − 4

c) 𝑓′(𝑥) = 𝑥3 + 3𝑥2 − 4𝑥 − 12 3) Given each graph of 𝑓′(𝑥), state the intervals of increase and decrease for the function 𝑓(𝑥). Then sketch a possible graph of 𝑓(𝑥). a) b)
c) 4) Sketch a continuous graph of 𝑓(𝑥) given each set of conditions.
a) 𝑓′(𝑥) > 0 when 𝑥 < 3, 𝑓′(𝑥) < 0 when 𝑥 > 3, 𝑓(3) = 5
b) 𝑓′(𝑥) > 0 when −1 < 𝑥 < 3, 𝑓′(𝑥) < 0 when 𝑥 < −1 and when 𝑥 > 3, 𝑓(−1) = −20
27, 𝑓(3) = 4

c) 𝑓′(𝑥) > 0 when 𝑥 ≠ 2, 𝑓(2) = 1 Answers:
1)a) increasing: 𝑥 < −2, 𝑥 > 0 b) increasing: 𝑥 < 0, 𝑥 > 4 c) increasing: −2 < 𝑥 < 0, 𝑥 > 1 decreasing: −2 < 𝑥 < 0 decreasing: 0 < 𝑥 < 4 decreasing: 𝑥 < −2, 0 < 𝑥 < 1
d) increasing: −2 < 𝑥 < 0.5, 𝑥 > 2.25 decreasing: 𝑥 < −2, 0.5 < 𝑥 < 2.25
2)a) increasing: −3 < 𝑥 < −2, 𝑥 > 1 b) increasing: 𝑥 < −1 − √5, 𝑥 > −1 + √5
decreasing: 𝑥 < −3, −2 < 𝑥 < 1 decreasing: −1 − √5 < 𝑥 < −1 + √5
c) increasing: −3 < 𝑥 < −2, 𝑥 > 2 decreasing: 𝑥 < −3, −2 < 𝑥 < 2 3a) increasing: 𝑥 > 3 b) increasing: 𝑥 < −1, 𝑥 > 2 c) increasing: −4 < 𝑥 < 0, 𝑥 > 2 decreasing: 𝑥 < 3 decreasing: −1 < 𝑥 < 2 decreasing: 𝑥 < −4, 0 < 𝑥 < 2
4)a) b) c)

W2 – Maxima and Minima Unit 2 MCV4U Jensen 1) Find the critical numbers for each function
a) 𝑓(𝑥) = −𝑥2 + 6𝑥 + 2 b) 𝑓(𝑥) = 𝑥3 − 2𝑥2 + 3𝑥
c) 𝑔(𝑥) = 2𝑥3 − 3𝑥2 − 12𝑥 + 5 d) 𝑦 = 𝑥 − √𝑥 2) Determine the absolute extreme values of each function on the given interval.
a) 𝑦 = 3𝑥2 − 12𝑥 + 7, 0 ≤ 𝑥 ≤ 4

b) 𝑔(𝑥) = 2𝑥3 − 3𝑥2 − 12𝑥 + 2, −3 ≤ 𝑥 ≤ 3 c) 𝑓(𝑥) = 𝑥3 + 𝑥, 0 ≤ 𝑥 ≤ 10 3) Find and classify the critical points of each function as a local max, local min, or neither. a) 𝑦 = 4𝑥 − 𝑥2

b) 𝑓(𝑥) = (𝑥 − 1)4 c) 𝑔(𝑥) = 2𝑥3 − 24𝑥 + 5
d) 𝑦 =1
4𝑥4 −
2
3𝑥3
4)a) Find the critical numbers of 𝑓(𝑥) = 2𝑥3 − 3𝑥2 − 12𝑥 + 5

b) Find any local extrema of 𝑓(𝑥). c) Find the absolute extrema of 𝑓(𝑥) in the interval [−2,4]. 5) A section of rollercoaster is in the shape of 𝑓(𝑥) = −𝑥3 − 2𝑥2 + 𝑥 + 15, where 𝑥 is between −2 and 2.
a) Find all local extrema and explain what portions of the rollercoaster they represent. b) Is the highest point of this section of the ride at the beginning, the end, or neither?

Answers: 1)a) 𝑥 = 3 b) no critical numbers c) 𝑥 = −1,2 d) 𝑥 =
1
4
2)a) absolute max at (0,7) and (4,7) b) absolute max at (−1,9) c) absolute max at (10,1010) absolute min at (2,−5) absolute min at (−3,−43) absolute min at (0,0) 3)a) (2,4) is a local max b) (1,0) is a local min c) (−2,37) is a local max; (2, −27) is a local min
d) (0,0) is neither; (2,−4
3) is a local min
4)a) 𝑥 = −1,2 b) (−1,12) is a local max; (2,−15) is a local min c) (2, −15) is the absolute min, (4,37) is the absolute max 5)a) The coaster starts down a hill from 𝑥 = −2, reaching a local min at the bottom of a hill at (−1.55,12.37). It then increases height until it reaches a local max at the top of a hill at (0.22,15.11). It then continues downward until 𝑥 = 2. b) The highest point is at (0.22,15.11), not either of the endpoints.
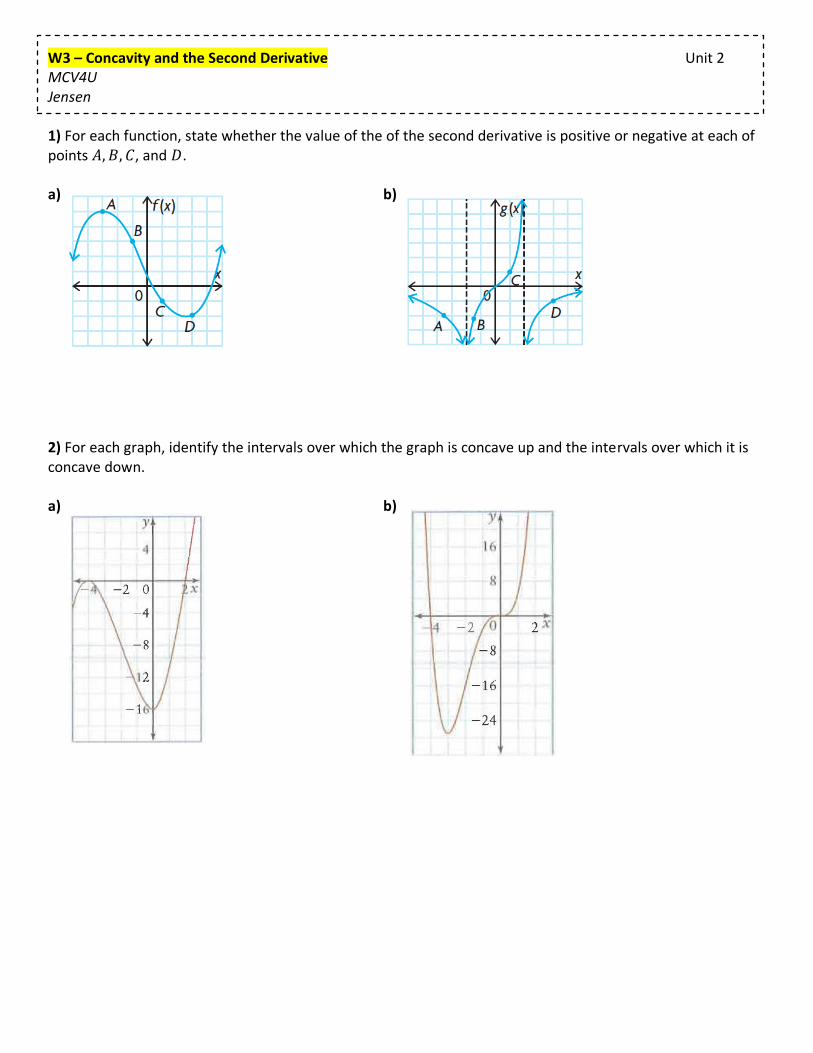
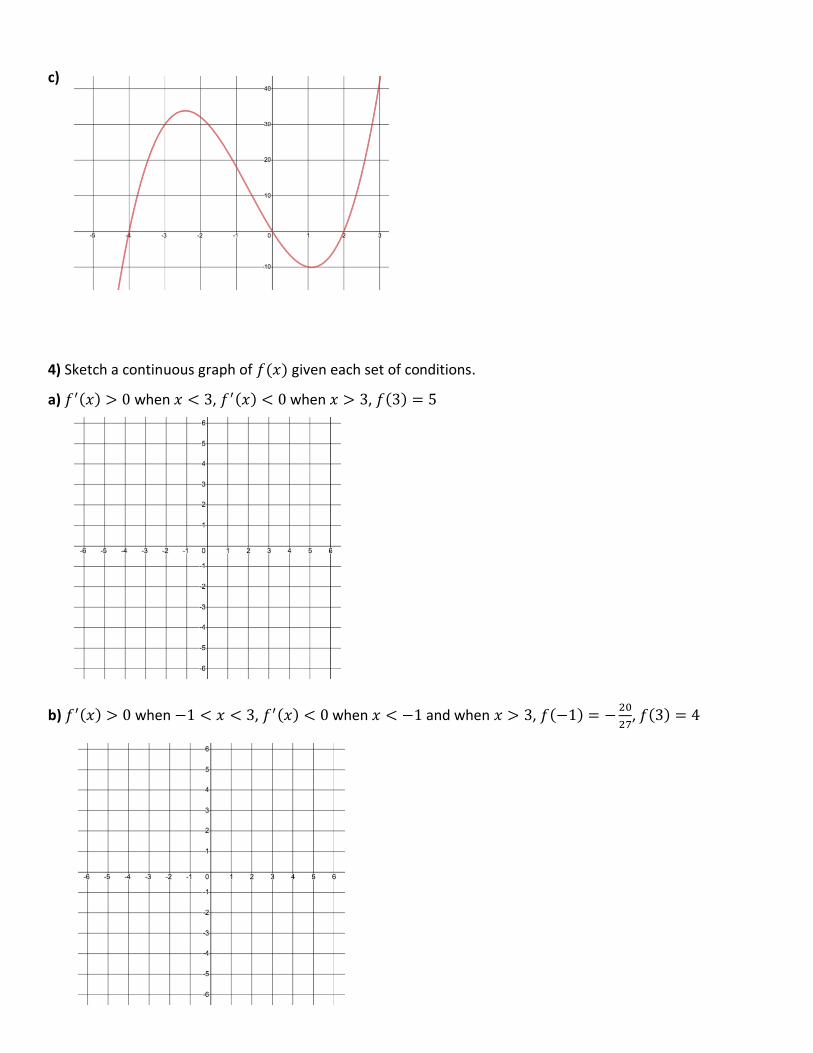
W3 – Concavity and the Second Derivative Unit 2 MCV4U Jensen 1) For each function, state whether the value of the of the second derivative is positive or negative at each of points 𝐴, 𝐵, 𝐶, and 𝐷. a) b) 2) For each graph, identify the intervals over which the graph is concave up and the intervals over which it is concave down. a) b)

3) Given each graph of 𝑓′′(𝑥), state the intervals of concavity for the function 𝑓(𝑥). Also indicate where any points of inflection occur for 𝑓(𝑥). a) b) 4) For each function, find the intervals of concavity and the coordinates of any points of inflection.
a) 𝑦 = 6𝑥2 − 7𝑥 + 5 b) 𝑔(𝑥) = −2𝑥3 + 12𝑥2 − 9

5) For each function, find and classify all the critical points using the second derivative test. a) 𝑦 = 𝑥2 + 10𝑥 − 11 b) 𝑓(𝑥) = 𝑥4 − 6𝑥2 + 10 6) Sketch a graph of a function that satisfies each set of conditions a) 𝑓′′(𝑥) = 2 for all 𝑥, 𝑓′(2) = 0, 𝑓(2) = −3

b) 𝑓′′(𝑥) > 0 when 𝑥 < −1, 𝑓′′(𝑥) < 0 when 𝑥 > −1, 𝑓′(−1) = 1, 𝑓(−1) = 2 c) 𝑓′′(𝑥) < 0 when −2 < 𝑥 < 1, 𝑓′′(𝑥) > 0 when 𝑥 < −2 and 𝑥 > 1, 𝑓(−2) = −3, 𝑓(0) = 0 Answers:
1)a) A-neg, B-neg, C-pos, D-pos b) A-neg, B-neg, C-pos, D-neg 2)a) concave up: 𝑥 > −2 b) concave up: 𝑥 < −2, 𝑥 > 0 concave down: 𝑥 < −2 concave down: −2 < 𝑥 < 0 3)a) concave up: 𝑥 > 2; concave down: 𝑥 < 2; POI when 𝑥 = 2 b) concave up: 𝑥 > 2; concave down: 𝑥 < −1 and −1 < 𝑥 < 2; POI when 𝑥 = 2 4)a) always concave up b) concave up: 𝑥 < 2; concave down: 𝑥 > 2; POI at (2,23).
5)a) (−5,−36) is a local min point b) (−√3, 1) and (√3, 1) are local mins, (0,10) is a local max
6)a) b) c)

W4 – Rational Functions Unit 2 MCV4U Jensen
1) Find the equation of any asymptotes for the following functions. Then, find the one-sided limits approaching the vertical asymptotes.
a) 𝑓(𝑥) =𝑥+3
𝑥2−4 b) 𝑦 =
𝑥2
𝑥2−3𝑥+2
c) 𝑦 = 2𝑥 +1
𝑥 d) 𝑔(𝑥) =
2𝑥−3
𝑥2−6𝑥+9

2) Find the derivative of each function. Then, determine whether the function has any local extrema.
a) 𝑓(𝑥) =2
𝑥+3 b) ℎ(𝑥) =
−3
(𝑥−2)2
3) Consider the function 𝑓(𝑥) =−2
(𝑥+1)2
a) Find the intervals of increase and decrease for 𝑓(𝑥). b) Find the intervals of concavity for 𝑓(𝑥).

4) Consider the function ℎ(𝑥) =1
𝑥2−4
a) Write the equations of the asymptotes b) Make a table showing the increasing and decreasing intervals for the function c) How can you use the table from part b) to determine the behavior of 𝑓(𝑥) near the vertical asymptotes? d) Sketch a graph of the function.

Answers:
1)a) VA: 𝑥 = 2 and 𝑥 = −2; HA: 𝑦 = 0; lim𝑥→2+
= ∞, lim𝑥→2−
= −∞, lim𝑥→−2+
= −∞, lim𝑥→−2−
= ∞
b) VA: 𝑥 = 1 and 𝑥 = 2; HA: 𝑦 = 1; lim𝑥→2+
= ∞, lim𝑥→2−
= −∞, lim𝑥→1+
= −∞, lim𝑥→1−
= ∞
c) VA: 𝑥 = 0; SA: 𝑦 = 2𝑥; lim𝑥→0+
= ∞, lim𝑥→0−
= −∞
d) VA: 𝑥 = 3; HA: 𝑦 = 0; lim𝑥→3+
= ∞, lim𝑥→3−
= ∞
2)a) 𝑓′(𝑥) =−2
(𝑥+3)2; no local extrema b) ℎ′(𝑥) =
6
(𝑥−2)3; no local extrema
3)a) decreasing when 𝑥 < −1, increasing when 𝑥 > −1 b) concave down when 𝑥 < −1 or 𝑥 > −1 4)a) VA: 𝑥 = 2 and 𝑥 = −2; HA: 𝑦 = 0 b) increasing when 𝑥 < −2 or −2 < 𝑥 < 0; decreasing when 0 < 𝑥 < 2 or 𝑥 > 2 c) Since the curve is increasing to the left of 𝑥 = −2, lim
𝑥→−2−= ∞
Since the curve is increasing to the right of 𝑥 = −2, lim𝑥→−2+
= −∞
Since the curve is decreasing to the left of 𝑥 = 2, lim𝑥→2−
= −∞
Since the curve is decreasing to the right of 𝑥 = 2, lim𝑥→2+
= ∞
d)

L5 – Curve Sketching Unit 2 MCV4U Jensen 1) For each function, determine the coordinates of the local extrema. Classify each point as a local max or min.
a) 𝑦 = 2𝑥 − 3𝑥2 b) 𝑦 = 2𝑡3 + 6𝑡2 + 6𝑡 + 4 2) For each function, determine the coordinates of any points of inflection.
a) 𝑓(𝑥) = 2𝑥3 − 4𝑥2 b) 𝑓(𝑥) = 3𝑥5 − 5𝑥4 − 40𝑥3 + 120𝑥2

3) Use the algorithm for curve sketching to analyze the key features of each of the following functions and to sketch a graph of them.
a) 𝑓(𝑥) = 𝑥4 − 8𝑥3

b) 𝑔(𝑥) = 3𝑥3 + 7𝑥2 + 3𝑥 − 1

c) ℎ(𝑥) = 2𝑥4 − 26𝑥2 + 72

d) 𝑗(𝑥) =𝑥2+2𝑥−4
𝑥2

Answers:
1)a) max: (1
3,1
3) b) no local extrema; (−1,2) is an inflection point NOT a max or min
2)a) (2
3, −
32
27) b) (−2, 624), (2,176), and (0,0)
3)a) 𝑥-int: (0,0) and (8,0); 𝑦-int: (0,0); local max: none; local min: (6,−432); POI: (0,0) and (4,−256); increasing: 𝑥 > 6; decreasing: 𝑥 < 0 and 0 < 𝑥 < 6; concave up: 𝑥 < 0 and 𝑥 > 4; concave down: 0 < 𝑥 < 4 b) 𝑥-int: (−1,0), (0.215,0), and (−1.549,0); 𝑦-int: (0,−1); local max: (−1.3, 0.34); local min: (−0.26,−1.36); POI: (−0.78,−0.51); increasing: 𝑥 < −1.3 and 𝑥 > −0.26; decreasing: −1.3 < 𝑥 < −0.26; concave up: 𝑥 > −0.78; concave down: 𝑥 < −0.78 c) 𝑥-int: (−3,0), (−2,0), (2,0) and (3,0); 𝑦-int: (0,72); local max: (0,72); local min: (−2.55,−12.5) and (2.55,−12.5); POI: (−1.47,25.16) and (1.47,25.16); increasing: −2.55 < 𝑥 < 0 and 𝑥 > 2.55; decreasing: 𝑥 < −2.55, and 0 < 𝑥 < 2.55; concave up: 𝑥 < −1.47 and 𝑥 > 1.47; concave down: −1.47 < 𝑥 < 1.47 d) VA: 𝑥 = 0; HA: 𝑦 = 1; 𝑥-int: (−3.24,0), and (1.24,0); 𝑦-int: none; local max: (4,1.25); local min: none; POI: (6,1.22); increasing: 0 < 𝑥 < 4 and; decreasing: 𝑥 < 0, and 𝑥 > 4; concave up: 𝑥 > 6; concave down: 𝑥 < 0 and 0 < 𝑥 < 6

W6 – Optimization Problems Unit 2 MCV4U Jensen 1) A rectangular pen is to be built with 1200 m of fencing. The pen is to be divided into three parts using two parallel partitions. Find the max possible area of the pen. 2) A showroom for a car dealership is to be built in the shape of a rectangle with brick on the back and sides, and glass on the front. The floor of the showroom is to have an area of 500 m2. If a brick wall costs $1200/m while a glass wall costs $600/m, what dimensions would minimize the cost of the showroom? What is the min cost?

3) A soup can of volume 500 cm3 is to be constructed. The material for the top costs 0.4¢/cm2 while the material for the bottom and sides costs 0.2¢/cm2. Find the dimensions that will minimize the cost of producing the can. What is the min cost? 4) A rectangular piece of paper with perimeter 100 cm is to be rolled to form a cylindrical tube. Find the dimensions of the paper that will produce a tube with maximum volume. What is the max volume?
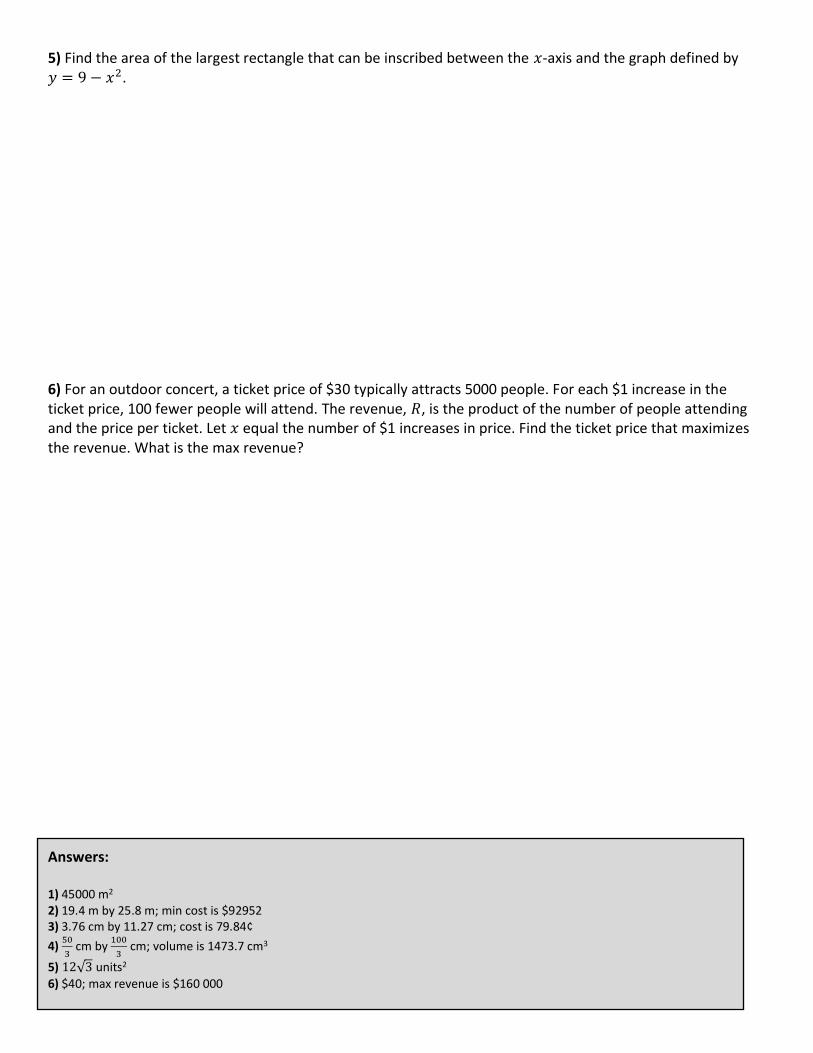
5) Find the area of the largest rectangle that can be inscribed between the 𝑥-axis and the graph defined by 𝑦 = 9 − 𝑥2. 6) For an outdoor concert, a ticket price of $30 typically attracts 5000 people. For each $1 increase in the ticket price, 100 fewer people will attend. The revenue, 𝑅, is the product of the number of people attending and the price per ticket. Let 𝑥 equal the number of $1 increases in price. Find the ticket price that maximizes the revenue. What is the max revenue? Answers: 1) 45000 m2 2) 19.4 m by 25.8 m; min cost is $92952 3) 3.76 cm by 11.27 cm; cost is 79.84¢
4) 50
3 cm by
100
3 cm; volume is 1473.7 cm3
5) 12√3 units2 6) $40; max revenue is $160 000
Related Documents