Welcome to MM207! Unit 1 Seminar To resize your pods: Place your mouse here. Left mouse click and hold. Drag to the right to enlarge the pod.

Unit 1 Seminar To resize your pods: Place your mouse here. Left mouse click and hold. Drag to the right to enlarge the pod.
Dec 18, 2015
Welcome message from author
This document is posted to help you gain knowledge. Please leave a comment to let me know what you think about it! Share it to your friends and learn new things together.
Transcript
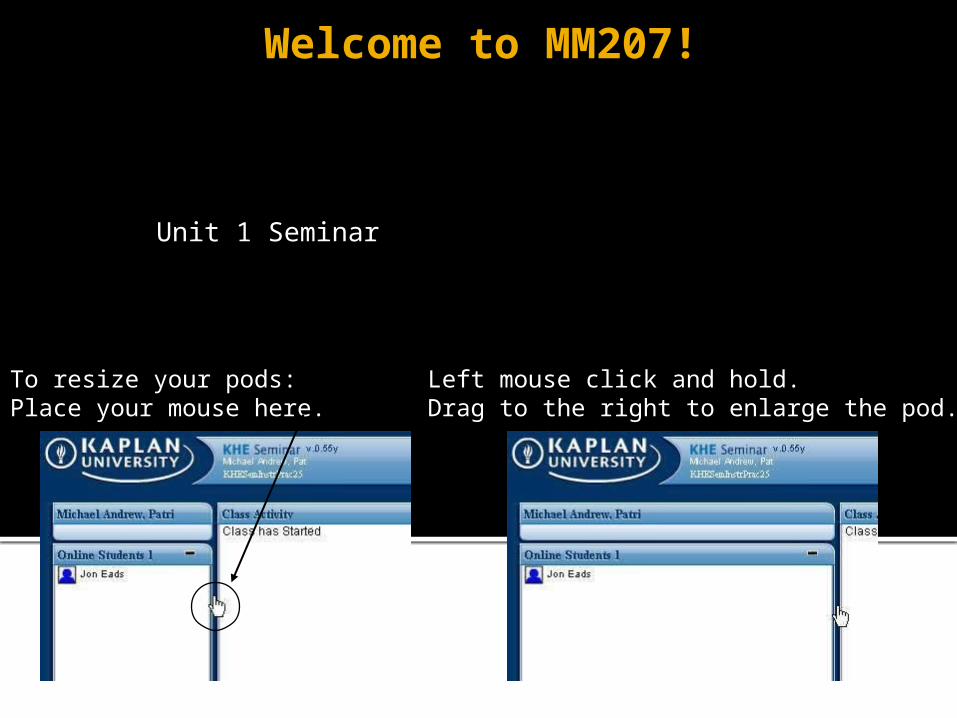
Welcome to MM207!
Unit 1 Seminar
To resize your pods: Place your mouse here.
Left mouse click and hold.Drag to the right to enlarge the pod.
Seminar Outline
Welcome! Brief Syllabus Review Contact Information for Instructor Seminar Rules Discussion
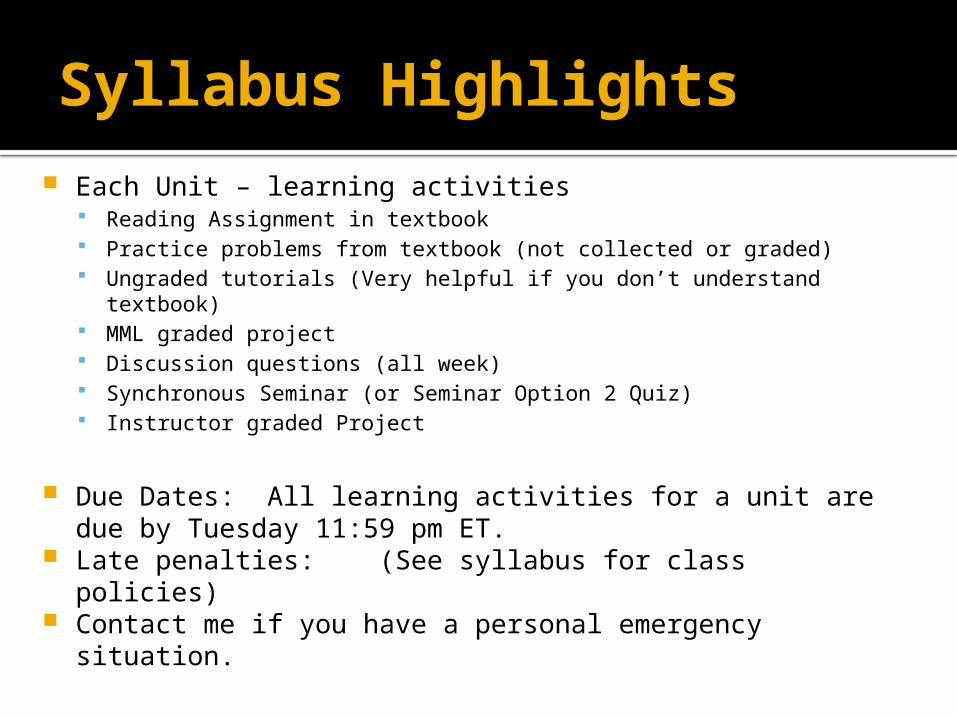
Syllabus Highlights Each Unit – learning activities
Reading Assignment in textbook Practice problems from textbook (not collected or graded) Ungraded tutorials (Very helpful if you don’t understand textbook) MML graded project Discussion questions (all week) Synchronous Seminar (or Seminar Option 2 Quiz) Instructor graded Project
Due Dates: All learning activities for a unit are due by Tuesday 11:59 pm ET.
Late penalties: (See syllabus for class policies) Contact me if you have a personal emergency situation.

About your Instructor
Instructor: Anne K. Geraci
Email: [email protected]
Office hours (AIM): ProfGeraci (See syllabus) or by appointment
Please download and print the Kaplan Information Document from Doc Sharing
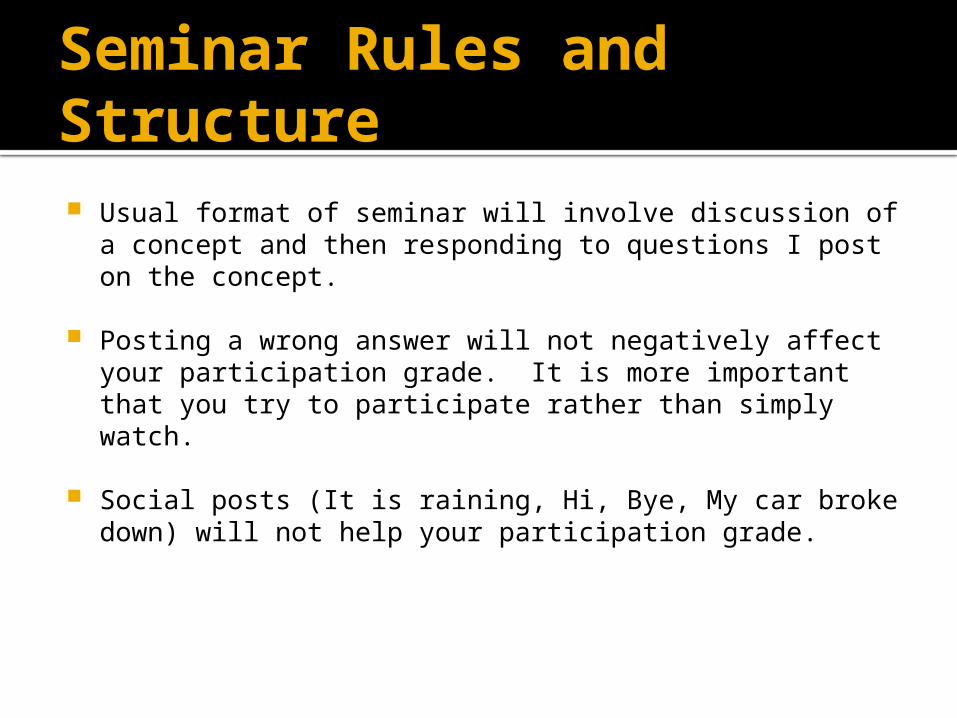
Seminar Rules and Structure Usual format of seminar will involve discussion of a concept
and then responding to questions I post on the concept.
Posting a wrong answer will not negatively affect your participation grade. It is more important that you try to participate rather than simply watch.
Social posts (It is raining, Hi, Bye, My car broke down) will not help your participation grade.
Read the Book!!
Flexible Seminars
You are free to choose any or all of the available seminars:
<<See syllabus for available seminars.>>
Or you may select Seminar Option 2 – complete the MML Quiz.
Available Resources
MyMathLab – “Ask my Instructor”Kaplan Math Center – live tutors &
seminarsDiscussion Boards – ask for helpSeminar discussions Internet resources Online Textbook (Use
“Ungraded Tutorials/Multimedia Textbook”)
Study Buddy (exchange e-mails)
It’s all up to you ….

Now, let’s get started
What is Statistics?
Statistics The science of collecting, organizing, analyzing, and interpreting data in order to make decisions.
11Larson/Farber 4th ed.
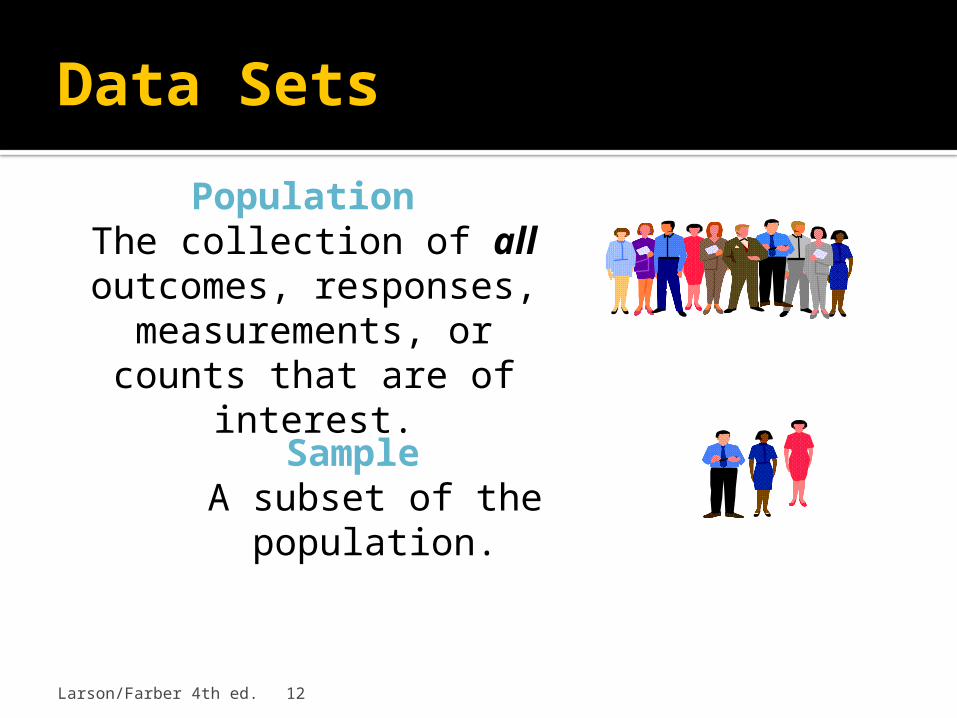
Data Sets
Population The collection of all outcomes,
responses, measurements, or counts that are of interest.
Sample A subset of the population.
12Larson/Farber 4th ed.

Population vs. Sample
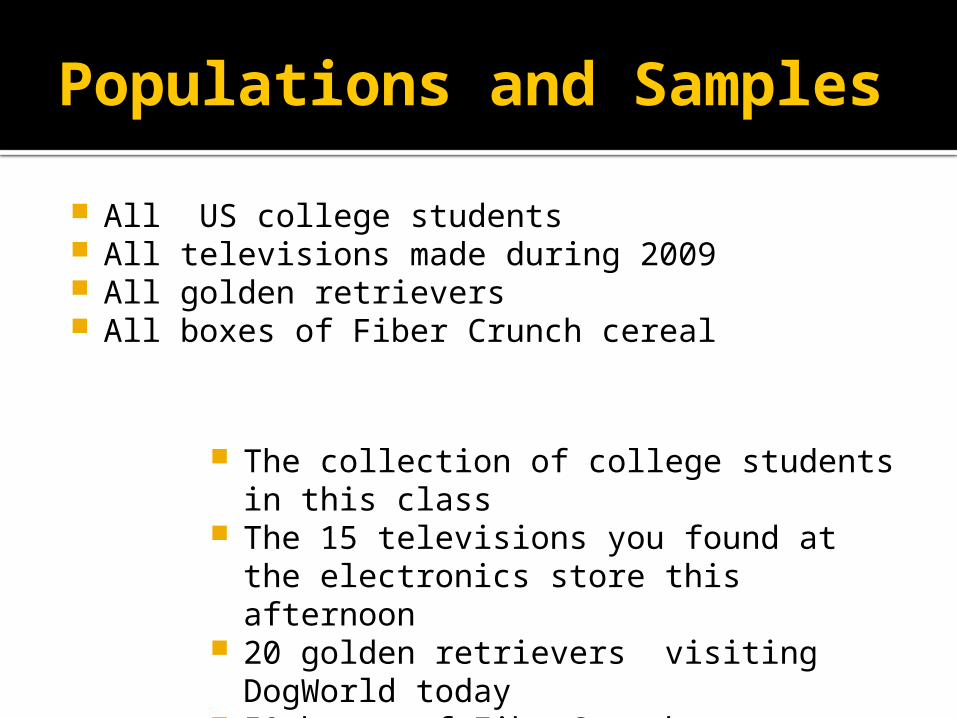
Populations and Samples All US college students All televisions made during 2009 All golden retrievers All boxes of Fiber Crunch cereal
The collection of college students in this class
The 15 televisions you found at the electronics store this afternoon
20 golden retrievers visiting DogWorld today
50 boxes of FiberCrunch
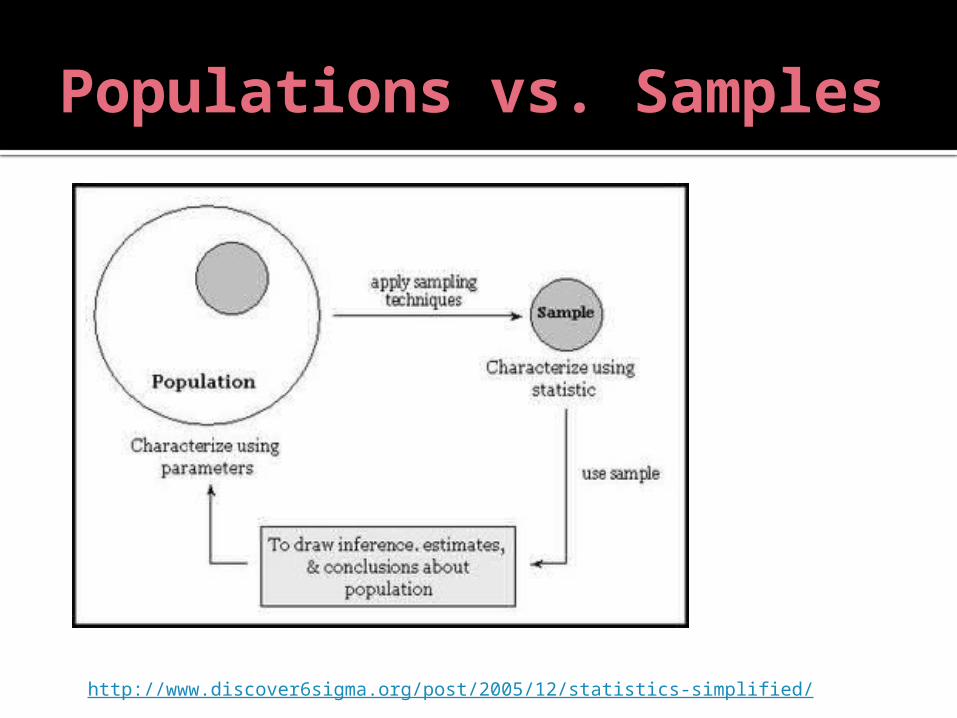
Populations vs. Samples
http://www.discover6sigma.org/post/2005/12/statistics-simplified/
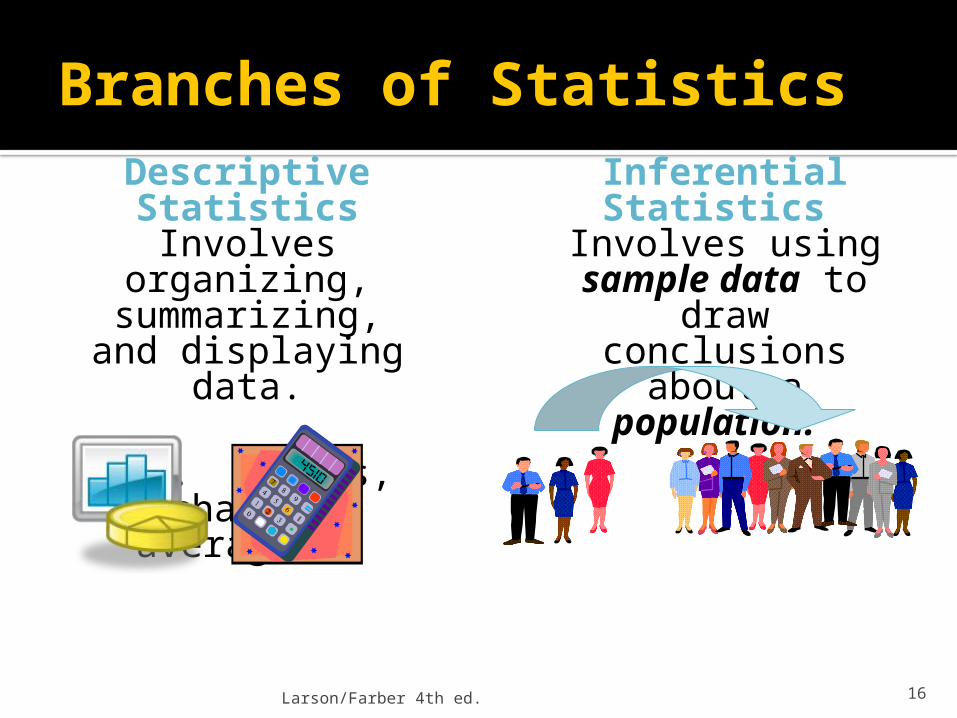
Branches of Statistics
Larson/Farber 4th ed. 16
Descriptive Statistics Involves
organizing, summarizing, and displaying data.
e.g. Tables, charts, averages
Inferential Statistics Involves using sample
data to draw conclusions about a
population.
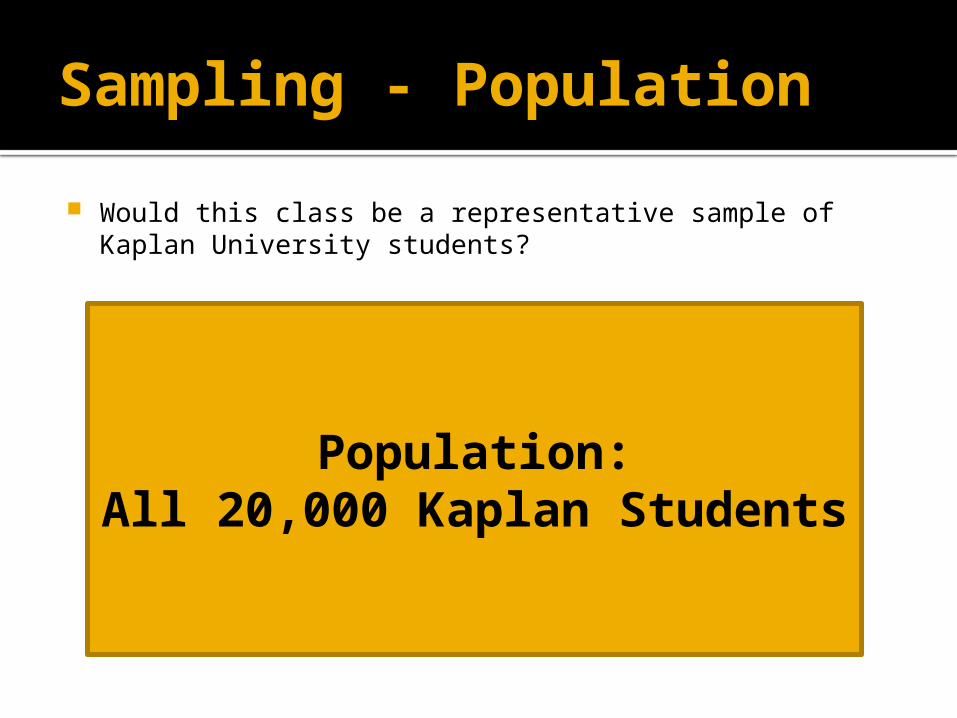
Sampling - Population
Would this class be a representative sample of Kaplan University students?
Population:All 20,000 Kaplan Students

Sampling - Samples
Would this class be a representative sample of Kaplan University students?
Sample:Randomly selected 100
students
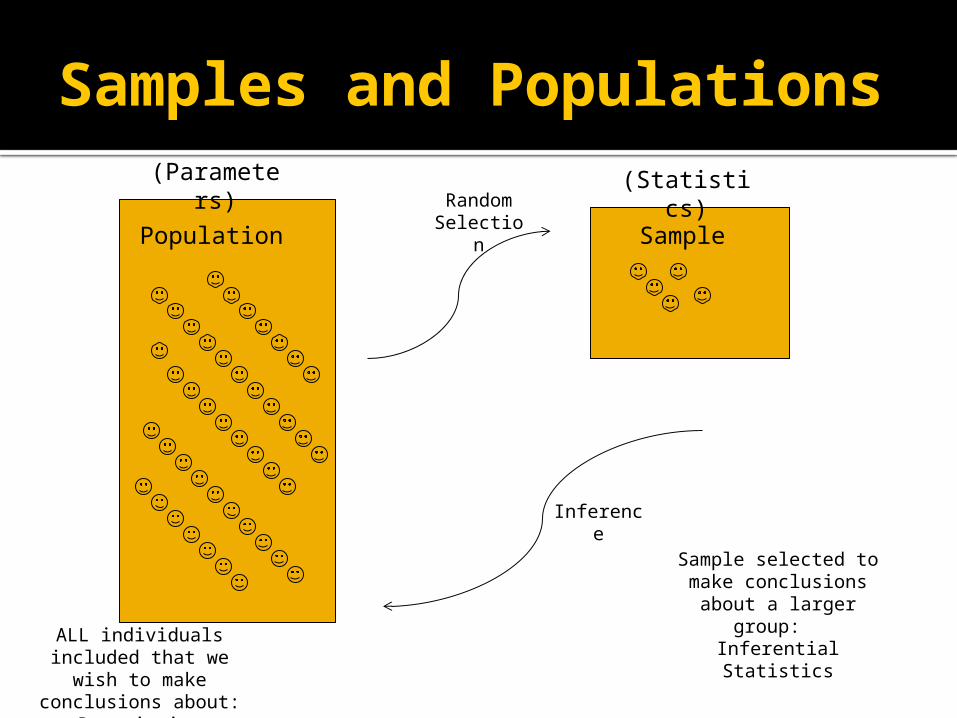
Samples and Populations
Population Sample
Inference
Random Selection
ALL individuals included that we wish to make conclusions about:
Descriptive Statistics
Sample selected to make conclusions about a
larger group: Inferential Statistics
(Parameters) (Statistics)
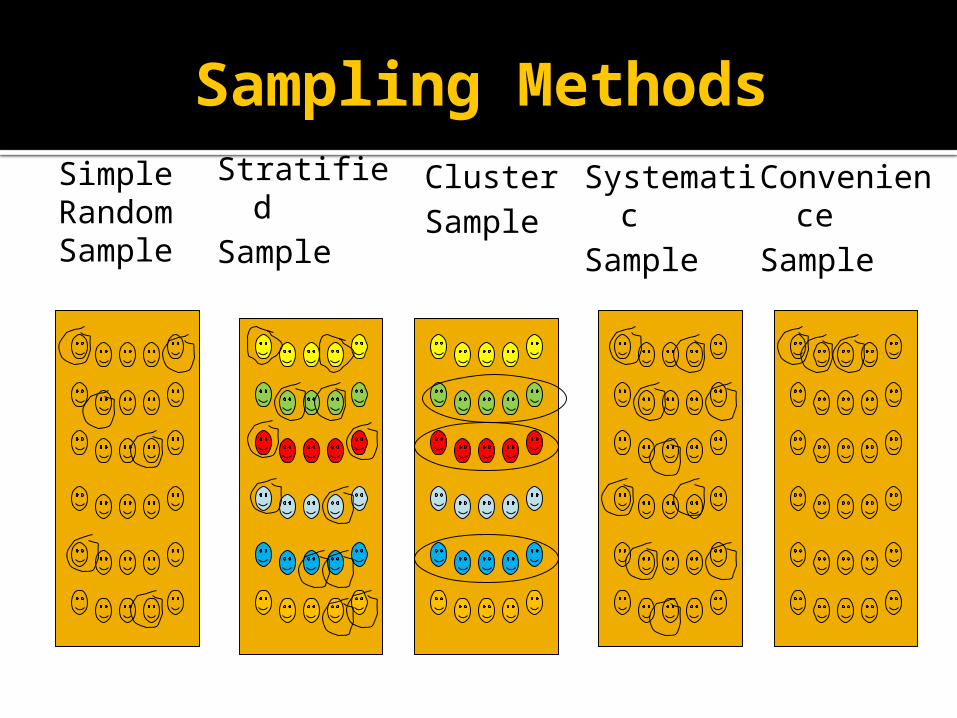
Sampling MethodsSimpleRandomSample
StratifiedSample
ClusterSample
Systematic
Sample
Convenience
Sample

Types of Data
Quantitative dataQuantitative data has a value or a numerical measurement for which you can calculate sums, products and other
numerical calculations.
Qualitative dataQualitative data is grouped into a category or group. Sums, products or other numerical calculations do not mean anything.

Example: Classifying Data by Type
The base prices of several vehicles are shown in the table. Which data are qualitative data and which are quantitative data? (Source Ford Motor Company)
22Larson/Farber 4th ed.
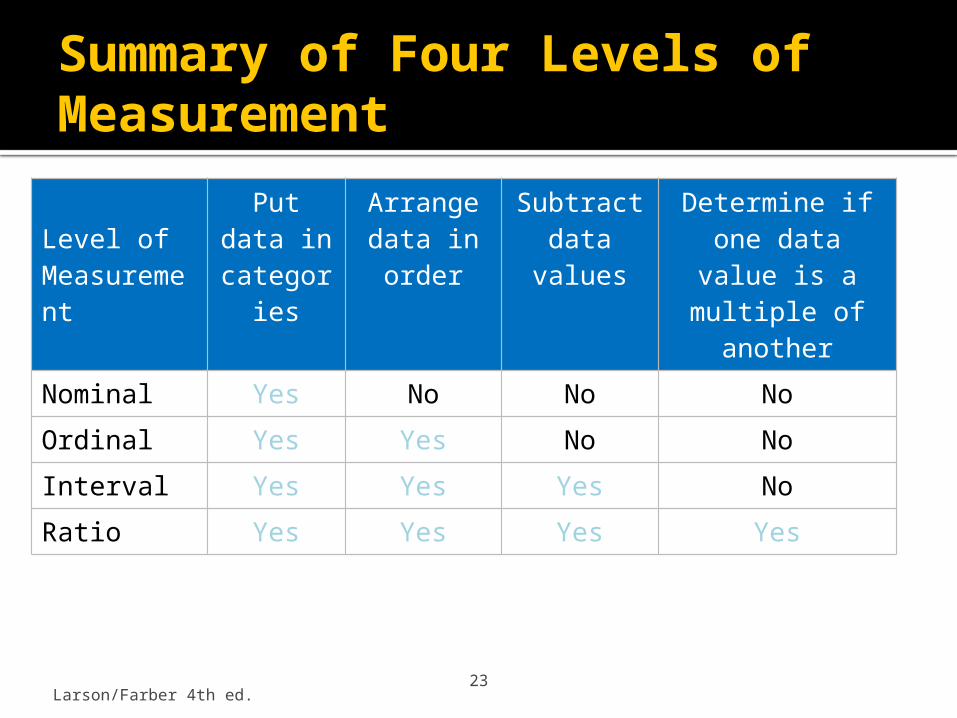
Summary of Four Levels of Measurement
Level ofMeasurement
Put data in
categories
Arrangedata inorder
Subtractdata
values
Determine if one data value is a multiple of
another
Nominal Yes No No No
Ordinal Yes Yes No No
Interval Yes Yes Yes No
Ratio Yes Yes Yes Yes
23Larson/Farber 4th ed.
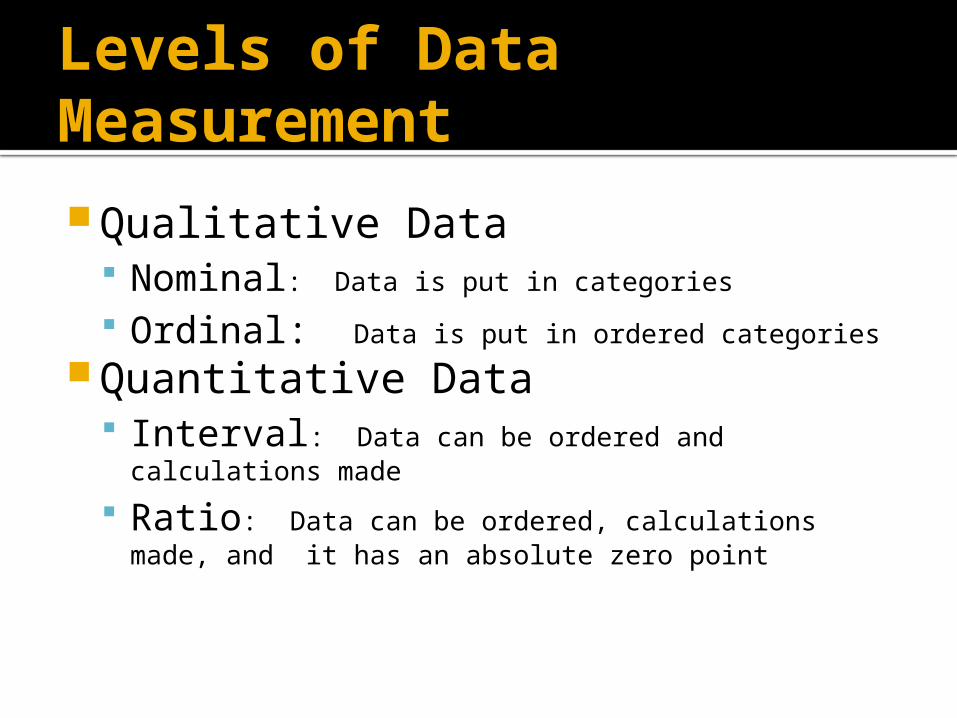
Levels of Data Measurement
Qualitative Data Nominal: Data is put in categories
Ordinal: Data is put in ordered categories
Quantitative Data Interval: Data can be ordered and calculations made
Ratio: Data can be ordered, calculations made, and it has an absolute zero point
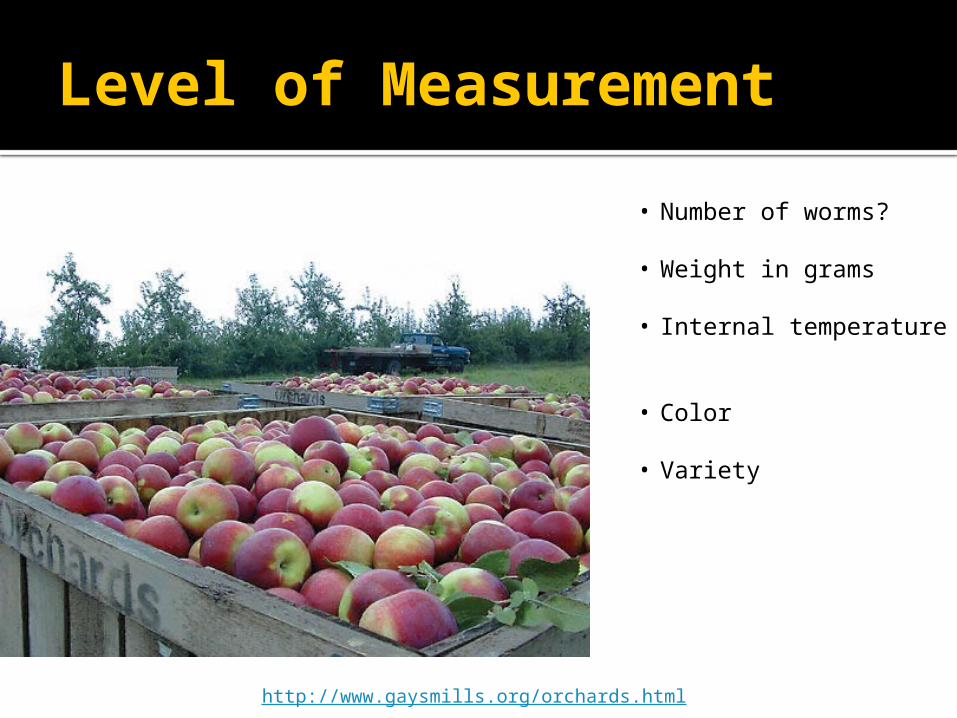
Level of Measurement
http://www.gaysmills.org/orchards.html
• Number of worms?
• Weight in grams
• Internal temperature
• Color
• Variety
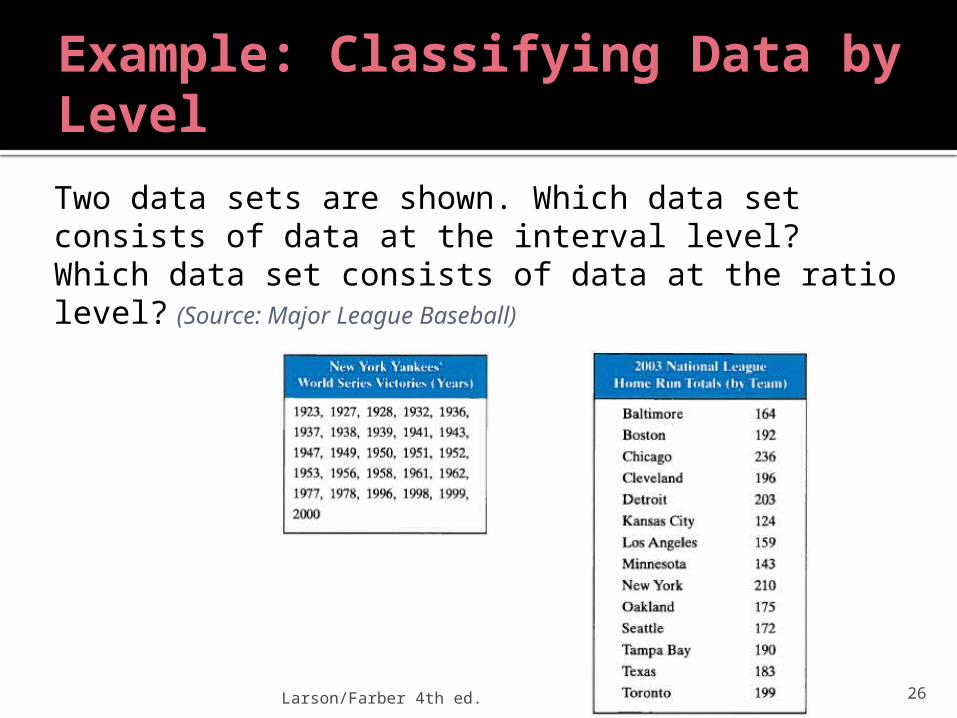
Example: Classifying Data by Level
Two data sets are shown. Which data set consists of data at the interval level? Which data set consists of data at the ratio level? (Source: Major League Baseball)
Larson/Farber 4th ed. 26

Solution: Classifying Data by Level
Interval level (Quantitative data. Can find a difference between two dates, but a ratio does not make sense.)
Larson/Farber 4th ed. 27
Ratio level (Can find differences and write
ratios.)

The End
At the end of each of my Powerpoint seminar lectures (PPT), you will find a number of self-study questions which you might find useful. I will not be covering them as part of seminar, but if we have time at the end of seminar, I am happy to answer questions.
Copyright © 2007 Pearson Education, Inc. Publishing as Pearson Addison-Wesley
Slide 1- 29
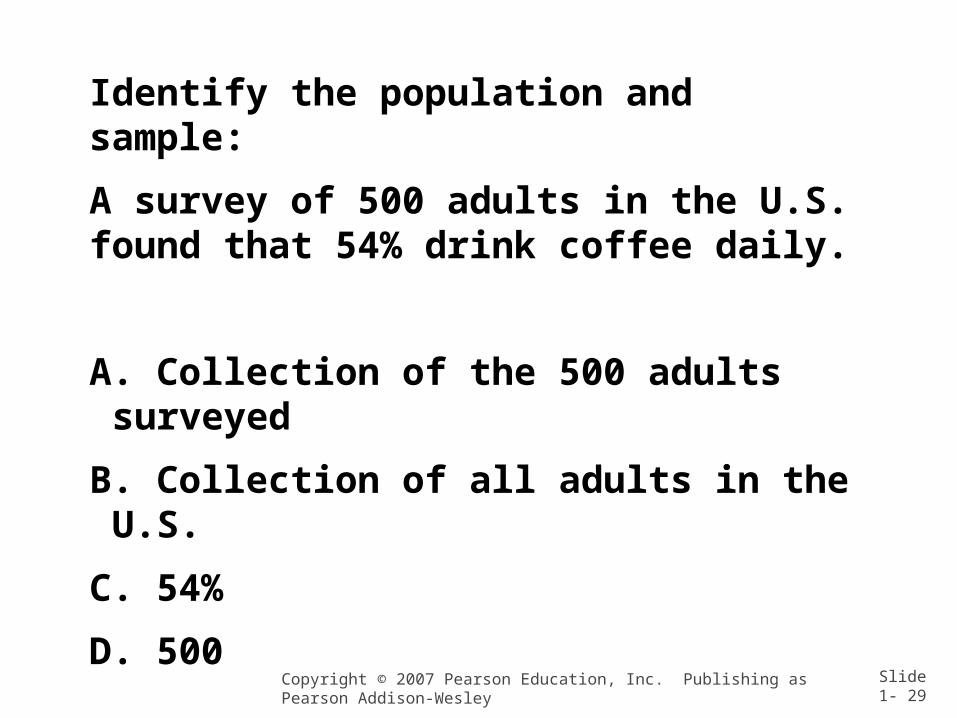
Identify the population and sample:
A survey of 500 adults in the U.S. found that 54% drink coffee daily.
A. Collection of the 500 adults surveyed
B. Collection of all adults in the U.S.
C. 54%
D. 500

Copyright © 2007 Pearson Education, Inc. Publishing as Pearson Addison-Wesley
Slide 1- 30
Identify the sampling technique used:
Students are classified according to major. Twenty students are selected from each major and asked how often they use the library.
A. Random sample
B. Stratified sample
C. Cluster sample
D. Systematic sample
Copyright © 2007 Pearson Education, Inc. Publishing as Pearson Addison-Wesley
Slide 1- 31
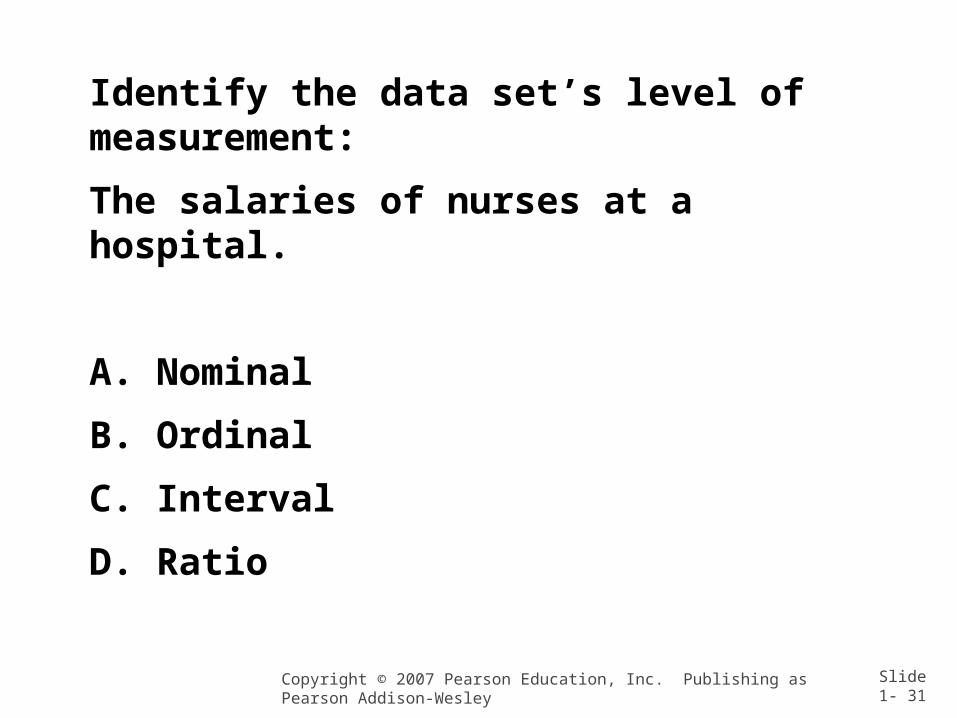
Identify the data set’s level of measurement:
The salaries of nurses at a hospital.
A. Nominal
B. Ordinal
C. Interval
D. Ratio
Copyright © 2007 Pearson Education, Inc. Publishing as Pearson Addison-Wesley
Slide 1- 32
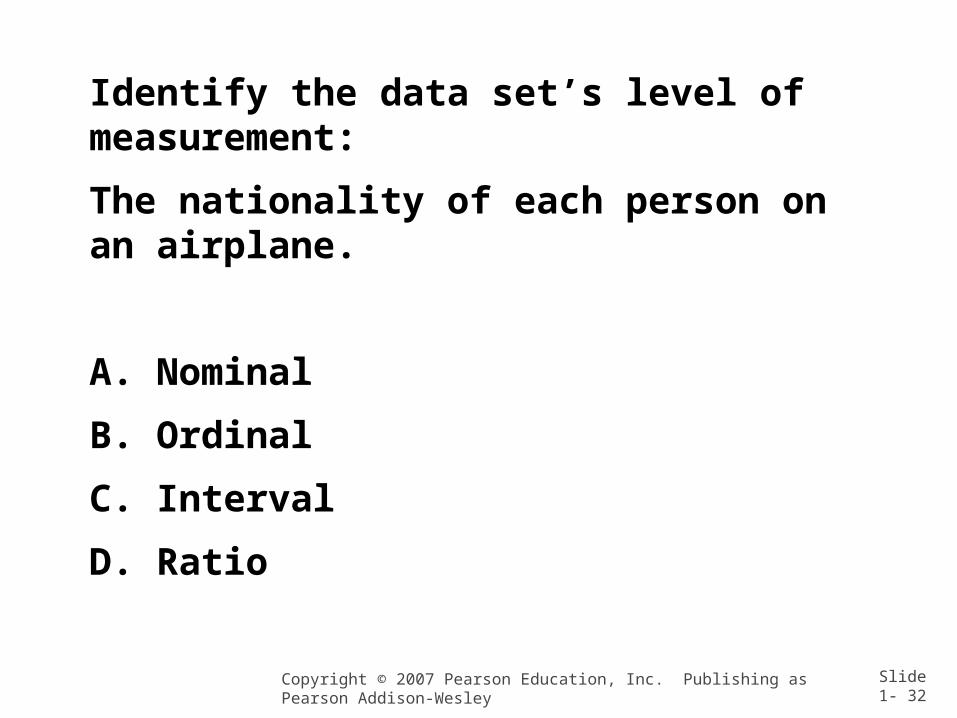
Identify the data set’s level of measurement:
The nationality of each person on an airplane.
A. Nominal
B. Ordinal
C. Interval
D. Ratio
Copyright © 2007 Pearson Education, Inc. Publishing as Pearson Addison-Wesley
Slide 1- 33
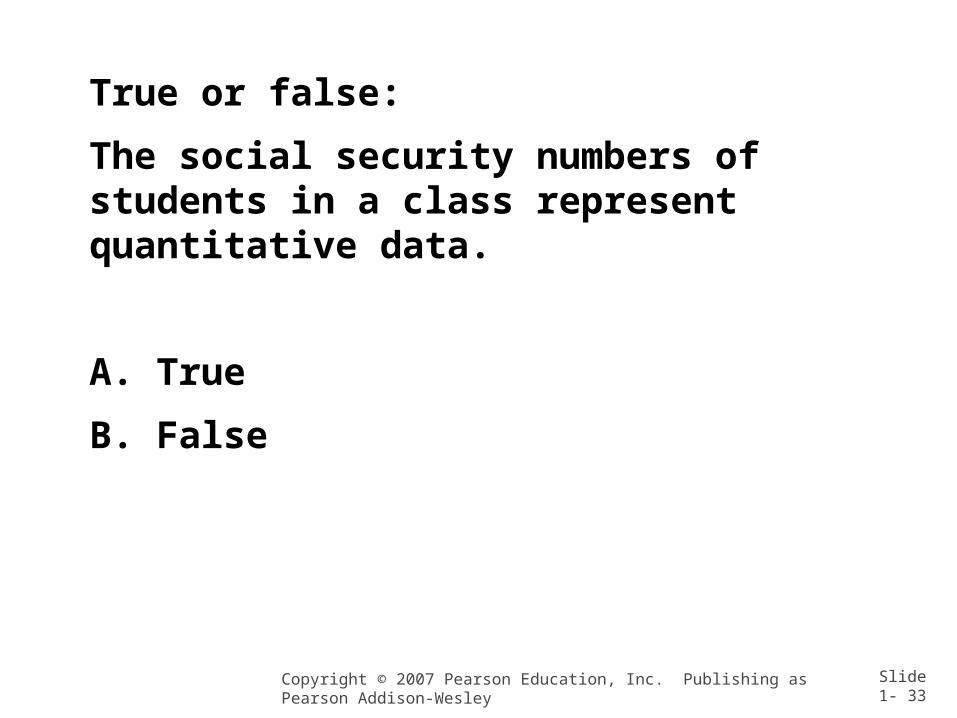
True or false:
The social security numbers of students in a class represent quantitative data.
A. True
B. False

Answers:
Population(B), Sample (A)Stratified Sample (B)Nurse’s salary: (D) RatioNationality: (A) NominalSocial Security Number: (B) False
Related Documents