Unit 1 Menu Include step by step directions for others to replicate the activity. Click in box below to begin typing. Steps will automatically number. 1. Students will be given differentiated instructions and a menu packet. 2. Students will follow the instructions and make choices on the menu board and complete the activities on ipads . 3. On the first day, students will fill out an exit ticket telling one thing they’ve learned or ask one question they have. This will facilitate the instruction for the next day’s lesson. 4. Day 2 – Teacher will answer any questions that were posed from the first day’s lesson. 5. Students will continue to work at their own pace on the ipads, keeping in mind that today is the last day. 6. Students will turn all activities in on Blackboard. 7. At the end of the lesson, students will complete a plus /delta identifying things they liked and didn’t like about the lesson to provide the teacher with feedback for future lessons. Suggested Partnering Tip: Find out which of your students know a lot about technology and then use them as your own tutors and pair them up (or put them in groups) with students who know less. Student Choice • Learning Outcome: Students will collect, organize, label, and display data in frequency tables and stem-and-leaf plots. Students will calculate and discuss mean, median, mode, and range of a set of data that is personal to the students. Students will describe, complete, and apply a pattern of differences found in an input/output table. • Common Core Standard/GLE: 29. Collect, organize, label, display, and interpret data in frequency tables, stem-and-leaf plots, and scatter plots and discuss patterns in the data verbally and in writing. 32. Calculate and discuss mean, median, mode, and range of a set of discrete data to solve real-life problems. 37. Describe, complete, and apply a pattern of differences found in an input-output table. • Description of Lesson: Students will be working on a menu to apply their knowledge of creating frequency tables, stem-and-leaf plots, collect data from peers, find the measures of central tendency of a set of data, and complete an input/output table.

Welcome message from author
This document is posted to help you gain knowledge. Please leave a comment to let me know what you think about it! Share it to your friends and learn new things together.
Transcript
Unit 1 Menu
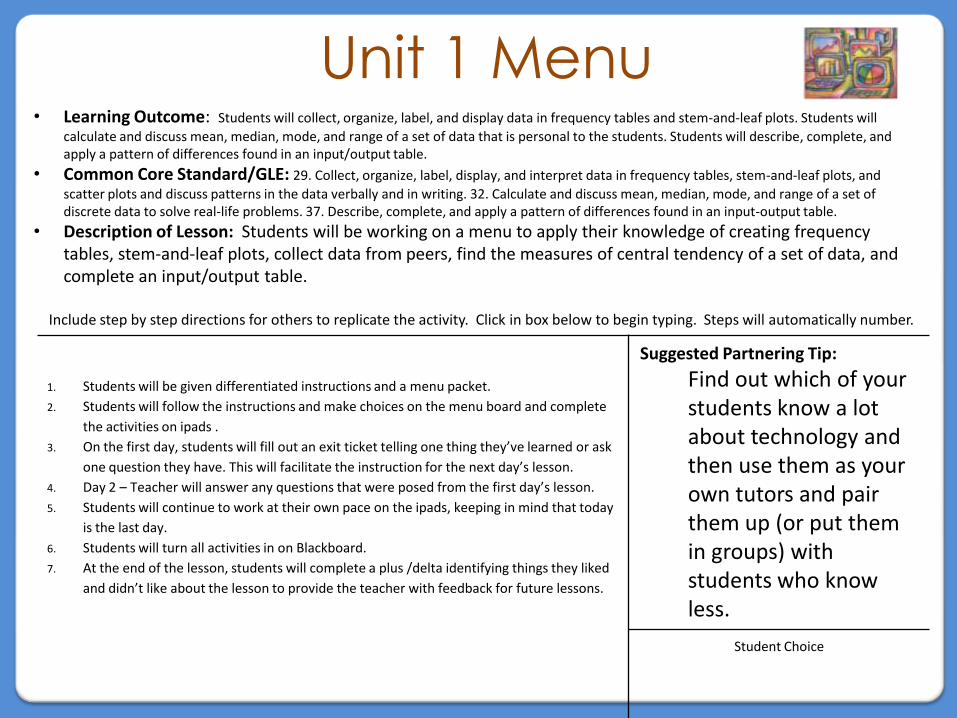
Include step by step directions for others to replicate the activity. Click in box below to begin typing. Steps will automatically number.
1. Students will be given differentiated instructions and a menu packet.
2. Students will follow the instructions and make choices on the menu board and complete
the activities on ipads .
3. On the first day, students will fill out an exit ticket telling one thing they’ve learned or ask
one question they have. This will facilitate the instruction for the next day’s lesson.
4. Day 2 – Teacher will answer any questions that were posed from the first day’s lesson.
5. Students will continue to work at their own pace on the ipads, keeping in mind that today
is the last day.
6. Students will turn all activities in on Blackboard.
7. At the end of the lesson, students will complete a plus /delta identifying things they liked
and didn’t like about the lesson to provide the teacher with feedback for future lessons.
Suggested Partnering Tip:
Find out which of your students know a lot about technology and then use them as your own tutors and pair them up (or put them in groups) with students who know less.
Student Choice
• Learning Outcome: Students will collect, organize, label, and display data in frequency tables and stem-and-leaf plots. Students will
calculate and discuss mean, median, mode, and range of a set of data that is personal to the students. Students will describe, complete, and apply a pattern of differences found in an input/output table.
• Common Core Standard/GLE: 29. Collect, organize, label, display, and interpret data in frequency tables, stem-and-leaf plots, and
scatter plots and discuss patterns in the data verbally and in writing. 32. Calculate and discuss mean, median, mode, and range of a set of discrete data to solve real-life problems. 37. Describe, complete, and apply a pattern of differences found in an input-output table.
• Description of Lesson: Students will be working on a menu to apply their knowledge of creating frequency tables, stem-and-leaf plots, collect data from peers, find the measures of central tendency of a set of data, and complete an input/output table.
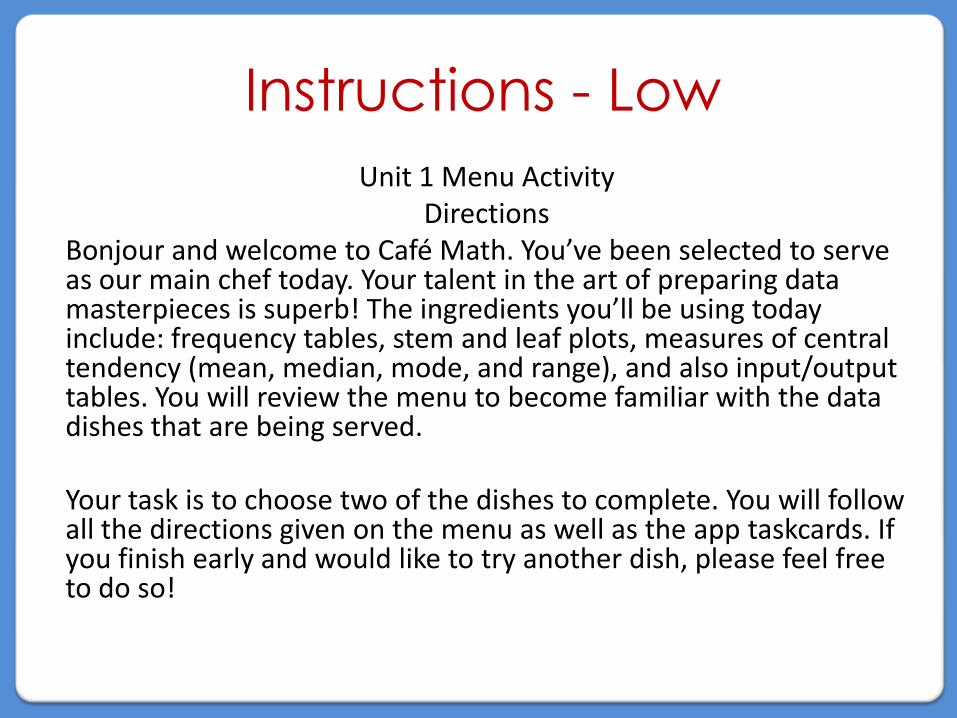
Instructions - Low
Unit 1 Menu Activity Directions
Bonjour and welcome to Café Math. You’ve been selected to serve as our main chef today. Your talent in the art of preparing data masterpieces is superb! The ingredients you’ll be using today include: frequency tables, stem and leaf plots, measures of central tendency (mean, median, mode, and range), and also input/output tables. You will review the menu to become familiar with the data dishes that are being served.
Your task is to choose two of the dishes to complete. You will follow all the directions given on the menu as well as the app taskcards. If you finish early and would like to try another dish, please feel free to do so!

Instructions - Medium
Unit 1 Menu Activity Directions
Bonjour and welcome to Café Math. You’ve been selected to serve as our main chef today. Your talent in the art of preparing data masterpieces is superb! The ingredients you’ll be using today include: frequency tables, stem and leaf plots, measures of central tendency (mean, median, mode, and range), and also input/output tables. You will review the menu to become familiar with the data dishes that are being served.
Your task is to choose three of the dishes to complete. You will follow all the directions given on the menu as well as the app taskcards. If you finish early and would like to try another dish, please feel free to do so!
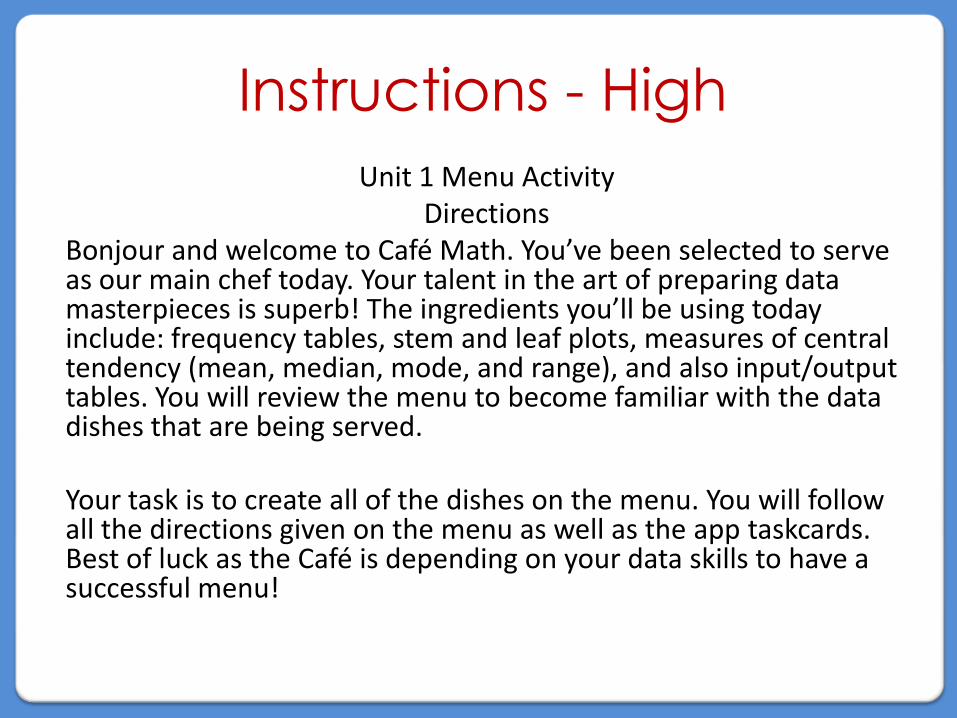
Instructions - High
Unit 1 Menu Activity Directions
Bonjour and welcome to Café Math. You’ve been selected to serve as our main chef today. Your talent in the art of preparing data masterpieces is superb! The ingredients you’ll be using today include: frequency tables, stem and leaf plots, measures of central tendency (mean, median, mode, and range), and also input/output tables. You will review the menu to become familiar with the data dishes that are being served.
Your task is to create all of the dishes on the menu. You will follow all the directions given on the menu as well as the app taskcards. Best of luck as the Café is depending on your data skills to have a successful menu!
Menu
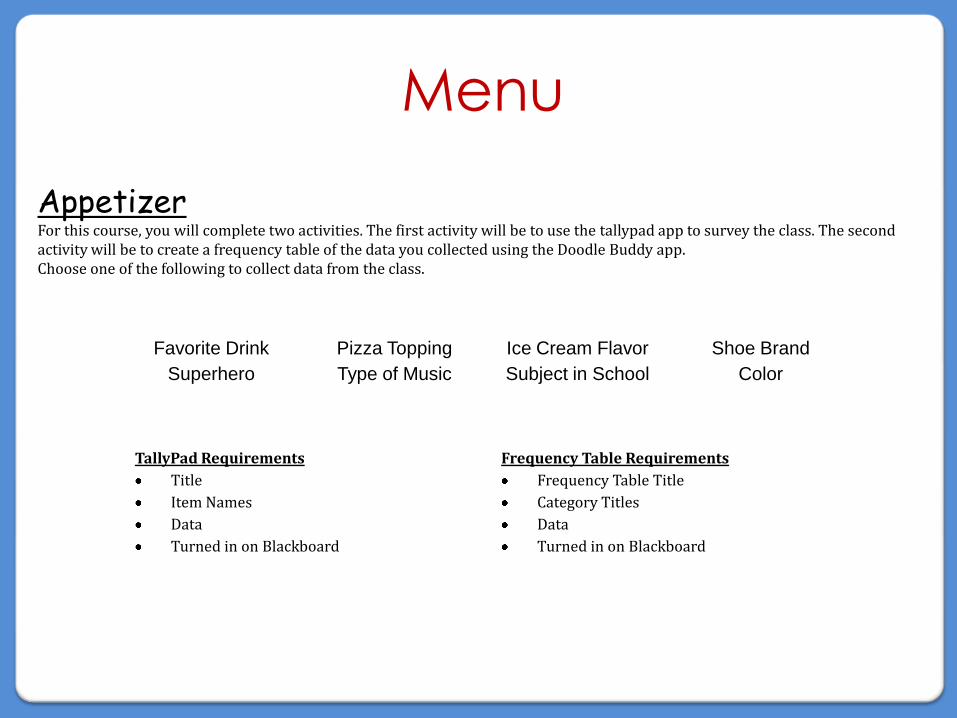
Favorite Drink Pizza Topping Ice Cream Flavor Shoe Brand
Superhero Type of Music Subject in School Color
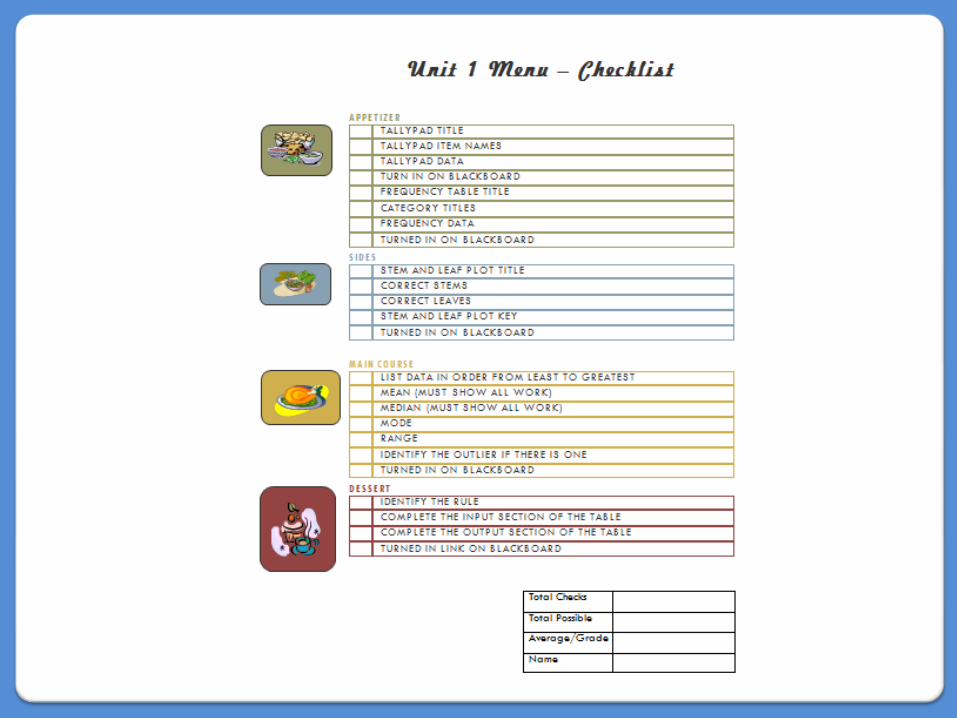
TallyPad Requirements
Title
Item Names
Data
Turned in on Blackboard
Frequency Table Requirements
Frequency Table Title
Category Titles
Data
Turned in on Blackboard
AppetizerFor this course, you will complete two activities. The first activity will be to use the tallypad app to survey the class. The second activity will be to create a frequency table of the data you collected using the Doodle Buddy app. Choose one of the following to collect data from the class.
Menu
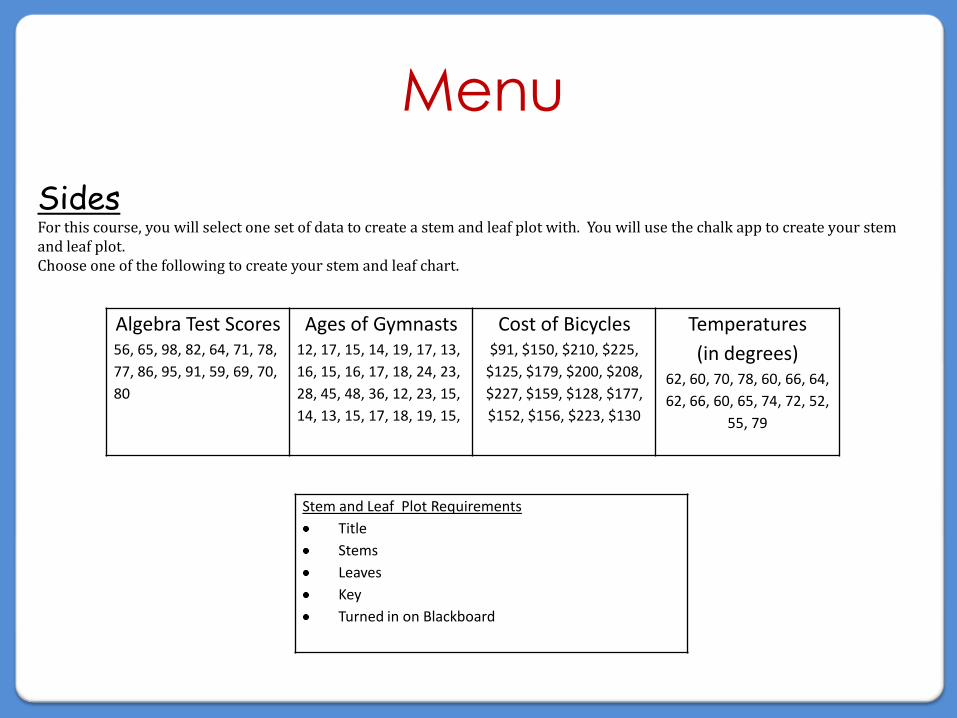
Algebra Test Scores56, 65, 98, 82, 64, 71, 78,
77, 86, 95, 91, 59, 69, 70,
80
Ages of Gymnasts12, 17, 15, 14, 19, 17, 13,
16, 15, 16, 17, 18, 24, 23,
28, 45, 48, 36, 12, 23, 15,
14, 13, 15, 17, 18, 19, 15,
Cost of Bicycles$91, $150, $210, $225,
$125, $179, $200, $208,
$227, $159, $128, $177,
$152, $156, $223, $130
Temperatures
(in degrees)62, 60, 70, 78, 60, 66, 64,
62, 66, 60, 65, 74, 72, 52,
55, 79
Stem and Leaf Plot Requirements
Title
Stems
Leaves
Key
Turned in on Blackboard
SidesFor this course, you will select one set of data to create a stem and leaf plot with. You will use the chalk app to create your stem and leaf plot. Choose one of the following to create your stem and leaf chart.

Menu
5th grade iLEAP Test Results for the Data Analysis and Probability Category
(measured in percent)2nd Hour – 57, 71, 71, 100, 57, 57, 57, 86, 86, 86, 71, 86, 57, 86, 57, 86
3rd Hour – 57, 71, 100, 100, 100, 57, 86, 29, 71, 57, 100, 86, 86, 100
4th Hour – 43, 57, 86, 57, 57, 100, 57, 71, 71, 71, 57, 53, 53, 27, 17, 86, 33, 71, 86
6th Hour – 86, 86, 86, 71, 86, 100, 71, 86, 100, 86, 86, 71, 57, 86, 71, 71, 86, 100, 71
7th Hour – 43, 86, 71, 57, 100, 71, 86, 57, 71, 57, 71, 86, 71, 86, 100, 57, 29, 100, 57, 71, 86, 71
Measures of Central Tendency Data Requirements
List data in order from least to greatest
Mean (must show all work)
Median (must show work)
Mode
Range
Identify the outlier
Turned in on Blackboard
Main CourseFor this course, you will select the set of data that correlates with your class hour. This data is taken from last year’s iLEAP test from the data analysis and probability category. You will use the educreations app to find the mean, median, mode, and range of the class set of data. Choose one of the following to find the measures of central tendency (mean, median, mode, and range) of the set of data.
Menu
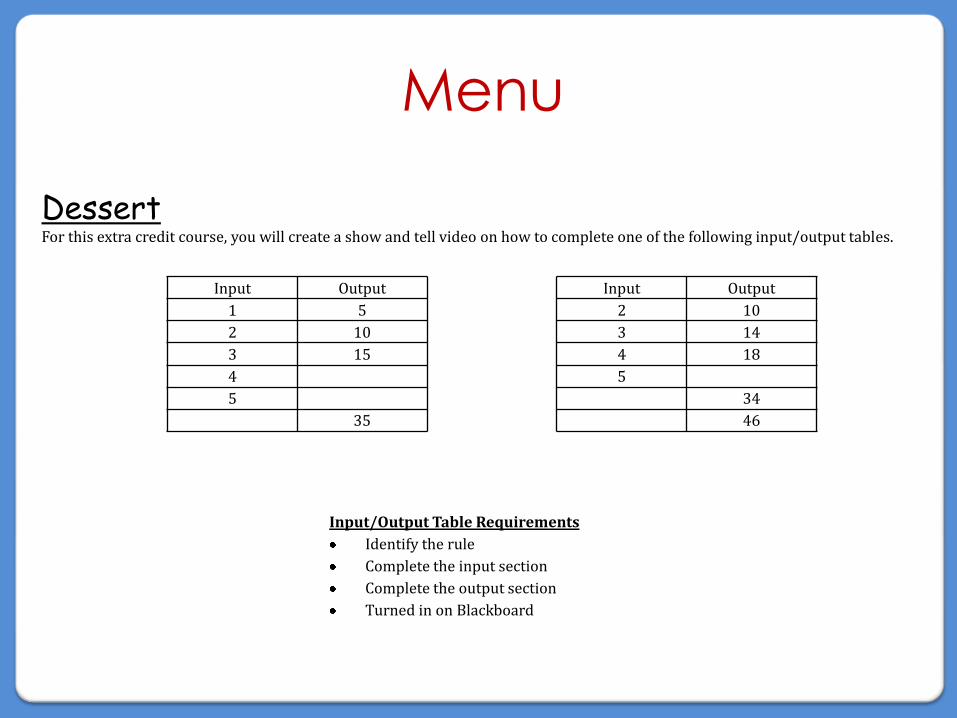
Input Output Input Output
1 5 2 10
2 10 3 14
3 15 4 18
4 5
5 34
35 46
Input/Output Table Requirements
Identify the rule
Complete the input section
Complete the output section
Turned in on Blackboard
DessertFor this extra credit course, you will create a show and tell video on how to complete one of the following input/output tables.
Appetizer
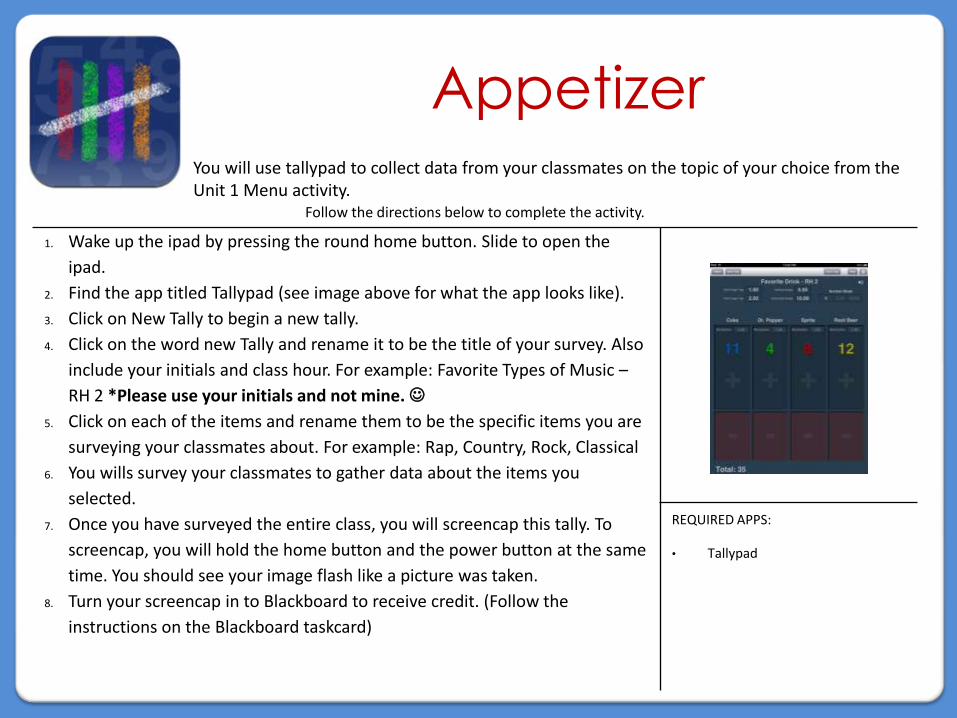
Follow the directions below to complete the activity.
1. Wake up the ipad by pressing the round home button. Slide to open the
ipad.
2. Find the app titled Tallypad (see image above for what the app looks like).
3. Click on New Tally to begin a new tally.
4. Click on the word new Tally and rename it to be the title of your survey. Also
include your initials and class hour. For example: Favorite Types of Music –
RH 2 *Please use your initials and not mine.
5. Click on each of the items and rename them to be the specific items you are
surveying your classmates about. For example: Rap, Country, Rock, Classical
6. You wills survey your classmates to gather data about the items you
selected.
7. Once you have surveyed the entire class, you will screencap this tally. To
screencap, you will hold the home button and the power button at the same
time. You should see your image flash like a picture was taken.
8. Turn your screencap in to Blackboard to receive credit. (Follow the
instructions on the Blackboard taskcard)
REQUIRED APPS:
• Tallypad
You will use tallypad to collect data from your classmates on the topic of your choice from the Unit 1 Menu activity.

Appetizer - 2
Follow the directions below to complete the activity.
1. Wake up the ipad by pressing the round home button. Slide to open the
ipad.
2. Find the app titled Doodle Buddy (see image above for what the app looks
like).
3. Click on the chalk to adjust your pen color as well as the size of your pen. I
would recommend you make your pen smaller so you have plenty of room
to make your tally marks.
4. You may use the Tt (text) tool to type as much of your data as possible.
Please note that once you type it and move the text, you may not edit it.
5. You are welcome to change the background color, but make sure that I can
read everything on your frequency table.
6. If you want to change the color of text or drawing, click on the chalk to
select the color before you do any drawing or typing. You must change the
color first before you actually draw or color.
7. Please make sure to put your first and last initial and hour in the bottom
right corner.
8. Turn your screencap in to Blackboard to receive credit. (Follow the
instructions on the Blackboard taskcard)
REQUIRED APPS:
• Doodle Buddy
You will use doodlebuddy to create a frequency table of the data you collected from the tallypad app.

Sides
Follow the directions below to complete the activity.
1. Wake up the ipad by pressing the round home button. Slide to open the
ipad.
2. Find the app titled Chalk (see image above for what the app looks like).
3. Select your color of chalk or marker if you chose. Click on the colored boxes
to go full screen. The colored boxes in the top right corner will help you
toggle back and forth between full screen and your menu.
4. Create a stem and leaf plot based on the data you selected from the Unit 1
menu activity.
5. Make sure that all data is accounted for. Create a key for your stem and leaf.
6. Make sure your initials and hour are in the bottom right corner.
7. Turn your screencap in to Blackboard to receive credit. (Follow the
instructions on the Blackboard taskcard) REQUIRED APPS:
• Chalk
You will use chalk app to create a stem and leaf plot for the set of data.
Main Course
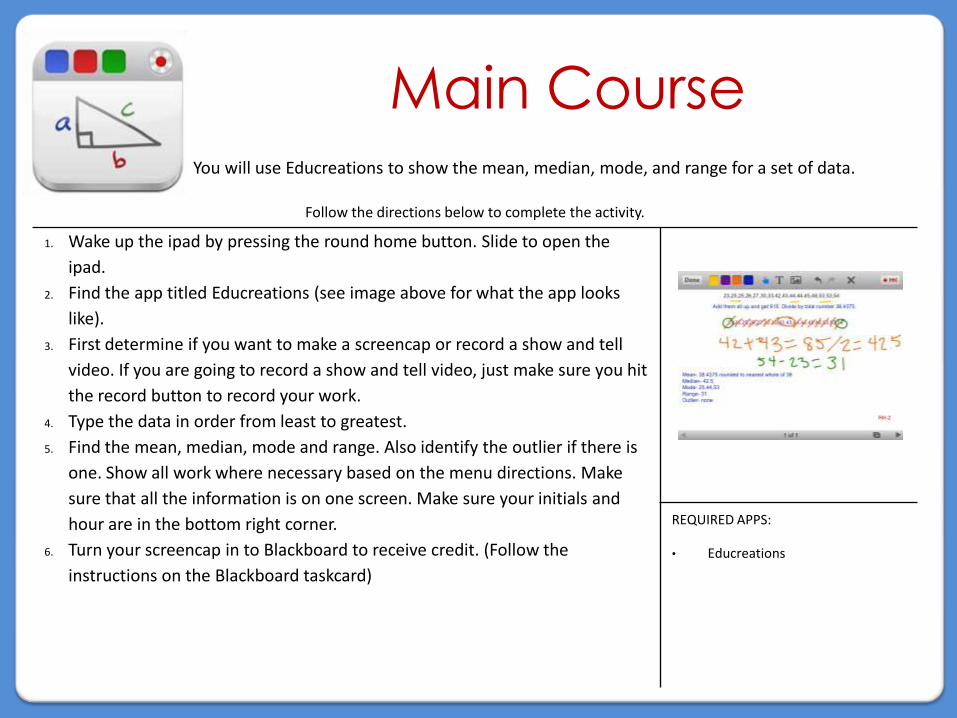
Follow the directions below to complete the activity.
1. Wake up the ipad by pressing the round home button. Slide to open the
ipad.
2. Find the app titled Educreations (see image above for what the app looks
like).
3. First determine if you want to make a screencap or record a show and tell
video. If you are going to record a show and tell video, just make sure you hit
the record button to record your work.
4. Type the data in order from least to greatest.
5. Find the mean, median, mode and range. Also identify the outlier if there is
one. Show all work where necessary based on the menu directions. Make
sure that all the information is on one screen. Make sure your initials and
hour are in the bottom right corner.
6. Turn your screencap in to Blackboard to receive credit. (Follow the
instructions on the Blackboard taskcard)
REQUIRED APPS:
• Educreations
You will use Educreations to show the mean, median, mode, and range for a set of data.

Dessert
Follow the directions below to complete the activity.
1. Wake up the ipad by pressing the round home button. Slide to open the
ipad.
2. Find the app titled Educreations (see image above for what the app looks
like).
3. Create the input/output table before recording. Use one color to type in
what was provided in class. Use a different color to input the new
information. Make sure to identify the rule prior to recording the problem.
4. When you are ready to record your problem as you work, hit the rec button
in the top right corner.
5. Show and tell how to find the rule in a given input/output table. Explain
what the rule is in your input/output table. Complete the chart and explain
how you got the answers.
6. You may use your calculator to help find solutions. Please pause it while you
work on the calculator. Remember to hit record again before you complete
the recording.
REQUIRED APPS:
• Educreations
You will use Educreations to create a show and tell video completing an input/output table. You will select one from the Unit 1 Menu activity.
Dessert
Follow the directions below to complete the activity.
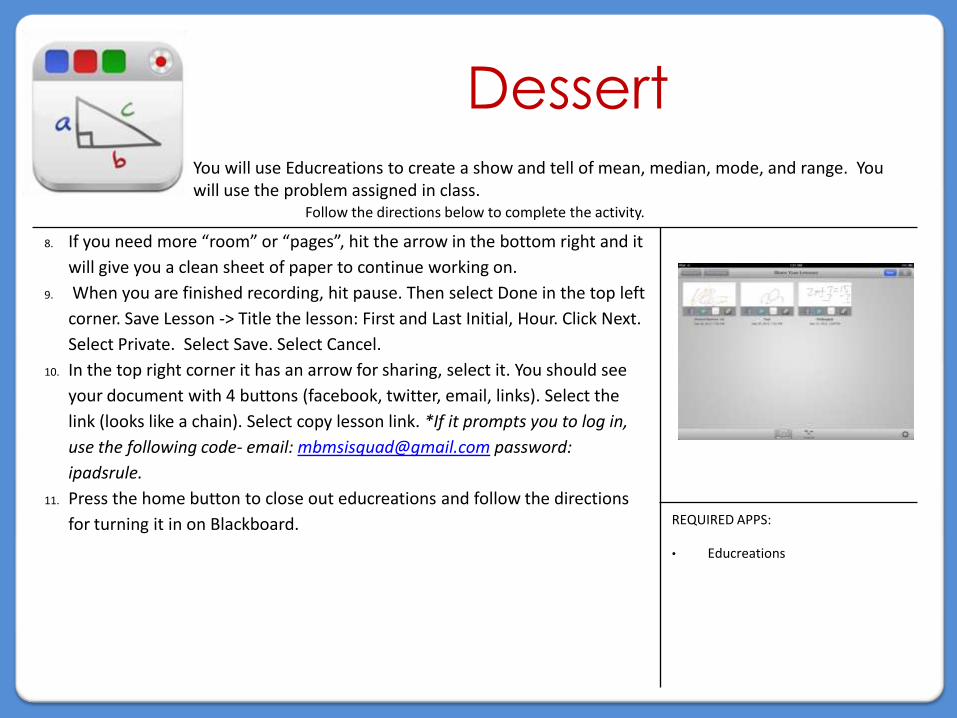
8. If you need more “room” or “pages”, hit the arrow in the bottom right and it
will give you a clean sheet of paper to continue working on.
9. When you are finished recording, hit pause. Then select Done in the top left
corner. Save Lesson -> Title the lesson: First and Last Initial, Hour. Click Next.
Select Private. Select Save. Select Cancel.
10. In the top right corner it has an arrow for sharing, select it. You should see
your document with 4 buttons (facebook, twitter, email, links). Select the
link (looks like a chain). Select copy lesson link. *If it prompts you to log in,
use the following code- email: [email protected] password:
ipadsrule.
11. Press the home button to close out educreations and follow the directions
for turning it in on Blackboard. REQUIRED APPS:
• Educreations
You will use Educreations to create a show and tell of mean, median, mode, and range. You will use the problem assigned in class.
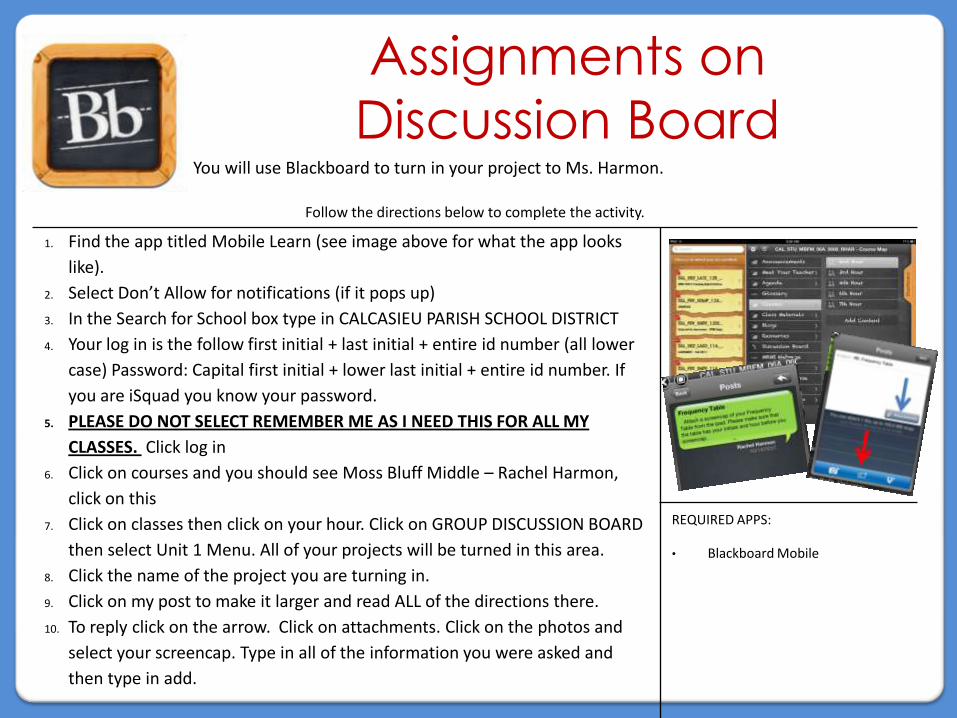
Assignments on
Discussion Board
Follow the directions below to complete the activity.
1. Find the app titled Mobile Learn (see image above for what the app looks
like).
2. Select Don’t Allow for notifications (if it pops up)
3. In the Search for School box type in CALCASIEU PARISH SCHOOL DISTRICT
4. Your log in is the follow first initial + last initial + entire id number (all lower
case) Password: Capital first initial + lower last initial + entire id number. If
you are iSquad you know your password.
5. PLEASE DO NOT SELECT REMEMBER ME AS I NEED THIS FOR ALL MY
CLASSES. Click log in
6. Click on courses and you should see Moss Bluff Middle – Rachel Harmon,
click on this
7. Click on classes then click on your hour. Click on GROUP DISCUSSION BOARD
then select Unit 1 Menu. All of your projects will be turned in this area.
8. Click the name of the project you are turning in.
9. Click on my post to make it larger and read ALL of the directions there.
10. To reply click on the arrow. Click on attachments. Click on the photos and
select your screencap. Type in all of the information you were asked and
then type in add.
REQUIRED APPS:
• Blackboard Mobile
You will use Blackboard to turn in your project to Ms. Harmon.

Exit Ticket
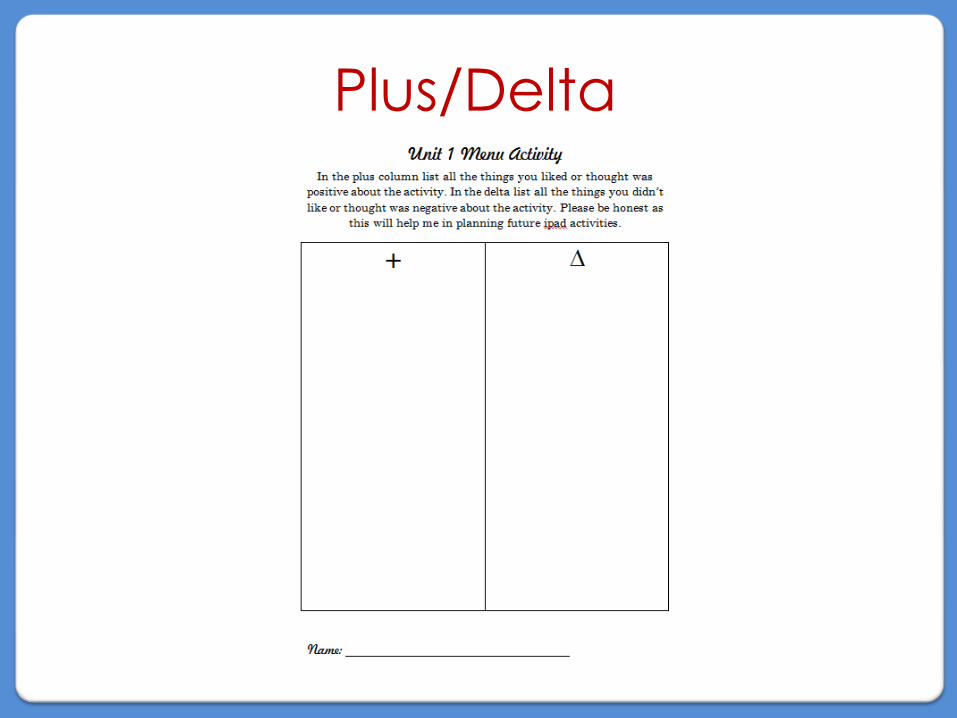
Plus/Delta
Related Documents