*28GBY1101* *28GBY1101* 9483 *GBY11* *GBY11* General Certificate of Secondary Education 2015 Biology Unit 1 Foundation Tier [GBY11] FRIDAY 5 JUNE, AFTERNOON Centre Number Candidate Number TIME 1 hour 15 minutes. INSTRUCTIONS TO CANDIDATES Write your Centre Number and Candidate Number in the spaces provided at the top of this page. You must answer the questions in the spaces provided. Do not write outside the boxed area on each page or on blank pages. Complete in blue or black ink only. Do not write with a gel pen. Answer all twelve questions. INFORMATION FOR CANDIDATES The total mark for this paper is 80. Figures in brackets printed down the right-hand side of pages indicate the marks awarded to each question or part question. Quality of written communication will be assessed in Questions 4 and 12.

Welcome message from author
This document is posted to help you gain knowledge. Please leave a comment to let me know what you think about it! Share it to your friends and learn new things together.
Transcript

*28GBY1101*
*28GBY1101*
9483
*GBY11*
*GBY11*
General Certificate of Secondary Education2015
Biology
Unit 1Foundation Tier
[GBY11]FRIDAY 5 JUNE, AFTERNOON
Centre Number
Candidate Number
TIME1 hour 15 minutes.
INSTRUCTIONS TO CANDIDATESWrite your Centre Number and Candidate Number in the spaces provided at the top of this page.You must answer the questions in the spaces provided. Do not write outside the boxed area on each page or on blank pages.Complete in blue or black ink only. Do not write with a gel pen.Answer all twelve questions.
INFORMATION FOR CANDIDATESThe total mark for this paper is 80.Figures in brackets printed down the right-hand side of pages indicate the marks awarded to each question or part question.Quality of written communication will be assessed in Questions 4 and 12.

*28GBY1102*
*28GBY1102*
9483
1 The drawings show leaves from five species of tree.
leaf A leaf B leaf C
leaf D leaf E
leaflet
needle
Look at the drawings.
(a) Use the key to identify which leaves belong to Maple, Jack pine and Buckeye trees.
Write the correct letter in each box.
1. Leaf made up of needles go to 2 Leaf not made up of needles go to 3
2. Leaf made up of two needles Jack pine ................. Leaf made up of five needles White pine
3. Leaf made up of leaflets go to 4 Leaf not made up of leaflets Maple ......................
4. Leaf made up of five leaflets Buckeye .................. Leaf made up of seven leaflets Horse Chestnut
[3]
(b) Trees belong to the plant kingdom.
Give one feature found only in the plant kingdom.
_______________________________________________________________
_____________________________________________________________ [1]
© CCEA

[Turn over
*28GBY1103*
*28GBY1103*
9483
2 Carbohydrates, fats and proteins are food groups found in a balanced diet.
(a) Name one element contained in all these food groups.
_________________________ [1]
(b) The lists give three foods and five food groups.
Each food is made up of one main food group.
Draw lines to link each food to its main food group.
Type of food Food Group
fat
potato
protein
butter
mineral
chicken
carbohydrate
vitamin
[3]
*28GBY1104*
*28GBY1104*
9483
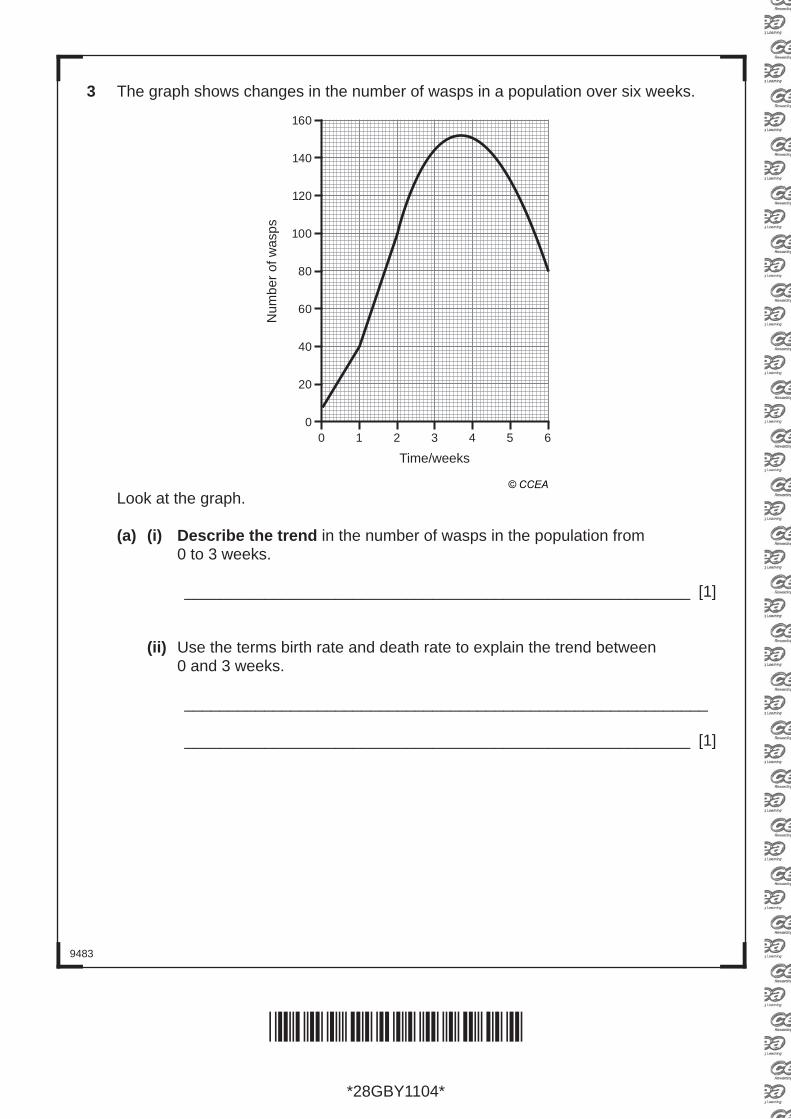
3 The graph shows changes in the number of wasps in a population over six weeks.
Num
ber o
f was
ps
160
140
120
100
80
60
40
20
00 1 2 3 4 5 6
Time/weeks
Look at the graph.
(a) (i) Describe the trend in the number of wasps in the population from 0 to 3 weeks.
_________________________________________________________ [1]
(ii) Use the terms birth rate and death rate to explain the trend between 0 and 3 weeks.
___________________________________________________________
_________________________________________________________ [1]
© CCEA
[Turn over
*28GBY1105*
*28GBY1105*
9483
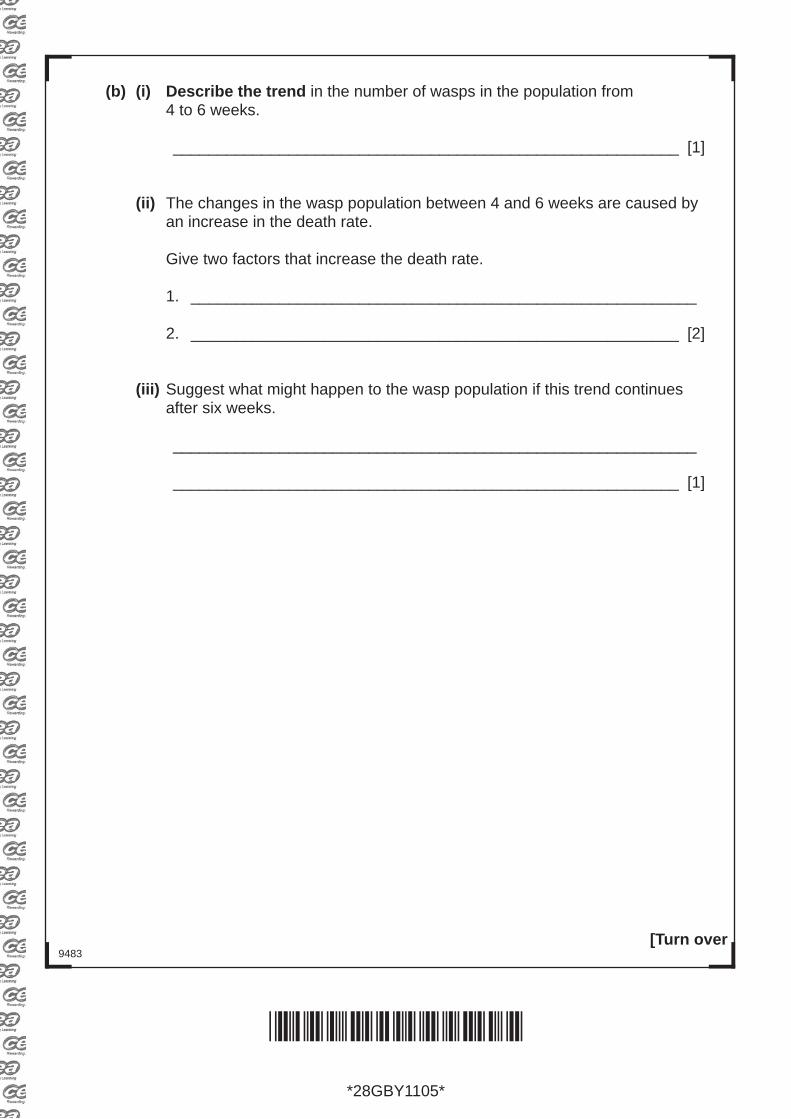
(b) (i) Describe the trend in the number of wasps in the population from 4 to 6 weeks.
_________________________________________________________ [1]
(ii) The changes in the wasp population between 4 and 6 weeks are caused by an increase in the death rate.
Give two factors that increase the death rate.
1. _________________________________________________________
2. _______________________________________________________ [2]
(iii) Suggest what might happen to the wasp population if this trend continues after six weeks.
___________________________________________________________
_________________________________________________________ [1]

*28GBY1106*
*28GBY1106*
9483
4 The diagrams show the steps used to test a leaf for starch.
.
.
.
.
water
chemical Y
water
reagent Z
water
step 1 step 2
step 3 step 4
© GCSE Biology for CCEA second edition by James Napier. Published by Hodder Education in 2011. ISBN: 9780340983805. Reproduced by permission of Hodder Education.

[Turn over
*28GBY1107*
*28GBY1107*
9483
Look at the diagrams.
Use the information in the diagrams to help you to describe and explain what is happening during each step.
• Nameanychemicalsorreagentsused. • Explainwhyeachstepiscarriedout. • Describeanysafetyprecautionsneeded.
In this question you will be assessed on your written communication skills, including the use of specialist scientific terms.
__________________________________________________________________
__________________________________________________________________
__________________________________________________________________
__________________________________________________________________
__________________________________________________________________
__________________________________________________________________
__________________________________________________________________
__________________________________________________________________
__________________________________________________________________
__________________________________________________________________
__________________________________________________________________
__________________________________________________________________
__________________________________________________________________
__________________________________________________________________
__________________________________________________________________
__________________________________________________________________
________________________________________________________________ [6]

*28GBY1108*
*28GBY1108*
9483
5 The photograph shows a magnified onion cell.
Look at the photograph.
(a) Name part A.
A _________________________ [1]
(b) (i) Use the scale provided to measure the length of the cell in the photograph along the line X–Y.
_____________ mm [1]
(ii) The cell in the photograph is magnified 200 times.
The actual length of a cell can be calculated using the formula
actual length of cell =
length of cell in photograph magnification
Calculate the actual length of this onion cell. Show your working.
Actual length of cell. _____________ mm [2]
© CCEA

[Turn over
*28GBY1109*
*28GBY1109*
9483
The diagram shows another type of cell.
It has been magnified 70 000 times.
non-cellulose cell wall
genetic material (double strands) plasmid
© GCSE Biology for CCEA second edition by James Napier. Published by Hodder Education in 2011. ISBN: 9780340983805. Reproduced by permission of Hodder Education.
(c) How does the actual size of this cell compare to the actual size of the onion cell?
_____________________________________________________________ [1]
(d) Give two other ways this cell differs from the onion cell.
1. _____________________________________________________________
_____________________________________________________________ [1]
2. _____________________________________________________________
_____________________________________________________________ [1]
(e) Use the information in the diagram to suggest the name of this type of cell.
Drawacirclearoundthecorrectanswer.
leaf bacterium cheek root hair [1]

9483
*28GBY1110*
*28GBY1110*
BLANK PAGE
DO NOT WRITE ON THIS PAGE
[Turn over9483
*28GBY1111*
*28GBY1111*
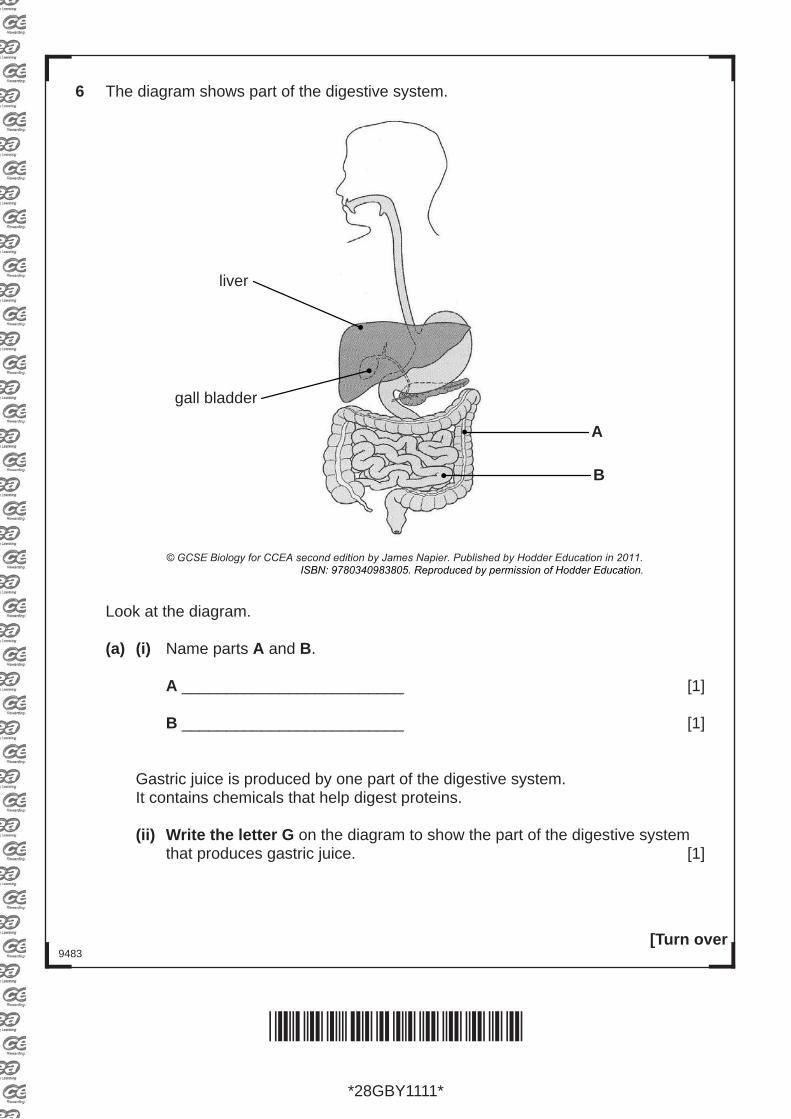
6 The diagram shows part of the digestive system.
A
liver
gall bladder
B
© GCSE Biology for CCEA second edition by James Napier. Published by Hodder Education in 2011.
Look at the diagram.
(a) (i) Name parts A and B.
A _________________________ [1]
B _________________________ [1]
Gastric juice is produced by one part of the digestive system. It contains chemicals that help digest proteins.
(ii) Write the letter G on the diagram to show the part of the digestive system that produces gastric juice. [1]
ISBN: 9780340983805. Reproduced by permission of Hodder Education.

9483
*28GBY1112*
*28GBY1112*
(iii) Name two of the chemicals in gastric juice that help the digestion of proteins.
Drawcirclesaroundthecorrectanswers.
mucus acid protease amylase [2]
(b) Bile helps digest fats. (i) Name the organ that produces bile.
_________________________ [1]
An experiment was set up to investigate the effect of bile on the action of lipase.
Two test tubes containing milk and lipase were placed in a water bath at 25°C.
Bile was added to test tube B.
The time taken to digest the fat in the milk was recorded.
water bath25°C
milk + lipase milk + lipase + bile
A B
(ii) What should be added to test tube A to make this a fair test? _________________________ [1]
© CCEA
[Turn over9483
*28GBY1113*
*28GBY1113*
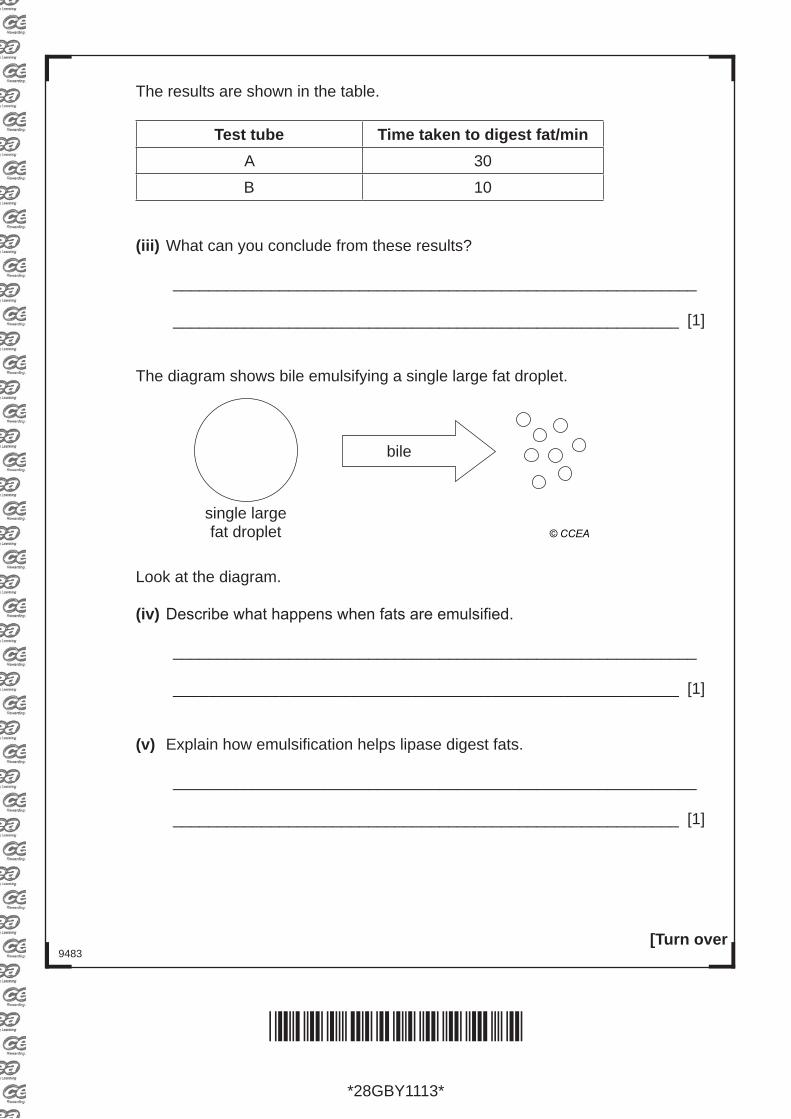
The results are shown in the table.
Test tube Time taken to digest fat/minA 30B 10
(iii) What can you conclude from these results?
___________________________________________________________
_________________________________________________________ [1]
The diagram shows bile emulsifying a single large fat droplet.
bile
single large fat droplet
Look at the diagram.
(iv) Describewhathappenswhenfatsareemulsified.
___________________________________________________________
_________________________________________________________ [1]
(v) Explain how emulsification helps lipase digest fats.
___________________________________________________________
_________________________________________________________ [1]
© CCEA
9483
*28GBY1114*
*28GBY1114*
7 (a) The nervous system and hormonal system use signals which enable one part of the body to communicate with another.
(i) Name the type of signal used in each system.
Nervous ________________________ [1]
Hormonal _______________________ [1]
(ii) The two systems also differ in the speed of their response.
Describehowthespeedsdiffer.
___________________________________________________________
_________________________________________________________ [1]
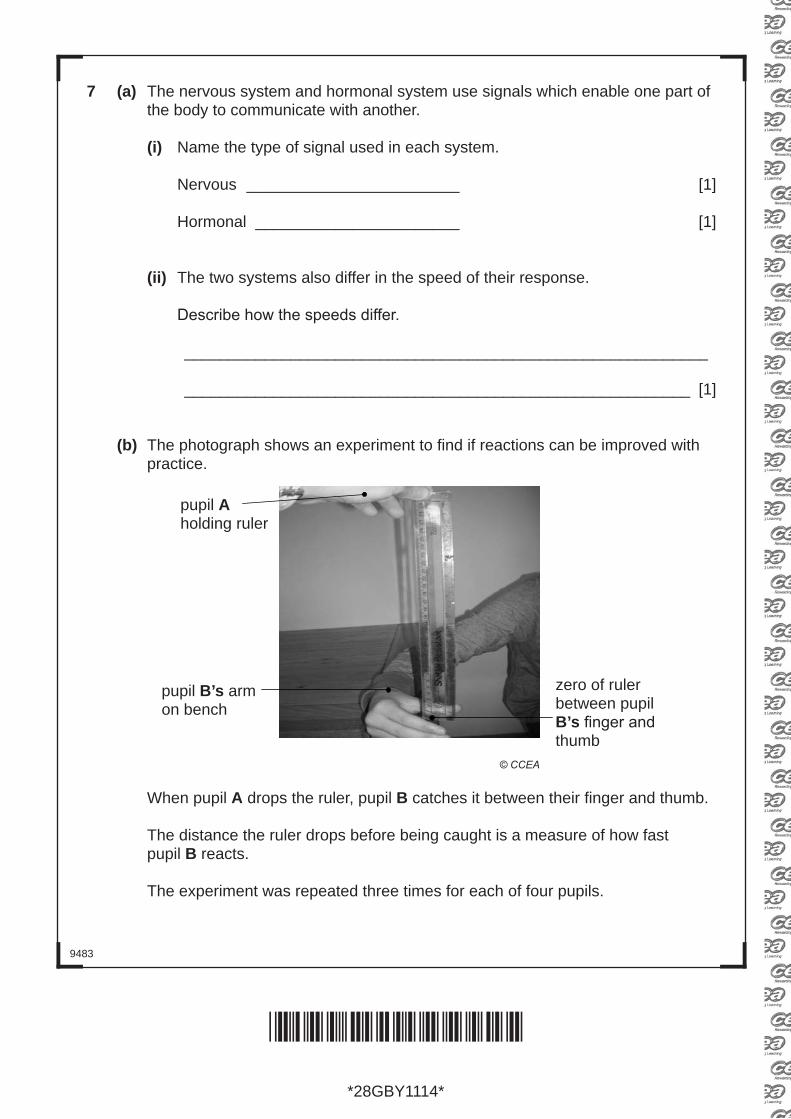
(b) The photograph shows an experiment to find if reactions can be improved with practice.
pupil Aholding ruler
pupil B’s armon bench
zero of ruler between pupil B’sfingerandthumb
© CCEA
When pupil A drops the ruler, pupil B catches it between their finger and thumb.
The distance the ruler drops before being caught is a measure of how fast pupil B reacts.
The experiment was repeated three times for each of four pupils.

[Turn over9483
*28GBY1115*
*28GBY1115*
(i) What was the dependent variable in this experiment?
_________________________________________________________ [1]
(ii) Give one way the pupils kept this a fair test.
___________________________________________________________
_________________________________________________________ [1]
The results are shown in the table.
PupilDistance ruler dropped/mm
Test 1 Test 2 Test 3 AverageA 150 95 85 110B 210 200 190 200C 244 210 140 198D 195 125 115 145
Look at the table.
(iii) Which pupil had the fastest average reaction?
Pupil _____________ [1]
(iv) Which pupil’s results varied the least?
Pupil _____________ [1]
(v) Use data from the table to explain if reactions improved with practice.
___________________________________________________________
___________________________________________________________
___________________________________________________________
_________________________________________________________ [3]
© CCEA

9483
*28GBY1116*
*28GBY1116*
BLANK PAGE
DO NOT WRITE ON THIS PAGE

[Turn over9483
*28GBY1117*
*28GBY1117*
8 The diagram shows part of the carbon cycle in a woodland.
Carbon dioxide in the air
Process A
Process B
© CCEA
Look at the diagram.
(a) Name processes A and B.
A _________________________ [1]
B _________________________ [1]
(b) Students set up an experiment to compare the rate of decomposition of beech and holly leaves.
Samples of the leaves were weighed and placed in two net bags which had a fine mesh.
One bag contained beech leaves and one bag holly leaves.
The net bags were left under a tree in the woodland.
The leaves in each bag were weighed every 50 days.
The percentage mass of the leaves remaining was calculated.
© C
CE
A
© M
artin
Bon
d / S
cien
ce P
hoto
Lib
rary

9483
*28GBY1118*
*28GBY1118*
The results are shown in the table.
DayPercentage mass of leaves remaining
Beech Holly0 100 10050 70 75100 60 70150 50 65200 40 60250 35 55300 30 50
(i) Complete the graph by plotting the results for holly.
The first three points have been done for you.
Beech
0 50 100 150 200 250 300
Time/days
100
80
60
40
20
0
Perc
enta
ge m
ass
of le
aves
rem
aini
ng
X
X
X
XX
X
X
[3]© CCEA
© CCEA

[Turn over9483
*28GBY1119*
*28GBY1119*
Look at the graph.
(ii) Use data from the graph to describe which type of leaf decomposed faster.
___________________________________________________________
___________________________________________________________
___________________________________________________________
___________________________________________________________
_________________________________________________________ [3]
Fungi in the net bags helped decompose the leaves.
(iii) What term is used to describe fungi which decompose dead material?
Drawacirclearoundthecorrectanswer.
consumers saprophytes producers [1]
(iv) Another group of organisms could have helped decompose the leaves in the net bags with a fine mesh.
Name this group.
_________________________ [1]
(v) What is formed in the soil by the decomposition of dead leaves?
_________________________ [1]

9483
*28GBY1120*
*28GBY1120*
9 Animals grow differently from plants.
The drawings show the growth of a seedling to a mature tree and a chick to a chicken.
growing points
Seedling Mature tree
ChickenChick© Dorling Kindersley/ Thinkstock
Look at the drawings.
(a) Use the drawings to compare the patterns of growth of a seedling and a chick.
_______________________________________________________________
_______________________________________________________________
_______________________________________________________________
_____________________________________________________________ [3]

[Turn over9483
*28GBY1121*
*28GBY1121*
(b) Organisms are made up of cells which group together to form different tissues which have higher levels of organisation.
Complete the table to show which level of organisation describes each body
part shown.
Body part Level of organisation
Dr Gladden Willis/Visuals Unlimited/ Science Photo Library
tissue
© 3drenderings/ iStock/ Thinkstock
© Anna Omelchenko/ iStock/ Thinkstock
[2]
9483
*28GBY1122*
*28GBY1122*
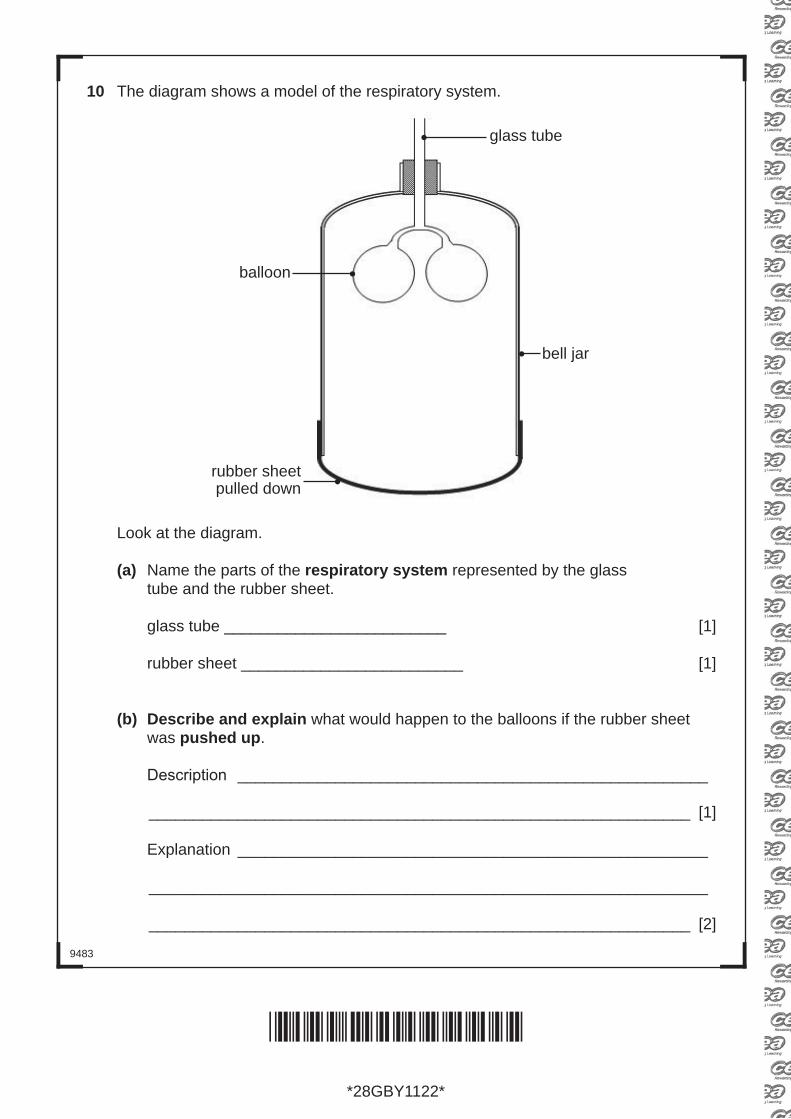
10 The diagram shows a model of the respiratory system.
bell jar
glass tube
balloon
rubber sheet pulled down
Look at the diagram.
(a) Name the parts of the respiratory system represented by the glass tube and the rubber sheet.
glass tube _________________________ [1]
rubber sheet _________________________ [1]
(b) Describe and explain what would happen to the balloons if the rubber sheet was pushed up.
Description _____________________________________________________
_____________________________________________________________ [1]
Explanation _____________________________________________________
_______________________________________________________________
_____________________________________________________________ [2]

[Turn over9483
*28GBY1123*
*28GBY1123*
11 A student wanted to compare the number of flying insects in two areas of long grass.
(a) (i) Describehowhecoulduseanettosampletheflyinginsectsineacharea.
___________________________________________________________
___________________________________________________________
_________________________________________________________ [2]
(ii) Explain what he should do to make sure the results for the two areas can be compared.
___________________________________________________________
___________________________________________________________
_________________________________________________________ [2]
(b) What apparatus can be set up and left for twenty four hours to collect crawling insects in long grass?
_________________________ [1]

9483
*28GBY1124*
*28GBY1124*
12 The table shows the results of food tests carried out on a biscuit.
Test reagent Reagent colour at start Result of food test
Benedict’s blue positive
Ethanol clear positive
Biuret blue negative
Iodine yellow/brown positive
Look at the table.
Use the information in the table to draw conclusions about the types of food in the biscuit.
Describethecolourchangeforeachfoodtest.
In this question you will be assessed on your written communication skills, including the use of specialist scientific terms.
__________________________________________________________________
__________________________________________________________________
__________________________________________________________________
__________________________________________________________________
__________________________________________________________________
__________________________________________________________________
__________________________________________________________________
__________________________________________________________________
__________________________________________________________________
__________________________________________________________________
__________________________________________________________________
________________________________________________________________ [6]
© CCEA

[Turn over
*28GBY1125*
9483
BLANK PAGE
DO NOT WRITE ON THIS PAGE
*28GBY1125*
*28GBY1125*
THIS IS THE END OF THE QUESTION PAPER

9483
*28GBY1126*
*28GBY1126*
BLANK PAGE
DO NOT WRITE ON THIS PAGE

*28GBY1127*
*28GBY1127*
9483
BLANK PAGE
DO NOT WRITE ON THIS PAGE
DO NOT WRITE ON THIS PAGE
*28GBY1128*
*28GBY1128*
Examiner Number
Permission to reproduce all copyright material has been applied for.In some cases, efforts to contact copyright holders may have been unsuccessful and CCEAwill be happy to rectify any omissions of acknowledgement in future if notified.
9483/8
For Examiner’suse only
QuestionNumber Marks
1 2 3 4 5 6 7 8 9101112
TotalMarks
Related Documents


