UNIQA Group European Embedded Value 2005 and Increased Earnings Programme 2007-2010 Konstantin Klien CEO Hannes Bogner CFO Vienna November 2006

Welcome message from author
This document is posted to help you gain knowledge. Please leave a comment to let me know what you think about it! Share it to your friends and learn new things together.
Transcript

UNIQAGroup European Embedded Value 2005 and Increased
Earnings Programme 2007-2010
Konstantin Klien CEOHannes Bogner CFO
Vienna November 2006

Group European Embedded Value 2005

page 3
Group European Embedded Value - Introduction
n First publication of Group European Embedded Value (GEV) results
n Includes European Embedded Value (EEV) using bottom-up, market consistent methodology compliant with CFO Forum Principles for main Life and Health businesses in Austria
n Adjusted net asset value (ANAV) for Property & Casualty businesses and Life and Health businesses excluded from scopeof EEV on the basis of adjusted IFRS equity
n Independent review of methodology, assumptions and calculations for EEV and calculations for GEV by B&W Deloitte

page 4
Methodology (1)
n EEV for conventional life business based on stochastic cashflowprojections using market consistent capital market scenarios. Projections allow for management actions (e.g. profitparticipation or asset allocation)
n Explicit allowance for cost of guarantees and options
n Assumed policyholder profit participation allows for localsupervisory laws and contractual agreements
n Explicit allowance for cost of non-market risks
n Best estimate assumptions based on recent experience forexpenses, mortality and lapses
n EEV for health business and unit linked business based on deterministic projections
n Aggregate allowance for risk on the basis of risk discount rates

page 5
Methodology (2)
n GEV allows for consolidation adjustments and minorityinterests
n Goodwill and value of business in force (VBI) eliminated in respect of businesses included in the scope of the EEV calculations
n EEV defined as:
- Adjusted net asset value
- plus value of in-force (VIF)
- less time value of options and guarantees (FOG)
- less cost of capital and cost of non-market risks (CoCNMR)n GEV defined as:
- Adjusted net asset value for Property and Casualty and Life and Health businesses excluded from scope of EEV calculations
- plus EEV

page 6
Results before Minority Interests
2,410.5
n/a
-108.4
-51.1
875.9
1,694.2
2005
Total
2,173.0
n/a
-101.7
-8.7
897.2
1,386.2
2004
10.9%
-1.0%
6.6%
487.4%
-2.4%
22.2%
Change
n/an/an/an/aGEV
n/an/a1,417.41,404.0EEV
n/an/a-101.7-108.4CoCNMR
n/an/a-8.7-51.1FOG
n/an/a897.2875.9VIF
755.61,006.6630.6687.6ANAV
2004200520042005
Property & Casualty
Life & Health€ mn
n Small reduction in EEV mainly due to increase in value of FOG caused bylower interest rates and higher interest rate volatility
n 11% increase in GEV due mainly to increase in unrealised gains for the P&C and Health businesses, and the sale of UNIQA shares
n ANAV includes additional value due to non-quoted equity holdings

page 7
Analysis of Change Life & Health
EEV at 31.12.04 before minority interests
Changes to management rules
Dividends paid by Life and Health businesses
Market consistent and RDR roll forward
Mortality and expense assumptions
Lower than expected premium adjustments
High returns in 2005 and lower interest rates at year end
Value of new business
EEV at 31.12.2005
EEV at Dec 31, 2004 before dividends
Modelling changes
Dividends paid
Roll forward
Changes in operating assumptions
Operating variance
Inv. performace and econ.assumption changes
Value of new business
EEV at Dec 31, 2005
1,417.4
1,404.0
16.6
-37.2
89.7
-39.6
2.5
-99.0
53.6

page 8
Minority Interests
„Austria Ins. and Collegialität Ins.“
UNIQA Versicherungen AG
FinanceLife Lebensversicherung AG
UNIQA Personenversicherung AG36.6%
18.3%
64.4%
81.7%
The disclosure shows theresults before and afterminority interests.

page 9
Value of Life and Health New Business
Life & Health€ mn before minority interests
53.6NBV
268.1Annual Premium Equivalent (APE)
20.0%APE-Ratio
n Exceptionally high volumes of new business in FinanceLife dueto sales of „geförderte Zukunftsvorsorge“

page 10
EEV-Sensitivities Life&Health (in € mn)
Value As % of Base
+1% 1,363.6 97.1%-1% 1,488.9 106.0%+1% 1,630.0 116.1%-1% 1,033.7 73.6%
-10% 1,407.3 100.2%+10% 1,402.9 99.9%
-5% 1,418.2 101.0%+5% 1,392.4 99.2%
Mortality
Equity and Property Prices -10% 1,338.5
Administration Expenses
Lapses
-10% 98.8%
95.3%
Base value 1,404.0
Risk Discount Rate *
Change in Yield Curve
1,386.8
* calculated only for Health business and FinanceLife

page 11
VNB-Sensitivities Life&Health (in € mn)
Value As % of Base
+1% 45,7 85,3%-1% 63,6 118,7%+1% 69,7 130,0%-1% 24,5 45,7%
-10% 54,7 102,1%+10% 53,2 99,3%
-5% 55,5 103,5%+5% 52,6 98,1%
Mortality
Administration Expenses
Lapses
-10% 90,7%
Base value 53,6
Risk Discount Rate *
Change in Yield Curve
48,6
* calculated only for Health business and FinanceLife

page 12
Reconciliation of IFRS equity to ANAV
2005 2004Consolidated IFRS equity 1.133,7 860,2Goodwill and VIF for EEV companies -67,5 -71,2Differences in valuation of assets and liabilities 219,6 199,2Additional value from non-quoted eq. holdings 408,4 398,0Adjusted Net Asset Value bef. Minorities 1.694,2 1.386,2Minority Interests 312,6 289,4Adjusted Net Asset Value after Minorities 1.381,6 1.096,8

page 13
EEV Assumptions (2004 and 2005)
2005 20041 year 2,93% 2,41%5 years 3,22% 3,23%10 years 3,48% 3,88%15 years 3,70% 4,24%20 years 3,80% 4,48%25 years 3,85% 4,58%
2005 200420,40% 16,40%
2005 200422,37% 21,75%
2005 20041,00% 1,00%
2004 2005Austria 25,00% 25,00%
Interest rate volatility (*)
Equity volatility
Expense/Medical inflation
Tax rate
The yields shown are risk-freeeuro-zone spot rates
(*) 5 into 5 implied swaption volatility

page 14
Disclaimer
Cautionary statement regarding forward-looking information
n This presentation contains forward-looking statements.
n Forward-looking statements involve inherent risks and uncertainties, and it might not be possible to achieve thepredictions, forecasts, projections and other outcomes described or implied in forward-looking statements.
n A number of important factors could cause results to differmaterially from the plans, objectives, expectations, estimates and intentions expressed in these forward-looking statements.
n These forward-looking statements will not be updated exceptas required by applicable laws.

Increased Earnings Program 2007-2010

page 16
Basic Considerations for PEP
n Potential for optimisation at individual level has largely been exhausted
n ..new potential for improvement has to be foundby innovative and creative efforts which concentrate on intra-company outsourcing within the UNIQA Group.
n ...but there is still potential for optimisation if welook at the value-added chains
UNIQA IEP 2007 - 2010
page 17
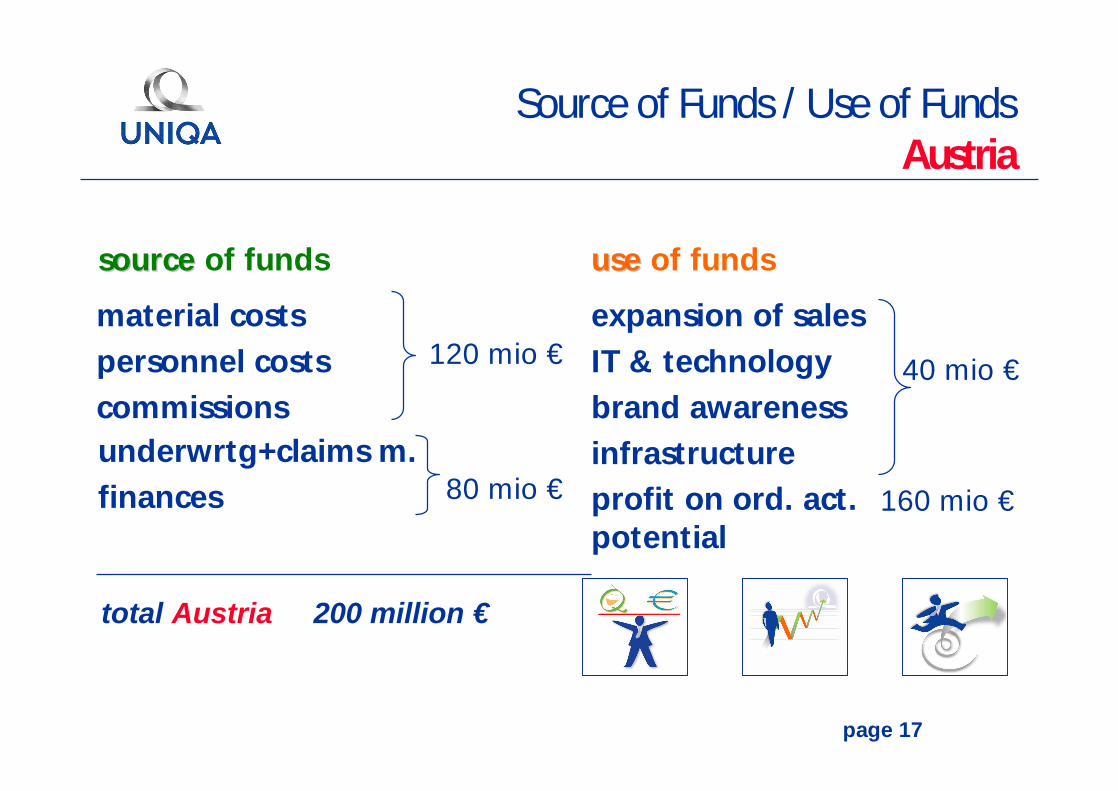
material costspersonnel costscommissions
Source of Funds / Use of Funds Austria
80 mio €
total Austria 200 million €
sourcesource of funds useuse of funds
expansion of salesIT & technologybrand awarenessinfrastructureprofit on ord. act.potential
120 mio € 40 mio €
underwrtg+claims m.finances 160 mio €

page 18
Source of Funds / Use of Funds International
total international 80 mio €
material costspersonnel costscommissionsunderwritg+claims mgmt
sourcesource of funds useuse of funds
expansions of salesIT & technologybrand awarenessinfrastructureprofit on ord. act.potential
40 mio €
40 mio €

page 19
Source of Funds / Use of fundsAustria + International
domestic 200 mio Euro domestic 40 mio Euro
total source source 280 mio Euro total useuse 280 mio Euro
source source of funds use use of funds
abroad 80 mio Euro abroad 40 mio Euro
prof. o.o.activ. 200 mio Euro

page 20
Combined Ratio Targets Compared to Competition
97.0%
95.6%
90.7% 89.9%
100.1%
84%86%88%90%92%94%96%98%
100%102%
UNIQAGroup
AXA Group AllianzGroup
Ergo Group GeneraliGroup
combined ratio gross 2005IRP

page 21
Combined Ratio Targets Compared to Competition
97.0%
95.6%
90.7% 89.9%
100.1%
84%86%88%90%92%94%96%98%
100%102%
UNIQAGroup
AXA Group AllianzGroup
Ergo Group GeneraliGroup
--1.4 %1.4 %--pppp(20 (20 miomio Euro) Euro)
--6.2 %6.2 %--pppp(87 (87 miomio Euro) Euro)
--7.0 %7.0 %--pppp(98 (98 miomio Euro) Euro)
combined ratio gross 2005on an average this means
an improvement of 70 mio Euro in order
to reach an international level
IRP

page 22
Increased Earnings Programm Costs UNIQA Group
UNIQA - Group goal 2007-2010:
cost ratio reduction (incl. commission)
from 2006 26.1 %to 2010 22.8 %
costcost ratio ratio basedbased on premium on premium volumevolume incl. 10 % incl. 10 % singlesingle premiumpremium
domestic internationalfrom 23.2%to 20.9%
from 33.6%to 29.2%
approx. - 14% approx. - 13%

page 23
Leadership Role:Cost Ratio Austria
20.1%20.9%21.7%22.5%23.7%23.5%
15%
20%
25%
30%
35%
actual 2005 FC 1 2006 2007 e 2008 e 2009 e 2010 e
-14.5% ≅ 120 mio €
page 24
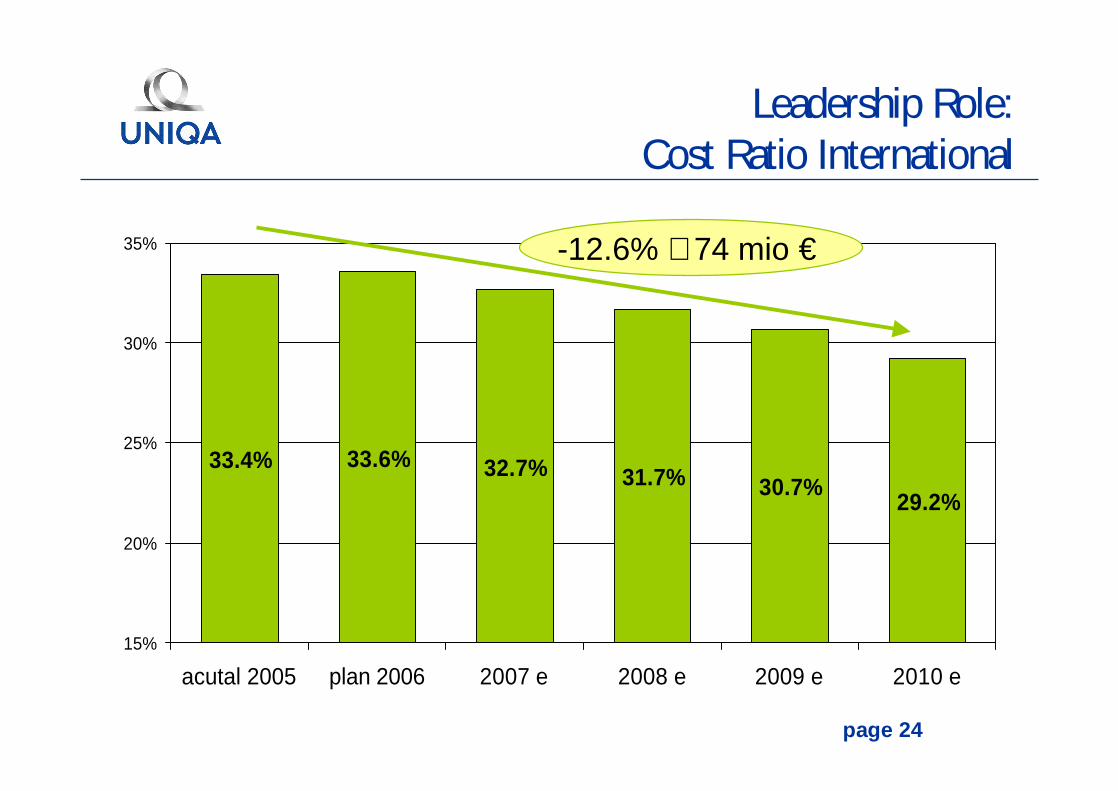
Leadership Role:Cost Ratio International
29.2%30.7%31.7%32.7%33.6%33.4%
15%
20%
25%
30%
35%
acutal 2005 plan 2006 2007 e 2008 e 2009 e 2010 e
-12.6% ≅ 74 mio €

page 25
material costspersonnel costscommissions
Source of Funds / Use of Funds AustriaStatus
80 mio €
total Austria 200 million €
sourcesource of funds useuse of funds
expansion of salesIT & technologybrand awarenessinfrastructureprofit on ord. act.potential
120 mio € 40 mio €
underwrtg+claims m.finances 160 mio €
82.2 82.2 miomio €€
87.4 87.4 mio mio €€
target achievement: 85%!?
page 26
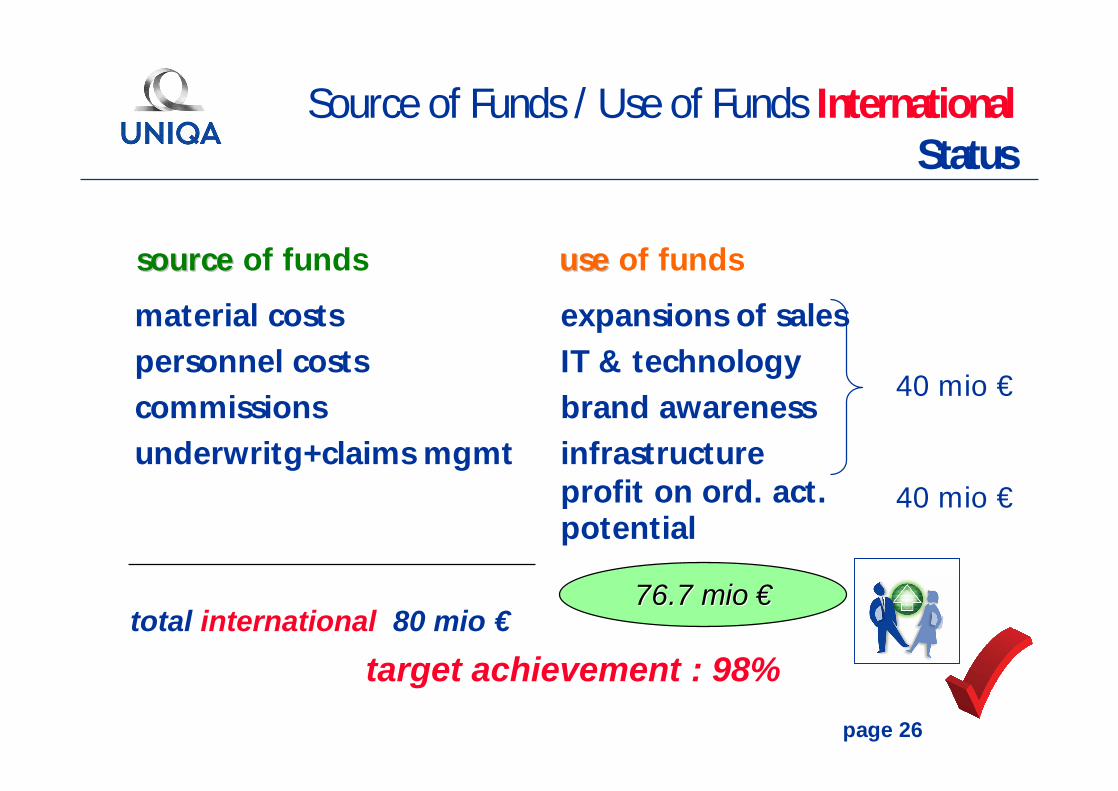
Source of Funds / Use of Funds InternationalStatus
total international 80 mio €
material costspersonnel costscommissionsunderwritg+claims mgmt
sourcesource of funds useuse of funds
expansions of salesIT & technologybrand awarenessinfrastructureprofit on ord. act.potential
40 mio €
40 mio €
76.7 76.7 miomio €€
target achievement : 98%

page 27
Chances – Risks in Practice
linear implementation vs „plan hockey“- effect
280
2006 2010 t
€
yes
no

page 28
Mid Term Profit Targets
IEP Profit Target
0
100
200300
400
500
2006 2007 2008 2009 2010
Year
Mio
€
profit before tax
page 29
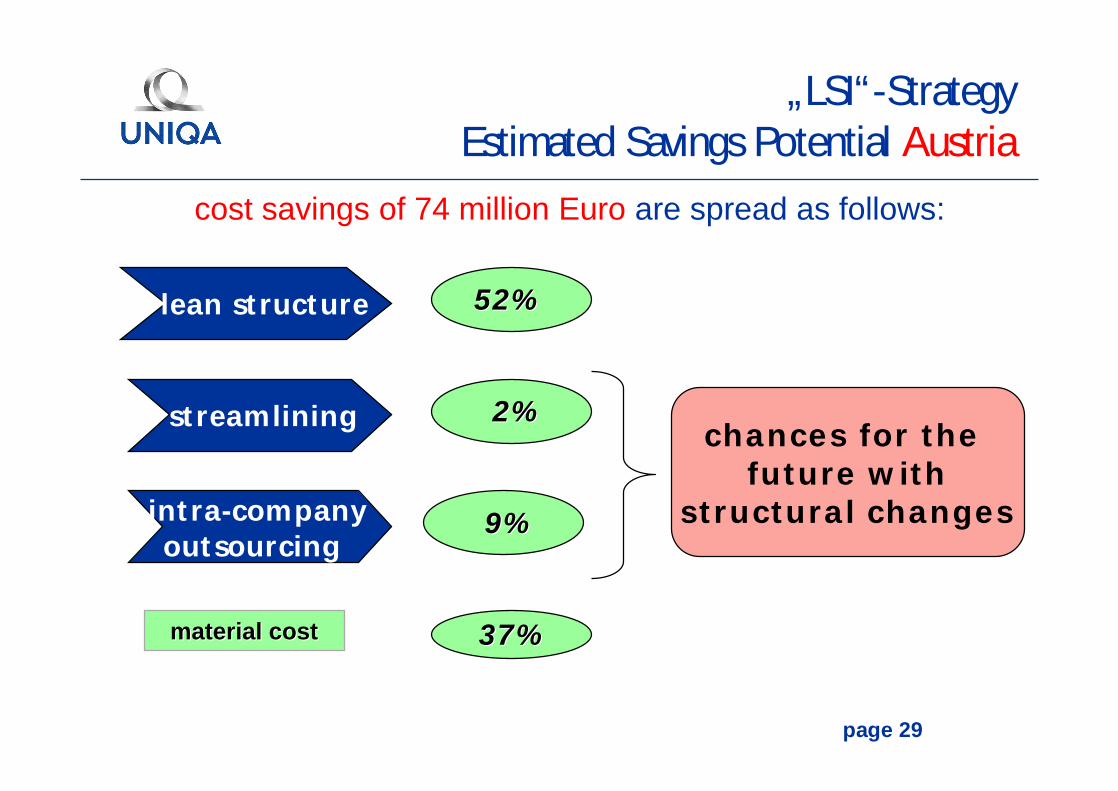
„LSI“-StrategyEstimated Savings Potential Austria
streamlining
intra-companyoutsourcing
52% 52%
2%2%
9%9%
37% 37% materialmaterial costcost
lean structure
cost savings of 74 million Euro are spread as follows:
chances for the future with
structural changes

page 30
„LSI“-StrategyEstimated Savings Potential International
streamlining
intra-companyoutsourcing
85% 85%
0%0%
0%0%
15% 15% material material costcost
lean structure
cost savings of 21 million Euro are spread as follows:
chances for the future with
structural changes

page 31
Principles: Lean Structures – Streamlining – Intra-Company Outsourcing
streamlining intra-companyoutsourcinglean structure
structures & tasks- bundling of organisational
units
- increase number of directly reporting employees
- bundle similar tasks
- clear central of decentralassignment of tasks
- increase productivity
outsourcing- to regional companies
- to external companies
elimination of tasks without replacement
- „nice to have‘s“a) in central servicesb) in various technical
processes
- redundancies(central and regional HQs)
- redundancies (regions and subregions)
cross border teleworking
- transfer of simple mass work
- coping with peaks
- „shift“ of work places
focus inPEP I 2001 – 2003
138 mio €
PEP II 2004 – 2006~175 mio €
new focus in PEP III
chances for the future withstructural changes
Related Documents