Wayne State University Wayne State University Human Biology Open Access Pre-Prints WSU Press 6-16-2020 Uniparental Genetic Analyses Reveal the Major Origin of Fujian Uniparental Genetic Analyses Reveal the Major Origin of Fujian Tanka from Ancient Indigenous Daic Populations Tanka from Ancient Indigenous Daic Populations Luo Xiao-Qin MOE Key Laboratory of Contemporary Anthropology and B&R International Joint Laboratory for Eurasian Anthropology, School of Life Sciences, Fudan University Du Pan-Xin MOE Key Laboratory of Contemporary Anthropology and B&R International Joint Laboratory for Eurasian Anthropology, School of Life Sciences Wang Ling-Xiang MOE Key Laboratory of Contemporary Anthropology and B&R International Joint Laboratory for Eurasian Anthropology, School of Life Sciences Zhou Bo-Yan MOE Key Laboratory of Contemporary Anthropology and B&R International Joint Laboratory for Eurasian Anthropology, School of Life Sciences Li Yu-Chun State Key Laboratory of Genetic Resources and Evolution/Key Laboratory of Healthy Aging Research of Yunnan Province, Kunming Institute of Zoology, Chinese Academy of Sciences See next page for additional authors Follow this and additional works at: https://digitalcommons.wayne.edu/humbiol_preprints Recommended Citation Recommended Citation Xiao-Qin, Luo; Pan-Xin, Du; Ling-Xiang, Wang; Bo-Yan, Zhou; Yu-Chun, Li; Hong-Xiang, Zheng; Lan-Hai, Wei; Jun-Jian, Liu; Chang, Sun; Hai-Liang, Meng; Jing-Ze, Tan; Wen-Jing, Su; Shao-Qing, Wen; and Hui, Li, "Uniparental Genetic Analyses Reveal the Major Origin of Fujian Tanka from Ancient Indigenous Daic Populations" (2020). Human Biology Open Access Pre-Prints. 170. https://digitalcommons.wayne.edu/humbiol_preprints/170 This Article is brought to you for free and open access by the WSU Press at DigitalCommons@WayneState. It has been accepted for inclusion in Human Biology Open Access Pre-Prints by an authorized administrator of DigitalCommons@WayneState.

Welcome message from author
This document is posted to help you gain knowledge. Please leave a comment to let me know what you think about it! Share it to your friends and learn new things together.
Transcript

Wayne State University Wayne State University
Human Biology Open Access Pre-Prints WSU Press
6-16-2020
Uniparental Genetic Analyses Reveal the Major Origin of Fujian Uniparental Genetic Analyses Reveal the Major Origin of Fujian
Tanka from Ancient Indigenous Daic Populations Tanka from Ancient Indigenous Daic Populations
Luo Xiao-Qin MOE Key Laboratory of Contemporary Anthropology and B&R International Joint Laboratory for Eurasian Anthropology, School of Life Sciences, Fudan University
Du Pan-Xin MOE Key Laboratory of Contemporary Anthropology and B&R International Joint Laboratory for Eurasian Anthropology, School of Life Sciences
Wang Ling-Xiang MOE Key Laboratory of Contemporary Anthropology and B&R International Joint Laboratory for Eurasian Anthropology, School of Life Sciences
Zhou Bo-Yan MOE Key Laboratory of Contemporary Anthropology and B&R International Joint Laboratory for Eurasian Anthropology, School of Life Sciences
Li Yu-Chun State Key Laboratory of Genetic Resources and Evolution/Key Laboratory of Healthy Aging Research of Yunnan Province, Kunming Institute of Zoology, Chinese Academy of Sciences
See next page for additional authors
Follow this and additional works at: https://digitalcommons.wayne.edu/humbiol_preprints
Recommended Citation Recommended Citation Xiao-Qin, Luo; Pan-Xin, Du; Ling-Xiang, Wang; Bo-Yan, Zhou; Yu-Chun, Li; Hong-Xiang, Zheng; Lan-Hai, Wei; Jun-Jian, Liu; Chang, Sun; Hai-Liang, Meng; Jing-Ze, Tan; Wen-Jing, Su; Shao-Qing, Wen; and Hui, Li, "Uniparental Genetic Analyses Reveal the Major Origin of Fujian Tanka from Ancient Indigenous Daic Populations" (2020). Human Biology Open Access Pre-Prints. 170. https://digitalcommons.wayne.edu/humbiol_preprints/170
This Article is brought to you for free and open access by the WSU Press at DigitalCommons@WayneState. It has been accepted for inclusion in Human Biology Open Access Pre-Prints by an authorized administrator of DigitalCommons@WayneState.

Authors Authors Luo Xiao-Qin, Du Pan-Xin, Wang Ling-Xiang, Zhou Bo-Yan, Li Yu-Chun, Zheng Hong-Xiang, Wei Lan-Hai, Liu Jun-Jian, Sun Chang, Meng Hai-Liang, Tan Jing-Ze, Su Wen-Jing, Wen Shao-Qing, and Li Hui
This article is available at DigitalCommons@WayneState: https://digitalcommons.wayne.edu/humbiol_preprints/170

Pre-print version. Visit http://digitalcommons.wayne.edu/humbiol/ after publication to acquire the final version.
Uniparental Genetic Analyses Reveal the Major Origin of Fujian Tanka from Ancient
Indigenous Daic Populations
Luo Xiao-Qin,1 Du Pan-Xin,1 Wang Ling-Xiang,1 Zhou Bo-Yan,1 Li Yu-Chun,2 Zheng Hong-
Xiang,1 Wei Lan-Hai,3 Liu Jun-Jian,4 Sun Chang,1 Meng Hai-Liang,1 Tan Jing-Ze,1 Su Wen-
Jing,5 Wen Shao-Qing,1,6* and Li Hui1,7*
1MOE Key Laboratory of Contemporary Anthropology and B&R International Joint
Laboratory for Eurasian Anthropology, School of Life Sciences, Fudan University, 200438
Shanghai, China.
2State Key Laboratory of Genetic Resources and Evolution/Key Laboratory of Healthy Aging
Research of Yunnan Province, Kunming Institute of Zoology, Chinese Academy of Sciences,
Kunming 650223, China.
3Department of Anthropology and Ethnology Institute of Anthropology, Xiamen University,
Xiamen 361005, China.
4School of International Pharmaceutical Business, China Pharmaceutical University, Nanjing
211198, China.
5Institute of Fujianese Entrepreneurs Culture, Fuzhou University, Fuzhou 350108, China.
6Institute of Archaeological Science, Fudan University, Shanghai 200433, China.
7Shanxi Academy of Advanced Research and Innovation, Fudan-Datong Institute of Chinese
Origin, Datong 037006, China.

Pre-print version. Visit http://digitalcommons.wayne.edu/humbiol/ after publication to acquire the final version.
*Correspondence to: Wen Shao-Qing or Li Hui, MOE Key Laboratory of Contemporary
Anthropology and B&R International Joint Laboratory for Eurasian Anthropology, School of
Life Sciences, Fudan University, 200438 Shanghai, China. E-mails:
[email protected], [email protected].
Short Title: Genes of Indigenous Population in Southeast China
KEY WORDS: FUJIAN TANKA, ISOLATED POPULATION, UNIPARENTAL
INHERITANCE, ANCIENT DAIC, HAPLOTYPE-SHARING ANALYSIS.

Pre-print version. Visit http://digitalcommons.wayne.edu/humbiol/ after publication to acquire the final version.
Abstract
The Fujian Tanka people are officially classified as a southern Han ethnic group while they
have customs similar to Daic and Austronesion people. Whether they originated in Han or
Daic people, there is no consensus. Three hypotheses have been proposed to explain the
origin of this group: 1) the Han Chinese origin, 2) the ancient Daic origin, 3) and the
admixture between Daic and Han. In this study, we address this issue by analyzing the
paternal Y chromosome and maternal mtDNA variation of 62 Fujian Tanka and 25
neighboring Han in Fujian. We found that the southern East Asian predominant haplogroups,
e.g. O1a1a-P203 and O1b1a1a-M95 of Y chromosome and F2a, M7c1, and F1a1 of mtDNA,
reach relatively high frequencies in Tanka. The interpopulation comparison reveals that the
Tanka have a closer affinity with Daic populations than with Han Chinese in paternal lineages
while are closely clustered with southern Han populations such as Hakka and Chaoshanese in
maternal lineages. Network and haplotype-sharing analyses also support the admixture
hypothesis. The Fujian Tanka mainly originate from the ancient indigenous Daic people and
have only limited gene flows from Han Chinese populations. Notably, the divergence time
inferred by the Tanka-specific haplotypes indicates that the formation of Fujian Tanka was a
least 1033.8-1050.6 years before present (the early Northern Song Dynasty), indicating that
they are indigenous population, not late Daic migrants from southwestern China.

Pre-print version. Visit http://digitalcommons.wayne.edu/humbiol/ after publication to acquire the final version.
The genetic relationships between populations include three models: isolation, admixture, and
replacement. Admixture is the most common event in human migrations and dispersals,
appearing populations including African-Americans (Glass et al. 1953) and European-
Americans (Reed 1969; Durand et al.2015). Isolated populations, those that by virtue of
geography, history and/or culture experience, experienced little gene flows with surrounding
populations. Such populations include the Andaman Islanders (Reich et al.2009; Thangaraj et
al. 2005) and Sardinians (Pala et al. 2009; Francalacci et al. 2013; Sidore et al. 2015) who
have their unique allele frequency and phenotypic characteristics due to the geographic
barriers; the Roma (Gresham et al. 2001; Regueiro et al.2011; Mendizabal et al. 2012) and
the Jews (Behar et al. 2006; Hammer et al. 2009; Behar et al. 2010) have maintained genetic
coherence over vast geographical distances because of their distinctive history and culture.
Population isolation is more likely to generate population-specific haplotypes or lineages,
allowing geneticists to trace population history.
The Tanka people (Huang 2008) who live in southeastern China are officially
classified as Southern Han, but have many distinct cultural traits. The Tanka people are
widely distributed along southeast coast of China, spanning from Zhejiang to Guangxi
provinces. Since 1949, the government built houses on land and enrolled them in compulsory
primary and secondary education, leading to the gradual erosion of the Tanka people’s
original customs and lifeway. Now, the only remaining areas with many Tanka communities
are in the Minjiang River estuary of Fujian province. In contrast to the ethnically Han
farmers, the Tanka have remained lifestyle of fisher-traders since ancient time. In the past, the
Tanka endured discrimination by neighboring populations and were barred from owning land.

Pre-print version. Visit http://digitalcommons.wayne.edu/humbiol/ after publication to acquire the final version.
Therefore, they were generally called “Gypsies in water” (Chen 1954). Their unique history
makes them a potentially isolated genetic group.
Many researchers have discussed the origin of the Tanka using data from historical
(Luo 1929; Lin 1936), ethnologic (Chen 1948) and folkloric (Zhong 1928) sources, leading to
three testable hypotheses. First, according to folklore, the Tanka were originally Han Chinese
refugees from war, famine, and political persecution in coastal areas. As a result of this
hardship, they changed their life-style from farming the land to fishing in rivers. Second,
some scholars (Luo 1929) hold the view that the Tanka are descendants of the ancient Daic
people because they have similar customs to Daic and Austronesian populations, such as
tattooing, the snake totems, and a long tradition of boating. Before Han Dynasty, there was an
indigenous Daic kingdom of Minyue. In 110 BC, the kingdom was conquered and the
Minyue people were migrated to the other place. However, there might still be some Minyue
populations remained in Fujian, such as Tanka. Lastly, other researchers (Lin 1936) argued
that the Tanka was the admixture of the Daic people and Han Chinese immigrants.
To test the aforementioned hypotheses and shed light on the origin and formation of
Tanka, we analyzed the Y chromosome and mtDNA variation of 62 Fujian Tanka and 25
neighboring Han individuals in this study. Furthermore, in order to do some comparison
among Tanka, indigenous people in southern East Asia and Han Chinese, the published
genetic data in related articles were considered and reclassified as well.
Material and Methods
Population Samples
Pre-print version. Visit http://digitalcommons.wayne.edu/humbiol/ after publication to acquire the final version.
We collected blood samples of unrelated male individuals from four villages named
Shuisheng (n=21), Huyu’ao (n=21), Beiqi (n=20) and Dongguan (n=25), located in Xiapu
county, Fujian provionce of China (Figure 1). Notably, people in the first three villages are
Tanka people, while Han are the majority in the latter village. This study has been approved
by the Ethics Committee for Biological Research at Fudan University and all the samples
were collected with informed consent.
Y Chromosome Markers
For each sample, we extracted DNA, typed relevant Y-chromosomal SNPs via a hierarchical
strategy(Wang et al. 2014; Wen et al. 2017). These SNPs were included in the following
seven panels:
Corset Panel: M130, P256, M1, M231, M168, M174, M45, M89, M272, M258, M242,
M207, M9, M96, P125, M304, M201 and M306.
Haplogroup O panel: M175, M119, P203, M110, M268, P31, M95, M176, M122, M324,
M121, P201, M7, M134, M117, 002611, P164, L127 (rs17269396), and KL1
(rs17276338).
Haplogroup C panel: P54, M105, M48, M208, M407, P33, M93, P39, P92, P53.1, M217,
M38, M210, M356, P55, and M347.
Haplogroup D panel: P47, N1, P99, M15, M125, M55, M64.2, M116.1, M151, and 022457.
Haplogroup N panel: M214, M128, M46/Tat, P63, P119, P105, P43, and M178.
Haplogroup R panel: M306, M173, M124, M420, SRY10831.2, M17, M64.1, M198, M343,
V88, M458, M73, P312, M269, and U106/M405.
Pre-print version. Visit http://digitalcommons.wayne.edu/humbiol/ after publication to acquire the final version.
Haplogroup Q panel: M3, M120, MEH2, M378, N14/M265, M25, M143, M346, L53, and
M323.
17 YSTRs (DYS19, DYS389I/II, DYS390, DYS391, DYS392, DYS393, DYS437, DYS438,
DYS439, DYS448, DYS456,DYS458, DYS635, Y-GATA H4, and DYS385a/b) were
amplified using the Y-filer kit (Life Technologies, Carlsbad, CA, USA).
Mitochondrial DNA Markers
Sequencing of the mtDNA HSV-I and HSV-Ⅱ region was performed for all 85 individuals
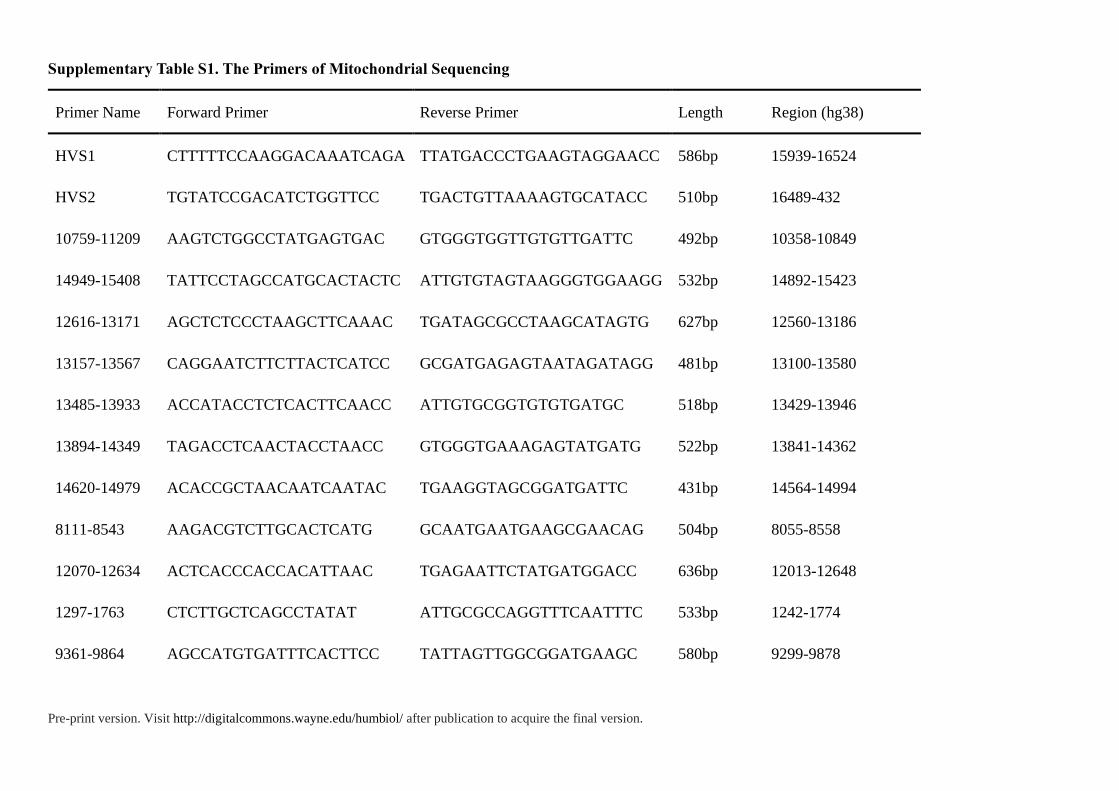
(D07 and D08 were poorly amplified in this step). Primers for HSV sequencing are in Table
S1. Purified PCR products were sequenced using the BigDye terminator cycle sequencing kit
and an ABI 3100 genetic analyzer (Wen et al. 2004a, b, c). The HSV (hyper variable
segment) region variations were determined refer to rCRS (GenBank: NC_012920 )(Andrews
et al. 1999). Haplogroups were assigned using HaploGrep2 (Kloss-Brandstätter et al. 2011)
with PhyloTree mtDNA tree Build 17(Oven et al. 2009). For ambiguous haplogroup
assignment, sanger sequencing was performed in the coding regions to determine the
assignment results(the primers were also in Table S1). In addition, one sample (H64) was
completely sequenced using the method as described in our previous work(Qin et al. 2010).
The mtDNA sequences have been deposited in Genbank with accession numbers (HSV-I:
MN196578-MN196662; HSV-Ⅱ: MN229382-MN229466).
Statistical Analyses
Principal component analysis (PCA) was performed using R 3.5.1 software. The pairwise
Pre-print version. Visit http://digitalcommons.wayne.edu/humbiol/ after publication to acquire the final version.
genetic distances of Rst between different populations were estimated and visualized in
multidimensional scaling (MDS) plots using the AMOVA & MDS tool available at the
YHRD website. 15-STR-haplotypes were analyzed (DYS385a and DYS385b were excluded;
for DYS389, DYS389I and DYS389b [=DYS398II-DYS389I] were used). The search for
shared haplotypes was conducted using the Haplomatch software (Chukhryaeva et al. 2016).
Networks of Y chromosomal STR data and the mtDNA HVS-I motifs (1600-16569) were
constructed by reduced median-joining method (Bandelt et al. 1999) using NETWORK v.
5.0.1.0 (Fluxus-engineering.com). Reference population data on the Y chromosomes (Wang
et al. 2014; Wen et al. 2004a; Cai et al. 2011; Li et al. 2008b; Gan et al. 2008; Deng et al.
2013; Trejaut et al. 2014; Park et al. 2012) and mtDNA (Wen et al. 2004b; Ko et al. 2014;
Summerer et al. 2014) were retrieved from the literature and 1000 Genomes Project. The time
to the most recent common ancestor (TMRCA) for each clade was estimated using
BATWING method based on 15 STRs (Wilson et al. 2003) under a model of exponential
growth from an initially constant-sized population. The parameters used in estimation were
following Xue et al (Xue et al. 2006). Four sets of Y-STR mutation rates were applied in time
estimations as Wei et al did (Wei et al. 2013). These were a widely used evolutionary
mutation rate (EMR) (Zhivotovsky et al. 2004), two observed genealogical mutation rates
(OMRB and OMRS) (Burgarella et al. 2011; Shi et al. 2010), and a genealogical mutation
rate adjusted for population variation using logistic model (lmMR) (Burgarella et al. 2011). A
total of 104 samples of the program’s output representing 106 MCMC cycles were taken after
discarding the first 3×10³ samples as burn-in. The Time to the Most Recent Common
Ancestor (TMRCA) is calculated using the product of the estimated population size N and the
Pre-print version. Visit http://digitalcommons.wayne.edu/humbiol/ after publication to acquire the final version.
height of the tree T (in coalescent units) (Wilson et al. 2003).A generally accepted generation
time of 25 years was used to produce a time estimate in years. The geographic distributions
of mtDNA haplogroup F2a were presented by generation of contour maps using Surfer 8.0
Software (Golden Software).
Results
Y Chromosome and Mitochondrial DNA Haplogroup Profile
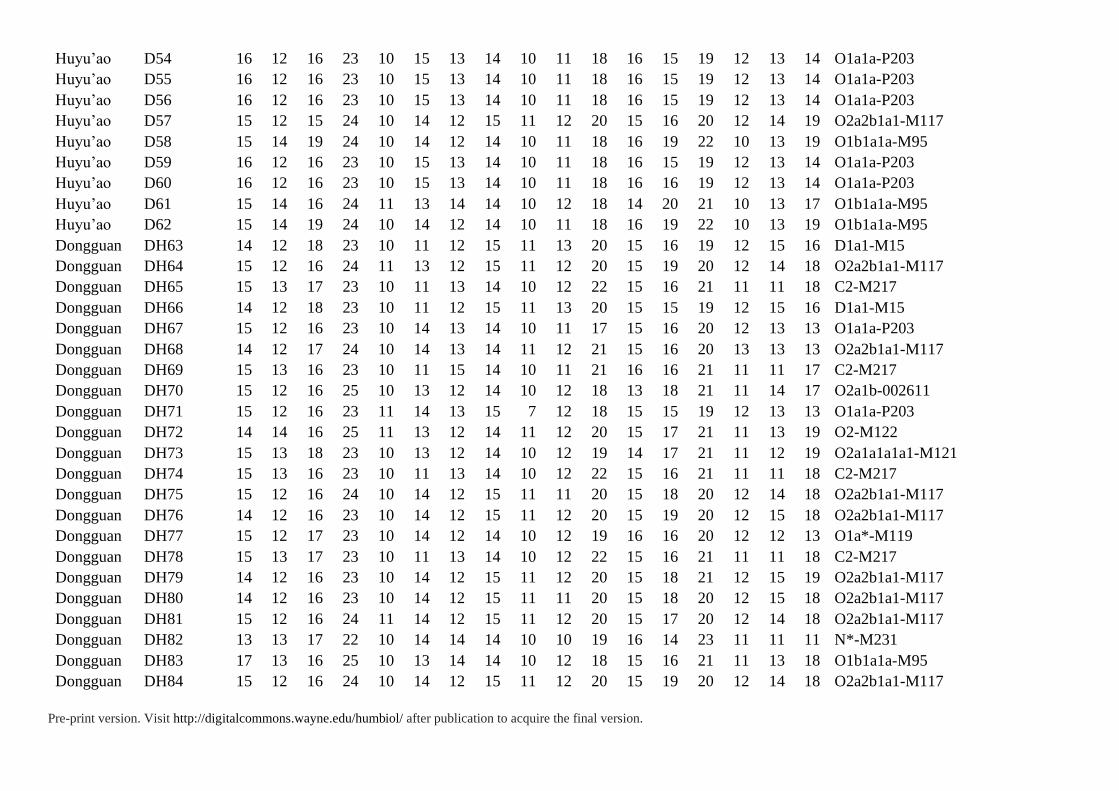
Y chromosome haplogroups of all 87 samples were determined according to ISOGG 2019
(Figure 2 and Table S2). Overall, there are three major haplogroups in Tanka: O1a1a-P203
(33.9%), O1b1a1a-M95 (30.6%), and O2a2b1a1-M117 (16.1%). The haplogroup O1a1a-
P203 was quite common in Southern Asia populations (Li et al. 2008b; Trejaut et al. 2014;
Karafet et al. 2010) like the Daic, Austronesian and southern Han, and Taiwan aboriginals
(30-90%) (Trejaut et al. 2014). This haplogroup is most frequent in Tanka populations from
village Beiqi (35%), ShuiSheng (33.33%), and Huyu’ao (33.33%). According to broadly
accepted hypothesis, the O1b1a1a-M95 lineage originated in the southern East Asia (Zhang et
al. 2015) and then dispersed southward to Southeast Asia before moving westward to the
Indian subcontinent (Zhang et al. 2015; Chaubey et al. 2011; Arunkumar et al. 2015;
Majumder et al. 2010). This haplogroup was shown to be prevalent in Austro-Asiatic
speaking populations in Southeast Asia (74-87%) (Chaubey et al. 2011; Kumar et al. 2007)
and Northeast India (85%) (Chaubey et al. 2011; Kumar et al. 2007), the Daic and Hmong-
Mien speaking populations in China (45%) (Cai et al. 2011; Li et al. 2008a, b; Gan et al.
2008; Zhang et al. 2015), and the Austronesian speaking populations (28%) (Li et al. 2008b;

Pre-print version. Visit http://digitalcommons.wayne.edu/humbiol/ after publication to acquire the final version.
Karafet et al. 2010; Chaubey et al. 2011; Delfin et al. 2010). In Tanka populations, this
haplogroup was detected in Shuisheng (38.1%) and Huyu’ao(52.38%), but not detected in
Beiqi. O2a2b1a1-M117 was one of the major founder paternal lineages (Yan et al. 2014; Wen
et al. 2016) in modern Han Chinese (Yan et al. 2014; Yan et al. 2011; Ning et al. 2016) about
15-16% and was also quite frequent in Tibeto-Burman populations (Xue et al. 2006; Shi et al.
2005; Gayden et al. 2007; Kang et al. 2012) like Nu (62%), Derung (32%), Lhoba (31%),
Tibetan in Yunnan (22%) and Hani (17%). This haplogroup was prevalent in Han from
Dongguan (36%) and its neighboring village Beiqi (35%), but was rare in other Tanka
villages: ShuiSheng (9.52%) and Huyu’ao (4.76%). In summary, the two dominant lineages
in the Tanka, O1a1a-P203 (33.9%) and O1b1a1a-M95 (30.6%), have a southern Asia origin
and are prevalent in indigenous people like Daic, Hmong-Mien, Austro-Asiatic and
Austronesia population, whereas O2a2b1a1-M117 mirrors the gene flows mainly from Han
Chinese.
MtDNA haplogroups of 85 samples were determined by PhyloTree mtDNA tree Build
17. (Figure 3 and Table S3). Compared to the Y chromosome, the mtDNA gene pool is more
heterogeneous. In Tanka, the most frequent haplogroups are F2a (25%), M7c1 (11.67%),
M8a2 (8.33%), F1a1 (6.67%), B4b (5%) and A15 (5%). The dominant haplogroup F2a
(average 25%) in Tanka reached the highest frequency in PhuLa (26.8%) (Thuy et al. 2018)
and PaThen (19.44%) in northern Vietnam (Thuy et al. 2018) but was sporadic occurrence in
East Asian populations, like Guangxi Mien (2.44%) (Wen et al. 2004a), Yunnan Yi (5-6.25%)
(Wen et al. 2004c), Qinghai Han (8%) (Li et al. 2019), and southern Han (0.88%-2.04%) (Li
et al. 2019) (Figure S3). The distribution pattern of the mtDNA haplogroup F2a indicates the

Pre-print version. Visit http://digitalcommons.wayne.edu/humbiol/ after publication to acquire the final version.
Fujian Tanka experienced a strong bottleneck effect caused by isolation. As for M7c1, this
haplogroup was quite common in southern East Asia, especially in Daic populations like
Phuan (28%) in Northern Thailand (Kutanan et al. 2017) and Dai (14.29-20%) in Yunnan (Li
et al. 2016). Similarly, the haplogroup F1a1 was common in southern East Asia and had a
southern East Asia origin (Kutanan et al. 2017). Then, the haplogroup M8a2 was low
frequent in the whole East Asia, except for in Yuan in Southwestern Thailand (28%). In
summary, the dominant mtDNA lineages like F2a, M7c1 and F1a1 are quite frequent in
southern East Asian populations and have a southern Asia origin, whereas the low frequent
haplogroups like A15, Y2, A5b and D5 reflect gene flows from northern China.
Population Comparisons
Based on the Y chromosome PCA plot (Figure 4), the Fujian Tanka (i.e. ShuiSheng and
Huyu’ao) cluster with the minority populations, particularly the Daic people, while the
neighboring Han from Dongguan village are closer to the Han Chinese. To further discern the
relationship with surrounding populations, the multidimensional scaling (MDS) plot (in
Figure S1) with Fujian Tanka and 26 populations from YHRD website was analyzed.
Similarly, in MDS plot, both Dongguan and Beiqi are closely related with Han Chinese like
Fujian Han, Minnan Han and Zhejiang Han, while the Huyu’ao and ShuiSheng are near to
Tai-Kadai populations. In the mtDNA plot, the Tanka population, except Huyu’ao, are close
to the southern Han. However, the southern Han that cluster closely to Tanka are mixed
populations including the Guangdong Hakka, Taiwan Hakka, Guangdong Chaoshanese,
Dongguan Han and Hong Kong Han. According to previous studies, these populations were
Pre-print version. Visit http://digitalcommons.wayne.edu/humbiol/ after publication to acquire the final version.
mixed with mainly Han Chinese and part of indigenous people such as Daic, Austronesian,
and Hmong-Mien populations. Substantial matrilineages of these southern Han are of
southern origin (Wen et al. 2004a; Wang et al. 2010). This indicates that the Fujian Tanka are
deeply affected by several southern aboriginal populations. In summary, the interpopulation
comparison reveals that Fujian Tanka show close affinity with Daic population in the Y
chromosome and with southern Han in their mtDNA.
Network Analyses
To discern the detailed relationship between the Tanka people and related populations
including Han and other minority populations, we used reduced median-joining networks
constructed based on 15 Y-STRs and mtDNA HSV-I motifs (16000-16569) of major
haplogroups shown in Figures 5 and 6. The major Y haplogroups are O1a1a-P203, O1b1a1a-
M95 and O2a2b1a1-M117 in the Fujian Tanka. Notably, reference samples belonging to
haplogroup O1a1a-P203 and O1b1a1a-M95 were too many, so we selected haplotypes within
5 mutational steps from Tanka. There are two parts in the network of O1a1a-P203: the left
part is dominant with Taiwan aborigines, while the right is Southern Han, especially Fujian
Hakka and Taiwan Minnan individuals. In the left part of the network, the Tanka share the
STR haplotypes with Siraya individuals from Taiwan aborigines and have tight ties (in
general within three-step STR distance) with other Siraya and Amis individuals. In the right
part of the network, the Tanka also share with Taiwan Minnan individuals and have tight ties
with other Taiwan Minnan, Fujian Han and Fujian Hakka individuals. In the network of
O1b1a1a-M95, the Tanka can be divided into two groups. The two groups are far from each

Pre-print version. Visit http://digitalcommons.wayne.edu/humbiol/ after publication to acquire the final version.
other, but individuals are close to each other within each group. In the network of O2a2b1a1-
M117, the Tanka share haplotypes in common with southern Han samples. In addition to
sharing, many Tanka samples link directly with Han samples from Beiqi, southern Han and
northern Han. Moreover, these Han samples that link with the Tanka are closer to the center
of the network, which indicates the Tanka individuals are derived from Han individuals since
recent times.
The mtDNA HSV-I motifs and coding region sequencing information are given in
Table S3. Based on the motifs, the networks of mtDNA haplogroups F2a, F1a1, M7c1, D4a
and M8a2 were analyzed (Figure 6). The mtDNA networks are always star-like with a huge
central haplotype and a great number of small haplotypes derive from the central one. Almost
all of the populations share the central haplotype. Interactions among these ethnic groups can
be frequently observed. In addition to the southern aboriginal populations, the Tanka also
share the same motif with Han samples. This illustrates the recent gene flows between Tanka
and Han Chinese widely. In overall, the Tanka still retain some southern origin maternal
lineages.
Haplotype-Sharing Analysis and Time Estimation
To inspect the impact of recent events, we found the haplotypes less than 5 mutational steps
from the Fujian Tanka. Considering 15 Y-STRs and mutation rate 0.0021 per locus per
generation (Burgarella et al. 2011; Gusmão et al. 2005; Ge et al. 2009; Zhabagin et al. 2017),
five mutations roughly occur within two thousand years, which might cover the time interval
for our analysis. The search of shared haplotypes is performed in our in-house database

Pre-print version. Visit http://digitalcommons.wayne.edu/humbiol/ after publication to acquire the final version.
which contains 30548 Y-STR Asian haplotypes using the Haplomatch software (Chukhryaeva
et al. 2016). The shared haplotypes are listed in Table S5. In haplogroup O1a1a-P203, the
closely shared haplotypes were mostly from southeastern Han and Taiwan aborigines. In
haplogroup O2a2b1a1-M117, the closely shared haplotypes were mostly from southern Han,
northern Han and Tibetans. However, in haplogroup O1b1a1a-M95, we found 16 individuals
had no shared haplotypes less than 4 steps away and they were tightly linked with each other,
which may be a signal of an isolated population. Then we estimated the divergence time from
these isolated individuals (IsoIndi) and other populations (Table 1, Table S6). First, we used
time to the most recent common ancestor (TMRCA) of isolated individuals as the lower
bound. Although pedigree STR mutation rate underestimates the TMRCAs of older nodes
(Wei et al. 2013), this method performs some precision for young nodes (<10 ka) (Hallast et
al. 2015; Wang et al. 2015)when compared with full Y-chromosome sequence data. Then in
our previous case studies (Wang et al. 2015) about evaluating the Y-STR dating in deep-
rooting pedigrees, we found that the Y chromosomal genealogical mutation rates (OMRB and
lmMR) from the BATWING method could give the best-fit estimation for historical lineage
dating. Hence, the lower bound was about 1033.8-1050.6 years before present, in the early
years of Northern Song Dynasty, which indicated the divergence time was a least 1033.8-
1050.6 years before present. According to historical records (Han 1954), an event played
important role in the formation of Tanka: the refugees eluding from wars in the Five
Dynasties and Ten Kingdoms period (from 1040 to 1112 years before present).So our
estimated time coincides with historical records, which suggests that the formation of Fujian
Tanka may be related to this historical event.
Pre-print version. Visit http://digitalcommons.wayne.edu/humbiol/ after publication to acquire the final version.
Discussion
The ancient Daic people represented an ancient ethnic group residing along southern coast of
China from around 2000-8000 years ago. According to archeological studies (Peng 2009),
this group was characterized by rice farming, pottery with geometric patterns, stepped adze,
shouldered stone axe, stilted houses (called Ganlan-style houses) and a custom of tooth
ablation. Then, when the Han began to expand southward in 2000 years ago (Wen et al.
2004b), a large number of ancient Daic descendants were assimilated by Han Chinese. Others
migrated and became the Daic people (Song 1991; Wang 1999; Xu 1988; Jiang 1988) and
Taiwan aboriginal populations (Lin 1981; Lin 1955; Shi 1982). Since there are few direct
genetic studies on the ancient Daic people, we had to represent them using their supposed
present descendants like Daic populations including Zhuang, Dong, Sui, Thai, and Taiwan
aborigines including Amis, Siraiya, and Atayal.
In this study, based on genetic evidence from Y chromosome and mtDNA, our results
support the admixture origin hypothesis - the Tanka are mainly descendants of ancient Daic
with limited gene flows from Han Chinese. The Tanka gene pools were mainly contributed by
the lineages of southern East Asian origin. In population comparisons, the Fujian Tanka
showed closer affinity with the Daic population than the Han Chinese in paternal Y
chromosome lineages. However, in maternal mtDNA lineages, the Tanka people were closely
clustered with some mixed southern Han populations such as Chaoshanese and Hakka. The
network and haplotype-sharing analyses at individual level also supported the hypothesis. In
haplogroup O1a1a-P203, the Fujian Tanka samples showed tight links to Taiwan aborigines
Pre-print version. Visit http://digitalcommons.wayne.edu/humbiol/ after publication to acquire the final version.
and southeastern Han. In haplogroup O2a2b1a1-M117, the samples reflected recent
population expansion from Han Chinese. Notably, in haplogroup O1b1a1a-M95, the samples
were isolated from other populations. The divergence time from these Tanka-specific
haplotypes to others was at least in the early years of Northern Song Dynasty, which
corresponded with an important historical event related to the formation of Tanka. Moreover,
the highest frequency of mtDNA haplogroup F2a in Tanka also indicated the strong
bottleneck in maternal lineages.
The Fujian Tanka population is an excellent sample for studying the population
isolation in southern China in the context of demic diffusion of Han culture. The origin of
Fujian Tanka is mainly from ancient Daic people. However, due to the discrimination and
cultural differences, the Fujian Tanka have been relatively isolated from the Han populations
on the land, and also from the Daic populations migrated to southwestern China. The
divergence time inferred by Tanka-specific haplotypes indicated that the formation of Fujian
Tanka was a least 1033.8-1050.6 years before present. Then limited diffusion from “land”
population to Tanka has never been interrupted.
One of the interesting folklore about the origin of Han Chinese in Fujian is that they
were admixture of Han male immigrants and indigenous Daic females. However, our data
rejected this hypothesis. The Fujian Han people comprise maternal lineages mainly from Han
origin. In the contrary, the indigenous Tanka people are mainly admixture of Daic males and
Han females.
Acknowledgments

Pre-print version. Visit http://digitalcommons.wayne.edu/humbiol/ after publication to acquire the final version.
We are grateful to all the volunteers for providing blood samples. We also thank Michael
Storozum for his helpful text revision. This work was supported by the Scientific and
Technology Committee of Shanghai Municipality (18490750300), the National Key R&D
Program of China (2016YFC0900303,2017YFC0910101) and National Natural Science
Foundation of China (91731303, 81671874, 31771325, 91631105,31671297).
Received 20 September 2019; accepted for publication 4 February 2020.

Pre-print version. Visit http://digitalcommons.wayne.edu/humbiol/ after publication to acquire the final version.
Literature Cited
Andrews, R. M., I. Kubacka, P. F. Chinnery et al. 1999. Reanalysis and revision of the
Cambridge reference sequence for human mitochondrial DNA. Nat. Genet. 23:147.
Arunkumar, G. P., L. H. Wei, V. J. Kavitha et al. 2015. A late Neolithic expansion of Y
chromosomal haplogroup O2a1-M95 from east to west. J. Syst. Evol. 53:546–560.
Bandelt, H. J., P. Forster, and A. Rohl. 1999. Median-joining networks for inferring
intraspecific phylogenies. Mol. Biol. Evol. 16:37–48.
Behar, D. M., E. Metspalu, T. Kivisild et al. 2006. The matrilineal ancestry of Ashkenazi
Jewry: Portrait of a recent founder event. Am. J. Hum. Genet. 78:487–497.
Behar, D. M., B. Yunusbayev, M. Metspalu et al. 2010. The genome-wide structure of the
Jewish people. Nature 466:238–242.
Bodner, M., B. Zimmermann, A. Röck et al. 2011. Southeast Asian diversity: First insights
into the complex mtDNA structure of Laos. BMC Evol. Biol. 11:1–12.
Bryc, K., E. Durand, J. Macpherson et al. 2015. The genetic ancestry of African Americans,
Latinos, and European Americans across the United States. Am. J. Hum. Genet.
96:37–53.
Burgarella, C., and M. Navascués. 2011. Mutation rate estimates for 110 Y-chromosome
STRs combining population and father-son pair data. Eur. J. Hum. Genet. 19:70–75.
Cai, X. Y., Z. D. Qin, B. Wen et al. 2011. Human migration through bottlenecks from
Southeast Asia into East Asia during Last Glacial Maximum revealed by Y
chromosomes. PLoS One 6:1–10.
Chaubey, G., M. Metspalu, Y. Choi et al. 2011. Population genetic structure in Indian

Pre-print version. Visit http://digitalcommons.wayne.edu/humbiol/ after publication to acquire the final version.
Austroasiatic speakers: The role of landscape barriers and sex-specific admixture.
Mol. Biol. Evol. 28:1,013–1,024.
Chen, B. S. 1954. The name, origin, characteristic and minority identification about “water
residents” in Fuzhou. J. Xiamen Univ.
Chen, F., S. Y. Wang, R. Z. Zhang et al. 2008. Analysis of mitochondrial DNA
polymorphisms in Guangdong Han Chinese. Forensic Sci. Int. Genet. 2:150–153.
Chen, X. J. 1948. The Survey of Tanka People in Fuzhou. Beijing, China: The Commercial
Press.
Chukhryaeva, M. I., I. O. Ivanov, S. A. Frolova et al. 2016. The haplomatch program for
comparing Y-chromosome STR-haplotypes and its application to the analysis of the
origin of Don Cossacks. Russ. J. Genet. 52:521–529.
Delfin, F., J. M. Salvador, G. C. Calacal et al. 2010. The Y-chromosome landscape of the
Philippines: Extensive heterogeneity and varying genetic affinities of Negrito and
non-Negrito groups. Eur. J. Hum. Genet. 19:224–230.
Deng, Q. Y., C. C. Wang, X. Q. Wang et al. 2013. Genetic affinity between the Kam-Sui
speaking Chadong and Mulam people. J. Syst. Evol. 51:263–270.
Francalacci, P., L. Morelli, A. Angius et al. 2013. Low-pass DNA sequencing of 1200
Sardinians reconstructs European Y-chromosome phylogeny. Science 341:565–569.
Gan, R. J., S. L. Pan, L. F. Mustavich et al. 2008. Pinghua population as an exception of Han
Chinese’s coherent genetic structure. J. Hum. Genet. 53:303–313.
Gayden, T., A. M. Cadenas, M. Regueiro et al. 2007. The Himalayas as a directional barrier
to gene flow. Am. J. Hum. Genet. 80:884–894.

Pre-print version. Visit http://digitalcommons.wayne.edu/humbiol/ after publication to acquire the final version.
Ge, J., B. Budowle, X. G. Aranda et al. 2009. Mutation rates at Y chromosome short tandem
repeats in Texas populations. Forensic Sci. Int. Genet. 3:179–184.
Glass, B., and C. C. Li. 1953. The dynamics of racial intermixture: An analysis based on the
American Negro. Am. J. Hum. Genet. 5:1–20.
Gresham, D., B. Morar, P. A. Underhill et al. 2001. Origins and divergence of the Roma
(gypsies). Am. J. Hum. Genet. 69:1,314–1,331.
Gusmão, L., P. Sánchez-Diz, F. Calafell et al. 2005. Mutation rates at Y chromosome specific
microsatellites. Hum. Mutat. 26:520–528.
Hallast, P., C. Batini, D. Zadik et al. 2015. The Y-chromosome tree bursts into leaf: 13,000
high-confidence SNPs covering the majority of known clades. Mol. Biol. Evol.
32:661–673.
Hammer, M. F., D. M. Behar, T. M. Karafet et al. 2009. Extended Y chromosome haplotypes
resolve multiple and unique lineages of the Jewish priesthood. Hum. Genet. 126:707–
717.
Han, Z. H. 1954. The origin of Fujian Tanka. J. Xiamen Univ.
Huang, X. C. 2008. Through the angle of Tanka: A hundred years exploration of study of
ethnohistory and ethnic group of China. Stud. Ethn. Guangxi 4:55–65.
Irwin, J. A., J. L. Saunier, H. Niederstätter et al. 2009. Investigation of heteroplasmy in the
human mitochondrial DNA control region: A synthesis of observations from more
than 5000 global population samples. J. Mol. Evol. 68:516–527.
Irwin, J. A., J. L. Saunier, K. M. Strouss et al. 2008. Mitochondrial control region sequences
from a Vietnamese population sample. Int. J. Legal Med. 122:257–259.

Pre-print version. Visit http://digitalcommons.wayne.edu/humbiol/ after publication to acquire the final version.
Jiang, B. Z., J. J. Wu, and T. C. Xin. 1988. The Culture of Baiyue. Shanghai, China: Xuelin
Publishing House.
Jin, H. J., C. Tyler-Smith, and W. Kim. 2009. The peopling of Korea revealed by analyses of
mitochondrial DNA and Y-chromosomal markers. PLoS One 4:1–10.
Kang, L., Y. Lu, C. Wang et al. 2012. Y-chromosome O3 haplogroup diversity in Sino-
Tibetan populations reveals two migration routes into the Eastern Himalayas. Ann.
Hum. Genet. 76:92–99.
Karafet, T. M., B. Hallmark, M. P. Cox et al. 2010. Major east-west division underlies Y
chromosome stratification across Indonesia. Mol. Biol. Evol. 27:1,833–1,844.
Kivisild, T., H. V. Tolk, J. Parik et al. 2002. The emerging limbs and twigs of the East Asian
mtDNA tree. Mol. Biol. Evol. 19:1,737–1,751.
Kloss-Brandstätter, A., D. Pacher, S. Schönherr et al. 2011. HaploGrep: A fast and reliable
algorithm for automatic classification of mitochondrial DNA haplogroups. Hum.
Mutat. 32:25–32.
Ko, M. S., C. Y. Chen, Q. Fu et al. 2014. Early Austronesians: Into and out of Taiwan. Am. J.
Hum. Genet. 94:426–436.
Kumar, V., A. N. Reddy, J. P. Babu et al. 2007. Y-chromosome evidence suggests a common
paternal heritage of Austro-Asiatic populations. BMC Evol. Biol. 7:1–14.
Kutanan, W., J. Kampuansai, and A. Brunelli. 2018. New insights from Thailand into the
maternal genetic history of mainland Southeast Asia. Eur. J. Hum. Genet. 26:898–911.
Kutanan, W., J. Kampuansai, M. Srikummool et al. 2017. Complete mitochondrial genomes
of Thai and Lao populations indicate an ancient origin of Austroasiatic groups and

Pre-print version. Visit http://digitalcommons.wayne.edu/humbiol/ after publication to acquire the final version.
demic diffusion in the spread of Tai–Kadai languages. Hum. Genet. 136:85–98.
Li, D., H. Li, C. Ou et al. 2008a. Paternal genetic structure of Hainan Aborigines isolated at
the entrance to East Asia. PLoS One 3:1–6.
Li, H., X. Cai, E. R. Winograd-Cort et al. 2010. Mitochondrial DNA diversity and population
differentiation in southern East Asia. Am. J. Phys. Anthropol. 134:481–488.
Li, H., B. Wen, S. J. Chen et al. 2008b. Paternal genetic affinity between western
Austronesians and Daic populations. BMC Evol. Biol. 8:1–12.
Li, Y. C., W. Huang, J. Y. Tian et al. 2016. Exploring the maternal history of the Tai people. J.
Hum. Genet. 61:721–729.
Li, Y. C., W. J. Ye, C. G. Jiang et al. 2019. River valleys shaped the maternal genetic
landscape of Han Chinese. Mol. Biol. Evol. 36:1,643–1,652.
Lin, H. X. 1936. Tanka people. In Chinese Ethnic History. Beijing, China: The Commercial
Press, 139–144.
Lin, H. X. 1955. Research on the stone age relics in Taiwan. J. Xiamen Univ. Arts Soc. Sci.
Ed. 4.
Lin, H. X. 1981. Anthropological Works. Fuzhou, China: Fujian People’s Publishing House.
Luo, X. L. 1929. Tanka people. Folklore 76.
Majumder, P. P. 2010. The human genetic history of South Asia. Curr. Biol. 20:R184–R187.
Mendizabal, I., O. Lao, U. M. Marigorta et al. 2012. Reconstructing the population history of
European Romani from genome-wide data. Curr. Biol. 22:2,342–2,349.
Ning, C., S. Yan, K. Hu et al. 2016. Refined phylogenetic structure of an abundant East Asian
Y-chromosomal haplogroup O*-M134. Eur. J. Hum. Genet. 24:307–309.

Pre-print version. Visit http://digitalcommons.wayne.edu/humbiol/ after publication to acquire the final version.
Oven, M. V., and M. Kayser. 2009. Updated comprehensive phylogenetic tree of global
human mitochondrial DNA variation. Hum. Mut. 30:E386–E394.
Pala, M., A. Achilli, A. Olivieri et al. 2009. Mitochondrial haplogroup U5b3: A distant echo
of the epipaleolithic in Italy and the legacy of the early Sardinians. Am. J. Hum.
Genet. 84:814–821.
Park, M. J., H. Y. Lee, W. I. Yang et al. 2012. Understanding the Y chromosome variation in
Korea: Relevance of combined haplogroup and haplotype analyses. Int. J. Legal Med.
126:589–599.
Peng, M. S., J. D. He, H. X. Liu et al. 2011. Tracing the legacy of the early Hainan Islanders:
A perspective from mitochondrial DNA. BMC Evol. Biol. 11:1–13.
Peng, M. S., H. H. Quang, K. P. Dang et al. 2010. Tracing the Austronesian footprint in
mainland Southeast Asia: A perspective from mitochondrial DNA. Mol. Biol. Evol.
27:2,417–2,430.
Peng, S. F. 2009. The Study of Southern China Archaeology and Baiyue. Beijing, China:
Science Press.
Qin, Z., Y. Yang, L. Kang et al. 2010. A mitochondrial revelation of early human migrations
to the Tibetan Plateau before and after the last glacial maximum. Am. J. Phys.
Anthropol. 143:555–569.
Reed, T. E. 1969. Caucasian genes in American Negroes. Science 165:762–768.
Regueiro, M., A. Stanojevic, S. Chennakrishnaiah et al. 2011. Divergent patrilineal signals in
three Roma populations. Am. J. Phys. Anthropol. 144:80–91.
Reich, D., K. Thangaraj, N. Patterson et al. 2009. Reconstructing Indian population history.

Pre-print version. Visit http://digitalcommons.wayne.edu/humbiol/ after publication to acquire the final version.
Nature 461:489–494.
Shi, H., Y. L. Dong, B. Wen et al. 2005. Y-chromosome evidence of southern origin of the
East Asian-specific haplogroup O3-M122. Am. J. Hum. Genet. 77:408–419.
Shi, L. Z. 1982. The origin of Gaoshan people. Ethno-Natl. Stud. 3:27–36.
Shi, W., Q. Ayub, M. Vermeulen et al. 2010. A worldwide survey of human male
demographic history based on Y-SNP and Y-STR data from the HGDP-CEPH
populations. Mol. Biol. Evol. 27:385–393.
Sidore, C., F. Busonero, A. Maschio et al. 2015. Genome sequencing elucidates Sardinian
genetic architecture and augments association analyses for lipid and blood
inflammatory markers. Nat. Genet. 47:1,272–1,281.
Song, S. H. 1991. Bai-Yue. Changchun, China: Jilin Education Press.
Summerer, M., J. Horst, G. Erhart et al. 2014. Large-scale mitochondrial DNA analysis in
Southeast Asia reveals evolutionary effects of cultural isolation in the multi-ethnic
population of Myanmar. BMC Evol. Biol. 14:1–12.
Thangaraj, K., G. Chaubey, T. Kivisild et al. 2005. Reconstructing the origin of Andaman
Islanders. Science 308:996.
Thuy, D. N., M. Enrico, T. N. Dang et al. 2018. Complete human mtDNA genome sequences
from Vietnam and the phylogeography of Mainland Southeast Asia. Sci. Rep. 8:1–13.
Trejaut, J. A., E. S. Poloni, J. C. Yen et al. 2014. Taiwan Y-chromosomal DNA variation and
its relationship with Island Southeast Asia. BMC Genet. 15:1–23.
Wang, C. C., and H. Li. 2015. Evaluating the Y chromosomal STR dating in deep-rooting
pedigrees. Investig. Genet. 6:1–3.
Pre-print version. Visit http://digitalcommons.wayne.edu/humbiol/ after publication to acquire the final version.
Wang, C. C., L. X. Wang, R. Shrestha et al. 2014. Genetic structure of Qiangic populations
residing in the western Sichuan corridor. PLoS One 9:1–14.
Wang, W. G. 1999. The Ethnic History of Southern China. Beijing, China: The Ethnic
Publishing House.
Wang, W. Z., C. Y. Wang, Y. T. Cheng et al. 2010. Tracing the origins of Hakka and
Chaoshanese by mitochondrial DNA analysis. Am. J. Phys. Anthropol. 141:124–130.
Wei, W., Q. Ayub, Y. Xue et al. 2013. A comparison of Y-chromosomal lineage dating using
either resequencing or Y-SNP plus Y-STR genotyping. Forensic Sci. Int. Genet.
7:568–572.
Wen, B., H. Li, S. Gao et al. 2004a. Genetic structure of Hmong-Mien speaking populations
in East Asia as revealed by mtDNA lineages. Mol. Biol. Evol. 22:725–733.
Wen, B., H. Li, D. Lu et al. 2004b. Genetic evidence supports demic diffusion of Han culture.
Nature 431:302–305.
Wen, B., X. H. Xie, S. Gao et al. 2004c. Analyses of genetic structure of Tibeto-Burman
populations reveals sex-biased admixture in Southern Tibeto-Burmans. Am. J. Hum.
Genet. 74:856–865.
Wen, S. Q., X. Z. Tong, and H. Li. 2016. Y-chromosome-based genetic pattern in East Asia
affected by Neolithic transition. Quat. Int. 426:50–55.
Wen, S. Q., D. Xu, H. B. Yao et al. 2017. Present Y chromosomes refute the Roma/Gypsy
origin of the Xuejiawan people in Northwest China. In Languages and Genes in
Northwestern China and Adjacent Regions, D. Xu and H. Li, eds. Singapore:
Springer, 107–120.

Pre-print version. Visit http://digitalcommons.wayne.edu/humbiol/ after publication to acquire the final version.
Wilson, I. J., M. E. Weale, D. J. Balding et al. 2003. Inferences from DNA data: Population
histories, evolutionary processes and forensic match probabilities. J. R. Stat. Soc. Ser.
A Stat. Soc. 116:155–188.
Xu, F. L., M. Ding, J. Yao et al. 2017. Association between mitochondrial DNA variations
and schizophrenia in the northern Chinese Han population. PLoS One 12:1–11.
Xu, F. L., J. Yao, M. Ding et al. 2018. Characterization of mitochondrial DNA
polymorphisms in the Han population in Liaoning Province, Northeast China.
Mitochondrial DNA A. DNA Mapp. Seq. Anal. 29:250–255.
Xu, J. S., and H. Li. 2014. Ethnic History of Greater Canton. Kunming, China: Yunnan
People’s Publishing House.
Xu, K., and S. Hu. 2015. Population data of mitochondrial DNA HVS-I and HVS-II
sequences for 208 Henan Han Chinese. Leg. Med. (Tokyo) 17:287–294.
Xue, Y., T. Zerjal, W. Bao et al. 2006. Male demography in East Asia: A north-south contrast
in human population expansion times. Genetics 172:2,431–2,439.
Yan, S., C. C. Wang, H. Li et al. 2011. An updated tree of Y-chromosome haplogroup O and
revised phylogenetic positions of mutations P164 and PK4. Eur. J. Hum. Genet.
19:1,013–1,015.
Yan, S., C. C. Wang, H. X. Zheng et al. 2014. Y chromosomes of 40% Chinese descend from
three Neolithic super-grandfathers. PLoS One 9:1–7.
Yao, Y. G., Q. P. Kong, H. J. Bandelt et al. 2002. Phylogeographic differentiation of
mitochondrial DNA in Han Chinese. Am. J. Hum. Genet. 70:635–651.
Yao, Y. G., Q. P. Kong, X. Y. Man et al. 2003. Reconstructing the evolutionary history of

Pre-print version. Visit http://digitalcommons.wayne.edu/humbiol/ after publication to acquire the final version.
China: A caveat about inferences drawn from ancient DNA. Mol. Biol. Evol. 20:214–
219.
Zhabagin, M., E. Balanovska, Z. Sabitov et al. 2017. The connection of the genetic, cultural
and geographic landscapes of Transoxiana. Sci. Rep. 7:1–11.
Zhang, X. M., S. Y. Liao, X. B. Qi et al. 2015. Y-chromosome diversity suggests southern
origin and Paleolithic backwave migration of Austro-Asiatic speakers from eastern
Asia to the Indian subcontinent. Sci. Rep. 5:1–8.
Zhivotovsky, L. A., P. A. Underhill, C. Cinnioğlu et al. 2004. The effective mutation rate at Y
chromosome short tandem repeats, with application to human population-divergence
time. Am. J. Hum. Genet. 74:50–61.
Zhong, J. W. 1928. The literature of Tanka people. Novel Monthly.
Zhou, H. Y., H. Y. Shu, J. Dai et al. 2018. Maternal genetic backgrounds contribute to the
genetic susceptibility of tongue cancer patients in Hunan, central of China.
Mitochondrial DNA A. DNA Mapp. Seq. Anal. 29:347–352.
Zhou, H. Y., H. W. Wang, S. N. Tan et al. 2014. Genetic affinities of central China
populations. Genet. Mol. Res. 13:616–625.

Pre-print version. Visit http://digitalcommons.wayne.edu/humbiol/ after publication to acquire the final version.
Table 1. The TMRCA of Selected Individuals Using BATWING (time in years)
EMR lmMR OMRB OMRS
TMRCA 95% CI TMRCA 95% CI TMRCA 95% CI TMRCA 95% CI
IsoIndi 4140.9 568-28479.8 1050.6 153-6477.6 1033.8 150.5-6380.7 813.8 115.8-5127.9
IsoIndi 16 isolated individuals; OMRB and OMRS Two observed genealogical mutation rates; lmMR Genealogical mutation rate adjusted for population
variation using logistic model; EMR the evolutionary mutation rate.
Pre-print version. Visit http://digitalcommons.wayne.edu/humbiol/ after publication to acquire the final version.
Supplementary Table S1. The Primers of Mitochondrial Sequencing
Primer Name Forward Primer Reverse Primer Length Region (hg38)
HVS1 CTTTTTCCAAGGACAAATCAGA TTATGACCCTGAAGTAGGAACC 586bp 15939-16524
HVS2 TGTATCCGACATCTGGTTCC TGACTGTTAAAAGTGCATACC 510bp 16489-432
10759-11209 AAGTCTGGCCTATGAGTGAC GTGGGTGGTTGTGTTGATTC 492bp 10358-10849
14949-15408 TATTCCTAGCCATGCACTACTC ATTGTGTAGTAAGGGTGGAAGG 532bp 14892-15423
12616-13171 AGCTCTCCCTAAGCTTCAAAC TGATAGCGCCTAAGCATAGTG 627bp 12560-13186
13157-13567 CAGGAATCTTCTTACTCATCC GCGATGAGAGTAATAGATAGG 481bp 13100-13580
13485-13933 ACCATACCTCTCACTTCAACC ATTGTGCGGTGTGTGATGC 518bp 13429-13946
13894-14349 TAGACCTCAACTACCTAACC GTGGGTGAAAGAGTATGATG 522bp 13841-14362
14620-14979 ACACCGCTAACAATCAATAC TGAAGGTAGCGGATGATTC 431bp 14564-14994
8111-8543 AAGACGTCTTGCACTCATG GCAATGAATGAAGCGAACAG 504bp 8055-8558
12070-12634 ACTCACCCACCACATTAAC TGAGAATTCTATGATGGACC 636bp 12013-12648
1297-1763 CTCTTGCTCAGCCTATAT ATTGCGCCAGGTTTCAATTTC 533bp 1242-1774
9361-9864 AGCCATGTGATTTCACTTCC TATTAGTTGGCGGATGAAGC 580bp 9299-9878

Pre-print version. Visit http://digitalcommons.wayne.edu/humbiol/ after publication to acquire the final version.
5035-5329 AGCAGTTCTACCGTACAACC TTACTGAGGGCTTTGAAGGC 518bp 5042-5559
5914-6366 CAGTCCAATGCTTCACTCAGCC CTAAGATAGAGGAGACACCTGC 520bp 5862-6381
10143-10553 AACACCCTCCTAGCCTTAC AGGATATGAGGTGTGAGCG 469bp 10086-10554
2163-2602 AGGAACAGCTCTTTGGACAC AGGAACAAGTGATTATGCTACC 508bp 2106-2613
4283-4718 TACCCATTACAATCTCCAGC TTGGTTATGGTTCATTGTCC 507bp 4226-4732

Pre-print version. Visit http://digitalcommons.wayne.edu/humbiol/ after publication to acquire the final version.
Supplementary Table S2. 17 Y-STRs Data of 87 Individuals in This Study
Population Sample ID
G_D
YS
19
B_D
YS
389I
B_D
YS
389b
B_D
YS
390
Y_D
YS
391
Y_D
YS
392
Y_D
YS
393
R_D
YS
437
R_D
YS
438
Y_D
YS
439
R_D
YS
448
B_D
YS
456
G_D
YS
458
Y_D
YS
635
R_Y
_G
AT
A_H
4
G_D
YS
385a
G_D
YS
385b
Haplogroup
Beiqi D01 16 12 17 25 10 13 12 15 10 12 19 15 16 21 13 11 16 O2a2b*-P164+,M134-
Beiqi D02 15 13 16 23 11 11 15 14 10 12 21 15 17 22 12 11 18 C2-M217
Beiqi D03 14 12 16 23 10 14 12 15 11 11 20 15 18 20 11 15 19 O2a2b1a1-M117
Beiqi D04 15 12 17 24 11 14 13 14 10 13 18 17 15 19 12 13 13 O1a1a-P203
Beiqi D05 15 12 16 22 10 14 13 14 10 12 18 14 16 20 12 13 14 O1a1a-P203
Beiqi D06 17 13 17 24 10 13 12 14 10 13 20 15 18 23 11 12 20 O2a1b-002611
Beiqi D07 14 12 16 23 10 14 12 15 11 11 20 15 19 20 12 15 18 O2a2b1a1-M117
Beiqi D08 14 12 16 23 10 14 12 15 11 11 20 15 19 20 12 15 18 O2a2b1a1-M117
Beiqi D09 15 12 16 22 11 14 13 14 10 12 18 14 15 20 12 13 14 O1a1a-P203
Beiqi D10 14 12 16 23 10 14 12 15 11 12 20 15 19 21 12 15 18 O2a2b1a1-M117
Beiqi D11 15 13 17 24 10 13 13 15 10 12 20 15 16 20 11 13 22 O2a2*-P201
Beiqi D12 14 12 16 23 10 14 12 15 11 11 20 15 19 20 12 15 18 O2a2b1a1-M117
Beiqi D13 15 12 16 23 10 14 13 14 10 11 18 14 17 20 12 13 13 O1a1a-P203
Beiqi D14 15 13 16 24 10 13 12 15 10 13 19 15 18 21 12 11 16 O2a2b1*-M134+,M117-
Beiqi D15 15 12 15 23 10 14 12 14 10 12 18 15 15 20 12 13 13 O1a1a-P203
Beiqi D16 16 13 16 24 10 13 12 14 10 12 20 15 17 24 11 12 18 O2a1b-002611
Beiqi D17 14 12 16 24 11 14 12 15 11 13 19 15 19 21 12 12 19 O2a2b1a1-M117
Beiqi D18 14 12 16 24 10 14 12 15 11 13 20 15 17 18 12 13 19 O2a2b1a1-M117
Beiqi D19 16 12 17 24 11 14 13 14 10 12 18 17 15 19 12 13 13 O1a1a-P203
Beiqi D20 15 12 17 24 11 14 13 14 10 13 18 17 15 19 12 13 13 O1a1a-P203
Shuisheng D21 15 12 16 24 10 13 12 16 11 11 20 15 16 21 12 12 18 O2a2b1a1-M117
Shuisheng D22 14 12 16 25 10 13 12 14 10 11 19 14 16 20 12 12 19 O2a1b-002611

Pre-print version. Visit http://digitalcommons.wayne.edu/humbiol/ after publication to acquire the final version.
Shuisheng D23 15 14 17 24 10 14 12 14 10 11 18 15 17 22 10 13 19 O1b1a1a-M95
Shuisheng D24 15 14 17 24 10 14 12 14 10 11 18 16 17 22 10 13 19 O1b1a1a-M95
Shuisheng D25 15 13 16 22 10 13 12 14 10 14 20 15 19 22 12 11 11 O2a1b-002611
Shuisheng D26 15 14 17 24 10 14 12 14 10 11 18 15 17 22 10 13 19 O1b1a1a-M95
Shuisheng D27 15 12 17 24 11 14 13 14 10 11 18 17 15 19 12 13 13 O1a1a-P203
Shuisheng D28 15 12 17 24 11 14 13 14 10 11 18 17 15 19 12 13 13 O1a1a-P203
Shuisheng D29 15 13 18 23 10 13 12 14 10 11 19 14 18 21 12 13 18 O2a1a1a1a1-M121
Shuisheng D30 15 14 18 24 10 14 12 14 10 11 18 16 17 22 10 13 19 O1b1a1a-M95
Shuisheng D31 16 12 16 23 10 15 13 14 10 11 18 16 15 19 12 13 14 O1a1a-P203
Shuisheng D32 16 13 16 24 10 11 14 14 10 11 21 15 15 20 10 11 18 C2-M217
Shuisheng D33 15 12 17 24 11 14 13 14 10 12 18 16 15 19 12 13 13 O1a1a-P203
Shuisheng D34 15 12 17 24 11 14 13 14 10 12 18 16 15 19 12 13 13 O1a1a-P203
Shuisheng D35 15 14 17 24 10 14 12 14 10 11 18 16 17 22 10 13 19 O1b1a1a-M95
Shuisheng D36 15 12 15 24 10 14 12 15 11 12 20 15 16 20 12 14 19 O2a2b1a1-M117
Shuisheng D37 16 12 16 23 10 15 13 14 10 11 18 16 15 19 12 13 14 O1a1a-P203
Shuisheng D38 15 14 18 24 10 14 12 14 10 11 18 16 17 22 10 13 19 O1b1a1a-M95
Shuisheng D39 15 14 17 24 10 14 12 14 10 11 18 16 17 22 10 13 19 O1b1a1a-M95
Shuisheng D40 15 12 17 24 11 14 13 14 10 12 18 16 15 19 12 13 13 O1a1a-P203
Shuisheng D41 15 14 17 24 10 14 12 14 10 11 18 16 17 22 10 13 19 O1b1a1a-M95
Huyu’ao D42 15 14 19 24 10 14 12 14 10 11 18 16 17 22 10 13 19 O1b1a1a-M95
Huyu’ao D43 15 14 17 24 10 14 12 14 10 11 18 16 17 22 10 13 19 O1b1a1a-M95
Huyu’ao D44 15 14 19 24 10 14 12 14 10 11 18 16 17 22 10 13 19 O1b1a1a-M95
Huyu’ao D45 15 14 16 24 11 13 14 14 10 12 18 14 20 21 10 13 17 O1b1a1a-M95
Huyu’ao D46 16 12 16 23 10 15 13 14 10 11 18 16 15 19 12 13 14 O1a1a-P203
Huyu’ao D47 15 14 17 24 10 14 12 14 10 11 18 16 17 22 10 13 19 O1b1a1a-M95
Huyu’ao D48 16 12 16 23 10 15 13 14 10 11 18 16 15 19 12 13 14 O1a1a-P203
Huyu’ao D49 15 14 17 24 10 14 12 14 10 11 18 16 17 22 10 13 19 O1b1a1a-M95
Huyu’ao D50 15 13 17 24 10 13 13 15 10 12 20 15 16 20 11 13 22 O2a2*-P201
Huyu’ao D51 15 14 19 24 10 14 12 14 10 11 18 16 19 22 10 13 19 O1b1a1a-M95
Huyu’ao D52 16 13 16 23 11 14 14 14 10 10 18 14 18 21 12 11 11 N1a1a-M178
Huyu’ao D53 15 14 16 24 11 13 14 14 10 12 18 14 20 21 10 13 17 O1b1a1a-M95
Pre-print version. Visit http://digitalcommons.wayne.edu/humbiol/ after publication to acquire the final version.
Huyu’ao D54 16 12 16 23 10 15 13 14 10 11 18 16 15 19 12 13 14 O1a1a-P203
Huyu’ao D55 16 12 16 23 10 15 13 14 10 11 18 16 15 19 12 13 14 O1a1a-P203
Huyu’ao D56 16 12 16 23 10 15 13 14 10 11 18 16 15 19 12 13 14 O1a1a-P203
Huyu’ao D57 15 12 15 24 10 14 12 15 11 12 20 15 16 20 12 14 19 O2a2b1a1-M117
Huyu’ao D58 15 14 19 24 10 14 12 14 10 11 18 16 19 22 10 13 19 O1b1a1a-M95
Huyu’ao D59 16 12 16 23 10 15 13 14 10 11 18 16 15 19 12 13 14 O1a1a-P203
Huyu’ao D60 16 12 16 23 10 15 13 14 10 11 18 16 16 19 12 13 14 O1a1a-P203
Huyu’ao D61 15 14 16 24 11 13 14 14 10 12 18 14 20 21 10 13 17 O1b1a1a-M95
Huyu’ao D62 15 14 19 24 10 14 12 14 10 11 18 16 19 22 10 13 19 O1b1a1a-M95
Dongguan DH63 14 12 18 23 10 11 12 15 11 13 20 15 16 19 12 15 16 D1a1-M15
Dongguan DH64 15 12 16 24 11 13 12 15 11 12 20 15 19 20 12 14 18 O2a2b1a1-M117
Dongguan DH65 15 13 17 23 10 11 13 14 10 12 22 15 16 21 11 11 18 C2-M217
Dongguan DH66 14 12 18 23 10 11 12 15 11 13 20 15 15 19 12 15 16 D1a1-M15
Dongguan DH67 15 12 16 23 10 14 13 14 10 11 17 15 16 20 12 13 13 O1a1a-P203
Dongguan DH68 14 12 17 24 10 14 13 14 11 12 21 15 16 20 13 13 13 O2a2b1a1-M117
Dongguan DH69 15 13 16 23 10 11 15 14 10 11 21 16 16 21 11 11 17 C2-M217
Dongguan DH70 15 12 16 25 10 13 12 14 10 12 18 13 18 21 11 14 17 O2a1b-002611
Dongguan DH71 15 12 16 23 11 14 13 15 7 12 18 15 15 19 12 13 13 O1a1a-P203
Dongguan DH72 14 14 16 25 11 13 12 14 11 12 20 15 17 21 11 13 19 O2-M122
Dongguan DH73 15 13 18 23 10 13 12 14 10 12 19 14 17 21 11 12 19 O2a1a1a1a1-M121
Dongguan DH74 15 13 16 23 10 11 13 14 10 12 22 15 16 21 11 11 18 C2-M217
Dongguan DH75 15 12 16 24 10 14 12 15 11 11 20 15 18 20 12 14 18 O2a2b1a1-M117
Dongguan DH76 14 12 16 23 10 14 12 15 11 12 20 15 19 20 12 15 18 O2a2b1a1-M117
Dongguan DH77 15 12 17 23 10 14 12 14 10 12 19 16 16 20 12 12 13 O1a*-M119
Dongguan DH78 15 13 17 23 10 11 13 14 10 12 22 15 16 21 11 11 18 C2-M217
Dongguan DH79 14 12 16 23 10 14 12 15 11 12 20 15 18 21 12 15 19 O2a2b1a1-M117
Dongguan DH80 14 12 16 23 10 14 12 15 11 11 20 15 18 20 12 15 18 O2a2b1a1-M117
Dongguan DH81 15 12 16 24 11 14 12 15 11 12 20 15 17 20 12 14 18 O2a2b1a1-M117
Dongguan DH82 13 13 17 22 10 14 14 14 10 10 19 16 14 23 11 11 11 N*-M231
Dongguan DH83 17 13 16 25 10 13 14 14 10 12 18 15 16 21 11 13 18 O1b1a1a-M95
Dongguan DH84 15 12 16 24 10 14 12 15 11 12 20 15 19 20 12 14 18 O2a2b1a1-M117

Pre-print version. Visit http://digitalcommons.wayne.edu/humbiol/ after publication to acquire the final version.
Dongguan DH85 14 12 16 23 10 15 12 15 11 12 20 15 18 20 12 16 19 O2a2b1a1-M117
Dongguan DH86 15 14 17 24 10 13 13 14 10 13 18 14 19 23 10 13 13 O*-M175
Dongguan DH87 15 13 16 23 10 14 13 14 10 11 19 15 15 20 12 12 14 O1a1a-P203
Pre-print version. Visit http://digitalcommons.wayne.edu/humbiol/ after publication to acquire the final version.
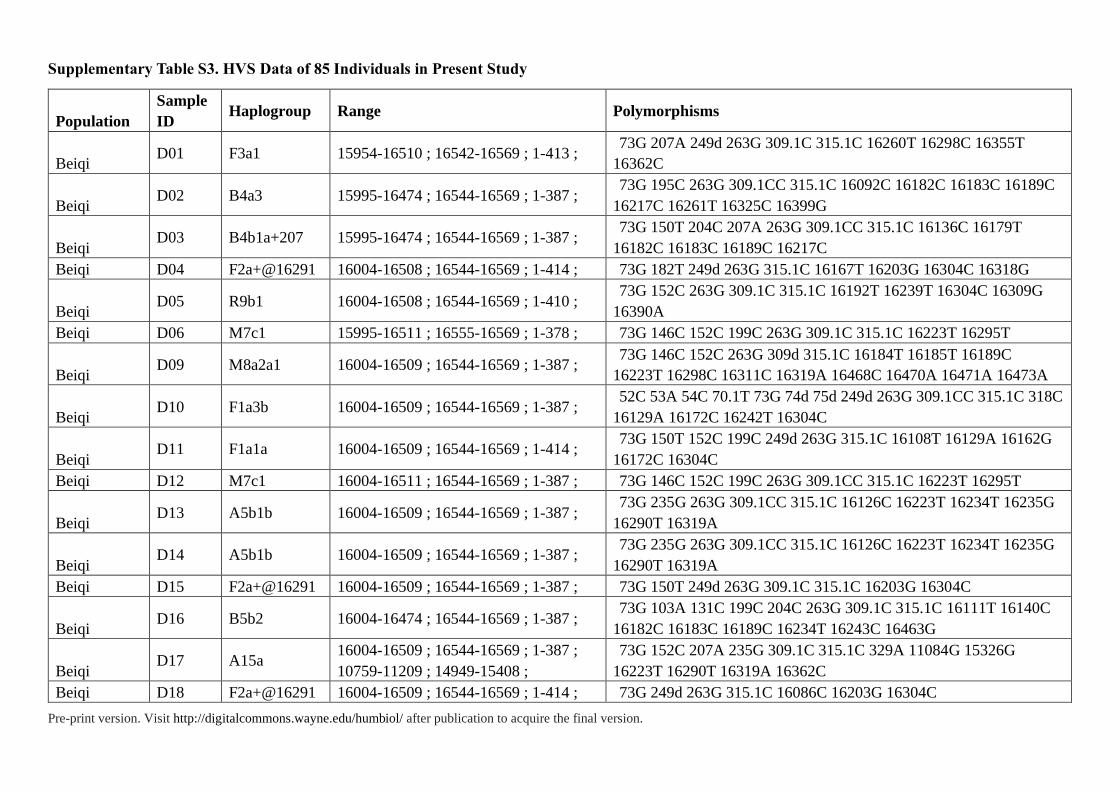
Supplementary Table S3. HVS Data of 85 Individuals in Present Study
Population
Sample
ID Haplogroup Range Polymorphisms
Beiqi D01 F3a1 15954-16510 ; 16542-16569 ; 1-413 ;
73G 207A 249d 263G 309.1C 315.1C 16260T 16298C 16355T
16362C
Beiqi D02 B4a3 15995-16474 ; 16544-16569 ; 1-387 ;
73G 195C 263G 309.1CC 315.1C 16092C 16182C 16183C 16189C
16217C 16261T 16325C 16399G
Beiqi D03 B4b1a+207 15995-16474 ; 16544-16569 ; 1-387 ;
73G 150T 204C 207A 263G 309.1CC 315.1C 16136C 16179T
16182C 16183C 16189C 16217C
Beiqi D04 F2a+@16291 16004-16508 ; 16544-16569 ; 1-414 ; 73G 182T 249d 263G 315.1C 16167T 16203G 16304C 16318G
Beiqi D05 R9b1 16004-16508 ; 16544-16569 ; 1-410 ;
73G 152C 263G 309.1C 315.1C 16192T 16239T 16304C 16309G
16390A
Beiqi D06 M7c1 15995-16511 ; 16555-16569 ; 1-378 ; 73G 146C 152C 199C 263G 309.1C 315.1C 16223T 16295T
Beiqi D09 M8a2a1 16004-16509 ; 16544-16569 ; 1-387 ;
73G 146C 152C 263G 309d 315.1C 16184T 16185T 16189C
16223T 16298C 16311C 16319A 16468C 16470A 16471A 16473A
Beiqi D10 F1a3b 16004-16509 ; 16544-16569 ; 1-387 ;
52C 53A 54C 70.1T 73G 74d 75d 249d 263G 309.1CC 315.1C 318C
16129A 16172C 16242T 16304C
Beiqi D11 F1a1a 16004-16509 ; 16544-16569 ; 1-414 ;
73G 150T 152C 199C 249d 263G 315.1C 16108T 16129A 16162G
16172C 16304C
Beiqi D12 M7c1 16004-16511 ; 16544-16569 ; 1-387 ; 73G 146C 152C 199C 263G 309.1CC 315.1C 16223T 16295T
Beiqi D13 A5b1b 16004-16509 ; 16544-16569 ; 1-387 ;
73G 235G 263G 309.1CC 315.1C 16126C 16223T 16234T 16235G
16290T 16319A
Beiqi D14 A5b1b 16004-16509 ; 16544-16569 ; 1-387 ;
73G 235G 263G 309.1CC 315.1C 16126C 16223T 16234T 16235G
16290T 16319A
Beiqi D15 F2a+@16291 16004-16509 ; 16544-16569 ; 1-387 ; 73G 150T 249d 263G 309.1C 315.1C 16203G 16304C
Beiqi D16 B5b2 16004-16474 ; 16544-16569 ; 1-387 ;
73G 103A 131C 199C 204C 263G 309.1C 315.1C 16111T 16140C
16182C 16183C 16189C 16234T 16243C 16463G
Beiqi D17 A15a
16004-16509 ; 16544-16569 ; 1-387 ;
10759-11209 ; 14949-15408 ;
73G 152C 207A 235G 309.1C 315.1C 329A 11084G 15326G
16223T 16290T 16319A 16362C
Beiqi D18 F2a+@16291 16004-16509 ; 16544-16569 ; 1-414 ; 73G 249d 263G 315.1C 16086C 16203G 16304C

Pre-print version. Visit http://digitalcommons.wayne.edu/humbiol/ after publication to acquire the final version.
Beiqi D19 F2a+@16291 16004-16509 ; 16544-16569 ; 1-414 ; 73G 249d 263G 315.1C 16086C 16203G 16304C
Beiqi D20 B4c1b2c2 16004-16474 ; 16544-16569 ; 1-387 ;
73G 146C 150T 263G 309.1C 315.1C 16129A 16140C 16166G
16183C 16189C 16217C 16274A
Shuisheng D21 A15 16004-16509 ; 16544-16569 ; 1-387 ;
73G 152C 207A 235G 309.1C 315.1C 329A 16223T 16290T
16319A 16362C
Shuisheng D22 F2a 16004-16509 ; 16544-16569 ; 1-416 ; 73G 249d 263G 315.1C 16203G 16262.1C 16291T 16304C
Shuisheng D23 M7c1 16004-16509 ; 16544-16569 ; 1-414 ; 73G 146C 152C 199C 263G 309.1C 315.1C 16223T 16295T
Shuisheng D24 D4a3 16004-16509 ; 16544-16569 ; 1-414 ;
73G 152C 263G 309.1C 315.1C 16129A 16223T 16249C 16294T
16362C
Shuisheng D25 F2a 16004-16509 ; 16544-16569 ; 1-414 ; 73G 249d 263G 315.1C 16203G 16262.1C 16291T 16304C
Shuisheng D26 D4a3 15995-16506 ; 16544-16569 ; 1-410 ;
73G 152C 263G 309.1C 315.1C 16129A 16223T 16249C 16294T
16362C
Shuisheng D27 F1+16189 16004-16467 ; 16544-16569 ; 1-387 ; 73G 249d 263G 309.1C 315.1C 16182C 16183C 16189C 16304C
Shuisheng D28 F2a 16004-16509 ; 16544-16569 ; 1-416 ; 73G 249d 263G 315.1C 16203G 16262.1C 16291T 16304C
Shuisheng
D29 M20
16004-16509 ; 16544-16569 ; 1-387 ;
12616-13171 ; 13157-13567 ; 13485-
13933 ; 13894-14349 ; 14620-14979 ;
73G 152C 225A 249d 263G 309.1C 315.1C 316A 12705T 14110C
14766T 14783C 14974T 16129A 16209C 16223T 16272G
Shuisheng D30 M7c1 16004-16509 ; 16544-16569 ; 1-387 ; 73G 146C 152C 199C 263G 309.1C 315.1C 345d 16223T 16295T
Shuisheng D31 M7b1a1 15995-16508 ; 16555-16569 ; 1-420 ; 73G 150T 199C 263G 315.1C 16129A 16223T 16297C
Shuisheng D32 M7b1a1 16004-16509 ; 16544-16569 ; 1-387 ; 73G 150T 199C 263G 315.1C 16223T 16297C
Shuisheng D33 D5 16004-16467 ; 16544-16569 ; 1-411 ; 73G 150T 263G 309.1C 315.1C 16183C 16189C 16223T 16362C
Shuisheng D34 F2a+@16291 16004-16509 ; 16544-16569 ; 1-415 ; 73G 249d 263G 315.1C 16086C 16203G 16304C
Shuisheng D35 B4b1 16004-16474 ; 16544-16569 ; 1-387 ;
73G 263G 309.1CC 315.1C 16136C 16183C 16189C 16217C
16260T
Shuisheng D36 M8a2+152 16004-16509 ; 16544-16569 ; 1-387 ;
73G 152C 263G 309.1CC 315.1C 345d 16184T 16223T 16293C
16298C 16319A
Shuisheng D37 B4b1 16004-16474 ; 16544-16569 ; 1-387 ;
73G 263G 309.1CC 315.1C 16136C 16183C 16189C 16217C
16260T
Shuisheng D38 N9a4b 16004-16509 ; 16544-16569 ; 1-387 ;
73G 150T 263G 309.1C 315.1C 16092C 16145A 16172C 16223T
16245T 16257A 16261T

Pre-print version. Visit http://digitalcommons.wayne.edu/humbiol/ after publication to acquire the final version.
Shuisheng D39 F1a1a 16004-16509 ; 16544-16569 ; 1-414 ;
73G 143A 249d 263G 315.1C 16108T 16129A 16162G 16172C
16256T 16362C
Shuisheng D40 F2a+@16291 16004-16509 ; 16544-16569 ; 1-411 ; 73G 249d 263G 315.1C 16086C 16203G 16304C
Shuisheng D41 F4a2 16004-16509 ; 16544-16569 ; 1-414 ;
64T 73G 146C 152C 249d 263G 281G 315.1C 16207G 16304C
16399G
Huyu’ao
D42 B5 16004-16474 ; 16544-16569 ; 1-390 ;
8111-8543 ;
73G 210G 263G 309.1C 315.1C 8188G 8281d 8282d 8283d 8284d
8285d 8286d 8287d 8288d 8289d 16066G 16140C 16183C 16189C
16266G 16274A 16291T
Huyu’ao D43 M8a2+152 15995-16509 ; 16544-16569 ; 1-387 ;
73G 152C 263G 309.1CC 315.1C 16184T 16223T 16293C 16298C
16319A
Huyu’ao D44 A15 16004-16509 ; 16544-16569 ; 1-387 ;
73G 152C 207A 235G 309.1C 315.1C 329A 16223T 16290T
16319A 16362C
Huyu’ao D45 F2a 16004-16509 ; 16544-16569 ; 1-414 ; 73G 249d 263G 309.1C 315.1C 16203G 16262.1C 16291T 16304C
Huyu’ao D46 M7c1b
15989-16510 ; 16547-16569 ; 1-387 ;
12070-12634 ;
73G 146C 152C 199C 263G 309.1C 315.1C 12091C 12561A
16223T 16295T 16550C 16552T
Huyu’ao D47 R9b1a1a 16004-16474 ; 16544-16569 ; 1-387 ;
73G 143A 183G 263G 309.1C 315.1C 16093C 16189C 16288C
16304C 16390A
Huyu’ao D48 M7c1 16004-16509 ; 16544-16569 ; 1-387 ; 73G 146C 152C 199C 263G 309.1CC 315.1C 16223T 16295T
Huyu’ao D49 M8a2+152 16004-16509 ; 16544-16569 ; 1-411 ;
73G 152C 263G 309.1C 315.1C 16184T 16223T 16293C 16298C
16319A
Huyu’ao D50 F2a 15995-16509 ; 16544-16569 ; 1-414 ; 73G 249d 263G 309.1C 315.1C 16203G 16262.1C 16291T 16304C
Huyu’ao D51 F2a 16004-16509 ; 16544-16569 ; 1-414 ; 73G 249d 263G 315.1C 16203G 16262.1C 16291T 16304C
Huyu’ao D52 F1a2 16004-16509 ; 16544-16569 ; 1-387 ; 73G 249d 263G 309.1C 315.1C 16172C 16304C
Huyu’ao D53 N9a4b 16004-16509 ; 16544-16569 ; 1-387 ;
73G 150T 263G 309.1C 315.1C 16092C 16145A 16172C 16223T
16245T 16257A 16261T
Huyu’ao D54 F1a1a 16004-16509 ; 16544-16569 ; 1-414 ;
73G 143A 249d 263G 315.1C 16108T 16129A 16162G 16172C
16256T 16362C
Huyu’ao D55 M7c1 15992-16509 ; 16544-16569 ; 1-365 ; 73G 146C 152C 199C 263G 309.1CC 315.1C 16223T 16295T
Huyu’ao D56 Y2 15951-16509 ; 16498-16569 ; 1-414 ; 73G 150T 200G 263G 309.1C 315.1C 16126C 16231C 16311C
Huyu’ao D57 F2a 16004-16509 ; 16544-16569 ; 1-415 ; 73G 249d 263G 315.1C 16203G 16262.1C 16291T 16304C
Huyu’ao D58 F2a 16004-16509 ; 16544-16569 ; 1-414 ; 73G 249d 263G 315.1C 16203G 16262.1C 16291T 16304C

Pre-print version. Visit http://digitalcommons.wayne.edu/humbiol/ after publication to acquire the final version.
Huyu’ao D59 Y2 16004-16510 ; 16502-16569 ; 1-387 ; 73G 150T 200G 263G 309.1C 315.1C 16126C 16231C 16311C
Huyu’ao D60 F1a1a 16004-16509 ; 16544-16569 ; 1-414 ;
73G 143A 249d 263G 315.1C 16108T 16129A 16162G 16172C
16256T 16362C
Huyu’ao D61 M8a2+152 16004-16509 ; 16544-16569 ; 1-411 ;
73G 152C 263G 309.1C 315.1C 16184T 16223T 16293C 16298C
16319A
Huyu’ao D62 F2a 16004-16509 ; 16544-16569 ; 1-414 ; 73G 249d 263G 315.1C 16203G 16262.1C 16291T 16304C
Dongguan H63 F1a 16004-16509 ; 16546-16569 ; 1-387 ; 73G 249d 263G 309.1C 315.1C 16129A 16172C 16304C
Dongguan H64 H6a
16004-16509 ; 16546-16569 ; 1-384 ;
1297-1763 ; 9361-9864 ; 239C 263G 309.1CC 315.1C 1438G 9380A 16278T 16362C 16482G
Dongguan H65 N10a 16004-16474 ; 16546-16569 ; 1-387 ;
73G 185A 189G 195C 234G 263G 309.1CC 315.1C 16111T 16172C
16183C 16189C 16209C 16223T 16362C
Dongguan H66 B4+16261 16004-16467 ; 16546-16569 ; 1-387 ;
73G 263G 309.1CC 315.1C 345d 16182C 16183C 16189C 16217C
16261T
Dongguan H67 M8a2+152 16004-16509 ; 16546-16569 ; 1-420 ; 73G 152C 263G 315.1C 16184T 16223T 16298C 16319A
Dongguan H68 F1a1 16004-16509 ; 16546-16569 ; 1-387 ;
73G 249d 251A 263G 309.1C 315.1C 16129A 16162G 16172C
16304C 16335G
Dongguan H69 F1a1d 16004-16509 ; 16546-16569 ; 1-420 ;
73G 249d 263G 315.1C 16129A 16162G 16172C 16304C 16362C
16399G
Dongguan H70 F2b1 16004-16509 ; 16546-16569 ; 1-420 ; 73G 249d 263G 315.1C 16092A 16291T 16304C 16311C
Dongguan H71 F4a1b 15996-16509 ; 16546-16569 ; 1-387 ;
73G 146C 249d 263G 309.1CC 315.1C 317A 16126C 16140C
16207G 16304C 16311C 16362C 16399G
Dongguan H72 F4a1a 16004-16509 ; 16546-16569 ; 1-420 ;
73G 146C 152C 207A 249d 263G 309.1C 315.1C 16207G 16304C
16362C 16399G 16497G
Dongguan H73 M10a1+16129 16004-16509 ; 16546-16569 ; 1-420 ; 73G 263G 315.1C 16129A 16223T 16311C
Dongguan H74 N10a 16004-16474 ; 16546-16569 ; 1-387 ;
73G 185A 189G 195C 234G 263G 309.1CC 315.1C 16111T 16172C
16183C 16189C 16209C 16223T 16362C
Dongguan
H75 M
15956-16509 ; 16544-16569 ; 1-417 ;
5035-5329 ; 5914-6366 ; 10143-10553 ;
2163-2602 ; 4283-4718 ;
73G 152C 263G 309.1C 315.1C 10398G 10400T 16223T 16362C
Dongguan H76 D4a6 16004-16509 ; 16546-16569 ; 1-387 ; 73G 146C 217C 263G 309.1C 315.1C 345d 16223T 16234T 16362C
Pre-print version. Visit http://digitalcommons.wayne.edu/humbiol/ after publication to acquire the final version.
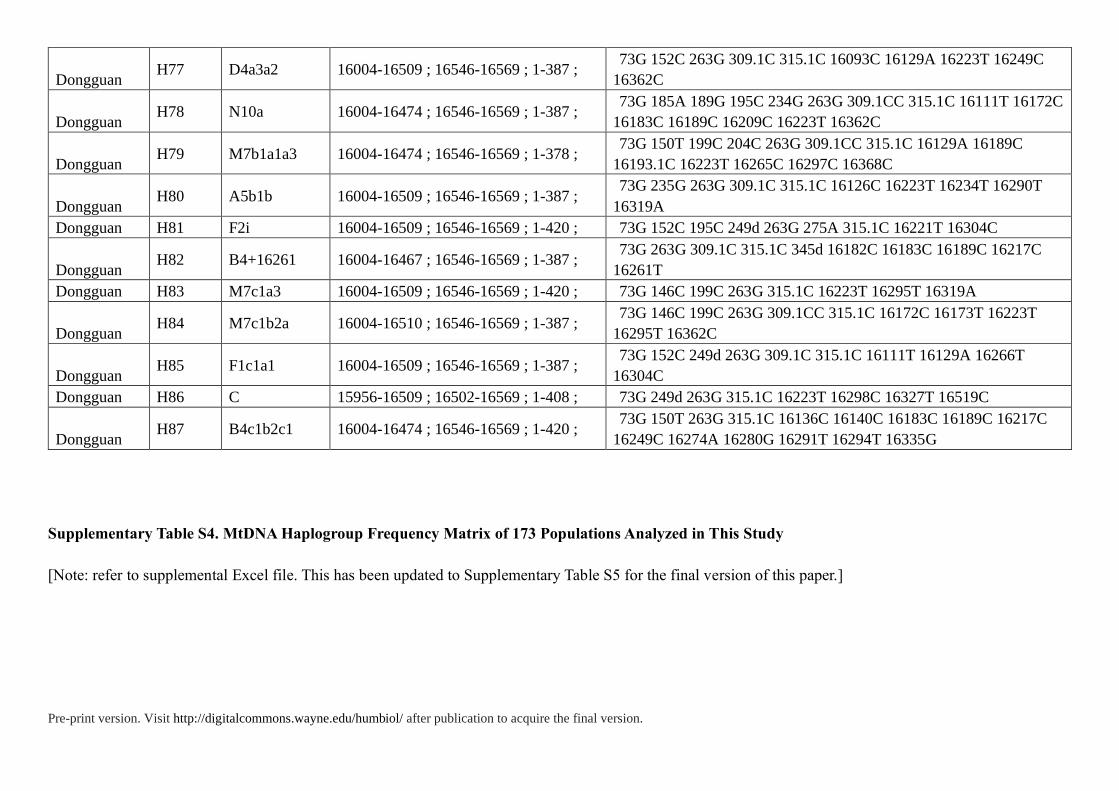
Dongguan H77 D4a3a2 16004-16509 ; 16546-16569 ; 1-387 ;
73G 152C 263G 309.1C 315.1C 16093C 16129A 16223T 16249C
16362C
Dongguan H78 N10a 16004-16474 ; 16546-16569 ; 1-387 ;
73G 185A 189G 195C 234G 263G 309.1CC 315.1C 16111T 16172C
16183C 16189C 16209C 16223T 16362C
Dongguan H79 M7b1a1a3 16004-16474 ; 16546-16569 ; 1-378 ;
73G 150T 199C 204C 263G 309.1CC 315.1C 16129A 16189C
16193.1C 16223T 16265C 16297C 16368C
Dongguan H80 A5b1b 16004-16509 ; 16546-16569 ; 1-387 ;
73G 235G 263G 309.1C 315.1C 16126C 16223T 16234T 16290T
16319A
Dongguan H81 F2i 16004-16509 ; 16546-16569 ; 1-420 ; 73G 152C 195C 249d 263G 275A 315.1C 16221T 16304C
Dongguan H82 B4+16261 16004-16467 ; 16546-16569 ; 1-387 ;
73G 263G 309.1C 315.1C 345d 16182C 16183C 16189C 16217C
16261T
Dongguan H83 M7c1a3 16004-16509 ; 16546-16569 ; 1-420 ; 73G 146C 199C 263G 315.1C 16223T 16295T 16319A
Dongguan H84 M7c1b2a 16004-16510 ; 16546-16569 ; 1-387 ;
73G 146C 199C 263G 309.1CC 315.1C 16172C 16173T 16223T
16295T 16362C
Dongguan H85 F1c1a1 16004-16509 ; 16546-16569 ; 1-387 ;
73G 152C 249d 263G 309.1C 315.1C 16111T 16129A 16266T
16304C
Dongguan H86 C 15956-16509 ; 16502-16569 ; 1-408 ; 73G 249d 263G 315.1C 16223T 16298C 16327T 16519C
Dongguan H87 B4c1b2c1 16004-16474 ; 16546-16569 ; 1-420 ;
73G 150T 263G 315.1C 16136C 16140C 16183C 16189C 16217C
16249C 16274A 16280G 16291T 16294T 16335G
Supplementary Table S4. MtDNA Haplogroup Frequency Matrix of 173 Populations Analyzed in This Study
[Note: refer to supplemental Excel file. This has been updated to Supplementary Table S5 for the final version of this paper.]

Pre-print version. Visit http://digitalcommons.wayne.edu/humbiol/ after publication to acquire the final version.
Supplementary Table S5. Haplotype-Sharing Analysis of 87 Individuals in This Study
Population ID Haplogroup Individuals of shared haplotypes
Step0 Step1 Step2 Step3 Step4 Step5
Beiqi D04 O1a1a-P203 1 8 39 114 318 451
Beiqi D19 O1a1a-P203 0 6 56 145 362 489
Beiqi D20 O1a1a-P203 1 8 39 114 318 451
Shuisheng D27 O1a1a-P203 7 62 227 382 423 323
Shuisheng D28 O1a1a-P203 7 62 227 382 423 323
Shuisheng D33 O1a1a-P203 1 13 94 218 433 535
Shuisheng D34 O1a1a-P203 1 13 94 218 433 535
Shuisheng D40 O1a1a-P203 1 13 94 218 433 535
Beiqi D13 O1a1a-P203 1 7 27 53 124 254
Beiqi D15 O1a1a-P203 1 2 15 55 165 321
Dongguan DH67 O1a1a-P203 0 12 36 73 151 421
Dongguan DH87 O1a1a-P203 0 2 17 71 200 548
Beiqi D05 O1a1a-P203 0 3 19 67 111 249
Beiqi D09 O1a1a-P203 0 2 13 42 109 259
Shuisheng D31 O1a1a-P203 0 0 16 114 318 488
Shuisheng D37 O1a1a-P203 0 0 16 114 318 488
Huyu’ao D46 O1a1a-P203 0 0 16 114 318 488
Huyu’ao D48 O1a1a-P203 0 0 16 114 318 488
Huyu’ao D54 O1a1a-P203 0 0 16 114 318 488
Huyu’ao D55 O1a1a-P203 0 0 16 114 318 488
Huyu’ao D56 O1a1a-P203 0 0 16 114 318 488
Huyu’ao D59 O1a1a-P203 0 0 16 114 318 488
Huyu’ao D60 O1a1a-P203 0 1 5 46 195 427
Huyu’ao D45 O1b1a1a-M95 0 4 24 43 38 49
Huyu’ao D53 O1b1a1a-M95 0 4 24 43 38 49
Huyu’ao D61 O1b1a1a-M95 0 4 24 43 38 49
Shuisheng D23 O1b1a1a-M95 0 0 0 0 3 29

Pre-print version. Visit http://digitalcommons.wayne.edu/humbiol/ after publication to acquire the final version.
Shuisheng D24 O1b1a1a-M95 0 0 0 0 1 8
Shuisheng D26 O1b1a1a-M95 0 0 0 0 3 29
Shuisheng D30 O1b1a1a-M95 0 0 0 0 0 2
Shuisheng D35 O1b1a1a-M95 0 0 0 0 1 8
Shuisheng D38 O1b1a1a-M95 0 0 0 0 0 2
Shuisheng D39 O1b1a1a-M95 0 0 0 0 1 8
Shuisheng D41 O1b1a1a-M95 0 0 0 0 1 8
Huyu’ao D42 O1b1a1a-M95 0 0 0 0 0 0
Huyu’ao D43 O1b1a1a-M95 0 0 0 0 1 8
Huyu’ao D44 O1b1a1a-M95 0 0 0 0 0 0
Huyu’ao D47 O1b1a1a-M95 0 0 0 0 1 8
Huyu’ao D49 O1b1a1a-M95 0 0 0 0 1 8
Huyu’ao D51 O1b1a1a-M95 0 0 0 0 0 0
Huyu’ao D58 O1b1a1a-M95 0 0 0 0 0 0
Huyu’ao D62 O1b1a1a-M95 0 0 0 0 0 0
Dongguan DH83 O1b1a1a-M95 0 0 10 27 84 202
Beiqi D03 O2a2b1a1-M117 0 29 151 456 717 904
Beiqi D07 O2a2b1a1-M117 6 52 186 500 774 934
Beiqi D08 O2a2b1a1-M117 6 52 186 500 774 934
Beiqi D10 O2a2b1a1-M117 5 43 194 482 732 1008
Beiqi D12 O2a2b1a1-M117 6 52 186 500 774 934
Shuisheng D36 O2a2b1a1-M117 0 8 60 270 562 833
Huyu’ao D57 O2a2b1a1-M117 0 8 60 270 562 833
Dongguan DH75 O2a2b1a1-M117 8 42 178 455 893 1148
Dongguan DH76 O2a2b1a1-M117 17 106 360 595 875 1000
Dongguan DH79 O2a2b1a1-M117 12 70 284 611 996 1095
Dongguan DH80 O2a2b1a1-M117 11 87 358 637 877 962
Dongguan DH81 O2a2b1a1-M117 3 13 108 350 716 1116
Dongguan DH84 O2a2b1a1-M117 8 54 233 535 861 970
Dongguan DH85 O2a2b1a1-M117 5 39 231 473 823 1049
Shuisheng D21 O2a2b1a1-M117 0 1 8 26 94 269

Pre-print version. Visit http://digitalcommons.wayne.edu/humbiol/ after publication to acquire the final version.
Beiqi D17 O2a2b1a1-M117 0 4 19 78 204 491
Beiqi D18 O2a2b1a1-M117 2 8 14 78 310 713
Dongguan DH64 O2a2b1a1-M117 0 0 18 95 328 674
Dongguan DH68 O2a2b1a1-M117 0 0 1 4 33 122
Beiqi D06 O2a1b-002611 0 9 27 47 53 73
Beiqi D16 O2a1b-002611 0 3 15 36 60 142
Dongguan DH70 O2a1b-002611 0 1 10 32 94 207
Shuisheng D22 O2a1b-002611 0 0 10 38 79 183
Shuisheng D25 O2a1b-002611 0 0 0 0 1 5
Dongguan DH69 C2-M217 0 20 105 216 359 403
Beiqi D02 C2-M217 3 3 7 34 103 189
Shuisheng D32 C2-M217 0 1 4 16 77 199
Dongguan DH65 C2-M217 0 0 5 25 121 254
Dongguan DH74 C2-M217 0 0 8 49 161 397
Dongguan DH78 C2-M217 0 0 5 25 121 254
Beiqi D11 O2a2*-P201 3 9 25 30 26 85
Huyu’ao D50 O2a2*-P201 3 9 25 30 26 85
Shuisheng D29 O2a1a1a1a1-M121 0 1 32 76 84 114
Dongguan DH73 O2a1a1a1a1-M121 2 24 62 59 55 100
Dongguan DH63 D1a1-M15 0 0 0 0 3 23
Dongguan DH66 D1a1-M15 0 0 0 0 0 7
Beiqi D14 O2a2b1*-M134+M117- 0 12 49 100 170 376
Dongguan DH72 O2-M122 0 3 11 20 45 50
Dongguan DH77 O1a*-M119 0 5 12 37 141 472
Beiqi D01 O2a2b*-P164+M134- 0 0 0 9 56 180
Huyu’ao D52 N1a1a-M178 0 0 0 1 6 16
Dongguan DH82 N*-M231 0 0 4 5 7 3
Dongguan DH86 O*-M175 0 0 0 1 11 42

Pre-print version. Visit http://digitalcommons.wayne.edu/humbiol/ after publication to acquire the final version.

Pre-print version. Visit http://digitalcommons.wayne.edu/humbiol/ after publication to acquire the final version.
Supplementary Table S6. The TMRCA of Selected Individuals Using BATWING (time in years)
EMR lmMR OMRB OMRS
TMRCA 95% CI TMRCA 95% CI TMRCA 95% CI TMRCA 95% CI
IsoIndi 4140.9 568-28479.8 1050.6 153-6477.6 1033.8 150.5-6380.7 813.8 115.8-5127.9
IsoIndi+CH 8433.1 1253.4-52264 2157.9 364.4-11682 2229 374.4-12064 1797.4 297.2-9811
IsoIndi 16 isolated individuals; IsoIndi+CH:16 isolated individuals and one closest haplotypes; OMRB and OMRS Two observed genealogical mutation rates;
lmMR Genealogical mutation rate adjusted for population variation using logistic model; EMR the evolutionary mutation rate.

Pre-print version. Visit http://digitalcommons.wayne.edu/humbiol/ after publication to acquire the final version.
Figure Captions
Figure 1. The distributions of East Asian populations in data analysis and detailed geographic
location of Fujian Tanka.
Figure 2. The phylogenetic relationship of Y chromosome haplogroups surveyed in this study
and their haplogroup-based frequencies in Tanka and Han. The marker names are shown
along the branches, and haplogroup names are shown on the right side according to the
ISOGG Y-DNA Haplogroup Tree 2019. Potentially paraphyletic undefined subgroups are
distinguished from recognized haplogroups by the asterisk symbol. Haplogroups tested for
but not seen in this study are enclosed in parentheses. Populations: BQ, Beiqi; SS, Shuisheng;
HYA, Huyu’ao; DG, Dongguan.
Figure 3. The phylogenetic relationship of mtDNA haplogroups surveyed in this study and
their haplogroup-based frequencies in Tanka and Han people. The marker names are shown
along the branches, and haplogroup names are shown on the right side according to the
PhyloTree mtDNA tree Build 17.
Figure 4. Principal component plot of Han Chinese and southern East Asian populations. A)
Principal component plot of Y chromosome haplogroups; B) Principal component plot of
mtDNA haplogroups.
Figure 5. Networks of the major Y chromosome haplogroups O1a1a-P203, O1b1a1a-M95
Pre-print version. Visit http://digitalcommons.wayne.edu/humbiol/ after publication to acquire the final version.
and O2a2b1a1-M117 of Fujian Tanka in comparison with Han Chinese and southern
indigenous populations.
Figure 6. Networks of the major mtDNA haplogroups of Fujian Tanka in comparison with
Han Chinese and southern indigenous populations.
Supplementary Figure S1. Multidimensional scaling plot based on 17 Y-STRs of Tanka and
other populations.
Supplementary Figure S2. Network of 16 isolated individuals and shared haplotypes fewer
than 5 mutational steps.
Supplementary Figure S3. Geographic distribution of mtDNA haplogroup F2a.

Pre-print version. Visit http://digitalcommons.wayne.edu/humbiol/ after publication to acquire the final version.
Figure 1.

Pre-print version. Visit http://digitalcommons.wayne.edu/humbiol/ after publication to acquire the final version.
Figure 2.

Pre-print version. Visit http://digitalcommons.wayne.edu/humbiol/ after publication to acquire the final version.
Figure 3.
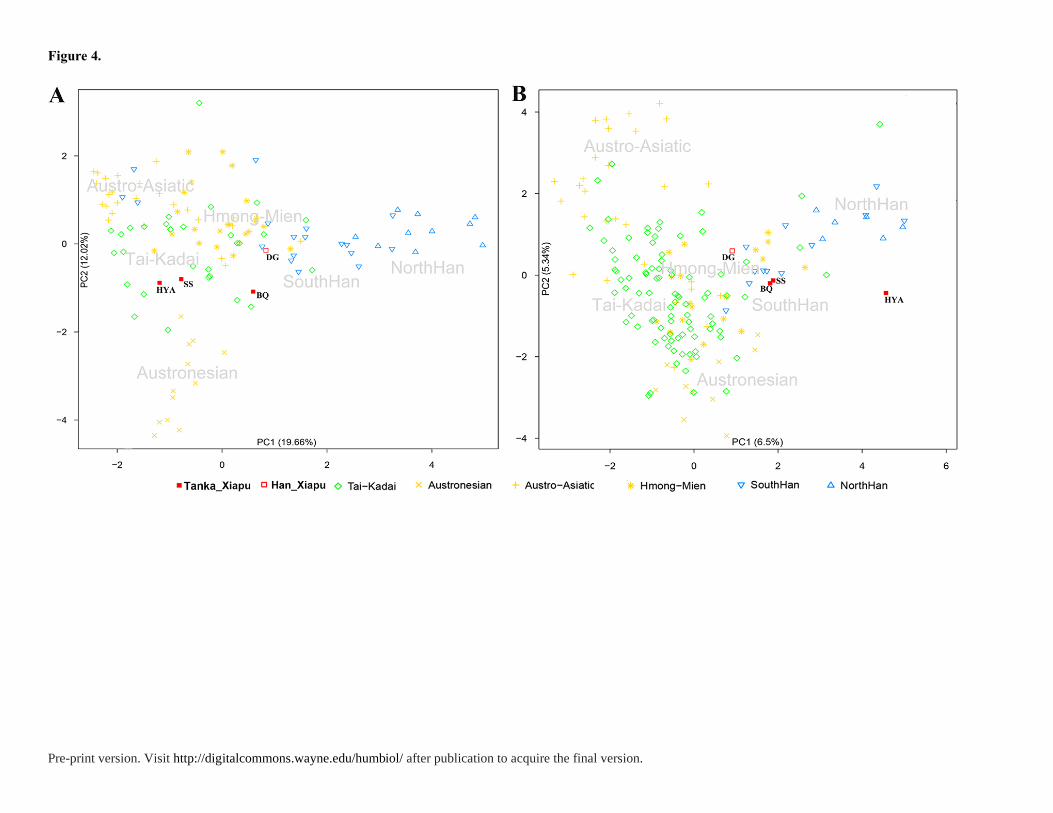
Pre-print version. Visit http://digitalcommons.wayne.edu/humbiol/ after publication to acquire the final version.
Figure 4.

Pre-print version. Visit http://digitalcommons.wayne.edu/humbiol/ after publication to acquire the final version.
Figure 5.

Pre-print version. Visit http://digitalcommons.wayne.edu/humbiol/ after publication to acquire the final version.
Figure 6.
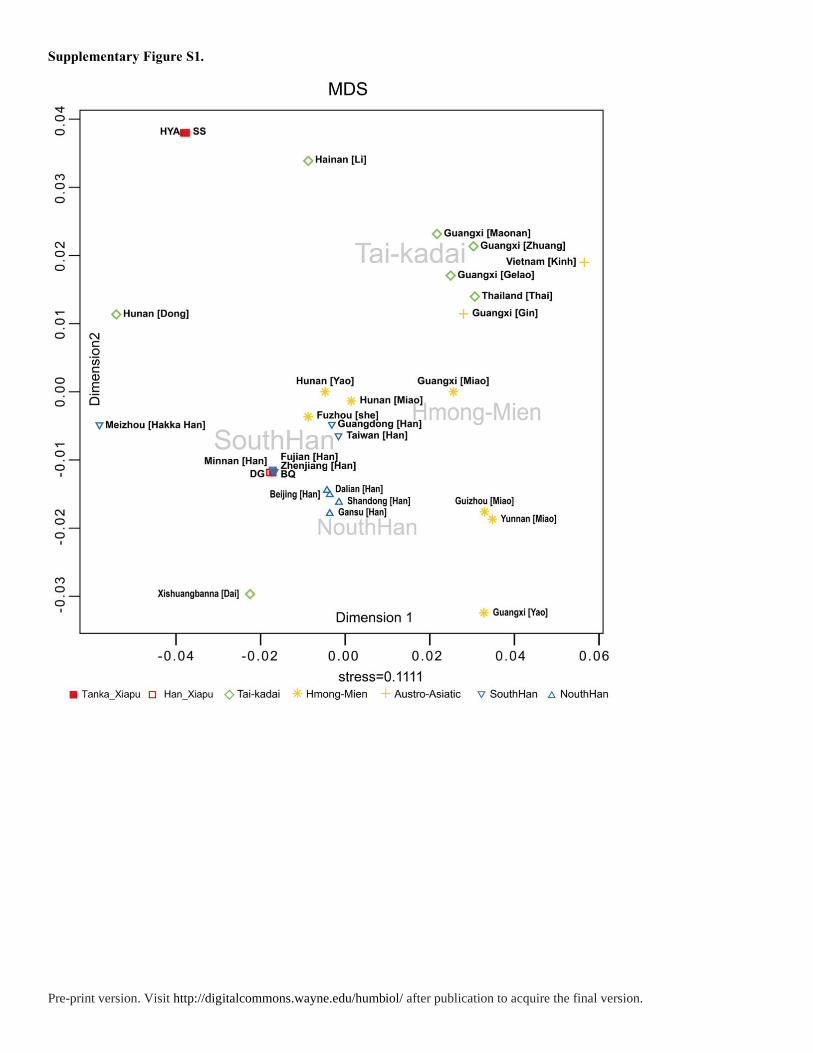
Pre-print version. Visit http://digitalcommons.wayne.edu/humbiol/ after publication to acquire the final version.
Supplementary Figure S1.

Pre-print version. Visit http://digitalcommons.wayne.edu/humbiol/ after publication to acquire the final version.
Supplementary Figure S2.

Pre-print version. Visit http://digitalcommons.wayne.edu/humbiol/ after publication to acquire the final version.
Supplementary Figure S3.
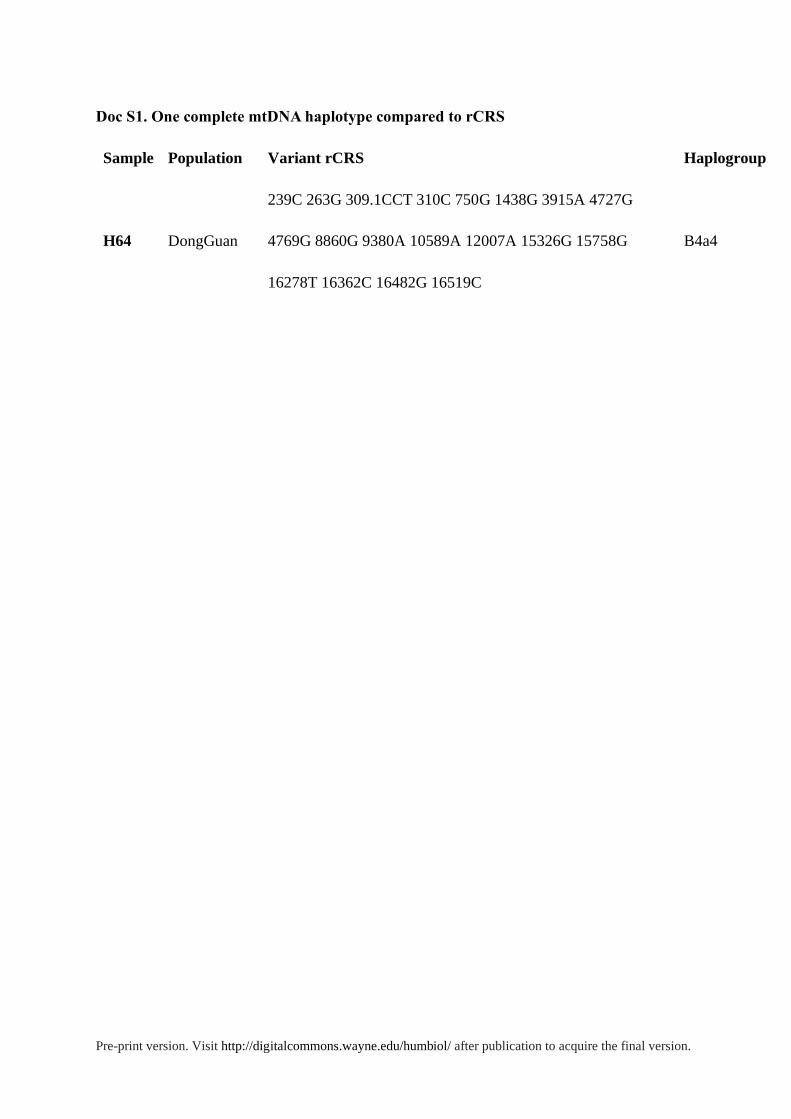
Pre-print version. Visit http://digitalcommons.wayne.edu/humbiol/ after publication to acquire the final version.
Doc S1. One complete mtDNA haplotype compared to rCRS
Sample Population Variant rCRS Haplogroup
H64 DongGuan
239C 263G 309.1CCT 310C 750G 1438G 3915A 4727G
4769G 8860G 9380A 10589A 12007A 15326G 15758G
16278T 16362C 16482G 16519C
B4a4

Pre-print version. Visit http://digitalcommons.wayne.edu/humbiol/ after publication to acquire the final version.
Doc S2. The divergence time estimation from Tanka-specific haplotypes
After haplotype-sharing analysis in haplogroup O1b1a1a-M95, we found 16 individuals had
no shared haplotypes less than 4 steps away and they were tightly linked with each other,
which may be a signal of an isolated population. Then we estimated the divergence time from
these isolated individuals (IsoIndi) and other populations (Table S6). First, we used time to
the most recent common ancestor (TMRCA) of isolated individuals as the lower bound. Next,
we selected the closest haplotype (Figure S2) to estimate the TMRCA of them (i.e. 16
isolated individuals and the closest haplotypes, abbr. IsoIndi+CH) as an upper bound. In our
previous case studies [86] about evaluating the Y-STR dating in deep-rooting pedigrees, we
found that the Y chromosomal genealogical mutation rates (OMRB and lmMR) from the
BATWING method could give the best-fit estimation for historical lineage dating. Hence, the
upper bound of divergence time is about 2157.9-2229 years before present, at the beginning
of the Western Han Dynasty. The lower bound is about 1033.8-1050.6 years before present, in
the early years of Northern Song Dynasty. According to historical records [87], two events
played important roles in the formation of Tanka: the survivors of kingdom of Minyue when
this kingdom was conquered in 110 BC, the refugees eluding from wars in the Five Dynasties
and Ten Kingdoms period (from 1040 to 1112 years before present). Our estimated
divergence time suggests that the formation of Fujian Tanka may be related to at least one of
these historical events.
86. Wang, CC, Li H. Evaluating the Y chromosomal STR dating in deep-rooting pedigrees.
Investig Genet.2015; 6, 8.
87. Han ZH. The origin of Fujian Tanka. Journal of Xiamen University. 1954(5).
Related Documents