Welcome message from author
This document is posted to help you gain knowledge. Please leave a comment to let me know what you think about it! Share it to your friends and learn new things together.
Transcript


1UNION BUDGET 2021-22
The Honourable Finance Minister’s budget for this year is a bold and proactive statement which lays down a vision and roadmap to take both physical and financial infrastructure to great heights. This is well and truly an “Infrastructure
Budget”. The budget proposals address the challenges created by COVID-19 pandemic. The budget proposal have skilfully addressed the demand side by expanding the role of the government through a sharp increase of 34.5% in capital expenditure over the BE 2020-2021 to Rs 5.54 lakh crore.
The Budget proposals themselves are a continuation of the AatmaNirbhar Packages and gives major thrust to AatmaNirbhar Bharat which includes doubling Farmers’ Income, Strong Infrastructure, Healthy India, Good Governance, Opportunities for Youth, Education for All, Women Empowerment, and Inclusive Development, among others.
Infrastructure, the foundation of AatmaNirbhar Bharat, has been segregated into five parts namely – ‘Health and Wellbeing’ covering health infrastructure, ‘Physical & Financial Capital’ covering physical infrastructure and industry; ‘Inclusive Development for Aspirational India’ covering agriculture infrastructure; ‘Reinvigorating Human Capital’ covering education infrastructure; ‘Innovation and R&D’ covering digital infrastructure and future technologies.
The recent COVID Pandemic having exposed the vulnerability of population to health shock, augmentation of health infrastructure was on cards. The thrust to rural health infrastructure is noteworthy with an outlay of about ₹64,180 crores over 6 years. The proposal is sure to address numerous issues such as reduction in out of pocket expenses, migration from rural to urban areas for treatment, and not the least local employment opportunities for trained medical staff.
The stated policy of Make in India, to attract more investment in PLI sectors and Vocal for Local, needs sound support for industry by bringing down the logistics costs. Accordingly, the government has committed significant resources to create infrastructure such as roads, railways, metro railways under Bharatmala Pariyojana, National Rail Plan for India – 2030, metro rails in Tiel 1 and Tier 2 cities and operational management of major ports on a PPP basis. The viability of electricity distribution companies has been given the attention they deserve and allocation to renewable energy has been increased. The proposal to launch a comprehensive National Hydrogen Energy Mission is a well thought move with far reaching technological advances in the automobile sector.
The pressing issue of infrastructure financing has been well addressed covering debt component, asset monetization and foreign participation through InVITS and REITs route. In order to facilitate funding of infrastructure, it is proposed to make Zero Coupon Bonds issued by notified IDF eligible for tax benefit.
The budget has also addressed the long pending debate of creating an apex level development financial institution to address the infrastructure financing requirement. The monetization of existing infrastructure in roads, oil, power transmission, airports and railways is also a welcome move. The “National Monetization Pipeline” which will complement the National Infrastructure Pipeline will bring synergy across both legs of the infrastructure lifecycle.
The budget also provides for an additional ₹2 lakh crore to States and Autonomous Bodies for their Capital Expenditure.
Dinesh KharaChairmanState Bank of IndiaMumbai
FOREWORD
2 UNION BUDGET 2021-22
On the financial infrastructure side, the proposal to consolidate various acts governing different segments of the financial market under Securities Markets Code is a good move. Utilising the infrastructure at GIFT city to promote fintechs and strengthening the existing gold infrastructure at GIFT are progression in right direction. The proposal to create an institutional mechanism to address liquidity in secondary markets for corporate bond has tried to address the stress that emerged due to COVID-19.
The budget has rightly recognised the role of core equity capital in financial sector by increasing the FDI limit in Insurance Companies to 74% and allow foreign ownership and control. The PSBs will have capital infusion of Rs 20,000 crore. An Asset Reconstruction Company Limited and Asset Management Company would be set up to consolidate and take over the existing stressed debt thus preventing any further erosion of capital. Over and above this NCLT framework will be strengthened, e-Courts system shall be implemented and alternate methods of debt resolution and special framework for MSMEs shall be introduced.
Under the theme of inclusive development, the efforts to double the farm income have been carried over from the last year. The agricultural credit target has been increased to Rs 16.5 lakh crore in FY22. To achieve the objectives of National Education Policy, more than 15,000 schools will be qualitatively strengthened to include all components of the Policy. To give a further boost to digital transactions, Rs 1,500 crore has been allocated.
The financing aspect of the budget and resource mobilisation was matter of concern for all. The budget has walked the thin line quite well and has ensured that economic revival is not hampered by lack of resources at the same time meeting the shares of the states as recommended by 15th Finance Commission.
The fiscal deficit for FY21 is pegged at 9.5% of GDP in 2020-21. To ensure that the economy is given the required push, the BE 2021-22 for expenditure is ₹34.83 lakh crore which includes ₹5.54 lakh crore as capital expenditure, an increase of 34.5% over the BE 2020-2021.
Assuming 14.4% growth in nominal GDP, the fiscal deficit in BE 2021-2022 is estimated to be 6.8% of GDP. The gross borrowing from the market for the next year would be around ₹12 lakh crore.
One of the cornerstone of this budget is fiscal numbers that are transparent and has the potential to surprise us on the upside. In principle, the budget has rationalised the off-balance sheet borrowings and headline fiscal deficit numbers, which will overtly please markets and even rating agencies. The fact that the expenditure announcement in the budget has been matched with status quo on taxes will bolster market sentiments.
The tax proposals have made reasonable demand with Agriculture Infrastructure and Development Cess (AIDC) on a small number of items as revival of rural demand is critical for overall revival in growth and doubling the farm income.
The medium-term fiscal consolidation path envisages to reach a fiscal deficit level below 4.5% of GDP by 2025-2026. The consolidation will rest on increasing the buoyancy of tax revenue through improved compliance, and secondly, by increased receipts from monetisation of assets, including Public Sector Enterprises and land and strategic disinvestments.
In all, given the background of COVID-19 pandemic, this year’s budget has achieved a balanced demand stimulus to correct the output gap. The measures for ease of doing business to ease of living, minimum government and maximum governance have only gathered pace. The minimal tinkering to personal income tax and promotion of self-employment deserves appreciation. The budget is sensitive to immediate concerns of the economy. It is a very well-crafted statement of intent, drawing from the experience and enhances India’s soft power by giving due recognition to its culture and heritage.
Dinesh Khara

3UNION BUDGET 2021-22
Sect ion 1The Macro Picture
KEY HIGHLIGHTS OF THE UNION BUDGET 2021-22
The Budget 2021-22 is presented in the ‘never before’ environment with an objective of Doubling Farmer’s Income, Strong Infrastructure, Healthy India, Good Governance, Opportunities for Youth, Education for All, Women Empowerment, and Inclusive Development.
As widely expected, fiscal deficit for FY21 is estimated at 9.5% of GDP (from 3.5% BE) due to rise in expenditure on account of the outbreak of COVID-19 and moderation in revenue. For the next fiscal, the fiscal deficit is pegged at 6.8% of GDP (or Rs 15.1 lakh crore). The nominal GDP for FY22 is estimated at Rs 222.9 lakh crore, a 14.4% growth over FY21. Assuming a conservative 10% real GDP growth rate, this translates into an inflation of around 4.4%. We believe, if growth comes back riding on the spending prowess, the nominal GDP projection may be an underestimate. This may thus provide even some more additional spending room for the Government.
The Centre’s gross tax revenue for FY21 has been revised downwards to Rs 19.0 lakh crore (5.5% decline over FY20), which is Rs 5.2 crore lesser over the Budget estimate for FY21. Coming to FY22 projections, due to low base almost all components of taxes has exhibited double digit growth (except excise and service tax). However, in absolute numbers, tax collection in FY22 is projected lower than the FY21 (BE), except for excise.
Government has set a target of Rs 1.75 lakh crore of disinvestment for FY22 on back of LIC IPO and the pending/remaining disinvestments of FY21. The disinvestment proceeds from LIC and other financial institutions is pegged at Rs 1 lakh crore. The disinvestment target of FY21 is now revised downwards from Rs 2.1 lakh crore to Rs 32,000 crore.
The proposed capital expenditure of Rs 5.5 lakh crore for FY22 amounts to 2.5% of the GDP and 3.4% of GDP if we include allocation for capital expenditure for Autonomous Bodies. Thus at 4.5 ICOR one can expect GDP growth contribution of 0.75% on account of capital expenditure.
On the back of buoyancy in equity market, in the budget for FY19, the Government had imposed a long-term capital gains tax on capital gains exceeding Rs 1 lakh at the rate of 10% without allowing the benefit of any indexation. In FY22 budget, this amount has been now pegged at Rs 52,740 crores (Rs 42,980 crores in FY21 revised estimates). The Government thus expects the financial markets to remain buoyant.
Government estimates the non-tax revenue to grow at 15.3% to Rs 2.43 lakh crore, from the revised estimate of Rs 2.10 lakh crore. The Government has estimated receipts under ‘Other Communication Services’ mainly relate to the license fees from telecom operators and receipts on account of spectrum usage charges of Rs 53,986 crore in FY22 from last year revised estimate of Rs 37,737 crore. It seems Government is expecting around Rs 20,000 crore from 5G spectrum actions.
Government propose to take up the privatization of two Public Sector Banks and one General Insurance company in FY22. Rs 20,000 crore as recapitalisation is provided in FY22 to further consolidate the financial capacity of PSBs.
Gross tax revenue is expected to grow by 16.7% in FY22 to Rs 22.2 lakh crore. This revenue target from taxation is supported by 21.4% growth in custom duty, 22.2% in income tax and 22.6% rise in corporation tax. The tax buoyancy for FY22 is estimated at 1.16 (based on gross tax revenue). GST collection target is budgeted to increase at 22.3% to Rs 6.3 lakh crore over FY21 revised estimates. Major subsidies will decline by 43.5% to Rs 3.36 lakh crore.
For FY22, the Gross Government Borrowing is Budgeted at Rs 12.05 lakh crore and net borrowing requirement is pegged at Rs 9.24 lakh crore considering repayments of Rs 2.39 lakh crore.
Taking a holistic approach to Health, Budget focusses on strengthening three areas: Preventive, Curative, and Wellbeing. The Budget outlay for Health and Wellbeing at Rs 2.24 lakh crore is 137% more than the BE of FY21 (Rs 94,452 crore). This expenditure is 1.8% of GDP. Provision of Rs 35,000 crore made for Covid-19 vaccine.
The total dividend from the Reserve Bank of India, nationalised banks and financial institutions is estimated at Rs 53,511 crore for FY22, almost 10% less than revised estimated of FY21 (Rs 61,826 crores). Compared to FY20 this amount is almost one-third.

4 UNION BUDGET 2021-22
7 Mega Investment Textiles Parks (MITRA) will be established over 3 years. This will create world class infrastructure with plug and play facilities to enable create global champions in exports.
Dwelling on the infrastructure sector, Finance Minister has emphasized that infrastructure needs long term debt financing. A professionally managed Development Financial Institution is necessary to act as a provider, enabler and catalyst for infrastructure financing. Accordingly, a Bill to set up a DFI will be introduced. Government has provided a sum of Rs 20,000 crore to capitalise this institution and the ambition is to have a lending portfolio of at least Rs 5 lakh crore for this DFI in three-year time.
A proposal has been made to setup an asset reconstruction company (ARC) and an asset management company (AMC) to hive off NPAs in the banking sector into a separate entity. With the banks now holding a significant amount of provisions for the stressed assets, a wholesale transfer of the bad assets to the proposed entities is purely a technical issue and the process of recovery and resolution could be carried out much better.
The Government has proposed to increase the FDI limit in insurance companies to 74% from the present 49%, with Indian management control. The Covid-19 pandemic has shown that further penetration of insurance in India is needed with a significant change in behavioural habits of individuals towards more insurance products and for that capital infusion is required. The move is need of the hour and expected to aid the sector in increasing insurance penetration in the country, which is currently at merely 3.76% (Life: 2.82%, Non-life: 0.94%; 2019), compared to World average of 7.23% (Life: 3.35%, Non-life: 3.88%).
As a part of the Aatmanirbhar Bharat Package, the Government has finalised for a new coherent PSE policy—where all sectors are open to the private sector while PSEs will play an important role in defined areas. Accordingly, Government has decided other than in strategic sectors (to be notified separately), all sectors will be open to the private sector. In strategic sectors, at least one enterprise will remain in the public sector but private sector will also be allowed, while in remaining sectors PSEs will be privatized. Further, to minimize wasteful administrative costs, number of enterprises in strategic sectors will ordinarily be only one to four; others will be privatized/ merged/ brought under holding companies. The measure is expected to free capital locked in failed PSE. As of Mar’19, India has 262 operating PSEs contributing Rs 1.43 lakh crore of profit. However, in services sector where there is 134 PSEs the amount of profit is only Rs 12,584 crore (i.e. Rs 545.6 crore profits per PSE).
To further augment road infrastructure, more economic corridors are also being planned. Finance Minister also provided an enhanced outlay of Rs 1.18 lakh crore for Ministry of Road Transport and Highways, of which Rs 1.08 lakh crore is for capital, the highest ever.
Production Linked Incentive scheme (PLI) launched to create manufacturing global champions across 13 sectors with amount committed nearly Rs 1.97 lakh crore in next 5 years starting FY22.
Government will add 100 more districts in next 3 years to the City Gas Distribution network.
Minimum loan size eligible for debt recovery under the Securitisation and Reconstruction of Financial Assets and Enforcement of Security Interest (SARFAESI) Act, 2002 proposed to be reduced from Rs 50 lakh to Rs 20 lakh for NBFCs with minimum asset size of Rs 100 crore.
Government has enhanced the agricultural credit target to Rs 16.5 lakh crore in FY22. Similarly, the allocation to the Rural Infrastructure Development Fund increased from Rs 30,000 crore to Rs 40,000 crore. The Micro Irrigation Fund, with a corpus of Rs 5,000 crore has been created under NABARD will be doubled.
In an important announcement to boost value addition in agriculture and allied products and their exports, the scope of ‘Operation Green Scheme’ that is presently applicable to tomatoes, onions, and potatoes, will be enlarged to include 22 perishable products.
To further facilitate credit flow under the scheme of Stand-Up India for SCs, STs, and women, the Finance Minister proposed to reduce the margin money requirement from 25% to 15%, and to also include loans for activities allied to agriculture. Moreover, several steps were taken to support the MSME sector and Government has provided Rs 15,700 crores to this sector – more than double of this year’s BE.
Senior citizens (who are of 75 years of age and above) having only pension and interest income will now be exempted from filing their income tax return.
Section 1

5UNION BUDGET 2021-22
MACRO VIEW AND FISCAL MANAGEMENT
As was widely expected the fiscal deficit target of 3.8% of GDP has been revised upwards to 9.5% of GDP for FY21, owing to huge expenditure related to Covid pandemic as well as reduced receipts for the Government. Revenue receipts gross of centre has fallen short of the Budget Estimate by Rs 8.6 lakh crores, with Rs 5.5 lakh crore shortfall in tax revenue itself. Disinvestments have also been lower than budget estimates by Rs 1.8 lakh crores. Meanwhile, expenditure has been revised upwards by Rs 4.1 lakh crore, of which Rs 3.1 lakh crore attributed to provisions for providing food during pandemic and Rs 71,000 crore jump in rural outlay in lieu of MGNREGA. Thus fiscal deficit has increased to Rs 18.5 lakh crore from the BE of Rs 7.96 lakh crore.
For FY22, the fiscal deficit as % of GDP has been projected at 6.8% of GDP, with nominal GDP growth rate expected at 14.4%. The Capital Expenditure has been kept at a higher level with growth of over 26%, in line with the infrastructure push that the Government is planning to give to the slowing economy. The incremental jump in capital expenditure is at Rs 1.4 lakh crores that is 8 times higher than the Rs 25,000 crore on an average increase during the last 2 decades. Fiscal deficit is expected at 4.5% of GDP by 2025-26 as growth returns to the economy. In FY22, food subsidy will be at Rs 2.4 lakh crore (Rs 4.2 lakh crore in FY21 because of pandemic) that will be still more than twice the food subsidy bill in FY20.
Meanwhile, even as the state fiscal deficit is expected to jump to 4.5% of GDP in FY21 from budgeted 2.8%, the cash balance of the Centre that us with RBI has increased significantly to around Rs 3.4 lakh crores, of which we believe at least 85-90% belongs to the states that is invested with the Centre. This clearly indicates that states are preserving cash as they are uncertain to spend in the current pandemic.
The genesis of fiscal deficit in incremental terms (Rs lakh crore)
Item FY21 RE /BE
FY22 BE/RE
Gross Corporation Tax shortfall A -2.4 1.0
Gross Income tax shortfall B -1.8 1.0
Gross Customs and Union Excise Duties surplus C 0.7 0.0
Gross Goods and Services Tax (GST) shorfall D -1.8 1.1
Disinvestment receipts shortfall E -1.8 1.4
Shortfall in other heads (Interest income, other non tax revenue, recovery of loans) F -0.6 0.0
Shortfall on account of Dividend & Profits due from instituions G -1.1 0.3
Total Revenue Loss H=Sum: A to G -8.6 5.0
Revenue loss of States I -2.3 1.2
Net Revenue shortfall to Center after adjusting for States transfer J=H-I -6.3 3.8
Expenditure increase K 4.1 0.3
Fiscal Deficit BE L 8.0 15.1
Revised Fiscal Deficit M = L+K-J 18.5 -
New Fiscal Deficit (% of GDP) N 9.5 6.8
Memo:
Increase in Food Subsidy 3.1 -1.8
Source:Union Budget Documents & SBI Research.
Economy & Banking
6 UNION BUDGET 2021-22
FISCAL DEFICIT MOVES FROM OFF BALANCE SHEET TO HEADLINE
The Union Budget FY22 has unveiled a spending jugular to revive growth. There has been a massive jump in investment in infrastructure. Despite a deceleration in the Gross Domestic Product (GDP) growth in FY21, the fundamentals of Indian economy remain strong and GDP growth is expected to rebound from the first quarter of FY22.
Three points need to be strongly reemphasized. First, the Union Budget estimate 14.4% nominal GDP growth rate. Assuming a conservative 10% real GDP growth rate, this translates into an inflation of around 4.4%. We believe, if growth comes back riding on the spending prowess, the nominal GDP projection may be an underestimate. This may thus provide even some more additional spending room for the Government.
In fact, the tax buoyancy (based on gross tax revenues) for FY22 is reasonably estimated at 1.2 as nominal GDP growth is projected by 14.4% while gross tax revenues are projected to grow by 16.7%. For FY21 (RE) the tax buoyancy is 1.3 despite that fact that economy was in recession.
Second, even as the market is apprehensive of financing of the large fiscal deficit estimates, the markets have clearly missed the finer details. The Centre has carefully removed the overt reliance of FCI from NSSF thus making budget numbers transparent. In fact, the stand-alone fiscal deficit of the Centre and including the extra budgetary borrowings of the Centre in FY22 are nearly identical at 6.8%, which has always diverged in the past. This only implies that fiscal deficit numbers reflect the true extent of indebtedness in FY22 budget. The net borrowings of the Centre and States are budgeted at Rs 18.1 lakh crores, which is marginally higher than Rs 17.8 lakh crores in FY21 budget. We must understand that out of estimated 9.5% of fiscal deficit for FY21, 1.6% of GDP is solely because of the jump in food subsidy bill, which underlines the humanitarian aspect of India’s pandemic response.
Third, the massive focus on health infrastructure. Taking a holistic approach to Health, Budget focus on strengthening three areas: Preventive, Curative, and Wellbeing. The Budget outlay for Health and Wellbeing at Rs 2.24 lakh crore is 137% more than the BE of FY21. This expenditure is 1.8% of GDP, now closer to South Asian countries like Malaysia. Interestingly, given the information asymmetries that make unregulated private enterprise suboptimal in healthcare, a sectoral regulator that undertakes regulation and supervision of the healthcare sector is sine qua non for India. This is especially pertinent as regulation has grown in importance as a key lever for Governments to affect the quantity, quality, safety and distribution of services in health systems.
However, a word of caution on public debt. The budget documents this year have altogether omitted the exact figures of outstanding central Government debt and have just stated that “Central Government Debt to GDP ratio is estimated to be 3.1% due to higher borrowings”. For our calculations of the debt trajectory we have assumed that the statement means that the central Government debt to GDP ratio is 3.1% higher than the 47.7% figure for FY20. However, more clarity is needed as a 50.1% Debt to GDP ratio will translate to only Rs 97 lakh crore for FY21 and the quarterly report on public debt management states that by end Sep’20, Total Debt/ Liabilities were already at Rs 1.07 lakh crore.
However, if we take the 50.1% Debt to GDP ratio for Centre and 31% for states, it shows that the Debt to GDP ratio will be around 82% of GDP. However, if we add the FY21 net borrowings to FY20 liabilities it will translate into debt of Rs 107.9 lakh crore, which will push the debt to GDP ratio to 86%.
If we compare the debt estimates for Centre and States with the ambitious FRBM targets set in a pre COVID scenario, it shows that even by FY25, the excess debt burden will be to the tune of 3% of GDP, which roughly translates into Rs 100 lakh crore and if the Government has to even come to a striking level mandated by FRBM it has to mobilise resources worth a minimum of Rs 100 lakh crore till FY25, through massive expenditure rationalization and substantial increase in tax revenues. In effect, it implies FRBM targets now need to be completely reset beyond FY25 also.
Additionally, in the current scenario when market appetite is already low it seems difficult how a large fiscal deficit might be financed and we expect maximum amount raised could go upto Rs 14-15 lakh crore depending on market appetite leaving a gap of around Rs 3-4 lakh crore which could be filled by RBI through OMOs or other means. Since insurance sector and pensions fund are the key players for long-term securities of 15 years and above, we believe RBI can even make some special arrangement with insurance sector or pension funds for long-term bonds and go for exclusive placement in long bonds with these investors.
Section 1

7UNION BUDGET 2021-22
Budget at a glance (Rs Crore and as a % of GDP)
FY19 FY20 FY21 (BE) FY21 ( RE) FY22 (BE)
FY22 (BE)/FY21 (RE)
(% Gr)
FY21 (RE) / FY20
(% Gr)
FY20/ FY19
(% Gr)
5 Yr CAGR (FY17-21 in
%)
Decadal CAGR (FY12- 21 in
%)
1.1 Revenue Receipts 15,52,916 16,84,059 20,20,926 15,55,153 17,88,42415.0 -7.7 8.4 3.1 8.4
% of GDP 8.2 8.3 9.0 8.0 8.0
1.1.1 Tax Revenue (Net to centre) 13,17,211 13,56,902 16,35,909 13,44,501 15,45,39614.9 -0.9 3.0 5.1 8.8
% of GDP 7.0 6.7 7.3 6.9 6.9
1.1.2 Non-Tax Revenue 2,35,705 3,27,157 3,85,017 2,10,652 2,43,02815.4 -35.6 38.8 -6.3 6.3
% of GDP 1.2 1.6 1.7 1.1 1.1
1.2 Capital Receipts 7,62,197 10,02,271 10,21,304 18,95,152 16,94,812-10.6 89.1 31.5 33.3 14.3
% of GDP 4.0 4.9 4.5 9.7 7.6
1.2.1 Recoveries of Loans 18,052 18,316 14,967 14,497 13,000-10.3 -20.9 1.5 -4.8 -2.9
% of GDP 0.1 0.1 0.1 0.1 0.1
1.2.2 Other Receipts 94,727 50,304 2,10,000 32,000 1,75,000446.9 -36.4 -46.9 -9.5 6.5
% of GDP 0.5 0.2 0.9 0.2 0.8
1.2.3 Borrowings and other liabilities* 6,49,418 9,33,651 7,96,337 18,48,655 15,06,812-18.5 98.0 43.8 36.3 14.8
% of GDP 3.4 4.6 3.5 9.5 6.8
1. Total Receipts 23,15,113 26,86,330 30,42,230 34,50,305 34,83,2361.0 28.4 16.0 15.0 11.4
% of GDP 12.3 13.2 13.5 17.7 15.6
2. Total Expenditure 23,15,113 26,86,330 30,42,230 34,50,305 34,83,2361.0 28.4 16.0 15.0 11.4
% of GDP 12.3 13.2 13.5 17.7 15.6
2.1 Revenue Expenditure 20,07,399 23,50,604 26,30,145 30,11,142 29,29,000-2.7 28.1 17.1 15.5 11.3
% of GDP 10.6 11.6 11.7 15.5 13.1
2.1.1 Grants for creation of Capital Assets 1,91,781 1,85,641 2,06,500 2,30,376 2,19,112-4.9 24.1 -3.2 8.6 6.3
% of GDP 1.0 0.9 0.9 1.2 1.0
2.1.2 Interest Payments 5,82,648 6,12,070 7,08,203 6,92,900 8,09,70116.9 13.2 5.0 9.6 10.9
% of GDP 3.1 3.0 3.1 3.6 3.6
2.2 Capital Expenditure 3,07,714 3,35,726 4,12,085 4,39,163 5,54,23626.2 30.8 9.1 11.5 12.0
% of GDP 1.6 1.6 1.8 2.3 2.5
3. Revenue Deficit (2.1-1.1) 4,54,483 6,66,545 6,09,219 14,55,989 11,40,576-21.7 118.4 46.7 46.5 15.6
% of GDP 2.4 3.3 2.7 7.5 5.1
4. Effective Revenue Deficit (3-2.1.1) 2,62,702 4,80,904 4,02,719 12,25,613 9,21,464-24.8 154.9 83.1 68.9 18.7
% of GDP 1.4 2.4 1.8 6.3 4.1
5. Fiscal Deficit {2-(1.1+1.2.1+1.2.2)} 6,49,418 9,33,651 7,96,337 18,48,655 15,06,812-18.5 98.0 43.8 36.3 15.2
% of GDP 3.4 4.6 3.5 9.5 6.8
6. Primary Deficit (5-2.1.2) 66,770 3,21,581 88,134 11,55,755 6,97,111-39.7 259.4 381.6 114.2 18.9
% of GDP 0.4 1.6 0.4 5.9 3.1
Revenue Deficit / Fiscal Deficit (%) 70.0 71.4 76.5 78.8 75.7
Memo:
Nominal GDP 1,88,86,957 2,03,51,013 2,24,89,420 1,94,81,975 2,22,87,379
Growth rate 10.5 7.8 10.5 -4.3 14.4
Source:Union Budget Documents & SBI Research, * Includes drawdown of cash Balance.
Economy & Banking

8 UNION BUDGET 2021-22
Expenditure of Major Items (Rs crore and as a % of GDP)
FY19 FY20 FY21 (BE) FY21 (RE) FY22 (BE) FY22 (BE)/ FY21 (RE) (% Gr)
FY21 (RE)/ FY20 (% Gr)
FY20 / FY19 (% Gr)
Pension 1,60,211 1,83,955 2,10,682 2,04,393 1,89,328-7.4 11.1 14.8
% of GDP 0.8 0.9 0.9 1.0 0.8
Defence 2,90,802 3,18,665 3,23,053 3,43,822 3,47,0880.9 7.9 9.6
% of GDP 1.5 1.6 1.4 1.8 1.6
Subsidy 1,96,769 2,28,341 2,27,794 5,95,355 3,35,361-43.7 160.7 16.0
% of GDP 1.0 1.1 1.0 3.1 1.5
Agriculture & allied Activities 63,259 1,12,452 1,54,775 1,45,355 1,48,3012.0 29.3 77.8
% of GDP 0.3 0.6 0.7 0.7 0.7
Commerce and Industry 27,851 27,299 27,227 23,515 34,62347.2 -13.9 -2.0
% of GDP 0.1 0.1 0.1 0.1 0.2
Education 80,345 89,437 99,312 85,089 93,2249.6 -4.9 11.3
% of GDP 0.4 0.4 0.4 0.4 0.4
Energy 45,461 43,542 42,725 33,440 42,82428.1 -23.2 -4.2
% of GDP 0.2 0.2 0.2 0.2 0.2
Finance 14,920 18,535 41,829 50,566 91,91681.8 172.8 24.2
% of GDP 0.1 0.1 0.2 0.3 0.4
Health 54,477 63,425 67,484 82,445 74,602-9.5 30.0 16.4
% of GDP 0.3 0.3 0.3 0.4 0.3
Home Affairs 98,116 1,19,850 1,14,387 98,106 1,13,52115.7 -18.1 22.2
% of GDP 0.5 0.6 0.5 0.5 0.5
Interest 5,82,648 6,12,070 7,08,203 6,92,900 8,09,70116.9 13.2 5.0
% of GDP 3.1 3.0 3.1 3.6 3.6
Others 74,497 79,523 84,256 94,371 87,528-7.3 18.7 6.7
% of GDP 0.4 0.4 0.4 0.5 0.4
Rural Development 1,32,803 1,42,384 1,44,817 2,16,342 1,94,633-10.0 51.9 7.2
% of GDP 0.7 0.7 0.6 1.1 0.9
Social Welfare 43,664 44,649 53,876 39,629 48,46022.3 -11.2 2.3
% of GDP 0.2 0.2 0.2 0.2 0.2
Tax Administration 69,416 1,69,331 1,52,962 1,47,728 1,31,100-11.3 -12.8 143.9
% of GDP 0.4 0.8 0.7 0.8 0.6
Transfer to States 1,19,144 1,48,907 2,00,447 2,07,001 2,93,30241.7 39.0 25.0
% of GDP 0.6 0.7 0.9 1.1 1.3
Transport 1,43,626 1,53,437 1,69,637 2,18,622 2,33,0836.6 42.5 6.8
% of GDP 0.8 0.8 0.8 1.1 1.0
Urban Development 40,612 42,054 50,040 46,791 54,58116.6 11.3 3.6
% of GDP 0.2 0.2 0.2 0.2 0.2
Grand Total 23,15,113 26,86,330 30,42,230 34,50,305 34,83,2361.0 28.4 16.0
% of GDP 12.3 13.2 13.5 17.7 15.6
Source:Union Budget Documents & SBI Research.
Section 1

9UNION BUDGET 2021-22
SUBSIDY TRENDS
The subsidy expenditure under three major heads is budgeted at Rs 3.36 lakh crore for FY22. Though compared to FY21 (RE) almost all subsidies exhibited huge decline but as compared to FY21 (BE), only petroleum subsidy is expected to decline.
Subsidy Trends (Rs crore and as a % of GDP)
FY19 FY20 FY21 (BE) FY21 (RE) FY22 (BE)
FY22 (BE)/
FY21 (RE) (% Gr)
FY21 (RE)/ FY20
(% Gr)
FY20/ FY19
(% Gr)
5 Yr CAGR
(FY17-21 in %)
Decadal CAGR
(FY12-21 in %)
Total 3 Major Subsidies 196769 228341 227794 595620 336439-43.5 160.8 16.0 2.8 15.4
% of GDP 1.0 1.1 1.0 3.1 1.5
Fertiliser Subsidy 70605 81124 71309 133947 79530-40.6 65.1 14.9 1.8 8.9
% of GDP 0.4 0.4 0.3 0.7 0.4
Food Subsidy 101327 108688 115570 422618 242836-42.5 288.8 7.3 1.2 23.4
% of GDP 0.5 0.5 0.5 2.2 1.1
Petroleum Subsidy 24837 38529 40915 39055 14073-64.0 1.4 55.1 10.4 0.2
% of GDP 0.1 0.2 0.2 0.2 0.1
Source: Union Budget documents & SBI Research.
TAX REVENUE TRENDS
The Centre’s gross tax revenue for FY21 has been revised downwards to Rs 19.0 lakh crore (5.5% decline over FY20), which is Rs 5.2 crore lesser over the Budget estimate for FY21. All the heads under gross tax revenue have seen a downward revision from the Budget estimates of FY21 (except excise and customs) as the economy faces an extreme slowdown due to Covid-19 lockdown.
Coming to FY22 projections, due to low base almost all components of taxes exhibited double digit growth (except excise and service tax). However, in absolute numbers, tax collection in FY22 is projected lower than the FY21 (BE), except for excise.
For the GST revenue, the growth rate for FY22 is projected at 22.3%. Notably, after the dip in tax collections in the initial months this fiscal, the gross GST monthly collections reached a record Rs 1.2 lakh crore in Jan’21. Monthly GST revenues have been above Rs 1 lakh crore for the last four months. The increase in tax collections is mainly due to the ‘combined effect of the rapid economic recovery post-pandemic and the nationwide drive against GST evaders and fake bills along with many systemic changes introduced recently, which have led to improved compliance. Further, the recent changes introduced and effectively implemented in GST technology platform like e-invoicing and of matching of supplier invoices along with strict enforcement by revenue authorities in checking fraudulent invoices, has induced an enhanced degree of reporting compliance.
Direct and Indirect taxes (Rs crore and as a % of GDP)
FY19 FY20 FY21 (BE)
FY21 (RE)
FY22 (BE)
FY22 (BE)/
FY21 (RE) (% Gr)
FY21 (RE)/ FY20
(% Gr)
FY20/ FY19 (%Gr)
5 Yr CAGR (FY17-
21 in %)
Decadal CAGR (FY12-
21 in %)
Gross Tax Revenue 20,80,465 20,10,059 24,23,020 19,00,280 22,17,05916.7 -5.5 -3.4 2.6 8.8
% of GDP 11.0 9.9 10.8 9.8 9.9Direct Tax
Corporation Tax 6,63,572 5,56,876 6,81,000 4,46,000 5,47,00022.6 -19.9 -16.1 -2.1 3.7
% of GDP 3.5 2.7 3.0 2.3 2.5
Economy & Banking

10 UNION BUDGET 2021-22
Direct and Indirect taxes (Rs crore and as a % of GDP)
FY19 FY20 FY21 (BE)
FY21 (RE)
FY22 (BE)
FY22 (BE)/
FY21 (RE) (% Gr)
FY21 (RE)/ FY20
(% Gr)
FY20/ FY19 (%Gr)
5 Yr CAGR (FY17-
21 in %)
Decadal CAGR (FY12-
21 in %)
Taxes on Income Other than Corporation Tax
4,72,983 4,92,654 6,38,000 4,59,000 5,61,00022.2 -6.8 4.2 7.1 12.1
% of GDP 2.5 2.4 2.8 2.4 2.5Indirect Taxes
Customs 1,17,813 1,09,282 1,38,000 1,12,000 1,36,00021.4 2.5 -7.2 -16.0 -3.1
% of GDP 0.6 0.5 0.6 0.6 0.6Union Excise Duty 2,31,045 2,40,615 2,67,000 3,61,000 3,35,000
-7.2 50.0 4.1 -1.4 10.7% of GDP 1.2 1.2 1.2 1.9 1.5
Service Tax 6,904 6,029 1,020 1,400 1,000-28.6 -76.8 -12.7 -72.8 -37.6
% of GDP 0.0 0.0 0.0 0.0 0.0Goods and Services Tax 5,81,559 5,98,750 6,90,500 5,15,100 6,30,000
22.3 -14.0 3.0 ---% of GDP 3.1 2.9 3.1 2.6 2.8
Source: Union Budget documents & SBI Research.
EXCISE DUTY ON OIL – COUNTER CYCLICAL FISCAL TOOL FOR SHORING UP REVENUES
Government has hiked the excise duty on petrol and diesel at the beginning of this fiscal in line with the reduced oil prices. This in turn has helped the Government shore up its revenues, especially in the context of Covid pandemic when all the other tax revenues collection has been hit hard. Net union excise duty was budgeted at Rs 2.67 lakh crore in FY21, however the revised estimate is much higher at Rs 3.61 lakh crore, an addition of Rs 94,000 crore.
For the states, however there is a shortfall. According to the Budget estimates, states are expecting Rs 2.3 lakh crore minimum as VAT collection from oil in FY21. Furthermore, monthly data of sales tax shows that states have garnered Rs 1.58 lakh crore till Dec’20. Considering 74% of this as VAT collection from oil, it translates into Rs 1.17 lakh crore till Dec’20, which in turn implies Rs 38,953 crore is collected in Q3 (Oct-Dec’20). Assuming the states will collect the 1.5 times this amount in the last quarter, the total sales tax/VAT collection from oil comes to around Rs 1.75 lakh crore, which is still less than the BE by at least Rs 50,000 crore.
States sales tax/VAT from Oil estimates (FY21, Rs lakh crore)
Revenue from Sales tax of States BE FY21 3.10
Budgeted revenue from oil (@74%) 2.29
Sales tax collection of States till Dec'20 1.58
of which sales tax/VAT on oil 1.17
Sales tax/VAT collection from oil till H1 FY21 0.78
Sales tax/VAT collection from oil in Q3 0.39
Collection in Q4 (assuming 1.5 times in Q3) 0.58
Total sales tax/VAT from oil in FY21 1.75
Shortfall in sales tax/VAT from oil in BE FY21 0.54
Source: PPAC, RBI, SBI Research
Section 1
11UNION BUDGET 2021-22
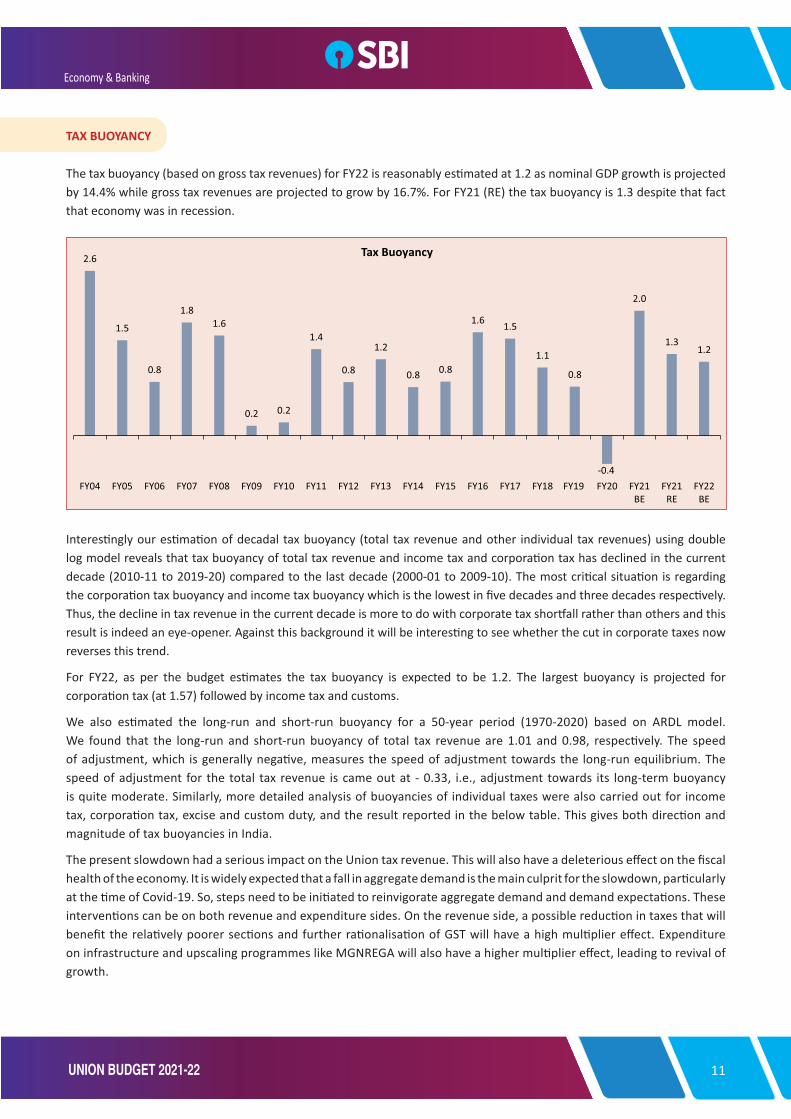
TAX BUOYANCY
The tax buoyancy (based on gross tax revenues) for FY22 is reasonably estimated at 1.2 as nominal GDP growth is projected by 14.4% while gross tax revenues are projected to grow by 16.7%. For FY21 (RE) the tax buoyancy is 1.3 despite that fact that economy was in recession.
Interestingly our estimation of decadal tax buoyancy (total tax revenue and other individual tax revenues) using double log model reveals that tax buoyancy of total tax revenue and income tax and corporation tax has declined in the current decade (2010-11 to 2019-20) compared to the last decade (2000-01 to 2009-10). The most critical situation is regarding the corporation tax buoyancy and income tax buoyancy which is the lowest in five decades and three decades respectively. Thus, the decline in tax revenue in the current decade is more to do with corporate tax shortfall rather than others and this result is indeed an eye-opener. Against this background it will be interesting to see whether the cut in corporate taxes now reverses this trend.
For FY22, as per the budget estimates the tax buoyancy is expected to be 1.2. The largest buoyancy is projected for corporation tax (at 1.57) followed by income tax and customs.
We also estimated the long-run and short-run buoyancy for a 50-year period (1970-2020) based on ARDL model. We found that the long-run and short-run buoyancy of total tax revenue are 1.01 and 0.98, respectively. The speed of adjustment, which is generally negative, measures the speed of adjustment towards the long-run equilibrium. The speed of adjustment for the total tax revenue is came out at - 0.33, i.e., adjustment towards its long-term buoyancy is quite moderate. Similarly, more detailed analysis of buoyancies of individual taxes were also carried out for income tax, corporation tax, excise and custom duty, and the result reported in the below table. This gives both direction and magnitude of tax buoyancies in India.
The present slowdown had a serious impact on the Union tax revenue. This will also have a deleterious effect on the fiscal health of the economy. It is widely expected that a fall in aggregate demand is the main culprit for the slowdown, particularly at the time of Covid-19. So, steps need to be initiated to reinvigorate aggregate demand and demand expectations. These interventions can be on both revenue and expenditure sides. On the revenue side, a possible reduction in taxes that will benefit the relatively poorer sections and further rationalisation of GST will have a high multiplier effect. Expenditure on infrastructure and upscaling programmes like MGNREGA will also have a higher multiplier effect, leading to revival of growth.
Economy & Banking

12 UNION BUDGET 2021-22
Tax Buoyancy
Decade
Total Tax Revenue Income tax Corporation tax Excise Customs
Double Log Model
Coefficient Coefficient Coefficient Coefficient Coefficient
1970-71 to 1979-80 1.29 1.85 1.30 1.07 1.56
1980-81 to 1989-90 1.18 0.89 0.94 1.05 1.45
1990-91 to 1999-00 0.85 1.48 1.29 0.66 0.73
2000-01 to 2009-10 1.28 1.46 1.95 0.50 0.86
2010-11 to 2019-20 1.05 1.23 0.75 0.92 -0.17
2021-22 BE 1.16 1.54 1.57 -0.50 1.49
ARDL
Long run 1.01 1.39 1.17 0.83 0.89
Short run 0.98 0.8 1.01 0.25 0.52
Speed -0.33 -0.2 -0.16 -0.3 -0.1
Source: SBI Research; All coefficients are significant at 1% significxance level.
GOVERNMENT BORROWINGS
Central Government Borrowings
Gross market borrowing of the Centre for FY21 has been revised to Rs 12.8 lakh crore compared to the BE of Rs 7.8 lakh crore, with net borrowing at Rs 10.5 lakh crore as against Rs 5.4 lakh crore in BE. The Government has undertaken switch of Rs 1.6 lakh crore against the budgeted Rs 2.7 lakh crore. Meanwhile, the buyback has been nil. Besides, abundant liquidity and demand for short-bills being high, the Government has used the short-term borrowing more which has been increased to Rs 2.25 lakh crore through various (91-day- Rs 2564 crore, 182 day- -Rs 15688 crore, 364 day- Rs 238124 crore) treasury bills as against the budgeted Rs 25,000 crore.
For FY22, Gross market borrowing through dated securities has been budgeted at Rs 12.05 lakh crore and taking repayments of Rs 2.81 lakh crore net market borrowing stands at Rs 9.24 lakh crore. The Government has also announced switch of Rs 1.8 lakh crore in FY22 as against the revised Rs 1.6 lakh crore in the current fiscal. Notably, the Government stocks repurchased by means of switch will not have any impact on the fiscal situation as they will get prematurely redeemed and interest will cease to accrue on such redeemed Government stocks. But on the flip side, the Government buys short term and lends long term in case of switch due for which the duration goes up and thus appetite of market players will decline. The short-term borrowing for FY22 has been pegged at Rs 50,000 crore, that we expect might be scaled up if need arises. The Government has also Budgeted Rs 2.5 lakh crore as borrowing against cash management bills in FY22.
State Government Borrowings
States gross borrowings were also revised upwards to Rs 8.7 lakh crore while net borrowings to Rs 7.2 lakh crore in FY21. For FY22, with ceiling of net borrowing at 4% of GDP and additional 0.5% of GDP conditional borrowing by States announced by the Government, the net borrowings are pegged at Rs 8.9 lakh crore and gross borrowings are expected to come around Rs 11 lakh crore after taking a repayment of around Rs 2.1 lakh crore.
Thus, total gross borrowing of the Centre and States for FY22 comes to 23 lakh crores while net borrowing stands at Rs 18.1 lakh crore which is similar to the level achieved in FY21.
Section 1

13UNION BUDGET 2021-22
Market Borrowings through Dated Securities (Rs lakh crore)
FY20 (RE) FY21 (BE) FY21 (RE) FY22 (BE)
Centre
Gross Borrowing 7.1 7.8 12.8 12.1
Repayments 2.4 2.4 2.3 2.8
Net Borrowing 4.7 5.4 10.5 9.2
State
Gross Borrowing 6.3 7.0 8.7 11.0
Repayments 1.5 1.4 1.5 2.1
Net Borrowing 4.9 5.6 7.2 8.9
Total
Gross Borrowing 13.4 14.8 21.5 23.0
Net Borrowing 9.6 11.0 17.8 18.1
Source: SBI Research.
Maturity Profile of Outstanding Central Government Dated Securities (% of total)
Maturity Bucket End Mar 2015
End Mar 2016
End Mar 2017
End Mar 2018
End Mar 2019
End Mar 2020
End Jun 2020
End Sep 2020
Less than 1 year 3.65 4.00 3.30 3.18 4.27 3.90 3.58 3.73
1-5 years 24.59 22.90 21.70 22.98 24.00 25.07 24.98 25.40
5-10 years 30.35 29.60 33.30 32.14 31.21 30.01 30.64 30.04
10-20 years 28.32 30.30 29.30 28.57 25.99 24.10 22.95 23.73
20 years and above 13.09 13.30 12.40 13.33 14.53 16.91 17.85 17.10
Source: SBI Research, DEA.
Off Balance Sheet Borrowings
The Government was using its off-Budget borrowing on a massive scale through public sector agencies to avoid showing such borrowing in its own books. However, there has been a progressive decline in extra budgetary resources (EBR) for PSUs to Rs 3.47 lakh crore in FY22 from the revised Rs 3.88 lakh crore in FY21. EBR for Petroleum and Natural Gas, steel and power has increased while that of others have declined.
This year the Government has reduced the EBR which was mobilised through NSSF and fully serviced bonds to Rs 30,000 crore only from Rs 1.3 lakh crore in FY21 RE. When we consider this along with the fiscal deficit of 6.8% of GDP estimated for FY22 it comes to increases to only 6.9% of GDP. In FY21, the fiscal deficit including the EBR of Centre of Rs 1.3 lakh crore comes at 10.2% of GDP compared to 9.5% of GDP. Thus, there has been a movement from off-balance sheet to headline fiscal deficit. When we look at NSSF the Government has projected net increase in collection of Rs 3.40 lakh crore in FY22 from the revised Rs 3.10 lakh crore in FY21. Interestingly, when the investment of NSSF funds is looked at it is observed that investment in public agencies has reduced to nil. The reduced NSSF loan support for FCI in FY21 is also one of the reasons for increase in fiscal deficit for FY21 between BE and RE and also for FY22 fiscal deficit. This is good for transparency.
Economy & Banking

14 UNION BUDGET 2021-22
Extra Budgetary Resources for PSUs (Rs Crore)
FY21 (BE) FY21 (RE) FY22 (BE) FY22 (BE)/ FY21 (% Gr)
Coal 5414 5414 1980 -63.4
Ministry of Housing and Urban Affairs 30240 28063 23046 -17.9
Petroleum and Natural Gas 28219 35973 47876 33.1
Power 33172 35632 41277 15.8
Steel 3385 4956 7602 53.4
Others 360098 278071 225769 -18.8
Total 460528 388108 347550 -10.5
% of GDP 2.0 2.0 1.6
GDP 22489420 19481975 22287379 14.4
Source: Union Budget Documents & SBI Research.
Total Borrowing Requirements including EBR (Rs lakh crore)
FY 20 FY21 (BE)
FY21 (RE)
FY22 (BE)
Net market borrowing of Centre 4.7 5.4 10.5 9.2
Net market borrowing of State 4.9 5.6 7.2 8.9
Extra Budgetary Resources of Government mobilised through issue fully serviced bonds and NSSF 1.5 1.9 1.3 0.3
Extra Budgetary Resources for PSUs 4.9 4.6 3.9 3.5
Total Borrowing 16.0 17.4 22.9 21.9
Total Borrowing (% of GDP) 7.9 7.8 11.7 9.8
Fiscal Deficit of Center (% of GDP) 3.8 3.5 9.5 6.8
Fiscal Deficit + EBR of Center (% of GDP) 4.6 4.3 10.2 6.9
Source: Union Budget Documents & SBI Research.
NSSF Fund allocation (Rs crore)
FY20 FY21 BE FY21 RE FY 22 BE
Net collection during the year 280275 295936 310521 340305
Net additional allocation during the year 304142 286577 333526 354663
Central Government securities (Budgetary borrowing from NSSF) 240000 240000 480574 391927
Special Central Government Securities 178478 157878 393642 258095
Reinnvestment in Central Government Special Securities 61522 82122 86932 133832
Special State Government Securities -30768 -26570 -24850 -22264
Public Agencies 94910 73147 -122198 -15000
FCI 63600 68200 -135888 -55000
BMTPC 15000 0 10000 0
Other Public Agencies 16310 4947.26 3690 40000
Source: SBI Research.
Section 1
15UNION BUDGET 2021-22
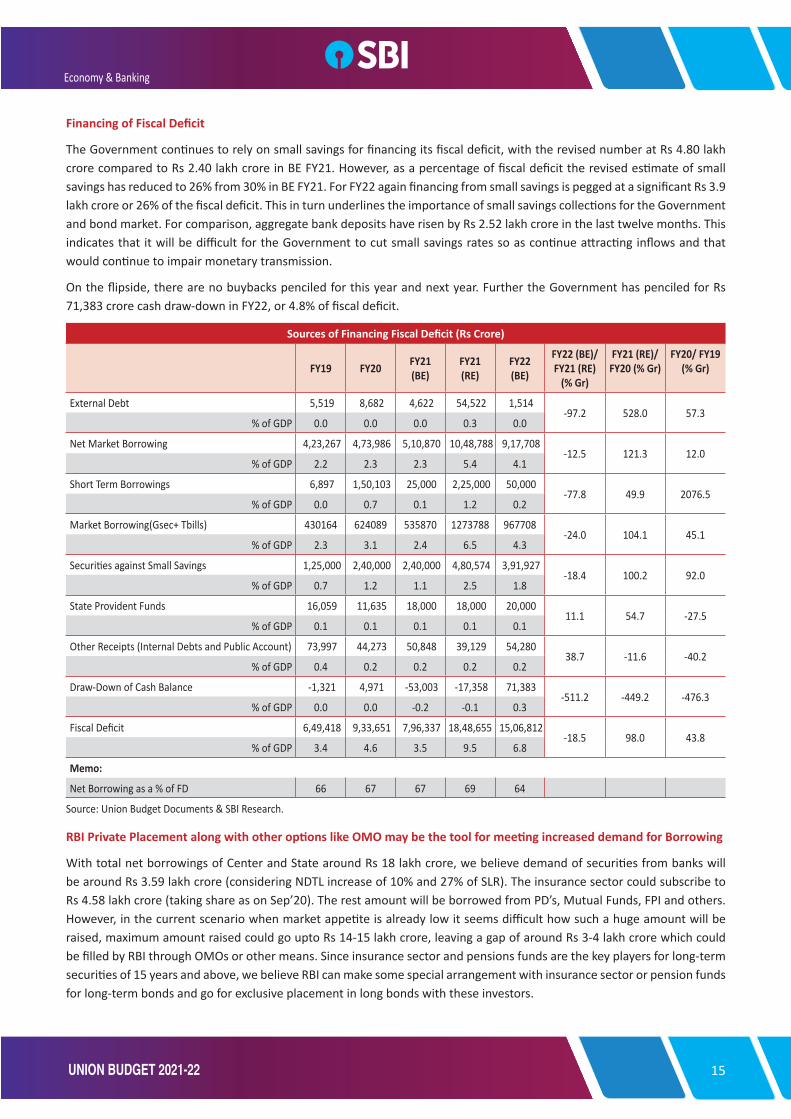
Financing of Fiscal Deficit
The Government continues to rely on small savings for financing its fiscal deficit, with the revised number at Rs 4.80 lakh crore compared to Rs 2.40 lakh crore in BE FY21. However, as a percentage of fiscal deficit the revised estimate of small savings has reduced to 26% from 30% in BE FY21. For FY22 again financing from small savings is pegged at a significant Rs 3.9 lakh crore or 26% of the fiscal deficit. This in turn underlines the importance of small savings collections for the Government and bond market. For comparison, aggregate bank deposits have risen by Rs 2.52 lakh crore in the last twelve months. This indicates that it will be difficult for the Government to cut small savings rates so as continue attracting inflows and that would continue to impair monetary transmission.
On the flipside, there are no buybacks penciled for this year and next year. Further the Government has penciled for Rs 71,383 crore cash draw-down in FY22, or 4.8% of fiscal deficit.
Sources of Financing Fiscal Deficit (Rs Crore)
FY19 FY20 FY21 (BE)
FY21 (RE)
FY22 (BE)
FY22 (BE)/FY21 (RE)
(% Gr)
FY21 (RE)/ FY20 (% Gr)
FY20/ FY19 (% Gr)
External Debt 5,519 8,682 4,622 54,522 1,514 -97.2 528.0 57.3
% of GDP 0.0 0.0 0.0 0.3 0.0
Net Market Borrowing 4,23,267 4,73,986 5,10,870 10,48,788 9,17,708 -12.5 121.3 12.0
% of GDP 2.2 2.3 2.3 5.4 4.1
Short Term Borrowings 6,897 1,50,103 25,000 2,25,000 50,000 -77.8 49.9 2076.5
% of GDP 0.0 0.7 0.1 1.2 0.2
Market Borrowing(Gsec+ Tbills) 430164 624089 535870 1273788 967708-24.0 104.1 45.1
% of GDP 2.3 3.1 2.4 6.5 4.3
Securities against Small Savings 1,25,000 2,40,000 2,40,000 4,80,574 3,91,927 -18.4 100.2 92.0
% of GDP 0.7 1.2 1.1 2.5 1.8
State Provident Funds 16,059 11,635 18,000 18,000 20,000 11.1 54.7 -27.5
% of GDP 0.1 0.1 0.1 0.1 0.1
Other Receipts (Internal Debts and Public Account) 73,997 44,273 50,848 39,129 54,280 38.7 -11.6 -40.2
% of GDP 0.4 0.2 0.2 0.2 0.2
Draw-Down of Cash Balance -1,321 4,971 -53,003 -17,358 71,383 -511.2 -449.2 -476.3
% of GDP 0.0 0.0 -0.2 -0.1 0.3
Fiscal Deficit 6,49,418 9,33,651 7,96,337 18,48,655 15,06,812 -18.5 98.0 43.8
% of GDP 3.4 4.6 3.5 9.5 6.8
Memo:
Net Borrowing as a % of FD 66 67 67 69 64
Source: Union Budget Documents & SBI Research.
RBI Private Placement along with other options like OMO may be the tool for meeting increased demand for Borrowing
With total net borrowings of Center and State around Rs 18 lakh crore, we believe demand of securities from banks will be around Rs 3.59 lakh crore (considering NDTL increase of 10% and 27% of SLR). The insurance sector could subscribe to Rs 4.58 lakh crore (taking share as on Sep’20). The rest amount will be borrowed from PD’s, Mutual Funds, FPI and others. However, in the current scenario when market appetite is already low it seems difficult how such a huge amount will be raised, maximum amount raised could go upto Rs 14-15 lakh crore, leaving a gap of around Rs 3-4 lakh crore which could be filled by RBI through OMOs or other means. Since insurance sector and pensions funds are the key players for long-term securities of 15 years and above, we believe RBI can make some special arrangement with insurance sector or pension funds for long-term bonds and go for exclusive placement in long bonds with these investors.
Economy & Banking
16 UNION BUDGET 2021-22
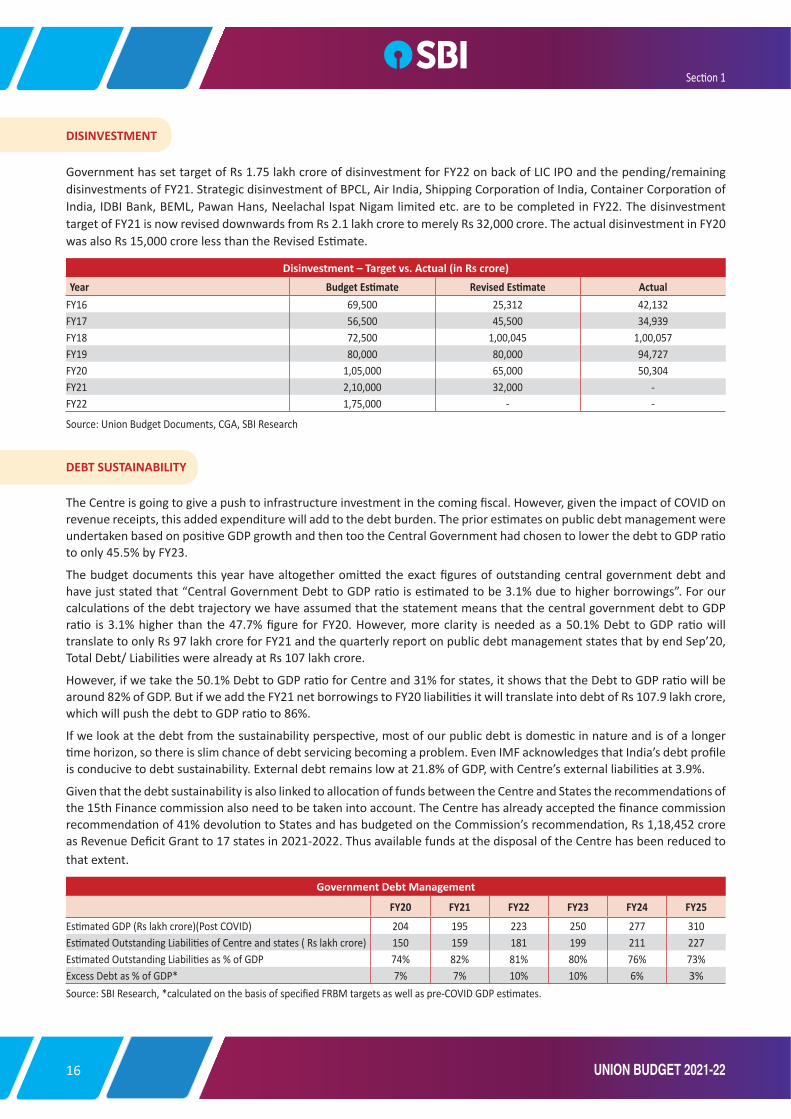
DISINVESTMENT
Government has set target of Rs 1.75 lakh crore of disinvestment for FY22 on back of LIC IPO and the pending/remaining disinvestments of FY21. Strategic disinvestment of BPCL, Air India, Shipping Corporation of India, Container Corporation of India, IDBI Bank, BEML, Pawan Hans, Neelachal Ispat Nigam limited etc. are to be completed in FY22. The disinvestment target of FY21 is now revised downwards from Rs 2.1 lakh crore to merely Rs 32,000 crore. The actual disinvestment in FY20 was also Rs 15,000 crore less than the Revised Estimate.
Disinvestment – Target vs. Actual (in Rs crore) Year Budget Estimate Revised Estimate Actual
FY16 69,500 25,312 42,132FY17 56,500 45,500 34,939FY18 72,500 1,00,045 1,00,057FY19 80,000 80,000 94,727FY20 1,05,000 65,000 50,304FY21 2,10,000 32,000 -FY22 1,75,000 - -
Source: Union Budget Documents, CGA, SBI Research
DEBT SUSTAINABILITY
The Centre is going to give a push to infrastructure investment in the coming fiscal. However, given the impact of COVID on revenue receipts, this added expenditure will add to the debt burden. The prior estimates on public debt management were undertaken based on positive GDP growth and then too the Central Government had chosen to lower the debt to GDP ratio to only 45.5% by FY23.
The budget documents this year have altogether omitted the exact figures of outstanding central government debt and have just stated that “Central Government Debt to GDP ratio is estimated to be 3.1% due to higher borrowings”. For our calculations of the debt trajectory we have assumed that the statement means that the central government debt to GDP ratio is 3.1% higher than the 47.7% figure for FY20. However, more clarity is needed as a 50.1% Debt to GDP ratio will translate to only Rs 97 lakh crore for FY21 and the quarterly report on public debt management states that by end Sep’20, Total Debt/ Liabilities were already at Rs 107 lakh crore.
However, if we take the 50.1% Debt to GDP ratio for Centre and 31% for states, it shows that the Debt to GDP ratio will be around 82% of GDP. But if we add the FY21 net borrowings to FY20 liabilities it will translate into debt of Rs 107.9 lakh crore, which will push the debt to GDP ratio to 86%.
If we look at the debt from the sustainability perspective, most of our public debt is domestic in nature and is of a longer time horizon, so there is slim chance of debt servicing becoming a problem. Even IMF acknowledges that India’s debt profile is conducive to debt sustainability. External debt remains low at 21.8% of GDP, with Centre’s external liabilities at 3.9%.
Given that the debt sustainability is also linked to allocation of funds between the Centre and States the recommendations of the 15th Finance commission also need to be taken into account. The Centre has already accepted the finance commission recommendation of 41% devolution to States and has budgeted on the Commission’s recommendation, Rs 1,18,452 crore as Revenue Deficit Grant to 17 states in 2021-2022. Thus available funds at the disposal of the Centre has been reduced to that extent.
Government Debt Management
FY20 FY21 FY22 FY23 FY24 FY25
Estimated GDP (Rs lakh crore)(Post COVID) 204 195 223 250 277 310Estimated Outstanding Liabilities of Centre and states ( Rs lakh crore) 150 159 181 199 211 227Estimated Outstanding Liabilities as % of GDP 74% 82% 81% 80% 76% 73%Excess Debt as % of GDP* 7% 7% 10% 10% 6% 3%Source: SBI Research, *calculated on the basis of specified FRBM targets as well as pre-COVID GDP estimates.
Section 1

17UNION BUDGET 2021-22
ILO has come up with estimates of fiscal stimulus which have been provided in the wake of COVID-19 and the working hours lost. In high-income countries, the announced fiscal stimulus measures equate to 10.1% of total working hours, while estimated working-hour losses averaged 9.4%. In low-income countries, the stimulus is equivalent to only 1.2% of total working hours, while working-hour losses averaged 9%. This “fiscal stimulus gap” is therefore around US$982 billion in low-income and lower-middle-income countries. These estimates make a case for enhanced fiscal spending in low and middle income countries. The recently released economic survey also calls for an active fiscal policy – one that recognises that fiscal multipliers are disproportionately higher during economic crises than during economic booms. The crux of the chapter “Does Growth Lead to Debt Sustainability? Yes, But Not Vice-Versa!” is that growth leads to debt sustainability in the Indian context but not necessarily vice-versa. This is because the interest rate on debt paid by the Indian government has been less than India’s growth rate by norm, not by exception. The survey also states that the Survey’s call for more active, counter-cyclical fiscal policy is a call to break the intellectual anchoring that has created an asymmetric bias against fiscal policy.
If we look at India, fiscal sustainability got importance during the late 80s, with sharp fiscal deterioration both at national as well as sub-national levels. The classic debt sustainability conditions as espoused by Evsey D. Domar (1994) stated two necessary conditions for public debt sustainability. One, nominal gross domestic product (GDP) growth rate should be greater than the growth rate of public debt. Two, Interest rate on public debt must be less than the annual growth rate of GDP. The track record of India in the first parameter is chequered. If we compare the average interest rate (interest payments in current period divided by past year’s outstanding liabilities) and GDP growth, the trend is encouraging with nominal GDP growing at a higher rate than the average interest rates, thus providing support to sustainability of debt in India, despite Indian running a primary deficit.
However, the most desirable condition is running a primary surplus and historically India has been running a primary deficit. The good thing is that despite the increasing primary deficit, the interest payments as % of GDP have stabilised after continuously rising till 2005. This year Centre’s primary deficit has seen a rapid increase.
Economy & Banking
18 UNION BUDGET 2021-22
Even though India fulfils the debt sustainability criteria to an extent, it should be remembered that off-balance sheet items are also a major expenditure and can impact the fiscal situation unless they are controlled.
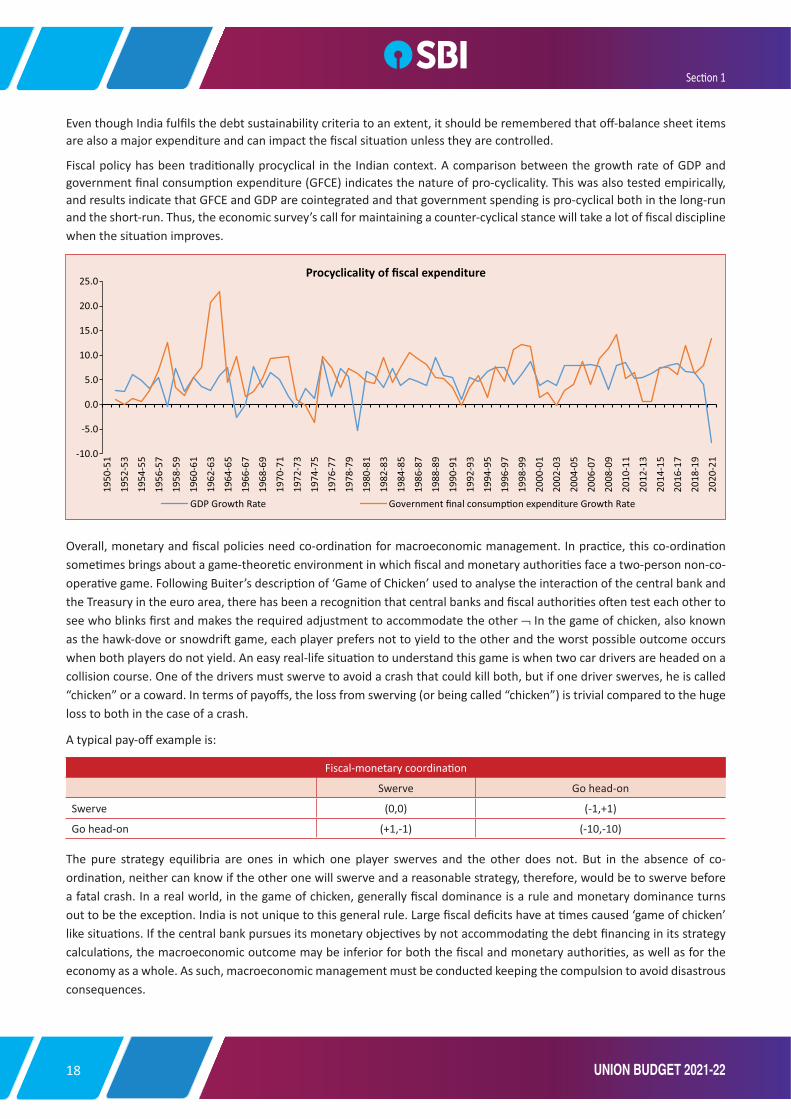
Fiscal policy has been traditionally procyclical in the Indian context. A comparison between the growth rate of GDP and government final consumption expenditure (GFCE) indicates the nature of pro-cyclicality. This was also tested empirically, and results indicate that GFCE and GDP are cointegrated and that government spending is pro-cyclical both in the long-run and the short-run. Thus, the economic survey’s call for maintaining a counter-cyclical stance will take a lot of fiscal discipline when the situation improves.
Overall, monetary and fiscal policies need co-ordination for macroeconomic management. In practice, this co-ordination sometimes brings about a game-theoretic environment in which fiscal and monetary authorities face a two-person non-co-operative game. Following Buiter’s description of ‘Game of Chicken’ used to analyse the interaction of the central bank and the Treasury in the euro area, there has been a recognition that central banks and fiscal authorities often test each other to see who blinks first and makes the required adjustment to accommodate the other ¬ In the game of chicken, also known as the hawk-dove or snowdrift game, each player prefers not to yield to the other and the worst possible outcome occurs when both players do not yield. An easy real-life situation to understand this game is when two car drivers are headed on a collision course. One of the drivers must swerve to avoid a crash that could kill both, but if one driver swerves, he is called “chicken” or a coward. In terms of payoffs, the loss from swerving (or being called “chicken”) is trivial compared to the huge loss to both in the case of a crash.
A typical pay-off example is:
Fiscal-monetary coordination
Swerve Go head-on
Swerve (0,0) (-1,+1)
Go head-on (+1,-1) (-10,-10)
The pure strategy equilibria are ones in which one player swerves and the other does not. But in the absence of co-ordination, neither can know if the other one will swerve and a reasonable strategy, therefore, would be to swerve before a fatal crash. In a real world, in the game of chicken, generally fiscal dominance is a rule and monetary dominance turns out to be the exception. India is not unique to this general rule. Large fiscal deficits have at times caused ‘game of chicken’ like situations. If the central bank pursues its monetary objectives by not accommodating the debt financing in its strategy calculations, the macroeconomic outcome may be inferior for both the fiscal and monetary authorities, as well as for the economy as a whole. As such, macroeconomic management must be conducted keeping the compulsion to avoid disastrous consequences.
Section 1

19UNION BUDGET 2021-22
HEALTH & WELLBEING
• Taking a holistic approach to Health, Budget focuses on strengthening three areas: Preventive, Curative, and Wellbeing. The Budget outlay for Health and Wellbeing at Rs 2.24 lakh crore is 137% more than the BE of FY21 (Rs 94,452 crore). This expenditure is 1.8% of GDP.
• Government announced a new centrally sponsored scheme, PM AtmaNirbhar Swasth Bharat Yojana, with an outlay of about Rs 64,180 crores over 6 years in order to develop capacities of primary, secondary, and tertiary care Health Systems, strengthen existing national institutions, and create new institutions, to cater to detection and cure of new and emerging diseases.
• To strengthen nutritional content, delivery, outreach, and outcome, Government merged the Supplementary Nutrition Programme and the Poshan Abhiyan and launched the Mission Poshan 2.0. This is an intensified strategy to improve nutritional outcomes across 112 Aspirational Districts.
• The Jal Jeevan Mission (Urban) will be launched. It aims at universal water supply in all 4,378 Urban Local Bodies with 2.86 crore household tap connections, as well as liquid waste management in 500 AMRUT cities. It will be implemented over 5 years, with an outlay of Rs 2.87 lakh crore.
• The Urban Swachh Bharat Mission 2.0 will be implemented with a total financial allocation of Rs 1,41,678 crore over a period of 5 years from 2021-2026.
HEALTH INFRASTRUCTURE IN INDIA
The above steps will give necessary fillip to the improvement of health infrastructure in India. Indian healthcare delivery system is categorised into two major components- public and private. The public healthcare system comprises limited secondary and tertiary care institutions in key cities and focuses on providing basic healthcare facilities in the form of primary healthcare centres (PHCs) in rural areas. The private sector provides majority of secondary tertiary and quaternary care institutions with a major concentrations in metros.
Medical education infrastructure in the country has shown rapid growth during the last 20 years. The country has 529 medical colleges, 313 Colleges for BDS courses and 253 colleges which conduct MDS courses. There has been a total admission of 58,756 in Medical Colleges & 26,960 in BDS and 6288 in MDS during FY19.
The Central Government Health Scheme (CGHS) was started under the Ministry of Health and Family Welfare in 1954 with the objective of providing comprehensive medical care facilities to Central Government employees, pensioners and their dependents residing in CGHS covered cities. At present, CGHS has health facilities in 37 cities having 288 Allopathic Dispensaries and 85 AYUSH Dispensaries in the country. There are 1141286 registered cards with total 3395453 number of beneficiaries.
India's Health Profile
Infr
astr
uctu
re
Medical Colleges 529Sub Centers, PHCs & CHCs 189784Total Hospitals (Govt.) 25778
of which, in Urban 4375in Rural 21403
Total Hospital Beds (Govt.) 713986of which, in Urban 448711
in Rural 265275Blood Banks 3108Eye Banks 469
Hum
an R
esou
rces
Number of Doctors 115468Dental Surgeons 254283Government Allopathic Doctors 116757Govt. Dental Surgeons 7337AYUSH Registered Practioners 799879
of which, Ayurveda 443704Homeopathy 293455
Registered Nurses 8,60,927Pharmacists 11,25,222
Heal
th F
inan
ce Public Expenditure on Health Rs 2.24 lakh crore
Per capita Public Expenditure on Health 1700Public Expenditure on Health (% of GDP) 1.80%Average Expenditure per Hospitalization (Urban) Rs 26455Average Expenditure per Hospitalization (Rural) Rs 16956
Source: SBI Research
Economy & Banking

20 UNION BUDGET 2021-22
Universal access to health care is a well-articulated goal for both global institutions and national governments. Under health related Sustainable Development Goal (SDG) No. 3 (Good Health and Well-Being), a commitment towards global effort to eradicate disease, strengthen treatment and healthcare, and address new and emerging health issues has been pronounced. Access to good health and well-being is a human right and that is why SDG offers a new chance to ensure the highest standard of heath and healthcare for all the citizens.
Public expenditure on Health, which was only 1.2% of GDP is set to increase to 1.8% of GDP in FY22. Though India has done well in managing the pandemic may be because of the herd immunity developed by the people, but the pandemic has shown that much more efforts are required by the Government to reach the goals of Universal Health Coverage and those envisioned in SDG.
States/UT Health Expenditure: Of 29 states and 2 UTs (Delhi/NCT and Puducherry) 19 have higher ratio of expenditure budgeted for Medical & Public Health & Family Welfare to total budgeted expenditure in FY21 when compared to the overall ratio for states. NCT Delhi tops the list with highest proportion of total expenditure allocated to health and public welfare, followed by Puducherry and Goa. North Eastern states of Meghalaya, Sikkim, Mizoram, Assam and Nagaland all have higher allocation to health-related expenditure in FY21. Meanwhile, certain states including Sikkim, Jharkhand, Tamil Nadu, Andhra Pradesh, Haryana and Uttarakhand have increased their expenditure on health in FY21 when compared to FY20.
General Government Health Expenditure (% of GDP, 2018)
Japan 9.21Germany 8.88United States of America 8.51France 8.26Canada 7.93United Kingdom 7.86Australia 6.41Spain 6.32Chile 4.65South Africa 4.46Greece 4.01Brazil 3.96Russian Federation 3.16China 3.02Thailand 2.89Viet Nam 2.70Mexico 2.69Malaysia 1.92India* 1.8Philippines 1.44Indonesia 1.42Bangladesh 0.40
Source: SBI Research, WHO, *FY22.
Expenditure on Medical & Public Health & Family Welfare (Ratio to Aggregate Expenditure)
State/UT FY19 FY20 (RE) FY21 (BE)NCT Delhi 11.9 11.1 11.9Puducherry 7.9 9.1 8.1Goa 6.7 7.2 7.2Meghalaya 8.8 7.1 7.1Rajasthan 5.8 6.1 6.5Assam 6.5 6.5 6.3Jammu and Kashmir 6.6 6.4 6.1Sikkim 5.9 5.5 6.1Himachal Pradesh 5.9 6.0 6.1Mizoram 6.0 5.6 5.8Chhattisgarh 5.0 5.5 5.7Jharkhand 5.2 4.3 5.3Tamil Nadu 5.1 4.8 5.3Gujarat 5.6 5.6 5.2Uttar Pradesh 4.6 5.0 5.2Nagaland 4.7 5.2 5.2Andhra Pradesh 4.5 4.3 5.2Madhya Pradesh 4.2 5.0 5.2Odisha 5.0 5.0 5.2Haryana 4.1 4.6 5.1Kerala 5.5 5.3 5.1Uttarakhand 5.2 4.7 5.1Tripura 6.7 5.3 5.1Bihar 4.7 4.7 5.0West Bengal 4.8 4.7 4.9Arunachal Pradesh 6.0 5.6 4.6Karnataka 4.4 4.1 4.3Manipur 5.1 4.9 4.3Maharashtra 4.0 4.0 4.0Punjab 3.7 3.1 3.8Telangana 4.0 3.6 3.1All States 5.0 4.9 5.1
Section 1
21UNION BUDGET 2021-22
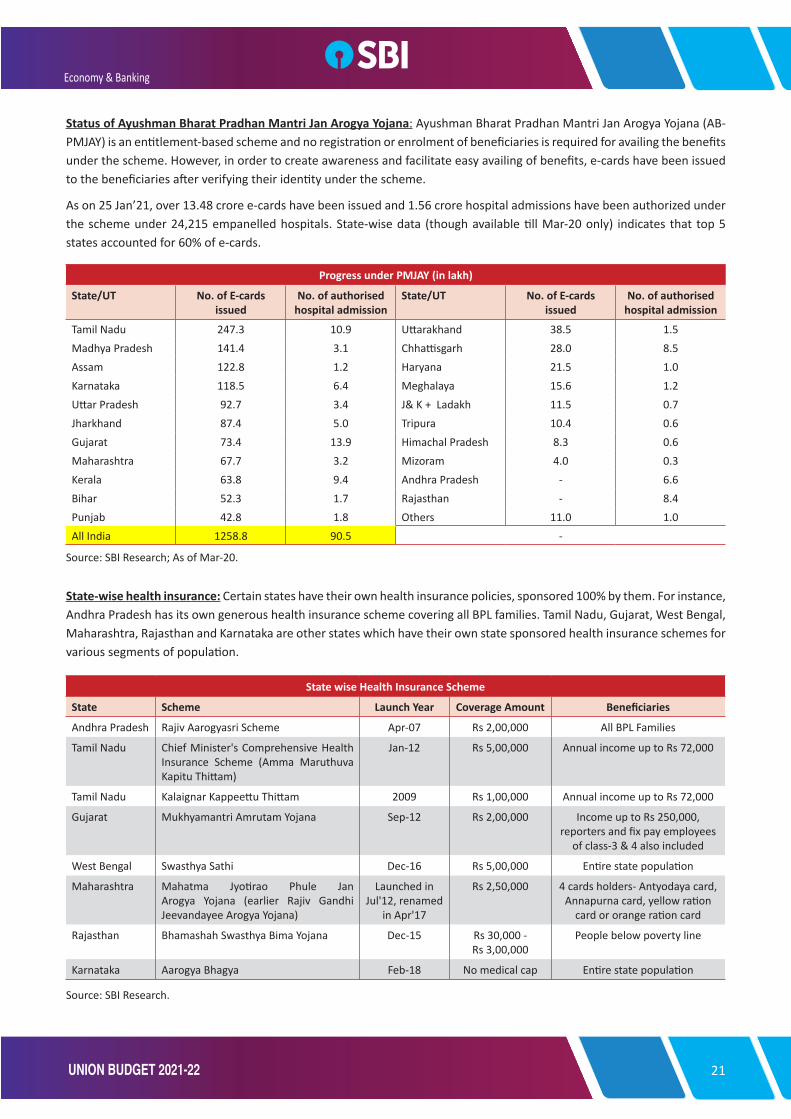
Status of Ayushman Bharat Pradhan Mantri Jan Arogya Yojana: Ayushman Bharat Pradhan Mantri Jan Arogya Yojana (AB-PMJAY) is an entitlement-based scheme and no registration or enrolment of beneficiaries is required for availing the benefits under the scheme. However, in order to create awareness and facilitate easy availing of benefits, e-cards have been issued to the beneficiaries after verifying their identity under the scheme.
As on 25 Jan’21, over 13.48 crore e-cards have been issued and 1.56 crore hospital admissions have been authorized under the scheme under 24,215 empanelled hospitals. State-wise data (though available till Mar-20 only) indicates that top 5 states accounted for 60% of e-cards.
Progress under PMJAY (in lakh)
State/UT No. of E-cards issued
No. of authorised hospital admission
State/UT No. of E-cards issued
No. of authorised hospital admission
Tamil Nadu 247.3 10.9 Uttarakhand 38.5 1.5Madhya Pradesh 141.4 3.1 Chhattisgarh 28.0 8.5Assam 122.8 1.2 Haryana 21.5 1.0Karnataka 118.5 6.4 Meghalaya 15.6 1.2Uttar Pradesh 92.7 3.4 J& K + Ladakh 11.5 0.7Jharkhand 87.4 5.0 Tripura 10.4 0.6Gujarat 73.4 13.9 Himachal Pradesh 8.3 0.6Maharashtra 67.7 3.2 Mizoram 4.0 0.3Kerala 63.8 9.4 Andhra Pradesh - 6.6Bihar 52.3 1.7 Rajasthan - 8.4Punjab 42.8 1.8 Others 11.0 1.0All India 1258.8 90.5 -
Source: SBI Research; As of Mar-20.
State-wise health insurance: Certain states have their own health insurance policies, sponsored 100% by them. For instance, Andhra Pradesh has its own generous health insurance scheme covering all BPL families. Tamil Nadu, Gujarat, West Bengal, Maharashtra, Rajasthan and Karnataka are other states which have their own state sponsored health insurance schemes for various segments of population.
State wise Health Insurance Scheme
State Scheme Launch Year Coverage Amount Beneficiaries
Andhra Pradesh Rajiv Aarogyasri Scheme Apr-07 Rs 2,00,000 All BPL Families
Tamil Nadu Chief Minister's Comprehensive Health Insurance Scheme (Amma Maruthuva Kapitu Thittam)
Jan-12 Rs 5,00,000 Annual income up to Rs 72,000
Tamil Nadu Kalaignar Kappeettu Thittam 2009 Rs 1,00,000 Annual income up to Rs 72,000
Gujarat Mukhyamantri Amrutam Yojana Sep-12 Rs 2,00,000 Income up to Rs 250,000, reporters and fix pay employees
of class-3 & 4 also included
West Bengal Swasthya Sathi Dec-16 Rs 5,00,000 Entire state population
Maharashtra Mahatma Jyotirao Phule Jan Arogya Yojana (earlier Rajiv Gandhi Jeevandayee Arogya Yojana)
Launched in Jul'12, renamed
in Apr'17
Rs 2,50,000 4 cards holders- Antyodaya card, Annapurna card, yellow ration
card or orange ration card
Rajasthan Bhamashah Swasthya Bima Yojana Dec-15 Rs 30,000 - Rs 3,00,000
People below poverty line
Karnataka Aarogya Bhagya Feb-18 No medical cap Entire state population
Source: SBI Research.
Economy & Banking
22 UNION BUDGET 2021-22
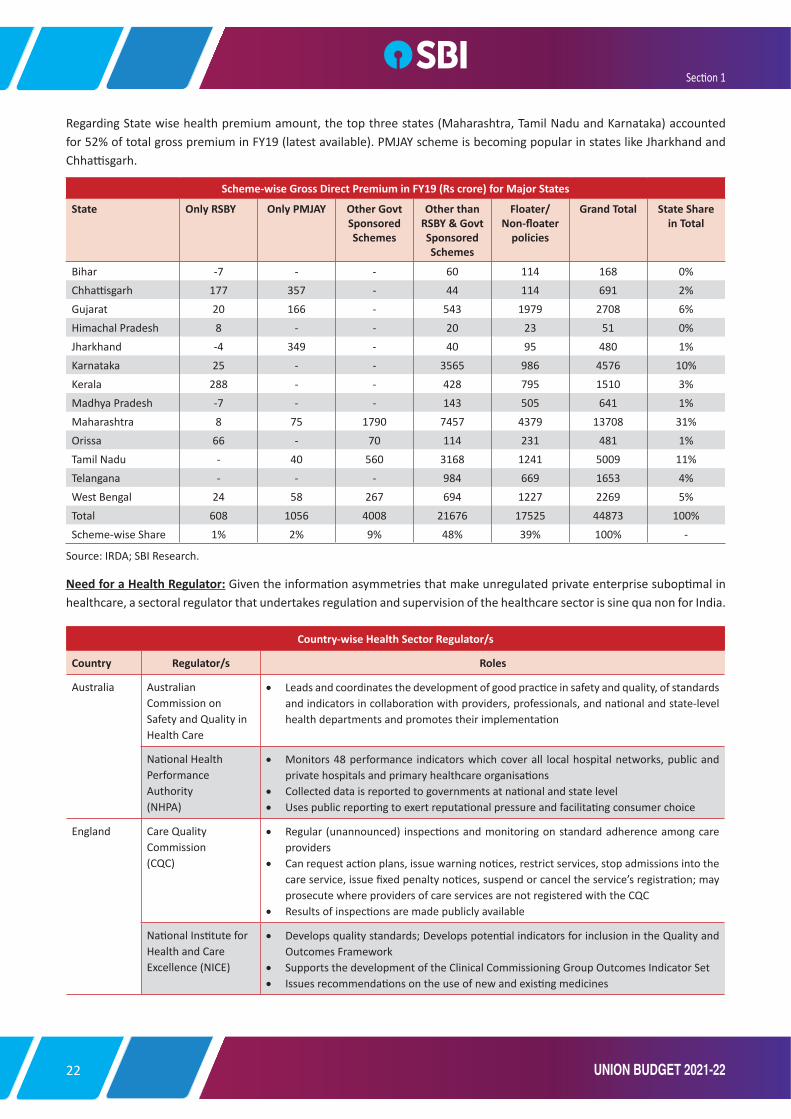
Regarding State wise health premium amount, the top three states (Maharashtra, Tamil Nadu and Karnataka) accounted for 52% of total gross premium in FY19 (latest available). PMJAY scheme is becoming popular in states like Jharkhand and Chhattisgarh.
Scheme-wise Gross Direct Premium in FY19 (Rs crore) for Major States
State Only RSBY Only PMJAY Other Govt Sponsored Schemes
Other than RSBY & Govt Sponsored Schemes
Floater/Non-floater
policies
Grand Total State Share in Total
Bihar -7 - - 60 114 168 0%Chhattisgarh 177 357 - 44 114 691 2%Gujarat 20 166 - 543 1979 2708 6%Himachal Pradesh 8 - - 20 23 51 0%Jharkhand -4 349 - 40 95 480 1%Karnataka 25 - - 3565 986 4576 10%Kerala 288 - - 428 795 1510 3%Madhya Pradesh -7 - - 143 505 641 1%Maharashtra 8 75 1790 7457 4379 13708 31%Orissa 66 - 70 114 231 481 1%Tamil Nadu - 40 560 3168 1241 5009 11%Telangana - - - 984 669 1653 4%West Bengal 24 58 267 694 1227 2269 5%Total 608 1056 4008 21676 17525 44873 100%Scheme-wise Share 1% 2% 9% 48% 39% 100% -
Source: IRDA; SBI Research.
Need for a Health Regulator: Given the information asymmetries that make unregulated private enterprise suboptimal in healthcare, a sectoral regulator that undertakes regulation and supervision of the healthcare sector is sine qua non for India.
Country-wise Health Sector Regulator/s
Country Regulator/s Roles
Australia Australian Commission onSafety and Quality in Health Care
•Leads and coordinates the development of good practice in safety and quality, of standards and indicators in collaboration with providers, professionals, and national and state-level health departments and promotes their implementation
National HealthPerformance Authority(NHPA)
•Monitors 48 performance indicators which cover all local hospital networks, public and private hospitals and primary healthcare organisations
•Collected data is reported to governments at national and state level •Uses public reporting to exert reputational pressure and facilitating consumer choice
England Care Quality Commission(CQC)
•Regular (unannounced) inspections and monitoring on standard adherence among care providers
•Can request action plans, issue warning notices, restrict services, stop admissions into the care service, issue fixed penalty notices, suspend or cancel the service’s registration; may prosecute where providers of care services are not registered with the CQC
•Results of inspections are made publicly available
National Institute for Health and CareExcellence (NICE)
•Develops quality standards; Develops potential indicators for inclusion in the Quality and Outcomes Framework
•Supports the development of the Clinical Commissioning Group Outcomes Indicator Set• Issues recommendations on the use of new and existing medicines
Section 1

23UNION BUDGET 2021-22
MSME & START-UPS
The Budget has provided Rs 15,700 crore to MSMEs. The Budget proposes certain changes to benefit MSMEs which include increasing duty on steel screws, plastic builder wares and prawn feed. It also provides for rationalizing exemption on import of duty-free items as an incentive to exporters of garments leather and handicraft items. It also provides withdrawing exemption on imports of certain kind of leather and raising custom duty on finished synthetic gemstones.
In order to incentivise setting-up of more start-ups in the country, it is proposed to extend the eligibility period to claim tax holiday for the start-ups by one more year to 31st March 2022. In order to incentivise investment in start-up, it is proposed to extend the eligibility period of claiming capital gains exemption for investment made in the start-ups by one more year to 31st Match, 2022.
BANKING, FINANCE & INSURANCE
In the last year Budget, Government had increased the deposit insurance coverage to Rs 5 lakh per depositor from Rs 1 lakh previously. In the Budget for FY22, Government has announced that in case a bank fails or withdrawals from the bank are stopped due to financial pressure on the bank, the depositors will be able to get immediate access to their deposits up to the deposit insurance amount of Rs 5 lakh the amount to which deposits are insured under the DICGC Act. This is an excellent step and will greatly help depositors in meeting immediate financial needs.
The Government is set to introduce a Development Financial Institution (DFI), for which Rs 20,000 crore will be provided to capitalise the new DFI, with an aim to have a lending portfolio of Rs 5 lakh crore in 3 years. DFIs existed in pre-liberalised period, who channelized domestic savings into infra projects with a longer loan period, say 10-15 years, and waited till a project was financially sustainable to repay, unlike traditional commercial lending that needs to
Country-wise Health Sector Regulator/s
Country Regulator/s Roles
Finland National SupervisoryAuthority for Welfare and Health (Valvira)
•Healthcare: sets standards and acts as steering body•Maintains register of healthcare professionals, supervises healthcare professionals handles
patient complaints; ensures safe and appropriate use of medical devices•Social care: governs social care facilities; handles social care complaints in collaboration
with regional agencies
Germany Joint Federal Committee (Gemeinsamer Bundesausschuss, G-BA)
•Mandated by law to carry out regulatory tasks defined by the Social Code Book V•Responsible for various areas of quality regulation of SHI (statutory health insurance)
covered medical and dental care, as well as for services provided in approved hospitals•Reporting obligations for providers include quality data for hospitals, collection of national
cross-sectoral quality data
The Netherlands
Health Care Inspectorate(Inspectie voor deGezondheidszorg, IGZ)
•Annual accountability reports•Statutory reporting duties•Sets performance indicators for patient safety and effectiveness•Criminal proceedings & disciplinary measures
USA Centers for Medicare and Medicaid services (CMS)
•CMS enforces standards through ‘conditions of participation’•Public reporting and payment reforms•Financial incentives to promote changes in practice either by changing payment formulas
or in pay-for-performance programmes•Accreditation inspections by the Joint Commission•Disqualification from receiving Medicare and Medicaid funds
Source: RAND Europe; SBI Research
Economy & Banking

24 UNION BUDGET 2021-22
be fully repaid in 3-5 years to match the ALM maturity of the banks. However, DFIs lost their importance in the post-liberalisation period and converted into banks. A new DFI aimed at providing debt financing to Greenfield infra projects will be able to divert long-term savings into much-needed capital for the infra sector.
Government proposed to setup of an asset reconstruction company (ARC) and an asset management company (AMC) to clean up NPAs in the banking sector. The AMC led resolution approach would apply to large accounts with exposure spread across multiple banks and with a potential for turnaround of stressed assets. The approach is to set up an AMC, which in partnership with an ARC takes overstressed assets from banks. The AMC then conducts operational turnaround of the asset creating value for the overall system. The AMC would be the market maker and thereby ensure healthy competition, fair price and cash recovery. Given that the governance of the AMC and its independence is central to the success, we have made suggestions to ensure the same, including keeping majority ownership in the private sector, putting together a strong and independent board, hiring a professional team from the market and linking AMC compensation to returns delivered to investors. Resolution in certain stressed assets, as for example Power and Road, changes in Government policies are required and these can be most effectively achieved by having a single window for both discussions with the Government and communication of the decision by the Government.
This approach has many benefits. With the benefit of hindsight, benefits of the “AMC/AIF structure” include a renewed focus on the long-term core operations of a good bank without the distraction of troubled assets. PSBs now have a provision coverage ratio of around 86 per cent (up from 62 per cent in FY18). This implies that the PSBs would have provided for most of the bad assets and a wholesale transfer of the bad assets to the bad bank is just a technical issue and the process of recovery and resolution could be carried out much better.
Additionally, removing troubled assets will relieve pressure on capital, enabling the institution to engage in more profitable and growth-oriented business activities including lending. Finally, removing troubled assets from the balance sheet would have a positive impact on the view of credit rating agencies, investors and potential investors, lenders, depositors and borrowers.
Recapitalisation of PSBs
• To support the growth and regulatory capital of PSBs, Government has infused Rs 2.5 lakh crore during FY17 to FY20 and provisioned Rs 20,000 crore for fresh capital infusion in FY21, out of which, so far Rs 5,500 crore has already been infused in to Punjab & Sind Bank in November 2020, to meet the regulatory capital requirement. Additionally, Government also infused capital through issue of bonds in 3 other banks namely IDBI (RS 4,557 crore), EXIM Bank (Rs 5,050 crore) and IIFCL (Rs 5,297.60 crore). For 2021-22, Government has proposed to infuse Rs 20,000 crore of capital in PSBs to further consolidate financial health of banks.
• Such capital infusion in PSBs by the Government in the last couple of years, has improved their CRARs despite the increase in risk weighted assets (RWAs). As per RBI’s preliminary estimates suggested that potential recapitalisation requirements for meeting regulatory purposes as well as for growth capital may be to the extent of 150 bps of CET I for the banking system in FY21. We believe banks might need more capital in FY22 than the provision of Rs 20,000 crore. So, PSBs may raise more resources from the market as an optimal capital raising strategy. In the last few months PSBs have raised about Rs 40,000 crore (Canara Rs 1,635 crore, PNB 3,788 crore) from the market.
The mistaken narrative on Public Sector Banks
RBI initiated in April 2015 an Asset Quality Review (AQR) to clean up bank balance sheets. Owing to that the gross NPAs increased from 4.3% in FY15 to 7.5% in FY16 and peaked at 11.2% in FY18. Interestingly, while the intent of cleaning up the banking system since 2015 was most noble and long overdue, it coincided with recognition in 2016 and recapitalisation in 2017 and when the economy was already moving into a deceleration mode. In fact, too many fundamental reforms were taken up within a short period of time with tough legal implications which rendered the economic environment uncertain for business and entrepreneurship. With more and more financial institutions coming under the scanner for financial misconduct and judgemental errors in extending credit, banks became extremely risk-averse in exploring lending
Section 1
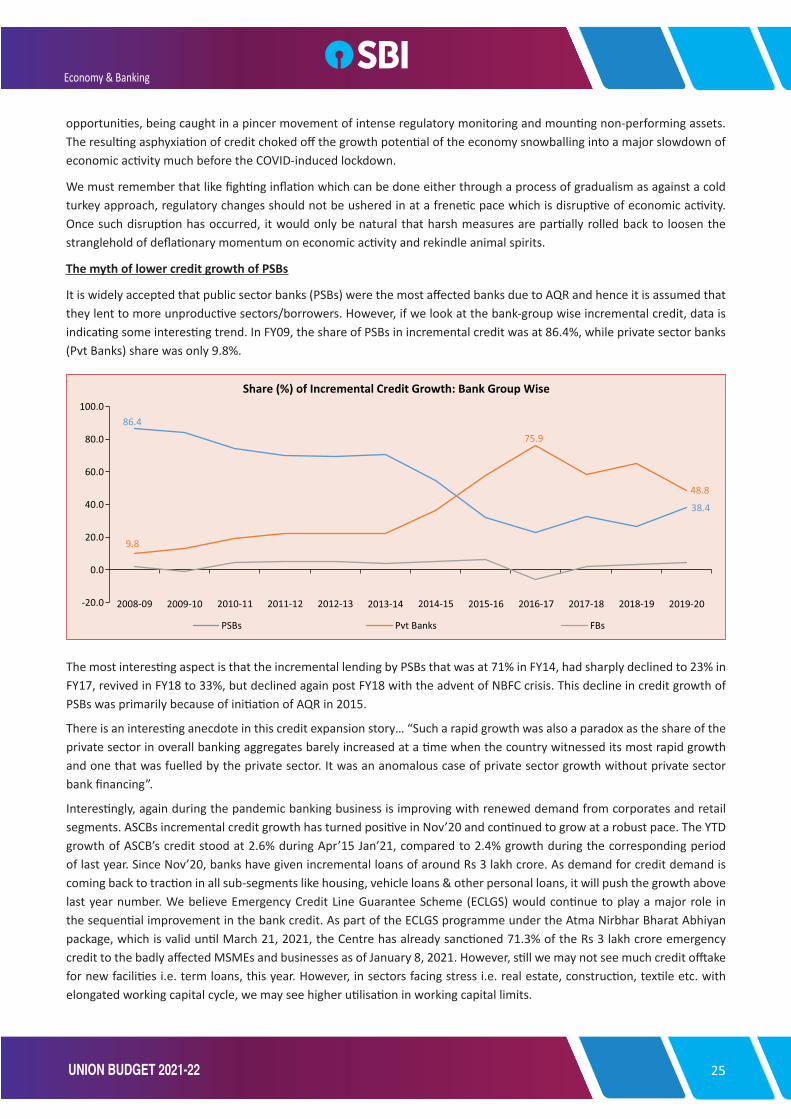
25UNION BUDGET 2021-22
opportunities, being caught in a pincer movement of intense regulatory monitoring and mounting non-performing assets. The resulting asphyxiation of credit choked off the growth potential of the economy snowballing into a major slowdown of economic activity much before the COVID-induced lockdown.
We must remember that like fighting inflation which can be done either through a process of gradualism as against a cold turkey approach, regulatory changes should not be ushered in at a frenetic pace which is disruptive of economic activity. Once such disruption has occurred, it would only be natural that harsh measures are partially rolled back to loosen the stranglehold of deflationary momentum on economic activity and rekindle animal spirits.
The myth of lower credit growth of PSBs
It is widely accepted that public sector banks (PSBs) were the most affected banks due to AQR and hence it is assumed that they lent to more unproductive sectors/borrowers. However, if we look at the bank-group wise incremental credit, data is indicating some interesting trend. In FY09, the share of PSBs in incremental credit was at 86.4%, while private sector banks (Pvt Banks) share was only 9.8%.
The most interesting aspect is that the incremental lending by PSBs that was at 71% in FY14, had sharply declined to 23% in FY17, revived in FY18 to 33%, but declined again post FY18 with the advent of NBFC crisis. This decline in credit growth of PSBs was primarily because of initiation of AQR in 2015.
There is an interesting anecdote in this credit expansion story… “Such a rapid growth was also a paradox as the share of the private sector in overall banking aggregates barely increased at a time when the country witnessed its most rapid growth and one that was fuelled by the private sector. It was an anomalous case of private sector growth without private sector bank financing”.
Interestingly, again during the pandemic banking business is improving with renewed demand from corporates and retail segments. ASCBs incremental credit growth has turned positive in Nov’20 and continued to grow at a robust pace. The YTD growth of ASCB’s credit stood at 2.6% during Apr’15 Jan’21, compared to 2.4% growth during the corresponding period of last year. Since Nov’20, banks have given incremental loans of around Rs 3 lakh crore. As demand for credit demand is coming back to traction in all sub-segments like housing, vehicle loans & other personal loans, it will push the growth above last year number. We believe Emergency Credit Line Guarantee Scheme (ECLGS) would continue to play a major role in the sequential improvement in the bank credit. As part of the ECLGS programme under the Atma Nirbhar Bharat Abhiyan package, which is valid until March 21, 2021, the Centre has already sanctioned 71.3% of the Rs 3 lakh crore emergency credit to the badly affected MSMEs and businesses as of January 8, 2021. However, still we may not see much credit offtake for new facilities i.e. term loans, this year. However, in sectors facing stress i.e. real estate, construction, textile etc. with elongated working capital cycle, we may see higher utilisation in working capital limits.
Economy & Banking
26 UNION BUDGET 2021-22
The portfolio distribution of PSBs indicates that almost 40% of lending goes to retail + agriculture sectors while 52% to Industry, trade & finance (even in the time of Covid-19 pandemic). Hence IT is incorrect to say that PSBs lending goes to unproductive sectors due to inadequate capital.
Understanding recapitalisation
Further, Economic Survey points out that the actual capital required by PSBs significantly exceeded the amount that the RBI seems to have estimated before the AQR. The total capital injected into PSBs by Government amounts to Rs 3.16 lakh crore in the last five years (2% of GDP). Further, under the first supplementary demands for grants in Sep’20, Government has earmarked Rs 20,000 crore for capital infusion in PSBs in FY21. While such capital infusion is indeed taxpayer’s money, but in US post the global crisis such capital infusion was at a staggering 10% of US GDP in a year.
FDI in Insurance
• Government has proposed to increase the FDI limit in insurance companies to 74% from the present 49%, with Indian management control. Under the new structure, majority of directors and management persons would be resident Indians with at least 50% of the directors being independent directors and a specified percentage of profits being retained as general reserve.
• In 2000, Indian insurance sector was opened for private players and several global players entered the market through joint venture with Indian peers. In the last 20 years, these companies have explored many new distribution channels, have done product innovations to boost business. However, due to the nature of this business, the sector needs more capital for growth and regulatory needs.
• The Covid-19 pandemic has shown that further penetration of insurance in India is needed, and for that capital infusion is required. However, the Indian promotors are not able to invest further capital in the sector. Further, some insurers need fresh capital infusion to meet the regulatory solvency margins. The move is need of the hour and expected to aid the sector in increasing insurance penetration in the country, which is staggering at 3.76% (Life: 2.82%, Non-life: 0.94%; 2019), compared to World average of 7.23% (Life: 3.35% and 3.88%)
• The move will give the foreign promoter an opportunity to buy more stake and grab the opportunity to tap the untapped Indian insurance market. It will also provide an impetus to the insurance industry to scale up and build more digital and infrastructure capabilities in the post pandemic era.
• However, as per the latest available data (Mar’2019), the average FDI investments in the 23 private life insurer is only 35.5%, 30% for 21 non-life private insurers and 31.7% for the 7-specialised health insurance. In our view, the increase in FDI limit in the insurance may receive Rs 5,000-6,000 crore of foreign investment in the sector in the next 1-2 years and Rs 15,000-16,000 crore in the next 5-years, apart from deeper product expertise and better underwriting skills.
• However, the question is that whether foreign investors are really interested in Indian insurance sector? If yes, then why the FDI used limit is still only at 33.8% in private insurers?
TAX PROPOSALS
In the Budget, the Government has left direct taxes unchanged, but took steps in direct tax incentives to ease compliance for taxpayers. The FM proposed making it so that advance tax liability on dividend income shall arise only after payment of dividend. The Budget also looked at pre-filled tax forms with respect to details like salary income, tax payment and TDS. Some of the major announcements are as under:
• It has been proposed that Sr. citizens (above 75) earning only pension and interest income from deposits would not be required to file ITR. This will reduce the compliance burden on senior citizens, however, the paying Bank will deduct the necessary tax on their income.
Section 1
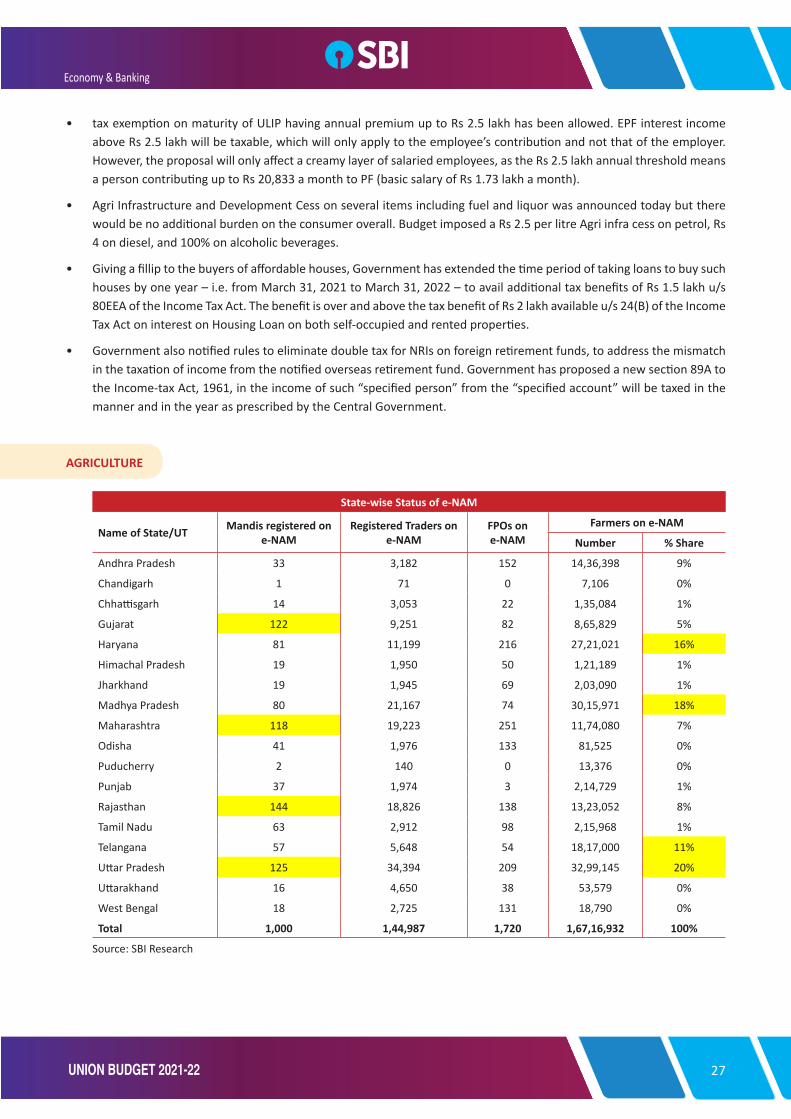
27UNION BUDGET 2021-22
• tax exemption on maturity of ULIP having annual premium up to Rs 2.5 lakh has been allowed. EPF interest income above Rs 2.5 lakh will be taxable, which will only apply to the employee’s contribution and not that of the employer. However, the proposal will only affect a creamy layer of salaried employees, as the Rs 2.5 lakh annual threshold means a person contributing up to Rs 20,833 a month to PF (basic salary of Rs 1.73 lakh a month).
• Agri Infrastructure and Development Cess on several items including fuel and liquor was announced today but there would be no additional burden on the consumer overall. Budget imposed a Rs 2.5 per litre Agri infra cess on petrol, Rs 4 on diesel, and 100% on alcoholic beverages.
• Giving a fillip to the buyers of affordable houses, Government has extended the time period of taking loans to buy such houses by one year – i.e. from March 31, 2021 to March 31, 2022 – to avail additional tax benefits of Rs 1.5 lakh u/s 80EEA of the Income Tax Act. The benefit is over and above the tax benefit of Rs 2 lakh available u/s 24(B) of the Income Tax Act on interest on Housing Loan on both self-occupied and rented properties.
• Government also notified rules to eliminate double tax for NRIs on foreign retirement funds, to address the mismatch in the taxation of income from the notified overseas retirement fund. Government has proposed a new section 89A to the Income-tax Act, 1961, in the income of such “specified person” from the “specified account” will be taxed in the manner and in the year as prescribed by the Central Government.
AGRICULTURE
State-wise Status of e-NAM
Name of State/UT Mandis registered on e-NAM
Registered Traders on e-NAM
FPOs on e-NAM
Farmers on e-NAM
Number % Share
Andhra Pradesh 33 3,182 152 14,36,398 9%
Chandigarh 1 71 0 7,106 0%
Chhattisgarh 14 3,053 22 1,35,084 1%
Gujarat 122 9,251 82 8,65,829 5%
Haryana 81 11,199 216 27,21,021 16%
Himachal Pradesh 19 1,950 50 1,21,189 1%
Jharkhand 19 1,945 69 2,03,090 1%
Madhya Pradesh 80 21,167 74 30,15,971 18%
Maharashtra 118 19,223 251 11,74,080 7%
Odisha 41 1,976 133 81,525 0%
Puducherry 2 140 0 13,376 0%
Punjab 37 1,974 3 2,14,729 1%
Rajasthan 144 18,826 138 13,23,052 8%
Tamil Nadu 63 2,912 98 2,15,968 1%
Telangana 57 5,648 54 18,17,000 11%
Uttar Pradesh 125 34,394 209 32,99,145 20%
Uttarakhand 16 4,650 38 53,579 0%
West Bengal 18 2,725 131 18,790 0%
Total 1,000 1,44,987 1,720 1,67,16,932 100%
Source: SBI Research
Economy & Banking

28 UNION BUDGET 2021-22
In a slew of steps to support the Agriculture Sector, Finance Minister has announced 9 measures for Agriculture Sector as part of inclusive development for aspirational India:
• SWAMITVA scheme to extend to all States/UTs
• Agricultural credit target enhanced to Rs 16.5 lakh crore in FY22
• 33% increase in Rural Infrastructure Development Fund from Rs 30,000 crore to Rs 40,000 crore
• Micro Irrigation Fund doubled by another Rs 5,000 crore
• Increase the scope of ‘Operation Green Scheme’ that is presently applicable to tomatoes, onions, and potatoes (TOPS), to be enlarged to include 22 perishable products
• Integrate 1,000 more mandis with e-NAM to bring transparency and competitiveness. Currently top 5 states accounted for 60% of total mandis.
• APMCs to get access to Agriculture Infrastructure Fund for augmenting their infrastructure facilities
• 5 major fishing harbours – Kochi, Chennai, Visakhapatnam, Paradip, and Petuaghat – will be developed as hubs of economic activity
• Multipurpose Seaweed Park to be established in Tamil Nadu
INFRASTRUCTURE
The Rs 111 lakh crore NIP will be in its third year and the financing of the envisaged projects will be challenging in the background of the COVID-19 pandemic. The government finances are bound to take a hit as GDP will shrink 7.8%. Despite the challenges, Government has kept the momentum going with Capex RE at Rs 4.39 lakh crore vis-à-vis Rs 4.12 lakh crore BE.
The impact of COVID-19 on infrastructure still needs to be fully ascertained given the diversity of the sector. NBFCs which fund the sector have faced challenges since the COVID-19 lockdown. A study of the distribution of TLTRO funds reveals that Infrastructure Finance Companies cornered 34.4% of the funds.
With poor demand, stress in NBFC sector and low risk appetite in mutual funds, the funding of NIP will be a major challenge in the coming years. Although the government has infused Rs 6000 crore in NIIF to create funding base for bankable projects, the requirement far outstrips supply as there will be cost/time overruns due delays caused by COVID-19 lockdown. The role of insurance and pension funds in this regard needs to be re-emphasised.
In the above context, the proposal in respect of infrastructure are analysed below (some deviation in total as pro-rata figures are taken under some head):
The major thrust for infrastructure is in three sectors roads, railways and urban transport. Allocation to health sector is much less than given the gap between the demand and supply.
The two components under financing namely the creation of DFI and asset monetization account for 6.4%. Further the DFI is expected to create a book of Rs 5.0 lakh crore over equity base of Rs 20,000 crore implying leverage of 25 or 5 times per year. This figure is less than target for NIIF which is expected to create a book of Rs 1 lakh core over equity of Rs 6000 crore in two years implying 8x expansion per year. With Government alone borrowing Rs 9.7 lakh crore it needs to be seen how will
Estimated Infrastructure Spending FY22
Rs crore % of Total
Funding infrastructure (DFI) 20,000 4.0%Asset Menonetization (Visible) 12,000 2.4%SectorsHealth 10,697 2.2%Water supply 57,400 11.6%Swachh Bharat Mission (Urban) 2.0 28,336 5.7%Roads 1,08,230 21.9%Railways 1,07,100 21.6%Metro 88,059 17.8%Power 61,197 12.4%Shipping 2,000 0.4%Total 4,95,018
Source:SBI Research, Budget documents
Section 1
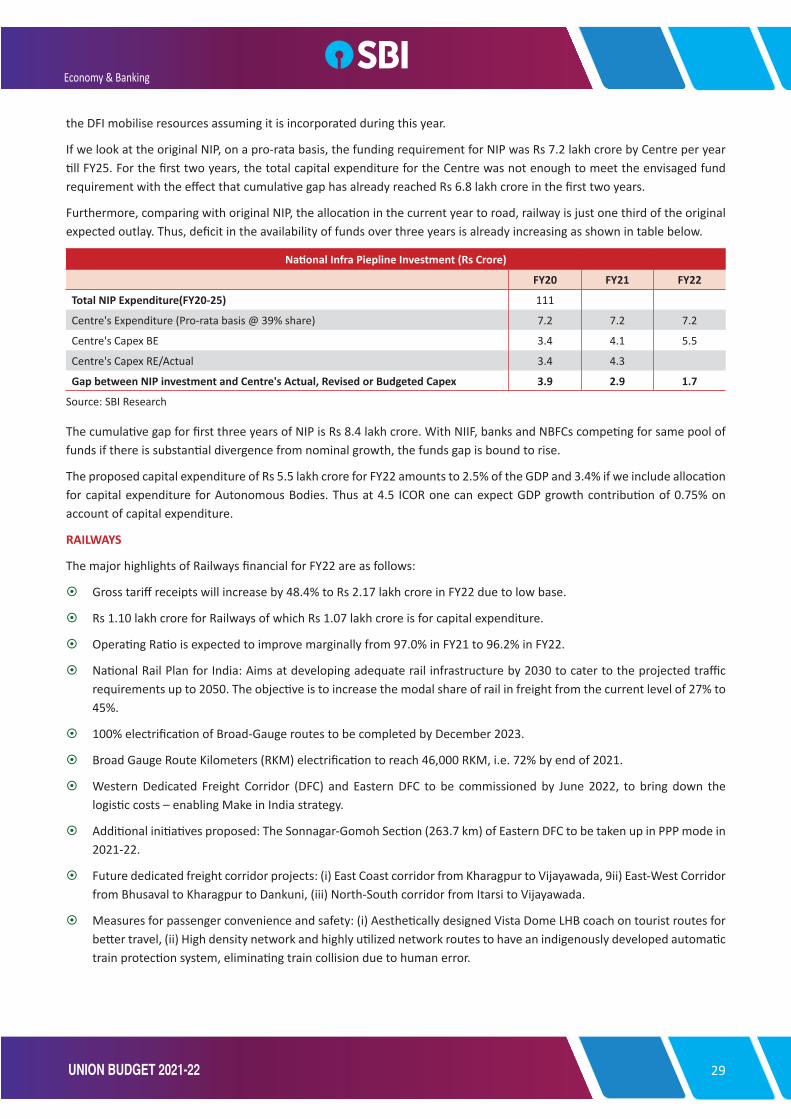
29UNION BUDGET 2021-22
the DFI mobilise resources assuming it is incorporated during this year.
If we look at the original NIP, on a pro-rata basis, the funding requirement for NIP was Rs 7.2 lakh crore by Centre per year till FY25. For the first two years, the total capital expenditure for the Centre was not enough to meet the envisaged fund requirement with the effect that cumulative gap has already reached Rs 6.8 lakh crore in the first two years.
Furthermore, comparing with original NIP, the allocation in the current year to road, railway is just one third of the original expected outlay. Thus, deficit in the availability of funds over three years is already increasing as shown in table below.
National Infra Piepline Investment (Rs Crore)
FY20 FY21 FY22
Total NIP Expenditure(FY20-25) 111
Centre's Expenditure (Pro-rata basis @ 39% share) 7.2 7.2 7.2
Centre's Capex BE 3.4 4.1 5.5
Centre's Capex RE/Actual 3.4 4.3
Gap between NIP investment and Centre's Actual, Revised or Budgeted Capex 3.9 2.9 1.7
Source: SBI Research
The cumulative gap for first three years of NIP is Rs 8.4 lakh crore. With NIIF, banks and NBFCs competing for same pool of funds if there is substantial divergence from nominal growth, the funds gap is bound to rise.
The proposed capital expenditure of Rs 5.5 lakh crore for FY22 amounts to 2.5% of the GDP and 3.4% if we include allocation for capital expenditure for Autonomous Bodies. Thus at 4.5 ICOR one can expect GDP growth contribution of 0.75% on account of capital expenditure.
RAILWAYS
The major highlights of Railways financial for FY22 are as follows:
Gross tariff receipts will increase by 48.4% to Rs 2.17 lakh crore in FY22 due to low base.
Rs 1.10 lakh crore for Railways of which Rs 1.07 lakh crore is for capital expenditure.
Operating Ratio is expected to improve marginally from 97.0% in FY21 to 96.2% in FY22.
National Rail Plan for India: Aims at developing adequate rail infrastructure by 2030 to cater to the projected traffic requirements up to 2050. The objective is to increase the modal share of rail in freight from the current level of 27% to 45%.
100% electrification of Broad-Gauge routes to be completed by December 2023.
Broad Gauge Route Kilometers (RKM) electrification to reach 46,000 RKM, i.e. 72% by end of 2021.
Western Dedicated Freight Corridor (DFC) and Eastern DFC to be commissioned by June 2022, to bring down the logistic costs – enabling Make in India strategy.
Additional initiatives proposed: The Sonnagar-Gomoh Section (263.7 km) of Eastern DFC to be taken up in PPP mode in 2021-22.
Future dedicated freight corridor projects: (i) East Coast corridor from Kharagpur to Vijayawada, 9ii) East-West Corridor from Bhusaval to Kharagpur to Dankuni, (iii) North-South corridor from Itarsi to Vijayawada.
Measures for passenger convenience and safety: (i) Aesthetically designed Vista Dome LHB coach on tourist routes for better travel, (ii) High density network and highly utilized network routes to have an indigenously developed automatic train protection system, eliminating train collision due to human error.
Economy & Banking
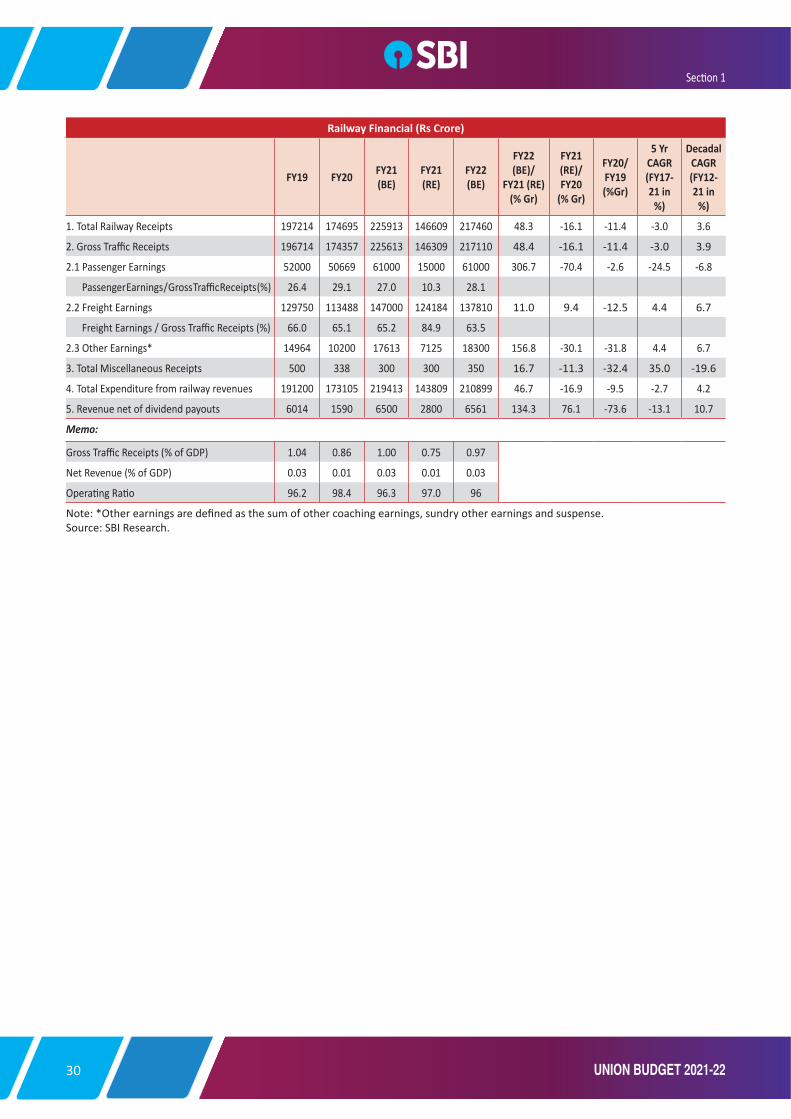
30 UNION BUDGET 2021-22
Railway Financial (Rs Crore)
FY19 FY20 FY21 (BE)
FY21 (RE)
FY22 (BE)
FY22 (BE)/
FY21 (RE) (% Gr)
FY21 (RE)/ FY20
(% Gr)
FY20/ FY19 (%Gr)
5 Yr CAGR (FY17-21 in
%)
Decadal CAGR (FY12-21 in
%)
1. Total Railway Receipts 197214 174695 225913 146609 217460 48.3 -16.1 -11.4 -3.0 3.6
2. Gross Traffic Receipts 196714 174357 225613 146309 217110 48.4 -16.1 -11.4 -3.0 3.9
2.1 Passenger Earnings 52000 50669 61000 15000 61000 306.7 -70.4 -2.6 -24.5 -6.8
Passenger Earnings / Gross Traffic Receipts (%) 26.4 29.1 27.0 10.3 28.1
2.2 Freight Earnings 129750 113488 147000 124184 137810 11.0 9.4 -12.5 4.4 6.7
Freight Earnings / Gross Traffic Receipts (%) 66.0 65.1 65.2 84.9 63.5
2.3 Other Earnings* 14964 10200 17613 7125 18300 156.8 -30.1 -31.8 4.4 6.7
3. Total Miscellaneous Receipts 500 338 300 300 350 16.7 -11.3 -32.4 35.0 -19.6
4. Total Expenditure from railway revenues 191200 173105 219413 143809 210899 46.7 -16.9 -9.5 -2.7 4.2
5. Revenue net of dividend payouts 6014 1590 6500 2800 6561 134.3 76.1 -73.6 -13.1 10.7
Memo:
Gross Traffic Receipts (% of GDP) 1.04 0.86 1.00 0.75 0.97
Net Revenue (% of GDP) 0.03 0.01 0.03 0.01 0.03
Operating Ratio 96.2 98.4 96.3 97.0 96
Note: *Other earnings are defined as the sum of other coaching earnings, sundry other earnings and suspense.Source: SBI Research.
Section 1

31UNION BUDGET 2021-22
Annexure
INDIA HAS TACKLED COVID MUCH BETTER CONSIDERING ITS POPULATION
India reached its COVID peak on 16 Sep 2020. The daily new cases have declined since then and are now moving in the range of 11,000 to 12,000, while the daily recoveries are higher than new cases. Since 4th week of March 2020, Government has taken many drastic steps to tackle the spread of COVID-19 virus in the country. It has also motivated States to save their people from infections. India has achieved several milestones in building isolation centers, special COVID-19 hospitals, free testing, door to door contact tracing etc.
To see statistically the state-wise infections, we tested a two stage least square (2-SLS) panel model with 20-major states considering the monthly data from April 2020 to January 2021. In this 2SLS regression, we first regressed the state-wise test data on population from Apr’20 to Jan’21 to gauge the number of tests that should have been done given the population difference. In Stage 2, the number of confirmed cases was regressed on estimated test numbers calculated in equation 1 to arrive at model estimate of number of cases if the tests were done in accordance with the population size.
T = α + βP µ …..(1)
C = σ + ρT + £ …..(2)
Where, T = Number of Test, P= Population, C = Confirmed Cases
Economy & Banking
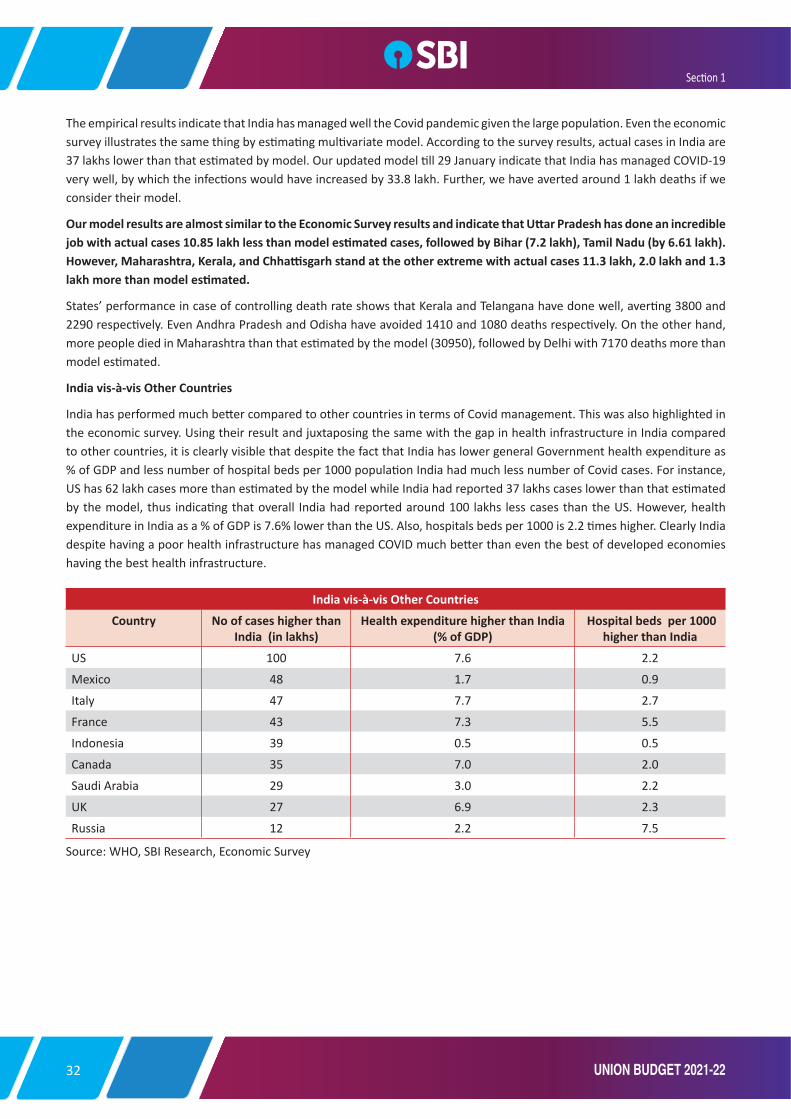
32 UNION BUDGET 2021-22
The empirical results indicate that India has managed well the Covid pandemic given the large population. Even the economic survey illustrates the same thing by estimating multivariate model. According to the survey results, actual cases in India are 37 lakhs lower than that estimated by model. Our updated model till 29 January indicate that India has managed COVID-19 very well, by which the infections would have increased by 33.8 lakh. Further, we have averted around 1 lakh deaths if we consider their model.
Our model results are almost similar to the Economic Survey results and indicate that Uttar Pradesh has done an incredible job with actual cases 10.85 lakh less than model estimated cases, followed by Bihar (7.2 lakh), Tamil Nadu (by 6.61 lakh). However, Maharashtra, Kerala, and Chhattisgarh stand at the other extreme with actual cases 11.3 lakh, 2.0 lakh and 1.3 lakh more than model estimated.
States’ performance in case of controlling death rate shows that Kerala and Telangana have done well, averting 3800 and 2290 respectively. Even Andhra Pradesh and Odisha have avoided 1410 and 1080 deaths respectively. On the other hand, more people died in Maharashtra than that estimated by the model (30950), followed by Delhi with 7170 deaths more than model estimated.
India vis-à-vis Other Countries
India has performed much better compared to other countries in terms of Covid management. This was also highlighted in the economic survey. Using their result and juxtaposing the same with the gap in health infrastructure in India compared to other countries, it is clearly visible that despite the fact that India has lower general Government health expenditure as % of GDP and less number of hospital beds per 1000 population India had much less number of Covid cases. For instance, US has 62 lakh cases more than estimated by the model while India had reported 37 lakhs cases lower than that estimated by the model, thus indicating that overall India had reported around 100 lakhs less cases than the US. However, health expenditure in India as a % of GDP is 7.6% lower than the US. Also, hospitals beds per 1000 is 2.2 times higher. Clearly India despite having a poor health infrastructure has managed COVID much better than even the best of developed economies having the best health infrastructure.
India vis-à-vis Other Countries
Country No of cases higher than India (in lakhs)
Health expenditure higher than India (% of GDP)
Hospital beds per 1000 higher than India
US 100 7.6 2.2
Mexico 48 1.7 0.9
Italy 47 7.7 2.7
France 43 7.3 5.5
Indonesia 39 0.5 0.5
Canada 35 7.0 2.0
Saudi Arabia 29 3.0 2.2
UK 27 6.9 2.3
Russia 12 2.2 7.5
Source: WHO, SBI Research, Economic Survey
Section 1
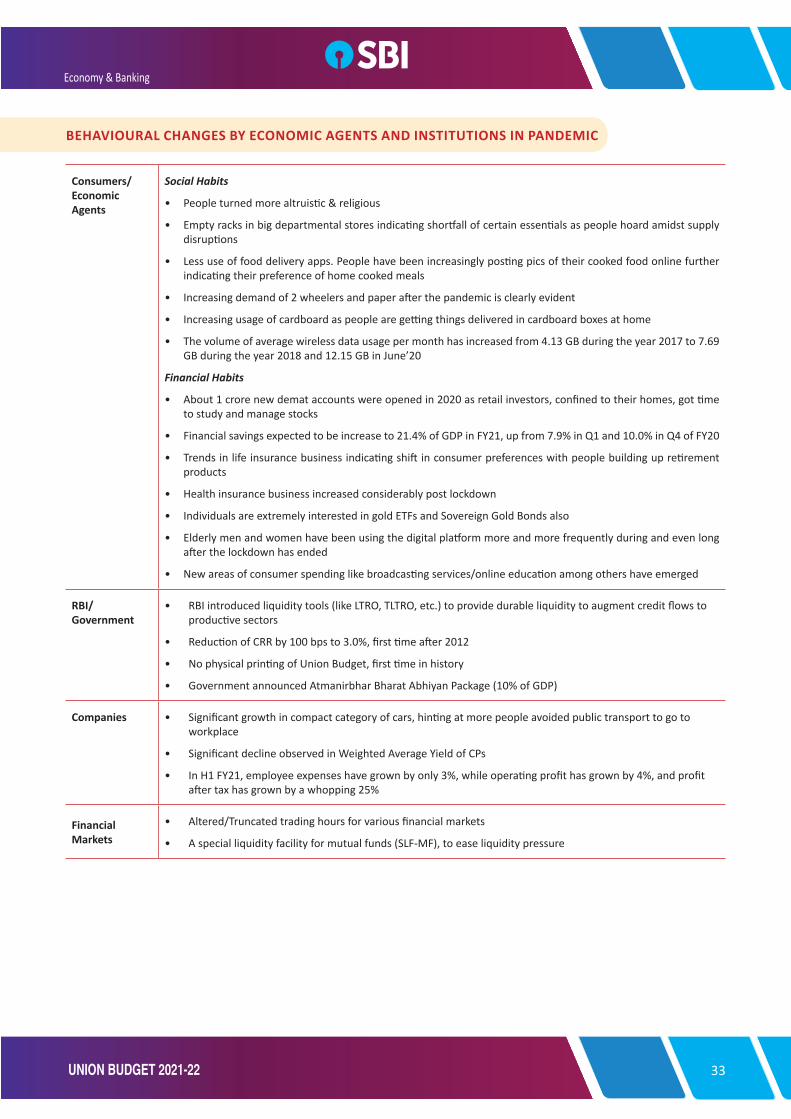
33UNION BUDGET 2021-22
BEHAVIOURAL CHANGES BY ECONOMIC AGENTS AND INSTITUTIONS IN PANDEMIC
Consumers/Economic Agents
Social Habits
• People turned more altruistic & religious
• Empty racks in big departmental stores indicating shortfall of certain essentials as people hoard amidst supply disruptions
• Less use of food delivery apps. People have been increasingly posting pics of their cooked food online further indicating their preference of home cooked meals
• Increasing demand of 2 wheelers and paper after the pandemic is clearly evident
• Increasing usage of cardboard as people are getting things delivered in cardboard boxes at home
• The volume of average wireless data usage per month has increased from 4.13 GB during the year 2017 to 7.69 GB during the year 2018 and 12.15 GB in June’20
Financial Habits
• About 1 crore new demat accounts were opened in 2020 as retail investors, confined to their homes, got time to study and manage stocks
• Financial savings expected to be increase to 21.4% of GDP in FY21, up from 7.9% in Q1 and 10.0% in Q4 of FY20
• Trends in life insurance business indicating shift in consumer preferences with people building up retirement products
• Health insurance business increased considerably post lockdown
• Individuals are extremely interested in gold ETFs and Sovereign Gold Bonds also
• Elderly men and women have been using the digital platform more and more frequently during and even long after the lockdown has ended
• New areas of consumer spending like broadcasting services/online education among others have emerged
RBI/ Government
• RBI introduced liquidity tools (like LTRO, TLTRO, etc.) to provide durable liquidity to augment credit flows to productive sectors
• Reduction of CRR by 100 bps to 3.0%, first time after 2012
• No physical printing of Union Budget, first time in history
• Government announced Atmanirbhar Bharat Abhiyan Package (10% of GDP)
Companies • Significant growth in compact category of cars, hinting at more people avoided public transport to go to workplace
• Significant decline observed in Weighted Average Yield of CPs
• In H1 FY21, employee expenses have grown by only 3%, while operating profit has grown by 4%, and profit after tax has grown by a whopping 25%
Financial Markets
• Altered/Truncated trading hours for various financial markets
• A special liquidity facility for mutual funds (SLF-MF), to ease liquidity pressure
Economy & Banking
34 UNION BUDGET 2021-22
Sect ion 2Corporate & Industry
SYNOPSIS OF BUDGET IMPACT
The Union Budget has adopted a specific target for sectors that require attention and no major changes have been introduced. The overall idea was to undertake measures that are employment intensive and encourage Production Linked Incentive (PLI) Scheme for 13 manufacturing sectors to create global champions. In order to lend fillip to PLI, change in customs duty is a major shift in terms of promoting manufacturing in India, thus creating space for global aspirants. Traditional sectors with a stronghold such as textiles, infrastructure, steel and energy have been given a measured impetus with desired impact. The PLI announced earlier for 10 key sectors, including textiles and automobiles, is to move towards becoming self-reliant and promote manufacturing and raise exports.
The increased spending on Covid 19 vaccine development, proposed at Rs 35000 crore, acknowledges the push to healthcare. The PM Atmanirbhar Swasth Bharat Yojana will be launched with a total outlay of Rs 64180 crore over a period of next 6 years. The scheme will focus on developing capacities of healthcare systems, develop institutions for detection and cure of new and emerging diseases. This push is expected to have positive effect.
In agriculture, the proposed budget outlay is of Rs 1.32 lakh crore for FY2021-22. Half of this is expected to be spent on PM-KISAN scheme. The outlay has also increased marginally in agri infrastructure and irrigation programmes. The allocation to 10 central schemes increased marginally to Rs 1.05 lakh crore (2021-22) from the revised estimate of Rs 1.03 lakh crore for the current fiscal year. All this augurs well for rural economy in terms of translating it to increase in disposable income and have a cascading effect across consumer centric sectors.
Other measures include - new proposed rules for removal of double taxation for NRIs, reduction in time period of tax assessments, advance tax liability on dividends income to be reckoned after declaration of payment of dividend. These are small but was quite meaningful measures for tax assesses.
In terms of sectors, revival of textile by setting up 7 Mega Textile Parks is likely to boost exports and leverage our expertise. Cotton and silk growers would be beneficiaries of the proposed levying of custom duty on cotton and raw silk. In steel, exempting duty on scrap for a specific period and reduction in customs duty on certain steel products would benefit MSMEs. The inverted duty structure in some cases, keeping in mind MSMEs, have been for a specific purpose where employment opportunities are likely to increase or sustain.
Promoting REITs and InVits and raising resources, through listing them on bourses, is gaining momentum. Going by the recent response and appetite for such papers, GAIL is also likely to hive off few of its revenue earning pipelines into InVits. In turn, Government would be able to monetise revenue earning assets and broaden resource raising sources. Part of the debt would also stand chance for reduction, thus improving perception and enabling future resource debt raising.
Overall, the budget has undertaken specific targets with a purpose, keeping in mind the focus on revival and aiming to benefit certain sections of the society as also traditional employment intensive sectors.

35UNION BUDGET 2021-22
KEY THEMES FOR CORPORATES UNFOLDING IN PANDEMIC
Improvement in Credit ratio (Rating upward to downward ratio)
Sector-wise rating upgrades reflects improvement in credit ratios across sectors post August’2020. Sectors such as Metal, Steel, Cement, Financials etc. have shown improvement in the ratio of 20bps or more. A comparative table of credit ratios April to July’20 and from August to December’20 is mentioned in the table below.
Sectorwise Rating Upgrade and Downgrade (select sector)
SectorApril to July 20 Aug to Dec 20
Change in U/D Ratio Rating
Upgrades Rating
Downgrades U/D ratio Rating Upgrades
Rating Downgrades U/D ratio
Capital Goods-Non Electrical Equipment 77 1098 0.07 199 1175 0.17 0.10
Construction & Engineering 44 523 0.08 95 573 0.17 0.08
Healthcare 43 160 0.27 63 173 0.36 0.10
Consumer Durables & Apparel 34 752 0.05 82 706 0.12 0.07
Textiles 27 522 0.05 53 501 0.11 0.05
Metals and Mining 13 279 0.05 69 273 0.25 0.21
Pharmaceuticals 23 80 0.29 33 97 0.34 0.05
Steel 12 232 0.05 56 224 0.25 0.20
Capital Goods - Electrical Equipment 9 131 0.07 20 120 0.17 0.10
IT 7 105 0.07 20 107 0.19 0.12
Sugar 11 20 0.55 9 22 0.41 -0.14
Auto Components and Ancillaries 7 134 0.05 12 115 0.10 0.05
Fertilizers & Agriculture chemicals 6 31 0.19 7 15 0.47 0.27
Cement 4 11 0.36 7 6 1.17 0.80
Automobiles - 8 - 1 5 0.20 0.20
Hotels Restaurants & Leisure - 84 0.00 3 113 0.03 0.03
Gems & Jewellery-Diamonds jewellery retailing - 14 0.00 5 20 0.25 0.25
Retailing 14 496 0.03 55 523 0.11 0.08
NBFC 1 47 0.02 10 48 0.21 0.19
Financials 9 89 0.10 31 99 0.31 0.21
Source: Crisil; SBI Research; U/D - upgrade to downgrades.
Improved corporate earnings – focus on cost cuttings
Corporates, in the listed space, reported improved earnings in Q2FY21, as compared to Q2FY20, post a laggard in Q1FY21 courtesy Covid-19 and its aftermaths. While analysing more than 3000 listed entities, excluding BFSI and telecom, we observed that around 11% de-growth in top line and around 7% growth in EBIDTA. PAT too grew by around 6% in Q2FY21 as compared to Q2FY20. Sectors such as Edible Oil, Packaging, FMCG, Pharma, Cement, Steel, Consumer Durable etc. reported better number in key parameters.
Early trend in Q3FY21 depicts improved earnings, from the listed entities, across parameters in many sectors. Around 500 listed companies excluding BFSI and Refineries reported revenue growth of around 10% in Q3FY21 as compared to Q3FY20. Further EBIDTA and PAT too grew by around 46% and 66% respectively in Q1FY21 as compared to same period previous year.
Out of around 500 companies reporting Q3 results under 62 sectors, we ranked each company (excluding banks and Financial Institutions) for Q3FY2021 (post pandemic) and Q3FY2020 (pre-pandemic) separately for Net Sales, EBIDTA and PAT for the said quarters and segregated them into sector-wise best performers and worst performers.
Corporate & Industry

36 UNION BUDGET 2021-22
Sectors such as, Infrastructure Developers & Operators are exhibiting narrowing of losses / improving profits. Larsen & Toubro Ltd, IRB Infrastructure Developers Ltd and Engineers India Ltd. seem to be recovering in Q3FY2021. For instance, IRB Infrastructure Developers Ltd, reported net loss of Rs 49 crore in H1FY2021 as compared to 9M FY2021 net profit of Rs 95 crore. Sectors that appear to be gaining ground during unlock 3 of pandemic include Chemicals, Non-Ferrous Metals and Mining.
Performing Sectors: Top 5 Leaders
Top 5 Sector - Growth (%) in key Parameters Q3FY21 vis-à-vis Q3FY20
Sector No of Cos.
Q3FY21 Q3FY20 Y-0-Y Growth %
Net Sales EBIDTA PAT Net
Sales EBIDTA PAT Net Sales EBIDTA PAT
IT - Software 42 99177 29504 24029 93906 24658 19455 6 20 24
Automobile 4 50866 5264 3125 41879 3713 1908 21 42 64
FMCG 15 20693 4687 3257 18000 3819 2664 15 23 22
Pharmaceuticals 28 18823 4311 2845 16158 2969 1951 16 45 46
Cement 12 18259 4016 2025 15963 2464 747 14 63 171
Source: CLine; SBI Research.
Bottom 5 Laggards
Bottom 5 Sector - Growth (%) in key Parameters Q3FY21 vis-à-vis Q3FY20
Sector No of Cos.
Q3FY21 Q3FY20 Y-0-Y Growth %
Net Sales EBIDTA PAT Net
Sales EBIDTA PAT Net Sales EBIDTA PAT
Packaging 4 597 106 66 586 78 42 2 36 56
Hotels & Restaurants 7 509 55 -6 957 259 142 -47 -79 -104
Plantation & Plantation Products 8 547 71 61 535 58 29 2 23 110
Diamond, Gems and Jewellery 6 753 50 42 586 34 18 29 44 135
Castings, Forgings & Fasteners 5 661 92 17 492 73 8 35 27 101
Source: CLine; SBI Research.
Loan Moratorium
Since the outbreak of Covid-19 pandemic businesses particularly the micro, small and medium enterprises have been hit quite hard with economies under lockdown the world over. Companies are looking at broad range of interrelated issues that span from keeping their employees and customer safe, shoring-up cash and liquidity, reorienting operations, and government support programs. Consequent upon the outbreak of COVID-19 pandemic in India, RBI had announced various measures to tackle the situation and give relief to various segments of the economy.
The RBI had initially allowed lenders to grant a loan moratorium for three months on equated monthly instalments (EMIs) falling due between March 1 and May 31, 2020. Later, it had extended this for another three months until August 31. To manage the financial stress amid the lockdown, RBI had also permitted lenders a one-time restructuring of loans without classifying these as non-performing assets.
Further, Reserve Bank of India had constituted an expert committee under the chairmanship of veteran banker K.V. Kamath to make recommendations on norms for the resolution of COVID-19 related stressed loans. Subsequently Committee had made recommendations for 26 sectors that could be factored by lending institutions, while finalizing loan resolution plans with sector specific parameters as guidance for preparation of RP for a borrower in the specified sector.
Section 2

37UNION BUDGET 2021-22
As on August 31, 2020 customers accounting for 40 per cent of outstanding bank loans availed the benefit of moratorium allowed by the Reserve Bank for borrowers affected by the COVID-19 pandemic. Most sectors reported lower outstanding loans under moratorium in August 2020 compared to April 2020. However, Micro, Small and Medium Enterprises (MSMEs) registered a marginal increase and the number of MSMEs customers availing moratorium increased to 78% in August’2020 and percentage of amount outstanding increased from 65% in April’2020 to 69.3% as on August’2020, reflecting the stress in the sector.
In financial system, improvements in soundness indictors have continued till September 2020 due to moratorium on loans till August 2020 and due to the continuing asset classification standstill.
However, India’s financial sector is riding the pandemic with positive surprise. Notably, it is now apparent that the big fear of large slippage in asset quality of banks is unfounded with Indian banks guiding at much lower credit cost than even their Asian counterparts. As far as our understanding goes, few borrowers have till date applied for restructuring and incrementally such borrowers are likely to be much lower. This is a notable climb-down from the base case scenario, and it is largely a part of efforts of the banks to redesign the banker and corporate relationship since the unveiling of AQR.
We believe, what is currently happening is that banks have been largely able to convince the corporates not to go for a restructuring given the negative externalities. Much credit should be given to RBI in this context as 6-month moratorium on interest and instalment till August resulted in surplus in the hands of borrowers and it gave confidence to the borrowers to service the debt without any restructuring. Moreover, the additional debt given as emergency funding to all the borrowers by the banks increased the liquidity in their hands that was further facilitated by significant scaling down of employee and operational costs. In some cases, it is also possible that locked up fund elsewhere was used to repay the debt.
Interestingly banks and RBI have also inculcated financial discipline much before pandemic to make the borrowers realise that timely payment of interest and instalment is necessary and any breach in that will affect their rating and pricing will be increased. Units with high leverage were advised to reduce their debt level in time bound manner.
We thus estimate only a further addition on corporate restructuring to the tune of Rs 2 lakh to Rs 2.5 lakh crore in the coming year, of which only Rs 1.5 lakh crore may slip into NPA.
Loan Moratorium Availed
Sector Corporate MSME Individual Others Total
% of total customers
% of total outstanding
% of total customers
% of total outstanding
% of total customers
% of total outstanding
% of total customers
% of total outstanding
% of total customers
% of total outstanding
as on April 30, 2020
NBFCs 39.7 56.2 60.7 61.1 32.5 45.9 37.3 41.4 29 49
SCBs 24.7 39.1 43.1 65.3 52.1 56.2 45.7 55.7 55.1 50
System 30.8 41.9 45.8 65 50.4 55.3 45.7 54.6 48.6 50.1
as on Aug 31, 2020
NBFCs 42.7 37.2 68.8 67 23.1 56.5 50.2 33.2 26.6 44.9
SCBs 18 30.4 77.2 68.1 43.7 33.9 35.6 39.1 43.8 37.9
System 31.3 34.3 77.5 69.3 42.6 41 45.4 42.1 45.6 40.4
Change in Aug'20 over April'20
NBFCs 3 -19 8.1 5.9 -9.4 10.6 12.9 -8.2 -2.4 -4.1
SCBs -6.7 -8.7 34.1 2.8 -8.4 -22.3 -10.1 -16.6 -11.3 -12.1
System 0.5 -7.6 31.7 4.3 -7.8 -14.3 -0.3 -12.5 -3 -9.7
Source: RBI; SBI Research.
Corporate & Industry

38 UNION BUDGET 2021-22
Corporate Insolvency Resolution Processs (CIRP)
Quarter
No. of CIRPs at the beginning of the Quarter
Admitted
Closure by No. of Corporates undergoing
Resolution at the end of the Qtr.
Appeal / Review
Withdrawal under
section 12A
Approval of Resolution
Plan
Commencement of Liquidation
2016-17 - 37 1 - - - 36
2017-18 36 705 89 - 20 91 541
2018-19 541 1152 141 95 80 306 1071
Apr-June, 2019 1071 301 45 31 26 96 1174
July-Sept, 2019 1174 588 46 43 33 155 1485
Oct-Dec, 2019 1485 623 71 43 40 150 1804
Jan-Mar, 2020 1804 441 62 46 36 135 1966
Apr-June, 2020 1966 81 7 21 20 25 1974
July-Sept, 2020 1974 80 10 12 22 68 1942
Total NA 4008 472 291 277 1026 2108
Source: IBBI, Data compiled from details available on NCLT Website; SBI Research.
As at the end of Q2FY2021, the number of CIRPs admitted since the inception of the Insolvency and Bankruptcy Code (IBC) stood at 4008. There was a sharp decline in the number of CIRPs during Q1 and Q2FY2021 as compared to previous quarters, owing to temporary suspension of the process, in the wake of the pandemic situation.
Section 2

39UNION BUDGET 2021-22
Budget Proposals and Impact
Exempting duty on steel scrap for a specific period and reduction in customs duty on certain steel products uniformly to 7.50% would help MSMEs in catering to local demand. Collateral free loans and setting up of Fund of Fund is proposed to be set up is aimed at benefitting MSMEs.
Further outlay on infrastructure, railway, healthcare, building mega textile parks, increase in defence capital expenditure etc. is likely to benefit steel sector, since these are linked intricately to the infrastructure sector. This Budget provides a record sum of Rs 110055 crore for Railways of which Rs 107100 crore for capital expenditure and Rs 118101 Lakh crore allocation to MoRTH of which an amount of Rs 108230 crore is for capital, highest ever.
Indirect benefit from infra spending is likely to benefit both the cement and the steel companies. Incremental infrastructure spending is likely to trickle from promoting REITs and Infrastructure InVits. The listing of REITs and InVits would help government entities monetise its revenue earning road assets, pipelines, airports etc thus, raising resources from the market and undertake incremental infrastructure after reducing part of the debt.
Backdrop
India’s finished steel consumption grew at a CAGR of 5.2% during FY16-FY20 to reach 100 MT. In FY20P, India produced 102.06 million tonnes (MT) and 109.22 MT of finished steel and crude steel, respectively. Exports and imports of finished steel stood at 8.36 MT and 6.77 MT, respectively, in FY20P.
The Government has taken various steps to boost the sector including the introduction of National Steel Policy 2017 and allowing 100 per cent Foreign Direct Investment (FDI) in the steel sector under the automatic route. Government has approved the National Steel Policy (NSP) 2017, as it seeks to create a globally competitive steel industry in India. NSP 2017 envisages 300 million tonnes (MT) steel-making capacity and 160 kgs per capita steel consumption by 2030-31.
Performance of Indian Steel industry
Category April-Mar (2019-20)*
(mt)
April-Mar (2018-19)
(mt)% change April-Oct
2020 * (mt)April-Oct 2019(mt) % change
Crude Steel Production 109.22 110.92 -1.5 52.84 63.98 -17.4
Hot Metal Production 73.01 74.38 -1.8 36.42 42.52 -14.4
Pig Iron Production 5.51 6.41 -14.1 2.431 3.416 -28.8
Sponge Iron Production 37.14 34.71 7.0 17.699 21.347 -17.1
Total Finished Steel (alloys/stainless + non alloys)
Production 102.06 101.29 0.8 47.23 59.94 -21.2
Import 6.77 7.84 -13.6 2.35 4.65 -49.5
Export 8.36 6.36 31.3 7.10 4.89 45.3
Conumprion 100.07 98.71 1.4 44.76 59.82 -25.2
Source: JPC; * provisional; mt = million tonnes
At 47.23 mt, production of total finished steel declined by 21.2% in April-October 2020. Contribution of the non-alloy steel segment stood at 44.899 mt (down by 21%), while the rest was the contribution of the alloy steel segment (including stainless steel).
Overall exports of total finished steel (7.10 mt) were up by 43.5% and India was a net exporter for this period (April-Oct). Contribution of the non-alloy steel segment stood at 6.625 mt (up by 49%), while the rest was the contribution of the alloy steel segment (including stainless steel). Volume-wise, non-alloy HRC (4.78 mt, up by 66.1%) was the most exported item (72% share in total non-alloy). China (28% share) was the largest export market (1.989 mt) for India.
OVERALL IMPACT : POSITIVE SECTOR : IRON & STEEL
Corporate & Industry
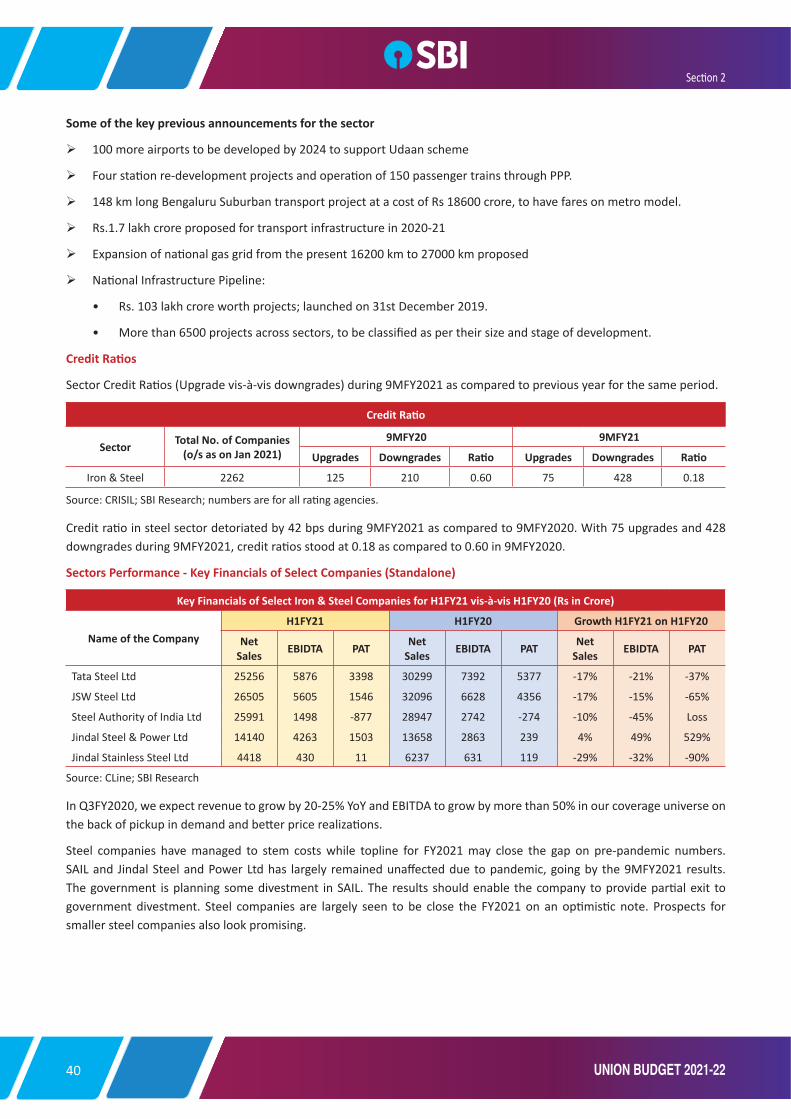
40 UNION BUDGET 2021-22
Some of the key previous announcements for the sector
100 more airports to be developed by 2024 to support Udaan scheme
Four station re-development projects and operation of 150 passenger trains through PPP.
148 km long Bengaluru Suburban transport project at a cost of Rs 18600 crore, to have fares on metro model.
Rs.1.7 lakh crore proposed for transport infrastructure in 2020-21
Expansion of national gas grid from the present 16200 km to 27000 km proposed
National Infrastructure Pipeline:
• Rs. 103 lakh crore worth projects; launched on 31st December 2019.
• More than 6500 projects across sectors, to be classified as per their size and stage of development.
Credit Ratios
Sector Credit Ratios (Upgrade vis-à-vis downgrades) during 9MFY2021 as compared to previous year for the same period.
Credit Ratio
Sector Total No. of Companies (o/s as on Jan 2021)
9MFY20 9MFY21
Upgrades Downgrades Ratio Upgrades Downgrades Ratio
Iron & Steel 2262 125 210 0.60 75 428 0.18
Source: CRISIL; SBI Research; numbers are for all rating agencies.
Credit ratio in steel sector detoriated by 42 bps during 9MFY2021 as compared to 9MFY2020. With 75 upgrades and 428 downgrades during 9MFY2021, credit ratios stood at 0.18 as compared to 0.60 in 9MFY2020.
Sectors Performance - Key Financials of Select Companies (Standalone)
Key Financials of Select Iron & Steel Companies for H1FY21 vis-à-vis H1FY20 (Rs in Crore)
Name of the CompanyH1FY21 H1FY20 Growth H1FY21 on H1FY20
Net Sales EBIDTA PAT Net
Sales EBIDTA PAT Net Sales EBIDTA PAT
Tata Steel Ltd 25256 5876 3398 30299 7392 5377 -17% -21% -37%
JSW Steel Ltd 26505 5605 1546 32096 6628 4356 -17% -15% -65%
Steel Authority of India Ltd 25991 1498 -877 28947 2742 -274 -10% -45% Loss
Jindal Steel & Power Ltd 14140 4263 1503 13658 2863 239 4% 49% 529%
Jindal Stainless Steel Ltd 4418 430 11 6237 631 119 -29% -32% -90%
Source: CLine; SBI Research
In Q3FY2020, we expect revenue to grow by 20-25% YoY and EBITDA to grow by more than 50% in our coverage universe on the back of pickup in demand and better price realizations.
Steel companies have managed to stem costs while topline for FY2021 may close the gap on pre-pandemic numbers. SAIL and Jindal Steel and Power Ltd has largely remained unaffected due to pandemic, going by the 9MFY2021 results. The government is planning some divestment in SAIL. The results should enable the company to provide partial exit to government divestment. Steel companies are largely seen to be close the FY2021 on an optimistic note. Prospects for smaller steel companies also look promising.
Section 2

41UNION BUDGET 2021-22
Market Reaction
Market Movement from Previous Budget (1st Feb'20) and on Budget Day (1st Feb'21)
Sector - Iron & Steel Name of the Companies 01-Feb-20 29-Jan-21 1-Feb-21
Movement Over 01-Feb-20 Movement on Budget Day
Price % Price %
Tata Steel Ltd 423.8 601.00 636.1 212.30 50.09% 35.10 5.84%
JSW Steel Ltd 244.75 366.85 380.85 136.10 55.61% 14.00 3.82%
Steel Authority of India Ltd 44.5 57.65 63.6 19.10 42.92% 5.95 10.32%
Jindal Steel & Power Ltd 167.15 261.75 277.5 110.35 66.02% 15.75 6.02%
Jindal Stainless Steel Ltd 39 81.20 74.15 35.15 90.13% -7.05 -8.68%
Source: NSE; closing price as on date
Corporate & Industry
42 UNION BUDGET 2021-22
Budget Proposals and Impact
The overall market pie for the sector is likely to expand. The setting up of new Development Financial Institution with a capital of Rs 20000 crore would enable infrastructure and construction companies to avail long term funds, a long-standing demand. Currently, there are two government backed platforms supporting the sector -- National Investment and Infrastructure Fund (NIIF) and India Infrastructure Finance Corporation Ltd (IIFCL). Five years ago, NIIF was created as a quasi-sovereign wealth fund. It is like an alternative investment fund owned 49 percent by government while balance is held by banks and international investors. In last 5 years, NIIF mobilised funds close to $4.50 bn. The focus of NIIF currently, is only on select assets like transportation and energy. The Fund operates as a private equity and also invests in funds managed by others.
IIFCL, on the other hand, is 15-year-old deposit taking NBFC, which is wholly owned by the government. IIFCL has a loan book of Rs 1.50 lakh crore with 25% NPAs. The loan exposure of IIFCL is also concentrated in two sectors viz. - Power and Roads. The fund is solely dependent on government for equity support. It remains to be seen what will be role of existing NBFC such PFC, Institution such as IFCI, IIFCL etc. and whether they would be subsumed under new Development Financial Institution. Upfront capitalisation with Rs 20000 crore by way of infusion would lend confidence to would be International Investors.
In real estate, no major measure was announced, except for continuance in tax holiday in affordable housing, as a priority focus. The Ministry of Housing and Urban Affairs has been proposed a grant of Rs 54581 crore in the Budget.
In roads, the proposed budget allocation of Rs 1.18 trn for Ministry of Road Transport & Highways is likely to maintain the growth momentum. The budget announcement of a mega national highway project in Tamil Nadu, West Bengal, Assam and Kerala with the proposed allocation of Rs 2.27 trn spread over three years. In Tamil Nadu, the proposed national highways of 3500 kms would entail cost of Rs 1.03 trn; Kerala (1100 kms for Rs 65000 crore); West Bengal (675 kms for Rs 25000 crore) and Assam (Rs 34000 crore) – all spread over three years. Going by the recent Q3 FY2021 results, the companies are yet to exhibit positive trend. While, the order books may be good, translating that to profits appears distant.
Backdrop
Developing India’s infrastructure is vital to achieving the target of making the country a USD 5tn economy by FY2025. A total investment of Rs 111 trillion will be required between FY2020 and FY2025 for projects whose realisation will be critical for India to become a USD 5trn economy by FY2025 and construction in key beneficiary to this. As of October 2020, some 40% of the projects comprised in the total investment of Rs 111 trillion, are under implementation, some 30% are at the conceptual stage, 20% are under development, and 10% are unclassified.
Some of the key announcements in previous budget for the sector
Rs 100 lakh crore to be invested on infrastructure over the next 5 years
• National Infrastructure Pipeline:
o Rs. 103 lakh crore worth projects; launched on 31st December 2019.
o More than 6500 projects across sectors, to be classified as per their size and stage of development.
100 more airports to be developed by 2024 to support Udaan scheme
Four station re-development projects and operation of 150 passenger trains through PPP.
148 km long Bengaluru Suburban transport project at a cost of Rs 18600 crore, to have fares on metro model.
Rs 1.7 lakh crore proposed for transport infrastructure in 2020-21
Expansion of national gas grid from the present 16200 km to 27000 km proposed
Corporate & Industry
SECTOR : CONSTRUCTION OVERALL IMPACT: MARGINALLY POSITIVE
Section 2

43UNION BUDGET 2021-22
Credit Ratios
Sector Credit Ratios (Upgrade vis-à-vis downgrades) during 9MFY2021 as compared to previous year for the same period
Credit Ratio
Sector Total No. of Companies (o/s as on Jan 2021)
9MFY20 9MFY21
Upgrades Downgrades Ratio Upgrades Downgrades Ratio
Constructions 4384 181 666 0.27 147 1042 0.14
Source: CRISIL; SBI Research; numbers are for all rating agencies; Constructions & Engineering
With upgrades of 147 and downgrades of 1042 during 9MFY2021, credit ratio detoriated by 13 bps to 0.14 from 0.27 for 9MFY2020.
Sectors Performance - Key Financials of Select Companies (Standalone)
Key Financials of Select Constructions Companies for H1FY21 vis-à-vis H1FY20 (Rs in Crore)
Name of the CompanyH1FY21 H1FY20 Growth H1FY21 on H1FY20
Net Sales EBIDTA PAT Net Sales EBIDTA PAT Net Sales EBIDTA PAT
Larsen & Toubro Ltd 23942 -1006 7023 35245 2753 3178 -32% Negative 121%
Rail Vikas Nigam Ltd 6093 306 316 6611 362 395 -8% -15% -20%
Dilip Buildcon Ltd 3817 606 81 4103 739 183 -7% -18% -56%
NCC Ltd 2720 325 75 3920 483 161 -31% -33% -53%
PNC Infratech Ltd 1959 262 129 2502 437 307 -22% -40% -58%
Source: CLine; SBI Research
Initial trend Q3FY21 - The sector is coping with pandemic after affects. Most of the companies declared their results are struggling to make a comeback, but it would be a while for them to reach pre-pandemic levels. Initial trend, as reported by 12 companies, shows sector reporting negative growth in both revenue and profit.
Market Reaction
Market Movement from Previous Budget (1st Feb'20) and on Budget Day (1st Feb'21)
Sector - Construction Name of the Companies 01-Feb-20 29-Jan-21 1-Feb-21
Movement Over 01-Feb-20 Movement on Budget Day
Price % Price %
Larsen & Toubro Ltd 1287.40 1334.70 1448.85 161.5 12.54% 114.2 8.55%
Rail Vikas Nigam Ltd 24.90 31.30 30.30 5.4 21.69% -1.0 -3.19%
Dilip Buildcon Ltd 393.00 422.90 440.60 47.6 12.11% 17.7 4.19%
NCC Ltd 50.90 58.95 67.05 16.2 31.73% 8.1 13.74%
PNC Infratech Ltd 191.85 189.35 196.75 4.9 2.55% 7.4 3.91%
NIFTY INFRA INDEX 3,155.30 3,671.85 3,853.40 698.1 22.12% 181.6 4.94%
Source: NSE; closing price as on date
Section 2Corporate & Industry
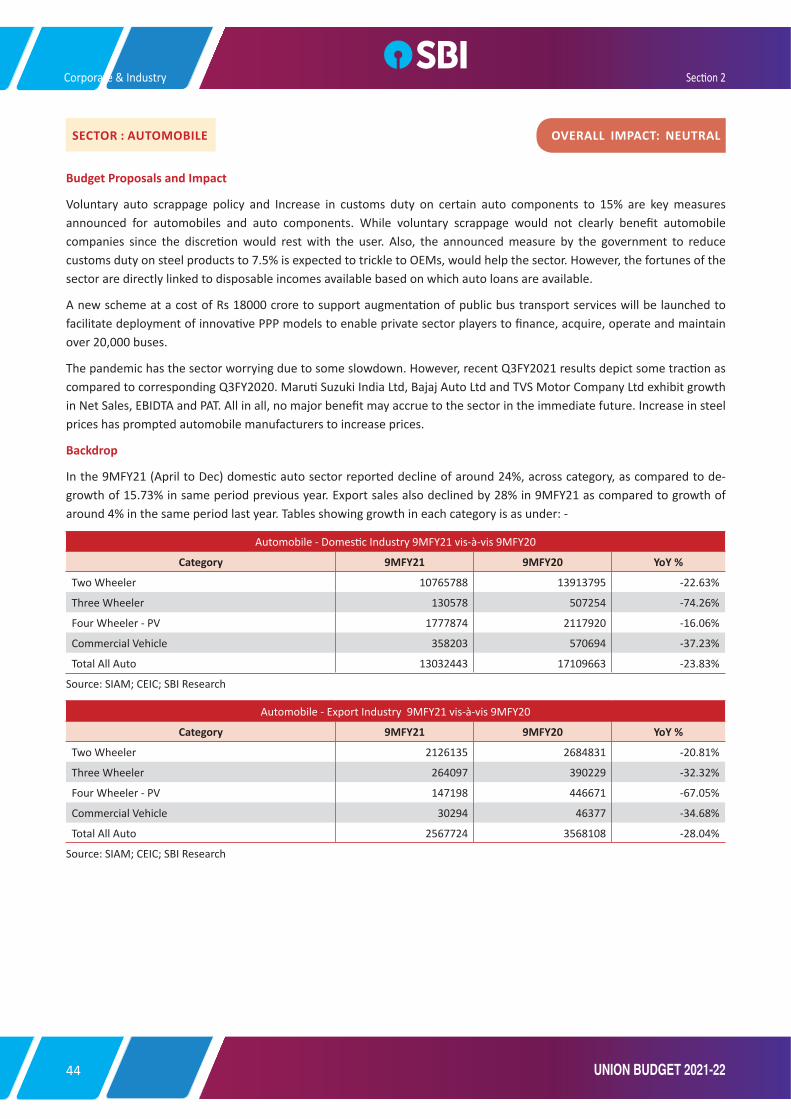
44 UNION BUDGET 2021-22
Budget Proposals and Impact
Voluntary auto scrappage policy and Increase in customs duty on certain auto components to 15% are key measures announced for automobiles and auto components. While voluntary scrappage would not clearly benefit automobile companies since the discretion would rest with the user. Also, the announced measure by the government to reduce customs duty on steel products to 7.5% is expected to trickle to OEMs, would help the sector. However, the fortunes of the sector are directly linked to disposable incomes available based on which auto loans are available.
A new scheme at a cost of Rs 18000 crore to support augmentation of public bus transport services will be launched to facilitate deployment of innovative PPP models to enable private sector players to finance, acquire, operate and maintain over 20,000 buses.
The pandemic has the sector worrying due to some slowdown. However, recent Q3FY2021 results depict some traction as compared to corresponding Q3FY2020. Maruti Suzuki India Ltd, Bajaj Auto Ltd and TVS Motor Company Ltd exhibit growth in Net Sales, EBIDTA and PAT. All in all, no major benefit may accrue to the sector in the immediate future. Increase in steel prices has prompted automobile manufacturers to increase prices.
Backdrop
In the 9MFY21 (April to Dec) domestic auto sector reported decline of around 24%, across category, as compared to de-growth of 15.73% in same period previous year. Export sales also declined by 28% in 9MFY21 as compared to growth of around 4% in the same period last year. Tables showing growth in each category is as under: -
Automobile - Domestic Industry 9MFY21 vis-à-vis 9MFY20
Category 9MFY21 9MFY20 YoY %
Two Wheeler 10765788 13913795 -22.63%
Three Wheeler 130578 507254 -74.26%
Four Wheeler - PV 1777874 2117920 -16.06%
Commercial Vehicle 358203 570694 -37.23%
Total All Auto 13032443 17109663 -23.83%
Source: SIAM; CEIC; SBI Research
Automobile - Export Industry 9MFY21 vis-à-vis 9MFY20
Category 9MFY21 9MFY20 YoY %
Two Wheeler 2126135 2684831 -20.81%
Three Wheeler 264097 390229 -32.32%
Four Wheeler - PV 147198 446671 -67.05%
Commercial Vehicle 30294 46377 -34.68%
Total All Auto 2567724 3568108 -28.04%
Source: SIAM; CEIC; SBI Research
Corporate & Industry
SECTOR : AUTOMOBILE OVERALL IMPACT: NEUTRAL
Section 2

45UNION BUDGET 2021-22
Credit Ratios
Sector Credit Ratios (Upgrade vis-à-vis downgrades) during 9MFY21 (April’2020 to Dec’2020) as compared to previous year for the same period is as under:
Credit Ratio
Sector Total No. of Companies (o/s as on Jan 2021)
9MFY20 9MFY21
Upgrades Downgrades Ratio Upgrades Downgrades Ratio
Automobile 63 1 4 0.25 1 13 0.08
Source: CRISIL; SBI Research; numbers are for all rating agencies.
Credit ratios for the sector deteriorated further to 0.08 in 9MFY2021 as compared to 0.25 in 9MFY2020. The ratio reflects weakness in across the sector on the back of Covid-19 and its subsequent impact.
Sectors Performance - Key Financials of Select Companies (Standalone)
Key Financials of Select Automobile Companies for H1FY21 vis-à-vis H1FY20 (Rs in Crore)
Name of the CompanyH1FY21 H1FY20 Growth H1FY21 on H1FY20
Net Sales EBIDTA PAT Net Sales EBIDTA PAT Net Sales EBIDTA PAT
Tata Motors Ltd 12225 -821 -3403 23164 312 -1379 -47% Negative Loss
Maruti Suzuki India Ltd 21367 1128 1122 34856 3654 2794 -39% -69% -60%
Mahindra & Mahindra Ltd 17313 1354 189 23999 3014 3526 -28% -55% -95%
Hero Motocorp Ltd 12339 1394 1015 15601 2199 2132 -21% -37% -52%
Ashok Leyland Ltd 3467 -256 -535 9480 681 269 -63% Negative PTL
Bajaj Auto Ltd 9990 1675 1666 15064 2476 2528 -33.7% -32% -34%
Source: CLine; SBI Research
All major players, across sector, reported negative growth in top line and operating income during H1FY2021 as compared to H1FY2020. However, company reported better sales number in Q3FY2021 backed by demand in two wheelers and passenger vehicles.
Initial trend in Q3FY2021 - The automobile sector was the worst affected during the pandemic, but growth is picking up and reaching pre-pandemic levels. If one were to compare 9MFY2021 with 9MFY2020, the numbers depict de-growth. However, Q3FY2021 results when compared to Q3FY2020 exhibit the gap in growth is being plugged when compared with 9M corresponding results. Except Tata Motors, all the companies exhibit growth.
Market Reaction
Market Movement from Previous Budget (1st Feb'20) and on Budget Day (1st Feb'21)
Sector - Automobile Name of the Companies 01-Feb-20 29-Jan-21 1-Feb-21
Movement Over 01-Feb-20 Movement on Budget Day
Price % Price %
Tata Motors Ltd 165.60 262.70 279.60 114.0 68.84% 16.90 6.43%
Maruti Suzuki India Ltd 6812.65 7206.65 7399.80 587.2 8.62% 193.15 2.68%
Mahindra & Mahindra Ltd 545.20 749.60 795.15 250.0 45.85% 45.55 6.08%
Hero Motocorp Ltd 2446.90 3256.05 3340.65 893.8 36.53% 84.60 2.60%
Ashok Leyland Ltd 77.15 110.80 122.05 44.9 58.20% 11.25 10.15%
Bajaj Auto Ltd 3143.30 4005.80 4114.70 971.4 30.90% 108.90 2.72%
NIFTY AUTO INDEX 7,880.30 9,813.15 10,227.95 2347.7 29.79% 414.8 4.23%
Source: NSE; closing price as on date
Section 2Corporate & Industry
46 UNION BUDGET 2021-22
Budget Proposals and Impact
In case of cement, no specific measures have been announced, but budget outlay on infrastructure, railway, healthcare, building mega textile parks, increase in defence capital expenditure etc. is likely to benefit cement and steel, since they are quite linked intricately to the infrastructure sector.
Budget provides a record sum of Rs 110055 crore for Railways of which Rs 107100 crore for capital expenditure and Rs 118101 Lakh crore allocation to MoRTH of which an amount of Rs 108230 crore is for capital, highest ever. Further collateral free loans and setting up of Fund of Fund is proposed to be set up is aimed at benefitting MSMEs.
Indirect benefit from infra spending is likely to benefit cement companies, both. Incremental infrastructure spending is likely to trickle from promoting REITs and Infrastructure InVits. The listing of REITs and InVits would help government entities monetise its revenue earning road assets, pipelines, airports etc thus, raising resources from the market and undertake incremental infrastructure after reducing part of the debt.
Backdrop
India’s overall cement production capacity was nearly 545 million tonnes (MT) in FY20 and accounted for over 8% of the global installed capacity in FY20. However, the consumption stood at 327 MT in FY20 and will likely reach 380 MT by FY22. As India has a high quantity and quality of limestone deposits through-out the country, the cement industry promises huge potential for growth.
According to the data released by Department for Promotion of Industry and Internal Trade (DPIIT), cement and gypsum products attracted Foreign Direct Investment (FDI) worth US$ 5.28 billion between April 2000 and March 2020.
The last Union Budget for FY2021 allocated USD 1.93bn to urban development missions, while another USD 3.93bn was allocated to affordable housing programmes. All these initiatives are expected to trickle into current year and sustain demand for cement in the foreseeable future. Owing to the recent COVID-19 outbreak, demand for cement has contracted, particularly in urban areas where the pandemic has struck harder. Labour issues have emerged on account of reverse migration and the industrial segment is opting for cash conservation over capex. While the government is fiscally constrained, it will strive to revive infrastructure to bring back the ailing economy on a growth track. Initial Q3 FY2021 corporate results depict some revival.
Developing India’s infrastructure is vital to achieving the target of making the country a USD 5tn economy by FY2025. A total investment of Rs 111 trillion will be required between FY2020 and FY2025 for projects whose realisation will be critical for India to become a USD 5 trn economy by FY2025. As of October 2020, some 40% of the projects are under implementation, some 30% are at the conceptual stage, 20% are under development, and 10% are unclassified. The opportunities span sectors such as transportation, logistics, energy, water sanitisation, communication, and social and commercial infrastructure. This will help increase reconnect the previous enablers in demand for cement in India in the medium term.
The start of FY2021 was marred by the outbreak of COVID-19, which led to a total lockdown between March 25 and mid-April 2020, almost halting production and impairing demand for cement. While operations were allowed to resume, albeit with restrictions the demand-supply dynamics altered due to a slowdown in sectors from where it derives demand. Furthermore, the sector faces challenges pertaining to logistics, labour and supply chain on account of regional lockdowns. The rural sector last year showed early signs of recovery due to healthy monsoons and a good harvest season, which were expected to drive production volumes in the ensuing year.
The Cement industry has been in the consolidation phase in the last three years, with large players acquiring capacity from small and weaker players. A few noteworthy acquisitions include UltraTech Cement Company acquiring the assets of JP Cement, Binani Cement, and Century Cement, the acquisition by Nirma Group of Emami Cement, and the acquisition by
SECTOR : CEMENT OVERALL IMPACT: POSITIVE
Section 2
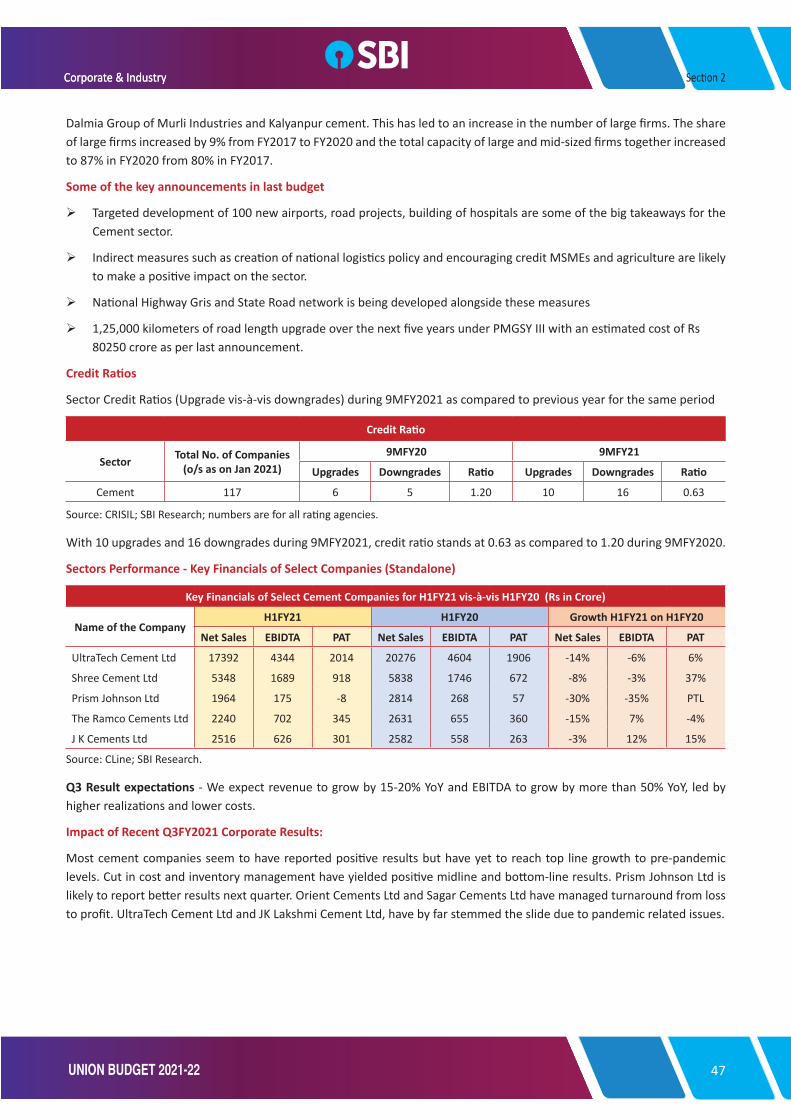
47UNION BUDGET 2021-22
Dalmia Group of Murli Industries and Kalyanpur cement. This has led to an increase in the number of large firms. The share of large firms increased by 9% from FY2017 to FY2020 and the total capacity of large and mid-sized firms together increased to 87% in FY2020 from 80% in FY2017.
Some of the key announcements in last budget
Targeted development of 100 new airports, road projects, building of hospitals are some of the big takeaways for the Cement sector.
Indirect measures such as creation of national logistics policy and encouraging credit MSMEs and agriculture are likely to make a positive impact on the sector.
National Highway Gris and State Road network is being developed alongside these measures
1,25,000 kilometers of road length upgrade over the next five years under PMGSY III with an estimated cost of Rs 80250 crore as per last announcement.
Credit Ratios
Sector Credit Ratios (Upgrade vis-à-vis downgrades) during 9MFY2021 as compared to previous year for the same period
Credit Ratio
Sector Total No. of Companies (o/s as on Jan 2021)
9MFY20 9MFY21
Upgrades Downgrades Ratio Upgrades Downgrades Ratio
Cement 117 6 5 1.20 10 16 0.63
Source: CRISIL; SBI Research; numbers are for all rating agencies.
With 10 upgrades and 16 downgrades during 9MFY2021, credit ratio stands at 0.63 as compared to 1.20 during 9MFY2020.
Sectors Performance - Key Financials of Select Companies (Standalone)
Key Financials of Select Cement Companies for H1FY21 vis-à-vis H1FY20 (Rs in Crore)
Name of the CompanyH1FY21 H1FY20 Growth H1FY21 on H1FY20
Net Sales EBIDTA PAT Net Sales EBIDTA PAT Net Sales EBIDTA PAT
UltraTech Cement Ltd 17392 4344 2014 20276 4604 1906 -14% -6% 6%
Shree Cement Ltd 5348 1689 918 5838 1746 672 -8% -3% 37%
Prism Johnson Ltd 1964 175 -8 2814 268 57 -30% -35% PTL
The Ramco Cements Ltd 2240 702 345 2631 655 360 -15% 7% -4%
J K Cements Ltd 2516 626 301 2582 558 263 -3% 12% 15%
Source: CLine; SBI Research.
Q3 Result expectations - We expect revenue to grow by 15-20% YoY and EBITDA to grow by more than 50% YoY, led by higher realizations and lower costs.
Impact of Recent Q3FY2021 Corporate Results:
Most cement companies seem to have reported positive results but have yet to reach top line growth to pre-pandemic levels. Cut in cost and inventory management have yielded positive midline and bottom-line results. Prism Johnson Ltd is likely to report better results next quarter. Orient Cements Ltd and Sagar Cements Ltd have managed turnaround from loss to profit. UltraTech Cement Ltd and JK Lakshmi Cement Ltd, have by far stemmed the slide due to pandemic related issues.
Section 2Corporate & IndustryCorporate & Industry

48 UNION BUDGET 2021-22
Market Reaction
Market Movement from Previous Budget (1st Feb'20) and on Budget Day (1st Feb'21)
Sector - Cement Name of the Companies 01-Feb-20 29-Jan-21 1-Feb-21
Movement Over 01-Feb-20 Movement on Budget Day
Price % Price %
UltraTech Cement Ltd 4265.25 5327.25 5744.15 1478.90 34.67% 416.90 7.83%
Shree Cement Ltd 22416.10 22773.35 24543.60 2127.50 9.49% 1770.25 7.77%
Prism Johnson Ltd 65.65 90.95 91.30 25.65 39.07% 0.35 0.38%
The Ramco Cements Ltd 763.80 781.00 836.45 72.65 9.51% 55.45 7.10%
J K Cements Ltd 1327.85 2130.90 2164.60 836.75 63.02% 33.70 1.58%
Source: NSE; closing price as on date.
Section 2

49UNION BUDGET 2021-22
Budget Proposals and Impact
The sector push is more towards renewable energy. The government proposed additional infusion of Rs 1000 crore for SECI (Solar Energy Corporation of India) and Rs 1500 crore to IREDA (The Indian Renewable Energy Development Agency Ltd).
Further, the government also announced the National Hydrogen Mission in 2021-22 for generating hydrogen from green power sources. Installation of smart meters and pre-paid meters would help to plug theft of power and aid cash flows for power and transmission companies. With focus on ensuring clean air and environment, the budget proposes to provide for Rs 2217 crore allocation for 42 urban centres with population of over 1 million.
A new package for ailing power discoms has been proposed worth around Rs 3.50 lakh crore The package would be implemented over 5 years. Improved financial health of DISCOMS is likely to boost the outstanding receivable position of Power Generation Companies resulting in reduced stress for the entire sector.
In power distribution, the consumer is currently offered little choice and hence, the distribution monopolies would require some framework to allow competition and choice. On anvil is monetisation of operating public infra assets such as that of Power Grid Corporation of India Ltd. The recent Q3FY2021 results are yet to establish firm trends in EBIDTA growth and PAT growth. The results suggest no firm trends as of now, and hence it would be a while to confirm growth trends.
Backdrop
Indian power sector is undergoing a significant change that has redefined the industry outlook. Sustained economic growth continues to drive electricity demand in India. The Government of India’s focus on attaining ‘Power for all’ has accelerated capacity addition in the country.
By 2022, solar energy is estimated to contribute 114 GW, followed by 67 GW from wind power and 15 GW from biomass and hydropower. The target for renewable energy has been increased to 227 GW by 2022. Total installed capacity of power stations in India stood at 373.43 GW as of October 2020. Electricity production reached 1,252.61 billion units (BU) in FY20
The Government of India has allocated Rs. 111 lakh crore under the National Infrastructure Pipeline for FY2019-25. The energy sector is likely to account for 24% capital expenditure over FY2019-25. Union Budget 2020-21 also allocated Rs. 15,875 to the Ministry of Power and Rs. 5,500 crore to Deen Dayal Upadhyay Gram Jyoti Yojana (DDUGJY).
Credit Ratios
Sector Credit Ratios (Upgrade vis-à-vis downgrades) during 9MFY2021 as compared to previous year for the same period.
Credit Ratio
Sector Total No. of Companies (o/s as on Jan 2021)
9MFY20 9MFY21
Upgrades Downgrades Ratio Upgrades Downgrades Ratio
Power 1506 109 193 0.56 102 164 0.62
Source: CRISIL; SBI Research; numbers are for all rating agencies; includes Power utilities, IPP and Energy Traders.
With 102 upgrades and 164 downgrades during 9MFY2021, credit ratio improved by 6 bps to 0.62 as compared to 0.56 during 9MFY2020.
Section 2
SECTOR : POWER OVERALL IMPACT: MARGINALLY POSITIVE
Corporate & Industry

50 UNION BUDGET 2021-22
Sectors Performance - Key Financials of Select Companies (Standalone)
Key Financials of Select Power Companies for H1FY21 vis-à-vis H1FY20 (Rs in Crore)
Name of the CompanyH1FY21 H1FY20 Growth H1FY21 on H1FY20
Net Sales EBIDTA PAT Net Sales EBIDTA PAT Net Sales EBIDTA PAT
NTPC Ltd 48131 13565 5975 46957 12799 5865 2% 6% 2%
Power Grid Corporation of India Ltd 18047 14770 5096 17489 15453 4955 3% -4% 3%
Torrent Power Ltd 5991 1551 565 7463 1778 1020 -20% -13% -45%
NHPC Ltd 5073 2808 2021 5027 3082 2221 1% -9% -9%
CESC Ltd 3574 566 362 4605 905 492 -22% -37% -26%
Source: CLine; SBI Research.
Q3FY21 early trend – Around 6 listed entities in the Power space declared their Q3FY21 results reporting 8% decline in revenue as compared to the same period in the previous year. However, they have reported positive EBIDTA and PAT as compared to loss during previous year.
Market Reaction
Market Movement from Previous Budget (1st Feb'20) and on Budget Day (1st Feb'21)
Sector - Power Name of the Companies 01-Feb-20 29-Jan-21 1-Feb-21
Movement Over 01-Feb-20 Movement on Budget Day
Price % Price %
NTPC Ltd 109.30 88.95 92.00 -17.30 -15.83% 3.05 3.43%
Power Grid Corporation of India Ltd 182.40 184.45 188.90 6.50 3.56% 4.45 2.41%
Torrent Power Ltd 304.05 308.80 307.45 3.40 1.12% -1.35 -0.44%
NHPC Ltd 23.90 24.00 23.70 -0.20 -0.84% -0.30 -1.25%
CESC Ltd 695.85 610.50 623.50 -72.35 -10.40% 13.00 2.13%
Source: NSE; closing price as on date.
Section 2
51UNION BUDGET 2021-22
Budget Proposals and Impact
Strengthening Traditional Strongholds to make it globally competitive
Reduction in basic customs duty on nylon raw materials such as nylon chips, nylon fibres & yarn and caprolactam from 7.50 percent to 5 percent is the major highlight This move would place nylon chain at par with polyester chain and other man-made fibres. MSME and exporters would be major beneficiaries from this move.
Cotton and silk also have been traditional stronghold. Cotton and silk growers would benefit from proposed increase in customs duty from nil to 10 percent in cotton and from 10 percent to 15 percent in raw silk and silk yarn. Imports from China of silk yarn would now take a backseat.
Further, in addition to PLI scheme, the government is proposing to set up 7 Mega Textiles park over 3 years which would increase and preserve employment. These textile parks would raise exports with the aim to be a global leader.
Backdrop
Textiles sector is one of the oldest industries in the Indian economy, dating back to several centuries. The industry is extremely varied, with hand-spun and hand-woven textiles sectors at one end of the spectrum, while the capital-intensive sophisticated mills sector on the other end. India’s textiles industry has a capacity to produce wide variety of products suitable for different market segments, both within India and across the world.
India’s textiles industry contributed 13% of the industry production in FY20. The sector contributed 12% to India’s export earnings in FY20. Textiles industry has around 4.5 crore employed workers including 35.22 lakh handloom workers across the country. Cotton production in India is estimated to have reached 35.7 million bales in FY20.
The Indian government has come up with several export promotion policies for the textiles sector. It has also allowed 100% FDI in the sector under the automatic route. Various initiatives taken by Government includes: -
• Production linked incentive scheme to provide incentives for manufacture and export of specific textile products made of man-made fibre.
• Under Union Budget 2020-21, a National Technical Textiles Mission is proposed for a period from 2020-21 to 2023-24 at an estimated outlay of Rs 1480 crore
• The Directorate General of Foreign Trade (DGFT) has revised rates for incentives under the Merchandise Exports from India Scheme (MEIS) for two subsectors of Textiles Industry - readymade garments and made-ups - from 2% to 4%.
• The Government of India has taken several measures including Amended Technology Up-gradation Fund Scheme (A-TUFS), estimated to create employment for 35 lakh people and enable investment worth Rs 95000 crore by 2022.
• The Cabinet Committee on Economic Affairs (CCEA), Government of India approved a new skill development scheme named ‘Scheme for Capacity Building in Textile Sector (SCBTS)’
The future for the sector looks promising, buoyed by strong domestic consumption as well as export demand. With consumerism and rising disposable income, the retail sector has experienced a rapid growth in the past and the trend seems to be continuing in future too.
SECTOR : TEXTILE OVERALL IMPACT : POSITIVE
Corporate & Industry

52 UNION BUDGET 2021-22
Credit Ratios
Sector Credit Ratios (Upgrade vis-à-vis downgrades) during 9MFY2021 as compared to previous year for the same period
Credit Ratio
Sector Total No. of Companies (o/s as on Jan 2021)
9MFY20 9MFY21
Upgrades Downgrades Ratio Upgrades Downgrades Ratio
Textile 4575 168 499 0.34 80 958 0.08
Source: CRISIL; SBI Research; numbers are for all rating agencies.
With only 80 upgrades as compared to 958 downgrades during 9MFY2021, credit ratio stands at 0.08 as compared to 0.34 during 9MFY2020.
Sectors Performance - Key Financials of Select Companies (Standalone)
Key Financials of Select Textile Companies for H1FY21 vis-à-vis H1FY20 (Rs in Crore)
Name of the CompanyH1FY21 H1FY20 Growth H1FY21 on H1FY20
Net Sales EBIDTA PAT Net Sales EBIDTA PAT Net Sales EBIDTA PAT
Grasim Industries Ltd 5378 194 91 9793 1211 728 -45% -84% -87%
SRF Ltd 2991 744 357 2967 590 488 1% 26% -27%
Welspun India Ltd 2498 457 205 2896 645 318 -14% -29% -36%
Vardhman Textiles Ltd 2304 139 -9 3111 466 224 -26% -70% PTL
Trident Ltd 1879 337 110 2626 545 260 -28% -38% -58%
Source: CLine; SBI Research.
Q3FY21 early trend – Around 29 listed entities in the Textile space declared their Q3FY21 results reporting 16% growth in revenue and 85% growth in EBIDTA as compared to the same period previous year.
Market Reaction
Market Movement from Previous Budget (1st Feb'20) and on Budget Day (1st Feb'21)
Sector - Textile Name of the Companies 01-Feb-20 29-Jan-21 1-Feb-21
Movement Over 01-Feb-20 Movement on Budget Day
Price % Price %
Grasim Industries Ltd 759.40 1055.65 1125.65 366.25 48.23% 70.00 6.63%
SRF Ltd 3688.15 5369.95 5490.95 1802.80 48.88% 121.00 2.25%
Welspun India Ltd 42.40 66.10 67.60 25.20 59.43% 1.50 2.27%
Vardhman Textiles Ltd 1008.65 1047.15 1036.20 27.55 2.73% -10.95 -1.05%
Trident Ltd 6.20 14.50 14.45 8.25 133.06% -0.05 -0.34%
Source: NSE; closing price as on date
Section 2
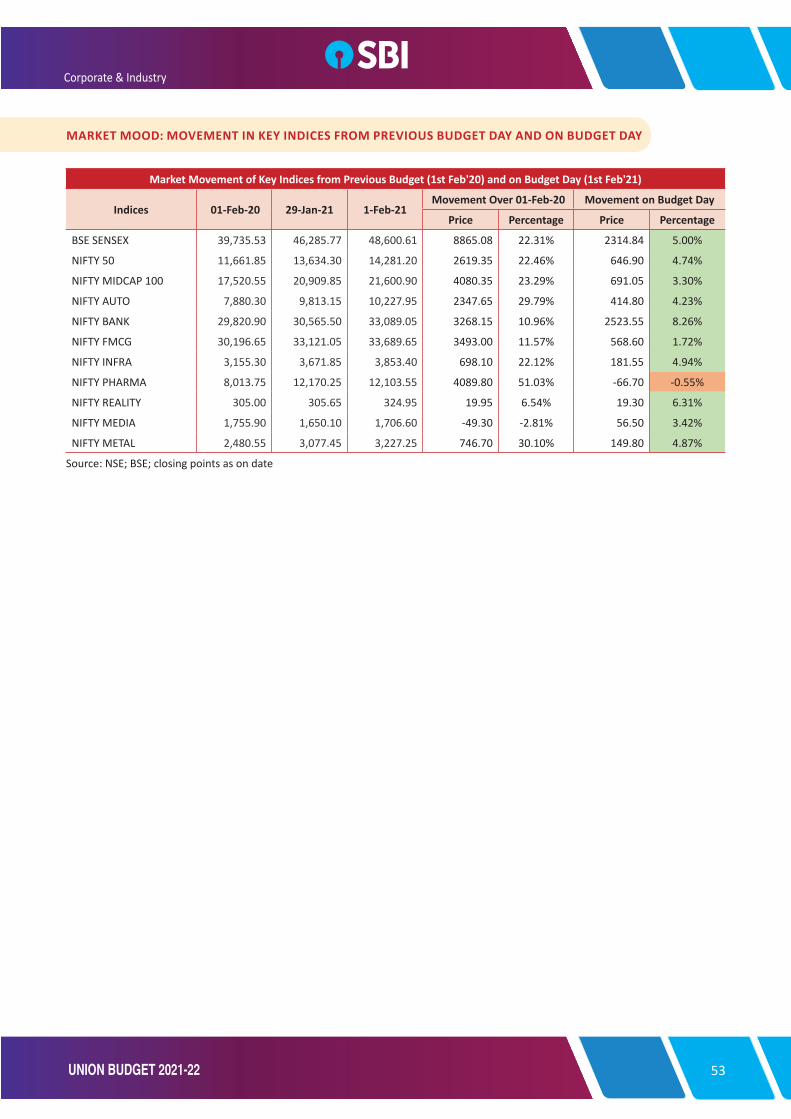
53UNION BUDGET 2021-22
MARKET MOOD: MOVEMENT IN KEY INDICES FROM PREVIOUS BUDGET DAY AND ON BUDGET DAY
Corporate & Industry
Market Movement of Key Indices from Previous Budget (1st Feb'20) and on Budget Day (1st Feb'21)
Indices 01-Feb-20 29-Jan-21 1-Feb-21Movement Over 01-Feb-20 Movement on Budget Day
Price Percentage Price Percentage
BSE SENSEX 39,735.53 46,285.77 48,600.61 8865.08 22.31% 2314.84 5.00%
NIFTY 50 11,661.85 13,634.30 14,281.20 2619.35 22.46% 646.90 4.74%
NIFTY MIDCAP 100 17,520.55 20,909.85 21,600.90 4080.35 23.29% 691.05 3.30%
NIFTY AUTO 7,880.30 9,813.15 10,227.95 2347.65 29.79% 414.80 4.23%
NIFTY BANK 29,820.90 30,565.50 33,089.05 3268.15 10.96% 2523.55 8.26%
NIFTY FMCG 30,196.65 33,121.05 33,689.65 3493.00 11.57% 568.60 1.72%
NIFTY INFRA 3,155.30 3,671.85 3,853.40 698.10 22.12% 181.55 4.94%
NIFTY PHARMA 8,013.75 12,170.25 12,103.55 4089.80 51.03% -66.70 -0.55%
NIFTY REALITY 305.00 305.65 324.95 19.95 6.54% 19.30 6.31%
NIFTY MEDIA 1,755.90 1,650.10 1,706.60 -49.30 -2.81% 56.50 3.42%
NIFTY METAL 2,480.55 3,077.45 3,227.25 746.70 30.10% 149.80 4.87%
Source: NSE; BSE; closing points as on date

54 UNION BUDGET 2021-22
Notes

Related Documents