DISCLAIMER Notes to the Annual Report on Form 20-F This PDF version of the Unilever Annual Report on Form 20-F 2011 is an exact copy of the document filed with the SEC at www.sec.gov. Certain sections of the Unilever Annual Report on Form 20-F 2011 have been audited. These are where indicated on pages 24 to 30. The Annual Report on Form 20-F 2011 references the Unilever Annual Report and Accounts 2011. The sections of the Unilever Annual Report and Accounts 2011 that have been audited are set out on pages 64 to 122, and those parts noted as audited within the Directors’ Remuneration Report on pages 56 to 59. The maintenance and integrity of the Unilever website is the responsibility of the Directors; the work carried out by the auditors does not involve consideration of these matters. Accordingly, the auditors accept no responsibility for any changes that may have occurred to the financial statements since they were initially placed on the website. Legislation in the United Kingdom and the Netherlands governing the preparation and dissemination of financial statements may differ from legislation in other jurisdictions. Disclaimer Except where you are a shareholder, this material is provided for information purposes only and is not, in particular, intended to confer any legal rights on you. This Annual Report on Form 20-F does not constitute an invitation to invest in Unilever shares. Any decisions you make in reliance on this information are solely your responsibility. The information is given as of the dates specified, is not updated, and any forward-looking statements are made subject to the reservations specified on the final page of the Report. Unilever accepts no responsibility for any information on other websites that may be accessed from this site by hyperlinks.

Welcome message from author
This document is posted to help you gain knowledge. Please leave a comment to let me know what you think about it! Share it to your friends and learn new things together.
Transcript
DISCLAIMER
Notes to the Annual Report on Form 20-F This PDF version of the Unilever Annual Report on Form 20-F 2011 is an exact copy of the document filed with the SEC at www.sec.gov.
Certain sections of the Unilever Annual Report on Form 20-F 2011 have been audited. These are where indicated on pages 24 to 30.
The Annual Report on Form 20-F 2011 references the Unilever Annual Report and Accounts 2011. The sections of the Unilever Annual Report and Accounts 2011 that have been audited are set out on pages 64 to 122, and those parts noted as audited within the Directors’ Remuneration Report on pages 56 to 59.
The maintenance and integrity of the Unilever website is the responsibility of the Directors; the work carried out by the auditors does not involve consideration of these matters. Accordingly, the auditors accept no responsibility for any changes that may have occurred to the financial statements since they were initially placed on the website.
Legislation in the United Kingdom and the Netherlands governing the preparation and dissemination of financial statements may differ from legislation in other jurisdictions.
Disclaimer Except where you are a shareholder, this material is provided for information purposes only and is not, in particular, intended to confer any legal rights on you.
This Annual Report on Form 20-F does not constitute an invitation to invest in Unilever shares. Any decisions you make in reliance on this information are solely your responsibility.
The information is given as of the dates specified, is not updated, and any forward-looking statements are made subject to the reservations specified on the final page of the Report.
Unilever accepts no responsibility for any information on other websites that may be accessed from this site by hyperlinks.
Unilever N.V. and Unilever PLC
ANNUAL REPORT ON FORM 20-F 2011
Creating a better future every day

Contents
Item 1 Identity of Directors, Senior Management and Advisers 1
Item 2 Offer Statistics and Expected Timetable 2
Item 3 Key Information 2
Item 4 Information on the Company 8
Item 4A Unresolved Staff Comments 8
Item 5 Operating and Financial Review and Prospects 8
Item 6 Directors, Senior Management and Employees 13
Item 7 Major Shareholders and Related Party Transactions 14
Item 8 Financial Information 15
Item 9 The Offer and Listing 15
Item 10 Additional Information 17
Item 11 Quantitative and Qualitative Disclosures About Market Risk 20
Item 12 Description of Securities Other than Equity Securities 20
Item 13 Defaults, Dividend Arrearages and Delinquencies 21
Item 14 Material Modifications to the Rights of Security Holders and Use of Proceeds 21
Item 15 Controls and Procedures 22
Item 16 Reserved 22
Item 17 Financial Statements 23
Item 18 Financial Statements 24
Item 19 Exhibits 30
Form 20-F
1
References set forth below are to certain references that include pages incorporated therein, including any page references incorporated in the incorporated material, unless specifically noted otherwise.
The following pages and sections of the Group’s Annual Report and Accounts 2011, regardless of their inclusion in any cross-reference below, are hereby specifically excluded and are not incorporated by reference into this report on Form 20-F:
• pages 2 to 5; • ‘Operational highlights‘ on page 6;• ‘Additional statutory disclosures‘ on page 59; • pages 62 and 63; and• pages 111 to 122.
This 20-F Report and the Group’s Annual Report and Accounts 2011 (furnished separately on 2 March 2012 under Form 6-K) contain certain measures that are not defined by generally accepted accounting principles (GAAP) such as IFRS. We believe this information, along with comparable GAAP measurements, is useful to investors because it provides a basis for measuring our operating performance, ability to retire debt and invest in new business opportunities. Our management uses these financial measures, along with the most directly comparable GAAP financial measures, in evaluating our operating performance and value creation. Non-GAAP financial measures should not be considered in isolation from, or as a substitute for, financial information presented in compliance with GAAP. Non-GAAP financial measures as reported by us may not be comparable with similarly titled amounts reported by other companies. In addition, there are limitations on the usefulness of our reported non-GAAP financial measures.
We report on the following non-GAAP measures:
• underlying sales growth;• underlying volume growth;• underlying operating margin (including explanation of restructuring, business disposals, impairments and other one-off items
(RDIs));• free cash flow; and• net debt.
The information set forth under the heading ‘Non-GAAP measures’ on pages 26 to 27 of the Group’s Annual Report and Accounts 2011 furnished separately on 2 March 2012 under Form 6-K is incorporated by reference. Within these pages further information about the above measures can be found.
The Unilever GroupUnilever N.V. (NV) is a public limited company registered in the Netherlands, which has listings of shares and depositary receipts for shares on Euronext Amsterdam and of New York Registry Shares on the New York Stock Exchange. Unilever PLC (PLC) is a public limited company registered in England and Wales which has shares listed on the London Stock Exchange and, as American Depositary Receipts, on the New York Stock Exchange.
The two parent companies, NV and PLC, together with their Group companies, operate as a single economic entity (the Unilever Group, also referred to as ‘Unilever‘ or ‘the Group‘). NV and PLC and their Group companies constitute a single reporting entity for the purposes of presenting consolidated accounts. Accordingly, the accounts of the Unilever Group are presented by both NV and PLC as their respective consolidated accounts.
This document contains references to our website. Information on our website or any other website referenced in this document is not incorporated into this document and should not be considered part of this document. We have included any website as an inactive textual reference only.
Item 1. Identity of Directors, Senior Management and Advisers
Not applicable.
Unilever Annual Report on Form 20-F 2011
Form 20-F
2
Item 2. Offer Statistics and Expected Timetable
Not applicable.
Item 3. Key Information
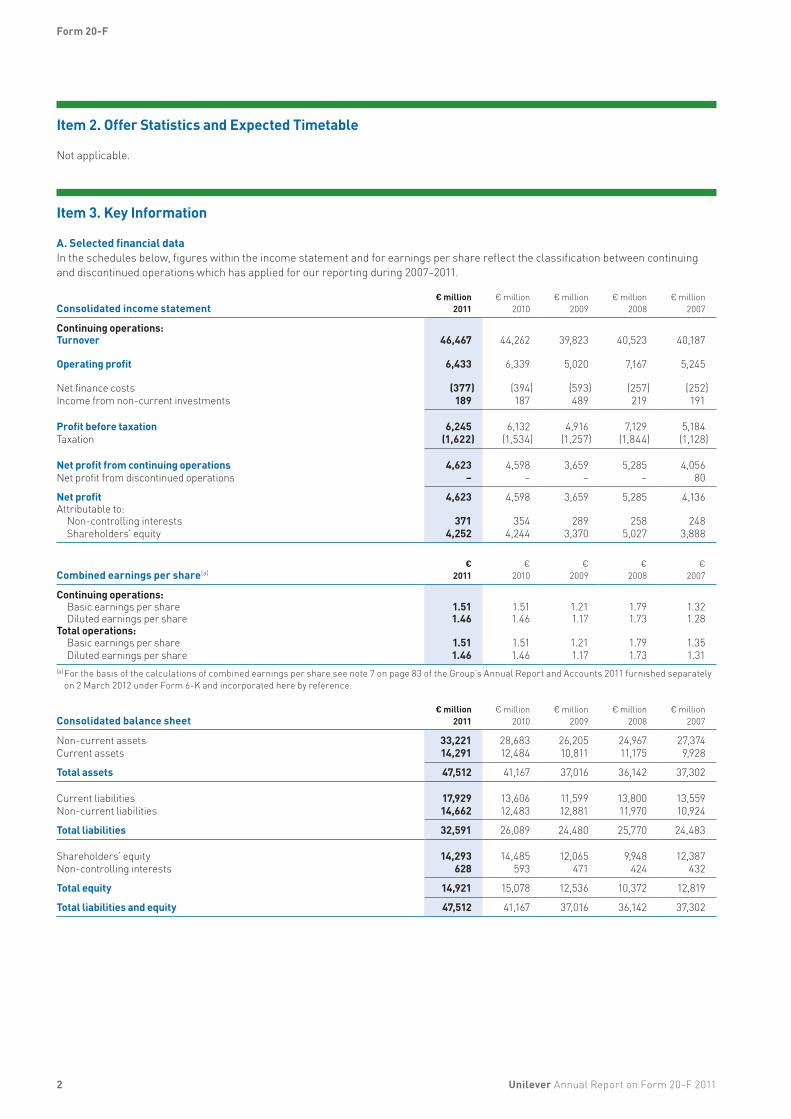
A. Selected financial dataIn the schedules below, figures within the income statement and for earnings per share reflect the classification between continuing and discontinued operations which has applied for our reporting during 2007–2011.
Consolidated income statement€ million
2011€ million
2010€ million
2009€ million
2008€ million
2007
Continuing operations:Turnover 46,467 44,262 39,823 40,523 40,187
Operating profit 6,433 6,339 5,020 7,167 5,245
Net finance costs (377) (394) (593) (257) (252)Income from non-current investments 189 187 489 219 191
Profit before taxation 6,245 6,132 4,916 7,129 5,184Taxation (1,622) (1,534) (1,257) (1,844) (1,128)
Net profit from continuing operations 4,623 4,598 3,659 5,285 4,056Net profit from discontinued operations – – – – 80
Net profit 4,623 4,598 3,659 5,285 4,136Attributable to:
Non-controlling interests 371 354 289 258 248Shareholders’ equity 4,252 4,244 3,370 5,027 3,888
Combined earnings per share(a)€
2011€
2010€
2009€
2008€
2007
Continuing operations:Basic earnings per share 1.51 1.51 1.21 1.79 1.32Diluted earnings per share 1.46 1.46 1.17 1.73 1.28
Total operations:Basic earnings per share 1.51 1.51 1.21 1.79 1.35Diluted earnings per share 1.46 1.46 1.17 1.73 1.31
(a) For the basis of the calculations of combined earnings per share see note 7 on page 83 of the Group’s Annual Report and Accounts 2011 furnished separately on 2 March 2012 under Form 6-K and incorporated here by reference.
Consolidated balance sheet€ million
2011€ million
2010€ million
2009€ million
2008€ million
2007
Non-current assets 33,221 28,683 26,205 24,967 27,374Current assets 14,291 12,484 10,811 11,175 9,928
Total assets 47,512 41,167 37,016 36,142 37,302
Current liabilities 17,929 13,606 11,599 13,800 13,559Non-current liabilities 14,662 12,483 12,881 11,970 10,924
Total liabilities 32,591 26,089 24,480 25,770 24,483
Shareholders’ equity 14,293 14,485 12,065 9,948 12,387Non-controlling interests 628 593 471 424 432
Total equity 14,921 15,078 12,536 10,372 12,819
Total liabilities and equity 47,512 41,167 37,016 36,142 37,302
Unilever Annual Report on Form 20-F 2011
Form 20-F

3
Consolidated cash flow statement€ million
2011€ million
2010€ million
2009€ million
2008€ million
2007
Net cash flow from operating activities 5,452 5,490 5,774 3,871 3,876Net cash flow from/(used in) investing activities (4,467) (1,164) (1,263) 1,415 (623)Net cash flow from/(used in) financing activities 411 (4,609) (4,301) (3,130) (3,009)
Net increase/(decrease) in cash and cash equivalents 1,396 (283) 210 2,156 244Cash and cash equivalents at the beginning of the year 1,966 2,397 2,360 901 710Effect of foreign exchange rates (384) (148) (173) (697) (53)
Cash and cash equivalents at the end of the year 2,978 1,966 2,397 2,360 901
Key performance indicators 2011 2010 2009 2008 2007
Underlying sales growth (%)(b) 6.5 4.1 3.5 7.4 5.5Underlying volume growth (%)(b) 1.6 5.8 2.3 0.1 3.7Underlying operating margin (%)(b) 14.9 15.0 14.8 14.6 14.5Free cash flow (€ million)(b) 3,075 3,365 4,072 2,390 2,487
Ratios and other metrics 2011 2010 2009 2008 2007
Operating margin (%) 13.8 14.3 12.6 17.7 13.1Net profit margin (%)(c) 9.2 9.6 8.5 12.4 9.7Net debt (€ million)(b) 8,781 6,668 6,357 8,012 8,335Ratio of earnings to fixed charges (times)(d) 10.0 10.7 8.8 11.7 8.3(b) Non-GAAP measures are defined and described on pages 26 and 27 of the Group’s Annual Report and Accounts 2011 furnished separately on 2 March 2012
under Form 6-K and incorporated here by reference.(c) Net profit margin is expressed as net profit attributable to shareholders’ equity as a percentage of turnover from continuing operations.(d) In the ratio of earnings to fixed charges, earnings consist of net profit from continuing operations excluding net profit or loss of joint ventures and associates
increased by fixed charges, income taxes and dividends received from joint ventures and associates. Fixed charges consist of interest payable on debt and a portion of lease costs determined to be representative of interest. This ratio takes no account of interest receivable although Unilever’s treasury operations involve both borrowing and depositing funds.
Dividend recordThe following tables show the dividends declared and dividends paid by NV and PLC for the last five years, expressed in terms of the revised share denominations which became effective from 22 May 2006. Differences between the amounts ultimately received by US holders of NV and PLC shares are the result of changes in exchange rates between the equalisation of the dividends and the date of payment.
Following agreement at the 2009 AGMs and separate meetings of ordinary shareholders, the Equalisation Agreement was modified to facilitate the payment of quarterly dividends from 2010 onwards.
2011 2010 2009 2008 2007
Dividends declared for the yearNV dividendsDividend per €0.16 €0.90 €0.83 €0.46 €0.77 €0.75Dividend per €0.16 (US Registry) US $1.25 US $1.13 US $0.67 US $1.02 US $1.13
PLC dividendsDividend per 31/9p £0.78 £0.71 £0.41 £0.61 £0.51Dividend per 31/9p (US Registry) US $1.25 US $1.13 US $0.67 US $0.94 US $1.01
Dividends paid during the yearNV dividendsDividend per €0.16 €0.88 €0.82 €0.78 €0.76 €0.72Dividend per €0.16 (US Registry) US $1.24 US $1.11 US $1.09 US $1.11 US $1.00
PLC dividendsDividend per 31/9p £0.77 £0.71 £0.64 £0.55 £0.49Dividend per 31/9p (US Registry) US $1.24 US $1.11 US $1.00 US $0.99 US $0.99
Unilever Annual Report on Form 20-F 2011
Form 20-F

4
Exchange ratesUnilever reports its financial results and balance sheet position in euros. Other currencies which may significantly impact our financial statements are sterling and US dollars. Average and year-end exchange rates for these two currencies for the last five years are given below.
2011 2010 2009 2008 2007
Year end€1 = US $ 1.294 1.337 1.433 1.417 1.471€1 = £ 0.839 0.862 0.888 0.977 0.734Average€1 = US $ 1.396 1.326 1.388 1.468 1.364€1 = £ 0.869 0.858 0.891 0.788 0.682
On 28 February 2012 the exchange rates between euros and US dollars and between euros and sterling as published in the Financial Times in London were as follows: €1 = US $1.340 and €1 = £0.846.
Noon Buying Rates in New York for cable transfers in foreign currencies as certified for customs purposes by the Federal Reserve Bank of New York were as follows:
2011 2010 2009 2008 2007
Year end€1 = US $ 1.297 1.327 1.433 1.392 1.460Average€1 = US $ 1.393 1.326 1.394 1.473 1.371High€1 = US $ 1.488 1.454 1.510 1.601 1.486Low€1 = US $ 1.293 1.196 1.255 1.245 1.290
High and low exchange rate values for each of the last six months:
September 2011
October 2011
November 2011
December2011
January 2012
February(a)
2012
High€1 = US $ 1.428 1.417 1.380 1.349 1.319 1.345Low€1 = US $ 1.345 1.328 1.324 1.293 1.268 1.307(a) Through 24 February 2012
Share capitalThe information set forth under the heading ‘Note 19 Share capital‘ on pages 101 to 102 of the Group’s Annual Report and Accounts 2011 furnished separately on 2 March 2012 under Form 6-K is incorporated by reference.
B. Capitalisation and indebtednessNot applicable.
C. Reasons for the offer and use of proceedsNot applicable.
D. Risk factorsOur principal risks, as described on pages 28 to 32 of the Group’s Annual Report and Accounts 2011 furnished separately on 2 March 2012 under Form 6-K are incorporated by reference. The information set forth under the heading ‘Note 16 Capital and treasury risk management’ on pages 93 to 99 of the Group’s Annual Report and Accounts 2011 furnished separately on 2 March 2012 under Form 6-K is incorporated by reference.
Risk factorsOur business is subject to risks and uncertainties. The risks that we regard as the most relevant to our business are set out below. We have undertaken certain mitigating actions that we believe help us to manage the risks identified below. However, we may not be successful in deploying some or all of these mitigating actions. If the circumstances in these risk factors occur or are not successfully mitigated, our cashflow, operating results, financial position, business and reputation could be materially adversely affected. In addition, risks and uncertainties could cause actual results to vary from those described in this document, or could impact on our ability to meet our targets or be detrimental to our profitability or reputation. This list is not intended to be exhaustive and there may be other risks and uncertainties that are not mentioned below that could impact our future performance or our ability to meet published targets. The risks and uncertainties discussed below should be read in conjunction with the Group’s consolidated financial statements and related notes and the portions of the Report of the Directors that are incorporated by reference from the Group’s Annual Report and Accounts 2011 (furnished separately on 2 March 2012 on Form 6-K) and other information included in or incorporated by reference in this Report on Form 20-F.
Unilever Annual Report on Form 20-F 2011
Form 20-F
5
Principal risk Description of risk
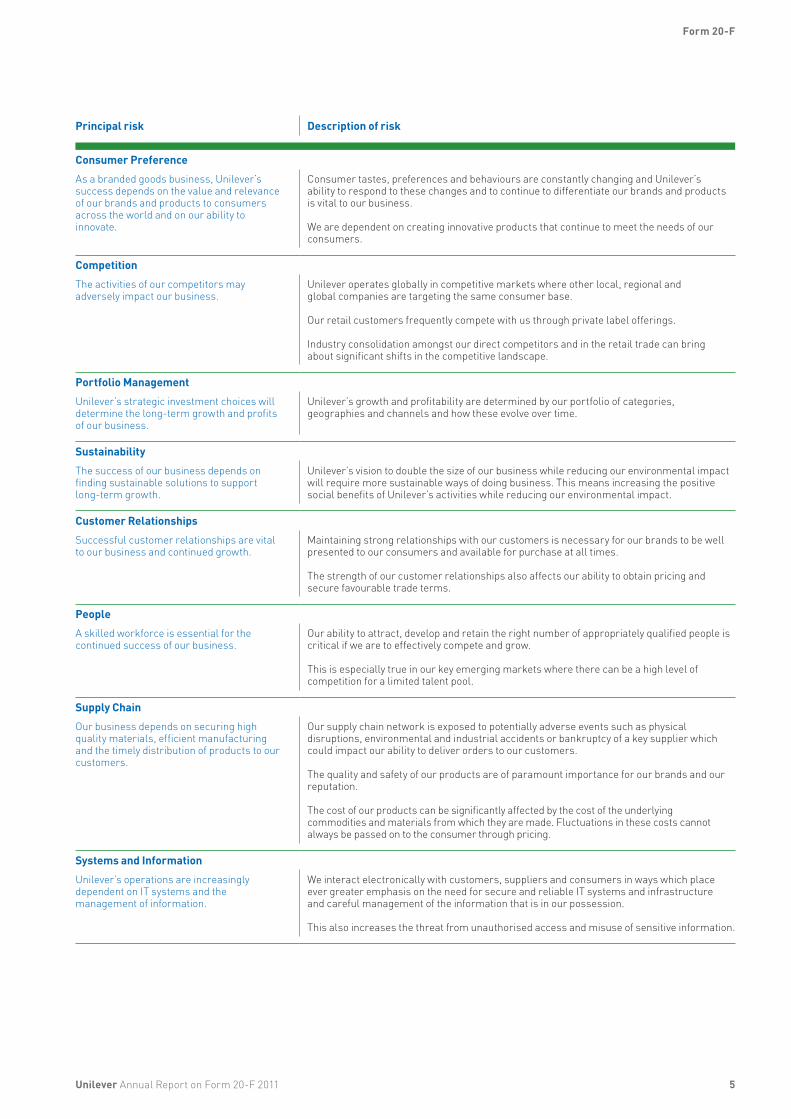
Consumer PreferenceAs a branded goods business, Unilever’s success depends on the value and relevance of our brands and products to consumers across the world and on our ability to innovate.
Consumer tastes, preferences and behaviours are constantly changing and Unilever’s ability to respond to these changes and to continue to differentiate our brands and products is vital to our business.
We are dependent on creating innovative products that continue to meet the needs of our consumers.
CompetitionThe activities of our competitors may adversely impact our business.
Unilever operates globally in competitive markets where other local, regional and global companies are targeting the same consumer base.
Our retail customers frequently compete with us through private label offerings.
Industry consolidation amongst our direct competitors and in the retail trade can bring about significant shifts in the competitive landscape.
Portfolio ManagementUnilever’s strategic investment choices will determine the long-term growth and profits of our business.
Unilever’s growth and profitability are determined by our portfolio of categories, geographies and channels and how these evolve over time.
SustainabilityThe success of our business depends on finding sustainable solutions to support long-term growth.
Unilever’s vision to double the size of our business while reducing our environmental impact will require more sustainable ways of doing business. This means increasing the positive social benefits of Unilever’s activities while reducing our environmental impact.
Customer RelationshipsSuccessful customer relationships are vital to our business and continued growth.
Maintaining strong relationships with our customers is necessary for our brands to be well presented to our consumers and available for purchase at all times.
The strength of our customer relationships also affects our ability to obtain pricing and secure favourable trade terms.
People A skilled workforce is essential for the continued success of our business.
Our ability to attract, develop and retain the right number of appropriately qualified people is critical if we are to effectively compete and grow.
This is especially true in our key emerging markets where there can be a high level of competition for a limited talent pool.
Supply ChainOur business depends on securing high quality materials, efficient manufacturing and the timely distribution of products to our customers.
Our supply chain network is exposed to potentially adverse events such as physical disruptions, environmental and industrial accidents or bankruptcy of a key supplier which could impact our ability to deliver orders to our customers.
The quality and safety of our products are of paramount importance for our brands and our reputation.
The cost of our products can be significantly affected by the cost of the underlying commodities and materials from which they are made. Fluctuations in these costs cannot always be passed on to the consumer through pricing.
Systems and InformationUnilever’s operations are increasingly dependent on IT systems and the management of information.
We interact electronically with customers, suppliers and consumers in ways which place ever greater emphasis on the need for secure and reliable IT systems and infrastructure and careful management of the information that is in our possession.
This also increases the threat from unauthorised access and misuse of sensitive information.
Unilever Annual Report on Form 20-F 2011
Form 20-F
6
Principal risk Description of risk
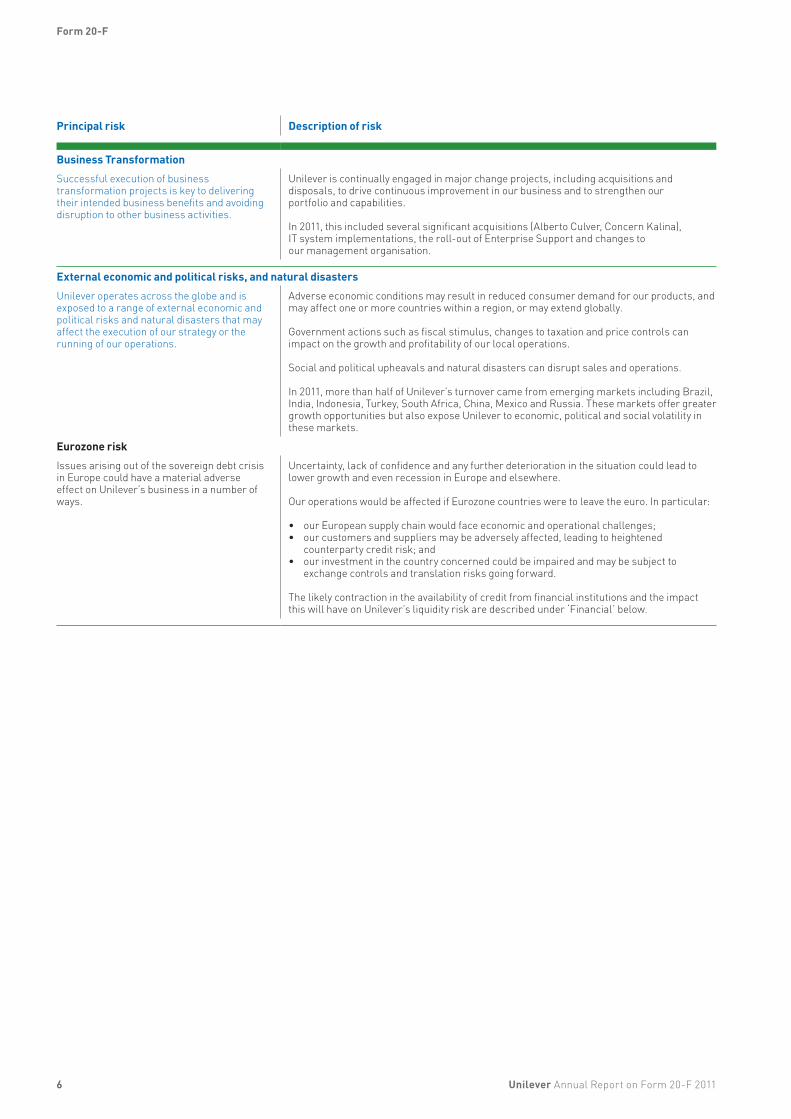
Business TransformationSuccessful execution of business Unilever is continually engaged in major change projects, including acquisitions and transformation projects is key to delivering disposals, to drive continuous improvement in our business and to strengthen our their intended business benefits and avoiding portfolio and capabilities.disruption to other business activities.
In 2011, this included several significant acquisitions (Alberto Culver, Concern Kalina), IT system implementations, the roll-out of Enterprise Support and changes to our management organisation.
External economic and political risks, and natural disastersUnilever operates across the globe and is Adverse economic conditions may result in reduced consumer demand for our products, and exposed to a range of external economic and may affect one or more countries within a region, or may extend globally. political risks and natural disasters that may affect the execution of our strategy or the Government actions such as fiscal stimulus, changes to taxation and price controls can running of our operations. impact on the growth and profitability of our local operations.
Social and political upheavals and natural disasters can disrupt sales and operations.
In 2011, more than half of Unilever’s turnover came from emerging markets including Brazil, India, Indonesia, Turkey, South Africa, China, Mexico and Russia. These markets offer greater growth opportunities but also expose Unilever to economic, political and social volatility in these markets.
Eurozone riskIssues arising out of the sovereign debt crisis Uncertainty, lack of confidence and any further deterioration in the situation could lead to in Europe could have a material adverse lower growth and even recession in Europe and elsewhere.effect on Unilever’s business in a number of ways. Our operations would be affected if Eurozone countries were to leave the euro. In particular:
• our European supply chain would face economic and operational challenges;• our customers and suppliers may be adversely affected, leading to heightened
counterparty credit risk; and• our investment in the country concerned could be impaired and may be subject to
exchange controls and translation risks going forward.
The likely contraction in the availability of credit from financial institutions and the impact this will have on Unilever’s liquidity risk are described under ‘Financial’ below.
6 Unilever Annual Report on Form 20-F 2011
Form 20-F
7
Principal risk Description of risk
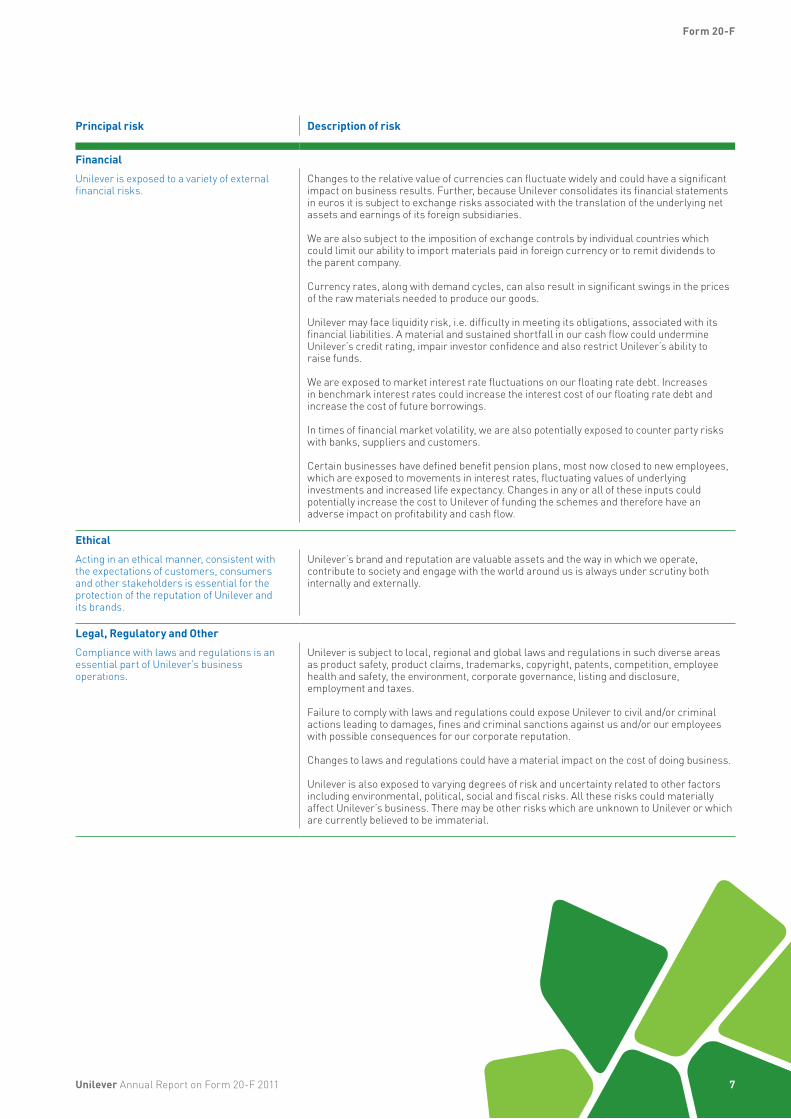
FinancialUnilever is exposed to a variety of external Changes to the relative value of currencies can fluctuate widely and could have a significant financial risks. impact on business results. Further, because Unilever consolidates its financial statements
in euros it is subject to exchange risks associated with the translation of the underlying net assets and earnings of its foreign subsidiaries.
We are also subject to the imposition of exchange controls by individual countries which could limit our ability to import materials paid in foreign currency or to remit dividends to the parent company.
Currency rates, along with demand cycles, can also result in significant swings in the prices of the raw materials needed to produce our goods.
Unilever may face liquidity risk, i.e. difficulty in meeting its obligations, associated with its financial liabilities. A material and sustained shortfall in our cash flow could undermine Unilever’s credit rating, impair investor confidence and also restrict Unilever’s ability to raise funds.
We are exposed to market interest rate fluctuations on our floating rate debt. Increases in benchmark interest rates could increase the interest cost of our floating rate debt and increase the cost of future borrowings.
In times of financial market volatility, we are also potentially exposed to counter party risks with banks, suppliers and customers.
Certain businesses have defined benefit pension plans, most now closed to new employees, which are exposed to movements in interest rates, fluctuating values of underlying investments and increased life expectancy. Changes in any or all of these inputs could potentially increase the cost to Unilever of funding the schemes and therefore have an adverse impact on profitability and cash flow.
EthicalActing in an ethical manner, consistent with Unilever’s brand and reputation are valuable assets and the way in which we operate, the expectations of customers, consumers contribute to society and engage with the world around us is always under scrutiny both and other stakeholders is essential for the internally and externally.protection of the reputation of Unilever and its brands.
Legal, Regulatory and OtherCompliance with laws and regulations is an Unilever is subject to local, regional and global laws and regulations in such diverse areas essential part of Unilever’s business as product safety, product claims, trademarks, copyright, patents, competition, employee operations. health and safety, the environment, corporate governance, listing and disclosure,
employment and taxes.
Failure to comply with laws and regulations could expose Unilever to civil and/or criminal actions leading to damages, fines and criminal sanctions against us and/or our employees with possible consequences for our corporate reputation.
Changes to laws and regulations could have a material impact on the cost of doing business.
Unilever is also exposed to varying degrees of risk and uncertainty related to other factors including environmental, political, social and fiscal risks. All these risks could materially affect Unilever’s business. There may be other risks which are unknown to Unilever or which are currently believed to be immaterial.
Unilever Annual Report on Form 20-F 2011
Form 20-F
8
Item 4. Information on the Company
A. History and development of the CompanyThe information set forth under the following headings of the Group’s Annual Report and Accounts 2011 furnished separately on 2 March 2012 under Form 6-K is incorporated by reference:
• ‘Financial Review 2011‘ on pages 20 to 27;• ‘Our requirements and compliance‘ on pages 43 to 45;• ‘ Note 21 Acquisitions and disposals‘ on pages 104 to 106; and• ‘Shareholder information‘ on pages 123 to 126.
Please refer also to ‘Financial Review 2010‘ within Item 5A of this report and ‘The Unilever Group’ on page 1 of this report.
B. Business overviewThe information set forth under the following headings of the Group’s Annual Report and Accounts 2011 furnished separately on 2 March 2012 under Form 6-K is incorporated by reference:
• ‘Note 2 Segment information‘ on pages 70 to 71; and• ‘ Better service‘ on page 16.
Please also refer to ‘The Unilever Group’ on page 1 of this report.
Marketing channelsUnilever’s products are generally sold through our own sales force as well as through independent brokers, agents and distributors to chain, wholesale, co-operative and independent grocery accounts, food service distributors and institutions. Products are physically distributed through a network of distribution centres, satellite warehouses, company-operated and public storage facilities, depots and other facilities.
Raw materialsOur products use a wide variety of raw and packaging materials which we source internationally, and which may be subject to price volatility. We saw commodity prices rise during the second half of 2011 and this looks set to continue into 2012.
SeasonalityCertain of our businesses, such as ice cream, are subject to significant seasonal fluctuations in sales. However, Unilever operates globally in many different markets and product categories, and no individual element of seasonality is likely to be material to the results of the Group as a whole.
Intellectual propertyWe have a large portfolio of patents and trademarks, and we conduct some of our operations under licences that are based on patents or trademarks owned or controlled by others. We are not dependent on any one patent or group of patents. We use all appropriate efforts to protect our brands and technology.
Competition As a FMCG (fast moving consumer goods) company, we are competing with a diverse set of competitors. Some of these operate on an international scale like ourselves, while others have a more regional or local focus. Our business model centres on building brands which consumers know, trust, like, and buy in conscious preference to competitors’. Our brands command loyalty and affinity and deliver superior performance.
C. Organisational structureThe information set forth under the heading ‘Principal group companies and non-current investments‘ on pages 109 and 110 of the Group’s Annual Report and Accounts 2011 furnished separately on 2 March 2012 under Form 6-K is incorporated by reference:
Please also refer to ‘The Unilever Group’ on page 1 of this report.
D. Property, plant and equipmentWe have interests in properties in most of the countries where there are Unilever operations. However, none is material in the context of the Group as a whole. The properties are used predominantly to house production and distribution activities and as offices. There is a mixture of leased and owned property throughout the Group. We are not aware of any environmental issues affecting the properties which would have a material impact upon the Group, and there are no material encumbrances on our properties. Any difference between the market value of properties held by the Group and the amount at which they are included in the balance sheet is not significant. We believe our existing facilities are satisfactory for our current business and we currently have no plans to construct new facilities or expand or improve our current facilities in a manner that is material to the Group.
The information set forth under the following headings of the Group’s Annual Report and Accounts 2011 furnished separately on 2 March 2012 under Form 6-K is incorporated by reference:
• ‘ Note 10 Property, plant and equipment‘ on pages 86 and 87; and
• ‘ Principal group companies and non-current investments‘ on pages 109 and 110.
Item 4A. Unresolved Staff Comments
Not applicable.
Item 5. Operating and Financial Review and Prospects
A. Operating resultsThe information set forth under the following headings of the Group’s Annual Report and Accounts 2011 furnished separately on 2 March 2012 under Form 6-K is incorporated by reference:
• ‘Outlook‘ on page 28;• ‘Financial review 2011‘ on pages 20 to 27; and• ‘Currency risk‘ on page 94.
Unilever Annual Report on Form 20-F 2011
Form 20-F
9
Financial Review 2010
Basis of reportingThe information set forth under the heading ‘Basis of reporting‘ on page 25 of the Group’s Annual Report and Accounts 2011 furnished separately on 2 March 2012 under Form 6-K is incorporated by reference.
Group results and earnings per shareThe following discussion summarises the results of the Group during the years 2010 and 2009. The figures quoted are in euros, at current rates of exchange, being the average rates applying in each period as applicable, unless otherwise stated. Information about exchange rates between the euro, pound sterling and US dollar is given on page 4 of this report.
In 2010 and 2009, no disposals qualified to be disclosed as discontinued operations for purposes of reporting.
€ million2010
€ million 2009
%Change
Turnover 44,262 39,823 11.1Operating profit 6,339 5,020 26Underlying operating profit 6,620 5,888 12Net profit 4,598 3,659 26
Diluted EPS €1.46 €1.17 25
Turnover at €44.3 billion increased 11.1%, with 7.3% due to currency. Underlying sales growth increased to 4.1%, driven in particular by an improvement in performance in Western Europe. Underlying volume growth of 5.8% was partially offset by the full year price effect of negative 1.6%, though in the fourth quarter pricing turned positive on an in-quarter basis.
Operating profit was €6.3 billion, compared with €5.0 billion in 2009, with higher one-off profits arising from the disposal of group companies and lower restructuring costs. Underlying operating profit increased by 12% to €6.6 billion, with underlying operating margin increasing by 0.2% to 15.0%.
The cost of financing net borrowings was €414 million, €15 million lower than 2009, as the adverse impact of currency was more than offset by lower average net debt. The interest rate on borrowings was 4.4% and on cash deposits was 1.7%. The charge for pensions financing was a credit of €20 million compared with a net charge of €164 million in 2009.
Unilever Annual Report on Form 20-F 2011
Form 20-F
The effective tax rate was 25.5% compared with 26.2% in 2009 reflecting the geographic mix of profits and the impact of the Italian frozen foods disposal. The underlying tax rate excluding the effect of restructuring, disposals and impairments was 27.1%.
Net profit from joint ventures and associates, together with other income from non-current investments contributed €187 million compared to €489 million in the prior year which benefited from the €327 million gain on disposal of the majority of the equity in JohnsonDiversey.
Fully diluted earnings per share increased 25%, to €1.46. This was driven by improved underlying operating profit, lower restructuring charges, lower pension costs, the favourable impact of foreign exchange and higher profit on business disposal partially offset by a provision in respect of the European Commission investigation into consumer detergents. Business disposals include the disposal of the Italian frozen foods business.
10
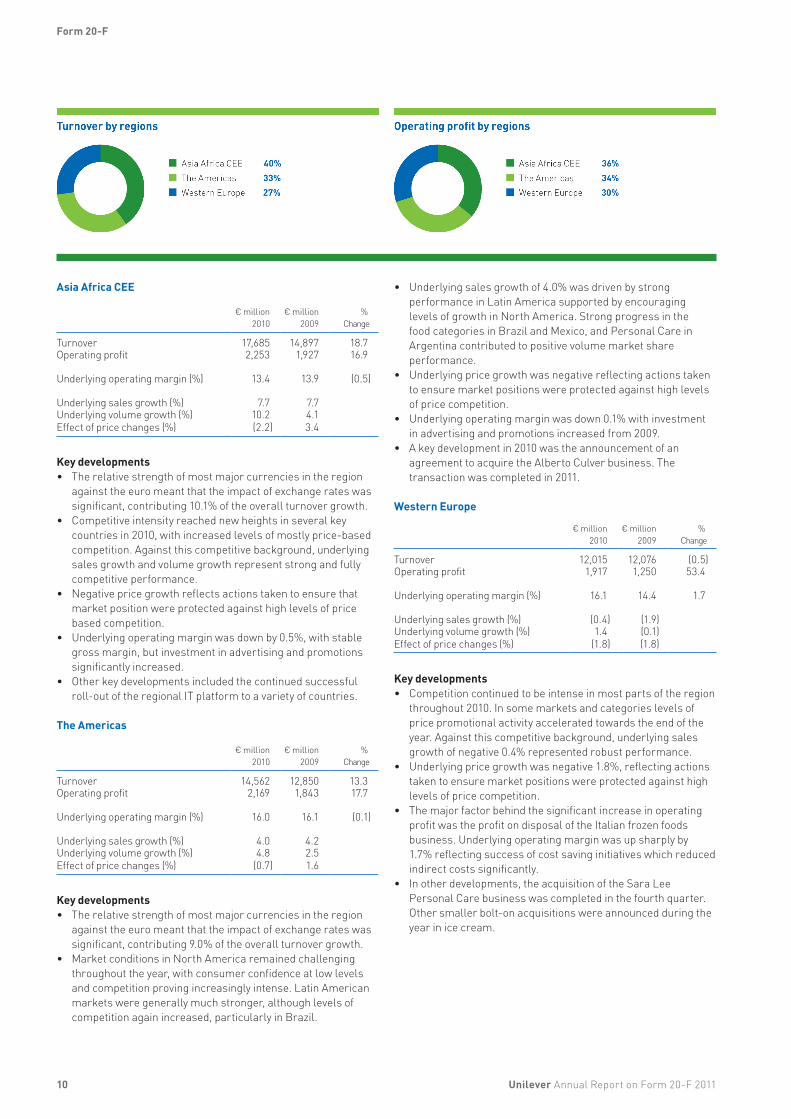
Asia Africa CEE
€ million2010
€ million2009
%Change
Turnover 17,685 14,897 18.7Operating profit 2,253 1,927 16.9
Underlying operating margin (%) 13.4 13.9 (0.5)
Underlying sales growth (%) 7.7 7.7Underlying volume growth (%) 10.2 4.1Effect of price changes (%) (2.2) 3.4
Key developments• The relative strength of most major currencies in the region
against the euro meant that the impact of exchange rates wassignificant, contributing 10.1% of the overall turnover growth.
• Competitive intensity reached new heights in several key countries in 2010, with increased levels of mostly price-basedcompetition. Against this competitive background, underlyingsales growth and volume growth represent strong and fully competitive performance.
• Negative price growth reflects actions taken to ensure that market position were protected against high levels of price based competition.
• Underlying operating margin was down by 0.5%, with stable gross margin, but investment in advertising and promotions significantly increased.
• Other key developments included the continued successful roll-out of the regional IT platform to a variety of countries.
The Americas
€ million2010
€ million2009
%Change
Turnover 14,562 12,850 13.3Operating profit 2,169 1,843 17.7
Underlying operating margin (%) 16.0 16.1 (0.1)
Underlying sales growth (%) 4.0 4.2Underlying volume growth (%) 4.8 2.5Effect of price changes (%) (0.7) 1.6
Key developments• The relative strength of most major currencies in the region
against the euro meant that the impact of exchange rates was significant, contributing 9.0% of the overall turnover growth.
• Market conditions in North America remained challenging throughout the year, with consumer confidence at low levels and competition proving increasingly intense. Latin American markets were generally much stronger, although levels of competition again increased, particularly in Brazil.
• Underlying sales growth of 4.0% was driven by strong performance in Latin America supported by encouraging levels of growth in North America. Strong progress in the food categories in Brazil and Mexico, and Personal Care in Argentina contributed to positive volume market share performance.
• Underlying price growth was negative reflecting actions taken to ensure market positions were protected against high levels of price competition.
• Underlying operating margin was down 0.1% with investment in advertising and promotions increased from 2009.
• A key development in 2010 was the announcement of an agreement to acquire the Alberto Culver business. The transaction was completed in 2011.
Western Europe
€ million2010
€ million2009
%Change
Turnover 12,015 12,076 (0.5)Operating profit 1,917 1,250 53.4
Underlying operating margin (%) 16.1 14.4 1.7
Underlying sales growth (%) (0.4) (1.9)Underlying volume growth (%) 1.4 (0.1)Effect of price changes (%) (1.8) (1.8)
Key developments• Competition continued to be intense in most parts of the region
throughout 2010. In some markets and categories levels of price promotional activity accelerated towards the end of the year. Against this competitive background, underlying sales growth of negative 0.4% represented robust performance.
• Underlying price growth was negative 1.8%, reflecting actions taken to ensure market positions were protected against high levels of price competition.
• The major factor behind the significant increase in operating profit was the profit on disposal of the Italian frozen foods business. Underlying operating margin was up sharply by 1.7% reflecting success of cost saving initiatives which reduced indirect costs significantly.
• In other developments, the acquisition of the Sara Lee Personal Care business was completed in the fourth quarter. Other smaller bolt-on acquisitions were announced during the year in ice cream.
Unilever Annual Report on Form 20-F 2011
Form 20-F
11
Non-GAAP measures
The information set forth under the heading ‘Non-GAAP measures‘ on pages 26 and 27 of the Group’s Annual Report and Accounts 2011 furnished separately on 2 March 2012 under Form 6-K is incorporated by reference.
Underlying sales growth (USG)The reconciliation of USG to changes in the GAAP measure turnover is as follows:
Total Group2010
vs 2009 2009
vs 2008
Underlying sales growth (%) 4.1 3.5Effect of acquisitions (%) 0.3 0.6Effect of disposals (%) (0.8) (3.0)Effect of exchange rates (%) 7.3 (2.7)Turnover growth (%) 11.1 (1.7)
Asia Africa CEE2010
vs 2009 2009
vs 2008
Underlying sales growth (%) 7.7 7.7Effect of acquisitions (%) 0.2 0.5Effect of disposals (%) (0.1) (0.9)Effect of exchange rates (%) 10.1 (4.0)Turnover growth (%) 18.7 2.9
The Americas2010
vs 2009 2009
vs 2008
Underlying sales growth (%) 4.0 4.2Effect of acquisitions (%) 0.3 0.7Effect of disposals (%) (0.4) (6.0)Effect of exchange rates (%) 9.0 (1.2)Turnover growth (%) 13.3 (2.6)
Western Europe2010
vs 2009 2009
vs 2008
Underlying sales growth (%) (0.4) (1.9)Effect of acquisitions (%) 0.5 0.5Effect of disposals (%) (2.0) (2.2)Effect of exchange rates (%) 1.4 (2.5)Turnover growth (%) (0.5) (6.0)
Underlying volume growth (UVG)Underlying volume growth is underlying sales growth after eliminating the impact of price changes. The relationship between the two measures is set out below:
2010 vs 2009
2009 vs 2008
Underlying volume growth (%) 5.8 2.3Effect of price changes (%) (1.6) 1.2Underlying sales growth (%) 4.1 3.5
Underlying operating margin The reconciliation of underlying operating profit to operating profit is as follows:
€ million 2010
€ million 2009
Operating profit 6,339 5,020Restructuring costs 589 897Business disposals (468) (4)Impairments and other one-off items 160 (25)
Underlying operating profit 6,620 5,888
Turnover 44,262 39,823Operating margin (%) 14.3 12.6Underlying operating margin (%) 15.0 14.8
Free cash flow (FCF)FCF represents the cash generation from the operation and financing of the business. The movement in FCF measures our progress against the commitment to deliver strong cash flows. FCF is not used as a liquidity measure within Unilever.
FCF includes the cash flow from Group operating activities, less income tax paid, net capital expenditure, net interest and preference dividends paid. The reconciliation of FCF to net profit is as follows:
€ million 2010
€ million 2009
Net profit 4,598 3,659Taxation 1,534 1,257Share of net profit of joint ventures/associates and other income from non-current investments (187) (489)
Net finance cost 394 593Depreciation, amortisation and impairment 993 1,032Changes in working capital 169 1,701Pensions and similar obligations less payments (472) (1,028)Provisions less payments 72 (258)Elimination of (profits)/losses on disposals (476) 13Non-cash charge for share-based compensation 144 195Other adjustments 49 58
Cash flow from operating activities 6,818 6,733
Income tax paid (1,328) (959)Net capital expenditure (1,701) (1,258)Net interest and preference dividends paid (424) (444)
Free cash flow 3,365 4,072
Net debtThe reconciliation of net debt to the GAAP measure total financial liabilities is as follows:
€ million 2010
€ million 2009
Total financial liabilities (9,534) (9,971)
Financial liabilities due within one year (2,276) (2,279)Financial liabilities due after one year (7,258) (7,692)
Cash and cash equivalents as per balance sheet 2,316 2,642
Cash and cash equivalents as per cash flow statement 1,966 2,397
Bank overdrafts deducted therein 350 245
Financial assets 550 972
Net debt (6,668) (6,357)
Unilever Annual Report on Form 20-F 2011
Form 20-F
12
Acquisitions and disposals – 2009On 2 April 2009 we announced the completion of our purchase of the global TIGI professional hair product business and its supporting advanced education academies. TIGI’s major brands include Bed Head, Catwalk and S-Factor. Turnover of the business worldwide in 2008 was around US $250 million. The cash consideration of US $411.5 million was made on a cash and debt free basis. In addition, further limited payments related to future growth may be made contingent upon meeting certain thresholds.
On 3 July 2009 we completed the acquisition of Baltimor Holding ZAO’s sauces business in Russia. The acquisition includes the ketchup, mayonnaise and tomato paste business under the Baltimor, Pomo d’Oro and Vostochniy Gourmand brands – and a production facility at Kolpino, near St Petersburg.
On 24 November 2009 we completed the sale of our interest in JohnsonDiversey. The cash consideration received was US $390 million, which included both the originally announced cash consideration of US $158 million plus the proceeds of the sale of the 10.5% senior notes in JohnsonDiversey Holdings, Inc. We retain a 4% interest in JohnsonDiversey in the form of warrants.
B. Liquidity and capital resources
(i) Information regarding the Group’s liquidityThe information set forth under the following headings of the Group’s Annual Report and Accounts 2011 furnished separately on 2 March 2012 under Form 6-K is incorporated by reference:
• ‘Finance and liquidity‘ and ‘Treasury‘ on pages 24 to 25;• ‘Market risk‘ on page 94;• ‘Liquidity risk‘ on page 95;• ‘Capital management‘ on page 93;• ‘Going concern‘ on page 61;• ‘Cash flow‘ on page 25;• ‘Consolidated cash flow statement‘ on page 67; and• ‘ Note 15 Financial assets and liabilities‘ on pages 90 to 92.
(ii) Information regarding the type of financial instruments used, the maturity profile of debt, currency and interest rate structureThe information set forth under the following headings of the Group’s Annual Report and Accounts 2011 furnished separately on 2 March 2012 under Form 6-K is incorporated by reference:
• ‘ Note 15 Financial assets and liabilities‘ on pages 90 to 92;• ‘ Note 16 Capital and treasury risk management‘ on pages 93
to 99; and• ‘Treasury‘ on page 25.
(iii) Information regarding the Group’s material commitments for capital expenditureThe information set forth under the following headings of the Group’s Annual Report and Accounts 2011 furnished separately on 2 March 2012 under Form 6-K is incorporated by reference:
• ‘ Note 20 Commitments and contingent liabilities‘ on pages 102 to 103; and
• ‘ Note 10 Property, plant and equipment‘ on pages 86 and 87.
C. Research and development, patents and licences, etcThe information set forth under the heading ‘Bigger, better, faster innovation’ on pages 10 to 13 and ‘Note 3 Gross profit and operating costs‘ (first table) on page 72 of the Group’s Annual Report and Accounts 2011 furnished separately on 2 March 2012 under Form 6-K is incorporated by reference.
D. Trend informationPlease refer also to Item 3D ‘Risk Factors‘ on pages 4 to 7 of this report.
The information set forth under the following headings of the Group’s Annual Report and Accounts 2011 furnished separately on 2 March 2012 under Form 6-K is incorporated by reference:
• ‘Financial review 2011’ on pages 20 to 27; and• ‘Outlook’ on page 28.
Please refer also to ‘Financial Review 2010‘ within Item 5A of this report on pages 8 to 12.
E. Off-balance sheet arrangementsThe information set forth under the following headings of the Group’s Annual Report and Accounts 2011 furnished separately on 2 March 2012 under Form 6-K is incorporated by reference:
• ‘Off-balance sheet arrangements’ on page 24; • ‘ Note 16 Capital and treasury risk management’ on pages 93
to 99; and• ‘ Note 20 Commitments and contingent liabilities’ on pages 102
to 103.
F. Tabular disclosure of contractual obligationsThe information set forth under the heading ‘Contractual obligations at 31 December 2011‘ on page 24 of the Group’s Annual Report and Accounts 2011 furnished separately on 2 March 2012 under Form 6-K is incorporated by reference.
G. Safe harbourThis document may contain forward-looking statements, including ‘forward-looking statements’ within the meaning of the United States Private Securities Litigation Reform Act of 1995. Words such as ‘will’, ‘aim’, ‘expects’, ‘anticipates’, ‘intends’, ‘believes’, ’vision’, or the negative of these terms and other similar expressions of future performance or results and their negatives are intended to identify such forward-looking statements. These forward-looking statements are based upon current expectations and assumptions regarding anticipated developments and other factors affecting the Group. They are not historical facts, nor are they guarantees of future performance.
Because these forward-looking statements involve risks and uncertainties, there are important factors that could cause actual results to differ materially from those expressed or implied by these forward-looking statements, including, among others, competitive pricing and activities, economic slowdown, industry consolidation, access to credit markets, recruitment levels, reputational risks, commodity prices, continued availability of raw materials, prioritisation of projects, consumption levels, costs, the ability to maintain and manage key customer relationships and supply chain sources, consumer demands, currency values,
Unilever Annual Report on Form 20-F 2011
Form 20-F

interest rates, the ability to integrate acquisitions and complete planned divestitures, finalizing fair values related to prior acquisitions, the ability to complete planned restructuring activities, physical risks, environmental risks, the ability to manage sustainability, regulatory, tax and legal matters and resolve pending matters within current estimates, legislative, fiscal and regulatory developments, political, economic and social conditions in the geographic markets where the Group operates, completion of the Sustainable Development Report 2011 and new or changed priorities of the Boards. Further details of potential risks and uncertainties affecting the Group are described in the Group’s filings with the London Stock Exchange, Euronext Amsterdam and the US Securities and Exchange Commission, including the Group’s Annual Report on Form 20-F for the year ended 31 December 2011 and the Annual Report and Accounts 2011. These forward-looking statements speak only as of the date of this document. Except as required by any applicable law or regulation, the Group expressly disclaims any obligation or undertaking to release publicly any updates or revisions to any forward-looking statements contained herein to reflect any change in the Group’s expectations with regard thereto or any change in events, conditions or circumstances on which any such statement is based.
Item 6. Directors, Senior Management and Employees
A. Directors and senior management
(i) Name, experience and functionsThe information set forth under the following headings of the Group’s Annual Report and Accounts 2011 furnished separately on 2 March 2012 under Form 6-K is incorporated by reference:
• ‘Unilever Leadership Executive‘ on pages 34 and 35; • ‘Non-Executive Directors‘ on page 34;• ‘Board of Directors‘ on pages 34; and • ‘Our Directors‘ and ‘Our Committees‘ on pages 38 to 40.
(ii) Activities outside the issuing companyThe information set forth under the headings ‘Board of Directors‘, Non-Executive Directors‘ and ‘Unilever Leadership Executive (ULE)‘ on pages 34 and 35 of the Group’s Annual Report and Accounts 2011 furnished separately on 2 March 2012 under Form 6-K is incorporated by reference.
(iii) AgeThe information set forth under the headings ‘Board of Directors‘, Non-Executive Directors‘ and ‘Unilever Executive (ULE)‘ on pages 34 and 35 of the Group’s Annual Report and Accounts 2011 furnished separately on 2 March 2012 under Form 6-K is incorporated by reference.
(iv) Family relationshipThe information set forth under the heading ‘Executive Directors‘ (first paragraph) on page 39 of the Group’s Annual Report and Accounts 2011 furnished separately on 2 March 2012 under Form 6-K is incorporated by reference.
(v) Other arrangementsThe information set forth under the following headings of the Group’s Annual Report and Accounts 2011 furnished separately on 2 March 2012 under Form 6-K is incorporated by reference:
• ‘Executive Directors‘ (first paragraph) on page 39; and• ‘ Non-Executive Directors – Independence‘ on page 38.
B. CompensationThe information set forth under the following headings of the Group’s Annual Report and Accounts 2011 furnished separately on 2 March 2012 under Form 6-K is incorporated by reference:
• ‘Executive Directors‘ on pages 50 to 51;• ‘The supporting policies‘ on page 51;• ‘Our remuneration practices‘ on pages 52 to 54;• ‘Proposed changes from 2012 onwards‘ on page 55;• ‘ Executive Directors’ remuneration in 2011‘ on pages 55 to 57;• ‘Non-Executive Directors‘ on page 58 to 59;• ‘ Note 4C Share-based compensation plans‘ on pages 79 and 80;• ‘ Note 4A Staff and management costs – Key management
compensation‘ on page 73; and• ‘ Note 4B Pensions and similar obligations‘ on pages 73 to 78.
C. Board practicesThe information set forth under the following headings of the Group’s Annual Report and Accounts 2011 furnished separately on 2 March 2012 under Form 6-K is incorporated by reference:
• ‘Board of Directors‘ and ‘Unilever Leadership Executive (ULE)‘ pages 34 and 35;
• ‘Appointment of Directors‘ on page 37;• ‘Executive Directors‘ on page 38 and 39;• ‘Non-Executive Directors‘ on page 38;• ‘Our Committees‘ on pages 39 and 40;• ‘Report of the Audit Committee‘ on pages 46 and 47; and• ‘Directors’ Remuneration Report‘ on pages 50 to 59.
D. EmployeesThe information set forth under the following headings of the Group’s Annual Report and Accounts 2011 furnished separately on 2 March 2012 under Form 6-K is incorporated by reference:
• ‘Note 4A Staff and management costs’ – Average number of employees during the year on page 73; and
• ‘Employee number‘ on page 7.
We believe our relationship with our employees and any labour unions of which they may be part is satisfactory in all material respects.
E. Share ownershipThe information set forth under the following headings of the Group’s Annual Report and Accounts 2011 furnished separately on 2 March 2012 under Form 6-K is incorporated by reference:
• ‘Our remuneration practices‘ on pages 52 to 54; • ‘ Executive Directors’ remuneration in 2011‘ on pages 55 to 58;• ‘Non-Executive Directors‘ on page 58 to 59; and• ‘ Note 4C Share-based compensation plans‘ on pages 79
and 80.
13Unilever Annual Report on Form 20-F 2011
Form 20-F
14
Item 7. Major Shareholders and Related Party Transactions
A. Major shareholdersThe information set forth under the following headings of the Group’s Annual Report and Accounts 2011 furnished separately on 2 March 2012 under Form 6-K is incorporated by reference:
• ‘Foundation Unilever NV Trust office‘ and ‘Margarine Union (1930) Limited‘ on page 41 and 42; and
• ‘Analysis of shareholding‘ on page 124.
The principal trading markets upon which Unilever shares are listed are Euronext Amsterdam for NV depositary receipts of ordinary and preference shares and the London Stock Exchange for PLC ordinary shares. NV ordinary shares mainly trade in the form of depositary receipts for shares.
In the United States, NV New York Registry Shares and PLC American Depositary Receipts are traded on the New York Stock Exchange. Citibank, N.A. acts for NV and PLC as issuer, transfer agent and, in respect of the PLC American Depositary Receipts, depositary.
There have not been any significant trading suspensions in the past three years.
At 28 February 2012 there were 5,499 registered holders of NV New York Registry Shares and 977 registered holders of PLC American Depositary Receipts in the United States. We estimate that approximately 17% of NV’s ordinary shares were held in the United States (approximately 16% in 2010), while most holders of PLC ordinary shares are registered in the United Kingdom – approximately 98% in 2011 and 99% in 2010.
NV and PLC are separate companies with separate stock exchange listings and different shareholders. Shareholders cannot convert or exchange the shares of one for shares of the other and the relative share prices on the various markets can, and do, fluctuate. Each NV ordinary share represents the same underlying economic interest in the Unilever Group as each PLC ordinary share (save for exchange rate fluctuations).
If you are a shareholder of NV, you have an interest in a Dutch legal entity, your dividends will be paid in euros (converted into US dollars if you have shares registered in the United States) and you may be subject to tax in the Netherlands. If you are a shareholder of PLC, your interest is in a UK legal entity, your dividends will be paid in sterling (converted into US dollars if you have American Depositary Receipts) and you may be subject to UK tax. Nevertheless, the Equalisation Agreement means that as a shareholder of either company you effectively have an interest in the whole of Unilever. You have largely equal rights over our combined net profit and capital reserves as shown in the consolidated accounts.
The information set forth under the heading ‘Equalisation Agreement‘ on page 42 of the Group’s Annual Report and Accounts 2011 furnished separately on 2 March 2012 under Form 6-K is incorporated by reference.
B. Related party transactionsThe information set forth under the heading ‘Note 23 – Related party transactions‘ on page 107 of the Group’s Annual Report and Accounts 2011 furnished separately on 2 March 2012 under Form 6-K is incorporated by reference.
Transactions with related parties are conducted in accordance with agreed transfer pricing policies and include sales to joint ventures and associates. Other than those disclosed in the Group’s Annual Report and Accounts (and incorporated herein as above), there were no related party transactions that were material to the Group or to the related parties concerned that are required to be reported in 2011 or the two preceding years.
C. Interest of experts and counselNot applicable.
Unilever Annual Report on Form 20-F 2011
Form 20-F
15
Item 8. Financial Information
A. Consolidated statements and other financial informationPlease refer also to Item 18 ‘Financial Statements‘ on page 24 to 30 of this report.
The information set forth under the following headings of the Group’s Annual Report and Accounts 2011 furnished separately on 2 March 2012 under Form 6-K is incorporated by reference:
• ‘ Financial statements‘ on page 61 and pages 64 to 110;• ‘Legal proceedings‘ on page 103; and• ‘Financial calendar‘ on page 125.
Also see ‘Dividend record’ on page 3 of this report.
B. Significant changesThe information set forth in ‘Note 25 Events after the balance sheet date‘ on page 108 of the Group’s Annual Report and Accounts furnished separately on 2 March 2012 under Form 6-K is incorporated by reference.
Item 9. The Offer and Listing
A. Offer and listing detailsPlease refer to information given on page 14 under Item 7A ‘Major shareholders‘.
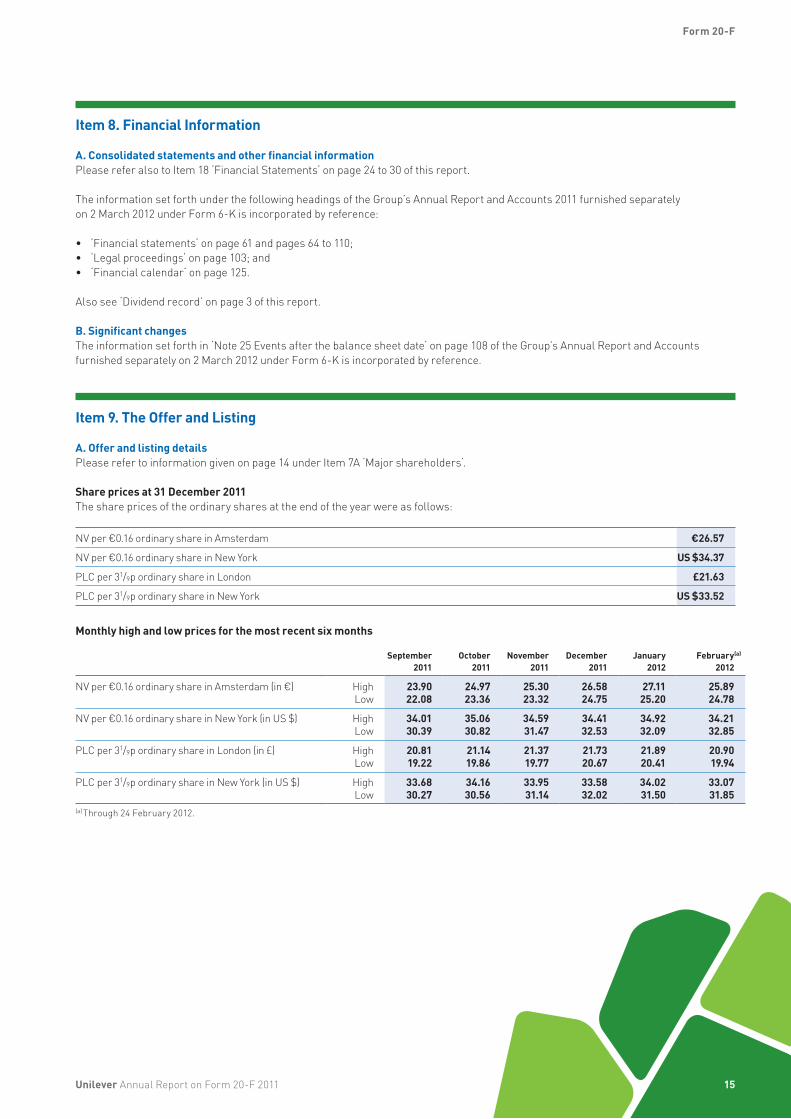
Share prices at 31 December 2011The share prices of the ordinary shares at the end of the year were as follows:
NV per €0.16 ordinary share in Amsterdam €26.57
NV per €0.16 ordinary share in New York US $34.37
PLC per 31/9p ordinary share in London £21.63
PLC per 31/9p ordinary share in New York US $33.52
Monthly high and low prices for the most recent six months
September2011
October2011
November2011
December2011
January2012
February(a)
2012
NV per €0.16 ordinary share in Amsterdam (in €) High 23.90 24.97 25.30 26.58 27.11 25.89Low 22.08 23.36 23.32 24.75 25.20 24.78
NV per €0.16 ordinary share in New York (in US $) High 34.01 35.06 34.59 34.41 34.92 34.21Low 30.39 30.82 31.47 32.53 32.09 32.85
PLC per 31/9p ordinary share in London (in £) High 20.81 21.14 21.37 21.73 21.89 20.90Low 19.22 19.86 19.77 20.67 20.41 19.94
PLC per 31/9p ordinary share in New York (in US $) High 33.68 34.16 33.95 33.58 34.02 33.07Low 30.27 30.56 31.14 32.02 31.50 31.85
(a) Through 24 February 2012.
Unilever Annual Report on Form 20-F 2011
Form 20-F

16
Quarterly high and low prices for 2011 and 2010
1st Quarter
2011
2nd Quarter
2011
3rd Quarter
2011
4th Quarter
2011
NV per €0.16 ordinary share in Amsterdam (in €) High 23.77 23.10 23.90 26.58Low 21.00 22.05 21.65 23.32
NV per €0.16 ordinary share in New York (in US $) High 31.72 33.50 34.24 35.06Low 29.07 31.35 30.39 30.82
PLC per 31/9p ordinary share in London (in £) High 19.72 20.06 20.81 21.73Low 17.93 18.85 18.92 19.77
PLC per 31/9p ordinary share in New York (in US $) High 31.03 32.96 34.30 34.16Low 28.65 30.59 30.27 30.56
1st Quarter
2010
2nd Quarter
2010
3rd Quarter
2010
4th Quarter
2010
NV per €0.16 ordinary share in Amsterdam (in €) High 23.00 23.89 24.11 24.08Low 20.82 21.17 20.68 20.82
NV per €0.16 ordinary share in New York (in US $) High 33.10 31.36 31.03 32.13Low 28.35 26.02 26.22 28.20
PLC per 31/9p ordinary share in London (in £) High 20.07 20.03 19.60 20.09Low 18.08 17.72 16.62 17.58
PLC per 31/9p ordinary share in New York (in US $) High 32.41 30.75 30.26 31.46Low 28.20 25.74 25.90 27.72
Annual high and low prices
2011 2010 2009 2008 2007
NV per €0.16 ordinary share in Amsterdam (in €) High 26.58 24.11 22.88 25.61 25.72Low 21.00 20.68 13.59 16.20 18.89
NV per €0.16 ordinary share in New York (in US $) High 35.06 33.10 32.80 37.18 37.31Low 29.07 26.02 17.04 21.27 24.94
PLC per 31/9p ordinary share in London (in £) High 21.73 20.09 20.15 19.47 19.24Low 17.93 16.62 12.30 12.49 13.20
PLC per 31/9p ordinary share in New York (in US $) High 34.30 32.41 32.19 38.02 38.25Low 28.65 25.74 17.04 20.22 25.57
B. Plan of distributionNot applicable.
C. MarketsThis information is set forth under the heading ‘The Unilever Group‘ on page 1 of this report.
D. Selling shareholdersNot applicable.
E. DilutionNot applicable.
F. Expenses of the issueNot applicable.
Unilever Annual Report on Form 20-F 2011
Form 20-F

Item 10. Additional Information
A. Share capitalNot applicable.
B. Memorandum and articles of associationThe information set forth under the following headings of the Group’s Annual Report and Accounts 2011 furnished separately on 2 March 2012 under Form 6-K is incorporated by reference.
• ‘Corporate governance‘ on pages 36 to 45; and• ‘Note 19 Share Capital‘ on pages 101 and 102.
C. Material contractsThe information set forth under the following headings of the Group’s Annual Report and Accounts 2011 furnished separately on 2 March 2012 under Form 6-K is incorporated by reference:
• ‘Financial Review 2011 – Acquisitions and disposals‘ on page 21; • ‘Note 21 Acquisition and disposals – 2010 and 2009‘ on pages 104 to 106; and• ‘Our Foundation agreements‘ on page 42.
D. Exchange controlsUnder the Netherlands Act on Financial Supervision (Wet op het financieel toezicht (Wft)) the Minister of Finance is authorised to issue regulations relating to financial transactions. To date no regulations of this type have been issued which are applicable to Unilever N.V.
There are currently no exchange controls affecting PLC shareholders.
E. Taxation
Taxation for US persons holding shares in NVThe following notes are provided for guidance. US persons should consult their local tax advisers, particularly in connection with potential liability to pay US taxes on disposal, lifetime gift or bequest of their shares. A US person is a US individual citizen or resident, a corporation organised under the laws of the United States, or any other legal person subject to US federal income tax on its worldwide income.
Taxation on dividends in the NetherlandsAs of 1 January 2007 dividends paid by companies in the Netherlands are in principle subject to dividend withholding tax of 15%. Where a shareholder is entitled to the benefits of the current Income Tax Convention (‘the Convention’) concluded on 18 December 1992 between the United States and the Netherlands, when dividends are paid by NV to:
• a corporation organised under the laws of the United States (or any territory of it) having no permanent establishment in the Netherlands of which such shares form a part of the business property; or
• any other legal person subject to United States Federal income tax with respect to its worldwide income, having no permanent establishment in the Netherlands of which such shares form a part of the business property, these dividends qualify for a reduction of withholding tax on dividends in the Netherlands from 15% to 5% if the beneficial owner is a company which directly holds at least 10% of the voting power of NV shares. The Convention provides, subject to certain conditions, for a complete exemption from, or refund of, Dutch dividend withholding tax if the beneficial owner is a qualified ‘Exempt Organisation’ as defined in Article 36 of the Convention.
Where a United States person has a permanent establishment in the Netherlands, which has shares in NV forming part of its business property, dividends it receives on those shares are included in that establishment’s profit. They are subject to income tax or corporation tax in the Netherlands, as appropriate, and tax on dividends in the Netherlands will generally be applied at the full rate of 15%. This tax should be treated as foreign income tax eligible for credit against the shareholder’s United States income taxes.
Under the Convention, qualifying United States organisations that are generally exempt from United States taxes and that are constituted and operated exclusively to administer or provide pension, retirement or other employee benefits may be exempt at source from withholding tax on dividends received from a Dutch corporation. A Competent Authority Agreement between the US and Dutch Tax Authorities on 6 August 2007, published in the US as Announcement 2007-75, 2007-2 Cumulative Bulletin 540 as amended by a Competent Authority Agreement published in the United States as Announcement 2010-26, 2010-1 Cumulative Bulletin 604, describes the eligibility of these US organisations for benefits under the Convention and procedures for claiming these benefits.
A United States trust, company or organisation that is operated exclusively for religious, charitable, scientific, educational or public purposes is subject to an initial 15% withholding tax rate. Such an exempt organisation is entitled to reclaim from Tax Authorities in the Netherlands a refund of the Dutch dividend tax, if and to the extent that it is exempt from United States Federal Income Tax and it would be exempt from tax in the Netherlands if it were organised and carried on all its activities there.
17Unilever Annual Report on Form 20-F 2011
Form 20-F
18
If you are an NV shareholder resident in any country other than the United States or the Netherlands, any exemption from, or reduction or refund of, dividend withholding tax in the Netherlands may be governed by the ‘Tax Regulation for the Kingdom of the Netherlands’ or by the tax convention or any other agreement for the avoidance of double taxation, if any, between the Netherlands and your country of residence.
United States taxation on dividendsIf you are a United States person, the dividend (including the withheld amount) up to the amount of our earnings and profits for United States Federal income tax purposes will be ordinary dividend income. Dividends received by an individual during taxable years before 2013 will be taxed at a maximum rate of 15%, provided the individual has held the shares for more than 60 days during the 121-day period beginning 60 days before the ex-dividend date, that NV is a qualified foreign corporation and that certain other conditions are satisfied. NV is a qualified foreign corporation for this purpose. Dividends received by an individual for taxable years after 2012 will be subject to tax at ordinary income rates and an additional tax will apply to dividends and other investment income received by individuals with incomes exceeding certain thresholds. The dividends are not eligible for the dividends received deduction allowed to corporations.
For US foreign tax credit purposes, the dividend is foreign source income, and withholding tax in the Netherlands is a foreign income tax that is eligible for credit against the shareholder’s United States income taxes. However, the rules governing the US foreign tax credit are complex, and additional limitations on the credit apply to individuals receiving dividends eligible for the 15% maximum tax rate on dividends described above.
Any portion of the dividend that exceeds our United States earnings and profits is subject to different rules. This portion is a tax free return of capital to the extent of your basis in our shares, and thereafter is treated as a gain on a disposition of the shares.
Under a provision of the Dividend Tax Act in the Netherlands and provided certain conditions are satisfied, NV is entitled to a credit (up to a maximum of 3% of the gross dividend from which dividend tax is withheld) against the amount of dividend tax withheld before remittance to tax authorities in the Netherlands. The United States tax authority may take the position that withholding tax in the Netherlands eligible for credit should be limited accordingly.
Disclosure requirements for US individual holdersBeginning with the 2011 tax year, US individuals that hold certain specified foreign financial assets, including stock in a foreign corporation, with values in excess of certain thresholds are required to file Form 8938 with their US Federal income tax return. Such Form requires disclosure of information concerning such foreign assets, including the value of the assets. Failure to file the form when required is subject to penalties. An exemption from reporting applies to foreign assets held through a US financial institution, generally including a non-US branch or subsidiary of a US institution and a US branch of a non-US institution. Investors are encouraged to consult with their own tax advisors regarding the possible application of this disclosure requirement to their investment in the shares.
Taxation on capital gains in the NetherlandsUnder the Convention, if you are a United States person and you have capital gains on the sale of shares of a Dutch company, these are generally not subject to taxation by the Netherlands. An exception to this rule generally applies if you have a permanent establishment in the Netherlands and the capital gain is derived from the sale of shares which form part of that permanent establishment’s business property.
Succession duty and gift taxes in the NetherlandsUnder the Estate and Inheritance Tax Convention between the United States and the Netherlands of 15 July 1969, individual US persons who are not Dutch citizens who have shares will generally not be subject to succession duty in the Netherlands on the individual’s death, unless the shares are part of the business property of a permanent establishment situated in the Netherlands.
A gift of shares of a Dutch company by a person who is not a resident or a deemed resident of the Netherlands is generally not subject to gift tax in the Netherlands. A non-resident Netherlands citizen, however, is still treated as a resident of the Netherlands for gift tax purposes for ten years and any other non-resident person for one year after leaving the Netherlands.
Taxation for US persons holding shares in PLCThe following notes are provided for guidance. US persons should consult their local tax advisers, particularly in connection with potential liability to pay US taxes on disposal, lifetime gift or bequest of their shares. A US person is a US individual citizen or resident, a corporation organised under the laws of the United States, or any other legal person subject to US federal income tax on its worldwide income.
United Kingdom taxation on dividendsUnder United Kingdom law, income tax is not withheld from dividends paid by United Kingdom companies. Shareholders, whether resident in the United Kingdom or not, receive the full amount of the dividend actually declared.
United States taxation on dividendsIf you are a US person, the dividend up to the amount of our earnings and profits for United States Federal income tax purposes will be ordinary dividend income. Dividends received by an individual during taxable years before 2013 will be taxed at a maximum rate of 15%, provided the individual has held the shares for more than 60 days during the 121-day period beginning 60 days before the ex-dividend date, that PLC is a qualified foreign corporation and certain other conditions are satisfied. PLC is a qualified foreign
Unilever Annual Report on Form 20-F 2011
Form 20-F
19
corporation for this purpose. Dividends received by an individual for taxable years after 2012 will be subject to tax at ordinary income rates, and an additional tax will apply to dividends and other investment income received by individuals with incomes exceeding certain thresholds. The dividend is not eligible for the dividends received deduction allowable to corporations. The dividend is foreign source income for US foreign tax credit purposes.
Any portion of the dividend that exceeds our United States earnings and profits is subject to different rules. This portion is a tax free return of capital to the extent of your basis in our shares, and thereafter is treated as a gain on a disposition of the shares.
Disclosure Requirements for US individual holdersBeginning with the 2011 tax year, US individuals that hold certain specified foreign financial assets, including stock in a foreign corporation, with values in excess of certain thresholds are required to file Form 8938 with their US Federal income tax return. Such Form requires disclosure of information concerning such foreign assets, including the value of the assets. Failure to file the form when required is subject to penalties. An exemption from reporting applies to foreign assets held through a US financial institution, generally including a non-US branch or subsidiary of a US institution and a US branch of a non-US institution. Investors are encouraged to consult with their own tax advisors regarding the possible application of this disclosure requirement to their investment in the shares.
UK taxation on capital gainsUnder United Kingdom law, when you sell shares you may be liable to pay capital gains tax. However, if you are either:
• an individual who is neither resident nor ordinarily resident in the United Kingdom; or• a company which is not resident in the United Kingdom
you will generally not be liable to United Kingdom tax on any capital gains made on disposal of your shares.
Two exceptions are: if the shares are held in connection with a trade or business which is conducted in the United Kingdom through a branch or an agency; and if the shares are held by an individual who has left the UK for a period of non-residence of less than five tax years having been resident for at least four of the seven tax years prior to leaving the UK.
UK inheritance taxUnder the current estate and gift tax convention between the United States and the United Kingdom, ordinary shares held by an individual shareholder who is:
• domiciled for the purposes of the convention in the United States; and• is not for the purposes of the convention a national of the United Kingdom
will not be subject to United Kingdom inheritance tax on:
• the individual’s death; or• on a gift of the shares during the individual’s lifetime.
The exception is if the shares are part of the business property of a permanent establishment of the individual in the United Kingdom or, in the case of a shareholder who performs independent personal services, pertain to a fixed base situated in the United Kingdom.
F. Dividends and paying agentsNot applicable.
G. Statement by expertsNot applicable.
H. Documents on displayThe information set forth under the heading ‘Shareholder information‘ on pages 123 to 126 of the Group’s Annual Report and Accounts 2011 furnished separately on 2 March 2012 under Form 6-K is incorporated by reference.
Unilever Annual Report on Form 20-F 2011Filed with the SEC on the SEC’s website. Printed copies are available, free of charge, upon request to Unilever PLC, Investor Relations Department, Unilever House, 100 Victoria Embankment, London EC4Y 0DY, United Kingdom.
Documents on display in the United StatesUnilever files and furnishes reports and information with the United States SEC. Such reports and information can be inspected and copied at the SEC’s public reference facilities in Washington DC, Chicago and New York. Certain of our reports and other information that we file or furnish to the SEC are also available to the public over the internet on the SEC’s website.
I. Subsidiary informationNot applicable.
Unilever Annual Report on Form 20-F 2011
Form 20-F

Item 11. Quantitative and Qualitative Disclosures About Market Risk
Please refer also to Item 3D ‘Risk Factors‘ of this report.
The information set forth under the following headings of the Group’s Annual Report and Accounts 2011 furnished separately on 2 March 2012 under Form 6-K is incorporated by reference:
• ‘Outlook‘ on page 28;• ‘Note 13 Trade and other receivables‘ on pages 88 to 89;• ‘Note 14 Trade payables and other liabilities‘ on page 89;• ‘Note 15 Financial assets and liabilities‘ on pages 90 to 92; and• ‘Note 16 Capital and treasury risk management‘ on pages 93 to 99.
Item 12. Description of Securities Other than Equity Securities
The Unilever Group has appointed Citibank, N.A. (‘Citibank’) as both its transfer agent and registrar pursuant to the New York Registered Share program for Unilever N.V. and as its depositary pursuant to its American Depositary Receipt program for Unilever PLC. Any fee arrangement with Citibank will therefore cover both programs.
D.3 Transfer Agent Fees and Charges for Unilever N.V.Although items 12.D.3 and 12.D.4 are not applicable to Unilever N.V. the following fees, charges and transfer agent payments are listed, as any fee arrangement with Citibank will cover both programs.
Under the terms of the Transfer Agent Agreement for the Unilever N.V. New York Registered Share program, a New York Share (NYS) holder may have to pay the following service fees to the transfer agent:
• Issuance of NYSs: Up to US 5¢ per NYS issued.• Cancellation of NYSs: Up to US 5¢ per NYS cancelled.
An NYS holder will also be responsible to pay certain fees and expenses incurred by the transfer agent and certain taxes and governmental charges such as:
• Fees for the transfer and registration of Shares charged by the registrar and transfer agent for the Shares in the Netherlands (i.e. upon deposit and withdrawal of Shares);
• Expenses incurred for converting foreign currency into US dollars;• Expenses for cable, telex and fax transmissions and for delivery of securities;• Taxes and duties upon the transfer of securities (i.e. when shares are deposited or withdrawn from deposit); and• Fees and expenses incurred in connection with the delivery or servicing of shares on deposit.
Transfer agent fees payable upon the issuance and cancellation of NYSs are typically paid to the transfer agent by the brokers (on behalf of their clients) receiving the newly-issued NYSs from the transfer agent and by the brokers (on behalf of their clients) delivering the NYSs to the transfer agent for cancellation. The brokers in turn charge these transaction fees to their clients.
Note that the fees and charges an investor may be required to pay may vary over time and may be changed by us and by the Transfer Agent. Notice of any changes will be given to investors.
D.3 Depositary Fees and Charges for Unilever PLCUnder the terms of the Deposit Agreement for the Unilever PLC American Depositary Shares (ADSs), an ADS holder may have to pay the following service fees to the depositary bank:
• Issuance of ADSs: Up to US 5¢ per ADS issued.• Cancellation of ADSs: Up to US 5¢ per ADS cancelled.
An ADS holder will also be responsible to pay certain fees and expenses incurred by the depositary bank and certain taxes and governmental charges such as:
• Fees for the transfer and registration of Shares charged by the registrar and transfer agent for the Shares in the United Kingdom (i.e., upon deposit and withdrawal of Shares);
• Expenses incurred for converting foreign currency into US dollars;• Expenses for cable, telex and fax transmissions and for delivery of securities;• Taxes and duties upon the transfer of securities (i.e. when shares are deposited or withdrawn from deposit); and• Fees and expenses incurred in connection with the delivery or servicing of shares on deposit.
20 Unilever Annual Report on Form 20-F 2011
Form 20-F
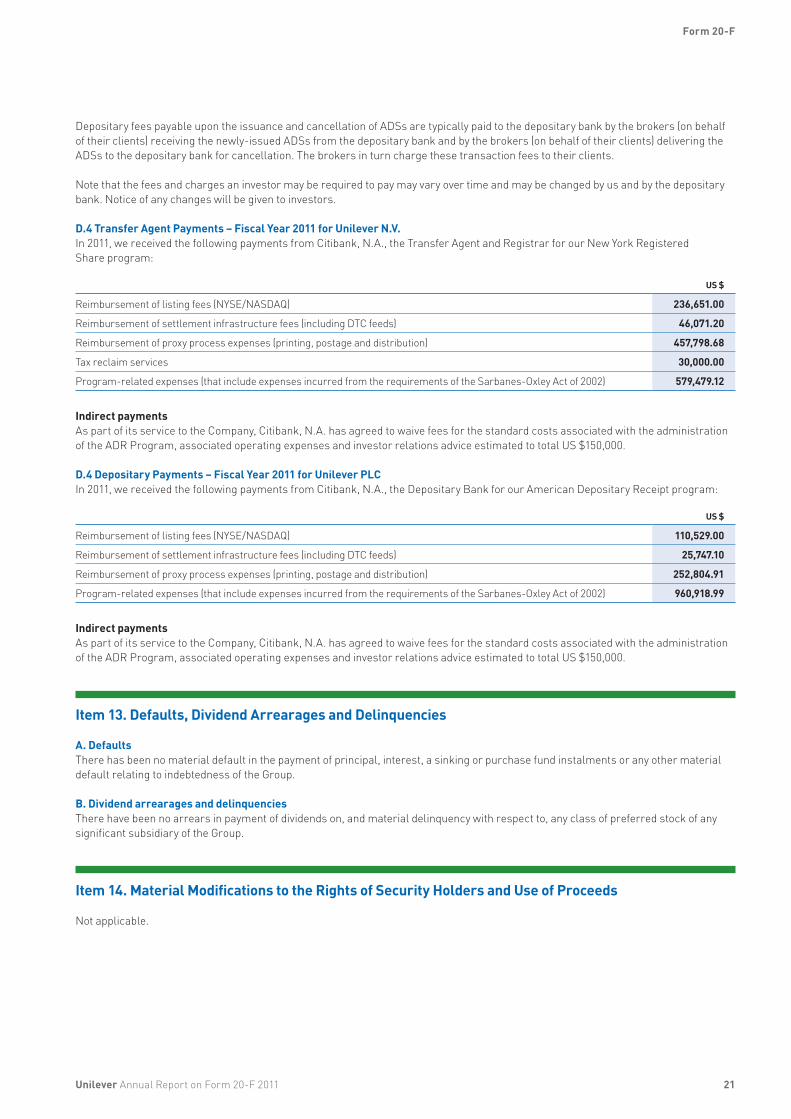
21
Depositary fees payable upon the issuance and cancellation of ADSs are typically paid to the depositary bank by the brokers (on behalf of their clients) receiving the newly-issued ADSs from the depositary bank and by the brokers (on behalf of their clients) delivering the ADSs to the depositary bank for cancellation. The brokers in turn charge these transaction fees to their clients.
Note that the fees and charges an investor may be required to pay may vary over time and may be changed by us and by the depositary bank. Notice of any changes will be given to investors.
D.4 Transfer Agent Payments – Fiscal Year 2011 for Unilever N.V.In 2011, we received the following payments from Citibank, N.A., the Transfer Agent and Registrar for our New York Registered Share program:
US $
Reimbursement of listing fees (NYSE/NASDAQ) 236,651.00
Reimbursement of settlement infrastructure fees (including DTC feeds) 46,071.20
Reimbursement of proxy process expenses (printing, postage and distribution) 457,798.68
Tax reclaim services 30,000.00
Program-related expenses (that include expenses incurred from the requirements of the Sarbanes-Oxley Act of 2002) 579,479.12
Indirect paymentsAs part of its service to the Company, Citibank, N.A. has agreed to waive fees for the standard costs associated with the administration of the ADR Program, associated operating expenses and investor relations advice estimated to total US $150,000.
D.4 Depositary Payments – Fiscal Year 2011 for Unilever PLCIn 2011, we received the following payments from Citibank, N.A., the Depositary Bank for our American Depositary Receipt program:
US $
Reimbursement of listing fees (NYSE/NASDAQ) 110,529.00
Reimbursement of settlement infrastructure fees (including DTC feeds) 25,747.10
Reimbursement of proxy process expenses (printing, postage and distribution) 252,804.91
Program-related expenses (that include expenses incurred from the requirements of the Sarbanes-Oxley Act of 2002) 960,918.99
Indirect paymentsAs part of its service to the Company, Citibank, N.A. has agreed to waive fees for the standard costs associated with the administration of the ADR Program, associated operating expenses and investor relations advice estimated to total US $150,000.
Item 13. Defaults, Dividend Arrearages and Delinquencies
A. DefaultsThere has been no material default in the payment of principal, interest, a sinking or purchase fund instalments or any other material default relating to indebtedness of the Group.
B. Dividend arrearages and delinquenciesThere have been no arrears in payment of dividends on, and material delinquency with respect to, any class of preferred stock of any significant subsidiary of the Group.
Item 14. Material Modifications to the Rights of Security Holders and Use of Proceeds
Not applicable.
Unilever Annual Report on Form 20-F 2011
Form 20-F
22
Item 15. Controls and Procedures
The information set forth under the headings ‘Report of Independent Registered Public Accounting Firm‘ in Item 18 on page 24 of this report,‘Our Risk Appetite and Approach to Risk Management‘ on page 33, ‘The United States‘ on pages 44 and 45 and ‘Risk management and internal control arrangements‘ on page 46 of the Group’s Annual Report and Accounts 2011 furnished separately on 2 March 2012 under Form 6-K is incorporated by reference.
Management’s report on internal control over financial reportingIn accordance with the requirements of Section 404 of the US Sarbanes-Oxley Act of 2002, the following report is provided by management in respect of the Company’s internal control over financial reporting (as defined in rule 13a–15(f) or rule 15d–15(f) under the US Securities Exchange Act of 1934):
• Unilever’s management is responsible for establishing and maintaining adequate internal control over financial reporting for the Group;
• Unilever’s management has used the Committee of Sponsoring Organizations of the Treadway Commission (COSO) framework to evaluate the effectiveness of our internal control over financial reporting. Management believes that the COSO framework is a suitable framework for its evaluation of our internal control over financial reporting because it is free from bias, permits reasonably consistent qualitative and quantitative measurements of internal controls, is sufficiently complete so that those relevant factors that would alter a conclusion about the effectiveness of internal controls are not omitted and is relevant to an evaluation of internal control over financial reporting;
• Management has assessed the effectiveness of internal control over financial reporting as of 31 December 2011, and has concluded that such internal control over financial reporting is effective; and
• PricewaterhouseCoopers LLP and PricewaterhouseCoopers Accountants N.V., who have audited the consolidated financial statements of the Group for the year ended 31 December 2011, have also audited the effectiveness of internal control over financial reporting as at 31 December 2011 and have issued an attestation report on internal control over financial reporting. For the Auditors’ Report please refer to Item 18 on page 24 of this report.
Item 16. Reserved
A. Audit Committee financial expertThe information set forth under the heading ‘Report of the Audit Committee‘ on pages 46 and 47 of the Group’s Annual Report and Accounts 2011 furnished separately on 2 March 2012 under Form 6-K is incorporated by reference.
B. Code of EthicsThe information set forth under the following headings of the Group’s Annual Report and Accounts 2011 furnished separately on 2 March 2012 under Form 6-K is incorporated by reference:
• ‘Foundation and principles‘ on page 33; and• ‘The United States‘ on pages 44 and 45.
Unilever Annual Report on Form 20-F 2011
Form 20-F
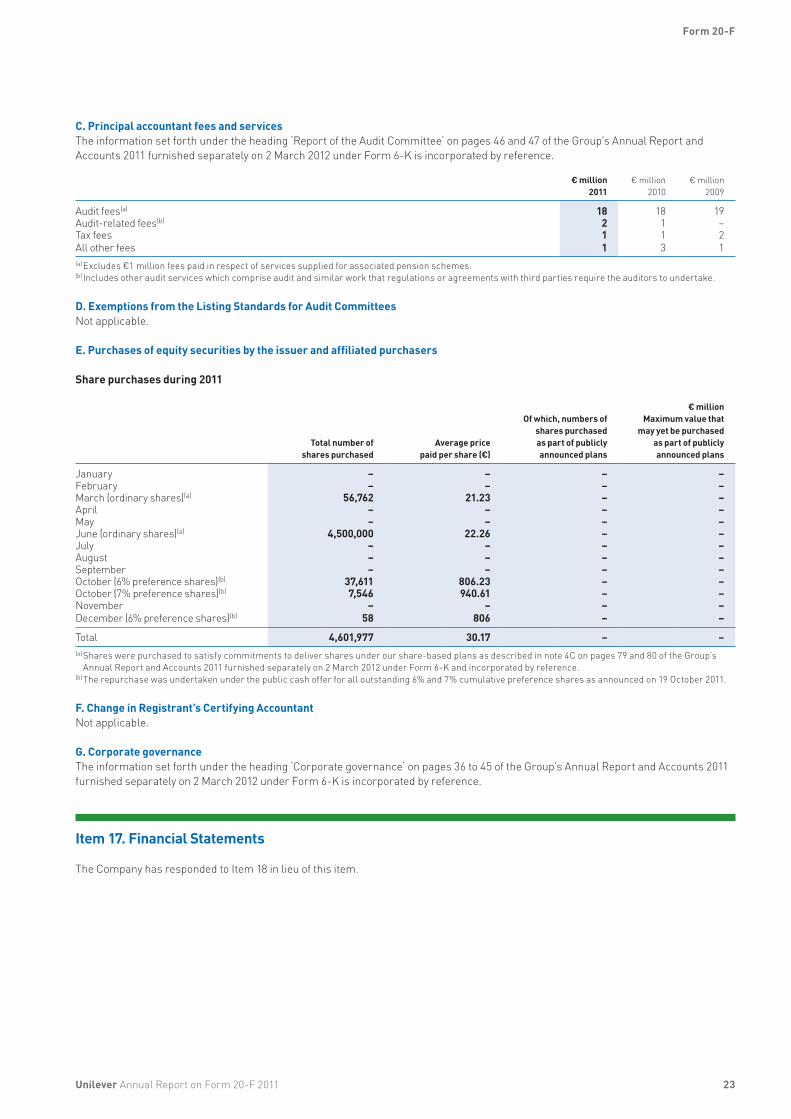
23
C. Principal accountant fees and servicesThe information set forth under the heading ‘Report of the Audit Committee‘ on pages 46 and 47 of the Group’s Annual Report and Accounts 2011 furnished separately on 2 March 2012 under Form 6-K is incorporated by reference.
€ million2011
€ million2010
€ million2009
Audit fees(a) 18 18 19Audit-related fees(b) 2 1 –Tax fees 1 1 2All other fees 1 3 1(a) Excludes €1 million fees paid in respect of services supplied for associated pension schemes.(b) Includes other audit services which comprise audit and similar work that regulations or agreements with third parties require the auditors to undertake.
D. Exemptions from the Listing Standards for Audit CommitteesNot applicable.
E. Purchases of equity securities by the issuer and affiliated purchasers
Share purchases during 2011
Total number of shares purchased
Average price paid per share (€)
Of which, numbers ofshares purchased as part of publicly announced plans
€ millionMaximum value that
may yet be purchased as part of publicly announced plans
January – – – –February – – – –March (ordinary shares)(a) 56,762 21.23 – –April – – – –May – – – –June (ordinary shares)(a) 4,500,000 22.26 – –July – – – –August – – – –September – – – –October (6% preference shares)(b) 37,611 806.23 – –October (7% preference shares)(b) 7,546 940.61 – –November – – – –December (6% preference shares)(b) 58 806 – –
Total 4,601,977 30.17 – –(a) Shares were purchased to satisfy commitments to deliver shares under our share-based plans as described in note 4C on pages 79 and 80 of the Group’s
Annual Report and Accounts 2011 furnished separately on 2 March 2012 under Form 6-K and incorporated by reference.(b) The repurchase was undertaken under the public cash offer for all outstanding 6% and 7% cumulative preference shares as announced on 19 October 2011.
F. Change in Registrant’s Certifying AccountantNot applicable.
G. Corporate governanceThe information set forth under the heading ‘Corporate governance‘ on pages 36 to 45 of the Group’s Annual Report and Accounts 2011 furnished separately on 2 March 2012 under Form 6-K is incorporated by reference.
Item 17. Financial Statements
The Company has responded to Item 18 in lieu of this item.
Unilever Annual Report on Form 20-F 2011
Form 20-F
24
Item 18. Financial Statements
The information set forth under the heading ‘Financial statements‘ on page 61 and pages 64 to 110 of the Group’s Annual Report and Accounts 2011 furnished separately on 2 March 2012 under Form 6-K is incorporated by reference.
To the Directors and shareholders
Report of Independent Registered Public Accounting FirmIn our opinion, the consolidated income statements and the related consolidated balance sheets, consolidated cash flow statements, consolidated statements of comprehensive income and consolidated statements of changes in equity set forth under the heading ‘Financial Statements’ on pages 64 to 108 (excluding Note 24 on page 108 of Unilever Group’s Annual Report and Accounts 2011 and the Guarantor financial information included in Item 18 of this Form 20-F present fairly, in all material respects, the financial position of the Unilever Group at 31 December 2011 and 31 December 2010 and the results of its operations and its cash flows for each of the three years in the period ended 31 December 2011, in conformity with International Financial Reporting Standards (IFRS) as issued by the International Accounting Standards Board and in conformity with IFRS as adopted by the European Union. Also in our opinion, the Group maintained, in all material respects, effective internal control over financial reporting as of 31 December 2011, based on criteria established in Internal Control – Integrated Framework issued by the Committee of Sponsoring Organizations of the Treadway Commission (COSO). The Group’s Directors and management are responsible for these consolidated financial statements.
The Group’s management is responsible for maintaining effective internal control over financial reporting and for its assessment of the effectiveness of internal control over financial reporting, included in the accompanying ‘Management’s report on internal control over financial reporting’ included in Item 15 of this Form 20-F. Our responsibility is to express opinions on these consolidated financial statements and on the Group’s internal control over financial reporting based on our integrated audits. We conducted our audits in accordance with the standards of the Public Company Accounting Oversight Board (United States). Those standards require that we plan and perform the audits to obtain reasonable assurance about whether the consolidated financial statements are free of material misstatement and whether effective internal control over financial reporting was maintained in all material respects. Our audits of the consolidated financial statements included examining, on a test basis, evidence supporting the amounts and disclosures in the consolidated financial statements, assessing the accounting principles used and significant estimates made by management, and evaluating the overall consolidated financial statements presentation. Our audit of internal control over financial reporting included obtaining an understanding of internal control over financial reporting, assessing the risk that a material weakness exists, and testing and evaluating the design and operating effectiveness of internal control based on the assessed risk. Our audits also included performing such other procedures as we considered necessary in the circumstances. We believe that our audits provide a reasonable basis for our opinions.
A company’s internal control over financial reporting is a process designed to provide reasonable assurance regarding the reliability of financial reporting and the preparation of consolidated financial statements for external purposes in accordance with generally accepted accounting principles. A company’s internal control over financial reporting includes those policies and procedures that (i) pertain to the maintenance of records that, in reasonable detail, accurately and fairly reflect the transactions and dispositions of the assets of the company; (ii) provide reasonable assurance that transactions are recorded as necessary to permit preparation of consolidated financial statements in accordance with generally accepted accounting principles, and that receipts and expenditures of the company are being made only in accordance with authorisations of management and Directors of the company; and (iii) provide reasonable assurance regarding prevention or timely detection of unauthorised acquisition, use, or disposition of the company’s assets that could have a material effect on the consolidated financial statements.
Because of its inherent limitations, internal control over financial reporting may not prevent or detect misstatements. Also, projections of any evaluation of effectiveness to future periods are subject to the risk that controls may become inadequate because of changes in conditions, or that the degree of compliance with the policies or procedures may deteriorate.
Amsterdam, The Netherlands, 28 February 2012 PricewaterhouseCoopers LLPPricewaterhouseCoopers Accountants N.V. London, United KingdomAs auditors of Unilever N.V. As auditors of Unilever PLC
R A J Swaak RA 28 February 2012
Unilever Annual Report on Form 20-F 2011
Form 20-F
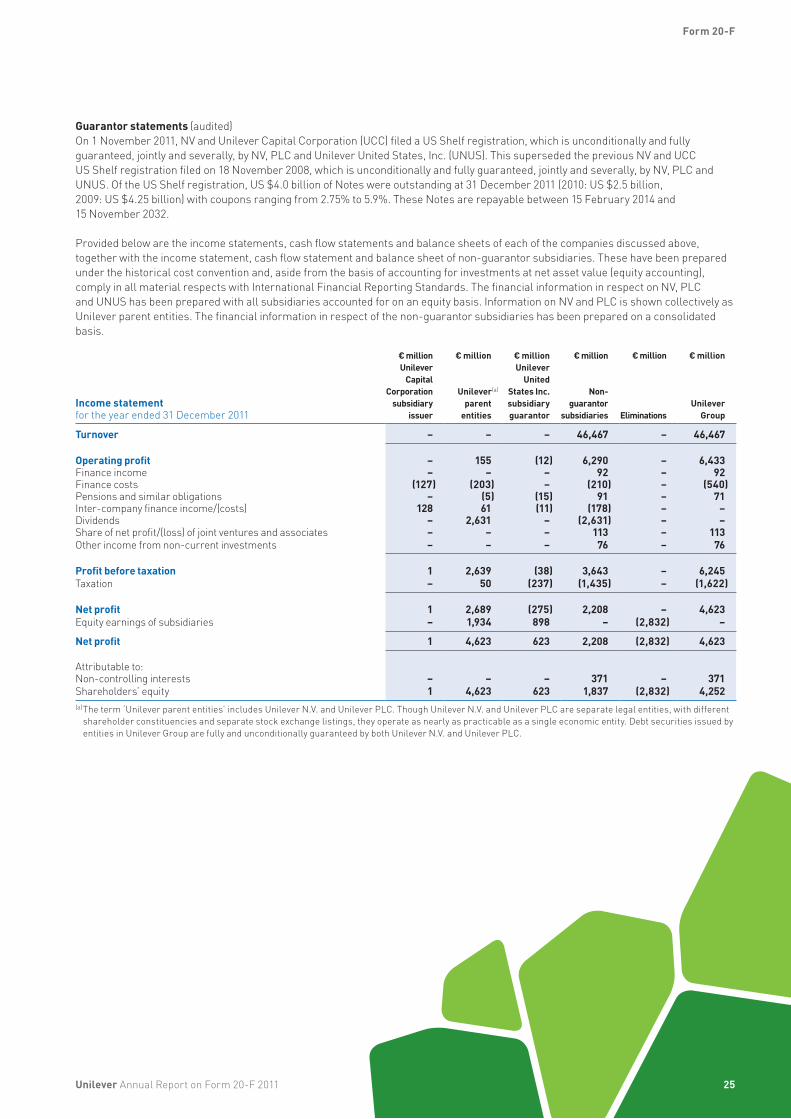
25
Guarantor statements (audited)On 1 November 2011, NV and Unilever Capital Corporation (UCC) filed a US Shelf registration, which is unconditionally and fully guaranteed, jointly and severally, by NV, PLC and Unilever United States, Inc. (UNUS). This superseded the previous NV and UCC US Shelf registration filed on 18 November 2008, which is unconditionally and fully guaranteed, jointly and severally, by NV, PLC and UNUS. Of the US Shelf registration, US $4.0 billion of Notes were outstanding at 31 December 2011 (2010: US $2.5 billion, 2009: US $4.25 billion) with coupons ranging from 2.75% to 5.9%. These Notes are repayable between 15 February 2014 and 15 November 2032.
Provided below are the income statements, cash flow statements and balance sheets of each of the companies discussed above, together with the income statement, cash flow statement and balance sheet of non-guarantor subsidiaries. These have been prepared under the historical cost convention and, aside from the basis of accounting for investments at net asset value (equity accounting), comply in all material respects with International Financial Reporting Standards. The financial information in respect on NV, PLC and UNUS has been prepared with all subsidiaries accounted for on an equity basis. Information on NV and PLC is shown collectively as Unilever parent entities. The financial information in respect of the non-guarantor subsidiaries has been prepared on a consolidated basis.
Income statement for the year ended 31 December 2011
€ millionUnilever
CapitalCorporation
subsidiary issuer
€ million
Unilever(a)
parententities
€ millionUnilever
UnitedStates Inc.subsidiaryguarantor
€ million
Non-guarantor
subsidiaries
€ million
Eliminations
€ million
Unilever Group
Turnover – – – 46,467 – 46,467
Operating profit – 155 (12) 6,290 – 6,433Finance income – – – 92 – 92Finance costs (127) (203) – (210) – (540)Pensions and similar obligations – (5) (15) 91 – 71Inter-company finance income/(costs) 128 61 (11) (178) – –Dividends – 2,631 – (2,631) – –Share of net profit/(loss) of joint ventures and associates – – – 113 – 113Other income from non-current investments – – – 76 – 76
Profit before taxation 1 2,639 (38) 3,643 – 6,245Taxation – 50 (237) (1,435) – (1,622)
Net profit 1 2,689 (275) 2,208 – 4,623Equity earnings of subsidiaries – 1,934 898 – (2,832) –
Net profit 1 4,623 623 2,208 (2,832) 4,623
Attributable to:Non-controlling interests – – – 371 – 371Shareholders’ equity 1 4,623 623 1,837 (2,832) 4,252(a) The term ‘Unilever parent entities’ includes Unilever N.V. and Unilever PLC. Though Unilever N.V. and Unilever PLC are separate legal entities, with different
shareholder constituencies and separate stock exchange listings, they operate as nearly as practicable as a single economic entity. Debt securities issued by entities in Unilever Group are fully and unconditionally guaranteed by both Unilever N.V. and Unilever PLC.
Unilever Annual Report on Form 20-F 2011
Form 20-F
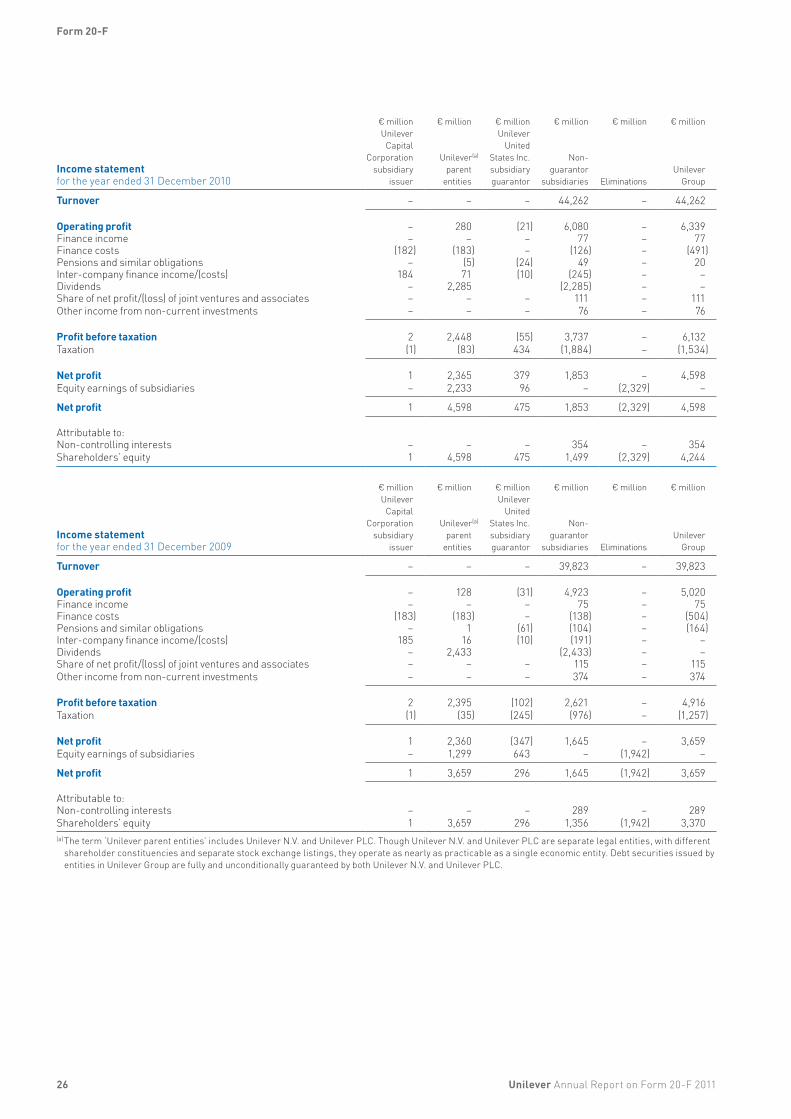
26
Income statement for the year ended 31 December 2010
€ millionUnilever
CapitalCorporation
subsidiary issuer
€ million
Unilever(a)
parententities
€ millionUnilever
UnitedStates Inc.subsidiaryguarantor
€ million
Non-guarantor
subsidiaries
€ million
Eliminations
€ million
Unilever Group
Turnover – – – 44,262 – 44,262
Operating profit – 280 (21) 6,080 – 6,339Finance income – – – 77 – 77Finance costs (182) (183) – (126) – (491)Pensions and similar obligations – (5) (24) 49 – 20Inter-company finance income/(costs) 184 71 (10) (245) – –Dividends – 2,285 (2,285) – –Share of net profit/(loss) of joint ventures and associates – – – 111 – 111Other income from non-current investments – – – 76 – 76
Profit before taxation 2 2,448 (55) 3,737 – 6,132Taxation (1) (83) 434 (1,884) – (1,534)
Net profit 1 2,365 379 1,853 – 4,598Equity earnings of subsidiaries – 2,233 96 – (2,329) –
Net profit 1 4,598 475 1,853 (2,329) 4,598
Attributable to:Non-controlling interests – – – 354 – 354Shareholders’ equity 1 4,598 475 1,499 (2,329) 4,244
Income statement for the year ended 31 December 2009
€ millionUnilever
CapitalCorporation
subsidiary issuer
€ million
Unilever(a)
parent entities
€ millionUnilever
UnitedStates Inc.subsidiaryguarantor
€ million
Non-guarantor
subsidiaries
€ million
Eliminations
€ million
Unilever Group
Turnover – – – 39,823 – 39,823
Operating profit – 128 (31) 4,923 – 5,020Finance income – – – 75 – 75Finance costs (183) (183) – (138) – (504)Pensions and similar obligations – 1 (61) (104) – (164)Inter-company finance income/(costs) 185 16 (10) (191) – –Dividends – 2,433 (2,433) – –Share of net profit/(loss) of joint ventures and associates – – – 115 – 115Other income from non-current investments – – – 374 – 374
Profit before taxation 2 2,395 (102) 2,621 – 4,916Taxation (1) (35) (245) (976) – (1,257)
Net profit 1 2,360 (347) 1,645 – 3,659Equity earnings of subsidiaries – 1,299 643 – (1,942) –
Net profit 1 3,659 296 1,645 (1,942) 3,659
Attributable to:Non-controlling interests – – – 289 – 289Shareholders’ equity 1 3,659 296 1,356 (1,942) 3,370(a) The term ‘Unilever parent entities’ includes Unilever N.V. and Unilever PLC. Though Unilever N.V. and Unilever PLC are separate legal entities, with different
shareholder constituencies and separate stock exchange listings, they operate as nearly as practicable as a single economic entity. Debt securities issued by entities in Unilever Group are fully and unconditionally guaranteed by both Unilever N.V. and Unilever PLC.
Unilever Annual Report on Form 20-F 2011
Form 20-F
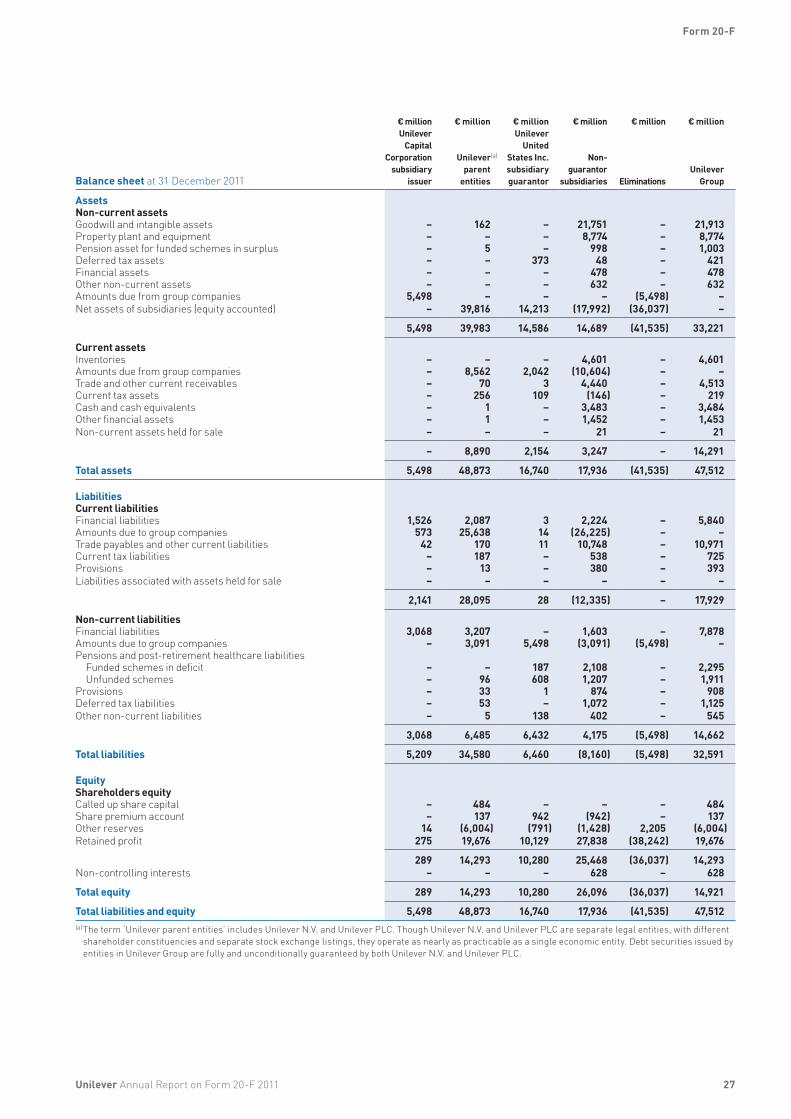
27
Balance sheet at 31 December 2011
€ millionUnilever
CapitalCorporation
subsidiary issuer
€ million
Unilever(a)
parententities
€ millionUnilever
UnitedStates Inc.subsidiaryguarantor
€ million
Non-guarantor
subsidiaries
€ million
Eliminations
€ million
Unilever Group
AssetsNon-current assetsGoodwill and intangible assets – 162 – 21,751 – 21,913Property plant and equipment – – – 8,774 – 8,774Pension asset for funded schemes in surplus – 5 – 998 – 1,003Deferred tax assets – – 373 48 – 421Financial assets – – – 478 – 478Other non-current assets – – – 632 – 632Amounts due from group companies 5,498 – – – (5,498) –Net assets of subsidiaries (equity accounted) – 39,816 14,213 (17,992) (36,037) –
5,498 39,983 14,586 14,689 (41,535) 33,221
Current assetsInventories – – – 4,601 – 4,601Amounts due from group companies – 8,562 2,042 (10,604) – –Trade and other current receivables – 70 3 4,440 – 4,513Current tax assets – 256 109 (146) – 219Cash and cash equivalents – 1 – 3,483 – 3,484Other financial assets – 1 – 1,452 – 1,453Non-current assets held for sale – – – 21 – 21
– 8,890 2,154 3,247 – 14,291
Total assets 5,498 48,873 16,740 17,936 (41,535) 47,512
LiabilitiesCurrent liabilitiesFinancial liabilities 1,526 2,087 3 2,224 – 5,840Amounts due to group companies 573 25,638 14 (26,225) – –Trade payables and other current liabilities 42 170 11 10,748 – 10,971Current tax liabilities – 187 – 538 – 725Provisions – 13 – 380 – 393Liabilities associated with assets held for sale – – – – – –
2,141 28,095 28 (12,335) – 17,929
Non-current liabilitiesFinancial liabilities 3,068 3,207 – 1,603 – 7,878Amounts due to group companies – 3,091 5,498 (3,091) (5,498) –Pensions and post-retirement healthcare liabilities
Funded schemes in deficit – – 187 2,108 – 2,295Unfunded schemes – 96 608 1,207 – 1,911
Provisions – 33 1 874 – 908Deferred tax liabilities – 53 – 1,072 – 1,125Other non-current liabilities – 5 138 402 – 545
3,068 6,485 6,432 4,175 (5,498) 14,662
Total liabilities 5,209 34,580 6,460 (8,160) (5,498) 32,591
EquityShareholders equityCalled up share capital – 484 – – – 484Share premium account – 137 942 (942) – 137Other reserves 14 (6,004) (791) (1,428) 2,205 (6,004)Retained profit 275 19,676 10,129 27,838 (38,242) 19,676
289 14,293 10,280 25,468 (36,037) 14,293Non-controlling interests – – – 628 – 628
Total equity 289 14,293 10,280 26,096 (36,037) 14,921
Total liabilities and equity 5,498 48,873 16,740 17,936 (41,535) 47,512(a) The term ‘Unilever parent entities’ includes Unilever N.V. and Unilever PLC. Though Unilever N.V. and Unilever PLC are separate legal entities, with different
shareholder constituencies and separate stock exchange listings, they operate as nearly as practicable as a single economic entity. Debt securities issued by entities in Unilever Group are fully and unconditionally guaranteed by both Unilever N.V. and Unilever PLC.
Unilever Annual Report on Form 20-F 2011
Form 20-F

28
Balance sheet at 31 December 2010
€ millionUnilever
CapitalCorporation
subsidiary issuer
€ million
Unilever(a)
parententities
€ millionUnilever
UnitedStates Inc.subsidiaryguarantor
€ million
Non-guarantor
subsidiaries
€ million
Eliminations
€ million
Unilever Group
AssetsNon-current assetsGoodwill and intangible assets – 120 – 18,113 – 18,233Property, plant and equipment – – – 7,854 – 7,854Pension asset for funded schemes in surplus – 6 14 890 – 910Deferred tax assets – – 383 224 – 607Financial assets – – – 511 – 511Other non-current assets – – – 523 – 523Amounts due from group companies(b) 5,060 3,912 – (3,912) (5,060) –Net assets of subsidiaries (equity accounted) – 38,986 11,662 (15,939) (34,709) –
5,060 43,024 12,059 8,264 (39,769) 28,638
Current assetsInventories – – – 4,307 – 4,307Amounts due from group companies – 2,495 1,968 (4,463) – –Trade and other current receivables – 69 6 4,067 – 4,142Current tax assets – 213 77 8 – 298Other financial assets – – – 550 – 550Cash and cash equivalents – – (3) 2,319 – 2,316Non-current assets held for sale – – – 921 – 921
– 2,777 2,048 7,709 – 12,534
Total current assets 5,060 45,801 14,107 15,973 (39,769) 41,172
LiabilitiesCurrent liabilitiesOther financial liabilities 224 560 – 1,492 – 2,276Amounts due to group companies(b) 2,678 21,538 13 (24,229) – –Trade payables and other current liabilities 24 171 16 10,028 – 10,239Current tax liabilities 1 266 6 369 – 642Provisions – 126 – 295 – 421Liabilities associated with assets held for sale – – – 30 – 30
2,927 22,661 35 (12,015) – 13,608
Non-current liabilitiesFinancial liabilities 1,853 4,099 – 1,306 – 7,258Amounts due to group companies(b) – 4,407 5,062 (4,409) (5,060) –Pensions and post-retirement healthcare liabilities
Funded schemes in deficit – – – 1,081 – 1,081Unfunded schemes – 95 610 1,194 – 1,899
Provisions – 21 2 863 – 886Deferred tax liabilities – 29 – 851 – 880Other non-current liabilities – 4 119 359 – 482
1,853 8,655 5,793 1,245 (5,060) 12,486
Total liabilities 4,780 31,316 5,828 (10,770) (5,060) 26,094
EquityShareholders’ equityCalled up share capital – 484 – – – 484Share premium account – 134 106 (106) – 134Other reserves 6 (5,406) (619) (981) 1,594 (5,406)Retained profit 274 19,273 8,792 27,237 (36,303) 19,273
Total equity 280 14,485 8,279 26,150 (34,709) 14,485Non-controlling interests – – – 593 – 593
Total equity 280 14,485 8,279 26,743 (34,709) 15,078
Total liabilities and equity 5,060 45,801 14,107 15,973 (39,769) 41,172(a) The term ‘Unilever parent entities’ includes Unilever N.V. and Unilever PLC. Though Unilever N.V. and Unilever PLC are separate legal entities, with different
shareholder constituencies and separate stock exchange listings, they operate as nearly as practicable as a single economic entity. Debt securities issued by entities in Unilever Group are fully and unconditionally guaranteed by both Unilever N.V. and Unilever PLC.
(b) Figures revised from 2010 20-F to reflect amounts due from/to group companies. These figures are eliminated on consolidation. In addition, the 2010 balance sheet for Unilever Group and non guarantor subsidiaries have been restated to include further facts and circumstances relating
to the Sara Lee acquisition which if known would have affected the measurement of the amounts recognised at that date. The information set forth under the heading’ Note 21 Acquisitions and disposals’ on pages 105 to 106 of the Group’s Annual Report and Accounts 2011 furnished separately on 2 March 2012 under Form 6-K is incorporated by reference.
Unilever Annual Report on Form 20-F 2011
Form 20-F
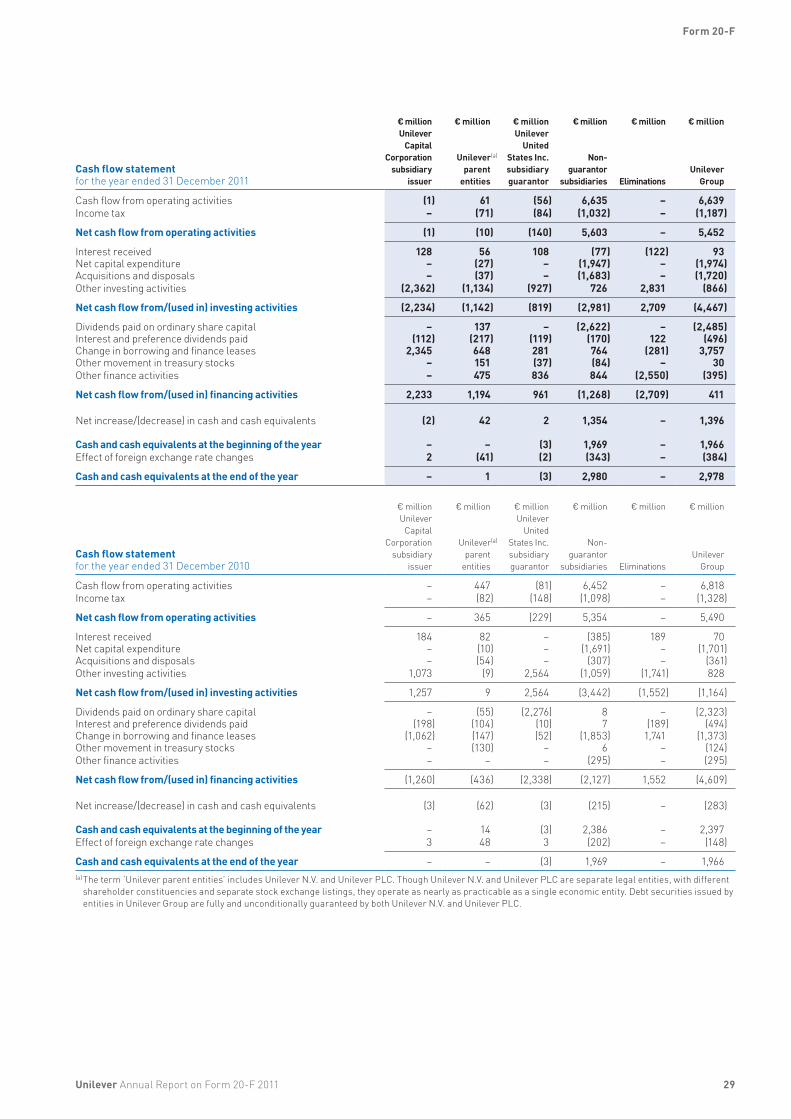
29
Cash flow statementfor the year ended 31 December 2011
€ millionUnilever
CapitalCorporation
subsidiary issuer
€ million
Unilever(a)
parententities
€ millionUnilever
UnitedStates Inc.subsidiaryguarantor
€ million
Non-guarantor
subsidiaries
€ million
Eliminations
€ million
Unilever Group
Cash flow from operating activities (1) 61 (56) 6,635 – 6,639Income tax – (71) (84) (1,032) – (1,187)
Net cash flow from operating activities (1) (10) (140) 5,603 – 5,452
Interest received 128 56 108 (77) (122) 93Net capital expenditure – (27) – (1,947) – (1,974)Acquisitions and disposals – (37) – (1,683) – (1,720)Other investing activities (2,362) (1,134) (927) 726 2,831 (866)
Net cash flow from/(used in) investing activities (2,234) (1,142) (819) (2,981) 2,709 (4,467)
Dividends paid on ordinary share capital – 137 – (2,622) – (2,485)Interest and preference dividends paid (112) (217) (119) (170) 122 (496)Change in borrowing and finance leases 2,345 648 281 764 (281) 3,757Other movement in treasury stocks – 151 (37) (84) – 30Other finance activities – 475 836 844 (2,550) (395)
Net cash flow from/(used in) financing activities 2,233 1,194 961 (1,268) (2,709) 411
Net increase/(decrease) in cash and cash equivalents (2) 42 2 1,354 – 1,396
Cash and cash equivalents at the beginning of the year – – (3) 1,969 – 1,966Effect of foreign exchange rate changes 2 (41) (2) (343) – (384)
Cash and cash equivalents at the end of the year – 1 (3) 2,980 – 2,978
Cash flow statementfor the year ended 31 December 2010
€ millionUnilever
CapitalCorporation
subsidiary issuer
€ million
Unilever(a)
parententities
€ millionUnilever
UnitedStates Inc.subsidiaryguarantor
€ million
Non-guarantor
subsidiaries
€ million
Eliminations
€ million
Unilever Group
Cash flow from operating activities – 447 (81) 6,452 – 6,818Income tax – (82) (148) (1,098) – (1,328)
Net cash flow from operating activities – 365 (229) 5,354 – 5,490
Interest received 184 82 – (385) 189 70Net capital expenditure – (10) – (1,691) – (1,701)Acquisitions and disposals – (54) – (307) – (361)Other investing activities 1,073 (9) 2,564 (1,059) (1,741) 828
Net cash flow from/(used in) investing activities 1,257 9 2,564 (3,442) (1,552) (1,164)
Dividends paid on ordinary share capital – (55) (2,276) 8 – (2,323)Interest and preference dividends paid (198) (104) (10) 7 (189) (494)Change in borrowing and finance leases (1,062) (147) (52) (1,853) 1,741 (1,373)Other movement in treasury stocks – (130) – 6 – (124)Other finance activities – – – (295) – (295)
Net cash flow from/(used in) financing activities (1,260) (436) (2,338) (2,127) 1,552 (4,609)
Net increase/(decrease) in cash and cash equivalents (3) (62) (3) (215) – (283)
Cash and cash equivalents at the beginning of the year – 14 (3) 2,386 – 2,397Effect of foreign exchange rate changes 3 48 3 (202) – (148)
Cash and cash equivalents at the end of the year – – (3) 1,969 – 1,966(a) The term ‘Unilever parent entities’ includes Unilever N.V. and Unilever PLC. Though Unilever N.V. and Unilever PLC are separate legal entities, with different
shareholder constituencies and separate stock exchange listings, they operate as nearly as practicable as a single economic entity. Debt securities issued by entities in Unilever Group are fully and unconditionally guaranteed by both Unilever N.V. and Unilever PLC.
Unilever Annual Report on Form 20-F 2011
Form 20-F
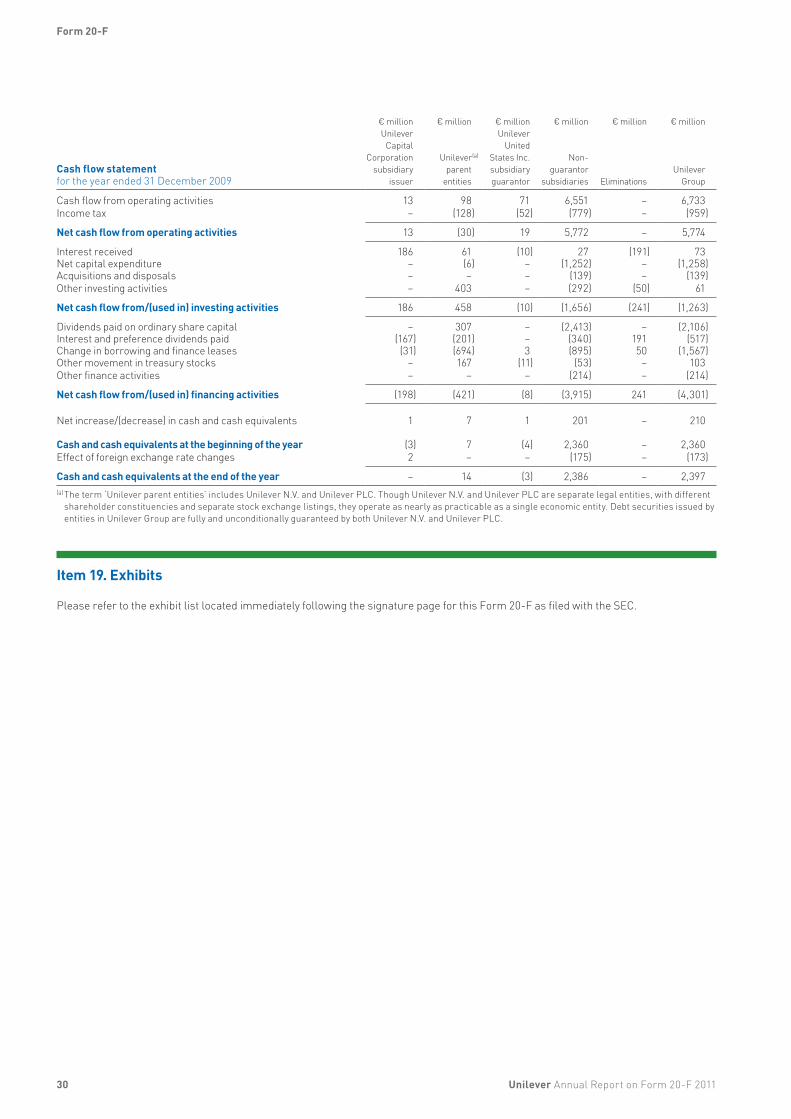
30
Cash flow statementfor the year ended 31 December 2009
€ millionUnilever
CapitalCorporation
subsidiary issuer
€ million
Unilever(a)
parententities
€ millionUnilever
UnitedStates Inc.subsidiaryguarantor
€ million
Non-guarantor
subsidiaries
€ million
Eliminations
€ million
Unilever Group
Cash flow from operating activities 13 98 71 6,551 – 6,733Income tax – (128) (52) (779) – (959)
Net cash flow from operating activities 13 (30) 19 5,772 – 5,774
Interest received 186 61 (10) 27 (191) 73Net capital expenditure – (6) – (1,252) – (1,258) Acquisitions and disposals – – – (139) – (139) Other investing activities – 403 – (292) (50) 61
Net cash flow from/(used in) investing activities 186 458 (10) (1,656) (241) (1,263)
Dividends paid on ordinary share capital – 307 – (2,413) – (2,106) Interest and preference dividends paid (167) (201) – (340) 191 (517) Change in borrowing and finance leases (31) (694) 3 (895) 50 (1,567) Other movement in treasury stocks – 167 (11) (53) – 103Other finance activities – – – (214) – (214)
Net cash flow from/(used in) financing activities (198) (421) (8) (3,915) 241 (4,301)
Net increase/(decrease) in cash and cash equivalents 1 7 1 201 – 210
Cash and cash equivalents at the beginning of the year (3) 7 (4) 2,360 – 2,360Effect of foreign exchange rate changes 2 – – (175) – (173)
Cash and cash equivalents at the end of the year – 14 (3) 2,386 – 2,397(a) The term ‘Unilever parent entities’ includes Unilever N.V. and Unilever PLC. Though Unilever N.V. and Unilever PLC are separate legal entities, with different
shareholder constituencies and separate stock exchange listings, they operate as nearly as practicable as a single economic entity. Debt securities issued by entities in Unilever Group are fully and unconditionally guaranteed by both Unilever N.V. and Unilever PLC.
Item 19. Exhibits
Please refer to the exhibit list located immediately following the signature page for this Form 20-F as filed with the SEC.
Unilever Annual Report on Form 20-F 2011
Form 20-F

31Unilever Annual Report on Form 20-F 2011
Form 20-F

32 Unilever Annual Report on Form 20-F 2011
Form 20-F

Printed at Pureprint Group, ISO 14001. FSC® certified and CarbonNeutral®.
This document forms part of the Unilever Annual Report and Accounts 2011 suite of documents and is printed on Amadeus 100% Recycled Silk. This has been exclusively supplied by Denmaur Independent Papers which has offset the carbon produced by the production and delivery of this paper to the printer.
The paper contains 100% recycled content, of which 100% is de-inked post-consumer waste. All of the pulp is bleached using an elemental chlorine free process (ECF). Printed in the UK by Pureprint using its alcofree® and pureprint® environmental printing technology, and vegetable inks were used throughout. Pureprint is a CarbonNeutral® company. Both manufacturing mill and the printer are registered to the Environmental Management System ISO 14001 and are Forest Stewardship Council® (FSC) chain-of-custody certified. If you have finished with this document and no longer wish to retain it, please pass it on to other interested readers or dispose of it in your recycled paper waste. Thank you.

Unilever N.V.Weena 455, PO Box 7603000 DK RotterdamThe NetherlandsT +31 (0)10 217 4000F +31 (0)10 217 4798
Commercial Register RotterdamNumber: 24051830
Unilever PLCUnilever House100 Victoria EmbankmentLondon EC4Y 0DYUnited KingdomT +44 (0)20 7822 5252F +44 (0)20 7822 5951
www.unilever.com
Unilever PLC registered officeUnilever PLCPort SunlightWirralMerseyside CH62 4ZDUnited Kingdom
Registered in England and WalesCompany Number: 41424
Related Documents


![Unilever and tea sustainability [PRESENTER’S NAME], [TITLE], UNILEVER [COUNTRY]](https://static.cupdf.com/doc/110x72/56649e4c5503460f94b41ad7/unilever-and-tea-sustainability-presenters-name-title-unilever-country.jpg)
