18 Int. J. Engineering Management and Economics, Vol. 4, No. 1, 2013 Copyright © 2013 Inderscience Enterprises Ltd. Unifying the supply-side and demand-side of business strategy with an ROI objective function Brett D. Steele Institute for International and Civil Security, Khalifa University, P.O. Box 127788, Abu Dhabi, UAE E-mail: [email protected] Abstract: This paper provides a derivation, justification, and application of a generalised Return on Investment (ROI) objective function of a design-and-manufacturing or ‘high-tech’ industrial firm. Based on analysis originally presented in Steele (1995), it offers a more expansive literature review and derivation, while also demonstrating its utility for increasing the rigor of strategic business reasoning. The ROI objective function reveals the consistent mathematical structure of the profits derived from a differentiated product over its product-life cycle as a function of its production/sales rate, technological performance level(s), and investments in both stimulating its market demand (marketing and advertising) and technological supply (product design and production/distribution process). This fundamental utility model of a design and manufacturing firm is compatible with the assumptions of neoclassical and neo-Schumpeterian economists. The paper concludes by noting how the ROI objective function represents a simultaneous theory of investment allocation and design specification. Keywords: ROI; return on investment; supply-side; demand-side; business strategy; objective function; design investment; production investment; marketing investment; advertising investment; product quality and performance. Reference to this paper should be made as follows: Steele, B.D. (2013) ‘Unifying the supply-side and demand-side of business strategy with an ROI objective function’, Int. J. Engineering Management and Economics, Vol. 4, No. 1, pp.18–53. Biographical notes: Brett D. Steele is an Associate Professor in the Institute for International and Security Studies at Khalifa University in Abu Dhabi. He has taught courses on history and strategy at UCLA, Stanford University, Georgetown University, and National Defense University’s College of International Security Affairs. He received his PhD in the History of Science and Technology from the University of Minnesota and his MS in Mechanical Engineering from Stanford University. In addition to conducting research in both security and business strategy at the RAND Corporation and the Homeland Security Institute, he worked as an engineer at NASA, Hewlett- Packard, and Exponent, and served more recently as a marketing manager at Ideal Innovations, Inc. He is the co-editor of The Heirs of Archimedes: Science and the Art of the War through the Age of Enlightenment (MIT Press, 2005) and received the Engineer-Historian Prize from the American Society of Mechanical Engineers in 2012.

Welcome message from author
This document is posted to help you gain knowledge. Please leave a comment to let me know what you think about it! Share it to your friends and learn new things together.
Transcript
18 Int. J. Engineering Management and Economics, Vol. 4, No. 1, 2013
Copyright © 2013 Inderscience Enterprises Ltd.
Unifying the supply-side and demand-side of business strategy with an ROI objective function
Brett D. Steele Institute for International and Civil Security, Khalifa University, P.O. Box 127788, Abu Dhabi, UAE E-mail: [email protected]
Abstract: This paper provides a derivation, justification, and application of a generalised Return on Investment (ROI) objective function of a design-and-manufacturing or ‘high-tech’ industrial firm. Based on analysis originally presented in Steele (1995), it offers a more expansive literature review and derivation, while also demonstrating its utility for increasing the rigor of strategic business reasoning. The ROI objective function reveals the consistent mathematical structure of the profits derived from a differentiated product over its product-life cycle as a function of its production/sales rate, technological performance level(s), and investments in both stimulating its market demand (marketing and advertising) and technological supply (product design and production/distribution process). This fundamental utility model of a design and manufacturing firm is compatible with the assumptions of neoclassical and neo-Schumpeterian economists. The paper concludes by noting how the ROI objective function represents a simultaneous theory of investment allocation and design specification.
Keywords: ROI; return on investment; supply-side; demand-side; business strategy; objective function; design investment; production investment; marketing investment; advertising investment; product quality and performance.
Reference to this paper should be made as follows: Steele, B.D. (2013) ‘Unifying the supply-side and demand-side of business strategy with an ROI objective function’, Int. J. Engineering Management and Economics, Vol. 4, No. 1, pp.18–53.
Biographical notes: Brett D. Steele is an Associate Professor in the Institute for International and Security Studies at Khalifa University in Abu Dhabi. He has taught courses on history and strategy at UCLA, Stanford University, Georgetown University, and National Defense University’s College of International Security Affairs. He received his PhD in the History of Science and Technology from the University of Minnesota and his MS in Mechanical Engineering from Stanford University. In addition to conducting research in both security and business strategy at the RAND Corporation and the Homeland Security Institute, he worked as an engineer at NASA, Hewlett-Packard, and Exponent, and served more recently as a marketing manager at Ideal Innovations, Inc. He is the co-editor of The Heirs of Archimedes: Science and the Art of the War through the Age of Enlightenment (MIT Press, 2005) and received the Engineer-Historian Prize from the American Society of Mechanical Engineers in 2012.
Unifying the supply-side and demand-side of business strategy 19
1 Introduction
This paper seeks to derive and apply a fundamental objective function for the strategic management of a manufacturing firm that generates a technological or quantitatively ‘differentiated’ product. This involves offering a robust derivation and justification of the generalised Return on Investment (ROI) function, originally presented in “An Economic Theory of Technological Products”, and using it to criticise both historical and generic approaches to the analysis of business strategy (Steele, 1995). Situated in the intersection between microeconomics, finance, marketing, operations management and engineering, “An Economic Theory of Technological Products” furnished a continuous ROI objective function in terms of the basic independent variables that a firm’s management can control to secure optimum returns. These include the technical variables of product performance (or ‘quality’) and production rate, along with the basic demand-side and supply-side investment variables. The demand-side variables are the investments made in ‘marketing’ or sales-argument design, and ‘advertising’ or sales-argument distribution. The supply-side variables, on the other hand, are investments made in product design and in setting up the product’s production and distribution process. A central insight of “An Economic Theory of Technological Products”, is that the average or unit sales price can be viewed as a dependent variable or function in terms of sales rate, product performance and the demand-side investments. Likewise, the unit production cost can be viewed as a dependent variable or function in terms of production rate, product performance and the supply-side investments. As a result, this ROI objective function revealed the fundamental economic relationships that constrain the strategies of all profitable manufacturing firms. These include those operating under perfect market conditions, where the manufacturers produce uniform commodities with fixed performance levels, and can therefore forgo any product-design, marketing and advertising investments. These also include those strategies of manufacturers who operate in monopolistic market conditions, and therefore produce differentiated or engineered products that require significant product-design investments. “An Economic Theory of Technological Products” consequentially permitted a rigorous analytical approach to determine the optimum selection of the six independent variables of a manufacturing firm for its particular unit sales-price function and unit production-cost function. These functions are highly dynamic, however, in response to new competitive developments, as described by Porter (1980), and the development of new capabilities within the firm, as articulated by Wernerfelt (1984). Likewise, these functions may also shift significantly due to the impact of revolutionary technological change or the diffusion of “general purpose technologies”, as articulated more recently by Lipsey et al. (2005).
“An Economic Theory of Technological Products” revealed the utility of its ROI objective function for the strategic managerial control of a firm by using it to analyse systematically the strategies associated with a wide range of technical innovations from the 19th and 20th centuries. These include the Armory system of production with interchangeable parts, the Singer sewing machine, hydraulic turbines, the electric utility system, the turbojet engine and labour-saving household appliances. Likewise, “An Economic Theory of Technological Products” also showed how to use its ROI objective function to analyse the basic reasoning associated with a number of more recent business strategies and recommendations, including those of Deming and the Japanese
20 B.D. Steele
automotive industry. This analytical approach, in short, directly refutes the considerable criticism that quantitative neoclassical-style economic reasoning offers little insight for business strategists, especially those focused on high-tech industry in the electronics and aerospace domains (Nelson and Winter, 1982; Porter, 1998).
For all the analytical rigor and capability displayed in “An Economic Theory of Technological Products”, it nevertheless suffers from certain performance deficiencies. The basic mathematical relationships of the average production-cost and average sales-price functions are presented inconsistently in graphical form, some minor mathematical errors and conceptual misconceptions exist, while the basic derivation lacks clarity by assuming too much. Most significantly, its key assumptions are not justified by referencing relevant economic and business literature. As a result, the paper is far more demanding for business economists, strategists and managers than necessary. A primary objective of this current paper is therefore to redress these shortcomings and deliver a knowledge product that places far fewer demands on the reader. This is hardly an insignificant task, given the persistent degree of relatively weak strategic thinking in the business domain that a stronger awareness of the ROI objective function could mitigate (Piercy et al., 2010).
This current paper is organised into three sections. The first is a review of the relevant business economics literature on generalised profit or ROI functions of commercial firms. The purpose is to reveal what the ROI objective function has in common with existing economic analysis to provide the conceptual justification that “An Economic Theory of Technological Products” lacks. A split emerges in this review between those theorists focused on developing profit functions from marketing oriented demand-side perspectives and those focused on the more production-oriented supply-side perspectives. The ROI objective function emerges in this context as a much-needed analytical unification of these two domains. The second section presents a far more robust and conceptually clearer derivation of the ROI objective function than what was offered in “An Economic Theory of Technological Products”. The third section comprises the use of this function to unpack of the strategic analyses of Nathan Rosenberg, Michael Porter and Adam Brandenburger and Barry Nalebuff. By using it to analyse both historical and generic approaches to business strategy, further evidence of the utility of this more deductive analytical approach towards strategic business thinking is presented.
2 Literature review
The academic discipline of microeconomics is oriented heavily more towards determining market equilibrium states than in analysing the economic relationships that constrain profit-seeking strategies. The disciplines of finance and managerial accounting are much more focused on that issue. Unfortunately, their practitioners tend to focus more on solving discrete problems involving specified quantities and situations, rather than analysing generalised functions with continuous variables in the manner of neoclassical economists or engineers. That said, a number of business economists have addressed this issue of generalised relationships associated with a firm’s profitability, especially when it permits more advanced analyses of market equilibrium points. Their research, however, tends to fall into two separate categories:
Unifying the supply-side and demand-side of business strategy 21
• the ‘demand-side’, where the firm is focused on shaping the external market’s demands for its products
• the ‘supply-side’ where the firm is focused on designing and manufacturing its products.
Neoclassical microeconomists privilege the condition of perfect competition. As result, their work is often exclusively focused on the supply-side of business strategy. In a perfect market, where only unvarying commodities get produced, the only strategic decision that the firm makes is in deciding what the production investment and production rate should be. This is reflected by the popularity of the isoquant curve in microeconomics, which displays the relationship between the production investment or ‘capital’ and production cost or ‘labour’. Product design, marketing and advertising investments are pointless to consider, because all the products are uniform and their sales price is set by the market.
Edward Chamberlin, in contrast, conducted the pioneering demand-side analysis in his landmark treatise, The Theory of Monopolistic Competition (Chamberlin, 1933). He argued that each competing design-and-production firm has its own downward-sloping demand curve, based on the assumption of the declining marginal utility of its unique product. As a result, the sales price of the differentiated product is a function of the sales rate. This market sensitivity to the unique attributes of the firm’s products stands in sharp contrast with the market for commodities in the domain of perfect competition. Chamberlin goes further in his paper “The Product as an Economic Variable” (Chamberlin, 1953). He explicitly argued for a fundamental demand-side relationship between sales price, sales price, advertising investment and product quality or technical performance level. To ensure the existence of market-equilibrium states, however, Chamberlin assumes that product differentiation levels are independent of production costs. This staggering notion not only violates the most basic principles of physical science, it effectively eliminates the need to consider the design investment. Therefore, advertising emerges as the central investment variable to consider. Such a simplifying assumption, which reduces the analysis to a purely demand-side problem, have also been used by Mussa and Rosen (1978) and Schmalensee (1978).
Business economists have focused considerable attention on analysing a firm’s optimum level of advertising investment. Dorfman and Steiner (1954) addressed a firm’s marketing capability by specifying a basic relationship between the product’s sales rate, quality level and advertising budget. They also show how the average production cost is a function of the production rate and the product’s quality level. By using these insights, they then determined basic conditions for optimising advertising, sales price and product-quality levels. This influential analysis guided a subsequent series of business economics papers that analyse both the manufacturing firm’s advertising investment and the product quality level (Milgrom and Roberts, 1986; Nerlove and Arrow, 1962). The demand-side oriented business-economics community, one may therefore conclude, accepts this profit function:
Profit = Total Sales Revenue (qs, z, A) – Total Production Cost (qp, z ) – A,
where qs is the sales rate, z is the product’s quality or technical performance level, qp is the production rate and A is the advertising investment level. Some economists, however, prefer to view sales price as an independent variable and the sales rate as the dependent variable that is a function of advertising investment and sales price. Unfortunately, this
22 B.D. Steele
precludes combining both supply-side and demand-side investments into a single profit equation (Lee, 2002a, 2002b; Wright, 2008).
What such profitability analysis tends to neglect, however, are the mathematical characteristics of these sales-revenue-and production-cost functions that persist regardless of the product, firm or market involved. Chamberlin’s downward-sloping demand curve for each design-and-production firm is one exception to this rule. Such relative neglect was more recently addressed by Johnson and Myatt (2004) in their analysis of transformations of market demand due to changes in both product design and consumer values. They argue how successful product promotions can rotate the demand curve in an upward direction. More complex changes in product design, involving shifts in numerous performance characteristics, may also rotate the demand curve, given how consumers may respond either favourably and unfavourably to the change. A key feature of such demand-side analysis nevertheless remains the lack of integration with such supply-side investments as capital expenditures in the design and construction of production/distribution processes and R&D investments in product development. An entirely separate branch of economics appears to be focused on that domain.
The neoclassic theory of perfect competition involves the production and sale of products with fixed quality or performance parameters. It therefore falls in the supply-side category. Because the price of the product is set by the market, individual producers cannot change it either through advertising or by changing their production rate. Therefore, their only strategic option is to invest in changing the production process to shape profitably the relationship between variable-labour and fixed-capital costs. The neoclassical orientation towards perfect competition is clearly related to the convenience it permits market equilibrium conditions to be determined. Neoclassic economists highly value such analysis, especially after the publication of Paul Samuelson’s Foundations of Economic Analysis (1947). That landmark work represents a synthesis of economics with the thermodynamic equilibrium analysis of Willard Gibbs. It offers further confirmation of the stimulating connection between economics and engineering science, extending back to Jules Dupuit’s discovery of the relationship between the principle of diminishing marginal utility and the downward-sloping demand function in mid-19th century France.
Smith (1959) offers a prime example of the supply-side analytical approach that relies on the ‘sunk cost’ of a production process. He presents the production rate as the output or dependent variable and the capital investment and variable production costs as the input or independent variables. Smith then proceeds to determine the optimum level of these inputs, yet only from the perspective of minimising costs. A pure supply-side analysis results that assumes constant levels of market demand. Smith also fails to address what the optimum production rate should be. Nor does he address how much R&D should be invested in redesigning the product to lower the average production costs. As Harter (1993) more recently observed about the economics literature on product differentiation, considerations of R&D investments are generally neglected when making choices about the characteristics of products. Harter proceeded to augment the classic product-differentiation analysis, in terms of spatial location of the distribution centre, by considering the investment cost of designing the new product. He then subtracts this design investment from the profit function. Nevertheless, that remains the only investment parameter used. A demand-side investment in advertising is not considered.
Unifying the supply-side and demand-side of business strategy 23
Another example of supply-side analysis is Segerstrom (2007). He develops complex profit models of high-tech firms to analyse optimum R&D investments that consider product quality, as well as labour costs. As with Harter, demand-side advertising costs are not considered. Segerstrom’s basic assumption is that the firms in question can only stimulate market demand by changing the product’s quality levels. Lee (2002, 2003) operates along different lines with a formal profit equation of a firm. He assumes the sales price and R&D investment level are the only independent variables, so the product’s quality level can be ignored. In his model, Lee equates the sales rate and production rate. He then makes this variable dependent on R&D investment level, sales price and the R&D levels of competitors’ products, since he assumes a direct relationship between the product’s quality level and R&D investment level. As a result, he renders the supply-side R&D investment a direct means to shape the market demand for a product. This paradoxical conclusion emerges from the problematic assumption that a product’s performance or quality level is determined only by its R&D budget, rather than viewing both as independent variables. Such problematic reasoning about R&D is revealed more recently in Hall et al. (2010) with a profit function where investment in R&D also shapes both the sales price and the production-cost functions. As a result, that supply-side investment effectively becomes a problematic substitute for product performance. It should be noted that such reasoning is based on earlier research of Bernstein and Nadiri (1991). To their credit, they cogently recognise how variable cost is a function of production rate, product performance, and both R&D and production investments. Nevertheless, they represent sales price as a function of production rate and R&D investment, but neither product performance nor advertising investment are included. As a result, the purely supply-side strategy of investing in R&D to only decrease production cost while holding sales price and product performance constant would generate illogical results.
For all the economists who focus exclusively on either supply-side or demand-side considerations, growing number of business theorists are honing in on that essence of entrepreneurship, which demands a simultaneous consideration of investments to control both domains. Hirschey (1982) presented a key argument that both advertising and R&D can be viewed as ‘intangible’ capital investments, as opposed to operating or variable production costs. Therefore, both can be used in general economic profit relationships with the same facility as more tangible investments in the design and installation of production facilities. Other business theorists have conducted extensive empirical analyses of the competitive advantages firms receive when making simultaneous investments in both advertising and R&D to stimulate both the supply-side and demand-side of their enterprise with varying degrees of success (Erickson and Jacobson, 1992; Chauvin and Hirschey, 1993). It is with Grabowski and Mueller (1978) that one finds an early use of both R&D and advertising investments in the same economic profit equation. To address the problem of how to consider the effects of such investments, which persist far beyond the initial outlay, they account for them using the capital stocks that result from past R&D and advertising investments.
ROI = (Sales Revenue – Variable Production Costs – ȜkKt – ȜRRt – ȜAAt)/(Kt + Rt + At),
24 B.D. Steele
where Kt is the total tangible assets in period t, Ȝk the depreciation rate of the tangible asset, while Rt and At represent the capital stocks due to past R&D and advertising expenditures and ȜR and ȜA are their depreciation rates, respectively.
However, significant this ROI equation may be from the perspective of unifying supply-side and demand-side considerations, it nevertheless fails to address how R&D and advertising are directly coupled to the sales revenue and variable production costs. This formulation also neglects to reveal how production and sales rates, along with the product’s quality or performance levels, factor in – along the lines offered by Dorfman and Steiner (1954). Elliott (1983) directly addresses such coupling. He argued how a key difference between perfect and oligopolistic markets lies in the constraint of limited demand that the latter faces. In contrast, the demand curve is flat or unconstrained in perfect markets. Therefore, firms in monopolistic or oligopolistic markets invest in advertising and R&D to relax this market constraint. Consequently, Elliott models the demand-side domain as a function of sales rate in terms of advertising and R&D investments, as well as sales price, while production rate is presented as the traditional economic function that depends on ‘variable’ labour costs and ‘fixed’ production capital investments. One can thus express the function of profit as the product of sales price and production rate minus the labour costs, capital investments in the production process and additional administrative overhead costs.
Elliott proceeded, however, to introduce the assumption that R&D only shapes the sales rate functions and not the production rate function. In short, R&D is a demand-side variable only, which is a problematic assumption. R&D investments by themselves have no bearing on the sales rate function. After all, when did a salesman ever face a customer who demanded to know what the R&D budget was of a particular product before making a purchasing decision? R&D investments only shape the firm’s internal relationship between the product’s production cost, production rate and performance level.1 Likewise, only the advertising and marketing investments shape the market’s external relationship between the product’s sales price, sales rate and performance level. Elliott might have introduced his R&D misconception because he neglects to use a product performance parameter in his analysis of both the production rate (supply-side) and sales rate (demand-side) functions. As a consequence, one may conclude that for all the insight provided about integrating both the demand and supply-sides into a single relationship of a firm’s profitability, Elliott failed to provide a basic objective function with which to guide a design and manufacturing firm’s profitable management. The purpose of the following section is to pull together the individual elements provided in the literature surveyed here to satisfy this need.
Economists and business theorists have introduced many key components that a fundamental objective function requires for the management of a design and manufacturing firm. Such a firm is subject to the ‘impure’ competition associated with the complex supply-side and demand-side dynamics of innovative, evolutionary and entrepreneurial business growth, in contrast with the simple supply-side statics of pure competition. Nevertheless, they have been unable to forge a single equation that satisfies the analytical rigor demanded by economists, the convenience and practicality demanded by business strategists and entrepreneurs, and the realism demanded by historians and business theorists. This is symbolised clearly in the work of Lee (2002a, 2003), where he only provided a generalised profit equation in terms of advertising, and another in terms of R&D, but cannot do both simultaneously. The purpose of the next section is to show how to accomplish that task.
Unifying the supply-side and demand-side of business strategy 25
3 Assumptions
The ROI objective function derived below relies on a number of assumptions to minimise its mathematical complexity without jeopardising its conceptual rigor or its practical utility. We will start by addressing the key assumptions of the design and manufacturing firm. It produces just one product line, and the product has just one quantifiable performance parameter. Lancaster (1966a, 1966b) developed the idea that the utility of a product from a consumer’s perspective is based on its properties, characteristics or ‘performance’ parameters. Although more parameters could be added if desired, one dimension of this parameter suffices for the strategic analysis sought here. Most commercial products have numerous quantitative and qualitative performance parameters. An automobile’s performance can be measured in terms of miles per gallon, horsepower or acceleration, but its utility is also informed qualitatively by its shape and colour that has little bearing on its physical performance. Plenty of technological products have virtual no aesthetic dimensions and therefore can be measured purely in terms of quantitative performance measures. These include turbines, satellites, carburetors, kinematic linkages and electrical transformers, not to mention electrical circuits.
Many economists use the words ‘quality’ as being synonymous with physical performance. This is a confusing habit from an engineering perspective, however. Many low-performing products can be made with very high quality, where quality is assumed to be a performance parameter for durability or reliability: the HP-15 calculator (relative to a PC), the US Sherman tank of World War II (relative to the Soviet T-34), and the German Karabiner 98k rifle (relative to the US M1 Garand rifle) are examples. Likewise, one can have high-performing yet low-quality products. German Tiger tanks and US Mark 14 torpedoes of World War II, US compact cars and British sports cars from the 1970s, and laptop computers from the 1990s come to mind. Quality could also signify a more subjective measure of high value, or the ratio between performance and cost.
Another basic assumption is that the firm designs, manufactures and sells the product over a finite product-life cycle. The time value of money will also not be emphasised here. Although it will be considered in the derivation below, the interest rate will ultimately be assumed to be zero to minimise the mathematical complexity that the resulting exponential functions introduce. Finally, it is also assumed that the production rate of the product will be equal to the sales rate. Plenty of examples exist where this assumption gets violated by commercial firms, especially those with access to significant storage facilities or have customers who tolerate long waiting lists. Nevertheless, this is becoming an increasingly valid assumption for aerospace, electronics and automobile industries, given the storage-eliminating trends in the 1990s associated with Just-In-Time manufacturing and global supply-chain management.
The variables used in this ROI objective function of a technology-producing or ‘hi-tech’ industrial firm may be classified into two categories: independent variables (parameters that the firm may directly control) and dependent variables (functions that the firm may only indirectly control through the independent variables). The dependent variables are the unit sales price and the unit production cost – also known in neoclassical microeconomics as the average variable cost. It should be noted that the neoclassical economic terms of variable cost vs. fixed costs are problematic terms from a high-tech industrial perspective, where supposedly ‘fixed’ production investments get changed routinely – as the integrated-circuit industry demonstrates to a staggering degree.
26 B.D. Steele
As a consequence, the more objective terms of average or unit production cost and production investment are adopted here. As their names suggest, they represent the sales price or production cost of a single unit of the product being manufactured.
Economists routinely assume that the unit sales price is an independent variable. After all, the firm’s managers may change that parameter at will. Such freedom ceases, however, when manufacturing executives must match their firm’s sales rate to the production rate. Take, for example, a retailer who reduces his or her prices sufficiently to sell a given quantity of merchandise within a given period of time. The unit production cost is also a dependent variable because it can be controlled only indirectly by varying the production rate along with both the production system and the product’s design specifications. This cost reflects only those resources and processes that directly add value to the product itself, and directly varies when the production rate changes – hence economists and accountants commonly refer to it as a ‘variable’ cost. Factors that affect this cost include the wages of the production workers, the cost of the raw materials, and the energy consumption of the production system, along with the routine maintenance and ‘debugging’ actions of the production engineers.
The status of the unit production cost and unit sales price as dependent variables stands in contrast with the investment variables – what is commonly called ‘fixed’ costs. They are independent variables because they are subject to the direct control of the firm’s managers. The traditional accounting categories of capital investments apply here, as well as more intangible ‘human capital’ investments in marketing and R&D (Elliot, 1983). An investment, as used in the ROI objective function, thus reflects the resources used to build and maintain the numerous processes within the firm to shape the functions represented by the unit sales price and unit production cost. An investment may consequently pay for such tangible assets as land and capital machinery, but it may also pay for more intangible resources, such as the salaries associated with an R&D lab and sales office, as well as employee-training costs. Finally, it should be emphasised that the production rate and the technological performance of the product are also independent variables; however, common it is for economists to view the former as a dependent variable.
Regardless of the particular production system or product in question, it is assumed here that a manufacturing engineering manager can always deliver a specified production rate within a given investment budget, but only if there are no restrictions on the unit production cost. Likewise, it is also assumed that an R&D or product-development manager can have his engineering staff design a product to achieve virtually any performance specification – within the constraint of basic scientific laws and a given investment budget – but again, only if there are no restrictions on the unit production cost.
Let us now define the two supply-side and two demand-side investment variables that are contained in our utility model of an industrial firm’s capabilities. The production investment refers to the expense of designing and constructing the production process and distribution system. The salaries of the manufacturing engineers and supply-chain logisticians, the cost of the capital production machinery, the price of the land and buildings, the training of workers, the purchase price of machine tools and even components of the supporting human-resource department fall under this category. A production investment thus may be a relatively discrete cost, such as the purchase
Unifying the supply-side and demand-side of business strategy 27
of a milling machine or lathe; or it may be ongoing, such as regular safety inspection of the production tools and conveyance systems. The key criterion for a production investment is that it shapes the relationship between the unit production cost and the production rate, yet is independent of the actual production rate the production management selects on any particular day.
The design investment refers to the cost of designing or developing the actual product. It is a neglected concept in the economics literature (Freiesleben, 2010). The costs associated with this investment pays the mechanical engineers who design the product’s structural and moving parts; the electrical engineers who design its electrical power and control systems; the computer scientists who design and debug its software or firmware; the test-and-evaluation engineers who verify compliance to performance specifications; the manufacturing engineers who ensures the design components are sufficiently ‘manufacturable’ for a particular production system; the project managers who coordinate all these actions. The design investment also pays for the toolmakers and machinists who construct the prototypes, as well as the raw materials and equipment they utilise. The measuring instruments, computers and experimental equipment deployed by the engineers also fall into this category of design investment. Its objective is to furnish the design plans or ‘blueprints’ of a product that offers a particular technical performance level(s) at a particular unit production cost for a given production system.
The marketing and advertising investments are assumed here to represent the expenses associated with the design and distribution of the sales argument, respectively.2 In some respects, they are the demand-side counterpart to the investments in product design and production. The marketing investment consequently comprises the direct and supporting work required to generate the basic features of a sales argument, whereas the advertising investment concerns actually distributing the argument to potential customers. Activities associated with the marketing investment include surveying the needs of potential customers, processing and interpreting the resulting data, funding the design and production of television commercials or magazine advertisements, researching and writing to generate contract proposals, formulating the logic of easy-to-grasp sales pitches or ‘elevator speeches’, writing and designing sales brochures, funding technical feasibility and demand studies, designing models or even prototypes of advanced experimental designs for demonstrations, compiling a list of the firm’s past accomplishments, retaining the services of a public-relations firm and even making charitable donations or lobbying for socially responsible policies to impress potential clients. Marketing investments are also spent to design the product’s labels and brochures. Ironically, many ‘advertising’ agencies that design commercials receive funds from the marketing investment category.
Stocking argued in the early 1930s that marketing investments seek not “the catering to wants, but the creation, modification and direction of wants. In so far as the returns depend on advertising, they are not derived from catering to wants, but from cultivating tastes for commodities, the supply of which the individual producer controls” (Stocking, 1931, p.54). Such perspective reflected an era when most advertising executives enthusiastically viewed the science of psychology as furnishing practically deterministic theory to boost the consumers’ value of their products. Such thinking became especially pronounced in the 1940s and 1950s due in part to the motivational research work of Ernst Dichter (Samuel, 2010). The revolutionary change in thinking about marketing investments involved adapting “a concept of man as non-rational,
28 B.D. Steele
whose desires and aspirations could be manipulated for the good of economic stability…” (McMahon, 1973, p.6). A more recent study of consumer psychology suggests the need for marketing investments to consider the tensions between consumers’ need on a personal level for assimilation and differentiation (Timmor and Katz-Navon, 2008). Such a ‘taste changing’ aspect of marketing and advertising also looms large in the social construction of technology literature (Pinch and Bijker, 1990). This transformative view of marketing and advertising is contrasted with its function of providing information, as cogently argued by Nelson (1974). Here, the emphasis of the marketing investment is not to change consumer’s values but rather to minimise their transaction costs in fulfilling them with the information contained in the sales arguments. Nevertheless, to optimise a marketing investment, Nelson (1970) argued how the content of a sales argument must depend on whether the consumer can accurately assess the product’s performance either before or only after making the purchase.
Activities associated with the advertising investment, or the distribution of a sales argument include training the sales staff, paying for the broadcast of television or radio commercials, printing up and mailing copies of proposals, making oral presentations, printing and mailing of sales brochures and finally, attending conferences or tradeshows to secure access to the potential client organisation’s influential decision makers – or, to use the language of Clausewitz in military strategy, their ‘centres of gravity’ (von Clausewitz, 1984).3 The internet represents a revolutionary decrease in the cost of advertising investments. The cost of setting up a website to distribute a sales argument is generally independent of the number of potential customers who view it, relative to magazine, television and radio advertisements. Nevertheless, that advertising revolution has its limits. Creamer (2008) argued that the internet has proved to be effective only in distributing information-oriented sales arguments and inefficient in distributing ‘taste changing’ sales arguments.
In the analysis that follows, the unit sales price, S, and unit production cost, P functions are assumed to be constant with respect to time over the product life cycle, T. One may therefore interpret the unit sales price and unit production cost functions as being the average sales price and average production cost function over the life cycle, T. Likewise, the time required to actually make the investments and achieved the desired results, from both supply-side and demand-side perspectives, is assumed to be instantaneous. Finally, no taxes, tax credits or depreciation rates are assumed, but can clearly be added to make the ROI objective function more useful for macroeconomic fiscal and monetary-policy analysis.
The following analysis also assumes that the product life cycle, T, is not an independent variable that shapes the unit production cost and unit sales price functions. This is clearly not valid in real business life, where the time required to bring a product to market can have an enormous impact on ROI. Thus, for the sake of analytical simplicity, the assumption here is that the unit production cost and unit sales price function are for a given product life cycle, T. Also, the assumption of monopolistic competition will be assumed, but the condition of perfect competition can easily be achieved by making the necessary simplifying restrictions. Finally, a constant probability of success level is assumed when analysing the unit sales price function and the unit production cost function.
Unifying the supply-side and demand-side of business strategy 29
Let us now turn our attention to the formal derivation of the quantitative objective profit function in terms of these variables and functions.
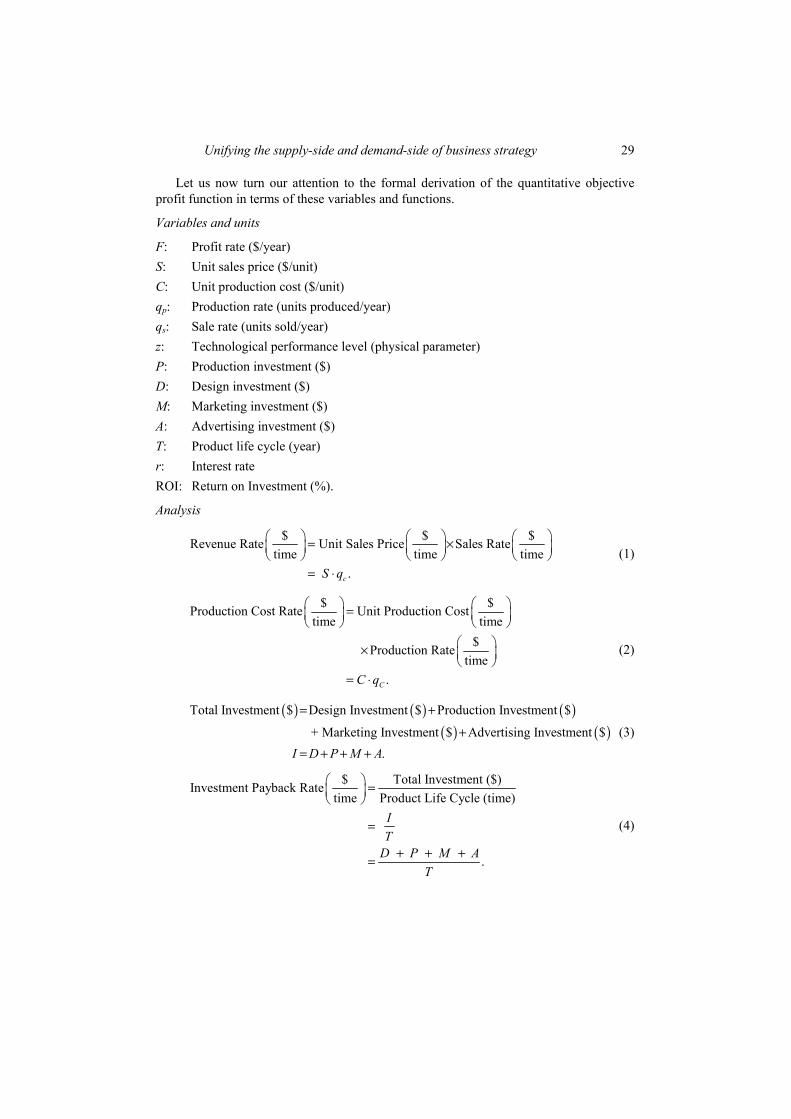
Variables and units
F: Profit rate ($/year) S: Unit sales price ($/unit) C: Unit production cost ($/unit) qp: Production rate (units produced/year) qs: Sale rate (units sold/year) z: Technological performance level (physical parameter) P: Production investment ($) D: Design investment ($) M: Marketing investment ($) A: Advertising investment ($) T: Product life cycle (year) r: Interest rate ROI: Return on Investment (%).
Analysis
$ $ $Revenue Rate Unit Sales Price Sales Ratetime time time
.cS q
§ · § · § ·= !¨ ¸ ¨ ¸ ¨ ¸© ¹ © ¹ © ¹
= " (1)
$ $Production Cost Rate Unit Production Costtime time
$Production Ratetime
.CC q
§ · § ·=¨ ¸ ¨ ¸© ¹ © ¹
§ ·! ¨ ¸© ¹
= "
(2)
( ) ( ) ( )( ) ( )
Total Investment $ Design Investment $ Production Investment $
+ Marketing Investment $ Advertising Investment $ .I D P M A
= ++
= + + + (3)
$ Total Investment ($)Investment Payback Ratetime Product Life Cycle (time)
.
IT
D P M AT
§ · =¨ ¸© ¹
=
+ + +=
(4)
30 B.D. Steele
$ $ $Profit Rate Revenue Rate Cost Ratetime time time
$Investment Payback Ratetime
$ unitUnit Sales Price Sales Rateunit time
$Unit Production Cost Production Runit
§ · § · § ·= #¨ ¸ ¨ ¸ ¨ ¸© ¹ © ¹ © ¹
§ ·# ¨ ¸© ¹
§ · § ·= !¨ ¸ ¨ ¸© ¹ © ¹
§ ·# !¨ ¸© ¹
unitatetime
Total Investment ($) ,Product Life (time)
Profit Rate ($/time)
.
s p
s p
I S q C q TD P M A S q C q
T
§ ·¨ ¸© ¹
#
= " # " #
+ + += " # " #
(5)
Assume a continuous compounding of interest at a rate of r
0
0
$Total Profit ($) e Profit Rate dtime
e d .
T rt
T rts p
t
D P M AS q C q tT
#
#
§ ·= ¨ ¸© ¹
+ + +ª º= " # " #« »¬ ¼
³
³ (6)
Assume functions of unit sales rate, S, and unit production cost, C, are independent of time over a given product life cycle, T, and that interest rate, r, is zero.
( )
( ) ( )
1Total Profit ($) 1 e ,
Total Profit ($)
- .
rTs p
s p
s p
D P M AS q C q T r
D P M AS q C q TT
S q C q T D P M A
#+ + +§ · § ·= " # " # #¨ ¸ ¨ ¸© ¹ © ¹
+ + +§ ·= " # " #¨ ¸© ¹
= " " # + + +
( ) ( )
( )
Total Profit ($)Return on Investment (%) 100%,Total Investment ($)
ROI 100%
1 100%.
s p
s p
S q C q T D P M AD P M A
S q C q TD P M A
= !
" # " # + + += !
+ + +§ ·" # "¨ ¸= # !¨ ¸+ + +© ¹
(7)
Assuming qs = qp, as discussed above
( )
( )
ROI 1 100%
ROI 1 100%.
T Sq CqD P M A
S C qT
D P M A
ª º= # #« »+ + +¬ ¼#ª º
= #« »+ + +¬ ¼
(8)
Unifying the supply-side and demand-side of business strategy 31
ROI is presented here as being a more strategically meaningful objective function than total profit or Net Present Value. Yes, it is a norm in the discipline of finance that all investment decisions should be made to maximise the net present value (total profit from the perspective of the time value of money), and that the Internal Rate of Return (IRR) must exceed the cost of capital (Brealey et al., 2008). But given how the ROI objective function seeks to determine the single best choice among the wide range of options over a constant period of time to get the “biggest bang for the buck”, the rationale behind prioritising net present value no longer applies (Jacobson, 1987).4
With this basic ROI objective function in equation (8), one might be tempted to conclude that to maximise the investment return, the firm would have to maximise the difference between unit sales price, S, and unit production cost, C; maximise production rate, q; maximise product life cycle, T; and minimise the total investment level D + P + M + A. Such strategic reasoning is fallacious, of course. It fails to consider the dependency that S and C have as dependent functions on q, D, P, M, A, and the product’s technological performance level, z, where S = S(z, q, A, M) and C = C(z, q, D, P). These functions reflect how the advertising and marketing investments only shape the unit sales price function, while the design and production investments only shape the unit production cost function. Technological performance and production/sales rate, in contrast, shape both.5 What then is the nature of these relationships? How can they be characterised? Do they have universal characteristics that transcend particular technologies and firms? The answer, as discussed below, is while these functions have common mathematical features, their specific magnitude and shapes or elasticities have profound implications for the profitability of the firm’s investments.
4 Unit production cost function and design investment
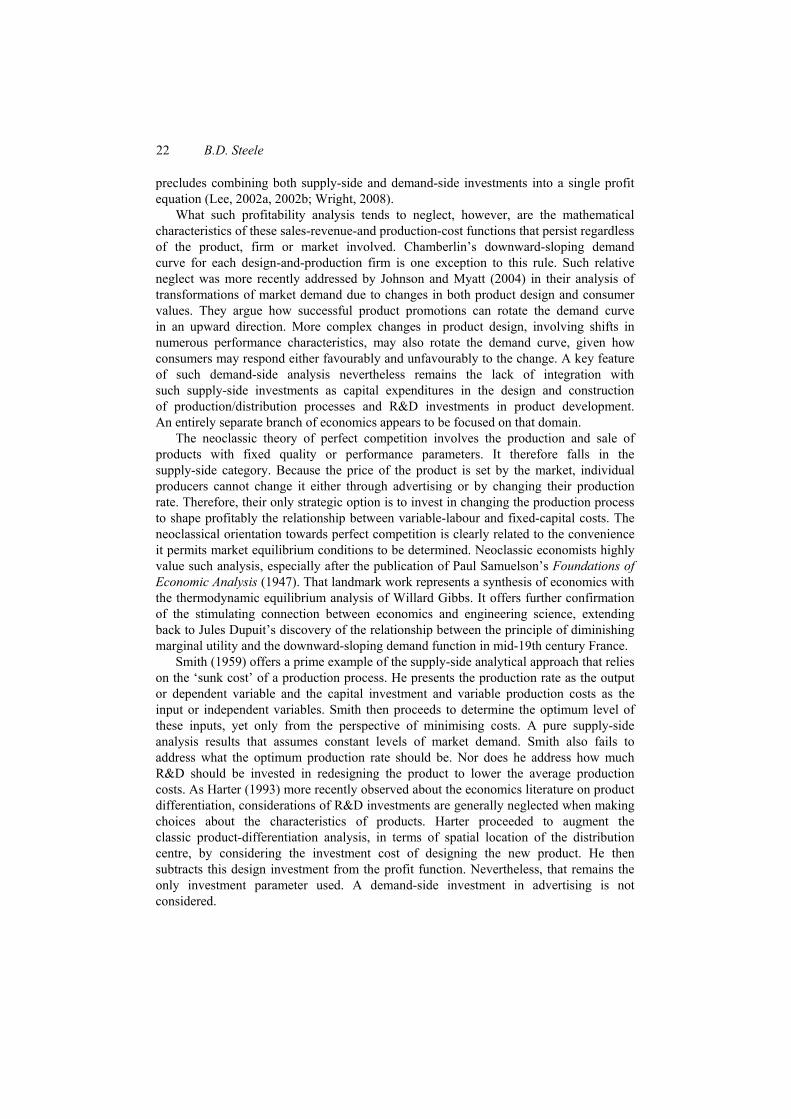
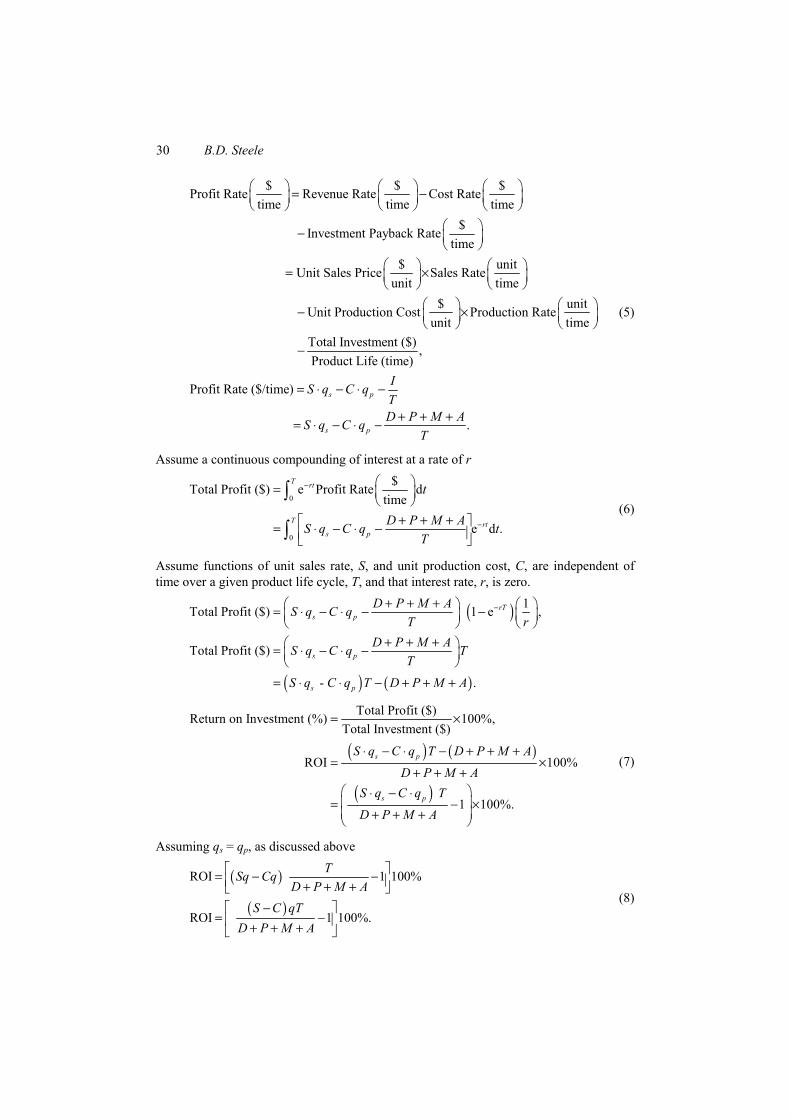
Let us commence by examining the unit production cost, C, as a function of technological performance, z. As represented in Figure 1, this function is generally modelled as an exponential function or an upwardly sloping curve with a vertical asymptote (Kossiakoff et al., 2011, p.29; McNaugher, 1989, p.7; Sharpe, 1969, p.6). This exponential curve is actually compatible with the “operational effectiveness vs. strategic positioning” curve in Porter (1996). You can see this by replacing the y-axis variable of “Non-price buyer value delivered” with the technological performance variable, z, and the x-axis variable of ‘relative cost position’ with the unit production cost variable, C. The trick is to reverse the mathematically awkward reverse direction of high to low that Porter elects to use on the x-axis to the more conventional Cartesian coordinates direction of low to high. He appears to have used this unconventional approach to preserve the productivity frontier shape of the curve, which is conventionally used to model a macroeconomy’s ability to produce two different products.
This exponential function means that for a given design-investment budget, the R&D staff of a firm can deliver ever increasing levels of performance, but only at ever greater unit production costs, which quickly soars to unpractical limits due to non-linear scaling effects (Lipsey et al., 2005, pp.397–401). At lower levels of performance, the bulk
32 B.D. Steele
of the design investment budget can go towards reducing the unit production cost, C, in terms of synthesising more optimum designs and searching for less expensive materials. As the performance increases, however, more design effort has to be placed in successfully achieving the performance demanded and consequentially less can be devoted towards reducing costs. Take the classic example of a steam power plant – a technological product with the primary performance parameter of efficiency. Low-performing designs require the generation of relatively low steam temperatures and therefore low steam pressure, as described by the Ideal Gas Law and the Second Law of Thermodynamics. Low steam pressure means that the boiler requires relatively thin cylindrical walls and straight end pieces to contain the pressure; hence the unit production cost from a material perspective is low. Low pressure also means that the welds and rivets are not subject to very high stress, so low amounts of skilled labour are required for their assembly. A greater portion of the design investment can therefore be devoted to determining the most inexpensive construction material, the fewest numbers of rivets and welds required, and the least amount of cutting, bending and shaping processes. As the demand for efficiency increases (and therefore the level of pressure containment), however, such a cost-reducing focus can no longer be prioritised. Far greater effort must be expended in analysing and testing to ensure its effective and safe performance at higher pressures. For example, purchasing sophisticated finite-element analysis software and placing it in the hands of expensive senior engineers, who can ensure the convergence of the analysis with approximate thin-shell analysis, becomes a far greater priority over those capable of negotiating with vendors the lowest possible material costs. Much more money needs to be devoted to analysing loading cycles and determining fatigue life to prevent a catastrophic rupture, as opposed to determining the most convenient locations for installing welds or rivets to minimise labour costs.
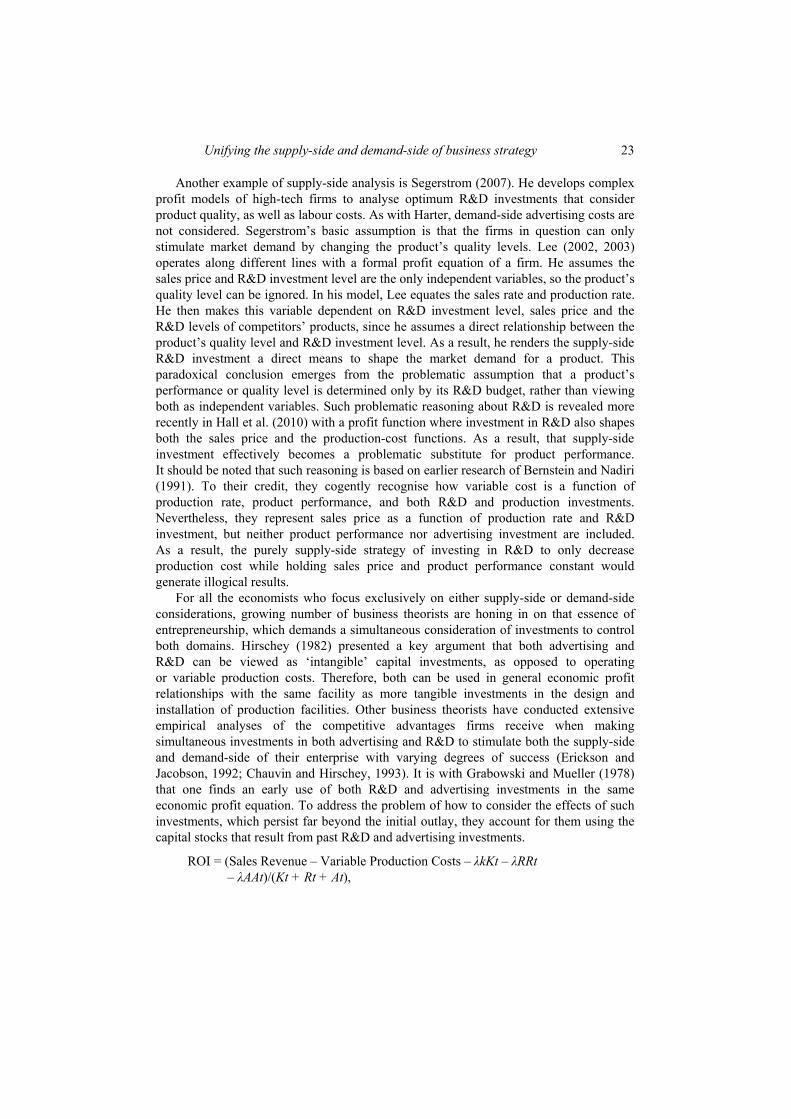
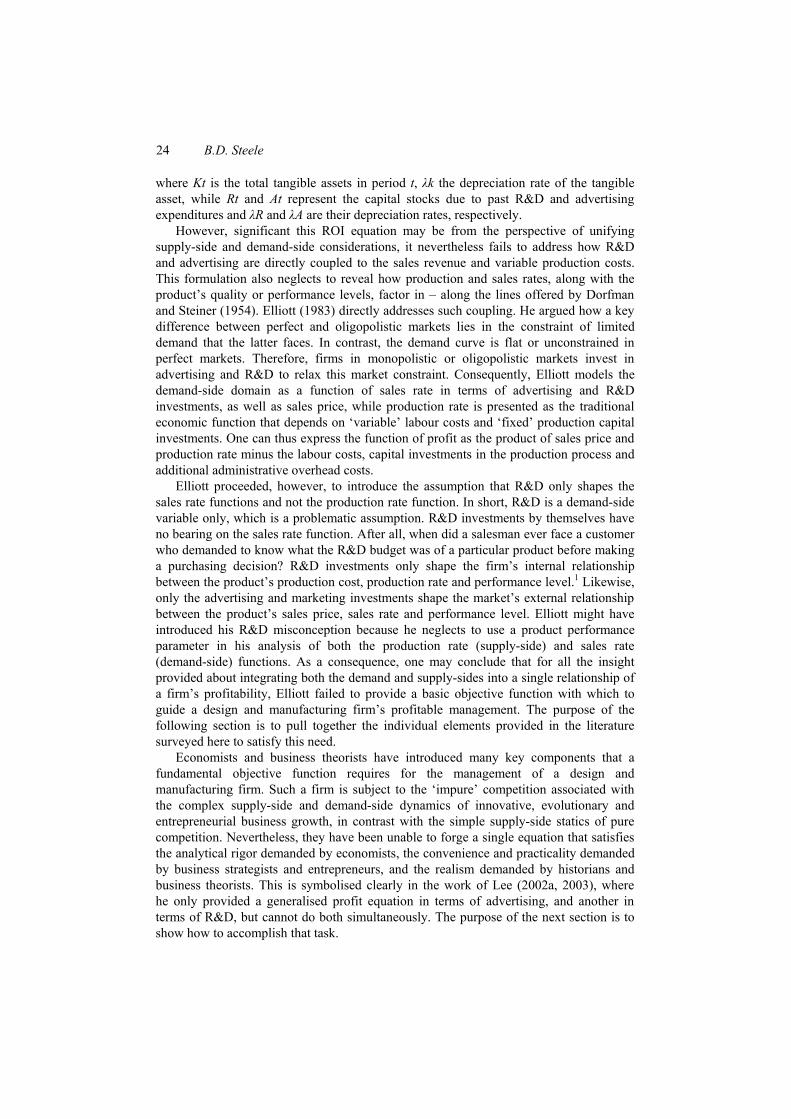
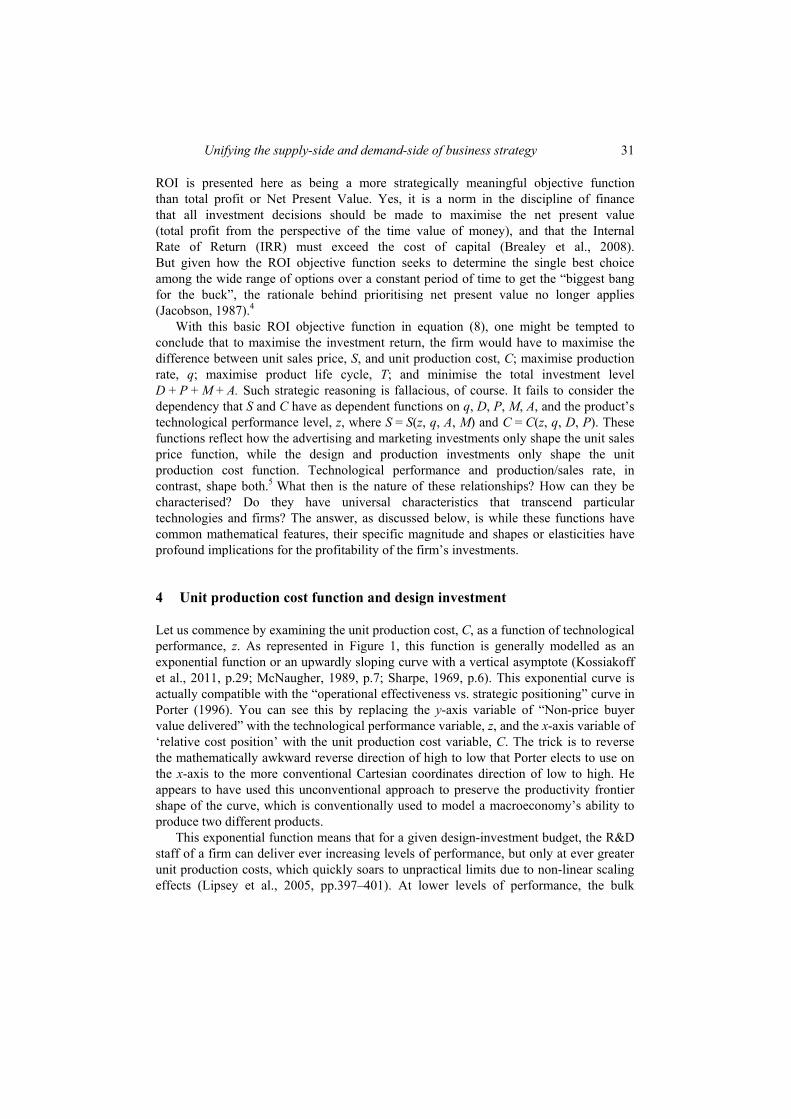
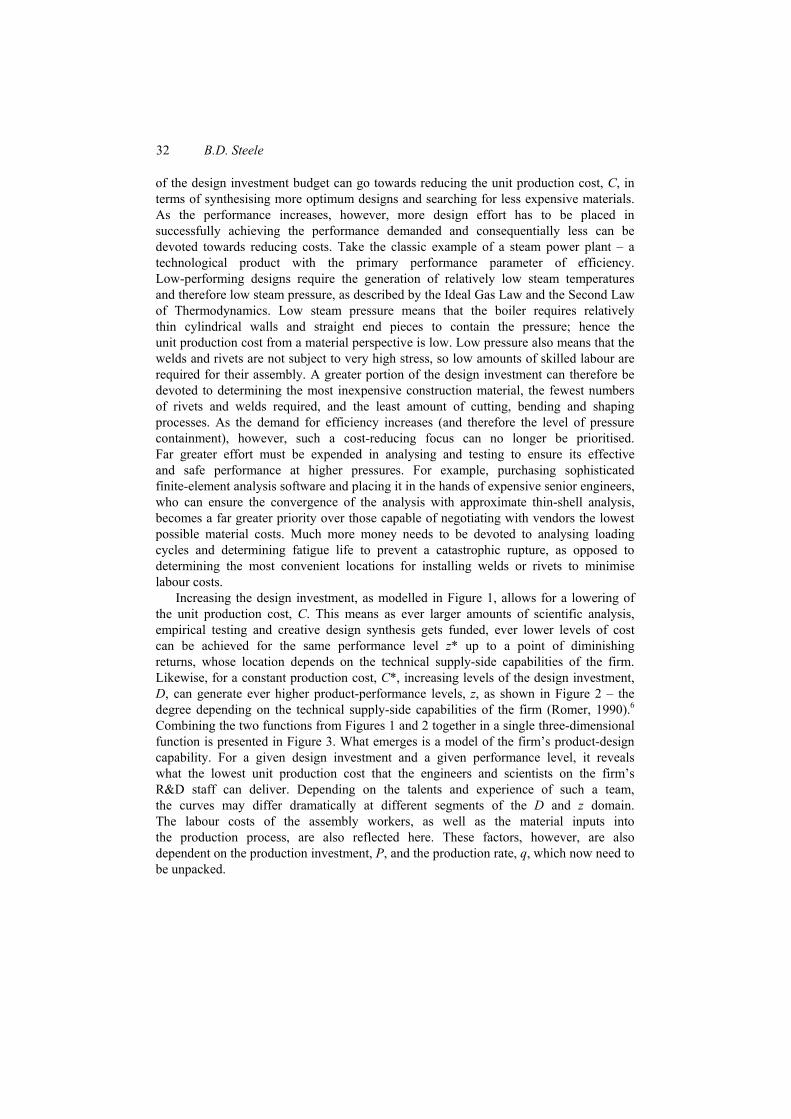
Increasing the design investment, as modelled in Figure 1, allows for a lowering of the unit production cost, C. This means as ever larger amounts of scientific analysis, empirical testing and creative design synthesis gets funded, ever lower levels of cost can be achieved for the same performance level z* up to a point of diminishing returns, whose location depends on the technical supply-side capabilities of the firm. Likewise, for a constant production cost, C*, increasing levels of the design investment, D, can generate ever higher product-performance levels, z, as shown in Figure 2 – the degree depending on the technical supply-side capabilities of the firm (Romer, 1990).6 Combining the two functions from Figures 1 and 2 together in a single three-dimensional function is presented in Figure 3. What emerges is a model of the firm’s product-design capability. For a given design investment and a given performance level, it reveals what the lowest unit production cost that the engineers and scientists on the firm’s R&D staff can deliver. Depending on the talents and experience of such a team, the curves may differ dramatically at different segments of the D and z domain. The labour costs of the assembly workers, as well as the material inputs into the production process, are also reflected here. These factors, however, are also dependent on the production investment, P, and the production rate, q, which now need to be unpacked.
Unifying the supply-side and demand-side of business strategy 33
Figure 1 Unit production cost, C, as a function of technological performance, z, at increasing levels of design investment, D
Figure 2 Unit production cost function, C, as a function of design investment, D, at increasing levels of product performance, z
Figure 3 Unit production cost, C, as a function of product performance, z, and design investment, D
34 B.D. Steele
5 Unit production cost function and production investment
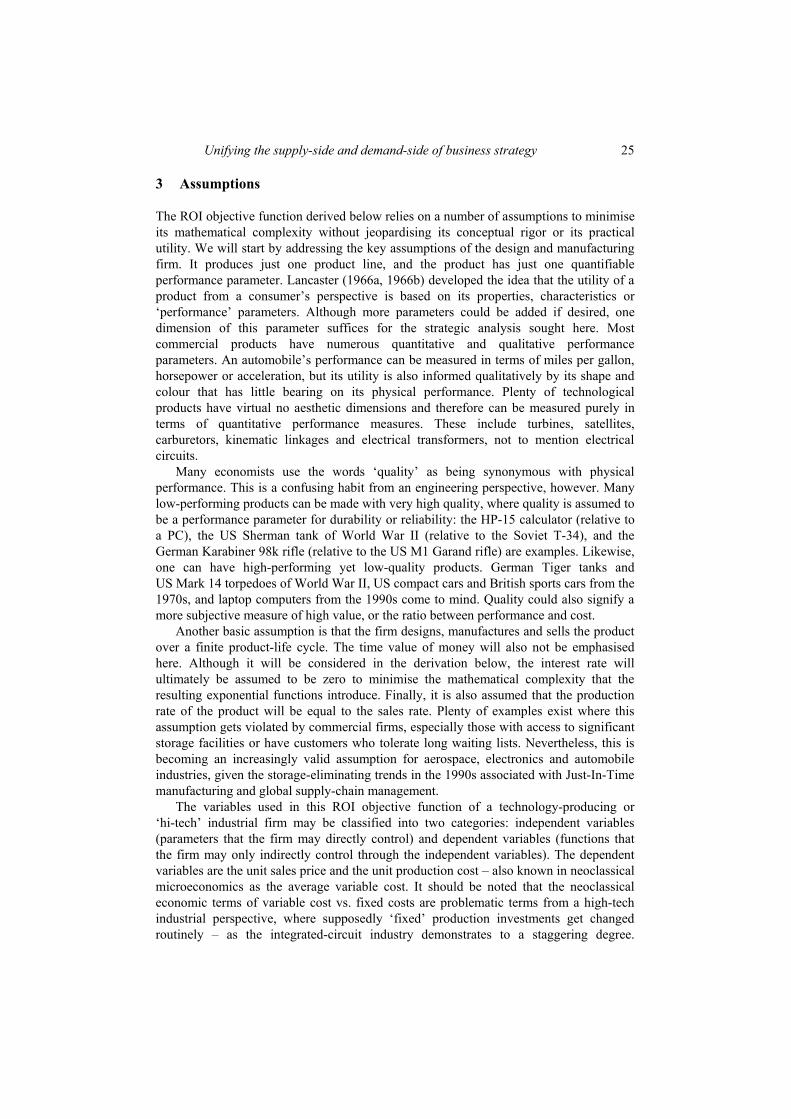
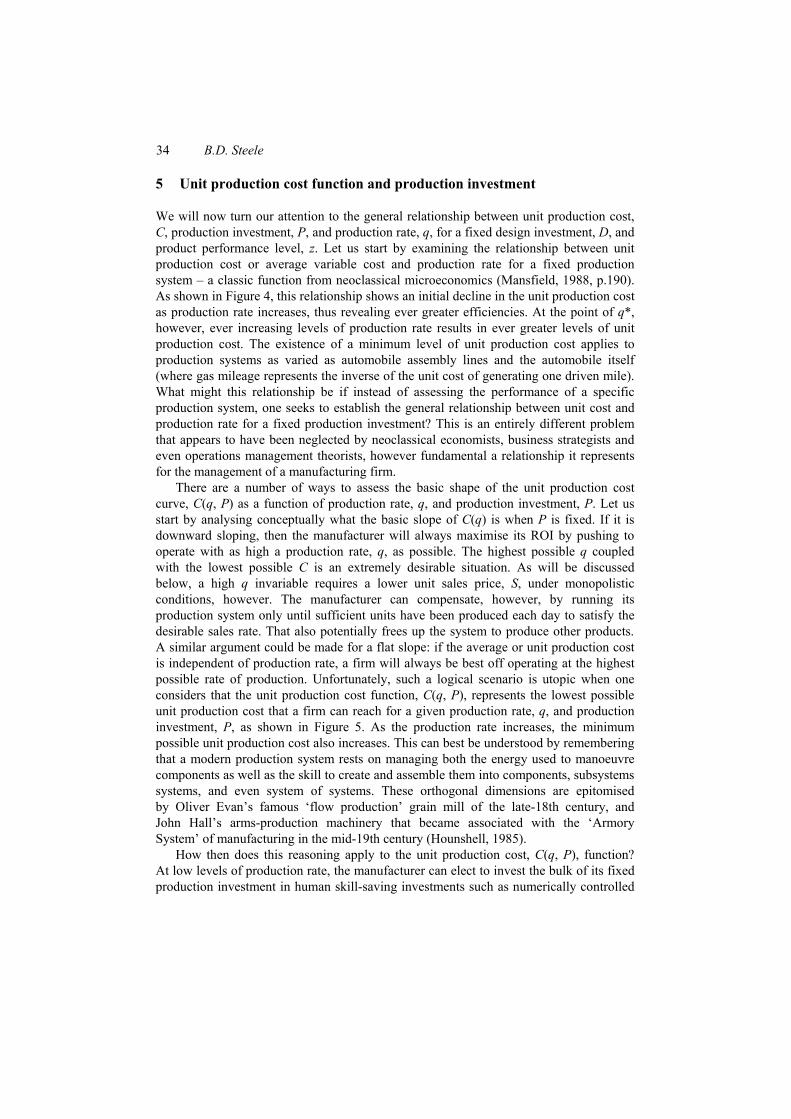
We will now turn our attention to the general relationship between unit production cost, C, production investment, P, and production rate, q, for a fixed design investment, D, and product performance level, z. Let us start by examining the relationship between unit production cost or average variable cost and production rate for a fixed production system – a classic function from neoclassical microeconomics (Mansfield, 1988, p.190). As shown in Figure 4, this relationship shows an initial decline in the unit production cost as production rate increases, thus revealing ever greater efficiencies. At the point of q*, however, ever increasing levels of production rate results in ever greater levels of unit production cost. The existence of a minimum level of unit production cost applies to production systems as varied as automobile assembly lines and the automobile itself (where gas mileage represents the inverse of the unit cost of generating one driven mile). What might this relationship be if instead of assessing the performance of a specific production system, one seeks to establish the general relationship between unit cost and production rate for a fixed production investment? This is an entirely different problem that appears to have been neglected by neoclassical economists, business strategists and even operations management theorists, however fundamental a relationship it represents for the management of a manufacturing firm.
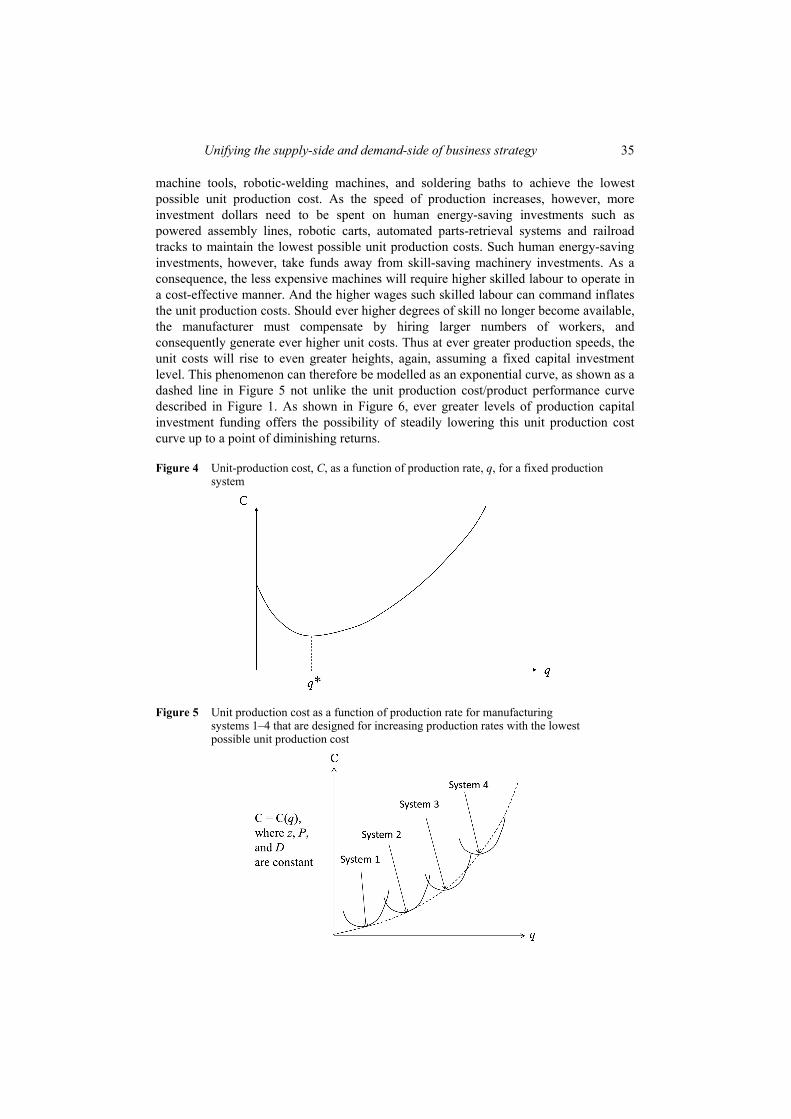
There are a number of ways to assess the basic shape of the unit production cost curve, C(q, P) as a function of production rate, q, and production investment, P. Let us start by analysing conceptually what the basic slope of C(q) is when P is fixed. If it is downward sloping, then the manufacturer will always maximise its ROI by pushing to operate with as high a production rate, q, as possible. The highest possible q coupled with the lowest possible C is an extremely desirable situation. As will be discussed below, a high q invariable requires a lower unit sales price, S, under monopolistic conditions, however. The manufacturer can compensate, however, by running its production system only until sufficient units have been produced each day to satisfy the desirable sales rate. That also potentially frees up the system to produce other products. A similar argument could be made for a flat slope: if the average or unit production cost is independent of production rate, a firm will always be best off operating at the highest possible rate of production. Unfortunately, such a logical scenario is utopic when one considers that the unit production cost function, C(q, P), represents the lowest possible unit production cost that a firm can reach for a given production rate, q, and production investment, P, as shown in Figure 5. As the production rate increases, the minimum possible unit production cost also increases. This can best be understood by remembering that a modern production system rests on managing both the energy used to manoeuvre components as well as the skill to create and assemble them into components, subsystems systems, and even system of systems. These orthogonal dimensions are epitomised by Oliver Evan’s famous ‘flow production’ grain mill of the late-18th century, and John Hall’s arms-production machinery that became associated with the ‘Armory System’ of manufacturing in the mid-19th century (Hounshell, 1985).
How then does this reasoning apply to the unit production cost, C(q, P), function? At low levels of production rate, the manufacturer can elect to invest the bulk of its fixed production investment in human skill-saving investments such as numerically controlled
Unifying the supply-side and demand-side of business strategy 35
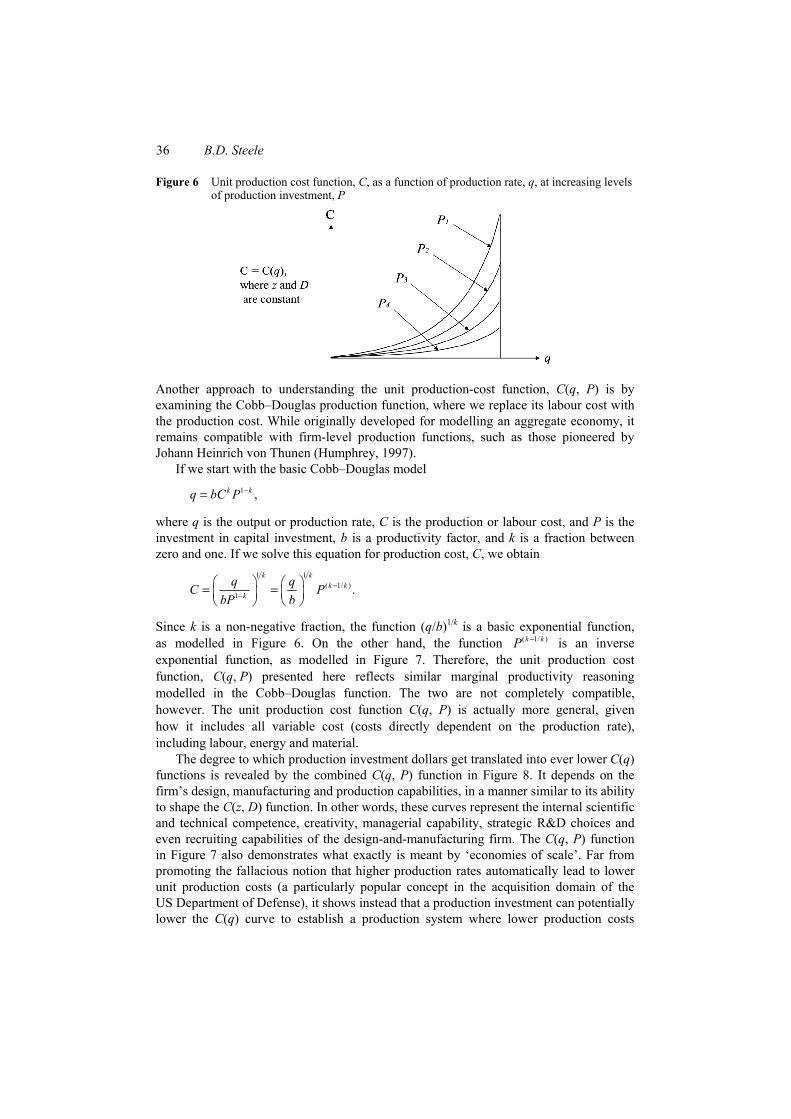
machine tools, robotic-welding machines, and soldering baths to achieve the lowest possible unit production cost. As the speed of production increases, however, more investment dollars need to be spent on human energy-saving investments such as powered assembly lines, robotic carts, automated parts-retrieval systems and railroad tracks to maintain the lowest possible unit production costs. Such human energy-saving investments, however, take funds away from skill-saving machinery investments. As a consequence, the less expensive machines will require higher skilled labour to operate in a cost-effective manner. And the higher wages such skilled labour can command inflates the unit production costs. Should ever higher degrees of skill no longer become available, the manufacturer must compensate by hiring larger numbers of workers, and consequently generate ever higher unit costs. Thus at ever greater production speeds, the unit costs will rise to even greater heights, again, assuming a fixed capital investment level. This phenomenon can therefore be modelled as an exponential curve, as shown as a dashed line in Figure 5 not unlike the unit production cost/product performance curve described in Figure 1. As shown in Figure 6, ever greater levels of production capital investment funding offers the possibility of steadily lowering this unit production cost curve up to a point of diminishing returns.
Figure 4 Unit-production cost, C, as a function of production rate, q, for a fixed production system
Figure 5 Unit production cost as a function of production rate for manufacturing systems 1–4 that are designed for increasing production rates with the lowest possible unit production cost
36 B.D. Steele
Figure 6 Unit production cost function, C, as a function of production rate, q, at increasing levels of production investment, P
Another approach to understanding the unit production-cost function, C(q, P) is by examining the Cobb–Douglas production function, where we replace its labour cost with the production cost. While originally developed for modelling an aggregate economy, it remains compatible with firm-level production functions, such as those pioneered by Johann Heinrich von Thunen (Humphrey, 1997).
If we start with the basic Cobb–Douglas model 1 ,k kq bC P #=
where q is the output or production rate, C is the production or labour cost, and P is the investment in capital investment, b is a productivity factor, and k is a fraction between zero and one. If we solve this equation for production cost, C, we obtain
1 1( 1/ )
1 .k k
k kk
q qC PbbP
##
§ · § ·= =¨ ¸ ¨ ¸© ¹ © ¹
Since k is a non-negative fraction, the function (q/b)1/k
is a basic exponential function,
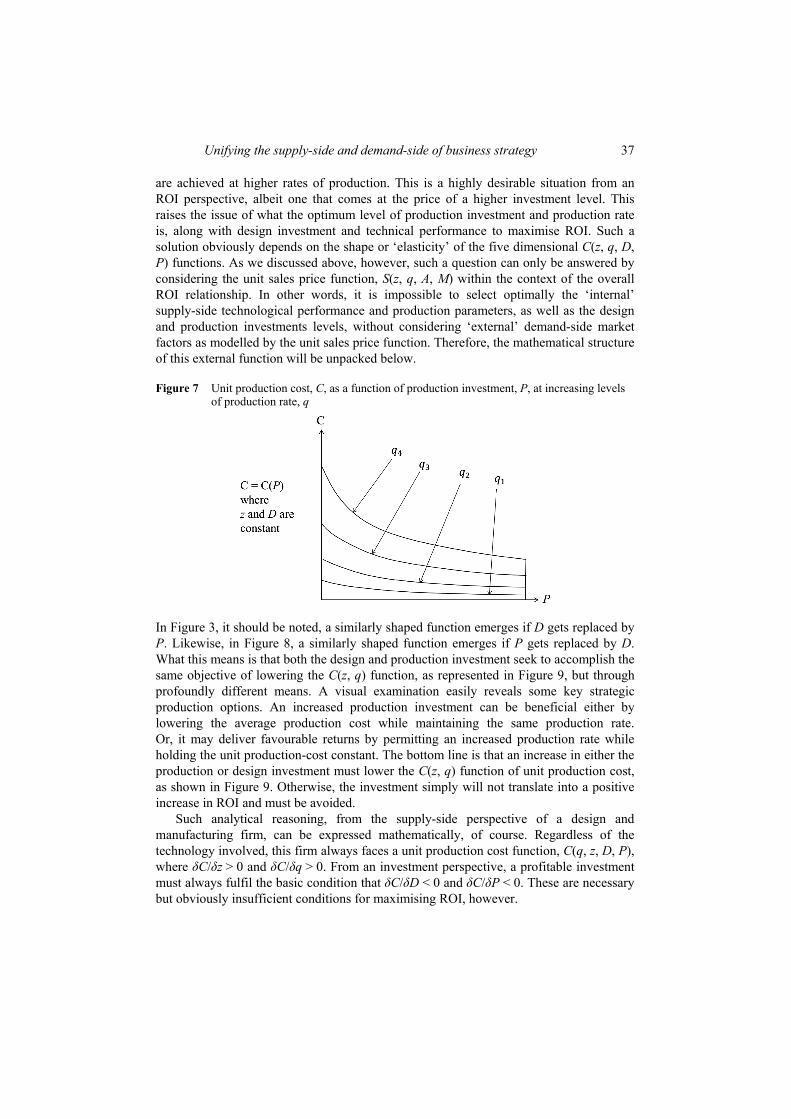
as modelled in Figure 6. On the other hand, the function ( 1/ )k kP # is an inverse exponential function, as modelled in Figure 7. Therefore, the unit production cost function, C(q, P) presented here reflects similar marginal productivity reasoning modelled in the Cobb–Douglas function. The two are not completely compatible, however. The unit production cost function C(q, P) is actually more general, given how it includes all variable cost (costs directly dependent on the production rate), including labour, energy and material.
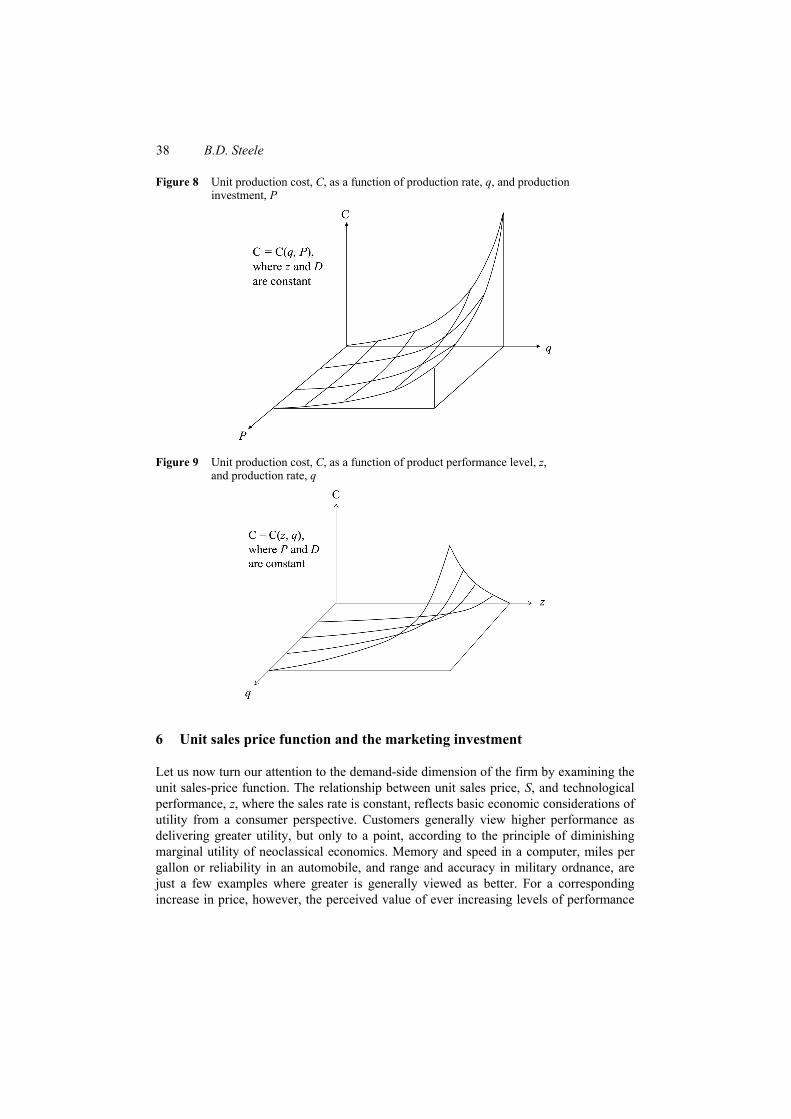
The degree to which production investment dollars get translated into ever lower C(q) functions is revealed by the combined C(q, P) function in Figure 8. It depends on the firm’s design, manufacturing and production capabilities, in a manner similar to its ability to shape the C(z, D) function. In other words, these curves represent the internal scientific and technical competence, creativity, managerial capability, strategic R&D choices and even recruiting capabilities of the design-and-manufacturing firm. The C(q, P) function in Figure 7 also demonstrates what exactly is meant by ‘economies of scale’. Far from promoting the fallacious notion that higher production rates automatically lead to lower unit production costs (a particularly popular concept in the acquisition domain of the US Department of Defense), it shows instead that a production investment can potentially lower the C(q) curve to establish a production system where lower production costs
Unifying the supply-side and demand-side of business strategy 37
are achieved at higher rates of production. This is a highly desirable situation from an ROI perspective, albeit one that comes at the price of a higher investment level. This raises the issue of what the optimum level of production investment and production rate is, along with design investment and technical performance to maximise ROI. Such a solution obviously depends on the shape or ‘elasticity’ of the five dimensional C(z, q, D, P) functions. As we discussed above, however, such a question can only be answered by considering the unit sales price function, S(z, q, A, M) within the context of the overall ROI relationship. In other words, it is impossible to select optimally the ‘internal’ supply-side technological performance and production parameters, as well as the design and production investments levels, without considering ‘external’ demand-side market factors as modelled by the unit sales price function. Therefore, the mathematical structure of this external function will be unpacked below.
Figure 7 Unit production cost, C, as a function of production investment, P, at increasing levels of production rate, q
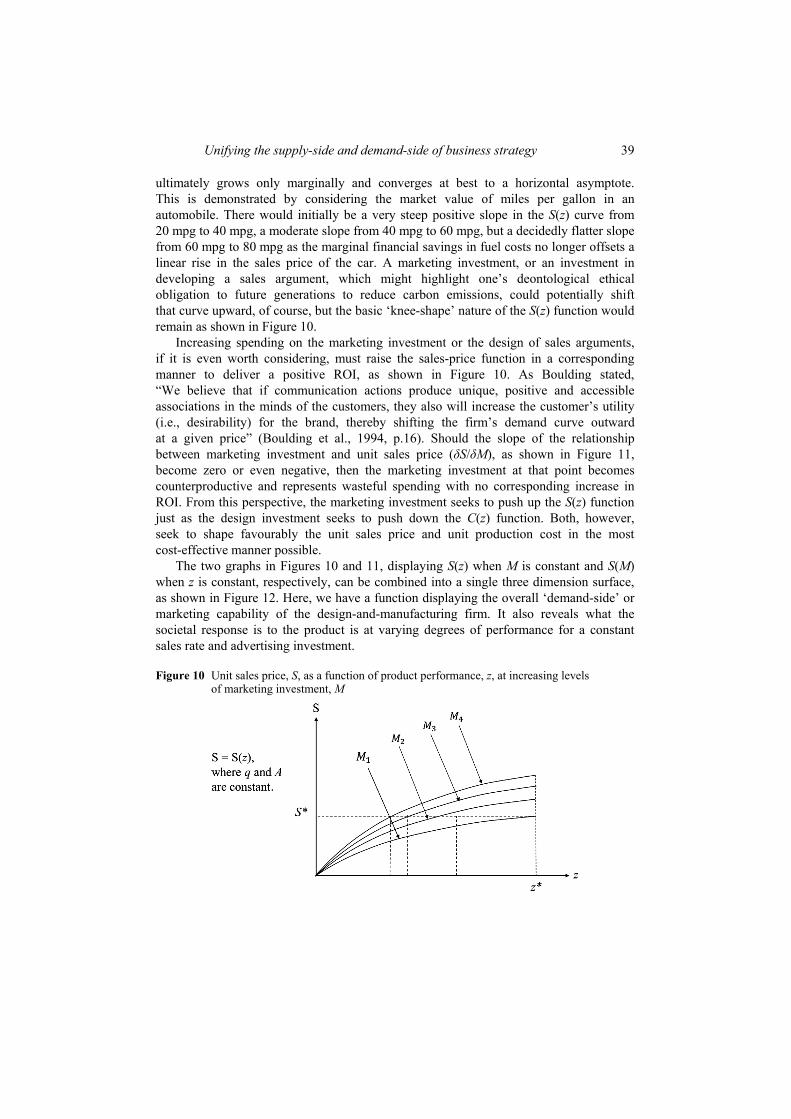
In Figure 3, it should be noted, a similarly shaped function emerges if D gets replaced by P. Likewise, in Figure 8, a similarly shaped function emerges if P gets replaced by D. What this means is that both the design and production investment seek to accomplish the same objective of lowering the C(z, q) function, as represented in Figure 9, but through profoundly different means. A visual examination easily reveals some key strategic production options. An increased production investment can be beneficial either by lowering the average production cost while maintaining the same production rate. Or, it may deliver favourable returns by permitting an increased production rate while holding the unit production-cost constant. The bottom line is that an increase in either the production or design investment must lower the C(z, q) function of unit production cost, as shown in Figure 9. Otherwise, the investment simply will not translate into a positive increase in ROI and must be avoided.
Such analytical reasoning, from the supply-side perspective of a design and manufacturing firm, can be expressed mathematically, of course. Regardless of the technology involved, this firm always faces a unit production cost function, C(q, z, D, P), where įC/įz > 0 and įC/įq > 0. From an investment perspective, a profitable investment must always fulfil the basic condition that įC/įD < 0 and įC/įP < 0. These are necessary but obviously insufficient conditions for maximising ROI, however.
38 B.D. Steele
Figure 8 Unit production cost, C, as a function of production rate, q, and production investment, P
Figure 9 Unit production cost, C, as a function of product performance level, z, and production rate, q
6 Unit sales price function and the marketing investment
Let us now turn our attention to the demand-side dimension of the firm by examining the unit sales-price function. The relationship between unit sales price, S, and technological performance, z, where the sales rate is constant, reflects basic economic considerations of utility from a consumer perspective. Customers generally view higher performance as delivering greater utility, but only to a point, according to the principle of diminishing marginal utility of neoclassical economics. Memory and speed in a computer, miles per gallon or reliability in an automobile, and range and accuracy in military ordnance, are just a few examples where greater is generally viewed as better. For a corresponding increase in price, however, the perceived value of ever increasing levels of performance
Unifying the supply-side and demand-side of business strategy 39
ultimately grows only marginally and converges at best to a horizontal asymptote. This is demonstrated by considering the market value of miles per gallon in an automobile. There would initially be a very steep positive slope in the S(z) curve from 20 mpg to 40 mpg, a moderate slope from 40 mpg to 60 mpg, but a decidedly flatter slope from 60 mpg to 80 mpg as the marginal financial savings in fuel costs no longer offsets a linear rise in the sales price of the car. A marketing investment, or an investment in developing a sales argument, which might highlight one’s deontological ethical obligation to future generations to reduce carbon emissions, could potentially shift that curve upward, of course, but the basic ‘knee-shape’ nature of the S(z) function would remain as shown in Figure 10.
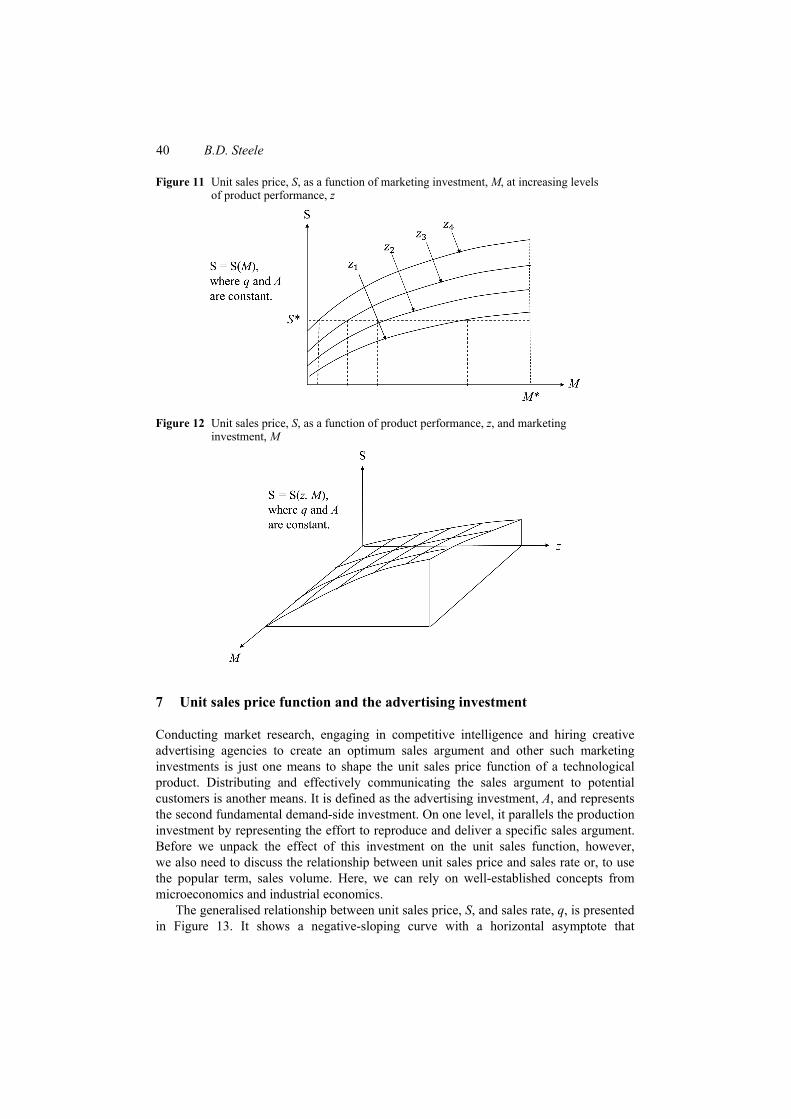
Increasing spending on the marketing investment or the design of sales arguments, if it is even worth considering, must raise the sales-price function in a corresponding manner to deliver a positive ROI, as shown in Figure 10. As Boulding stated, “We believe that if communication actions produce unique, positive and accessible associations in the minds of the customers, they also will increase the customer’s utility (i.e., desirability) for the brand, thereby shifting the firm’s demand curve outward at a given price” (Boulding et al., 1994, p.16). Should the slope of the relationship between marketing investment and unit sales price (įS/įM), as shown in Figure 11, become zero or even negative, then the marketing investment at that point becomes counterproductive and represents wasteful spending with no corresponding increase in ROI. From this perspective, the marketing investment seeks to push up the S(z) function just as the design investment seeks to push down the C(z) function. Both, however, seek to shape favourably the unit sales price and unit production cost in the most cost-effective manner possible.
The two graphs in Figures 10 and 11, displaying S(z) when M is constant and S(M) when z is constant, respectively, can be combined into a single three dimension surface, as shown in Figure 12. Here, we have a function displaying the overall ‘demand-side’ or marketing capability of the design-and-manufacturing firm. It also reveals what the societal response is to the product is at varying degrees of performance for a constant sales rate and advertising investment.
Figure 10 Unit sales price, S, as a function of product performance, z, at increasing levels of marketing investment, M
40 B.D. Steele
Figure 11 Unit sales price, S, as a function of marketing investment, M, at increasing levels of product performance, z
Figure 12 Unit sales price, S, as a function of product performance, z, and marketing investment, M
7 Unit sales price function and the advertising investment
Conducting market research, engaging in competitive intelligence and hiring creative advertising agencies to create an optimum sales argument and other such marketing investments is just one means to shape the unit sales price function of a technological product. Distributing and effectively communicating the sales argument to potential customers is another means. It is defined as the advertising investment, A, and represents the second fundamental demand-side investment. On one level, it parallels the production investment by representing the effort to reproduce and deliver a specific sales argument. Before we unpack the effect of this investment on the unit sales function, however, we also need to discuss the relationship between unit sales price and sales rate or, to use the popular term, sales volume. Here, we can rely on well-established concepts from microeconomics and industrial economics.
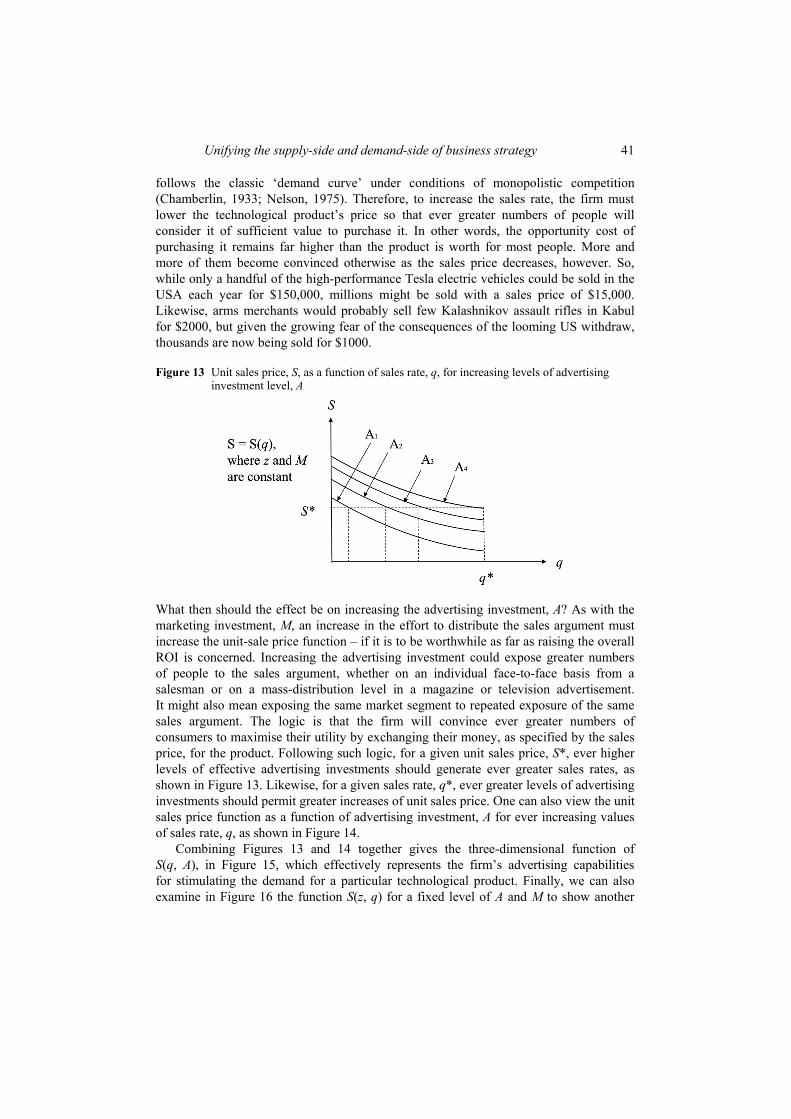
The generalised relationship between unit sales price, S, and sales rate, q, is presented in Figure 13. It shows a negative-sloping curve with a horizontal asymptote that
Unifying the supply-side and demand-side of business strategy 41
follows the classic ‘demand curve’ under conditions of monopolistic competition (Chamberlin, 1933; Nelson, 1975). Therefore, to increase the sales rate, the firm must lower the technological product’s price so that ever greater numbers of people will consider it of sufficient value to purchase it. In other words, the opportunity cost of purchasing it remains far higher than the product is worth for most people. More and more of them become convinced otherwise as the sales price decreases, however. So, while only a handful of the high-performance Tesla electric vehicles could be sold in the USA each year for $150,000, millions might be sold with a sales price of $15,000. Likewise, arms merchants would probably sell few Kalashnikov assault rifles in Kabul for $2000, but given the growing fear of the consequences of the looming US withdraw, thousands are now being sold for $1000.
Figure 13 Unit sales price, S, as a function of sales rate, q, for increasing levels of advertising investment level, A
What then should the effect be on increasing the advertising investment, A? As with the marketing investment, M, an increase in the effort to distribute the sales argument must increase the unit-sale price function – if it is to be worthwhile as far as raising the overall ROI is concerned. Increasing the advertising investment could expose greater numbers of people to the sales argument, whether on an individual face-to-face basis from a salesman or on a mass-distribution level in a magazine or television advertisement. It might also mean exposing the same market segment to repeated exposure of the same sales argument. The logic is that the firm will convince ever greater numbers of consumers to maximise their utility by exchanging their money, as specified by the sales price, for the product. Following such logic, for a given unit sales price, S*, ever higher levels of effective advertising investments should generate ever greater sales rates, as shown in Figure 13. Likewise, for a given sales rate, q*, ever greater levels of advertising investments should permit greater increases of unit sales price. One can also view the unit sales price function as a function of advertising investment, A for ever increasing values of sales rate, q, as shown in Figure 14.
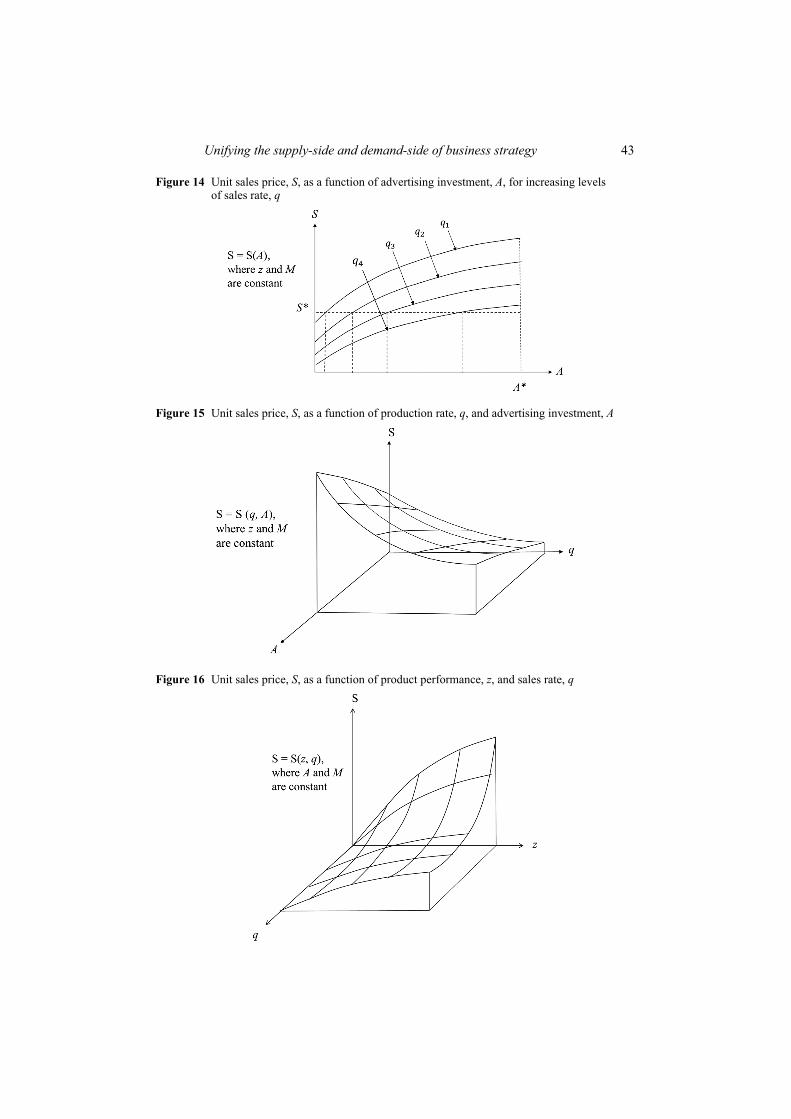
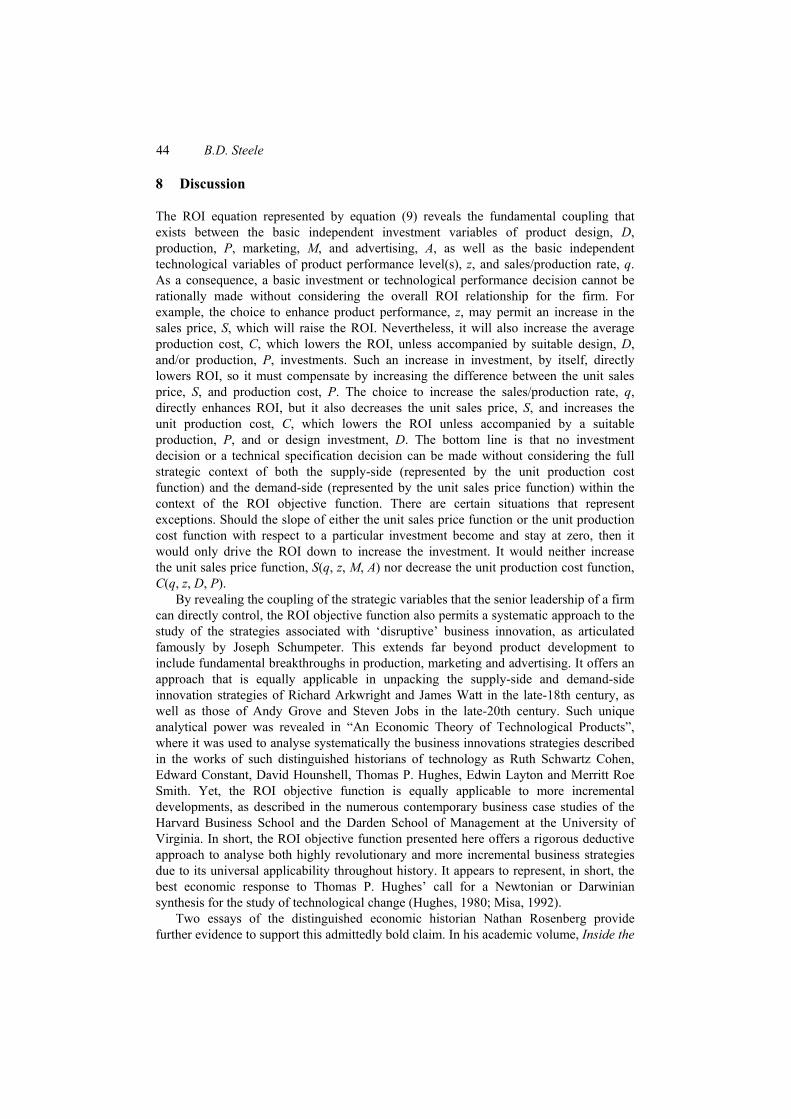
Combining Figures 13 and 14 together gives the three-dimensional function of S(q, A), in Figure 15, which effectively represents the firm’s advertising capabilities for stimulating the demand for a particular technological product. Finally, we can also examine in Figure 16 the function S(z, q) for a fixed level of A and M to show another
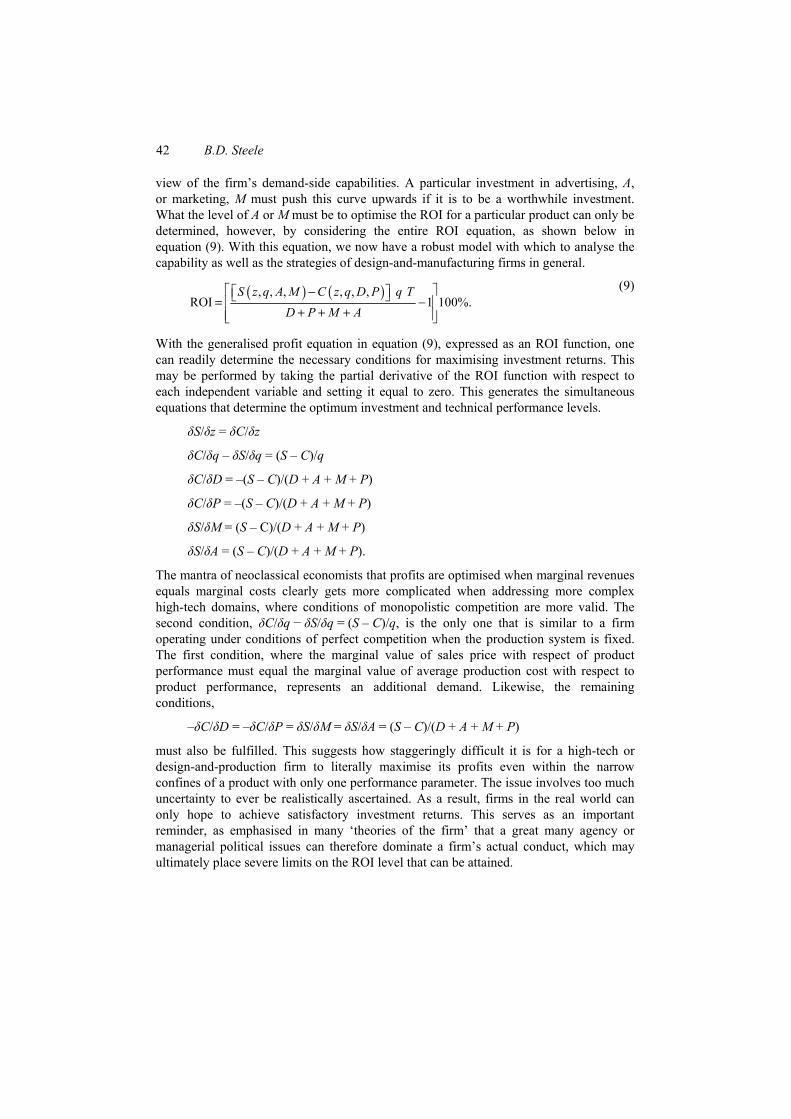
42 B.D. Steele
view of the firm’s demand-side capabilities. A particular investment in advertising, A, or marketing, M must push this curve upwards if it is to be a worthwhile investment. What the level of A or M must be to optimise the ROI for a particular product can only be determined, however, by considering the entire ROI equation, as shown below in equation (9). With this equation, we now have a robust model with which to analyse the capability as well as the strategies of design-and-manufacturing firms in general.
( ) ( ), , , , , , ROI 1 100%.
S z q A M C z q D P q T
D P M A
ª º#ª º¬ ¼= #« »+ + +« »¬ ¼
(9)
With the generalised profit equation in equation (9), expressed as an ROI function, one can readily determine the necessary conditions for maximising investment returns. This may be performed by taking the partial derivative of the ROI function with respect to each independent variable and setting it equal to zero. This generates the simultaneous equations that determine the optimum investment and technical performance levels.
įS/įz = įC/įz
įC/įq – įS/įq = (S – C)/q
įC/įD = –(S – C)/(D + A + M + P)
įC/įP = –(S – C)/(D + A + M + P)
įS/įM = (S – C)/(D + A + M + P)
įS/įA = (S – C)/(D + A + M + P).
The mantra of neoclassical economists that profits are optimised when marginal revenues equals marginal costs clearly gets more complicated when addressing more complex high-tech domains, where conditions of monopolistic competition are more valid. The second condition, įC/įq í įS/įq = (S – C)/q, is the only one that is similar to a firm operating under conditions of perfect competition when the production system is fixed. The first condition, where the marginal value of sales price with respect of product performance must equal the marginal value of average production cost with respect to product performance, represents an additional demand. Likewise, the remaining conditions,
–įC/įD = –įC/įP = įS/įM = įS/įA = (S – C)/(D + A + M + P)
must also be fulfilled. This suggests how staggeringly difficult it is for a high-tech or design-and-production firm to literally maximise its profits even within the narrow confines of a product with only one performance parameter. The issue involves too much uncertainty to ever be realistically ascertained. As a result, firms in the real world can only hope to achieve satisfactory investment returns. This serves as an important reminder, as emphasised in many ‘theories of the firm’ that a great many agency or managerial political issues can therefore dominate a firm’s actual conduct, which may ultimately place severe limits on the ROI level that can be attained.
Unifying the supply-side and demand-side of business strategy 43
Figure 14 Unit sales price, S, as a function of advertising investment, A, for increasing levels of sales rate, q
Figure 15 Unit sales price, S, as a function of production rate, q, and advertising investment, A
Figure 16 Unit sales price, S, as a function of product performance, z, and sales rate, q
44 B.D. Steele
8 Discussion
The ROI equation represented by equation (9) reveals the fundamental coupling that exists between the basic independent investment variables of product design, D, production, P, marketing, M, and advertising, A, as well as the basic independent technological variables of product performance level(s), z, and sales/production rate, q. As a consequence, a basic investment or technological performance decision cannot be rationally made without considering the overall ROI relationship for the firm. For example, the choice to enhance product performance, z, may permit an increase in the sales price, S, which will raise the ROI. Nevertheless, it will also increase the average production cost, C, which lowers the ROI, unless accompanied by suitable design, D, and/or production, P, investments. Such an increase in investment, by itself, directly lowers ROI, so it must compensate by increasing the difference between the unit sales price, S, and production cost, P. The choice to increase the sales/production rate, q, directly enhances ROI, but it also decreases the unit sales price, S, and increases the unit production cost, C, which lowers the ROI unless accompanied by a suitable production, P, and or design investment, D. The bottom line is that no investment decision or a technical specification decision can be made without considering the full strategic context of both the supply-side (represented by the unit production cost function) and the demand-side (represented by the unit sales price function) within the context of the ROI objective function. There are certain situations that represent exceptions. Should the slope of either the unit sales price function or the unit production cost function with respect to a particular investment become and stay at zero, then it would only drive the ROI down to increase the investment. It would neither increase the unit sales price function, S(q, z, M, A) nor decrease the unit production cost function, C(q, z, D, P).
By revealing the coupling of the strategic variables that the senior leadership of a firm can directly control, the ROI objective function also permits a systematic approach to the study of the strategies associated with ‘disruptive’ business innovation, as articulated famously by Joseph Schumpeter. This extends far beyond product development to include fundamental breakthroughs in production, marketing and advertising. It offers an approach that is equally applicable in unpacking the supply-side and demand-side innovation strategies of Richard Arkwright and James Watt in the late-18th century, as well as those of Andy Grove and Steven Jobs in the late-20th century. Such unique analytical power was revealed in “An Economic Theory of Technological Products”, where it was used to analyse systematically the business innovations strategies described in the works of such distinguished historians of technology as Ruth Schwartz Cohen, Edward Constant, David Hounshell, Thomas P. Hughes, Edwin Layton and Merritt Roe Smith. Yet, the ROI objective function is equally applicable to more incremental developments, as described in the numerous contemporary business case studies of the Harvard Business School and the Darden School of Management at the University of Virginia. In short, the ROI objective function presented here offers a rigorous deductive approach to analyse both highly revolutionary and more incremental business strategies due to its universal applicability throughout history. It appears to represent, in short, the best economic response to Thomas P. Hughes’ call for a Newtonian or Darwinian synthesis for the study of technological change (Hughes, 1980; Misa, 1992).
Two essays of the distinguished economic historian Nathan Rosenberg provide further evidence to support this admittedly bold claim. In his academic volume, Inside the
Unifying the supply-side and demand-side of business strategy 45
Black Box: Technology and Economics, he analyses the two quintessential high-tech industries of the 20th century: electronics and aerospace, with a focus on the development of integrated circuits and commercial aircraft. Rosenberg elected to analyse these developments on a purely qualitative level without the use of explicit economic models or theories. By using the ROI objective function, one can approach such history in a more systematic and analytically rigorous manner. Let us commence with Mowery and Rosenberg’s essay, “Technological Change in the Commercial Aircraft Industry, 1925–1975 (Mowery and Rosenberg, 1982). The authors sought to explain why commercial aircraft experienced such a staggering increase in technological performance levels, z (speed, safety and volume), which led to vast increases in the productivity of the commercial airlines or air-transportation firms, as measured by a 90% decrease in their unit production costs (cost per seat mile), C, from the 1920s through the 1970s. From a supply-side perspective, Mowery and Rosenberg explained how the federal government played a highly significant role in substantially reducing the design and production investments required by the commercial aircraft manufacturers to achieve such progress in an affordable manner for the commercial airliners. This partially came from the ‘spillover effect’ of federal spending on military aircraft, where an aircraft firm could apply the design and production lessons that military contracts allowed them to learn at taxpayer expense and use it to substantially reduce the investments required to increase the product performance level, z, of commercial aircraft. Federal spending on R&D, as evidenced prominently by the National Advisory Committee for Aeronautics (NACA), also lowered the design investments, D, required by the ambitious commercial aircraft projects, which kept pushing the performance envelop. As a result, the commercial airlines enjoyed vast decreases in their unit production cost function, C(q, z, D, P), while the complexity of the aircraft increased profoundly. Lowering this function gives the firm the option to manufacture products with the same performance for a lower cost, higher performance for the same cost, or even higher performance for lower cost – the actual strategic option selected by the commercial aircraft firms.
Mowery and Rosenberg did more than just focus on supply-side factors, however. They also examined how the federal government also stimulated the demand-side to push up the unit sales price function, S(q, z, M, A). This initially occurred through air-mail delivery contracts and then through the Civil Aeronautics Board (CAB). During the early 1930s, the federal government reduced the air postal rates to boost the sales rate, while also fixing the per weight payments to the firms. In other words, for absolutely no marketing or advertising investments (except, perhaps, for some lobbying in Washington, DC), the air transportation firms saw their production rate, q, of letters flown increase, while their sales price, S, remained fixed and their unit production cost, C, increased only marginally. The firms only had to increase their production investment of new aircraft purchased. As a result, their sales price function, S(q, z, M, A) increased. This function received a further boost when the McNary-Waters Act of 1930 mandated space-mile charges.
It was through the regulations of the CAB that the demand-side prerequisites for the rapid rate of commercial aircraft obsolescence really took off during the 1950s and 1960s. Given its strict control of commercial airliners’ pricing, route structure and market entry, the airliners elected to compete for passengers by increasing the performance level, z, of the ride in terms of safety, speed, comfort and pleasure. In other words, since CAB fixed the unit sales price level, S, and placed significant constraints on the sales rate, q, commercial airliners were willing to make ever larger production investments, P, of
46 B.D. Steele
higher performing aircraft to maximise their sales revenue. As Mowery and Rosenberg noted, however, “repeatedly, purchases of new aircraft designs by one carrier were matched by a competitor, resulting in recurrent binges of new equipment purchasing that left airlines burdened with heavy debts and excess carrying capacity” (p.173). Such inability to monopolise the new technology forced the airliners to make significant market, M, and advertising, A, investments that trumpeted their superior performance and service over the competition. The resulting increase in the sales price function and ROI was therefore relatively low. That said, at least the airliners were able to make some profits due to the spillovers from both the military and other commercial industries (petroleum and metallurgy, for example) that allowed the aircraft manufacturers to offer vast performance increases at substantially lower prices.
“Economic Implications of the VLSI Revolution” (Rosenberg and Steinmueller, 1982) also addressed the development of vast performance increases in integrated circuits during the 1960s and 1970s for rapidly decreasing levels of unit production cost. The authors also addressed both the supply-side and demand-side dimensions of this astonishing history of technological change. In the electronics industry, the primary product performance variable, z, is the density of circuit elements in the integrated circuit. Greater density is directly related to greater levels of computing speed or memory. So, as described by Rosenberg and Steinmueller, the trajectory of this development involved ever greater increases in the production investment, P, of the integrated circuit firms, which delivered ever cleaner manufacturing environments. Lower levels of contamination led to greater increases in the performance, z, of the ICs in terms of density for only modest design investments, D. On the other hand, the price per unit of performance ratio fell dramatically. So, while a profitable IC production plant cost around $2 million in 1970, a profitable plant in 1979 cost over $50 million. The only way to secure a sustainable ROI on the ever increasing production investment, P, was to achieve a vast increase of the sales/production rate, q. As a result, a few dominant firms emerged, not unlike the commercial airline manufacturers, as smaller firms became unable to secure sufficient sales.
Rosenberg and Steinmueller added that this vast decline in the average production cost function of the IC industry does not tell this entire story of high-tech business strategy. Only through new product innovation, including software, can a sufficiently high demand get developed for these ever higher performing and higher cost chips. What these firms did to boost their sales-price function with unusual marketing and advertising investments to ensure the growth of demand for these chips gets neglected in this essay, however. This includes making investments in new startup firms that were innovating new consumer electronics products that required ever more powerful ICs. Mike Markkula’s highly strategic investment in the young Apple Computer company to simultaneously boost the value of his Intel stocks, is a famous example of such an effort to increase the sales price function, S(q, z, M, A) of his former employer. Nalebuff and Brandenberger (1996) describe another type of demand-side investment that Intel made. To boost the demand for the Pentium Pro chip, Intel invested over $100 million in ProShare, a firm that produced a videoconferencing system for PCs. Before ProShare could only function effectively, it required Integrated Services Digital Network (ISDN) telephone lines, which Intel successfully convinced telephone companies to start installing. Likewise, they convinced Compaq to include ProShare with its business PCs. In short, Intel’s marketing, M, and advertising, A, investments, which targeted the local telephone companies and Compaq, also involved a $100 million investment in ProShare
Unifying the supply-side and demand-side of business strategy 47
stocks to ensure the successful development of the videoconferencing system. These represent investments that significantly boosted the sale-price function of Intel’s latest IC chips, so that when combined with the vast investment in the production facility, P, a satisfactory ROI level could be secured.
Such history reveals how marketing and advertising investment can be both direct and indirect. Paying an advertising agency money to develop a new sales argument for a new machine tool represents a direct marketing investment. Purchasing sufficient stock in a firm to provide the capital for it to reduce its product costs sufficiently so that it will be more receptive to the logic of the sales argument, however, is an indirect marketing investment. Such indirect demand-side investments could also range from charitable and campaign donations to securing elite country-club memberships for senior marketing executives. They are designed to minimise the cost of making the direct marketing and advertising investments. Using the military strategy language of Liddell-Hart, such reasoning is comparable to making a flanking military attack (indirect approach) to support a frontal assault (direct approach), to reduce the far heavier heavy costs of relying only on a frontal assault (Liddell-Hart, 1991).
The ROI objective function represents more than just a framework for understanding the history of innovation from a scholarly perspective. It also helps increase the critical thinking which business practitioners can use to interpret the advice of business-strategy experts. In other words, it helps fulfil that ideal from the Age of Enlightenment to get people to reason for themselves from first principles along the lines of Newtonian mechanics rather than relying solely on the pronouncement of authorities (Kant, 1996).7 For example, when Peter Drucker proclaimed that “any business enterprise has two – and only two – basic functions: marketing and innovation”, the ROI objective function counters that it involves either pushing down the average production cost function on the supply-side (‘innovation’), pushing up the sales price function on the demand-side (‘marketing’) or both (Drucker, 1954, pp.39–40). Nalebuff and Brandenberger (1996) likewise maintain that “a player is a complement if customers value your product more when they already have the other player’s product than when they have your product alone” (p.18), and that “a player is a competitor when a customer values your product less when they have the other player’s product than when they have your product alone” (p.18). The definitions of competitors and complements can be more rigorously defined in terms of the ROI objective function, where the ambiguity of ‘customer value’ is avoided since it does not distinguish between sales price and product performance. Here, a complementor is an external actor (an individual or organisation outside of firm) whose products either increase the firm’s unit sales price function and/or lowers the unit production cost function. Conversely, a competitor is an external actor whose products either decrease the firm’s unit sales price function and/or increase its unit production-cost function.
Let us now turn our attention to some central issues in Michael Porter’s highly influential thinking on business strategy. Porter (1980) defines three generic business strategies: overall cost leadership, differentiation and focus. All three can be restated in terms of the ROI objective function. The overall cost-leadership strategy can be viewed as focusing on lowering the average production costs, C, while either maintaining or decreasing the product performance level, z. Since it has a market-wide orientation, the overall cost leadership strategy is usually accompanied by a large sales/production rate, q (Bowman, 2008).8 The strategy of differentiation can be viewed as focusing on increasing or offering a unique set of product performance levels, z, while either maintaining or
48 B.D. Steele
increasing the unit production costs, C. Since it also has a large market focus, the production rate, q, is also high. Finally, the focus strategy involves a low production cost, C, or high performance level, z, but since it is oriented towards a narrow section of the market, the production rate, q, is low. The ROI objective function also permits consideration of a strategy not addressed by Porter, the highly innovative or revolutionary strategy of achieving very high performance at very low production cost, like the microprocessor or modern jet aircraft (in terms of passenger mile).
Porter’s Five Competitive Forces framework can also be interpreted with the ROI objective function. The framework is biased towards demand-side forces that could potentially lower the average sales price function, S, including “threat of new entrants”, “bargaining power of buyers”, “rivalry among existing competitors” and “threat of substitute products or services”. “Bargaining power of suppliers” appears to be the only one of Porter’s forces that directly threatens to increase the average sales price function, C. It is not hard to see how demand-side threats, such as “threat of new entrants” could increase the firm’s average sales price function, C. It could bid up the salaries of skilled employees and the price of raw materials, which would influence the “bargaining power of suppliers”. Nevertheless, the focus of Porter on the external competitive forces impinging on the firm, to the exclusion of its internal capabilities from both a supply-side and demand-side perspective, is revealed by his recent claim that the “job of the strategist is to understand and cope with competition” (Porter, 2008, p.79). Porter (1996) does address the importance of developing internal supply-side capabilities from the perspective of operational effectiveness, however. He can be viewed as defining such effectiveness as production investments that represent profitable ROIs without consideration of the competitive or demand-side market conditions. As confirmed by the logic of the ROI objective function, he concludes it is a necessary but insufficient investment strategy.
The ROI objective function also reveals how the generic strategy approach of Porter and other business strategists is oriented towards the ‘ends’ of business strategy rather than the firm’s ‘means’ and ‘ways’, to use the popular framework in military strategy. The ROI objective function, in contrast, articulates the ‘end’ result from the consumers’ perspective, as well as shedding light on the ‘means’ or available resources to be used, consumed, or invested, along with the ‘ways’ in which the resources get distributed among different investment options to achieve tangible capabilities – as represented by the firm’s unit production cost and unit sales price functions. This more balanced approach to strategic thinking is critical, since many different ways and means exist to accomplish the same ends. Thus, instead of the output or ‘ends’ parameter that Porter focuses on (technological performance, sales/production rate and sales price) it adds input or means and ways parameters (design, production, advertising, and marketing investments). As a result, the ROI objective function reveals how strategic business choices can be more fully articulated in terms of the vast combinations of the two technical and four investment independent variables. Likewise, it incorporates into a single equation the basic strategic means of selecting product-design and production-process constraints, as well as allocating investment resources.
The ROI objective function offers a systematic approach for interpreting frameworks of competitive or complementary business forces. Yet, it also offers a deductive theory with which to analyse what the firm’s optimum response should be to such forces, as well as developments to its internal demand-side and supply-side capabilities. As demonstrated in “An Economic Theory of Technological Products”, but beyond the
Unifying the supply-side and demand-side of business strategy 49
scope of this paper, if a firm’s supply-side and demand-side capabilities can be modelled algebraically in terms of average sales-price and average production-cost functions, it is possible to analyse what its optimum strategic response should be to maximise the firm’s investment return. Given the difficulties of defining empirically the simple two-dimensional supply and demand curves in perfectly competitive markets, however, the prospect of constructing such far more complicated five-dimensional supply-side and demand-side functions under conditions of monopolistic competition is daunting. But at least this paper describes some of those functions’ persistent mathematical characteristics.
9 Conclusion
The basic ROI objective function, as originally presented in “An Economic Theory of Technological Products” has proved challenging for business strategy theorists and neoclassical economists to accept. As a result, a detailed review of both the supporting and conflicting literature is presented here from both a demand-side and supply-side perspective. On the demand side, this includes the work on Chamberlin, Dorfman & Steiner and more recently, Lee and Johnson & Myatt. On the supply side, this involves the work of Harter, Segerstrom and Lee. And finally, on both the supply side and demand side, it includes the work on Elliot, Hall, Bernstein & Nardiri, and Grabowski & Mueller. The ROI objective function goes well beyond such analysis, however, to integrate rigorously these dimensions to create a robust economic theory of a design and manufacturing firm. It works within the assumptions that both neoclassical and neo-Schumpeterian economists privilege. As a result, it furnishes a fundamental economic constraint to strategic business reasoning, thus generating more critical thinking for business managers and entrepreneurs when confronted with the latest fad in strategic (or is it actually tactical?) thinking. And unlike the empirical Cobb–Douglas production function, the ROI objective function is based on physical considerations from engineering, as well as basic neoclassical thinking about markets and production. This function is hardly a general theory of a firm, however, given how it is focused only on the technical and investment relationships associated with a single product. It therefore does not address the optimum strategies of multi-product firms and corporate conglomerates. Nevertheless, it does provide an analytical foundation that should inform such corporate-level reasoning. And while the ROI objective function undermines the ability of neoclassical economists to calculate their cherished market equilibrium states, it does reveal how their rigorous mathematical reasoning with continuous differentiable functions is essential for a disciplined approach to business strategy. The implications for the academic discipline of industrial engineering may even be more profound. The ROI objective function provides a fundamental yet accessible theory for optimising the design constraints of both the product and its production system.
Acknowledgement
The author would like to thank Robert Jaedicke of the Stanford Business School and Richard Lipsey of Simon Fraser University for their critical feedback during the writing of this paper. He also wants to expresses his appreciation to Dr. Jose Colon of the Joint
50 B.D. Steele
Improvised Explosives Device Defeat Organization (JIEDDO) for supporting the writing of the first draft of this paper, and his gratitude to Tamera Dorland for the encouragement and intellectual stimulation needed to complete the final version.
References Bernstein, J.I. and Nadiri, M.I. (1991) Product Demand, Cost of Production, Spillovers, and the
Social Rate of Return to R&D, NBER Working Paper No. w3625, Cambridge. Boulding, W., Lee, E. and Staelin, R. (1994) ‘Mastering the mix: Do advertising, promotion, and
sales force activities lead to differentiation?’, Journal of Marketing Research, Vol. 31, No. 2, pp.159–172.
Bowman, C. (2008) ‘Generic strategies: a substitute for thinking?’, 360° The Ashbridge Journal, Spring, pp.6–11.
Brealey, R., Meyers, S. and Allen, F. (2008) Principles of Corporate Finance, 9th ed., McGraw Hill, Boston.
Chamberlin, E. (1933) The Theory of Monopolistic Competition: A Re-orientation of the Theory of Value, Harvard University Press, Cambridge.
Chamberlin, E. (1953) ‘The product as an economic variable’, The Quarterly Journal of Economics, Vol. 67, No. 1, pp.1–29.
Chauvin, K.W. and Hirschey, M. (1993) ‘Advertising, R&D expenditures and the market value of the firm’, Financial Management, Vol. 22, No. 4, pp.128–140.
Creamer, M. (2008) ‘Think different: Maybe the web’s not a place to stick your ads’, Advertising Age, Midwest region edition, Vol. 79, No. 11, p.3.
Dorfman, R. and Steiner, P.O. (1954) ‘Optimal advertising and optimal quality’, The American Economic Review, Vol. 44, No. 5, pp.826–836.
Drucker, P. (1954) The Practice of Management, Harper and Row, New York. Elliott, J.W. (1983) ‘Advertising and R&D investments in the wealth-maximizing firm’,
The Journal of Economics and Business, Vol. 35, Nos. 3–4, pp.389–397. Erickson, G. and Jacobson, R. (1992) ‘Gaining comparative advantage through discretionary
expenditures: the returns to R&D and advertising’, Management Science, Vol. 38, No. 9, pp.1264–1279.
Freiesleben, J. (2010) ‘Proposing a new approach to discussing economic effects of design quality’, International Journal of Production Economics, Vol. 124, No. 2, pp.348–359.
Grabowski, H.G. and Mueller, D.C. (1978) ‘Industrial research and development, intangible capital stocks, and firm profit rates’, The Bell Journal of Economics, Vol. 9, No. 2, pp.328–343.
Hall, B.H., Mairesse, J. and Mohnen, P. (2010) ‘Measuring the returns to R&D’, in Hall, B.H. and Rosenberg, N. (Eds.): Handbook of the Economics of Innovation, North Holland, Oxford, 2010, Chapter 24.
Harter, J.F.R. (1993) ‘Differentiated products with R&D’, The Journal of Industrial Economics, Vol. 41, No. 1, pp.19–28.
Hirschey, M. (1982) ‘Intangible capital aspects of advertising and R&D expenditures’, The Journal of Industrial Economics, Vol. 30, No. 4, pp.375–390.
Hounshell, D. (1985) From the American System to Mass Production, 1800–1932: The Development of Manufacturing Technology in the United States, Johns Hopkins University Press, Baltimore.
Hughes, T.P. (1980) ‘The order of the technological world’, History of Technology, Vol. 5, pp.1–16.
Humphrey, T. (1997) ‘Algebraic production functions and their uses before Cobb-Douglas’, Federal Reserve Bank of Richmond Economic Quarterly, Vol. 83, No. 1, pp.51–83.
Unifying the supply-side and demand-side of business strategy 51
Jacobson, R. (1987) ‘The validity of ROI as a measure of business performance’, The American Economic Review, Vol. 77, No. 3, pp.470–478.
Johnson, J.P. and Myatt, D.P. (2004) ‘On the simple economics of advertising, marketing, and product design’, The American Economic Review, Vol. 96, No. 3, pp.756–784.
Kant, I. (1996) ‘An answer to the question: what is enlightenment?’, in Schmidt, J. (Ed.): What is Enlightenment?: Eighteenth-Century Answers to Twentieth-Century Questions, University of California Press, Berkeley, pp.58–64.
Kossiakoff, A., Sweet, A., Seymour, S. and Biemer, S. (2011) Systems Engineering Principles and Practice, John Wiley and Sons, Inc., Hoboken.
Lancaster, K. (1966b) ‘Change and innovation in the technology of consumption’, The American Economic Review, Vol. 56, Nos. 1–2, pp.14–23.
Lancaster, K.J. (1966a) ‘A new approach to consumer theory’, The Journal of Political Economy, Vol. 74, No. 2, pp.132–157.
Lee, C-Y. (2002a) ‘Advertising: its determinants and market structure’, Review of Industrial Organization, Vol. 21, No. 1, pp.89–101.
Lee, C-Y. (2002b) ‘A simple model of R&D: an extension of the Dorfman-Steiner theorem’, Applied Economics Letters, Vol. 9, No. 7, pp.449–452.
Lee, C-Y. (2003) ‘A simple theory and evidence on the determinants of firm R&D’, Economics of Innovation and New Technology, Vol. 12, No. 5, pp.385–395.
Liddell-Hart, B.H. (1991) Strategy, Penguin Books, New York. Lipsey, R.G., Carlaw, K.I. and Bekar, C.T. (2005) Economic Transformations: General Purpose
Technologies and Long Term Economic Growth, Oxford University Press, Oxford. Mansfield, E. (1988) Microeconomics: Theory and Applications, W.W. Norton & Company,
New York City. McMahon, M. (1973) ‘An American courtship: psychologists and advertising theory in the
progressive era’, American Studies, Vol. 13, No. 2, pp.5–18. McNaugher, T.L. (1989) New Weapons, Old Politics: America’s Military Procurement Muddle,
Brookings Institute, Washington DC. Milgrom, P. and Roberts, J. (1986) ‘Price and advertising signals of product quality’, The Journal
of Political Economy, Vol. 94, No. 4, pp.796–821. Misa, T. (1992) ‘Theories of technological change’, Science, Technology and Human Values,
Vol. 17, No. 1, pp.3–12. Mowery, D.C. and Rosenberg, N. (1982) ‘Technical change in the commercial aircraft industry,
1925-1975’, Inside the Black Box: Technology and Economics, Cambridge University Press, Cambridge, pp.163–177.
Mussa, M. and Rosen, S. (1978) ‘Monopoly and product quality’, Journal of Economic Theory, Vol. 18, pp.301–317.
Nalebuff, B.J. and Brandenberger, A. (1996) Co-opetition, Doubleday Business, New York. Nelson, P. (1970) ‘Information and consumer behavior’, Journal of Political Economy, Vol. 78,
No. 2, pp.311–329. Nelson, P. (1974) ‘Advertising as information’, Journal of Political Economy, Vol. 82, No. 4,
pp.729–754. Nelson, P. (1975) ‘The economic consequences of advertising’, The Journal of Business, Vol. 48,
No. 2, pp.213–241. Nelson, R. and Winter, S. (1982) An Evolutionary Theory of Economic Change, The Belknap Press
of Harvard University Press, Cambridge. Nerlove, M. and Arrow, K.J. (1962) ‘Optimal advertising policy under dynamic conditions’,
Economica, Vo. 29, No. 114, pp.129–142. Piercy, N.F., Cravens D.W. and Lane, N. (2010) ‘Thinking strategically about pricing decisions’,
Journal of Business Strategy, Vol. 31, No. 5, pp.38–48.
52 B.D. Steele
Pinch, T. and Bijke, W. (1990) ‘The social construction of facts and artifacts: or how the sociology of science and the sociology of technology might benefit each other’, in Bijker, W., Hughes, T.P. and Pinch, T. (Eds.): The Social Construction of Technological Systems: New Directions in the Sociology and History of Technology, The MIT Press, Cambridge, pp.17–50.
Porter, M. (1980) Competitive Strategy: Techniques for Analyzing Industries and Competitors, The Free Press, New York.
Porter, M. (1996) ‘What is strategy?’, Harvard Business Review, November–December, pp.61–78. Porter, M. (1998) ‘The Adam Smith address: location, clusters, and the ‘new’ microeconomics of
competition’, Business Economics, 1 January, pp.7–13. Porter, M. (2008) ‘The five competitive forces that shape strategy’, Harvard Business Review,
January, pp.77–94. Romer, P. (1990) ‘Endogenous technological change’, The Journal of Political Economy, Vol. 98,
No. 5, Part 2, pp.71–102. Rosenberg, N. and Steinmueller, W.E. (1982) ‘The economic implications of the VLSI revolution’,
Inside the Black Box: Technology and Economics, Cambridge University Press, Cambridge, pp.178–192.
Samuel, L. (2010) Freud on Madison Avenue, University of Pennsylvania Press, Philadelphia. Samuelson, P. (1947) The Foundations of Economic Analysis, Harvard University Press,
Cambridge. Schmalensee, R. (1978) ‘A model of advertising and product quality’, The Journal of Political
Economy, Vol. 86, No. 3, pp.485–503. Segerstrom, P. (2007) ‘Intel economics’, International Economics Review, Vol. 48, No. 1,
pp.247–280. Sharpe, W.F. (1969) The Economics of Computers, Columbia University Press, New York City. Smith, V.L. (1959) ‘The theory of investment and production’, The Quarterly Journal of
Economics, Vol. 73, No. 1, pp.61–67. Steele, B.D. (1995) ‘An economic theory of technological products’, Technological Forecasting
and Social Change, Vol. 48, No. 4, pp.221–242. Stocking, C.A. (1931) ‘Modern advertising and economic theory’, The American Economic
Review, Vol. 21, No. 1, pp.43–55. Timmor, Y. and Katz-Navon, T. (2008) ‘Being the same and different: a model explaining new
product differentiation’, Journal of Consumer Behaviour, Vol. 7, pp.249–262. von Clausewitz, C. (1984) On War, Howard, M. and Paret, P.P. (Eds.), Princeton University Press,
Princeton. Wernerfelt, B. (1984) ‘A resource-based view of the firm’, Strategic Management Journal, Vol. 5,
No. 2, pp.171–180. Wright, M. (2008) ‘A new theorem for optimizing the advertising budget’, Journal of Advertising
Research, Vol. 49, No. 2, pp.164–169.
Notes 1An exception to this assertion that supply-side investments cannot shape the unit sales price function is when firms invest in R&D to obtain defensive patents to restrict legally the actions competitors.
2These independent and distinct processes have typically not been distinguished in the demand-side economics literature, curiously enough. Nevertheless, they do conform to tasks commonly associated with ‘marketing’ that involve identifying key characteristics of potential customers and ‘sales’ that involve delivering sales pitches directly to potential customers.
Unifying the supply-side and demand-side of business strategy 53
3See von Clausewitz (1984, p.486) for his application to military strategy of the concept of centre of gravity from the science of mechanics. Although this concept remains abstract and controversial with military strategists, it nevertheless can be viewed from a business perspective as where the sales argument can be directed for the least effort or minimum cost to overcome the resistance of potential customers to exchange their funds for the product. As disturbing as it sounds, the business analogy of opposing military force is not one’s business competitors but rather one’s potential customers, at least from the perspective of conventional warfare. The idea that one’s business competitors are analogous to the opposing enemy force is more logical from the perspective of irregular or revolutionary warfare, as articulated famously by Mao and Galula. In such irregular warfare, the insurgent and counter-insurgent forces are competing for the political and economic resources controlled by the local civilian population.
4The use here of ROI as a measure for the effectiveness of an investment for a particular project should not be confused with its use as a measure of performance for an entire business organisation. For an examination of the controversial nature of using ROI in that capacity, see Jacobson (1987).
5Such reasoning contradicts the assumptions of many economists who maintain that R&D investment directly stimulates market demand or the unit sales price function. As discussed in the literature review section of this paper, however, such reasoning leads to contradictory results when considering R&D investments that seek only to lower unit production costs without changing product-performance levels.
6This is similar to the phenomenon described by Romer (1990, pp.75–76). He describes how a hypothetical hard disk drive manufacturing firm doubles its initial design investment to increase the performance of the hard disk drive from 20 megabytes to 30 megabytes. Unfortunately, he provides no information about what the effect such a design investment has on the unit production cost of the hard disk drives.
7Kant (1996) defines enlightenment at the start of this famous essay as “human kind’s exit from its self-incurred immaturity”, and defines immaturity as “the inability to make use of one’s own understanding without the guidance of another”.
8A similar point was made by Bowman (2008). He uses a much simpler profit model, however, relative to the ROI Objective Function, when analysing the generic strategies of Porter and others, where Profit = (Total Sales Revenue – Total Production Costs) Sales Volume. While this equation may help explain the Cost Leadership strategy, it lacks the product performance variable, z, to articulate the Differentiation strategy.
Related Documents


![Loom: Unifying Client-Side Web Technologies in a Single ... · Introduction Today’s industry is increasingly concerned with the notion of user experience [Gar10]. In the context](https://static.cupdf.com/doc/110x72/5edf8c0fad6a402d666ae2d3/loom-unifying-client-side-web-technologies-in-a-single-introduction-todayas.jpg)