JOURNAL OF MATERIALS SCIENCE 26 (1991) 612 620 Unification of ductile failure and slow crack growth in an ethylene-octene copolymer X. LU, N. BROWN Department of Materials Science and Engineering, University of Pennsylvania, Philadelphia, Pennsylvania, 19104-6272, USA The time dependence of ductile and brittle failure of an ethylene-octene gas pipe resin was measured as a function of stress, notch depth and temperature. The ductile failure mode depends on the ligament stress and all the ductile data could be unified by normalizing the ligament stress with respect to the short-time yield point at each temperature. The brittle data were unified by correlating the stress and notch depth in terms of the stress intensity and by introducing a time-temperature shift. At each temperature there is a critical stress intensity above which the notch becomes blunted so that ductile failure ensues. The unified curve for the ductile failure is about the same for all polyethylenes. The unified curve for the brittle regime varies greatly with different polyethylenes where the primary difference is associated with the minimum time required to produce brittle behaviour for a common temperature and stress intensity. 1. Introduction In the neighbourhood of room temperature, poly- ethylene exhibits three types of time-dependent failure: (1) ductile failure which is governed by shear flow; (2) brittle failure which occurs at lower stress and is governed by slow crack growth which emanates from a point of stress concentration; and (3) a combination of these two failure modes. The time for ductile failure depends on the stress and the temperature, but the time for brittle failure depends on stress, temperature, and the type of stress concentration, notably its depth and sharpness. Differences in the times for ductile failure among different types of polyethylenes depend primarily on differences in their yield points. However, differences in the time for brittle failure among differ- ent polyethylenes depend on complex details of their molecular architecture and of their amorphous and crystalline morphology. Because polyethylene is used in such critical applications as gas and water pipes, sheeting to prevent pollution of ground watet and containers for radioactive waste, there have been ex- tensive investigations of the many factors that deter- mine the failure times for polyethylenes. This paper is concerned with the effects of stress, temperature, and notch depth on the failure time of an ethylene-octene gas pipe resin. In a previous paper by Lu and Brown [1], a similar investigation was made on an ethylene-hexene gas pipe resin that was com- pression moulded and the specimens had a fixed notch depth. It was found that the effect of stress and temperature both on the ductile and brittle failure modes could be unified by plotting a normalized stress against a common temperature-compensated time (Fig. 1). In this investigation the specimens were taken directly from the ethylene-octene gas pipe and the brittle failure times are about 102 times shorter than 612 for the compression-moulded ethylene-hexene gas pipe resin. The principal question to be answered is whether or not the method of unifying the data that was applicable to the ethylene-hexene copolymer would apply to the ethylene-octene resin. The concept of unifying the ductile and brittle regions was modified in order to include the effect of stress intensity on the brittle behaviour. An important finding was that there is a critical stress intensity above which ductile failure commences; this critical stress intensity increases with decreasing temperature. The stress for ductile behaviour is the ratio ofligament stress over the yield point. 2. Experimental procedure The specimens were taken from commercial gas pipes with 110mm o.d. and 10.5 mm wall thickness. The material was an ethylene octene copolymer with Mn = 93 000, Mw = 128 000 and density of 0.943 gcm -3. The geometry of the notched tensile specimen is shown in Fig. 2. The notch was made by pressing a fresh razor blade into the inside surface of the pipe wall at a speed of 50 lam min- 1. The specimen had side grooves which were 1 mm deep. The width of the specimen was chosen to be 25 mm so that with the aid of the side grooves, the fracture was almost entirely plane strain. The specimens were tested in the as- received condition from the pipe. The specimens were cut so that the tensile axes was parallel to the longit- udinal direction of the pipe. The applied stress was calculated on the basis of the unnotched cross-section. The kinetics of the failure process were observed under a constant load and temperature. The crack opening displacement (COD) was measured with an optical microscope with a filar eyepiece. The COD 0022 2461/91 $03.00 + .12 1991 Chapman and Hall Ltd.

Welcome message from author
This document is posted to help you gain knowledge. Please leave a comment to let me know what you think about it! Share it to your friends and learn new things together.
Transcript
JOURNAL OF MATERIALS SCIENCE 26 (1991) 612 620
Unification of ductile failure and slow crack growth in an ethylene-octene copolymer
X. LU, N. BROWN Department of Materials Science and Engineering, University of Pennsylvania, Philadelphia, Pennsylvania, 19104-6272, USA
The time dependence of ductile and brittle failure of an ethylene-octene gas pipe resin was measured as a function of stress, notch depth and temperature. The ductile failure mode depends on the ligament stress and all the ductile data could be unified by normalizing the ligament stress with respect to the short-time yield point at each temperature. The brittle data were unified by correlating the stress and notch depth in terms of the stress intensity and by introducing a time-temperature shift. At each temperature there is a critical stress intensity above which the notch becomes blunted so that ductile failure ensues. The unified curve for the ductile failure is about the same for all polyethylenes. The unified curve for the brittle regime varies greatly with different polyethylenes where the primary difference is associated with the minimum time required to produce brittle behaviour for a common temperature and stress intensity.
1. Introduct ion In the neighbourhood of room temperature, poly- ethylene exhibits three types of time-dependent failure: (1) ductile failure which is governed by shear flow; (2) brittle failure which occurs at lower stress and is governed by slow crack growth which emanates from a point of stress concentration; and (3) a combination of these two failure modes. The time for ductile failure depends on the stress and the temperature, but the time for brittle failure depends on stress, temperature, and the type of stress concentration, notably its depth and sharpness. Differences in the times for ductile failure among different types of polyethylenes depend primarily on differences in their yield points. However, differences in the time for brittle failure among differ- ent polyethylenes depend on complex details of their molecular architecture and of their amorphous and crystalline morphology. Because polyethylene is used in such critical applications as gas and water pipes, sheeting to prevent pol lut ion of ground watet and containers for radioactive waste, there have been ex- tensive investigations of the many factors that deter- mine the failure times for polyethylenes.
This paper is concerned with the effects of stress, temperature, and notch depth on the failure time of an ethylene-octene gas pipe resin. In a previous paper by Lu and Brown [1], a similar investigation was made on an ethylene-hexene gas pipe resin that was com- pression moulded and the specimens had a fixed notch depth. It was found that the effect of stress and temperature both on the ductile and brittle failure modes could be unified by plotting a normalized stress against a common temperature-compensated time (Fig. 1). In this investigation the specimens were taken directly from the ethylene-octene gas pipe and the brittle failure times are about 102 times shorter than
612
for the compression-moulded ethylene-hexene gas pipe resin. The principal question to be answered is whether or not the method of unifying the data that was applicable to the ethylene-hexene copolymer would apply to the ethylene-octene resin.
The concept of unifying the ductile and brittle regions was modified in order to include the effect of stress intensity on the brittle behaviour. An important finding was that there is a critical stress intensity above which ductile failure commences; this critical stress intensity increases with decreasing temperature. The stress for ductile behaviour is the ratio ofligament stress over the yield point.
2. Experimental procedure The specimens were taken from commercial gas pipes with 110mm o.d. and 10.5 mm wall thickness. The material was an ethylene octene copolymer with Mn = 93 000, Mw = 128 000 and density of 0.943 gcm -3. The geometry of the notched tensile specimen is shown in Fig. 2. The notch was made by pressing a fresh razor blade into the inside surface of the pipe wall at a speed of 50 lam min- 1. The specimen had side grooves which were 1 mm deep. The width of the specimen was chosen to be 25 mm so that with the aid of the side grooves, the fracture was almost entirely plane strain. The specimens were tested in the as- received condition from the pipe. The specimens were cut so that the tensile axes was parallel to the longit- udinal direction of the pipe. The applied stress was calculated on the basis of the unnotched cross-section.
The kinetics of the failure process were observed under a constant load and temperature. The crack opening displacement (COD) was measured with an optical microscope with a filar eyepiece. The COD
0022 2461/91 $03.00 + .12 �9 1991 Chapman and Hall Ltd.
bO I0 08
06 L-
04
cr 0 2
ld 10 lmon ly 4 8 16 32 64 128 ~_~~~~~~, "~.
O] I t ; I I 102 fO 3 I O 4 105 106 107 t08
Time to fo i lure (min)
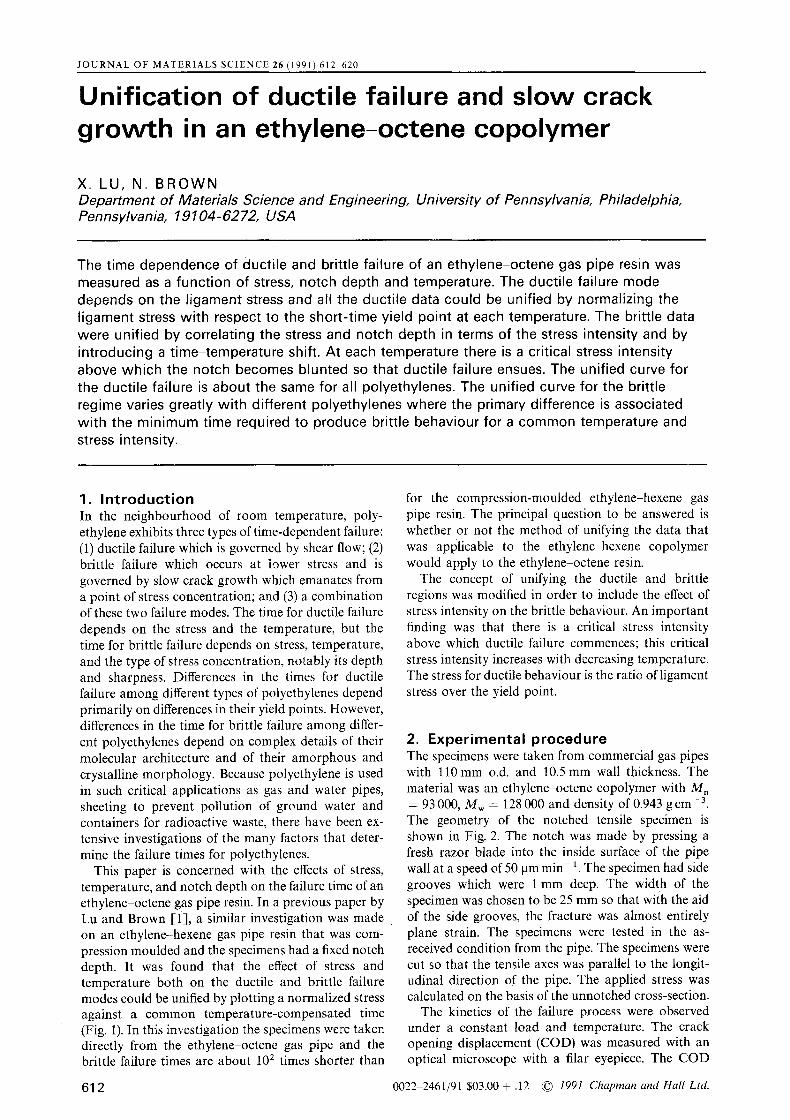
Figure 1 Reduced stress plotted against time to failure at 24 ~ for ethylene-hexene copolymer, c% is the stress at the lower limit of ductile behaviour. The unified data were obtained at 80, 70, 60, 50, 42, and 24 ~
was viewcd in the middle of the notch and was meas- ured at three places: (1) at the surface of the specimen; (2) at the point of the bottom of the notch as de- lineated by the tip of the razor blade; and (3) at the base of the craze that is initiated at the bottom of the notch. The error in the measurement of the COD was about 4- 2 gm.
S. R e s u l t s Views of the COD upon looking into the middle of the notch are shown in Fig. 3 where the base of the craze appears as a bright zone under the reflected light. Initially the base of the craze appears as a continuous film (Fig. 3a); then the film begins to shred (Fig. 3b), and finally fractures, as in Fig. 3c. The time when the film begins to shred (Fig. 3b) is defined as t B. After complete fracture of the initial film another contin- uous film appears beyond the initial film (Fig. 3d). Detailed observations of the process indicate that after the stage of initial fracture occurs (Fig. 3c), the crack jumps rapidly to the new position shown in Fig. 3d and then there is another appreciable interval before the crack jumps again. The optical observations of discontinuous crack growth are confirmed by the variation of kinetics of COD with time.
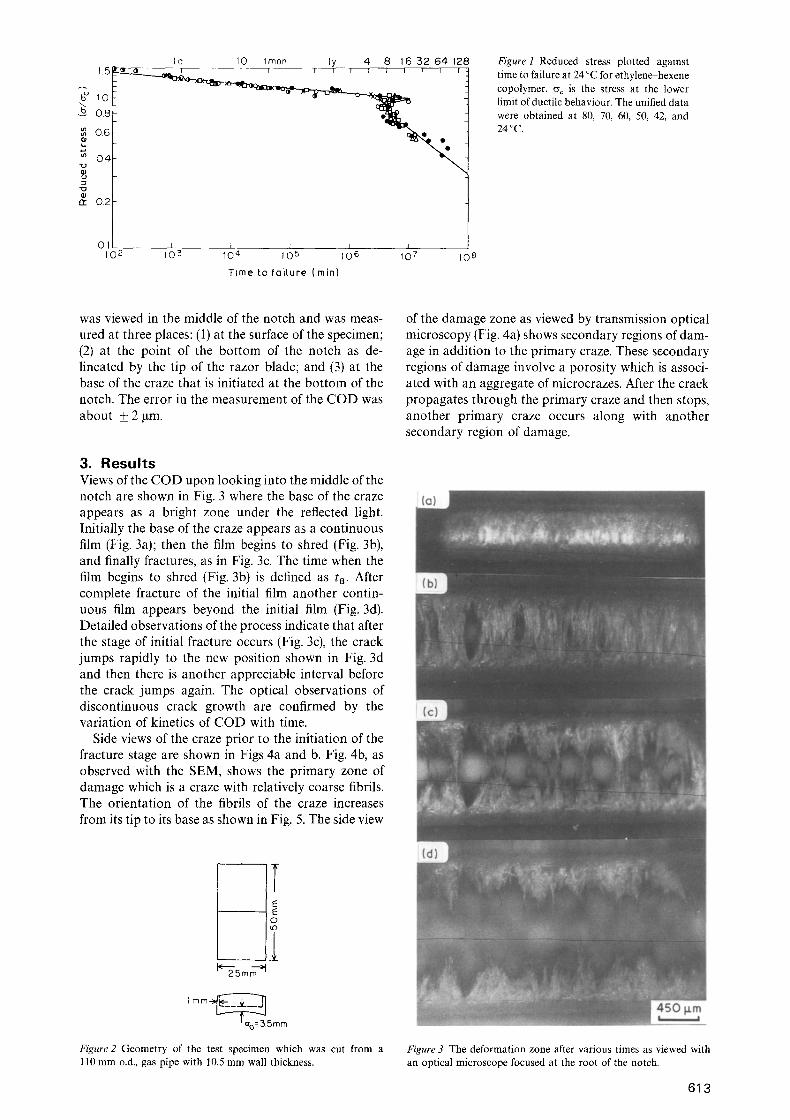
Side views of the craze prior to the initiation of the fracture stage are shown in Figs 4a and b. Fig. 4b, as observed with the SEM, shows the primary zone of damage which is a craze with relatively coarse fibrils. The orientation of the fibrils of the craze increases from its tip to its base as shown in Fig. 5. The side view
of the damage zone as viewed by transmission optical microscopy (Fig. 4a) shows secondary regions of dam- age in addition to the primary craze. These secondary regions of damage involve a porosity which is associ- ated with an aggregate of microcrazes. After the crack propagates through the primary craze and then stops, another primary craze occurs along with another secondary region of damage.
T
E E o
i l m m ~
' ao= 3.5mm
Figure 2 Geometry of the test specimen which was cut from a 110 mm o.d., gas pipe with 10.5 mm wall thickness.
Figure 3 The deformation zone after various times as viewed with an optical microscope focused at the root of the notch.
613
Figure 4 Side views of the damage zone prior to crack initiation. The specimen was sliced in order to obtain an interior view; (a) 0.2 mm slice viewed by transmission optical microscopy; (b) same as (a) viewed with SEM.
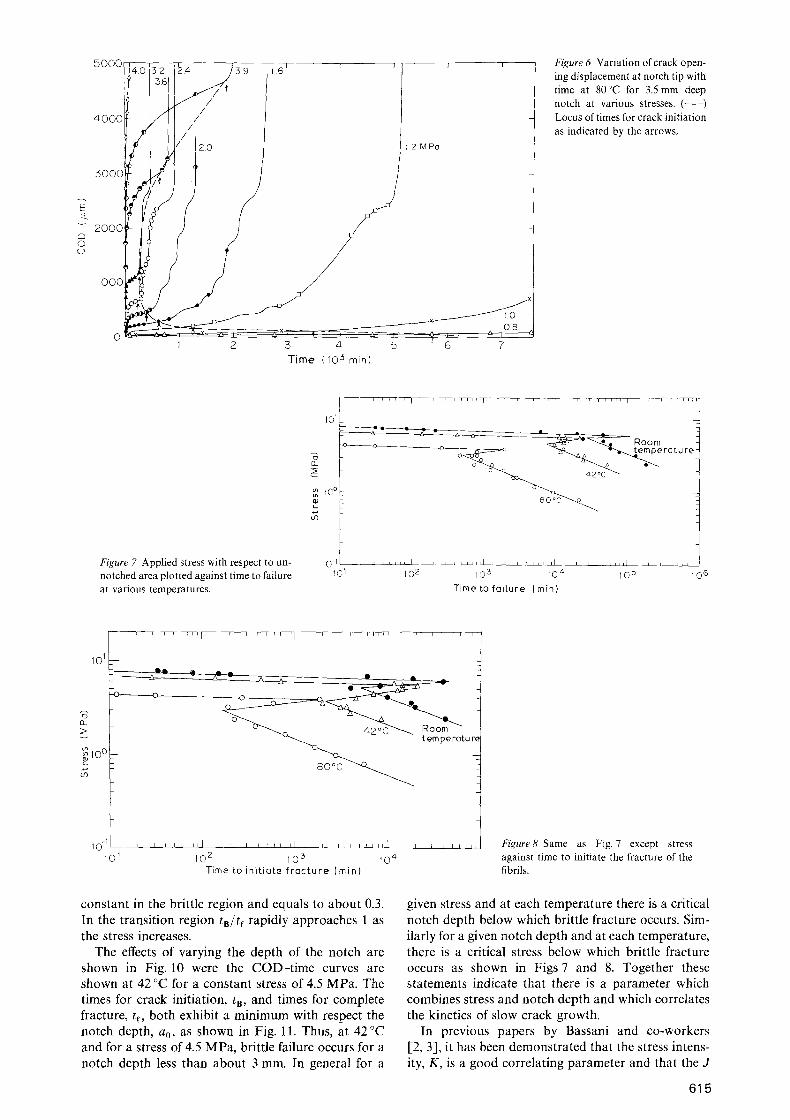
Curves of C O D against time are shown in Fig. 6 where the C O D was measured at the tip of the notch as defined by the tip of the razor blade. The discontin- uous nature of the crack growth process is evident. The curves are for various stresses at 80 ~ with a 3.5 mm noteh. The stresses cover the range of ductile
failure and slow crack growth. The arrows indicate the time for fracture initiation, tB, as observed in Fig. 3. In general, it was observed that the discontinuous nature of the crack growth tends to decrease as the stress is decreased.
The locus of points which connect the times for crack initiation, tB, exhibits a minimum with respect to the stress. At 80~ and for a 3.5 mm notch this minimum time for crack initiation occurs at 3.2 MPa. Below 3.2 MPa is the brittle regime and above 3.2 M P a the noteh becomes increasingly blunt as the failure process transforms to the ductile mode.
The curves shown in Fig. 6 were typical for the other two temperatures that were investigated, 42 and 24 ~ In Fig. 7, stress is plotted against time for the complete fracture of the specimen. In the ductile re- gion the time to failure, tf, varied as
tf ~ o -38 (1)
and in the brittle region
tf ~ (3 - -2 .6 (2)
The transition region is anomalous where tf increases as the stress increases.
In Fig. 8 stress is plotted against the time for crack initiation, tB. In the brittle region
t~ ,-~ cr -2"6 (3)
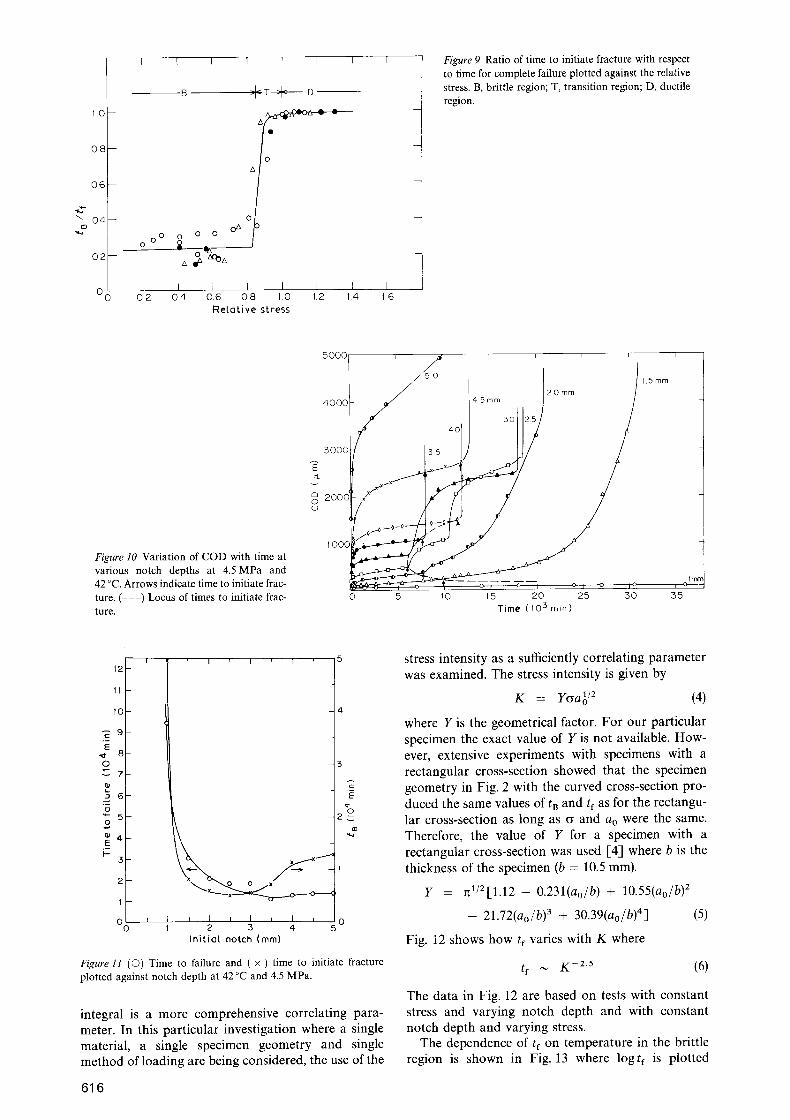
which is the same as for tf. The relationship between tB and tf is shown in Fig. 9 where the ratio, tB/tf, is nearly
Figure 5 SEM views of different positions in the damage zone shown in Fig. 4b going from the tip (a) to the base (d).
614
zk
K3 o c)
5~176176 Is2 I~4 ~ 16 F- '
Il ~11 .~0-/, /
5000,
2000
lO00
0 - ~ - - Z-~T-
I i
1 2 M P a
l 2
0.8 j - - ~ ~ _ _ _ ~
5 4 5 6 7
T i m e (10 �8 min)
Figure 6 Varia t ion o f c r a c k open- ing d i sp lacement at notch tip with t ime at 80~ for 3.5 m m deep notch at var ious stresses. ( - - - ) Locus of t imes for crack init iat ion as indicated by the arrows,
Figure 7 Appl ied stress with respect to un- notched area plotted against t ime to faiture at var ious temperatures .
i V ~ l , i , T ~ , I " T -
l
I�9 ~
I0 ~ r
,olt 1o 1
�9 ~ T ~ ~ 1 J , , J ~ l ~ J i i i i , J i I
t
8 0 ~
102 105 104 105 106
T i m e t o f a i t u r e (min}
101
~ 10 o
1�9 _ _
1�9
- - ~ ~ ~ I I I r r p ~ I I I I I i r l I p I P d d ~
t em pe rGtu r l
i [ I l l r l l ~ I i I r l i l l r I i i r r l i [ I I I I L _ ~ 10 2 10 3 10 4
Time to in i t i a te f r ac tu re (min)
Figure8 S a m e as Fig. 7 except stress against t ime to init iate the fracture of the fibrils.
constant in the brittle region and equals to about 0.3. In the transition region tB/ t f rapidly approaches 1 as the stress increases.
The effects of varying the depth of the notch are shown in Fig. 10 were the COD-t ime curves are shown at 42 ~ for a constant stress of 4.5 MPa. The times for crack initiation, tB, and times for complete fracture, tl, both exhibit a minimum with respect the notch depth, a0, as shown in Fig. 11. Thus, at 42 ~ and for a stress of 4.5 MPa, brittle failure occurs for a notch depth less than about 3 mm. In general for a
given stress and at each temperature there is a critical notch depth below which brittle fracture occurs. Sim- ilarly for a given notch depth and at each temperature, there is a critical stress below which brittle fracture occurs as shown in Figs 7 and 8. Together these statements indicate that there is a parameter which combines stress and notch depth and which correlates the kinetics of slow crack growth.
In previous papers by Bassani and co-workers [2, 3], it has been demonstrated that the stress intens- ity, K, is a good correlating parameter and that the J
615
\ 0 4
1 0 -
0 8 - -
0 6 - -
0 2 - -
0 o
I I I I 1 I I I
0 0 0 0 0 0
~ib-T ~ D - -
zx
I I I I I I I I 0 2 0 4 0.6 0 8 I 0 12 14 16
R e t G t i v e st ress
Figure 9 Ratio of time to initiate fracture with respect to time for complete failure plotted against the relative stress. B, brittle region; T, transition region; D, ductile region.
Figure 10 Variation of C O D with time at various notch depths at 4.5 M P a and 42 ~ Arrows indicate time to initiate frac- ture. ( - - - ) Locus of times to initiate frac- ture.
5 0 0 0
5 0
20mm 400C 4 5 mm / 4 0 ~Of / 5000
¦ z o o d
1 0 0 (
~ o 1 - - - 7 - 7 - ~ , o i o i o 0 5 10 I 5 20 25 5 0
T ime ( 1 0 3 m in )
15 mm
r ~ 55
c E
0
o
F.-
12
1I
IC
9
8
7
6
5
4
5
2
1
0 0
I I I
~ x ~ ~ o o x ~ ~ ~ ' ~ x ~''~ x ~ I k I i I ~ I i 0 1 2 3 4 5
I n i t i a t no tch (mm)
3
% 2 - -
Figure 11 (�9 Time to failure and ( x ) time to initiate fracture plotted against notch depth at 42 ~ and 4.5 MPa.
integral is a more comprehensive correlating para- meter. In this particular investigation where a single material, a single specimen geometry and single method of loading are being considered, the use of the
6 1 6
stress intensity as a sufficiently correlating parameter was examined. The stress intensity is given by
K = Y~a¦ (4)
where Y is the geometrical factor. For our particular specimen the exact value of Y is not available. How- ever, extensive experiments with specimens with a rectangular cross-section showed that the specimen geometry in Fig. 2 with the curved cross-section pro- duced the same values of tB and tf as for the rectangu- lar cross-section as long as ~ and a o were the same. Therefore, the value of Y for a specimen with a rectangular cross-section was used [-4] where b is the thickness of the specimen (b = 10.5 mm).
Y = ~1/2[1.12 - 0.231(ao/b ) + lO.55(ao/b) 2
- 21.72(ao/b) 3 + 30.39(ao/b) 4] (5)
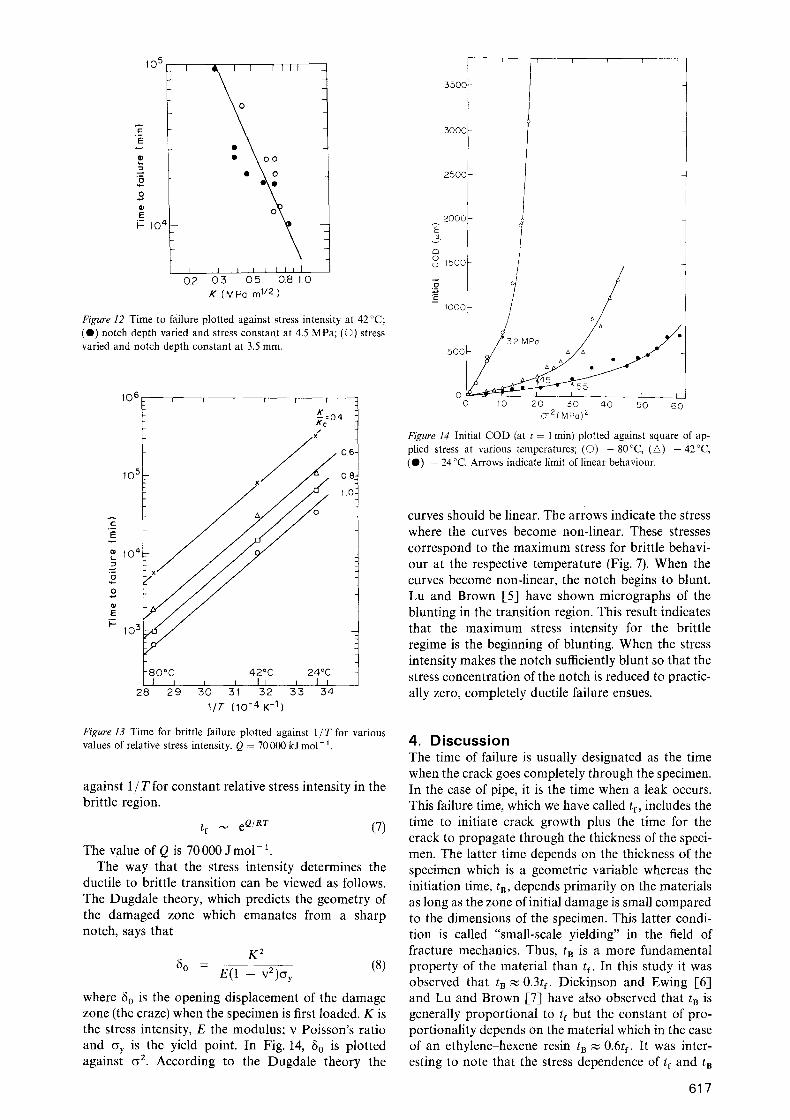
Fig. 12 shows how tf varies with K where
tf ~ K -2"5 (6)
The data in Fig. 12 are based on tests with constant stress and varying notch depth and with constant notch depth and varying stress.
The dependence of tf o n temperature in the brittle region is shown in Fig. 13 where log tf is plotted
E
o
E i c 104
105 I
I 0.2
1 I I II
I I I J I I I [ 0.3 0 5 0 8 10 K (MPa m 1/2 )
Figure 12 Time to failure plotted against stress intensity at 42 ~ ( 1 ) notch depth varied and stress constant at 4.5 MPa; (�9 stress varied and notch depth constant at 3.5 mm.
iill I I
~,;o.4 /
3500
3000
2500
2000
Π1500
~,ooop / ./
0 10 20 30 40 50 60 dT2(Mpa) 2
Figure 14 Initial COD (at t = I min) plotted against square of ap- plied stress at various temperatures; (�9 - 8 0 ~ (A) - 4 2 ~ (O) - 24 ~ Arrows indicate limit of linear behaviour.
c
lo 4
~" 103
80~ 42~ 24~
28 2 9 30 31 32 3 3 34
1/T (10 -4 K -1 )
curves should be linear. The arrows indicate the stress where the curves become non-linear. These stresses correspond to the maximum stress for brittle behavi- our at the respective temperature (Fig. 7). When the curves become non-linear, the notch begins to blunt. Lu and Brown [5] have shown micrographs of the blunting in the transition region. This result indicates that the maximum stress intensity for the brittle regime is the beginning of blunting. When the stress intensity makes the notch sufficiently blunt so that the stress concentration of the notch is reduced to practic- ally zero, completely ductile faiture ensues.
Figure 13 Time for brittle failure plotted against I /T for various values of relative stress intensity. Q = 70 000 kJ m o l - 1.
against 1 / T for constant relative stress intensity in the brittle region.
tf ~ e Q/Rr (7)
The value of Q is 70 000 Jmol-~ . The way that the stress intensity determines the
ductile to brittle transition can be viewed as follows. The Dugdale theory, which predicts the geometry of the damaged zone which emanates from a sharp notch, says tha t
K z
¦176 - E(1 - v2 )O 'y (8)
where 6 o is the opening displacement of the damage zone (the craze) when the specimen is first loaded. K is the stress intensity, E the modulus; v Poisson's ratio a n d O ' y is the yield point. In Fig. 14, 8o is plotted against o 2. According to the Dugdale theory the
4. Discussion The time of failure is usually designated as the time when the crack goes completely through the specimen. In the case of pipe, it is the time when a leak occurs. This failure time, which we have called tf, includes the time to initiate crack growth plus the time for the crack to propagate through the thickness of the speci- men. The latter time depends on the thickness of the specimen which is a geometric variable whereas the initiation time, tB, depends primarily on the materials as long as the zone ofinitial damage is small compared to the dimensions of the specimen. This latter condi- tion is called "small-scale yielding" in the field of fracture mechanics. Thus, tB is a more fundamental property of the material than tr. In this study it was observed that t~ ~ 0.3tl. Dickinson and Ewing [6] and Lu and Brown [7] have also observed that t B is generally proportional to tf but the constant of pro- portionality depends on the material which in the case of an ethylene-hexene resin t B ~ 0.6t e. It was inter- esting to note that the stress dependence of tf and t�9
617
were about the same in that t f ~ O - 2 " 6 and t B ~ O " - 2 " 6 . The temperature dependence of tB and tf are also the same. Thus, in order to understand the failure process from the more fundamental viewpoint, it is preferable to focus on ta rather than tl.
The significance of normalizing the applied stress in the ductile region relative to C~y at a particular temper- ature is a fundamental concept. In continuum mech- anics, the power law representation of time-dependent shear flow is orten shown in terms of a non-dimen- sional or effective stress which is equal to the applied stress divided by the yield point of the material. Lustiger and Markham [8] investigated the ductile failure process in different polyethylenes. They found that if they plotted the applied stress divided by the yield point of each polyethylene, all the normalized stress-time curves coincide for the different polyethyl- enes at each temperature. In this investigation the curves at different temperatures were brought together by normalizing the applied stress with respect to the yield point at each temperature. The yield point was arbitrarily chosen as the stress to produce ductile failure in 1 min.
The failure curve in the brittle region depends on stress and the notch depth. To first approximation the stress intensity is a good corretating parameter as shown in Fig. 12 where tf and tB ~ K - 2 5 . There is a critical stress below which the purely brittle behaviour occurs for a given notch depth (Fig. 6) and there also is a critical notch depth below which brittle behaviour occurs for a given stress (Figs 10 and 11). There is a critical stress below which the notch remains sharp (Fig. 14). These results suggest that, for each temper- ature, there is a critical stress intensity below which purely brittle behaviour occurs. Above this critical stress intensity, the zone of damage enlarges greatly as shown by the microscopic study of Battacharya and Brown [9]. This enlarged deformation zone blunts the notch. The critical stress intensity for fracture initia- tion will be called KBc and for complete brittle failure Kfc. From the data in Figs 7, 8, 11 and 14 the values of Kn c and Kfc are as given in Table I. The critical stress intensity decreases with increasing temperature, prim- arily because the yield stress does also.
Fig. 1 does not represent the most fundamental view of the failure processes in polyethylenes because it does not take into account the effect of the notch and because it implies that brittle and ductile regions are governed by the applied stress. In the ductile region the ligament stress, GE, is the important stress
Ao 13u = 1 3 " - - (9)
A
where c~ is the applied stress and Ao and A are the unnotched and notched cross-sectional areas. If the
T A B L E I Values of the critical stress intensity
T (~ KBc (MPa m 1/2) Kfc (MPa rn 1/2)
Room temperature 0.97 1.06 42 0.69 0.87 80 0.58 0.62
618
ductile curves at different temperatures are to be unified, then the stress should be normalized to a yield stress, r ~y(0) is conveniently taken to be the failure stress after an arbitrarily chosen short time, such as 1 min. Thus, the ductile regimes shown in Fig. 7 can be unified by plotting ~L/y against time. Because the slope of the curve in the ductile region is about the same for all polyethylenes the ductile curve in Fig. 15 is about the same for all polyethylenes.
In the brittle region, the stress intensity is the governing factor. There is a critical stress intensity, Kfc, above which the purely brittle behaviour ceases and the anomalous transition region occurs. Thus, to unify the brittle fracture data with respect to stress, notch depth and temperature, the following method is proposed when the slope of K against tf is independ- ent of temperature. Let the ordinate be the normalized stress intensity relative to the critical stress intensity, Kg~Kly The abscissa should be a temperature com- pensated time so that
( K f f ) " = t~Re70000/R(~-@-R)tf (10)
where tR is the time for failure at the reference temper- ature, irR, and at the critical stress intensity, Kfc .
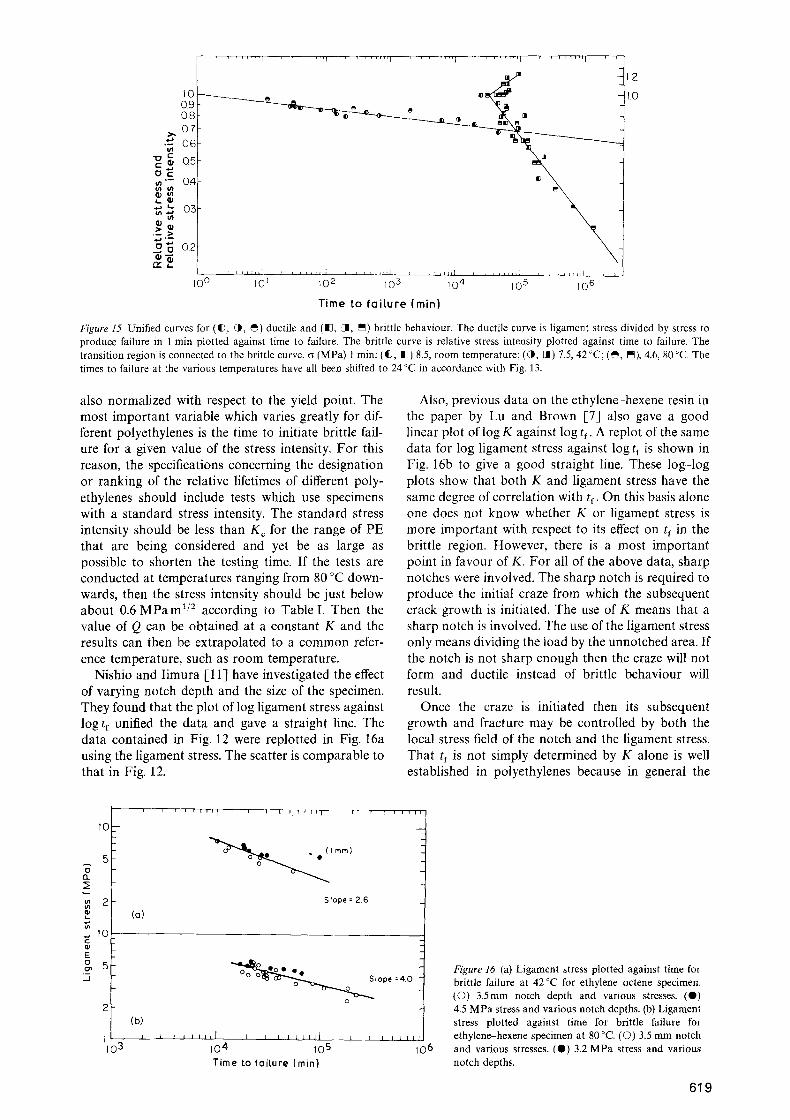
In Fig. 15 the data for the brittle region in Figs 7 and 12 are plotted in accordance with the above equation with room temperature as the reference tem- perature, For K > Kfc the behaviour is anomalous because the stress intensity loses its meaning above Kfc when the notch is no longer sharp.
The question arises as to whether there is a thres- hold stress intensity below which crack growth cannot occur. Qian et al. [10] investigated the threshold stress intensity for producing observable damage at the root of the notch in a high-density PE at 42 ~ They found a value of about 0.07 M P a m 1/2. This value depends primarily on the stress to produce a craze in PE, because if a craze is not formed at the root of the notch, the slow crack growth process cannot occur. They also found that the threshold stress intensity for producing complete failure at 42~ was about 0.08 MPa m 1/2. For the PE used in this investigation, the time to produce failure at K = 0.08 M P a m 1/2 at room temperature would be 2.5 x 10⁷ min.
Generally, in service, a gas pipe fails in the brittle mode. The quality of the resin depends primarily on the minimum time required to produce brittle failure at the service temperature tR. From Fig. 15 for the resin used in this investigation this time is 4 x 10⁴ min. For the resin exhibited in Fig. 1 the correspond- ing time is 3 x 10⁶ min. The great variation in this critical time, t R, among polyethylenes is determined by many factors involving the details of the molecular structure and morphology. On the other hand, the ductile behaviour at the service temperature is readily observed by fairly short-time experiments and does not vary appreciably among all the polyethylenes as long as the ligament stress is normalized with respect to the short-time yield point.
The maximum value of K c is not expected to vary greatly with the polyethylenes and especially so if K c is
. . . . . . . I . . . . . . . . r . . . . r ' " l . . . . . . . . I . . . . . . . . I . . . . . . . . I
12
I 0 ----'----------~ e _ �9 I 0 0 9 " ~ ~ - �9 0 8 - ~ ~ , ~ ~ ~~., �9
- - 061
~ ~ Q5
�9 | "I " ~ q, ~ ~ X
2, .~ 2 o o2
I0 0 I01 IO 2 lO 3 10 4 10 5 I0 6
Time to faiLure (min}
Figure 15 Unified curves for (ID, @, ~) ductile and (U, 1], ~) brittle behaviour. The ductile curve is ligament stress divided by stress to produce failure in 1 min plotted against time to failure. The brittle curve is relative stress intensity plotted against time to failure. The transition region is connected to the brittle curve. y (MPa) 1 min: (~, I~) 8.5, room temperature; (~, J ) 7.5, 42~ (~, ~), 4.6, 80~ The times to failure at the various temperatures have all been shifted to 24 ~ in accordance with Fig. 13.
also normalized with respect to the yield point. The most important variable which varies greatly for dif- ferent polyethylenes is the time to initiate brittle fail- ure for a given value of the stress intensity. For this reason, the specifications concerning the designation or ranking of the relative lifetimes of different poly- ethylenes should include tests which use specimens with a standard stress intensity. The standard stress intensity should be less than K c for the range of PE that are being considered and yet be as large as possible to shorten the testing time. If the tests are conducted at temperatures ranging from 80 ~ down- wards, then the stress intensity should be just below about 0.6 M P a m 1/2 according to Table I. Then the value of Q can be obtained at a constant K and the results can then be extrapolated to a common refer- ence temperature, such as room temperature.
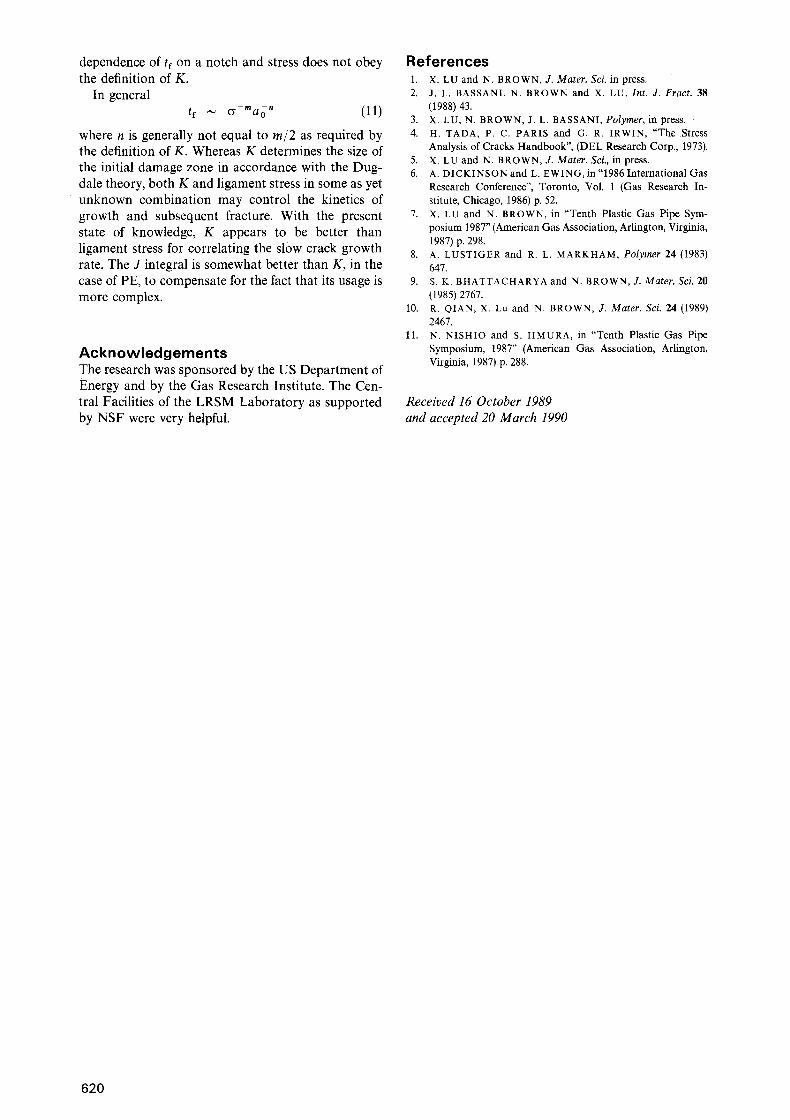
Nishio and Iimura [11] have investigated the effect of varying notch depth and the size of the specimen. They found that the plot of log ligament stress against log tf unified the data and gave a straight line. The data contained in Fig. 12 were replotted in Fig. 16a using the ligament stress. The scatter is comparable to that in Fig. 12.
Also, previous data on the ethylene-hexene resin in the paper by Lu and Brown [7] also gave a good linear plot of log K against log tl. A replot of the same data for log ligament stress against log tr is shown in Fig. 16b to give a good straight line. These log-log plots show that both K and ligament stress have the same degree of correlation with tl. On this basis alone one does not know whether K or ligament stress is more important with respect to its effect on t e in the brittle region. However, there is a most important point in favour of K. For all of the above data, sharp notches were involved. The sharp notch is required to produce the initial craze from which the subsequent crack growth is initiated. The use of K means that a sharp notch is involved. The use of the ligament stress only means dividing the load by the unnotched area. If the notch is not sharp enough then the craze will not form and ductile instead of brittle behaviour will result.
Once the craze is initiated then its subsequent growth and fracture may be controlled by both the local stress field of the notch and the ligament stress. That tf is not simply determined by K alone is well established in polyethylenes because in general the
I0--
5
rl
2 P
E g 5 _J
2
1 10 3
(a)
(b) I I
i [ [ E i ii[ i , i i r I i i I i
~ 1 m m )
S lope = 2 . 6
t [ i i i i
Oo ~ e~ �9 ~ e Slope =4.0
I J I I l l l 1 I I I J J J J ~
10 4 I0 5
T i m e to f a i l u r e (m in )
0 6
Figure 16 (a) Ligament stress plotted against time for brittle failure at 42 ~ for ethylene-octene specimen. (O) 3.5mm notch depth and various stresses. (0) 4.5 MPa stress and various notch depths. (b) Ligament stress plotted against time for brittle failure for ethylene-hexene specimen at 80 ~ (O) 3.5 mm notch and various stresses. (0) 3.2 MPa stress and various notch depths.
6 1 9
dependence of tf on a notch and stress does not obey the definition of K.
In general tf ~ 1 7 - m a o n (11)
where n is generally not equal to tal2 as required by the definition of K. Whereas K determines the size of the initial damage zone in accordance with the Dug- dale theory, both K and ligament stress in some as yet unknown combination may control the kinetics of growth and subsequent fracture. With the present state of knowledge, K appears to be better than ligament stress for correlating the slow crack growth rate. The J integral is somewhat better than K, in the case of PE, to compensate for the fact that its usage is more complex.
Acknowledgements The research was sponsored by the US Department of Energy and by the Gas Research Institute. The Cen- tral Facilities of the LRSM Laboratory as supported by NSF were very helpful.
References 1. X. LU and N. BROWN, J. Mater. Sci. in press. 2. J . L . BASSANI, N. BROWN and X. LU, Int. J. Fract. 38
(1988) 43. 3. X. LU, N. BROWN, J. L. BASSANI, Polymer, in press. 4. H. TADA, P. C. PARIS and G. R. IRWIN, "The Stress
Analysis of Cracks Handbook", (DEL Research Corp., 1973). 5. X. LU and N. BROWN, J. Mater. Sei., in press. 6. A. DICKINSON and L. EWING, in "1986 International Gas
Research Conference", Toronto, Vol. 1 (Gas Research In- stitute, Chicago, 1986) p. 52.
7. X. LU and N. BROWN, in "Tenth Plastic Gas Pipe Sym- posium 1987" (American Gas Association, Arlington, Virginia, 1987) p. 298.
8. A. LUSTIGER and R. L. MARKHAM, Polymer 24 (1983) 647.
9. S .K. BHATTACHARYA and N. BROWN, J. Mater. Sci. 20 (1985) 2767.
10. R. QIAN, X. Lu and N. BROWN, J. Mater. Sci. 24 (1989) 2467.
11. N. NISHIO and S. I IMURA, in "Tenth Plastic Gas Pipe Symposium, 1987" (American Gas Association, Arlington, Virginia, 1987) p. 288.
Received 16 October 1989 and accepted 20 March 1990
620
Related Documents