Unicorn Media Index™: Who Ranks Where Across News, Social and Search? April 13, 2016

Unicorn Media Index: Who Ranks Where Across News, Social and Search
Jan 18, 2017
Welcome message from author
This document is posted to help you gain knowledge. Please leave a comment to let me know what you think about it! Share it to your friends and learn new things together.
Transcript

Unicorn Media Index™: Who Ranks Where Across News, Social and Search?
April 13, 2016
VISIBILITY + MOMENTUM: WHO RANKS WHERE AND WHY?
Unicorns are a phenomenon. Over the past 18 months, they have gone from mythical creature to tech meme – spawning greed and envy for global entrepreneurs, investors and recruiters, while feeding the tech media engine with endless news stories, leader boards and Fortune cover stories.
The “unicorn” concept was coined in Nov’13 by venture capitalist Aileen Lee, and refers to privately held start-up companies with valuations exceeding $1 billion. What started out as a rare breed grew to 146 companies by April 2016, according to Dow Jones VentureSource.
The chase for unicorn status has abated somewhat as startup valuations moderate in early 2016. However, the class continues to expand and contract almost weekly – providing a valuable microcosm to understand today’s tech trends and startup dynamics.
To that end, this report analyzes 75 top unicorns to benchmark their visibility and momentum across news, social and search channels. This is relevant because many founders believe unicorn status provides advantages for recruiting top talent, and demonstrates a startup’s viability for customers and prospects.
This study also showcases a new Earned Media Index™ for benchmarking earned media performance – often the most impactful but least-invested, under-measured part of the marketing and communications mix. We conclude that unicorn status and valuation alone do not dictate media performance. We also learn a lot about category performance, company success factors, IPO impact and channel dynamics.
We look forward to your feedback as we continue to study this important class of startups…
2
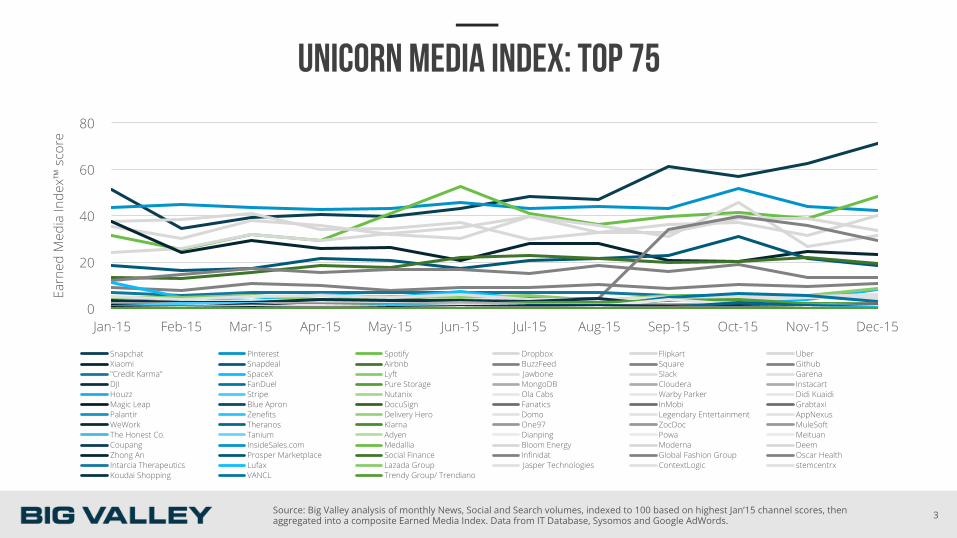
UNICORN MEDIA INDEX: TOP 75
0
20
40
60
80
Jan-15 Feb-15 Mar-15 Apr-15 May-15 Jun-15 Jul-15 Aug-15 Sep-15 Oct-15 Nov-15 Dec-15
Earn
ed M
edia
Inde
x™ s
core
Snapchat Pinterest Spotify Dropbox Flipkart Uber Xiaomi Snapdeal Airbnb BuzzFeed Square Github "Credit Karma" SpaceX Lyft Jawbone Slack Garena DJI FanDuel Pure Storage MongoDB Cloudera Instacart Houzz Stripe Nutanix Ola Cabs Warby Parker Didi Kuaidi Magic Leap Blue Apron DocuSign Fanatics InMobi Grabtaxi Palantir Zenefits Delivery Hero Domo Legendary Entertainment AppNexus WeWork Theranos Klarna One97 ZocDoc MuleSoft The Honest Co. Tanium Adyen Dianping Powa Meituan Coupang InsideSales.com Medallia Bloom Energy Moderna Deem Zhong An Prosper Marketplace Social Finance Infinidat Global Fashion Group Oscar Health Intarcia Therapeutics Lufax Lazada Group Jasper Technologies ContextLogic stemcentrx Koudai Shopping VANCL Trendy Group/ Trendiano
Source: Big Valley analysis of monthly News, Social and Search volumes, indexed to 100 based on highest Jan’15 channel scores, then aggregated into a composite Earned Media Index. Data from IT Database, Sysomos and Google AdWords. 3
UNICORN MEDIA INDEX: KEY FINDINGS
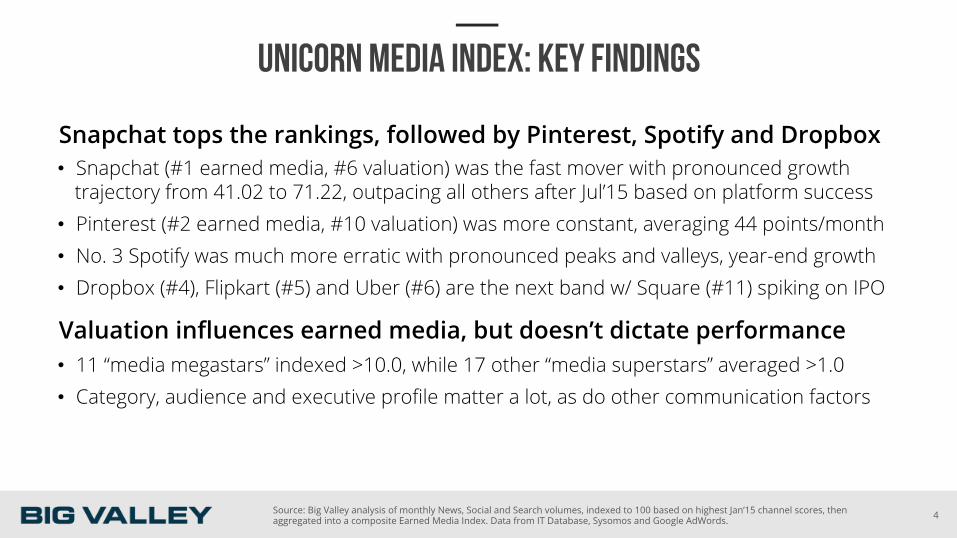
Snapchat tops the rankings, followed by Pinterest, Spotify and Dropbox • Snapchat (#1 earned media, #6 valuation) was the fast mover with pronounced growth
trajectory from 41.02 to 71.22, outpacing all others after Jul’15 based on platform success • Pinterest (#2 earned media, #10 valuation) was more constant, averaging 44 points/month • No. 3 Spotify was much more erratic with pronounced peaks and valleys, year-end growth • Dropbox (#4), Flipkart (#5) and Uber (#6) are the next band w/ Square (#11) spiking on IPO
Valuation influences earned media, but doesn’t dictate performance • 11 “media megastars” indexed >10.0, while 17 other “media superstars” averaged >1.0 • Category, audience and executive profile matter a lot, as do other communication factors
Source: Big Valley analysis of monthly News, Social and Search volumes, indexed to 100 based on highest Jan’15 channel scores, then aggregated into a composite Earned Media Index. Data from IT Database, Sysomos and Google AdWords. 4

UNICORN MEDIA INDEX: KEY FINDINGS
Consumer tech and Internet suck up oxygen from other companies • Social media platforms and on-demand services dominated valuations and earned media • Top B2B = GitHub (#12), SpaceX (#14), Slack (#17), Pure Storage (#21), MongoDB (#22) • Hardware stood out with negative linear trends for four of the five companies • Healthcare under-performs: All six companies averaged >1 point per month • Flipkart (#5) and Xiaomi (#7) were international standouts despite limited availability
Controversy and IPO windows drive major spikes • Theranos spiked 11X from ~0.25 to ~2.75 in Oct’15 and Nov’15 due to media firestorm • Uber dominates valuation (#1) and news (#1), but lags in social (#3) and search (#9) • Square spiked to #5 for Sept’15-Nov’15 based on IPO window, but trending down into 2016
Source: Big Valley analysis of monthly News, Social and Search volumes, indexed to 100 based on highest Jan’15 channel scores, then aggregated into a composite Earned Media Index. Data from IT Database, Sysomos and Google AdWords. 5

UNICORNS ARE NOT CREATED EQUAL
MEDIA MEGASTARS (Earned Media Index > 10.00)
Company Rank Ave. Score
Snapchat 1 49.55
Pinterest 2 44.24
Spotify 3 38.01
Dropbox 4 35.76
Flipkart 5 34.34
Uber 6 32.88
Xiaomi 7 25.63
Snapdeal 8 20.67
Airbnb 9 18.77
BuzzFeed 10 15.75
Square 11 14.47
MEDIA SUPERSTARS (Earned Media Index > 1.00)
Company Rank Ave. Score
GitHub 12 9.46
Credit Karma 13 6.37
SpaceX 14 5.33
Lyft 15 5.22
Jawbone 16 4.49
Slack 17 4.09
Garena 18 3.12
DJI 19 2.64
FanDuel 20 2.34
Pure Storage 21 2.04
MEDIA SUPERSTARS (Earned Media Index > 1.00)
Company Rank Ave. Score
MongoDB 22 1.89
Cloudera 23 1.72
Instacart 24 1.54
Houzz 25 1.51
Stripe 26 1.39
Nutanix 27 1.21
Ola Cabs 28 1.20
6 Source: Big Valley analysis of monthly News, Social and Search volumes, indexed to 100 based on highest Jan’15 channel scores, then aggregated into a composite Earned Media Index. Data from IT Database, Sysomos and Google AdWords.

EARNED MEDIA INDEX VS. VALUATION
TOP 10 OVER-PERFORMERS IN EARNED MEDIA
Company Ave. Earned Media Index
Index Rank
Valuation Rank
Over/Under
BuzzFeed 15.75 10 65 +55
FanDuel 2.34 20 70 +50
Warby Parker 0.98 29 75 +46
GitHub 9.46 12 51 +39
MongoDB 1.89 22 58 +36
AppNexus 0.62 42 73 +31
Lyft 5.22 15 41 +26
Garena 3.12 18 42 +24
Instacart 1.54 24 48 +24
Grabtaxi 0.68 36 59 +23
Source: Big Valley analysis of monthly News, Social and Search volumes, indexed to 100 based on highest Jan’15 channel scores, then aggregated into a composite Earned Media Index. Data from IT Database, Sysomos and Google AdWords.
TOP 10 UNDER-PERFORMERS IN EARNED MEDIA
Company Ave. Earned Media Index
Index Rank
Valuation Rank
Over/Under
Lufax 0.03 68 12 -56
StemcentRX 0.01 72 23 -49
Zhong An 0.10 61 16 -45
VANCL 0.01 74 30 -44
Global Fashion 0.08 65 26 -39
Meituan 0.17 54 17 -37
ContextLogic 0.01 71 35 -36
Palantir 0.67 37 4 -33
WeWork 0.61 43 11 -32
Theranos 0.57 44 13 -31
7

So What?
• Unicorn status and valuation influence earned media – esp. news and social – but they don’t dictate media performance
• Company performance varies widely across news, social and search channels, reflecting lack of leverage across media
• Consumer categories dominate earned media; software steady but unspectacular; fintech rising and hardware declining
• Companies need to cultivate category (not just company) interest, plus vocal audience base and executive thought leadership
• Companies should bust marketing silos, invest more in owned and earned media, use analytics and planning to drive leverage
• Continue to track Unicorn Media Index to learn from the class: category dynamics, post-IPO drop-off, “unicorn fatigue”, etc.
Now What?
INSIGHTS + RECOMMENDATIONS
Source: Big Valley analysis of monthly News, Social and Search volumes, indexed to 100 based on highest Jan’15 channel scores, then aggregated into a composite Earned Media Index. Data from IT Database, Sysomos and Google AdWords. 8

Unicorn Media Index™: Company Rankings + Scores
April 13, 2016

UNICORN MEDIA INDEX RANKING: TOP 20
Rank Company Index News/Search/Social Volume
11 Square 14.47 1,281 757,167 18,344
12 GitHub 9.46 742 1,151,667 84,967
13 Credit Karma 6.37 14 5,653,333 4,065
14 SpaceX 5.33 404 407,250 149,138
15 Lyft 5.22 414 299,750 124,619
16 Jawbone 4.49 365 448,167 32,680
17 Slack 4.09 283 903,750 26,203
18 Garena 3.12 5 2,781,667 3,203
19 DJI 2.64 133 3,358 304,638
20 FanDuel 2.34 68 1,128,092 95,136
Source: Big Valley analysis of monthly News, Social and Search volumes, indexed to 100 based on highest Jan’15 channel scores, then aggregated into a composite Earned Media Index. Data from IT Database, Sysomos and Google AdWords.
Rank Company Index News/Search/Social Volume
1 Snapchat 49.55 1,131 9,189,167 6,832,577
2 Pinterest 44.24 711 30,966,667 684,333
3 Spotify 38.01 1,778 12,753,333 1,289,949
4 Dropbox 35.76 1,144 21,208,333 97,026
5 Flipkart 34.34 865 22,416,667 150,733
6 Uber 32.88 2,194 4,624,167 1,137,737
7 Xiaomi 25.63 2,146 2,145,000 139,629
8 Snapdeal 20.67 505 13,333,333 175,055
9 Airbnb 18.77 581 10,958,333 148,618
10 BuzzFeed 15.75 686 4,772,500 808,171
10

UNICORN MEDIA INDEX RANKING: 21-40
Rank Company Index News/Search/Social Volume
21 Pure Storage 2.04 187 34,883 4,284
22 MongoDB 1.89 140 238,500 34,860
23 Cloudera 1.72 153 59,583 9,497
24 Instacart 1.54 124 180,000 7,830
25 Houzz 1.51 20 1,058,583 32,790
26 Stripe 1.39 108 209,250 4,214
27 Nutanix 1.21 104 63,333 10,607
28 Ola Cabs 1.20 31 725,250 20,936
29 Warby Parker 0.98 47 409,000 8,320
30 Didi Kuaidi 0.92 85 5,563 3,486
Rank Company Index News/Search/Social Volume
31 Magic Leap 0.90 73 82,167 8,261
32 Blue Apron 0.89 22 573,583 7,395
33 DocuSign 0.86 53 252,250 4,717
34 Fanatics 0.83 15 332,083 77,716
35 InMobi 0.72 63 32,750 3,398
36 Grabtaxi 0.68 49 133,592 5,027
37 Palantir 0.67 52 94,250 4,502
38 Zenefits 0.67 51 98,042 6,021
39 Delivery Hero 0.65 55 63,875 1,263
40 Domo 0.63 21 361,167 2,990
Source: Big Valley analysis of monthly News, Social and Search volumes, indexed to 100 based on highest Jan’15 channel scores, then aggregated into a composite Earned Media Index. Data from IT Database, Sysomos and Google AdWords. 11

UNICORN MEDIA INDEX RANKING: 41-60
Rank Company Index News/Search/Social Volume
41 Legendary Entertainment 0.63 57 1,842 5,909
42 AppNexus 0.62 55 23,083 2,114
43 WeWork 0.61 47 64,208 11,476
44 Theranos 0.57 34 143,208 14,459
45 Klarna 0.40 13 236,083 1,276
46 One97 0.34 31 5,575 426
47 ZocDoc 0.31 11 171,000 1,095
48 MuleSoft 0.29 23 28,283 3,068
49 The Honest Co 0.27 10 110,208 9,320
50 Tanium 0.25 21 16,700 1,277
Rank Company Index News/Search/Social Volume
51 Adyen 0.22 18 25,650 1,464
52 Dianping 0.19 17 7,000 362
53 Powa 0.18 14 9,183 4,789
54 Meituan 0.17 16 6,000 412
55 Coupang 0.13 8 33,417 1,201
56 InsideSales.com 0.13 11 1,305 1,272
57 Medallia 0.13 7 42,300 994
58 Bloom Energy 0.13 10 20,217 437
59 Moderna 0.12 7 33,833 2,238
60 Deem 0.11 6 42,750 241
Source: Big Valley analysis of monthly News, Social and Search volumes, indexed to 100 based on highest Jan’15 channel scores, then aggregated into a composite Earned Media Index. Data from IT Database, Sysomos and Google AdWords. 12

UNICORN MEDIA INDEX RANKING: 61-75
Rank Company Index News/Search/Social Volume
61 Zhong An 0.10 10 248 157
62 Prosper Marketplace 0.09 8 4,450 726
63 Social Finance 0.09 8 5,300 888
64 Infinidat 0.09 8 4,883 286
65 Global Fashion Group 0.08 7 1,777 203
66 Oscar Health 0.08 6 7,358 962
67 Intarcia 0.05 4 3,100 224
68 Lufax 0.03 3 2,607 127
69 Lazada Group 0.03 2 5,433 148
70 Jasper Tech 0.02 1 2,042 568
Rank Company Index News/Search/Social Volume
71 ContextLogic 0.01 1 1,233 82
72 Stemcentrx 0.01 1 1,747 59
73 Koudai Shopping 0.01 1 928 3
74 VANCL 0.01 1 3,317 29
75 Trendy Group/ Trendiano 0.00 0 893 70
Source: Big Valley analysis of monthly News, Social and Search volumes, indexed to 100 based on highest Jan’15 channel scores, then aggregated into a composite Earned Media Index. Data from IT Database, Sysomos and Google AdWords. 13

UNICORN MEDIA INDEX SCORES: 1-25
Source: Big Valley analysis of monthly News, Social and Search volumes, indexed to 100 based on highest Jan’15 channel scores, then aggregated into a composite Earned Media Index. Data from IT Database, Sysomos and Google AdWords.
0
20
40
60 1 2 3 4 5 6 7 8 9 10
11
12
13
14
15
16
17
18
19
20
21
22
23
24
25
0 20 40 60 80
100 120
1: S
napc
hat
2: P
inte
rest
3: S
potif
y
4: D
ropb
ox
5: F
lipka
rt
6: U
ber
7: X
iaom
i
8: S
napd
eal
9: A
irbnb
10: B
uzzF
eed
11: S
quar
e
12: G
ithub
13: C
redi
t Kar
ma
14: S
pace
X
15: L
yft
16: J
awbo
ne
17: S
lack
18: G
aren
a
19: D
JI
20: F
anD
uel
21: P
ure
Stor
age
22: M
ongo
DB
23: C
loud
era
24: I
nsta
cart
25: H
ouzz
Aver
age
chan
nel s
core
s
News Search Social
14

UNICORN MEDIA INDEX SCORES: 26-50
0
1
2
3
4
5
26: S
trip
e
27: N
utan
ix
28: O
la C
abs
29: W
arby
Par
ker
30: D
idi K
uaid
i
31: M
agic
Lea
p
32: B
lue
Apro
n
33: D
ocuS
ign
34: F
anat
ics
35: I
nMob
i
36: G
rabt
axi
37: P
alan
tir
38: Z
enefi
ts
39: D
eliv
ery
Her
o
40: D
omo
41: L
egen
dary
En
tert
ainm
ent
42: A
ppN
exus
43: W
eWor
k
44: T
hera
nos
45: K
larn
a
46: O
ne97
47: Z
ocD
oc
48: M
uleS
oft
49: T
he H
ones
t Co
50: T
aniu
m
Aver
age
chan
nel s
core
s
News Search Social
Source: Big Valley analysis of monthly News, Social and Search volumes, indexed to 100 based on highest Jan’15 channel scores, then aggregated into a composite Earned Media Index. Data from IT Database, Sysomos and Google AdWords.
0.00 0.50 1.00 1.50
26
27
28
29
30
31
32
33
34
35
36
37
38
39
40
41
42
43
44
45
46
47
48
49
50
15

UNICORN MEDIA INDEX SCORES: 51-75
0.00
0.25
0.50
0.75
1.00
51: A
dyen
52: D
ianp
ing
53: P
owa
54: M
eitu
an
55: C
oupa
ng
56: I
nsid
eSal
es.
57: M
edal
lia
58: B
loom
Ene
rgy
59: M
oder
na
60: D
eem
61: Z
hong
An
62: P
rosp
er
63: S
ocia
l Fin
ance
64: I
nfini
dat
65: G
loba
l
66: O
scar
Hea
lth
67: I
ntar
cia
68: L
ufax
69: L
azad
a G
roup
70: J
aspe
r Tec
h
71: C
onte
xtLo
gic
72: S
tem
cent
rx
73: K
ouda
i
74: V
ANCL
75: T
rend
y Aver
age
chan
nel s
core
s
News Search Social
Source: Big Valley analysis of monthly News, Social and Search volumes, indexed to 100 based on highest Jan’15 channel scores, then aggregated into a composite Earned Media Index. Data from IT Database, Sysomos and Google AdWords.
0.00 0.05 0.10 0.15 0.20 0.25
51
52
53
54
55
56
57
58
59
60
61
62
63
64
65
66
67
68
69
70
71
72
73
74
75
16

Unicorn Media Index™: Category + Company Snapshots
April 13, 2016

CATEGORY ANALYSIS: TOP 10 UNICORNS
• Snapchat (#1 earned media, #6 valuation) is the big mover with search and social growth in late 2015, suggesting audience momentum
• Spotify is biggest out-performer (#3 earned media, #15 valuation) including Jun’15 spike due to Apple, Amazon, Google competition
• Uber is #1 in valuation and funding, but only #6 in earned media – strong news and social presence (#1 and #3) but lags in search (#9)
• Xiaomi (#7 earned media, #2 valuation) is the only company with a negative linear trend, fueled by sharply lower news and social
Top 10 Unicorns
0
25
50
75
Jan-
15
Feb-
15
Mar
-15
Apr-
15
May
-15
Jun-
15
Jul-1
5
Aug-
15
Sep-
15
Oct
-15
Nov
-15
Dec
-15
Snapchat Pinterest Spotify Dropbox Flipkart Uber Xiaomi Snapdeal Airbnb BuzzFeed
Source: Big Valley analysis of monthly News, Social and Search volumes, indexed to 100 based on highest Jan’15 channel scores, then aggregated into a composite Earned Media Index. Data from IT Database, Sysomos and Google AdWords. 18

CATEGORY ANALYSIS: HARDWARE
• Hardware stood out with negative linear trends for four of the five companies
• Chinese mobile phone maker Xiaomi (#7 earned media, #2 valuation) lost ground from early high point spiked by Apple market battle
• Jawbone (#16 earned media, #70 valuation) showed steady declines from 5+ to <3
• Drone maker DJI (#19 earned media) was strong through Q3 2015, but lost ground after “drone for beginners” launch Aug’15
• Magic Leap (#31 earned media) spiked on Mar’15 (demo) and Oct’15 (funding) news
• Only storage provider Infinidat (#64) bucked trend with but steadily increasing visibility
Hardware Unicorns
0
10
20
30
40
J-15
F-15
M-1
5
A-15
M-1
5
J-15
J-1
5
A-1
5
S-15
O-1
5
N-1
5
D-1
5
Xiaomi Jawbone DJI Magic Leap Infinidat
Source: Big Valley analysis of monthly News, Social and Search volumes, indexed to 100 based on highest Jan’15 channel scores, then aggregated into a composite Earned Media Index. Data from IT Database, Sysomos and Google AdWords. 19

CATEGORY ANALYSIS: CONSUMER INTERNET
• Social media platforms (Snapchat, Pinterest, Spotify, Houzz) and on-demand services (Uber, Airbnb, Lyft, Instacart) dominated both valuations and earned media through 2015
• Uber’s valuation and visibility (#6 earned media) drove impressive category pull-through for Lyft (#15), Ola (#28), Didi Kuaidi (#30) and Grabtaxi (#36)
• Airbnb (#9) showed steady growth from ~13 to ~20, fueled largely via search and social
• Spotify (#3) also showed solid upward trend from ~30 to ~40, fueled by social and search
• Most companies in this group posted upward linear trends – will they drop in 2016?
Consumer Internet Unicorns
0
25
50
75
J-15
F-15
M-1
5
A-15
M-1
5
J-15
J-1
5
A-1
5
S-15
O-1
5
N-1
5
D-1
5
Snapchat Pinterest Spotify Uber Airbnb Lyft FanDuel Instacart Houzz Ola Cabs Didi Kuaidi Grabtaxi Delivery Hero Dianping
Source: Big Valley analysis of monthly News, Social and Search volumes, indexed to 100 based on highest Jan’15 channel scores, then aggregated into a composite Earned Media Index. Data from IT Database, Sysomos and Google AdWords. 20

CATEGORY ANALYSIS: SOFTWARE
• This was the largest group, with 19 brands • Only two – Dropbox (#4) and GitHub (#12) –
indexed above 5. Five more indexed above 1: Slack (#17), Pure Storage (#21) , MongoDB (#22), CloudEra (#23) and Nutanix (#27)
• Dropbox showed slight negative linear trend, while GitHub and Slack showed steady gains
• In middle tier, Pure Storage had exponential visibility gains around sub-par IPO in Oct’15, while open source players MongoDB and Cloudera trended downward over 2015
• Among the others, Nutanix (#30), AppNexus (#45) and Tanium (#54) benefited from strong funding and product news spikes
Software Unicorns
0
10
20
30
40
50
J-15
F-15
M-1
5
A-15
M-1
5
J-15
J-1
5
A-1
5
S-15
O-1
5
N-1
5
D-1
5
Dropbox Github Slack Pure Storage MongoDB Cloudera Nutanix DocuSign InMobi Palantir Zenefits Domo AppNexus MuleSoft Tanium InsideSales.com Medallia Deem Jasper Tech
Source: Big Valley analysis of monthly News, Social and Search volumes, indexed to 100 based on highest Jan’15 channel scores, then aggregated into a composite Earned Media Index. Data from IT Database, Sysomos and Google AdWords. 21
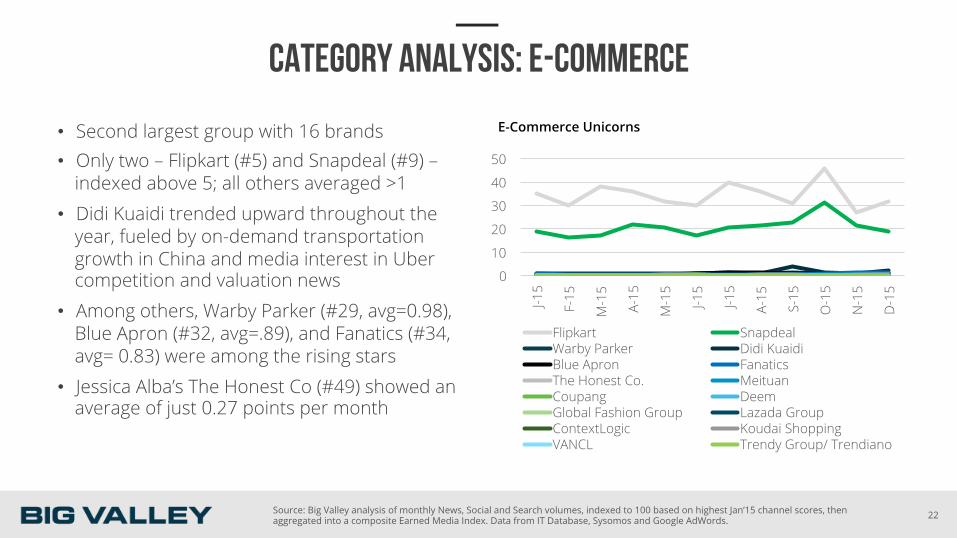
CATEGORY ANALYSIS: E-COMMERCE
• Second largest group with 16 brands • Only two – Flipkart (#5) and Snapdeal (#9) –
indexed above 5; all others averaged >1 • Didi Kuaidi trended upward throughout the
year, fueled by on-demand transportation growth in China and media interest in Uber competition and valuation news
• Among others, Warby Parker (#29, avg=0.98), Blue Apron (#32, avg=.89), and Fanatics (#34, avg= 0.83) were among the rising stars
• Jessica Alba’s The Honest Co (#49) showed an average of just 0.27 points per month
E-Commerce Unicorns
0
10
20
30
40
50
J-15
F-15
M-1
5
A-15
M-1
5
J-15
J-1
5
A-1
5
S-15
O-1
5
N-1
5
D-1
5
Flipkart Snapdeal Warby Parker Didi Kuaidi Blue Apron Fanatics The Honest Co. Meituan Coupang Deem Global Fashion Group Lazada Group ContextLogic Koudai Shopping VANCL Trendy Group/ Trendiano
Source: Big Valley analysis of monthly News, Social and Search volumes, indexed to 100 based on highest Jan’15 channel scores, then aggregated into a composite Earned Media Index. Data from IT Database, Sysomos and Google AdWords. 22

CATEGORY ANALYSIS: FINANCIAL SERVICES
• Only three players posted average media index scores above 1.0: Square (14.47); Credit Karma (6.37) and Stripe (1.39)
• Square had huge jump in visibility leading up to Nov’15 IPO; IPO price was lower than last private valuation ($6B); can it sustain in 2016?
• Credit Karma (#13) was relatively stable through Aug’15, dipped in Sept’15-Nov’15 and rebounded in Dec’15
• Fintech gained momentum through 2015, fueling late surge for 8 of 11 players – Credit Karma, Klarna, One97, Adyen, Powa, Prosper Marketplace, Social Finance and Lufax
Financial Services Unicorns
0
10
20
30
40
J-15
F-15
M-1
5
A-15
M-1
5
J-15
J-1
5
A-1
5
S-15
O-1
5
N-1
5
D-1
5
Square Credit Karma Stripe Klarna One97 Adyen Powa Zhong An Prosper Marketplace Social Finance Lufax
Source: Big Valley analysis of monthly News, Social and Search volumes, indexed to 100 based on highest Jan’15 channel scores, then aggregated into a composite Earned Media Index. Data from IT Database, Sysomos and Google AdWords. 23
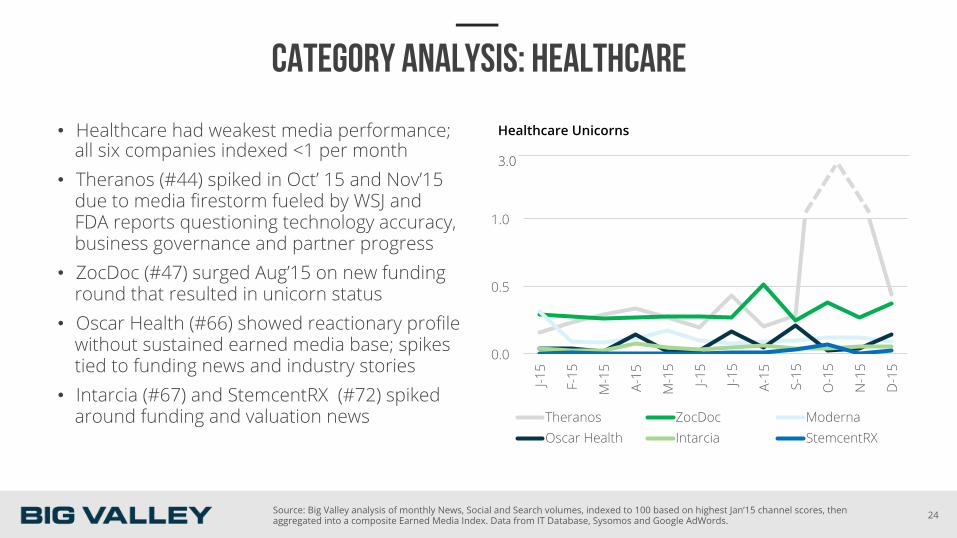
CATEGORY ANALYSIS: HEALTHCARE
• Healthcare had weakest media performance; all six companies indexed <1 per month
• Theranos (#44) spiked in Oct’ 15 and Nov’15 due to media firestorm fueled by WSJ and FDA reports questioning technology accuracy, business governance and partner progress
• ZocDoc (#47) surged Aug’15 on new funding round that resulted in unicorn status
• Oscar Health (#66) showed reactionary profile without sustained earned media base; spikes tied to funding news and industry stories
• Intarcia (#67) and StemcentRX (#72) spiked around funding and valuation news
Healthcare Unicorns
0.0
0.5
1.0
J-15
F-15
M-1
5
A-15
M-1
5
J-15
J-1
5
A-1
5
S-15
O-1
5
N-1
5
D-1
5
Theranos ZocDoc Moderna Oscar Health Intarcia StemcentRX
3.0
Source: Big Valley analysis of monthly News, Social and Search volumes, indexed to 100 based on highest Jan’15 channel scores, then aggregated into a composite Earned Media Index. Data from IT Database, Sysomos and Google AdWords. 24

COMPANY ANALYSIS: SNAPCHAT
• #1 Earned Media Index (49.55) • #6 in valuation ($16.0B) with $1.3B in
total funding • Led Unicorn Media Index by an average
5-point margin over #2 Pinterest • Most visible growth in search volume; up
significantly in second half of year • Social volumes spike in July (locks out
“jailbreakers;”) September (Burberry debuts London’s Fashion Week)
• News was comparably steady (new initiatives, partnerships)
0
20
40
60
80
100
120
J-15
F-15
M-1
5
A-15
M-1
5
J-15
J- 15
A-1
5
S-15
O-1
5
N-1
5
D-1
5
Aver
age
chan
nel s
core
s News Search Social
0 25 50 75
100
J-15
F-15
M-1
5
A-15
M-1
5
J-15
J- 15
A-1
5
S-15
O-1
5
N-1
5
D-1
5
Source: Big Valley analysis of monthly News, Social and Search volumes, indexed to 100 based on highest Jan’15 channel scores, then aggregated into a composite Earned Media Index. Data from IT Database, Sysomos and Google AdWords. 25

COMPANY ANALYSIS: AIRBNB
• #9 Earned Media Index (18.77) • #3 in valuation ($25.5B) with $2.3B in
total funding • Airbnb showed steady growth from ~13
to ~20, fueled largely via search and social
• Strong seasonal growth during summer and holiday months – with 13.6M average monthly searches Jun’15-Aug’15
• News and social trended up in summer, leveled in fall but grew again Nov’15 on funding news and “voting cartel” plans 0
10
20
30
40
50
J-15
F-15
M-1
5
A-15
M-1
5
J-15
J- 15
A-1
5
S-15
O-1
5
N-1
5
D-1
5
Aver
age
chan
nel s
core
s News Search Social
0 5
10 15 20 25
J-15
F-15
M-1
5
A-15
M-1
5
J-15
J- 15
A-1
5
S-15
O-1
5
N-1
5
D-1
5
Source: Big Valley analysis of monthly News, Social and Search volumes, indexed to 100 based on highest Jan’15 channel scores, then aggregated into a composite Earned Media Index. Data from IT Database, Sysomos and Google AdWords. 26

COMPANY ANALYSIS: GITHUB
• #12 Earned Media Index (9.46) • #57 in valuation ($2.0B) with $350M in
total funding • GitHub was highest-scoring B2B player,
powered by active and vocal developer audience
• News and search trends tracked more closely together than for consumer brands – 739 stories + 85K social posts + 1.2M searches per month
• News spiked March as GitHub was hit by its biggest DDoS attack ever; Oct’15 on Google AMP project
0
5
10
15
20
25
30
J-15
F-15
M-1
5
A-15
M-1
5
J-15
J- 15
A-1
5
S-15
O-1
5
N-1
5
D-1
5
Aver
age
chan
nel s
core
s News Search Social
0 4 8
12
J-15
F-15
M-1
5
A-15
M-1
5
J-15
J- 15
A-1
5
S-15
O-1
5
N-1
5
D-1
5
Source: Big Valley analysis of monthly News, Social and Search volumes, indexed to 100 based on highest Jan’15 channel scores, then aggregated into a composite Earned Media Index. Data from IT Database, Sysomos and Google AdWords. 27

Unicorn Media Index™: Methodology April 13, 2016

“UNICORN” CLASS OF $1B+ PRIVATE COMPANIES
29

EARNED MEDIA INDEX™
Key Questions • How do brands (or other entities) perform across
earned media relative to peers and competitors?
• How does performance correlate across news, social and search channels?
• What can brands learn from other brands to improve their earned media performance?
Goals • Benchmark earned media performance for my brand,
product or idea, over time and against other entities
• Understand which channel types best drive earned media impact for my brand and category
• Plan future communication strategies, campaigns and channel mix to optimize performance
Approach • Analyze earned media visibility and trajectory across
channels, including relevant data for news, social and search. Capture channel data monthly and aggregate it into a composite index for easy comparison over time and against others.
- News: Keyword search for number of news citations for the entity in IT Database, a well-curated online database of technology, business and vertical news outlets.
- Social: Keyword search for number of social citations for the entity name or handle using Sysomos, a broad social media aggregator that captures social content (Twitter, Facebook, LinkedIn, blogs, forums, videos and images).
- Search: Average monthly searches for the entity name via search engines as tracked via Google AdWords, reflecting organic brand search behavior by month.
30
METHODOLOGY NOTES
• This study applies the Earned Media Index to analyze earned media performance, visibility patterns and channel dynamics for a distinct class of companies.
• Big Valley analysts conducted this analysis between Dec’15 and Feb’16, capturing data for each company across news, social and search channels.
• The full study captures monthly channel data for each company from Jan’15 through Dec’15. Each brand’s channel score is indexed to 100, based on the leader for that channel as of Jan’15. The channel scores are then aggregated into a composite Earned Media Index score.
• Because the unicorn list is constantly evolving, we focused our data gathering on the top 75 companies based on Nov’15 valuations tracked by Dow Jones VentureSource. When a company goes public, it is removed after a three-month period (though we continue to track it separately to evaluate post-IPO effects on earned media performance).
• Financial valuations and industry classifications were leveraged from Dow Jones VentureSource. Valuation levels and rankings are based on Mar’16 data.
31

Related Documents