UNICON Investment Solutions Page 1 COMPANY PROFILE Unicon Investment Solutions Uniconhas been founded with the aim of providing world class investing experience to hitherto underserved investor community. The technology today has made it possible to reach out to the last person in the financial market and give him the same level of service which was available to only the selected few. We give personalized premium service with reasonable commissions on the NSE, BSE & Derivative market through our Equity broking arm Unicon Securities Pvt Ltd. and Commodities on NCDEX and MCX through our Commodity broking arm Unicon Commodities Pvt. Ltd. With our sophisticated technology you can trade through your computer and if you want human touch you can also deal through our Relationship Managers out of our more than 100 branches spread across the nation. We also give personalized services on Insurance (Life & General) & Investments (Mutual Funds & IPO's) needs, through our Insurance & Investment distribution arm Unicon Insurance Advisors Pvt. Ltd. Our tailor-made customized solutions are perfect match to different financial objectives. Our distribution network is backed by in-house back office support to serve our customers promptly. MISSION: To create long term value by empowering individual investors through superior financial services supported by culture based on highest level of teamwork, efficiency and integrity. VISION: To provide the most useful and ethical Investment Solutions - guided by values driven approach to growth, client service and employee development.

Welcome message from author
This document is posted to help you gain knowledge. Please leave a comment to let me know what you think about it! Share it to your friends and learn new things together.
Transcript
UNICON Investment Solutions Page 1
COMPANY PROFILE
Unicon Investment Solutions
Uniconhas been founded with the aim of providing world class investing experience to
hitherto underserved investor community. The technology today has made it possible to reach
out to the last person in the financial market and give him the same level of service which
was available to only the selected few.
We give personalized premium service with reasonable commissions on the NSE, BSE &
Derivative market through our Equity broking arm Unicon Securities Pvt Ltd. and
Commodities on NCDEX and MCX through our Commodity broking arm Unicon
Commodities Pvt. Ltd. With our sophisticated technology you can trade through your
computer and if you want human touch you can also deal through our Relationship Managers
out of our more than 100 branches spread across the nation.
We also give personalized services on Insurance (Life & General) & Investments (Mutual
Funds & IPO's) needs, through our Insurance & Investment distribution arm Unicon
Insurance Advisors Pvt. Ltd. Our tailor-made customized solutions are perfect match to
different financial objectives. Our distribution network is backed by in-house back office
support to serve our customers promptly.
MISSION:
To create long term value by empowering individual investors through superior financial
services supported by culture based on highest level of teamwork, efficiency and integrity.
VISION:
To provide the most useful and ethical Investment Solutions - guided by values driven
approach to growth, client service and employee development.
UNICON Investment Solutions Page 2
MANAGEMENT TEAM :
Mr.GajendraNagpal (founder and CEO)
Mr. Ram Gupta (Co-founder and president)
Mr.Y P Narang (chairman for fixed assets group)
Mr.SandeepArora (Chief Operation Manager)
Mr. Vijay Chopra(National Head)
PRODUCTS AND SERVICES :
Customers have the advantage of trading in all the market segments together in the same
window, as we understand the need of transactions to be executed with high speed and
reduced time. At the same time, they have the advantage of having all Advisory Services for
Life Insurance, General Insurance, Mutual Funds and IPO’s also.
Unicon is a customer focused financial services organization providing a range of investment
solutions to our customers. We work with clients to meet their overall investment objectives
and achieve their financial goals. Our clients have the opportunity to get personalized
services depending on their investment profiles. Our personalized approach enables clients to
achieve their Total INVESTMENT OBJECTIVES.
1. Equity
2. Commodity
3. Depository
4. Distribution
5. NRI Services
6. Back Office
7. Fixed Income

UNICON Investment Solutions Page 3
EQUITY :
1.UniconPlus
Browser based trading terminal that can be accessed by a unique ID and password. This
facility is available to all our online customers the moment they get registered with us.
FEATURES :
Trading at NSE & BSE:
1. Add multiple scrips on the market watch.
2. Greater exposure for trading on the available margin.
3. Common window for display of market watch and order execution.
4. Real time updating of exposure and portfolio while trading.
5. Offline order placement facility.
6. Proxy link to enable trading behind firewalls.
2.UNICON SWIFT :
Application based terminal for active traders. It provides better speed, greater analytical
features & priority access to Relationship Managers.
FEATURES:
Trading at NSE & BSE:
1. Add any number of scrips in the Market Watch.
2. Tick by tick live updation of Intraday chart.
3. Greater exposure for trading on the margin available
4. Common window for market watch and order execution.
5. Key board driven short cuts for punching orders quickly.
6. Facility to customize any number of portfolios & watch lists.
7. Stop-loss feature
UNICON Investment Solutions Page 4
COMMODITY:
Uniconoffers a unique feature of a single screen trading platform in MCX and
NCDEX.Unicon offers both Offline & Online trading platforms. You can Walk in or place
your orders through telephone at any of our branch locations Online Commodity Internet
trading Platform through UniFlex.
Live Market Watch for commodity market (NCDEX, MCX) in one screen.
Add any number of scrips in the Market Watch.
Tick by tick live updation of Intraday chart.
1. Greater exposures for trading on the margin available Common window for market
watch and order execution.
2. Key board driven short cuts for punching orders quickly.
3. Real time updation of exposure and portfolio.
4. Facility to customize any number of portfolios &watchlists.
5. Market depth, i.e. Best 5 bids and offers, updated live for all scripts.
6. Facility to cancel all pending orders with a single click.
7. Instant trade confirmations.
8. Stop-loss feature.
DISTRIBUTION
Unicon is fast emerging as a leader in the Insurance and Mutual Funds distribution space.
Unicon has over 100 branches and a huge number of “Business Development Executives”
who help to source and service the customers throughout the country. Unicon is fast
becoming the preferred “Vendor Independent” distribution houses because of providing
efficient service like free pick-up of collection of cheques/DD’s, Keeping track of the
premiums etc to its customers.
UNICON Investment Solutions Page 5
BOMBAY STOCK EXCHANGE
The Bombay stock exchange, existed in Mumbai, popularly known as “BSE” was established
in 1875 as “The Native Share and Stock brokers association” as a voluntary non-profit
making association. It has an evolved over the year into its present status as the premiere
Stock exchange in the country it may be noted that the stock exchange the oldest one in Asia,
even older than the Tokyo Stock Exchange, which was founded in 1878.
The exchange, upholds the interest of the investors and insurers dressed of their grievances,
whether against the companies or its own member brokers. It also strives to educate and
enlighten the investors by making available necessary informative inputs and conducing
investor education programmers.
A governing board comprising of 9 elected directors, 2 SEBI nominees, 7 public
representatives and an executive director is the apex body, which decides the policies and
regulates the affairs of the exchange.
The executive’s directors as the chief executive officer are responsible for the day to day
administration of the exchange. The average daily turnover of the exchange during the year
2000-01 (April-March) was Rs.3984.19 cores and average number of Daily trades 5.69 lakes.
However the average daily turnover of the exchange during the year 2001-02 has declined to
Rs.1244.10 cores and number of average daily trades during the period to 5.17 lakes. The
average daily turnover of the exchange during the year 2002-03 has declined and number of
average daily trades during the period is also decreased. The Ban on all deferral products like
BLESS AND ALBM in the Indian capital markets by SEBI with effect from July 2, 2001,
abolition of account period settlements, introduction of compulsory rolling settlements in all
scripts traded on the exchange with effect from Dec 31, 2001, etc., have adversely imprecated
the liquidity and consequently there is a considerable decline in the daily turnover of the
exchange present scenario is 110363 lakhs and number of average daily trades 1075 lakhs

UNICON Investment Solutions Page 6
BSE INDICES:
In order to enable the market participants, analysts etc., to track the various ups and
downs in the Indian stock market, the exchange has introduced in 1986 an equity stock index
called BSE-SENSEX that subsequently became the barometer of the movements of the share
prices in the Indian stock market. It is a “market capitalization weighted” index of 30
components stocks representing a sample of large, well-established and leading companies.
The base year sensex is 1978-79. The sensex is widely reported in both domestic and
international markets through print as well as electronic media.
Sensex is calculated using a market capitalization weighted method. As per this methodology,
the level of the index reflects the total market value of all 30 component stocks from different
industries related to particular base period. The total market value of a company is
determined by multiplying the price of its stocks by the number of shares outstanding.
Statisticians call an all index of a set of combined variables (such as price and number of
shares) a composite index. An indexed number is sued to represent the results of this
calculation in order to market the value easier to work with and track over a time. It much
easier to graph a chart based on indexed values than one based on actual values world over
majority of the well-known indices are constructed using “Market Capitalization weighted
method”. In practice, the daily calculation of SENSEX is done by dividing the aggregate
market value of the 30 companies in the index by a number called the index Divisor. The
Divisor is the only link to the original base period value of the SENSEX. The Divisor keeps
the Index comparable over a period of time and if the reference point for the entire index
maintenance adjustments. SENSEX is widely used to describe the mood in the Indian stock
markets. Base year average is changed as per the formula new base year average = old base
year average * (new market value/old market value.
UNICON Investment Solutions Page 7
National Stock Exchange:
The NSE was incorporated in Nov 1992 with an equity capital of Rs.25 cores. The
international securities consultancy (ISC) of Hong Kong has helped in setting up NSE. ISE
has prepared the detailed business plans and installation of hardware and software systems.
The promotions for NSE were financial institutions, insurances companies, banks and SEBI
capital market Ltd, infrastructure leasing and financial services Ltd and stock holding
corporation Ltd.
It has been set up to strengthen the move towards professionalization of the capital
market as well provided nationwide securities trading facilities to investors.
NSE is not an exchange in the traditional sense where brokers own and manage the
exchange. A two tier administrative set up involving a company board and a governing
abroad of the exchange envisaged. NSE is a national market for shares PSU bonds,
debentures and government securities since infrastructure and trading facilities are provided.
NSE-NIFTY:
The NSE on April 22, 1996 launched a new equity index. The NSE-50. The new index,
which replaces the existing NSE-100 index, is expected, to serve as an appropriate index for
the new segment of futures and options. “Nifty” means National Index for Fifty Stocks.
The NSE-50 comprises 50 companies that represent 20 broad industry groups with an
aggregate market capitalization of around Rs.1, 70,000 cores. All companies included in the
index have a market capitalization in excess of Rs.500 cores each and should have traded for
85% of trading days at an impact cost of less than 1.5%. The base period for the index is the
close of prices on Nov, 1995, which makes one year of completion of operation of Nose’s
capital market segment. The base value of the index has been set at 1000.
UNICON Investment Solutions Page 8
NSE-MIDCAP INDEX:
The NSE madcap index or the junior nifty comprises 50 stocks that represent 21 a board
industry groups and will provide proper representation of the madcap segment of the Indian
capital market. All stocks in the index should have market capitalization of greater than R’s
list of 200 crores and should have traded 85% of the trading days at an impact cost of less
2.5%.
The base period for the index is Nov 4, 1996, which signifies two years for completion of
operations of the capital market segment of the operations. The base value of the index has
been set at 1000.
Average daily turnover of the present scenarios 258212 lakhs and number of averages daily trades 2160 lakhs. At present, there are 24 stocks exchanges recognized under the securities contracts (regulations) Act, 1956.
UNICON Investment Solutions Page 9
INTRODUCTION
THEORETICAL BACKGROUND
The foundation of Modern Portfolio Theory was laid by Markowitz in 1951. He began
with the simple premise that since almost all investors invest in multiple securities rather than
one, there must be some benefit in investing in a portfolio of securities. He measured riskiness
of a portfolio through variability of returns and showed that investment in several securities
reduced this risk. His work won him the Nobel Prize for Economics in 1990. Markowitz's
work was extended by Sharpe in 1964, Lintner in1965 and Mossin in 1966. Sharpe shared the
Nobel Prize for Economics in 1990 with Markowitz and Miller for his contribution to the
Capital Asset Pricing Model (CAPM). This model breaks up the riskiness of each security
into two components - the market related risk which cannot be diversified called systematic
risk measured by the beta coefficient and another component which can be eliminated
through diversification called unsystematic risk.
The Markowitz model is extremely demanding in its data needs for generating the desired
efficient portfolio. It requires N (N+3)/2 estimates (N expected returns + N variances of
returns + N*(N-1 )/2 unique covariance's of returns). Because of this limitation the single index
model with less input data requirements has emerged. The Single index model requires 3N+2
estimates (estimates of alpha for each stock, estimates of beta for each stock, estimates of
variance σei2 for each stock, estimate for expected return on market index and an estimate of the
variance of returns on the market index σm2) to use the Markowitz optimization framework.
The single index model assumes that co-movement between stocks is due to movement in the
index. The basic equation underlying the single index model is:
Ri = ai + βi*Rm where
Ri = Return on the ith stock
ai = component of security i's that is independent of market performance βi= coefficient that measures expected change in Ri given a change in Rm
Rm = rate of return on market index
UNICON Investment Solutions Page 10
The term ai in the above equation is usually broken down into two elements ai which is
the expected value of ai and ei which is the random element of ai. The single index model
equation, therefore, becomes:
Ri = αi + βi*Rm + ei
Single index model has been criticized because of its assumption that stock prices move together only because of common co-movement with the market. Many researchers have found that there are influences beyond the market, like industry-related factors, that cause securities to move together.
FUNDAMENTAL ANALYSIS
Fundamental analysis of a business involves analyzing its income statement, financial
statements, its management, competitive advantages, its competitors and markets. The
analysis is performed on historical and present data, with the goal to make financial
projections. One of the primary assumptions of fundamental analysis is that the price on the
stock market does not fully reflect a stock's ―real‖ value.
Intrinsic value is defined to be the present value of all future net cash flows to the company.
The intrinsic value of an equity share depends on a multitude of factors. The earnings of the
company, the growth rate and risk exposure of the company have a direct bearing on the price
of the share. These factors in turn rely on the host of other factors like economic environment
in which they function, the industry which they belong to, and finally companies' own
performance. The fundamental school of thought appraised the intrinsic value of shares
through:
• Economic Analysis
• Industry Analysis
• Company Analysis
UNICON Investment Solutions Page 11
Economic Analysis
The level of economic activity has an impact on investment in many ways. If the economy
grows rapidly, the industry can also be expected to show rapid growth and vice- versa. When
the level of economic activity is low, stock prices are low, and when the level of economic
activity is high, stock prices are high reflecting the prosperous outlook for sales and profits of
the firms. The analysis of macroeconomic environment is essential to understand the behavior
of the stock prices. The commonly analyzed macro-economic factors are as follows:
A. Gross Domestic Product:
GDP indicates the rate of growth of the economy. GDP represents the aggregate value of the
goods and services produced in the economy. GDP consists of personal consumption
expenditure, gross private domestic investment and government expenditure on goods and
services and net export of goods and services. The growth rate of economy points out the
prospects for the industrial sector and return investors can expect from investment in shares.
The higher growth rate is more favorable to the stock market.
B. Savings and invetment:
It is obvious that growth requires investment which in turn requires substantial amount of
domestic savings. Stock market is a channel through which the savings of the investors are
made available to corporate bodies. Savings are distributed over various assets like equity
shares, deposits, mutual fund units, real estate and bullion. The saving and investment
patterns of the public affect the stock to a great extent.
C. Inflation:
Along with the growth of GDP, if inflation also increases, then the real rate of growth would
be very little. The demand in the consumer product industry is significantly affected. If there
is a mid level of inflation, it is good to the stock market but high rate of inflation is harmful to
the stock market.
UNICON Investment Solutions Page 12
D. Interest rates:
The interest rate affects the cost of financing to the firms. A decrease in interest rate implies
lower cost of finance for firms and more profitability. More money is available at a lower
interest rate for the brokers who are doing business with borrowed money. Availability of
cheap fund encourages speculation and rise in price of shares.
E. Budget:
The budget draft provides an elaborate account of the government revenues and
expenditures. A deficit budget may lead to high rate of inflation and adversely affect the cost
of production. Surplus budget may result in deflation. Hence, balanced budget is highly
favorable to the stock market.
F. The tax structure:
Concessions and incentives given to a certain industry encourage investment in that
particular industry. Tax relief given to savings encourages savings. The type of tax exemption
has an impact on the profitability of the industries.
G. The Balance of payment:
The balance of payment is the record of a country's money receipts from and payments
abroad. The difference between receipts and payments may be surplus or deficit. BOP is the
measure of the strength of rupee on external account. If the deficit increases, the rupee may
depreciate against other currencies, thereby, affecting the cost of imports. The volatility of
the foreign exchange rate affects the investment of the foreign institutional investors in the
Indian Stock Market. A favorable balance of payment renders a positive effect on the stock
market.
UNICON Investment Solutions Page 13
H. Monsoon and Agriculture:
Agriculture is directly and indirectly linked with the industries. A good monsoon leads to
higher demand for input and results in bumper crop. This would lead to buoyancy in the
stock market. When the monsoon is bad, Agriculture and hydroelectric production would
suffer. They cast a shadow on the share market.
I. Infrastructure facilities:
Infrastructure facilities are essential for the growth of industrial and agricultural sector. A
wide network of communication system is a must for the growth of the economy. Regular
supply of power without any power cut would boost the production. Banking and financial
sectors should also be sound enough to provide adequate support to industry and agriculture.
J. Demographic factors:
The demographic data provides details about the population by age, occupation, literacy and
geographic location. This is needed to forecast the demand for the consumer goods. The
population by age indicates the availability of able work force. Population, by providing
labor and demand for products, affects the industry and stock market.
Industry Analysis
Industry analysis is a type of investment research that begins by focusing on the status of an
industry or an industrial sector. Each industry has differences in terms of its customer base,
market share among firms, industry-wide growth, competition, regulation and business
cycles. Learning about how the industry works will give an investor a deeper understanding
of a company's financial health. The Industry life cycle analysis and Porter's 5 forces model
for competitive advantage are common valuation techniques.
A. Industry Life Cycle Model:
This model is a useful tool for analyzing the effects of an industry's evolution on competitive
forces. Using the industry life cycle model, we can identify five industry environments, each
linked to a distinct stage of an industry's evolution.
UNICON Investment Solutions Page 14
a. Pioneering development: - During this start up stage, the industry experiences modest
sales growth and very small or negative profit margins and profits. The market for the
industry's product or service during this time period is small, and the firms involved incur
major development costs.
b. Rapid accelerating growth: - During this rapid growth stage, a market develops for the
product or service and demand becomes substantial. The profit margins are very high. The
industry builds its productive capacity as sales grow at an increasing rate as the industry
attempts to meet excess demands.
c. Mature stage: - The success in stage2 has satisfied most of the demands of the industry
goods and services. Thus, further sales growth may be above normal but it no longer
accelerates. The rapid growth of sales and the high profit margins attract competitors to the
industry, which causes an increase in supply and lower price, which the profit margin begin to
decline to normal levels.
d. Stabilization and market maturity: - During this stage which is probably the longest
stage, the industry growth rate declines to the growth rate of aggregate economy or its
industry segment. Competition produces tight profit margins, and the rate of return on capital
eventually becomes below the competitive level.
e. Deceleration of growth and decline: - At this stage of maturity, the industries sales
growth declines because of shifts in demand or growth in substitutes. Profit margins continue
to be squeezed, and some firms experiences low profits or even losses.
B. Porter's Five Forces Model
This model identifies five competitive forces that shape every single industry and market.
These forces help us to analyze everything from the intensity of competition to the
profitability and attractiveness of an industry.
UNICON Investment Solutions Page 15
a. Threat of New Entrants: - The easier it is for new companies to enter the industry, the
more cutthroat competition there will be. Factors that can limit the threat of new entrants
such as high fixed cost, existing loyalty to major brands, government regulations etc act as
barriers to entry.
b. Power of Suppliers: - This is how much pressure suppliers can place on a business. If
one supplier has a large enough impact to affect a company's margins and volumes, then they
hold substantial power. When there are very few suppliers of a particular product or there are
no substitutes or switching to another (competitive) product is very costly, the supplier is
powerful and vice versa.
c. Power of Buyers: - This is how much pressure customers can place on a business. Some
companies serve only a handful of customers, while others serve millions. In general, it's a
red flag (a negative) if a business relies on a small number of customers for a large portion
of its sales because the loss of each customer could dramatically affect revenues. If one
customer has a large enough impact to affect a company's margins and volumes, then they
hold substantial power.
d. Availability of Substitutes: - What is the likelihood that someone will switch to a
competitive product or service? If the cost of switching is low, then this poses to be a serious
threat. The main issue is the similarity of substitutes. If substitutes are similar, then it can be
viewed in the same light as a new entrant, which is a threat to the company.
e. Competitive Rivalry: - This describes the intensity of competition between existing firms
in an industry. A highly competitive market might result from:
• Many players of about the same size, no dominant firm.
• Little differentiation between competitor's products and
services.
• A mature industry with very little growth. Companies can only grow by
stealing customers away from competitors.
UNICON Investment Solutions Page 16
Company Analysis
In the company analysis the investor assimilates the several bit of information related to
the company and evaluates the present and future value of stock. The risk and return
associated with the purchase of the stock is analyzed to take better investment decision.
The present and future are affected by a number of factors. They are:- A. Competitive advantage of the company:
Competitive advantage (CA) is a position that a firm occupies in its competitive landscape.
A company's long-term success is driven largely by its ability to maintain a competitive
advantage - and keep it. Competitive advantages vary from situation to situation and from
time to time. Some basic examples of CAs can be divided in 4 main global areas:
• Cost - Low cost operations
• Quality - High quality and consistent quality
• Time - delivery speed, on time delivery and development speed
• Flexibility - customization, volume flexibility and variety
B. Earnings of the company: Sales alone do not increase the earnings but the costs and expenses of the company also
influence the earnings of the company. Further, earnings do not always increase with the
increase in sales. The company's sales might have increased but its earnings may decline due
to the rise in costs.
C. Capital structure:
The equity holders' return can be increased manifold with the help of financial leverage, i.e.
using debt financing along with equity financing. The effect of financial leverage is
measured by computing leverage ratios. The debt may be in the form of debentures and term
loans from financial institutions.
UNICON Investment Solutions Page 17
D. Management:
Good and capable management generates profit to the investors. The management of the firm
should efficiently plan, organize, actuate and control the activities of the company. The basic
objective of management is to attain the stated objectives of the company for the good of the
equity share holders, the public and the employers. Good management depends on the
quality of the manager. Some believe that management is the most important aspect for
investing in a company. It makes sense - even the best business model is doomed if the
leaders of the company fail to properly execute the plan.
E. Operating efficiency:
The operating efficiency of a company directly affects the earnings of a company. An
expanding company that maintains high operating efficiency with a low break-even point
earns more than the company with high break-even points. If a firm has stable operating
ratio, the revenue will also be stable. Efficient use of fixed assets with a raw materials,
labour and management would lead to more income from sales. This leads to internal fund
generation for the expansion of the firm. A growing company should have low operating ratio
to meet the growing demand for its product.
F. Business Model:
Even before an investor looks at a company's financial statements or does any research, one
of the most important questions that should be asked is: What exactly does the company do?
This is referred to as a company's business model - it's how a company makes money. You
can get a good overview of a company's business model by checking out its website. Unless
you understand a company's business model, you don't know what the drivers are for future
growth, and you leave yourself vulnerable to being blindsided.
UNICON Investment Solutions Page 18
G. Corporate Governance:
Corporate governance describes the policies in place within an organization denoting the
relationships and responsibilities between management, directors and stakeholders. These
policies are defined and determined in the company charter and its bylaws, along with
corporate laws and regulations. The purpose of corporate governance policies is to ensure
that proper checks and balances are in place, making it more difficult for anyone to conduct
unethical and illegal activities Good corporate governance is a situation in which a company
complies with all of its governance policies and applicable government regulations in order to
look out for the interests of the company's investors and other stakeholders.
H. Financial analysis:
The best source of financial information about a company is its own financial statements.
This is a primary source of information for evaluating the investments prospects in the
particular company's stock. Financial statement analysis is the study of a company's financial
statement from various viewpoints. The statement gives the historical and current information
about the company's operations. Historical financial statements help to predict the future. The
current information aids to analyze the present status of the company. The two main
statements used in analysis are:-
• Balance sheet
• Profit and loss account
Strengths Of Fundamental Analysis A. Long-term trends:
Fundamental analysis is good for long-term investments based on long-term trends, very
long-term. And also the ability to identify and predict long-term economic, demographic,
technological or consumer trends can benefit patient investors who pick the right industry
groups or companies.
UNICON Investment Solutions Page 19
B. Value Spotting:
Sound fundamental analysis will help identify companies that represent good value. Some of
the most legendary investors think long-term and value. Fundamental analysis can help
uncover companies with valuable assets, a strong balance sheet, stable earnings and staying
power.
C. Business Acumen:
One of the most obvious, but less tangible, rewards of fundamental analysis is the
development of a thorough understanding of the business. After such painstaking research and
analysis, an investor will be familiar with the key revenue and profit drivers behind a
company. Earnings and earnings expectations can be potent drivers of equity prices. Even
some technicians will agree to that. A good understanding can help investors avoid
companies that are prone to shortfalls and identify those that continue to deliver.
Weakness Of Fundamental Analysis A. Time Constraints:
Fundamental analysis may offer excellent insights, but it can be extraordinarily time
consuming. Time consuming models often produce valuations that are contradictory to the
current price prevailing on Wall Street. When this happens, the analyst basically claims that
the whole street has got it wrong. This is not to say that there are not misunderstood
companies out there, but it is quite brash to imply that the market price, and hence Wall Street,
is wrong.
B. Industry/Company Specific:
Valuation techniques vary depending on the industry group and specifics of each company.
For this reason, a different technique and model is required for different industries and
different companies. This can get quite time consuming and limit the amount of research that
can be performed.
UNICON Investment Solutions Page 20
C. Subjectivity:
Fair value is based on assumptions. Any changes to growth or multiplier assumptions can
greatly alter the ultimate valuation. Fundamental analysts are generally aware of this and use
sensitivity analysis to present a base-case valuation, a best-case valuation and a worst-case
valuation. However, even on a worst case, most models are almost always bullish, the only
question is how much so.
Obstacles in the way of a successful Fundamental Analysis: A. Inadequacies or incorrectness of data:
An analyst has to often wrestle with inadequate or incorrect data. While deliberate falsification
of data may be rare, subtle misrepresentation and concealment are common. Often, an
experienced and skilled analyst may be able to detect such ploys and cope with them.
However, in some instances, he too is likely to be misled by them into drawing wrong
conclusions.
B. Future uncertainties:
Future change are largely unpredictable more so when the economic and business
environment is buffeted by frequent winds of change. In an environment characterized by
discontinuities, the past record is a poor guide to future performance.
C. Irrational market behavior:
The market itself presents a major obstacle to the analyst. On account of neglect or
prejudice, under valuations may persist for extended periods; likewise overvaluations
arising from unjustified optimism and misplaced enthusiasm may endure for unreasonable
lengths of time. The slow correction of under or overvaluation poses a threat to the analyst.
Before the market eventually reflects the values established by the analyst, new forces may
emerge. As Benjamin Graham put it; ―The particulars danger to analyst is that, because of
such delay, new determining factors may supervene before the market price adjusts itself to
the value as he found it
UNICON Investment Solutions Page 21
Criticisms of Fundamental Analysis
The biggest criticisms of fundamental analysis come primarily from two groups:
proponents of ―technical analysis and believers of ―efficient market hypothesis. Put simply,
technical analysts base their investments (or, more precisely, their trades) solely on the price
and volume movements of securities. Using charts and a number of other tools, they trade on
momentum, not caring about the fundamentals. While it is possible to use both techniques in
combination, one of the basic tenets of technical analysis is that the market discounts
everything. Accordingly, all news about a company already is priced into a stock, and
therefore a stock's price movements give more insight than the underlying fundamental
factors of the business itself. Followers of the efficient market hypothesis, however, are
usually in disagreement with both fundamental and technical analysts. The efficient market
hypothesis contends that it is essentially impossible to produce market-beating returns in the
long run, through either fundamental or technical analysis. The rationale for this argument is
that, since the market efficiently prices all stocks on an ongoing basis, any opportunities for
excess returns derived from fundamental (or technical) analysis would be almost
immediately whittled away by the market's many participants, making it impossible for
anyone to meaningfully outperform the market over the long term.
Fundamental analysis can be valuable, but it should be approached with caution. We
all have personal biases and every analyst has some sort of bias. There is nothing wrong with
this and the research can still be of great value. Corporate statements and press releases offer
good information, but should be read with a healthy degree of scepticism to separate the
facts from the spin. Press releases don't happen by accident and are an important PR tool for
companies. Investors should become skilled readers to weed out the important information and
ignore the hype.
VALUATION
In selecting stocks that trade for less than their intrinsic value, value investors actively seek
stocks of companies with sound financial statements that they believe the market has
undervalued. They believe the market always overreacts to good and bad news, causing stock

UNICON Investment Solutions Page 22
price movements that do not correspond with their long-term fundamentals. The result is an
opportunity for value investors to profit by taking a position on an inflated/deflated price
and getting out when the price is later corrected by the market.
Valuation Approaches
• Discounted cash flow valuation:
This approach has its foundation in the ―present value‖ rule, where the value of any
asset is the present value of expected future cash flows on it. The discount rate will be
a function of the riskiness of the estimated cash flows, with higher rates for riskier
assets and lower rates for safer projects.
• Relative valuation:
Estimates the value of an asset by looking at the pricing of 'comparable' assets
relative to a common variable like earnings, cash flows, book value or sales.
• Contingent claim valuation:
A contingent claim or option is an asset that pays off only under certain
contingencies, if the value of the underlying asset exceeds a prescribed value for a call
option or is less than the prescribed value for a put option. Option pricing models are
used to measure the value of assets that share option characteristics.
UNICON Investment Solutions Page 23
CAPM- CAPITAL ASSET PRICING MODEL
The Capital Asset Pricing Model (CAPM) is used in finance to determine a theoretically
appropriate required rate of return (and thus the price if expected cash flows can be
estimated) of an asset, if that asset is to be added to an already well-diversified portfolio,
given that asset's non-diversifiable risk. The CAPM formula takes into account the asset's
sensitivity to non-diversifiable risk (also known as systematic risk or market risk), often
represented by the quantity beta (β) in the financial industry, as well as the expected return of the
market and the expected return of a theoretical risk-free asset.
A. Assumptions of CAPM
• All investors have rational expectations.
• There are no arbitrage opportunities.
• Returns are distributed normally.
• Fixed quantity of assets.
• Perfectly efficient capital markets.
• Investors are solely concerned with level and uncertainty of future wealth
• Separation of financial and production sectors.
• Thus, production plans are fixed.
• Risk-free rates exist with limitless borrowing capacity and universal access.
• The Risk-free borrowing and lending rates are equal.
• No inflation and no change in the level of interest rate exist.
• Perfect information, hence all investors have the same expectations about
security returns for any given time period.
UNICON Investment Solutions Page 24
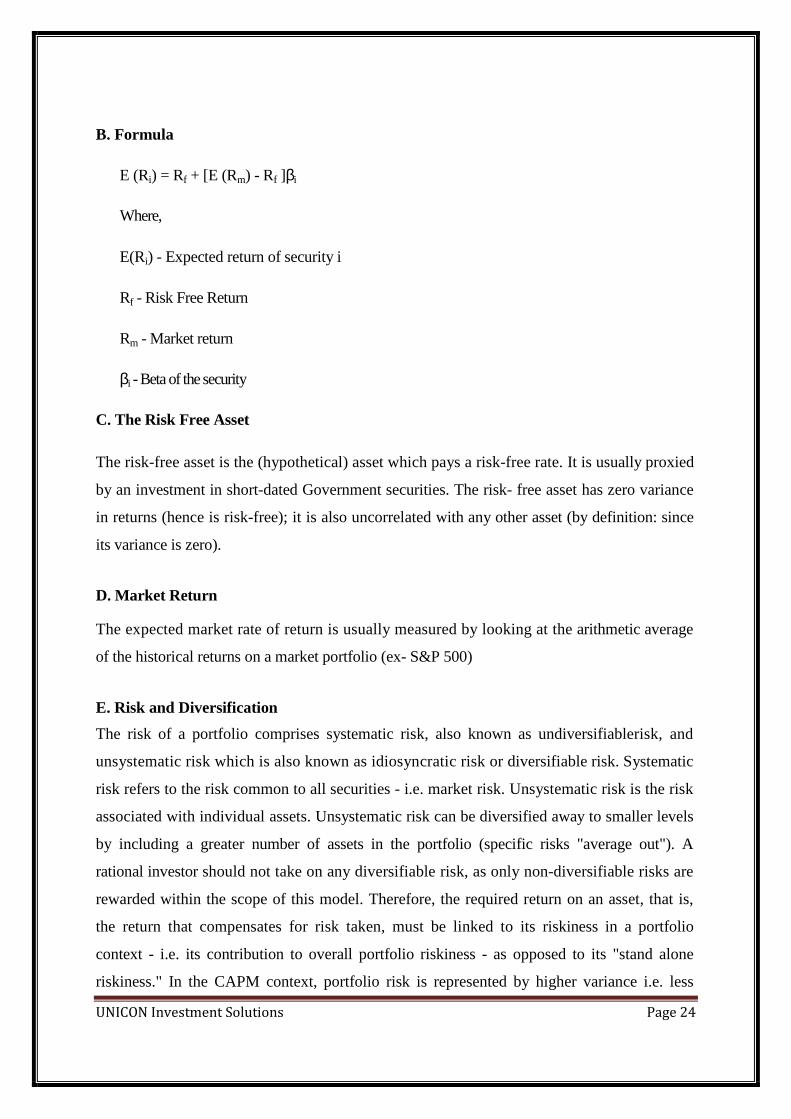
B. Formula
E (Ri) = Rf + [E (Rm) - Rf ]βi
Where,
E(Ri) - Expected return of security i
Rf - Risk Free Return
Rm - Market return
βi - Beta of the security
C. The Risk Free Asset
The risk-free asset is the (hypothetical) asset which pays a risk-free rate. It is usually proxied
by an investment in short-dated Government securities. The risk- free asset has zero variance
in returns (hence is risk-free); it is also uncorrelated with any other asset (by definition: since
its variance is zero).
D. Market Return The expected market rate of return is usually measured by looking at the arithmetic average
of the historical returns on a market portfolio (ex- S&P 500)
E. Risk and Diversification
The risk of a portfolio comprises systematic risk, also known as undiversifiablerisk, and
unsystematic risk which is also known as idiosyncratic risk or diversifiable risk. Systematic
risk refers to the risk common to all securities - i.e. market risk. Unsystematic risk is the risk
associated with individual assets. Unsystematic risk can be diversified away to smaller levels
by including a greater number of assets in the portfolio (specific risks "average out"). A
rational investor should not take on any diversifiable risk, as only non-diversifiable risks are
rewarded within the scope of this model. Therefore, the required return on an asset, that is,
the return that compensates for risk taken, must be linked to its riskiness in a portfolio
context - i.e. its contribution to overall portfolio riskiness - as opposed to its "stand alone
riskiness." In the CAPM context, portfolio risk is represented by higher variance i.e. less
UNICON Investment Solutions Page 25
predictability.
MEANINGS OF VARIOUS PERFORMANCE MEASURES
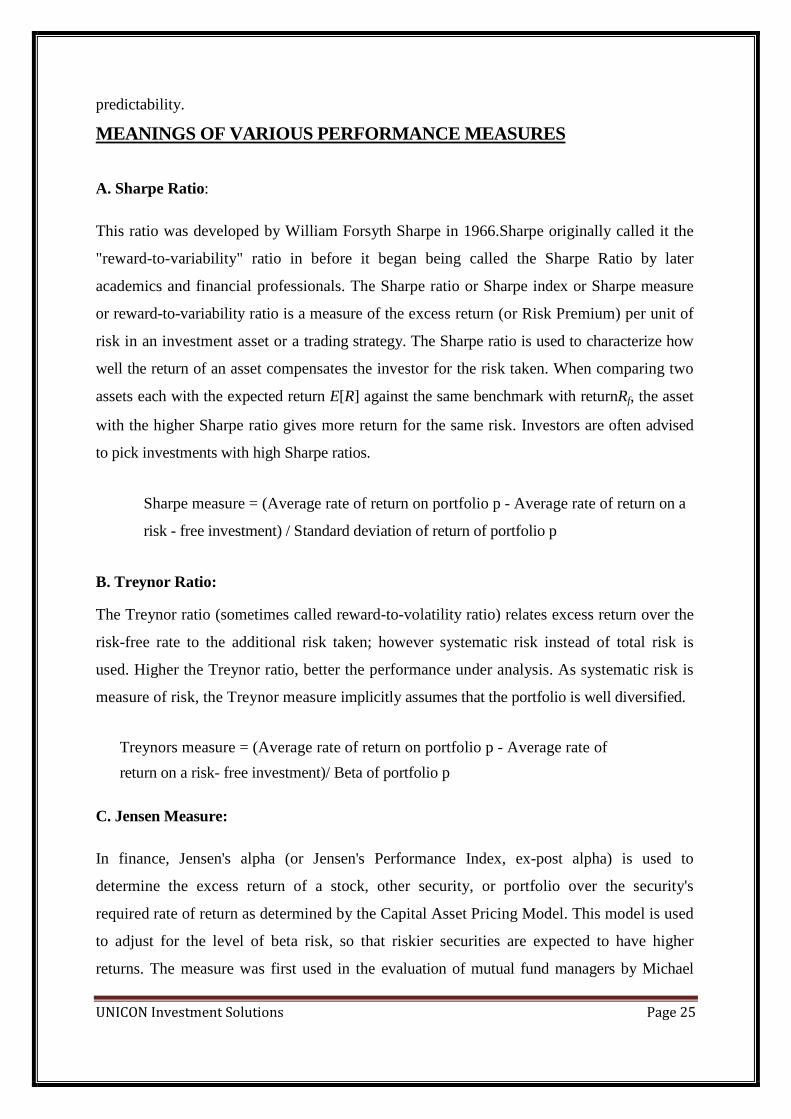
A. Sharpe Ratio:
This ratio was developed by William Forsyth Sharpe in 1966.Sharpe originally called it the
"reward-to-variability" ratio in before it began being called the Sharpe Ratio by later
academics and financial professionals. The Sharpe ratio or Sharpe index or Sharpe measure
or reward-to-variability ratio is a measure of the excess return (or Risk Premium) per unit of
risk in an investment asset or a trading strategy. The Sharpe ratio is used to characterize how
well the return of an asset compensates the investor for the risk taken. When comparing two
assets each with the expected return E[R] against the same benchmark with returnRf, the asset
with the higher Sharpe ratio gives more return for the same risk. Investors are often advised
to pick investments with high Sharpe ratios.
Sharpe measure = (Average rate of return on portfolio p - Average rate of return on a
risk - free investment) / Standard deviation of return of portfolio p
B. Treynor Ratio:
The Treynor ratio (sometimes called reward-to-volatility ratio) relates excess return over the
risk-free rate to the additional risk taken; however systematic risk instead of total risk is
used. Higher the Treynor ratio, better the performance under analysis. As systematic risk is
measure of risk, the Treynor measure implicitly assumes that the portfolio is well diversified.
Treynors measure = (Average rate of return on portfolio p - Average rate of
return on a risk- free investment)/ Beta of portfolio p
C. Jensen Measure:
In finance, Jensen's alpha (or Jensen's Performance Index, ex-post alpha) is used to
determine the excess return of a stock, other security, or portfolio over the security's
required rate of return as determined by the Capital Asset Pricing Model. This model is used
to adjust for the level of beta risk, so that riskier securities are expected to have higher
returns. The measure was first used in the evaluation of mutual fund managers by Michael

UNICON Investment Solutions Page 26
Jensen in the 1970's.
To calculate alpha, the following inputs are needed:
• The realized return (on the portfolio),
• The market return,
• The risk-free rate of return, and
• The beta of the portfolio.
Jensen's alpha = Portfolio Return - (Risk Free Rate + Portfolio Beta * (Market
Return - Risk Free Rate))
UNICON Investment Solutions Page 27
REVIEW OF LITERATURE: Elton, Edwin J, et al., (1977), are among the prominent researchers, who have worked on
Sharpe's Single Index Model. They presented a new method for selecting optimal portfolios
when upper bound constraints on investments in individual stocks were present and when the
variance-covariance matrix of returns possessed a special structure such as that implied by
standard single index model. Extending their previous work, more commonly called as EPG
approach to portfolio optimization, it was shown that upper bounds could be dealt with in a
more complex fashion that shares many of the features of ranking procedures of standard
single index model.
Bawa, Vijay S, et al., (1979), showed that the construction of optimal portfolio could be
simplified by using simple ranking procedures when returns followed a stable distribution and
the dependence structure had any of several standard forms. The ranking procedures
simplified the computations necessary to determine an optimum portfolio.
Faaland, Bruce H. and jacob, Nancy l, (1981), examined alternative solution procedure to
achieve the objective of chossing 'n' securities from a universe of 'm' securities in order to
maximise the portfolio's excess-return-to Beta ratio. The paper concluded with
computational experience on problems with 'n' ranging from 10 to 200 and 'm' from 500 to
1245.
Mulvey, John M, et al., (2003), observed that a multiperiod portfolio model provides
significant advantages over traditional single-period approaches-especially for long-term
investors. Such a framework can enhance risk adjusted performance and help investors
evaluate the probability of reaching financial goals by linking asset and liability policies.
UNICON Investment Solutions Page 28
STATEMENT OF PROBLEM
Investors generally hold a portfolio of securities to take advantage of diversification, while
individual return and risks are important, what matters finally is the return and risk of the
portfolio. In constructing a portfolio fundamental analysis can be used to select securities or
Sharpe single index model can be used to construct an optimal portfolio. In many cases it is
seen that securities trade above their intrinsic value because of boom in stock market, as a
result investors pay more to purchase them and the returns are not up to the mark. Hence the
study entitled:-―Portfolio Management at Unicon
OBJECTIVES OF THE STUDY
• To undertake study of different sector.
• To identify stocks in sectors which trade for less than their intrinsic value, less than
their Industrial Price to Earnings Ratio
• To construct a portfolio of stocks which are less than their Industrial Price to
Earnings Ratio
• To construct a portfolio of stocks using Sharpe single index model.
• To find if there is a significant difference in mean returns of portfolio constructed
using fundamental and optimization approach.
SCOPE OF THE STUDY
Scope of the research is confined to valuation of selected stocks, construction of portfolio
based on the analysis and to check the significant difference between returns of the portfolios.
OPERATIONAL DEFINITION OF CONCEPTS
• Fundamental Analysis:
A method of evaluating a stock by attempting to measure its intrinsic value.
Fundamental analysts study everything from the overall economy and industry
conditions, to the financial conditions and management of companies.
UNICON Investment Solutions Page 29
• Intrinsic value:
The economic value of a company or its common stock based on internally-
generated cash returns. Intrinsic value can be thought of as the discounted stream of
net cash flows from an asset
• Beta:
A statistical measure of the relative volatility of a stock, fund, or other security in
comparison with the market as a whole. The beta for the market is 1.00. Stocks with
betas above 1.0 are more responsive to the market, but are also more risky
investments. Stocks with a beta below 1.0 tend to move in the opposite direction of
the market. It is measure of systematic risk of a stock
• Single index model:
A model of stock returns that decomposes influences on returns into a systematic
factor, as measured by the return on the broad market index, and firm specific factors.
UNICON Investment Solutions Page 30
RESEARCH METHODOLOGY
• Type of Study:
The research conducted is an Analytical study. It may involve relating the
interaction of two or more variables. In this project a study is conducted to determine
the level of significance in portfolio mean returns constructed through fundamental
analysis and Sharpe single index model.
• Type of Data:
Data required for this study was secondary data which was collected from various
secondary sources likeUnicon, , Ministry of Finance,NSE India,Economic Times,
Moneycontrol, MSN Money etc.
• Method of Sampling:
The sampling technique followed for the study is non-probabilistic judgmental
sampling. The samples were collected based on certain criteria which suited the
research objective
• Sample Size:
The sample consists of 15 companies of the different industries selected on the basis
of the research objective
• Techniques of Analysis:
The Price to Earnings of companies which are lesser than the Industrial Price to
Earnings are selected , then portfolio is constructed using these stocks. This is
followed by selecting stocks to construct an optimum portfolio using past share price
data through the Sharpe's optimization model. The return and risk aspects were then
compared between the two portfolios.Then the significance between the return of
two portfolios constructed is determined. The following test is used to check the
hypothesis.

UNICON Investment Solutions Page 31
Test for equality /difference of mean portfolio returns
Ho : There is no significant difference between the returns of the two
Portfolios.
H1 : There is significant difference between the returns of the two portfolios.
The test statistics is
Where
Degrees of Freedom = (n1+ n2 – 2)
the means of the two samples
S12, S2
2the variances of the two samples
n1, n2 the sample sizes of the two samples
Compare the calculated t-value with degrees of freedom, to the critical t-value from
the t distribution table at the chosen confidence level and decide whether to accept or
reject the null hypothesis
Reject Null hypothesis when calculated t-value is > critical t-value
UNICON Investment Solutions Page 32
FUDAMENTAL ANALYSIS
ECONOMIC ANALYSIS
A. Gross Domestic Product (GDP) India's economy grew at its slowest pace, as rising interest rates crimped the consumption and
investment demand in economy. The slower performance in mining and quarrying,
manufacturing and financing, insurance, real estate & business services led to deceleration in
the GDP growth to7.8% from 8.3% in Q3FY11 & 9.4% in Q4FY10.
For the fiscal year 2011, India's economy has grown by 8.5% in FY11, just below the
government's 8.6% estimate, and up from 8% a year earlier.Evident from lower industrial
production numbers the manufacturing sector grew by 5.5%, compared with 15.2% in
Q4FY10 & 6% in Q3FY11. Also mining output decelerated by 1.7%, compared with 8.9% in
Q4FY10 & 7% in Q3FY11. Financing, insurance, real estate and business service grew 9%
versus 6.3% in Q4FY10, however, on sequential basis fell from 11%, also Construction grew
by 8.2% versus 9.2% in Q4FY10. The farm sector in Q4FY11 grew by 7.5% from 1.1% in
Q4FY10; however, it declined from 10% on sequential basis. Agriculture is expected to
perform well for the second straight year after the government forecast a normal monsoon in
2011. Agriculture, forestry and fishing sector in FY11 has shown a growth rate of 7%.
The Gross National Income (GNI) is estimated to have risen by 8.3% during FY11, in
comparison to the growth rate of 7.9% in FY10. The per capita net national income during
FY11 is estimated at 6.5% during 2010-11 as against 6.1% during FY10.
On the expenditure side in FY11, the private and government’s final consumption growth
marginally declined to 58.3% and 11.2% from 58.5% and 11.6% in FY10. Investment
activities in the country improved in FY11 as the gross fixed capital formation expanded by
32% same as in FY10.
Tighter monetary policy (due to higher inflationary pressures) has started to affect the
consumer demand in the economy. Going forward with a rise in crude oil & global
UNICON Investment Solutions Page 33
commodity prices inflation is likely to remain at elevated levels. Since March 2010 the
Reserve Bank of India has raised its policy rate by a total of 250 basis points as part of battle
against stubbornly high inflation and expected to continue this policy action.
For FY12, the industrial production is likely to remain volatile on back of rising input costs,
slower demand, rising interest rates. However, it is expected the agriculture & service sector
would continue to steer the Indian economy.
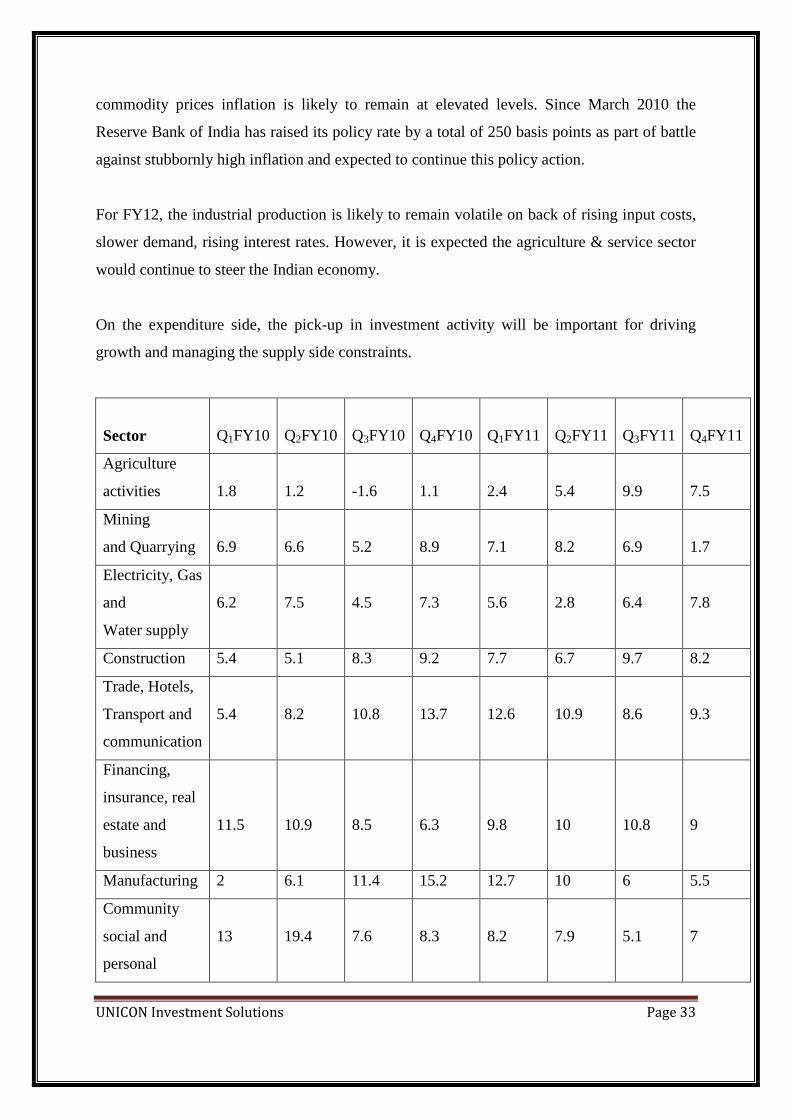
On the expenditure side, the pick-up in investment activity will be important for driving
growth and managing the supply side constraints.
Sector
Q1FY10
Q2FY10
Q3FY10
Q4FY10
Q1FY11
Q2FY11
Q3FY11
Q4FY11
Agriculture
activities
1.8
1.2
-1.6
1.1
2.4
5.4
9.9
7.5
Mining
and Quarrying
6.9
6.6
5.2
8.9
7.1
8.2
6.9
1.7
Electricity, Gas
and
Water supply
6.2
7.5
4.5
7.3
5.6
2.8
6.4
7.8
Construction 5.4 5.1 8.3 9.2 7.7 6.7 9.7 8.2
Trade, Hotels,
Transport and
communication
5.4
8.2
10.8
13.7
12.6
10.9
8.6
9.3
Financing,
insurance, real
estate and
business
11.5
10.9
8.5
6.3
9.8
10
10.8
9
Manufacturing 2 6.1 11.4 15.2 12.7 10 6 5.5
Community
social and
personal
13
19.4
7.6
8.3
8.2
7.9
5.1
7
UNICON Investment Solutions Page 34
services
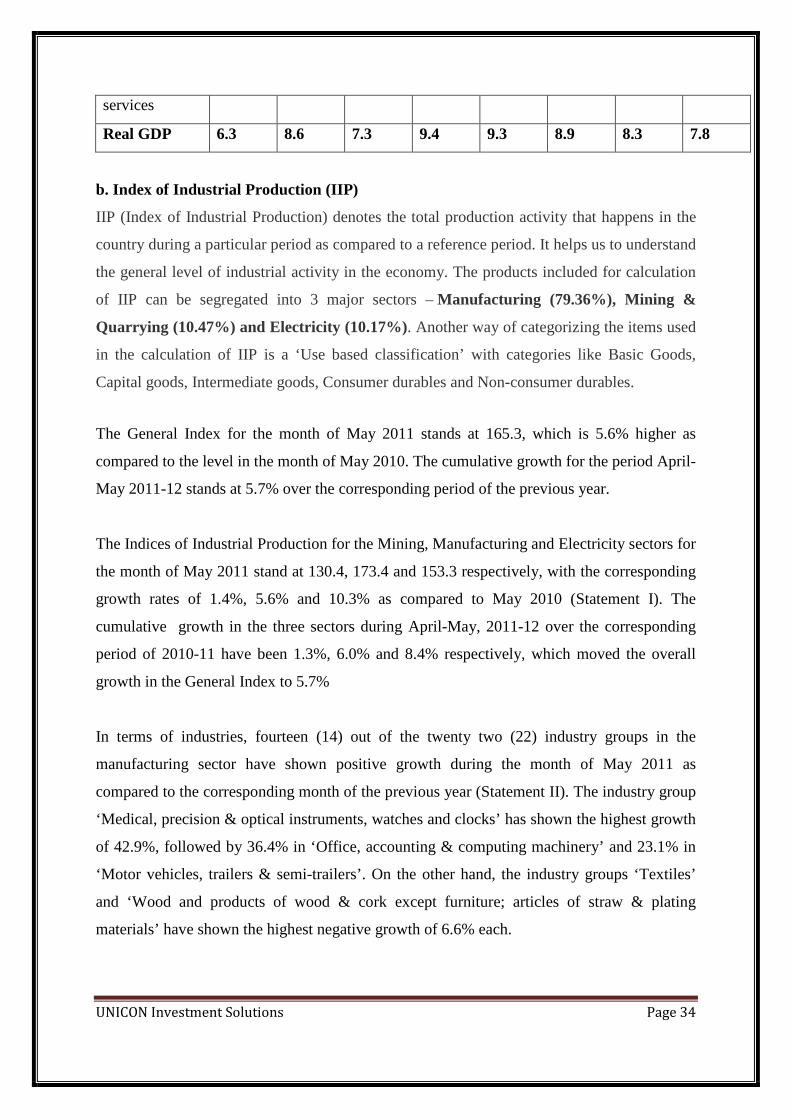
Real GDP 6.3 8.6 7.3 9.4 9.3 8.9 8.3 7.8
b. Index of Industrial Production (IIP)
IIP (Index of Industrial Production) denotes the total production activity that happens in the
country during a particular period as compared to a reference period. It helps us to understand
the general level of industrial activity in the economy. The products included for calculation
of IIP can be segregated into 3 major sectors – Manufacturing (79.36%), Mining &
Quarrying (10.47%) and Electricity (10.17%). Another way of categorizing the items used
in the calculation of IIP is a ‘Use based classification’ with categories like Basic Goods,
Capital goods, Intermediate goods, Consumer durables and Non-consumer durables.
The General Index for the month of May 2011 stands at 165.3, which is 5.6% higher as
compared to the level in the month of May 2010. The cumulative growth for the period April-
May 2011-12 stands at 5.7% over the corresponding period of the previous year.
The Indices of Industrial Production for the Mining, Manufacturing and Electricity sectors for
the month of May 2011 stand at 130.4, 173.4 and 153.3 respectively, with the corresponding
growth rates of 1.4%, 5.6% and 10.3% as compared to May 2010 (Statement I). The
cumulative growth in the three sectors during April-May, 2011-12 over the corresponding
period of 2010-11 have been 1.3%, 6.0% and 8.4% respectively, which moved the overall
growth in the General Index to 5.7%
In terms of industries, fourteen (14) out of the twenty two (22) industry groups in the
manufacturing sector have shown positive growth during the month of May 2011 as
compared to the corresponding month of the previous year (Statement II). The industry group
‘Medical, precision & optical instruments, watches and clocks’ has shown the highest growth
of 42.9%, followed by 36.4% in ‘Office, accounting & computing machinery’ and 23.1% in
‘Motor vehicles, trailers & semi-trailers’. On the other hand, the industry groups ‘Textiles’
and ‘Wood and products of wood & cork except furniture; articles of straw & plating
materials’ have shown the highest negative growth of 6.6% each.
UNICON Investment Solutions Page 35
As per Use-based classification, the growth rates in May 2011 over May 2010 are 7.2% in
Basic goods, 5.9% in Capital goods and 0.9% inIntermediate goods (Statement III). The
Consumer durables and Consumer non-durables have recorded growth of 5.2% and 5.6%
respectively, with the overall growth in Consumer goods being 5.4%.
c. Inflation
The word “inflation” refers to a general rise in prices measured against a standard level of
purchasing power. Previously the term was used to refer to an increase in the money supply,
which is now referred to as expansionary monetary policy or monetary inflation. Inflation is
measured by comparing two sets of goods at two points in time, and computing the increase
in cost not reflected by an increase in quality.
The overall inflation was 9.06 per cent in May, up from 8.66 per cent in April while food
inflation rose to a one-month high of 8.55 per cent for the week ended May 14. However it is
expected that inflation will come down to 6.5 per cent by March 2012.
d. Foreign Exchange Rate
In fiscal 2009-10, rupee depreciated against major international currencies except pound
sterling. The annual average exchange rate of 45.99 per US dollar in 2008-09 depreciated
by 3.0 per cent to ` 47.42 per US dollar in 2009-10.
In fiscal 2010-11 between April and January 2011, the monthly average exchange rate of
rupee (average of buying and selling by Foreign Exchange Dealer Association of India
(FEDAI)) depreciated by 2.0 per cent against US dollar from ` 44.50 per US dollar in April
2010 to ` 45.39 per US dollar in January 2011. Similarly,depreciated by 4.6 per cent
against pound sterling, 1.4 per cent against euro and by 13.3 per cent against Japanese yen
during the same period.
UNICON Investment Solutions Page 36
e. Export Import
India’s exports have registered a growth of 56.9% during May 2011, at US $ 25.9 billion.
During the period April-May 2011, exports have reached a level of US $ 49.8 billion at a
growth of 45.3% while the imports were US $ 73.7 billion with a growth of 33.3% and a
trade deficit of US $ 23.9 billion, during the same period.
During April-May 2011, the following sectors have done well viz., engineering, 115% (US $
14.7 billion); Gems & Jewellery, 23% (5.7 billion US $); petroleum & oil products, 64% (US
$ 8.8 billion); cotton yarn & made-ups, 10.4% (US $ 1.04 billion); electronics, 80% (US $
1.83 billion) and Marine products, 15.8% (0.4 billion).
As regards imports during April-May 2011, the growth estimates on the following sectors
are: POL, 12.9% (US $ 20.3 billion); pearls & precious stones, 24.6% (US $ 5.2 billion); gold
& silver, 222% (US $ 13.5 billion); Iron & steel, -13% (US $ 1.8 billion) and machinery,
46.7% (US $ 5.9 billion) .
f. Fiscal deficit
Fiscal deficit for the year 2010-2011 is 5.6 per cent and it estimated that the Fiscal deficit for
the year 2011-2012 to be 4.6 per cent of GDP. India's fiscal deficit from April to May was
1.31 trillion rupees ($29.2 billion), or 31.7 percent of the full-year target
India's fiscal deficit had ballooned to 6.3 per cent of the GDP in 2009-10 in view of stimulus
spending worth billions of dollars to combat global financial meltdown.
g. Balance of Payments
For fiscal 2010-11, though there is marginal deterioration in the BoP situation vis-à-vis
2009- 10, reflected in higher trade deficit and current account deficit, there was higher
capital flows.
The merchandise exports on a BoP basis posted an increase of 33.8 per cent to US$ 110.5
billion in H1 (April-September 2010) of 2010-11 as against a negative growth of 25.7 per
cent in the corresponding period of the previous year. Similarly, import also increased by
28.3 per cent to US$ 177.5 billion during April-September 2010 as against a decrease of
UNICON Investment Solutions Page 37
21.1 per cent in the corresponding period of the previous year. The trade deficit was higher
at US$ 66.9 billion during H1 of 2010-11 as compared with US$ 55.9 billion in H1 of 2009-
10. This was mainly due to significant increase in imports which was in line with robust
domestic economic performance in first half of 2010-11.
The net invisibles surplus (invisibles receipts minus invisibles payments) stood lower at
US$ 39.1 billion during April-September of 2010 as compared to US$ 42.5 billion during
April-September 2009. Consequently the current account deficit increased to US$ 27.9
billion in H1 of 2010-11, as compared to US$ 13.3 billion during the corresponding period
of 2009-10. This was mainly attributed to higher trade deficit combined with lower net
invisible surplus.
Net capital flows at US$ 36.7 billion in April-September 2010 remained higher as compared
with US$ 23.0 billion in April-September 2009. Under net capital flows, all the
components except FDI and bank capital, showed improvement during April-September
2010 from their level in the corresponding period of the previous year. Net FDI into India
moderated to US$ 5.3 billion during April-September 2010 as against the US$ 12.3 billion
in April-September 2009.
h. FII
Portfolio investment mainly comprising foreign institutional investors (FIIs) investments
and American Depository Receipts (ADRs)/ Global Depository Receipts (GDRs), however,
witnessed large net inflows of US$ 23.8 billion in H1 of 2010-11 vis-a-vis US$ 17.9 billion
in H1 of 2009-10. The surge in portfolio investments especially FIIs investment could be
attributed to relatively sound economic fundamentals and increased international liquidity as
number of advanced economies has followed easy monetary policies
UNICON Investment Solutions Page 38
The Economic Scenario
The UNCTAD World Investment Report (WIR) 2010, in its analysis of the global trends and
sustained growth of Foreign Direct Investment (FDI) inflows, has reported India to be the
second most attractive location for FDI for 2010-2012.
Moreover, India attracted FDI equity inflows of US$ 1,274 million in February 2011. The
cumulative amount of FDI equity inflows from April 2000 to February 2011 stood at US$
193.7 billion, according to the data released by the Department of Industrial Policy and
Promotion (DIPP).
The services sector comprising financial and non-financial services attracted 21 per cent of
the total FDI equity inflow into India worth US$ 3,274 million during April-February 2011,
while telecommunications (including radio paging, cellular mobile and basic telephone
services) attracted the second largest amount of FDI worth US$ 1,410 million during the
same period. Automobile industry was the third highest sector attracting FDI worth US$
1,320 million followed by Housing and Real Estate industry which garnered FDI worth US$
1,109 million during the financial year April-February 2011.
Foreign institutional investors (FIIs)have purchased stocks and debt securities worthUS$ 222
billion in the financial year ending March 31, 2011, as per the data available with the
Securities and Exchange Board of India (SEBI).
Growth Potential Story
• The data centre services market in the country is estimated to grow at a compound
annual growth rate (CAGR) of 22.7 per cent and is estimated to touch close to US$
2.2 billion by the end of 2011, according to research firm IDC India’s report.
• The Q211 BMI India Retail Report forecasts that total retail sales will grow from US$
395.96 billion in 2011 to US$ 785.12 billion by 2015.
• According to a McKinsey Global Institute (MGI) study titled 'Bird of Gold': The Rise
of India's Consumer Market’, the total consumption in India is likely to quadruple
making India the fifth largest consumer market by 2025. Urban India will account for

UNICON Investment Solutions Page 39
nearly 68 per cent of consumption growth while rural consumption will grow by 32
per cent by 2025.
• India ranks first in the Nielsen Global Consumer Confidence survey released in
January 2011. “India is one of the fastest growing markets in the world and the
current consumer belief that recession would soon be a thing of the past has filled
Indians with confidence,” said PiyushMathur, Managing Director, South Asia, The
Nielsen Co. With 131 index points, India ranked number one in the recent round of
the survey, followed by Philippines (120) and Norway (119).
UNICON Investment Solutions Page 40
INDUSTRY ANALYSIS:
a. Gems and Jewellery sector
India possesses world’s most competitive gems and jewellery market due to its low cost of
production and availability of skilled labour and low cost manpower, along with strong
government support in the form of incentives and establishment of SEZs, has been the major
driver for the Indian gems and jewellery market. The market also plays a vital role in the
Indian economy as it is a leading foreign exchange earner and accounts for 19% of India’s
total exports. The Indian gems and jewellery sector is expected to grow at a CAGR of around
14%. At present, the Indian gems and jewellery market is dominated by the unorganized
sector; however, the trend is set to change in near future with the branded jewellery market
growing at an expected CAGR of more than 41% in the coming four years. India remains
world’s largest gold consumer and this share is expected to grow further.
One of India’s leading foreign exchange earning sectors over the year has witnessed a
considerable growth in the volume of exports from export figures of US$ 29358.49 million in
the FY 2009-2010, to US$ 43139.24 million in FY 2010-2011, thus indicating a net increase
of 46.89% in the total Gem & Jewellery exports. The performance of this industry is critical
as it contributes 16.67% to India’s total merchandise exports.
The growth in the sector was primarily driven by Cut & Polished Diamondswhich registered
an increase of 54.91% in FY '11. The exports grew from US$ 18243.92 million in 2009-10 to
US$ 28251.92 million in 2010-2011. Cut & Polished Diamonds accounted for 65.49% of the
total exports baskets with Gold Jewellery comprising of 29.86% while Colour Gemstones and
other accounted for 4.69%.
Gold Jewellery exports have also been on a rise with the figures accounting for a 33.27 %
increase over FY’11. From US$ 9678.67million in 2009-2010 to US$ 12885.59 million in
2010-2011, the increase is apparent. Coloured Gemstone exports also increased by 9.68% in
dollar terms with sector witnessing a rise from US$ 286.78 million in 2009-2010 to US$
314.54 millionin 2010-2011
FY10- FY’11 saw UAE emerge as the largest exporting destination with 47% of exports to
the market, followed by Hong Kong with 22% and USA with 11% of exports.

UNICON Investment Solutions Page 41
b. Oil and Gas
A significant catalyst in fuelling the growth of the Indian economy, the oil and gas sector
presents a powerful scope for investors in the years to come. Of late, the government has
followed deregulation path to attract foreign participants. The New Exploration Licensing
Policy (NELP), conceived to address the increasing demand supply gap of energy in India,
has proved to be successful in attracting the interest of both domestic private sector players
and some foreign players
Production and Consumption
According to the provisional production data released by the Ministry of Petroleum and
Natural Gas, dated June 2011,
• Crude Oil production for April 2011 was 3.186 million metric tonne (MMT), as
compared to the 2.871 MMT in April 2010.
• Natural Gas production during April-January 201 1 was 4096.3 million cubic metres
(MCM)
• During April 2011, 14.006 MMT of crude oil was refined, compared to 13.136 MMT
refined in April 2010.
ONGC Videsh Limited (OVL), the wholly-owned subsidiary of Oil and Natural Gas
Corporation Ltd. (ONGC), has registered a production of 9.433 million tonnes of oil
equivalents (MMTOE) in 2010-11, surpassing the earlier peak production of 8.870 MMTOE
of oil and oil equivalent gas in 2009-10.
India will account for 12.4 per cent of Asia Pacific regional oil demand by 2015, while
providing 11.2 per cent of supply, according to the BMI India Oil & Gas Report for third-
quarter 2011. Regional oil production was around 7.6mn barrels per day (b/d) in 2001 and
averaged an estimated 8.0mn b/d in 2010. It is set to increase to 8.2mn b/d by 2015.
Similarly, Regional oil use of 20.6mn b/d in 2001 reached an estimated 26.4mn b/d in 2010
and is forecast to rise to around 29.6mn b/d by 2015.India is the world’s fifth biggest energy
consumer and the need is continuously growing.
UNICON Investment Solutions Page 42
Petroleum
Demand for petroleum products rose by 4.4 per cent (year-on-year) to 144.35 million tonnes
(MT) during the financial year 2010-11, according to the latest figures released by the
Petroleum Planning and Analysis Cell (PPAC).
Currently, India's total demand for the petroleum products is estimated at around 140 million
tonnes per annum (MTPA). This creates a spare capacity of 48 MTPA at the refineries. The
spare capacity will increase to around 90 MTPA. The domestic demand is expected to be
around 142- 143 million tonnes per annum.
Gas
The proportion of natural gas in the total energy mix has increased to 10 per cent in 2009
from 4 per cent in 1999. The same is expected to increase to 20 per cent in 2025, playing a
vital role in the country’s total energy-mix
It is expected that gas production would rise from an estimated 45billion cubic meters (BCM)
in 2010 to a possible 95 BCM by 2019.
In a bid to develop its gas field in the KG Basin and produce up to 30 MCM a day in five
years, ONGC has earmarked US$ 7.7 billion for investment. The company plans to drill eight
additional wells in the block to maximize output from the deep-sea field in the Bay of Bengal
and has sought approval for the plan from the directorate general of hydrocarbons and the
petroleum ministry.
Oil & Gas – Key Developments and Investments
• Gujarat State Petroleum Corporation (GSPC) has awarded Larson & Turbo (L&T) an
offshore process platform contract KG Basin. Valued at US$ 317.5 million, the
offshore process cum living quarter platform project was awarded under international
competitive bidding by GSPC to meet its production target of hydrocarbon by July,
2013.
• GSPC and Russian petroleum giant, Gazprom Global LNG (GGLNG) have entered
into an agreement for supply of up to 2.5 MTPA of liquefied natural gas (LNG).
UNICON Investment Solutions Page 43
• The newly approved Petroleum, Chemicals and Petrochemicals Investment Region for
Tamil Nadu, set up at Cuddalore and Nagapattinam, has received government support
of US$ 1.14 billion.
• Quippo Oil & Gas Infrastructure Limited (QOGIL), promoted by Srei Infrastructure,
intends to start oil and gas exploration at Cambay Basin in Gujarat in 2011-12.
QOGIL was awarded an oil block, (NELP VII Round) for exploration and production
in Cambay basin in 2009
Oil & Gas - Government Policies
• NELP, implemented by government, permits 100 per cent FDI for small and medium
sized oil fields via competitive bidding.
• Public-private partnerships as well as only private investments can foray into the
refining sector. In case of an Indian private company, 100 per cent FDI is allowed.
• 100 per cent FDI is allowed for petroleum products and pipeline sector as well as
natural gas/LNG pipeline, for infrastructure related to marketing of petroleum
products, market study of formulation and investment financing.
• Minimum 26 per cent equity is covered over five years, in case of trading and
marketing
• The Karnataka Government has announced plans to set up a US$ 822 million, 700-
MW dedicated LNG power plant for its capital. The power plant’s work is expected to
be entrusted to the state-owned Karnataka Power Corporation — the nodal agency for
power generation.
Oil & Gas - Road Ahead
Entailing an investment of US$ 13.33-14.44 billion, India's petroleum refining capacities are
expected to rise to 240 MTPA by March 2012 from the current 188 MTPA. The capacity
addition would facilitate a boost in country's exports of petroleum products, S Sundereshan,
secretary, ministry of petroleum & natural gas, stated.
UNICON Investment Solutions Page 44
Following are the major projects that are likely to get commissioned within 2011-12:
• The Guru Gobind Singh refinery project will be commissioned by HPCL-Mittal
Energy by September 2011. The project on completion is expected to add a capacity
of 90 million tonnes.
• It is expected that Essar Oil will complete the phase-I project of its Vadinar Oil
refinery by July 2011. This will raise the existing capacity of 105 million tonnes per
annum to 180 million tonnes per annum. The company has also announced its plans to
add another 20 million tonnes per annum in phase-II and take the total capacity to 200
million tonnes per annum by September 2012.
• IOCL is expected to commission its green field Paradip refinery by mid-2012. The
project will add a refinery capacity of 150 lakh tonnes per annum.
c. Steel
Consumption of steel in the construction sector, industrial applications, and transport sector
has been on the rise and special steel usage in engineering industries such as power
generation, petrochemicals and fertiliser industry is also growing.
India has retained its position as the 5th largest producer in 2010 and recorded a growth of
11.3 per cent as compared to 2009. India has also emerged as the largest sponge iron/direct
reduced iron (DRI) producing country in the world in 2010
India is expected to become the second largest producer of steel in the world by 2015-16, on
account of growing steel demand, rich resources base of iron ore, skilled manpower and vast
experience of steel making and the huge capacity expansion planned and being executed in
the steel sector.
India has recorded a growth of over 8.6 per cent, producing 6.35 MT of steel in March 2011
as against 5.85 MT in the corresponding month in 2010, according to World Steel
Association (WSA).
Steel exports has increased by 17.3 per cent as it reached an estimated 2.46 MT, while steel
imports were at an estimated 5.36 MT, a growth of 2.8 per cent in 2010.

UNICON Investment Solutions Page 45
Crude steel production was registered at 51.57 MT during April-Dec 2010 in the country as
per Joint Plant Committee (JPC). The production is expected to be nearly 110 MT by 2012-
13.
Crude steel production grew at a compound annual growth rate (CAGR) of 8.4 per cent
during the five years, 2005-06 to 2009-10. The crude steel performance accounted for 31 per
cent of the total crude steel production in the country during 2009-10.
Steel Authority of India (SAIL) Ltd has planned to enhance its hot metal production capacity
from the level of 13.82 million tonnes per annum (MTPA) to 23.46 MTPA under its current
phase of expansion and modernisation which is expected to be completed by financial year
2012-13.
NMDC Ltd plans to increase the production of iron ore from the present level of about 24
MT to 40 MT by 2014-15. Besides, setting up a 3 MTPA Integrated Steel Plant at Nagarnar
in Chhattisgarh.
Government Initiatives
The current policy regime allows 100 per cent foreign domestic investment (FDI) in steel
sector, as per Minister of State for Steel. Some multinational steel companies like POSCO
and Arcelor Mittal have signed MoU with respective to State Governments to set up steel
production units in the country. The total proposed capacity under FDI is approximately 45
MT.
Some of the initiatives undertaken by the Indian Government in the Eleventh Five Year Plan
(2007-12) to promote the steel sector include:
• The Planning Commission has approved a total outlay of US$ 9.5 billion for the
development and promotion of the iron and steel sector.
• The scheme for the promotion of research and development in the iron and steel
sector has been approved with a budgetary provision of US$ 24.6 million to initiate
and implement the provisions of the scheme.
• National Steel Policy 2005 is under review and the process for drafting a 'National
Steel Vision' has since been initiated.
UNICON Investment Solutions Page 46
d. Engineering
The engineering sector is the largest segment of the overall Indian industrial sector. The
engineering industry accounts for 12 per cent of India's GDP.
India enjoys a cost-advantage in casting and forging, as manufacturing costs in India are 25-
30 per cent lower than western countries.
Engineering Services Outsourcing (ESO)
The Engineering Services Outsourcing (ESO) sector is another sector with great potential.
ESO includes product design, research and development and other technical services across
sectors like automotive, aerospace, hi-tech/telecom, utilities and construction/industrial
machinery.
According to a study by NASSCOM and Booz Allen Hamilton (a strategy and technology
consulting firm), the global engineering services market in 2020 is estimated to touch US$
1,100 billion, of which the outsourced component is estimated to reach around US$ 200
billion. As per the report, India may capture around 25 per cent of the global ESO pie, worth
around US$ 40 billion by 2020. At present the ESO market is around US$ 15 billion, with
India enjoying 12 per cent share. The engineering services landscape in India has evolved
significantly over the last four years, reflecting maturity, diversification and enhanced
verticalisation to partner with global corporations, as per the study.
Chennai is fast emerging a hub in engineering design, R&D and product development for a
number of global players. Companies across sectors- automobile, telecom, infrastructure,
wind energy have set up their centres in the city encouraged by the good eco-system, talent
pool and growing number of original equipment manufacturers (OEMs).
UNICON Investment Solutions Page 47
Government Initiatives
Indian service providers have invested considerably in increasing their global footprint to
provide services to geographically distributed customers. They have established sales teams
in North America and Europe and delivery centres in China and Japan for closer interaction
with customers in the former and to co-ordinate efforts with existing manufacturing facilities
in the latter. Within India, companies have begun to move to tier-2 cities to take advantage of
lower costs of operations and to access a large graduating pool of engineers.
The miscellaneous mechanical and engineering industries sector-wise foreign direct
investments (FDI) inflows from April 2000 to January 2010 was calculated at US$ 891.49
million, as per the Department of Industrial Policy and Promotion (DIPP).
The Government has announced a series of policy initiatives and programmes - a special
incentive package for investments in manufacturing, setting up a National Electronics
Mission and an Electronics Development Fund - in the field of information and
communication technology (ICT).
e. Banking
The banking system remains, as always, the most dominant segment of the financial sector.
Indian banks continue to build on their strengths under the regulator's watchful eye and
hence, have emerged stronger.
Nationalised banks, as a group, accounted for 51.2 per cent of the aggregate deposits, while
State Bank of India (SBI) and its associates accounted for 22.5 per cent, according to Reserve
Bank of India's (RBI) 'Quarterly Statistics on Deposits and Credit of Scheduled Commercial
Banks. Foreign banks and Regional Rural banks in aggregate deposits was 13.5 per cent, 4.5
per cent, 5.2 per cent and 3.1 per cent respectively.
With respect to gross bank credit also, nationalised banks hold the highest share of 50.9 per
cent in the total bank credit, with SBI and its associates at 23.1 per cent and New Private
sector banks at 13.7 per cent. Foreign banks, Old private sector banks and Regional Rural
banks held relatively lower shares in the total bank credit with 5.2 per cent, 4.5 per cent and
2.5 per cent respectively.
UNICON Investment Solutions Page 48
Bank loans registered a growth of 21.38 per cent in 2010-11, while deposit growth stood at
15.84 per cent, according to data released by RBI. Analysts and it is expected that a growth
rate of 18 per cent in deposits and 20 per cent in credit should be sustainable for banks in
2011-12.
India's foreign exchange reserves stood at US$ 308.2 billion as on April 8, 2011, according to
the data in the weekly statistical supplement released by RBI.
Indians who live and work abroad have remitted US$ 55 billion in 2010 as compared to US$
49.6 billion in 2009 and have topped the world list in sending money back home, according
to World Bank's Migration and Remittances Factbook 2011
Major Developments
• Hindustan Unilever Limited (HUL) has tied up with State Bank of India (SBI) to start
a pilot project to promote financial inclusion in rural markets in Maharashtra and
Karnataka, through HUL's 'Shakti Ammas', a network of self-help groups to open
bank accounts for people.
Government Initiatives
The government would provide an additional US$ 1.35 billion capital to state-owned banks in
financial year 2011-12 to help them maintain at least 8 per cent capital adequacy ratio in Tier-
I level
“To liberalise the portfolio investment route, it has been decided to permit Sebi-registered
mutual funds to accept subscriptions from foreign investors who meet the KYC (Know Your
Customer) requirements for equity schemes,” This would enable Indian mutual funds to have
a direct access to foreign investors and widen the class of foreign investors in the Indian
equity market.
UNICON Investment Solutions Page 49
COMPANY ANALYSIS
TITAN INDUSTRIES
Titan Industries is the fifth largest integrated watch manufacturer in the world. The success
story began in 1984 with a joint venture between the Tata Group and the Tamil Nadu
Industrial Development Corporation. Presenting Titan quartz watches that sported an
international look, Titan Industries transformed the Indian watch market. After Sonata, a
value brand of functionally styled watches at affordable prices, Titan Industries reached out
to the youth segment with Fastrack, its third brand, trendy and chic. The company has sold
100 million watches world over and manufactures 12 million watches every year.
Titan Industries launched Tanishq, India’s most trusted and fastest growing jewellery brand.
Gold Plus, the later addition, focuses on the preferences of semi-urban and rural India.
Completing the jewellery portfolio is Zoya, the latest retail chain in the luxury segment.
Titan Industries has also made its foray into eyewear, launching Fastrack eyewear and
sunglasses, as well as prescription eyewear. The organization has leveraged its manufacturing
competencies and branched into precision engineering products and machine building.
With over 665 retail stores across a carpet area of over 8,10,072 sq. ft. Titan Industries has
India’s largest retail network. The company has over 311 exclusive ‘World of Titan'
showrooms and over 650 after-sales-service centers. Titan Industries is also the largest
jewellery retailer in India with over 120 Tanishq boutiques and Zoya stores, over 29 Gold
Plus stores and over 150 Titan Eye+ stores. The company has two exclusive design studios
for watches and jewellery
Backed by 4,934 employees, two exclusive design studios for watches and jewellery, 11
manufacturing units, and innumerable admirers world over, Titan Industries continues to
grow and sets new standards for innovation and quality. The organization is all geared to
repeat the Titan and Tanishq success story with each new offering.
UNICON Investment Solutions Page 50
Observations:
• The competitors include Titan include Timex industries Ltd. Titan Industries Market
capital is 20574.44(Rs. cr.) with a sales turnover of 6521.64(Rs. cr.) with a net profit
of 450.46(Rs, cr.). Market capital of Titan is more than its competitors, Timex Market
capital is 433.58(Rs. cr.) and a sales turnover of 173.19(Rs. cr.) with a net profit of
14.0(Rs. cr.)
• The Titan industries is having Price to Earnings ratio of 44.94 when compared to its
competitors Price to Earnings ratio of Timex industries is 30.90. However Titan
industries is performing equal to Industrial Price to Earnings ratio of 44.02
• It is observed that Earnings per share of Titan Industries is 4.85 which higher than the
Timex Industries Ltd. EPS of 1.39
• Titan Industries Limited aims to clock sales of over INR8200 crore (INR82 billion) in
fiscal 2012. According to Reuters Estimates, analysts on an average are expecting the
Company to report revenues of INR81 billion for fiscal 2012. • Titan Industries Limited announced that the Board of Directors of the Company at its
meeting held on April 29, 2011, inter alia, have recommended a dividend of 250%
viz., INR25 per share
UNICON Investment Solutions Page 51
INDRAPRASTHA GAS LIMITED
Incorporated in 1998, IGL took over Delhi city gas distribution project in 1999 from GAIL
(India) Limited (Formerly Gas Authority of India Limited).
The project was started to lay the network for the distribution of natural gas in the National
Capital Territory of Delhi to consumers in the domestic, transport, and commercial sectors.
With the backing of strong promoters – GAIL (India) Ltd. and Bharat Petroleum Corporation
Ltd. (BPCL) – IGL plans to provide natural gas in the entire capital region.
The two main business objectives of the company are -
• To provide safe, convenient and reliable natural gas supply to its customers in the
domestic and commercial sectors. • To provide a cleaner, environment-friendly alternative as auto fuel to Delhi’s
residents. This will considerably bring down the alarmingly high levels of pollution.
The transport sector uses natural gas as Compressed Natural Gas (CNG), the domestic and
commercial sectors use it as Piped Natural Gas (PNG) and re-gassified liquid natural gas (R-
LNG) is being supplied to industrial establishments.
IGL continues to augment its infrastructure so as to meet the increasing demand of CNG
arising out of growing number of CNG vehicles in Delhi. The growth drivers for increase in
demand of CNG are - car manufacturers coming up with CNG variants and Delhi
Government’s directive making it mandatory for all LCVs operating in Delhi to run on CNG.
The company is in the process of enhancing its compression capacity by adding new stations.
On the PNG front, IGL has planned to expand its business activities in Delhi and its
neighbouring towns like Noida, Greater Noida and Ghaziabad. Our customers will now be
benefited with supply of PNG for non-cooking applications like Geysers also. IGL is also
working towards expanding its PNG network to cover all charge areas of Delhi by 2012.
Industrial and commercial segments would be the focus areas for the organization in the
future.
UNICON Investment Solutions Page 52
Observations:
• Indraprastha Gas Limited(IGL) is having a Market capital of 5481.71(Rs. Cr.) with a
sales turnover of 1750.46(Rs. Cr.), Net profit of 259.77(Rs. Cr.)
• The competitors of Indraprastha Gas Limited are Gujarat Gas Limited, PetronetLng
• Percentage of Net profit to sales is comparatively higher for Indraprastha Gas
Llimited at 14.84 per cent which is more than its competitors
• IGL is having a Price to Earnings ratio of 19.89 is performing near with Industrial
Price to Earnings ratio of 21.24
• Earnings per share of IGL is 18.55 and the Net worth of the company is 1003.86 (Rs.
Cr.)
• It is observed that Indraprastha Gas Limited has been authorized to lay, build operate
or expand City Gas Distribution Network in Geographical area of Ghaziabad.
• IGL has guided for a volume growth of 20% to 25% for FY12 along with a capex of
INR 20 bn over the next three years. IGL plans to spend this amount to expand the
infrastructure for compressed natural gas (CNG) and piped natural gas (PNG).
UNICON Investment Solutions Page 53
WELSPUN CORP Ltd.
Welspun Corp Ltd. (WCL), the flagship company of Welspun Group, is today probably the
Largest Large Diameter Line Pipe Company in the World. It is ranked as the 2nd Largest
(Large Diameter) Pipe Producer by Financial Times UK and awarded 'The ‘Emerging
Company of the Year' by Economic Times, 2008, respectively. With a strong culture of
‘Engineering Excellence' WCL takes pride in manufacturing and supplying some of the most
critical pipelines in the World from its India and U.S. plants. With an installed line pipe
capacity of nearly 2.0 MTPA.
To its credit, the company has supplied pipes for World’s deepest pipeline project
(Independence Trail', Gulf of Mexico), Highest Pipeline project (Peru LNG), to the longest
pipeline (Canada to US) and the heaviest Pipeline (Persian Gulf). WCL’s has an esteemed
client list which includes Transcanada, Enterprise, Kinder Morgan, Texas Gas, Hunt Oil,
Saudi Aramco, Elpaso, Exxon Mobil and Qatar Petro DOW to name a few.
Welspun Corp Limited (Welspun), formerly Welspun Gujarat Stahl Rohren Ltd. is an India-
based company. The Company, together with its subsidiaries are engaged in the business of
production and coating of high grade submerged arc welded pipes, hot rolled steel plates and
coils, infrastructure, oil and gas exploration, and energy and power generation. The
Company’s subsidiaries include Welspun Pipes Limited, Welspun Natural Resources Private
Limited, Welspun Pipes Inc, WelspunTradings Limited and WelspunInfratech Limited. The
Company’s indirect subsidiaries include Welspun Tubular LLC, Welspun Global Trade LLC
and Welspun Plastics Private Limited. In April 2009, the Company announced the demerger
of its Plate-cum-Coil mill into a 100% subsidiary. On March 31, 2010, WelspunUrja India
Limited ceased to be the subsidiary of the Company
UNICON Investment Solutions Page 54
Observations:
• Welspuncorp has won plates, coating and other orders worth Rs 788 crore and pipe
orders worth INR1,182 crores (INR11.82 billion) (approx 155 KMT) largely from
international clients. Its current order book now stands at Rs 6,941 crore.
• Welspuncorp Market capital of Rs 3336.10 crore with a sales turnover of Rs 6269.44
crore, Net profit is Rs 364.45 crore
• Welspuncorp is having a price to earnings ratio of 9.28 performing near to Industrial
price to earnings ratio of 8.83
• Earnings per share of Welspun Corp Ltd is 17.81 and is having its competition from
Jindal saw
• The beta value of Welspuncorp is 1.462 and hence his having more sensitivity to
market

UNICON Investment Solutions Page 55
THERMAX
Thermax Ltd. is an INR 4,935 crore (USD 1.11 Billion) company, providing a range of
engineering solutions to the energy and environment sectors.
Headquartered in Pune, India and operate globally through 19 International offices, 12 Sales
& Service offices and 4 Manufacturing facilities - three of which are in India and one in
China. Its presence spans 75 countries across Asia Pacific, Africa and the Middle East, CIS
countries, Europe, USA and South America.
Solutions Suite – Innovative and Eco-friendly
• Heating equipment - using a variety of fuels, including biomass
• Absorption chillers - fired by waste heat or steam
• Power and captive cogeneration plants
• Waste heat recovery units
• Waste water management systems – pre-treatment, waste water treatment and
chemical conditioning of water, sewage effluent treatment and recycling
• Air pollution control systems
• Performance improving chemicals
Product Range – Diverse and Efficient
From our experience of over three decades in the energy sector, we offer a range of boilers
and thermal oil heaters, energy chillers and customized products like exhaust gas boilers.
Thermax absorption chillers have found a niche in green energy systems in Europe and
Australia. We also help industries reduce energy costs by shifting to abundantly available,
alternate energy such as biomass.

UNICON Investment Solutions Page 56
Industry-specific Solutions – Clean and Green
Thermax provides industries with clean technologies that recover pollutants; thereby reducing
their hazardous impact on the environment. Today, many iron & steel, cement, fertilizer and
chemical industries reduce emissions using our air pollution control systems.
Industries in the US and Japan consistently use our hi-grade ion exchange resins for
specialised applications.
Project Management Capabilities
Our project management capabilities extend to setting up energy-environment projects for
customers in several markets. This is backed by a robust and innovative R&D setup,
involved in technology development and adaptation for various industrial applications.
Observations:
• It has received a INR403 crore (INR4.03 billion) order from a producer of viscose
staple fibre to construct and commission a turnkey captive power plant in Western
India. The Company will supply four multi fuel, 175 TPH Capacity CFBC
(circulating fluidised bed combustion) boilers for the 3x32 MW co-generation plant.
Scope of work for Thermax includes entire engineering, procurement, construction of
power plant, including civil works, piping and miscellaneous balance of plant on a
turnkey basis.
• Thermax with a Market Capital of Rs 6946.81 cr, Sales turnover of Rs 4883.23 cr. is
having competition from Engineers India which is having a market capital of Rs.
9434.22 cr. However Engineers India is having a low sales turnover compared to
Thermax.
• Price to Earnings ratio of Thermax is 18.46 and is performing equal to Industrial Price
to Earnings ratio of 18.52 with a beta of 0.803
UNICON Investment Solutions Page 57
GODREJ CONSUMER PRODUCTS
Godrej Consumer Products Limited (GCPL) is engaged in manufacturing toilet soaps and
other toiletries. The Company manufactures and markets toilet soaps, hair color, liquid
detergents and other toiletries. The Company exports its products to 31 countries, including
Jordan, Egypt, Sudan, United Arab Emirates (UAE), Bangladesh and Port of Spain. The
Company’s subsidiaries include Godrej Netherlands B.V., Inecto Manufacturing Limited,
Rapidol Pty. Limited, Godrej Global Mideast FZE and Kinky Group Pty. Limited. In June
2009, the Company completed the acquisition of the remaining 50% stake in Godrej SCA
Hygiene Ltd. In April 2010, the Company announced the acquisition of PT.
MegasariMakmur Group and its distribution company in Indonesia. In addition, in May 2010,
the Company acquired the remaining 51% stake in Godrej Sara Lee Limited. In March 2010,
the Company announced the acquisition of Tura in Nigeria. In July 2010, Godrej Consumer
Products Limited acquired Argencos, Argentina.
Observations:
• Godrej consumer products are having competition from Dabur India, Colgate. It is
having a Market Capital of Rs 14381.96 cr. with a sales turnover of Rs 2442.64 cr.
• Godrej consumer products with a Net Profit of 434.96 cr are having 17.80 per cent as
percentage of net profit to sales which is more than its competitors Dabur India and
Colgate.
• Godrej consumer products are having a Price to Earnings ratio of 31.97 which is low
compared to Industrial Price to Earnings ratio of 33.7 and is hence a good stock to
accumulate.
• Godrej Consumer Products Limited has entered into an agreement for the rights to
acquire 51% stake in Darling Group Holdings that operates in 14 countries across
sub-Saharan Africa. The Darling Group manufactures and distributes the full range of
hair extension products.
UNICON Investment Solutions Page 58
• Operating profit per share of Godrej consumer products is 14.10 which is higher than
that of Dabur India, but is lower than that of Colgate
BANK OF MAHARASHTRA
Bank of Maharashtra is a public sector bank in Maharashtra, which is engaged in providing
treasury, corporate/ wholesale banking, retail banking, and other banking operations. During
the fiscal year ended March 31, 2010, the Bank opened 33 new branches. As on 31.03.2010,
the total branch network comprised of 1453 branches spread over 22 states and two union
territories. The branch network includes specialized branches for foreign exchange,
government business, treasury and international banking, industrial finance, micro, small and
medium enterprises including smallscale industry, hi-tech agriculture, pension payment,
pension processing, retail credit and asset recovery. The Bank’s investment portfolio includes
maturity, available for sale and held for trading.
Observations:
• Bank's Rural Development Centres at Hadapsar and Bhigwan are undertaking vaious
developmental activities for the benefit of the famers vi. Lab to Land project, reuse /
rehabilitation of Saline Soil and advice on scientific use of inputs for optimum results.
• The Mahabank Agricultural Research and Rural Development Foundation
(MARDEF) is active in socio-economic development of villages by encouraging
farmers to take diversified activities like dairy, EMU farming, goat rearing, grape
cultivation, horticulture and scientific use of various inputs like fertilizers etc. The
foundation assists farmers, especially small and marginal farmers, in receiving timely
bank credit. • Competitors of Bank of Maharashtra include Indian Bank, Allahabad Bank. It has
Market Capital of Rs. 2668.69 cr. with a net profit of 330.39 cr. • Bank of Maharashtra is having a Price to Earnings ratio of 8.14 and is lower than the
Industrial Price to Earnings ratio of 9.36 and is performing well with the Industry.

UNICON Investment Solutions Page 59
• Bank of Maharashtra is having a Earnings to Price ratio of 6.86 with a beta value of
0.94, means it is performing equal toMarket • The Net worth of the company is Rs 3970.93 cr as of March 31,2011
ENGINEERS INDIA LIMITED
Engineers India Limited (EIL) was set up in 1965 to provide engineering and related
technical services for petroleum refineries and other industrial projects. EIL is working under
the administrative control of Minstry of Petroleum and Natural Gas , Government of India.
EIL has emerged as Asia’s leading design, engineering and turnkey contracting providing a
complete range of project services needed to conceptualize, plan, design, engineer and
construct projects to meet the specific requirements of its clients in the following fields:
• Petroleum Refining
• Petro chemicals
• Pipelines
• Offshore Oil and Gas
• Terminals and Storages
• Mining and Metallurgy
• Infrastructure
Engineers India Limited is an engineering consultancy company providing design,
engineering, procurement, construction and integrated project management services,
principally focused on the oil and gas and petrochemicals industries in India and
internationally. It also operates in a diverse set of other sectors, including non-ferrous mining
and metallurgy and infrastructure. The Company is also a primary provider of engineering
consultancy services for the Government of India’s energy security initiative under its
UNICON Investment Solutions Page 60
Integrated Energy Policy for strategic crude storages. The Company has two segments: the
Consultancy and Engineering segment, and the Lumpsum Turnkey Projects segment. It has
provided a range of engineering consultancy and project implementation services on more
than 49 refinery projects, including eight greenfield refinery projects, seven petrochemical
complexes, 35 oil and gas processing projects and 205 offshore platforms projects.
Observations:
• EIL has onging projects in the fields of Refinery projects - Guru gobind refinery
project of HMEL, Capacity expansion cum modernisation project for BPCL, Visakh
clean refinery project of HPCL, in the field of Petrochemicals – Assam gas cracker
project of BCPL, Panipat Naphtha Cracket project of IOCL, in the field Overseas
projects - PMC services for Borouge -2 project in Abu Dhabi, PMC services of
Rehabilitation and Adaptation for SONATRACH, Algeria
• EIL competitors include Thermax, Punj Lloyd. However, Eil has a Market Capital of
Rs 9462.86 cr. with a sales turnover of Rs 160.37 cr.
• EIL is having a Price to Earnings ratio of 18.05 with an Industrial Price to Earnings
ratio of 16.87 and its sensitivity to market is 0.98. It means it is performing similar to
the market movements
• Earnings to Price ratio of EIL is 15.51
UNICON Investment Solutions Page 61
UNION BANK OF INDIA
Union Bank of India is an India-based public sector bank. The Bank’s business segments
include Treasury Operations, Retail Banking Operations, Corporate Wholesale Banking and
Other Banking Operations. The various types of deposits offered by the Bank include savings
bank deposits, current deposits, current and savings account (CASA) deposits, and term
deposits. Its advances portfolio includes large corporate advances; micro, small and medium
enterprises advances; agriculture advances, and retail advances. Its retail advances include
home loan, vehicle loan, education and other retail loans. Its investments portfolio includes
investments made in government securities, state development loans and other approved
securities. It holds a 51% interest in Union KBC Asset Management Company Pvt. Ltd. As of
March 31, 2010, it operated 2,805 branches and 2,327 automated teller machines. The total
outlets, including extension counters and services branches, stood at 2,910 as of March 31,
2010.
Observations:
• Revised interest rates for deposits by non-resident Indians (NRIs) across maturities
and currencies. Under the revised rate structure, NRIs will get up to 26 basis points
more for deposits in foreign currencies. A deposit in Euros for a maturity above four
UNICON Investment Solutions Page 62
years but less than five years will earn an NRI 3.90% per annum as against the earlier
3.64%
• Got the approval from the markets watchdog SEBI to enter the mutual fund (MF)
arena.
• Competitors of Union Bank of India include Allahabad Bank, Andhra Bank. Union
Bank is having a Market Capital of Rs 18599.28 cr. with a Net profit of Rs 2081.95
cr.
• Union Bank of India is expected to grow deposits & credit by 20% &22% in FY12E
respectively and fee-based income in line with the loan-book thus overall profitability
should be up by 22% in FY12E.
• Union Bank of India is having a Price to Earnings Ratio of 9.37 and is performing
equal to Industrial Price to Earnings ratio of 9.36 and hence is a good stock to hold.
PORTFOLIO CONSTRUCTION BASED ON PRICE TO EARNINGS R ATIO
Calculation of Beta
BETA - Beta is a measure of a stock's volatility in relation to the market. The beta
coefficient is a key parameter in the capital asset pricing model (CAPM). It measures the part
of the asset's statistical variance that cannot be mitigated by the diversification provided by
the portfolio of many risky assets, because it is correlated with the return of the other assets
that are in the portfolio. The formula for the Beta of an asset within a portfolio is,
Beta = Covariance (stock versus market returns) / Variance of the Stock Market
Price to Earnings Ratio
The P/E ratio (price-to-earnings ratio) of a stock (also called its "P/E", or simply "multiple")
is a measure of the price paid for a share relative to the annual net income or profit earned by
the firm per share. The P/E ratio can therefore alternatively be calculated by dividing the
company's market capitalization by its total annual earnings.
UNICON Investment Solutions Page 63
Unlike the EV/EBITDA multiple, the price-to-earnings ratio reflects the capital structure of
the company in question. The price-to-earnings ratio is a financial ratio used for valuation: a
higher P/E ratio means that investors are paying more for each unit of net income, so the
stock is more expensive compared to one with a lower P/E ratio. The P/E ratio can be seen as
being expressed in years, in the sense that it shows the number of years of earnings which
would be required to pay back purchase price, ignoring inflation. The P/E ratio also shows
current investor demand for a company share. The reciprocal of the P/E ratio is known as
the earnings yield. The earnings yield is an estimate of the expected return from holding the
stock if we accept certain restrictive assumptions
Calculated as follows
Market value per share
Earnings per share
Results of Price to Earnings Ratio
company P/E Indstry P/E
β Stock Price as on 18/06/2011
EPS
BEML 16.40712 15.94 0.937 590 35.96
Bank of Maharashtra 8.141399 9.36 0.942 55.85 6.86
Century textiles 13.83229 15.58 1.619 353 25.52
Engineers India 18.05287 16.87 0.988 280 15.51
Godrejconsumer prts 31.97941 33.7 0.441 419.25 13.11
IDBI 7.711814 9.36 1.505 129.25 16.76
IOB 8.568956 9.36 1.211 148.5 17.33
Indraprastha Gas Ltd. 19.89218 21.24 0.617 369 18.55
Jindalsaw 9.436747 8.83 1.093 156.65 16.6
Optocircuits 21.37405 22.17 0.888 280 13.1
Thermax 18.46681 18.52 0.803 592.6 32.09
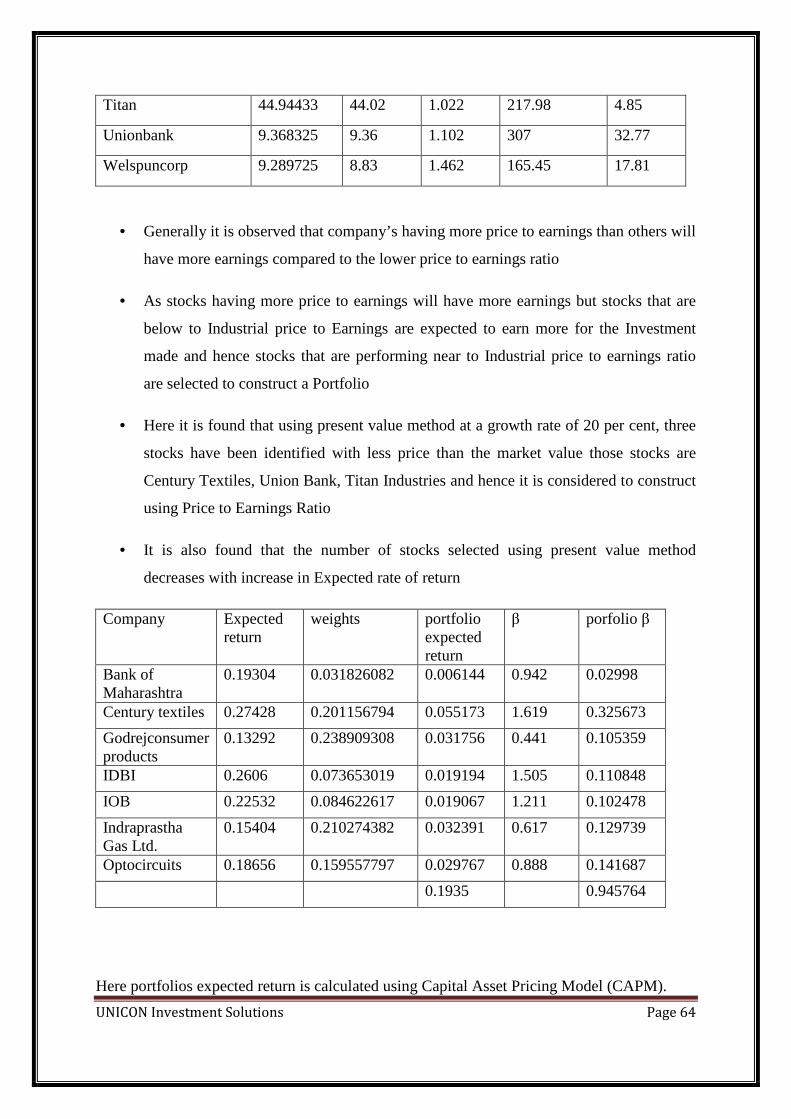
UNICON Investment Solutions Page 64
Titan 44.94433 44.02 1.022 217.98 4.85
Unionbank 9.368325 9.36 1.102 307 32.77
Welspuncorp 9.289725 8.83 1.462 165.45 17.81
• Generally it is observed that company’s having more price to earnings than others will
have more earnings compared to the lower price to earnings ratio
• As stocks having more price to earnings will have more earnings but stocks that are
below to Industrial price to Earnings are expected to earn more for the Investment
made and hence stocks that are performing near to Industrial price to earnings ratio
are selected to construct a Portfolio
• Here it is found that using present value method at a growth rate of 20 per cent, three
stocks have been identified with less price than the market value those stocks are
Century Textiles, Union Bank, Titan Industries and hence it is considered to construct
using Price to Earnings Ratio
• It is also found that the number of stocks selected using present value method
decreases with increase in Expected rate of return
Company Expected return
weights portfolio expected return
β porfolio β
Bank of Maharashtra
0.19304 0.031826082 0.006144 0.942 0.02998
Century textiles 0.27428 0.201156794 0.055173 1.619 0.325673
Godrejconsumer products
0.13292 0.238909308 0.031756 0.441 0.105359
IDBI 0.2606 0.073653019 0.019194 1.505 0.110848
IOB 0.22532 0.084622617 0.019067 1.211 0.102478
Indraprastha Gas Ltd.
0.15404 0.210274382 0.032391 0.617 0.129739
Optocircuits 0.18656 0.159557797 0.029767 0.888 0.141687
0.1935 0.945764
Here portfolios expected return is calculated using Capital Asset Pricing Model (CAPM).
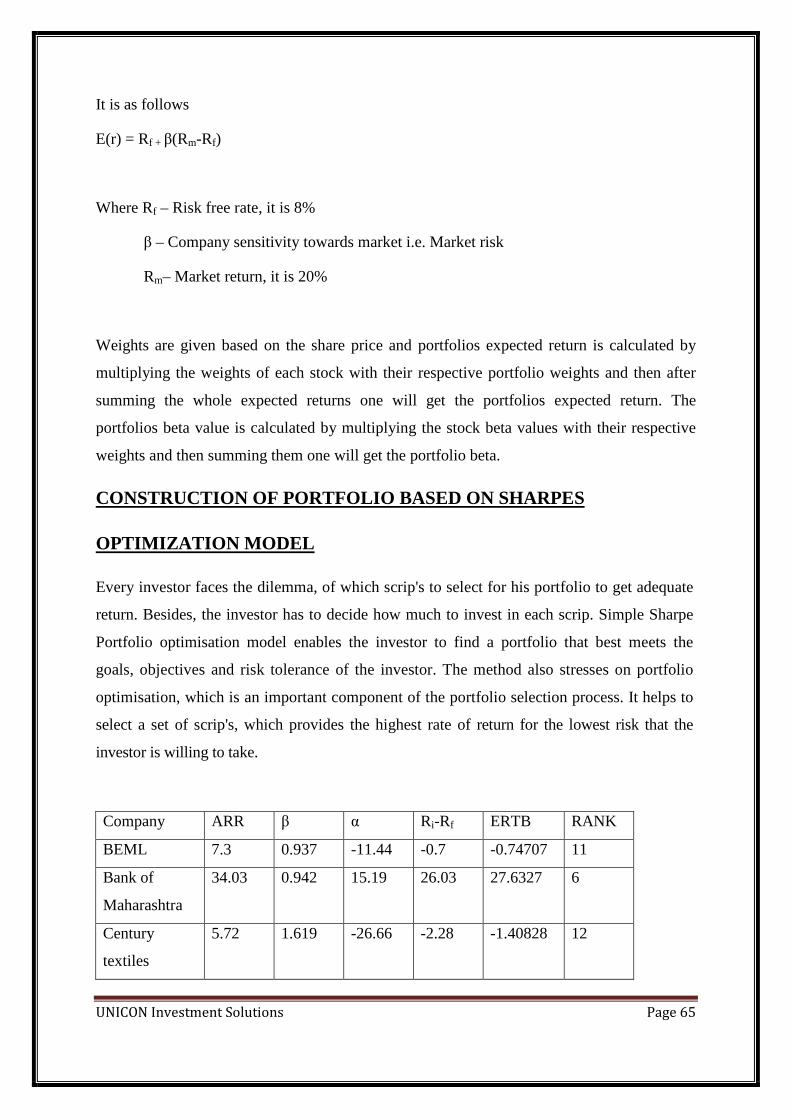
UNICON Investment Solutions Page 65
It is as follows
E(r) = Rf + β(Rm-Rf)
Where Rf – Risk free rate, it is 8%
β – Company sensitivity towards market i.e. Market risk
Rm– Market return, it is 20%
Weights are given based on the share price and portfolios expected return is calculated by
multiplying the weights of each stock with their respective portfolio weights and then after
summing the whole expected returns one will get the portfolios expected return. The
portfolios beta value is calculated by multiplying the stock beta values with their respective
weights and then summing them one will get the portfolio beta.
CONSTRUCTION OF PORTFOLIO BASED ON SHARPES
OPTIMIZATION MODEL
Every investor faces the dilemma, of which scrip's to select for his portfolio to get adequate
return. Besides, the investor has to decide how much to invest in each scrip. Simple Sharpe
Portfolio optimisation model enables the investor to find a portfolio that best meets the
goals, objectives and risk tolerance of the investor. The method also stresses on portfolio
optimisation, which is an important component of the portfolio selection process. It helps to
select a set of scrip's, which provides the highest rate of return for the lowest risk that the
investor is willing to take.
Company ARR β α Ri-Rf ERTB RANK
BEML 7.3 0.937 -11.44 -0.7 -0.74707 11
Bank of
Maharashtra
34.03 0.942 15.19 26.03 27.6327 6
Century
textiles
5.72 1.619 -26.66 -2.28 -1.40828 12
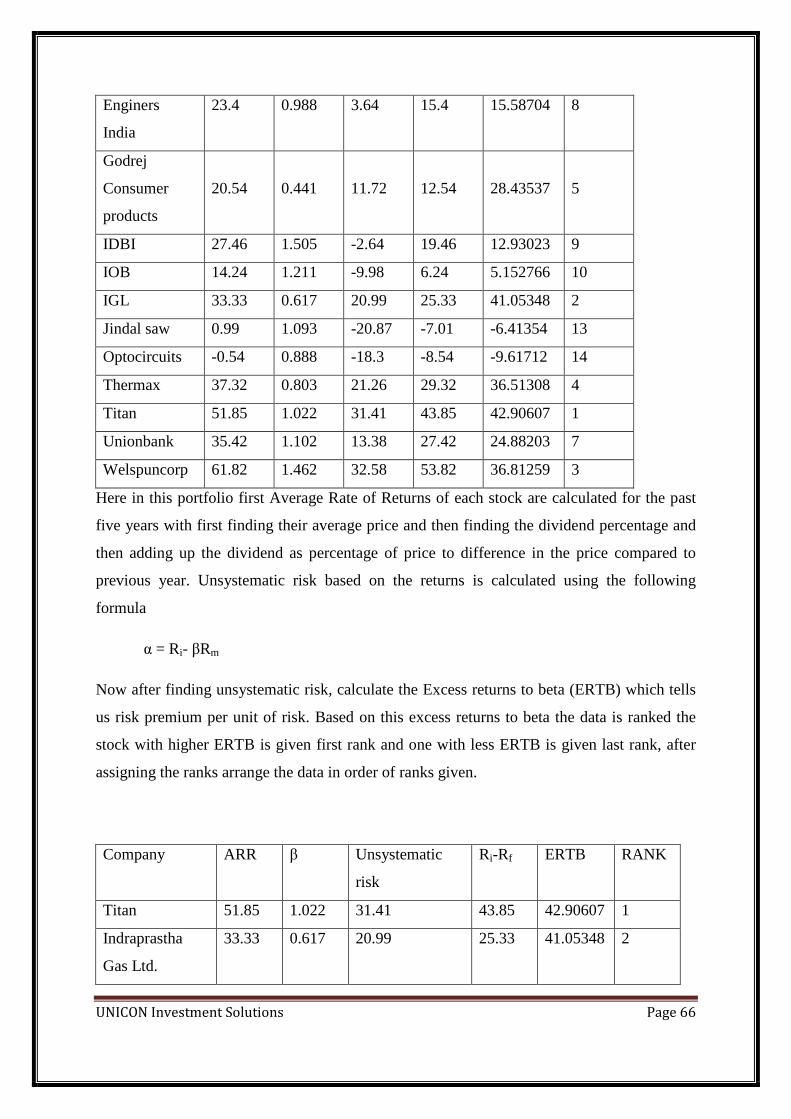
UNICON Investment Solutions Page 66
Enginers
India
23.4 0.988 3.64 15.4 15.58704 8
Godrej
Consumer
products
20.54
0.441
11.72
12.54
28.43537
5
IDBI 27.46 1.505 -2.64 19.46 12.93023 9
IOB 14.24 1.211 -9.98 6.24 5.152766 10
IGL 33.33 0.617 20.99 25.33 41.05348 2
Jindal saw 0.99 1.093 -20.87 -7.01 -6.41354 13
Optocircuits -0.54 0.888 -18.3 -8.54 -9.61712 14
Thermax 37.32 0.803 21.26 29.32 36.51308 4
Titan 51.85 1.022 31.41 43.85 42.90607 1
Unionbank 35.42 1.102 13.38 27.42 24.88203 7
Welspuncorp 61.82 1.462 32.58 53.82 36.81259 3
Here in this portfolio first Average Rate of Returns of each stock are calculated for the past
five years with first finding their average price and then finding the dividend percentage and
then adding up the dividend as percentage of price to difference in the price compared to
previous year. Unsystematic risk based on the returns is calculated using the following
formula
α = Ri- βRm
Now after finding unsystematic risk, calculate the Excess returns to beta (ERTB) which tells
us risk premium per unit of risk. Based on this excess returns to beta the data is ranked the
stock with higher ERTB is given first rank and one with less ERTB is given last rank, after
assigning the ranks arrange the data in order of ranks given.
Company ARR β Unsystematic
risk
Ri-Rf ERTB RANK
Titan 51.85 1.022 31.41 43.85 42.90607 1
Indraprastha
Gas Ltd.
33.33 0.617 20.99 25.33 41.05348 2
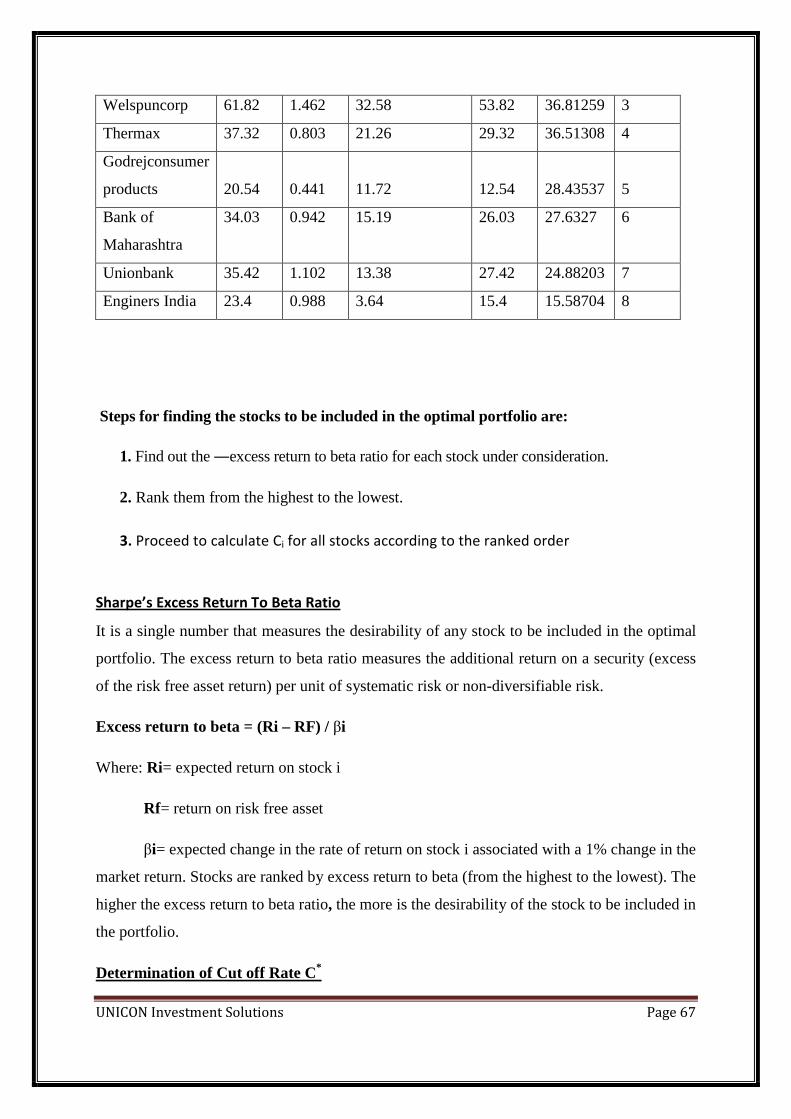
UNICON Investment Solutions Page 67
Welspuncorp 61.82 1.462 32.58 53.82 36.81259 3
Thermax 37.32 0.803 21.26 29.32 36.51308 4
Godrejconsumer
products
20.54
0.441
11.72
12.54
28.43537
5
Bank of
Maharashtra
34.03 0.942 15.19 26.03 27.6327 6
Unionbank 35.42 1.102 13.38 27.42 24.88203 7
Enginers India 23.4 0.988 3.64 15.4 15.58704 8
Steps for finding the stocks to be included in the optimal portfolio are:
1. Find out the ―excess return to beta ratio for each stock under consideration.
2. Rank them from the highest to the lowest.
3. Proceed to calculate Ci for all stocks according to the ranked order
Sharpe’s Excess Return To Beta Ratio
It is a single number that measures the desirability of any stock to be included in the optimal
portfolio. The excess return to beta ratio measures the additional return on a security (excess
of the risk free asset return) per unit of systematic risk or non-diversifiable risk.
Excess return to beta = (Ri – RF) / βi
Where: Ri= expected return on stock i
Rf= return on risk free asset
βi= expected change in the rate of return on stock i associated with a 1% change in the
market return. Stocks are ranked by excess return to beta (from the highest to the lowest). The
higher the excess return to beta ratio, the more is the desirability of the stock to be included in
the portfolio.
Determination of Cut off Rate C*

UNICON Investment Solutions Page 68
σ2mΣ(Ri - Rf)β
σ2cj
Ci=Σ
1+σ2mΣβ
2/σ2cj
Where σ2m – variance in the market index
σ2cj– unsystematic risk
Ri – Expected return of the stock
Rf – Risk free return
Company Ri β σ2cj β
2 β2/σ2
cj (Ri-
Rf)β/σ2cj
Σ(Ri-
Rf)β/σ2cj
Σβ2/σ2
cj Ci
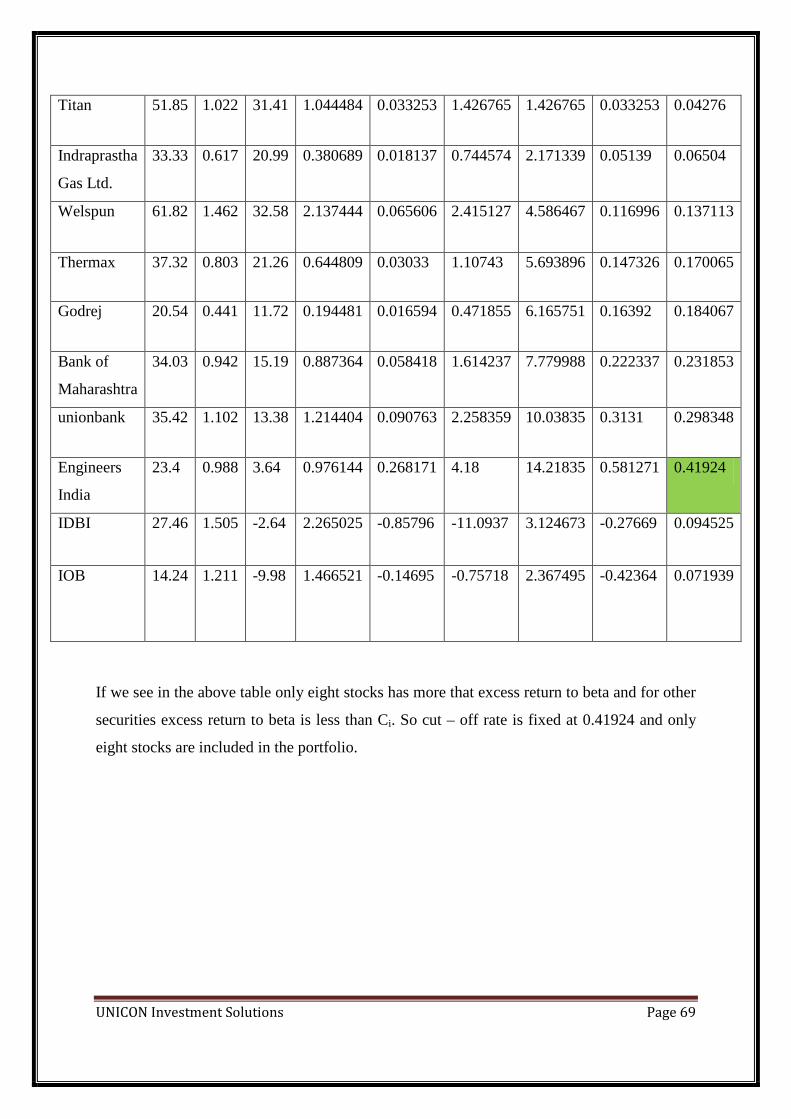
UNICON Investment Solutions Page 69
If we see in the above table only eight stocks has more that excess return to beta and for other
securities excess return to beta is less than Ci. So cut – off rate is fixed at 0.41924 and only
eight stocks are included in the portfolio.
Titan 51.85 1.022 31.41 1.044484 0.033253 1.426765 1.426765 0.033253 0.04276
Indraprastha
Gas Ltd.
33.33 0.617 20.99 0.380689 0.018137 0.744574 2.171339 0.05139 0.06504
Welspun 61.82 1.462 32.58 2.137444 0.065606 2.415127 4.586467 0.116996 0.137113
Thermax 37.32 0.803 21.26 0.644809 0.03033 1.10743 5.693896 0.147326 0.170065
Godrej 20.54 0.441 11.72 0.194481 0.016594 0.471855 6.165751 0.16392 0.184067
Bank of
Maharashtra
34.03 0.942 15.19 0.887364 0.058418 1.614237 7.779988 0.222337 0.231853
unionbank 35.42 1.102 13.38 1.214404 0.090763 2.258359 10.03835 0.3131 0.298348
Engineers
India
23.4 0.988 3.64 0.976144 0.268171 4.18 14.21835 0.581271 0.41924
IDBI 27.46 1.505 -2.64 2.265025 -0.85796 -11.0937 3.124673 -0.27669 0.094525
IOB 14.24 1.211 -9.98 1.466521 -0.14695 -0.75718 2.367495 -0.42364 0.071939
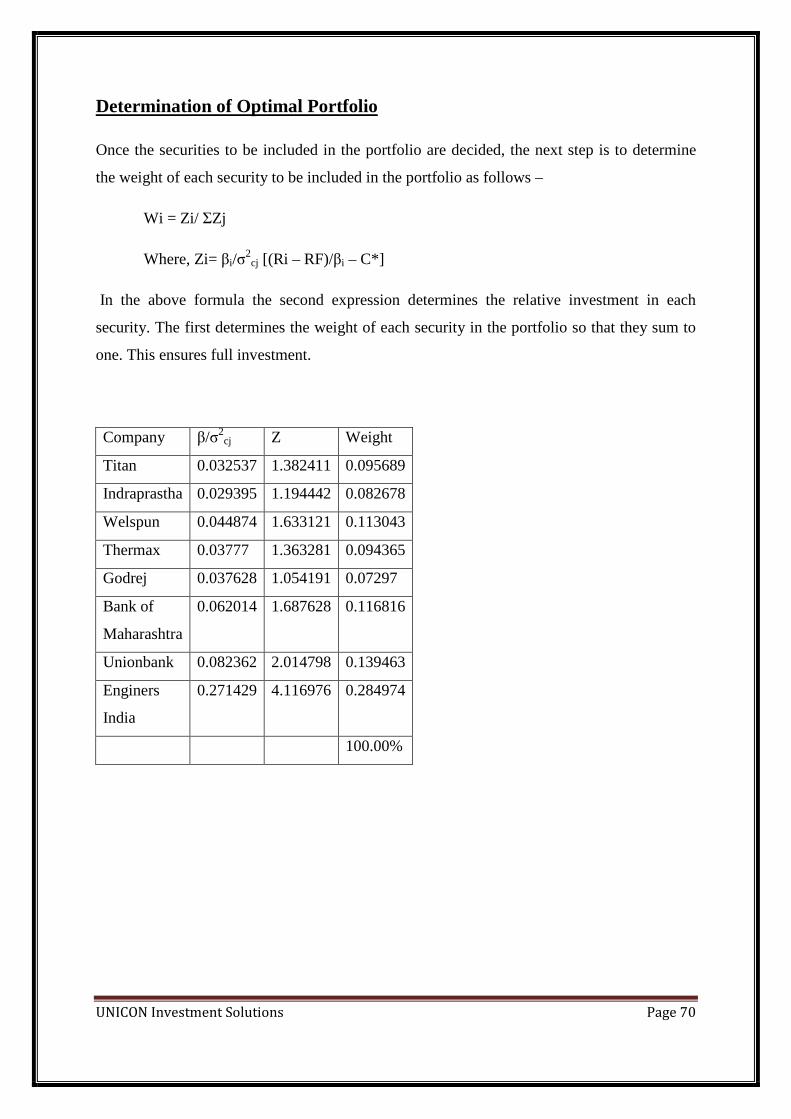
UNICON Investment Solutions Page 70
Determination of Optimal Portfolio
Once the securities to be included in the portfolio are decided, the next step is to determine
the weight of each security to be included in the portfolio as follows –
Wi = Zi/ ΣZj
Where, Zi= βi/σ2cj [(Ri – RF)/βi – C*]
In the above formula the second expression determines the relative investment in each
security. The first determines the weight of each security in the portfolio so that they sum to
one. This ensures full investment.
Company β/σ2cj Z Weight
Titan 0.032537 1.382411 0.095689
Indraprastha 0.029395 1.194442 0.082678
Welspun 0.044874 1.633121 0.113043
Thermax 0.03777 1.363281 0.094365
Godrej 0.037628 1.054191 0.07297
Bank of
Maharashtra
0.062014 1.687628 0.116816
Unionbank 0.082362 2.014798 0.139463
Enginers
India
0.271429 4.116976 0.284974
100.00%
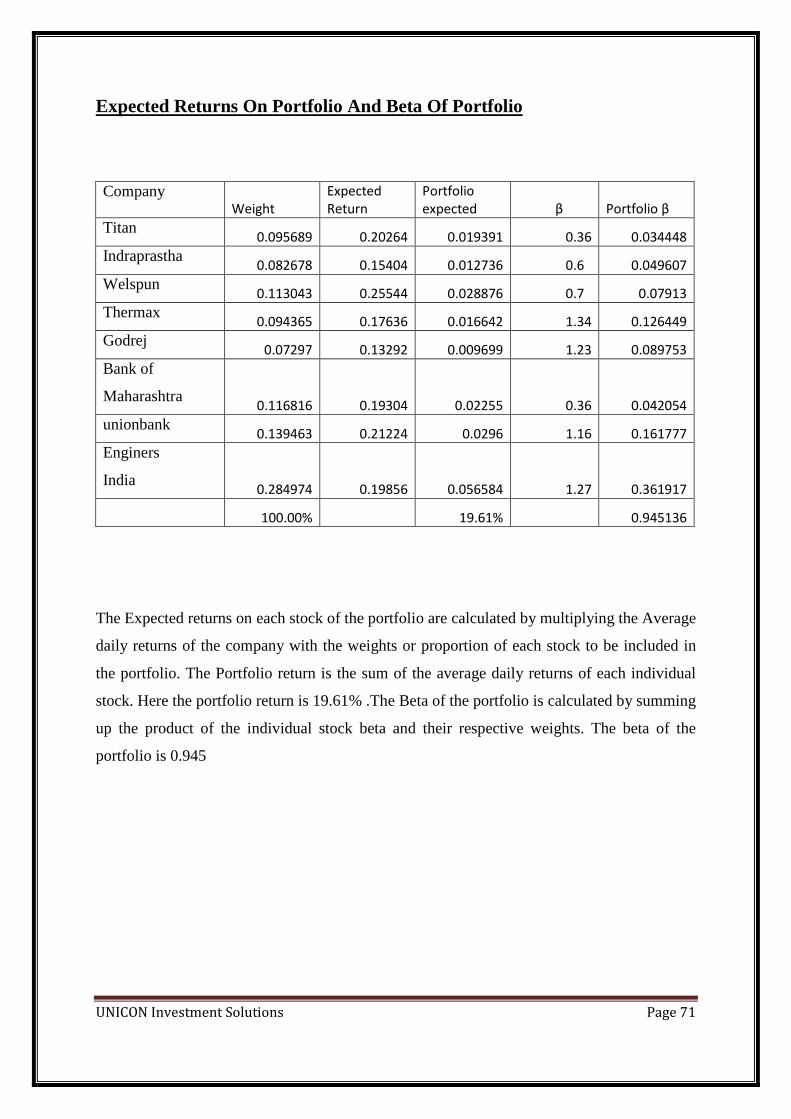
UNICON Investment Solutions Page 71
Expected Returns On Portfolio And Beta Of Portfolio
Company Weight
Expected
Return
Portfolio
expected β Portfolio β
Titan 0.095689 0.20264 0.019391 0.36 0.034448
Indraprastha 0.082678 0.15404 0.012736 0.6 0.049607
Welspun 0.113043 0.25544 0.028876 0.7 0.07913
Thermax 0.094365 0.17636 0.016642 1.34 0.126449
Godrej 0.07297 0.13292 0.009699 1.23 0.089753
Bank of
Maharashtra 0.116816 0.19304 0.02255 0.36 0.042054
unionbank 0.139463 0.21224 0.0296 1.16 0.161777
Enginers
India 0.284974 0.19856 0.056584 1.27 0.361917
100.00% 19.61% 0.945136
The Expected returns on each stock of the portfolio are calculated by multiplying the Average
daily returns of the company with the weights or proportion of each stock to be included in
the portfolio. The Portfolio return is the sum of the average daily returns of each individual
stock. Here the portfolio return is 19.61% .The Beta of the portfolio is calculated by summing
up the product of the individual stock beta and their respective weights. The beta of the
portfolio is 0.945
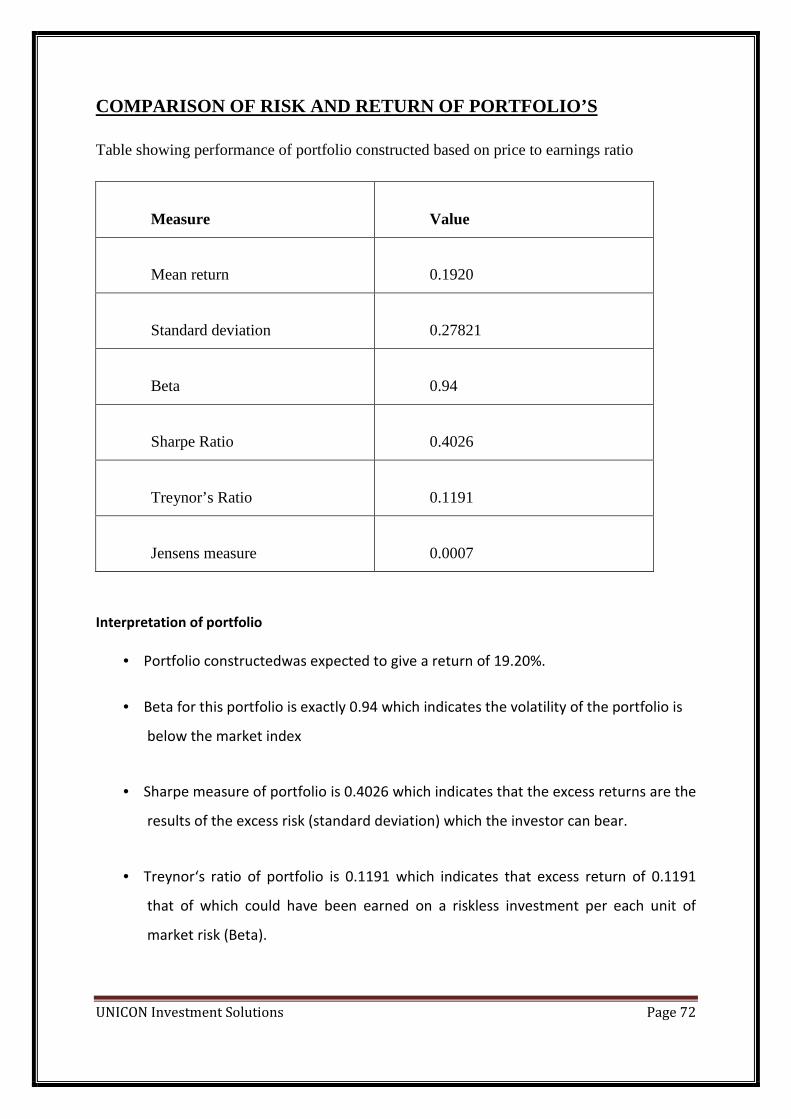
UNICON Investment Solutions Page 72
COMPARISON OF RISK AND RETURN OF PORTFOLIO’S
Table showing performance of portfolio constructed based on price to earnings ratio
Measure
Value
Mean return
0.1920
Standard deviation
0.27821
Beta
0.94
Sharpe Ratio
0.4026
Treynor’s Ratio
0.1191
Jensens measure
0.0007
Interpretation of portfolio
• Portfolio constructedwas expected to give a return of 19.20%.
• Beta for this portfolio is exactly 0.94 which indicates the volatility of the portfolio is
below the market index
• Sharpe measure of portfolio is 0.4026 which indicates that the excess returns are the
results of the excess risk (standard deviation) which the investor can bear.
• Treynor‘s ratio of portfolio is 0.1191 which indicates that excess return of 0.1191
that of which could have been earned on a riskless investment per each unit of
market risk (Beta).
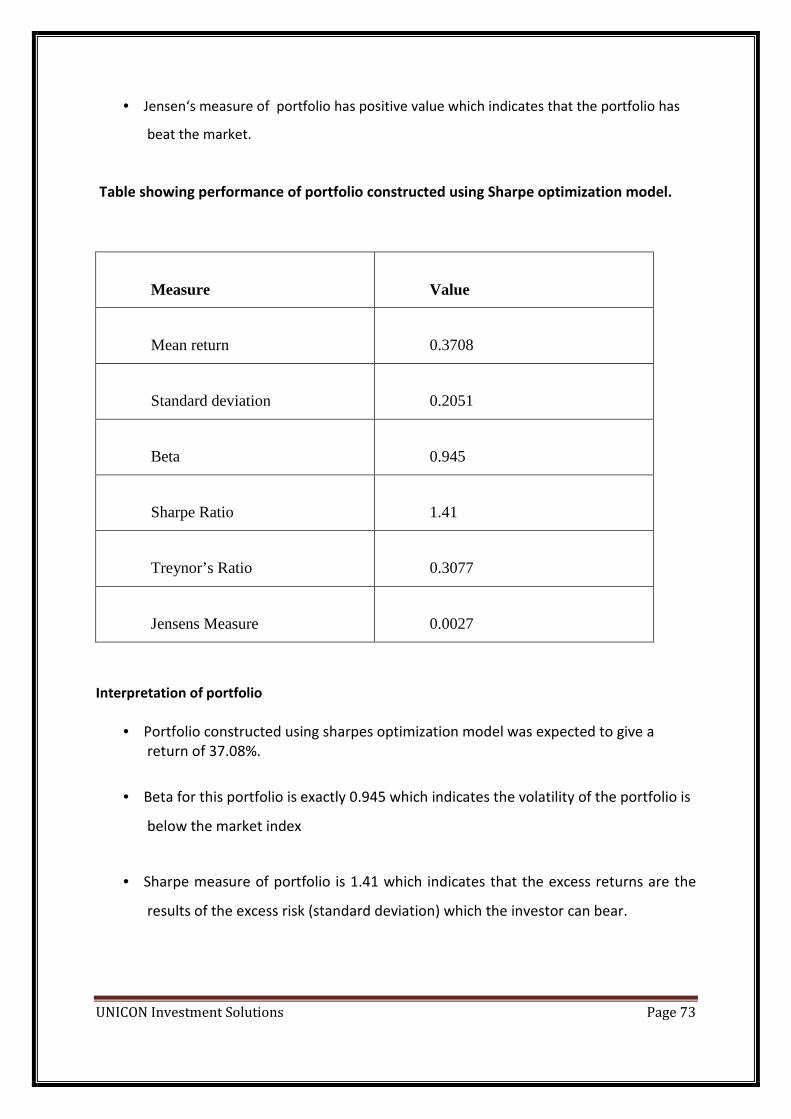
UNICON Investment Solutions Page 73
• Jensen‘s measure of portfolio has positive value which indicates that the portfolio has
beat the market.
Table showing performance of portfolio constructed using Sharpe optimization model.
Measure
Value
Mean return
0.3708
Standard deviation
0.2051
Beta
0.945
Sharpe Ratio
1.41
Treynor’s Ratio
0.3077
Jensens Measure
0.0027
Interpretation of portfolio
• Portfolio constructed using sharpes optimization model was expected to give a
return of 37.08%.
• Beta for this portfolio is exactly 0.945 which indicates the volatility of the portfolio is
below the market index
• Sharpe measure of portfolio is 1.41 which indicates that the excess returns are the
results of the excess risk (standard deviation) which the investor can bear.
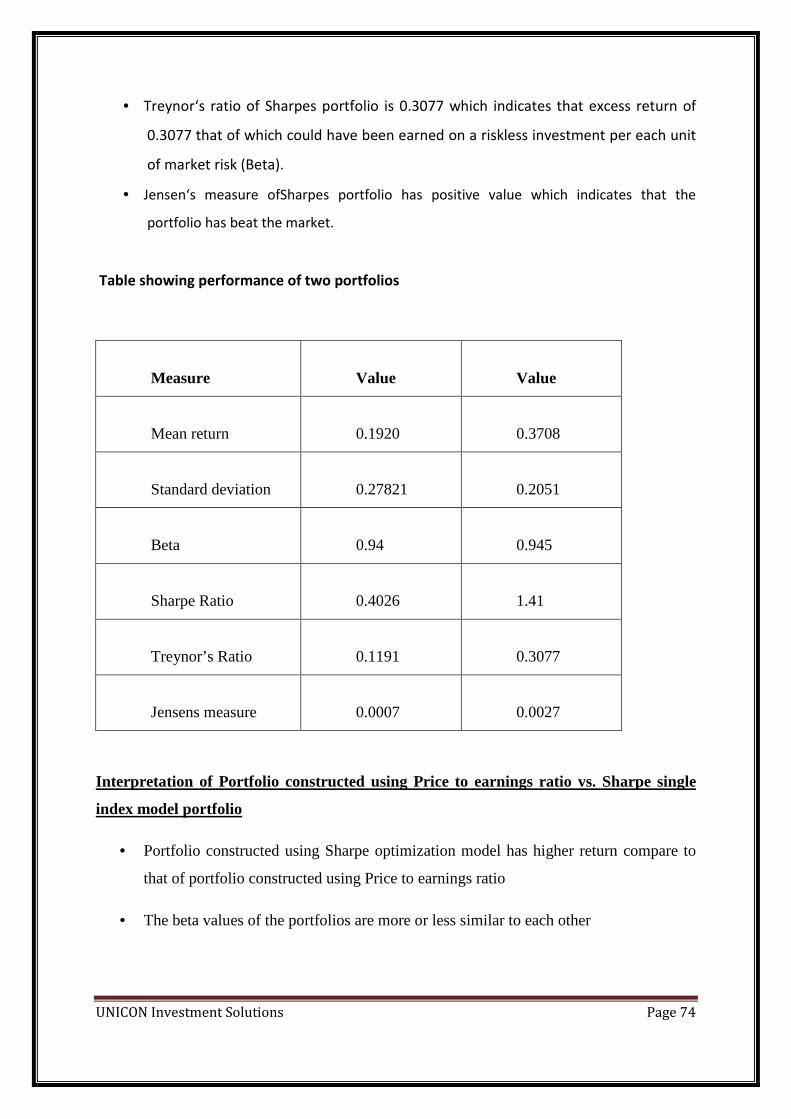
UNICON Investment Solutions Page 74
• Treynor‘s ratio of Sharpes portfolio is 0.3077 which indicates that excess return of
0.3077 that of which could have been earned on a riskless investment per each unit
of market risk (Beta).
• Jensen‘s measure ofSharpes portfolio has positive value which indicates that the
portfolio has beat the market.
Table showing performance of two portfolios
Measure
Value
Value
Mean return
0.1920
0.3708
Standard deviation
0.27821
0.2051
Beta
0.94
0.945
Sharpe Ratio
0.4026
1.41
Treynor’s Ratio
0.1191
0.3077
Jensens measure
0.0007
0.0027
Interpretation of Portfolio constructed using Price to earnings ratio vs. Sharpe single
index model portfolio
• Portfolio constructed using Sharpe optimization model has higher return compare to
that of portfolio constructed using Price to earnings ratio
• The beta values of the portfolios are more or less similar to each other

UNICON Investment Solutions Page 75
• Sharpe ratio for portfolio constructed using Price to earnings ratio has been less than
the Sharpe portfolio which means that the Sharpe portfolio has given more positive
returns for every unit risk.
• Portfolio constructed as per Sharpe has higher Treynor‘s ratio compare to that of
Price to earnings ratio which indicates the returns earned in excess of that which
could have been earned on riskless investment per unit of market risk.
• Portfolio constructed as per Sharpe optimization portfolio has given excess return than
what was supposed to be earned , given it beta as per the capital asset pricing model
which is reflected by Jensen‘s alpha whereas portfolio constructed using Price to earnigs
ratio has given lesser return.
TEST FOR EQUALITY/DIFFERENCE OF MEAN OF PORTFOLIO
H0 : No difference in returns from the two portfolios.
H1 : Difference in returns from the two portfolios
Using the two sample t-test to test for difference in mean returns, the results were as
follows
Price to
earnins
n1 7 vriance 0.077404 mean 0.192014
Sharpes n2 8 variance 0.042067 mean 0.370881
t-value is 1.43
UNICON Investment Solutions Page 76
now we have to calculate degree of freedom using the following equation
df = (n1+n2-2)
Hence degree of freedom is two, now one has to look for table value that is at 10 per cent
for 13 degree of freedom table value is 1.35017
So my calculated value > table value
Hence null hypothesis Hois rejected, so it is found there is significant difference between the
portfolios constructed and hence there exists a risk return relation ship
Conclusion:
In general, a high Price to Earnings suggests that investors are expecting higher earnings
growth in the future compared to companies with a lower Price to Earnings. However, the
Price to Earnings ratio doesn't tell us the whole story by itself. It's usually more useful to
compare the Price to Earnings ratios of one company to other companies in the same
industry, to the market in general or against the company's own historical P/E. It would not
be useful for investors using the Price to Earnings ratio as a basis for their investmentas
each industry has much different growth prospects.
UNICON Investment Solutions Page 77
SUMMARY OF FINDINGS
• Portfolio constructed as per Sharpe optimization model has higher return compare
to that of portfolio constructed using price to earnings ratio.
• The beta values of the portfolios is more or less similar to each other
• Sharpe ratio for portfolio constructed using Price to Earnings ratio has been less than
the Sharpe portfolio which means that the Sharpe portfolio has given more positive
returns for every unit risk.
• Portfolio constructed as per Sharpe has higher Treynor‘s ratio compare to that of
Price to Earnings ratio which indicates the returns earned in excess of that which
could have been earned on riskless investment per unit of market risk.
• Portfolio constructed as per Sharpe optimization portfolio has given excess return
that what was supposed to be earned , given it beta as per the capital asset pricing
model which is reflected by Jensen‘s alpha whereas portfolio constructed using price
to earnings ratio has given lesser return.
• t-test at 95% confidence level shows that there is a significant difference between
the mean returns of the portfolio constructed by using Sharpe single index model
and Price to Earnings ratio

UNICON Investment Solutions Page 78
BIBILOGRAPHY
References:
Security Analysis and Portfolio Management by SUDHINDHRA BHAT
Websites:
www.unicon.in
www.moneycontrol.com
www.in.finance.yahoo.com
Related Documents