Abstract We used mitochondrial DNA sequence comparisons to assess range-wide population structure and historical patterns of differentiation among popu- lations of the bog turtle (Glyptemys muhlenbergii). This species is one of North America’s smallest and most endangered pond turtles, and is currently found in three largely disjunct groups of populations: in the southern U.S., in the northeast, and in the Finger Lakes and Lake Ontario Plains region of western and central New York State. All the New York sites and most of the north- eastern sites were glaciated during the Pleistocene. We surveyed 2793 bases pairs of mitochondrial DNA span- ning three genes (cytb, nd4, and d-loop) in 41 individuals from 21 populations throughout most of the bog turtle’s distribution. We found surprisingly low levels of diver- gence among populations, even in southern populations that have been hypothesized as refugia during times of climate change. Our data suggest populations of bog turtle’s suffered a bottleneck, followed by a rapid post- Pleistocene expansion into northern segments of the species’ range. We discuss historical changes in habitat availability and climate that may have influenced the historical deployment of lineages in this species, and possible life history traits and habitat dynamics that might also contribute to the overall low genetic diversity across its range. Keywords Phylogeography Bottleneck Pleistocene Bog turtle Clemmys muhlenbergii Introduction The spatial genetic structure of an organism is an outcome of the combined evolutionary forces acting within populations (e.g. drift and selection) and historical biogeographical events such as vicariance and changes in habitat that affect the distribution of evolving lineages (e.g. Hewitt 2000; Austin et al. 2002). In addition, species-typical life history characteristics and ecologies such as clutch size, longevity, dispersal capacity, and habitat specificity can increase or de- crease the rate and direction of among-population ge- netic differentiation (Scribner et al. 1986, 1993; Nevo and Beiles 1991; Peterson and Denno 1998a, b; Hoelzel 1999). For example, all else being equal, we would expect that specialists occupying fragments or patches of habitat are more likely to exhibit higher genetic divergence among subdivided populations, particularly if populations have small effective population sizes (Nunney 1991). Intraspecific molecular phylogenies and population genetic studies are widely used to evaluate the distribution of genetic diversity among populations and regions and can offer insight into historical effects of isolation, biogeographic changes, and demographic and life history characteristics that contribute to rangewide genetic structure (Avise et al. 1987; Moritz 1994). Much of eastern North America was glaciated during the climatic cycles of the late Pleistocene and the effect of these climatic and habitat changes have been demonstrated in many ectotherms with northern P. A. Rosenbaum Department of Biological Sciences, State University of New York, Oswego, 213 Piez Hall, Oswego, NY 13126, USA J. M. Robertson K. R. Zamudio (&) Department of Ecology and Evolutionary Biology, Cornell University, E145 Corson Hall, Ithaca, NY 14850, USA e-mail: [email protected] Conserv Genet (2007) 8:331–342 DOI 10.1007/s10592-006-9172-3 123 ORIGINAL PAPER Unexpectedly low genetic divergences among populations of the threatened bog turtle (Glyptemys muhlenbergii) Peter A. Rosenbaum Jeanne M. Robertson Kelly R. Zamudio Received: 6 November 2005 / Accepted: 16 May 2006 / Published online: 16 January 2007 ȑ Springer Science+Business Media B.V. 2007

Welcome message from author
This document is posted to help you gain knowledge. Please leave a comment to let me know what you think about it! Share it to your friends and learn new things together.
Transcript
Abstract We used mitochondrial DNA sequence
comparisons to assess range-wide population structure
and historical patterns of differentiation among popu-
lations of the bog turtle (Glyptemys muhlenbergii). This
species is one of North America’s smallest and most
endangered pond turtles, and is currently found in three
largely disjunct groups of populations: in the southern
U.S., in the northeast, and in the Finger Lakes and Lake
Ontario Plains region of western and central New York
State. All the New York sites and most of the north-
eastern sites were glaciated during the Pleistocene. We
surveyed 2793 bases pairs of mitochondrial DNA span-
ning three genes (cytb, nd4, and d-loop) in 41 individuals
from 21 populations throughout most of the bog turtle’s
distribution. We found surprisingly low levels of diver-
gence among populations, even in southern populations
that have been hypothesized as refugia during times of
climate change. Our data suggest populations of bog
turtle’s suffered a bottleneck, followed by a rapid post-
Pleistocene expansion into northern segments of the
species’ range. We discuss historical changes in habitat
availability and climate that may have influenced the
historical deployment of lineages in this species, and
possible life history traits and habitat dynamics that
might also contribute to the overall low genetic diversity
across its range.
Keywords Phylogeography Æ Bottleneck ÆPleistocene Æ Bog turtle Æ Clemmys muhlenbergii
Introduction
The spatial genetic structure of an organism is an
outcome of the combined evolutionary forces acting
within populations (e.g. drift and selection) and
historical biogeographical events such as vicariance
and changes in habitat that affect the distribution of
evolving lineages (e.g. Hewitt 2000; Austin et al. 2002).
In addition, species-typical life history characteristics
and ecologies such as clutch size, longevity, dispersal
capacity, and habitat specificity can increase or de-
crease the rate and direction of among-population ge-
netic differentiation (Scribner et al. 1986, 1993; Nevo
and Beiles 1991; Peterson and Denno 1998a, b; Hoelzel
1999). For example, all else being equal, we would
expect that specialists occupying fragments or patches
of habitat are more likely to exhibit higher genetic
divergence among subdivided populations, particularly
if populations have small effective population sizes
(Nunney 1991). Intraspecific molecular phylogenies
and population genetic studies are widely used to
evaluate the distribution of genetic diversity among
populations and regions and can offer insight into
historical effects of isolation, biogeographic changes,
and demographic and life history characteristics that
contribute to rangewide genetic structure (Avise et al.
1987; Moritz 1994).
Much of eastern North America was glaciated
during the climatic cycles of the late Pleistocene and
the effect of these climatic and habitat changes have
been demonstrated in many ectotherms with northern
P. A. RosenbaumDepartment of Biological Sciences, State University of NewYork, Oswego, 213 Piez Hall, Oswego, NY 13126, USA
J. M. Robertson Æ K. R. Zamudio (&)Department of Ecology and Evolutionary Biology,Cornell University, E145 Corson Hall, Ithaca,NY 14850, USAe-mail: [email protected]
Conserv Genet (2007) 8:331–342
DOI 10.1007/s10592-006-9172-3
123
ORIGINAL PAPER
Unexpectedly low genetic divergences among populationsof the threatened bog turtle (Glyptemys muhlenbergii)
Peter A. Rosenbaum Æ Jeanne M. Robertson ÆKelly R. Zamudio
Received: 6 November 2005 / Accepted: 16 May 2006 / Published online: 16 January 2007� Springer Science+Business Media B.V. 2007

distributions (Bernatchez and Dodson 1991; Holman
and Andrews 1994; Hewitt 2000; Austin et al. 2002;
Zamudio and Savage 2003). The common genetic
signature for most of these species is a pattern of rapid
population expansion from southern refugia, with large
recolonized regions that are genetically homogeneous
(Hewitt 1996, 2000; Bernatchez and Wilson 1998).
Despite this common genetic pattern, the variance in
degree and scale of population differentiation is high;
with the accumulation of phylogeographies for more
taxa, it is becoming clear that biogeographical pro-
cesses alone are not sufficient to explain patterns
among all species examined. Therefore, to fully
understand genetic diversity in post-glacial populations
we will ultimately have to examine the contribution of
life history, ecology, and demography in the origin and
maintenance of population differentiation (Nevo and
Beiles 1991; Ross 1999; Austin et al. 2004).
In this study, we use mitochondrial DNA (mtDNA)
sequence data to reconstruct the phylogenetic history
of bog turtles (Glyptemys muhlenbergii, formerly
Clemmys muhlenbergii; Holman and Fritz 2001), a rare
and endangered semi-aquatic turtle distributed in
the eastern U.S. Bog turtles range as far north
as northern New York, well into regions covered by
ice sheets during the last glacial maximum (Shackleton
and Opdyke 1977; Shackleton et al. 1984); therefore,
northernmost populations must have resulted from
post-glacial colonization from southern refugia. A
previous preliminary rangewide survey of genetic var-
iation suggested genetic uniformity within bog turtles
(Amato et al. 1997). Nonetheless, because of habitat
requirements, life history and demographic character-
istics, we would predict that this species should exhibit
high levels of population differentiation when com-
pared to other ectotherms with similar distributions. Of
all North American turtles with northerly distributions,
the bog turtle has the most disjunct and fragmented
distribution at local and rangewide scales (Fig. 1;
Conant and Collins 1998). This species is a habitat
specialist, living in open canopy wetlands (bogs and
fens) and wet meadows (Tryon and Herman 1990;
Carter et al. 1999; USFWS 2001). These habitats are
patchily distributed especially in the northern regions
of the species’ range (Klemens 1990, 1993; Tryon and
Herman 1990). The range of the bog turtle is also
highly discontinuous at a regional scale and remaining
populations can be grouped into: (1) southern popula-
tions in Virginia, North Carolina, South Carolina,
Georgia, and Tennessee; (2) northeastern populations
in Delaware, Maryland, Connecticut, Massachusetts,
New Jersey, eastern Pennsylvania, and eastern New
York and (3) Lake Plains/Prairie Peninsula populations
in western and central New York. A fourth historical
population group in western Pennsylvania is believed
to be extirpated (Fig. 1; Breisch 1988; Conant and
Collins 1998; USFWS 2001).
In addition to a fragmented distribution, the bog
turtle exhibits life history characteristics that should
promote high levels of genetic differentiation among
populations. Bog turtles are one of North America’s
smallest and rarest turtle, measuring 80–120 mm total
carapace length (Klemens 1990, 1993; Ernst et al.
1994). They are long-lived and persist in small isolated
populations, usually composed of less than 50 individ-
uals (Klemens 1990, 1993; Tryon 1990). Bog turtles
also have relatively low vagility (Ernst 1977; Chase
et al. 1989), with infrequent instances of dispersal over
longer distances or unsuitable habitat (Carter et al.
2000). Combined, we expected that restricted move-
ment and high habitat specificity would limit gene flow
and that small population sizes would further enhance
genetic divergence among isolated populations
(Walker and Avise 1998; Clark et al. 1999).
Over the past 20 years, this species has experienced
a 50% population decline due to loss and alteration of
wetland habitats, invasive wetland plant species,
hydrological changes, toxic and organic pollution, and
illegal collection (Groombridge 1982; Tryon and Her-
man 1990; USFWS 2001). In addition, habitats used by
this species typically undergo ecological succession,
from open canopy fens and bogs to closed canopy
swamps, leading to the loss of suitable habitat that is
not currently replaced (Klemens 1993; Herman and
Tryon 1997). Locally extirpated populations are usu-
ally not repopulated, either because modified habitat
patches can no longer support bog turtle populations,
or because limited dispersal capacity reduces the like-
lihood that metapopulation dynamics can be sustained.
In 1997, the US Fish and Wildlife Service listed
northern allopatric populations as ‘‘threatened’’ under
the Endangered Species Act due to habitat special-
ization and dwindling population sizes; at the same
time southern populations were also listed due to
similarity of appearance (USFWS 2001). Bog turtles
are also listed as a CITES I species, which ranks them
as one of the most imperiled turtles in the world
(Turtle Conservation Fund 2002).
Given the conservation concern for this species, their
current patchy distribution, and their unique life history
characteristics, we surveyed rangewide genetic vari-
ability to determine intraspecific patterns of genetic
diversity. Specifically, our goals were to examine the
degree of genetic differentiation among regional popu-
lation groups, the genetic signatures of past demo-
graphic processes such as post-Pleistocene colonization,
332 Conserv Genet (2007) 8:331–342
123

and compare our results to patterns observed in other
turtle species with similar distributions.
Methods
Population sampling
We sampled G. muhlenbergii from 21 localities dis-
tributed across the three disjunct segments of the
species’ range, including 11 sites in the South, 7 sites in
the Northeast, and 3 sites in the Lake Plains region of
New York (Fig. 1, Table 1). We chose Glyptemys in-
sculpta and Chrysemys picta as successively distant
outgroup taxa (Holman and Fritz 2001; Feldman and
Parham 2002). Our sample of G. insculpta was obta-
ined from the Royal Ontario Museum (accession
number 1523); all C. picta sequences were obtained
from Genbank (AF069423).
Molecular methods
We extracted DNA from blood samples collected in
New York using a standard digestion with Proteinase K
and lysis buffer followed by phenol–chloroform organic
clean up (Sambrook and Russell 2001). Samples from
North Carolina and Massachusetts were extracted with
the Puregene DNA Isolation Kit (T. King pers comm).
A previous study of genetic variability in this species
(Amato et al. 1997) compared 291 bp of the 16S
mtDNA gene, a gene known to evolve relatively slowly
in vertebrates (Lopez et al. 1997; Pesole et al. 1999). To
maximize our chances of capturing even low levels of
diversity within this species, we sampled more popula-
tions throughout the range and targeted gene regions
with higher rates of evolution. We assayed individuals
for variation at three mitochondrial gene fragments: (1)
the 5¢ segment of the NADH dehydrogenase subunit 4
and the adjacent Histidine, Serine, and Leucine transfer
RNAs (hereafter referred to as nd4), (2) the complete
cytochrome b and partial sequence of the adjacent
Threonine transfer RNA (hereafter referred to as
cytb), and (3) a partial sequence at the 5¢ end of the
control region within the displacement loop (hereafter
referred to as d-loop). We used the polymerase chain
reaction (PCR) to amplify the nd4 fragment using
primers ND4 and Leu (Arevalo et al. 1994), the cytb
gene using primers M (Shaffer et al. 1997) and
GLUDG (Palumbi et al. 1991), and the partial d-loop
fragment using primers Des1 and Des2 (Starkey et al.
2003). Reactions were performed in a total volume of
Fig. 1 The geographic range of Glyptemys muhlenbergii can bedivided in to three geographically isolated segments occupyingthe southern, northeastern, and the Lake Plains/Prairie Penin-
sula regions of the species’ range. Numbered dots identifycounties where single or multiple populations were sampled forthis study. Populations sampled correspond to those in Table 1.
Conserv Genet (2007) 8:331–342 333
123

25 ll, each containing 100 ng template DNA, 1· PCR
Buffer, 0.75 mM dNTPs, 1.5 mM MgCl2, 1 uM primer,
and 0.625 units of Taq polymerase. PCR conditions
were the same for all three fragments: 95�C initial
denaturation for 5 min, 35 amplification cycles of
denaturation at 94�C for 1 min, annealing at 50�C for
1 min, extension at 72�C for 1 min, and a final 5 min
extension at 72�C. Exonuclease I (10 units) and SAP
(1 unit) were used to remove unincorporated oligonu-
cleotides and dNTPs. For each successful amplification
we performed cycle sequencing reactions with Big Dye
terminator sequencing kits according to manufacturer’s
protocol (Applied Biosystems, Perkin Elmer, Foster
City, CA). Cycle sequencing reaction conditions were
25 cycles of 96�C (30 s), 50�C (15 s), and 60�C (4 min).
We used the same sequencing primers used in the ori-
ginal amplification, with the exception of an internal
sequencing primer designed for cytb (Cmprimus; 5¢-TGAGGCCAAATATCCTTCTGAGGTGCCACCG-3¢).We sequenced each gene in both directions to avoid
base-calling ambiguities. Products were column puri-
fied to remove non-incorporated terminator dye using
SephadexTM G-50 and products were electrophoresed
on a 6% denaturing polyacrylamide gel on an ABI 377
automated sequencer. For 41 bog turtle samples we
sequenced 889 bp of the nd4-tRNA fragment, 1179 bp
of the cytb–tRNA fragment and 725 bp of d-loop
(corresponding to positions 10920–11809, 14399–15583,
and 15889–16563 of the complete mtDNA genome for
C. picta; Mindell et al. 1999). We detected very low
levels of nucleotide diversity in our initial rangewide
sampling of bog turtles, therefore, in addition to the
41 individuals sequenced at all gene fragments, we also
sequenced one or two target genes for an additional 33
individuals to determine whether the low levels of
observed variability could be explained by low sample
sizes. Electropherograms were checked by eye using
the editing program Sequencher v.4.1 (GeneCodes,
Michigan).
Analyses
We aligned cytb, nd4, and d-loop sequences separately
using ClustalW (Thompson et al. 1994) in the Meg-
Align v. 6.1.2 program of the Lasergene sequence
analysis software (DNASTAR, Inc., Madison, Wis-
consin). For each gene, we used gap penalty to gap
length ratios ranging from 2/3 to 20 (2/3, 1, 2, 5, 10,
16.6, 20) to identify any regions of ambiguous homol-
ogy (Gatesy et al. 1993). All other alignment parame-
ters were held constant at the default values.
Low levels of nucleotide diversity precluded mean-
ingful phylogenetic reconstruction. Therefore, we used
statistical parsimony (Templeton et al. 1992), imple-
mented in the program TCS version 1.13 (Clement
et al. 2000), to examine the evolutionary relationships
among haplotypes. We calculated haplotype diversity
(h = 1–S fi2, where f is the frequency of the ith haplo-
type; Nei 1987; Avise 2000) and nucleotide diversity,
the average number of nucleotide differences per site
between sequences, P = S fi fj pij where pij is the
sequence divergence between the ith and jth haplotype;
Table 1 Sampling localities,sample sizes (N), andgeographic distribution ofunique haplotypes inGlyptemys muhlenbergiipopulations included in ourstudy. Localities correspondto those in Fig. 1.
*Haplotype designation basedon 5 of 6 variable sites forcytb and d-loop.
Region State Locality County Haplotypes N
Lake Plains New York 1a Oswego A 5New York 1b Oswego A/C 3/1New York 2 Seneca A/B 1/1
Northeast Massachusetts 3 Berkshire A 2New York 4 Columbia A 2New York 5a Dutchess A 1New York 5b Dutchess A 2New York 5c Dutchess A 2Pennsylvania 6 Monroe A 1Pennsylvania 7 Chester A 1
South Virginia 8 Floyd E 2Virginia 9 Patrick E 2Virginia 10 Carroll E 2North Carolina 11 Surrey E 1North Carolina 12a Alleghany E* 1North Carolina 12b Alleghany D 2North Carolina 12c Alleghany D/E 1/1North Carolina 13a Wilkes D 2North Carolina 13b Wilkes D 2North Carolina 13c Wilkes D 2North Carolina 13d Wilkes D 1
Total 41
334 Conserv Genet (2007) 8:331–342
123

Nei 1987; Avise 2000) to evaluate the genetic signature
of possible historical demographic changes in bog turtle
populations. We quantified h and P at two scales: range
wide (all populations) and regionally (with northern
and southern populations analyzed separately).
Mismatch distributions of individual pairwise dif-
ferences between mtDNA haplotypes provide infor-
mation about historical demography of populations
(Rogers and Harpending 1992; Rogers et al. 1996).
Theoretical studies have shown that population growth
has a strong affect on patterns of genetic polymor-
phism (Rogers and Harpending 1992). Populations
in long and stable demographic equilibrium have
multimodal distributions, whereas the distribution is
unimodal (approximately Poisson) in populations that
have passed through demographic expansions (possibly
following a bottleneck). To test for population expan-
sion, we conducted a mismatch distribution test using
Arlequin v. 2.0 (Schneider et al. 2000) to calculate the
expansion parameters s, h1, and h0. These parameters
are fitted by a generalized least square procedure and
represent age of expansion (s = 2l t) expressed in units
of mutational time, and population size before (h 0 = 2lN0) and after (h1 = 2l N1) expansion, where N0 and N1
are the effective female population sizes. The fit of
mismatch distributions to the expansion model was
assessed with 1000 Monte Carlo simulations and we
calculated the upper and lower boundaries of the
mismatch at a = 0.01. The significance probability was
calculated by comparing the sum of square deviations
(SSD) between the observed data and those from the
simulated expansion model; a significant P value re-
jects the fit of the data to the expansion model. We
also calculated Tajima’s D (Tajima 1989) and Fu’s FS
(Fu 1997). Historical population growth predicts sig-
nificantly negative D and FS values (Tajima 1989; Fu
1997). The significance of any deviation from values
expected under demographic stationarity was tested
with 1000 bootstrap replicates in Arlequin v. 2.0.
Because the northern (including both Northeastern
and Lake Plains populations) and southern regions of
the species range may have very different histories,
we also considered them separately in analyses.
Results
We detected only five haplotypes among the 41 G.
muhlenbergii individuals sampled for all three genes
combined (total 2793 bp), a surprisingly low level of
genetic variation. We did not find any polymorphism
among all nd4 sequences (100% similarity); we
detected four polymorphic nucleotide sites in the cytb
fragment (three transitions and one transversion;
average pairwise similarity = 99.84%) and two nucle-
otide transitions in the d-loop (average pairwise simi-
larity = 99.87%; Table 2). We combined cytb (1179 bp)
and d-loop (725 bp) fragments and aligned the total
1904 nucleotides for analyses. Because our initial re-
sults were surprising, we increased our sampling by
sequencing 33 additional samples (primarily from the
northern part of the range) at one or two of our target
gene fragments to confirm that the pattern was not a
result of small sample sizes. Additional sampling re-
vealed no novel or undetected haplotypes and the data
were entirely consistent with the findings of the original
sample. Northern bog turtles had genetic profiles con-
sistent with haplotype A (15 additional individuals were
sequenced at nd4, 12 individuals at cytb, and 5 at a
combination of two genes (nd4/cytb, cytb/d-loop or
nd4/d-loop). We sequenced cytb for one additional
turtle from the south and that individual had a sequence
profile consistent with haplotype D. We continued our
analyses with the 41 samples for which we had complete
data at all three gene fragments, since they apparently
encompass all the diversity found throughout the range
of this species.
Sequence alignment using ClustalW resulted in zero
alignment-invariant sites and zero alignment-ambigu-
ous sites for cytb, and 2 alignment-invariant sites and 14
alignment-ambiguous sites for d-loop. All alignment
Table 2 Variable nucleotide sites for Glyptemys muhlenbergii across three mitochondrial genes.
Haplotype cytb d-loop
14404 14624 14625 15392 16317 16360
A C G T T T CB . . G . . .C . . . . C .D T . . . . .E T A . C . T
All individuals sequenced were monomorphic for the nd4 fragment, thus the six variable sites were found in cytb (4 sites) and d-loop(2 sites) only. Numbers correspond to nucleotide positions in the C. picta mitochondrion (Mindell et al. 1999); dots indicate bases equalto those in haplotype A. Sequences for each gene fragment have been accessioned in Genbank (DQ499646–DQ499656).
Conserv Genet (2007) 8:331–342 335
123

ambiguous sites were indel mutations between the
outgroups and bog turtle sequences, and none corre-
sponded to polymorphic sites within bog turtle samples.
Despite this low rangewide and regional nucleotide
diversity, we did find fixed genetic differences between
populations in the northern and southern portions of
the range. Bog turtle populations in the Lake Plains/
Prairie Peninsula region included one of three haplo-
types found at unequal frequencies: haplotypes A
(82%), B (9%) and C (9%). Populations in the
northeast were fixed for haplotype A. In the south
haplotypes D and E were observed in approximately
equal frequency (56% D and 44% E). Haplotype A,
the most common haplotype in the northern segments
of the species’ range, is a single nucleotide transitional
mutation from the widespread southern haplotype D
(Fig. 2, Table 2). Haplotypes B and C are a single
mutational step from the widespread northern haplo-
type A and these two haplotypes are each restricted to
single populations in the Lake Plains region (Fig. 2,
Table 1). One North Carolina individual had a genetic
profile consistent with Haplotype E across 2554 of
2793 bp (including 5/6 variable sites) but this haplotype
assignment is tentative because of missing data at the
cytb ‘T/C’ positional transversion (14404; Table 2). Due
to exceedingly low levels of variation, even a single error
at polymorphic sites can affect patterns of geographic
genetic diversity, therefore the sequence for this indi-
vidual was not included in the diversity or mismatch
analyses. The outgroup taxa were too divergent for
inclusion within the haplotype network, and exceeded
the 95% confidence interval for statistical parsimony.
Glyptemis insculpta, the immediate outgroup to bog
turtles (Feldman and Parham 2002) is 95 mutational
steps from the nearest bog turtle haplotype.
Rangewide haplotype diversity was moderately high
(h = 0.664) while nucleotide diversity was exceptionally
low (P = 0.000279). We found regional differences in
these measures of genetic diversity; the two northern
population groups are characterized by lower haplotype
and nucleotide diversity (h = 0.169, P = 0.00003) com-
pared to southern populations (h = 0.5, P = 0.000452).
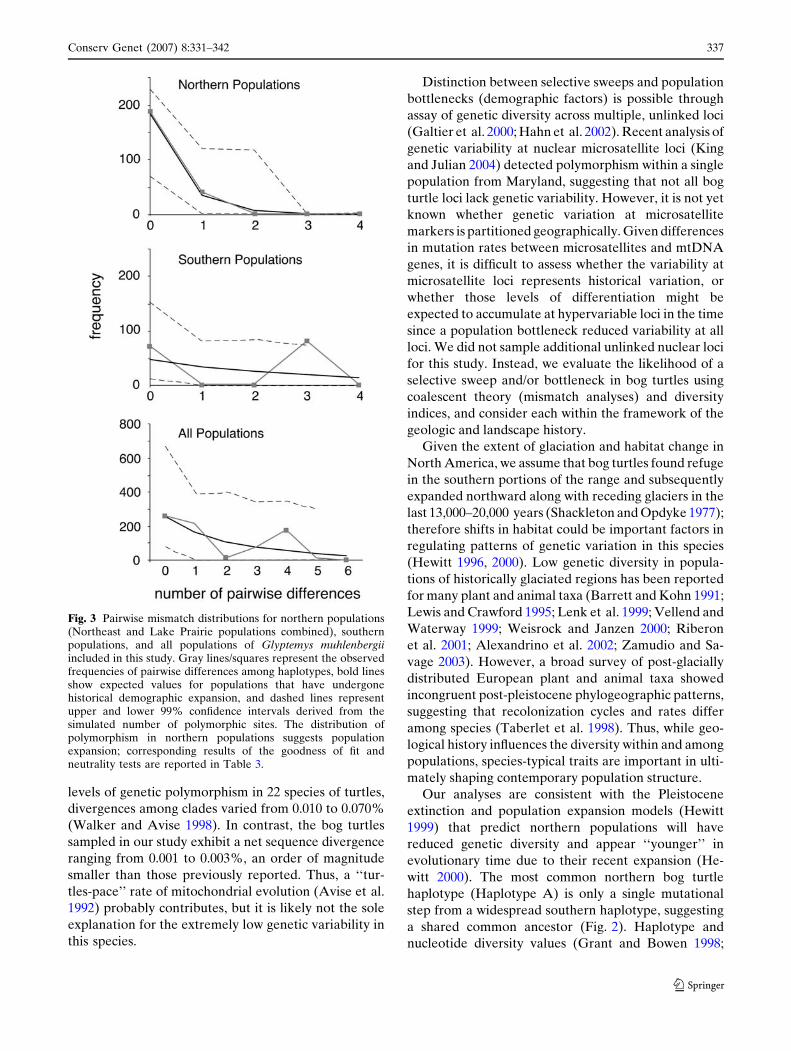
Mismatch analyses significantly supported the hypoth-
esis of range-wide population expansion, but the pat-
terns differed among regions; we detected a signature of
rapid population expansion for northern populations
but not for southern populations using goodness-of-fit
test, Tajima’s D, and Fu’s FS (Fig. 3, Table 3).
Discussion
Possible causes of low genetic diversity
We predicted deep intraspecific divergences and pop-
ulation structure among bog turtle populations due to a
number of intrinsic and extrinsic factors, including
fragmented range, historical barriers to gene exchange,
small population sizes, high longevity, low dispersal
capacity, and low reproductive rate. Indeed, we found
significant differentiation (no shared haplotypes
between northern and southern regions; Table 3);
however, contrary to our predictions we observed ex-
tremely shallow divergence suggesting alternative
evolutionary forces have shaped the genetic composi-
tion of this species. We discuss four possible scenarios
that could explain the extremely low levels of diver-
gences observed in this species: (1) slow rate of
mtDNA evolution, (2) selective sweep of the mtDNA
genome, (3) population bottleneck due to Pleistocene
recolonization, and (4) an interaction between life-
history and habitat specificity that reduces the fixation
of geographic variation in this system.
Slow rate of turtle mitochondrial DNA evolution is
one potential explanation for the genetic homogeneity
among bog turtle populations (Amato et al. 1997; King
and Julian 2004). Although turtle species vary signifi-
cantly in their degree of intraspecific differentiation
(Walker and Avise 1998), an increasing number of
rangewide studies have revealed relatively low levels of
variation in many freshwater species, despite broad
geographic distributions and potential barriers to gene
flow (Weisrock and Janzen 2000; Starkey et al. 2003;
Spinks and Shaffer 2005). In a now classic survey of
Fig. 2 TCS haplotype network for 5 haplotypes (cytb and d-loopfragments combined) detected in 41 Glyptemys muhlenbergiiindividuals. Each line represents a single mutational change.Each haplotype is represented by a circle and the area of thecircle is proportional to the number of individuals with thathaplotype. Black circles indicate intermediate haplotypes notsampled in this study.
336 Conserv Genet (2007) 8:331–342
123
levels of genetic polymorphism in 22 species of turtles,
divergences among clades varied from 0.010 to 0.070%
(Walker and Avise 1998). In contrast, the bog turtles
sampled in our study exhibit a net sequence divergence
ranging from 0.001 to 0.003%, an order of magnitude
smaller than those previously reported. Thus, a ‘‘tur-
tles-pace’’ rate of mitochondrial evolution (Avise et al.
1992) probably contributes, but it is likely not the sole
explanation for the extremely low genetic variability in
this species.
Distinction between selective sweeps and population
bottlenecks (demographic factors) is possible through
assay of genetic diversity across multiple, unlinked loci
(Galtier et al. 2000; Hahn et al. 2002). Recent analysis of
genetic variability at nuclear microsatellite loci (King
and Julian 2004) detected polymorphism within a single
population from Maryland, suggesting that not all bog
turtle loci lack genetic variability. However, it is not yet
known whether genetic variation at microsatellite
markers is partitioned geographically. Given differences
in mutation rates between microsatellites and mtDNA
genes, it is difficult to assess whether the variability at
microsatellite loci represents historical variation, or
whether those levels of differentiation might be
expected to accumulate at hypervariable loci in the time
since a population bottleneck reduced variability at all
loci. We did not sample additional unlinked nuclear loci
for this study. Instead, we evaluate the likelihood of a
selective sweep and/or bottleneck in bog turtles using
coalescent theory (mismatch analyses) and diversity
indices, and consider each within the framework of the
geologic and landscape history.
Given the extent of glaciation and habitat change in
North America, we assume that bog turtles found refuge
in the southern portions of the range and subsequently
expanded northward along with receding glaciers in the
last 13,000–20,000 years (Shackleton and Opdyke 1977);
therefore shifts in habitat could be important factors in
regulating patterns of genetic variation in this species
(Hewitt 1996, 2000). Low genetic diversity in popula-
tions of historically glaciated regions has been reported
for many plant and animal taxa (Barrett and Kohn 1991;
Lewis and Crawford 1995; Lenk et al. 1999; Vellend and
Waterway 1999; Weisrock and Janzen 2000; Riberon
et al. 2001; Alexandrino et al. 2002; Zamudio and Sa-
vage 2003). However, a broad survey of post-glacially
distributed European plant and animal taxa showed
incongruent post-pleistocene phylogeographic patterns,
suggesting that recolonization cycles and rates differ
among species (Taberlet et al. 1998). Thus, while geo-
logical history influences the diversity within and among
populations, species-typical traits are important in ulti-
mately shaping contemporary population structure.
Our analyses are consistent with the Pleistocene
extinction and population expansion models (Hewitt
1999) that predict northern populations will have
reduced genetic diversity and appear ‘‘younger’’ in
evolutionary time due to their recent expansion (He-
witt 2000). The most common northern bog turtle
haplotype (Haplotype A) is only a single mutational
step from a widespread southern haplotype, suggesting
a shared common ancestor (Fig. 2). Haplotype and
nucleotide diversity values (Grant and Bowen 1998;
Fig. 3 Pairwise mismatch distributions for northern populations(Northeast and Lake Prairie populations combined), southernpopulations, and all populations of Glyptemys muhlenbergiiincluded in this study. Gray lines/squares represent the observedfrequencies of pairwise differences among haplotypes, bold linesshow expected values for populations that have undergonehistorical demographic expansion, and dashed lines representupper and lower 99% confidence intervals derived from thesimulated number of polymorphic sites. The distribution ofpolymorphism in northern populations suggests populationexpansion; corresponding results of the goodness of fit andneutrality tests are reported in Table 3.
Conserv Genet (2007) 8:331–342 337
123

Avise 2000) further corroborate this scenario of post-
glacial population expansion. The low nucleotide and
haplotype diversity observed in northern populations
could indicate a population expansion from a single (or
few) haplotypes following population bottleneck. In
contrast, southern populations exhibit higher nucleo-
tide diversity, suggesting rapid population growth fol-
lowing a period of low effective population size. The
difference between these two scenarios is based on the
genetic diversity of founding populations and popula-
tion sizes prior to the presumed bottleneck as well as
sufficient time since the bottleneck to accumulate
mutations (Grant and Bowen 1998). We suggest that
northern bog turtle populations were recently founded
by colonizers bearing few haplotypes while the source
populations in the south were larger and more diverse.
Accordingly, our mismatch distribution analyses and
significance of D and FS detected a signature of rapid
population expansion for northern populations, but not
for southern ones, suggesting that demographic pro-
cesses in the north are unique (Fig. 3, Table 3). Mis-
match analyses also supported a rangewide population
expansion, however this pattern is likely driven by the
highly skewed distribution of haplotypes in the north.
Our inferences about historical demography of the
bog turtle are based on a small number of haplotypes
and few segregating sites, raising the question whether
our data can provide sufficient statistical power for
tests of population expansion. A recent study using
analyses of reduced data sets and simulations of
expanding and stable populations, demonstrated that
mismatch analyses, D, and FS were robust and con-
tinued to show the expected significant patterns
even with vastly reduced datasets (Pereira et al. 2001).
As expected, the mean and variance of mismatch
distributions changed, but the genetic patterns were
generally retained even with only 10 segregating sites
(the least diverse subsampled dataset in the study). A
comparison of the performance of the three tests for
population expansion suggested that Tajima’s D may
be more robust than FS in cases of small sample sizes,
but FS is more sensitive when few polymorphic sites are
present (Pereira et al. 2001). Our data set contains
both small sample sizes and low polymorphism; how-
ever, given the robustness of these tests, repeatable
results across tests of the bog turtle data, and the dif-
ferent patterns detected in northern and southern
populations, we conclude that these patterns are likely
not merely statistical artifacts.
Combined, our data suggest a historical population
bottleneck with subsequent rapid expansion for north-
ern turtle populations. Although we cannot eliminate
selective sweep or slow mtDNA evolution as possible
explanations of low genetic diversity in bog turtles, we
do find genetic evidence compatible with historical
bottlenecks and post-glacial colonization and hypothe-
size that the patterns of genetic diversity we observed
most likely resulted from these demographic processes.
Table 3 Mismatch distribution models, Tajima’s D, and Fu’s FS, detect different historical demographic processes in northern andsouthern segments of the bog turtle’s range.
Population
North South Combined
Model parametersN 22 18 40S 2 3 6s 3.00 (0.401–4.254) 4.02 (0.619–12.904) 4.87 (0.471–12.535)h1 0.078 (0–0.802) 0.003 (0–8.667) 0.002 (0–6.861)h0 0.227 (0–2300.227) 2.427 (0–4266.802) 2.088 (0.15–2396.462)Goodness-of-fit testSSD 0.0011 0.2701 0.045P 0.429* < 0.001 0.326*
Tajima’s D –1.514 2.276 0.511P 0.010* 0.992 0.633
Fu’s FS –1.974 4.253 1.169P 0.007* 0.976 0.811
We tested the significance of the model of population expansion using a goodness-of-fit test (Rogers and Harpending 1992; Schneiderand Excoffier 1999), Tajima’s D (Tajima 1989), and Fu’s FS (Fu 1997). The parameters of the model of population expansion, s, h0, andh1, are the age of expansion, and population size before and after expansion. S is the number of segregating sites. We report goodness-of-fit tests for the mismatch distributions (based on SSD, sum of squared deviations) and significance of D and FS. Non-significantvalues for SSD (P > 0.05) signify that the data do not deviate from that expected under the model of expansion. Significant negative Dand FS values are expected in cases of population expansion.
*Model significant for population expansion.
338 Conserv Genet (2007) 8:331–342
123
Post-Pleistocene range expansion may account for
the reduced genetic variability of bog turtle popula-
tions; however, other factors may also enhance genetic
uniformity in long-lived vertebrates (Kuo and Janzen
2003, 2004; Mockford et al. 2004). Bog turtles inhabit
open-canopy wetlands that are subject to ecological
succession to closed-canopy, wooded swamplands
rendering them inappropriate for this species (Tryon
and Herman 1990; Klemens 1993). It is assumed that
historically turtles compensated for these natural habi-
tat shifts via migration (Carter et al. 2000) and that
natural processes such as beaver activity or fires created
new habitat patches, thus maintaining populations con-
nected through low levels of gene flow. This mechanism
has been proposed for other long-lived organisms that
rely on low levels of gene flow to balance the genetic cost
of isolation (Scribner et al. 1984; Mockford et al. 2004).
In addition to being long-lived, bog turtles also have
small population sizes, delayed sexual maturity, and
low reproductive output (USFWS 2001); life history
characters that inhibit rapid genetic change (Bromham
2002). It is possible that the turnover rate of suitable
habitat exceeds the expected rate of genetic fixation in
a population. In other words, the life history charac-
teristics of this species, coupled with specialization on a
‘‘short-lived’’ habitat could result in a pattern of re-
peated extinction–recolonization dynamics in neigh-
boring populations. This combination of life history
and habitat turnover (promoting low fixation and
multiple founder events) could potentially result in the
repeated loss of polymorphism and retention of few
mitochondrial haplotypes. Future finer-scale popula-
tion genetic studies and modeling approaches could be
used to investigate the feasibility of this scenario as a
general explanation for low levels of diversity in taxa
with this combination of characteristics.
Phylogeographic comparison with other turtles in
eastern North America
Population genetic studies have been carried out in
three North American freshwater turtles with distri-
butions similar to that of the bog turtle: the painted
turtle, C. picta (Starkey et al. 2003), softshell turtles,
Apalone spinifera (Weisrock and Janzen 2000), and the
common snapping turtle, Chelydra serpentina (Phillips
et al. 1996; Walker et al. 1998). In general, these
studies reveal a shared history of northward post-gla-
cial colonization from more genetically diverse south-
ern populations, although absolute degrees of genetic
differentiation vary substantially among studies.
Apalone spinifera (softshell turtle) and Chrysemis
picta (painted turtle) both exhibit higher genetic
diversity and structure in southern populations relative
to northern populations. A mitochondrial DNA phy-
logeny supports the conclusion that A. spinifera pop-
ulations in the north were derived from southern
populations as a result of post-Pleistocene glacial dis-
persal (Weisrock and Janzen 2000). Similarly, phylo-
genetic analyses of C. picta (painted turtle) populations
across North America revealed four distinct clades,
one of which is less genetically diverse and widespread
in the northeastern U.S., the pattern expected after
regional glacial extirpation and recolonization events
(Starkey et al. 2003). Phylogeographic sampling of
Chelydra serpentina (common snapping turtle) re-
vealed low overall genetic variation and shallow pop-
ulation divergences; however, sampling for that study
focused on south-eastern populations (Walker et al.
1998); therefore direct genetic comparisons are not
possible with our data set. However, all three species
show higher genetic diversity rangewide than we found
in bog turtle populations, suggesting that the demo-
graphic changes that shaped genetic distribution in G.
muhlenbergii were extreme, even when compared to
other co-distributed turtles.
Analyses of fossil faunas suggest that the painted
and the snapping turtle were early invaders of formerly
glaciated areas at the end of the Wisconsinan (Holman
and Andrews 1994), and these species have several
behavioral, physiological, and reproductive adapta-
tions for cold tolerance (Obbard and Brooks 1979,
1981a; Storey et al. 1988; St. Clair and Gregory 1990).
Although these species are generally habitat general-
ists and are capable of significant overland dispersal
(Obbard and Brooks 1981b; Ernst et al. 1994; Holman
and Andrews 1994), a common pattern in phylogeo-
graphic structure of these widespread freshwater tur-
tles is the apparent reduced levels of variability even in
southern portion the range (Walker et al. 1998; Starkey
et al. 2003). The population-level phylogeny of painted
turtle suggests that this species was present in the
Great Plains/Rocky Mountain region, was extirpated,
and subsequently recolonized the region, perhaps due
to a brief period of aridification approximately 14,000-
years ago (Starkey et al. 2003). These extinction/colo-
nization dynamics reduce genetic differentiation and
are similar to the more localized recolonization pro-
cesses we propose as a mechanism for reduced popu-
lation-level variability in bog turtles inhabiting
temporary successional habitats.
Conservation implications
Due to anthropogenic landscape changes, the loss of fens
and bogs in the last century far exceeds the creation of
Conserv Genet (2007) 8:331–342 339
123

novel, suitable habitat patches (Herman 1989; Tryon
and Herman 1990; Klemens 1990, 2000). Fragmentation
of bog turtle habitat will further limit gene flow among
remaining sub-populations, preventing the exchange of
genetic diversity in this species. However, low genetic
diversity seems to be a historical characteristic of this
species, therefore, the lack of genetic variability is not
likely the largest threat to the persistence of bog turtles.
Preservation of extant habitats supporting populations
with sustainable levels of recruitment and the restora-
tion or creation of habitats in areas occupied historically
are likely the most important measure necessary for
conservation of this species.
Acknowledgements We thank Tim King and Robyn Johnsonfor tissues and DNA extracts from bog turtle populations in MA,PA, NC, and VA; Ann Somers and Project Bog Turtle forsamples from NC and VA; Alison Whitlock and MichaelKlemens for samples from MA; and Robert Zappalorti forsamples from PA. The Royal Ontario Museum provided thetissue of G. insculpta. Diane Lynch (USFWS) kindly facilitatedthe necessary permits. Alvin Breisch, Jesse Jaycox, JohnSullivan, and Andrew Nelson provided support and assistance inthe field for sampling of New York populations. Field and labstudies were supported by grants and contracts from SUNY-Oswego, the New York State Department of EnvironmentalConservation, and the Linnaeus Fund of the Chelonian ResearchFoundation (to PAR); remaining laboratory work was funded byNSF grant DEB-9907798 (to KZ). Labwork was performed inthe Evolutionary Genetics Core Facility at Cornell University.We thank J. Austin, F. Janzen, and two anonymous reviewersfor comments on earlier versions of the manuscript.
References
Alexandrino J, Arntzen JW, Ferrand N (2002) Nested cladeanalysis and the genetic evidence for population expansionin the phylogeography of the golden-striped salamander,Chioglossa lusitanica (Amphibia: Urodela). Heredity88:66–74
Amato GD, Behler JL, Tryon BW, Herman DW (1997) Mo-lecular variation in the bog turtle, Clemmys muhlenbergii.In: Proceedings of the International Conference of Con-servation, Restoration and Management of Tortoises andTurtles. New York Turtle and Tortoise Society, New York,pp 259–262
Arevalo E, Davis SK, Sites JW Jr (1994) Mitochondrial DNAsequence divergence and phylogenetic relationships amongeight chromosome races of the Sceloporus grammicuscomplex (Phrynosomatidae) in central Mexico. Syst Biol43:387–418
Austin JD, Lougheed SC, Boag PT (2004) Controlling for theeffects of history and nonequilibrium conditions in gene flowestimates in northern bullfrog (Rana catesbeiana) popula-tions. Genetics 168:1491–1506
Austin JD, Lougheed SC, Neidrauer L, Check AA, Boag PT(2002) Cryptic lineages in a small frog: the post-glacial his-tory of the spring peeper, Pseudacris crucifer (Anura: Hy-lidae). Mol Phylogenet Evol 25:316–329
Avise JC, Arnold J, Ball RM, Bermingham E, Lamb T,Neigel JE, Reeb CA, Saunders NC (1987) Intraspecific
phylogeography: the mitochondrial DNA bridge betweenpopulation genetics and systematics. Ann Rev Ecol Syst18:489–522
Avise JC (2000) Phylogeography: the history and formation ofspecies. Harvard University Press, Cambridge
Avise JC, Bowen BW, Lamb T, Meylan AB, Bermingham E(1992) Mitochondria DNA evolution at a turtle’s pace:evidence for low genetic variability and reduced microevo-lutionary rate in the Testudines. Mol Biol Evol 9:457–463
Barrett SCH, Kohn JR (1991) Genetic and evolutionary conse-quences of small population size in plants: implications forconservation. In: Falk DA, Holsinger KE (eds), Geneticsand conservation of rare plants. Oxford University Press,Oxford, pp 3–30
Bernatchez L, Dodson JJ (1991) Phylogeographic structure inmitochondrial DNA of the Lake Whitefish (Coregonusclupeaformis) and its relation to Pleistocene glaciations.Evolution 45:1016–1035
Bernatchez L, Wilson C (1998) Comparative phylogeography ofNearctic and Palearctic fishes. Mol Ecol 7:431–452
Breisch AR (1988). New York state recovery plan—bog turtle(Clemmys muhlenbergii). Endangered Species Unit, NewYork State Department of Environmental Conservation,Albany, New York
Bromham L (2002) Molecular clocks in reptiles: life historyinfluences rate of molecular evolution. Mol Biol Evol19:302–309
Carter SL, Haas CA, Mitchell JC (1999) Home range and habitatselection of bog turtles in southwestern Virginia. J WildlifeManage 63:853–860
Carter SL, Haas CA, Mitchell JC (2000) Movement and activityof bog turtles (Clemmys muhlenbergii) in southwesternVirginia. J Herpetol 34:75–80
Chase JD, Dixon KR, Gates JE, Jacobs D, Taylor G (1989)Habitat characteristics, population size, and home range ofthe bog turtle, Clemmys muhlenbergii, in Maryland. J Her-petol 23:356–362
Clark AM, Bowen BW, Branch LC (1999) Effects of naturalhabitat fragmentation on an endemic scrub lizard (Scelop-orus woodi): an historical perspective based on mitochon-drial DNA gene genealogy. Mol Ecol 8:1093–1104
Clement M, Posada D, Crandall KA (2000) TCS: a com-puter program to estimate gene genealogies. Mol Ecol9:1658–1660
Conant R, Collins JT (1998) A field guide to reptiles andamphibians of Eastern and central North America.Houghton Mifflin, Boston
Ernst CH (1977) Biological notes on the bog turtle, Clemmysmuhlenbergii. Herpetologica 33:241–246
Ernst CH, Lovich JE, Barbour RW (1994) Turtles of theUnited States and Canada. Smithsonian Institution Press,Washington DC
Feldman CR, Parham JF (2002) Molecular phylogenetics ofemydine turtles: taxonomic revision and the evolution ofshell kinesis. Mol Phyl Evol 22:388–398
Fu Y-X (1997) Statistical tests of neutrality of mutations againstpopulation growth, hitchhiking and background selection.Genetics 147:915–925
Galtier N, Depaulis F, Barton NH (2000) Detecting bottlenecksand selective sweeps from DNA sequence polymorphism.Genetics 155:981–987
Gatesy J, Desalle R, Wheeler W (1993) Alignment-ambiguousnucleotide sites and the exclusion of systematic data. MolPhyl Evol 2:152–157
Grant WS, Bowen BW (1998) Shallow population histories indeep evolutionary lineages of marine fishes: insight from
340 Conserv Genet (2007) 8:331–342
123

sardines and anchovies and lessons for conservation. J Hered89:415–426
Groombridge B (1982) The IUCN amphibia–reptilia red databook: Testudines, Crocodylia, Rhynchocephalia. IUCN,Gland Switzerland
Hahn MW, Rausher MD, Cunningham CW (2002) Distinguish-ing between selection and population expansion in anexperimental lineage of bacteriophage T7. Genetics 161:11–20
Herman DW (1989) Tracking the rare bog turtle. Wildlife NorthCarol 53:17–19
Herman DW, Tryon BW (1997) Land use, development, andnatural succession and their effects on bog turtle habitatin the southeastern United States. In: Van Abbema J(ed), Proceedings: Conservation, Restoration, and Man-agement of Tortoises and Turtles: an International Con-ference. New York Turtle and Tortoise Society, New York,pp 364–371
Hewitt GM (1996) Some genetic consequences of ice ages, andtheir role in divergence and speciation. Biol J Linn Soc58:247–276
Hewitt GM (1999) Post-glacial colonization of European biota.Biol J Linn Soc 68:87–112
Hewitt GM (2000) The genetic legacy of the Quaternary iceages. Nature 405:907–913
Hoelzel AR (1999) Impact of population bottlenecks on geneticvariation and the importance of life-history; a case study ofthe northern elephant seal. Biol J Linn Soc 68:23–29
Holman JA, Andrews KD (1994) North America quaternarycold-tolerant turtles: distributional adaptations and con-straints. Boreas 23:44–52
Holman JA, Fritz U (2001) A new emydine species from theMiddle Miocene (Barstovian) of Nebraska, USA with a newgeneric arrangement for the species of Clemmys sensuMcDowell (1964) (Reptilia:Testudines: Emydidae). Zoo-logische Abhandlungen Staatliches Museum fur TierkundeDresden 51:331–354
King TL, Julian SE (2004) Conservation of microsatellite DNAflanking sequence across 13 Emydid genera assayed withnovel bog turtle (Glyptemys muhlenbergii) loci. ConservGenet 5:719–725
Klemens MW (1990) The herpetofauna of southwestern NewEngland. PhD thesis, University of Kent, Canterbury,United Kingdom
Klemens MW (1993) Amphibians and reptiles of Connecticutand adjacent regions. State Geol Nat Hist Survey Conn Bull112:1–318
Klemens MW (2000) Turtle conservation. Smithsonian Institu-tion Press, Washington, DC
Kuo CH, Janzen FJ (2003) Bottlesim: a bottleneck simulationprogram for long-lived species with overlapping generations.Mol Ecol Notes 3:339–373
Kuo CH, Janzen FJ (2004) Genetic effects of a persistentbottleneck on a natural population of ornate box turtles(Terrapene ornata). Conserv Genet 5:425–437
Lenk P, Fritz U, Joger U, Wink M (1999) Mitochondrial phy-logeography of the European pond turtle, Emys orbicularis(Linnaeus 1758). Mol Ecol 8:1911–1922
Lewis PO, Crawford DJ (1995) Pleistocene refugium endemicsexhibit greater allozymic diversity than widespread cong-eners in the genus Polygonella (Polygonaceae). Am J Bot82:141–149
Lopez JV, Culver M, Stephens JC, Johnson WE, O’Brien SJ(1997) Rates of nuclear and cytoplasmic mitochondrialDNA sequence divergence in mammals. Mol Biol Evol14:277–286
Mindell DP, Sorenson MD, Dimcheff DE, Hasegawa M, Ast JC,Yuri T (1999) Interordinal relationships of birds and otherreptiles based on whole mitochondrial genomes. Syst Biol48:138–152
Mockford SW, McEachern L, Herman TB, Snyder M, WrightJM (2004) Population genetic structure of a disjunct popu-lation of Blanding’s turtle (Emydoidea blandingii) in NovaScotia, Canada. Biol Conserv 123:373–380
Moritz C (1994) Applications of mitochondrial DNA analysis inconservation: a critical review. Mol Ecol 3:401–411
Nei M (1987) Molecular evolutionary genetics. ColumbiaUniversity Press, New York
Nevo E, Beiles A (1991) Genetic diversity and ecological het-erogeneity in amphibian evolution. Copeia 3:565–592
Nunney L (1991) The influence of age structure and fecundity oneffective population size. Proc Roy Soc Ser B 246:71–76
Obbard ME, Brooks RJ (1979) Factors affecting basking in anorthern population of the common snapping turtle Chely-dra serpentina. Can J Zool 57:435–440
Obbard ME, Brooks RJ (1981a) Fate of overwintered clutches ofthe common snapping turtle (Chelydra serpentina) inAlgonquin Park, Ontario. Can Field Nat 95:350–352
Obbard ME, Brooks RJ (1981b) A radio telemetry and markrecapture study of activity in the common snapping turtleChelydra serpentina. Copeia 1981:630–637
Palumbi S, Martin A, Romano S, McMillan WO, Stice L,Grabowski G (1991) The simple fool’s guide to PCR. Ver 2.University of Hawaii, Honolulu
Pereira L, Dupanloup I, Rosser ZH, Jobling MA, Barbujani G(2001) Y-chromosome mismatch distributions in Europe.Mol Biol Evol 18:1259–1271
Pesole G, Gissi C, De Chirico A, Saccone C (1999) Nucleotidesubstitutionrateofmammalianmitochondrialgenomes. JMolEvol 48:427–434
Peterson MA, Denno RF (1998a) The influence of dispersal anddiet breadth on patterns of genetic isolation by distance inphytophagous insects. Am Nat 152:428–446
Peterson MA, Denno RF (1998b) Life history strategies and thegenetic structure of phytophagous insect populations. In:Mopper S, Strauss S (eds), Genetic structure and localadaptation in natural insect populations: effects of ecology,life history, and behavior. Chapman and Hall, New York,pp 263–322
Phillips CA, Dimmick WW, Carr JL (1996) Conservationgenetics of the common snapping turtle (Chelydra serpen-tina). Conserv Biol 10:397–405
Riberon A, Miaud C, Grossenbacher K, Taberlet P (2001) Phy-logeography of the alpine salamander, Salamandra atra(Salamandridae) and the influence of the Pleistocene climaticoscillations on population divergence. Mol Ecol 10:2555–2560
Rogers AR, Harpending H (1992) Population growth makeswaves in the distribution of pairwise genetic differences.Mol Biol Evol 9:552–569
Rogers AR, Fraley AE, Bamshad MJ, Watkins WE, Jorde LB(1996) Mitochondrial mismatch analysis is insensitive to themutational process. Mol Biol Evol 13:895–902
Ross TR (1999) Phylogeography and conservation genetics ofthe Iowa pleistocene snail. Mol Ecol 8:1363–1373
Sambrook J, Russell DW (2001) Molecular cloning: a laboratorymanual, 3rd edn. Cold Springs Harbor Laboratory Press,New York
Schneider S, Excoffier L (1999) Estimation of past demo-graphic parameters from the distribution of pairwise dif-ferences when the mutation rates vary among sites:application to human mitochondrial DNA. Genetics152:1079–1089
Conserv Genet (2007) 8:331–342 341
123

Schneider S, Roessli D, Excoffier L (2000) Arlequin: a softwarefor population genetics data analysis. Ver 2.000. Geneticsand Biometry Lab, Dept. of Anthropology, University ofGeneva
Scribner KT, Smith MH, Gibbons JW (1984) Genetic differen-tiation among local populations of the yellow-bellied sliderturtle Pseudemys scripta. Herpetologica 40:382–387
Scribner KT, Evans J, Morreale SJ, Smith MH, Gibbons JW(1986) Genetic variability among populations of the yellow-bellied slider turtle (Pseudemys scripta) from aquaticallyand terrestrially separated habitats. Copeia 1986:691–700
Scribner KT, Congdon JD, Chesser RK, Smith MH (1993)Annual differences in female reproductive success affectspatial and cohort-specific genotypic heterogeneity inpainted turtles. Evolution 47:1360–1373
Shackleton NJ, Opdyke ND (1977) Oxygen isotope and paleo-magnetic evidence for early Northern Hemisphere glacia-tion. Nature 270:216–219
Shackleton NJ, Backman J, Zimmerman H, Kent DV, Hall MA,Roberts DG, Schnikter D, Baldauf JG, Desprairies A,Homrighausen R, Huddlestun P, Keene JB, Kaltenback AJ,Krumsiek KAO, Morton AC, Murray JW, and Westberg-Smith J (1984) Oxygen isotope calibration of the onset of icerafting and the history of glaciation in the North Atlanticregion. Nature 307:620–623
Shaffer HB, Meylan P, McKnight ML (1997) Tests of turtlephylogeny: molecular, morphological and paleontologicalapproaches. Syst Biol 46:235–268
Spinks PQ, Shaffer HB (2005) Range-wide molecular analysis ofthe western pond turtle (Emys marmorata): cryptic varia-tion, isolation by distance, and their conservation implica-tions. Mol Ecol 14:2047–2064
Starkey DE, Shaffer HB, Burke RL, Forstner MRJ, Iverson JB,Janzen FJ, Rhodin AG, Ultsch GR (2003) Molecular sys-tematics, phylogeography, and the effects of Pleistoceneglaciation in the painted turtle (Chrysemys picta) complex.Evolution 57:119–128
St. Clair RC, Gregory PT (1990) Factors affecting the northernrange limit of painted turtles (Chrysemys picta): winteracidosis or freezing? Copeia 1990:1083–1089
Storey KB, Storey JM, Brooks SPJ, Churchill TA, Brooks RJ(1988) Hatchling turtles survive freezing during winterhibernation. Proc Natl Acad Sci USA 85:8350–8354
Taberlet P, Fumagalli L, Wust-Saucy A-G, Cosson J-F (1998)Comparative phylogeography and postglacial colonizationroutes in Europe. Mol Ecol 7:453–464
Tajima F (1989) Statistical method for testing the neutralmutation hypothesis by DNA polymorphism. Genetics123:585–595
Templeton AR, Crandall KA, Sing CF (1992) A cladistic analysisof phenotypic associations with haplotypes inferred fromrestriction endonuclease mapping and DNA sequence data.III. Cladogram estimation. Genetics 132:597–601
Thompson JD, Higgins DG, Gibson TJ (1994) Clustal W: improvingthe sensitivity of progressive multiple sequence alignmentthrough sequence weighting, position-specific gap penaltiesand weight matrix choice. Nucl Acids Res 22:4673–4680
Turtle Conservation Fund (2002) A global action plan for con-servation of tortoises and freshwater turtles. Strategy andfunding prospectus 2002–2007. Conservation Internationaland Chelonian Research Foundation, Washington, DC
Tryon BW (1990) Bog turtles (Clemmys muhlenbergii) in thesouth—a question of survival. Bull Chicago Herpetol Soc25:57–66
Tryon BW, Herman DW (1990) Status, conservation, and man-agement of the bog turtle, Clemmys muhlenbergii, in thesoutheastern United States. In: Beaman K, Caporaso F,McKeown S, Graff M (eds), Proceedings of the first interna-tional symposium on turtles and tortoises: conservation andcaptive husbandry. Chapman University, Orange California,pp 36–53
United States Fish and Wildlife Service (2001) Bog turtle(Clemmys muhlenbergii), northern population, recoveryplan. Hadley, Massachussetts
Vellend M, Waterway MJ (1999) Geographic patterns in the ge-netic diversity of a northern sedge, Carex rariflora. Can J Bot7:269–278
Walker D, Avise JC (1998) Principles of phylogeography asillustrated by freshwater and terrestrial turtles in thesoutheastern United States. Ann Rev Ecol Syst 29:23–58
Walker D, Moler PE, Buhlmann KA, Avise JC (1998) Phylo-genetic uniformity in mitochondrial DNA of the snappingturtle (Chelydra serpentina). Anim Conserv 1:55–60
Weisrock DW, Janzen FJ (2000) Comparative molecular phy-logeography of North American Softshell Turtles (Ap-alone spinifera): implications for regional and wide-scalehistorical evolutionary forces. Mol Phylogenet Evol14:152–164
Zamudio KR, Savage WK (2003) Historical isolation, rangeexpansion, and secondary contact of two highly divergentmitochondrial lineages in spotted salamanders (Ambystomamaculatum). Evolution 57:1631–1652
342 Conserv Genet (2007) 8:331–342
123
Related Documents