RESEARCH ARTICLE Unexpected connections between residential urban forest diversity and vulnerability to two invasive beetles Adam Berland • Grant P. Elliott Received: 25 November 2012 / Accepted: 9 October 2013 / Published online: 17 October 2013 Ó Springer Science+Business Media Dordrecht 2013 Abstract Invasive pests pose a threat to the key environmental and social benefits provided by urban forests, and diverse tree planting is a primary management strategy for reducing pest vulnerability. For example, past urban forest losses to Dutch elm disease (DED) prompted municipal foresters to emphasize diversification, but it is unclear whether residential properties developed after the peak DED outbreak are actually more diverse than older proper- ties. To address this issue, we inventoried all public and private trees on 150 residential properties in the Twin Cities Metropolitan Area, Minnesota, USA, and compared genus diversity on pre- and post-Dutch elm properties. We then quantified vulnerability to two current invasive pest threats, emerald ash borer (EAB) (Agrilus planipennis) and Asian longhorned beetle (ALB) (Anoplophora glabripennis), to evaluate whether higher diversity corresponds with lower pest vulnerability. We assessed vulnerability based on two fundamental urban forest metrics–frequency and size of vulnerable trees. Surprisingly, properties developed after the peak DED outbreak were less diverse than older properties. At the same time, less diverse post- Dutch elm properties exhibited low ALB vulnerability and modest EAB vulnerability, while more diverse older sites were highly susceptible to ALB. The importance of pest host specificity in characterizing urban forest vulnerability was underscored by low EAB vulnerability and high ALB vulnerability on our oldest study sites. This research highlights an apparent disconnect between the theoretical notion that higher diversity should reduce invasive pest vulnerability, and our empirical data indicating that genus diversity does not necessarily correspond with pest vulnerability. Keywords Genus diversity Pest vulnerability Emerald ash borer Asian longhorned beetle Housing age Minnesota, USA Introduction Urban forests are a key component of the urban ecological landscape because they provide key envi- ronmental benefits including stormwater interception (Dwyer et al. 1992), air quality improvement (Nowak A. Berland (&) Institute for the Environment and Sustainability, Miami University, Oxford, OH 45056, USA e-mail: [email protected] Present Address: A. Berland Office of Research and Development, National Risk Management Research Laboratory, Sustainable Technology Division, Sustainable Environments Branch, US Environmental Protection Agency, 26 West Martin Luther King Dr, MS 443, Cincinnati, OH 45268, USA G. P. Elliott Department of Geography, University of Missouri, Columbia, MO 65211, USA 123 Landscape Ecol (2014) 29:141–152 DOI 10.1007/s10980-013-9953-2

Welcome message from author
This document is posted to help you gain knowledge. Please leave a comment to let me know what you think about it! Share it to your friends and learn new things together.
Transcript

RESEARCH ARTICLE
Unexpected connections between residential urban forestdiversity and vulnerability to two invasive beetles
Adam Berland • Grant P. Elliott
Received: 25 November 2012 / Accepted: 9 October 2013 / Published online: 17 October 2013
� Springer Science+Business Media Dordrecht 2013
Abstract Invasive pests pose a threat to the key
environmental and social benefits provided by urban
forests, and diverse tree planting is a primary
management strategy for reducing pest vulnerability.
For example, past urban forest losses to Dutch elm
disease (DED) prompted municipal foresters to
emphasize diversification, but it is unclear whether
residential properties developed after the peak DED
outbreak are actually more diverse than older proper-
ties. To address this issue, we inventoried all public
and private trees on 150 residential properties in the
Twin Cities Metropolitan Area, Minnesota, USA, and
compared genus diversity on pre- and post-Dutch elm
properties. We then quantified vulnerability to two
current invasive pest threats, emerald ash borer (EAB)
(Agrilus planipennis) and Asian longhorned beetle
(ALB) (Anoplophora glabripennis), to evaluate
whether higher diversity corresponds with lower pest
vulnerability. We assessed vulnerability based on two
fundamental urban forest metrics–frequency and size
of vulnerable trees. Surprisingly, properties developed
after the peak DED outbreak were less diverse than
older properties. At the same time, less diverse post-
Dutch elm properties exhibited low ALB vulnerability
and modest EAB vulnerability, while more diverse
older sites were highly susceptible to ALB. The
importance of pest host specificity in characterizing
urban forest vulnerability was underscored by low
EAB vulnerability and high ALB vulnerability on our
oldest study sites. This research highlights an apparent
disconnect between the theoretical notion that higher
diversity should reduce invasive pest vulnerability,
and our empirical data indicating that genus diversity
does not necessarily correspond with pest
vulnerability.
Keywords Genus diversity � Pest vulnerability �Emerald ash borer � Asian longhorned beetle �Housing age � Minnesota, USA
Introduction
Urban forests are a key component of the urban
ecological landscape because they provide key envi-
ronmental benefits including stormwater interception
(Dwyer et al. 1992), air quality improvement (Nowak
A. Berland (&)
Institute for the Environment and Sustainability, Miami
University, Oxford, OH 45056, USA
e-mail: [email protected]
Present Address:
A. Berland
Office of Research and Development, National Risk
Management Research Laboratory, Sustainable
Technology Division, Sustainable Environments Branch,
US Environmental Protection Agency, 26 West Martin
Luther King Dr, MS 443, Cincinnati, OH 45268, USA
G. P. Elliott
Department of Geography, University of Missouri,
Columbia, MO 65211, USA
123
Landscape Ecol (2014) 29:141–152
DOI 10.1007/s10980-013-9953-2
et al. 2006), and urban heat island reduction (Hardin
and Jensen 2007). In addition, urban forests are a
valuable structural asset (Nowak et al. 2002), and they
require substantial economic investment for tree
planting and maintenance (McPherson 2000; McPh-
erson et al. 2005). Furthermore, urban forests provide
socioeconomic benefits including recreation opportu-
nities, aesthetics, privacy, and increased property
values (Tyrvainen 1997; Payton et al. 2008). Trees
on residential lands are particularly important because
residential areas may account for half of urban land
area and approximately 75 % of urban trees and
related basal area (McPherson 1998). Thus, in light of
the environmental, economic, and social values of
urban forests, it is critically important to protect their
long-term structural integrity.
Invasive pests and pathogens pose serious threats to
urban forests. For example, Dutch elm disease (DED)
devastated American elm (Ulmus americana) popula-
tions for decades following its introduction to North
America in 1930 (Carter 1975). Originally from Asia
and thus considered an exotic species in North
America, the DED-causing fungi Ophiostoma ulmi
and O. novo-ulmi played a key role in prompting urban
foresters to consider the importance of diverse plant-
ings to protect urban forests from future pest outbreaks
(Miller 1997). In fact, various diversification goals
have been proposed to improve long-term urban forest
stability in the face of invasive pests (Barker 1975;
Grey and Deneke 1986; Santamour 1990; Miller and
Miller 1991). For instance, Santamour (1990) sug-
gested that urban forests should contain no more than
10 % of a single species, no more than 20 % of a
single genus, and no more than 30 % of a single
family.
Such efforts to diversify urban forests met three key
challenges. First, only a small set of species is well
suited to stressful urban environments, so increased
diversity may come at the expense of tree health and
longevity where poorly suited species are planted
(Richards 1982/1983). Second, nurseries carry limited
ranges of species that do not satisfy the requests of
urban foresters (Sydnor et al. 2010). Third, diversity
goals have historically focused on municipal street tree
and park tree populations (Barker 1975; Santamour
1990; Miller and Miller 1991). Consequently, this focus
overlooks tree diversity on private residential properties
where most urban trees are located (McPherson 1998).
So while coordinated diversification efforts at the
municipal scale may have increased public street tree
diversity, it is largely unknown whether overall urban
forest diversity increased following the DED outbreak
and subsequent loss of elm trees, because most tree
planting decisions are made by private landowners and
land developers. For instance, reduced diversity in trees
planted on residential properties, arising from uncoor-
dinated planting decisions among many landowners at
the household scale, may have offset or outweighed any
diversity increases in street tree populations. Under-
standing whether overall urban forest biodiversity
increased in residential areas following the devastating
DED outbreak is crucial for evaluating the effectiveness
of diversification efforts and vulnerability to future pest
outbreaks.
At present, urban forests in the Midwestern US are
threatened by two exotic beetles—the emerald ash
borer (EAB) and Asian longhorned beetle (ALB).
EAB (Agrilus planipennis) is a phloem-feeding beetle
first discovered in North America near Detroit, MI in
2002 (Poland and McCullough 2006). As its name
implies, EAB feeds on ash (Fraxinus) trees, which
were once a popular planting choice in urban
environments (Poland and McCullough 2006). In fact,
an estimated 37.9 million ash trees grow on developed
lands in the eastern US alone (Kovacs et al. 2010).
EAB is spreading rapidly across North America
(Prasad et al. 2010), and it generally kills infested
ash trees within 5 years without ongoing insecticide
treatments (McKenney and Pedlar 2012).
ALB (Anoplophora glabripennis) was discovered
in the US before EAB (1996 and 2002, respectively;
USDA APHIS 2013), but is currently not as wide-
spread. To date, notable infestations have been
reported in the metropolitan regions of New York,
NY, Chicago, IL, Cincinnati, OH, and Worcester, MA
(Haack et al. 2010; USDA APHIS 2013). Unlike EAB,
ALB has been successfully eradicated in two states
(USDA APHIS 2013), but ALB remains a major
concern because it threatens approximately 30–35 %
of urban trees in the US (Nowak et al. 2001; Smith and
Wu 2008). According to Wang (2012), ALB’s broad
range of preferred host genera includes maple (Acer),
buckeye/horse chestnut (Aesculus), birch (Betula),
willow (Salix), and elm (Ulmus). Additionally, Wang
(2012) indicates occasional or rare ALB infestations
have been noted in mimosa (Albizia), Katsura (Cer-
cidiphyllum), ash, plane tree (Platanus), poplar (Pop-
ulus), and mountain ash (Sorbus), with questionable
142 Landscape Ecol (2014) 29:141–152
123
accounts of US infestations in genera such as hack-
berry (Celtis), apple (Malus), and oak (Quercus). ALB
kills trees via larval tunneling in the wood and
cambium, which may impede vascular function and/
or cause structural failure (Haack et al. 2010).
Considered together, the combined threat posed by
EAB and ALB place approximately half of the trees in
eastern US cities at risk (Raupp et al. 2006), yet the
linkages between tree diversity and invasive beetle
vulnerability remain uncertain within inherently het-
erogeneous metropolitan regions.
In this study, we examined intra-regional variation
in pest vulnerability across time and space within
Minnesota’s Twin Cities Metropolitan Area (TCMA)
by focusing on two central questions. First, is urban
forest genus diversity higher on residential properties
developed after the peak DED outbreak, as compared
to older properties? Second, does higher urban forest
diversity correspond with lower pest vulnerability, as
measured by the frequency and sizes of vulnerable
trees? We hypothesized that urban forest diversity
would be higher on post-DED properties, reflecting a
lesson learned in the importance of diversity following
the DED devastation. We also hypothesized that this
increased diversity on post-DED properties would
correspond with lower EAB and ALB vulnerability on
these sites. Given the limited data on US urban forest
structure (Nowak et al. 2001), this type of vulnerabil-
ity assessment advances the characterization of
potential invasive beetle impacts on valuable residen-
tial urban forest resources.
Methods
Study area
The study area is located within the TCMA, an area
defined here as the 7,215 km2 seven-county region
surrounding the central cities of Minneapolis and Saint
Paul (Fig. 1). The TCMA had a 2010 population of
2.85 million (US Census Bureau 2010), and is
expected to grow to 3.74 million by 2040 (Metropol-
itan Council 2012). From World War II (WWII) to
present, the study area has experienced rapid urban-
ization, largely at the expense of row crop agricultural
lands (Adams and VanDrasek 1993; Berland 2012).
Minneapolis is characterized by older neighborhoods
with compact property parcels situated along regularly
gridded streets, while suburban neighborhoods have
larger lots, often on winding streets with fewer
boulevards bordering the streets (Fig. 2; Adams and
VanDrasek 1993). In comparison to Minneapolis,
suburban neighborhoods typically have a lower pro-
portion of municipal street trees owing to the general
lack of boulevards, less active tree planting programs,
and proportionally smaller building footprints on a
given parcel of land leaving more space for private
trees. DED peaked in the TCMA in 1977; in that year,
Minneapolis lost 32,000 trees and Saint Paul lost over
50,000 trees (Adams and VanDrasek 1993; French
1993). EAB was discovered in the TCMA in 2009, at
the same time that we were collecting field data for this
project. See http://gis.mda.state.mn.us/eab/ for a cur-
rent map of EAB distribution in Minnesota. ALB has
yet to be found in the TCMA.
Data collection
We collected data within a 120 km2 transect (40 km
long by 3 km wide) positioned along an urban–rural
gradient from the center of downtown Minneapolis
(44.98�N 93.26�W) south through suburbs to the peri-
urban fringe (Fig. 1). Confining our study to an urban–
rural transect prevented us from making direct claims
about urban forest diversity and vulnerability patterns
within the entire TCMA, but this strategy had several
advantages. For example, while similar ground-based
studies of urban forest structure have typically focused
on a single central city, we were able to characterize
the urban forest across a range of housing ages and
urban forms by sampling along an urban–rural transect
(Fig. 2). This focus beyond the central city of Minne-
apolis was critical for obtaining adequate representa-
tion of suburban residential property parcels
developed after the peak DED outbreak in 1977. In
addition, this particular transect placement minimized
complicating factors by avoiding the downtown Saint
Paul secondary urban core and numerous water bodies
found elsewhere in the TCMA. Finally, limiting our
investigation to two counties reduced problems asso-
ciated with inconsistent geospatial data and tax
database availability across multiple counties.
We focused our study on residential land, which
comprised 62 km2 (51.7 %) of the 120 km2 study
transect. Candidate study sites were selected from a tax
parcel database consisting of all residential properties
(e.g., single family houses, duplexes, townhomes,
Landscape Ecol (2014) 29:141–152 143
123

apartment buildings) in the study transect. We originally
drew 150 random candidate parcels and set study site
quotas for each study area municipality (Fig. 1c) based
on this initial drawing. When sampling permission was
not obtained for a candidate site, it was replaced with a
random parcel in the same municipality, thus ensuring
that each municipality was adequately represented in the
study. We did not pursue a sampling strategy aimed at
inventorying equal numbers of property parcels or trees
across housing age groups because parcels had varying
numbers of trees. Targeting a set number of parcels in
each housing age group (e.g., post-DED sites) would
result in varying tree counts among housing age groups,
while targeting a set number of trees would incorporate
varying numbers of parcels and thus would include
varying numbers of homeowners who make tree
planting decisions. Hence, given that either target—
equal trees or equal parcels—could affect the study
Fig. 1 Study area.
a Minnesota is located in the
north central United States.
b Location of the study
transect within the TCMA.
c The study transect is
situated along an urban–
rural gradient from north to
south. 150 residential study
sites are categorized by
housing age group
Fig. 2 Characteristic urban
form in each housing age
group. All panels shown at
1:10,000 scale to highlight
differences in property
parcel sizes
144 Landscape Ecol (2014) 29:141–152
123
results, we implemented a completely random sampling
strategy to avoid potential biases introduced by an
arbitrary sampling decision. Avoiding these housing age
biases was particularly important because our primary
goal was to compare diversity and vulnerability among
housing age groups.
We visited candidate sites from May to October
2009, and asked for permission to sample the
residential property. When permission was denied
(n = 9) or nobody answered the door, we moved to the
next candidate parcel on the list until we met each
municipality’s quota. Qualitative observations indi-
cating diverse participant demographics alleviated
concerns about study participant bias toward those
who were at home during the day (e.g., the retired). To
ensure that our study sites were reasonably represen-
tative of their respective municipalities in terms of
housing age, we compared mean study site housing
ages for each municipality to the overall municipality
mean derived from the tax parcel database. At each
study site, we sampled all trees on the property,
including all private and public land from mid-street to
mid-alley. Consequently, the sample included both
privately managed trees and municipal street trees,
providing a more complete picture of urban forest
composition on residential lands. Trees were defined
as any woody vegetation[2.54 cm (1 in.) diameter at
breast height (1.37 m; DBH). For each tree, we
recorded its species and DBH to the nearest 0.1 cm.
For multi-stem trees, DBH was summed for up to the
six largest stems[2.54 cm DBH. While DBH is only
one measure of tree size, it is closely related to other
fundamental tree measures including height, crown
diameter, and leaf area (Peper et al. 2001).
Data analysis
For data analysis, study sites were grouped into the
following three age class bins based on the year of
housing construction: pre-WWII (1889–1945), post-
WWII (1946–1977), and post-DED peak outbreak
(1978–2009). DED peak outbreak was characterized
as the year when the most elms in the TCMA were lost
to DED, which coincided with a spike in funding to
fight the disease (Adams and VanDrasek 1993; French
1993). This sample stratification added a spatiotem-
poral component to facilitate comparison of older
(primarily urban and near suburban) sites to post-DED
sites concentrated in the outlying suburbs (Fig. 1c).
Genus diversity
We calculated diversity metrics to determine whether
tree diversity was higher on residential properties
developed after the peak DED outbreak. Several
related considerations led us to calculate diversity at
the genus level rather than the species level. Both EAB
and ALB impact multiple species within genera
(Poland and McCullough 2006; Haack et al. 2010).
While vulnerability to both EAB (Rebek et al. 2008)
and ALB (Dodds and Orwig 2011) varies by species
within a particular genus, limited understanding
prevents reliable quantitative estimates of species-
level vulnerability. For example, Dodds and Orwig
(2011) report contrasting findings between two studies
assessing ALB preferences within the Acer genus.
Finally, previous studies have set a precedent of
assessing pest vulnerability at the genus level because
that is the level at which pest management interven-
tions would likely be made (Nowak et al. 2001; Raupp
et al. 2006).
We measured diversity at the housing age group
level as genus richness and as Simpson’s reciprocal
index (1/D). Richness simply measures the total
number of genera observed within each housing age
group. Simpson’s index (D, Eq. 1) is a common and
robust diversity index that accounts for both richness
and dominance by the most abundant genera, with
particular emphasis on dominance (Magurran 2004).
D ¼X ni½ni � 1�
N½N � 1�
� �ð1Þ
where ni is the number of individuals (or basal area) in
the ith species, and N is the total number of individuals
(or total basal area). Increasing values of Simpson’s
reciprocal index (1/D) indicate increasing genus
diversity within a housing age group. We calculated
Simpson’s reciprocal index separately using both
individuals and basal area, because diversity in terms
of both individual trees and tree sizes offer useful
descriptions of urban forest structure. While urban
ecologists have typically calculated diversity indices
using individuals (i.e., frequencies), calculating the
index using basal area can potentially describe struc-
tural diversity better than simple tree counts, which do
not account for differences in tree sizes among genera.
It is often difficult to assess whether biodiversity
measures are significantly different among sampling
groups (Solow 1993; Wiens et al. 1996), and our
Landscape Ecol (2014) 29:141–152 145
123
diversity comparisons were further complicated by an
unequal sampling effort across housing age groups. In
particular, we sampled uneven numbers of parcels
across groups, parcels were different sizes, and parcels
contained varying numbers of trees. To provide a
reliable evaluation of housing age group genus
diversity with respect to sampling effort and observed
diversity across the entire study area, we implemented
a nonparametric randomization technique developed
by Solow (1993). The randomization test was first
conducted for individual trees by pooling genus
frequencies from all three housing age groups. Then
we randomly partitioned the observed genera amongst
the three age groups such that each age group
contained the same number of trees as the observed
sample data set, but not necessarily the same genus
frequencies (after Wiens et al. 1996). We calculated
genus richness and Simpson’s reciprocal index for
each of 1,000 randomizations to serve as a null
distribution, or the expected diversity in each housing
age group, given the genera frequencies from the
entire data set and the number of trees in each housing
age group. Using a two-tailed test, the null hypothesis
was rejected for any observed housing age group
diversity values within the top or bottom 2.5 percentile
of the null distribution (after Solow 1993).
Calculating a null distribution for Simpson’s
reciprocal index using basal area was more compli-
cated because, while each housing age group received
the same number of trees as before, the total basal area
for each housing group changed for each randomiza-
tion. When performing this randomization, we main-
tained genus and basal area relationships for
individual trees through the randomization process,
and recomputed both ni and N for each randomization
based on the basal area of individuals.
Pest vulnerability
We assessed variability in pest vulnerability among
housing age groups based on two fundamental urban
forest metrics–frequency and sizes of vulnerable trees.
For EAB, all ash species were considered vulnerable.
For ALB, we confined our analysis to what Wang (2012)
lists as preferred genera, which include maple, buckeye,
horse chestnut, birch, willow, and elm. This conserva-
tive approach of only considering preferred ALB hosts
is appropriate given that to date ALB has spread
considerably slower than EAB (USDA APHIS 2013).
As described above, limited understanding of relative
EAB and ALB species preferences within a particular
genus prevented us from characterizing susceptibility at
the species level. In addition, genus level vulnerability
assessment may have more practical relevance given
that pest management interventions are made at the
genus level (Nowak et al. 2001; Raupp et al. 2006). First,
we tested whether a particular housing age group’s
observed vulnerable tree counts were different than
would be expected based on random partitioning of all
sampled trees among the three housing age groups. This
assessment relied on the same randomization approach
used to analyze genus diversity by individuals, and was
conducted separately for EAB and ALB. Next, we used
this randomization technique to assess whether the
observed proportion of vulnerable basal area in each
housing age group was significantly different than what
would be expected given the overall proportion of
vulnerable basal area in the entire data set. As with
diversity calculations for basal area, we maintained
genus and basal area relationships for individual trees
throughout the randomization process. After comparing
vulnerability across housing age groups, we calculated
the number of study sites with at least one vulnerable
tree for EAB or ALB, because having to remove or
chemically treat just one vulnerable tree incurs a
substantial cost for the household.
Results
We inventoried a total of 1,723 trees on 150 property
parcels, with a mean and median of 11.5 and 6 trees per
parcel, respectively. Overall, 41 genera were repre-
sented, with maple, spruce (Picea), ash, oak, and elm
being the most common (Table 1). These five most
common genera represented 55.3 % of all trees and
73.8 % of total basal area. Housing age groups generally
followed an urban-to-rural gradient, with older homes
located near the urban core and newer homes concen-
trated toward the peri-urban fringe (Fig. 1). By munic-
ipality, our mean study site ages were all within 3 years
of the overall municipality mean, indicating that our
sample was reasonably representative of the residential
areas within the study transect.
146 Landscape Ecol (2014) 29:141–152
123

Genus diversity
According to all three measures of diversity, post-DED
parcels were less diverse than would be expected based
on the overall genus abundances throughout the study
area (Table 2). Post-WWII parcels had higher than
expected diversity for both calculations of Simpson’s
reciprocal index, while diversity values on pre-WWII
parcels were within the expected ranges (Table 2).
Pest vulnerability
Tree counts and basal area were used to assess EAB
and ALB vulnerability across housing age groups. Of
the overall sample of 1,723 trees, 8.4 % were vulner-
able to EAB, and 33.1 % were preferred ALB hosts
(Table 3). Out of 150 residential properties, 66
(44.0 %) had at least one ash tree, and 126 (84.0 %)
had at least one preferred ALB host (Table 3). For
EAB, the proportion of vulnerable individuals was low
on pre-WWII sites and high on post-WWII sites, while
the proportion of vulnerable basal area fell within
expected levels for each housing age group (Table 4).
ALB vulnerability was high on pre- and post-WWII
sites, but low on post-DED sites (Table 4).
Discussion
This study offers new perspectives on urban forest
diversity and pest vulnerability across a metropolitan
landscape. Given the high quantity of residential trees
Table 1 Summary of the ten most common genera sampled
Genus All sites
(1889–2009)
Pre-WWII
(1889–1945)
Post-WWII
(1946–1977)
Post-DED
(1978–2009)
Rel. freq. Basal area Freq. Basal area Freq. Basal area Freq. Basal area
(%) (% of total) Rank Rank Rank Rank Rank Rank
Acer 21.4 37.4 1 1 1 1 1 1
Picea 9.9 14.3 5 6 4 6 2 10
Fraxinus 8.4 9.8 6 3 3 3 4 3
Quercus 8.1 7.6 17 25 2 2 6 2
Ulmus 7.6 4.8 2 2 5 4 6 7
Populus 5.3 3.9 21 8 18 9 3 4
Rhamnus 5.2 3.7 11 17 8 14 5 12
Celtis 4.5 2.5 3 4 6 15 13 11
Malus 4.3 2.2 9 14 9 5 8 5
Thuja 4.0 1.9 4 9 7 10 12 16
31 others 21.5 12.1 – – – – – –
For all sites (1889–2009), relative frequency and basal area are given as percent of total. For each housing age group, ranks are given
for genus relative frequency and basal area. Post-DED refers to the period of time following the peak outbreak of Dutch elm disease
Table 2 Genus diversity by housing age group
Housing age
group
Study
sites (n)
Trees
(n)
Genus
richness
P Simpson’s 1/D
(individuals)
P Simpson’s 1/D
(basal area)
P
Pre-WWII
(1889–1945)
43 205 27 0.218 11.19 0.448 4.83 0.328
Post-WWII
(1946–1977)
66 868 35 0.646 12.60 0.004 (high) 6.94 0.026 (high)
Post-DED
(1978–2009)
41 650 27 £0.002 (low) 10.25 0.039 (low) 3.99 0.026 (low)
Bold values signify statistically significant (P \ 0.05) deviations from the expected values in each housing age group, given the
observed diversity within the entire data set. P-values were derived from the ranks of observed data values in comparison to 1,000
data randomizations
Landscape Ecol (2014) 29:141–152 147
123
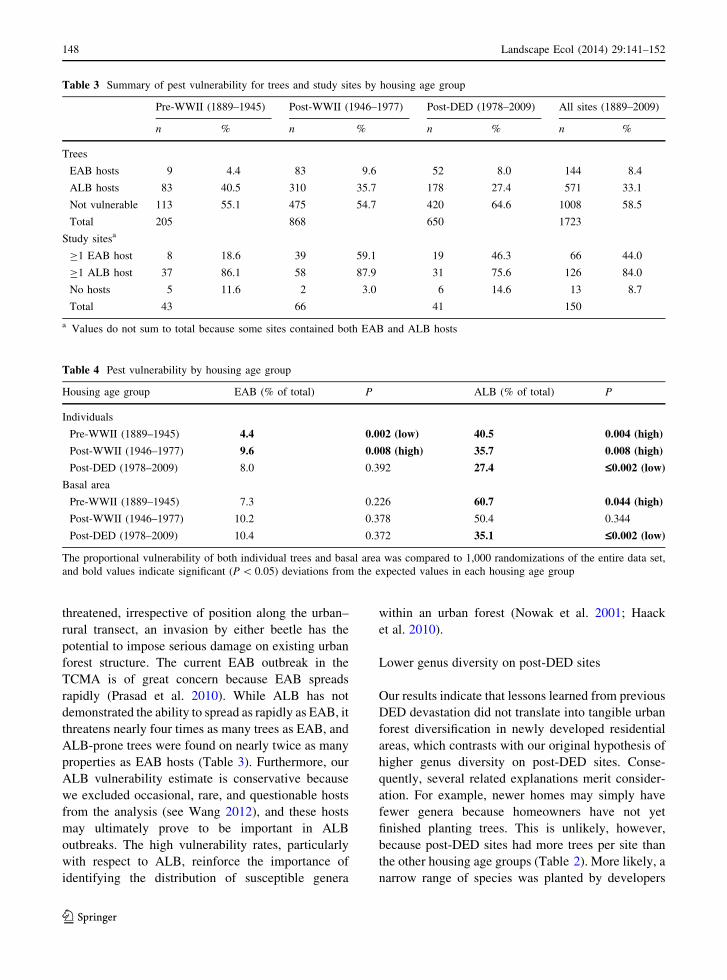
threatened, irrespective of position along the urban–
rural transect, an invasion by either beetle has the
potential to impose serious damage on existing urban
forest structure. The current EAB outbreak in the
TCMA is of great concern because EAB spreads
rapidly (Prasad et al. 2010). While ALB has not
demonstrated the ability to spread as rapidly as EAB, it
threatens nearly four times as many trees as EAB, and
ALB-prone trees were found on nearly twice as many
properties as EAB hosts (Table 3). Furthermore, our
ALB vulnerability estimate is conservative because
we excluded occasional, rare, and questionable hosts
from the analysis (see Wang 2012), and these hosts
may ultimately prove to be important in ALB
outbreaks. The high vulnerability rates, particularly
with respect to ALB, reinforce the importance of
identifying the distribution of susceptible genera
within an urban forest (Nowak et al. 2001; Haack
et al. 2010).
Lower genus diversity on post-DED sites
Our results indicate that lessons learned from previous
DED devastation did not translate into tangible urban
forest diversification in newly developed residential
areas, which contrasts with our original hypothesis of
higher genus diversity on post-DED sites. Conse-
quently, several related explanations merit consider-
ation. For example, newer homes may simply have
fewer genera because homeowners have not yet
finished planting trees. This is unlikely, however,
because post-DED sites had more trees per site than
the other housing age groups (Table 2). More likely, a
narrow range of species was planted by developers
Table 3 Summary of pest vulnerability for trees and study sites by housing age group
Pre-WWII (1889–1945) Post-WWII (1946–1977) Post-DED (1978–2009) All sites (1889–2009)
n % n % n % n %
Trees
EAB hosts 9 4.4 83 9.6 52 8.0 144 8.4
ALB hosts 83 40.5 310 35.7 178 27.4 571 33.1
Not vulnerable 113 55.1 475 54.7 420 64.6 1008 58.5
Total 205 868 650 1723
Study sitesa
C1 EAB host 8 18.6 39 59.1 19 46.3 66 44.0
C1 ALB host 37 86.1 58 87.9 31 75.6 126 84.0
No hosts 5 11.6 2 3.0 6 14.6 13 8.7
Total 43 66 41 150
a Values do not sum to total because some sites contained both EAB and ALB hosts
Table 4 Pest vulnerability by housing age group
Housing age group EAB (% of total) P ALB (% of total) P
Individuals
Pre-WWII (1889–1945) 4.4 0.002 (low) 40.5 0.004 (high)
Post-WWII (1946–1977) 9.6 0.008 (high) 35.7 0.008 (high)
Post-DED (1978–2009) 8.0 0.392 27.4 £0.002 (low)
Basal area
Pre-WWII (1889–1945) 7.3 0.226 60.7 0.044 (high)
Post-WWII (1946–1977) 10.2 0.378 50.4 0.344
Post-DED (1978–2009) 10.4 0.372 35.1 £0.002 (low)
The proportional vulnerability of both individual trees and basal area was compared to 1,000 randomizations of the entire data set,
and bold values indicate significant (P \ 0.05) deviations from the expected values in each housing age group
148 Landscape Ecol (2014) 29:141–152
123
across subdivisions or neighborhoods according to the
trees that were fashionable at the time of development
and valued for a combination of their aesthetic
qualities, climatic hardiness, growth rates, or urban
suitability (Miller 1997). As post-DED sites were at
most 31 years old, most of the original trees were
probably still alive on site. In contrast, some of the
original plantings on older sites may have died at
staggered intervals and been replaced with a broader
range of species, leading to relatively higher diversity
on older parcels.
Compared to older housing age groups, post-DED
sites had fewer boulevards, less active municipal
planting programs, and proportionally smaller house
footprints which left more private land area for
homeowner landscaping choices. Where homeowners
made a higher proportion of tree planting choices, it is
likely that these citizens were not aware of the
rationale for planting diverse assemblages of trees,
or that they prioritized factors like tree costs or
landscaping aesthetics over biodiversity and other
ecological considerations (Summit and McPherson
1998). A lack of coordinated municipal tree planting
outreach programs in newer communities could help
explain lower tree diversity in newer areas. In newly
developed areas, diversity could potentially be
enhanced via policies requiring land developers to
meet specified planting diversity targets, or by imple-
menting education or cost-share programs encourag-
ing homeowners to consider diversity in tree planting
decisions. For example, creating incentives for home-
owners to plant trees from multiple families or orders
could reduce vulnerability to pests that attack multiple
species or genera (Raupp et al. 2006). This would both
promote urban forest stability within the municipality
as a whole and reduce the likelihood that individual
homeowners would be burdened by future pest
infestation costs (i.e., insecticide treatments or tree
removal) for multiple trees at any given time.
Methodologically, we combined all trees within a
housing age group to quantify biodiversity, so diverse
planting at the household scale could be obscured if
many households planted a diverse yet similar set of
trees. This may occur, for example, where neighbors
intentionally mimic one another in landscaping
choices (Boone et al. 2010), where a common land
developer uses a limited set of trees across entire
subdivisions, or where neighborhood tree planting
choices are influenced by a local retailer carrying a
narrow selection of tree species. In fact, our results
may align with Sydnor et al. (2010), who report
widespread mismatches between what urban foresters
request for diverse planting and the stock availability
from nurseries in Ohio. Thus, while we were ulti-
mately unable to determine the exact reason for lower
diversity among post-DED sites, each of these expla-
nations reflects the importance of spatial clustering of
similar-aged houses, which has consistently proven
useful for understanding variability in vegetation
within urban landscapes (e.g., Hope et al. 2003; Grove
et al. 2006; Berland 2012).
Diversity and pest vulnerability
Contrary to our original hypothesis, there was not a
clear link between high diversity and low pest
vulnerability. As evidence, even though post-DED
sites had low genus diversity (Table 2), they also
exhibited low ALB vulnerability and modest EAB
vulnerability (Table 4). On the other hand, more
diverse sites developed prior to the peak DED
outbreak were highly vulnerable to ALB (Table 4).
Based on these findings, this research challenges the
traditional notion that biodiversity necessarily yields
ecological stability. Richards (1982/1983) previously
contested the importance of biodiversity for urban
forest stability on the grounds that a diverse assem-
blage of trees poorly suited to urban environments is
less stable than a smaller set of species well adapted to
urban conditions. Our challenge is more direct, as our
analysis did not suggest a positive relationship
between diversity and resilience to EAB and ALB,
but instead indicated the opposite connection for ALB.
Diversification has been promoted to decrease pest
vulnerability (e.g., Raupp et al. 2006), but in this study
higher genus diversity did not correspond with lower
vulnerability to the pests we studied. So while urban
forest diversification strategies may prove useful for
managing against devastating pest outbreaks in many
situations, there is no guarantee that such measures
will lead to tangible reductions in pest vulnerability
because vulnerability is largely dependent on pest host
preferences, which vary from pest to pest and may
include species that are locally abundant or rare.
Additional research is needed to determine whether
our observed pattern is anomalous, or if it is emblem-
atic of a larger disconnect between diversity and pest
vulnerability.
Landscape Ecol (2014) 29:141–152 149
123
Characterizing local- to regional-scale pest vulner-
ability is particularly challenging because different
pests threaten different abundances and sizes of trees,
and because we do not know which tree species will be
affected by invasive pests arriving in the future. Yet,
our finding that pre-WWII sites were highly vulner-
able to ALB and low in vulnerability to EAB
demonstrates the influence of pest host specificity on
diversity–vulnerability linkages. The fact that post-
WWII sites exhibited significantly high ALB vulner-
ability in terms of individual trees but expected levels
of ALB vulnerability in terms of basal area highlights
the importance of which particular trees on a land-
scape are susceptible to a pest. In this case, a
significant number of individuals on post-WWII sites
are susceptible to ALB, but those vulnerable trees do
not represent a disproportionate amount of the basal
area on these sites.
The differences in pest vulnerability according to
housing age group highlight the importance of intra-
regional spatiotemporal variability. In light of
observed urban forest diversity differences and the
influence of host specificity on pest vulnerability,
certain neighborhoods and municipalities may bear
disproportionate burdens associated with an invasive
pest outbreak. At the municipal level, intra-regional
variability in EAB and ALB vulnerability could
conceivably lead to a highly unequal strain on city
budgets, even for neighboring communities with
similar socioeconomic characteristics. While post-
DED sites did not exhibit high vulnerability to EAB or
ALB, lower genus diversity on these sites may leave
them particularly vulnerable to new invasive pest
threats. At the household scale, documenting the
number of residential properties with at least one
vulnerable tree (Table 3) is important when consider-
ing the socioeconomic impacts of pest outbreaks,
because pest invasion of a single tree crosses a
threshold from zero to substantial costs for insecticide
treatment or removal of the infested tree. For example,
an EAB outbreak in this study area would only affect
up to about one-fifth of pre-WWII households, but it
could impact nearly three-fifths of post-WWII sites
(Table 3). Variability among housing age groups was
not as great for ALB, but a much higher percentage of
homes stand to be affected by ALB as compared to
EAB. Considering the documented pest-specific het-
erogeneity in urban forest vulnerability, similar anal-
yses elsewhere could be useful to further elucidate the
relationships among housing age, urban forest diver-
sity, and pest vulnerability.
Conclusions
Invasive pests pose a serious economic threat to urban
forests. They also threaten key urban ecosystem
services, which may take decades to recover after a
pest outbreak due to lagged growth of replacement
trees. By characterizing urban forest structure and the
potential losses associated with EAB and ALB
outbreaks, this study provides the type of urban forest
structural information that can help municipal forest-
ers understand their risks and plan for future scenarios.
Across the study area, EAB and ALB together
threatened over 40 % of the trees sampled, and over
90 % of the study parcels had at least one tree
susceptible to either beetle. By sampling across an
urban–rural transect, we were able to compare pest
vulnerability among housing age groups and incorpo-
rate vulnerability perspectives from understudied
suburban areas. Our findings underscore the impor-
tance of pest host specificity when considering the
potential impacts of invasive pests on urban forest
resources. For example, pre-WWII sites exhibited low
EAB vulnerability but high ALB vulnerability relative
to the entire sample. Similarly, variability in urban
forest structure, even among adjacent communities,
may lead to uneven effects of invasive pest outbreaks
within a metropolitan region.
We do not know which species will be impacted by
the next invasive forest pest, so diversification is
usually cited as the best strategy to promote stability in
the face of pest outbreaks. Unexpectedly, genus
diversity was lower on properties developed after the
peak DED outbreak. Any lessons learned from DED
seemingly did not translate into diversification of the
study area’s residential urban forest, most likely
because private land developers and homeowners are
responsible for the majority of tree planting decisions
on newer sites. Equally surprising, while newer
properties were less diverse than older properties,
they were also less vulnerable to ALB than older
housing age groups. As such, there was an apparent
disconnect between the theoretical notion that biodi-
versity should decrease vulnerability to invasive pests,
and the data from this study indicating that biodiver-
sity does not necessarily correspond with reduced
150 Landscape Ecol (2014) 29:141–152
123
vulnerability. Based on our findings, additional
research is warranted to investigate the linkages
between urban forest diversity and pest vulnerability.
In particular, future work could assess whether our
observed disconnect between diversity and vulnera-
bility occurs in other places, examine the relative
contributions of private trees versus municipal street
trees in determining residential urban forest diversity,
and investigate best management practices to simul-
taneously increase diversity and resilience in the
residential urban forest.
Acknowledgments This material is based upon work
supported by the National Science Foundation under Grant
#1003138, and by the Graduate School at the University of
Minnesota. We thank Tom Crist for helpful discussions of
biodiversity metrics, and Brewster Malevich for field assistance.
Three anonymous reviewers and the handling editor provided
constructive comments that improved the quality of the paper.
References
Adams JS, VanDrasek BJ (1993) Minneapolis-St. Paul: people,
place, and public life. University of Minnesota Press,
Minneapolis
Barker PA (1975) Ordinance control of street trees. J Arboric
1:212–216
Berland A (2012) Long-term urbanization effects on tree canopy
cover along an urban–rural gradient. Urban Ecosyst
15:721–738
Boone CG, Cadenasso ML, Grove JM, Schwarz K, Buckley GL
(2010) Landscape, vegetation characteristics, and group
identity in an urban and suburban watershed: why the 60 s
matter. Urban Ecosyst 13:255–271
US Census Bureau (2010) Demographic profile data. http://
factfinder2.census.gov. Accessed July 2013
Carter JC (1975) Major tree diseases of the century. J Arboric
1:141–147
Dodds KJ, Orwig DA (2011) An invasive urban forest pest invades
natural environments—Asian longhorned beetle in north-
eastern US hardwood forests. Can J For Res 41:1729–1742
Dwyer JF, McPherson EG, Schroeder HW, Rowntree RA (1992)
Assessing the benefits and costs of the urban forest.
J Arboric 18:227–234
French DW (1993) History of Dutch elm disease in Minnesota.
Minnesota Agricultural Experiment Station. http://purl.
umn.edu/151957. Accessed July 2013
Grey GW, Deneke FJ (1986) Urban forestry. Krieger, Malabar
Grove JM, Troy AR, O‘Neil-Dunne JPM, Burch WR, Caden-
asso ML, Pickett STA (2006) Characterization of house-
holds and its implications for the vegetation of urban
ecosystems. Ecosystems 9:578–597
Haack RA, Herard F, Sun J, Turgeon JJ (2010) Managing
invasive populations of Asian longhorned beetle and citrus
longhorned beetle: a worldwide perspective. Ann Rev
Entomol 55:521–546
Hardin PJ, Jensen RR (2007) The effect of urban leaf area on
summertime urban surface kinetic temperatures: a Terre
Haute case study. Urban For Urban Green 6:63–72
Hope D, Gries C, Zhu W, Fagan WF, Redman CL, Grimm NB,
Nelson AL, Martin C, Kinzig A (2003) Socioeconomics
drive urban plant diversity. Proc Natl Acad Sci USA
100:8788–8792
Kovacs KF, Haight RG, McCullough DG, Mercader RJ, Siegert
NW, Liebhold AM (2010) Cost of potential emerald ash
borer damage in U.S. communities, 2009–2019. Ecol Econ
69:569–578
Magurran AE (2004) Measuring biological diversity. Blackwell,
Malden
McKenneyDW, Pedlar JH (2012) To treator remove: aneconomic
model to assist in deciding the fate of ash trees threatened by
emerald ash borer. Arboric Urban For 38:121–129
McPherson EG (1998) Structure and sustainability of Sacra-
mento’s urban forest. J Arboric 24:174–190
McPherson EG (2000) Expenditures associated with conflicts
between street tree root growth and hardscape in Califor-
nia, United States. J Arboric 26:289–297
McPherson EG, Simpson JR, Peper PJ, Maco SE, Xiao Q (2005)
Municipal forest benefits and costs in five US cities. J For
103:411–416
Metropolitan Council (2012) What lies ahead: population, house-
hold and employment forecasts to 2040. http://stats.metc.
state.mn.us/stats/pdf/MetroStats_Forecasts.pdf. Accessed
July 2013
Miller RW (1997) Urban forestry: planning and managing urban
greenspaces. Waveland, Long Grove
Miller RH, Miller RW (1991) Planting survival of selected street
tree taxa. J Arboric 17:185–191
Nowak DJ, Pasek JE, Sequiera RA, Crane DE, Mastro VC
(2001) Potential effect of Anoplophora glabripennis
(Coleoptera: Cerambycidae) on urban trees in the United
States. J Econ Entomol 94:116–122
Nowak DJ, Crane DE, Dwyer JF (2002) Compensatory value of
urban trees in the United States. J Arboric 28:194–199
Nowak DJ, Crane DE, Stevens JC (2006) Air pollution removal
by urban trees and shrubs in the United States. Urban For
Urban Green 4:115–123
Payton S, Lindsey G, Wilson J, Ottensmann JR, Man J (2008)
Valuing the benefits of the urban forest: a spatial hedonic
approach. J Environ Plan Manag 51:717–736
Peper PJ, McPherson EG, Mori SM (2001) Equations for pre-
dicting diameter, height, crown width, and leaf area of San
Joaquin Valley street trees. J Arboric 27:306–317
Poland TM, McCullough DG (2006) Emerald ash borer: inva-
sion of the urban forest and the threat to North America’s
ash resource. J For 104:118–124
Prasad AM, Iverson LR, Peters MP, Bossenbroek JM, Matthews
SN, Sydnor TD, Schwartz MW (2010) Modeling the
invasive emerald ash borer risk of spread using a spatially
explicit cellular model. Landscape Ecol 25:353–369
Raupp MJ, Cumming AB, Raupp EC (2006) Street tree diversity
in eastern North America and its potential for tree loss to
exotic borers. Arboric Urban For 32:297–304
Rebek EJ, Herms DA, Smitley DR (2008) Interspecific variation
in resistance to emerald ash borer (Coleoptera: Bupresti-
dae) among North American and Asian ash (Fraxinus
spp.). Environ Entomol 37:242–246
Landscape Ecol (2014) 29:141–152 151
123
Richards NA (1982/1983) Diversity and stability in a street tree
population. Urban Ecol 7:159–171
Santamour FS (1990) Trees for urban planting: diversity, uni-
formity, and common sense. In: Proceedings of the 7th
conference of the metropolitan tree improvement alliance,
pp 57–65
Smith MT, Wu J (2008) Asian longhorned beetle: renewed
threat to northeastern USA and implications worldwide. Int
Pest Control 50(311):316
Solow AR (1993) A simple test for chance in community
structure. J Anim Ecol 62:191–193
Summit J, McPherson EG (1998) Residential tree planting and
care: a study of attitudes and behavior in Sacramento,
California. J Arboric 24:89–97
Sydnor TD, Subburayalu S, Bumgardner M (2010) Contrasting
Ohio nursery stock availability with community planting
needs. Arboric Urban For 36:47–54
Tyrvainen L (1997) The amenity value of the urban forest: an
application of the hedonic pricing method. Landsc Urban
Plan 37:211–222
USDA APHIS (2013) Asian longhorned beetle. USDA Animal
and Plant Health Inspection Service. http://asianlonghorned
beetle.com/. Accessed July 2013
Wang B (2012) Asian longhorned beetle: annotated host list.
http://www.aphis.usda.gov/plant_health/plant_pest_info/
asian_lhb/downloads/hostlist.pdf. Accessed July 2013
Wiens JA, Crist TO, Day RH, Murphy SM, Hayward GD (1996)
Effects of the Exxon Valdez oil spill on marine bird com-
munities in Prince William Sound, Alaska. Ecol Appl
6:828–841
152 Landscape Ecol (2014) 29:141–152
123
Related Documents