See discussions, stats, and author profiles for this publication at: https://www.researchgate.net/publication/236981143 Unequal Welfare States: Distributive consequences of population ageing in six European countries Book · January 2004 CITATIONS 43 READS 383 4 authors, including: Some of the authors of this publication are also working on these related projects: De maatschappelijke consequenties van het institutionele pad View project Verschil in Nederland View project J. Cok Vrooman Sociaal en Cultureel Planbureau 135 PUBLICATIONS 859 CITATIONS SEE PROFILE Pier Marco Ferraresi Università degli Studi di Torino 22 PUBLICATIONS 74 CITATIONS SEE PROFILE Giovanna Segre Università degli Studi di Torino 30 PUBLICATIONS 316 CITATIONS SEE PROFILE All content following this page was uploaded by J. Cok Vrooman on 26 May 2014. The user has requested enhancement of the downloaded file.

Welcome message from author
This document is posted to help you gain knowledge. Please leave a comment to let me know what you think about it! Share it to your friends and learn new things together.
Transcript
See discussions, stats, and author profiles for this publication at: https://www.researchgate.net/publication/236981143
Unequal Welfare States: Distributive consequences of population ageing in six
European countries
Book · January 2004
CITATIONS
43READS
383
4 authors, including:
Some of the authors of this publication are also working on these related projects:
De maatschappelijke consequenties van het institutionele pad View project
Verschil in Nederland View project
J. Cok Vrooman
Sociaal en Cultureel Planbureau
135 PUBLICATIONS 859 CITATIONS
SEE PROFILE
Pier Marco Ferraresi
Università degli Studi di Torino
22 PUBLICATIONS 74 CITATIONS
SEE PROFILE
Giovanna Segre
Università degli Studi di Torino
30 PUBLICATIONS 316 CITATIONS
SEE PROFILE
All content following this page was uploaded by J. Cok Vrooman on 26 May 2014.
The user has requested enhancement of the downloaded file.

Unequal Welfare States

Unequal Welfare States
Distributive consequences of population ageing in six European countries
A.J. Soede (SCP)J.C. Vrooman (SCP)P.M. Ferraresi (CeRP)G. Segre (CeRP)
Social and Cultural Planning OfficeThe Hague, June 2004

Social and Cultural Planning OfficeAs referred to in Article 9 of Royal Decree no. 175 of 30 March 1973.
The Social and Cultural Planning Office was established by Royal Decree of March 30, 1973 with the following terms of reference:
a to carry out research designed to produce a coherent picture of the state of social and cultural welfare in the Netherlands and likely developments in this area;
b to contribute to the appropriate selection of policy objectives and to provide an assessment of the advantages and disadvantages of the various means of achieving those ends;
c to seek information on the way in which interdepartmental policy on social and cultural welfare is implemented with a view to assessing its implementation.
The work of the Social and Cultural Planning Office focuses especially on problems coming under the responsibility of more than one Ministry.
As Coordinating Minister for social and cultural welfare, the Minister for Health, Welfare and Sport is responsible for the policies pursued by the Social and Cultural Planning Office. With regard to the main lines of such policies the Minister consults the Ministers of General Affairs, Justice, Home Affairs, Education, Culture and Science, Finance, Housing, Physical Planning and Environmental Protection, Economic Affairs, Agriculture, Nature Management and Fisheries and Social Affairs and Employment.
© Social and Cultural Planning Office, The Hague 2004scp-publication 2004/10Cover design: Bureau Stijlzorg, UtrechtCover illustration: A New European Logo, © oma, Rotterdamdtp: Trees Vulto, Schalkwijk
isbn 90 377 0185 xnur 740
Distribution in the usa & Canada: Transaction Publishers, New Brunswick (usa)Distribution in Belgium: Maklu-Distributie, Somersstraat 13-15, 2018 Antwerp
This publication is based on the final report of the research project ‘Demography, Institutions and Distributions’, which was commissioned by dg empl/e1. The content does not necessarily reflect the opinion or position of the European Commission Directorate-General for Employment and Social Affairs.
Social and Cultural Planning OfficeParnassusplein 52511 VX The HagueTel. (070) 340 70 00Fax (070) 340 70 44Website: www.scp.nlE-mail: [email protected]
Centre for Research on Pensions and Welfare Policies – cerpVia Real Collegio 30 10024 Moncalieri (to), ItalyTel. +39 011 6402402 Fax +39 011 6403680Website: http://cerp.unito.it

v
Contents
Preface 1
Executive summary 3
1 Introduction 15
2 Welfare regimes 19
2.1 Theoretical welfare regimes 19
2.2 Empirical analysis 28
2.3 Nordic welfare regime 32
2.4 Anglo-Saxon welfare regime 33
2.5 Mediterranean welfare regime 34
2.6 Continental welfare regime 35
2.7 Eastern European welfare regime 36
2.8 Hybrid countries 37
2.9 Conclusions 38
3 Methodology and scenarios 41
3.1 Outline of the study 42
3.2 The demographic-economic macro model 44
3.3 Scenarios 54
4 Employment, income developments and sustainability 66
4.1 Employment 66
4.2 Income developments 68
4.3 Sustainability 70
4.4 Conclusions 74
5 Income inequality 77
5.1 Measurement of inequality 77
5.2 Current and future income inequalities 79
5.3 Effects of demographic differences 86
5.4 Policy scenarios 88
5.5 Conclusions 92
6 Redistribution 95
6.1 The redistribution process 95
6.2 Measuring redistribution 97
6.3 Current redistribution 100
6.4 Future redistribution 102

vi Contents 1
6.5 Effects of demographic differences 104
6.6 Policy scenarios 105
6.7 Conclusions 109
7 Poverty 113
7.1 The definition of poverty 113
7.2 Poverty in various welfare states 114
7.3 Groups at risk 117
7.4 Conclusions 120
8 Conclusions and suggestions for further research 121
8.1 Overview 121
8.2 Baseline scenario 122
8.3 Participation scenario 123
8.4 Pension reform scenario 124
8.5 Institutional reform scenario 125
8.6 Policy implications 126
8.7 Suggestions for further research 128
References 129
Annexes 133
A1 Main characteristics of institutional analysis 135
A2 Some technical aspects of the demographic-economic macro model 145
A2.1 The structure of the pension unit 145
A2.2 Feedback effects and elasticity matrices 146
A2.3 Measures in the institutional reform scenario 149
A2.4 Optimisation procedure in participation scenario 151
A3 echp 153
A4 Weighting and adjustment of echp 156
A5 Decomposition of income inequality 158
A6 Various tables 162
A6.1 Country-specific demographic projections 162
A6.2 Income inequality decomposition statistics 164
A6.3 Redistribution statistics 180
B.1 About scp 183
B.2 About cerp 184
List of publications in English 185

vi Contents 1
Preface
One of the major policy issues in the current debate on welfare states concerns the impact of population ageing. This issue is often approached from the perspective of the sustainability of pension systems. However, the ageing process may also have serious social consequences: income differentials, redistribution and poverty rates may change considerably, depending on how the institutional systems respond to the demographic shockwave. This is the main focus of this study; it seeks to show the possible distributive consequences of population ageing in relation to the different welfare state types currently found in the European Union. The study was carried out by the Social and Cultural Planning Office of the Nether-lands (scp), in close collaboration with the Centre for Research on Pensions and Wel-fare Policies (cerp) in Italy. It builds on earlier comparative research by scp which sought to ascertain the effects of different welfare regimes on income distributions. The demographic-economic macro model which lies at the heart of this study was developed by cerp in conjunction with scp. Many people were involved in the process of finalising the project. scp and cerp wish to thank the European Commission (dg Empl/E1), which enabled us to realize the project; not only financially, but also through its careful scrutiny of the research proposal and the various drafts of the text. The discussions the authors held with Constantinos Fotakis, Fritz von Nordheim Nielsen, Jörg Peschner and Poul Rasmus-sen proved most valuable in this respect. We are also grateful to Camiel Vanderhoeft (Statistics Belgium) for kindly providing the g-Calib weighting software.
Finally, the scp’s reading committee not only provided the usual internal quality con-trol, but also contributed to the project in a more direct manner, through Michiel Ras’ efforts in preparing the echp-database.
Prof. Paul Schnabel, Director scpProf. Elsa Fornero, Director cerp

3

3
Executive summary*
Introduction
The future ageing process in Europe’s welfare states may have serious economic and social consequences. Research in this field, for instance by the eu’s Economic Policy Committee and the oecd, has mainly focused on assessing the weight of the finan-cial burden in the coming decades. This of course is a highly relevant issue: the future sustainability of welfare state provisions should be a key policy concern. Research findings indicate that all member states will be facing an increase in benefit depen-dency rates during the coming decades, especially due to the larger share of pension-ers in the population. This will lead to a substantial rise in relative social security expenditure (outlays as a percentage of gdp). The trend shows some variation across the eu-15; this is due mainly to differences in female labour participation, to reforms in pensions and pre-pensions – changes that have already been set in motion in some countries – and to the fact that some social protection schemes (especially in the Southern countries) are currently at an early stage of their development, and will grow towards more common European standards. The general picture, however, is decid-edly clear: up to 2040 social security will be under a considerable demographic strain in all Member States.
This basic fact has been reflected in the eu’s policy-making process. At the Euro-pean Council summits in Stockholm and Gothenburg (2001) it was agreed to tackle the problems of ageing by means of a triple strategy: reduction of the national debt of Member States, increasing labour participation, and adaptation of the national sys-tems of social protection and pensions. At the Barcelona meeting (2002) these policy aims were elaborated. Financial sustainability should be encouraged through the rais-ing of employment levels, the extension of working lives, the restructuring of national pension and benefit schemes, and the stimulation of private pension build-up. How-ever, pensions systems should not only be financially sustainable, but adequate as well. To ensure this, social policy must seek to reduce the risks of poverty and social exclusion among the elderly, and to encourage that people will be able to maintain their acquired standard of living to a reasonable degree after retirement. Solidarity between generations and among the elderly should be promoted, in order to attain acceptable levels of inequality. These aims are in line with the social policy targets set by the European Council at the Lisbon, Nice and Laeken summits (2000/2001).
* This executive summary is available in Dutch on www.scp.nl and in Italian on cerp.unito.it

4 Executive summary 5Executive summary
This widening of the policy scope implies that it may be useful to analyse not only the future financial implications of the ageing process, but also its possible impact on the issues of poverty, inequality and income redistribution. The study presented here seeks to do so.
Research issues
This project aims to construct an explorative analysis of the possible future distribu-tional results of ageing, in a representative selection of member states, taking the existing variety of welfare provisions into account. More specifically, the key question is how future demographic and socio-economic developments will interact with the formal institutions of different ‘regimes’ to produce certain distributive results.
The main demographic input for this project is Eurostat’s household progno-sis, which currently runs up to 2025. Current institutional heterogeneity in differ-ent countries is assessed through a detailed study of their social security and labour market features during the late 1990s. For the period 2000-2025 these ‘regimes’ interact with the demographic and economic developments, according to a number of scenarios. Future distributive results are analysed at the micro-level, based on a weighting procedure of Eurostat’s European Community Household Panel Survey (echp). On several indicators of inequality, redistribution, and poverty rates, changes will be assessed for the period 2000-2025.
Selection of countries
The study starts with a large set of countries. The existing welfare provisions are ana-lysed for all eu-15 member states, 4 Eastern European member states, Norway, the usa, Canada and Australia. This gives an adequate picture of current institutional variety, and makes it possible to identify clusters of countries representing different ‘regime types’.
Such an elaborate approach, however, was not possible in the second and third parts of this study: building a macro model and calculating the distributive results. Due to time and budget constraints, a selection of countries had to be made. The non-eu-15 countries had to be dropped, because these were not included in the echp. The impact of the future ageing process on inequality, redistribution and poverty was ultimately assessed for six countries: Germany, France, the United Kingdom, Italy, Denmark and the Netherlands. These were chosen for the very reason that their social security schemes reflect different traditions, and because their inhabitants make up a large majority (74%) of the total eu-15 population. The six country cases are consid-ered to be representative examples of different ‘regime types’.

4 Executive summary 5Executive summary
Limitations
Since current data availability makes it impossible to stretch the time horizon beyond the year 2025, the study does not cover the peak of the ageing process, which in most countries is expected around 2040-2050. However, it should be possible to make clear what general trends are to be expected.
The restriction to six representatives of regime types may imply that the project does not give an adequate picture of the dispersion within regimes types. For instance, the distributive results for Greece could be different from those for Italy, the exponent of the Mediterranean regime type analysed here. Moreover, it was neither possible to pay attention to differences between regions within countries, nor to assess the future impact of migration processes. The analysis of redistribution was limited due to the lack of indicators on taxes and benefits in kind in the echp.
Finally, both the macro modelling of future trends and its translation to the expected consequences for the income/benefit positions of households, have been performed using a specific methodology (see below). The application of other assumptions and techniques could lead to a different perspective being presented on the future of the ageing process. These limitations mean that the project should be considered as explorative.
Welfare regimes
In assessing the differences between the pension and social security systems of countries no comparison was made between specific benefit schemes, such as pen-sion rules or disability insurance schemes for specific groups. This would be rather time-consuming, and has already been dealt with quite adequately in the eu’s missoc-project (and its recent extension to Central and Eastern European coun-tries, missceec). Moreover, the key issue in this study is more general: is it possible to discern specific clusters of countries, having different types of welfare regimes? This concept theoretically refers to the way in which welfare production is allocated between state, market and households.
Data were collected on 85 traits of welfare regimes in 23 countries. These cover the main income provisions – including pensions, parental leave and custody arrange-ments – taxes and social security contributions, and labour market regulations. Together, the variables present a fairly complete picture of each welfare regime. These indicators were subjected to a statistical scaling technique (non-linear principal com-ponents analysis). This basically awards countries which share a lot of regime traits similar scores, while cases having little in common are positioned a long way apart. Figure es.1 shows the results.

6 Executive summary 7Executive summary
Figure ES.1 Scaling of 23 countries based on 85 welfare regime characteristics
Source: SCP
The first dimension (x-axis) indicates the scope or size of the social security system in general; the second (y-axis) mainly refers to the extent of pension schemes. Five country clusters emerge. The Nordic regime type consists of Denmark, Finland and Sweden. These score especially high on scope: a large social security system, high expenditure on labour market programmes, generous parental leave arrangements, and universalistic entry conditions. At the other extreme there is a cluster of Mediter-ranean countries (Greece, Spain, Portugal and Italy). These are low in terms of scope, but in relative terms have fairly well-developed collective pension schemes. Regimes of the Anglo-Saxon type (the usa, Canada, Australia, the United Kingdom and Ireland) are slightly less residual in terms of their social security provisions, but lack extensive state pensions. To a lesser degree this also applies to four Eastern European member states (Poland, the Czech Republic, Hungary, and Slovakia), which also form a dis-tinct cluster. Here collective social security benefits, including pensions, generally lie below the eu-15 average. There are a lot of occupational schemes for specific groups, but these usually do not include civil servants. The Continental regime type is
��
���
���
���
��
��
��
��
��
�
���
�
�
��
�
�
���
�
���
�
��
�
gene
ral s
cope
of s
ocia
l sec
urity
extent of pensions etc.
low high
high
low

6 Executive summary 7Executive summary
represented by Germany, France, Austria, Belgium and Luxemburg. These countries occupy a midway position. Social security schemes are well-developed, but not as universalistic as in the Nordic countries. There is a strong relationship between pre-vious occupations and entitlement to provisions, and income protection for families with children is rather generous. Employees are well protected against dismissal. The number of special schemes for occupational groups is high, and there is extensive collective coverage for civil servants. Pension benefits in the Continental regime are slightly above the European average.
Two countries, the Netherlands and Norway, do not fall clearly into any cluster. They are scaled at some distance from the Nordic group, and may be considered hybrids.The results of this empirical analysis largely confirm Esping-Andersen’s well-known theoretical typology. The main differences are the existence of a separate Mediterra-nean cluster and the ambiguous position of Norway.
Model and scenarios
Thus, the six countries that were selected for the second and third part of this study currently show sufficient institutional variety. Germany and France represent the Con-tinental regime type, and Denmark the Nordic cluster. The United Kingdom is an exponent of the Anglo-Saxon regime (although figure es.1 shows that it is less ‘pure’ than the usa), and Italy belongs to the Mediterranean cluster (with a social security system somewhat wider in scope than Greece’s). The Netherlands is a hybrid, sharing Nordic and Continental regime traits; it may be interesting to see whether it shares ‘the best of both worlds’.
A demographic-economic macro model was developed for these ‘regime representa-tives’. Its inputs are demographic projections, assumptions on future labour partici-pation rates, and the current income/benefit positions of the population. The model results in consistent estimates of future developments on a number of economic key variables, and of indicators for the future income/benefit positions of specific groups. The latter are subsequently implemented in the echp’s microdata through a weight-ing procedure. This makes it possible to calculate indicators of inequality, redistribu-tion and poverty for the year 2025.
Four future scenarios were developed. In the country-specific baseline scenario regimes are left intact. This shows the results that could be expected on the basis of demo-graphic developments, if the present pension and social security schemes were not reformed. The scenario also has a variant, in which the eu-15’s demographic struc-ture and development is imposed on all countries. The ‘uniform demography’ variant usually has results that are rather similar to the country-specific one, and will not be discussed in this summary.
8 Executive summary 9Executive summary
Besides this, there are three scenarios which imply changes to the current social security systems. In the first reform scenario it is assumed that the labour participa-tion goals agreed upon at the Lisbon summit – which for some countries are rather ambitious – will be realised by the year 2010 (participation scenario). The second reform scenario focuses on pension changes that have already been set in motion in some countries (pension reform scenario). These scenarios could theoretically be expected to lead to a certain regime convergence: welfare states pursue common goals through the same kind of policy measures.
Finally, an institutional reform scenario was developed. Its basic assumption is that countries will want to reform their current social protection systems as little as pos-sible; and if they do, that they will want to stick to their key policy principles. Such a ‘regime-dependent’ reform scenario rests, first of all, on the national responsibility for social security provisions. This combines with some standard theoretical reasons for ‘path dependency’: the economic and organisational costs of system changes; the cognitive frames of policy makers; and the values, norms and interests of the electorate.
The institutional reform scenario is rather stylised. Eight policy measures were selected, adjusting the volume and level of the main social security schemes. The assumptions were that countries will strive for a certain balance between financial sustainability and social adequacy; and that they will select reforms from this ‘pool of measures’ in a certain order, which fits in with the welfare regime they belong to.
If the future demographic ‘shock’ were to force most countries to implement all of these measures, some regime convergence could theoretically be expected in this sce-nario. However, in practice the number of measures to be taken in each country varies between two and seven. This makes it likely that some regime divergence will occur in the institutional reform scenario: the existing differences between welfare regimes tend to be magnified.
Sustainability
To assess financial sustainability a ‘notional contribution rate’ was calculated. This indicates the contributions that will be necessary to finance social security, taking account of private pension fund assets and government debt. In the starting year (2000) the rate in the Continental and Mediterranean regimes lies between 31 and 33%, which clearly exceeds the level of the three other countries (23-25%). Under the assumptions of the baseline scenario, the Netherlands will face the highest increase in the contribution rate, from 23% to 31%. This is due to the severity of the demo-graphic shock in this country, which currently has a comparatively ‘young’ popula-tion. The increase in Italy, on the other hand, is rather moderate: from 32% to 35% in

8 Executive summary 9Executive summary
2025. This is primarily a consequence of the Italian indexation regime: pension bene-fits are expected to lag behind the development of labour income. The other countries face increases in the notional contribution rate of between 4 to 6 percentage points up to 2025. As a result, France is expected to have the highest rate according to the base-line scenario (38%).
The three ‘reform scenarios’ generally lead to improved financial sustainability. The impact of the participation scenario is limited in this respect: the maximum effect occurs in France, where the contribution rate turns out 1 percentage point lower than in the baseline scenario. In principle, higher participation rates have a positive impact on sustainability through the widening of the contribution base (more people paying levies) and the reduction of benefit dependency below the pension age. However, this effect tends to be mitigated through the extension of pension rights, which also results from increasing labour market participation.
The pension reform scenario also has a fairly minor impacts on sustainability. Once again, the effect shows most clearly in France, where the contribution rate is about 2 percentage points lower than in the baseline scenario.
The institutional reform scenario leads to the biggest reductions in contribution rates. This is most pronounced in France and the Netherlands, where the contribu-tion rate drops by 6 percentage points compared to the baseline scenario. Accord-ing to the logic of this scenario (cf. above) these two countries have to introduce the greatest number of measures. However, elsewhere the contribution rates fall consid-erably as well (3-4 percentage points below the baseline projection).
Income inequality
In the starting year of the analysis (2000), according to the echp data the inequal-ity of the so-called ‘equivalised’ net household incomes was lowest in Denmark and highest in the United Kingdom. This is in line with the theoretical expectations: Nordic regimes explicitly try to limit income inequality, while this is not a prime con-cern in the Anglo-Saxon type, where the residual, targeted collective social security system may enhance the differences between income groups. The Netherlands and Germany follow Denmark at a close distance. France and Italy hold a middle posi-tion, having more inequality than the three former countries, but less than the United Kingdom.
According to the baseline scenario, inequality in all regimes will increase slightly by 2025. The changes are limited because overall income inequality is mainly determined by the differences within various groups (e.g. pensioners, wage-earners). This implies that the changes in the population composition studied here will not greatly affect

10 Executive summary 11Executive summary
the future income contrasts. As a result of this, the ranking of countries remains the same. The growth in inequality is strongest in the Nordic regime, but even there not very spectacular, with the Gini-coefficient rising from 0.236 to 0.247 (+4%).
Pension reductions and institutional reforms to meet sustainability generally lead to a somewhat greater income inequality in 2025 than in the baseline scenario. In these two reform scenarios the deteriorating income position of benefit claimants and pen-sioners results in greater income contrasts. However, even here inequality growth is rather limited. The institutional reform scenario indicates the greatest mutation for the German Continental regime, with the Gini-coefficient rising from 0.246 to 0.265 over the entire 25-year period (+8%). The Nordic regime is an interesting exception in this scenario. In line with its basic philosophy, the Danish measures focus on increas-ing labour participation. This results in a comparatively small rise in the Gini-coeffi-cient, from 0.236 to 0.247 – the same as in the baseline scenario, but at considerably lower costs in terms of the notional contribution rate.
Inequality growth is less marked in the participation scenario. In all regimes inequal-ity comes out lower than in the baseline variant; and in France and Italy it will even drop below the 2000 level. The inequality-reducing impact of this scenario is a con-sequence of two factors: the smaller weight of income contrasts of wage-earners and benefit claimants below the pension age (as more people have a job); and the higher pension rights accumulated by future pensioners, which reduces their income gap compared with the working population.
Redistribution of income
In 2000, redistribution through pensions and social security schemes was highest in the two Continental countries – not in the Nordic welfare regime, the a priori expecta-tion. This is mainly due to the high current volume of benefit dependency (especially pensioners) in Germany and France. The baseline scenario indicates that redistribu-tion will be higher by 2025 in all countries analysed here. This is mainly a result of the larger share of pensioners in the population; the redistribution effect of the other provisions (unemployment, disability benefits, social security and other benefits) is found to be rather stable. The higher redistribution of pensions largely compen-sates for the growth in inequality in primary incomes, which is also a consequence of the ageing process (more pensioners implies more households having a zero earned income). The rising redistribution will be most apparent in the two Continen-tal regimes, the hybrid case and the Mediterranean regime. Over the 25-year period, the difference between the Gini-coefficients of primary and net income will increase by .04-.06 in these countries. As a result of this, the ranking is expected to change: by 2025 the redistribution effect will be highest in the Netherlands, Germany and France, and lowest in Denmark and the United Kingdom.

10 Executive summary 11Executive summary
According to the three reform scenarios, redistribution will rise to a slightly lesser degree than in the baseline variant, especially in the institutional reform scenario. This is a consequence of the smaller scope of the welfare regime assumed in these scenarios (fewer benefit claimants and pensioners, lower benefit levels). But these scenarios indicate an increasing degree of redistribution over the 25-year period stud-ied here as well: the effect of the increasing volume of pensioners remains dominant.
Poverty rates
If one measures poverty by the generally accepted criterion in comparative research (60% of median net household income), the six countries studied here fell into three classes in the year 2000. According to the echp figures poverty rates were lowest in Denmark, Germany and the Netherlands (11-12%); the French Continental regime held a position in the middle (16%), while Italy and the United Kingdom clearly had the highest poverty figures (19%). This is generally in line with the results in terms of income inequalities.
According to the baseline scenario poverty rates will show minor changes by the year 2025 (-1 to +1 percentage points). The Netherlands, France and Denmark will see lim-ited rises in poverty, while Germany and the United Kingdom are expected to remain stable. For Italy the poverty rate is even predicted to decrease a little, mainly due to the slight increase in female participation which is assumed. As a result of this, the rank-ing in terms of poverty will remain the same, with a slight ‘drifting apart’ of the Medi-terranean and Anglo-Saxon regimes.
The pension reform scenario and the institutional reform scenario generally lead to bigger increases in poverty rates by 2025 (or, in the case of Italy, to more limited pov-erty reductions). The greatest rises in poverty occur in the institutional reform sce-nario for France, Germany and the Netherlands (up to 4 percentage points), mainly because of the reduction in pension benefit levels. Denmark, on the other hand, is expected to reduce poverty rates in the latter variant. In line with the characteris-tic philosophy of the Nordic regime, it is assumed this country will prefer measures aimed at higher participation rates. As a result, the number of benefit claimants below the pension age will decrease, with benefit levels remaining intact.
This effect shows much more clearly in the participation scenario. This induces slightly decreasing poverty rates in the Anglo-Saxon, Mediterranean and Continental regimes. In Denmark and the Netherlands the increase of poverty is less than in the baseline scenario. However, the impact of the participation scenario on poverty is still rather limited, with the greatest decrease in poverty showing in Italy (-2 percentage points).

12 Executive summary 13Executive summary
Currently, poverty rates among pensioners are much higher than among the popula-tion as a whole. In the baseline and participation scenarios these rates stay more or less constant. The biggest increase is seen in Italy in the baseline scenario (from 20% to 24%); this is a consequence of the relative decline of pension levels compared to wages because of the Italian indexation mechanism. The two other policy scenarios, however, indicate rather sharp increases in poverty among pensioners by 2025; in the pension reform scenario poverty rates will increase by 6-8 percentage points in France, Italy and the United Kingdom. The institutional reform scenario has an even greater impact, with poverty rates rising by 7-9 percentage points in the two Conti-nental regimes and in the Netherlands, and as much as 13 percentage points in the Anglo-Saxon welfare regime. This is mainly because a reduction in pension levels is assumed in these scenarios. The picture is even clearer for a specific group with a high poverty rate, namely single elderly women. These findings indicate that a policy focusing on financial sustainability is likely to lead to a substantial increase in poverty among the elderly in the future.
Implications for future policy and research
The present study has shown that there are clear structural differences in welfare regimes within the European Union. The Nordic systems are extensive and aim at high levels of solidarity; the Anglo-Saxon regimes are limited in scope and gener-ally do no more than complement individual and occupational welfare arrangements. Continental systems fall in between, being less universalistic and stressing the rela-tionship with the labour market experience of pensioners and benefit recipients. The Mediterranean countries are unique in their combination of limited social secu-rity provisions below the pension age, and comparatively well-developed pension schemes, at least in relative terms. The four Eastern European member states anal-ysed here achieve low scores on the general scope of social security, and lag slightly behind the European average in terms of pension schemes. A few countries, such as the Netherlands, have a hybrid welfare regime.
Taking this existing institutional heterogeneity as read, the baseline scenario indi-cates that the future ageing process will have some impact on income distributions and sustainability. In the six countries representing the Nordic, Anglo-Saxon, Con-tinental and hybrid regimes here, income inequality, poverty and redistribution will increase up to 2025, while social security systems will become less sustainable in financial terms. However, the distributive changes are often limited. The overriding impression is that the present differences will to a large extent be replicated in the future: the ranking of regimes in terms of inequality, redistribution and poverty does not change fundamentally. In distributive terms, the ageing process over the next two decades will have a degree of impact everywhere; but if the current welfare regimes
12 Executive summary 13Executive summary
remain unchanged, the existing distributive contrasts between them can be expected to persist.
As all countries will face a deterioration in financial sustainability, however, it is not very realistic to assume that the current welfare regimes will remain the same. It is more likely that countries will introduce reforms to their social security systems; and these changes may lead to different outcomes, in terms of both income distributions and sustainability.
This can be clearly observed in policy measures which limit the pension formula. The analysis performed here indicates that the long-term financial consequences of pen-sion reforms are fairly positive, in the sense that financial sustainability is improved compared with a ‘no policy’ scenario. However, these measures may have higher social costs, as the changes in the distributive indicators become larger. In particular, the income gap and poverty rates of pensioners can be expected to rise as a result of such a policy approach.
Policy measures aimed at increasing labour market participation have fairly favour-able effects compared to a ‘no reform’ scenario. These measures generally lead to greater financial sustainability and to lower scores on income inequality, redistribu-tion and poverty. However, this line of policy is by no means a panacea. Its effect on sustainability is mitigated by the fact that a higher labour force participation will ulti-mately lead to a growing group of pensioners, who in turn will have more pension rights. And the remedy may not be applicable everywhere: only in regimes which are able to raise their employment rates considerably are the effects likely to be substan-tial.
The institutional reform scenario is rather interesting, because it assumes that each country will introduce measures to tackle sustainability that are as far as possible in line with its current regime. Countries are thus expected to produce qualitatively dif-ferent policy responses to the ageing process. This implies an interaction of reforms with existing welfare regimes, which may be the most realistic assumption as regards the future policy-making process. The analyses performed here suggest that a ‘Nordic’ policy, which typically focuses on measures which raise labour participation, could have favourable effects on sustainability, while limiting the distributive impli-cations of the ageing process. Such a line of policy may not always be adequate, how-ever; the rising costs of future demographic changes may simply be too high in some countries to enable the problem to be solved merely by increasing participation rates. This explicitly holds for the Netherlands. This country will face a rather strong ageing of the population in the 2000-2025 period. This implies cuts in benefit levels had to be taken in the institutional reform scenario, leading to higher rates of inequality and poverty than in a pure ‘Nordic’ strategy.

14 Executive summary 15
Of course, the reforms that are preferred depend on a political evaluation of the rela-tive importance of sustainability and income-distributive effects. If the degree of inequality, redistribution and poverty are considered to be of little importance, and sustainability is considered to be the main policy issue, one should opt for an efficient pension reform scenario. If, on the other hand, the income distribution issue is cen-tral to policy-making – as the emphasis on poverty and social inclusion in the recent European policy debate would suggest – the aim should probably be to strive for an efficient trade-off between financial sustainability and distributive impact. In that case, two rather obvious rules of thumb could be followed in policy design:– the first step should be to stimulate labour market participation as much and as
soon as possible;– if this is not sufficient to attain acceptable levels of sustainability, the second step
should be a timely introduction of pension reforms which minimise the income effects for the poorest among the elderly population.
This research project merely presents a first and exploratory analysis of the distribu-tive consequences of the future ageing process in different institutional settings. Fur-ther research should preferably aim to:– stretch the time horizon beyond 2025, to study the effects of the peak of the ageing
process;– allow for within-regime variance, by including all eu-15 member states;– include Eastern European States in the institutional and distributive analyses;– try to refine the modelling process through the development of general equilib-
rium models for each country;– improve the specifics of the micro-simulation, by including more subgroups. This
could also allow for a detailed analysis of groups which with little or no opportu-nity to accrue pension rights: elderly women, ethnic minorities, but also single-parent families.

14 Executive summary 15
1 Introduction
To date, the debate on the implications for European welfare states of the ageing of their populations has mainly focused on the financial sustainability of pension and care systems. Earlier work, in particular by the eu’s Economic Policy Committee and the oecd, points to a growing financial burden in the eu-15-countries over the coming decades.1 The costs of statutory pensions for people aged 55 years and over are expected to rise in all eu-15 countries.
However, relative pension costs are also determined – and possibly reduced – by other factors. Examples include the development of labour participation, eligibility, and benefit levels. Labour participation is expected to rise in all countries, thus widening the funding base for pensions. The southern eu member states in particular could make substantial gains here, because at present female participation is relatively low. Furthermore, in many countries the eligible group is expected to become smaller due to reductions and increased flexibility of pre-pension schemes and a higher statutory retirement age. However, some countries may see a rise in eligibility, because social protection schemes are still in an early stage of development and will grow towards more general European standards. Finally, pension benefits in several countries are expected to lag behind the development of labour productivity, which would make it easier to finance the growing number of pensions. Again, this may not apply to coun-tries which currently have relatively meagre pensions, because these may be expected to rise towards higher standards in the future.
Analyses that take these factors into account may help to clarify the demographic strain the eu-member states are under, and are quite relevant for the policy process, especially considering the goals as espoused at several recent eu summits. At the Stockholm and Gothenburg meetings there was agreement on tackling the problems of ageing through a triple strategy: reduction of the national debt of member states, increasing labour participation, and adaptation of the national systems of social pro-tection, including pensions. For the latter an ‘open method of coordination’ was chosen, implying an intergovernmental procedure which aims at the development of common objectives, agreed indicators, regular reporting and the identification of best practices.
As mentioned above, much of the research effort has thus far been devoted to the first of these common objectives, the financial sustainability of pensions and care systems; knowledge on the other two common goals is less well developed – for example, the implications of population ageing for the adequacy of pension systems, and the need to modernize pension systems in the light of changing needs of individuals and society (flexibilisation of the labour market, equal opportunities for both sexes, more individ-

16 Introduction 17Introduction
ual choice in terms of coverage). This is a particularly striking omission, since there may very well be a trade-off between these goals. For instance, not indexing pension benefits may be an effective way to reduce costs; but in the long run it could lead to increasing poverty and inequality. This runs counter to the goal of adequacy of pen-sions, and in some countries could induce resistance among a substantial part of the elderly electorate, making non-indexation over an extended period of time less fea-sible there. On the other hand, indexing pension benefits may be an effective means of guaranteeing an adequate standard of living for older people, but this line of policy could leave less room to modernize the social protection system in order to serve the growing demands of the well-to-do middle classes.
It is therefore quite useful to include not only issues of financial sustainability on the research agenda on ageing, but also questions relating to distributions and the (im)possibilities of modernization. In this project attention will focus on the dis-tributional results in different countries: the changes in the existing distributions of income and poverty rates within and between groups as a consequence of demo-graphic change. An emphasis on distributional aspects means a shift from the macro-effects towards the micro-effects of ageing. It is desirable to analyse the potential impact of ageing on the income position of individual households in various eu member states. This is in line with the central place accorded to poverty and social exclusion in the European policy process after the Lisbon and Nice summits, and may provide guidelines for future policy in the field.
The aim of this study is to carry out an explorative analysis of the possible future dis-tributional results in a representative selection of member states of the European Union. Of course, the analysis could focus on national differences as such, but ana-lytically this is not a very satisfactory approach. More interesting would be to study the way in which the formal institutions of countries interact with future demographic and socio-economic developments to produce certain distributive result, and this will be the key aim of this study. This requires an analysis of similarities and differences of countries’ institutional structures. It is relevant for future policy development to know whether systems with different policy traditions might produce different reactions and results on the demographic ‘shock’ of ageing. Therefore, the units of analysis are not countries as such, but rather the regime type to which they belong.
The study consists of three parts. First of all, an institutional analysis is performed (chapter 2). In this part of the project, all welfare states of the former eu-15, four Eastern European member states and four other Western countries are analysed and clustered into welfare regimes.
In the second part of the study, six welfares states which are considered representative for the various welfare regimes in the European Union were analysed to explore pos-

16 Introduction 17Introduction
sible future income distribution results. For this purpose, a demographic-economic macro model and four scenarios were developed to describe the effects of the ageing process on the main indicators of social security (e.g. number of beneficiaries and average benefit levels) up to 2025 (chapters 3 and 4).
In the third part of the study, these indicators were applied to the European Com-munity Household Panel (echp) to generate simulations of the situation in 2025. The simulated databases were used to analyse future income inequalities (chapter 5), redistribution of welfares regimes (chapter 6), and poverty rates (chapter 7) for the various welfare regimes.
18 Introduction 19
Notes
1 Cf. European Commission, Reforms of pension systems in the eu – an analysis of policy options. In: European Economy, 73, 2001; epc, Budgetary challenges posed by ageing populations: the impact of public spending on pensions, health and long-term care for the elderly and possible indicators of the long-term sustainability of public finances. Brussels: Economic Policy Committee, 24 October 2001; oecd, Fiscal implications of ageing: projections of age-related spending. In: Economic Outlook, nr. 69, 145-167. Paris: 2001; oecd, Ageing and income, financial resources and retirement in 9 oecd countries. Paris: 2001.

18 Introduction 19
2 Welfare regimes
The focus of this study is on an analysis of the consequences of different welfare states with regard to poverty and income distribution in the coming decades. In the European Union, each country differs in its social security arrangements. In some countries old age pensions are only provided to former employees, whereas other countries give all citizens an old age pension. In addition, the level of benefits can vary quite considerably. Some countries give disabled people about seventy percent of their former salary, whereas other countries only provide an allowance at a minimum level. These differences can be quite substantial. In order to analyse the consequences of ageing societies, therefore, a separate analysis is needed for each country.
Although all countries differ in their arrangements, some correlation between the institutional schemes can be observed. This aspect is described by Esping-Andersen’s typology of ‘welfare states’. In his book The Three Worlds of Welfare Capitalism (1990) he describes the differences between ‘liberal’ countries, like the United Kingdom and Ireland, ‘corporatist’ countries such as Germany and France, and ‘social-democratic’ countries such as Denmark and Sweden. For each of these three typical welfare states, he describes the main characteristics in the field of social security and labour market arrangements.
Quantitative analysis was used to analyse the different welfare regimes. All current eu member states (eu-15 countries), four Eastern European new member states (Poland, Hungary, The Czech Republic and Slovakia) and four other Western countries (United States, Canada, Australia and Norway) were included in this analysis, in which 85 key characteristics of the national welfare states were collected in order to test the exis-tence of the different welfare regimes posited by Esping-Andersen. The results pre-sented in this chapter confirm the existence of the three welfare state types referred to, but the analysis additionally reveals two further welfare state types: the ‘Mediterra-nean’ and the Eastern European welfare state.
2.1 Theoretical welfare regimes
In 1990, Gøsta Esping-Andersen published his book The Three Worlds of Welfare Capi-talism, identifying three types of welfare state regimes: the liberal welfare regime, which has low provisions; the social-democratic welfare state, which is geared primar-ily towards reducing income differentials; and the corporatist welfare regime, which places the emphasis on social insurance for employees. After a few years the book actually became a classic, and as a result Esping-Andersen has become the most widely quoted sociologist in the field of research on welfare states. In the argumenta-tion used by Esping-Andersen, the concept of a welfare regime is wider than a welfare

20 Welfare regimes 21Welfare regimes
state. Studying regimes enables the systematic coherence between social policy in the countries concerned to be analysed. ‘Regimes refer to the ways in which welfare pro-duction is allocated between state, market and households’ (Esping-Andersen 1999:73).
The assumption of stable welfare regimes is plausible for three reasons (North 1990, 1998; Hall and Taylor 1996). The cost of changing regimes may be quite consider-able, both in organisational and social terms. Policymakers may have certain cogni-tive frameworks and vested interests, which makes it difficult for them to envisage an entirely different future. And the electorate may hold certain values and social norms, and cast their vote according to group interest, which may bar revisions which would fundamentally alter the current institutional regime. The characterisation of a welfare regime therefore shows the more long-lasting characteristics of social security sys-tems rather than analyses of separate provisions.
Esping-Andersen’s central tenet is that three divergent welfare regimes can be identi-fied, and that each has a different social impact in terms of the two main dimensions:– Decommodification, i.e. the degree to which individuals or families are able to
achieve a socially acceptable living standard, independently of their participation in the labour market.
– Stratification; this refers to the way countries shape the structuring of rights. Welfare states of the same size can have very different stratification effects: one country may sustain the existing hierarchy and status divisions, another country may promote a two-tier system; while a third may aim at universalism.
Esping-Andersen argues that these two aspects largely define the different wel-fare regimes. The liberal welfare regime (mainly the Anglo-Saxon countries) is char-acterised by a low level of decommodification. This regime provides only meagre means-tested benefits for the demonstrably needy. In order to keep the number of beneficiaries small, strict access conditions are applied: only those not capable of work are eligible, and stringent means-testing is used to determine the benefit. The benefit levels tend towards ‘minimal subsistence level’ rather than seeking to main-tain the recipient’s former wealth status. As benefits are meagre, tax rates can be low. The rest of the population are stimulated by tax breaks and tax exemptions to pur-chase private social insurance plans, leading to a stratification in the population – on the one hand a minority of low-income state dependents, and on the other a major-ity of people able to afford insurance plans. In the liberal welfare state, people are encouraged to participate in the labour force. Therefore a minimum wage, if present, is low and the pension age is high. The low levels of benefits and the strict access con-ditions encourage women to enter the labour market.

20 Welfare regimes 21Welfare regimes
The corporatist welfare states (mainly the continental European countries) are char-acterised by a moderate level of decommodification. In the past, most schemes were set up to generate loyalty by specific groups in society to the central state or the mon-archy, and thus introduced separate schemes for the existing castes and classes. Wealth differences between these groups were accurately replicated so as to pro-tect the individual social positions, while civil servants had an elevated position in the programmes because of their link with the state. Since the Catholic Church was often also responsible for the development of the system, this type of welfare regime is often designed to foster the traditional family structure: non-working women are generally excluded from social insurance schemes; family provisions encourage full-time motherhood, while childcare and similar facilities are underdeveloped. The labour participation of women is therefore low.
The access conditions of the different programmes are fairly strict. In contrast to the liberal welfare regimes, these conditions are based on the history of paid contribu-tions rather than on the actual need for benefit. In the corporatist regime, benefits may be paid for a long period, provided sufficient entitlement has been built up. The level of benefits is high and is generally a percentage of previously earned income, and thus aims to replicate the former wealth of the employee. As the schemes are mostly separately funded and encompass solidarity within each scheme, they are financed through compulsory contributions, which can be regarded as relatively high. The predominance of these collective social insurance schemes means the coverage of private provisions is limited.
Since the retirement age is low, the participation rates of the elderly are also low in these countries. Similarly, the incentives for disabled people to work are low since eligibility for disability benefit is determined mainly by the employment history of the claimant. As the schemes are organised collectively, less productive people can leave the labour process relatively painlessly during times of economic recession. There is little collectively guaranteed employment and only a small number of sheltered employment schemes.
The stratification in corporatist countries tends to maintain the traditional differ-ences based on occupational status, lifestyle and gender. Esping-Andersen refers to a division between working and non-working people such as women, the disabled, the elderly and young people. As pay demands are set at high levels by the trade unions, the employment opportunities for less productive workers are low, thus lowering the employment rate in these countries.
The degree of decommodification differs between (formerly) employed people and non-working people. The former group generally have a high replacement rate for their disability and pension benefits. However, as most benefit schemes are based on

22 Welfare regimes 23Welfare regimes
employment history, the latter group suffer low decommodification. For example, the amounts of social assistance are relatively low in corporatist countries.
The social-democratic welfare regime (mostly the Scandinavian countries) is character-ised by a high degree of decommodification. The aim in these regimes is to achieve a high level of social protection for all residents of the country, while reducing income differentials between citizens. Employment plays a crucial role in this regime. In con-trast to the corporatist welfare regime, eligibility for benefits mainly depends on the recipient’s chances on the labour market, thus encouraging all people to accept a job. Moreover, active labour market policies and training programmes are widely available to motivate people to find work. Elderly people face a high retirement age and women are supported by widely available childcare and leave arrangements to enable them to combine work with care tasks. If a minimum wage is present, the amount is low, thus opening the labour market to low-production employment. To stimulate employ-ment, many educational programmes are set up for unemployed people, including courses, trainee placements and other on-the-job training schemes. The goal of these active labour market programmes is to reduce the distance between unemployed people and the labour market.
The social-democratic regime is largely universalistic; in that all inhabitants are cov-ered for the same risks and on the same conditions. No distinction is made between occupational classes; everyone falls within the same scheme. The access conditions are based more on ideals of citizenship than on claimants’ employment history. Because of this universalistic approach, most arrangements are financed through taxation.
The benefits for people who are unable to work can be high and last for a long time. Benefits are usually linked to previous salary and minimum income benefits are fairly high. As a consequence, tax rates are also high, though are mitigated by the high employment rate which broadens the tax base. The high tax rates also oblige women to go out to work, since an adequate family income can only be achieved if both part-ners work. Another result of the high benefits and the generous access conditions is the low coverage of private provisions.
Esping-Andersen has also received criticism for his work. Some critics argue that his typology has merit but is neither exhaustive nor exclusive. In recent years, many authors have replicated the study and posited other dimensions of the welfare regimes. In a state-of-the-art article, Arts and Gelissen (2002) enumerate several stud-ies in which welfare states are classified into distinct regimes. Some studies focus on replication of the Esping-Andersen study; while others focus on other aspects of the welfare regime. However, as Arts and Gelissen conclude, a certain pattern can be deduced from the analyses. Their meta-analysis shows that not every classification

22 Welfare regimes 23Welfare regimes
by the authors covers the same nations, although there is a fairly large overlap in the clustering of the countries. All studies show at least the three Esping-Andersen wel-fare regimes, although the designations of the regimes are all different. Some authors add a fourth or even fifth welfare regime to the Esping-Andersen classification. Table 2.1 shows the features of the regimes of these various authors. Arts and Gelissen noticed that for each welfare regime some countries are always classified in the same cluster. These countries could serve as prototypes of the respective welfare regimes and are therefore listed in the headings of the cells.
Table 2.1 An overview of typologies of welfare states
Liberal regimes(United States)
Corporatist regimes(Germany)
Social-democratic regimes(Sweden, Norway)
Mediterranean regimes(Spain, Portugal, Greece, Italy)
Radical regimes(Australia)
Esping Andersen (1990)
Liberallow level of decom-modification; market differentia-tion of welfare
Corporatistmoderate levels of decommodification; social benefits mainly depend on former con-tributions and status
Social-democratichigh level of decom-modification; universal benefits and high degree of benefit equality
Leibfried (1992)
Anglo-Saxonright to income transfers; welfare state as compensa-tor of last resort and tight enforcer to work in the marketplace
Bismarckright to social security; welfare state as com-pensator of first resort and employer of last resort
Scandinavianright to work for everyone; universal-ism; welfare state as employer of first resort and compensator of last resort
Latin Rimright to work and welfare proclaimed; welfare state as a semi-institutionalised promise
Castles and Mitchell (1993)
Liberallow social spending and no adoption of equalising instru-ments in social policy
Conservativehigh social expen-ditures, but little adoption of equalising instruments in social policy
Non-right hegemonyhigh social expendi-ture and use of highly equalising instruments in social policy
Radicalachievement of equality in pre-tax, pre-transfer income, but little social spending
Siaroff (1994)
Protestant liberalminimal family wel-fare, yet relatively egalitarian gender situation in labour market; family benefits are paid to the mother but are rather inadequate
Advanced Christian democraticno strong incentives for women to work, but strong incentives to stay at home
Protestant social-democratictrue work-welfare choice for women; family benefits are high, paid to the mother; importance of Protestantism
Late female mobili-sationabsence of Protes-tantismFamily benefits are usually paid to the father; universal female suffrage is relatively new

24 Welfare regimes 25Welfare regimes
Table 2.1 An overview of typologies of welfare states (Cont’d)
Liberal regimes(United States)
Corporatist regimes(Germany)
Social-democratic regimes(Sweden, Norway)
Mediterranean regimes(Spain, Portugal, Greece, Italy)
Radical regimes(Australia)
Ferrera (1996)
Anglo-Saxonfairly high welfare state coverage; social assistance with a means test; mixed system of financing; highly integrated organi-sational framework entirely managed by a public admin-istration.
Bismarckstrong link between work position and social entitlements; benefits proportional to income; financing through contributions; reasonably substantial social assistance benefits; insurance schemes mainly governed by unions and employers organi-sations
Scandinaviansocial protection as a civil right; universal coverage; relatively generous fixed ben-efits for various risks; financing mainly through tax revenues; strong organisational integration
Mediterraneanfragmented system of income guarantees linked to work posi-tion; generous benefits without articulated net of minimum social protection; health care as a right of citizenship; particularism in pay-ments of cash benefits and financing
Bonoli (1997)
Britishlow percentage of social expenditure financed through contributions (Beveridge); low expenditure as percentage of GDP
Continentalhigh percentage of social expenditure financed through con-tributions (Bismarck); high social expenditure as percentage of GDP
Nordiclow percentage of social expenditure financed through contributions (Bev-eridge); high social expenditure as percentage of GDP
Southernhigh percentage of social expenditure financed through contri-butions (Bismarck); low social expenditure as percentage of GDP
Korpi and Palme (1998)
Basic securityentitlements based on citizenship; application of flat-rate benefits principle
Corporatistentitlements based on occupational category and labour force participation; use of the earnings-related benefit principle
Encompassingentitlement based on citizenship and contributions; use of flat-rate and earn-ings-related benefit principle
Targetedeligibility based on proven need; use of the mini-mum benefit principle
Source: Arts and Gelissen (2002)
Besides these studies, the scp studied the three welfare regimes as defined by Esping-Andersen empirically in 2001. In the scp publication On Worlds of Welfare, 58 features of 11 countries were analysed using non-linear principal component analysis (Wildeboer Schut et al., 2001). The results confirmed the existence of the three different types of welfare regimes: a corporatist group (France, Germany and Belgium), a liberal group (United States, Canada, United Kingdom and Australia) and a social-democratic group (Sweden, Norway and Denmark). The results showed the Netherlands to be a special case in the study, combining both social-democratic and corporatist features.
24 Welfare regimes 25Welfare regimes
In general, the various analyses of the welfare regimes appear to both confirm and contradict each other. All studies confirm at least a threefold division of welfare regimes. Esping-Andersen’s liberal regime can be compared to the Anglo-Saxon regime of Leibfried, the Liberal regime of Castles and Mitchell, the Protestant Liberal regime of Siaroff, the Anglo-Saxon regime of Ferrera, the British regime of Bonoli, and the Basic Security regime of Korpi and Palme. All authors consider the United States as a representative of this ‘liberal’ regime. However, the focus of the different authors differs and it is not entirely accurate to regard the different classifications as representations of the same welfare regime classification. However, as Arts and Gelis-sen argue, the coincidence is certainly present. Whereas Esping-Andersen considers decommodification and stratification the main dimensions of welfare states, Leib-fried uses social insurance and poverty policies as the main dimensions. He character-ises the Anglo-Saxon type as a welfare regime which only compensates for poverty as a last resort. The main focus of this welfare regime is on encouraging employment in the market sector. Other typical features are low social spending (Castles and Mitch-ell, Bonoli), low adoption of equalising instruments in social policy (Castles and Mitchell), minimal family welfare (Siaroff ), low, flat-rate benefits (Korpi and Palme) and strictly means-tested social assistance (Ferrera).
All authors include Germany in their ‘corporatist’ regimes. The names given to these regimes range from ‘Bismarck’ to ‘Advanced Christian Democratic’. The strong link between a person’s employment situation (Ferrera), the limited use of equalising instruments (Castles and Mitchell), high percentage of social expenditure through contributions (Bonoli) and entitlement based on occupational category (Korpi and Palme) are all features that are mentioned by Esping-Andersen. The low female par-ticipation rate is explicitly mentioned by Siaroff.
The ‘social-democratic’ regimes are characterised by a high labour participation rate (Leibfried, Siaroff ), universal rights or eligibility based on citizenship (Leibfried, Fer-rera) and a strong focus on equality (Castles and Mitchell). In addition, according to Bonoli and Castles and Mitchell, social expenditure is high. All authors consider Sweden and Norway as belonging to this regime.
There are also differences between the studies, however. Authors like Leibfried (1992), Siaroff (1996), Ferrera (1996) and Bonoli (1997) demonstrate the presence of a fourth welfare regime, a Mediterranean or ‘Southern’ model. Although the nomenclature and the specific division of countries varies between the authors, all agree that Spain, Por-tugal, Greece and Italy belong to this welfare regime (Arts and Gelissen, 2002).
Ferrera explicitly argues for the existence of a ‘Southern model’ by showing some typical traits of these countries. This welfare regime is characterised by a highly frag-mented and ‘corporatist’ income maintenance system, displaying marked internal

26 Welfare regimes 27Welfare regimes
polarisation: peaks of generosity (e.g. on pensions) accompanied by wide gaps in social security protection: some countries have no minimum income guarantees, for example. Secondly, the ‘Southern’ model is characterised by a low degree of state penetration of the welfare sphere and a highly collusive mix of public and non-public actors and institutions. A third characteristic, according to Ferrera, is the persis-tence of clientelism and the formation – in some cases – of fairly elaborate ‘patronage machines’ for the selective distribution of cash subsidies. Finally, Ferrera character-ises the Southern welfare state as showing a departure from corporatist traditions in the field of health care.
As most schemes are occupation-related, the Southern welfare regime is closer to the corporatist regime than to the liberal or social-democratic system. There are differ-ent schemes for private-sector employees, civil servants and the self-employed; this characteristic is most pronounced in Italy and Greece (Ferrera 1996:19) and is present to the lowest degree in Portugal. However, the most distinctive characteristic is the ‘polarised’ character of the income protection system, which Ferrera describes as the first important difference compared to the corporatist countries. While the pension schemes can be described as generous for employees in the regular labour market, schemes for the irregular labour market (e.g. social assistance and unemployment schemes) are lacking or very small. The dualistic system of income maintenance tends to generate a peculiar polarisation within the clientele of the Southern welfare state. On the one hand there is a large group of hyper-protected beneficiaries such as public employees, white-collar workers and private sector wage-earners. On the other hand, there is also a large number of under-protected workers and citizens who draw only meagre benefits. For every family, it is necessary to have at least one member firmly anchored in the first group (Ferrera 1996: 21). As a consequence, the family is very important in the Mediterranean countries as this provides a major means of redistrib-uting income among citizens. Ferrera observes that the current situation of ‘polari-sation’ can be partly explained in terms of underdevelopment. Countries such as France, Belgium or Luxembourg have filled the gaps in their safety nets only in recent decades, and Ferrera expects the Southern countries to catch up soon.
Esping-Andersen characterises Australia and New Zealand as representatives of the liberal welfare regime. However, according to Castles and Mitchell, these countries have a more particular and a more inclusive approach to social protections. They argue that social policy in these countries is almost entirely means-tested, something which is also stated by Korpi and Palme. However, eligibility is rather broad, so that the number of people receiving some benefit is fairly high. Total social spending is still low and most risks are covered by the private market.
When Esping-Andersen developed his classification in 1990, no attention was paid to the former Eastern Bloc countries. In 2004, 15 years after the Iron Curtain was swept

26 Welfare regimes 27Welfare regimes
away, eight countries (Poland, Hungary, the Czech Republic, Slovakia, Slovenia, Esto-nia, Latvia and Lithuania) join the European Union, along with Cyprus and Malta. The New member states will account for some 16% of the total population of the enlarged European Union.
The institutions of these countries have undergone considerable changes since 1990. The early years of transformation in most Central and Eastern European countries brought economic crises unlike anything experienced under the old Socialist regime: high inflation, sudden and widespread job losses and spreading poverty (Fultz, 2000). In most countries the governments moved quickly to adapt existing social security schemes to the crisis: criteria for early retirement were liberalised and new family benefits were established to compensate for inflation and the removal of subsidies on basic commodities. The economic transformation implied that two pillars of their welfare regime, viz. the principle of full employment and fixed prices for consump-tion goods, would have to be discarded. As a consequence, unemployment and pov-erty rose steadily in these countries. The Eastern European countries had to design new institutions and instruments to cope with these problems. When the econo-mies gained stability in the second half of the 1990s, almost all governments started to restructure their social security systems to take account of the new needs of the population. However, this reform process appeared to be very complex and, as a con-sequence, many proposed reforms had to be withdrawn or amended. Debates on pension reforms engendered a clash between neoliberal economists and supporters of traditional social insurance. In Hungary and Poland, where the former prevailed, this complexity of radical pension reform led to a faltering start to the privatisation of pensions. By contrast, the restructuring of the disability arrangements was relatively modest.
Fultz (2000) shows that pension and disability reforms were largely shaped by the desire of former Eastern Bloc countries for more individualised benefits in the wake of the socialist period, and that family benefits contracted under fiscal pressures were targeted at those most in need. Götting (1998) argues that the reforms in the four major countries of the region (Poland, Hungary, the Czech Republic and Slovakia) resulted in hybrid institutional arrangements that reflected a compromise between the liberal-residual and corporatist welfare regime concepts. The governments intro-duced strong links between income, contributions and benefits in unemployment, pension, health and sickness insurance, in order to improve the equivalence prin-ciple and the reproduction of recipients’ prior welfare status, which is a characteris-tic of the corporatist welfare regime. On the other hand, the pension reforms can be described as liberal because most governments introduced private pension funds, in which the pension received depends only on the contributions paid by the employee (defined contribution system). Early retirement schemes were widely applied in order to reduce the labour force. Incentives for women to withdraw from the labour market

28 Welfare regimes 29Welfare regimes
were introduced, although the majority of women did not adopt the ‘new-old’ house-wife role concept put forward by some conservative political forces (Brusis, 1998). All four countries introduced income-related insurance-based unemployment benefits, for which the eligibility constraints were subsequently tightened. Only the Polish gov-ernment replaced the comparatively generous income-related unemployment benefit with a flat-rate benefit, in 1992.
2.2 Empirical analysis
As discussed in the last section, the characterisation of a welfare regime shows the longer-term characteristics of a social security system rather than an analysis of sepa-rate provisions. To detect these main characteristics, a princals-analysis (principal components analysis by alternating least squares) is very useful. This procedure uses optimal scoring to detect the main dimensions of the various arrangements repre-senting the institutional structure of the welfare state. These dimensions are relevant for future policy development because a system that generally places strong emphasis on social policy might produce other reactions and results in response to the demo-graphic ‘shock’ of ageing than a system that attaches low priority to social policy. Therefore, it is not specific provisions that should be the unit of analysis, but rather their main welfare state dimensions.
To explore the different social security systems in the European countries, an prin-cals-analysis was carried out on the main characteristics of the various European social security systems, replicating the scp-study of Wildeboer Schut et al. (2001). In the new analysis, the social security systems of 23 countries are included: the current 15 member states of the European Union, four New Member States that will join the eu in 2004 and four other countries (usa, Australia, Canada and Norway). Note that the current 15 member states also include Italy, Greece, Portugal and Spain, so that it is possible to analyse the existence of a Mediterranean welfare regime. Due to the addition of the four non-eu countries, it is also possible to compare the new analy-sis with the former scp analysis. In 2004, ten countries will join the European Union. Four of these countries (Poland, Hungary, the Czech Republic and Slovakia) are included in the analysis, enabling the existence of a New Member welfare state regime to be tested. The other six New Member States (Estonia, Latvia, Lithuania, Slovenia, Malta and Cyprus) are excluded because of lack of data availability. These states are not members of the oecd and some data were therefore not available. Note that the four selected countries in the analysis are all Eastern European countries, which is not the case for the other New Member States like Malta and Cyprus. These four countries are therefore denominated as Eastern European.
In table 2.2 the selected countries are listed according to the theoretical analysis of Esping-Andersen, supplemented by the Mediterranean and New Member countries.

28 Welfare regimes 29Welfare regimes
Table 2.2 Theoretical classification of countries
Social-democratic Corporatist Liberal Hybrid Mediterranean Eastern European
Denmark France United Kingdom Netherlands Italy Poland
Sweden Germany Ireland Spain Hungary
Finland Austria United States Portugal Czech Republic
Norway Belgium Canada Greece Slovakia
Luxembourg Australia
To examine this theoretical classification empirically and to analyse whether the six selected countries represent different welfare regimes, data were collected on 85 dif-ferent characteristics of the welfare states of the 23 countries concerned. The main data sources used were the descriptions of the social security arrangements given by the missoc and missceec-database of the European Commission (2002), the Inter-national Social Security Association, oecd statistics and scientific studies involving comparisons of the social security arrangements. The items are listed in Appendix A1 and divided into 12 sub-categories: occupationalism; funding of social security; labour market arrangements; old age pension provision; widow’s benefit insurance; child/family allowances; custody arrangements; disability arrangements; occupa-tional disability insurances; unemployment benefits; national assistance; and paren-tal leave arrangements. Together, the variables present a fairly complete picture of each welfare state type with respect to the social security arrangements.
The systems featured in this analysis are based on the situation around 2000. Most of the qualitative data on the systems reflect the situation in around 2001; the more quantitative characteristics (estimated replacement rates, tax rates) refer to the years around 1998 to 2000. In some specific cases, the system has changed in the last few years (e.g. pension reforms in Sweden and Italy). In these cases, the new system char-acteristics are taken into account as well as the quantitative information relating to the old situation. Although this may appear inconsistent, it describes the transitional state of the arrangements reasonably well. Most countries have transitional legisla-tion whereby the system change comes into full effect after several years, so their impact will not yet be visible in the current statistics.
The princals procedure is used to scale the different welfare states (Gifi, 1990). This procedure detects the main dimensions of the countries and their system features. The main characteristic of these dimensions is that they correlate opti-mally with the original 85 features of the dataset.1 The dimensions can therefore be regarded as a reduced representation of the dataset and also as a description of the welfare states of the countries. Owing to the procedure used, countries that have a lot in common attain almost the same scores on the dimensions, whereas countries

30 Welfare regimes 31Welfare regimes
with many differences attain very different scores. Princals always standardises the scores to a zero mean and a standard deviation of 1. As a consequence, leaving out or adding countries or characteristics to the analysis changes the scores of the other countries.
All characteristics are classified in categories for the princals procedure. Some-times the coding of the variables is straightforward (e.g. widow’s pension is means-tested or not), but for the quantitative variables it is more complicated. To classify these variables, some cut-off points were chosen where natural distinctions occurred. Naturally, the results of the princals depend on the cut-off point chosen and on the selected features of the welfare states. However, sensitivity analysis showed the results to be stable to different selections and classifications of the variables; only slight changes in positions of the countries were observed.
For this analysis, the dataset is represented by two dimensions. Annex A1 presents a table in with the component loadings of all variables for both dimensions.2 The princals procedure shows the first dimension unifying several features of the wel-fare state, such as the size of the social security system (e.g. tax rates and unemploy-ment benefits as a percentage of gdp and levels of national assistance), but also the expenditure on labour market programmes and the generosity of leave arrangements. In addition to these characteristics, the universalism of the arrangements is also rep-resented in the first dimension. This dimension can therefore be denominated as the ‘general scope of the social security system’. The second dimension, plotted on the vertical axis, corresponds mainly with the generosity of the pension system in combi-nation with occupational disability benefits, child benefits and employee protection on the labour market as can therefore be denominated as ‘Extent of pensions etc.’. Figure 2.1 plots the scores of the princals-scaling procedure for the 23 countries.3
From the figure five clusters of welfare states can be observed: a Nordic, a Continen-tal, an Anglo-Saxon, a Mediterranean, and an Eastern European welfare regime. The Nordic countries Denmark, Finland and Sweden have high scores on the first dimen-sion: in general, the scope of social security arrangements is generally high and uni-versalistic, which corresponds to Esping-Andersen’s social-democratic welfare state. The Mediterranean countries (Greece, Spain, Italy and Portugal) are separated from the other countries by low scores on the first dimension and high scores on the second dimension. Of this group, Greece and Spain are the most distinct examples of the Mediterranean model. The Anglo-Saxon countries (Ireland, United Kingdom, Austra-lia, Canada and the United States) form a separate group in the lower part of the figure. In these countries, the state pension schemes are small. The features of this regime correspond in certain ways to Esping-Andersen’s liberal welfare regime. In contrast to the analyses of Castles and Mitchell, and Korpi and Palme, Australia comes out as a clear member of the Anglo-Saxon welfare regime. This means that a ‘radical’ wel-

30 Welfare regimes 31Welfare regimes
fare regime cannot be detected on the basis of this analysis. The Continental coun-tries (France, Germany, Austria, Luxembourg and Belgium) lie in the centre of the figure. This group do not achieve particularly high scores on either dimension. Note that the Continental countries score on average higher on this dimension than the Nordic regime. As this dimension is related to the size of the state pension schemes, the scope of the pension schemes in the Continental can be regarded as greater than in the Nordic regime. On average, the four Eastern European states (Poland, the Czech Republic, Hungary and Slovakia) score lower than the Continental countries on both dimensions. These countries can therefore be considered as a separate welfare state type.
Figure 2.1 Scaling of 23 countries based on 85 welfare regime characteristics
Source: SCP
Two countries do not fit into any of these groups: the Netherlands and Norway. These countries can be described as hybrid. Norway lies in between the Nordic and Anglo-Saxon groups, while the Netherlands lies between the Nordic and Continental groups. For the Netherlands, this is discussed theoretically by Esping-Andersen and is also empirically analysed in Wildeboer Schut et al. (2001). For Norway, however, the
��
���
���
���
��
��
��
��
��
�
���
�
�
��
�
�
���
�
���
�
��
�
gene
ral s
cope
of s
ocia
l sec
urity
extent of pensions etc.
low high
high
low

32 Welfare regimes 33Welfare regimes
result is more or less unexpected, although Wildeboer Schut et al. (2001) showed the Norwegian welfare state in some respects to be less Nordic and more Anglo-Saxon than that in Denmark, and Sweden.4 Spending on active labour market policies is lower in Norway and the replacement rates of pensions, unemployment benefits and socials assistance are slightly lower than in the other Nordic countries, thus leading to lower tax rates.
For all selected characteristics, the mode of each cluster is presented in annex A1. In the next sections, the main characteristics of the different welfare states will be dis-cussed using the characteristics from this table.
2.3 Nordic welfare regime
As can been seen from figure 2.1, the Nordic countries (Denmark, Finland and Sweden) achieve high scores on the first dimension, which correlates with a large-scale social security system, high expenditure on labour market programmes, rela-tively large scope of parental leave arrangements, and universalistic entry conditions. This welfare state type is therefore comparable with the social-democratic denomi-nation of Esping-Andersen. For this welfare regime total general government rev-enues exceed 55% of gdp, while this percentage is below 55% for the other regimes in the analysis. Expenditure on labour market programmes is high, with Denmark, for instance, spending the most on labour market policies of all analysed countries; about 3% of gdp is spent on passive labour market instruments and more than 1.5% on active labour market activities. In comparison with other countries, the leave arrangements for parents are extensive. In this welfare regime, governments pay for parental leave for all residents. In Denmark and Finland, the allowance is a low flat-rate payment, which in Denmark is 70% of the unemployment benefit rate. In Sweden, the benefits are equivalent to 80% of earnings for one year, after which the allowance is reduced to a flat rate benefit for three months.
The leave arrangements are paid by the government and funded through taxes. The tax rates are relatively high in these countries; for example, the average tax rate for a married worker with two children is 37% in Denmark, the highest of all countries analysed. Although the average tax rates are high in the Nordic countries, the mar-ginal tax rates differ between countries and are comparable with the Continental regimes. For instance, the total marginal rate for a standard single worker with no children as defined by the oecd is 51% in Denmark, whereas in Belgium and Ger-many this rate is over 53% (oecd, 2002c). On the other hand, the marginal rate in Sweden would be 35% for this person, which is comparable with Austria (42%) and Luxembourg (35%). However, as the tax base is broader in the Nordic countries (fewer tax credits and tax deduction facilities), the average rate of tax on income is higher.

32 Welfare regimes 33Welfare regimes
Unemployment benefits are relatively high in the Nordic countries. For instance, in Denmark unemployment benefit is set at around 90% of the recipient’s former wage for up to five years, by far the highest unemployment benefit level in the European Union. The average net replacement rate during these five years, averaged for four family types and at two earnings levels, is 81% in Denmark. This figure is also above the European Union average for Sweden (79%), Finland (69%) and Norway (69%). The main reason for these high figures is the long duration of the unemployment benefit in combination with the high standard social security levels in these countries. Furthermore, social assistance rates are fairly high: if an average unemployed person remains unemployed, his/her social security benefit rises after five years. In Denmark, a married unemployed person with two children and a former salary at average pro-duction level receives 73% of this former salary in the first month. In the longer term, s/he may receive up to 80%, although the latter allowances are means-tested.
Pensions in the Nordic welfare regime are moderate. Pension systems do not differ-entiate between occupational groups and can therefore be characterised as universal-istic. People without an employment history are eligible for a state pension, although this pension is means-tested in Denmark and Finland. As regards earnings-related pension schemes, in Sweden and Finland all working people (salaried and self-employed) are covered by the state pension system. In Denmark the self-employed have to arrange their own pension. Because of the defined contribution system used in Denmark and Sweden (benefits are related only to former contributions), there are no limitations to the minimum and maximum benefits from earnings-related schemes.
2.4 Anglo-Saxon welfare regime
The Anglo-Saxon states (United Kingdom, Ireland, United States, Canada and Aus-tralia) generally have rather low state pension benefits in comparison to the other countries. Older persons without an employment history are only entitled to means-tested social assistance in this regime. For those with an employment history, ben-efits are relatively low. In general, this regime operates defined contribution schemes or, where there is a defined benefit scheme, the target for the state pension is below 50% of earned income levels. In addition, the maximum pension benefits are often restricted in these countries to relatively low amounts. This results in low gross replacement rates for the state pension schemes. Consequently, earnings-related pen-sions are mainly provided by private pension funds.
Like pensions, unemployment benefits are relatively low in the Anglo-Saxon states. In these five countries, the benefit is flat-rated or below 55% of most recent salary and the duration is frequently less than one year, resulting in the least generous unem-ployment benefits of all welfare states. Because of the short duration of the unem-

34 Welfare regimes 35Welfare regimes
ployment benefits, social assistance benefit is more important in this regime. Social assistance levels vary between the Anglo-Saxon countries; in comparison with the East-European states and the Continental countries, levels can be considered moder-ate, whereas in the United States they are low. In comparison with the Nordic coun-tries, the levels of social assistance are markedly lower in the Anglo-Saxon states.
In addition to the low unemployment benefits, the level of employee protection is also low in these countries. To dismiss an employee, the employer either faces no restric-tions (Canada and United States) or simply has to send a written statement to the employee concerned (United Kingdom and Australia). Only in Ireland does a third party have to be notified of the dismissal. When an employee is made redundant, there are few labour market programmes to help him in these countries; in all Anglo-Saxon countries, the percentage of gdp spent on such programmes is less than 0.5%, a figure only equalled in some of the East-European states.
Owing to the relatively small scope of the social benefits, tax rates are low in the Anglo-Saxon regime. Government and social security revenues are often below 45% of gdp. Because benefits in the Anglo-Saxon social security system are mainly intended to provide the needy with income at a minimum subsistence level, the cor-relation with their employment history is low. The funding of benefits is based largely on tax revenues, not on contributed premiums.
2.5 Mediterranean welfare regime
In contrast to the Nordic welfare regime, the social security system of the Mediter-ranean regime is relatively small. Portugal and Greece have no national systems of social assistance. In Spain and Italy, the net maximum amounts for a single person or a family are among the lowest in the European Union. Only the East-European states and the United States have lower social assistance levels.
Unemployment benefits are around average in the Mediterranean countries, although the level and duration of benefits varies. In Spain, an unemployed person can receive around 70% of their former salary for two years, whereas in Greece they receive only 40% for one year. In general, the benefits are lower than in the Nordic and Conti-nental countries but higher than in the Anglo-Saxon and East-European countries. Because the social assistance levels are low, a person unemployed for five years in the Mediterranean countries receives the lowest overall benefits in the European Union.
Employees are relatively well protected against dismissal; in all four Mediterranean countries a third party must be notified in the event of a dismissal. Typical severance pay after four years’ tenure in these countries is high: the equivalent of three to four months’ salary. Also, in three of the countries the typical compensation on dismissal

34 Welfare regimes 35Welfare regimes
with twenty years’ tenure is more than 18 months’ salary. In Italy it is 32.5 months, the highest of all countries analysed.
If a worker becomes unemployed in the Mediterranean regime, a number of labour market programmes are available to help them to find work. Spending on active labour market programmes is around average in these countries, being between around 0.5% and 1% of gdp in Spain, Portugal and Italy. Only Greece spends less, at 0.46% of gdp. These figures tally with the spending on passive labour market poli-cies: Italy and Portugal spend between 0.5% and 1%, while Greece spends slightly less (0.47%) and Spain slightly more (1.33%).
Pensions in the Mediterranean regime are typically high compared to the other regimes. For instance, an employee in Spain with 35 years’ employment history can receive 100% of his/her former salary, among the highest rate in Europe. In addition, the retirement age in this welfare regime is fairly low, and average spending on pen-sions in the four Mediterranean countries as a percentage of gdp is consequently the highest of all welfare regimes studied.
2.6 Continental welfare regime
The Continental countries (Germany, France, Belgium, Austria and Luxembourg) occupy a midway position between the Nordic, Anglo-Saxon and Mediterranean wel-fare regimes; compared with the other regimes, their overall welfare states score nei-ther particularly low nor spectacularly high, though there is some variation between them.
Pension benefits in the Continental regime are slightly above average and compara-ble with the Nordic regime, with gross replacement rates of between 50% and 100% of previous earnings. The gross replacement rates are high in Luxembourg and Aus-tria, at around 93% and 80%, respectively, of average income. Apart from Belgium, all Continental countries apply a minimum period of membership for eligibility to the income-related pension. In Luxembourg and Austria this period is more than five years.
A typical feature of the Continental regime is the relationship between previous occu-pation and entitlement to provisions. There is also an emphasis on protecting fami-lies with children, with no commitment to securing the economic independence of both partners. The system is thus directed towards maintaining the standard of living. Rights and entitlements to provisions differ between the various groups, and these welfare regimes therefore sustain existing differences, whereas the Nordic wel-fare regime focuses on reducing income differentials.

36 Welfare regimes 37Welfare regimes
The number of special schemes for occupational classes is high in the Continental regime, particularly in France and Germany. There are also many special schemes for civil servants in these countries, which typically provide higher provisions than other schemes. As most schemes are arranged by occupational class, the percentage of social benefits paid by contributions is 83% in France, the highest of all 23 countries analysed.
Employees are well protected against dismissal. In Germany, an employer needs authorisation to fire an employee; in the other countries, a third party has to be notified. The typical compensation in the case of dismissal in all countries is 12-18 months’ pay for an employee with twenty years’ tenure. Only in the Mediterranean countries is this figure higher.
In the event of unemployment, an average employee receives between 68% (Germany) and 85% (Luxembourg) of previous earnings at the onset; the average for all 23 coun-tries is 68%, so that unemployment benefits are fairly high in these countries. More importantly, however, the duration of these benefits is long. For instance, in France an unemployed person receives benefit for up to five years, while in Belgium the dura-tion is unrestricted. The average gross replacement rate calculated for five years after dismissal is consequently high in these countries.
2.7 Eastern European welfare regime
The social security systems in the four Eastern European states analysed are char-acterised by relatively low unemployment, disability and child benefits compared to other regimes in the European Union. Pensions are slightly below average as well. In contrast to the former universalistic Communist welfare state, the number of special occupational schemes is high; however, the number of special schemes for civil ser-vants is low.
Government revenues as a percentage of gdp are below 45%, which is comparable with the Mediterranean and Anglo-Saxon regimes. Likewise, tax rates are gener-ally moderate. Unemployment benefits are low; in Poland they are flat-rated and in the other three countries an employee receives less than 66% of previous salary. The duration of these benefits is moderate, at between 6 and 18 months, after which the benefit claimant becomes dependent on social assistance schemes. In the four East-ern European states analysed, the maximum amount of social assistance is low. As a consequence, in all countries the gross replacement rate over a five-year period after dismissal for an average employee is less than 30%. The four Eastern European states spend little on labour market policies. Only Poland spends more than 0.5%; the other three countries spend even less.

36 Welfare regimes 37Welfare regimes
Pension benefits in this regime are slightly below the average in the other European regimes. According to the oecd, the average gross replacement rate in these states is between 50% and 70% (oecd 1998). In the late 1990s, Hungary and Poland enacted major reform legislation that called for the replacement of their state pay-as-you-go schemes with systems of commercially managed individual savings accounts which are compulsory for every employee. In conjunction with privatisation, the state pen-sion schemes in both countries are being scaled down. In both systems the income redistribution within the state pension schemes is being reduced (Fultz, 2002). The Czech Republic and Slovakia have kept their defined-benefit systems, with a full pen-sion of between 60% and 75% of average wages.
2.8 Hybrid countries
Two countries were classified as hybrid: the Netherlands and Norway. The Nether-lands is classified between the Continental and the Nordic regimes. A typical example of this ‘hybrid’ situation is the Dutch pension system. The first tier, the basic state pension, can be characterised as typically Nordic; all citizens above 65 years receive a flat-rated old age pension at a rate slightly above the minimum subsistence level. The second tier, the occupation-related schemes, is typically Continental. For most sectors in the Netherlands, an earnings-related pension scheme is compulsory for all employ-ees. All schemes differ in terms of their generosity, eligibility constraints, retirement age and other features. Most aim to provide a pension which is 70% of most recent earnings for a single earner, which can be described as Continental.
Unemployment benefits in the Netherlands are reasonably high, and in line with the Continental regime. The benefits for an employee with a full employment his-tory could originally last seven years, with the first five years being earnings-related and the last two years at a flat-rated minimum level. However, the Dutch government adjusted the duration to a maximum of five years in 2003, skipping the benefit at minimum level. In line with the Nordic countries, the social assistance rates are fairly high. No distinction is made in the Netherlands between occupational and non-occu-pational disability. As a consequence, the non-occupational disability benefits can be described as high, covering more than 60% of earnings. The minimum disability levels are rather low and there is no minimum period of membership. In the Conti-nental regime, these benefits are much lower and there is always a minimum period of membership. In comparison with occupational disability schemes in other coun-tries, the Dutch scheme is not very generous.
Child provisions are rather meagre in the Netherlands; child allowances can be described as low. The expenditure on child benefits is below 0.5% of gdp, which is more in line with the Anglo-Saxon regime than the Continental or Nordic regime. The leave arrangements for child care are not very well developed. While all Nordic coun-
38 Welfare regimes 39Welfare regimes
tries provide paid parental leave, the Netherlands only grants unpaid leave to parents, for a maximum of twelve months.
Norway is also characterised as a hybrid country, with both Nordic and Anglo-Saxon features. One of the main Nordic characteristics is the fact that the provisions are all universalistic, i.e. there are no separate schemes for different occupational groups. In many respects, Norway is close to the Nordic regime. There is no minimum wage and arrangements for paid parental leave exist. In addition, benefit levels for pension, disability, unemployment, and social assistance can be described as moderate to high.
However, closer examination shows that most arrangements are slightly smaller than in the other Scandinavian countries. For instance, spending on pensions is less than 6% of gdp, while it is over 6% in the other Nordic countries. Likewise, spending on unemployment benefits is low, at less than 0.75% of gdp. This is mainly because of the replacement rate, which is also lower (between 50% and 66% instead of over 66%). Similarly, social assistance levels are also moderate, which is more in line with a Anglo-Saxon or Continental regime. The duration of parental leave is also maxi-mised at less than a year and paternity leave is unpaid. Spending on active and pas-sive labour market policies as a percentage of gdp is lower than in the pure Nordic countries. For instance, expenditure on passive labour market policies is less than 0.5% of gdp, which is more in line with the Anglo-Saxon regime (all countries below 1%) than the Nordic regime (all over 1%). This smaller scope of the Norwegian social security system also results in lower tax rates. For instance, the tax rate for a single employee is below 30%, the lowest of all Scandinavian countries. The same holds for a married employee.
2.9 Conclusions
Although all countries in the European Union have their own specific features with respect to their social security arrangements, it is possible to classify most countries into five welfare regimes. Three of them are comparable with those originally dis-cussed by Esping-Andersen in his book The three worlds of welfare capitalism (1990) and are also supported by other analyses: the Nordic welfare regime which Esping-Ander-sen denominates as social-democratic, characterised by a high degree of decom-modification; the Continental welfare regime, in which there are separate schemes for different occupational classes and which is denominated by Esping-Andersen as corporatist; and the Anglo-Saxon welfare regime, in which social security is limited to those in need. The latter is denominated as liberal by Esping-Andersen. The analysis placed Denmark, Sweden and Finland in the Nordic cluster, while Germany, France, Austria, Belgium and Luxembourg emerged as Continental. The United Kingdom and Ireland, along with the United States, Canada and Australia, belong to the Anglo-Saxon welfare states. In contrast to the analyses of Castles and Mitchell, and Korpi

38 Welfare regimes 39Welfare regimes
and Palme, Australia belongs to the Anglo-Saxon welfare regime in this study. A dis-tinct radical welfare regime could not be detected.
Note that in the analysis here, the second dimension, in contrast to the earlier scp-study, is more or less related to the size of the pension schemes. The size of the pen-sion schemes is limited in the Anglo-Saxon regime and are relatively high in the Mediterranean countries. The Continental regime scores on average higher than the Nordic regime on this dimension.
Besides the three welfare regimes suggested by Esping-Andersen, two others were identified. In line with the theoretical observations of several authors, there is a Medi-terranean welfare regime in the European Union represented by Spain, Greece, Portu-gal and Italy. Its most distinctive characteristic is the ‘polarised’ nature of the income protection. While benefits can be described as high for employees in the regular labour market, schemes for people without a permanent appointment (e.g. social assistance and unemployment schemes) are absent or very small. The current situa-tion of ‘polarisation’ can be partly explained in terms of underdevelopment. Coun-tries such as France, Belgium and Luxembourg have filled the gaps in their safety nets only in recent decades, and it can be expected that the Southern countries will catch up in the coming years or decades.
When Esping-Andersen developed his classification in 1990, no attention was paid to the former Eastern Bloc countries. However, Poland, Hungary, the Czech Repub-lic, Slovakia, Slovenia, Estonia, Latvia and Lithuania will all join the European Union in 2004, as well as Cyprus and Malta. During recent decades, many social security reforms have been enacted to ensure the sustainability of the government budget. The debates on many of the reforms prompted a clash between neoliberal economists and supporters of traditional social insurance, leading to a welfare regime type which lies between the Anglo-Saxon and Continental regimes. The social security systems in the four Eastern European states analysed (Poland, Hungary, the Czech Republic and Slo-vakia) are characterised by relatively low unemployment, disability and child benefits compared to the other regimes in the European Union. Pensions are slightly below average as well. In contrast to the former universalistic Communist welfare state, the number of special occupational schemes is high; however, the number of special schemes for civil servants is low.
Two countries are identified as ‘hybrid’. The Netherlands is classified between the Continental and Nordic regimes, while Norway has both Nordic and Anglo-Saxon features. As the focus of this study is on analysis of the consequences of different wel-fare states with regard to poverty and income distribution, this classification provides a useful starting point.

40 Welfare regimes 41
Notes
1 Due to the large number of countries and features, the database contains some miss-ing values. For instance, no information was available on the leave arrangements in the Eastern European states and the non-European countries. These values are used passively by spss so they do not affect the optimisation (spss, 2002: p 29).
2 In the princals procedure, it is possible to vary the number of dimensions. For this analysis, two dimensions turned out to be enough to represent the dataset adequately. The eigenvalue of the first dimension is 0.2697. The eigenvalue of the second dimen-sion is 0.1666, resulting in a total fit of 0.4363. A supplementary analysis was also carried out with a five-dimension solution. The eigenvalues of the higher dimensions were 0.1071, 0.0953, and 0.0849. This analysis did not produce any new substantive insights, as the same clustering resulted from the first two dimensions, while the latter three dimensions were not clearly interpretable on the basis of the component loadings.
3 In the analysis, most features were scaled at an ordinal level. Five variables (typical dismissal compensation, target full mandatory pension, minimum level of incapac-ity for work for occupational disability, minimum level of incapacity for work for non-occupational disability benefits, and unemployment payment rate) were scaled on a single nominal basis because the order of the groups could not be determined in advance. For three variables (social contributions as a percentage of gdp, income tax plus employee contributions for a single person without children, and extent of state involvement in ensuring child support) the scaling was even less restrictive. They were scaled on a multiple nominal level, resulting in an increase in total fit of more than 0.015.
4 In the earlier scp-analysis, Norway was classified as social-democratic, although this country was the weakest representative of this welfare regime. The scoring of Norway on the first dimension is rather comparable with the scoring on the first dimension in the earlier scp-study (Wildeboer Schut et al. 2001). However, the second dimension in this study represents, more or less, the exptent of the pensions whereas in the previ-ous analysis the second dimension was clearly related to corporatism. This partly explains the different classification. An additional analysis of the current database confined to eleven countries from the earlier scp-study (France, Germany, Belgium, Netherlands, Sweden, Denmark, Norway, United Kingdom, United States, Canada and Australia) also showed Norway to be ‘hybrid’. This is due to the more dominant character of the pension traits in this study.

40 Welfare regimes 41
3 Methodology and scenarios
In the institutional analysis performed in chapter 2, five welfare regimes were iden-tified. All regimes differ in terms of their social security and labour market arrange-ments and consequently the regimes may differ in terms of their distributional results, as has been pointed out in several publications (e.g. Wildeboer Schut et al., 2001). However, in the coming decades, the member states of the European Union will face an ageing society and, as a consequence, income distributions and inequali-ties will change. The focus of this chapter is an analysis of how these differences will be affected by the ageing of the European population.
To analyse these future distributions, a static micro-analysis has been performed based on the European Community Household Panel (echp) for Denmark (Nordic), France and Germany (Continental), Italy (Mediterranean), United Kingdom (Anglo-Saxon) and the Netherlands (hybrid). Unfortunately, the echp contains no informa-tion for the countries of Eastern Europe, which therefore had to be left out of this part of the study. Using a demographic-economic macro-projection model, the income trends of several groups (e.g. wage-earners, pensioners, disability benefit claimants) were projected, as were the sizes of the groups. The model is adapted to describe the effects of an ageing society with respect to the institutional setting. The projections are used to simulate future income levels in the echp up to 2025.
The whole analysis is performed by referring to four different scenarios. In the base-line scenario, the countries are considered as representatives of particular welfare regimes, which are in principle assumed to stay constant over time. However, govern-ments are already taking measures to prevent their systems from becoming unsus-tainable, and in this reform process they may have drifted away from their original welfare model. In the baseline scenario, these measures are ignored, as the aim is to analyse the consequences of ageing for income distributions and poverty within the ‘typical’ welfare regimes, before any reform drift. Actual policies and possible future measures are analysed and discussed in three further policy scenarios: a ‘participa-tion’ scenario, in which employment is assumed to rise to meet the employment targets of the Lisbon-Stockholm European Councils, a ‘pension reform’ scenario and an ‘institutional’ scenario in which governments take measures according to their institutional setting.
Section 3.1 gives a general overview of the methodology used in the study, while sec-tion 3.2 discusses the main assumptions underlying the demographic-economic macro model. The typical assumptions of the various scenarios are described in sec-tion 3.3.

42 Methodology and scenarios 43Methodology and scenarios
3.1 Outline of the study
There are two possible approaches for exploring future poverty, income inequality and redistribution processes. One is a dynamic microsimulation in which the income for each person in a survey is estimated from year to year based on their personal characteristics (year of birth, employment status, accrued pension rights), in line with the institutional arrangements. This could be more tailored to the needs of a distribu-tional analysis. However, such an approach would suffer from a lack of both adequate microdata and institutional details. Moreover, implementing for six countries would barely be feasible in the project.
The second approach is a static microsimulation of future incomes. This kind of microsimulation implies the transformation of incomes according to projected average future income developments, diversified for each socio-economic group. The sizes of the groups are adjusted by reweighting the survey. These simulated incomes make it possible to analyse future income distribution and poverty rates.
This approach requires projections of demographic situation, the sizes of the vari-ous groups in each welfare regime (employment, number of benefit claimants) and income trends. In addition, the projections have to be consistent. A demographic-economic macro model was therefore developed which explicitly describes the inter-actions between demographics, welfare regimes and wages and benefit trends. The macro model produces consistent estimates of the future development of a number of key economic variables and several indicators for the income/benefit positions of populations. The inputs for this demographic-economic macro model are exogenous demographic projections, assumptions on future labour participation rates, and statistics for each welfare state. The projections of the model are subsequently imple-mented in a set of microdata, on which the distributional analysis is performed. This results in estimates of the future distributional results of welfare regimes, the main aim of the study. Figure 3.1 provides an overview of these different steps.
The aim of the demographic-economic macro model is to deliver projections, up to the year 2025, of fiscal and social security variables and the future employment status (i.e. employed, unemployed, out of the labour force) of different groups, as well as projections of different components of personal incomes. As a result, eco-nomic growth and some sustainability indicators are calculated. Macro-developments are translated to the micro-level of household members by reweighting the survey to correct for future changes in sizes of groups and adjusting the incomes to future income trends. These simulated incomes can be used to analyse future income distri-bution and poverty rates. This is described in more detail in annex A4.

42 Methodology and scenarios 43Methodology and scenarios
Figure 3.1 General outline of the study
In this study the European Community Household Panel (echp) is used as the source on information on incomes for the distributional analyses. It is a survey of around 4,000 (Denmark) to 15,000 (Italy) adults per country. This database contains detailed information on the incomes of a sample from all households at both household level and household member level. A major advantage of the echp is the harmonised income definition. Net incomes are available and mutually comparable for all coun-tries. One drawback of the echp is the lack of data concerning gross incomes; it is therefore not possible to analyse the effects of taxation and redistribution in the dif-ferent welfare regimes. Similarly, the echp focuses only on incomes in cash; it pro-vides no information on benefits in kind (e.g. health services, housing facilities).
demographic projections (2000-2025)– country-specific– uniform demography
economic assumptions (2000-2025)– labour participation rates– unemployment rates– labour productivity growth
projections up to 2025economic indicators– employment rates by age/gender
classes– economic growth– financial sustainability indicators
income/benefit positions (by age/gender)– number of income earners – average earned incomes – number of social security benefit
claimants– average pensions/benefits
demographic-economic macro model
implementation in micro-dataset and
distributional analysis
future distributional results of welfare regimes– income inequality – redistribution– poverty
welfare regime income/benefit statistics (2000)– income benefit positions (by age/gender/labour
market status) – number of income
earners – average earned
incomes – number of social
security benefit claimants
– average pensions/ benefits
– indexation of pensions

44 Methodology and scenarios 45Methodology and scenarios
In the institutional analysis, the countries of the European Union were found to belong to distinct welfare types. Since it is not feasible in this project to apply the macro model to all current and Eastern European member states, a selection there-fore had to be made. This selection was based mainly on institutional variety, since it was desirable to cover all the welfare state types identified in the institutional analysis. A second constraint was that the selected countries should represent a majority of the eu-15 population. On these grounds, the four countries with the largest populations were selected: Germany, France (both Continental), the United Kingdom (Anglo-Saxon), and Italy (Mediterranean). To ensure full coverage of the welfare state types, Denmark (Nordic) and the Netherlands (hybrid) were added. The Netherlands was added because a hybrid welfare state may combine the better features of other welfare regimes and may have better results in terms of income distribution in an ageing soci-ety. These six countries account for about 74% of the eu-15 population, and can be considered as representative for the present welfare regimes in the current member states. One caveat should be made, however: the United Kingdom is not such a clear-cut example of the Anglo-Saxon welfare regime as the United States of America, and Italy is less ‘Mediterranean’ than Greece or Portugal. For practical reasons, no East-ern European state could be selected: they are not included in the echp, and hence it is not possible to calculate distributional results on the basis of the standard dataset used in this study.
3.2 The demographic-economic macro model
Given the focus of the analysis on the differential effects of population ageing within differently arranged welfare systems, much effort in the building of the model was devoted to delineating the interrelationships between demographic and economic variables and their dynamics. It was possible to model these interrelationships as part of a general equilibrium approach, allowing both for the effects of demographic variables on economic variables and for the parallel effects of economic variables on demographics, for example according to the kind of framing provided by the theory of endogenous family formation.
The analytical complexity of a general equilibrium approach is however far beyond the scope of this study. A general equilibrium model directed at a cross-country com-parison of distributive outcomes would hardly be a viable solution in terms of either parameterisation or computation. Besides this, the simultaneous modelling of com-plex systems, although allowing for a high degree of economic consistency, would weaken the understanding of the direct consequences of different policy measures, because of the presence of various feedback effects.
These considerations suggest a partial equilibrium approach, with ‘a step by step’ analysis of the following, more specific aspects:

44 Methodology and scenarios 45Methodology and scenarios
– effects of demographic dynamics on the structure of the labour supply– effects of changes in the structure of the labour supply on economic growth– consequences for the sustainability of the welfare state of changes in the age pro-
file of the population, in the labour supply and in the economic growth rate.
Given the objective of performing the analysis for different European countries, char-acterised by different welfare regimes, a more modest parameterisation of the main economic and institutional features of each country is used. This methodological approach informed the main decisions taken in the building of the model, i.e. the characterisation of the institutional context (through a simplification of the specific welfare rules); the selection of exogenous and endogenous variables; and the allow-ance for feedback effects.
3.2.1 Demographic projectionsThe impact of the future ageing process on income inequality and poverty is the key focus of this study. Besides the standard population projections, it is therefore also necessary to have household projections since income inequality and poverty rates are commonly based on household incomes rather than personal incomes (see section 5.1). The only currently available household projections for the European Union are the demographic household projections produced by Eurostat (Alders and Manting, 1998).1 Unfortunately, these projections only run up to 2025, and as a consequence the time horizon of this study is limited to 2025.
The demographic and household projections used are country-specific. The ageing processes differ between countries and this may influence the distributional results. As the focus of this project is to study the various welfare regimes rather than the spe-cific future situation of a particular country, the country-specific demographic devel-opments are sometimes replaced in the baseline scenario by a uniform demographic variant, thus cancelling out the demographic variation between countries. In this case, the specific process of the total eu-15 population is applied to all countries.2
Table 3.1 shows the population structure of the eu-15 up to 2025. Due to ageing, the groups ‘elderly’ and ‘middle-aged’ will increase with respect to the younger category. In annex A.6.1 the country-specific demographic projections are presented in the same format.

46 Methodology and scenarios 47Methodology and scenarios
Table 3.1 Age structure of the EU-15 population 2000-2025 (in percent)
age class 2000 2005 2010 2015 2020 2025difference 2000-2025
younger men (<55) 37 37 36 35 34 33 -5
younger women (<55) 36 35 35 34 32 31 -5
middle aged men (55-64) 5 6 6 6 7 7 2
middle aged women (55-64) 6 6 6 7 7 7 2
older men (65+) 6 7 7 8 9 10 3
older women (65+) 9 10 10 10 11 12 3
total 100 100 100 100 100 100 0
Source: EUROSTAT(2000)
In most Western countries, the number of elderly people is growing with respect to the number of younger people. A trend can be observed of declining fertility rates, partly in response to economic progress. In addition, economic growth enables countries to invest in health services and hygiene, thus raising life expectancy. These trends cause a structural increase in the proportion of elderly people in the popula-tion. Countries like the Netherlands and Germany face a second ageing process, in the form of the baby-boom after the Second World War. People born in this period will start to retire in the period from 2000 to 2010, thus boosting the ageing process still further. However, this ageing process can be described as ‘temporary’: when this generation passes away, the number of elderly people with respect to the younger generations will decrease in relative terms.
The ageing process differs between countries. A commonly used statistic which shows these different ageing processes is the dependency ratio, defined as the ratio between the number of people aged 65 years and the number of people aged 15-64. Table 3.2 shows the average dependency ratio of all eu-15 countries and the six selected countries. In the fifteen European Union countries, the overall depen-dency ratio is 0.23 in 2000; this means that about four people aged 15-64 years have to contribute to fund one old-age pensioner. In 2025, the ratio will increase to 0.34, which means only three people will be available for each old-age pensioner. In an unchanged welfare state, contribution rates of the pure pay-as-you-go schemes would have to be raised, increasing the pressure on the working population.

46 Methodology and scenarios 47Methodology and scenarios
Table 3.2 Old age dependency ratios and growth with respect to 2000*
2000 2025 maximum (year)growth up to
2025 (%)growth to peak-year
after 2025 (%)
average EU-15 0.23 0.34 0.44 (2045) 44 52
Nordic (DK) 0.21 0.31 0.38 (2040) 47 34
Hybrid (NL) 0.19 0.31 0.40 (2040) 68 51
Continental (D) 0.23 0.34 0.47 (2040) 51 55
Continental (F) 0.24 0.35 0.45 (2050) 48 42
Mediterranean (I) 0.25 0.36 0.54 (2045) 43 72
Anglo-Saxon (UK) 0.23 0.32 0.42 (2040) 38 45
* Number of people aged 65 years and over as a fraction of people aged 15-64.
Source: NewCronos (Eurostat)
Up to 2025, the Netherlands will suffer from a relatively strong increase (68%) in the ratio, which will rise from 0.19 in 2000 to 0.31 in 2025. The relatively low percentage of people aged 65 and over in the Netherlands in 2000 can be explained by the fact that the post-war baby boom continued for longer than in most other countries (De Beer, 1996). As a result, the group of under-65s is relatively large compared with the other countries, thus lowering the dependency rate in 2000. By contrast, the United Kingdom already has a modest dependency ratio in 2000 (0.23), which only increases by 38% to 0.32 in the period to 2025. The same situation holds for Italy, where the increase is just 43%.
Because the household projections only run up to 2025, the time horizon of this study is limited to this same year. To show the consequences of this limitation, the projected maximum of the dependency ratio over the period 2000-2050 is presented in table 3.2. As can be seen, the peak in the ageing process occurs between 2040 and 2050 in all countries. Especially in Italy and the United Kingdom, the growth of the dependency rate is greater after 2025 than before 2025. By contrast, most of the ageing process will already have occurred in Denmark and the Netherlands in 2025. France and Germany are about midway in the ageing process in 2025. This study will therefore only consider a part of the total ageing process, and as a result the changes in the income distributions may only show a part of the total changes.
3.2.2 Labour participation and unemploymentThe macro-economic model starts by stratifying the total population by age and by gender using the age classes ‘younger’ (15-54), ‘middle-aged’ (55-64) and ‘elderly’ (65+). For all six age/gender classes, labour market participation rates are drawn from exogenous sources, namely ilo (1997) and epc (2001). Table 3.3 shows the participa-

48 Methodology and scenarios 49Methodology and scenarios
tion rates for the younger and the middle-aged groups at the beginning and at the end of the analysed period.
Table 3.3 Labour market participation rates (in percent)
male participation rates
welfare regime younger (15-54) middle-aged (55-64)
2000 2025 2000 2025
Nordic (DK) 88.4 86.5 65.9 61.9
Hybrid (NL) 89.3 88.0 51.4 49.3
Continental (D) 80.2 79.6 41.8 40.5
Continental (F) 88.7 85.9 55.2 58.5
Mediterranean (I) 80.7 81.0 42.4 50.3
Anglo-Saxon (UK) 88.7 87.5 63.3 61.6
female participation rates
welfare regime younger (15-54) middle-aged (55-64)
2000 2025 2000 2025
Nordic (DK) 80.2 80.8 56.3 61.4
Hybrid (NL) 72.4 81.0 26.3 41.5
Continental (D) 67.0 70.6 33.1 36.1
Continental (F) 71.8 72.7 34.1 40.7
Mediterranean (I) 52.6 62.3 16.1 30.3
Anglo-Saxon (UK) 74.1 76.1 42.6 48.9
Sources: For 2000: ECHP-figures, corrected to match OECD labour force statistics, for 2025: SCP/CeRP- calculations according to ILO (1997) and EPC (2001)
As for unemployment rates, the level of total unemployment (i.e. for all age and gender classes) is set at the structural unemployment rate calculated for each country by the oecd (2000), and kept constant over the whole projection period.3 Exceptions are made for France and Italy, where the structural level is assumed to be gradually met by 2010, and an extra gradual decline of 2% is assumed in the period 2010-2025, because of labour market reforms already undertaken, according to the assump-tion of epc (ec, 2001). In some countries, where the unemployment rate in 2000 is already below the structural unemployment level (see for instance the Netherlands), this procedure implies a decrease in the number of employed people in order to meet the structural unemployment rates. Employment rates result from participation and unemployment rates, according to standard definitions.4 The employment rates for elderly workers are assumed to remain constant at the 2000-level, since no particular target (e.g. in the Lisbon goals) for this class of workers can be considered relevant in the macroeconomic framework. This part of the model determines the number of people employed, unemployed and out of the labour force for all age/gender classes.

48 Methodology and scenarios 49Methodology and scenarios
3.2.3 Labour productivity growthIn the model, the growth rate of labour productivity is introduced as an exogenous parameter. The rate of growth of labour productivity is assumed to be constant at 1.75% for all countries, for the whole projection period. This level is the one to which the Working Group on Ageing agreed that European Countries are likely to converge by 2030 (see epc, 2001). The adoption of this assumption permits measurement of the effects on economic growth of different institutional frameworks, and of different demographic dynamics, on a ceteris paribus basis for productivity. This hypothesis has the advantage of providing an easier comparison across scenarios and across welfare types, but the drawback that productivity may be a function of age and, in this case, the ageing process of the European economies might have consequences for pro-ductivity that are not explicitly taken into account in the model. The literature on this issue, however, does not provide an unambiguous perception on whether this impact is positive or negative, and in any case, positive or negative, its magnitude is unlikely to be great in absolute terms.
3.2.4 Welfare regime income/benefits statistics in 2000All welfare states use different rules to grant benefits to their citizens. The complex-ity of the different rules cannot be fully represented in the model; the characterisa-tion of the regimes given in the institutional analysis is already a simplification of the complexity of the overall picture. In order to enable a common projection model to be used, producing comparable results, in framing the welfare rules of each coun-try (representative of a particular regime) the complexity is further reduced by con-centrating on two simple parameters for each of the social protection schemes: the number of people covered by the schemes and the average benefits of the schemes (both based on the echp figures).
For income levels information is drawn from the echp database for the year 1998. The figures are adjusted to 2000 by re-weighting the population to the demographic structure and employment status in 2000. Taken together, the data reflect the institu-tional setting of a country by showing the demographic/income/benefit structure of a given country’s population for the year 2000.
3.2.5 Income and benefit projectionsThe demographic-economic model projects, for each income or benefit category, the number of earners or recipients and the average annual amount in euros (at constant prices for the year 2000), in a way that is consistent with the projected trend in the age profile of the population. The focus on income and transfers is motivated by the needs of the distributive analysis.
As the number of people in each age/gender class and employment status category is known, and the echp dataset provides the percentage of wage-earners by age/gender

50 Methodology and scenarios 51Methodology and scenarios
and employment status in 2000, the number of wages-earners can be projected by keeping this percentage in a given class constant during the whole projection period. The same procedure is adopted for self-employed income and capital income; over-lapping is allowed, however, since a wage-earner may also be self-employed and/or receive a capital income.
The average amount of each income component (wages, self-employed income, capi-tal income) is assumed to grow for each age/gender class according to exogenous labour productivity. Capital income is assumed to grow in line with the growth of wages, which implies that households, through their savings behaviour, adjust their capital stock to income movements.5
For unemployment benefits, social assistance and other benefits, the same procedure is used. For each age/gender and employment status class the percentage of benefi-ciaries for each scheme is kept constant, which adequately represents an ongoing welfare regime. In scenarios with active policies, this assumption is relaxed. The aver-age benefit is assumed to increase, within each class, in line with labour productivity. All benefits are thus constrained to grow in line with average wages.
For disability benefits and pensions, a somewhat different methodology is followed. The number of disability recipients is determined as a constant fraction of employed workers, rather than as a fraction of the overall population. The reason for this approach lies in the fact that most disability benefits are occupation-related:6 people are usually required to have been employed in order to be entitled to disability ben-efits, and in many cases disability is related to unhealthy working conditions or acci-dents at work. Disability benefits in the echp also include sickness pays. However, in common with other kinds of benefit, the average benefit is assumed to grow in line with wages.
3.2.6 Pension projectionsGiven the importance of pensions in the overall welfare budget, benefits are modelled using a specific module, which deserves a lengthier explanation. Appendix A2.1 gives a detailed description of this module. The main structure is as follows. Starting from the number of pensioners, projections should in principle simply reflect the applica-tion of the eligibility rules to the changing demography. Many relevant complications, however, mainly relating to the evolution of the labour market, cannot be dismissed.
In particular, the European objectives of increasing the employment rates of both the middle-aged and of women will influence labour market performance, leading to two opposing effects on the number of pensioners: while an increase in the employ-ment rate of the middle-aged will reduce the number of pensioners in the short run, the greater employment rate of women will increase this number in the longer term.
50 Methodology and scenarios 51Methodology and scenarios
Another effect of a higher employment rate for middle-aged people is lower numbers of pensioners, as in most regimes middle-aged people can receive a pension benefit.
The projected numbers of pensioners in all six age/gender classes are determined by three factors: the stock of existing pensioners in each period; the inflow of new pensioners, which depends on the employment rates in the previous periods; and the number of pensioners dying in each period, according to the most recent avail-able mortality tables for each country. The number of pensioners at time T can thus be determined by adding to the stock of pensioners at time T-1 the flow of new pen-sioners,7 and subtracting pensioners who die between T-1 and T. As the number of pensioners depends on the employment rates in the previous periods, an increasing female employment rate results in an increasing number of pensioners in the follow-ing years.
The average pension figure includes not only the state pension but also supplemen-tary (second pillar) and personal (third pillar) pension schemes. This choice, apart from being consistent with the data provided by the echp, stresses the focus of the analysis, which is on the adequacy of the total welfare systems, rather than on the sustainability of public schemes. The pension formulae of each country are not explicitly modelled; the only elements that are considered are the replacement ratio and the pension indexation mechanism. At time T, the average pension is deter-mined as a weighted average of the pension received by existing pensioners at time T-1, and the pension calculated for new pensioners. The latter is computed by apply-ing the replacement ratio to the average wage at time T-1. The procedure followed to determine the replacement ratio is extensively discussed in the appendix and varies between the different scenarios.
As regards the indexation mechanism, pensions are wage-indexed in Denmark and Germany, while they are indexed only to prices in Italy and the United Kingdom. Hybrid situations are found in France, where the majority of pensions (72%) are indexed to prices and the rest to wages, and in the Netherlands, where 96% of pen-sions are indexed to wages and the rest to prices.
3.2.7 gdp projectionsGiven the assumed exogenous labour productivity growth, the model allows the annual average growth in gdp to be calculated as the sum of the annual average growth in employment and productivity. Labour productivity is defined as the ratio between gdp and the number of workers. According to this definition, the rate of growth of gdp can be expressed as the sum of the growth of labour productivity and the number of employed people. This definition of gdp growth does not imply that other factors, in particular capital, are assumed to be irrelevant. The productivity of capital has not been explicitly analysed simply because the estimation of the evolution

52 Methodology and scenarios 53Methodology and scenarios
of the capital stock in the economy is not the aim of this project. However, since it is assumed that the average amount of each income component increases at the same rate of labour productivity, our implicit hypothesis is that the share of gdp attributed to labour and the share of gdp attributed to capital are constant during the projection period. Thus the definition of economic growth through the concept of labour pro-ductivity does not dismiss the role of capital, nor the role of total factor productivity, but accounts for them in an indirect way.
3.2.8 Feedback effectsThe structure described allows the number of people entitled to retirement benefits, unemployment benefits, disability benefits and social benefits to be varied directly, and also allows benefit levels to be adjusted in different future scenarios (see sec-tion 3.3). In order to take account of the fact that modifying the welfare system in one respect is likely to have consequences both on other aspects of the same system and on the overall economic performance, feedback effects are introduced. Thus, for example, reducing the number of beneficiaries of a particular regulation is likely to change the number of people applying for other kinds of benefit, or trying to find a job, thus also affecting labour market participation rates. The methodology adopted for feedback effects, which is described in detail in Annex A2.2, relies on the con-struction of matrices measuring the elasticity of the number of subjects in receipt some kind of welfare benefit or taking a job.
3.2.9 Sustainability indicatorsGiven the partial equilibrium approach that has been adopted, it is possible that social expenditure will become unsustainable. Indeed, the results of the baseline scenario, in which no policy measures are assumed, show that active policies are required in order to achieve financial sustainability. To explore the sustainability of the projections two methods are used. First, total social security expenditures are cal-culated, based on the number of recipients and the average amount of each benefit. However, these figures are not entirely appropriate, because of the underestimation of the average amounts provided by the echp compared with national statistics.8 The projected growth rates of the expenditures remain reliable, however, and are therefore applied to Eurostat (2003) social protection expenditures in order to obtain values for 2025. The level of total expenditure, for each benefit and on aggregate, is then expressed as a proportion of the estimated gdp.
Secondly, a ‘notional equilibrium contribution rate’ was computed. This theoreti-cal rate is defined as the average contribution rate that should be levied on wages and self-employed income in order to finance the payment of pensions, disability benefits, unemployment benefits, social assistance and other benefits. The financial sustain-ability of the welfare systems is not however determined only by the taxation of wages or self-employed income; some countries (like the Netherlands and the United King-

52 Methodology and scenarios 53Methodology and scenarios
�����
����
����
���
���
����
������������������������������� ����������������������
dom) have large pension funds that can help provide an adequate income for future pensioners. In addition, the government debt must be considered in the analysis, since a high level of debt reduces the room for deficits in the public social security sys-tems. Public and private pensions are included in the model since pension fund assets as well as government debt will contribute to the sustainability of the pension provi-sion. The ‘notional contribution rate’ is therefore corrected to take into account the benefits of the present pension fund assets, as well as the costs of government debt. This ‘notional contribution rate’ is particularly appropriate in countries such as the United Kingdom, where private pensions play a fundamental role in providing retire-ment income. In such countries in particular, this notional rate may not be regarded as a direct index of the sustainability of public finances, but it still captures the quota of aggregate income that is devoted to social security and private insurance payments, and remains relevant for the purposes of the distributive analysis.
The annual benefits of the pension funds are defined as the real revenues from the pension fund assets, computed at a real interest rate of 4%. Servicing the government debt is computed at a real interest rate of 3%, because governments usually finance their debt with short-term bonds, while pension funds invest in long-term bonds and stocks. If all the revenues of the pension funds were to be used to lower the contribu-tion rate, the size of the pension fund assets would decline with respect to gdp. Part of the revenues is therefore used to keep the size of the pension funds constant with respect to gdp. In the same way, it is assumed that government debt is a constant fraction of gdp over 25 years. Figure 3.2 shows the available pension fund assets and government debt as a percentage of gdp.
Figure 3.2 Pension fund assets and government debt as a percentage of GDP
Source: Pension fund assets: W.M. Mercer, Government debt: Eurostat
Nord
ic (D
K
Hybr
id (N
L)
Cont
inen
tal (
D)
Cont
inen
tal (
F)
Med
iterre
nean
(I)
Angl
o-Sa
xon
(UK)

54 Methodology and scenarios 55Methodology and scenarios
The figure shows a clear distinction between the Continental and Mediterranean countries on the one hand and the remaining countries on the other. The pension fund assets of Germany, France and Italy amount to less than 22% of gdp, while in Denmark and the United Kingdom they equate to 78% and 80%, respectively. The Netherlands has the largest pension funds, with assets of 150% of gdp. The dif-ferences between the levels of the government debts are smaller, mainly due to the criteria imposed by the Maastricht Treaty for joining emu in 1998. The European Commission set a threshold of a maximum debt ratio of 60% of gdp to qualify for entry to emu, prompting all countries to reduce their debt accordingly. Only Italy failed to meet this target; its national debt is still above this threshold, at 113% of gdp in 2000.
3.3 Scenarios
As has been pointed out in several studies (e.g. ec 2001), in the coming decades the sustainability of all welfare regimes will come under pressure if no measures are taken. In addition to the baseline scenario (see section 3.3.1), several possible policy measures are analysed in three policy scenarios, which governments could employ to tackle the sustainability problem. First, it is assumed that governments try to improve the sustainability in terms of the notional contribution rate by raising the employ-ment rates in their countries. Accordingly, a ‘participation’ scenario is presented in which the employment rates rise according to the Lisbon accord. This scenario is dis-cussed in section 3.3.2. Section 3.3.3 presents a ‘pension reform’ scenario, in which it is assumed that the pensions of new pensioners are gradually lowered in line with the projections of the Economic Policy Committee (ec 2001). Finally, an ‘institutional reform’ scenario is presented in section 3.3.4. The purpose of this scenario is to create an explicit link between the institutional and economic analyses. Different poli-cies are implemented according to a priority scale that stems from the in-depth analy-sis of the theoretical models of welfare states as discussed in chapter 2.
3.3.1 Baseline scenarioIn the baseline scenario, each country is seen as a representative of a particular wel-fare regime, which is assumed to persist into the future. The percentages of people receiving a typical income component (wages, self-employed income, capital income and social security benefits) are therefore assumed to stay constant over time for each age/gender/employment status class. The pension replacement rate is also assumed to stay constant over time.
The European welfare regimes are the result of a process of successive legislative actions, reflecting different national histories and political preferences with respect to the fundamental trade-off between efficiency and redistribution, financial sustain-ability and generosity, individual responsibility and social protection. As discussed in
54 Methodology and scenarios 55Methodology and scenarios
chapter 2, it may be reasonable to assume that countries will pursue the same institu-tional path for three reasons: the cost of changing regimes may be quite considerable, both in organisational and social terms; policymakers may have certain cognitive frameworks and vested interests, which makes it difficult for them to envisage an entirely different future; and the electorate may hold certain values and social norms and vote according to group interests, which may bar revisions that would fundamen-tally alter the current institutional regime. The concept of welfare regimes therefore shows the more long-lasting characteristics of social security systems better than comparisons of single arrangements.
In the baseline scenario it is likely that the financing of welfare arrangements will become problematic due to the ageing process. In reality governments have already taken measures to prevent their systems from becoming unsustainable, and in this reform process they may have drifted away from their original welfare model. In this respect, therefore, the assumed baseline scenario is ‘hypothetical’. However, this scenario is introduced in this study since the focus is on analysing the consequences of ageing for income distributions and poverty within the current ‘typical’ welfare regimes, before any reform drift. Measures, even those already taken, are therefore ignored. In the other scenarios, actual policies and possible future measures are anal-ysed and discussed.
3.3.2 Participation scenarioIn March 2000, the European Council in Lisbon launched a ten-year strategy for the European Union directed towards economic, social and environmental renewal. The rather ambitious aim of this strategy is to enable Europe to become ‘the most compet-itive and dynamic knowledge-based economy in the world’. Two of the more impor-tant aspects of this strategy are the creation of conditions for full employment in the European Union, and reducing differences in prosperity across Europe.
To accommodate these goals, the European Council agreed to monitor several indica-tors of poverty, social inclusion, economic growth and employment. For the latter, the Council even set specific targets for female, middle-aged and total employment rates in 2010. This should counteract the shrinking workforce that will become apparent when the baby-boom cohorts begin to retire. These targets are considered particularly helpful as an instrument for enhancing economic convergence, and are a challeng-ing objective for some welfare regimes. The ec’s employment aims for the European Union for 2010 are:1 The total number of workers should be at least 70% of the total population aged
15-64.2 Female workers should account for at least 60% of the total female population
aged 15-64.
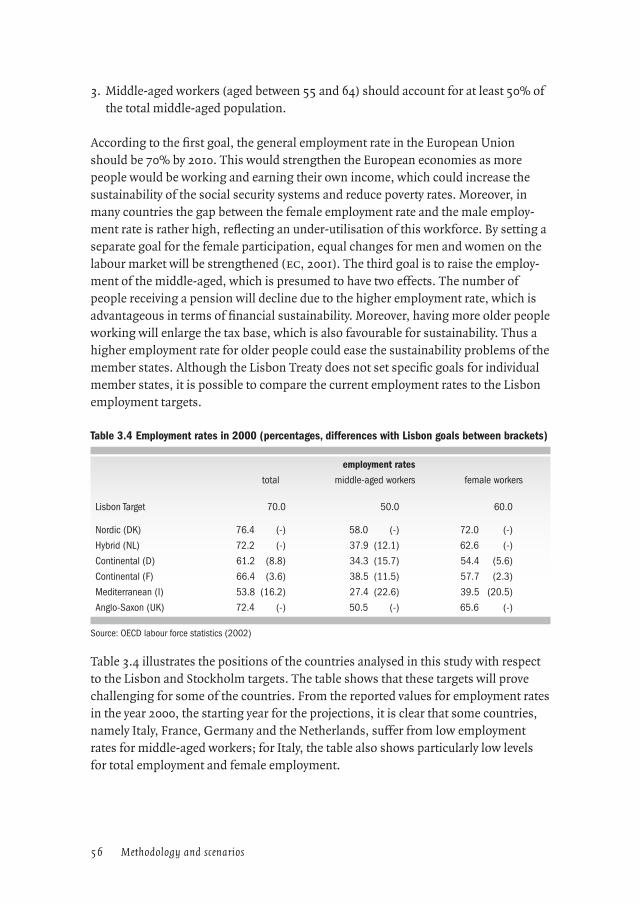
56 Methodology and scenarios 57Methodology and scenarios
3. Middle-aged workers (aged between 55 and 64) should account for at least 50% of the total middle-aged population.
According to the first goal, the general employment rate in the European Union should be 70% by 2010. This would strengthen the European economies as more people would be working and earning their own income, which could increase the sustainability of the social security systems and reduce poverty rates. Moreover, in many countries the gap between the female employment rate and the male employ-ment rate is rather high, reflecting an under-utilisation of this workforce. By setting a separate goal for the female participation, equal changes for men and women on the labour market will be strengthened (ec, 2001). The third goal is to raise the employ-ment of the middle-aged, which is presumed to have two effects. The number of people receiving a pension will decline due to the higher employment rate, which is advantageous in terms of financial sustainability. Moreover, having more older people working will enlarge the tax base, which is also favourable for sustainability. Thus a higher employment rate for older people could ease the sustainability problems of the member states. Although the Lisbon Treaty does not set specific goals for individual member states, it is possible to compare the current employment rates to the Lisbon employment targets.
Table 3.4 Employment rates in 2000 (percentages, differences with Lisbon goals between brackets)
employment rates
total middle-aged workers female workers
Lisbon Target 70.0 50.0 60.0
Nordic (DK) 76.4 (-) 58.0 (-) 72.0 (-)
Hybrid (NL) 72.2 (-) 37.9 (12.1) 62.6 (-)
Continental (D) 61.2 (8.8) 34.3 (15.7) 54.4 (5.6)
Continental (F) 66.4 (3.6) 38.5 (11.5) 57.7 (2.3)
Mediterranean (I) 53.8 (16.2) 27.4 (22.6) 39.5 (20.5)
Anglo-Saxon (UK) 72.4 (-) 50.5 (-) 65.6 (-)
Source: OECD labour force statistics (2002)
Table 3.4 illustrates the positions of the countries analysed in this study with respect to the Lisbon and Stockholm targets. The table shows that these targets will prove challenging for some of the countries. From the reported values for employment rates in the year 2000, the starting year for the projections, it is clear that some countries, namely Italy, France, Germany and the Netherlands, suffer from low employment rates for middle-aged workers; for Italy, the table also shows particularly low levels for total employment and female employment.

56 Methodology and scenarios 57Methodology and scenarios
In the participation scenario, it is assumed that all societies will individually meet the Lisbon targets in 2010 by raising the employment rates of the younger men, younger women, middle-aged men and middle-aged women in the model. As there are four groups and there are three targets to be reached, it is unclear to what extent the employment rate of each group needs to be raised. For instance, the Dutch govern-ment could theoretically try to raise only the employment rate of middle-aged men in order to meet the Lisbon target, leaving the employment rate of the middle-aged women constant. To model the behaviour of governments, an optimisation routine is used to keep the changes to a minimum, allowing all the adjustments to be as smooth as possible within the timeframe considered. This routine is described in more detail in annex A2.4.
In the baseline scenario, some countries will suffer from a slight decline in the labour participation rate of some age/gender classes (see table 3.3), and this will also push down the employment rates. In the participation scenario, however, it is assumed that the small deterioration of these employment rates will be stopped. Thus for the coun-tries which already meet the Lisbon targets in 2000, Denmark and the United King-dom, the participation scenario also differs from the baseline scenario. In addition, the total unemployment rate (i.e. for all age and gender classes, except the elderly) for the years between 2005 and 2025 is assumed to converge gradually to 4% for all coun-tries in 2045, according to the ‘Lisbon Scenario’ of epc (2001).
In this participation scenario, the specific policy measures by which governments try to achieve the Lisbon and Stockholm goals are not defined. It is simply assumed that employment rates will increase or will remain at current levels. However, govern-ments could raise employment by increasing the availability of jobs and/or enlarging the available workforce. As is well known, the overall macroeconomic situation will heavily influence demand for labour in the economy in the short term. In an equi-librium situation as assumed in the demographic-economic model, the structure of employment and the functioning of the labour market mainly determine the extent to which employers offer jobs. The latter is also influenced by the taxation of labour, and governments could therefore raise their employment rates for middle-aged workers by lowering the taxation for these groups.
Besides taxation, employment protection and regulations governing fixed-term con-tracts influence the structural employment rate. As pointed out in the institutional analysis, in the Anglo-Saxon and Nordic welfare regimes, regulation of fixed-term contracts is rather limited. In these welfare regimes, employers will benefit from the possibilities of a flexible market because they can hire and fire people more easily. As a result, more jobs will be available. In line with these flexible jobs, public and pri-vate employment services could promote labour market activity as job vacancies and
58 Methodology and scenarios 59Methodology and scenarios
job-seekers can be more easily matched, thus reducing the structural unemployment rates.
A third strategy for increasing employment is to promote active labour market poli-cies, giving jobless people a subsidised job to increase their chances on the regular labour market. These extra jobs will create extra employment. However, the main focus of the programmes is to give jobless people extra training and more work expe-rience to increase their skills and competencies. In addition, education and training are crucial for the economies, because the higher the activity rate, the more educated the workforce (ec, 2003). The Netherlands Bureau for Economic Policy Analysis (cpb) has pointed out that demand for highly educated people will rise in the coming decades (Nahuis and de Groot, 2003), thus showing the need for education.
More childcare facilities could also help stimulate female labour participation. For women caring for children, lack of childcare is a major barrier to work if alternatives are not available. Governments therefore have several options for raising employment rates. However, in this scenario these policies are not explicitly implemented in the macro model.
3.3.3 Pension reform scenarioIn contrast to the assumptions in the baseline scenario, governments are in fact cur-rently taking measures to prevent their systems from becoming unsustainable; and in this reform process they may diverge from their original welfare regime. The pension reform scenario takes into account pension reforms already set in notion by govern-ments to enhance the sustainability of their pension systems. The pension reforms in this scenario are those described in epc (2001).
Given the stylised way in which the pension systems are represented in the model, these reforms can only be modelled in a more synthetic way. It is assumed that the replacement ratio of the new pensioners will gradually decline in the period 2000-2025. This is done in such a way that the change in the average replacement ratio of all pensioners matches the assumed change in the replacement rate as calculated by the epc (2001, p 26). However, as the epc only presents the change occurring between 2000 and 2050, a linear interpolation is used to compute a consistent target change at 2025. As the epc only analyses state pensions, the target change is also adjusted for the fraction of private pensions in the echp analysis.
Table 3.5 shows the percentage variations in the average replacement ratios used in the pension reform scenario, as well as the replacement ratios for incoming pension-ers that allow variations to be produced during the period considered.

58 Methodology and scenarios 59Methodology and scenarios
Table 3.5 Replacement ratios for incoming pensioners in the pension reform scenario
average change of benefit ratio for all pensioners* consistent replacement ratios for incoming pensioners**
welfare regimepercentage change
2000-2025 2000 2005 2010 2015 2020 2025 change
Nordic (DK) -6 0.56 0.55 0.54 0.54 0.53 0.52 -7%
Hybrid (NL) +0.75 0.84 0.85 0.86 0.86 0.87 0.88 5%
Continental (D) -17 0.77 0.75 0.72 0.69 0.66 0.64 -18%
Continental (F) -10 0.70 0.69 0.67 0.66 0.64 0.63 -11%
Mediterranean (I) -13.5 0.74 0.73 0.72 0.71 0.70 0.69 -7%
Anglo-Saxon (UK) -12.5 0.63 0.61 0.59 0.57 0.55 0.53 -17%
* Percentage variation of average replacement ratio due to current reforms in the period 2000-2025, based on EPC (2001).
** Replacement ratios for pensioners getting their first pension in the given year, needed to bring the average replacement ratio in 2025 at a level consistent with variations specified in the first column.
In all countries, apart from the Netherlands, the average benefit ratio is set to decline according to the epc. The reduction in the benefit ratio is fairly high in Germany and the United Kingdom, in particular.
3.3.4 Institutional reform scenarioBoth the participation scenario and the pension reform scenario show what might happen if countries change their welfare arrangements to address the sustainability problems in the coming decades. However, these scenarios do not make clear what policy course will be taken if countries choose to reform their social security systems in line with their current institutional setting. Most countries consider social policy to be one of their key policy areas, in which they wish to maximize their political autonomy rather than handing this over to ‘Brussels’. In so far as it remains a matter of national concern, it might be more realistic to assume a regime-dependent policy for each country, unless future demographic, economic or social circumstances force them to abandon the established regime. Countries will stick to the same institutional path because the costs of changing regimes may be quite considerable, both in organ-isational and social terms (see chapter 2).
For this reason an ‘institutional reform scenario’ was developed, based on the prin-ciple of ‘maximizing regime consistency, minimizing regime divergence’ – which could be denoted by the acronym regimemaximin. In this scenario, the information from the analysis in the institutional module is used to define a scenario in line with the insti-tutional setting. The implication is that, if all countries were to experience the same exogenous demographic and economic developments, it is assumed that for instance Nordic countries would have a different policy reaction from Continental countries, which again would diverge from the Anglo-Saxon countries.
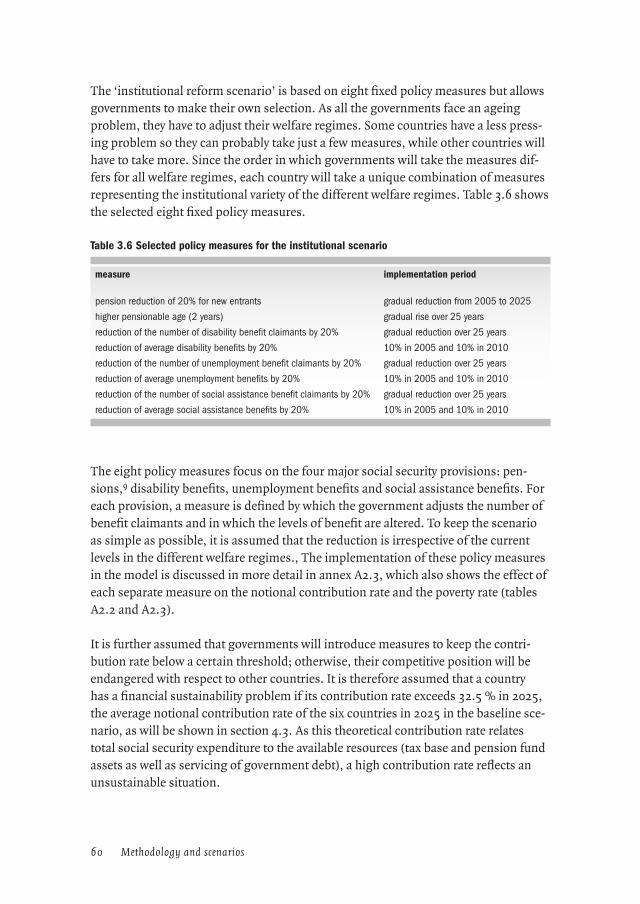
60 Methodology and scenarios 61Methodology and scenarios
The ‘institutional reform scenario’ is based on eight fixed policy measures but allows governments to make their own selection. As all the governments face an ageing problem, they have to adjust their welfare regimes. Some countries have a less press-ing problem so they can probably take just a few measures, while other countries will have to take more. Since the order in which governments will take the measures dif-fers for all welfare regimes, each country will take a unique combination of measures representing the institutional variety of the different welfare regimes. Table 3.6 shows the selected eight fixed policy measures.
Table 3.6 Selected policy measures for the institutional scenario
measure implementation period
pension reduction of 20% for new entrants gradual reduction from 2005 to 2025
higher pensionable age (2 years) gradual rise over 25 years
reduction of the number of disability benefit claimants by 20% gradual reduction over 25 years
reduction of average disability benefits by 20% 10% in 2005 and 10% in 2010
reduction of the number of unemployment benefit claimants by 20% gradual reduction over 25 years
reduction of average unemployment benefits by 20% 10% in 2005 and 10% in 2010
reduction of the number of social assistance benefit claimants by 20% gradual reduction over 25 years
reduction of average social assistance benefits by 20% 10% in 2005 and 10% in 2010
The eight policy measures focus on the four major social security provisions: pen-sions,9 disability benefits, unemployment benefits and social assistance benefits. For each provision, a measure is defined by which the government adjusts the number of benefit claimants and in which the levels of benefit are altered. To keep the scenario as simple as possible, it is assumed that the reduction is irrespective of the current levels in the different welfare regimes., The implementation of these policy measures in the model is discussed in more detail in annex A2.3, which also shows the effect of each separate measure on the notional contribution rate and the poverty rate (tables A2.2 and A2.3).
It is further assumed that governments will introduce measures to keep the contri-bution rate below a certain threshold; otherwise, their competitive position will be endangered with respect to other countries. It is therefore assumed that a country has a financial sustainability problem if its contribution rate exceeds 32.5 % in 2025, the average notional contribution rate of the six countries in 2025 in the baseline sce-nario, as will be shown in section 4.3. As this theoretical contribution rate relates total social security expenditure to the available resources (tax base and pension fund assets as well as servicing of government debt), a high contribution rate reflects an unsustainable situation.

60 Methodology and scenarios 61Methodology and scenarios
It is also plausible that countries will want to avoid too steep a rise in the contribution rate. Therefore, a maximum increase of 2 percentage points over 25 years is allowed for all countries. A third criterion is the poverty rate. Just as the sustainability problem differs between countries, so may the poverty problem. As the poverty rate does not influence the competitive position of a country, there is no absolute degree of pov-erty at which the poverty rate can be characterised as problematic. However, societies will judge their poverty rate by relating them to former values. It is therefore assumed that governments will react if poverty rises by more than one percentage point. If this threshold is exceeded, it is assumed that the government will withdraw one of the measures taken, i.e. the one that affects the poverty rate most, without relaxing the sustainability constraints.
If the regimemaximin principle is applied, it can be assumed that the Nordic regime when faced with a sustainability problem will tend to leave benefit levels intact if possible and focus on measures that are consistent with their active labour market policy. It is likely that they will first reduce the number of employment beneficiaries by short-ening the length of unemployment benefits, then altering the eligibility for dis-ability benefits, and next raising the pension age.10 All three measures theoretically increase labour market participation; their ordering is based on the relative strength of the three groups on the labour market: the ‘strongest’ unemployed come first, the ‘weakest’ elderly last. Stricter means-testing of social assistance benefits comes fourth in the hierarchy of measures, because this can be reconciled with Nordic prin-ciples. Entry to long-term social assistance schemes is already rather restricted in these countries, and usually combined with extensive activating labour market pro-grammes.
The other four measures are more or less regime-divergent for Nordic welfare states, because they directly touch upon the basic income protection. As Nordic countries focus on reducing income inequality, they will reduce social assistance levels as an ultimate measure. Once again, a reduction in unemployment benefits will come first, after which a reduction of the replacement rate in disability benefits will be imple-mented before the level of pension benefits is reduced, as the distance to the labour market is smaller for unemployed and disabled people then for pension beneficiaries.
The Continental regime traditionally tries to shrink the labour market by discouraging the labour participation of the older potential labour force. It is therefore assumed that they will not start with a volume-based policy which aims at this group. If these countries have a sustainability problem, they will first apply stricter means testing in social assistance and reduce the benefit levels of this scheme, which is relatively small, especially for the elderly. Subsequently, the duration and levels of unemploy-ment benefits will be tackled, an area where the older middle-aged are theoretically also under-represented. Next, the levels of disability and pensions will be reduced,

62 Methodology and scenarios 63Methodology and scenarios
which still leaves access to these regulations unhampered. Only as a final step will these countries curtail the eligibility for disability regulations or increase the pension age.
If the Anglo-Saxon regime faces a sustainability problem, it will traditionally tackle it by controlling entry to social assistance. However, as the social assistance levels are already close to the absolute minimum subsistence level, reducing benefits would be the last option for Anglo-Saxon regimes; they are more likely to lower pension, unem-ployment, and disability benefit levels. As pension benefits are related to former con-tributions, these are difficult to reduce because of their statutory character. Therefore, governments will first adjust unemployment benefit levels, then disability benefit levels. After these measures, volume measures that do not affect social assistance will be taken. It is assumed once again that distance to the labour market will be a second-order selection criterion; thus the duration of unemployment benefits is tackled first, eligibility for disability benefit next, and raising the pension age last.
The Mediterranean regime is characterised by relatively good pension and disability pro-visions and rather meagre social assistance and unemployment benefits. This can be interpreted as a phase difference: these countries are still building their systems, but it is not their intention, as in a Anglo-Saxon welfare regime, to keep unemployment and social assistance benefits as low as possible. It is therefore not regime-consistent to lower unemployment and social assistance benefits even further, nor regime-diver-gent to raise these forms of social protection. On the contrary, it can be assumed that Greece, Portugal and Spain will extend their systems in this respect in the near future, to meet general ec standards. As can be noticed, this implies a convergence to other welfare regimes. This would be a logical consequence of a social security system, which have not been developed to his full extent yet.
Therefore, if Mediterranean countries face sustainability problems, they will first take volume measures in the disability and pension systems. They will tighten eligibility and raise the pension age, leaving the levels of these provisions intact. Next they will reduce the replacement rates for disability benefits and lower the average pension. The duration and levels of unemployment benefits will be the next option. Stricter means-testing and lowering of social assistance benefits will come last, because there is not much to be gained here, and politically one would expect an extension of this regulation.
The Netherlands, a hybrid regime, will have a specific institutional scenario. If there is a sustainability problem, the most plausible assumption is that benefit levels will be left intact for as long as possible (as in the Nordic regime), and that the labour market participation of the older potential labour force will remain low (as in the Continen-tal countries). This makes shortening of the duration of unemployment benefits and
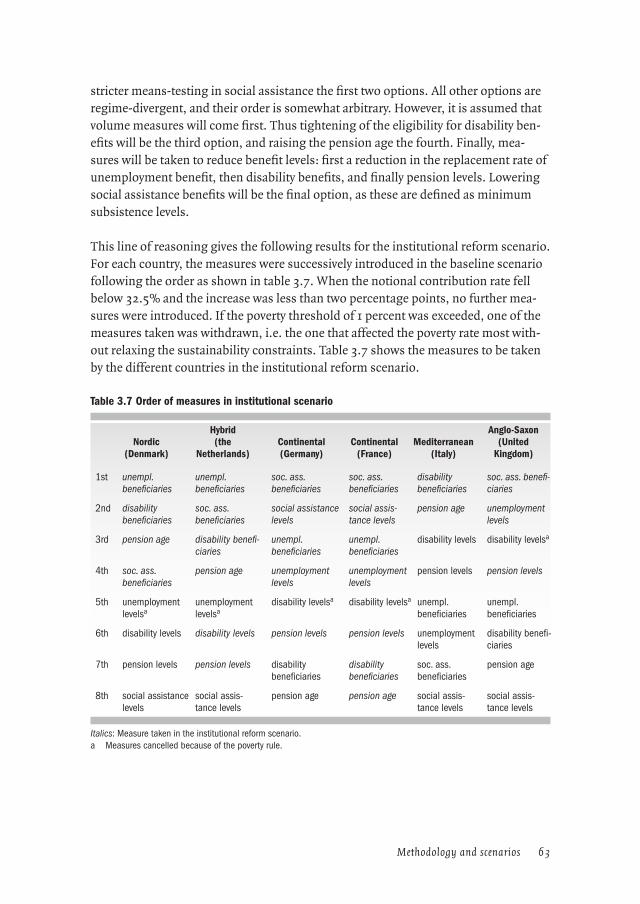
62 Methodology and scenarios 63Methodology and scenarios
stricter means-testing in social assistance the first two options. All other options are regime-divergent, and their order is somewhat arbitrary. However, it is assumed that volume measures will come first. Thus tightening of the eligibility for disability ben-efits will be the third option, and raising the pension age the fourth. Finally, mea-sures will be taken to reduce benefit levels: first a reduction in the replacement rate of unemployment benefit, then disability benefits, and finally pension levels. Lowering social assistance benefits will be the final option, as these are defined as minimum subsistence levels.
This line of reasoning gives the following results for the institutional reform scenario. For each country, the measures were successively introduced in the baseline scenario following the order as shown in table 3.7. When the notional contribution rate fell below 32.5% and the increase was less than two percentage points, no further mea-sures were introduced. If the poverty threshold of 1 percent was exceeded, one of the measures taken was withdrawn, i.e. the one that affected the poverty rate most with-out relaxing the sustainability constraints. Table 3.7 shows the measures to be taken by the different countries in the institutional reform scenario.
Table 3.7 Order of measures in institutional scenario
Nordic(Denmark)
Hybrid(the
Netherlands)Continental(Germany)
Continental(France)
Mediterranean(Italy)
Anglo-Saxon(United
Kingdom)
1st unempl. beneficiaries
unempl. beneficiaries
soc. ass. beneficiaries
soc. ass. beneficiaries
disability beneficiaries
soc. ass. benefi-ciaries
2nd disability beneficiaries
soc. ass. beneficiaries
social assistance levels
social assis-tance levels
pension age unemployment levels
3rd pension age disability benefi-ciaries
unempl. beneficiaries
unempl. beneficiaries
disability levels disability levelsa
4th soc. ass. beneficiaries
pension age unemployment levels
unemployment levels
pension levels pension levels
5th unemployment levelsa
unemployment levelsa
disability levelsa disability levelsa unempl. beneficiaries
unempl. beneficiaries
6th disability levels disability levels pension levels pension levels unemployment levels
disability benefi-ciaries
7th pension levels pension levels disability beneficiaries
disability beneficiaries
soc. ass. beneficiaries
pension age
8th social assistance levels
social assis-tance levels
pension age pension age social assis-tance levels
social assis-tance levels
Italics: Measure taken in the institutional reform scenario.a Measures cancelled because of the poverty rule.

64 Methodology and scenarios 65Methodology and scenarios
All countries have to adjust their pension system because of a sustainability problem. They may do this by reducing the levels of benefits or by raising the pension age. Den-mark, as a representative of the Nordic regime, only has to adjust the eligibility con-straints for the social arrangements, while the level of benefits is maintained. This is quite typical for the Nordic regime’s institutional setting. The Continental countries will have to take more measures to address sustainability. France has an especially difficult task here. All proposed measures are necessary to reduce the contribution rate, mainly because the Continental countries are very reluctant to enforce a higher pension age. Only the measure of adjusting disability benefits is not chosen, because of the poverty rule. Germany takes five measures. In comparison with France, the number of disability benefit claimants and the pension age are not adjusted.
The Mediterranean regime has to reform its welfare state by tightening disability eli-gibility constraints and raising the pension age; the latter is quite an effective means of achieving sustainability. Due to the steep rise of the contribution rate in the base-line scenario, the Netherlands has to take seven measures including adjustment of pensions and disability benefits. The adjustment of unemployment benefits is with-drawn because of a rising poverty rate.
The United Kingdom, representing the Anglo-Saxon welfare regime, will adjust the number of social assistance beneficiaries, for instance by stricter means testing. After this measure, an adjustment of unemployment benefits, disability benefits and pen-sion benefits are considered to keep sustainability under control. As adjustment of disability benefits severely worsens the poverty rate, this measure is not introduced in the United Kingdom.

64 Methodology and scenarios 65Methodology and scenarios
Notes
1 Alders presents three possible scenarios (Individualisation Scenario, Baseline Sce-nario and Family Scenario). For this study, the projections according to the baseline scenario are used.
2 Note that in the country-specific demographic household projections, the average household sizes differ by country. In the uniform demography variant, only the pro-jections are adjusted to European standard. The average household sizes are assumed to be country-specific.
3 The adjustment of the total unemployment rate to the structural unemployment rate has been carried using a proportional adjustment of the age/gender specific unem-ployment rates.
4 Note that in the participation scenario, by contrast, labour market participation rates are endogenously determined as a function of the assumed employment and unem-ployment rates (cf. section 2.4.2 for a detailed explanation).
5 c.f. F. Ramsey, 1928, D. Cass, 1965, T. C. Koopmans, 1965.6 Disability benefits also include non-occupational disability benefits (i.e. risqué social).
In general, the total amount of the risqué social payments is substantially less than the amounts of occupation-related payments. For instance, about 12% of the amount of disability benefits is due to risqué social arrangements in the Netherlands. In Italy, this figure is about 31%.
7 This procedure is partially constrained by the lack of data: because of overly wide age classes, a year by year application of the pension eligibility requirements to the employed workers is not feasible. To compute the flow of new pensioners for each year, the starting point is thus made up of the employed people aged 15-54 at time T; it is assumed that 40 years later all the pensioners will come from that class. The stock of pensioners at time T+40 can therefore be determined as a function of the employ-ment rate at time T. From T on, the flow of new pensioners is computed annually in order to reach this level in a linear manner.
8 This is mainly due to the fact that echp figures are net of taxes and administration costs, but they may also suffer from underreporting problems.
9 In the modelling the pension age is raised by raising the employment rate of the middle-aged group for both men and women.
10 Since Denmark is the representative of the Nordic regime in the analysis, and this country actually lowered its pension age from 67 to 65 recently, it may seem a bit odd to give ‘raising the pension age’ such a high ranking. On the other hand: Sweden recently created the possibility of postponing retirement until age 67 (on a voluntary basis). This, at least, seems to indicate that changing the pension age is a relatively easy measure to take in social-democratic welfare regimes.
66 67Employment, income developments and sustainability
4 Employment, income developments and sustainability
The future ageing process may have major effects on various economic aspects with regard to the welfare state. A first consequence concerns changes in the distribution of income sources over the population. Whereas currently a clear majority of the pop-ulation have an earned income, this proportion will decline as more people leave the labour market and receive a pension. Because pensions are generally lower than previ-ous wages, the average income of the population will show a decreasing trend, reduc-ing the average prosperity of a society. Although the main focus of this study is on income distributions, this aspect is also important.
A second result of the ageing process is that there will be fewer contributors to pay for the benefits schemes. This may have severe implications for the financial sustainabil-ity of welfare states. These issues are addressed in this chapter, in order to sketch the problems that social protection systems may face in the coming decades. This chapter discusses the employment rates, income developments and sustainability, according to the different scenarios outlined in the previous chapter.
4.1 Employment
Future demographic changes will adversely affect the budgetary position of the countries in this study in the coming decades. However, as extensively pointed out (ec 2001, cpb 2000), the employment rate also helps shape the financial prospects. A higher employment rate eases the financial sustainability and also improves the income positions of many individual households. Table 4.1 shows the projected employment rates for selected groups, according to the assumptions outlined in chapter 3.
Total employment rates in the baseline scenario largely follow the participation rates projected by ilo (1997). The total employment rate declines slightly in Denmark and the United Kingdom because in these welfare state the proportion of middle-aged people with respect to the total workforce is set to increase. In the other countries, this demographic trend is compensated by higher employment rates of women or middle-aged people. Particularly in the Mediterranean, but also in the Continental welfare regime, it is assumed that the current rise in female and middle-aged employ-ment rates will continue, thus raising the total employment rates. In the Netherlands, the representative of a hybrid regime, the overall employment rate is constant because the decrease in the male employment rate is offset by a rise in the female and middle-aged employment rates.
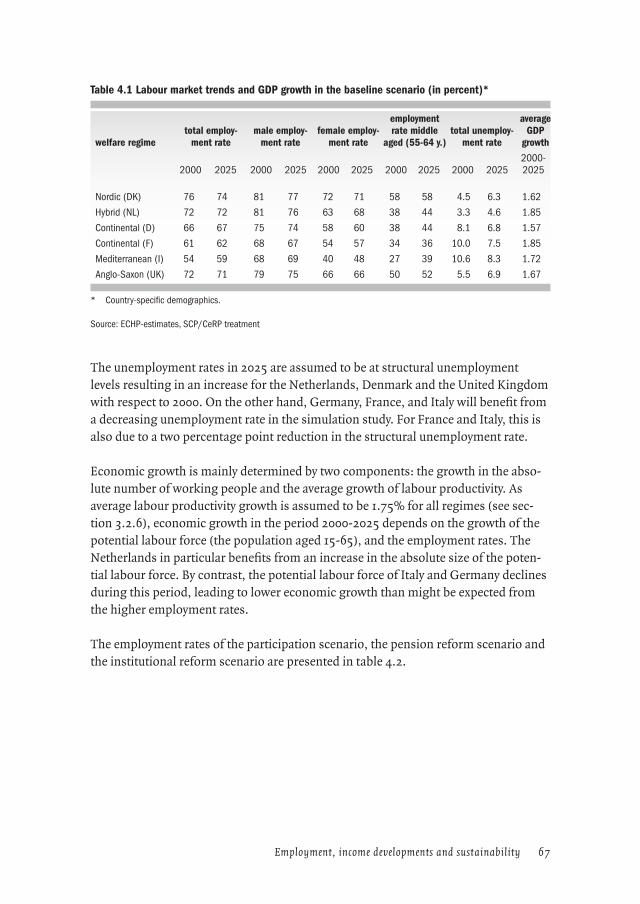
66 67Employment, income developments and sustainability
Table 4.1 Labour market trends and GDP growth in the baseline scenario (in percent)*
welfare regimetotal employ-
ment ratemale employ-
ment ratefemale employ-
ment rate
employment rate middle
aged (55-64 y.)total unemploy-
ment rate
average GDP
growth
2000 2025 2000 2025 2000 2025 2000 2025 2000 20252000-2025
Nordic (DK) 76 74 81 77 72 71 58 58 4.5 6.3 1.62
Hybrid (NL) 72 72 81 76 63 68 38 44 3.3 4.6 1.85
Continental (D) 66 67 75 74 58 60 38 44 8.1 6.8 1.57
Continental (F) 61 62 68 67 54 57 34 36 10.0 7.5 1.85
Mediterranean (I) 54 59 68 69 40 48 27 39 10.6 8.3 1.72
Anglo-Saxon (UK) 72 71 79 75 66 66 50 52 5.5 6.9 1.67
* Country-specific demographics.
Source: ECHP-estimates, SCP/CeRP treatment
The unemployment rates in 2025 are assumed to be at structural unemployment levels resulting in an increase for the Netherlands, Denmark and the United Kingdom with respect to 2000. On the other hand, Germany, France, and Italy will benefit from a decreasing unemployment rate in the simulation study. For France and Italy, this is also due to a two percentage point reduction in the structural unemployment rate.
Economic growth is mainly determined by two components: the growth in the abso-lute number of working people and the average growth of labour productivity. As average labour productivity growth is assumed to be 1.75% for all regimes (see sec-tion 3.2.6), economic growth in the period 2000-2025 depends on the growth of the potential labour force (the population aged 15-65), and the employment rates. The Netherlands in particular benefits from an increase in the absolute size of the poten-tial labour force. By contrast, the potential labour force of Italy and Germany declines during this period, leading to lower economic growth than might be expected from the higher employment rates.
The employment rates of the participation scenario, the pension reform scenario and the institutional reform scenario are presented in table 4.2.

68 Employment, income developments and sustainability 69Employment, income developments and sustainability
Table 4.2 Total employment rates, several scenarios (in percent)
welfare regime baseline* participation pension reform institutional reform
2000 2025 2025 2025 2025
Nordic (DK) 76.4 74.0 76.6 (2.6) 74.0 (0.0) 79.8 (5.8)
Hybrid (NL) 72.2 72.0 74.6 (2.5) 72.0 (0.0) 75.7 (3.6)
Continental (D) 66.4 66.9 70.0 (3.1) 66.9 (0.0) 66.8 (-0.1)
Continental (F) 61.2 63.0 70.0 (7.0) 63.0 (0.0) 67.5 (4.5)
Mediterranean (I) 53.8 58.6 70.0 (11.4) 58.6 (0.0) 62.5 (3.9)
Anglo-Saxon (UK) 72.4 70.5 72.4 (1.9) 70.5 (0.0) 70.8 (0.3)
* Country-specific demographics.Figures between brackets show the difference compared with the baseline scenario in 2025.
Source: ECHP-estimates, SCP/CeRP treatment
In the participation scenario, all regimes have a higher employment rate, in line with the assumptions in this scenario. Germany, France, and Italy just reach the ec target of a total employment rate of 70%, while in Denmark and the United Kingdom the decline in the employment rates stops. Italy benefits in this scenario from an increase of 11.4%, the highest increase in total employment. Due to a rising employment rate among middle-aged people, the employment rate in the Netherlands is 2.5% higher in 2025 than in the baseline scenario.
As only the level of the benefits is adjusted in the pension reform scenario, employ-ment rates are precisely equal to the rates in the baseline scenario. On the other hand, almost all employment rates rise in the institutional reform scenario. The German welfare state faces a slight decrease, mainly because the measures on the number of social assistance and unemployment benefit claimants do not have much influence on the employment rates. The other regimes, apart the Anglo-Saxon regime in the United Kingdom, enjoy higher employment rates, mainly due to the pension age rises which are assumed in these four regimes.
4.2 Income developments
Changing employment rates will influence the average income position of a society. If more people are assumed to be working, more income will be earned, and as a result prosperity will increase. On the other hand, a pension reform in which pensions are reduced will lower the incomes of the elderly. The institutional reform scenario is ambiguous in this respect: more people will earn an income and therefore average prosperity will increase; on the other hand, most benefits are reduced and therefore the average income position could be harmed. Table 4.3 shows the (real), average (non-equivalised) income levels in the various scenarios with respect to the average income position in 2000.

68 Employment, income developments and sustainability 69Employment, income developments and sustainability
Table 4.3 Average income developments 2000-2025, several scenarios (as percentage of 2000)
welfare regime baseline* participation pension reform institutional reform
2000 2025 2025 2025 2025
Nordic (DK) 100 147 152 (4) 146 (-1) 156 (9)
Hybrid (NL) 100 156 161 (5) 157 (1) 154 (-1)
Continental (D) 100 153 158 (6) 150 (-3) 146 (-7)
Continental (F) 100 158 175 (17) 153 (-6) 161 (3)
Mediterranean (I) 100 160 187 (27) 158 (-2) 169 (8)
Anglo-Saxon (UK) 100 150 154 (4) 146 (-3) 146 (-4)
* Country-specific demographics.Figures between brackets show the difference compared with the baseline scenario in 2025.
Source: ECHP-estimates, SCP/CeRP treatment
All countries will have higher average incomes in 2025, but the results differ in the various regimes types and scenarios. The main reason for the increasing incomes is the annual labour productivity growth of 1.75% during a 25-year period. People are expected to become more productive due to better education, capital investments in machines, etc. As it is assumed that their earned income will grow in line with their productivity, average wages and self-employed income will grow by 54% (1.75% over 25 years). Besides this, one of the assumptions in the baseline scenario is that the welfare regimes will remain stable over time. Therefore, the average unemploy-ment, disability, social assistance and other benefits will grow in line with wages. The generally lower levels of pension benefits are rather important here. As more people receive a pension, which is generally lower, average income will grow at a lower rate than average wages, which is typically the case for Denmark and the United Kingdom.
The main reasons for the varying average income developments are the changes in employment. Higher employment rates result for certain groups in a substitution of benefits for wage incomes. Because the latter generally are higher, increasing employ-ment rates lead to higher income growth and more collective wealth. This is espe-cially the case for France and Italy. Because it is assumed that their (female) labour participation rates will increase in the baseline scenario (see table 4.3), average incomes will grow faster than average labour productivity. The Mediterranean regime (Italy) in particular benefits from a 4.8% higher employment rate.
The participation scenario also shows the clear relationship between participation trends and average income trends: increasing participation leads to a higher average income. The Mediterranean regime will have a 27% higher average income in 2025 if it meets the Lisbon employment targets, whereas the average income positions of the Nordic and Anglo-Saxon regimes, which by definition have a non-decreasing employ-

70 Employment, income developments and sustainability 71Employment, income developments and sustainability
ment position in the participation scenario, are therefore close the 54% increase in average wages.
In the pension reform scenario the effect of lower pensions is apparent. For all regimes in which pension reductions are assumed, the average income grows to a lesser degree. France, which would introduce the severest pension retrenchments, also sees the biggest decrease in average income with respect to the baseline scenario.
The institutional reform scenario indicates a higher increase in income for some regimes and a lower increase for others. This results from two opposing influences of the various measures. Firstly, the measures which reduce the number of beneficia-ries generally increase the employment rate and total income may therefore rise. The measures which reduce benefit levels of course mitigate average income growth. For instance, a Nordic welfare regime like Denmark is assumed to focus on high employ-ment rates. This regime is inclined to opt for measures which reduce the number of pension, disability, unemployment and social assistance benefit claimants. In the institutional reform scenario, this leads to a 9% average income increase with respect to the baseline variant. On the other hand, continental Germany is expected to focus mainly on reducing benefit levels and keeping the share of pensioners and disabil-ity benefit claimants constant. This leads to decreasing average income. Continental France ‘profits’ in the institutional reform scenario from its weak sustainability posi-tion. This forces it to raise the pension age, to the benefit of the average income devel-opment. Italy reduces its number of disability benefits and raises its pension age in the institutional reform scenario; these measures boost the average income level by 8%. The Netherlands reduces the volumes of all type of benefits, and also reduces the average disability and pension benefits. The reduction in benefit levels appears to be the more important factor in this as the average income position slightly declines.
4.3 Sustainability
As pointed out in the institutional analysis, welfare states differ in their social secu-rity arrangements. Some regimes currently provide relatively high pensions for their elderly people (the Mediterranean regime of Italy), while others are more focused on their unemployed (Continental and Nordic). However, the ageing process will push up costs everywhere, especially the costs of private and state pensions. Table 4.4 shows the development of the different benefit types with respect to gdp during the coming decades according to the baseline scenario. It is worth stressing yet again that the main purpose of the baseline scenario is not to provide reliable projections for the countries considered, but to highlight the main features of different institutional types. This scenario is characterised by the fact that no reforms are introduced, not even the pension reforms already implemented in some countries. The scenario proj-ects, as a benchmark, all the variables in line with the status quo in 2000. In practice,

70 Employment, income developments and sustainability 71Employment, income developments and sustainability
however, governments are already taking measures to prevent their systems becom-ing unsustainable, and in this reform process they might have drifted away from their original welfare model. This is indeed the underlying reason for the development of the participation and pension reform scenarios.
Table 4.4 Expenditure on social security, baseline scenario (percentage of GDP)
welfare regime total pensions disabilityunemploy-
mentsocial
assistance other
2000 2025 2000 2025 2000 2025 2000 2025 2000 2025 2000 2025
Nordic (DK) 14.4 18.2 9.0 12.6 1.7 1.7 2.9 3.1 0.8 0.8 2.9 3.0
Hybrid (NL) 15.7 22.5 10.2 16.5 2.8 2.8 1.3 1.7 1.4 1.5 1.3 1.4
Continental (D) 15.8 19.2 11.6 15.2 1.5 1.5 2.1 2.1 0.5 0.5 3.3 3.2
Continental (F) 15.6 20.4 12.1 17.2 1.2 1.2 1.9 1.7 0.4 0.4 3.4 3.1
Mediterranean (I) 15.5 17.5 13.7 15.7 1.4 1.3 0.4 0.4 0.0 0.0 1.0 0.9
Anglo-Saxon (UK) 12.7 16.4 10.5 14.1 1.3 1.3 0.6 0.7 0.3 0.3 3.2 3.3
Source: OECD, SCP/CeRP treatment
Mainly due to the growth of pension expenditure, total social security outlays are set to rise in all welfare regimes. The biggest increase will occur in the Netherlands, where total spending on social protection is projected to rise to 22.5% of gdp com-pared with 15.7% in 2000. This rise is due mainly to the growth in spending on pensions, although a small rise in unemployment benefit volumes (0.4%) also con-tributes. The large rise in pension outlays is partly caused by the steep growth in old age dependency of the Netherlands (see table 3.2) and partly by the relatively high (and stable) average pension benefit in the Netherlands with respect to other incomes. In the hybrid regime represented by the Netherlands, average income is about 95% of the total average in both 2000 and 2025, the highest of all regimes (see table A6.2). In addition, pensions in the Netherlands are almost universally indexed to wage growth. This is costlier than indexation based on inflation.
The increase in expenditure in Italy, the representative of the Mediterranean welfare regime in this study, is two percentage points – much lower than in the other coun-tries. This is mainly due to a cut in the indexation regime which was introduced in 1992, and the relatively low degree of ageing. The same holds for the United King-dom, where most pensions are indexed to price inflation rather than wages and where the ageing process will be less severe than in the other countries. The Continental countries, France and Germany, also face increasing expenditure. The position of France is the most delicate, as it is projected that this regime will have the highest pension expenditure in 2025.

72 Employment, income developments and sustainability 73Employment, income developments and sustainability
The changes in expenditure on disability, unemployment, social assistance and other benefits are relatively modest. The rise in expenditure on unemployment benefits for the regimes of the Netherlands, the United Kingdom and Denmark can be explained by the unemployment rates in 2000, which are below the structural levels. As a result, unemployment and the expenditure on unemployment benefits are assumed to be higher in 2025. The opposite holds for the Continental regimes of France and Ger-many and the Mediterranean regime of Italy. In these countries, the structural unem-ployment rates are lower than the actual situation in 2000. Therefore, the expenditure in 2025 is projected to be lower with respect to 2000.
Of course, the rising expenditure may affect the financial sustainability of social secu-rity systems. To analyse this, a ‘notional contribution rate’ has been calculated. This theoretical rate is defined as the average contribution rate that should be levied on wages and self-employed income in order to finance the payment of pensions, dis-ability benefits, unemployment benefits, social assistance and other benefits, taking into account both pension fund assets and the level of government debt. For instance, the Netherlands and the United Kingdom have major pension funds through which they can finance the growing pension burden. As a result, the notional contribution rate turns out lower than might be expected on the basis of their expenditure and employment rates. The ‘notional contribution rates’ are presented in table 4.5 accord-ing to the baseline scenario (using both country-specific and uniform demography projections).
Table 4.5 Notional contribution rates, baseline scenario (in percent)
welfare regime country-specific demography uniform demography
2000 2025 Increase 2000 2025 Increase
Nordic (DK) 23.9 28.2 4.3 24.7 29.0 4.3
Hybrid (NL) 22.8 30.7 8.0 26.3 32.8 6.5
Continental (D) 31.4 36.2 4.8 31.7 36.2 4.5
Continental (F) 32.8 38.3 5.6 32.8 38.1 5.3
Mediterranean (I) 31.8 34.7 2.8 30.9 34.0 3.1
Anglo-Saxon (UK) 23.1 27.2 4.1 23.0 27.4 4.3
Source: ECHP (1999), SCP/CeRP treatment
Notional contribution rates differ between welfare regimes. Continental regimes gen-erally have higher contribution rates as the number of the pension beneficiaries is rather low in these regimes. Moreover, the unfavourable employment rates and low pension fund reserves also tend to increase the contribution rate. France has the high-est contribution rate in 2000, and will maintain this position in 2025. The rate using uniform demographic projections produces the same conclusions. The same holds for Germany which also has high contribution rates in 2000 and 2025. The increase

72 Employment, income developments and sustainability 73Employment, income developments and sustainability
in the contribution rate of Italy is the lowest of all countries, mainly because of the modest rise in pension expenditure and the growth in the employment rate from 2000 to 2025. However, in 2025 the contribution rate is one of the highest, only just below the Continental states. Just like France and Germany, the differences between the ‘country-specific’ and the ‘uniform demography’ variant are relatively small in the baseline scenario.
In the baseline scenario with country-specific demographics in 2000, the Nether-lands benefits from its favourable demographical situation in 2000; the contribution rate is the lowest of all countries in this year. However, corrected for uniform demo-graphics, Denmark and the United Kingdom have lower rates in 2000 and in 2025. Of all regimes, the hybrid regime in the Netherlands sees the highest increase in the notional contribution rate up to 2025; this follows from the relatively higher increase in pension expenditure.
Table 4.6 shows that, compared with the baseline scenario, almost all other sce-narios lead to better sustainability for all countries. The pension reform scenario in the Netherlands is an exception, however. This follows from the projected increase in average pension benefits in the Netherlands according to the epc study (see sec-tion 3.4.3).
Table 4.6 Notional contribution rates, policy scenarios (in percent)
welfare regime baseline participation pension reform institutional reform
2000 2025 2025 2025 2025
Nordic (DK) 23.9 28.2 27.8 (-0.4) 27.6 (-0.6) 24.8 (-3.4)
Hybrid (NL) 22.8 30.7 30.1 (-0.6) 31.3 (0.5) 24.4 (-6.3)
Continental (D) 31.4 36.2 35.3 (-0.9) 35.1 (-1.1) 32.5 (-3.7)
Continental (F) 32.8 38.3 37.3 (-1.1) 36.0 (-2.3) 32.2 (-6.1)
Mediterranean (I) 31.8 34.7 34.5 (-0.2) 33.8 (-0.9) 31.2 (-3.4)
Anglo-Saxon (UK) 23.1 27.2 27.0 (-0.2) 25.4 (-1.9) 23.6 (-3.6)
Figures between brackets show the difference compared with the baseline scenario in 2025.
Source: ECHP-estimates, SCP/CeRP treatment
In general, the pension measures in the pension reform scenario are more effective for sustainability than the rise in employment rates in line with the Lisbon employ-ment targets. In the participation scenario even Italy, which has to increase the total employment rate by 11.4% in 2025, only sees a slight reduction of 0.2% in the notional contribution rate. For France and Germany, increasing employment accord-ing to the Lisbon target leads to a reduction in the contribution rate of 1.1% and 0.9%,

74 Employment, income developments and sustainability 75Employment, income developments and sustainability
respectively. The lower effectiveness of the participation scenario is mainly due to the increasing pension rights that the working population will be building up.
In the institutional reform scenario, it is assumed that governments will introduce measures in order to keep the contribution rate below the threshold of 32.5% in 2025 (see section 3.4.4); otherwise, their competitive position will be endangered with respect to other countries. It is also assumed in this scenario that countries want to avoid too steep a rise in the contribution rate. Therefore, a maximum increase of two percentage points over 25 years is allowed for all countries. As a result of these assumptions, the Netherlands and France in particular have to reduce their contribu-tion rates by more than 6%. For France this is mainly due to the threshold of 32.5%. For the Netherlands, the maximum increase of 2% is the binding restriction, as the notional contribution rate will increase by 7.9% in the baseline scenario. This reduc-tion explains the large number of measures France and the Netherlands have to take (see table 3.6). For the other countries, the reduction in the contribution rate is between 3 and 4 percent. As can be seen, the gap between the Continental and Medi-terranean regimes (France, Germany and Italy) and the Anglo-Saxon, Nordic and hybrid regimes (United Kingdom, Denmark and the Netherlands) will still exist in the institutional reform scenario in 2025, despite the differences in reduction.
4.4 Conclusions
In this chapter several macroeconomic results of the model and the scenarios were presented: employment rates, average income trends and the financial sustainability of the welfare states. Total employment rates in the baseline scenario largely follow the participation rates projected by ilo (1997). These projections show that the cur-rent small rise in the female and middle-aged participation rates will continue in the Mediterranean and Continental countries. As a result, total employment rates will increase slightly in these regimes. The Nordic and Anglo-Saxon regimes will see a slight decline in the employment rate. Female labour participation is already high in these countries, and will barely rise in the future. For this reason, the ageing of these societies will result in a slight decrease in their employment rates. In the hybrid wel-fare state of the Netherlands, the slightly higher female labour participation compen-sates for the ageing effect: the employment rate will remain constant for this country in the baseline scenario.
In the participation scenario, all regimes will have a higher employment rate, which is in line with the basic assumptions. The Mediterranean and the Continental regimes will derive particular benefit from meeting the Lisbon employment targets in 2010. In the pension reform scenario employment rates are equal to those in the baseline sce-nario; this follows from the assumption that only pension benefit levels are adjusted in this scenario. The institutional reform scenario shows mostly higher employment
74 Employment, income developments and sustainability 75Employment, income developments and sustainability
rates with respect to the baseline scenario in 2025, mainly because the pension age is assumed to be raised in most of these regimes.
Due to the assumed increase in labour productivity over the period 2000-2025, real average incomes will be higher for all welfare regimes in all scenarios. However, some differences are apparent. In the participation scenario, higher employment rates result for certain groups in a substitution of benefits for earned income. Since the latter are generally higher, rising employment rates lead to higher income growth and more collective wealth. This is especially the case for the Mediterranean and Con-tinental welfare regimes.
The pension reform scenario leads to a clear conclusion: in all regimes in which a pension reduction is assumed, average income grows to a lesser degree. The opposite holds for the Netherlands: pensions levels increase slightly up to 2025 with respect to the baseline scenario and therefore average income also increases in this country.
The institutional reform scenario indicates a bigger income increase for some regimes and a lower increase for others. This is the result of two opposing conse-quences of the various measures. Firstly, measures which reduce the number of ben-eficiaries generally increase the employment rates, so that total income may rise. Measures which reduce benefit levels of course mitigate average income growth. The latter trend is dominant in the Anglo-Saxon regime, the hybrid welfare state of the Netherlands and in Germany as the representative of the Continental regime. In the other regimes, average income is higher in the institutional reform scenario with respect to the baseline scenario in 2025.
Although the focus of this study is on the analysis of possible future distribution results, it is important to bear in mind the costs of social security as the financing of the welfare regimes may become problematic in the coming decades. The ‘notional contribution rate’ that was introduced in chapter 3 relates the expenditure on welfare benefits to the tax base, taking into account present pension fund assets and govern-ment debt. For all welfare regimes, this sustainability indicator will increase up to 2025, especially in the hybrid welfare state of Netherlands and in France. In France, this follows from the large size of the pensioner group, which reflects the lower employment rates in this country. Although this also holds for Italy, the increase in the contribution rate is smaller than in these two countries because of its indexation regime (based on inflation) and the higher general employment rate in 2025. The big increase in the contribution rate in the Netherlands can be explained by its compara-tively unfavourable demographical position; other relevant factors are its indexation policy (tied to wage growth) and the relatively high and stable pension levels with respect to other incomes.

76 Employment, income developments and sustainability 77
Compared to the baseline scenario, all scenarios lead to improved financial sustain-ability for all regimes. In the pension reform scenario, the Netherlands is the excep-tion, as this country is assumed to raise average pension benefits. Higher labour participation or lower pension benefits lead to better sustainability, although the measures assumed in these scenario do not protect welfare regimes from rising con-tribution rates up to 2025. In the participation scenario, the decrease in the contri-bution rates is mitigated by the higher pension rights of the working population. The reforms in the institutional reform scenario show the highest reductions of the ‘notional contribution rates’, especially in France and the Netherlands, as these coun-tries are assumed to introduce the most measures.

76 Employment, income developments and sustainability 77
5 Income inequality
In terms of pensions, the Continental and Mediterranean regimes seem be to the most extensive, owing to the large share of earning-related pensions. This may also apply to the Nordic regime, where there is a universal basic pension, which may be topped up by occupational benefits. At the other extreme we find the Anglo-Saxon regime, where collective pensions are generally more limited and therefore more tar-geted towards poverty relief.
However, the fact is that all regimes provide their elderly with some kind of pension. Because such pensions are generally lower than average earned income, the rising share of pensions may seriously affect income distributions in the coming decades. Of course, this also depends on income developments in the working population and other benefit recipients, and on the policies countries pursue. These future distribu-tional consequences of ageing in different policy contexts are the key focus of this study. This chapter seeks to analyse the first distribution indicator: income inequality.
5.1 Measurement of inequality
In his work, Esping-Andersen did not pay a great deal of attention to income distri-bution. His main concern was the stratification of welfare regimes in terms of class and status positions, not their impact in terms of income inequality, redistribution and poverty. Nevertheless, the scp studies On Worlds of Welfare (Wildeboer Schut et al., 2001) and Social Europe (Dekker et al., 2003) showed a fairly close correspondence between the Esping-Andersen welfare regimes and the results in terms of income dis-tribution, redistribution and poverty.
This gives reason to assume that the future distributive consequences of ageing may also vary with the regime type. In this chapter this topic will be explored for three indicators of income inequality. All indicators are homogenous; in other words, if all incomes were to grow by the same factor (e.g. inflation, wage growth) the coefficient remains unchanged. The first inequality indicator is the widely used Gini-coefficient. The Gini-coefficient is quite sensitive to changes at the middle-income level and less sensitive at the extremes of the distribution. The coefficient has a minimum value of 0 (all incomes are equal) and a maximum value of 1 (extremely unequal).1
The second main indicator for measuring income inequality is the Theil-coefficient. A major advantage of this coefficient is the possibility it offers of decomposing changes in this indicator into changes between and within groups.2 This aspect will be used in sections 5.3 and 5.4 of this chapter. A drawback of this indicator is its relatively sen-sitivity to changes at the upper end of the income distribution. The indicator has zero

78 Income inequality 79Income inequality
value in the event of total equality; the upper limit depends on the number of observa-tions.3
The third indicator is the S80/S20-ratio: the total income of the population in the highest two incomes deciles divided by the total income of the lowest two income deciles. This is one of the so-called Laeken-indicators. An advantage of this indicator is its simplicity. An obvious disadvantage of the S80/S20-ratio is that the income dis-persion of 60 percent of the population is not taken into account.
The definition of income is also important for the measurement of inequality. The echp provides only one single definition, namely annual net income including social transfers (see section 3.1). It is therefore not possible to analyse income inequality of gross incomes and the redistribution function of taxes.
Income inequality can be measured on a personal and on a household basis. Income inequality on a purely personal basis shows the inequality between persons and their social and economic independence. The gender aspect is especially relevant here as the percentage of women without an income is higher in the Continental and Medi-terranean welfare regimes; this will lead to higher income inequality on a personal basis in these regimes. However, it is reasonable to assume that members of a house-hold share their incomes, resulting in the same wealth for all household members. It is therefore more informative to analyse the income inequality of households.
The third income definition is the equivalised household income per person, which will be the main definition used in this study. This is because one drawback of using simple household incomes is the incomparability of the household incomes of single households and two-person households. For instance, if two persons having the same personal income were to decide to marry or cohabit, their household income would be twice their single income. It should therefore be logical to adjust household income by dividing household income by the number of adults as this makes incomes comparable. However, even if a couple had precisely twice the income of a single person, the couple is considered wealthier because they benefit from some economies of scale. For instance, instead of two dwellings, they only have to rent one. Conse-quently, the household income of a couple is generally not divided by 2, but a figure less than this (e.g. 1.5) to take into account these efficiencies. Another relevant aspect which determines the wealth of the household members is the number of children, as the costs of children can be quite substantial. Household incomes are therefore ‘equivalised’ in this study by using the ‘modified oecd equivalence scale’.4 In this commonly used equivalence scale, the first adult is accorded a weight of 1, each sub-sequent adult accorded a weighting of 0.5, and children 0.3. So, for a couple without any children the equivalence scale is 1.5.5

78 Income inequality 79Income inequality
5.2 Current and future income inequalities
Table 5.1 shows the Gini, Theil and S80/S20 indicators for the various definitions of income in the year 2000, the starting point of the analysis.
Table 5.1 Income inequalities for various income definitions 2000
personal incomesnon-equivalised
household incomesequivalised household income
per person
welfare regime 2000 (ranking) 2000 (ranking) 2000 (ranking)
Gini coefficient
Nordic (DK) 0.323 (1) 0.327 (3) 0.236 (1)
Hybrid (NL) 0.460 (4) 0.295 (1) 0.253 (3)
Continental (D) 0.429 (2) 0.308 (2) 0.246 (2)
Continental (F) 0.463 (5) 0.341 (5) 0.289 (4)
Mediterranean (I) 0.525 (6) 0.332 (4) 0.295 (5)
Anglo-Saxon (UK) 0.438 (3) 0.365 (6) 0.316 (6)
Theil coefficient
Nordic (DK) 0.195 (1) 0.178 (3) 0.104 (1)
Hybrid (NL) 0.409 (4) 0.159 (1) 0.125 (3)
Continental (D) 0.330 (2) 0.164 (2) 0.114 (2)
Continental (F) 0.421 (5) 0.214 (5) 0.162 (5)
Mediterranean (I) 0.527 (6) 0.184 (4) 0.151 (4)
Anglo-Saxon (UK) 0.353 (3) 0.231 (6) 0.183 6)
S80/ S20
Nordic (DK) –* –* 5.7 (3) 3.4 (1)
Hybrid (NL) –* –* 4.9 (1) 3.6 (3)
Continental (D) –* –* 5.3 (2) 3.5 (2)
Continental (F) –* –* 6.2 (5) 4.4 (4)
Mediterranean (I) –* –* 5.9 (4) 4.8 (5)
Anglo-Saxon (UK) –* –* 7.3 (6) 5.3 (6)
* Due to the large share of people without any personal income, total income of the lowest 20% group is very small through which the ratio can become infinite. Therefore the S80/S20 ratio is not calculated on personal basis.
Source: ECHP (1999), SCP/CeRP treatment
On the personal income level, the Gini and Theil income inequality measures show the Nordic regime of Denmark to have the lowest inequality, while the Mediterranean regime has the highest income inequality. The Danish result is mainly a consequence of the high labour participation of women; both men and women generally have a job and therefore both earn an income which reduces the personal income inequality. The opposite holds for Mediterranean regime: due to the high proportion of non-work-

80 Income inequality 81Income inequality
ing women, the number of people without any income is relatively high and therefore personal income inequality is high. Note that using this income definition, the Anglo-Saxon regime has the third lowest income inequality – once again, the main reason is the high labour participation of women – whereas it has the highest income inequal-ity according to the other income definitions. In terms of individual independence, the Anglo-Saxon regime shows better results than the Mediterranean and hybrid regimes.
The inequality of household incomes is generally much lower than income inequal-ity on the personal level: In Italy, the Theil measure reduces by 65% to 0.184, while the inequality in the Netherlands reduces by 61% to 0.159. The pooling effect is relatively weak the Nordic regime because of the limited income contrasts between household members, which results from the high female labour participation. In the Mediter-ranean regime, the opposite happens: because of the large share of women without a personal income, the number of people without any income is relatively high, increas-ing personal income inequality. This effect vanishes in the household income defini-tion. Income pooling can therefore be considered as a major instrument of inequality reduction. The strong reduction of inequality achieved by using households incomes results in a complete different ordering of the regimes. Instead of the Mediterranean regime, the Anglo-Saxon regime is now the regime with the highest income inequal-ity.
Income inequality measured using the equivalised income definition generally results in lower income inequalities than measurements based on total household income. This follows mainly from the effect that the higher income positions of multiple-person households are made comparable to single-person household incomes. The reduction in income inequality is greatest in the Nordic regime. In this regime, each partner in a couple generally earns about the same as a single person, and the gap between the household incomes of couples and singles is therefore relatively high. The opposite holds for the Hybrid and Mediterranean regimes; in these two regimes the inequality reduction is relatively small because the contribution by women to household income is relatively low. In the Mediterranean regime this is because of the lower labour participation of women; in the hybrid regime of the Netherlands, it results from the high proportion of part-time jobs held by women, as a result of which their addition to household income is relatively small.
Following this third income definition, the ranking of the welfare regimes changes once again. Apart from the Continental regime, welfare regimes show an order with respect to income inequality. The Nordic regime has the lowest income inequality, followed by the hybrid regime of the Netherlands and the Mediterranean regime. The Anglo-Saxon regime has the highest income inequality. It is more difficult to desig-nate the Continental regime, since the representatives of this regime show different

80 Income inequality 81Income inequality
results. Germany has an income inequality slightly below that of the Netherlands, whereas France has an income inequality in line with the Mediterranean regime.
Table 5.2 shows the projections for income inequality for 2025 using the various defi-nitions of income.
Table 5.2 Income inequality for various indicators and income definitions in 2025 (baseline scenario)
personal incomenon-equivalised
household incomesequivalised household
income per person
welfare regime 2025 growth (%) 2025 growth (%) 2025 growth (%)
Gini coefficient
Nordic (DK) 0.329 (1) 2 0.333 (3) 2 0.247 (1) 4
Hybrid (NL) 0.441 (4) -4 0.307 (1) 4 0.260 (3) 3
Continental (D) 0.417 (2) -3 0.313 (2) 2 0.251 (2) 2
Continental (F) 0.445 (5) -4 0.348 (5) 2 0.293 (4) 1
Mediterranean (I) 0.489 (6) -7 0.343 (4) 3 0.299 (5) 2
Anglo-Saxon (UK) 0.432 (3) -1 0.371 (6) 2 0.321 (6) 2
Theil coefficient
Nordic (DK) 0.206 (1) 6 0.187 (3) 5 0.115 (1) 10
Hybrid (NL) 0.372 (4) -9 0.169 (1) 6 0.130 (3) 4
Continental (D) 0.312 (2) -6 0.170 (2) 4 0.119 (2) 4
Continental (F) 0.384 (5) -9 0.219 (5) 2 0.163 (5) 1
Mediterranean (I) 0.456 (6) -14 0.200 (4) 9 0.161 (4) 6
Anglo-Saxon (UK) 0.343 (3) -3 0.239 (6) 4 0.188 (6) 3
S80/ S20
Nordic (DK) –* –* 5.7 (3) 0 3.5 (1) 5
Hybrid (NL) –* –* 5.2 (1) 5 3.7 (3) 4
Continental (D) –* –* 5.3 (2) 1 3.6 (2) 3
Continental (F) –* –* 6.4 (5) 2 4.5 (4) 3
Mediterranean (I) –* –* 6.1 (4) 4 4.7 (5) -1
Anglo-Saxon (UK) –* –* 7.3 (6) 1 5.4 (6) 0
* Due to the large proportion of people without any personal income, the total income of the lowest 20% group is very small, so that the ratio can become infinite. Therefore the S80/S20 ratio is not calculated.
Source: ECHP (1999), SCP/CeRP treatment
The Gini and Theil indicators show that ageing leads to a reduction in personal income inequality. Especially in the Mediterranean welfare regime, inequality reduces rather sharply by 14% according to the Theil-statistic and 7% following the Gini-coef-ficient. The main explanation for this is the number of people earning an income or receiving benefit. Due to the ageing process more elderly people will be receiving a

82 Income inequality 83Income inequality
personal pension because pensions are often paid individually to pensioners or their widow(er)s. The proportion of persons without any income therefore falls, leading to a reduction in personal income inequality. In Denmark, the effect of more elderly people receiving an income is the opposite. The reducing effect of more people receiv-ing an income during their working life is negligible in this regime. Therefore chang-ing income positions is more relevant, leading to increasing income inequality.
In the other two definitions of income, based on total household income, inequali-ties are set to rise in almost all welfare regimes. In the case of France, using the equivalised household income per person, the Theil statistic only rises by 1%, but in Denmark the increase will be 10%. According to the Gini-coefficient and the S80/S20-ratio, the differences are more moderate. Denmark still has the highest increase using the equivalised income definition. For Italy, the various indicators show slightly dif-ferent pictures. According to the Theil-coefficient, income inequality will increase by 6%, whereas the S80/S20-ratio shows a small decrease of –1%. The Gini holds a midway position: an increase of 2%. It can therefore be concluded that the shape of the income distribution in Italy will alter. The gap between the highest and lowest incomes will decreases slightly, but the income inequality in the middle incomes will increase marginally.
It is important to note that the relative positions of the various regimes are stable over the period 2000-2025. There is one small exception to this: France and Italy are close to each other and interchange their positions according to the Theil-coefficient in the averaged household income definition. The main conclusion is that income inequal-ity will increase slightly in all welfare regimes if the standard equivalised income definition is used. As a result, the relative positions of the various regimes remain unchanged over the period 2000-2025.
The increasing income inequalities can be analysed by a decomposition of the Theil-index. This index can be a split up into two components: ‘between group inequality’ and ‘within group inequality’. This division has been demonstrated by Mookherjee and Shorrocks (1982). In annex A5, formal definitions are presented.
The between group inequality is the share of income inequality which can be explained by the differences in average incomes between groups. For instance: the average incomes of pensioners and social assistance beneficiaries are generally lower then total average, whereas the average wage is generally higher then total average. The greater the differences between the average incomes of the various groups, the higher is the between group inequality. If the average incomes of all groups were equal, the between group inequality would be zero.

82 Income inequality 83Income inequality
Of course, the differences in the average incomes of the various groups do not totally explain inequality, because income inequalities within groups are also relevant. Pen-sions are often related to previous wages and therefore the differences in individual pension benefits can be quite substantial. This also holds for the income inequalities within groups such as wage-earners and the self-employed. The second component, ‘within group inequality’, averages the various income inequalities within the groups. The relative weight in the summation of each within group inequality depends on the size of the group and its average income.
To make use of this decomposition possibility the total population has to be split into relevant groups. In this study, this is done using two criteria to make a classifica-tion. The first criterion is the main income component of a household, differentiating between wag- earners, self-employed persons, pensioners, disability benefit claim-ants, unemployment benefit claimants, social assistance beneficiaries, and people for whom the main household income comes from other categories (e.g. capital income, income from property, educational allowances, etc). The statistics of the various groups using this division (group sizes, average incomes and inequality within the groups) for the years 2000 and 2025 are shows in table A6.2 in annex A6.
A second criterion for splitting a total population is the marital/cohabitation status of a household and the number of earners in the household.6 Households in which both partners have an income are generally wealthier than single-earners. In addi-tion, a distinction has been made between younger (under 65 years) and elderly people (over 65 years). This results in the following eight groups: a couple with two earners, a couple with one earner, a couple with no earner, a single person with earn-ings, a single person without earnings, a couple over 65 years, a single person over 65 years, and others. A rather important aspect of this division is that the increasing size of the elderly population mainly results in an increase in married/cohabitating elderly persons. The percentage of single elderly persons is also increasing, but at a more modest rate. For instance, the share of single elderly persons in Denmark will increase by 1 percentage point, while the proportion of married elderly persons will grow by 5 percentage points up to 2025. The results are typical for the situa-tion in 2025, when a large number of ‘new’ pensioners (from the baby boom), will have passed the age of 65 and still be living together. Later, when one of the part-ners passes away, the share of single elderly persons will increase in relative terms. The group statistics based on this division (size of the groups, average income and inequality within the groups) for the year 2000 and 2025 are shows in table A6.3.
Using the statistics from table A6.2 and A6.3, it is possible to decompose the Theil inequality indicator to the ‘between group inequality’ and ‘within group inequality’. Figure 5.1 shows the results.

84 Income inequality 85Income inequality
For all welfare regimes and both group divisions, it is mainly the within group inequality that determines the total inequality. The minimum within inequality is about 0.08 (Nordic regime using household situation) whereas the maximum is 0.16 (Anglo-Saxon regime using main income). The between group equality is generally between 0.005 (Mediterranean regime using household income division) and 0.04 (Anglo-Saxon regime using household situation). The size of the within inequalities can be described as the ‘unexplained’ part of the group division and the decomposi-tion does not always provide an explanation for changes in this income inequality component. However, the classification into different groups does explain a (rela-tively small) part of the income inequalities. The income inequalities within the vari-ous groups (e.g. pensioners, wage-earners) are the more dominant factor for income inequality.
On the other hand, the changes in between groups inequalities can always be anal-ysed by a narrow focus on the changes in the sizes of the groups and changes in aver-age incomes. The within group inequality is influenced by the same two factors, but also by the changing income inequality within the groups. It is possible to split the change in income inequality into the changes in these three factors. In annex A5, the formal decomposition of this analysis is presented mathematically. Table 5.3 shows the effects of the three factors on the between group inequalities and the total within group inequalities.
����
����
����
����
����
�����������
�����������
���������������
���������������
�����������������
����������������
�����������
�����������
���������������
���������������
�����������������
����������������
����������������������������� ����������������������������� ���������������������� ����������������������
��������������������������������� �����������������������������������������������������
Figure 5.1 Decomposition of income inequality (Theil-statistics)
Source: ECHP (1999), SCP/CeRP treatment
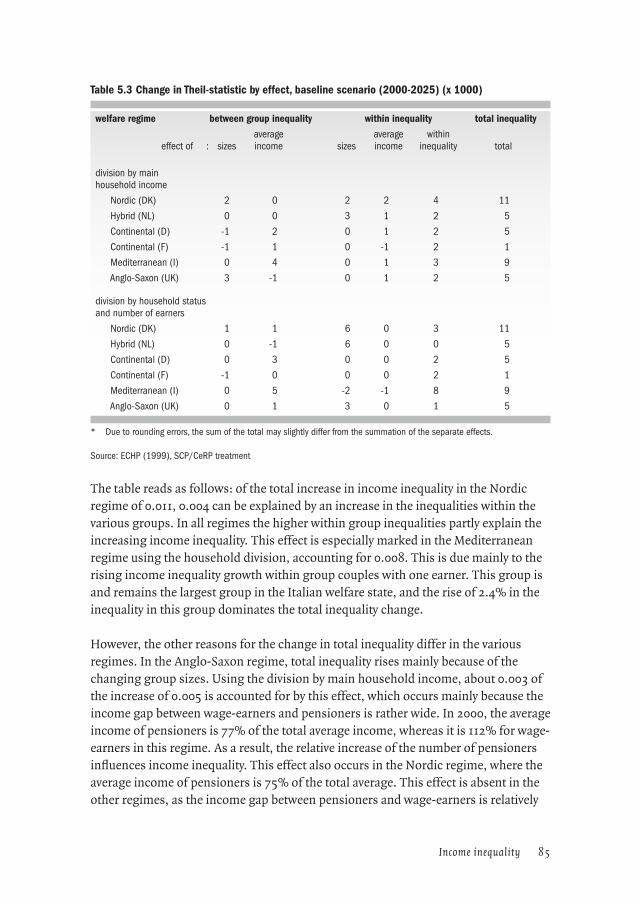
84 Income inequality 85Income inequality
Table 5.3 Change in Theil-statistic by effect, baseline scenario (2000-2025) (x 1000)
welfare regime between group inequality within inequality total inequality
effect of : sizes average income sizes
average income
withininequality total
division by main household income
Nordic (DK) 2 0 2 2 4 11
Hybrid (NL) 0 0 3 1 2 5
Continental (D) -1 2 0 1 2 5
Continental (F) -1 1 0 -1 2 1
Mediterranean (I) 0 4 0 1 3 9
Anglo-Saxon (UK) 3 -1 0 1 2 5
division by household status and number of earners
Nordic (DK) 1 1 6 0 3 11
Hybrid (NL) 0 -1 6 0 0 5
Continental (D) 0 3 0 0 2 5
Continental (F) -1 0 0 0 2 1
Mediterranean (I) 0 5 -2 -1 8 9
Anglo-Saxon (UK) 0 1 3 0 1 5
* Due to rounding errors, the sum of the total may slightly differ from the summation of the separate effects.
Source: ECHP (1999), SCP/CeRP treatment
The table reads as follows: of the total increase in income inequality in the Nordic regime of 0.011, 0.004 can be explained by an increase in the inequalities within the various groups. In all regimes the higher within group inequalities partly explain the increasing income inequality. This effect is especially marked in the Mediterranean regime using the household division, accounting for 0.008. This is due mainly to the rising income inequality growth within group couples with one earner. This group is and remains the largest group in the Italian welfare state, and the rise of 2.4% in the inequality in this group dominates the total inequality change.
However, the other reasons for the change in total inequality differ in the various regimes. In the Anglo-Saxon regime, total inequality rises mainly because of the changing group sizes. Using the division by main household income, about 0.003 of the increase of 0.005 is accounted for by this effect, which occurs mainly because the income gap between wage-earners and pensioners is rather wide. In 2000, the average income of pensioners is 77% of the total average income, whereas it is 112% for wage-earners in this regime. As a result, the relative increase of the number of pensioners influences income inequality. This effect also occurs in the Nordic regime, where the average income of pensioners is 75% of the total average. This effect is absent in the other regimes, as the income gap between pensioners and wage-earners is relatively

86 Income inequality 87Income inequality
smaller. In the hybrid regime of the Netherlands, the average income of pensioners is about 95% of the total average in 2000, the highest of all regimes. The Continen-tal (Germany and France) and Mediterranean regime (Italy) hold a mid-way position; the average income of pensioners in these regimes is 92% (France and Germany) and 88% (Italy).
In the Nordic, Anglo-Saxon and hybrid regimes, these average pension benefits are relatively stable up to 2025. On the other hand, the average income of an Italian pen-sioner will decline from 88% to 82% of average income. This deteriorating income position of pensioners explains 0.004 of the between group inequality and is the dominant effect in Italy. In the Continental regimes the average income of pensioners will also decrease, but to a lesser extent. In Germany the average pension will decline from 92% to 88% in 2025, and in France from 92% to 90%.
Based on household division, there is also a gap between the incomes of pensioners and other incomes. In particular, the incomes of elderly couples (65 years and over) in Italy will decrease from 103% of the total average in 2000 to 92% in 2025, accounting for 0.005 of the change in income inequality. As a result, this average income is more in line with the average income of elderly couples in other welfare regimes. The same effect is present in Germany, where the average income of couples will fall from 100% to 94% of overall average income, accounting for 0.003 of the increasing income inequality.
Based on the household division, the change in the sizes of the various groups is the most relevant factor for the growth in income inequality in the Nordic regime, mainly due to an increase of 0.006 in the within group inequality. The main effect is a shift towards the groups with the higher inequalities, which in Denmark are cou-ples aged 65 years and over. This group grows relatively quickly and has the highest income inequality of all groups in Denmark. The same effect occurs in the hybrid and Anglo-Saxon regimes. On the one hand, the groups with lower within group income inequalities, two-earner couples and single-earner couples, decrease in size in relative terms; on the other hand, groups with higher inequalities, namely younger single per-sons and the elderly, show a relative increase. Both effects increase the within group inequality.
5.3 Effects of demographic differences
As shown in the previous section, demographic changes will influence the income distributions in the various welfare regimes. These demographic changes differ in the various countries, however, and this could influence the main results with respect to income inequality. In other words, differences in distribution developments in the dif-ferent welfare regimes may also be caused by differences in demographic structure

86 Income inequality 87Income inequality
between countries. To make this effect visible, uniform demographic projections are applied to all regimes in the baseline scenario (see section 3.2). The uniform demo-graphic projections match the average demographic change of the eu-15 countries.
The income inequality results are presented in table 5.4. In this table the equivalised household income definition is used. This income definition reflects a person’s ‘wealth’ best, and is therefore used in the remainder in this study.
Table 5.4 Income inequalities,* baseline scenario
country-specific demography uniform demography
2000 2025increase
(%) 2000 2025increase
(%)
Gini coefficient
Nordic (DK) 0.236 (1) 0.247 (1) 4 0.237 (1) 0.250 (1) 6
Hybrid (NL) 0.253 (3) 0.260 (3) 3 0.252 (3) 0.259 (3) 3
Continental (D) 0.246 (2) 0.251 (2) 2 0.246 (2) 0.251 (2) 2
Continental (F) 0.289 (4) 0.293 (4) 1 0.287 (4) 0.291 (4) 2
Mediterranean (I) 0.295 (5) 0.299 (5) 2 0.296 (5) 0.298 (5) 1
Anglo-Saxon (UK) 0.316 (6) 0.321 (6) 2 0.316 (6) 0.322 (6) 2
Theil coefficient
Nordic (DK) 0.104 (1) 0.115 (1) 10 0.104 (1) 0.118 (1) 14
Hybrid (NL) 0.125 (3) 0.130 (3) 4 0.124 (3) 0.130 (3) 5
Continental (D) 0.114 (2) 0.119 (2) 4 0.112 (2) 0.118 (2) 5
Continental (F) 0.162 (5) 0.163 (5) 1 0.156 (5) 0.158 (5) 1
Mediterranean (I) 0.151 (4) 0.161 (4) 6 0.152 (4) 0.158 (4) 4
Anglo-Saxon (UK) 0.183 (6) 0.188 (6) 3 0.183 (6) 0.189 (6) 4
S80/ S20
Nordic (DK) 3.4 (1) 3.5 (1) 5 3.4 (1) 3.6 (1) 7
Hybrid (NL) 3.6 (3) 3.7 (3) 4 3.6 (3) 3.7 (3) 4
Continental (D) 3.5 (2) 3.6 (2) 3 3.5 (2) 3.6 (2) 2
Continental (F) 4.4 (4) 4.5 (4) 3 4.4 (4) 4.5 (4) 3
Mediterranean (I) 4.8 (5) 4.7 (5) -1 4.8 (5) 4.7 (5) -1
Anglo-Saxon (UK) 5.3 (6) 5.4 (6) 0 5.3 (6) 5.4 (6) 1
* Equivalised household income per person.
Source: ECHP (1999), SCP/CeRP treatment
Based on uniform demographic projections, income inequality will grow slightly in all welfare regimes, apart from the S80/S20-indicator for Italy. As a result, all regimes will maintain the same relative positions in 2025 with respect to 2000. However, the expected increase in inequality in the Nordic regime is greater if the uniform demo-graphic projections are used. Denmark therefore benefits from a favourable demo-

88 Income inequality 89Income inequality
graphic structure in 2025; there are relatively fewer elderly people in Denmark than elsewhere in the European Union. This corresponds to the lower contribution rate in the country-specific variant (see table 4.5). Even for the Netherlands, which has the most deviant demographic structure, the differences in income inequalities in both variants of the baseline scenario are rather small.
The differences between the country-specific and the uniform demography variant are thus rather small. In both variants, all countries are expected to maintain the rela-tive positions in 2025. The income inequality of Denmark remains the lowest of all welfare regimes, while the United Kingdom remains on top with the greatest income inequality. For most countries the three indicators lead to the same conclusions, as the ranking of the countries is the same for both variants. However, as seen ear-lier with the country-specific variant, the indicators are contradictory for France and Italy in the uniform demography variant because income inequality is almost equal in these countries. The Theil coefficient indicates France to be the country with the greater income inequality, while the Gini and S80/S20-coefficients indicate Italy as having greater inequality. In the rest of this chapter, country-specific demographic projections will be used.
5.4 Policy scenarios
In the baseline scenario it is assumed that governments keep their welfare regimes stable. In this scenario, even major changes already made by governments are ignored. To analyse the effects of possible measures, three policy scenarios were defined in chapter 3. First, a participation policy scenario was defined, in which the labour participation rate is raised to the Lisbon targets for employment. In the pen-sion reform scenario, pension levels are adjusted according to the changes as pro-jected by the Economic Policy Committee of the European Commission (ec 2001). The third scenario incorporates the policy measures which governments are expected to take according to their institutional setting. The goal in this scenario is to prevent the social security system from becoming unsustainable, without bringing about a major increase in poverty. Table 3.6 in section 3.4.4 shows the various measures that are assumed to be introduced by the various welfare regimes.
The measures to be taken in the various scenarios also have consequences for the income distribution and poverty rates. In table 5.5 the Gini, Theil and S80/S20-coeffi-cients are presented for the various scenarios and regimes.

88 Income inequality 89Income inequality
Table 5.5 Changes in income inequality, policy scenarios
country baseline participation pension reform institutional reform
2000 2025 2025 2025 2025
Gini coefficient
Nordic (DK) 0.236 0.247 0.245 (-1%) 0.250 (1%) 0.247 (0%)
Hybrid (NL) 0.253 0.260 0.257 (-1%) 0.259 (0%) 0.268 (3%)
Continental (D) 0.246 0.251 0.248 (-1%) 0.255 (1%) 0.265 (5%)
Continental (F) 0.289 0.293 0.284 (-3%) 0.298 (2%) 0.302 (3%)
Mediterranean (I) 0.295 0.299 0.286 (-4%) 0.302 (1%) 0.303 (1%)
Anglo-Saxon (UK) 0.316 0.321 0.318 (-1%) 0.327 (2%) 0.331 (3%)
Theil coefficient
Nordic (DK) 0.104 0.115 0.114 (-0%) 0.117 (2%) 0.115 (0%)
Hybrid (NL) 0.125 0.130 0.127 (-2%) 0.129 (0%) 0.136 (5%)
Continental (D) 0.114 0.119 0.116 (-2%) 0.122 (3%) 0.130 (9%)
Continental (F) 0.162 0.163 0.151 (-7%) 0.169 (4%) 0.173 (6%)
Mediterranean (I) 0.151 0.161 0.150 (-7%) 0.164 (2%) 0.167 (4%)
Anglo-Saxon (UK) 0.183 0.188 0.185 (-2%) 0.195 (3%) 0.198 (5%)
S80/S20-ratio
Nordic (DK) 3.4 3.5 3.5 (-1%) 3.6 (2%) 3.5 (-1%)
Hybrid (NL) 3.6 3.7 3.7 (-2%) 3.7 (-0%) 3.9 (5%)
Continental (D) 3.5 3.6 3.5 (-2%) 3.7 (2%) 3.9 (8%)
Continental (F) 4.4 4.5 4.3 (-6%) 4.7 (3%) 4.8 (6%)
Mediterranean (I) 4.8 4.7 4.4 (-7%) 4.8 (2%) 4.8 (2%)
Anglo-Saxon (UK) 5.3 5.4 5.2 (-2%) 5.6 (4%) 5.7 (7%)
Figures between brackets show the difference compared with the baseline scenario in 2025.
Source: ECHP (1999). SCP/CeRP treatment
The results of the participation scenario show a clear picture of the effect of higher participation: for all regimes and indicators, income inequalities rise less than in the baseline situation. Besides this, in the Continental regime in France and in the Medi-terranean regime, where total employment rates increase most of all the regimes, all income inequality indicators also decrease with respect to the 2000 figures. Accord-ing to this scenario, income inequality in these regimes will decrease slightly up to 2025. Decomposition results (see section A6.2) show that this is mainly due to a lower total ‘within group inequality’. This effect mainly follows from the lower within income inequality of couples. In addition, the ‘between group inequalities’ decline as more people go to work. More people are earning a wage and therefore the size of the group of social security benefit claimants declines. This is favourable for the income inequality as this group have lower incomes on average. Another result is the lower average incomes of double-earner couples with respect to the baseline scenario. Due to the higher employment rate in the participation scenario, more incomes are pooled

90 Income inequality 91Income inequality
and therefore the rise in average income is relatively lower than the rise in incomes within single-person households with an earner.
The higher number of earners in 2010, which follows from the Lisbon employment goals, leads to a higher accumulation of pension rights. Since in most regimes almost all elderly people receive a pension, the higher pension entitlements result in rela-tively higher average pensions in 2025. Thus participation measures lead to a ‘size’ effect for the younger generation (more people at work), but also to an ‘income’ effect for pensioners. This latter phenomenon is one of the main effects in the Mediter-ranean welfare regime: the relative average income position of pensioners improves with respect to the baseline scenario and therefore the between income inequality reduces in Italy. For the Nordic, Anglo-Saxon and hybrid regime of the Netherlands, the main effect explaining the lower income inequalities is the lower within group inequality of wage-earners.
The opposite holds for the pension reform measures (see section 3.3.3). A reduction in benefit levels leads to greater income inequalities, especially in the Continen-tal regime in France and the Anglo-Saxon regime, which have the highest raises of inequality; this is understandable as these countries also had a bigger reduction in benefit levels. However, the rising inequality in the Mediterranean regime, which is also assumed to introduce a major pension reduction, is limited as pension levels are fairly high in this regime. In all regimes apart from the hybrid regime in the Nether-lands, the gap between wage-earners and pensioners (following from the decompo-sition by main income) as well as the (same) gap between younger and older people (following from the decomposition by household type and earner) becomes more relevant; it leads to an increase in the between group inequality and therefore also in the total inequality.
The institutional reform scenario combines a complete package of measures to regu-late the growing contribution rates in the welfare regime. Total inequality does not change in the Nordic regime compare with the projections in the baseline scenario. This regime will mainly introduce measures to raise labour participation. The number of people receiving unemployment, disability or social assistance benefit is assumed to reduce by 20%, while the pension age in raised by two years. As a result, the per-centages of persons depending on one of these types of benefit is reduced. The single exception is the percentage of social assistance beneficiaries; the size of this group rises, in contrast to the assumed reduction, because the former disability and unem-ployment benefit claimants will claim social assistance benefit instead (see section 3.2.8). Following the decomposition by main income components, the increasing within inequality is offset by a decreasing between group inequality due to the higher average incomes of pensioners. This results from the higher pension entitlements

90 Income inequality 91Income inequality
that are granted in the years before 2025. This increases the average pension and nar-rows the gap compared with wage-earners.
For the Continental regime in Germany, the decomposition shows a clear picture. As this regime is assumed to prefer adjustments in the social assistance and unemploy-ment benefit schemes, the size and level of these two provisions is reduced in Ger-many, along with pension levels. As a result the income position of social assistance beneficiaries declines by 6 percentage points (from 44% of total average income to 38%) in 2025 compared with the baseline scenario in 2025. The same thing happens to the average incomes of pensioners and unemployment benefit claimants (both minus 10 percentage points). Thus the income position in particular of households with no earnings deteriorates, which explains the higher income inequalities.
Besides the measures taken by Germany, the Continental regime in France is also assumed to raise the pension age and to reduce their number of disability benefit claimants, since France’s starting point is worse than Germany’s. The increasing gap between groups is again the most dominant. Due to the deteriorating incomes of social security beneficiaries, between group inequality increases by 0.007, making it easily the main effect, as the total inequality increases by 0.010. In France, the aver-age income of pensioners declines by 8 percentage points with respect to the baseline scenario in 2025, and the same applies for unemployment and social assistance bene-fit recipients. Thus the deteriorating incomes of households without earnings are the main explanatory factor behind the greater income inequality.
The Mediterranean regime of Italy is assumed to adjust the number of disability ben-efit claimants as well as the number of pensioners by raising the pension age. As a result, the income inequality is slightly higher than in the baseline scenario in 2025. In both decompositions, the rise in within group inequality is the main effect and the decompositions therefore do not provide a clear insight into the underlying processes to explain the increase I inequality for Italy. A detailed analysis in which the groups are split up by age classes (younger, middle-aged and elderly, together with their earnings status) shows that the middle-aged enter the labour market. As this group receive higher wages on average than the younger wage-earners, the inequality within the group of wage-earners will increase slightly.
In the hybrid regime of the Netherlands, income inequality is 5% (Theil-coefficient) higher than the baseline scenario in 2025. The changing average incomes of the vari-ous groups are the most dominant effect here. The Netherlands is assumed to take all measures, apart from the reduction of unemployment and social assistance benefit levels. These measures mainly result in lower incomes for pensioners, as their average income position is clearly lower in the institutional reform scenario than in the base-line scenario (85% rather than 95%). The same conclusion results from the division

92 Income inequality 93Income inequality
by households and number of earners. The average incomes of persons in households without earnings (including pensioners) decrease in relative terms, and this explains the increasing between group inequality.
For the Anglo-Saxon regime, the income effect on between group inequality is once again the most dominant effect. The United Kingdom introduces measures to reduce the number of social assistance beneficiaries and to lower unemployment benefit and pension levels. The latter is the most important as the size of the pensioners’ group is clearly dominant. The average income of pensioners falls from 78% in the baseline scenario in 2025 to 68% in the institutional reform scenario.
5.5 Conclusions
In 2000, inequality of ‘equivalised’ net household incomes is lowest in the Nordic regime of Denmark and highest in the Anglo-Saxon regime of the United Kingdom. The Netherlands and Germany follow Denmark at a close distance. The regimes of France and Italy hold a middle position, having more inequality than the three former regimes, but less than the United Kingdom.
Under the assumption of stable welfare regimes, the ageing process will lead by 2025 to relatively small increases in income inequality. This is because the income inequali-ties within the various groups (e.g. pensioners, wage-earners) mainly determine the overall income inequality. Therefore, changes in the population composition do not have a large effect on income inequality. As a result, the ranking of the various regimes will not change.
However, the income gap between wage-earners and pensioners is relevant for the growing inequality. This gap is the main reason for the increasing income inequality in the Nordic and Anglo-Saxon regimes. In the other regimes, this income gap is so small that no inequality increase is attributed to this effect. If the gap increases, as in the Mediterranean welfare regime of Italy, this income effect will be the main deter-minant of the increasing inequality. This gap also widens in the Continental regime, but to a much lesser degree.
The participation scenario leads to lower income inequalities for all welfare regimes compared with the baseline scenario in 2025. This effect is especially marked in the Mediterranean and the French Continental welfare regime, since these regimes see the biggest rise in employment. However, the main effects leading to this reduction differ for the two regimes. In France, the decreasing within income inequality of the self-employed and couples is rather dominant. In the Mediterranean regime, the rela-tively higher pension levels of the elderly in 2025 explain the income inequality reduc-tion, due to the greater accrual of pension rights. The higher participation rate in
92 Income inequality 93Income inequality
2010, which follows from the Lisbon employment targets, leads to a greater build-up of pension rights and thus to higher pensions in 2025. This narrows the income gap between pensioners and wage-earners, reducing income inequality. For the Nordic, Anglo-Saxon and hybrid regime of the Netherlands, the main effect explaining the lower income inequalities is the lower within group inequality of wage-earners.
The reduction in pension levels leads to greater inequalities. The Continental regime in France and the Anglo-Saxon regime see the biggest rises in inequality, which is understandable as these countries also introduced bigger reductions in benefit levels.
In the institutional reform scenario, income inequality is greater than in the base-line scenario in 2025 for almost all welfare regimes. This is mainly due to the lower incomes of social security benefit claimants following the adjustments of benefit levels. However, in the Nordic regime the total inequality does not change because of the various measures in the institutional scenario, since this regime will mainly introduce measures which raise labour participation. Following decomposition by main income components, the increasing within group inequality is compensated for by fall in between group inequality due to the higher average incomes of pensioners as a result of the higher pension entitlements granted in the years before 2025. This increases the average pension and narrows the gap relative to wage-earners.

94 Income inequality 95
Notes
1 The Gini-index is defined as �� −=i j
ji xxn
Gµ22
1� where xi
is the income of
person i, µ the arithmetical mean income and n is total population.
2 The Theil-index is defined as )ln(1
µµi
i
i xx
nT �= where xi
is the income of person i, µ
the arithmetical mean income and n is total population.
3 Officially the Theil indicator is not defined for zero incomes as in the formula the
natural logarithm is used. However, in the formula of the Theil-index, the
)ln(µµii xx
-product can be set to zero if xi is zero, as 0)ln(lim0
=↓ µµ
xxx
(see Odink and
Imhoff, 1984).4 A good deal has been written about standardisation using equivalence factors (cf.
Buhmann et al., 1988). In Dutch research – see for example the analyses in the Poverty Monitor which is published bi-annually by scp and Statistics Netherlands – empirical equivalence factors are often used, which Statistics Netherlands derives from budget surveys. Because it cannot simply be assumed that these factors are also applicable for other countries and therefore this would be a less appropriate method for an interna-tional comparative analysis. In one country it may for example be much more difficult for a family with two children to make ends meet than in another country. However, it is beyond the scope of this study to use country-specific equivalence scales.
5 Besides the oecd-equivalence scale, another commonly used equivalence scale is the √n-method. This equivalence factor is determined by taking the square root of the total number of adults and children. For instance, a family with two adults and two children has a scale of √4= 2 whereas the oecd equivalence scale gives a factor of 2.1. The resulting inequality statistics were rather small in comparison with statistics using the oecd-equivalence scale and these results are therefore not presented.
6 Someone is considered an earner if he or she has had wages of self-employed income over one third of the median of these income types.

94 Income inequality 95
6 Redistribution
To some extent, the income inequality figures presented in the previous chapter are the product of welfare state provisions. The differences in incomes that emerged there are partly the result of the ways in which earned income is submitted to taxa-tion, and the way social security benefits are provided by the government. This redis-tribution function is the central topic of this chapter. More specifically, the aim is to ascertain whether the welfare regimes currently differ in the degree of redistribution they attain; and to investigate whether such differences are likely to continue in the future, by looking at the four scenarios presented in chapter 3. One might assume that redistribution will be greater in the Nordic system because of the high level of benefits and the universal target group. For opposite reasons, one could assume redistribution to be rather low under an Anglo-Saxon regime. Redistribution in the Mediterranean regimes could theoretically be expected to be somewhat higher, espe-cially in view of their more extensive pension schemes. In terms of redistribution, the Continental countries could fall somewhere in the middle: less distribution than in the Nordic regime, more than in the Anglo-Saxon type. Following the first dimension of the institutional typology (see figure 2.1), the hybrid case of the Netherlands might be expected to lie between the Continental and Nordic regimes. Before turning to the actual redistribution functions in these different regime types, however, the concept itself requires some clarification.
6.1 The redistribution process
The starting point for a distributional analysis should be the income distribution of gross earned incomes and capital income components such as interest, dividend and rental income. These primary incomes are considered as the incomes of citizens with-out taking into account the provisions of the welfare state. No taxation is considered and no awarding of any social security provisions. Clearly, the income inequality in these primary incomes will be high, as some people have an income (those with earn-ings) while others do not (the unemployed, the elderly).
These primary incomes can be considered as the incomes of citizens that would be made on market if there were no interference by the government. Note that this is a rather theoretical concept. First, if there were no social allowances, former social security benefit claimants would still have to make a living and, as a consequence, they would accept a (low-paid) job. The number of earners would therefore increase, thus reducing the income inequality. Social security therefore theoretically influences the primary income distribution as well. Another way in which primary incomes are influenced is through taxation. The net income position of an employee is more likely to be decisive in wage negotiations than gross income. A higher tax or contribution

96 Redistribution 97Redistribution
rate levied by the government is frequently followed by a higher gross wage claim, which changes primary incomes.
Primary income may be defined as income from work or capital: wages, self-employed income and capital income. These primary incomes are redistributed to net incomes in two ways. First, taxation and the levying of contributions are used to raise money. This taxation is often used as part of an incomes policy as tax rates are gener-ally higher for the higher incomes and lower for lower incomes. As a result, the share of the tax take paid by the higher incomes is higher in relation to their incomes than is the share paid by the lower incomes in relation to their income. This can be called a progressive system. A progressive taxation system reduces the income inequality in a society since the higher incomes pay relatively more. However, taxation and the levy-ing of contributions are not always progressive. Contribution rates for specific pro-visions such as unemployment are often set at a fixed percentage of wages. In some cases it is even possible for taxation and contributions to be regressive; this may occur if there is a contribution ceiling or if a fixed contribution amount is applied through which the higher incomes pay relatively less.
Social security benefits are the second way through which primary incomes are redis-tributed. These allowances are mostly distributed to citizens with low or no income. As a result, social security benefits are, like most tax systems, progressive: the share of the benefits received by the lower incomes is higher in relation to their incomes than the share received by higher incomes.1 It is important to note that progressivity is related to proportionality with primary income. Suppose, for example, the poorest 25% of households earn 5% of total primary income and the richest 25% earn 50% of total primary income. If the poorest 25% of households receive 10% of all benefits and the wealthiest 25% of households receive 20%, then the higher incomes receive more benefit per person in absolute terms. However, social security benefits are still progressive because the poor receive more in relation to their primary incomes.
Unfortunately, the echp database used in this project does not provide information on individual taxes and contributions paid or on benefits in kind. It is therefore not possible to analyse the taxation effect in this study. However, the influence of taxa-tion on income inequality is relatively small. The study On Worlds of Welfare (Wilde-boer Schut et al., p 64) showed for ten countries the minimum and maximum effect of the income inequality reductions due to the progressivity of taxation. The mini-mum was 7% for Sweden and the maximum was 17% for Belgium. In comparison with the effects of social security, these percentages can be considered small because the effects due to social security benefits were at least 28% (United States), rising to a maximum of 46% (Belgium).
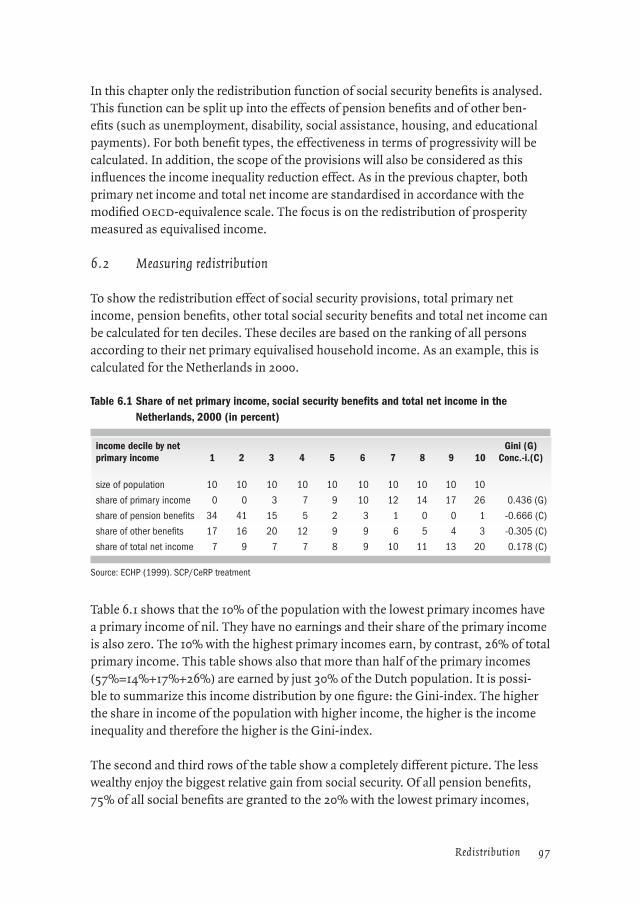
96 Redistribution 97Redistribution
In this chapter only the redistribution function of social security benefits is analysed. This function can be split up into the effects of pension benefits and of other ben-efits (such as unemployment, disability, social assistance, housing, and educational payments). For both benefit types, the effectiveness in terms of progressivity will be calculated. In addition, the scope of the provisions will also be considered as this influences the income inequality reduction effect. As in the previous chapter, both primary net income and total net income are standardised in accordance with the modified oecd-equivalence scale. The focus is on the redistribution of prosperity measured as equivalised income.
6.2 Measuring redistribution
To show the redistribution effect of social security provisions, total primary net income, pension benefits, other total social security benefits and total net income can be calculated for ten deciles. These deciles are based on the ranking of all persons according to their net primary equivalised household income. As an example, this is calculated for the Netherlands in 2000.
Table 6.1 Share of net primary income, social security benefits and total net income in the Netherlands, 2000 (in percent)
income decile by net primary income 1 2 3 4 5 6 7 8 9 10
Gini (G)Conc.-i.(C)
size of population 10 10 10 10 10 10 10 10 10 10
share of primary income 0 0 3 7 9 10 12 14 17 26 0.436 (G)
share of pension benefits 34 41 15 5 2 3 1 0 0 1 -0.666 (C)
share of other benefits 17 16 20 12 9 9 6 5 4 3 -0.305 (C)
share of total net income 7 9 7 7 8 9 10 11 13 20 0.178 (C)
Source: ECHP (1999). SCP/CeRP treatment
Table 6.1 shows that the 10% of the population with the lowest primary incomes have a primary income of nil. They have no earnings and their share of the primary income is also zero. The 10% with the highest primary incomes earn, by contrast, 26% of total primary income. This table shows also that more than half of the primary incomes (57%=14%+17%+26%) are earned by just 30% of the Dutch population. It is possi-ble to summarize this income distribution by one figure: the Gini-index. The higher the share in income of the population with higher income, the higher is the income inequality and therefore the higher is the Gini-index.
The second and third rows of the table show a completely different picture. The less wealthy enjoy the biggest relative gain from social security. Of all pension benefits, 75% of all social benefits are granted to the 20% with the lowest primary incomes,
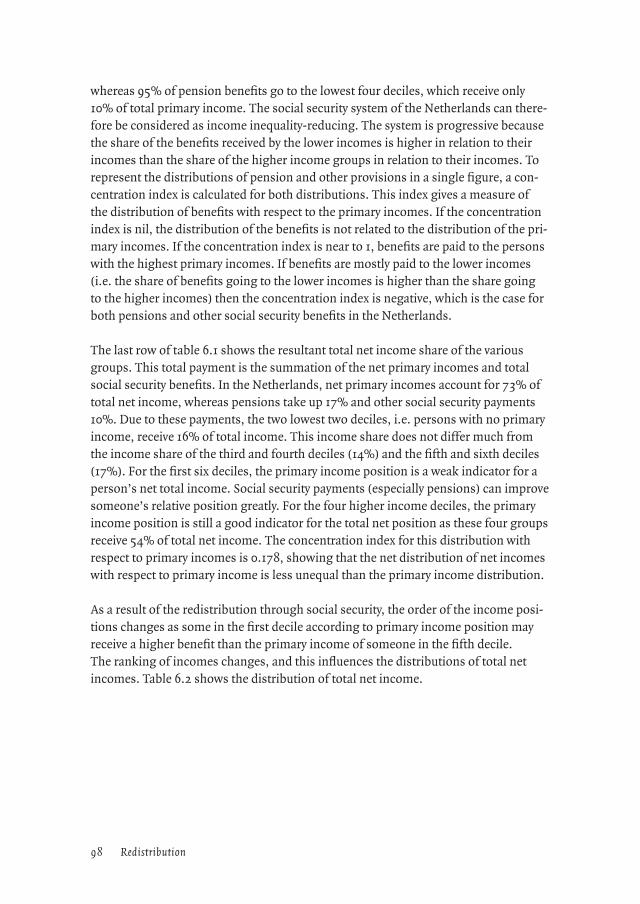
98 Redistribution 99Redistribution
whereas 95% of pension benefits go to the lowest four deciles, which receive only 10% of total primary income. The social security system of the Netherlands can there-fore be considered as income inequality-reducing. The system is progressive because the share of the benefits received by the lower incomes is higher in relation to their incomes than the share of the higher income groups in relation to their incomes. To represent the distributions of pension and other provisions in a single figure, a con-centration index is calculated for both distributions. This index gives a measure of the distribution of benefits with respect to the primary incomes. If the concentration index is nil, the distribution of the benefits is not related to the distribution of the pri-mary incomes. If the concentration index is near to 1, benefits are paid to the persons with the highest primary incomes. If benefits are mostly paid to the lower incomes (i.e. the share of benefits going to the lower incomes is higher than the share going to the higher incomes) then the concentration index is negative, which is the case for both pensions and other social security benefits in the Netherlands.
The last row of table 6.1 shows the resultant total net income share of the various groups. This total payment is the summation of the net primary incomes and total social security benefits. In the Netherlands, net primary incomes account for 73% of total net income, whereas pensions take up 17% and other social security payments 10%. Due to these payments, the two lowest two deciles, i.e. persons with no primary income, receive 16% of total income. This income share does not differ much from the income share of the third and fourth deciles (14%) and the fifth and sixth deciles (17%). For the first six deciles, the primary income position is a weak indicator for a person’s net total income. Social security payments (especially pensions) can improve someone’s relative position greatly. For the four higher income deciles, the primary income position is still a good indicator for the total net position as these four groups receive 54% of total net income. The concentration index for this distribution with respect to primary incomes is 0.178, showing that the net distribution of net incomes with respect to primary income is less unequal than the primary income distribution.
As a result of the redistribution through social security, the order of the income posi-tions changes as some in the first decile according to primary income position may receive a higher benefit than the primary income of someone in the fifth decile. The ranking of incomes changes, and this influences the distributions of total net incomes. Table 6.2 shows the distribution of total net income.
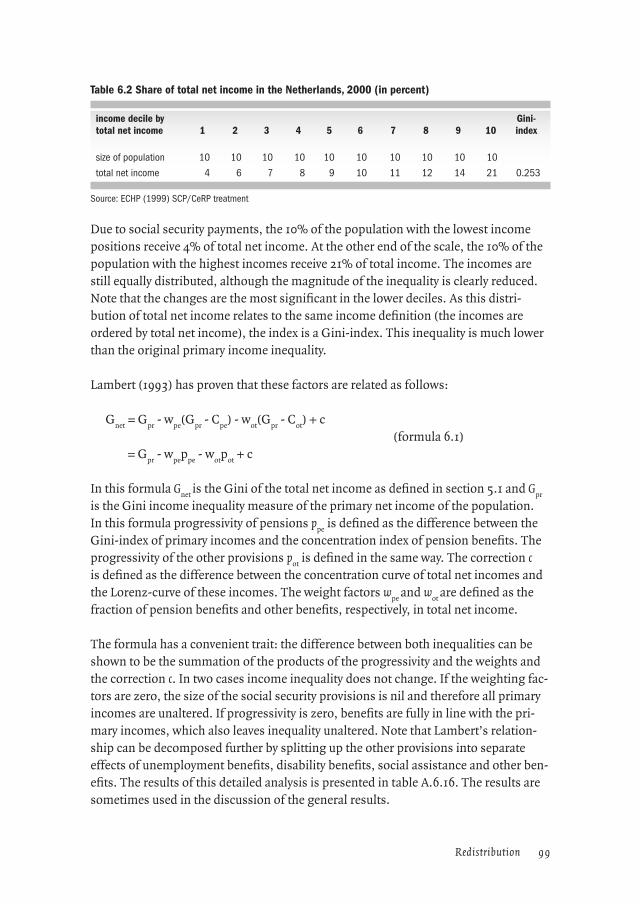
98 Redistribution 99Redistribution
Table 6.2 Share of total net income in the Netherlands, 2000 (in percent)
income decile by total net income 1 2 3 4 5 6 7 8 9 10
Gini-index
size of population 10 10 10 10 10 10 10 10 10 10
total net income 4 6 7 8 9 10 11 12 14 21 0.253
Source: ECHP (1999) SCP/CeRP treatment
Due to social security payments, the 10% of the population with the lowest income positions receive 4% of total net income. At the other end of the scale, the 10% of the population with the highest incomes receive 21% of total income. The incomes are still equally distributed, although the magnitude of the inequality is clearly reduced. Note that the changes are the most significant in the lower deciles. As this distri-bution of total net income relates to the same income definition (the incomes are ordered by total net income), the index is a Gini-index. This inequality is much lower than the original primary income inequality.
Lambert (1993) has proven that these factors are related as follows:
In this formula Gnet
is the Gini of the total net income as defined in section 5.1 and Gpr
is the Gini income inequality measure of the primary net income of the population. In this formula progressivity of pensions p
pe is defined as the difference between the
Gini-index of primary incomes and the concentration index of pension benefits. The progressivity of the other provisions p
ot is defined in the same way. The correction c
is defined as the difference between the concentration curve of total net incomes and the Lorenz-curve of these incomes. The weight factors w
pe and w
ot are defined as the
fraction of pension benefits and other benefits, respectively, in total net income.
The formula has a convenient trait: the difference between both inequalities can be shown to be the summation of the products of the progressivity and the weights and the correction c. In two cases income inequality does not change. If the weighting fac-tors are zero, the size of the social security provisions is nil and therefore all primary incomes are unaltered. If progressivity is zero, benefits are fully in line with the pri-mary incomes, which also leaves inequality unaltered. Note that Lambert’s relation-ship can be decomposed further by splitting up the other provisions into separate effects of unemployment benefits, disability benefits, social assistance and other ben-efits. The results of this detailed analysis is presented in table A.6.16. The results are sometimes used in the discussion of the general results.
(formula 6.1)G
net = G
pr - w
pe(G
pr - C
pe) - w
ot(G
pr - C
ot) + c
= Gpr
- wpe
ppe
- wot
pot
+ c

100 Redistribution 101Redistribution
6.3 Current redistribution
In this section, the current redistribution effects in the different regimes are analysed. Table 6.3 shows the main findings. The redistribution effects of social security are split between the impact of pension and of other welfare state provisions (unemploy-ment, disability, social assistance and other benefits).
Table 6.3 Redistribution in various welfare regimes (2000)
pensions other arrangements
Gini primary income
(ranking)
Gini total net income (ranking)
inequality reduction*
(ranking) weight progres-
sivity weight progres-
sivitycorrection
factor
Nordic (DK) 0.417 (1) 0.236 (1) 0.181 (4) 0.13 1.03 0.12 0.74 0.037
Hybrid (NL) 0.436 (2) 0.253 (3) 0.183 (3) 0.17 1.10 0.10 0.74 0.075
Continental (D) 0.444 (3) 0.246 (2) 0.198 (2) 0.21 1.01 0.09 0.63 0.068
Continental (F) 0.489 (6) 0.289 (4) 0.200 (1) 0.22 1.03 0.09 0.70 0.083
Mediterranean (I) 0.465 (4) 0.295 (5) 0.170 (5) 0.26 0.85 0.03 0.74 0.078
Anglo-Saxon (UK) 0.475 (5) 0.316 (6) 0.159 (6) 0.15 0.91 0.08 0.83 0.045
* Inequality reduction is the product of the weight and progressivity of pensions plus the product and the weight and progres-sivity of the other provisions minus the correction factor (For Denmark: 0.181 = 0.13*1.03 + 0.12*0.74 – 0.037).
Source: ECHP (1999) SCP/CeRP treatment
The starting point for the redistribution analysis is the primary income inequality. This inequality is the lowest in the Nordic regime of Denmark. This follows from one of the main characteristics of the regime, namely the high labour participation. Many people have a job and therefore primary income inequality is relatively low. On the other hand, primary income inequality is highest in France due to the high proportion of pensioners. The primary income inequality of the Anglo-Saxon regime is mainly due to the higher income inequality among the working population.
In line with expectations, the income inequality-reduction effect in the Anglo-Saxon regime is the lowest of all regimes, amounting to about one third of the primary income inequality. As a result, the Anglo-Saxon regime has the highest net income inequality of all regimes. This low reduction follows both from the small weight of pensions and the low weight of the other provisions, which is typical for the Anglo-Saxon welfare regime.
The progressivity of pensions in the Anglo-Saxon regime is the second lowest of all regimes. The main explanation for this is the fact that many pensioners in the United Kingdom have a capital income as an additional pension provision. As a conse-quence, pensions are not typically provided to the elderly without any primary income and, as a result, progressivity is moderate in the Anglo-Saxon regime. On the other

100 Redistribution 101Redistribution
hand, the progressivity of other benefits is the highest of all countries (0.83). This is related to the strict targeting of benefits in the Anglo-Saxon regime; this regime pro-vides only means-tested benefits for the demonstrably needy: those with no other source of income.
The second lowest income inequality reduction is in the Mediterranean regime. As a result, this regime has the second highest net income inequality. The weights in the income share are typical for the Mediterranean regimes. The share of pensions in total income is the highest of all regimes (0.26), while the share of the other provi-sions is the lowest of all regimes (0.03). The low income inequality reduction follows mainly from the low progressivity of pensions. The Mediterranean regime grants a relatively small proportion of pensions to the lower primary incomes. For instance: in the Nordic, hybrid and Continental regimes more than 86% of pension benefits are paid to the 40% with the lowest primary incomes. In the Mediterranean regime, it is just 69% while in the Anglo-Saxon regime it is 77%. Progressivity of pensions is therefore rather low in the Mediterranean regime. The progressivity of the other Med-iterranean schemes can be considered as moderate. This follows from the high share of disability benefits compared with the other regimes. This provision has a high pro-gressivity because disabled people often do not participate in the labour market and therefore have no primary income.
The income inequality reduction is greatest in the Continental regime: 0.198 for Ger-many and 0.200 for France. As a result, both countries have a lower ranking in terms of net income inequality. Germany has the second lowest inequality while France moves up from sixth to fourth position. The high income inequality reductions mainly follow from the pension schemes. In this regime, the expenditure on pensions can be described as moderate to high but, in contrast to the Mediterranean regime, the progressivity is also high. In Germany and France, receiving a pension is more strictly related to withdrawal from the labour market. This results in a high redistri-bution effect in the Continental regime. The expenditure on other schemes can be described as modest in these countries. The progressivity of these benefits is typically low in Germany. This is due to the large share of benefits like education allowances and housing benefits in Germany. As these are not typically provided to the lower incomes the progressivity is low, resulting in a moderate redistribution effect of the other provisions.
In the Netherlands, the representative of a hybrid regime in this study, income inequality reduction holds the middle ground between the Continental regime and the Anglo-Saxon and Mediterranean regimes. As a result, the ranking of the Nether-lands declines from second to third position in net income inequality. This moderate redistribution effect mainly follows from the modest share of pensions in total net income (0.17). The progressivity of these benefits is in line with the Continental and
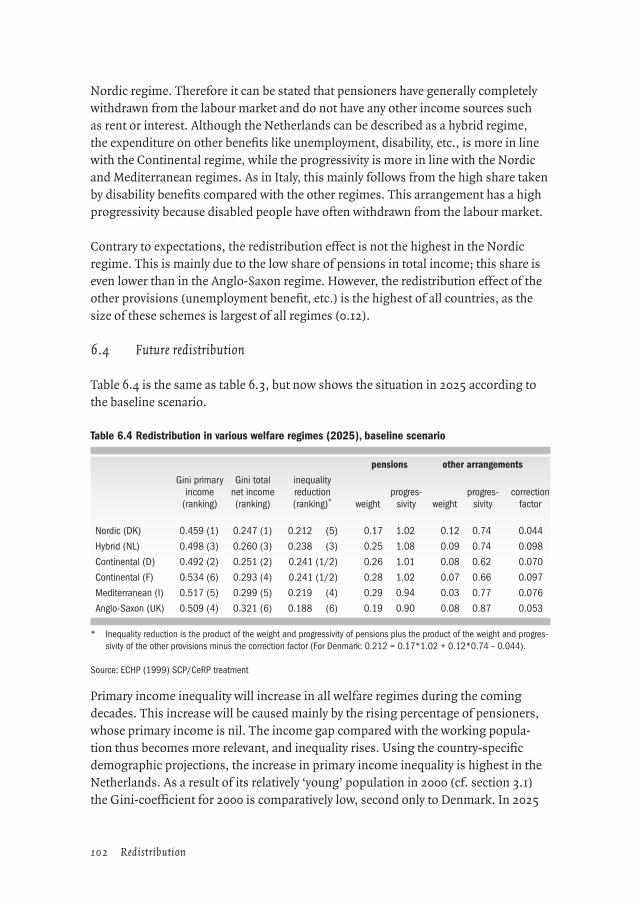
102 Redistribution 103Redistribution
Nordic regime. Therefore it can be stated that pensioners have generally completely withdrawn from the labour market and do not have any other income sources such as rent or interest. Although the Netherlands can be described as a hybrid regime, the expenditure on other benefits like unemployment, disability, etc., is more in line with the Continental regime, while the progressivity is more in line with the Nordic and Mediterranean regimes. As in Italy, this mainly follows from the high share taken by disability benefits compared with the other regimes. This arrangement has a high progressivity because disabled people have often withdrawn from the labour market.
Contrary to expectations, the redistribution effect is not the highest in the Nordic regime. This is mainly due to the low share of pensions in total income; this share is even lower than in the Anglo-Saxon regime. However, the redistribution effect of the other provisions (unemployment benefit, etc.) is the highest of all countries, as the size of these schemes is largest of all regimes (0.12).
6.4 Future redistribution
Table 6.4 is the same as table 6.3, but now shows the situation in 2025 according to the baseline scenario.
Table 6.4 Redistribution in various welfare regimes (2025), baseline scenario
pensions other arrangements
Gini primary income
(ranking)
Gini total net income (ranking)
inequality reduction(ranking)* weight
progres-sivity weight
progres-sivity
correction factor
Nordic (DK) 0.459 (1) 0.247 (1) 0.212 (5) 0.17 1.02 0.12 0.74 0.044
Hybrid (NL) 0.498 (3) 0.260 (3) 0.238 (3) 0.25 1.08 0.09 0.74 0.098
Continental (D) 0.492 (2) 0.251 (2) 0.241 (1/2) 0.26 1.01 0.08 0.62 0.070
Continental (F) 0.534 (6) 0.293 (4) 0.241 (1/2) 0.28 1.02 0.07 0.66 0.097
Mediterranean (I) 0.517 (5) 0.299 (5) 0.219 (4) 0.29 0.94 0.03 0.77 0.076
Anglo-Saxon (UK) 0.509 (4) 0.321 (6) 0.188 (6) 0.19 0.90 0.08 0.87 0.053
* Inequality reduction is the product of the weight and progressivity of pensions plus the product of the weight and progres-sivity of the other provisions minus the correction factor (For Denmark: 0.212 = 0.17*1.02 + 0.12*0.74 – 0.044).
Source: ECHP (1999) SCP/CeRP treatment
Primary income inequality will increase in all welfare regimes during the coming decades. This increase will be caused mainly by the rising percentage of pensioners, whose primary income is nil. The income gap compared with the working popula-tion thus becomes more relevant, and inequality rises. Using the country-specific demographic projections, the increase in primary income inequality is highest in the Netherlands. As a result of its relatively ‘young’ population in 2000 (cf. section 3.1) the Gini-coefficient for 2000 is comparatively low, second only to Denmark. In 2025
102 Redistribution 103Redistribution
this favourable position will have deteriorated and as a result the hybrid regime of the Netherlands will take third place, after the regimes of Denmark and Germany.
Table 6.4 shows a clear conclusion, namely that the redistribution function of all wel-fare regimes will become more pronounced in the coming decades, and almost com-pletely compensates for the increasing inequality of primary incomes. As a result, the net income inequality increase up to 2025 is fairly modest. The increase in the weight-ing of pensions is the main factor here; in all regimes, the share of pensions in total income, and therefore the income redistribution effect, increases.
The size and progressivity of the other benefits will not change much in the next few decades. This follows from the assumption in the baseline scenario that welfare states will remain stable over this period. Moreover, the ageing process does not have a major impact on public spending in these welfare states. As a result, the differences in terms of welfare regimes will not change much for the unemployment, disability, social assistance and other benefits.
In both Continental countries the income inequality-reducing effect increases to 0.241. Note that this figure was 0.198 for Germany and 0.200 for France in 2000, which therefore see an increase of more than 20%. The Continental regime will also see the biggest reduction in income inequality in 2025, mainly due to the higher spending on pensions up to 2025.
In the Netherlands, the share of pensions in total income rises sharply, from 17% to 25% of total net income. This is a result of the deterioration in the favourable age structure of Dutch society in 2000. The costs of the Dutch hybrid welfare regime will therefore rise sharply, as was also pointed out in section 3.1. On the other hand, the redistribution function will also increase; it nearly matches the high income inequal-ity reduction of the Continental regimes and passes the Mediterranean regime in terms of total redistribution.
The increase in expenditure on pensions in the Mediterranean regime can be consid-ered as modest; the share of pensions in total income increases by only 3 percent-age points, from 26% to 29%. The progressivity of pensions is also increasing in this regime, as pensions go more to people with lower incomes.
In 2025, the Nordic regimes will have achieved the second lowest income inequality reduction of all countries analysed. This follows from the relatively low share taken by pension benefits. Although expenditure on other benefits is high in this regime, this does not compensate for the small share of pension benefits in total income (0.17). However, the primary income inequality is still the lowest of all regimes, and as a result Denmark will still have the lowest net income inequality in 2025.

104 Redistribution 105Redistribution
In terms of redistribution, the Anglo-Saxon regime will continue to hold its position in 2025. Due to the low expenditure on pensions and other welfare state provisions, the redistribution function in this welfare regime is the lowest of all. In contrast to the Med-iterranean regime, the progressivity of pensions does not increase. The reason for the low progressivity lies in additional capital income; both older (65 and over) and middle-aged pensioners have this source of income, and therefore no change is to be expected.
6.5 Effects of demographic differences
Table 6.3 shows that ageing has a major effect on primary income inequality and inequality reduction. The ageing process varies in each of the countries, and this vary-ing ageing effect influences the inequality of primary incomes and the redistribution. Table 6.5 therefore presents the analysis using uniform demographics.
Table 6.5 Redistribution in baseline scenario, using uniform demographic projections
pensions other arrangements
Gini prim. income
(ranking)
Gini tot. net income (ranking)
inequality reduction (ranking) weight
progres-sivity weight
progres-sivity
correction factor
2000
Nordic (DK) 0.422 (1) 0.237 (1) 0.185 (4) 0.13 1.03 0.12 0.74 0.039
Hybrid (NL) 0.457 (3) 0.252 (3) 0.205 (1) 0.20 1.09 0.10 0.73 0.085
Continental (D) 0.442 (2) 0.246 (2) 0.196 (3) 0.21 1.01 0.09 0.61 0.070
Continental (F) 0.486 (6) 0.287 (4) 0.199 (2) 0.22 1.03 0.08 0.68 0.084
Mediterranean (I) 0.458 (4) 0.296 (5) 0.162 (5) 0.25 0.85 0.03 0.73 0.077
Anglo-Saxon (UK) 0.474 (5) 0.316 (6) 0.158 (6) 0.15 0.91 0.08 0.84 0.046
2025
Nordic (DK) 0.469 (1) 0.250 (1) 0.219 (4) 0.18 1.02 0.11 0.74 0.045
Hybrid (NL) 0.505 (3) 0.259 (3) 0.246 (1) 0.26 1.08 0.09 0.74 0.106
Continental (D) 0.488 (2) 0.251 (2) 0.237 (3) 0.26 1.02 0.08 0.61 0.073
Continental (F) 0.530 (6) 0.291 (4) 0.239 (2) 0.28 1.02 0.07 0.65 0.096
Mediterranean (I) 0.506 (4) 0.298 (5) 0.208 (5) 0.28 0.93 0.03 0.77 0.078
Anglo-Saxon (UK) 0.511 (5) 0.322 (6) 0.189 (6) 0.20 0.90 0.07 0.87 0.052
Source: ECHP (1999) SCP/CeRP treatment
The hybrid welfare regime in the Netherlands shows the most divergent picture with respect to the country-specific analysis. This regime has in principle the highest income inequality-reducing effect in 2000, rather than the Continental regime in the country-specific variant. This is mainly because of the high progressivity of the Dutch system in combination with a higher weight of social security due to the type of wel-fare regime. If the Netherlands had the same demographic profile as the average of the eu-15 countries, about 20% of incomes would be provided by pensions and 10%
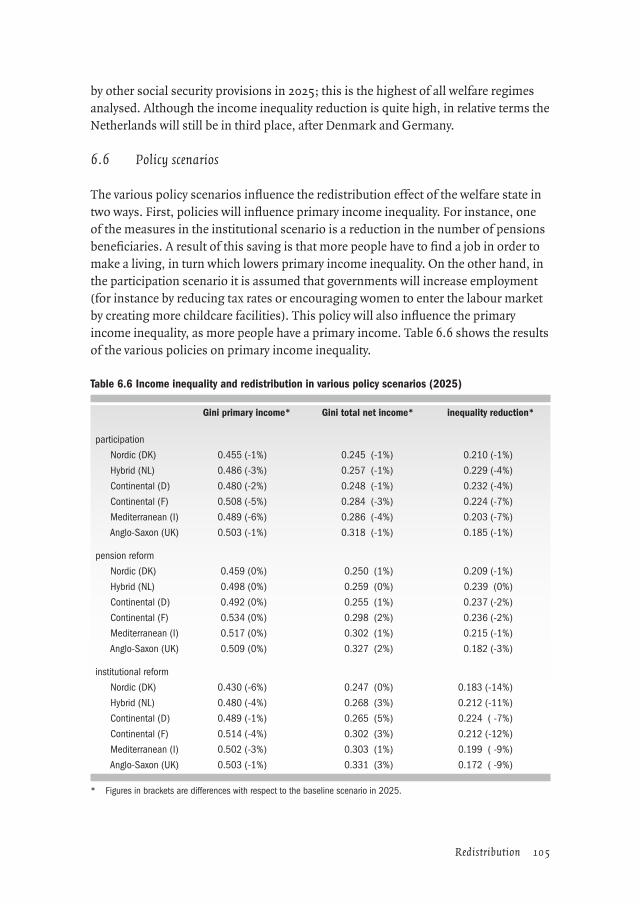
104 Redistribution 105Redistribution
by other social security provisions in 2025; this is the highest of all welfare regimes analysed. Although the income inequality reduction is quite high, in relative terms the Netherlands will still be in third place, after Denmark and Germany.
6.6 Policy scenarios
The various policy scenarios influence the redistribution effect of the welfare state in two ways. First, policies will influence primary income inequality. For instance, one of the measures in the institutional scenario is a reduction in the number of pensions beneficiaries. A result of this saving is that more people have to find a job in order to make a living, in turn which lowers primary income inequality. On the other hand, in the participation scenario it is assumed that governments will increase employment (for instance by reducing tax rates or encouraging women to enter the labour market by creating more childcare facilities). This policy will also influence the primary income inequality, as more people have a primary income. Table 6.6 shows the results of the various policies on primary income inequality.
Table 6.6 Income inequality and redistribution in various policy scenarios (2025)
Gini primary income* Gini total net income* inequality reduction*
participation
Nordic (DK) 0.455 (-1%) 0.245 (-1%) 0.210 (-1%)
Hybrid (NL) 0.486 (-3%) 0.257 (-1%) 0.229 (-4%)
Continental (D) 0.480 (-2%) 0.248 (-1%) 0.232 (-4%)
Continental (F) 0.508 (-5%) 0.284 (-3%) 0.224 (-7%)
Mediterranean (I) 0.489 (-6%) 0.286 (-4%) 0.203 (-7%)
Anglo-Saxon (UK) 0.503 (-1%) 0.318 (-1%) 0.185 (-1%)
pension reform
Nordic (DK) 0.459 (0%) 0.250 (1%) 0.209 (-1%)
Hybrid (NL) 0.498 (0%) 0.259 (0%) 0.239 (0%)
Continental (D) 0.492 (0%) 0.255 (1%) 0.237 (-2%)
Continental (F) 0.534 (0%) 0.298 (2%) 0.236 (-2%)
Mediterranean (I) 0.517 (0%) 0.302 (1%) 0.215 (-1%)
Anglo-Saxon (UK) 0.509 (0%) 0.327 (2%) 0.182 (-3%)
institutional reform
Nordic (DK) 0.430 (-6%) 0.247 (0%) 0.183 (-14%)
Hybrid (NL) 0.480 (-4%) 0.268 (3%) 0.212 (-11%)
Continental (D) 0.489 (-1%) 0.265 (5%) 0.224 ( -7%)
Continental (F) 0.514 (-4%) 0.302 (3%) 0.212 (-12%)
Mediterranean (I) 0.502 (-3%) 0.303 (1%) 0.199 ( -9%)
Anglo-Saxon (UK) 0.503 (-1%) 0.331 (3%) 0.172 ( -9%)
* Figures in brackets are differences with respect to the baseline scenario in 2025.

106 Redistribution 107Redistribution
Table 6.6 presents a clear conclusion with respect to primary income inequality. This inequality is lower in the participation and the institutional reform scenarios, but remains unchanged in the pension reform scenario. The redistribution effect is low-ered in all regimes in all scenarios, apart from the Netherlands in the pension reform scenario.
The unchanging primary income inequality in the pension reform scenario results from the unchanged labour participation rates with respect to the baseline scenario (see table 4.3), which means that the sources of primary income do not change. In the participation scenario, more people earn an income; as the ratio between earners and non-earners strongly influences primary income inequality, this inequality will decline. In France and Italy especially, the representatives of the welfare regimes with the lowest labour participation in 2000, primary income inequality declines by about 5% with respect to the baseline scenario in 2025.
The same line of reasoning can be used in the institutional reform scenario. As in the participation scenario, labour participation rates are higher and as a result primary income inequalities decline because of the institutional reforms. The biggest income inequality reduction is in Denmark, which focuses mainly on measures that increase labour participation in this scenario. The modest decreases in France, Italy and Neth-erlands mainly follow from the raising of the pension age that is assumed in these countries. In terms of labour participation, this measure is one of the more effec-tive, since more workers remain in the labour market. Reducing the number of dis-ability or unemployment benefit claimants is generally less effective, as these former recipients are more likely to apply for social assistance benefit than to seek to earn an income.
Another important conclusion is that the redistribution effect in the various scenarios is lower in comparison with the baseline scenario. The Netherlands in the pension reform scenario is once again the exception in this. As a result, the effect of lower pri-mary income inequalities is reduced in the high participation scenario. For instance, whereas primary income inequality is reduced by 3% in the hybrid regime, net income equality is only 1% lower with respect to the baseline scenario. In the institutional reform scenario, the effect of lower primary income inequalities is reversed because of the smaller welfare regimes. As a result, net income inequality increases. In the pension reform scenario, it is the smaller income inequality reduction which explains the higher net income inequality.
In the various scenarios, the order of the welfare regimes in terms of redistribution sometimes changes. However, there is one constant factor: the Anglo-Saxon regime will have the lowest income inequality reduction in 2025 in all scenarios. The Con-tinental regime of France, which had the highest income inequality reduction in the

106 Redistribution 107Redistribution
baseline scenario, takes third position in the participation scenario. This is because of the relatively high rise in employment which is assumed in this scenario (see table 4.2). As a result, the size of the French welfare state declines and with it the income inequality redistribution effect. The same line of reasoning holds for the Mediter-ranean regime in Italy. It is assumed that employment will increase here and as the result the redistribution effect will decline because fewer people will need social security benefit. The smaller income inequality reduction leads to the second lowest income inequality reduction overall, as the Mediterranean regime will pass the Nordic regime.
In the pension reform scenario, the hybrid regime of the Netherlands will have the highest income inequality reduction. This regime passes both representatives of the Continental regime, France and Germany. The higher income inequality reduc-tion follows from the assumed increase in pension benefits in the Netherlands. All other regimes are assumed to reduce pension levels. The order of the other regimes is maintained.
In the institutional scenario, it is assumed that welfare regimes choose measures in line with their institutional setting to meet the increasing costs of pensions. Some regimes (Anglo-Saxon and Mediterranean) only have to take two or three measures, whereas other regimes (Continental and Hybrid) have to take five or more measures. France has the hardest task, as it has to introduce seven measures. As a result, the redistribution effect is lower in all regimes with respect to the baseline scenario. An important conclusion is that the positions of the various regimes are fairly stable. The Anglo-Saxon regime has the lowest income inequality reduction, followed by the Mediterranean regime, the Nordic regime, the hybrid regime and the Continental regime. The position of the Continental regime of France is somewhat different: due to the many measures the redistribution effect is comparable with the hybrid regime of the Netherlands.
Table 6.7 shows the five explanatory factors for the changes in the extent of income redistribution. Note that tables with projected weights, progressivity measures and correction factors are presented in annex A6.

108 Redistribution 109Redistribution
Table 6.7 Income inequality reduction and the explanatory factors in the policy scenarios in 2025 (x1000)
Δ income inequality reduction
explanatory factors
Δ weightpensions
Δ pro-gressivity pensions
Δ weight benefits
Δ progres-sivity other
benefits
Δ cor-rection factor
participation
Nordic (DK) -2 1 0 -3 -0 0
Hybrid (NL) -9 -4 -1 -2 -2 -1
Continental (D) -9 -5 1 -2 -1 -2
Continental (F) -17 -8 0 -2 -3 -4
Mediterranean (I) -16 -8 -2 -1 -1 -4
Anglo-Saxon (UK) -2 0 0 -2 0 0
pension reform
Nordic (DK) -3 -7 0 1 0 3
Hybrid (NL) 1 6 -1 -1 0 -4
Continental (D) -4 -13 0 1 0 8
Continental (F) -5 -27 0 2 0 21
Mediterranean (I) -3 -9 0 0 0 6
Anglo-Saxon (UK) -6 -17 0 2 0 10
institutional reform
Nordic (DK) -29 -11 3 -17 -2 -3
Hybrid (NL) -26 -55 5 -8 5 27
Continental (D) -17 -32 0 -4 -1 20
Continental (F) -30 -48 4 -8 0 23
Mediterranean (I) -20 -27 3 -2 1 5
Anglo-Saxon (UK) -16 -27 0 -2 -1 15
In the Nordic regime, the income inequality reduction is 0.002 lower according to the participation scenario compared with the baseline scenario in 2025. Of this change, 0.003 can be explained by a lower weight of the other provisions. The differences for the Nordic and Anglo-Saxon regimes are fairly small in the participation scenario; the main effect is the slightly higher employment rate of the younger population, which results in a smaller fraction of the other provisions in total net income. It is striking that pensions show an increasing redistribution effect for the Nordic regime. As more people will be working in 2010, total pension benefits are higher in 2025, as people will have built up more pension entitlements over the years; the pension redistribu-tion effect is therefore higher. In the other regimes, the smaller redistribution effect is due to a smaller weight of pensions. These regimes will raise the employment rate of middle-aged people by up to 50% according to the employment targets of the Lisbon Treaty; this means that fewer pensions have to be paid, resulting in a lower income inequality reduction effect.

108 Redistribution 109Redistribution
In the pension reform scenario, pension benefits are reduced in all welfare regimes except the hybrid regime. As expected, the table shows the pension effect to be the main determinant of change in the inequality reduction. The small effects of chang-ing progressivity parameters can be explained by the relative stability of these param-eters. The reduction in pensions as defined in the pension reform scenario affects all pensioners at the same rate. If a pension saving were to be targeted at a specific group (e.g. wealthy pensioners), the progressivity would be expected to increase. In the assumed scenario, however, no specific group is targeted and therefore the composi-tion of this group is not altered. As a result, the progressivity is fairly stable.
The same holds for the measures in the institutional reform scenario. As these are general reductions, the remaining beneficiaries have the same characteristics as the former group of recipients. Therefore the effect in terms of changing progressiv-ity is small. The pension effect is once again the most dominant effect for almost all regimes. All regimes will take measures on pensions (either reducing pension ben-efits or raising the pension age) and these measures have the biggest impact because the amount of spending on pensions is high. In this scenario, it is assumed that France and the Netherlands will adjust both pension benefits and the pension age. As a result, the decrease of the redistribution effect of pensions is the highest in these welfare states. In contrast to the other regimes, the lower distribution effect of pen-sions is not the dominant factor in the Nordic regime. Since in this regime the weight of the other provisions is relatively large, the effect of the reductions in the number of recipients unemployment, social assistance and disability benefits is greater than the effect of raising the pension age.
6.7 Conclusions
Net income inequality is determined by two components: the income inequality at the level of primary income (earned and capital incomes) and social security provisions. Both aspects differ across the various regimes. Unfortunately, it was not possible to analyse the redistribution function of taxes, social insurance premiums and benefits in kind.
Primary income inequality is highest in the Continental regime in France and lowest in the Nordic regime. The latter follows from the high labour participation in this regime. Although France and Germany belong to the same regime, the primary income inequalities of these countries differ markedly. Whereas France has a high primary income inequality, Germany has the third lowest, after the Nordic regime and the hybrid regime. In 2025, Germany actually holds the second lowest position as it passes the hybrid regime. The Anglo-Saxon regime and the Mediterranean regime generally have the higher income inequalities.

110 Redistribution 111Redistribution
Measured as a fraction of total net income, the provision of income through social security is greatest in the Continental, Mediterranean and hybrid regimes, mainly due to the large fraction of pensions in the provisions. If pensions are left out of consid-eration, the Nordic regime becomes the largest, which is in line with the characteri-sation by Esping-Andersen. The Anglo-Saxon regime has the smallest social security system.
This analysis shows the redistribution function to be greatest in the Continental regime in 2000, followed by the hybrid regime. This is mainly due to the large share of pensions and the strong progressivity of pensions in these countries. As pension beneficiaries in these regimes are generally out of the labour market, pensions have a strong income-levelling effect. This is not the case for the Anglo-Saxon regime, where pensioners more often have a capital income, which has the same effect.
The redistribution function of all welfare regimes will become stronger in the coming decades, and will almost completely compensate for the increasing primary income inequality. As a result, the net income inequality increase up to 2025 is fairly modest. Therefore, according to the baseline scenario, these regimes will maintain the same order in 2025, although the gap between the Continental regime and hybrid regime will be smaller as the favourable demographic situation of the Netherlands deterio-rates. If the uniform demographic situation were to be applied to all regimes, the hybrid regime would actually have the highest income reduction effect.
In the baseline scenario, the Nordic regime has the biggest income inequality reduc-tion after the Continental and hybrid regimes, mainly because of the large size of the other welfare provisions. This position will be taken over by the Mediterranean regime as pensions become more important in 2025 due to the ageing process. A typical characteristic of the Mediterranean regime is the large size of the pension pro-visions in combination with the small size of the other benefits.
Increasing employment influences both the primary income inequality and the income-levelling effect of social security. Due to the higher employment rate, more people earn an income and therefore primary income inequality declines. However, this effect is offset by a lower income equality reduction since fewer benefits are paid. The resultant net income inequality is slightly lowered in this participation scenario and the ranking of the regimes in terms of net income inequality is unchanged. The change in redistribution is greatest in the Mediterranean regime, as this regime has the biggest increase in employment rates. The smaller income inequality reduction leads to the second lowest income inequality reduction, as Italy will pass Denmark.
In the pension reform scenario primary income inequalities in 2025 are equal to those in the baseline scenario since in the pension reform scenario only pension benefits
110 Redistribution 111Redistribution
are altered. In the regimes where pension benefits are lowered, the income-levelling effect will also be reduced and therefore net income inequality will increase. Due to the assumed increase in benefits in 2025 with respect to the baseline scenario, the hybrid regime of the Netherlands will see the biggest reduction in income inequality.
The measures assumed in the institutional reform scenario generally lead to more pronounced income inequalities. Although employment rates increase and primary income inequality therefore declines, the smaller income-levelling effect leads to greater net income inequalities. In particular those regimes which adjust both pen-sion levels and pension age (Continental regime of France and the hybrid regime of the Netherlands), show a smaller income-levelling effect. The exception in the insti-tutional reform scenario is the Nordic regime. This regime focuses on measures which increase labour participation, and as a result the reduction in primary income inequality is the same as the smaller income-levelling effect of social security. In con-trast to the other regimes, net income inequality is the same as in the baseline sce-nario.

112 Redistribution 113
Note
1 Note that in the literature the terms ‘progressive’ and ‘regressive’ are not always accorded exactly the same meaning. This study aligns with the definitions of Kak-wani (1996), in which progressivity is defined on the basis of the effect: income-level-ling systems are progressive. Other authors (e.g. Lambert 1993) define progressivity on the basis of income shares: systems in which the transfers are higher for the higher incomes are progressive. Social security systems are then generally regressive.

112 Redistribution 113
7 Poverty
Over the last decade, combating poverty has become one of the more urgent aims of European social policy. Member states have voiced their commitment to this goal; this was made explicit at the summits of Nice and Lisbon, resulting in the Lisbon Treaty in which reducing poverty and social exclusion was espoused as a specific aim. This, of course, makes it highly relevant to investigate what might happen with poverty in the future according to the demographic-economic forecasts and the scenarios discussed in chapter 3. This is the main concern of this chapter. First, however, the concept ‘poverty’ needs to be delineated, especially in relation to social policy and the distribu-tive issues raised in the previous chapter.
7.1 The definition of poverty
Poverty lines are often a major item of discussion in the public policy debate. Broadly, in line with Hagenaars et al (1987, 1988), three methods of establishing a poverty line can be distinguished.– people are poor if they have less than an absolute minimum;– people are poor if they have less than others in the society in which they live;– people are poor if they have less than what is considered sufficient.
According to definitions of the first type, poverty is absolute; according to the other two, it is relative. The second definition is moreover objective in the sense that the opinions of those concerned play no role in establishing the degree of poverty. Opin-ions do play a role in the definition of the third type, since people are considering their own situation; these are therefore called subjective poverty lines.
There is no single, clear poverty line which can be used to compare poverty levels in different countries in a valid and uniform way. However, one of the main pov-erty indicators used in the policy debate is defined as the number of people having a standardised income that is below 60% of the median standardised income level. A key advantage of this criterion is its comparability. It is well defined for all countries and there is no need to define currency conversion rates as is the case for purchasing power parities, which suffer from incomparability of the consumption goods. The disadvantage of this poverty indicator is that it is mainly influenced by the income distribution and therefore could lead to the same conclusions as those in chapter 5. However, in this chapter the focus will be on the risk of poverty for pensioners, as the size of this group will increase due to the ageing process.

114 Poverty 115Poverty
7.2 Poverty in various welfare states
One of the main goals of the welfare state is to combat poverty. However, chapter 2 indicates that the various welfare regimes differ in how far they are from achieving this goal. The Nordic welfare regime focuses on bringing about a large reduction in income inequality and poverty through a high labour participation rate. As a result, most people have an earned income, which reduces poverty. In addition, most provi-sions in the Nordic regime have universalistic entry conditions which mean that all citizens are covered. The Nordic regime is therefore expected to have a fairly low pov-erty rate. The opposite holds for the Anglo-Saxon welfare regime, as this regime only focuses on combating the most severe poverty; poverty rates are therefore expected to be relatively high in this regime.
The Continental welfare regime is expected to hold a midway position. Most provi-sions are specifically focused on present and former employees. Consequently, the levels of pensions, disability and unemployment benefits can be regarded as moderate to high and therefore poverty in these groups is expected to be low. However, provi-sions for citizens without an employment history are fairly limited. Social assistance levels are relatively low and it is therefore expected that in this regime the poverty rate among this group will be quite high. In the light of these arguments, the total pov-erty rate in the Continental regime may occupy a midway position. The Mediterranean regime is more specific in this respect as it typically focuses on pensions; the poverty rate among the elderly population is therefore expected to be low. However, poverty due to other risks (disability and unemployment) is likely to be higher than in the other welfare regimes since the coverage of these risks is rather limited, especially for citizens without an employment history.
The Netherlands, as a hybrid country, is expected to have a relatively low poverty rate as it holds a midway position between the Nordic and Continental regimes. Occupa-tion-related benefits (unemployment benefits) and more universalistic benefits (e.g. the state pension) are fairly high in the Netherlands. It is therefore expected that the poverty rate in the Netherlands will be relatively low.
Table 7.1 shows the poverty rates in the different regimes as per the baseline scenario.

114 Poverty 115Poverty
Table 7.1 Poverty rate at 60% of median income, baseline scenario (in percent)
country country-specific demography uniform demography
2000 2025 increase 2000 2025 increase
Nordic (DK) 12.2 13.2 1.0 12.6 13.5 0.9
Hybrid (NL) 10.8 11.6 0.8 10.6 11.0 0.4
Continental (D) 10.8 10.8 0.0 10.7 10.9 0.2
Continental (F) 15.8 16.2 0.4 15.7 16.4 0.7
Mediterranean (I) 18.5 17.6 -0.9 18.8 17.7 -1.0
Anglo-Saxon (UK) 19.3 19.3 0.0 19.3 19.5 0.2
Source: ECHP (1999), SCP/CeRP treatment
The poverty rates according to the echp both confirm and contradict the expecta-tions. In line with the description of its welfare regime, the Anglo-Saxon regime has the highest poverty rate of all regimes in 2000: about 19% of all citizens have an equiv-alised income below 60% of median income. This is reasonably comparable with the second highest poverty rate (18.5%), which is found in Italy. In these regimes poverty reduction is a less central target of social security provisions.
The poverty rates of the two representatives of the Continental regime, France and Germany, differ. In 2000, the poverty rate in Germany is the lowest of all countries, next to the Netherlands, whereas the poverty rate in France occupies a midway posi-tion. This is in line with the higher income inequality of France as seen in chapter 5. Contrary to expectations, the Nordic regime does not have the lowest poverty rate of all welfare regimes. This feature could however be a specific result for Denmark from the echp; a comparison of the echp statistics of a Danish national register-based survey showed lower poverty rates for elderly people. This is mainly a consequence of the treatment of imputed rental income in the different databases (ec 2003). The fig-ures for Denmark therefore need to be interpreted with care.
As can been seen, poverty rates increase slightly in most welfare regimes. The pov-erty rates in the Nordic and the hybrid regimes could increase by almost 1 percent by 2025. By contrast, the poverty rate in the Continental regime in France will increase only slightly, by 0.4% whereas the poverty rates in Germany and the United King-dom will remain constant. However, the projected poverty rates based on the uniform demographic projections show somewhat larger increases for both representatives of the Continental regime. This implies that France and Germany benefit from a comparatively favourable demographical situation. The poverty rate in the Mediter-ranean regime will decline in the period up to 2025. The higher labour participation of women moderates the increase of the median with respect to average income and as a result, the poverty line is somewhat lower than might be expected on the average income growth. This is in line with the contradicting income inequalities statistics:
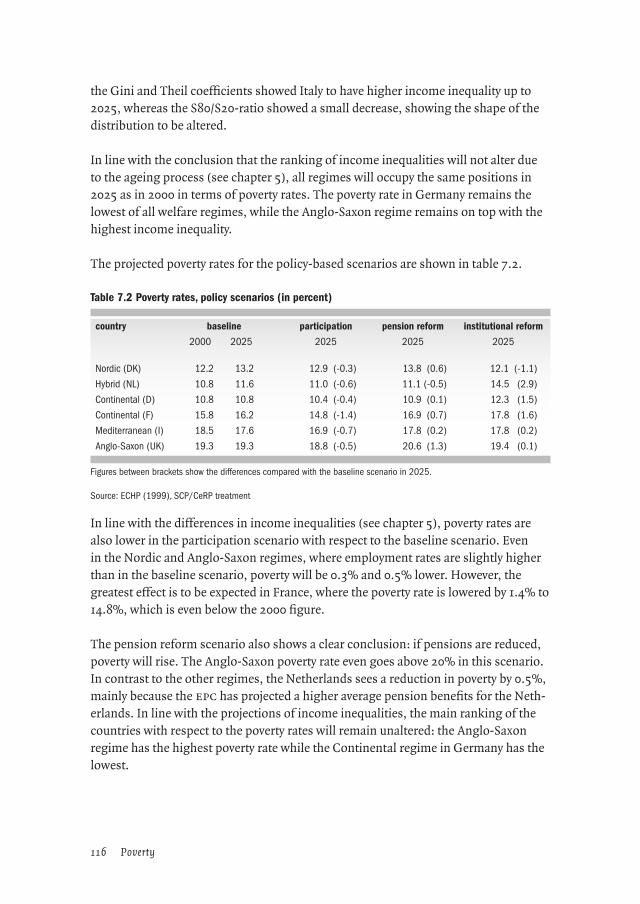
116 Poverty 117Poverty
the Gini and Theil coefficients showed Italy to have higher income inequality up to 2025, whereas the S80/S20-ratio showed a small decrease, showing the shape of the distribution to be altered.
In line with the conclusion that the ranking of income inequalities will not alter due to the ageing process (see chapter 5), all regimes will occupy the same positions in 2025 as in 2000 in terms of poverty rates. The poverty rate in Germany remains the lowest of all welfare regimes, while the Anglo-Saxon regime remains on top with the highest income inequality.
The projected poverty rates for the policy-based scenarios are shown in table 7.2.
Table 7.2 Poverty rates, policy scenarios (in percent)
country baseline participation pension reform institutional reform
2000 2025 2025 2025 2025
Nordic (DK) 12.2 13.2 12.9 (-0.3) 13.8 (0.6) 12.1 (-1.1)
Hybrid (NL) 10.8 11.6 11.0 (-0.6) 11.1 (-0.5) 14.5 (2.9)
Continental (D) 10.8 10.8 10.4 (-0.4) 10.9 (0.1) 12.3 (1.5)
Continental (F) 15.8 16.2 14.8 (-1.4) 16.9 (0.7) 17.8 (1.6)
Mediterranean (I) 18.5 17.6 16.9 (-0.7) 17.8 (0.2) 17.8 (0.2)
Anglo-Saxon (UK) 19.3 19.3 18.8 (-0.5) 20.6 (1.3) 19.4 (0.1)
Figures between brackets show the differences compared with the baseline scenario in 2025.
Source: ECHP (1999), SCP/CeRP treatment
In line with the differences in income inequalities (see chapter 5), poverty rates are also lower in the participation scenario with respect to the baseline scenario. Even in the Nordic and Anglo-Saxon regimes, where employment rates are slightly higher than in the baseline scenario, poverty will be 0.3% and 0.5% lower. However, the greatest effect is to be expected in France, where the poverty rate is lowered by 1.4% to 14.8%, which is even below the 2000 figure.
The pension reform scenario also shows a clear conclusion: if pensions are reduced, poverty will rise. The Anglo-Saxon poverty rate even goes above 20% in this scenario. In contrast to the other regimes, the Netherlands sees a reduction in poverty by 0.5%, mainly because the epc has projected a higher average pension benefits for the Neth-erlands. In line with the projections of income inequalities, the main ranking of the countries with respect to the poverty rates will remain unaltered: the Anglo-Saxon regime has the highest poverty rate while the Continental regime in Germany has the lowest.

116 Poverty 117Poverty
In the institutional reform scenario, most poverty rates are expected to be higher in 2025 compared with the projected rates in the baseline scenario. It is striking that in the Nordic regime the institutional reform scenario leads to a (small) reduction in poverty while in the other regimes an increase of the poverty is seen. This is mainly due to the preference shown in the Nordic regime to start with measures focusing on higher labour participation in the institutional reform scenario. Poverty in the hybrid regime will rise by 3.7%, from 10.8% in 2000 to 14.5% in 2025, which is higher than the poverty threshold as defined for the institutional reform scenario (see section 3.3.4). Even the withdrawal of the reduction in unemployment benefit levels will not be able to prevent the poverty from rising by 1% compared with 2000. This also holds for the Continental regime in France, where the poverty rate will rise by 2.0% from 2000 to 2025 according to this scenario.
7.3 Groups at risk
Table 7.3 shows the size of the pensioners’ group and the percentage of pension-ers living below the poverty threshold. The poverty lines in this table are the same as those in the previous section, i.e. based on 60% of the median income of the total population. The poverty rates for the Nordic regime are left out in this section, as they are unreliable because of the income treatment of Denmark in the echp.
Table 7.3 Percentage of pensioners and poverty rate of pensioners (in percent)
percentage of pensioners poverty rate of pensioners
baseline scenario baseline participation pension reforminstitutional
reform
2000 2025 2000 2025 2025 2025 2025
Hybrid (NL) 18 27 10 11 9 (-2) 9 (-2) 19 (8)
Continental (D) 23 30 13 14 13 (0) 15 (2) 21 (7)
Continental (F) 25 33 18 19 18 (-1) 25 (6) 25 (6)
Mediterranean (I) 27 34 20 24 22 (-3) 26 (2) 24 (0)
Anglo-Saxon (UK) 20 26 28 28 28 (0) 35 (8) 41 (13)
Figures between brackets show the differences compared with the baseline scenario in 2025.
Source: ECHP (1999), SCP/CeRP treatment
The poverty rate among pensioners is higher in almost all regimes than the general poverty rate. Where the general total poverty rate in the Anglo-Saxon regime is 19% in 2000, for example, it is 28% for pensioners. The Continental and Mediterranean regimes occupy a midway position on this aspect: the poverty rate among pension-ers in these regimes is about 2% higher than the overall poverty rates, which can be explained by the fairly narrow gap between average pensions and average wages in

118 Poverty 119Poverty
these regimes. The hybrid regime is an exception in this result; although the average income of pensioners is lower than the overall average income (95%), the poverty rate among pensioners, at 10% is lower than the overall rate of 10.8%. The reasons for this is the basic pension in the Netherlands: all pensioners receive this flat-rated allow-ance without any means-testing, and as a result the poverty rate in this group is rela-tively small.
In most regimes the poverty rate for pensioners remains constant or increases slightly up to 2025 in the baseline scenario. Therefore, if the positions of the various welfare regimes remain unchanged, the ageing process will have little impact on the poverty position of the elderly. In general, the elderly are fairly well protected against pov-erty. The exception is the Mediterranean regime, where the poverty rate of pension-ers increases by 4 percentage points to 24%. This is because of the Italian indexation mechanism which was introduced in 1992; this leads to a decline in the average pen-sion up to 2025 and therefore to an increase in poverty within this group.
The policy scenarios also have an impact on the poverty rates among pensioners. A higher labour participation rate, in line with the Lisbon targets for 2010, results in a lower poverty rate for the Continental regime in France, as well as in the Mediterra-nean and hybrid regimes. This results from the higher pension entitlements built up because of the higher employment rates in the period before 2025. Therefore, higher labour market participation not only improves the situation of the younger genera-tion, but also results in a better income position during retirement.
In contrast to a scenario of a higher labour participation rate, a pension reform sce-nario in which the pensions are lowered inevitably increases poverty rates among pen-sioners. In the Anglo-Saxon regime in particular, where pensions are lowered by 17%, around 35% of all pensioners will have an income below the poverty line. The same holds for France, as a representative of the Continental regime; this country lowers its pensions by 18%, and as a result the poverty rate of pensioners increases by 6%.
The institutional reforms in the various welfare regimes show higher poverty rates for all regimes. The biggest increases take place in the regimes which reduce pension levels (hybrid, Continental and Anglo-Saxon).
One of the conclusions in chapter 5 was that, on average, single pensioners have a lower (equivalised) income than married or cohabiting pensioners. Single persons are older on average than married elderly people and as a result, due to a indexation, their income compared with other groups in society can be harmed. It is therefore impor-tant to look at the poverty rates of these specific groups. Accordingly, table 7.4 shows the poverty rates of single pensioners, broken down by gender.
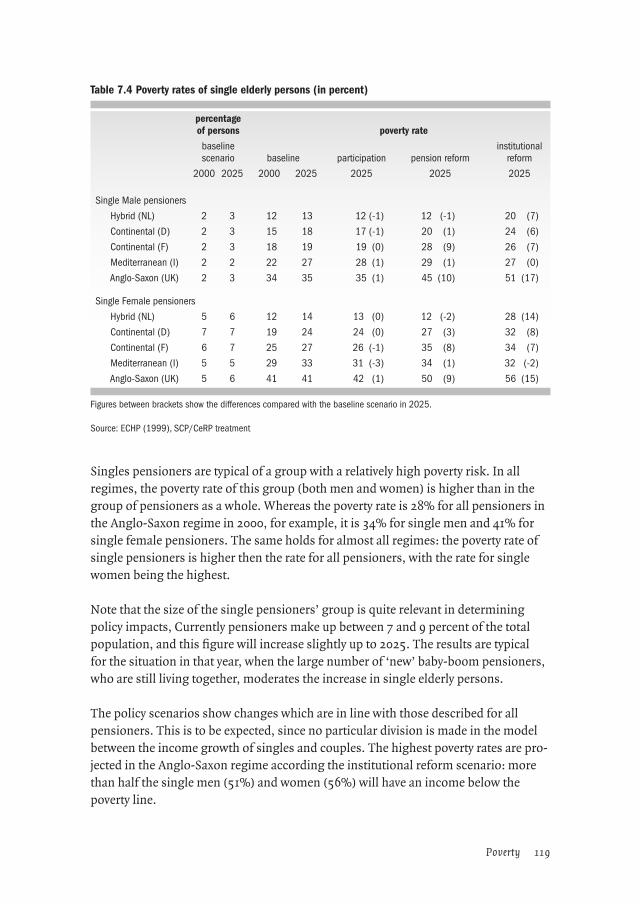
118 Poverty 119Poverty
Table 7.4 Poverty rates of single elderly persons (in percent)
percentage of persons poverty rate
baseline scenario baseline participation pension reform
institutionalreform
2000 2025 2000 2025 2025 2025 2025
Single Male pensioners
Hybrid (NL) 2 3 12 13 12 (-1) 12 (-1) 20 (7)
Continental (D) 2 3 15 18 17 (-1) 20 (1) 24 (6)
Continental (F) 2 3 18 19 19 (0) 28 (9) 26 (7)
Mediterranean (I) 2 2 22 27 28 (1) 29 (1) 27 (0)
Anglo-Saxon (UK) 2 3 34 35 35 (1) 45 (10) 51 (17)
Single Female pensioners
Hybrid (NL) 5 6 12 14 13 (0) 12 (-2) 28 (14)
Continental (D) 7 7 19 24 24 (0) 27 (3) 32 (8)
Continental (F) 6 7 25 27 26 (-1) 35 (8) 34 (7)
Mediterranean (I) 5 5 29 33 31 (-3) 34 (1) 32 (-2)
Anglo-Saxon (UK) 5 6 41 41 42 (1) 50 (9) 56 (15)
Figures between brackets show the differences compared with the baseline scenario in 2025.
Source: ECHP (1999), SCP/CeRP treatment
Singles pensioners are typical of a group with a relatively high poverty risk. In all regimes, the poverty rate of this group (both men and women) is higher than in the group of pensioners as a whole. Whereas the poverty rate is 28% for all pensioners in the Anglo-Saxon regime in 2000, for example, it is 34% for single men and 41% for single female pensioners. The same holds for almost all regimes: the poverty rate of single pensioners is higher then the rate for all pensioners, with the rate for single women being the highest.
Note that the size of the single pensioners’ group is quite relevant in determining policy impacts, Currently pensioners make up between 7 and 9 percent of the total population, and this figure will increase slightly up to 2025. The results are typical for the situation in that year, when the large number of ‘new’ baby-boom pensioners, who are still living together, moderates the increase in single elderly persons.
The policy scenarios show changes which are in line with those described for all pensioners. This is to be expected, since no particular division is made in the model between the income growth of singles and couples. The highest poverty rates are pro-jected in the Anglo-Saxon regime according the institutional reform scenario: more than half the single men (51%) and women (56%) will have an income below the poverty line.

120 Poverty 121
7.4 Conclusions
Using a relative poverty indicator, 60% of median income, the Anglo-Saxon regime type has the highest poverty rate of all regimes in 2000, followed by the Mediterra-nean regime. The poverty rates in the Nordic, hybrid and Continental regime (Ger-many) are the lowest, while the poverty rate in France occupies a middle position.
Up to 2025, the overall poverty rate will increase slightly in most regimes. This is in line with the increasing income inequalities, as concluded in chapter 5. The Mediter-ranean regime is an exception, however; the higher labour participation of women in this regime moderates the increase in the median income with respect to average income, and as a result the poverty line is somewhat lower than might be expected based on average income growth. Consequently, the poverty rate according to this indicator will be lower in the period up to 2025.
A higher labour participation tends to reduce poverty. As more people work, so they accumulate pension rights. This reduces the gap between pension incomes and wage-based incomes in 2025, causing the projected poverty rate in the participation sce-nario to be lower than according to the baseline scenario. A reduction in pension levels always leads to higher poverty rates, especially among pensioners. The institu-tional reforms show different results, as welfare regimes will take measures in line with their specific regime type. The regimes that reduce pension levels (hybrid, Con-tinental and Anglo-Saxon) see the highest increases in poverty. Only in the Nordic regime does the poverty rate decline because of the institutional reforms, as these measures are introduced to raise the labour participation of the younger generation.
Single pensioners are a typical group with a relatively high poverty risk. In all regimes, the poverty rate among this group (both men and women) is higher than for pen-sioners as a whole. The policy scenarios show changes that are in line with those described for all pensioners. The highest poverty rates are projected in the Anglo-Saxon regime according to the institutional reform scenario: more than half of single men (51%) and single women (56%) in this regime are expected to have an income below the poverty line in this scenario.

120 Poverty 121
8 Conclusions and suggestions for further research
8.1 Overview
Most research on the future ageing process in Europe’s welfare states focuses on the rising costs. This study was designed to explore another issue: the distribu-tional results that may be expected in countries with different types of social security schemes. In chapter 2 the current institutional setting was analysed for 23 countries. Five welfare regimes were identified: a Nordic welfare regime type, characterised by a universalistic, large-scale social security system aimed at reducing income differen-tials; a Continental welfare regime type, in which there are separate schemes for differ-ent occupational classes; an Anglo-Saxon welfare regime type, in which social security is limited to those in need; a Mediterranean welfare regime type in which employees are well protected and pensions are relatively high; and an Eastern European regime type, in which the scope of the provisions is generally below the European average. The analysis showed that these regimes can be adequately described by two dimen-sions: one is related to the general scope of social security, the second more or less to the magnitude of pension benefits. The Nordic regime has the highest scores on the first dimension, followed by the Continental, Anglo-Saxon and Eastern European and Mediterranean regimes. The Mediterranean regimes score highest on the second dimension, followed by the Continental, Nordic, Eastern European and Anglo-Saxon regimes. Two countries are identified as ‘hybrid’. The Netherlands is classi-fied between the Continental and Nordic regimes, while Norway has both Nordic and Anglo-Saxon features.
Due to data and time constraints, it was not possible to show the consequences of ageing in terms of inequality, redistribution and poverty for all these countries. In the second part of the study, six exponents of the different regimes were analysed: Germany, France (Continental), the United Kingdom (Anglo-Saxon), Italy (Mediter-ranean), Denmark (Nordic) and the Netherlands (hybrid). These countries represent 74% of the eu-15 population.
The methodology of the study was outlined in chapter 3. Basically, it consists of two steps: building a demographic-economic macro model for the period 2000-2025; and translating the predicted changes to the micro-level of households through a weight-ing procedure applied to Eurostat’s European Community Household Panel Survey (echp).
Four different future scenarios were developed. Chapter 4 outlines their possible impact on key economic indicators (employment, income development and sustain-ability). The influence they may be expected to have in terms of inequality (chapter 5),
122 Conclusions and suggestions for further research 123Conclusions and suggestions for further research
redistribution (chapter 6) and poverty (chapter 7) are then discussed. The conclusions to each of these chapters provide a detailed overview of these specific topics. Here a different angle of approach is chosen. The next sections will discuss the results for each scenario; this may also provide some indication of the relative performance of different future policy options.
8.2 Baseline scenario
The simplest picture of the future is one of ‘persisting welfare regimes’, and this is the main characteristic of the baseline scenario: pensions and social security schemes are left intact, and participation in employment only changes in line with existing trends. According to this scenario, income inequalities will increase slightly. Based on ‘equivalised’ net household incomes, the highest rise is projected to occur in Den-mark, with a Gini-coefficient that goes up by 4% from 0.236 to 0.247. This increase is small because the income inequalities within the various groups (e.g. pensioners, wage-earners) mainly determine the overall income inequality. Therefore, changes in the population composition do not have a major effect on income inequality and as a result, the ranking of the various regimes will not alter. Income inequality remains lowest in the Nordic regime and highest in the Anglo-Saxon regime. The inequalities in the regimes of the Netherlands and Germany follow the Nordic regime at a short distance. France and Italy hold a middle position, having more inequality than the three former countries, but less than the United Kingdom. The changes in inequality rates are largely a consequence of the higher number of pensioners. Because pensions are generally lower than earned incomes, a growth in pension dependency throws the income differentials into sharper relief.
In line with the increasing income inequalities, poverty rates, defined as the percent-age of the population with an income of less than 60% of median income, are likely to rise in the coming decades as well. The Anglo-Saxon regime has the highest poverty rate in 2000, followed by the Mediterranean regime. The poverty rates of the Nordic, hybrid and Continental regime in Germany are the lowest, while the poverty rate in France holds a position in the middle. The biggest increase in poverty will be in the Nordic regime, where the rate will rise by 1 percentage point (from 12% to 13%); the growth in other countries is less marked. One exception to this trend is the Medi-terranean regime, where the general poverty rate will decline up to 2025. This fol-lows from the slight increase in female labour participation which is assumed in the baseline scenario for Italy. On the other hand, poverty among pensioners in Italy will increase with respect to 2000: from 20% to 24%. This is a result of the relative decline of pension levels, which follows from the indexation mechanism in Italy. The poverty rate among pensioners in other regimes will also increase, but to a lesser extent.

122 Conclusions and suggestions for further research 123Conclusions and suggestions for further research
In all countries, the baseline scenario shows a higher degree of redistribution because there will be more income transfers to the growing group of pensioners. The size of the changes in the redistribution function is more or less in line with the second dimension of the typology of welfare regimes (size of pension systems). A large change occurs in the Mediterranean regime, followed by the Continental, Nordic and Anglo-Saxon regimes. However, the change in redistribution is most apparent in the Dutch hybrid regime, as a consequence of the comparatively severe ageing process up to 2025. In that year, redistribution will be the highest in the Netherlands, Germany and France, and lowest in Denmark and the United Kingdom. Italy holds a midway position. Unlike pensions, the changes in redistribution effects of other arrange-ments (unemployment, disability, social assistance and other benefits) are not large, because these provisions are less clearly related to the ageing process.
However, the increasing redistribution also leads to higher costs. In order to assess the financial sustainability a ‘notional contribution rate’ was calculated. This indi-cates the overall contribution rate that will be necessary to finance social security, taking into account the assets of private pension funds and government debt. In 2000 the Nordic, hybrid and Anglo-Saxon regimes have the lowest contribution rates, at between 23% and 25%, while the rates of the Continental and Mediterranean regimes are between 31% and 33%. Under the assumptions of the baseline scenario, the hybrid regime in the Netherlands will face the biggest increase: from 23% to 31%, chiefly due to the unfavourable demographic development up to 2025. Italy has the lowest increase, from 32% to 35% in 2025. This once again follows from the Italian indexation regime. The other countries have to increase their contribution rates by between 4 and 6 percentage points. As a result, France will have the highest contribu-tion rate in 2025, at 38%.
8.3 Participation scenario
It is not very likely that governments will allow the baseline scenario to materialise. Most countries are already considering or implementing strategies to combat the financial consequences of the future ageing process. An obvious way to achieve this is by stimulating labour participation. This strategy both broadens the contribu-tion base (more levies on earned income) and lessens the cost of benefit dependency below the pension age. It plays a central role in the eu’s policy target on pensions, poverty and social inclusion. The study performed here presents information on the potential effect of this strategy. This is the so-called ‘participation scenario’, which assumes that the labour participation targets agreed by the member states at the Lisbon summit will be reached by the year 2010.
In terms of income inequality, the higher labour participation has the greatest impact in France and Italy. Employment increases much more than in the baseline scenario,

124 Conclusions and suggestions for further research 125Conclusions and suggestions for further research
and as a result the various income inequality indicators (Gini, Theil, S80/S20) actu-ally drop below their 2000 level. In the other countries, the differences compared with the baseline scenario are smaller. In these cases, the higher participation mitigates the growth in inequality (1-2 percentage points) a little. Generally speaking, higher labour participation rates tend to reduce income inequality for three reasons:– the number of benefit recipients below the pension age becomes smaller– future pensioners will accrue more pension rights due to their increasing labour
participation– the inequality relative to certain groups (especially working people and married/
cohabiting couples) is expected to decline because of the higher female labour participation.
Another effect in the participation scenario is that poverty rates will rise somewhat less than according to the baseline scenario. In Italy, France, Germany and the United Kingdom, the rates may even fall below their 2000 levels. The participation scenario also seems to lead to slightly lower poverty rates among pensioners, which implies that the poverty rates in this group will remain high. The redistribution effects are also somewhat less in the participation scenario; this is mainly due to the smaller number of benefit claimants below the pension age.
Overall, the savings that result from the higher labour participation are relatively modest. The biggest reduction in the contribution rate with respect to the baseline scenario is about 1 percentage point (France) in 2025. This means that the contribu-tion rates in all regimes will still increase up that year in this scenario. The relatively small effect on the contribution rate of the higher labour participation is a result of the extension of pension rights which follows from the increasing labour market par-ticipation.
8.4 Pension reform scenario
Another strategy which could enhance financial sustainability is the lowering of income transfers to the elderly. This option is studied in the pension reform sce-nario. This scenario tries to take account of changes in the pension systems that have already been set in motion, and is based on the projections made by the Economic Policy Committee (epc, 2001). Because of the various reforms in the pension systems, it is projected that the replacement rates of new pensions will decline in most coun-tries, especially in Germany (-18%), France (-11%) and the United Kingdom (-17%). The Netherlands is an exception, as it is projected that the ratio in this country will slightly increase.
The pension reform scenario shows that a reduction in pension benefits generally leads to greater income inequality. This applies especially in the two Continental

124 Conclusions and suggestions for further research 125Conclusions and suggestions for further research
and in the Anglo-Saxon regimes, corresponding to the considerable changes in the replacement ratios in these countries. In all countries (except the Netherlands) the total reduction in income inequality is less than in the baseline scenario. The differ-ences are not very great, however; and compared with the starting year (2000) the pension reform scenario still implies a considerable increase in redistribution every-where. However, because redistribution is less than in the baseline scenario, sustain-ability improves.
If pensions are lowered, the redistribution effect is likely to decline. However, the sav-ings are fairly limited compared to the baseline scenario; the biggest reduction in the contribution rate in this scenario is about 2 percentage points (France). Consequently, the contribution rates will rise in all regimes, in spite of the pension reforms that have already been set in motion.
8.5 Institutional reform scenario
Whereas in the previous reform scenarios all countries are assumed to apply the same strategy, in the institutional reform scenario each regime introduces measures to foster sustainability according to its own specific institutional setting (see table 3.6). It is assumed that a Nordic regime will tend to leave benefit levels intact if pos-sible and focus on measures which are consistent with that regime’s activating labour market policy. A Continental regime is assumed first to adjust social assistance and unemployment benefit schemes. The main concern here is with occupational pen-sion and disability schemes. If an Anglo-Saxon regime faces a sustainability problem, it will tackle this first by restricting the entry to social assistance. The Mediterranean regime is assumed to first take volume measures in disability and pension systems.
The primary concern of the measures in this scenario is to achieve a financially sus-tainable system, with limiting the consequences in terms of poverty as a secondary constraint. As France has the highest contribution rate and the Netherlands has the greatest increase in the contribution rate in the baseline scenario, these countries are assumed to introduce the greatest number of reforms. As a result, the contribution rate is 6 percentage points lower than the rate projected in the baseline scenario. The contribution rates in the other regimes are 3 to 4 percentage points lower due to the various measures.
The measures taken in the institutional reform scenario generally lead to a smaller redistribution effect and therefore to greater income inequalities. In particular the regimes which adjust both pension levels and the pension age (the French Continen-tal regime and the hybrid regime of the Netherlands) show a lower income-levelling effect.
126 Conclusions and suggestions for further research 127Conclusions and suggestions for further research
As a result, income inequality increases in the institutional reform scenario in all regimes, apart from the Nordic regime, which focuses on measures that increase labour participation. The same holds for poverty rates; the regimes that reduce pen-sion levels (hybrid, Continental and Anglo-Saxon) have the higher increases as the size of the pensioner population is fairly large. This scenario even has a high impact for pensioners, with poverty rates rising by 7-9 percentage points in the two Conti-nental regimes and in the Netherlands, and by as much as 13 percentage points in the Anglo-Saxon welfare regime. As in the pension reform scenario, this indicates that a policy focusing on financial sustainability by reducing pension benefits is likely to lead to a substantial increase in poverty among the elderly in the future.
8.6 Policy implications
The present study has shown that there are clear structural differences in welfare regimes within the European Union. The Nordic systems are extensive and aim at high levels of solidarity; the Anglo-Saxon regimes are limited in scope and gener-ally do no more than complement individual and occupational welfare arrangements. Continental systems fall in between, being less universalistic and stressing the rela-tionship with the labour market experience of pensioners and benefit recipients. The Mediterranean countries are unique in their combination of limited social secu-rity provisions below the pension age, and comparatively well-developed pension schemes, at least in relative terms. The four Eastern European member states anal-ysed here achieve low scores on the general scope of social security, and lag slightly behind the European average in terms of pension schemes. A few countries, such as the Netherlands, have a hybrid welfare regime.
Taking this existing institutional heterogeneity as read, the baseline scenario indi-cates that the future ageing process will have some impact on income distributions and sustainability. In the six countries representing the Nordic, Anglo-Saxon, Con-tinental and hybrid regimes here, income inequality, poverty and redistribution will increase up to 2025, while social security systems will become less sustainable in financial terms. However, the distributive changes are often limited. The overriding impression is that the present differences will to a large extent be replicated in the future: the ranking of regimes in terms of inequality, redistribution and poverty does not change fundamentally. In distributive terms, the ageing process over the next two decades will have a degree of impact everywhere; but if the current welfare regimes remain unchanged, the existing distributive contrasts between them can be expected to persist.
As all countries will face a deterioration in financial sustainability, however, it is not very realistic to assume that the current welfare regimes will remain the same. It is more likely that countries will introduce reforms to their social security systems; and

126 Conclusions and suggestions for further research 127Conclusions and suggestions for further research
these changes may lead to different outcomes, in terms of both income distributions and sustainability.
This can be clearly observed in policy measures which limit the pension formula. The analysis performed here indicates that the long-term financial consequences of pen-sion reforms are fairly positive, in the sense that financial sustainability is improved compared with a ‘no policy’ scenario. However, these measures may have higher social costs, as the changes in the distributive indicators become larger. In particular, the income gap and poverty rates of pensioners can be expected to rise as a result of such a policy approach.
Policy measures aimed at increasing labour market participation have fairly favour-able effects compared to a ‘no reform’ scenario. These measures generally lead to greater financial sustainability and to lower scores on income inequality, redistribu-tion and poverty. However, this line of policy is by no means a panacea. Its effect on sustainability is mitigated by the fact that a higher labour force participation will ulti-mately lead to a growing group of pensioners, who in turn will have more pension rights. And the remedy may not be applicable everywhere: only in regimes which are able to raise their employment rates considerably are the effects likely to be substan-tial.
The institutional reform scenario is rather interesting, because it assumes that each country will introduce measures to tackle sustainability that are as far as possible in line with its current regime. Countries are thus expected to produce qualitatively dif-ferent policy responses to the ageing process. This implies an interaction of reforms with existing welfare regimes, which may be the most realistic assumption as regards the future policy-making process. The analyses performed here suggest that a ‘Nordic’ policy could have favourable effects on sustainability, while limiting the dis-tributive implications of the ageing process. Such a line of policy may not always be adequate, however; the rising costs of future demographic changes may simply be too high in some countries to enable the problem to be solved merely by increasing par-ticipation rates. This explicitly holds for the Netherlands. This country faces a relative strong deterioration of the population composition up to 2025 through which also cuts in benefit levels had to be taken in the institutional reform scenario. As a result, the effects on inequality and poverty are worser than in a pure ‘Nordic’ strategy.
Of course, the reforms that are preferred depend on a political evaluation of the rela-tive importance of sustainability and income-distributive effects. If the degree of inequality, redistribution and poverty are considered to be of little importance, and sustainability is considered to be the main policy issue, one should opt for an efficient pension reform scenario. If, on the other hand, the income distribution issue is cen-tral to policy-making – as the emphasis on poverty and social inclusion in the recent

128 Conclusions and suggestions for further research 129
European policy debate would suggest – the aim should probably be to strive for an efficient trade-off between financial sustainability and distributive impact. In that case, two rather obvious rules of thumb could be followed in policy design:– the first step should be to stimulate labour market participation as much and as
soon as possible;– if this is not sufficient to attain acceptable levels of sustainability, the second step
should be a timely introduction of pension reforms which minimise the income effects for the poorest among the elderly population.
8.7 Suggestions for further research
This explorative study has shown that income inequalities and poverty rates are likely to increase up to 2025. Of course, this raises the question of what will happen beyond that year, when the peak of the ageing process is reached in 2040 and 2050. It seems likely that distributive effects will magnified, and more measures may be necessary to attain a certain level of sustainability.
In this study, one or two representative countries were selected for each welfare regime. This does not allow for within-regime variance. For instance, the distributive results for Greece could be different than those for Italy. An advisable step would be to analyse all European Union member states, including the Eastern European ones. In addition, a more detailed analysis of regional differences within countries could be interesting (North/South Italy, West/East Germany).
Some suggestions can also be made for refining the demographic-economic model. In this study, a partial equilibrium model was used in which labour productivity is assumed to be constant over time and across regimes. By developing a full equilib-rium model with a more detailed age structure and which takes the capital market more fully into account, a better estimate of future sustainability and distributive indi-cators may be obtained.
A complete dynamic microsimulation would make it possible to study the impact of factors which could not be evaluated here, such as changes in levels of education and in the structure of the labour market. Such a simulation could also take into account taxation systems and benefits in kind. It could also allow for a detailed analysis of groups which with little or no opportunity to accrue pension rights: elderly women, ethnic minorities, but also single-parent families.

128 Conclusions and suggestions for further research 129
References
Abramovici, G. (2002). ‘Social Protection: Expenditure on Cash Benefits and on Benefits in Kind’. In: Statistics in focus (3) 16. Luxembourg: Eurostat.
Adema, W. (2001). Net SocialEexpenditure, oecd, 2001 (Labour market and social policy – occasional papers no 52).
Alders, M and D. Manting. (1998). ‘Household Scenarios for the European Union’. In: Maandstatistiek van de bevolking (p. 11-27). Voorburg: Centraal Bureau voor de Statistiek.
Arts, W. and J. Gelissen (2002). ‘Three worlds of welfare capitalism or more? A state-of-the-art report’. In: Journal of European Social Policy, 12 (2), p. 137-158.
Auer, P. et al. (2000). Ageing of the labour force in oecd Countries: Economic and Social Conse-quences, Employment paper 2000/2. Geneva: International Labour Office, Employment Sector.
Bakkum, H. and S. Desczka (2002). De Nederlandse wao in internationaal perspectief. Den Haag: Ministerie van Sociale Zaken en Werkgelegenheid.
Beaujot, R. and J. Liu (2002). Children, social assistance and outcomes, Cross national compari-sons (Working Paper 304). Luxemburg: Luxembourg Income Study.
Beer, de P. (1996). Nederland minder vergrijsd dan andere West-Europese landen, Maand-statistiek bevolking cbs, 96/11, p. 6-8.
Blanchet, D. (2001). Ageing of the labour force: which implications for productivity, training or wages at a macro level? (Paper prepared for the cepii meeting ‘Ageing, skills and labour markets’). Nantes: cepii.
Bonoli, G. (1997). ‘Classifying Welfare States: a Two-dimension Approach’. In: Journal of Social Policy, 26 (3), p. 351-72.
Brusis, M. (1998).‘Residual or European welfare model? Central and Eastern Europe at the crossroads’. 1998, http://www.cap.uni-muenchen.de/download/2000/brusis.pdf.
Cass, D. (1965). ‘Optimum Growth in an Aggregative Model of Capital Accumulation’. In: Review of Economic Studies, 32, July.
Clare, R. (2002). ‘Minimum wages in the European Union, 2002’. In: Statistics in focus, 3 (5). Luxembourg: Eurostat.
Disney, R and P. Johnson (eds.) (2001). Pension systems and retirement incomes across oecd countries, Cheltenham: Edward Elgar.
Dulk, L. den, A. van Doorne-Huiskes and J. Schippers (1999). Work-Family arrangements in Europe. Amsterdam: Thela-Thesis.
EC (2002). Increasing labour force participation and promoting active ageing, Brussels: Council of the European Union, Soc 95, Ecofin 72.
EPC (2001). Budgetary challenges posed by ageing populations, Brussels: European Union.Eurostat (1999). European Community Household Panel, Selective indicators from the 1995 wave.
Luxembourg: Eurostat.Eurostat (2002). Eurostat Yearbook 2002. Luxembourg: Eurostat.Eurostat (2002a). Labour Force Statistics 1981-2001. Luxembourg: Eurostat.Eurostat (2003). European social statistics. Luxembourg: Eurostat.Fultz, E. (2002). Social security reforms in Central and Eastern Europe: How effective, equitable
and secure?. Paper presented at the European regional meeting in Budapest, organised by the International Social Security Association, 13-15 November 2002.
Gifi, A. (1990). Non linear multivariate analysis. Chichester: Wiley & Sons.Götting, U. (1998). ‘Transformation der Wohlfahrstaten’. In: Mittel- und Ost europa. Eine
Zwischenbilanz. Opladen: Leske und Budrich.

130 References 131References
Hall, P.A. and R.C.R. Taylor (1996). ‘Political science and the three new institutional-isms’. In: Political studies (44) 5, p. 936-957.
ilo (1997). Economically active population, Geneva: International Labour Organisation.issa (2001). International Social Security Association, Database Complementary and private
pensions, 2001. http://www-ssw.issa.int/sswlp2/engl/page1.htm.issa (2002). International Social Security Association, Database: Social security systems
around the World, 2002, http://www-ssw.issa.int/sswlp2/engl/page1.htm.Koopmans, Tjalling C. (1965). ‘On the Concept of Optimal Economic Growth’. In: The
Econometric Approach to Development Planning. Amsterdam: North Holland.Lambert, P.J. (1993). The distribution and redistribution of income. A mathematical analysis
(second edition). Manchester/New York: Manchester University Press.Leibfried, S. (1992). ‘Towards a European welfare state? On Integrating Poverty Regimes
into the European Community’. In: Z. Ferge and J.E Kolberg (eds.), Social Policy in a Changing Europe. Frankfurt am Main: Campus Verlag.
Melis, A. (2002). ‘Public expenditure on Labour Market Policies in 1999 varied greatly among Member States.’ In: Statistics in Focus, (3)12, p. 1-6. Luxembourg: Eurostat.
missceec (2002). Mutual Information System on Social Protection in the Central and Eastern European countries, Situation on 1 January 2002. http://europa.eu.int/comm/employment_social/missceec/index_en.html.
missoc (2002). Mutual Information System on Social protection in the EU Member States and the European Economic Area, Situation on January 1st 2002 and Evolution, 2002. http://europa.eu.int/comm/employment_social/missoc/index_en.html.
Nahuis, R and H.L.F. de Groot (2003). Rising Skill Premia (cpb Discussion Paper No 20). The Hague: Centraal Planbureau.
North, D.C. (1990). Institutions, institutional change and economic performance. Cambridge: Cambridge University Press.
North, D.C. (1998). ‘Economic performance trough time’. In: M.C. Brinton and V. Nee (eds.), The new institutionalism in sociology (p. 247-257). New York: Russel Sage.
nyfer (2000). Bescherming en economische efficiëntie, Een alternatief ontslagstelsel. Breukelen: nyfer.
Moss, P. and F. Deven (eds.) (1999). Parental Leave: Progress or Pitfall? The Hague/Brussels: nidi cbgs Publications.
Odink, J.G. and E. van Imhoff (1984). ‘True versus measured Theil Inequality’. In: Statis-tica Neerlandica (38) 4, p. 219-32.
oecd (1997). Civil service pension schemes, Sigma papers: no 10, 1997. Paris: oecd.oecd (1998). Retirement income systems: The reform process across oecd countries, 1998. Paris:
oecd.oecd (1999). Employment Outlook. Paris: oecd. oecd (2000). Economic Outlook 68. Paris: oecd.oecd (2001). Ageing and Income, Financial Resources and retirement in 9 oecd countries. Paris:
oecd.oecd (2001a). Economic Outlook 69. Paris: oecd.oecd (2002). Employment Outlook 2002. Paris: oecd. oecd (2002a). Benefits and Wages oecd Indicators. Paris: oecd.oecd (2002b). Quarterly Labour Force Statistics 2002/1. Paris: oecd.oecd (2002c). Taxing wages 2000-2001. Paris: oecd.oecd (2002d). Economic Outlook 2002, 2 (72)., Paris: oecd.oecd (2002e). Ability and Disability: Policies to promote work and income security for disabled
people. Paris: oecd.Pommer, E, J., J. van Leeuwen and M. Ras (2003). Inkomen verdeeld, Trends in ongelijkheid,
herverdeling en dynamiek. The Hague: scp.
130 References 131References
Ramsey, F. (1928). ‘A Mathematical Theory of Saving’. In: Economic Journal, 38, p. 543-59.Siaroff, A. (1994), ‘Work, Welfare and Gender Equality: a New Typology’. In: Gendering
Welfare States, p. 82-100. London: Sage.socx (1998). socx database, Public social expenditure by main category, oecd, 1998,
http://www.oecd.org/EN/home/0,,EN-home-686-5-no-no--no,00.html.spss (2002). Spss Categories Manual 11.5. Chicago: spss Inc. Standing, G. (2000). Unemployment Benefits and Income Security (Discussion Paper, Interna-
tional Labour Organisation). Geneva: Follow-up to the World.Vanderhoeft, C. (2001). Generalised Calibration at Statistics Belgium. spss® Module g-calib-s
and Current Practices. Statistics Belgium Working Paper n°3: an extensive and rigorous review of theory.
Wildeboer Schut, J.M., J.C. Vrooman and P.T. de Beer (2001). On Worlds of Welfare. The Hague: scp.


Annexes

135

135
feat
ure
clas
sific
atio
nsso
urce
mod
al v
alue
by
wel
fare
regi
me
type
*co
mpo
nent
load
ings
PR
INCA
LS a
naly
sis
Nord
icth
e Ne
th-
erla
nds
Cont
i-ne
ntal
Angl
o-Sa
xon
East
ern
Euro
pean
Med
iterr-
anea
nNo
rway
dim
en-
sion
1di
men
-si
on 2
occu
patio
nalis
m
sc
hem
es fo
r occ
upat
iona
l gr
oups
1: n
ot, 2
: mod
erat
e, 3
: fre
quen
tM
isso
c (2
002)
12
2/3
12/
33
1-0
.47
0.43
sp
ecia
l sch
emes
for c
ivil
serv
ants
1: n
ot, 2
: mod
erat
e, 3
: fre
quen
tM
isso
c (2
002)
12
31/
21
31
-0.1
30.
25
un
paid
fam
ily w
orke
rs1:
bel
ow 1
%, 2
: 1%
-4%
, 3: 4
%
or h
ighe
rOE
CD (2
002b
)1
12
11
2/3
1-0
.43
0.50
ci
vil s
erva
nts
(sha
re in
tota
l la
bour
forc
e)1:
bel
ow 5
%, 2
: 5%
-6%
, 3: 6
%-
7%, 4
: 7%
or h
ighe
rOE
CD (2
002b
)1
34
1/2/
32
23
-0.5
80.
24
fund
ing
so
cial
con
tribu
tions
as
% o
f GD
P (2
000)
1: b
elow
10%
, 2: 1
0%-1
5%,
3: 1
5% o
r hig
her
Euro
stat
(200
2),
p 18
01/
2/3
33
10
20
***
***
to
tal g
ener
al g
over
nmen
t re
venu
es a
s %
of G
DP1:
bel
ow 4
5%, 2
: 45%
-49%
, 3:
49%
-55%
, 4: 5
5% o
r hig
her
NewC
rono
s 4
23
11
14
0.78
-0.0
1
fu
ndin
g pu
blic
pen
sion
s1:
PAY
G, 2
: mixe
dM
isso
c (2
002)
22
11
11
10.
810.
16
fin
anci
ng fa
mily
allo
wanc
es1:
tax
base
d, 2
: mixe
d, 3
: con
tri-
butio
ns b
ased
Mis
soc
(200
2)1
12
10
2/3
1-0
.62
0.58
Anne
x A1
M
ain
char
acte
rist
ics o
f ins
titu
tion
al a
naly
sis
Tabl
e A1
Cl
assi
ficat
ion
of w
elfa
re re
gim
es b
y 85
sys
tem
cha
ract
eris
tics

136 Annexes 137Annexes
in
com
e ta
x pl
us e
mpl
oyee
co
ntrib
utio
ns, s
ingl
e pe
rson
wi
thou
t chi
ldre
n, A
PW (%
of
gros
s in
com
e, 2
000)
1: b
elow
20%
, 2: 2
0%-2
5%,
3: 2
5%-3
0%, 4
: 30%
-35%
, 5:
35%
or h
ighe
r
OECD
(200
2c),
p 84
45
32
41
3**
***
*
in
com
e ta
x pl
us e
mpl
oyee
co
ntrib
utio
ns, m
arrie
d tw
o ch
il-dr
en, A
PW (%
of g
ross
inco
me,
(2
000)
1: b
elow
20%
, 2: 2
0%-3
0%,
3: 3
0% o
r hig
her
OECD
(200
2c),
p 84
33
1/2
21/
21
20.
850.
21
m
argi
nal r
ate
inco
me
tax
plus
em
ploy
ee c
ontri
butio
ns (s
ingl
e,
no c
hild
ren)
1: b
elow
30%
, 2: 3
0%-4
0%,
3: 4
0%-5
0%, 4
: 50%
-or h
ighe
rOE
CD (2
002c
), p
872/
3/4
43/
42
21
20.
71-0
.08
labo
ur m
arke
t
st
atut
ory
min
imum
mon
thly
wa
ges
1: n
o, 2
: yes
Euro
stat
(2
002)
, p 2
12,
www.
stat
e.go
v
12
22
22
1-0
.57
-0.2
3
no
tifica
tion
proc
edur
e in
cas
e of
dis
mis
sal
1: n
o re
stric
tions
, 2: W
ritte
n st
atem
ent,
3: Th
ird p
arty
mus
t be
notifi
ed, 4
: Aut
horis
atio
n ne
eded
fro
m th
ird p
arty
OECD
(199
9),
p 92
34
31/
23
33
0.20
0.72
se
vera
nce
pay
at 4
yea
rs o
f se
rvic
e (w
hite
col
lar)
1: n
one,
2: 1
-2 m
onth
s, 3
: 3-4
m
onth
sOE
CD(1
999)
, p97
11
1/2
12
31
-0.6
30.
49
re
gula
tion
of fi
xed-
term
con
-tra
cts
1: p
erm
itted
onl
y fo
r obj
ectiv
e re
ason
s, 2
: per
mitt
ed in
cas
e of
em
ploy
er n
eed
or s
peci
al g
roup
s,
3: fe
w re
stric
tions
, 4: n
o re
stric
-tio
ns
OECD
(199
9),
p104
44
24
32
20.
34-0
.72
feat
ure
clas
sific
atio
nsso
urce
mod
al v
alue
by
wel
fare
regi
me
type
*co
mpo
nent
load
ings
PR
INCA
LS a
naly
sis
Nord
icth
e Ne
th-
erla
nds
Cont
i-ne
ntal
Angl
o-Sa
xon
East
ern
Euro
pean
Med
iterr-
anea
nNo
rway
dim
en-
sion
1di
men
-si
on 2
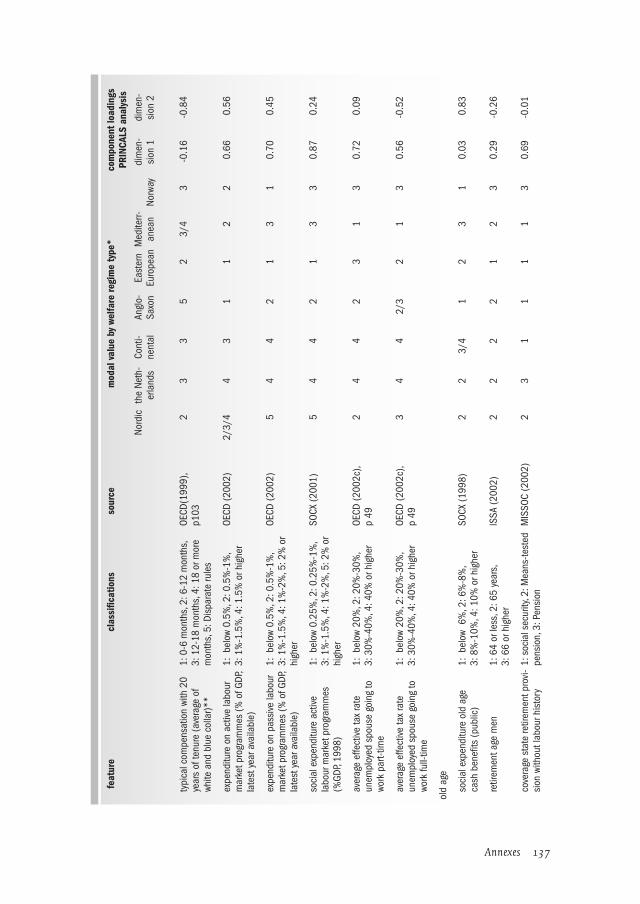
136 Annexes 137Annexes
ty
pica
l com
pens
atio
n wi
th 2
0 ye
ars
of te
nure
(ave
rage
of
white
and
blu
e co
llar)*
*
1: 0
-6 m
onth
s, 2
: 6-1
2 m
onth
s,
3: 1
2-18
mon
ths,
4: 1
8 or
mor
e m
onth
s, 5
: Dis
para
te ru
les
OECD
(199
9),
p103
23
35
23/
43
-0.1
6-0
.84
ex
pend
iture
on
activ
e la
bour
m
arke
t pro
gram
mes
(% o
f GDP
, la
test
yea
r ava
ilabl
e)
1: b
elow
0.5
%, 2
: 0.5
%-1
%,
3: 1
%-1
.5%
, 4: 1
.5%
or h
ighe
r OE
CD (2
002)
2/3/
44
31
12
20.
660.
56
ex
pend
iture
on
pass
ive la
bour
m
arke
t pro
gram
mes
(% o
f GDP
, la
test
yea
r ava
ilabl
e)
1: b
elow
0.5
%, 2
: 0.5
%-1
%,
3: 1
%-1
.5%
, 4: 1
%-2
%, 5
: 2%
or
high
er
OECD
(200
2)5
44
21
31
0.70
0.45
so
cial
exp
endi
ture
act
ive
labo
ur m
arke
t pro
gram
mes
(%
GDP,
1998
)
1: b
elow
0.2
5%, 2
: 0.2
5%-1
%,
3: 1
%-1
.5%
, 4: 1
%-2
%, 5
: 2%
or
high
er
SOCX
(200
1)5
44
21
33
0.87
0.24
av
erag
e ef
fect
ive ta
x ra
te
unem
ploy
ed s
pous
e go
ing
to
work
par
t-tim
e
1: b
elow
20%
, 2: 2
0%-3
0%,
3: 3
0%-4
0%, 4
: 40%
or h
ighe
rOE
CD (2
002c
), p
492
44
23
13
0.72
0.09
av
erag
e ef
fect
ive ta
x ra
te
unem
ploy
ed s
pous
e go
ing
to
work
full-
time
1: b
elow
20%
, 2: 2
0%-3
0%,
3: 3
0%-4
0%, 4
: 40%
or h
ighe
rOE
CD (2
002c
), p
493
44
2/3
21
30.
56-0
.52
old
age
so
cial
exp
endi
ture
old
age
ca
sh b
enefi
ts (p
ublic
)1:
bel
ow 6
%, 2
: 6%
-8%
, 3:
8%
-10%
, 4: 1
0% o
r hig
her
SOCX
(199
8)2
23/
41
23
10.
030.
83
re
tirem
ent a
ge m
en1:
64
or le
ss, 2
: 65
year
s,
3: 6
6 or
hig
her
ISSA
(200
2)2
22
21
23
0.29
-0.2
6
co
vera
ge s
tate
retir
emen
t pro
vi-
sion
with
out l
abou
r his
tory
1: s
ocia
l sec
urity
, 2: M
eans
-test
ed
pens
ion,
3: P
ensi
onM
ISSO
C (2
002)
23
11
11
30.
69-0
.01
feat
ure
clas
sific
atio
nsso
urce
mod
al v
alue
by
wel
fare
regi
me
type
*co
mpo
nent
load
ings
PR
INCA
LS a
naly
sis
Nord
icth
e Ne
th-
erla
nds
Cont
i-ne
ntal
Angl
o-Sa
xon
East
ern
Euro
pean
Med
iterr-
anea
nNo
rway
dim
en-
sion
1di
men
-si
on 2

138 Annexes 139Annexes
fu
ndin
g1:
PAY
G, 2
: (Pa
rtial
) fun
ded
MIS
SOC
(200
2)2
21
11/
21
10.
640.
07
m
inim
um p
erio
d of
mem
ber-
ship
em
ploy
ees
(sec
ond
tier)
1: n
o m
inim
um p
erio
d, 2
: Les
s th
an 5
yea
rs, 3
: Mor
e th
an 5
yea
rsIS
SA (2
002)
11
2/3
1/3
1/3
32
-0.7
10.
11
m
inim
um p
ensi
on (s
ingl
e pe
rson
)1:
no
min
imum
, 2: Y
es, l
ow,
3: Ye
s, h
igh
ISSA
(200
2)1
11
12
31
-0.5
50.
55
co
nditi
on fo
r dra
wing
full
pens
ion
(sec
ond
tier p
ublic
sc
hem
e)
1: <
40
year
s, 2
: 40
or m
ore
year
sM
ISSO
C (2
002)
, OE
CD (2
001)
12
22
11
20.
12-0
.27
be
nefit
adj
ustm
ent
1: w
ith p
rices
, 2: N
ot d
efine
d or
av
erag
e of
wag
es a
nd p
rices
, 3:
With
wag
es
ISSA
(200
2)1/
2/3
23
1/3
23
2-0
.30
0.28
ta
rget
full
man
dato
ry p
ensi
on,
sing
le p
erso
n**
1: D
C-sy
stem
, 2: D
B: L
ess
than
50
% p
revi
ous
wage
s or
flat
rate
, 3:
DB:
50-
65%
of w
ages
, 4: D
B:
65-7
5% o
f wag
es, 5
: DB:
mor
e th
an 7
5% o
f wag
es
ISSA
(200
2)1
44
21
3/5
1-0
.04
0.86
m
inim
um fu
ll pe
nsio
n1:
no,
2: n
esM
ISSO
C (2
002)
11
11
21
1-0
.30
-0.0
5
m
axim
um fu
ll pe
nsio
n1:
yes
, low
, 2: y
es, h
igh,
3: n
one
ISSA
(200
2)3
32
13
32
0.27
0.75
ol
d-ag
e GR
R pu
blic
and
man
-da
tory
pen
sion
sys
tem
1: b
elow
50%
, 2: 5
0%-7
0%,
3: 7
0%-1
00%
, 4: 1
00%
OE
CD (1
998)
, p1
842
12
12
3/4
2-0
.47
0.70
im
plic
ate
aver
age
tax
rate
on
work
from
55
to 6
41:
bel
ow 2
5%, 2
: 25%
-40%
, 3:
40%
or h
ighe
rOE
CD (1
998)
, p1
863
32
11
31
0.10
0.65
sp
endi
ng o
n ea
rly re
tirem
ent
prog
ram
s1:
no
sche
mes
, 2:
belo
w 1.
5%,
3: 1
.5%
or h
ighe
rOE
CD (2
001a
), p1
543
21
12
1/3
30.
600.
02
feat
ure
clas
sific
atio
nsso
urce
mod
al v
alue
by
wel
fare
regi
me
type
*co
mpo
nent
load
ings
PR
INCA
LS a
naly
sis
Nord
icth
e Ne
th-
erla
nds
Cont
i-ne
ntal
Angl
o-Sa
xon
East
ern
Euro
pean
Med
iterr-
anea
nNo
rway
dim
en-
sion
1di
men
-si
on 2
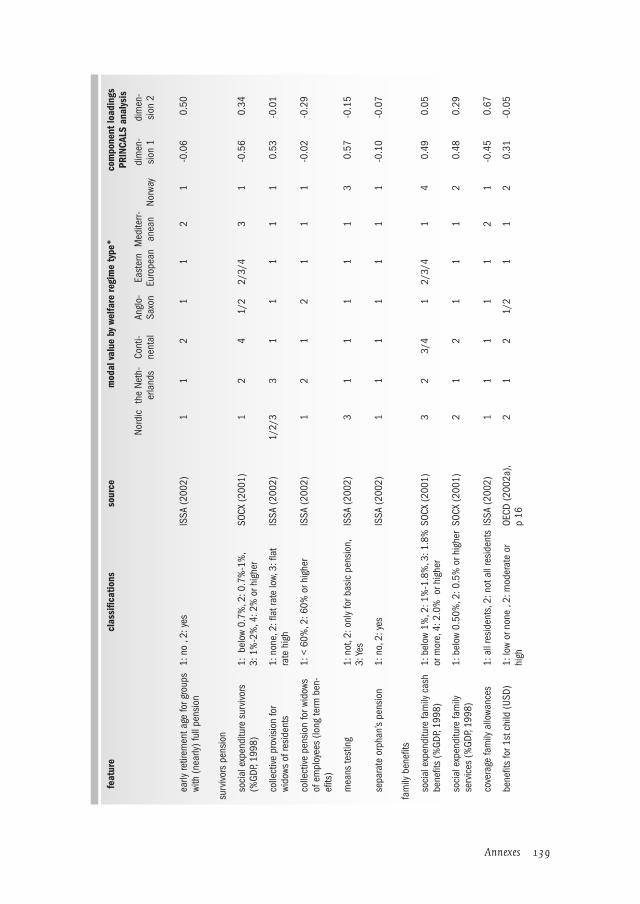
138 Annexes 139Annexes
ea
rly re
tirem
ent a
ge fo
r gro
ups
with
(nea
rly) f
ull p
ensi
on1:
no
, 2: y
esIS
SA (2
002)
11
21
12
1-0
.06
0.50
surv
ivors
pen
sion
so
cial
exp
endi
ture
sur
vivo
rs
(%GD
P, 19
98)
1: b
elow
0.7
%, 2
: 0.7
%-1
%,
3: 1
%-2
%, 4
: 2%
or h
ighe
r SO
CX (2
001)
12
41/
22/
3/4
31
-0.5
60.
34
co
llect
ive p
rovi
sion
for
wido
ws o
f res
iden
ts1:
non
e, 2
: flat
rate
low,
3: fl
at
rate
hig
hIS
SA (2
002)
1/2/
33
11
11
10.
53-0
.01
co
llect
ive p
ensi
on fo
r wid
ows
of e
mpl
oyee
s (lo
ng te
rm b
en-
efits
)
1: <
60%
, 2: 6
0% o
r hig
her
ISSA
(200
2)1
21
21
11
-0.0
2-0
.29
m
eans
test
ing
1: n
ot, 2
: onl
y fo
r bas
ic p
ensi
on,
3: Ye
sIS
SA (2
002)
31
11
11
30.
57-0
.15
se
para
te o
rpha
n’s
pens
ion
1: n
o, 2
: yes
ISSA
(200
2)1
11
11
11
-0.1
0-0
.07
fam
ily b
enefi
ts
so
cial
exp
endi
ture
fam
ily c
ash
bene
fits
(%GD
P, 19
98)
1: b
elow
1%
, 2: 1
%-1
.8%
, 3: 1
.8%
or
mor
e, 4
: 2.0
% o
r hig
her
SOCX
(200
1)3
23/
41
2/3/
41
40.
490.
05
so
cial
exp
endi
ture
fam
ily
serv
ices
(%GD
P, 19
98)
1: b
elow
0.5
0%, 2
: 0.5
% o
r hig
her
SOCX
(200
1)2
12
11
12
0.48
0.29
co
vera
ge fa
mily
allo
wanc
es1:
all
resi
dent
s, 2
: not
all
resi
dent
sIS
SA (2
002)
11
11
12
1-0
.45
0.67
be
nefit
s fo
r 1st
chi
ld (U
SD)
1: lo
w or
non
e , 2
: mod
erat
e or
hi
ghOE
CD (2
002a
), p
162
12
1/2
11
20.
31-0
.05
feat
ure
clas
sific
atio
nsso
urce
mod
al v
alue
by
wel
fare
regi
me
type
*co
mpo
nent
load
ings
PR
INCA
LS a
naly
sis
Nord
icth
e Ne
th-
erla
nds
Cont
i-ne
ntal
Angl
o-Sa
xon
East
ern
Euro
pean
Med
iterr-
anea
nNo
rway
dim
en-
sion
1di
men
-si
on 2

140 Annexes 141Annexes
m
eans
-test
ed c
hild
ben
efits
1: n
o, 2
: yes
OECD
(200
2a),
p 16
11
12
22
2-0
.55
-0.2
9
child
cus
tody
ex
tent
of s
tate
invo
lvem
ent i
n en
surin
g ch
ild s
uppo
rt1:
min
imal
, 2: e
nfor
cem
ent o
f ch
ild s
uppo
rt, 3
: adv
ance
mai
nte-
nanc
e pa
ymen
ts
Beau
jot a
nd L
iu
(200
2), p
20
33
32
01/
33
***
***
ex
tent
of d
iffer
entia
l sup
port
for l
one
pare
nts
1: m
inim
al, 2
: sig
nific
ant
Beau
jot a
nd L
iu
(200
2), p
20
21
11
01/
32
0.66
0.26
pe
rcen
tage
join
t cus
tody
ar
rang
emen
ts in
cas
e of
a
divo
rce
1: b
elow
50%
, 2: 5
0% o
r hig
her
Beau
jot a
nd L
iu
(200
2), p
20
22
21
01/
32
0.74
0.40
disa
bilit
y
so
cial
exp
endi
ture
dis
abili
ty
cash
ben
efits
%GD
P SO
CX
(199
8)
1: b
elow
1%
, 2: 1
%-1
.5%
, 3:
1.5
%-2
%, 4
: 2%
or h
ighe
rSO
CX (2
001)
44
2/3
13
2/3
40.
52-0
.05
di
sabi
lity
bene
fit,
perc
enta
ge
of 2
0-64
pop
ulat
ion
(199
9)1:
bel
ow 5
%, 2
: 5%
-7.5
%,
3: 7
.5%
or h
ighe
rOE
CD (2
002e
)3
31
1/2
1/3
1/2/
33
0.63
0.10
co
vera
ge d
isab
ility
1: a
ll re
side
nts,
2: n
ot a
ll re
side
nts
ISSA
(200
2)1
22
22
21
-0.6
50.
29
co
vera
ge s
ickn
ess
1: (a
lmos
t) al
l wor
king
pop
ulat
ion,
2:
all
sala
ried
work
ers
and
assi
mi-
late
d ca
tego
ries,
3: s
ome
priva
te
sect
or e
mpl
oyee
s
ISSA
(200
2)1
21
1/2
11/
21
-0.2
7-0
.48
m
inim
um le
vel o
f inc
apac
ity fo
r wo
rk**
1: n
ot d
efine
d as
per
cent
age,
2:
1%
-50%
, 3: 5
0-<
MIS
SOC
(200
2)2
22/
33
12/
32
-0.4
2-0
.23
feat
ure
clas
sific
atio
nsso
urce
mod
al v
alue
by
wel
fare
regi
me
type
*co
mpo
nent
load
ings
PR
INCA
LS a
naly
sis
Nord
icth
e Ne
th-
erla
nds
Cont
i-ne
ntal
Angl
o-Sa
xon
East
ern
Euro
pean
Med
iterr-
anea
nNo
rway
dim
en-
sion
1di
men
-si
on 2

140 Annexes 141Annexes
m
inim
um p
erio
d of
affi
liatio
n fo
r ent
itlem
ent (
year
s)1:
no
perio
d, 2
: 0-3
yea
rs,
3: 3
or m
ore
MIS
SOC
(200
2)1
12
33
32
-0.8
1-0
.02
le
vel o
f ben
efit (
full
insu
ranc
e pe
riod)
1: fl
at ra
te, 2
: dep
endi
ng
cont
r.yea
rs a
nd e
arni
ngs,
3: l
ess
than
60%
of e
arni
ngs,
4: m
ore
than
60%
of e
arni
ngs
ISSA
(200
2),
MIS
SOC
(200
2)4
42/
31
32
30.
620.
39
occu
patio
nal d
isab
ility
so
cial
exp
endi
ture
occ
upa-
tiona
l inj
ury
and
dise
ase
%GD
P SO
CX (1
998)
1: b
elow
0.3
%, 2
: 0.3
%-<
SOCX
(200
1)1
00
11/
23
1-0
.23
0.35
co
vera
ge w
ork
inju
ry1:
(alm
ost)
all w
orki
ng p
opul
atio
n,
2: a
ll sa
larie
d wo
rker
s an
d as
sim
i-la
ted
cate
gorie
s
ISSA
(200
2)1
11
21
22
-0.0
4-0
.42
le
vel o
f ben
efit
1: fi
xed
amou
nt o
r les
s th
en 7
5%,
2: 7
5%-9
9%, 3
: 100
% o
r mor
eIS
SA (2
002)
21
11/
23
33
0.13
0.03
m
inim
um le
vel o
f inc
apac
ity fo
r wo
rk**
1: n
ot d
efine
d as
per
cent
age,
2:
1%
-10%
, 3: 1
0%-2
0%,
4: 2
0% o
r hig
her
MIS
SOC
(200
2)2
33
1/2/
31
44
-0.5
20.
28
be
nefit
adj
ustm
ent
1: w
ith p
rices
, 2: n
ot d
efine
d or
av
erag
e of
wag
es a
nd p
rices
, 3:
with
wag
es
ISSA
(200
2),
MIS
SOC
(200
2)1
33
30
32
-0.3
8-0
.07
feat
ure
clas
sific
atio
nsso
urce
mod
al v
alue
by
wel
fare
regi
me
type
*co
mpo
nent
load
ings
PR
INCA
LS a
naly
sis
Nord
icth
e Ne
th-
erla
nds
Cont
i-ne
ntal
Angl
o-Sa
xon
East
ern
Euro
pean
Med
iterr-
anea
nNo
rway
dim
en-
sion
1di
men
-si
on 2
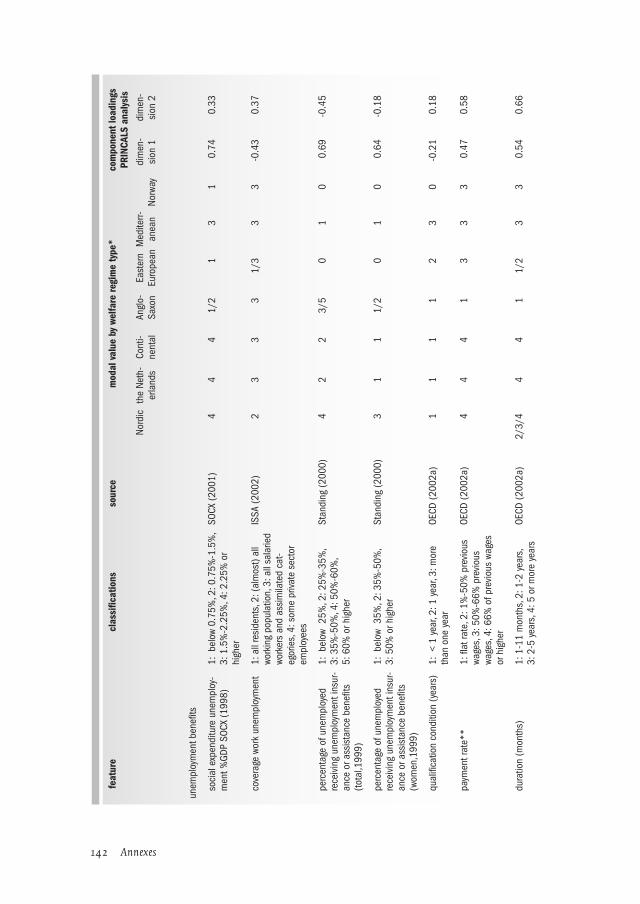
142 Annexes 143Annexes
unem
ploy
men
t ben
efits
so
cial
exp
endi
ture
une
mpl
oy-
men
t %GD
P SO
CX (1
998)
1: b
elow
0.7
5%, 2
: 0.7
5%-1
.5%
, 3:
1.5
%-2
.25%
, 4: 2
.25%
or
high
er
SOCX
(200
1)4
44
1/2
13
10.
740.
33
co
vera
ge w
ork
unem
ploy
men
t1:
all
resi
dent
s, 2
: (al
mos
t) al
l wo
rkin
g po
pula
tion,
3: a
ll sa
larie
d wo
rker
s an
d as
sim
ilate
d ca
t-eg
orie
s, 4
: som
e pr
ivate
sec
tor
empl
oyee
s
ISSA
(200
2)2
33
31/
33
3-0
.43
0.37
pe
rcen
tage
of u
nem
ploy
ed
rece
ivin
g un
empl
oym
ent i
nsur
-an
ce o
r ass
ista
nce
bene
fits
(tota
l,199
9)
1: b
elow
25%
, 2: 2
5%-3
5%,
3: 3
5%-5
0%, 4
: 50%
-60%
, 5:
60%
or h
ighe
r
Stan
ding
(200
0)4
22
3/5
01
00.
69-0
.45
pe
rcen
tage
of u
nem
ploy
ed
rece
ivin
g un
empl
oym
ent i
nsur
-an
ce o
r ass
ista
nce
bene
fits
(wom
en,1
999)
1: b
elow
35%
, 2: 3
5%-5
0%,
3: 5
0% o
r hig
her
Stan
ding
(200
0)3
11
1/2
01
00.
64-0
.18
qu
alifi
catio
n co
nditi
on (y
ears
)1:
< 1
yea
r, 2:
1 y
ear,
3: m
ore
than
one
yea
rOE
CD (2
002a
)1
11
12
30
-0.2
10.
18
pa
ymen
t rat
e**
1: fl
at ra
te, 2
: 1%
-50%
pre
viou
s wa
ges,
3: 5
0%-6
6% p
revi
ous
wage
s, 4
: 66%
of p
revi
ous
wage
s or
hig
her
OECD
(200
2a)
44
41
33
30.
470.
58
du
ratio
n (m
onth
s)1:
1-1
1 m
onth
s, 2
: 1-2
yea
rs,
3: 2
-5 y
ears
, 4: 5
or m
ore
year
sOE
CD (2
002a
)2/
3/4
44
11/
23
30.
540.
66
feat
ure
clas
sific
atio
nsso
urce
mod
al v
alue
by
wel
fare
regi
me
type
*co
mpo
nent
load
ings
PR
INCA
LS a
naly
sis
Nord
icth
e Ne
th-
erla
nds
Cont
i-ne
ntal
Angl
o-Sa
xon
East
ern
Euro
pean
Med
iterr-
anea
nNo
rway
dim
en-
sion
1di
men
-si
on 2
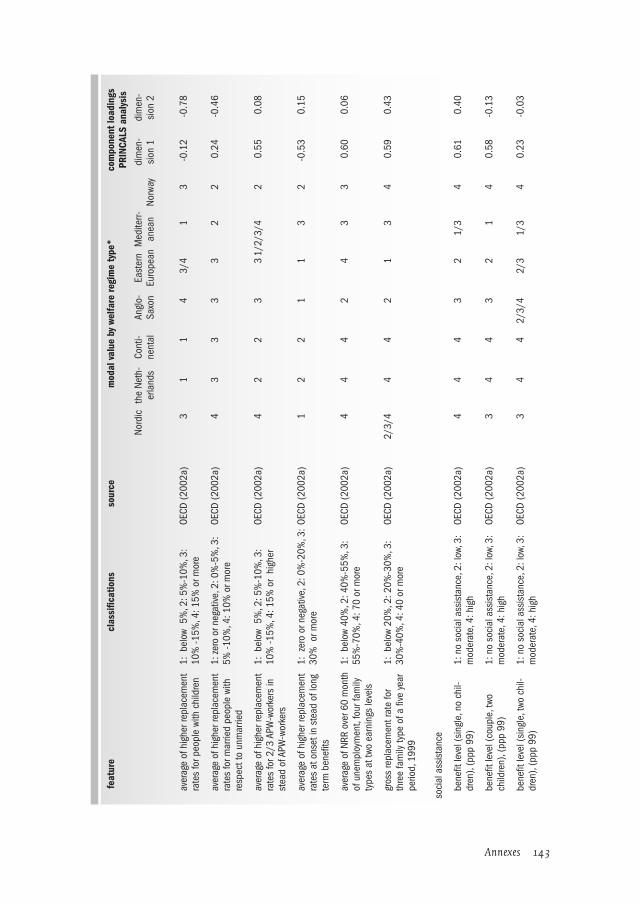
142 Annexes 143Annexes
av
erag
e of
hig
her r
epla
cem
ent
rate
s fo
r peo
ple
with
chi
ldre
n1:
bel
ow 5
%, 2
: 5%
-10%
, 3:
10%
-15%
, 4: 1
5% o
r mor
eOE
CD (2
002a
)3
11
43/
41
3-0
.12
-0.7
8
av
erag
e of
hig
her r
epla
cem
ent
rate
s fo
r mar
ried
peop
le w
ith
resp
ect t
o un
mar
ried
1: z
ero
or n
egat
ive, 2
: 0%
-5%
, 3:
5% -1
0%, 4
: 10%
or m
ore
OECD
(200
2a)
43
33
32
20.
24-0
.46
av
erag
e of
hig
her r
epla
cem
ent
rate
s fo
r 2/3
APW
-wor
kers
in
stea
d of
APW
-wor
kers
1: b
elow
5%
, 2: 5
%-1
0%, 3
: 10
% -1
5%, 4
: 15%
or
high
er
OECD
(200
2a)
42
23
31/
2/3/
42
0.55
0.08
av
erag
e of
hig
her r
epla
cem
ent
rate
s at
ons
et in
ste
ad o
f lon
g te
rm b
enefi
ts
1: z
ero
or n
egat
ive, 2
: 0%
-20%
, 3:
30%
or m
ore
OECD
(200
2a)
12
21
13
2-0
.53
0.15
av
erag
e of
NRR
ove
r 60
mon
th
of u
nem
ploy
men
t, fo
ur fa
mily
ty
pes
at tw
o ea
rnin
gs le
vels
1: b
elow
40%
, 2: 4
0%-5
5%, 3
: 55
%-7
0%, 4
: 70
or m
ore
OECD
(200
2a)
44
42
43
30.
600.
06
gr
oss
repl
acem
ent r
ate
for
thre
e fa
mily
type
of a
five
yea
r pe
riod,
199
9
1: b
elow
20%
, 2: 2
0%-3
0%, 3
: 30
%-4
0%, 4
: 40
or m
ore
OECD
(200
2a)
2/3/
44
42
13
40.
590.
43
soci
al a
ssis
tanc
e
be
nefit
leve
l (si
ngle
, no
chil-
dren
), (p
pp 9
9)1:
no
soci
al a
ssis
tanc
e, 2
: low
, 3:
mod
erat
e, 4
: hig
hOE
CD (2
002a
)4
44
32
1/3
40.
610.
40
be
nefit
leve
l (co
uple
, two
ch
ildre
n), (
ppp
99)
1: n
o so
cial
ass
ista
nce,
2: l
ow, 3
: m
oder
ate,
4: h
igh
OECD
(200
2a)
34
43
21
40.
58-0
.13
be
nefit
leve
l (si
ngle
, two
chi
l-dr
en),
(ppp
99)
1: n
o so
cial
ass
ista
nce,
2: l
ow, 3
: m
oder
ate,
4: h
igh
OECD
(200
2a)
34
42/
3/4
2/3
1/3
40.
23-0
.03
feat
ure
clas
sific
atio
nsso
urce
mod
al v
alue
by
wel
fare
regi
me
type
*co
mpo
nent
load
ings
PR
INCA
LS a
naly
sis
Nord
icth
e Ne
th-
erla
nds
Cont
i-ne
ntal
Angl
o-Sa
xon
East
ern
Euro
pean
Med
iterr-
anea
nNo
rway
dim
en-
sion
1di
men
-si
on 2
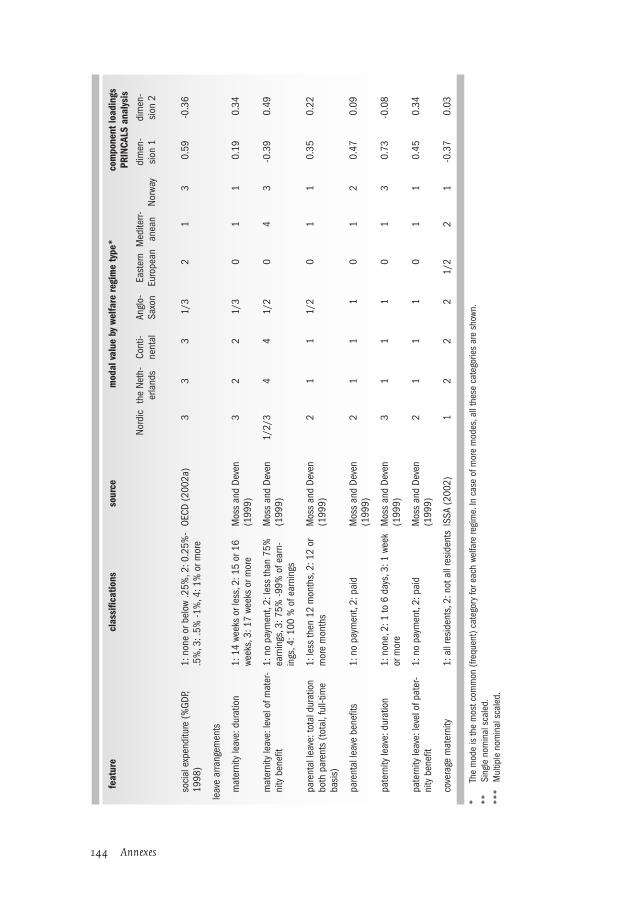
144 Annexes 145Annexes
so
cial
exp
endi
ture
(%GD
P, 19
98)
1: n
one
or b
elow
.25%
, 2: 0
.25%
-.5
%, 3
: .5%
-1%
, 4: 1
% o
r mor
eOE
CD (2
002a
)3
33
1/3
21
30.
59-0
.36
leav
e ar
rang
emen
ts
m
ater
nity
leav
e: d
urat
ion
1: 1
4 we
eks
or le
ss, 2
: 15
or 1
6 we
eks,
3: 1
7 we
eks
or m
ore
Mos
s an
d De
ven
(1
999)
32
21/
30
11
0.19
0.34
m
ater
nity
leav
e: le
vel o
f mat
er-
nity
ben
efit
1: n
o pa
ymen
t, 2:
less
than
75%
ea
rnin
gs, 3
: 75%
-99%
of e
arn-
ings
, 4: 1
00 %
of e
arni
ngs
Mos
s an
d De
ven
(1
999)
1/2/
34
41/
20
43
-0.3
90.
49
pa
rent
al le
ave:
tota
l dur
atio
n bo
th p
aren
ts (t
otal
, ful
l-tim
e ba
sis)
1: le
ss th
en 1
2 m
onth
s, 2
: 12
or
mor
e m
onth
sM
oss
and
Deve
n
(199
9)2
11
1/2
01
10.
350.
22
pa
rent
al le
ave
bene
fits
1: n
o pa
ymen
t, 2:
pai
dM
oss
and
Deve
n
(199
9)2
11
10
12
0.47
0.09
pa
tern
ity le
ave:
dur
atio
n1:
non
e, 2
: 1 to
6 d
ays,
3: 1
wee
k or
mor
eM
oss
and
Deve
n
(199
9)3
11
10
13
0.73
-0.0
8
pa
tern
ity le
ave:
leve
l of p
ater
-ni
ty b
enefi
t1:
no
paym
ent,
2: p
aid
Mos
s an
d De
ven
(1
999)
21
11
01
10.
450.
34
co
vera
ge m
ater
nity
1: a
ll re
side
nts,
2: n
ot a
ll re
side
nts
ISSA
(200
2)1
22
21/
22
1-0
.37
0.03
*
The
mod
e is
the
mos
t com
mon
(fre
quen
t) ca
tego
ry fo
r eac
h we
lfare
regi
me.
In c
ase
of m
ore
mod
es, a
ll th
ese
cate
gorie
s ar
e sh
own.
**
Sing
le n
omin
al s
cale
d.**
* M
ultip
le n
omin
al s
cale
d.
feat
ure
clas
sific
atio
nsso
urce
mod
al v
alue
by
wel
fare
regi
me
type
*co
mpo
nent
load
ings
PR
INCA
LS a
naly
sis
Nord
icth
e Ne
th-
erla
nds
Cont
i-ne
ntal
Angl
o-Sa
xon
East
ern
Euro
pean
Med
iterr-
anea
nNo
rway
dim
en-
sion
1di
men
-si
on 2

144 Annexes 145Annexes
Annex A2 Some technical aspects of the demographic-economic macro model
A2.1 The structure of the pension unit
Starting from the number of pensioners, projections should in principle simply reflect the application of the eligibility rules to the changing demography. Many rele-vant complications, however, mainly pertaining to the evolution of the labour market, cannot be dismissed. In particular, the European objectives of increasing the employ-ment rates both of older people and of women will influence labour market perfor-mance, causing two opposing effects on the number of pensioners; while an increase in the employment rate of older people will reduce the number of pensioners in the short run, the greater employment rate of women will increase it in the longer term.
The procedure adopted in the pension unit divides pensioners into two broad fami-lies, the first comprising the ‘sensitive classes’ and the second the ‘constant-ratio classes’.
The ‘sensitive classes’ are made up of people out of the labour force and aged over 54. Constant-ratio classes are people younger than 54, or people still in the labour force, such as semi-retired pensioners; for these classes the proportion of pensioners is kept constant at the level of the year 2000, as was done for all the other benefits. This is based on the one hand on the negligible role of the ‘constant-ratio classes’ among pensioners; and on the other on the minimal relevance of these classes for policy objectives. The first aspect is due both to the low incidence of pensioners among people younger than 54 and to the negligible number of people older than 65 who are still in the labour force. For the second aspect, reform efforts are understandably aimed at increasing employment among those of working age (i.e. 15-65), rather than at raising the employment rates of older people.
By contrast, pensioners within the sensitive classes are projected in a more detailed way. The projection procedure can be summarised by referring to three elements:– the stock of existing pensioners in each period;– the inflow of new pensioners;– the number of pensioners dying in each period.The number of pensioners at time T can thus be determined by adding to the stock of pensioners at time T-1 the inflow of new pensioners, and subtracting pensioners who die between T-1 and T.
This procedure is partially constrained by the lack of data: because of overly wide age classes, a year by year application of the pension eligibility requirements to the

146 Annexes 147Annexes
employed workers is not feasible. To compute the flow of new pensioners for each year, the starting point is thus made up of the employed people aged 15-54 at time T; it is assumed that 40 years later all the pensioners will come from that class. The stock of pensioners at time T+40 can therefore be determined as a function of the employment rate at time T. From T on, the flow of new pensioners is computed annu-ally in order to reach this level in a linear manner. Variations of this linear path may however occur, since the computed T+40 number of pensioners may change at each year T as a function of the employment rates, which may vary in accordance with the demographic, economic and policy settings.
The average retirement period is calculated according to the most recent available mortality tables for each country, keeping them constant for the whole simulated period. It is assumed that each year a fraction of the previous year’s pensioners’ popu-lation dies, this fraction is set equal to the reciprocal of the average retirement period.
The average pension, as outlined above, not only includes the state pension, but also supplementary (second pillar) and personal (third pillar) schemes. This choice, apart from being consistent with the data provided by the echp, stresses the focus of the analysis, which is on the adequacy of the welfare systems rather than on the sustain-ability of state schemes.
The pension formulae of each country are not explicitly modelled; rather the elements that are included are the replacement ratio and the pension indexation mechanism.
At each time T, the average pension is determined as a weighted average of a) the pen-sion earned by pensioners existing at time T-1, and b) the pension calculated for new pensioners. Variable (b) is computed by multiplying the average wage at time T-1 by the replacement ratio. This replacement ratio is computed for the year 2000 and, unless pension reforms are introduced, is kept constant throughout the whole simu-lation.
As for the indexation mechanism, pensions are wage-indexed in Denmark and Ger-many, while they are indexed only to prices in Italy and the UK; hybrid situations are found in France, where most of the average pension (72%) is indexed to prices, and the Netherlands, where 96% of the average pension is indexed to wages.
A2.2 Feedback effects and elasticity matrices
Feedback effects are introduced to take into account the fact that modifying the wel-fare system in one respect is likely to have consequences both on other aspects of the same system and on the overall economic performance. Thus, for example, reduc-ing the beneficiaries of a particular provision is likely to change the number of people
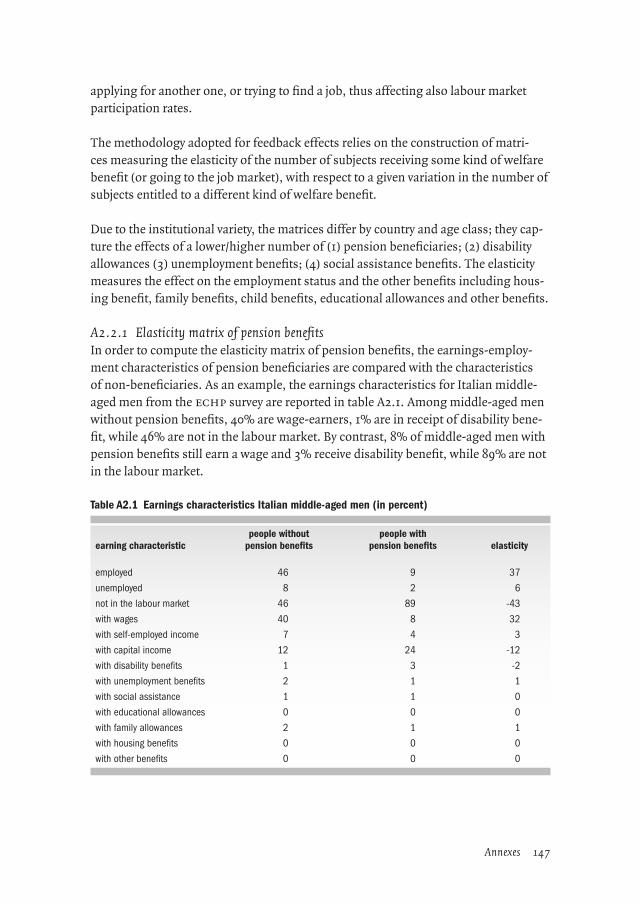
146 Annexes 147Annexes
applying for another one, or trying to find a job, thus affecting also labour market participation rates.
The methodology adopted for feedback effects relies on the construction of matri-ces measuring the elasticity of the number of subjects receiving some kind of welfare benefit (or going to the job market), with respect to a given variation in the number of subjects entitled to a different kind of welfare benefit.
Due to the institutional variety, the matrices differ by country and age class; they cap-ture the effects of a lower/higher number of (1) pension beneficiaries; (2) disability allowances (3) unemployment benefits; (4) social assistance benefits. The elasticity measures the effect on the employment status and the other benefits including hous-ing benefit, family benefits, child benefits, educational allowances and other benefits.
A2.2.1 Elasticity matrix of pension benefitsIn order to compute the elasticity matrix of pension benefits, the earnings-employ-ment characteristics of pension beneficiaries are compared with the characteristics of non-beneficiaries. As an example, the earnings characteristics for Italian middle-aged men from the echp survey are reported in table A2.1. Among middle-aged men without pension benefits, 40% are wage-earners, 1% are in receipt of disability bene-fit, while 46% are not in the labour market. By contrast, 8% of middle-aged men with pension benefits still earn a wage and 3% receive disability benefit, while 89% are not in the labour market.
Table A2.1 Earnings characteristics Italian middle-aged men (in percent)
earning characteristicpeople without
pension benefitspeople with
pension benefits elasticity
employed 46 9 37
unemployed 8 2 6
not in the labour market 46 89 -43
with wages 40 8 32
with self-employed income 7 4 3
with capital income 12 24 -12
with disability benefits 1 3 -2
with unemployment benefits 2 1 1
with social assistance 1 1 0
with educational allowances 0 0 0
with family allowances 2 1 1
with housing benefits 0 0 0
with other benefits 0 0 0

148 Annexes 149Annexes
The procedure for the computation of the elasticity matrix implicitly assumes that if a given number of people are no longer eligible for a pension, they will assume the earning characteristics of people without pension benefits. As the model describes a steady-state situation, any transitional states can be ignored. Therefore, a reduction in middle-aged male pensioners by 100 persons results in a rise of 37 employed men: of the 100 people who moved, 9 were already employed and 37 must be added to allow the shifted group to attain the employment level of 46% for men without pension benefits. The same line of reasoning may be applied to compute the effects of a reduc-tion in pension beneficiaries on the number of disability beneficiaries. As 1% of men without a pension has a disability benefit and 3% of people with a pension also have disability benefit, a reduction in the pension beneficiaries leads to a reduction in the number of disability benefits by 2% of the shifted group. Thus fewer pensions result simultaneously in fewer disability benefits. As can be seen, the elasticity on employ-ment is positive. If the number of pension beneficiaries is reduced by 100 persons, employment rises by 37 persons.
A2.2.2 Elasticity matrix of disability benefitsTo assess the effects of a variation in the number of disability benefits recipient, the method cannot be applied in the same way as it was for pension benefits. This is because current disability beneficiaries cannot simply be compared with people with-out disability benefit since they suffer from some infirmities. Therefore, the shifted group has to be compared to another group with approximately the same infirmi-ties. This is possible since the echp provides information on the self-reported dis-ability status of each respondent. Therefore, the group with a disability benefit is split into two classes: those with severe infirmities and a class that reports that they do not suffer from any infirmities; the same method is applied for the group without disabil-ity benefits.
Marital status is however another relevant aspect of the earnings characteristics of disabled people. Disabled people without a disability benefit are less likely to be eli-gible for other kinds of social assistance if they can rely on other earnings from a partner. Therefore, the classes are also split according to marital status, thus creating four sub-classes for the group receiving disability benefits (reporting infirmities and single, not reporting infirmities and single, reporting infirmities and not single, not reporting infirmities and not single), and likewise for the other group.
The elasticity can be calculated as for pensions by comparing homogeneous classes. As an example, those on disability benefit who are single and reported infirmities are compared with the same class from the group without disability benefits, and the same is done for all sub-classes.

148 Annexes 149Annexes
A2.2.3 Elasticity matrix of unemployment benefitsFor unemployment benefits, the same procedure is used as for the pension benefits with the exception that, because of the low number of people receiving unemploy-ment benefits, the elasticity is computed irrespective of age/gender classes. Once a group is redistributed from unemployment benefits to other categories, however, it is assumed to have been chosen randomly from among the recipients of unemployment benefits, meaning that the age structure of the ‘shifted’ group is the same. The elderly (65+) are left out of the analysis; moreover it is assumed that people losing unemploy-ment benefit cannot move on to pension or disability benefits, as governments would block this alternative route by tightening the eligibility constraints.
A2.3.4 Elasticity matrix of social assistance benefitsFor social assistance benefits, the same procedure is used as for unemployment ben-efits. No distinction is made between age/gender classes. In this case too, however, once a group is redistributed to other categories, it is assumed to have been chosen randomly from among the social assistance beneficiaries. And again it is assumed that people losing social assistance benefits cannot move on to pension or disability benefits, as governments would block these alternative routes by tightening the eligi-bility constraints.
A2.3 Measures in the institutional reform scenario
The Institutional Reform Scenario (irs) is defined with respect to the baseline sce-nario, but exogenous reform policies are considered. These policies have the aim of enhancing the financial sustainability of the welfare system while trying to preserve the adequacy of provisions in order to limit the costs in terms of poverty. Measures that are analysed for different countries depend both on the relevance of the sustain-ability and adequacy problems, and on the welfare model of which the country is taken as a representative, according to the priorities outlined in the institutional anal-ysis.
To allow the simulation of active policies the model has been made parametric to the following variables:
– The number of recipients of disability benefits, unemployment benefits and social assistance benefits. The number of people receiving such benefits can be changed with respect to the baseline scenario. In particular, the percentage variation of recipients with respect to the baseline projections may be chosen for 2025, and the model will gradually distribute this variation across the 25 years covered. Elasticity matrixes are applied (cf. section 2.4.3) to take into account cross-effects among benefits and between the benefit in question and the labour market.

150 Annexes 151Annexes
– The average amount of each of the above benefits. The percentage variations of such amounts with respect to their level at 2000 can be chosen, as well as the period during which these variations are expected to be implemented; the model will distribute the correction in a linear fashion over the selected timespan. How-ever, in this process the economic growth is not excluded, so that the final average benefits will result from the interaction between the imposed variation and the real economic growth.
– The replacement ratio for new pensioners. A percentage variation of the average replacement ratio (i.e. average pension as a ratio of average wage) with respect to its level in 2000 can be imposed, to be gradually implemented between 2000 and 2025. This variation is obtained without affecting the pensions of people who are already pensioners, and gradually varying the replacement ratio for the flows of incoming pensioners.
– The average retirement age. This can be changed to meet gradually a specific target increment (or decrement) in 2025. The middle-aged constitute the ‘sensitive class’ for this change. Variation of the retirement age obviously affects the number of pension beneficiaries. This will have cross-effects on other benefits and on the labour market; these effects are modelled, as stated above, through the elasticity matrixes.
The effects of each proposed measure from table 2.5 in the main text are analysed for the ‘notional contribution rate’ as is their effect on the poverty rate in the baseline sce-nario. Table A2.2. shows the effects of each separate measure on the notional contri-bution rate.
Table A2.2 Effect of each measure on the notional contribution rate in 2025 (in percent)
measureadjustment
pensionpension
age
disability beneficia-
riesdisability benefits
unemploy-ment ben-eficiaries
unemploy-ment
benefits
soc assis-tance ben-eficiaries
soc assis-tance
benefits
Denmark -2.5 -2.1 -0.5 -0.5 -0.6 -0.5 -0.3 -0.1
Netherlands -3.6 -1.6 -0.5 -0.6 -0.2 -0.2 -0.2 -0.2
Germany -3.0 -2.7 -0.2 -0.2 -0.3 -0.3 -0.1 0.0
France -2.8 -2.9 -0.3 -0.2 -0.2 -0.2 -0.1 0.0
Italy -2.3 -3.2 -0.2 -0.2 -0.1 -0.1 0.0 0.0
United Kingdom -3.1 -2.3 -0.6 -0.4 -0.1 -0.1 -0.5 -0.1
As can be seen, all measures ease the sustainability problem, since for all measures and countries the national contribution rate declines. The measures in the pension system have the biggest impact on the contribution rates, as the expenditure on pen-

150 Annexes 151Annexes
sions in all welfare regimes is the highest compared with the other provisions. In Denmark, Germany, the Netherlands and France, a reduction in pensions levels for new pensioners is the most effective measure. In France and Italy, raising the pension age is the more effective measure. Second best are measures on disability or unem-ployment provisions. The effects on the contribution rate are between 0.1% and 0.6%. The impact on the contribution rate of a measure in the social assistance system is relatively low, as expenditure on social assistance is also relatively low.
Table A2.3 shows the effect of each measure on the poverty rates.
Table A2.3 Effect of each measure on the poverty rate in 2025 (in percent)
measure
adjust-ment
pensionpension
age
disability beneficia-
riesdisability benefits
unemploy-ment benefi-
ciaries
unemploy-ment
benefits
soc assis-tance ben-eficiaries
soc assis-tance
benefits
Denmark 2.5 -0.7 0.0 0.5 0.0 0.2 0.0 0.3
Netherlands 2.2 -0.2 -0.1 0.5 0.0 0.0 -0.2 0.4
Germany 1.1 -0.1 0.0 0.1 0.0 0.3 -0.1 0.0
France 0.9 0.5 0.2 0.3 0.1 0.0 0.0 0.0
Italy 1.2 0.3 0.1 0.3 0.1 0.0 0.0 0.0
United Kingdom 2.3 0.6 0.1 0.6 0.0 0.0 0.0 0.2
A reduction in the number of beneficiaries or in benefit levels leads to higher poverty rates for almost all measures. The effect of a reduction in pension levels, in particular, is relatively large. If pensions are lowered, older people cannot improve their income position by accepting a new job, and reducing their pension therefore leads to a mark-edly higher poverty rate. Some measures, for instance raising the pension age, lead to lower poverty rates. This is due to the fact that people move from pension to work, enabling them to earn a higher income and thus avoiding poverty. This happens in Denmark, the Netherlands and Germany. In the other countries, raising the pension age probably leads to greater take-up of disability or unemployment benefits, thus raising the poverty rates.
A2.4 Optimisation procedure in participation scenario
Some European countries, given their starting position, will have to devise an ade-quate set of policies in order to achieve the Lisbon and Stockholm targets without excessive social costs. Intuitively, the transition towards these targets involves a cer-tain effort or cost. Policies are likely to keep this effort to a minimum and this, in turn, should result in a smooth rise in employment figures.
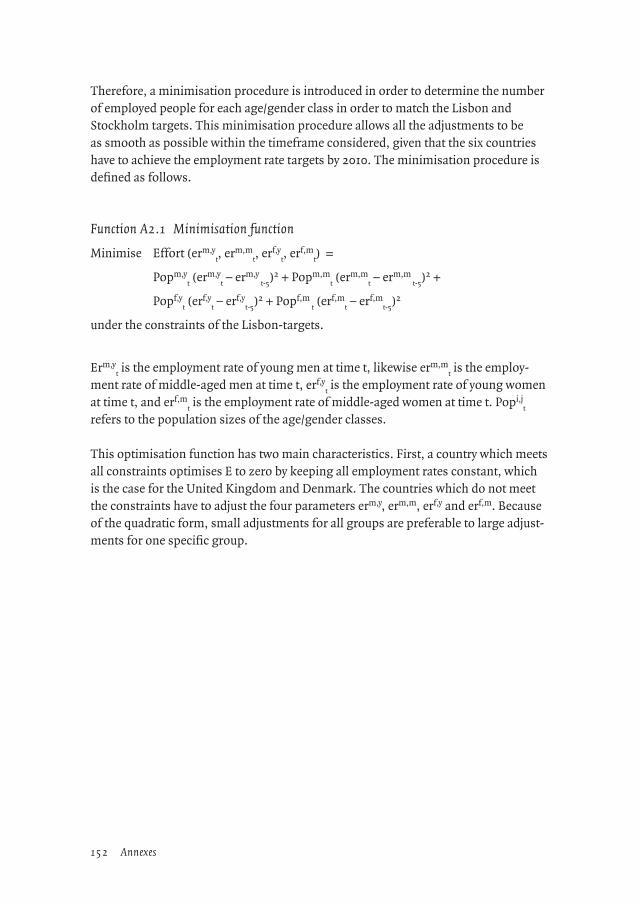
152 Annexes 153Annexes
Therefore, a minimisation procedure is introduced in order to determine the number of employed people for each age/gender class in order to match the Lisbon and Stockholm targets. This minimisation procedure allows all the adjustments to be as smooth as possible within the timeframe considered, given that the six countries have to achieve the employment rate targets by 2010. The minimisation procedure is defined as follows.
Function A2.1 Minimisation function
Minimise Effort (erm,yt, erm,m
t, erf,y
t, erf,m
t) =
Popm,yt (erm,y
t – erm,y
t-5)2 + Popm,m
t (erm,m
t – erm,m
t-5)2 +
Popf,yt (erf,y
t – erf,y
t-5)2 + Popf,m
t (erf,m
t – erf,m
t-5)2
under the constraints of the Lisbon-targets.
Erm,yt is the employment rate of young men at time t, likewise erm,m
t is the employ-
ment rate of middle-aged men at time t, erf,yt is the employment rate of young women
at time t, and erf,mt is the employment rate of middle-aged women at time t. Popi,j
t
refers to the population sizes of the age/gender classes.
This optimisation function has two main characteristics. First, a country which meets all constraints optimises E to zero by keeping all employment rates constant, which is the case for the United Kingdom and Denmark. The countries which do not meet the constraints have to adjust the four parameters erm,y, erm,m, erf,y and erf,m. Because of the quadratic form, small adjustments for all groups are preferable to large adjust-ments for one specific group.

152 Annexes 153Annexes
Annex A3 echp
Empirical income comparisons between countries used to be based mainly on offi-cial statistics. One problem with this was that the income definitions between coun-tries used by the national administrations were usually different. Each country has its own fiscal and social security arrangements and the income definitions for scien-tific research are usually linked to these national statutory regulations. This situation changed with the arrival of the Luxembourg Income Study and the European Commu-nity Household Panel (echp). Both databases contain detailed, mutually comparable incomes of a sample from all households at both household and household member level. The Luxembourg Income Study is based on existing surveys in which income measurement was not always the central focus. Therefore, the databases are provided on an irregular basis and with different sample years.
Therefore, in this study the 1999 version of the echp was used to provide income data for 1998; this database is provided by Eurostat. The central focus of the echp project is to provide mutually comparable income data over all 15 current European Union member states. Unfortunately, no income data on the ten new member states is avail-able in either the echp or the lis.
For the selected countries, the following number of households and persons were used in this analysis.
Table A3.1 Number of available households
country number of households number of persons 16 years or older
Denmark 2.381 4.142
The Netherlands 4.981 9.601
Germany 5.845 11.677
France 5.593 10.763
Italy 6.273 15.347
United Kingdom 4.935 9.446
Source: ECHP (1999)
The echp not only provide income details for all respondents, but also a more detailed analysis of their household situation. For instance, for every inhabitant in the household, the employment status, the health, education and relation to the other inhabitants are included in the survey.
One of the main objectives of the echp was to use to same income definition for all countries. The echp provides information only on net incomes. This is the gross

154 Annexes 155Annexes
income (primary income) after social transfers and taxes increased by housing ben-efits and educational allowances. Individual incomes are split into 8 categories:
– Wages and salaries Normal income from work as an employee or apprentice and additional earnings
from overtime, commission or tips. Additional payments (13th and 14th month’s salary), holiday pay or allowance, profit-sharing bonus, other lump-sum payments and company shares are also included.
– Self-employed income Data on income from a person’s own business, profession or farm are gathered
as the pre-tax profit, i.e. the profit after deducting all expenses and wages paid, but before deducting tax or funds withdrawn for private use. This pre-tax profit is converted into net profit on the basis of a net/gross ratio.
– Capital income– Income from property Rental income after deducting mortgage, repairs, maintenance, insurance.
The value before tax is converted into a net figure on the basis of a net/gross ratio. Data on income from property is gathered at household level and divided equally among all adult members (persons aged 16 or more) of the household.
– Capital income Interest on savings certificates, bank deposits and dividend from shares.– Private transfers Any financial support or maintenance from relatives, friends or other persons
outside the household.– Old-age and surviving dependants’ pensions Pensions or benefits relating to old age or retirement from basic (first pillar),
supplementary (second pillar), personal (third pillar) schemes, means-tested wel-fare, early retirement and other age-related schemes. Widow’s pension from the three pillars and from the means-tested welfare scheme, other widow’s benefits, orphan’s pensions or allowances are also included.
– Disability/Sickness benefits Income maintenance benefits in the event of sickness and injury, other sickness
benefits and compensations for occupational accidents or diseases, disability pen-sion and other invalidity benefits.
– Unemployment benefits Any benefit related to unemployment, job creation or training, such as unemploy-
ment benefits, unemployment assistance, training/retraining allowance, place-ment, resettlement and rehabilitation benefits or other.
– Social assistance Payments from the welfare office. Data are collected at household level and divided
equally among all adult members (persons aged 16 or more) of the household.
154 Annexes 155Annexes
– Other benefits– Housing benefit Subsidies or other payments from public schemes to help meet housing costs.
Data are gathered at household level and divided equally among all adult mem-bers (persons aged 16 or more) of the household.
– Family-related benefits Child allowance, attendance allowance, maternity benefit, birth allowance,
unmarried mother’s allowance, deserted wife’s allowance and other family-related benefits.
– Education-related benefits Scholarships or study grants.– Other benefits Residual benefits not included in the above subcategories.
156 Annexes 157Annexes
Annex A4 Weighting and adjustment of echp
In this study, the developments as projected by the demographic-economic macro model are translated into the micro-level of household members by adjusting the echp (see section 3.1). By doing this, a 2025-situation is simulated through which it is possible to analyse future income distributions and poverty rates. In this annex the procedure for adjusting the echp according to the macro-projections is described in more detail.
The demographic household projections (see Alders, 1998) are the key figures in this study. These are projections of total populations for all eu-15 countries up to 2025, divided by gender and 10-year classes (0-14, 15-24, 25-34, 35-44, 45-54, 55-64, 65-74 and 75 and over). In contrast to standard demographic projections, these projections also contain projections of the division of the population by household status for each age/gender class. The household status of a person can be ‘single’, ‘living with a part-ner’, ‘child’, and ‘other’. The denomination ‘child’ refers to the household position: if a 30-year man lives in the household of his parents, his household status is ‘child’.
It is important that the echp is consistent with these projections for the years 2000 and 2025. Therefore, the echp 1999 was reweighted according to the household pro-jections for the year 2000. As the labour market status (employed, unemployed and out of the labour market) is also one of the important factors in this study, the EHCP 1999 also had to be made consistent with the oecd-labour market statistics for the year 2000. This was done by simultaneously reweighting the echp to the demo-graphic situation in 2000 as well as the employment statistics in 2000.
For the reweighting procedure the g-Calib-procedure (generalised Calibration) of Statistics Belgium was used. This method is described in more detail in Vanderhoeft (2001). The procedure is programmed in spss by Statistics Belgium, which kindly provided the software. This weighting procedure quickly calibrates the initial weights to match the echp to the population profile and employment statistics. The weights are calculated on an individual level, although the restriction was applied that house-hold members had to have an equal weight. The standard weights provided by the echp were used as the initial weights. After this reweighting procedure the welfare regime statistics were calculated (see section 3.2.3)
For simulation up to the year 2025, the number of recipients for each income compo-nent also had be taken into account in the weighting procedure, besides the demo-graphical and labour market projections. The macro model projects these numbers for each age (15-54, 55-64 and 65 years and over) and gender class. Therefore, the same procedure was used under the extra constraints of the number of income recipi-

156 Annexes 157Annexes
ents. However, due to the large number of calibration figures, the Calib-procedure could not find a feasible solution in the initial run for most countries. Therefore, some age classes had to be joined in the demographic projections: the age classes 15-24, 25-34, 35-44, 45-54, 65-74 and 75 were joined to form three classes: 15-34, 35-54, and 65 year and over. After this adjustment, the weighting procedure was able solve the calibration.
The last step in the simulation is the adjustment of the incomes in the echp. The demographic-economic model projects the average amount of all income compo-nents by age/gender class. For each age/gender class, all income components are adjusted in the survey by the multiplying the amounts of the incomes of this compo-nent in the survey by a factor to match the projected average amount of that compo-nent. The simulated income components are then summed up to achieve simulated personal incomes.

158 Annexes 159Annexes
Annex A5 Decomposition of income inequality
It is possible to decompose income inequality measured by the Theil index by three key statistics per group: the proportion of the group, the relative average income position, and the inequality within each group. Formula A.1 gives the relationship between the Theil-statistic and the various group-statistics. This relationship has been proven by Mookherjee and Shorrocks (1982).
( ) I +I
Iip +iip = I
withinbetween
ggg
g
ggg
g
=
��
ln
In formula 5.1, I is income inequality according to the Theil index, pg the size of group g with respect to total population, ig is the ratio between average income of group g and average income of total population, and Ig is defined as the ‘within income inequality’ of group g. As can be seen from the formula, total inequality can be split up into a component which describes inequality because of the differences in aver-age incomes between groups (I
between) and into a component which totals the within
inequalities of the various groups (Iwithin
).
The ‘between group inequality’ (Ibetween
) depends entirely on the relative size of the
groups and their average incomes. The greater the differences between the average incomes of the various groups, the higher I
between will be. If all average incomes of the
groups were equal, all ig would be equal to 1, and consequently Ibetween
is zero.
The second part of the formula depends on the various income inequalities within the groups. If the within inequality Ig of one single group rises by 1 while the size and the average income of this group stays constant, total inequality will increase by the prod-uct of p
g and i
g. If all groups were completely homogenous (e.g. all members of the
same group had the same income), all Ig would be zero and the total inequality would be determined solely by the inequality between the groups.
The changing sizes of the groups, average incomes and within income inequali-ties will lead to changes in the total inequality. To separate the effects, formulas are derived for changes in income inequality according to Pommer et al. (2003). The explanation of the changes between moment x or moment y (or scenario x and scenario y) can be determined from the separate changes. Note that according to Mookherjee and Shorrocks (1982):
I p + p = I + I = I g
gg
g
ggg
gwithinbetween µ
µµµ
µµ �� ��
�
����
�ln
(A5.1)
(A5.2)
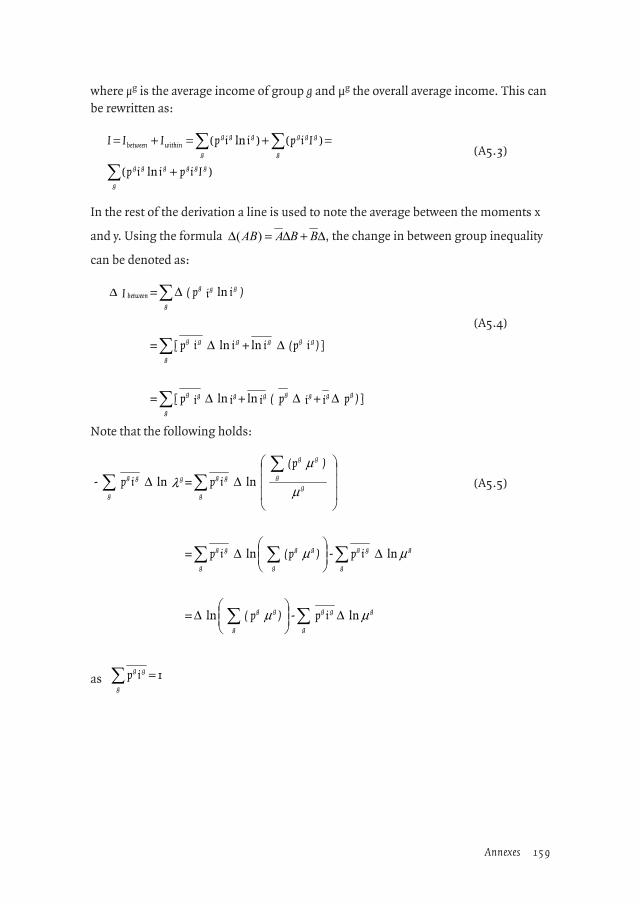
158 Annexes 159Annexes
where µg is the average income of group g and µg the overall average income. This can be rewritten as:
�
��+
=+=+=
g
gggggg
g
ggg
g
gggwithinbetween
Iipiip
IipiipIII
)ln(
)()ln(
In the rest of the derivation a line is used to note the average between the moments x
and y. Using the formula ������ ∆+∆=∆ �� , the change in between group inequality
can be denoted as:
] ) p i + i p( i + i i p [ =
] )i p( i + i i p [ =
) i i p( = I
gggggggg
g
gggggg
g
ggg
gbetween
∆∆∆
∆∆
∆∆
�
�
�
lnln
lnln
ln
�
Note that the following holds:
µµ
µµ
µ
µλ
ggg
g
gg
g
ggg
g
gg
g
gg
g
g
gg
ggg
g
ggg
g
ip - ) p( =
ip - ) p( ip =
) p(
ip = ip -
lnln
lnln
lnln
∆���
����
�∆
∆���
����
�∆
���
�
�
���
�
�
∆∆
��
���
���
�
as 1=� gg
g
ip
(A5.4)
(A5.3)
(A5.5)

160 Annexes 161Annexes
The first term of this formula can be denoted as:
] / pi + 1 [ + ] p i - 1 [ - =
p
] p+ [p
+ p
])p( - [p
- =
p
p
+ p
p
- =
) p
1 +
p
1 - =
) ( p - )( p = ) p(
gx
ggx
gx
g
ggy
g
gx
gx
g
ggx
gx
gx
g
gy
gy
g
gy
ggy
gy
g
gx
gx
g
gy
gx
g
gy
gy
g
gy
gx
g
gx
gx
g
gy
gy
g
gx
gx
g
gy
gy
g
gg
g
µµ
µ
µµ
µ
µµ
µ
µ
µ
µ
µµ
µµµ
∆∆
���
�
�
���
�
� ∆
���
�
�
���
�
� ∆
���
�
�
���
�
�
���
�
�
���
�
�
���
�
�
���
�
�
���
�
�
���
�
�
���
����
����
����
����
����
�∆
��
��
��
��
��
��
���
lnln
lnln
lnln
lnln
lnlnln
Combining formula A5.3 and A5.4 gives
B + A =
p i + ) p+p(
- 1
p )i(
+ ] + ] /pi+[1 -] pi -[1[ip = I
gggggg
ggy
gx
gggg
g
ggx
ggx
gx
g
ggx
g
gg
gbetween
���
�
���
�∆
���
�
���
�∆∆∆��
�
����
�
∆∆∆∆
��
���
µµµµ
µµµ
µµµ
ln
lnlnln
�
in which
���
�
���
�∆∆��
�
����
�
∆∆
���
�
���
�∆∆
∆
��
��
��
��
)p(
- 1
pi(
+ ] +] / pi +[1[-ip = B
p i+)p(
p -)i(
+ pi-(1 ip [ =A
gg
ggy
gx
gggg
g
ggx
gpx
px
g
gg
g
gggg
ggy
gx
ggg
g
ggy
g
gg
g
µµµ
µµµ
µµµ
µµµ
µ
)ln
lnln
ln
})ln
(A5.6)
(A5.7)
(A5.8)

160 Annexes 161Annexes
which separates the effects of Δpg en Δµg.
The change in the within inequality is:
] )ip+pi(I+I ip [ =
)]ip( I + I ip [ =
) Iip( = I
gggggggg
g
gggggg
g
ggg
gwithin
∆∆∆
∆∆
∆∆
�
�
�
�
Δig can be rewritten with :
���
����
�∆∆��
�
����
����
����
�∆∆
µµµ
µµµ ������ ���
� �
) p + p(
1 - =
- = - (
1 =
1 -
1 =
1
gggg
gxy
xyyx
xy
xy
∆∆
∆
���
����
����
����
����
����
�∆
� µµµµ
µµµµµ
µµ
µµµ
)
where
As a result, the change in within inequality can be written as
���
�
���
�∆∆��
�
����
�
��
�
�
��
�
�∆∆
∆
���
�
���
�
���
�
���
�∆∆∆��
�
����
�∆∆
���
�
���
�
���
�
���
����
����
�∆∆��
�
����
�∆∆∆
��
���
�
��
�
) p( - 1
p I +
)p ( I p
- p I +
I ip =
) p +p( - 1
p I + p i I + I ip =
1+
1 p I + p i I + I ip = I
gg
gyx
gggg
g
gg
gyx
ggg
g
ggg
g
ggg
g
gggg
gyx
gggggggggg
g
gggggggggg
gwithin
µµµ
µµµ
µµµ
µλ
µµµµ
µµµ
µµµ
µ
with separate effects of ΔIg, Δpg en Δµg.
(A5.9)
(A5.10)
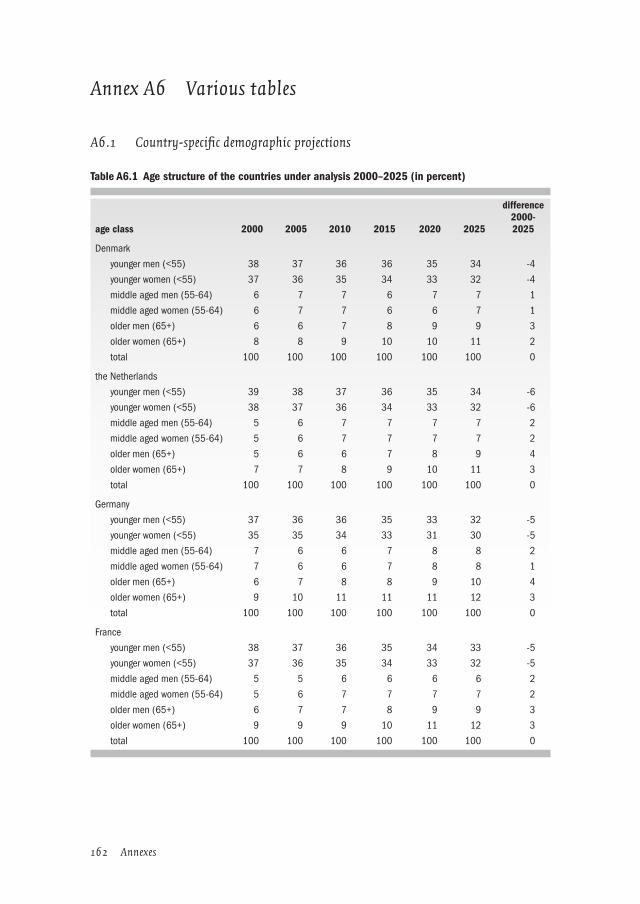
162 Annexes 163Annexes
Annex A6 Various tables
A6.1 Country-specific demographic projections
Table A6.1 Age structure of the countries under analysis 2000–2025 (in percent)
age class 2000 2005 2010 2015 2020 2025
difference 2000-2025
Denmark
younger men (<55) 38 37 36 36 35 34 -4
younger women (<55) 37 36 35 34 33 32 -4
middle aged men (55-64) 6 7 7 6 7 7 1
middle aged women (55-64) 6 7 7 6 6 7 1
older men (65+) 6 6 7 8 9 9 3
older women (65+) 8 8 9 10 10 11 2
total 100 100 100 100 100 100 0
the Netherlands
younger men (<55) 39 38 37 36 35 34 -6
younger women (<55) 38 37 36 34 33 32 -6
middle aged men (55-64) 5 6 7 7 7 7 2
middle aged women (55-64) 5 6 7 7 7 7 2
older men (65+) 5 6 6 7 8 9 4
older women (65+) 7 7 8 9 10 11 3
total 100 100 100 100 100 100 0
Germany
younger men (<55) 37 36 36 35 33 32 -5
younger women (<55) 35 35 34 33 31 30 -5
middle aged men (55-64) 7 6 6 7 8 8 2
middle aged women (55-64) 7 6 6 7 8 8 1
older men (65+) 6 7 8 8 9 10 4
older women (65+) 9 10 11 11 11 12 3
total 100 100 100 100 100 100 0
France
younger men (<55) 38 37 36 35 34 33 -5
younger women (<55) 37 36 35 34 33 32 -5
middle aged men (55-64) 5 5 6 6 6 6 2
middle aged women (55-64) 5 6 7 7 7 7 2
older men (65+) 6 7 7 8 9 9 3
older women (65+) 9 9 9 10 11 12 3
total 100 100 100 100 100 100 0

162 Annexes 163Annexes
Table A6.1 Age structure of the countries under analysis 2000–2025 (in percent) (Cont’d)
age class 2000 2005 2010 2015 2020 2025
difference 2000-2025
Italy
younger men (<55) 36 35 35 34 33 31 -5
younger women (<55) 35 34 34 33 31 30 -5
middle aged men (55-64) 6 6 6 6 7 8 2
middle aged women (55-64) 6 6 6 7 7 8 2
older men (65+) 7 8 8 9 9 10 3
older women (65+) 10 11 11 12 12 13 3
total 100 100 100 100 100 100 0
United Kingdom
younger men (<55) 38 37 37 36 34 33 -5
younger women (<55) 37 36 35 34 33 32 -5
middle aged men (55-64) 5 6 6 6 7 7 2
middle aged women (55-64) 5 6 6 6 7 7 2
older men (65+) 6 7 7 8 8 9 3
older women (65+) 9 9 9 10 10 11 2
total 100 100 100 100 100 100 0
Source: EUROSTAT (2000)

164 Annexes 165Annexes
A6.2 Income inequality decomposition statistics
Table A6.2 Populations, income and income inequality according to main household income, baseline scenario
population (%)
average income (% of average)
income inequality(theil-statistic)
2000 2025differ-ence 2000 2025
differ-ence 2000 2025
difference (%)
Nordic regime (DK)
wages 68 63 -6 109 111 2 0.065 0.066 0.1
self-employment income 5 4 0 119 121 2 0.213 0.253 4.0
old age pension 18 23 6 74 75 0 0.096 0.101 0.4
disability 4 4 0 71 74 4 0.087 0.086 0.0
unemployment benefit 2 2 1 79 81 3 0.070 0.076 0.6
social assistance 1 0 0 85 77 -9 0.058 0.039 -1.9
other income components 3 3 0 81 93 15 0.551 0.595 4.4
Hybrid regime (NL)
wages 69 60 -9 104 105 1 0.096 0.100 0.4
self-employment income 3 3 0 133 137 3 0.303 0.303 -0.1
old age pension 18 27 9 95 95 0 0.129 0.128 -0.1
disability 5 5 0 73 73 1 0.094 0.090 -0.4
unemployment benefit 1 2 1 82 88 7 0.119 0.100 -2.0
social assistance 2 2 0 53 50 -6 0.041 0.032 -0.9
other income components 2 2 0 70 76 8 0.589 0.553 -3.6
Continental regime (D)
wages 65 59 -6 102 105 3 0.077 0.079 0.2
self-employment income 6 5 -1 145 150 3 0.243 0.246 0.3
old age pension 23 30 7 92 88 -5 0.092 0.091 -0.2
disability 1 1 0 71 71 0 0.162 0.162 0.0
unemployment benefit 3 2 0 58 60 4 0.095 0.097 0.2
social assistance 0 0 0 47 44 -7 0.088 0.114 2.6
other income components 2 2 0 77 83 7 0.612 0.662 5.0
Continental regime (F)
wages 60 53 -7 106 109 3 0.107 0.112 0.4
self-employment income 7 6 0 131 129 -1 0.475 0.453 -2.3
old age pension 25 33 8 92 90 -2 0.125 0.125 0.0
disability 2 1 0 68 69 1 0.125 0.105 -2.0
unemployment benefit 2 2 0 67 72 7 0.255 0.265 1.1
social assistance 0 0 0 39 36 -8 0.061 0.066 0.4
other income components 5 5 0 55 55 -1 0.233 0.265 3.2
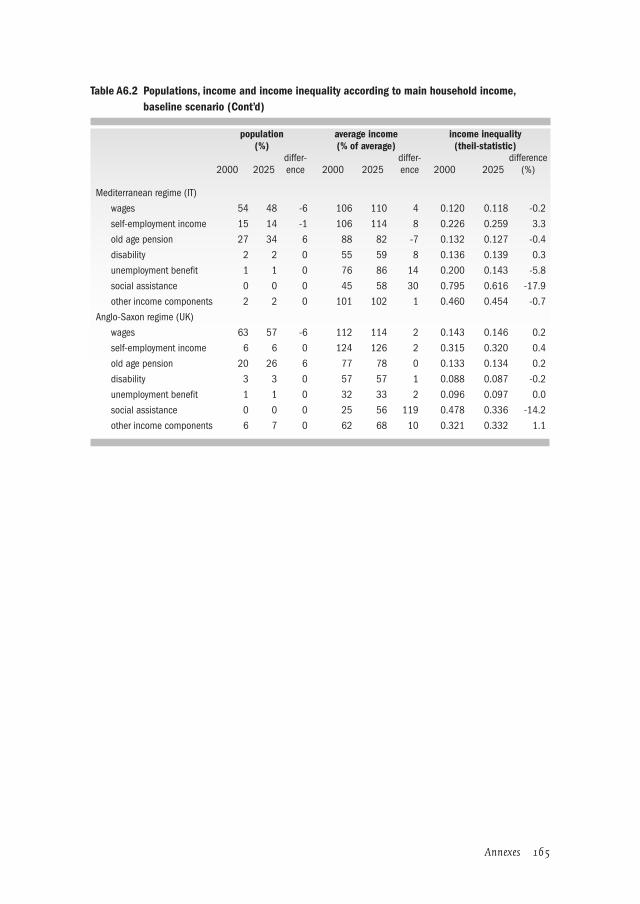
164 Annexes 165Annexes
Table A6.2 Populations, income and income inequality according to main household income, baseline scenario (Cont’d)
population(%)
average income (% of average)
income inequality(theil-statistic)
2000 2025differ-ence 2000 2025
differ-ence 2000 2025
difference (%)
Mediterranean regime (IT)
wages 54 48 -6 106 110 4 0.120 0.118 -0.2
self-employment income 15 14 -1 106 114 8 0.226 0.259 3.3
old age pension 27 34 6 88 82 -7 0.132 0.127 -0.4
disability 2 2 0 55 59 8 0.136 0.139 0.3
unemployment benefit 1 1 0 76 86 14 0.200 0.143 -5.8
social assistance 0 0 0 45 58 30 0.795 0.616 -17.9
other income components 2 2 0 101 102 1 0.460 0.454 -0.7
Anglo-Saxon regime (UK)
wages 63 57 -6 112 114 2 0.143 0.146 0.2
self-employment income 6 6 0 124 126 2 0.315 0.320 0.4
old age pension 20 26 6 77 78 0 0.133 0.134 0.2
disability 3 3 0 57 57 1 0.088 0.087 -0.2
unemployment benefit 1 1 0 32 33 2 0.096 0.097 0.0
social assistance 0 0 0 25 56 119 0.478 0.336 -14.2
other income components 6 7 0 62 68 10 0.321 0.332 1.1

166 Annexes 167Annexes
Table A6.3 Populations, income and income inequality by age and household position/ number of earners
population(%)
average income(% of average)
income inequality (theil-statistic)
2000 2025differ-ence 2000 2025
differ-ence 2000 2025
difference (%)
Nordic (DK)
couple/two earners 43 37 -6 120 123 3 0.056 0.054 -0.1
couple/single earner 14 13 -1 98 102 5 0.109 0.136 2.7
couple/no earner 4 4 0 71 73 1 0.057 0.061 0.3
single/earner 12 13 1 95 96 1 0.062 0.060 -0.3
single/no earner 6 7 1 63 64 1 0.181 0.169 -1.3
other 4 3 -1 93 99 6 0.131 0.112 -1.9
65 years/couple 9 14 5 87 88 0 0.182 0.191 0.9
65 years/single 9 10 1 69 70 1 0.103 0.109 0.6
65 year/other 0 0 0 177 146 -31 0.048 0.076 2.8
Hybrid (NL)
couple/two earners 29 24 -5 122 123 1 0.081 0.077 -0.4
couple/single earner 31 26 -5 94 98 4 0.103 0.109 0.6
couple/no earner 8 7 0 72 74 2 0.155 0.158 0.4
single/earner 7 10 3 111 111 0 0.155 0.144 -1.1
single/no earner 5 6 2 65 67 1 0.174 0.190 1.6
other 5 3 -2 88 89 1 0.079 0.076 -0.3
65 years/couple 9 15 6 98 97 -1 0.115 0.114 -0.2
65 years/single 6 8 2 92 94 3 0.205 0.206 0.1
65 year/other 0 1 0 104 102 -3 0.115 0.122 0.7
Continental (D)
couple/two earners 28 24 -4 118 122 4 0.084 0.086 0.2
couple/single earner 28 24 -4 98 102 4 0.103 0.109 0.6
couple/no earner 8 8 -1 78 78 -1 0.131 0.127 -0.4
single/earner 9 11 1 104 107 2 0.127 0.128 0.1
single/no earner 5 5 0 65 63 -3 0.196 0.187 -0.9
other 3 2 -1 94 102 9 0.145 0.142 -0.3
65 years/couple 11 16 6 100 94 -6 0.084 0.083 -0.1
65 years/single 7 9 1 89 86 -3 0.116 0.123 0.7
65 year/other 1 1 0 112 115 3 0.052 0.050 -0.2
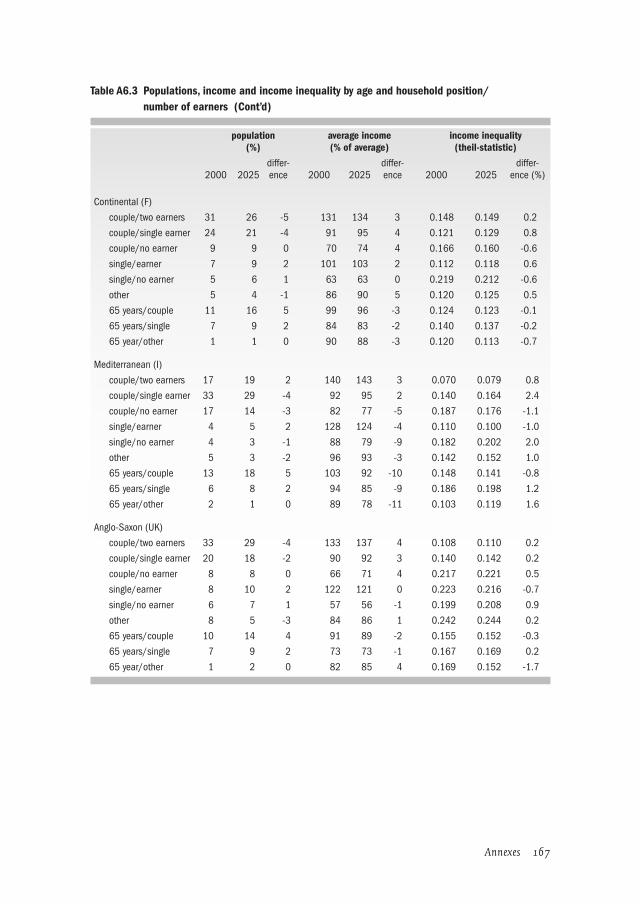
166 Annexes 167Annexes
Table A6.3 Populations, income and income inequality by age and household position/ number of earners (Cont’d)
population(%)
average income(% of average)
income inequality(theil-statistic)
2000 2025differ-ence 2000 2025
differ-ence 2000 2025
differ-ence (%)
Continental (F)
couple/two earners 31 26 -5 131 134 3 0.148 0.149 0.2
couple/single earner 24 21 -4 91 95 4 0.121 0.129 0.8
couple/no earner 9 9 0 70 74 4 0.166 0.160 -0.6
single/earner 7 9 2 101 103 2 0.112 0.118 0.6
single/no earner 5 6 1 63 63 0 0.219 0.212 -0.6
other 5 4 -1 86 90 5 0.120 0.125 0.5
65 years/couple 11 16 5 99 96 -3 0.124 0.123 -0.1
65 years/single 7 9 2 84 83 -2 0.140 0.137 -0.2
65 year/other 1 1 0 90 88 -3 0.120 0.113 -0.7
Mediterranean (I)
couple/two earners 17 19 2 140 143 3 0.070 0.079 0.8
couple/single earner 33 29 -4 92 95 2 0.140 0.164 2.4
couple/no earner 17 14 -3 82 77 -5 0.187 0.176 -1.1
single/earner 4 5 2 128 124 -4 0.110 0.100 -1.0
single/no earner 4 3 -1 88 79 -9 0.182 0.202 2.0
other 5 3 -2 96 93 -3 0.142 0.152 1.0
65 years/couple 13 18 5 103 92 -10 0.148 0.141 -0.8
65 years/single 6 8 2 94 85 -9 0.186 0.198 1.2
65 year/other 2 1 0 89 78 -11 0.103 0.119 1.6
Anglo-Saxon (UK)
couple/two earners 33 29 -4 133 137 4 0.108 0.110 0.2
couple/single earner 20 18 -2 90 92 3 0.140 0.142 0.2
couple/no earner 8 8 0 66 71 4 0.217 0.221 0.5
single/earner 8 10 2 122 121 0 0.223 0.216 -0.7
single/no earner 6 7 1 57 56 -1 0.199 0.208 0.9
other 8 5 -3 84 86 1 0.242 0.244 0.2
65 years/couple 10 14 4 91 89 -2 0.155 0.152 -0.3
65 years/single 7 9 2 73 73 -1 0.167 0.169 0.2
65 year/other 1 2 0 82 85 4 0.169 0.152 -1.7

168 Annexes 169Annexes
Table A6.4 Populations, income and income inequality by main household income, baseline (BS) and Participation scenario (PS) 2025
population (%)
average income (% of average)
income inequality(theil-statistic)
BS PSdiffer-ence BS PS
differ-ence BS PS
differ-ence (%)
Nordic (DK) wages 63 63 1 111 110 -1 0.066 0.066 0.0 self income 4 4 0 121 121 0 0.253 0.269 1.6 old age pension 23 23 0 75 75 1 0.101 0.101 0.0 disability 4 4 0 74 74 0 0.086 0.093 0.7 unemployment benefit 2 2 0 81 81 -1 0.076 0.074 -0.2 social assistance 0 0 0 78 78 0 0.039 0.036 -0.3 other income components 3 3 0 93 97 4 0.595 0.601 0.5
Hybrid (NL) wages 60 62 1 105 104 -1 0.100 0.096 -0.5 self income 3 3 0 137 138 1 0.303 0.304 0.2 old age pension 27 26 -1 95 96 1 0.128 0.131 0.3 disability 5 4 0 73 74 1 0.090 0.092 0.2 unemployment benefit 2 1 0 88 91 4 0.100 0.115 1.5 social assistance 2 2 0 50 49 -1 0.032 0.034 0.1 other income components 2 2 0 76 73 -3 0.553 0.538 -1.5
Continental (D) wages 59 60 2 105 104 -1 0.079 0.078 -0.1 self income 5 5 0 150 148 -2 0.246 0.249 0.3 old age pension 30 29 -1 88 89 1 0.091 0.091 0.0 disability 1 1 0 72 71 0 0.162 0.149 -1.3 unemployment benefit 2 2 0 60 60 0 0.097 0.102 0.5 social assistance 0 0 0 44 43 -1 0.114 0.110 -0.4 other income components 2 2 0 83 85 2 0.662 0.663 0.1
Continental (F) wages 53 56 3 109 105 -4 0.112 0.111 0.0 self income 6 7 1 129 124 -5 0.453 0.379 -7.4 old age pension 33 32 -2 90 93 3 0.125 0.124 -0.1 disability 1 1 0 69 74 6 0.105 0.096 -0.9 unemployment benefit 2 1 0 72 73 1 0.265 0.247 -1.9 social assistance 0 0 0 36 35 -1 0.066 0.060 -0.6 other income components 5 3 -2 55 56 1 0.265 0.309 4.4
Mediterranean (I) wages 48 50 2 110 106 -4 0.118 0.114 -0.3 self income 14 14 0 114 111 -3 0.259 0.257 -0.2 old age pension 34 33 -1 82 88 5 0.127 0.121 -0.6 disability 2 1 0 59 58 -1 0.139 0.148 0.9 unemployment benefit 1 1 0 86 84 -2 0.143 0.164 2.1 social assistance 0 0 0 58 64 6 0.616 0.608 -0.8 other income components 2 1 -1 102 103 1 0.454 0.472 1.8

168 Annexes 169Annexes
Table A6.4 Populations, income and income inequality by main household income, baseline (BS) and Participation scenario (PS) 2025 (Cont’d)
population(%)
average income(% of average)
income inequality(theil-statistic)
BS PSdiffer-ence BS PS
differ-ence BS PS
difference (%)
Anglo-Saxon (UK)
wages 57 58 1 114 114 -1 0.146 0.142 -0.4
self income 6 6 0 126 127 1 0.320 0.327 0.7
old age pension 26 26 0 78 78 0 0.134 0.133 -0.1
disability 3 3 0 57 57 -1 0.087 0.087 0.1
unemployment benefit 1 1 0 33 33 0 0.097 0.099 0.2
social assistance 0 0 0 56 59 3 0.336 0.295 -4.1
other income components 7 6 0 68 69 1 0.332 0.336 0.3
Table A6.5 Effects participation scenario on income inequality in 2025, decomposition by main income component (theil-statistic)
between group inequality within inequality total inequality
effect of: sizes average income sizes
average income
within inequality total
Nordic (DK) 0.000 -0.001 -0.001 0.001 0.001 0.000
Hybrid (NL) 0.000 0.000 0.000 0.000 -0.002 -0.003
Continental (D) 0.000 -0.001 -0.001 0.000 0.000 -0.002
Continental (F) -0.002 -0.003 0.000 0.000 -0.006 -0.011
Mediterranean (I) -0.001 -0.005 -0.002 0.000 -0.003 -0.010
Anglo-Saxon (UK) -0.001 0.000 0.000 0.000 -0.002 -0.003
Due to rounding errors, total may slightly differ from the summation of the separate effects.Effects with respect to the 2025-situation according to the baseline scenario.

170 Annexes 171Annexes
Table A6.6 Populations, income and income inequality by household status and earner, baseline (BS) and Participation scenario (PS) 2025
population(%)
average income(% of average)
income inequality(theil-statistic)
BS PSdiffer-ence BS PS
differ-ence BS PS
differ-ence (%)
Nordic (DK) couple/two earners 37 37 0 123 122 -1 0.054 0.054 0.0 couple/single earner 13 13 0 102 101 -1 0.136 0.149 1.3 couple/no earner 4 4 0 72 72 0 0.061 0.057 -0.4 single/earner 13 13 0 96 96 0 0.060 0.060 0.0 single/no earner 7 6 0 64 64 1 0.169 0.167 -0.2 other 3 3 0 99 102 4 0.112 0.113 0.1 65 years/couple 14 14 0 87 88 1 0.191 0.189 -0.1 65 years/single 10 10 0 70 70 0 0.109 0.109 0.0 65 year/other 0 0 0 145 149 4 0.076 0.072 -0.4
Hybrid (NL) couple/two earners 24 25 1 122 121 -1 0.077 0.075 -0.1 couple/single earner 26 27 1 97 96 -1 0.109 0.100 -0.9 couple/no earner 7 6 -1 74 72 -1 0.158 0.164 0.6 single/earner 10 10 0 110 110 0 0.144 0.149 0.4 single/no earner 6 6 0 66 64 -2 0.190 0.178 -1.2 other 3 3 0 88 88 0 0.076 0.073 -0.3 65 years/couple 15 15 0 96 97 1 0.114 0.115 0.2 65 years/single 8 8 0 94 95 1 0.206 0.207 0.0 65 year/other 1 1 0 101 104 3 0.122 0.119 -0.3
Continental (D) couple/two earners 24 25 1 121 119 -2 0.086 0.086 0.0 couple/single earner 24 24 0 101 100 -2 0.109 0.108 -0.1 couple/no earner 8 6 -1 77 78 1 0.127 0.127 0.0 single/earner 11 11 0 106 104 -1 0.128 0.128 0.1 single/no earner 5 5 0 62 62 0 0.187 0.193 0.6 other 2 2 0 102 101 -1 0.142 0.138 -0.4 65 years/couple 16 16 0 93 94 1 0.083 0.083 0.0 65 years/single 9 9 0 85 86 1 0.123 0.123 0.0 65 year/other 1 1 0 114 114 0 0.050 0.046 -0.4
Continental (F) couple/two earners 26 29 3 133 126 -6 0.149 0.140 -0.9 couple/single earner 21 20 -1 94 92 -3 0.129 0.124 -0.5 couple/no earner 9 7 -2 73 74 1 0.160 0.159 -0.1 single/earner 9 10 1 102 99 -3 0.118 0.119 0.1 single/no earner 6 5 -1 62 64 2 0.212 0.214 0.2 other 4 4 0 90 92 2 0.125 0.119 -0.6 65 years/couple 16 16 0 95 97 2 0.123 0.120 -0.3 65 years/single 9 9 0 82 84 2 0.137 0.137 -0.1 65 year/other 1 1 0 87 93 6 0.113 0.108 -0.5
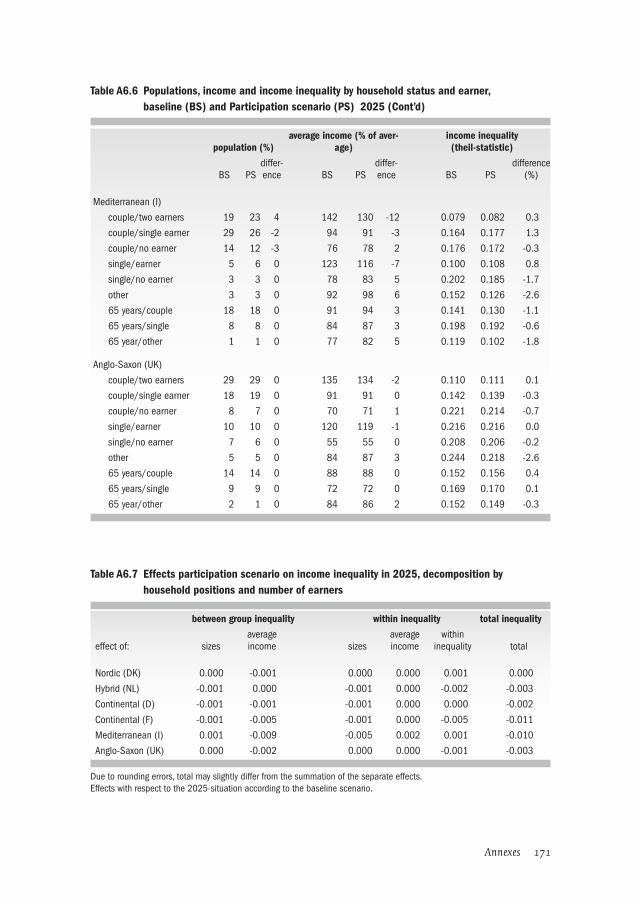
170 Annexes 171Annexes
Table A6.6 Populations, income and income inequality by household status and earner, baseline (BS) and Participation scenario (PS) 2025 (Cont’d)
population (%)average income (% of aver-
age)income inequality(theil-statistic)
BS PSdiffer-ence BS PS
differ-ence BS PS
difference (%)
Mediterranean (I)
couple/two earners 19 23 4 142 130 -12 0.079 0.082 0.3
couple/single earner 29 26 -2 94 91 -3 0.164 0.177 1.3
couple/no earner 14 12 -3 76 78 2 0.176 0.172 -0.3
single/earner 5 6 0 123 116 -7 0.100 0.108 0.8
single/no earner 3 3 0 78 83 5 0.202 0.185 -1.7
other 3 3 0 92 98 6 0.152 0.126 -2.6
65 years/couple 18 18 0 91 94 3 0.141 0.130 -1.1
65 years/single 8 8 0 84 87 3 0.198 0.192 -0.6
65 year/other 1 1 0 77 82 5 0.119 0.102 -1.8
Anglo-Saxon (UK)
couple/two earners 29 29 0 135 134 -2 0.110 0.111 0.1
couple/single earner 18 19 0 91 91 0 0.142 0.139 -0.3
couple/no earner 8 7 0 70 71 1 0.221 0.214 -0.7
single/earner 10 10 0 120 119 -1 0.216 0.216 0.0
single/no earner 7 6 0 55 55 0 0.208 0.206 -0.2
other 5 5 0 84 87 3 0.244 0.218 -2.6
65 years/couple 14 14 0 88 88 0 0.152 0.156 0.4
65 years/single 9 9 0 72 72 0 0.169 0.170 0.1
65 year/other 2 1 0 84 86 2 0.152 0.149 -0.3
Table A6.7 Effects participation scenario on income inequality in 2025, decomposition by household positions and number of earners
between group inequality within inequality total inequality
effect of: sizes average income sizes
average income
within inequality total
Nordic (DK) 0.000 -0.001 0.000 0.000 0.001 0.000
Hybrid (NL) -0.001 0.000 -0.001 0.000 -0.002 -0.003
Continental (D) -0.001 -0.001 -0.001 0.000 0.000 -0.002
Continental (F) -0.001 -0.005 -0.001 0.000 -0.005 -0.011
Mediterranean (I) 0.001 -0.009 -0.005 0.002 0.001 -0.010
Anglo-Saxon (UK) 0.000 -0.002 0.000 0.000 -0.001 -0.003
Due to rounding errors, total may slightly differ from the summation of the separate effects.Effects with respect to the 2025-situation according to the baseline scenario.
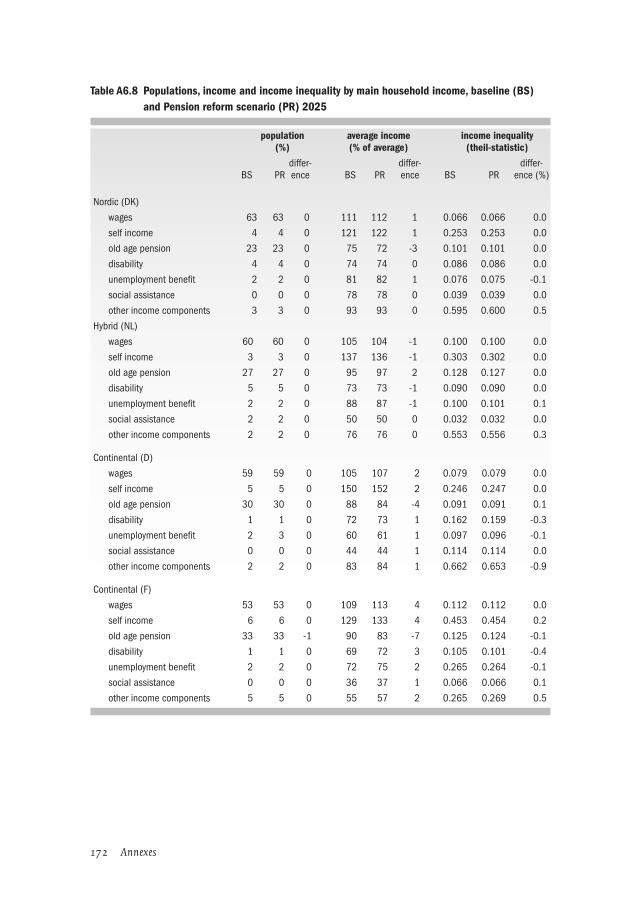
172 Annexes 173Annexes
Table A6.8 Populations, income and income inequality by main household income, baseline (BS) and Pension reform scenario (PR) 2025
population(%)
average income (% of average)
income inequality(theil-statistic)
BS PRdiffer-ence BS PR
differ-ence BS PR
differ-ence (%)
Nordic (DK)
wages 63 63 0 111 112 1 0.066 0.066 0.0
self income 4 4 0 121 122 1 0.253 0.253 0.0
old age pension 23 23 0 75 72 -3 0.101 0.101 0.0
disability 4 4 0 74 74 0 0.086 0.086 0.0
unemployment benefit 2 2 0 81 82 1 0.076 0.075 -0.1
social assistance 0 0 0 78 78 0 0.039 0.039 0.0
other income components 3 3 0 93 93 0 0.595 0.600 0.5
Hybrid (NL)
wages 60 60 0 105 104 -1 0.100 0.100 0.0
self income 3 3 0 137 136 -1 0.303 0.302 0.0
old age pension 27 27 0 95 97 2 0.128 0.127 0.0
disability 5 5 0 73 73 -1 0.090 0.090 0.0
unemployment benefit 2 2 0 88 87 -1 0.100 0.101 0.1
social assistance 2 2 0 50 50 0 0.032 0.032 0.0
other income components 2 2 0 76 76 0 0.553 0.556 0.3
Continental (D)
wages 59 59 0 105 107 2 0.079 0.079 0.0
self income 5 5 0 150 152 2 0.246 0.247 0.0
old age pension 30 30 0 88 84 -4 0.091 0.091 0.1
disability 1 1 0 72 73 1 0.162 0.159 -0.3
unemployment benefit 2 3 0 60 61 1 0.097 0.096 -0.1
social assistance 0 0 0 44 44 1 0.114 0.114 0.0
other income components 2 2 0 83 84 1 0.662 0.653 -0.9
Continental (F)
wages 53 53 0 109 113 4 0.112 0.112 0.0
self income 6 6 0 129 133 4 0.453 0.454 0.2
old age pension 33 33 -1 90 83 -7 0.125 0.124 -0.1
disability 1 1 0 69 72 3 0.105 0.101 -0.4
unemployment benefit 2 2 0 72 75 2 0.265 0.264 -0.1
social assistance 0 0 0 36 37 1 0.066 0.066 0.1
other income components 5 5 0 55 57 2 0.265 0.269 0.5
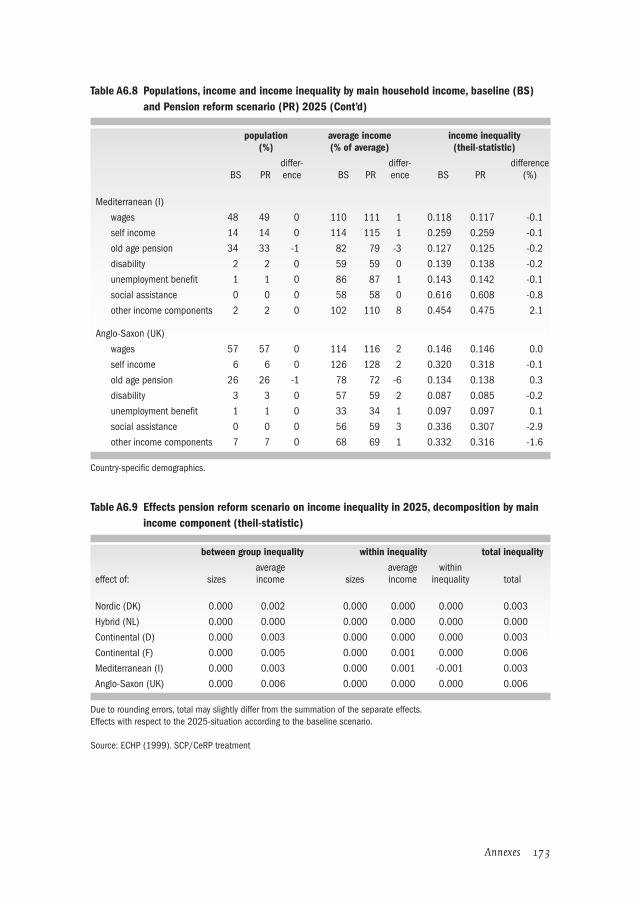
172 Annexes 173Annexes
Table A6.8 Populations, income and income inequality by main household income, baseline (BS) and Pension reform scenario (PR) 2025 (Cont’d)
population (%)
average income (% of average)
income inequality(theil-statistic)
BS PRdiffer-ence BS PR
differ-ence BS PR
difference (%)
Mediterranean (I)
wages 48 49 0 110 111 1 0.118 0.117 -0.1
self income 14 14 0 114 115 1 0.259 0.259 -0.1
old age pension 34 33 -1 82 79 -3 0.127 0.125 -0.2
disability 2 2 0 59 59 0 0.139 0.138 -0.2
unemployment benefit 1 1 0 86 87 1 0.143 0.142 -0.1
social assistance 0 0 0 58 58 0 0.616 0.608 -0.8
other income components 2 2 0 102 110 8 0.454 0.475 2.1
Anglo-Saxon (UK)
wages 57 57 0 114 116 2 0.146 0.146 0.0
self income 6 6 0 126 128 2 0.320 0.318 -0.1
old age pension 26 26 -1 78 72 -6 0.134 0.138 0.3
disability 3 3 0 57 59 2 0.087 0.085 -0.2
unemployment benefit 1 1 0 33 34 1 0.097 0.097 0.1
social assistance 0 0 0 56 59 3 0.336 0.307 -2.9
other income components 7 7 0 68 69 1 0.332 0.316 -1.6
Country-specific demographics.
Table A6.9 Effects pension reform scenario on income inequality in 2025, decomposition by main income component (theil-statistic)
between group inequality within inequality total inequality
effect of: sizes average income sizes
average income
within inequality total
Nordic (DK) 0.000 0.002 0.000 0.000 0.000 0.003
Hybrid (NL) 0.000 0.000 0.000 0.000 0.000 0.000
Continental (D) 0.000 0.003 0.000 0.000 0.000 0.003
Continental (F) 0.000 0.005 0.000 0.001 0.000 0.006
Mediterranean (I) 0.000 0.003 0.000 0.001 -0.001 0.003
Anglo-Saxon (UK) 0.000 0.006 0.000 0.000 0.000 0.006
Due to rounding errors, total may slightly differ from the summation of the separate effects.Effects with respect to the 2025-situation according to the baseline scenario.
Source: ECHP (1999). SCP/CeRP treatment

174 Annexes 175Annexes
Table A6.10 Populations, income and income inequality according households status number of earners, baseline (BS) and Pension reform scenario (PR) 2025
population (%) average income (% of average) income inequality
BS PRdiffer-ence BS PR
differ-ence BS PR
differ-ence
Nordic (DK) couple/two earners 37 37 0 123 124 1 0.054 0.054 0.0 couple/single earner 13 13 0 102 103 1 0.136 0.136 0.0 couple/no earner 4 4 0 72 71 -1 0.061 0.060 0.0 single/earner 13 13 0 96 97 1 0.060 0.060 0.0 single/no earner 7 7 0 64 64 0 0.169 0.169 0.1 other 3 3 0 99 99 0 0.112 0.111 0.0 65 years/couple 14 14 0 87 85 -2 0.191 0.197 0.6 65 years/single 10 10 0 70 68 -2 0.109 0.112 0.3 65 year/other 0 0 0 145 144 -2 0.076 0.084 0.8
Hybrid (NL) couple/two earners 24 24 0 122 121 -1 0.077 0.077 0.0 couple/single earner 26 26 0 97 96 -1 0.109 0.109 0.0 couple/no earner 7 7 0 74 74 1 0.158 0.160 0.2 single/earner 10 10 0 110 109 -1 0.144 0.144 0.0 single/no earner 6 6 0 66 66 0 0.190 0.192 0.2 other 3 3 0 88 88 -1 0.076 0.077 0.0 65 years/couple 15 15 0 96 98 2 0.114 0.114 0.0 65 years/single 8 8 0 94 96 2 0.206 0.205 -0.2 65 year/other 1 1 0 101 103 2 0.122 0.122 0.0
Continental (D) couple/two earners 24 24 0 121 123 2 0.086 0.086 0.0 couple/single earner 24 24 0 101 102 1 0.109 0.109 0.0 couple/no earner 8 8 0 77 75 -2 0.127 0.127 0.0 single/earner 11 11 0 106 108 2 0.128 0.128 0.0 single/no earner 5 5 0 62 62 -1 0.187 0.183 -0.4 other 2 2 0 102 102 1 0.142 0.143 0.1 65 years/couple 16 16 0 93 90 -4 0.083 0.085 0.2 65 years/single 9 9 0 85 82 -3 0.123 0.126 0.3 65 year/other 1 1 0 114 111 -3 0.050 0.050 0.0
Continental (F) couple/two earners 26 26 0 133 138 5 0.149 0.149 0.0 couple/single earner 21 21 0 94 97 2 0.129 0.126 -0.3 couple/no earner 9 9 0 73 70 -4 0.160 0.149 -1.1 single/earner 9 9 0 102 106 4 0.118 0.118 0.0 single/no earner 6 6 0 62 61 -1 0.212 0.201 -1.2 other 4 4 0 90 92 2 0.125 0.127 0.2 65 years/couple 16 16 0 95 87 -7 0.123 0.124 0.1 65 years/single 9 9 0 82 76 -6 0.137 0.140 0.3 65 year/other 1 1 0 87 82 -5 0.113 0.120 0.7

174 Annexes 175Annexes
Table A6.10 Populations, income and income inequality according households status number of earners, baseline (BS) and Pension reform scenario (PR) 2025 (Cont’d)
population(%)
average income (% of average)
incomeinequality
BS PRdiffer-ence BS PR
differ-ence BS PR
differ-ence (%)
Mediterranean (I)
couple/two earners 19 19 0 142 144 2 0.079 0.078 0.0
couple/single earner 29 29 0 94 95 1 0.164 0.164 0.0
couple/no earner 14 14 0 76 75 -1 0.176 0.176 0.0
single/earner 5 5 0 123 124 1 0.100 0.099 -0.1
single/no earner 3 3 0 78 77 -1 0.202 0.204 0.2
other 3 3 0 92 92 0 0.152 0.155 0.3
65 years/couple 18 18 0 91 90 -2 0.141 0.145 0.4
65 years/single 8 8 0 84 82 -2 0.198 0.204 0.7
65 year/other 1 1 0 77 76 -1 0.119 0.123 0.3
Anglo-Saxon (UK)
couple/two earners 29 29 0 135 138 3 0.110 0.110 0.0
couple/single earner 18 18 0 91 92 1 0.142 0.141 -0.1
couple/no earner 8 8 0 70 68 -2 0.221 0.211 -1.0
single/earner 10 10 0 120 122 2 0.216 0.216 0.0
single/no earner 7 7 0 55 55 0 0.208 0.206 -0.3
other 5 5 0 84 85 1 0.244 0.248 0.4
65 years/couple 14 14 0 88 83 -5 0.152 0.161 0.9
65 years/single 9 9 0 72 68 -4 0.169 0.176 0.7
65 year/other 2 2 0 84 81 -4 0.152 0.155 0.2
Table A6.11 Effects pension reform scenario on income inequality in 2025, decomposition by household positions and number of earners
between group inequality within inequality total inequality
effect of: sizes average income sizes
average income
within inequality total
Nordic (DK) 0.000 0.002 0.000 0.000 0.001 0.003
Hybrid (NL) 0.000 -0.001 0.000 0.000 0.000 0.000
Continental (D) 0.000 0.003 0.000 0.000 0.000 0.003
Continental (F) 0.000 0.007 0.000 0.000 -0.001 0.006
Mediterranean (I) 0.000 0.002 0.000 0.000 0.001 0.003
Anglo-Saxon (UK) 0.000 0.006 0.000 0.000 0.001 0.006
Due to rounding and non-linearity’s, the total may slightly differ from the summation of the separate effects.Effects with respect to the 2025-situation according to the baseline scenario.

176 Annexes 177Annexes
Table A6.12 Populations, income and income inequality by main household income, baseline (BS) and Institutional reform scenario (IR) 2025
population(%)
average income(% of average)
income inequality(theil-statistic)
BS IRdiffer-ence BS IR
differ-ence BS IR
difference (%)
Nordic (DK) wages 63 66 3 111 109 -2 0.066 0.064 -0.2 self income 4 6 2 121 108 -13 0.253 0.323 7.0 old age pension 23 21 -2 75 77 3 0.101 0.099 -0.1 disability 4 3 -1 74 72 -2 0.086 0.109 2.3 unemployment benefit 2 1 -1 81 76 -6 0.076 0.064 -1.3 social assistance 0 0 0 78 81 3 0.039 0.070 3.1 other income components 3 3 0 93 95 2 0.595 0.686 9.1
Hybrid (NL) wages 60 64 4 105 108 3 0.100 0.104 0.4 self income 3 3 0 137 138 1 0.303 0.289 -1.3 old age pension 27 23 -4 95 85 -10 0.128 0.133 0.6 disability 5 4 0 73 72 -1 0.090 0.081 -0.9 unemployment benefit 2 2 0 88 99 12 0.100 0.135 3.5 social assistance 2 2 0 50 46 -4 0.032 0.026 -0.6 other income components 2 3 0 76 74 -2 0.553 0.484 -6.9
Continental (D) wages 59 60 1 105 109 4 0.079 0.080 0.1 self income 5 5 0 150 157 6 0.246 0.249 0.3 old age pension 30 29 -1 88 78 -10 0.091 0.094 0.4 disability 1 1 0 72 74 3 0.162 0.155 -0.7 unemployment benefit 2 2 -1 60 50 -10 0.097 0.085 -1.2 social assistance 0 0 0 44 38 -6 0.114 0.110 -0.4 other income components 2 3 0 83 83 0 0.662 0.635 -2.6
Continental (F) wages 53 56 3 109 111 3 0.112 0.115 0.3 self income 6 7 1 129 128 -1 0.453 0.446 -0.7 old age pension 33 30 -4 90 83 -7 0.125 0.129 0.3 disability 1 1 0 69 67 -2 0.105 0.104 -0.1 unemployment benefit 2 1 -1 72 57 -16 0.265 0.177 -8.8 social assistance 0 0 0 36 28 -8 0.066 0.047 -1.9 other income components 5 5 0 55 51 -3 0.265 0.296 3.2
Mediterranean (I) wages 48 51 3 110 109 -1 0.118 0.121 0.3 self income 14 15 1 114 115 1 0.259 0.277 1.7 old age pension 34 30 -3 82 82 0 0.127 0.133 0.6 disability 2 1 0 59 56 -3 0.139 0.141 0.2 unemployment benefit 1 1 0 86 69 -17 0.143 0.121 -2.1 social assistance 0 0 0 58 70 12 0.616 0.539 -7.7 other income components 2 2 0 102 84 -18 0.454 0.532 7.8
Anglo-Saxon (UK) wages 57 59 1 114 116 2 0.146 0.147 0.1 self income 6 6 0 126 130 3 0.320 0.319 -0.1 old age pension 26 25 -2 78 68 -9 0.134 0.140 0.6 disability 3 3 0 57 60 3 0.087 0.084 -0.3 unemployment benefit 1 1 0 33 31 -2 0.097 0.102 0.5 social assistance 0 0 0 56 43 -12 0.336 0.373 3.7 other income components 7 7 0 68 71 3 0.332 0.314 -1.8

176 Annexes 177Annexes
Table A6.13 Effects institutional reform scenario on income inequality in 2025, decomposition by main income component
between group inequality within inequality total inequality
effect of: sizes average income sizes
average income
within inequality total
Nordic (DK) -0.001 -0.003 0.000 0.000 0.005 0.000
Hybrid (NL) 0.000 0.005 0.000 -0.001 0.002 0.006
Continental (D) -0.001 0.010 0.001 0.000 0.001 0.011
Continental (F) 0.000 0.007 0.003 -0.001 0.002 0.010
Mediterranean (I) -0.001 0.001 0.001 -0.001 0.007 0.007
Anglo-Saxon (UK) -0.001 0.009 0.000 0.001 0.001 0.010
Due to rounding errors, total may slightly differ from the summation of the separate effects.Effects with respect to the 2025-situation according to the baseline scenario.

178 Annexes 179Annexes
Table A6.14 Populations, income and income inequality according to household status and number of earners baseline (BS) and Institutional reforms scenario (IR) 2025
population(%)
average income(% of average)
income inequality(theil-statistic)
BS IRdiffer-ence BS IR
differ-ence BS IR
differ-ence (%)
Nordic (DK) couple/two earners 37 40 4 123 120 -3 0.054 0.052 -0.2 couple/single earner 13 12 -1 102 95 -7 0.136 0.189 5.3 couple/no earner 4 2 -2 72 67 -5 0.061 0.072 1.2 single/earner 13 14 1 96 92 -4 0.060 0.059 -0.1 single/no earner 7 5 -2 64 59 -4 0.169 0.236 6.8 other 3 4 1 99 100 1 0.112 0.098 -1.3 65 years/couple 14 14 0 87 91 4 0.191 0.187 -0.3 65 years/single 10 10 0 70 73 3 0.109 0.100 -0.8 65 year/other 0 0 0 145 201 55 0.076 0.014 -6.2
Hybrid (NL) couple/two earners 24 26 2 122 125 3 0.077 0.078 0.2 couple/single earner 26 25 -1 97 99 2 0.109 0.114 0.5 couple/no earner 7 6 -1 74 67 -6 0.158 0.201 4.3 single/earner 10 11 1 110 112 2 0.144 0.146 0.2 single/no earner 6 5 -1 66 57 -9 0.190 0.138 -5.1 other 3 3 0 88 92 4 0.076 0.080 0.4 65 years/couple 15 15 0 96 88 -8 0.114 0.113 0.0 65 years/single 8 8 0 94 85 -9 0.206 0.217 1.1 65 year/other 1 1 0 101 94 -7 0.122 0.106 -1.6
Continental (D) couple/two earners 24 24 0 121 126 5 0.086 0.086 0.1 couple/single earner 24 24 0 101 104 3 0.109 0.109 0.0 couple/no earner 8 8 0 77 72 -5 0.127 0.138 1.0 single/earner 11 11 0 106 110 4 0.128 0.129 0.2 single/no earner 5 5 0 62 59 -3 0.187 0.195 0.8 other 2 2 0 102 104 2 0.142 0.149 0.7 65 years/couple 16 16 0 93 85 -9 0.083 0.091 0.8 65 years/single 9 9 0 85 77 -9 0.123 0.132 0.9 65 year/other 1 1 0 114 107 -6 0.050 0.053 0.3
Continental (F) couple/two earners 26 28 2 133 136 3 0.149 0.146 -0.3 couple/single earner 21 20 0 94 92 -3 0.129 0.130 0.1 couple/no earner 9 6 -2 73 62 -11 0.160 0.183 2.3 single/earner 9 10 1 102 105 3 0.118 0.125 0.7 single/no earner 6 5 -1 62 56 -6 0.212 0.227 1.5 other 4 4 0 90 92 3 0.125 0.141 1.6 65 years/couple 16 16 0 95 88 -6 0.123 0.124 0.1 65 years/single 9 9 0 82 77 -5 0.137 0.139 0.2 65 year/other 1 1 0 87 82 -5 0.113 0.122 0.9
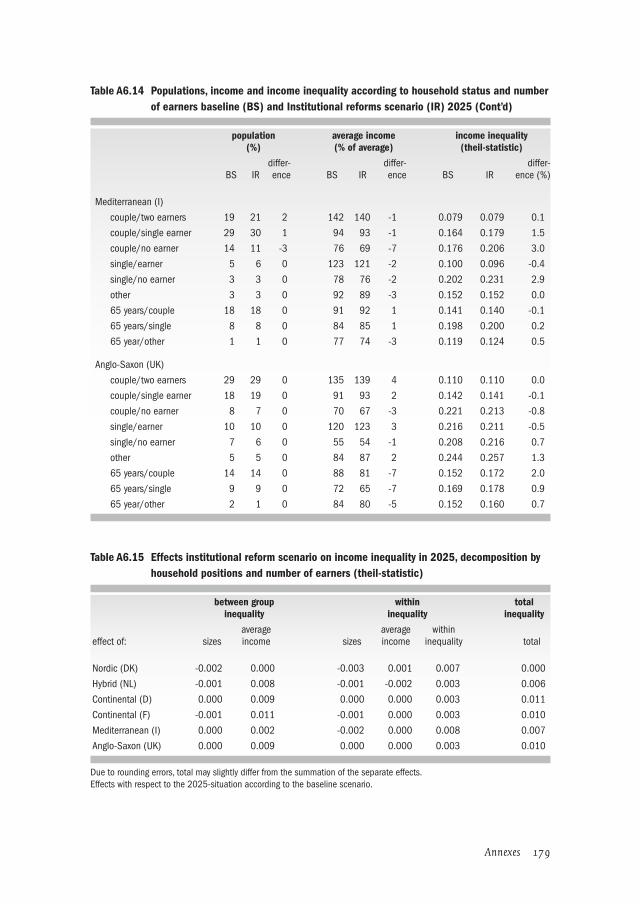
178 Annexes 179Annexes
Table A6.14 Populations, income and income inequality according to household status and number of earners baseline (BS) and Institutional reforms scenario (IR) 2025 (Cont’d)
population(%)
average income(% of average)
income inequality(theil-statistic)
BS IRdiffer-ence BS IR
differ-ence BS IR
differ-ence (%)
Mediterranean (I)
couple/two earners 19 21 2 142 140 -1 0.079 0.079 0.1
couple/single earner 29 30 1 94 93 -1 0.164 0.179 1.5
couple/no earner 14 11 -3 76 69 -7 0.176 0.206 3.0
single/earner 5 6 0 123 121 -2 0.100 0.096 -0.4
single/no earner 3 3 0 78 76 -2 0.202 0.231 2.9
other 3 3 0 92 89 -3 0.152 0.152 0.0
65 years/couple 18 18 0 91 92 1 0.141 0.140 -0.1
65 years/single 8 8 0 84 85 1 0.198 0.200 0.2
65 year/other 1 1 0 77 74 -3 0.119 0.124 0.5
Anglo-Saxon (UK)
couple/two earners 29 29 0 135 139 4 0.110 0.110 0.0
couple/single earner 18 19 0 91 93 2 0.142 0.141 -0.1
couple/no earner 8 7 0 70 67 -3 0.221 0.213 -0.8
single/earner 10 10 0 120 123 3 0.216 0.211 -0.5
single/no earner 7 6 0 55 54 -1 0.208 0.216 0.7
other 5 5 0 84 87 2 0.244 0.257 1.3
65 years/couple 14 14 0 88 81 -7 0.152 0.172 2.0
65 years/single 9 9 0 72 65 -7 0.169 0.178 0.9
65 year/other 2 1 0 84 80 -5 0.152 0.160 0.7
Table A6.15 Effects institutional reform scenario on income inequality in 2025, decomposition by household positions and number of earners (theil-statistic)
between groupinequality
withininequality
totalinequality
effect of: sizes average income sizes
average income
within inequality total
Nordic (DK) -0.002 0.000 -0.003 0.001 0.007 0.000
Hybrid (NL) -0.001 0.008 -0.001 -0.002 0.003 0.006
Continental (D) 0.000 0.009 0.000 0.000 0.003 0.011
Continental (F) -0.001 0.011 -0.001 0.000 0.003 0.010
Mediterranean (I) 0.000 0.002 -0.002 0.000 0.008 0.007
Anglo-Saxon (UK) 0.000 0.009 0.000 0.000 0.003 0.010
Due to rounding errors, total may slightly differ from the summation of the separate effects.Effects with respect to the 2025-situation according to the baseline scenario.

180 Annexes 181Annexes
A6.3 Redistribution statistics
Table A6.16 Income redistribution, 2000 and 2025, baseline scenario, country-specific demographics
2000 2025
weightprogres-
sivity effect % of total
effect weightprogres-
sivity effect % of total
effect
Nordic (DK) pensions 0.13 1.03 0.129 59 0.17 1.02 0.170 66 disability 0.03 0.94 0.030 14 0.03 0.93 0.028 11 unemployment 0.03 0.68 0.020 9 0.03 0.66 0.020 8 social assistance 0.01 0.92 0.006 3 0.01 0.92 0.005 2 other 0.05 0.63 0.033 15 0.05 0.66 0.033 13 total social security 0.25 0.89 0.218 100 0.28 0.90 0.256 100
Hybrid (NL) pensions 0.17 1.10 0.185 72 0.25 1.08 0.268 80 disability 0.04 0.87 0.037 14 0.04 0.85 0.032 10 unemployment 0.01 0.64 0.009 4 0.02 0.67 0.011 3 social assistance 0.01 1.06 0.011 4 0.01 1.09 0.011 3 other 0.03 0.50 0.015 6 0.03 0.51 0.013 4 total social security 0.27 0.97 0.258 100 0.34 0.99 0.336 100
Continental (D) pensions 0.21 1.01 0.212 80 0.26 1.01 0.262 84 disability 0.02 0.87 0.014 5 0.01 0.87 0.013 4 unemployment 0.03 0.74 0.021 8 0.03 0.73 0.018 6 social assistance 0.00 1.04 0.002 1 0.00 1.03 0.002 0 other 0.04 0.44 0.018 7 0.04 0.44 0.016 5 total social security 0.30 0.90 0.266 100 0.34 0.92 0.311 100
Continental (F) pensions 0.22 1.03 0.223 79 0.28 1.02 0.289 86 disability 0.02 0.90 0.017 6 0.02 0.87 0.015 4 unemployment 0.02 0.58 0.013 5 0.02 0.55 0.011 3 social assistance 0.00 1.12 0.002 1 0.00 1.12 0.002 1 other 0.04 0.65 0.027 10 0.04 0.59 0.021 6 total social security 0.30 0.94 0.283 100 0.36 0.95 0.338 100
Mediterranean (I) pensions 0.26 0.85 0.223 90 0.29 0.94 0.270 91 disability 0.02 0.84 0.017 7 0.02 0.90 0.017 6 unemployment 0.01 0.62 0.005 2 0.01 0.59 0.005 2 social assistance 0.00 0.73 0.001 0 0.00 0.95 0.001 0 other 0.01 0.53 0.003 1 0.00 0.51 0.002 1 total social security 0.30 0.84 0.248 100 0.32 0.92 0.295 100
Anglo-Saxon (UK) pensions 0.15 0.91 0.139 68 0.19 0.90 0.175 73 disability 0.03 0.93 0.027 13 0.03 0.96 0.026 11 unemployment 0.00 0.86 0.003 2 0.00 0.87 0.003 1 social assistance 0.00 0.83 0.004 2 0.00 0.95 0.005 2 other 0.04 0.76 0.032 16 0.04 0.80 0.032 13 total social security 0.23 0.88 0.205 100 0.27 0.89 0.241 100

180 Annexes 181Annexes
Table A6.17 Redistribution in policy scenario (2025)
pensions other arrangements
Gini prim. income
(ranking)
Gini total net income(ranking)
inequalityreduction(ranking) weight
progres-sivity weight
progres-sivity
cor-rection factor
Participation
Nordic (DK) 0.455 (1) 0.245 (1) 0.210 (4) 0.17 1.02 0.11 0.74 0.045
Hybrid (NL) 0.486 (3) 0.257 (3) 0.229 (2) 0.24 1.08 0.09 0.72 0.109
Continental (D) 0.480 (2) 0.248 (2) 0.232 (1) 0.25 1.02 0.07 0.61 0.089
Continental (F) 0.508 (6) 0.284 (4) 0.224 (3) 0.28 1.02 0.07 0.62 0.119
Mediterranean (I) 0.489 (4) 0.286 (5) 0.203 (5) 0.28 0.92 0.03 0.74 0.097
Anglo-Saxon (UK) 0.503 (5) 0.318 (6) 0.185 (6) 0.20 0.90 0.07 0.86 0.066
Pension reform
Nordic (DK) 0.459 (1) 0.250 (1) 0.209 (5) 0.16 1.02 0.12 0.74 0.038
Hybrid (NL) 0.498 (3) 0.259 (3) 0.239 (1) 0.25 1.08 0.09 0.75 0.111
Continental (D) 0.492 (2) 0.255 (2) 0.237 (2) 0.25 1.01 0.08 0.62 0.072
Continental (F) 0.534 (6) 0.298 (4) 0.236 (3) 0.26 1.02 0.08 0.66 0.080
Mediterranean (I) 0.517 (5) 0.302 (5) 0.215 (4) 0.28 0.94 0.03 0.78 0.071
Anglo-Saxon (UK) 0.509 (4) 0.327 (6) 0.182 (6) 0.18 0.90 0.08 0.87 0.048
Institutional reform
Nordic (DK) 0.430 (1) 0.247 (1) 0.183 (5) 0.16 1.04 0.09 0.73 0.046
Hybrid (NL) 0.480 (2) 0.268 (3) 0.212 (2/3) 0.20 1.10 0.08 0.80 0.071
Continental (D) 0.489 (3) 0.265 (2) 0.224 (1) 0.23 1.01 0.07 0.61 0.050
Continental (F) 0.514 (6) 0.302 (4) 0.212 (2/3) 0.24 1.04 0.06 0.66 0.074
Mediterranean (I) 0.502 (4) 0.303 (5) 0.199 (4) 0.26 0.95 0.03 0.80 0.072
Anglo-Saxon (UK) 0.503 (5) 0.331 (6) 0.172 (6) 0.16 0.90 0.07 0.86 0.039
Inequality reduction is the product of the weight of progressivity of pensions plus the product of the weight of progressivity of the other arrangements minus the correction factor (For Denmark in the participation scenario: 0.210 = 0.17*1.02 + 0.11*0.74 – 0.045.
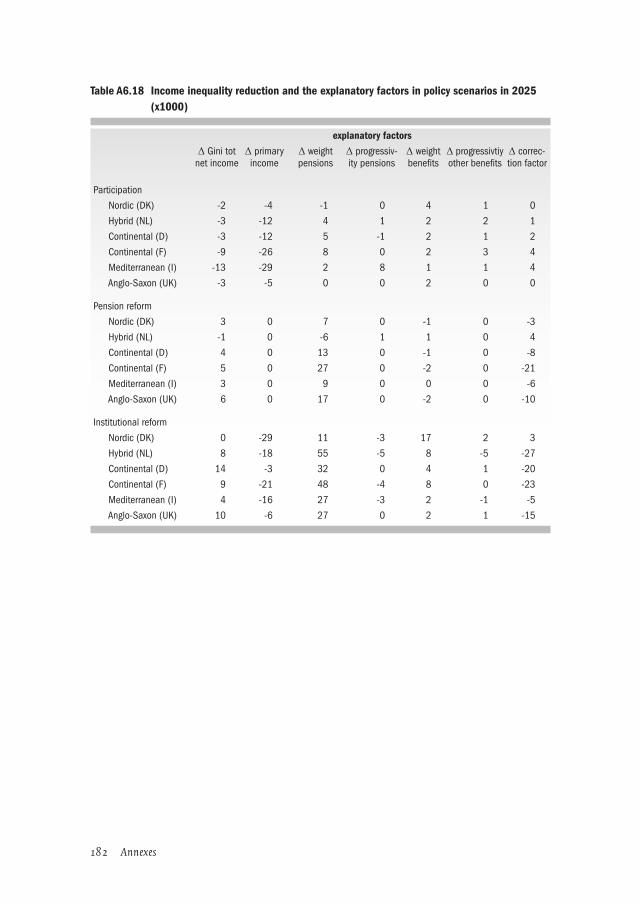
182 Annexes 183
Table A6.18 Income inequality reduction and the explanatory factors in policy scenarios in 2025 (x1000)
explanatory factors
Δ Gini tot net income
Δ primary income
Δ weight pensions
Δ progressiv-ity pensions
Δ weight benefits
Δ progressivtiy other benefits
Δ correc-tion factor
Participation
Nordic (DK) -2 -4 -1 0 4 1 0
Hybrid (NL) -3 -12 4 1 2 2 1
Continental (D) -3 -12 5 -1 2 1 2
Continental (F) -9 -26 8 0 2 3 4
Mediterranean (I) -13 -29 2 8 1 1 4
Anglo-Saxon (UK) -3 -5 0 0 2 0 0
Pension reform
Nordic (DK) 3 0 7 0 -1 0 -3
Hybrid (NL) -1 0 -6 1 1 0 4
Continental (D) 4 0 13 0 -1 0 -8
Continental (F) 5 0 27 0 -2 0 -21
Mediterranean (I) 3 0 9 0 0 0 -6
Anglo-Saxon (UK) 6 0 17 0 -2 0 -10
Institutional reform
Nordic (DK) 0 -29 11 -3 17 2 3
Hybrid (NL) 8 -18 55 -5 8 -5 -27
Continental (D) 14 -3 32 0 4 1 -20
Continental (F) 9 -21 48 -4 8 0 -23
Mediterranean (I) 4 -16 27 -3 2 -1 -5
Anglo-Saxon (UK) 10 -6 27 0 2 1 -15

182 Annexes 183
Annex B1 About scp
During the 1960s, politicians in the Netherlands began to take an increasing interest in the welfare of the population. This heightened interest also created an increased need for information: facts and figures on how people lived, on social trends, and on the changes taking place in society. This development coincided with the increas-ingly prevalent ideas at that time about the need to base policy decisions on sound scientific knowledge, and it was from this basis that the Social and Cultural Planning Office (scp) was founded in 1973. The Royal Decree of 13 March 1973 lists three offi-cial tasks of the scp:– to describe the social and cultural situation in the Netherlands and to map out
likely future developments; – to contribute to the responsible selection of social and cultural policy objectives
and resources, and to formulate appropriate policy alternatives;– to evaluate past and current policy, in particular interdepartmental policy.
The Social and Cultural Planning Office supplies central government with informa-tion on the Dutch welfare state. For almost 30 years, the scp has been charting devel-opments in the daily lives of the Dutch population: work, income, health, education, social security, housing, culture, how they spend their time and their opinions on a whole range of subjects. scp-studies also show how government policy does or could influence these aspects. With the growing importance of the eu, in recent years the scp has devoted a greater part of its working programme to international compari-sons and policy analysis.
The scp is an interdepartmental scientific institute, which carries out independent research and issues recommendations on the basis of that research, both on request and on its own initiative. It publishes these recommendations in advisory reports aimed at the government, parliament and the heads of government departments. Its publications are also an important source of information and advice for leading pro-fessionals and civil servants in the public sector, as well as for scientists and members of the academic world. scp staff members also contribute to the public and scientific debate through articles, lectures, conference papers and interviews.

184 Annexes 185
Annex B2 About cerp
Founded in 1999, the Centre for Research on Pensions and Welfare Policies (cerp) is an independent centre within coripe Piemonte, connected to the University of Turin, specifically directed at addressing pension and welfare policies. The mission of the centre is to study, from both an economic and financial perspective, the different forms of pension provision: public and private, compulsory and free, pay-as-you-go and funded; and to provide independent evaluations of pension schemes and of the impact of reforms. cerp aims at carrying out high quality economic analysis for pol-icy support, especially with respect to the challenges posed by population ageing.
The centre is directed by Elsa Fornero (Professor of Economics, University of Turin) and the Scientific Committee includes some of the most accomplished scholars in the field (Michael Hurd, Richard Disney, Giuseppe Bertola). Research is carried out by a number of permanent researchers, PhD students as well as by affiliates throughout Europe. Every year fellowships are awarded to postgraduate students and researchers from other institutions.
A strong European commitment characterizes all the initiatives of the centre, from active participation in international research networks to the organization of interna-tional annual conferences on a key pension issue and to the realization of European-focused publications.

184 Annexes 185
List of publications in English
The Netherlands in a European Perspective. Social & Cultural Report 2000. isbn 90-377-0062 4 (English edition 2001)
On Worlds of Welfare. Institutions and their effects in eleven welfare states. isbn 90-377-0049-7
Report on the Elderly 2001. isbn 90-377-0082-9
25 years of social change in the Netherlands; Key data from the Social and Cultural Report 1998. isbn 90-6168-580-x
Efficiency of Homes for the Mentally Disabled in the Netherlands (2001). isbn 90-377-0064-0
The Poor Side of the Netherlands. Results from the Dutch ‘Poverty Monitor’, 1997-2003 (2004). isbn 90-377-0183-3
Social Europe. European Outlook 1 (2004). isbn 90-377-0155-8
Does Leave Work? Summary (2004). isbn 90-377-0182-5

Related Documents