Black Employment and Unemployment July 2012 Page 1 DATA BRIEF: Black Employment and Unemployment in July 2012 The unemployment rate for Blacks was 14.1% last month. This is according to the latest report on the nation’s employment situation released Friday morning by the Bureau of Labor Statistics in its monthly Employment Situation report. This rate was a decrease from June, when unemployment in the Black community stood at 14.4%. For the nation as a whole, unemployment was 8.3% in the month of July; this was virtually unchanged from June when the national unemployment rate stood at 8.2%. Among whites, unemployment was 7.4%; among Latinos, unemployment was 10.3%. Comparable June 2012 figures were 7.4% and 11.0% respectively. Overall, total non-farm payroll employment increased by 163,000 jobs from last month. FIGURE 1 8.3 7.4 14.1 10.3 All White Black Latino Bureau of Labor Statistics Unemployment Rates - July 2012 August 3, 2012

Welcome message from author
This document is posted to help you gain knowledge. Please leave a comment to let me know what you think about it! Share it to your friends and learn new things together.
Transcript
Black Employment and Unemployment July 2012
Page 1
DATA BRIEF:
Black Employment and Unemployment in July 2012
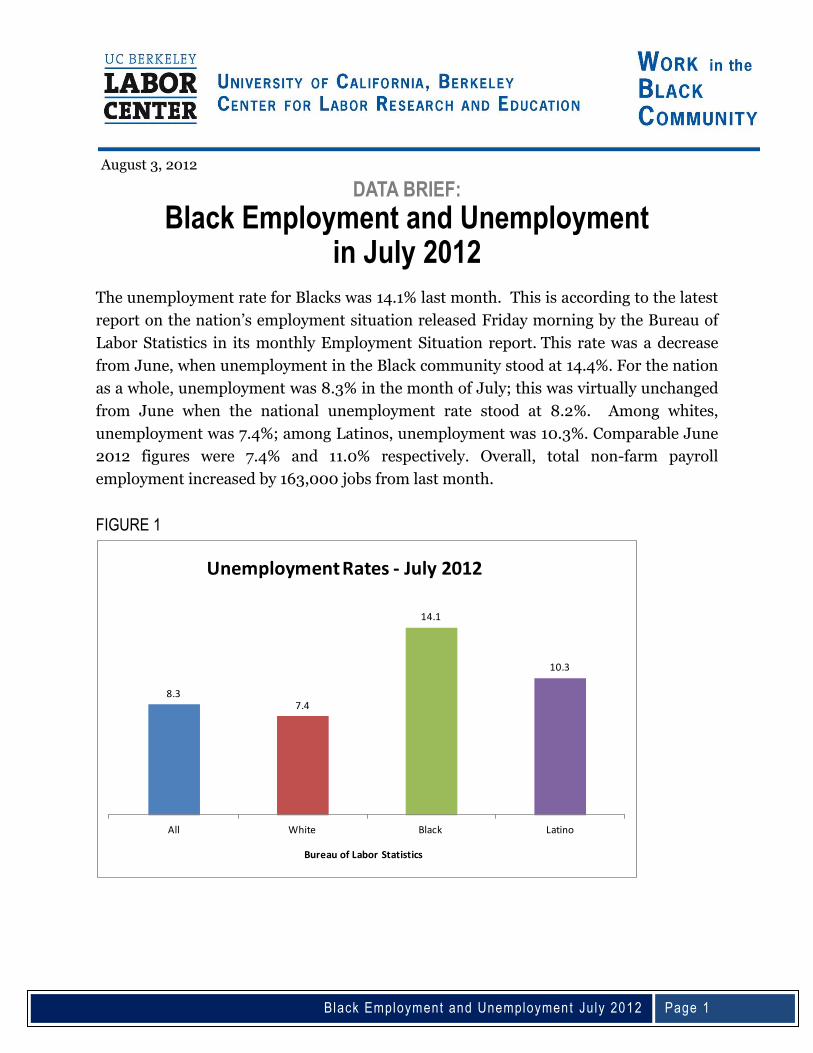
The unemployment rate for Blacks was 14.1% last month. This is according to the latest
report on the nation’s employment situation released Friday morning by the Bureau of
Labor Statistics in its monthly Employment Situation report. This rate was a decrease
from June, when unemployment in the Black community stood at 14.4%. For the nation
as a whole, unemployment was 8.3% in the month of July; this was virtually unchanged
from June when the national unemployment rate stood at 8.2%. Among whites,
unemployment was 7.4%; among Latinos, unemployment was 10.3%. Comparable June
2012 figures were 7.4% and 11.0% respectively. Overall, total non-farm payroll
employment increased by 163,000 jobs from last month.
FIGURE 1
8.37.4
14.1
10.3
All White Black Latino
Bureau of Labor Statistics
Unemployment Rates - July 2012
August 3, 2012

Black Employment and Unemployment July 2012
Page 2
Unemployment The unemployment rate represents the percentage of the civilian labor force that is
unemployed. To be counted as officially unemployed, an individual must not have had a
job and must have actively looked for work in the last month.
During July, the unemployment rate for Blacks, 16 years of age and older, was 14.1%.
This was a decrease from 14.4% in June. For Black women, unemployment was 12.5% (a
decrease from 13.7% in June). For Black men, unemployment was 15.8% (an increase
from 15.1% in June). Table 1 presents these data for the months of December 2007 (the
beginning of the Great Recession); June 2009 (the official end of the Great Recession);
June 2011; and July 2012.2
FIGURE 2
9.010.0
8.1
14.9
17.5
12.7
14.415.1
13.714.1
15.8
12.5
All Male Female
Source: Bureau of Labor Statistics
Black Unemployment (16+)
December, 2007 June, 2009 June, 2012 July, 2012
December 2007 was the first month of the recession, and June 2009 was the last month of the recession. Both are included for comparison.
1 This report was produced with the support of a grant from the Open Society Foundation’s Campaign for Black Male Achievement. 2 All statistics in this report are seasonally adjusted data from the Current Population Survey.
Black Employment and Unemployment July 2012
Page 3
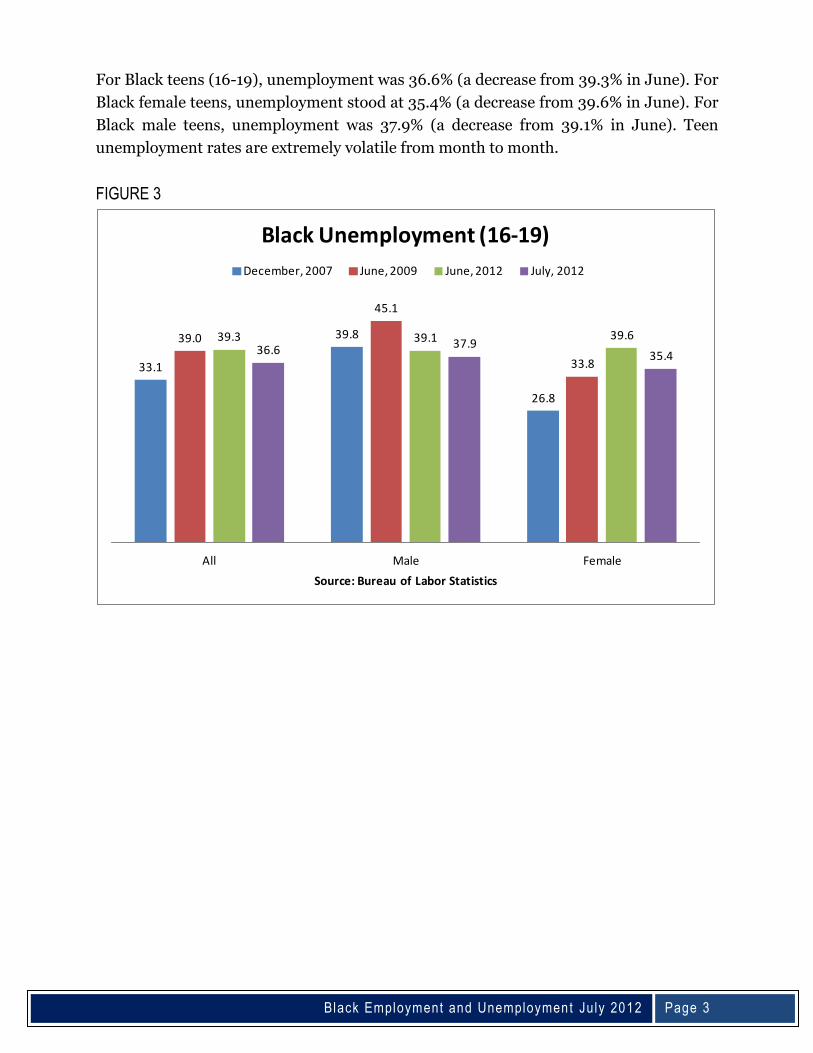
For Black teens (16-19), unemployment was 36.6% (a decrease from 39.3% in June). For
Black female teens, unemployment stood at 35.4% (a decrease from 39.6% in June). For
Black male teens, unemployment was 37.9% (a decrease from 39.1% in June). Teen
unemployment rates are extremely volatile from month to month.
FIGURE 3
33.1
39.8
26.8
39.0
45.1
33.8
39.3 39.1 39.636.6 37.9
35.4
All Male Female
Source: Bureau of Labor Statistics
Black Unemployment (16-19)
December, 2007 June, 2009 June, 2012 July, 2012
Black Employment and Unemployment July 2012
Page 4
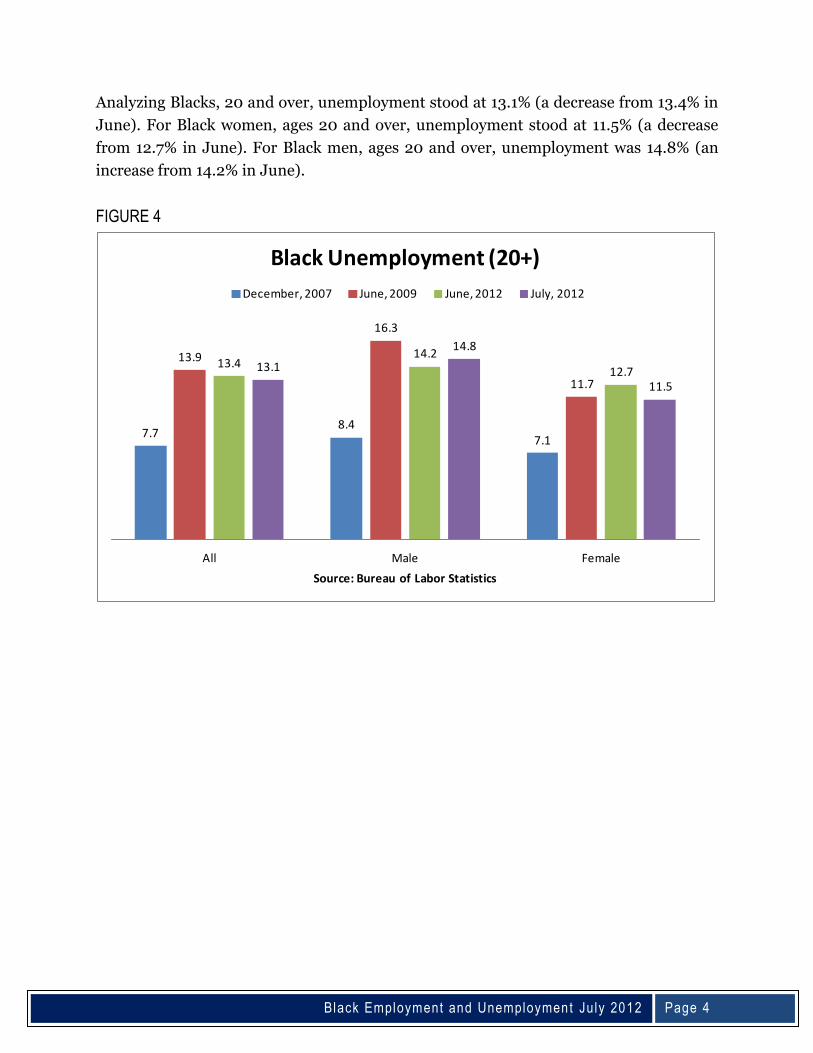
Analyzing Blacks, 20 and over, unemployment stood at 13.1% (a decrease from 13.4% in
June). For Black women, ages 20 and over, unemployment stood at 11.5% (a decrease
from 12.7% in June). For Black men, ages 20 and over, unemployment was 14.8% (an
increase from 14.2% in June).
FIGURE 4
7.78.4
7.1
13.9
16.3
11.7
13.414.2
12.713.1
14.8
11.5
All Male Female
Source: Bureau of Labor Statistics
Black Unemployment (20+)
December, 2007 June, 2009 June, 2012 July, 2012

Black Employment and Unemployment July 2012
Page 5
Employment-Population Ratio The employment-population ratio represents the percentage of the population that
is employed and it can be interpreted as the probability that a member of the population
is employed. It captures employment prospects better than the unemployment rate,
since jobless individuals who are not in the labor force (including discouraged workers)
are not calculated in the unemployment rate. However, it would be a mistake to
conclude that all persons not employed are without a job and desiring employment.
Some people might not be employed because of their status as a full-time student,
homemaker, retiree, or disabled person. Hence, an employment-population ratio of 60%
does not imply an unemployment rate of 40%.
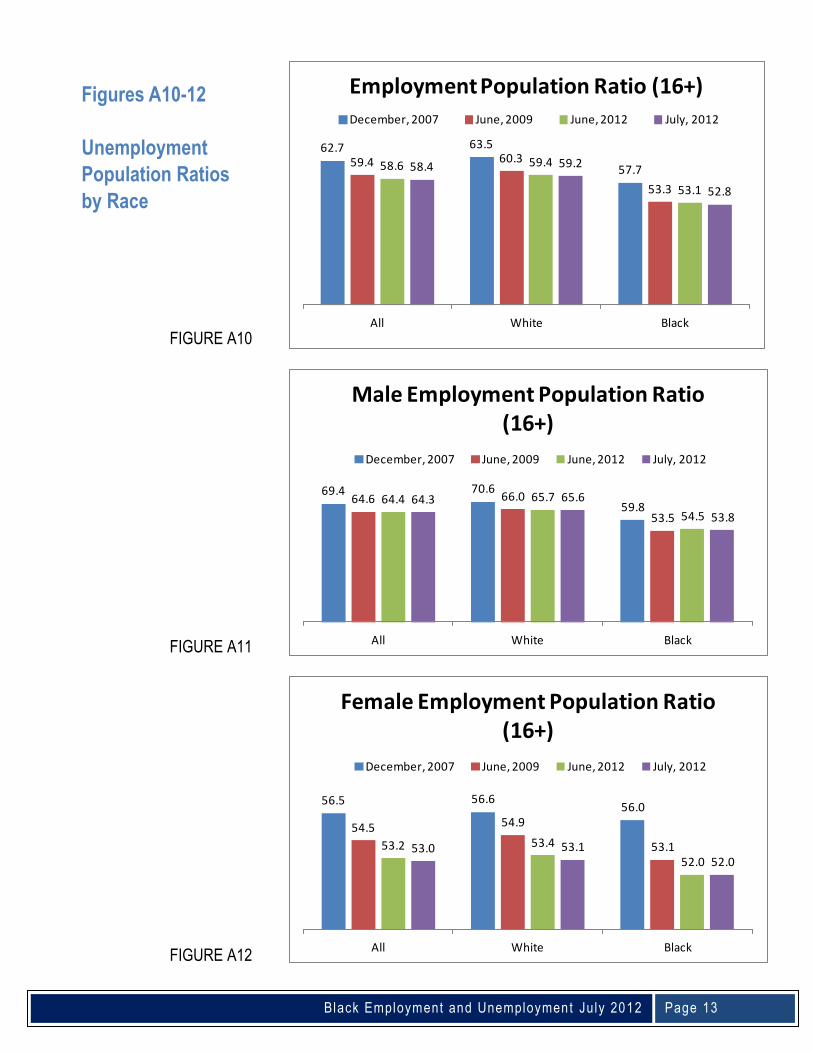
In July, the employment-population ratio for Blacks, 16 and over, was 52.8%. This was a
slight decrease from 53.1% in June. For Black women, the employment-population ratio
stood at 52.0% (unchanged from 52.0% in June). For Black men, the employment-
population ratio was 53.8% (a decrease from 54.5% in June).
FIGURE 5
57.7
59.8
56.0
53.3 53.553.153.1
54.5
52.052.8
53.8
52.0
All Male Female
Source: Bureau of Labor Statistics
Black Employment Population Ratio (16+)
December, 2007 June, 2009 June, 2012 July, 2012

Black Employment and Unemployment July 2012
Page 6
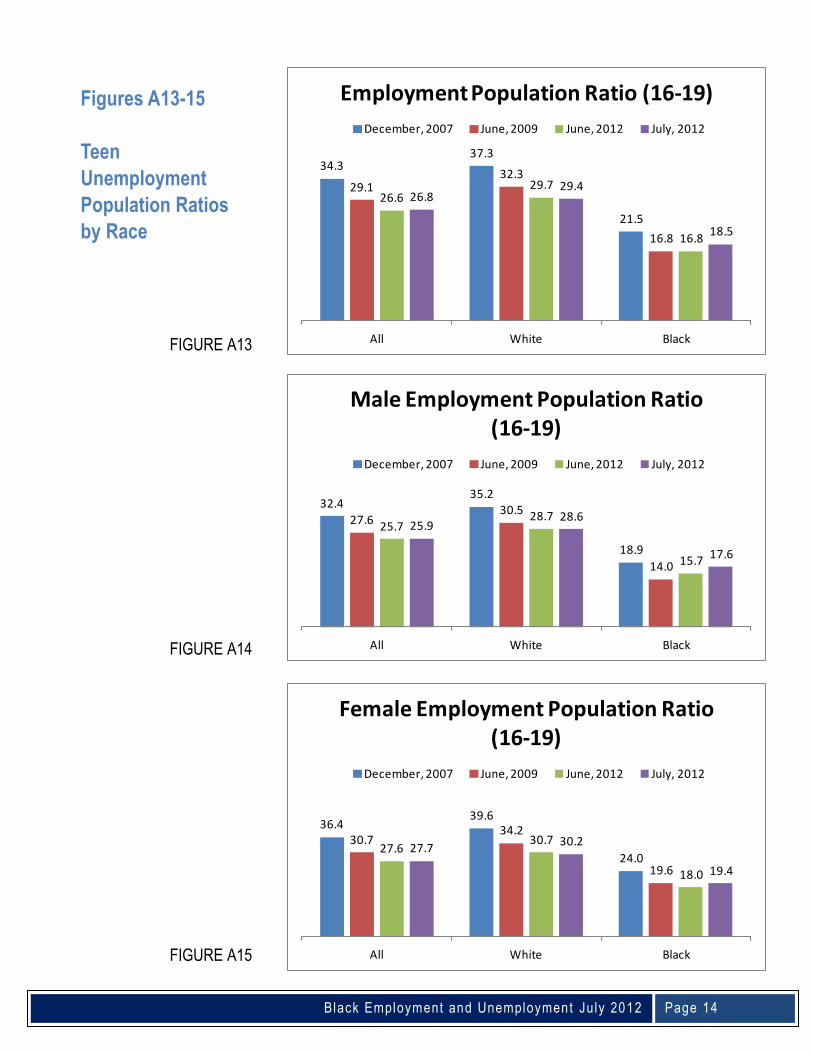
For Black teens, the employment-population ratio was 18.5% (an increase from 16.8% in
June). For Black female teens, ages 16 - 19, the employment-population ratio stood at
19.4% (an increase from 18.0% in June). For Black male teens, 16 -19, the employment-
population ratio was 17.6% (an increase from 15.7% in June). As with the monthly teen
unemployment rates, these figure are very volatile.
FIGURE 6
21.5
18.9
24.0
16.8
14.0
19.6
16.815.7
18.018.517.6
19.4
All Male Female
Source: Bureau of Labor Statistics
Black Employment Population Ratio (16-19)
December, 2007 June, 2009 June, 2012 July, 2012
Black Employment and Unemployment July 2012
Page 7
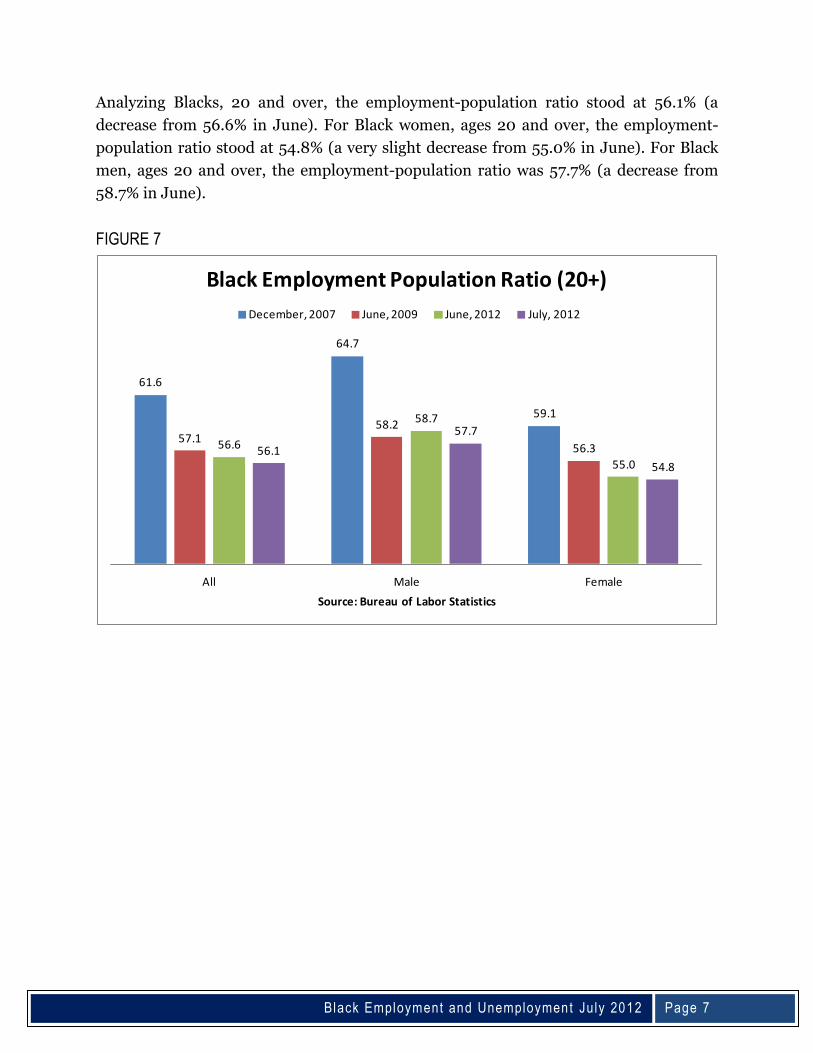
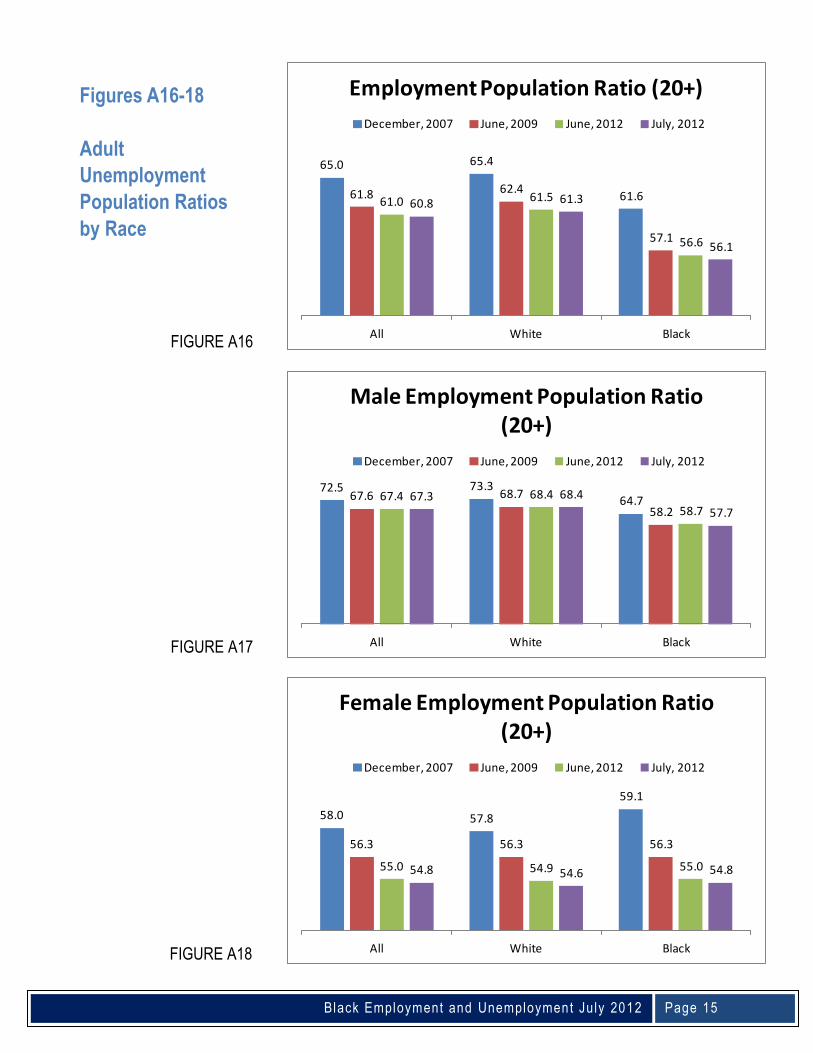
Analyzing Blacks, 20 and over, the employment-population ratio stood at 56.1% (a
decrease from 56.6% in June). For Black women, ages 20 and over, the employment-
population ratio stood at 54.8% (a very slight decrease from 55.0% in June). For Black
men, ages 20 and over, the employment-population ratio was 57.7% (a decrease from
58.7% in June).
FIGURE 7
61.6
64.7
59.1
57.158.2
56.356.6
58.7
55.056.1
57.7
54.8
All Male Female
Source: Bureau of Labor Statistics
Black Employment Population Ratio (20+)
December, 2007 June, 2009 June, 2012 July, 2012
Black Employment and Unemployment July 2012
Page 8
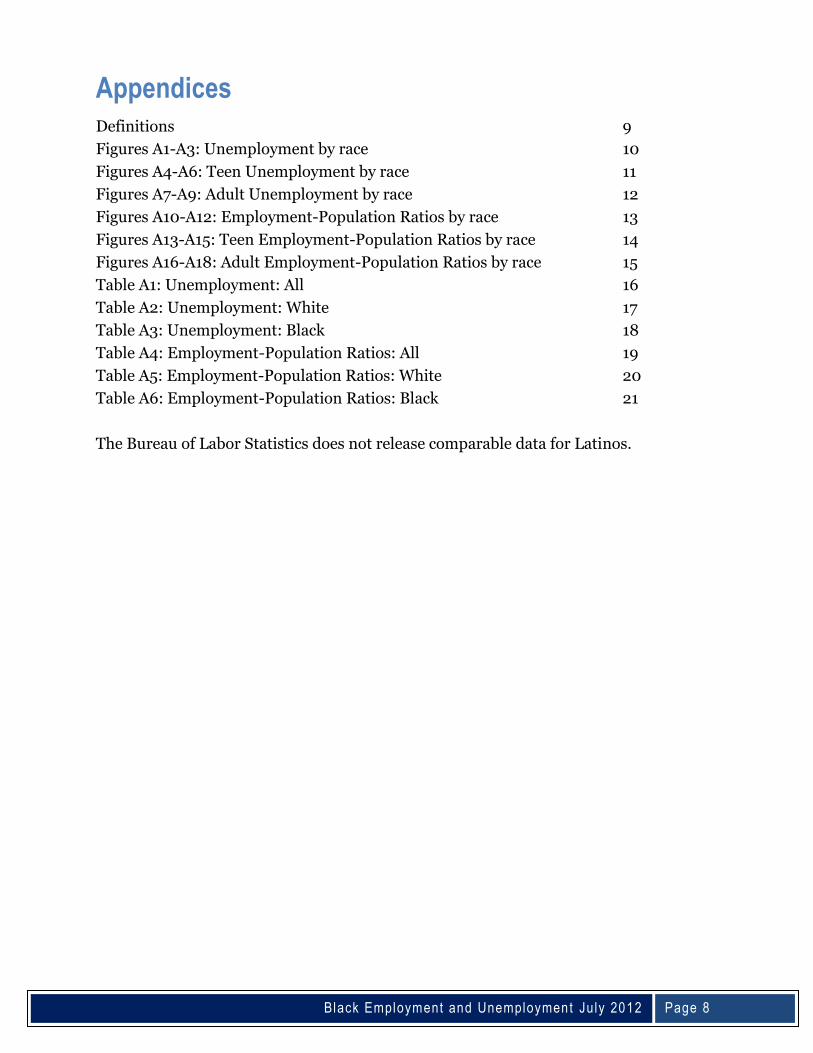
Appendices Definitions 9
Figures A1-A3: Unemployment by race 10
Figures A4-A6: Teen Unemployment by race 11
Figures A7-A9: Adult Unemployment by race 12
Figures A10-A12: Employment-Population Ratios by race 13
Figures A13-A15: Teen Employment-Population Ratios by race 14
Figures A16-A18: Adult Employment-Population Ratios by race 15
Table A1: Unemployment: All 16
Table A2: Unemployment: White 17
Table A3: Unemployment: Black 18
Table A4: Employment-Population Ratios: All 19
Table A5: Employment-Population Ratios: White 20
Table A6: Employment-Population Ratios: Black 21
The Bureau of Labor Statistics does not release comparable data for Latinos.
Black Employment and Unemployment July 2012
Page 9
Definitions Each month, the Bureau of Labor Statistics surveys approximately 60,000 households
reporting information on the labor market activity of the civilian non-
institutionalized population that is 16 years of age or older. (Members of the armed
services and persons in prisons, mental institutions, and homes for the elderly and
disabled are not included) From this information, an individual’s labor status is
determined to fall into one of three broad categories:
Employed. Persons will be considered employed if (during the survey week)
they did paid work for at least 1 hour; worked in their own firm; worked unpaid
for at least 15 hours for a family business; or were temporarily absent from work
for a variety of reasons. (Work in their own home is not included.)
Unemployed. Persons will be considered unemployed if (during the survey
week) they did not have a job, but they were available to work and sought work
during the preceding month. (Laid off workers awaiting recall are labeled as
unemployed.)
Not in the Labor Force. Those persons not considered employed or
unemployed are classified as not in the labor force.
The Civilian Labor Force represents the total number of employed and unemployed
persons.
Given these basic concepts, the following rates can be calculated:
Unemployment Rate. The unemployment rate is the proportion of the civilian labor
force that was unemployed. (The ratio of the unemployed (U) and the civilian labor force
(CLF): U% = U/CLF.) Please note: persons can be jobless, but unemployed if they are
not seeking employment. Hence the unemployment rate understates the amount of
joblessness.
Employment-Population Ratio. The employment-population ratio is the proportion
of the population that is employed. (The ratio of the employed (EMP) and the
population (POP): Emp-Pop Ratio = EMP/POP.)
For more information, please consult the website of the Bureau of Labor Statistics:
http://www.bls.gov/bls/glossary.htm and http://www.bls.gov/opub/hom/homch1_b.htm
Black Employment and Unemployment July 2012
Page 10
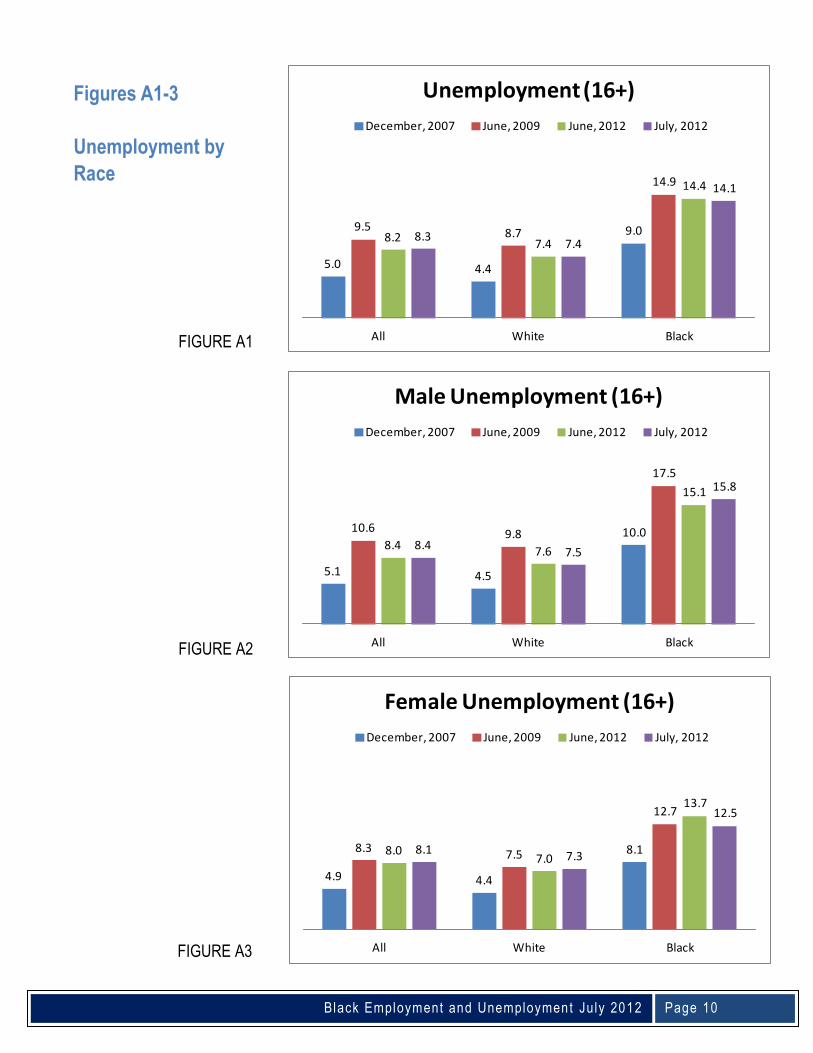
Figures A1-3
Unemployment by
Race
FIGURE A1
FIGURE A2
FIGURE A3
5.0 4.4
9.09.58.7
14.9
8.27.4
14.4
8.37.4
14.1
All White Black
Unemployment (16+)
December, 2007 June, 2009 June, 2012 July, 2012
5.1 4.5
10.010.6 9.8
17.5
8.4 7.6
15.1
8.47.5
15.8
All White Black
Male Unemployment (16+)
December, 2007 June, 2009 June, 2012 July, 2012
4.9 4.4
8.18.37.5
12.7
8.07.0
13.7
8.17.3
12.5
All White Black
Female Unemployment (16+)
December, 2007 June, 2009 June, 2012 July, 2012
Black Employment and Unemployment July 2012
Page 11
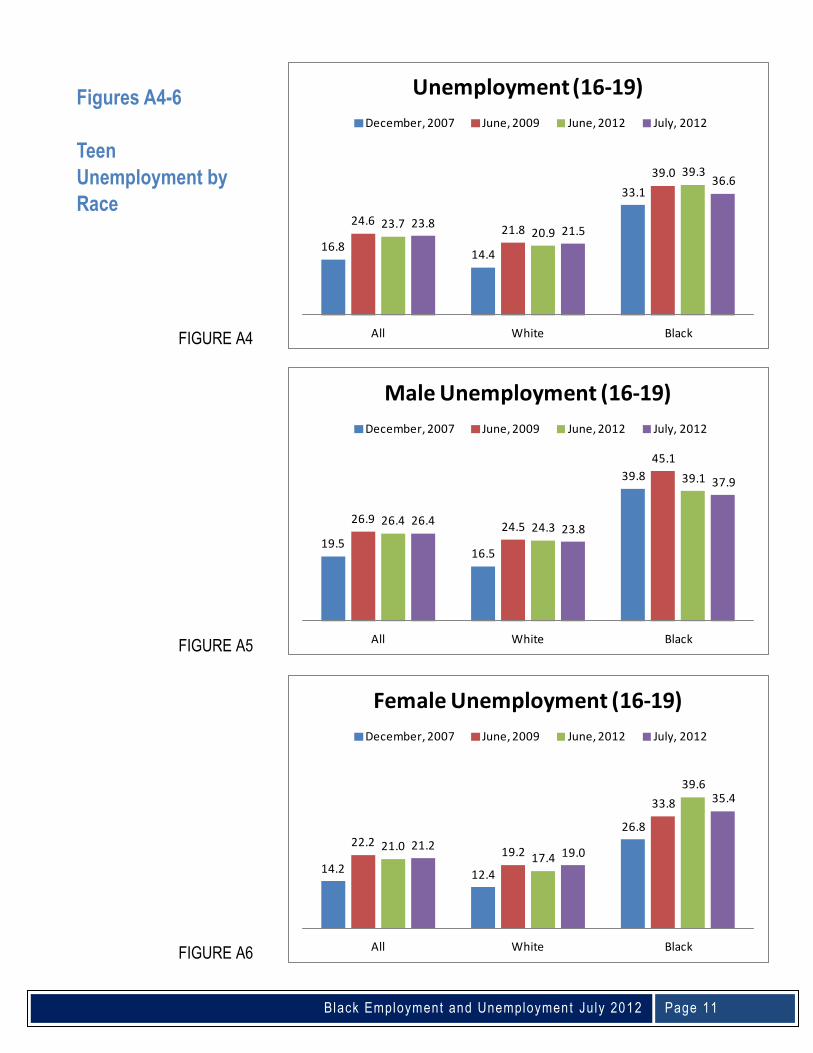
Figures A4-6
Teen
Unemployment by
Race
FIGURE A4
FIGURE A5
FIGURE A6
16.814.4
33.1
24.621.8
39.0
23.720.9
39.3
23.821.5
36.6
All White Black
Unemployment (16-19)
December, 2007 June, 2009 June, 2012 July, 2012
19.516.5
39.8
26.924.5
45.1
26.424.3
39.1
26.423.8
37.9
All White Black
Male Unemployment (16-19)
December, 2007 June, 2009 June, 2012 July, 2012
14.2 12.4
26.822.2
19.2
33.8
21.017.4
39.6
21.219.0
35.4
All White Black
Female Unemployment (16-19)
December, 2007 June, 2009 June, 2012 July, 2012
Black Employment and Unemployment July 2012
Page 12
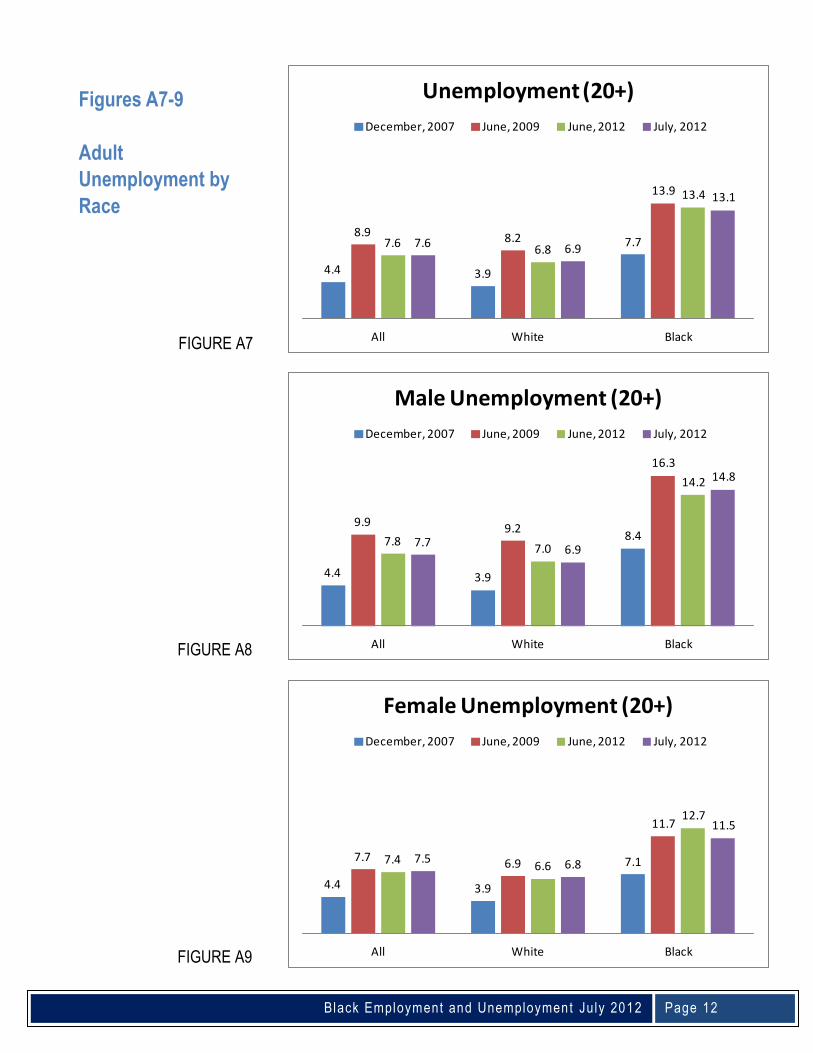
Figures A7-9
Adult
Unemployment by
Race
FIGURE A7
FIGURE A8
FIGURE A9
4.4 3.9
7.78.9 8.2
13.9
7.66.8
13.4
7.6 6.9
13.1
All White Black
Unemployment (20+)
December, 2007 June, 2009 June, 2012 July, 2012
4.4 3.9
8.49.9 9.2
16.3
7.87.0
14.2
7.76.9
14.8
All White Black
Male Unemployment (20+)
December, 2007 June, 2009 June, 2012 July, 2012
4.4 3.9
7.17.76.9
11.7
7.46.6
12.7
7.5 6.8
11.5
All White Black
Female Unemployment (20+)
December, 2007 June, 2009 June, 2012 July, 2012
Black Employment and Unemployment July 2012
Page 13
Figures A10-12
Unemployment
Population Ratios
by Race
FIGURE A10
FIGURE A11
FIGURE A12
62.7 63.5
57.759.4 60.3
53.3
58.6 59.4
53.1
58.4 59.2
52.8
All White Black
Employment Population Ratio (16+)
December, 2007 June, 2009 June, 2012 July, 2012
69.4 70.6
59.864.6 66.0
53.5
64.4 65.7
54.5
64.3 65.6
53.8
All White Black
Male Employment Population Ratio (16+)
December, 2007 June, 2009 June, 2012 July, 2012
56.5 56.656.0
54.5 54.9
53.153.2 53.4
52.053.0 53.1
52.0
All White Black
Female Employment Population Ratio (16+)
December, 2007 June, 2009 June, 2012 July, 2012
Black Employment and Unemployment July 2012
Page 14
Figures A13-15
Teen
Unemployment
Population Ratios
by Race
FIGURE A13
FIGURE A14
FIGURE A15
34.337.3
21.5
29.132.3
16.8
26.629.7
16.8
26.829.4
18.5
All White Black
Employment Population Ratio (16-19)
December, 2007 June, 2009 June, 2012 July, 2012
32.435.2
18.9
27.630.5
14.0
25.728.7
15.7
25.928.6
17.6
All White Black
Male Employment Population Ratio (16-19)
December, 2007 June, 2009 June, 2012 July, 2012
36.439.6
24.0
30.734.2
19.6
27.630.7
18.0
27.730.2
19.4
All White Black
Female Employment Population Ratio (16-19)
December, 2007 June, 2009 June, 2012 July, 2012
Black Employment and Unemployment July 2012
2012
Page 15
Figures A16-18
Adult
Unemployment
Population Ratios
by Race
FIGURE A16
FIGURE A17
FIGURE A18
65.0 65.4
61.661.8 62.4
57.1
61.0 61.5
56.6
60.8 61.3
56.1
All White Black
Employment Population Ratio (20+)
December, 2007 June, 2009 June, 2012 July, 2012
72.5 73.364.767.6 68.7
58.267.4 68.4
58.767.3 68.4
57.7
All White Black
Male Employment Population Ratio (20+)
December, 2007 June, 2009 June, 2012 July, 2012
58.0 57.8
59.1
56.3 56.3 56.3
55.0 54.9 55.054.8 54.6 54.8
All White Black
Female Employment Population Ratio (20+)
December, 2007 June, 2009 June, 2012 July, 2012

Black Employment and Unemployment July 2012
2012
Page 16
TABLE A1
Unemployment Rate: All
All Men Women
All 16-19 20+ All 16-19 20+ All 16-19 20+
2007 December 5.0 16.8 4.4 5.1 19.5 4.4 4.9 14.2 4.4
2010 January 9.7 26.4 9.0 10.8 30.6 10.0 8.4 21.9 7.9
2010 February 9.7 25.0 9.1 10.7 27.6 10.0 8.6 22.3 8.0
2010 March 9.7 26.1 9.1 10.7 29.7 10.0 8.6 22.4 8.0
2010 April 9.9 25.4 9.2 10.8 29.3 10.1 8.8 21.4 8.2
2010 May 9.7 26.4 9.0 10.5 28.1 9.8 8.8 24.6 8.1
2010 June 9.5 25.7 8.9 10.5 29.2 9.9 8.3 22.3 7.8
2010 July 9.5 26.1 8.8 10.4 29.0 9.7 8.5 23.1 7.9
2010 August 9.6 26.3 9.0 10.6 29.7 9.8 8.6 22.9 8.0
2010 September 9.6 26.0 8.9 10.5 29.3 9.8 8.6 22.8 8.0
2010 October 9.6 27.1 8.9 10.4 29.8 9.7 8.8 24.2 8.1
2010 November 9.8 24.6 9.2 10.6 26.7 10.0 8.9 22.4 8.4
2010 December 9.4 25.2 8.8 10.0 27.8 9.4 8.6 22.6 8.1
2011 January 9.1 25.4 8.4 9.6 27.2 8.9 8.5 23.6 7.9
2011 February 9.0 23.9 8.4 9.4 25.9 8.8 8.5 21.8 7.9
2011 March 8.9 24.5 8.3 9.4 26.4 8.7 8.3 22.6 7.8
2011 April 9.0 24.9 8.4 9.5 28.1 8.8 8.4 21.6 7.9
2011 May 9.0 24.1 8.5 9.5 27.0 8.9 8.5 21.3 8.0
2011 June 9.1 24.6 8.5 9.7 27.4 9.0 8.5 21.7 8.0
2011 July 9.1 24.9 8.5 9.6 27.2 8.9 8.5 22.5 7.9
2011 August 9.1 25.3 8.4 9.5 28.1 8.8 8.5 22.4 7.9
2011 September 9.0 24.5 8.4 9.4 27.8 8.7 8.6 21.1 8.1
2011 October 8.9 24.0 8.3 9.4 27.3 8.7 8.4 20.6 7.9
2011 November 8.7 23.7 8.1 8.9 26.6 8.3 8.3 20.7 7.8
2011 December 8.5 23.1 8.0 8.7 26.6 8.0 8.3 19.3 7.9
2012 January 8.3 23.2 7.7 8.3 25.3 7.7 8.3 21.1 7.7
2012 February 8.3 23.8 7.7 8.3 27.0 7.7 8.2 20.7 7.7
2012 March 8.2 25.0 7.5 8.3 26.7 7.6 8.1 23.4 7.4
2012 April 8.1 24.9 7.4 8.2 27.2 7.5 8.0 22.5 7.4
2012 May 8.2 24.6 7.6 8.4 26.8 7.8 7.9 22.3 7.4
2012 June 8.2 23.7 7.6 8.4 26.4 7.8 8.0 21.0 7.4
2012 July 8.3 23.8 7.6 8.4 26.4 7.7 8.1 21.2 7.5
Black Employment and Unemployment July 2012
2012
Page 17
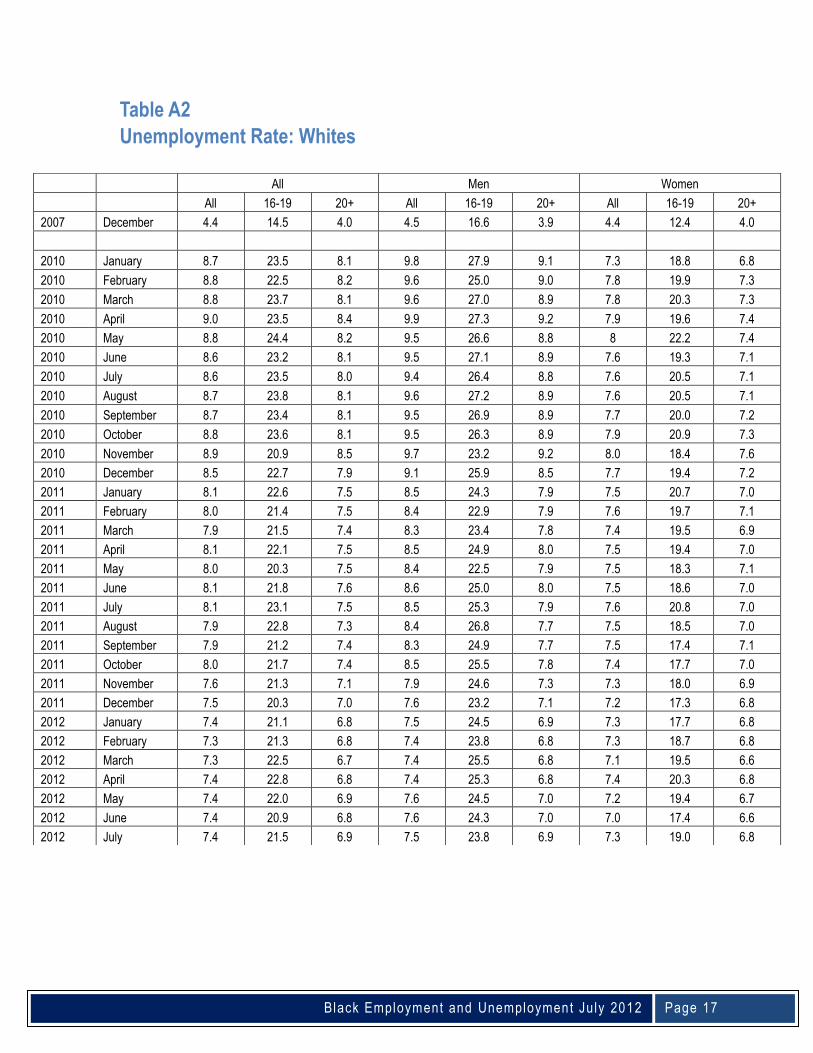
Table A2
Unemployment Rate: Whites
All Men Women
All 16-19 20+ All 16-19 20+ All 16-19 20+
2007 December 4.4 14.5 4.0 4.5 16.6 3.9 4.4 12.4 4.0
2010 January 8.7 23.5 8.1 9.8 27.9 9.1 7.3 18.8 6.8
2010 February 8.8 22.5 8.2 9.6 25.0 9.0 7.8 19.9 7.3
2010 March 8.8 23.7 8.1 9.6 27.0 8.9 7.8 20.3 7.3
2010 April 9.0 23.5 8.4 9.9 27.3 9.2 7.9 19.6 7.4
2010 May 8.8 24.4 8.2 9.5 26.6 8.8 8 22.2 7.4
2010 June 8.6 23.2 8.1 9.5 27.1 8.9 7.6 19.3 7.1
2010 July 8.6 23.5 8.0 9.4 26.4 8.8 7.6 20.5 7.1
2010 August 8.7 23.8 8.1 9.6 27.2 8.9 7.6 20.5 7.1
2010 September 8.7 23.4 8.1 9.5 26.9 8.9 7.7 20.0 7.2
2010 October 8.8 23.6 8.1 9.5 26.3 8.9 7.9 20.9 7.3
2010 November 8.9 20.9 8.5 9.7 23.2 9.2 8.0 18.4 7.6
2010 December 8.5 22.7 7.9 9.1 25.9 8.5 7.7 19.4 7.2
2011 January 8.1 22.6 7.5 8.5 24.3 7.9 7.5 20.7 7.0
2011 February 8.0 21.4 7.5 8.4 22.9 7.9 7.6 19.7 7.1
2011 March 7.9 21.5 7.4 8.3 23.4 7.8 7.4 19.5 6.9
2011 April 8.1 22.1 7.5 8.5 24.9 8.0 7.5 19.4 7.0
2011 May 8.0 20.3 7.5 8.4 22.5 7.9 7.5 18.3 7.1
2011 June 8.1 21.8 7.6 8.6 25.0 8.0 7.5 18.6 7.0
2011 July 8.1 23.1 7.5 8.5 25.3 7.9 7.6 20.8 7.0
2011 August 7.9 22.8 7.3 8.4 26.8 7.7 7.5 18.5 7.0
2011 September 7.9 21.2 7.4 8.3 24.9 7.7 7.5 17.4 7.1
2011 October 8.0 21.7 7.4 8.5 25.5 7.8 7.4 17.7 7.0
2011 November 7.6 21.3 7.1 7.9 24.6 7.3 7.3 18.0 6.9
2011 December 7.5 20.3 7.0 7.6 23.2 7.1 7.2 17.3 6.8
2012 January 7.4 21.1 6.8 7.5 24.5 6.9 7.3 17.7 6.8
2012 February 7.3 21.3 6.8 7.4 23.8 6.8 7.3 18.7 6.8
2012 March 7.3 22.5 6.7 7.4 25.5 6.8 7.1 19.5 6.6
2012 April 7.4 22.8 6.8 7.4 25.3 6.8 7.4 20.3 6.8
2012 May 7.4 22.0 6.9 7.6 24.5 7.0 7.2 19.4 6.7
2012 June 7.4 20.9 6.8 7.6 24.3 7.0 7.0 17.4 6.6
2012 July 7.4 21.5 6.9 7.5 23.8 6.9 7.3 19.0 6.8
Black Employment and Unemployment July 2012
2012
Page 18
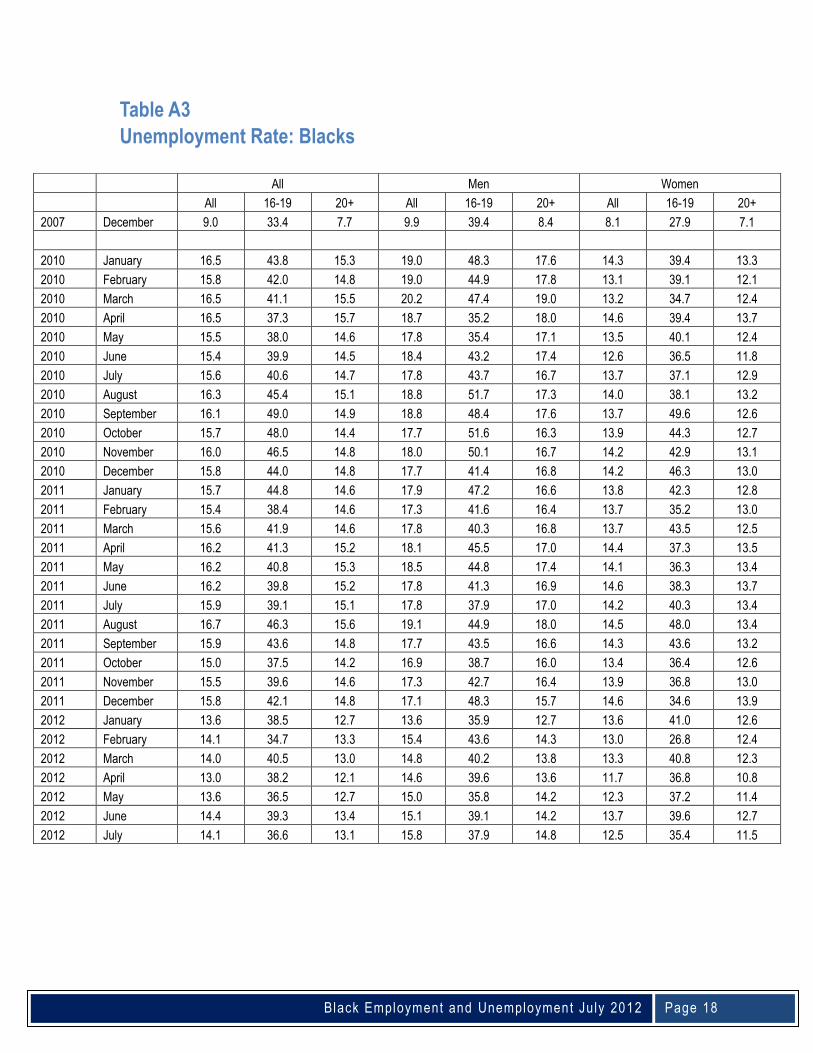
Table A3
Unemployment Rate: Blacks
All Men Women
All 16-19 20+ All 16-19 20+ All 16-19 20+
2007 December 9.0 33.4 7.7 9.9 39.4 8.4 8.1 27.9 7.1
2010 January 16.5 43.8 15.3 19.0 48.3 17.6 14.3 39.4 13.3
2010 February 15.8 42.0 14.8 19.0 44.9 17.8 13.1 39.1 12.1
2010 March 16.5 41.1 15.5 20.2 47.4 19.0 13.2 34.7 12.4
2010 April 16.5 37.3 15.7 18.7 35.2 18.0 14.6 39.4 13.7
2010 May 15.5 38.0 14.6 17.8 35.4 17.1 13.5 40.1 12.4
2010 June 15.4 39.9 14.5 18.4 43.2 17.4 12.6 36.5 11.8
2010 July 15.6 40.6 14.7 17.8 43.7 16.7 13.7 37.1 12.9
2010 August 16.3 45.4 15.1 18.8 51.7 17.3 14.0 38.1 13.2
2010 September 16.1 49.0 14.9 18.8 48.4 17.6 13.7 49.6 12.6
2010 October 15.7 48.0 14.4 17.7 51.6 16.3 13.9 44.3 12.7
2010 November 16.0 46.5 14.8 18.0 50.1 16.7 14.2 42.9 13.1
2010 December 15.8 44.0 14.8 17.7 41.4 16.8 14.2 46.3 13.0
2011 January 15.7 44.8 14.6 17.9 47.2 16.6 13.8 42.3 12.8
2011 February 15.4 38.4 14.6 17.3 41.6 16.4 13.7 35.2 13.0
2011 March 15.6 41.9 14.6 17.8 40.3 16.8 13.7 43.5 12.5
2011 April 16.2 41.3 15.2 18.1 45.5 17.0 14.4 37.3 13.5
2011 May 16.2 40.8 15.3 18.5 44.8 17.4 14.1 36.3 13.4
2011 June 16.2 39.8 15.2 17.8 41.3 16.9 14.6 38.3 13.7
2011 July 15.9 39.1 15.1 17.8 37.9 17.0 14.2 40.3 13.4
2011 August 16.7 46.3 15.6 19.1 44.9 18.0 14.5 48.0 13.4
2011 September 15.9 43.6 14.8 17.7 43.5 16.6 14.3 43.6 13.2
2011 October 15.0 37.5 14.2 16.9 38.7 16.0 13.4 36.4 12.6
2011 November 15.5 39.6 14.6 17.3 42.7 16.4 13.9 36.8 13.0
2011 December 15.8 42.1 14.8 17.1 48.3 15.7 14.6 34.6 13.9
2012 January 13.6 38.5 12.7 13.6 35.9 12.7 13.6 41.0 12.6
2012 February 14.1 34.7 13.3 15.4 43.6 14.3 13.0 26.8 12.4
2012 March 14.0 40.5 13.0 14.8 40.2 13.8 13.3 40.8 12.3
2012 April 13.0 38.2 12.1 14.6 39.6 13.6 11.7 36.8 10.8
2012 May 13.6 36.5 12.7 15.0 35.8 14.2 12.3 37.2 11.4
2012 June 14.4 39.3 13.4 15.1 39.1 14.2 13.7 39.6 12.7
2012 July 14.1 36.6 13.1 15.8 37.9 14.8 12.5 35.4 11.5

Black Employment and Unemployment July 2012
2012
Page 19
Table A4
Employment-Population Ratio: All
All Men Women
All 16-19 20+ All 16-19 20+ All 16-19 20+
2007 December 62.7 34.2 64.9 69.3 32.2 72.4 56.5 36.2 58.0
2010 January 58.4 25.9 60.9 63.3 24.6 66.4 53.9 27.3 55.8
2010 February 58.5 26.3 61.0 63.5 25.4 66.6 53.8 27.3 55.8
2010 March 58.6 26.5 61.0 63.7 25.3 66.8 53.8 27.7 55.7
2010 April 58.8 26.8 61.2 64.0 25.4 67.1 53.8 28.2 55.7
2010 May 58.7 26.2 61.2 64.0 25.2 67.2 53.7 27.3 55.6
2010 June 58.5 25.4 61.1 63.7 24.0 66.9 53.6 26.8 55.6
2010 July 58.4 25.6 60.9 63.8 24.8 66.9 53.4 26.4 55.4
2010 August 58.5 25.9 61.0 63.8 24.4 67.0 53.5 27.5 55.3
2010 September 58.5 25.3 61.0 63.7 23.8 66.9 53.6 26.8 55.5
2010 October 58.3 25.6 60.8 63.6 24.5 66.7 53.3 26.8 55.3
2010 November 58.2 26.1 60.6 63.4 25.8 66.4 53.3 26.5 55.2
2010 December 58.3 25.6 60.7 63.6 24.8 66.7 53.3 26.4 55.2
2011 January 58.4 25.7 60.9 63.7 25.4 66.8 53.3 26.0 55.3
2011 February 58.4 25.5 60.9 63.9 25.0 67.0 53.3 26.1 55.2
2011 March 58.5 25.7 61.0 63.8 24.8 67.0 53.4 26.7 55.3
2011 April 58.4 25.3 60.9 63.7 23.6 66.9 53.3 27.1 55.2
2011 May 58.4 25.4 60.9 63.9 23.9 67.1 53.3 26.9 55.1
2011 June 58.2 25.7 60.6 63.7 24.3 66.9 53.0 27.2 54.8
2011 July 58.2 25.4 60.6 63.6 24.3 66.7 53.1 26.7 54.9
2011 August 58.3 25.9 60.7 63.7 24.6 66.8 53.1 27.2 54.9
2011 September 58.4 26.1 60.8 63.9 24.5 67.0 53.2 27.7 55.0
2011 October 58.4 26.3 60.8 63.9 24.7 67.0 53.2 28.0 55.0
2011 November 58.5 26.4 60.9 64.2 24.9 67.3 53.1 28.0 54.8
2011 December 58.5 26.3 60.9 64.4 25.2 67.5 53.0 27.4 54.8
2012 January 58.5 25.7 61.0 64.5 24.3 67.7 52.9 27.1 54.7
2012 February 58.6 25.6 61.1 64.4 23.9 67.7 53.2 27.4 55.0
2012 March 58.5 25.4 61.1 64.4 23.9 67.7 53.1 26.9 54.9
2012 April 58.4 25.4 60.9 64.3 24.6 67.5 53.0 26.2 54.9
2012 May 58.6 25.8 61.0 64.3 25.0 67.5 53.2 26.6 55.1
2012 June 58.6 26.6 61.0 64.4 25.7 67.4 53.2 27.6 55.0
2012 July 58.4 26.8 60.8 64.3 25.9 67.3 53.0 27.7 54.8
Black Employment and Unemployment July 2012
2012
Page 20
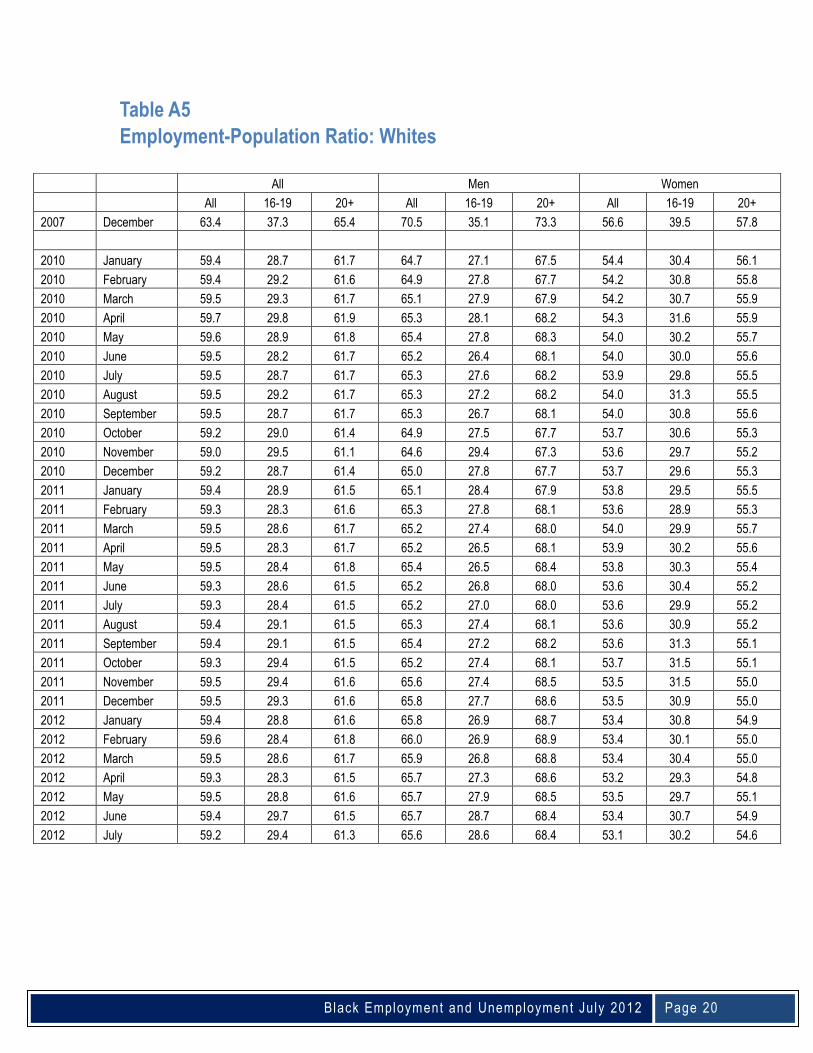
Table A5
Employment-Population Ratio: Whites
All Men Women
All 16-19 20+ All 16-19 20+ All 16-19 20+
2007 December 63.4 37.3 65.4 70.5 35.1 73.3 56.6 39.5 57.8
2010 January 59.4 28.7 61.7 64.7 27.1 67.5 54.4 30.4 56.1
2010 February 59.4 29.2 61.6 64.9 27.8 67.7 54.2 30.8 55.8
2010 March 59.5 29.3 61.7 65.1 27.9 67.9 54.2 30.7 55.9
2010 April 59.7 29.8 61.9 65.3 28.1 68.2 54.3 31.6 55.9
2010 May 59.6 28.9 61.8 65.4 27.8 68.3 54.0 30.2 55.7
2010 June 59.5 28.2 61.7 65.2 26.4 68.1 54.0 30.0 55.6
2010 July 59.5 28.7 61.7 65.3 27.6 68.2 53.9 29.8 55.5
2010 August 59.5 29.2 61.7 65.3 27.2 68.2 54.0 31.3 55.5
2010 September 59.5 28.7 61.7 65.3 26.7 68.1 54.0 30.8 55.6
2010 October 59.2 29.0 61.4 64.9 27.5 67.7 53.7 30.6 55.3
2010 November 59.0 29.5 61.1 64.6 29.4 67.3 53.6 29.7 55.2
2010 December 59.2 28.7 61.4 65.0 27.8 67.7 53.7 29.6 55.3
2011 January 59.4 28.9 61.5 65.1 28.4 67.9 53.8 29.5 55.5
2011 February 59.3 28.3 61.6 65.3 27.8 68.1 53.6 28.9 55.3
2011 March 59.5 28.6 61.7 65.2 27.4 68.0 54.0 29.9 55.7
2011 April 59.5 28.3 61.7 65.2 26.5 68.1 53.9 30.2 55.6
2011 May 59.5 28.4 61.8 65.4 26.5 68.4 53.8 30.3 55.4
2011 June 59.3 28.6 61.5 65.2 26.8 68.0 53.6 30.4 55.2
2011 July 59.3 28.4 61.5 65.2 27.0 68.0 53.6 29.9 55.2
2011 August 59.4 29.1 61.5 65.3 27.4 68.1 53.6 30.9 55.2
2011 September 59.4 29.1 61.5 65.4 27.2 68.2 53.6 31.3 55.1
2011 October 59.3 29.4 61.5 65.2 27.4 68.1 53.7 31.5 55.1
2011 November 59.5 29.4 61.6 65.6 27.4 68.5 53.5 31.5 55.0
2011 December 59.5 29.3 61.6 65.8 27.7 68.6 53.5 30.9 55.0
2012 January 59.4 28.8 61.6 65.8 26.9 68.7 53.4 30.8 54.9
2012 February 59.6 28.4 61.8 66.0 26.9 68.9 53.4 30.1 55.0
2012 March 59.5 28.6 61.7 65.9 26.8 68.8 53.4 30.4 55.0
2012 April 59.3 28.3 61.5 65.7 27.3 68.6 53.2 29.3 54.8
2012 May 59.5 28.8 61.6 65.7 27.9 68.5 53.5 29.7 55.1
2012 June 59.4 29.7 61.5 65.7 28.7 68.4 53.4 30.7 54.9
2012 July 59.2 29.4 61.3 65.6 28.6 68.4 53.1 30.2 54.6

Black Employment and Unemployment July 2012
2012
Page 21
Table A6
Employment-Population Ratio: Blacks
All Men Women
All 16-19 20+ All 16-19 20+ All 16-19 20+
2007 December 57.7 21.1 61.6 59.8 18.7 64.7 56.0 23.5 59.1
2010 January 52.0 15.6 55.7 52.6 14.5 57.0 51.4 16.7 54.7
2010 February 52.3 14.9 56.2 52.5 14.5 56.9 52.1 15.3 55.6
2010 March 52.2 15.7 55.9 52.7 14.5 57.0 51.8 16.9 55.1
2010 April 52.4 15.8 56.1 53.4 16.2 57.6 51.5 15.4 54.9
2010 May 53.0 16.2 56.8 54.1 15.4 58.5 52.1 16.9 55.4
2010 June 52.4 14.4 56.3 52.9 14.1 57.3 52.0 14.6 55.5
2010 July 51.9 14.4 55.7 53.0 14.4 57.3 51.0 14.3 54.4
2010 August 52.0 14.3 55.9 53.0 13.8 57.4 51.3 14.8 54.7
2010 September 51.7 11.7 55.8 52.4 12.6 56.9 51.1 10.9 54.9
2010 October 52.4 13.7 56.4 53.3 13.1 57.8 51.7 14.3 55.2
2010 November 52.5 14.2 56.3 53.2 13.3 57.6 51.9 15.0 55.3
2010 December 52.2 13.8 56.1 53.0 13.7 57.4 51.6 13.9 55.1
2011 January 51.9 13.9 55.7 52.7 14.0 56.9 51.3 13.8 54.7
2011 February 52.0 14.8 55.7 52.8 14.2 57.1 51.4 15.3 54.7
2011 March 51.9 14.9 55.5 53.0 15.3 57.1 51.0 14.4 54.3
2011 April 51.5 15.5 55.1 52.6 14.1 56.8 50.7 16.8 53.7
2011 May 51.1 14.4 54.7 51.9 14.5 56.0 50.5 14.4 53.7
2011 June 51.1 15.4 54.6 52.8 15.5 56.8 49.8 15.4 52.9
2011 July 50.9 14.0 54.5 52.3 14.9 56.3 49.7 13.2 52.9
2011 August 51.3 13.0 55.1 52.2 14.5 56.3 50.6 11.5 54.1
2011 September 52.1 14.6 55.8 52.9 14.9 57.0 51.5 14.3 54.8
2011 October 52.5 15.2 56.1 53.4 14.7 57.5 51.8 15.6 55.0
2011 November 51.8 15.1 55.3 53.1 13.8 57.3 50.7 16.4 53.7
2011 December 52.1 15.3 55.6 54.0 15.1 58.2 50.4 15.6 53.5
2012 January 52.9 15.2 56.6 55.2 15.4 59.7 51.0 15.0 54.2
2012 February 53.0 17.4 56.5 54.0 14.1 58.4 52.2 20.7 55.0
2012 March 53.2 14.9 56.9 54.5 14.0 58.9 52.1 15.9 55.4
2012 April 53.3 15.5 57.0 53.9 15.5 58.1 52.8 15.5 56.1
2012 May 52.9 15.9 56.6 54.2 15.1 58.4 51.9 16.7 55.1
2012 June 53.1 16.8 56.6 54.5 15.7 58.7 52.0 18.0 55.0
2012 July 52.8 18.5 56.1 53.8 17.6 57.7 52.0 19.4 54.8
Related Documents