Unemployment Rates (August of each year) 4.0 5.0 6.0 7.0 8.0 9.0 10.0 2000 2001 2002 2003 2004 2005 2006 2007 2008 2009 2010 R ochester M SA NYS US-9.5% NYS-8.2% Rochester-7.5% 2010 7.5% 9.5% 2009 7.8% 9.6% Rochester MSA U.S.

Unemployment Rates (August of each year) 2010 7.5%9.5% 20097.8%9.6% Rochester MSA U.S.
Dec 16, 2015
Welcome message from author
This document is posted to help you gain knowledge. Please leave a comment to let me know what you think about it! Share it to your friends and learn new things together.
Transcript

Unemployment Rates(August of each year)
4.0
5.0
6.0
7.0
8.0
9.0
10.0
2000 2001 2002 2003 2004 2005 2006 2007 2008 2009 2010
Rochester MSANYS
US-9.5%
NYS-8.2%
Rochester-7.5%
2010 7.5% 9.5%2009 7.8% 9.6%
Rochester MSA U.S.
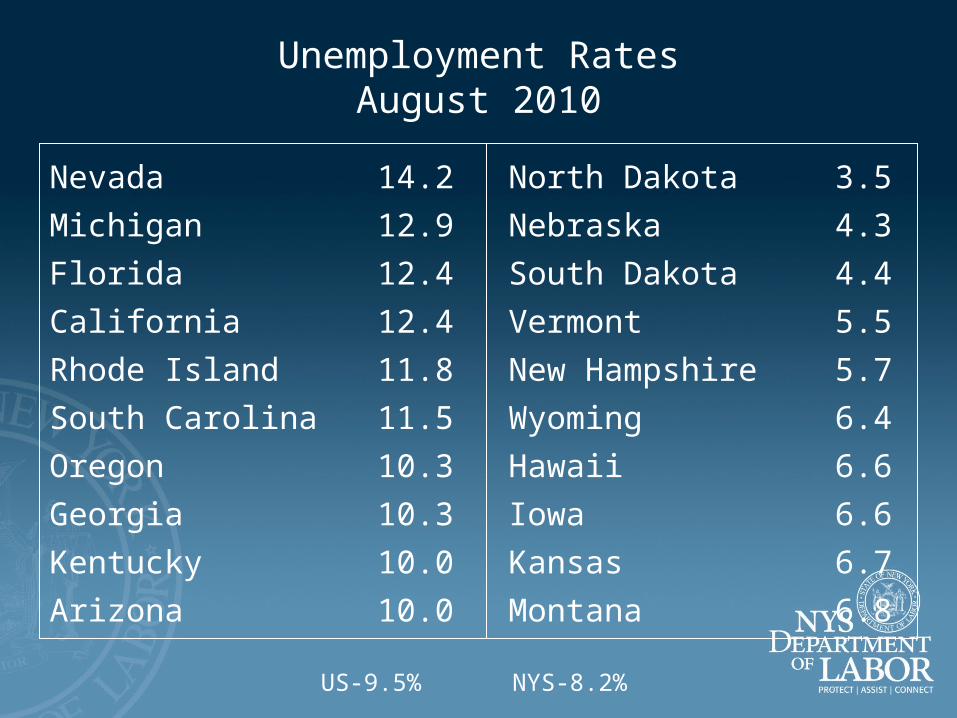
Unemployment RatesAugust 2010
Nevada 14.2 North Dakota 3.5
Michigan 12.9 Nebraska 4.3
Florida 12.4 South Dakota 4.4
California 12.4 Vermont 5.5
Rhode Island 11.8 New Hampshire 5.7
South Carolina 11.5 Wyoming 6.4
Oregon 10.3 Hawaii 6.6
Georgia 10.3 Iowa 6.6
Kentucky 10.0 Kansas 6.7
Arizona 10.0 Montana 6.8
US-9.5%NYS-8.2%

Private Sector EmploymentRochester MSA
July of Each Year
Employment is 3,900 (-1.4%) below its pre-recession levelRecovered ~80% of the jobs lost during the recession

Private Sector EmploymentUnited States
July of Each Year
Employment is 5.3 million (-4.6%) below its pre-recession level
The US lost 8.2 million jobs (-7%)2007-2010

Change in EmploymentRochester MSA March 2012-March 2011
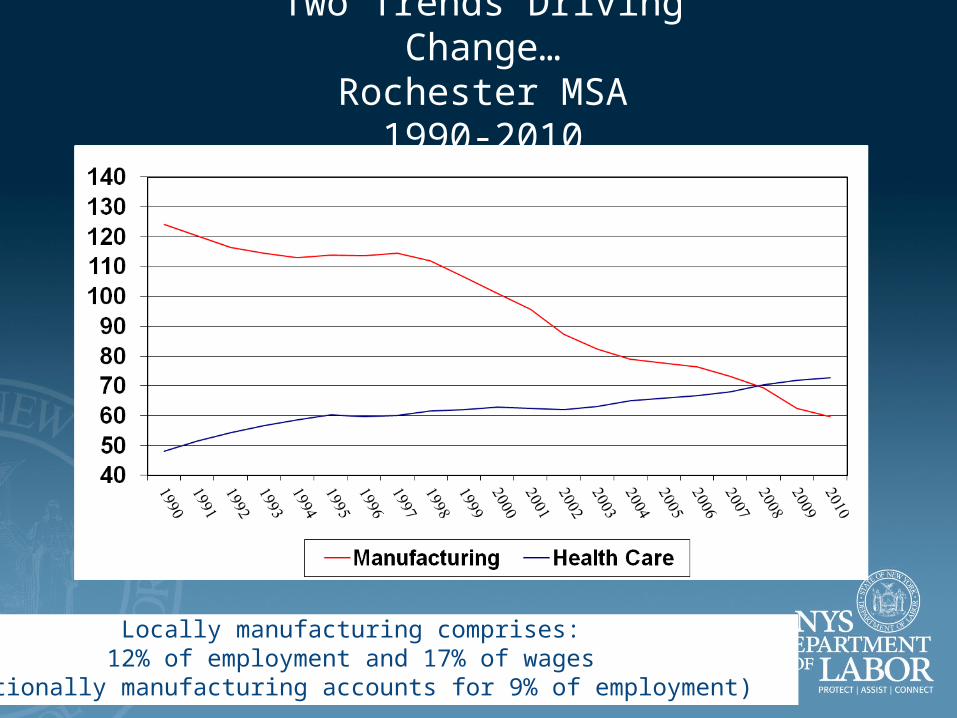
Two Trends Driving Change…Rochester MSA
1990-2010
Locally manufacturing comprises:12% of employment and 17% of wages
(Nationally manufacturing accounts for 9% of employment)

Employment by IndustryRochester MSAJanuary 2009

Fastest Growing OccupationsFinger Lakes Region
2008-2018
TitlePercentChange
Employment
Wages 2018
Personal and Home Care Aides 49.4 $18,500 3,690
Network Systems and Data Communications Analysts 33.6 $50,700 1,550
Home Health Aides 31.6 $19,100 11,150
Dental Hygienists 26.0 $59,700 1,310
Dental Assistants 25.0 $24,600 1,300
Medical and Public Health Social Workers 24.2 $30,100 770
Medical Assistants 23.8 $24,400 780
Physician Assistants 22.4 $75,400 820
Social and Human Service Assistants 20.7 $17,900 2,510
Physical Therapists 20.3 $45,900 830
Source: New York State Department of Labor

Fastest Growing Occupations continued…
Occupational Therapists 20.0 $41,200 600
Rehabilitation Counselors 18.9 $22,800 1,260
Medical Secretaries 17.8 $22,300 1,260
Market Research Analysts 16.8 $36,400 1,530
Licensed Practical and Licensed Vocational Nurses 14.9 $29,500 4,870
Pharmacy Technicians 14.2 $20,800 1,290
Nursing Aides, Orderlies, and Attendants 13.9 $19,900 7,520
Registered Nurses 13.7 $45,200 12,410
Combined Food Preparation and Serving Workers, Including Fast Food
12.9 $17,300 8,290
Child, Family, and School Social Workers 11.4 $32,300 1,560

Registered Nurses 340Computer Support Specialists 80Dental Hygienists 50Paralegals and Legal Assistants 40Medical Records & Health Information Technicians 30
Occupations Requiring an Associate Degree, Finger Lakes, 2008-
2018Fastest Growing Occupations % Growth
Dental Hygienists 26.0%Physical Therapist Assistants 25.0%Occupational Therapist Assistants 25.0%Radiation Therapists 25.0%Medical Equipment Repairers 20.8%
Occupations with Most Annual Openings Openings/Year
Median Wage
$57,800 $35,300 $42,300 $60,400 $43,500
$58,700 $44,300 $57,800 $41,600 $31,100
Source: New York State Department of Labor
Accountants and Auditors 140Computer Systems Analysts 80Child, Family and School Social Workers 60Employment, Recruitment and Placement Specialists 50Medical and Clinical Laboratory Technologists 30
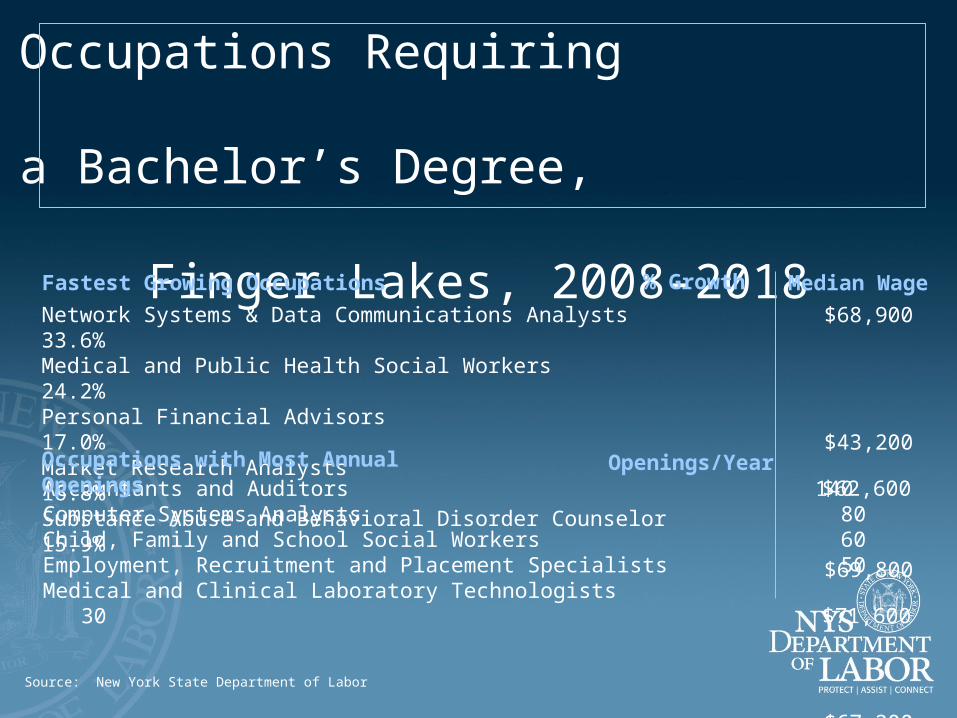
Occupations Requiring a Bachelor’s Degree,
Finger Lakes, 2008-2018
Fastest Growing Occupations % Growth
Network Systems & Data Communications Analysts 33.6%Medical and Public Health Social Workers 24.2%Personal Financial Advisors 17.0%Market Research Analysts 16.8%Substance Abuse and Behavioral Disorder Counselor 15.9%
Occupations with Most Annual Openings Openings/Year
Median Wage
$68,900 $43,200 $69,800 $67,200 $38,400
$62,600 $71,600 $46,400 $43,300 $50,500
Source: New York State Department of Labor

Fastest Growing Occupations* % Growth
Fitness Trainers & Aerobics Instructors 23.7%Licensed Practical Nurses 14.9%Nursing Aides, Orderlies & Technicians 13.9%Preschool Teachers 9.2%Restaurant Cooks 6.7%
Occupations with Most Annual Openings Openings/YearAutomotive Service Technicians and Mechanics 80Police and Sheriff’s Patrol Officers 60Carpenters 50Electricians 50
Median Wage
$22,700 $37,400 $25,200 $22,300 $23,800
$30,700 $54,600 $35,900 $48,800
Source: New York State Department of Labor
Occupations Requiring Either Postsecondary Training or Long-term OTJ Training,
Finger Lakes, 2008-2018

Occupations Requiring Moderate to Short-term OTJ Training,
Finger Lakes, 2008-2018
Occupations with Most Annual Openings Openings/Year
Cashiers 690Retail Salesperson 500Waiters and Waitresses 480Home Health Aides 350Customer Service Representatives 350Teacher Assistant 270Food Preparation and Serving Workers 260Child Care Workers 250Stock Clerks and Order Fillers 210Janitors and Cleaners 210
Median Wage
$17,400 $20,000 $19,300 $23,700 $29,200 $21,000 $18,000 $18,300 $19,800 $22,800
Source: New York State Department of Labor
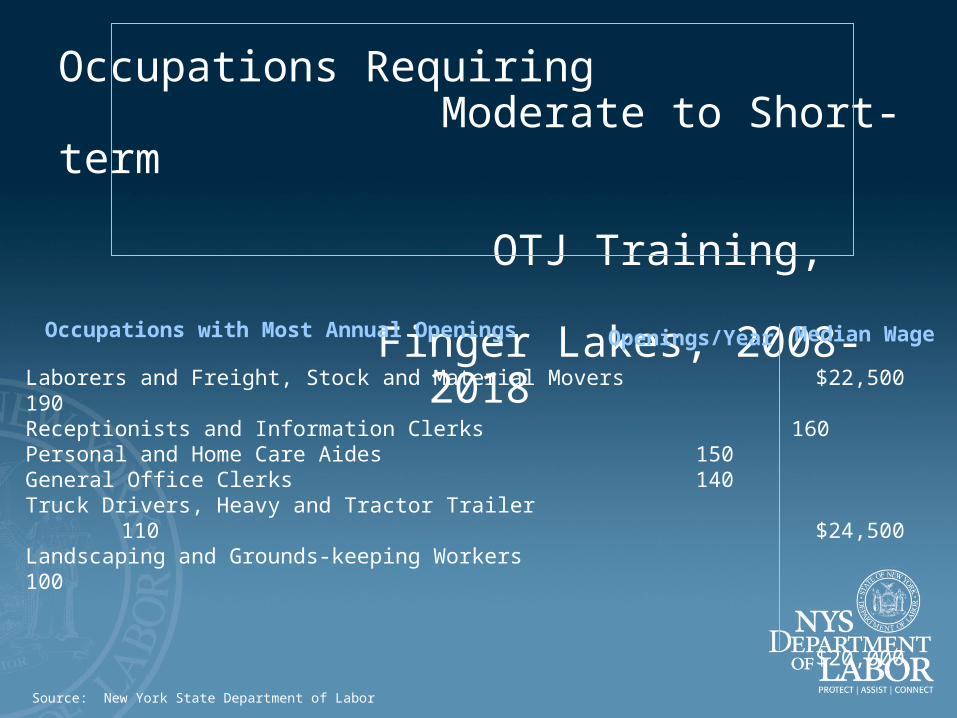
Occupations Requiring Moderate to Short-term OTJ Training,
Finger Lakes, 2008-2018
Occupations with Most Annual Openings Openings/Year
Laborers and Freight, Stock and Material Movers 190Receptionists and Information Clerks 160Personal and Home Care Aides 150General Office Clerks 140Truck Drivers, Heavy and Tractor Trailer 110Landscaping and Grounds-keeping Workers 100
Median Wage
$22,500 $24,500 $20,000 $23,800 $35,300 $24,000
Source: New York State Department of Labor
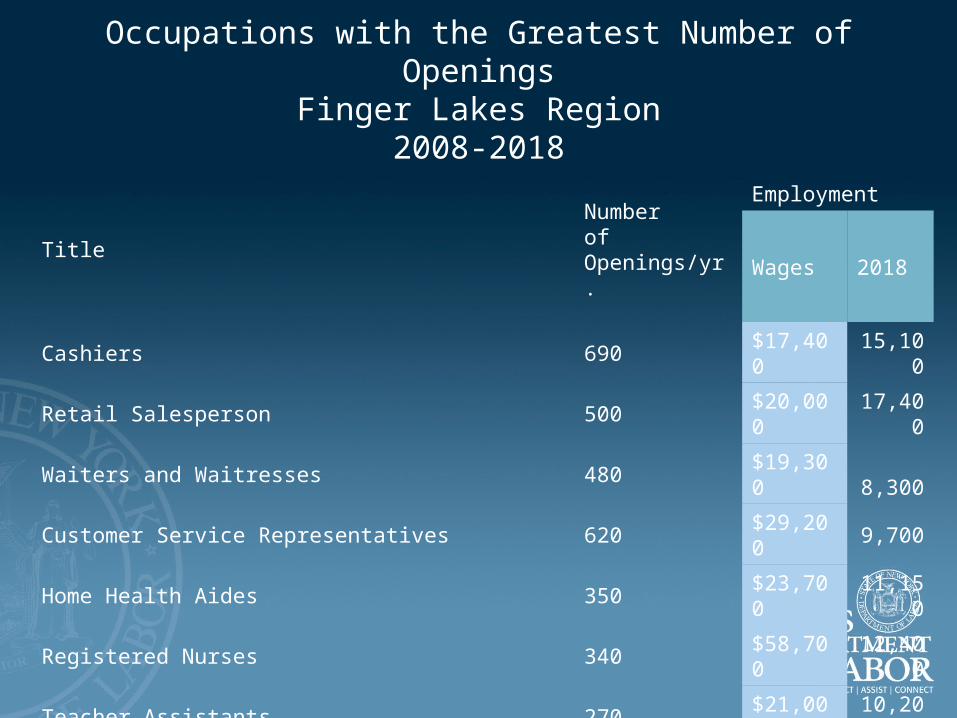
Occupations with the Greatest Number of OpeningsFinger Lakes Region
2008-2018
TitleNumberof Openings/yr.
Employment
Wages 2018
Cashiers 690 $17,400 15,100
Retail Salesperson 500 $20,000 17,400
Waiters and Waitresses 480 $19,300 8,300
Customer Service Representatives 620 $29,200 9,700
Home Health Aides 350 $23,700 11,150
Registered Nurses 340 $58,700 12,400
Teacher Assistants 270 $21,000 10,200
Food Preparation and Serving Workers 260 $18,000 8,300
Child Care Workers 250 $18,300 7,200
Stock Clerks and Order Fillers 210 $19,800 9,000

Occupations with the Largest Number of Openings continued…
Janitors and Cleaners 210 $22,800 11,000
Licensed Practical Nurses 190 $37,400 4,900
Laborers and Freight, Stock and Material Movers 190 $22,500 5,200
Secretaries, Except Medical and Legal 160 $29,500 11,900
Nursing Aides, Orderlies and Attendants 160 $25,200 7,500
Receptionists and Information Clerks 160 $24,500 5,000
Personal and Home Care Aides 150 $20,000 3,700
Accountants and Auditors 140 $62,600 5,800

Long Term Trends
• Network Systems and Data Communications Analysts • Computer Software Engineers, Applications• Home Health Aides• Personal and Home Care Aides• Medical Assistants• Dental Hygienists • Dental Assistants • Physical Therapist Assistants • Substance Abuse and Behavioral Disorder Counselors • Computer Systems Analysts• Physical Therapist Aides • Network and Computer Systems Administrators
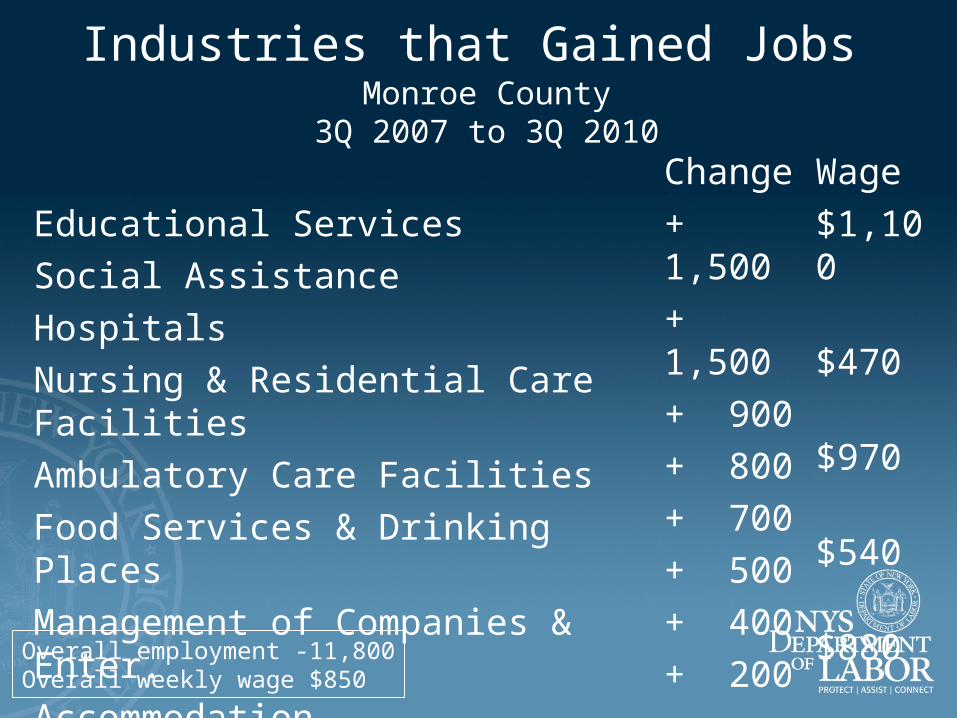
Industries that Gained Jobs Monroe County
3Q 2007 to 3Q 2010
Educational Services
Social Assistance
Hospitals
Nursing & Residential Care Facilities
Ambulatory Care Facilities
Food Services & Drinking Places
Management of Companies & Enter.
Accommodation
Change
+ 1,500
+ 1,500
+ 900
+ 800
+ 700
+ 500
+ 400
+ 200
Wage
$1,100
$470
$970
$540
$880
$280
$1,690
$430
Overall employment -11,800Overall weekly wage $850

Industries that Lost Jobs Monroe County
3Q 2007 to 3Q 2010
Chemical Manufacturing
Machinery Manufacturing
Professional, Scientific & Tech. Svc.
Transportation Equipment Mfg.
Miscellaneous Manufacturing
Plastics & Rubber Products Mfg. Fabricated Metal Products Mfg.
Specialty Trade Contractors
Change
-3,900
-2,200
-1,900
-1,800
- 800
- 700
- 700
- 600
Wage
$1,600
$1,440
$1,130
$1,150
$1,195
$870
$930
$920
Related Documents