Journal of Accounting and Economics 25 (1998) 101 — 127 Underwriting relationships, analysts’ earnings forecasts and investment recommendations Hsiou-wei Lin!, Maureen F. McNichols",* ! Department of International Business, National Taiwan University, Taipei, Taiwan " Graduate School of Business, Stanford University, Stanford, CA 94305, USA Received 1 April 1997; received in revised form 1 July 1998 Abstract We examine the effect of underwriting relationships on analysts’ earnings forecasts and recommendations. Lead and co-underwriter analysts’ growth forecasts and recommen- dations are significantly more favorable than those made by unaffiliated analysts, although their earnings forecasts are not generally greater. Investors respond similarly to lead underwriter and unaffiliated ‘Strong buy’ and ‘Buy’ recommendations, but three-day returns to lead underwriter ‘Hold’ recommendations are significantly more negative than those to unaffiliated ‘Hold’ recommendations. The findings suggest investors expect lead analysts are more likely to recommend ‘Hold’ when ‘Sell’ is warranted. The post- announcement returns following affiliated and unaffiliated analysts’ recommendations are not significantly different. ( 1998 Elsevier Science B.V. All rights reserved. JEL classification: M4; G14; G24 Keywords: Capital markets; Analyst forecasts; Incentives; Information; Market efficiency 1. Introduction This paper examines whether research reports issued by analysts whose employer is affiliated with a company through an underwriting relationship are more favorable than research reports issued by unaffiliated analysts. This inquiry is motivated by concern expressed in the financial press that * Corresponding author. Tel.: (650) 723-0833; fax: (650) 725-6152; e-mail: fmcnich@leland.stan- ford.edu 0165-4101/98/$ — see front matter ( 1998 Elsevier Science B.V. All rights reserved PII: S 0 1 6 5 - 4 1 0 1 ( 9 8 ) 0 0 0 1 6 - 0

Welcome message from author
This document is posted to help you gain knowledge. Please leave a comment to let me know what you think about it! Share it to your friends and learn new things together.
Transcript
Journal of Accounting and Economics 25 (1998) 101—127
Underwriting relationships, analysts’ earnings forecastsand investment recommendations
Hsiou-wei Lin!, Maureen F. McNichols",*! Department of International Business, National Taiwan University, Taipei, Taiwan
" Graduate School of Business, Stanford University, Stanford, CA 94305, USA
Received 1 April 1997; received in revised form 1 July 1998
Abstract
We examine the effect of underwriting relationships on analysts’ earnings forecasts andrecommendations. Lead and co-underwriter analysts’ growth forecasts and recommen-dations are significantly more favorable than those made by unaffiliated analysts,although their earnings forecasts are not generally greater. Investors respond similarly tolead underwriter and unaffiliated ‘Strong buy’ and ‘Buy’ recommendations, but three-dayreturns to lead underwriter ‘Hold’ recommendations are significantly more negative thanthose to unaffiliated ‘Hold’ recommendations. The findings suggest investors expect leadanalysts are more likely to recommend ‘Hold’ when ‘Sell’ is warranted. The post-announcement returns following affiliated and unaffiliated analysts’ recommendationsare not significantly different. ( 1998 Elsevier Science B.V. All rights reserved.
JEL classification: M4; G14; G24
Keywords: Capital markets; Analyst forecasts; Incentives; Information; Market efficiency
1. Introduction
This paper examines whether research reports issued by analysts whoseemployer is affiliated with a company through an underwriting relationshipare more favorable than research reports issued by unaffiliated analysts.This inquiry is motivated by concern expressed in the financial press that
*Corresponding author. Tel.: (650) 723-0833; fax: (650) 725-6152; e-mail: [email protected]
0165-4101/98/$ — see front matter ( 1998 Elsevier Science B.V. All rights reservedPII: S 0 1 6 5 - 4 1 0 1 ( 9 8 ) 0 0 0 1 6 - 0
underwriting relationships create a conflict of interest for analysts1:
Morgan Stanley’s powerful investment bankers often have run roughshodover the firm’s research analysts, some current and former Morgan Stanleyanalysts say. These analysts say Morgan Stanley’s bankers have repeatedlypressured them to alter negative research reports on the stocks of the firm’scorporate clients — particularly those for which it did stock underwritingdeals. (Siconolfi, 1992)
Because the underwriting business requires substantial investment in developingand managing relationships with issuing companies, it is argued that investmentbankers do not welcome a negative investment report by a member of theresearch staff, and may actively discourage them.
It is also argued that an investment bank’s willingness to underwrite a firm’ssecurities requires that it have a favorable view about the client’s prospects, asone analyst argued:
It goes without saying that if you do a company’s IPO, you are going to havea buy [on the stock], because frankly if you don’t you shouldn’t be doing thedeal. . .. for every deal Salomon has done in the last 12 months, I havepersonally turned down two deals. (Raghavan, 1997).
If issuers select underwriters on the basis of the favorableness of the termsunderwriters offer and these terms are related to their analysts’ views, then thechosen underwriters’ analysts are more likely to have favorable views of issuingcompanies’ prospects.
Both arguments suggest that affiliated analysts’ research reports are morefavorable than those issued by unaffiliated analysts. To test this, we examine keyelements of research reports, specifically, current and subsequent year earningsforecasts, long term earnings growth forecasts and investment recommenda-tions. We consider two groups of affiliated analysts, analysts employed by thelead bank underwriting seasoned equity offerings (lead underwriter analysts),and analysts employed by the co-underwriter bank (co-underwriter analysts). Wecompare their forecasts and recommendations to those made by analysts atinvestment banks that have not served as a lead or co-underwriter for the firm(unaffiliated analysts). We find that current and subsequent year earnings fore-casts issued by affiliated analysts both before and after seasoned equity offeringsare generally not more favorable than those issued by unaffiliated analysts. In
1Additional examples include Browning (1995), Dorfman (1991), Dorfman and McGough (1993),Dorfman (1995), Konrad (1989), Raghavan (1997), Schism and Steinmetz (1994), Schultz (1990) andSiconolfi (1992, 1995).
102 H.-w. Lin, M.F. McNichols / Journal of Accounting and Economics 25 (1998) 101—127
contrast to these findings, we find that lead and co-underwriter analysts’ growthforecasts and recommendations are significantly more favorable than thoseissued by unaffiliated analysts.
This paper also examines whether investors perceive differences in the qualityof affiliated versus unaffiliated recommendations, and whether returns followingthe recommendations are different. Given affiliated analysts’ more favorableinvestment recommendations, the return analysis ascertains whether investorsrespond differently to their announcement, and whether affiliated recommenda-tions, if followed literally, generate poorer investment performance. We examinethe returns to lead underwriter and unaffiliated investment recommendationsfor the 3-day period surrounding their announcement, and for longer windowsin the first and second years following seasoned equity offerings. For theannouncement period, we find no difference in returns to lead and unaffiliatedanalysts’ ‘Strong buy’ and ‘Buy’ recommendations, but find the returns to lead‘Hold’ recommendations are significantly more negative than unaffiliated ‘Hold’recommendations. Looking at the post-announcement period, we find no differ-ence in the returns to following affiliated versus unaffiliated analysts’ recommen-dations.
The return analysis therefore suggests that analysts are overoptimistic, onaverage, when issuing a ‘Hold’ recommendation, and that lead analysts areoveroptimistic to a greater degree than are unaffiliated analysts. If issuingcompanies select the underwriter whose analyst has the most favorable view,one would expect greater announcement returns for all unaffiliated recommen-dations. The finding of less negative announcement returns only for unaffiliatedversus affiliated ‘Hold’ recommendations suggests that affiliated analysts stra-tegically avoid ‘Sell’ recommendations to a greater extent than unaffiliatedanalysts to maintain client relations. However, the findings indicate that leadanalysts’ ‘Strong Buy’ and ‘Buy’ recommendations are not overoptimistic rela-tive to those issued by unaffiliated analysts.
The study’s findings contribute to two streams of literature. The first streamexamines analysts’ forecasts and forecast errors around initial and seasonedpublic equity offerings. Hansen and Sarin (1996) calculate adjusted forecasterrors, where the earnings performance of the firm is a control variable, and findthat the adjusted forecast errors are not significantly different from those byanalysts at other times. They also examine the forecasts of lead and otheranalysts and do not find a difference. Hansen and Sarin conclude that analystsare disciplined by reputational forces and consequently forecast credibly aroundequity offerings. Our finding for earnings forecasts of affiliated versus unaf-filiated analysts is consistent with theirs. Our finding of significant differences ingrowth forecasts and investment recommendations, however, suggests thatstudies focusing solely on near-term earnings forecasts cannot resolve thequestion of whether concern for reputation is sufficient to offset pressuresfrom investment banking relationships. The present paper contributes to the
H.-w. Lin, M.F. McNichols / Journal of Accounting and Economics 25 (1998) 101—127 103
literature by analyzing earnings forecasts, growth forecasts and recommenda-tions for a comprehensive sample of affiliated and unaffiliated analysts, anddocumenting significant differences in growth forecasts and recommendations.
Ali (1996) finds that analysts’ forecasts of earnings for the year of the offeringare not overoptimistic, but that earnings forecasts issued in the five yearsfollowing offerings are significantly overoptimistic. Dechow et al. (1998) docu-ment that their sample of lead underwriter analysts’ earnings growth forecastsaround seasoned equity offerings are significantly more favorable than those ofunaffiliated analysts. Their findings, and those of Ali (1996), suggest the differ-ence between our results for earnings forecasts and recommendations mayreflect differences in analysts’ expectations of long-term earnings growth. Ourevidence from analysts’ long-term earnings growth forecasts is consistent withthis conjecture, as we find that lead analysts’ growth forecasts are significantlygreater than those of unaffiliated analysts. The mean difference in growthforecasts is small however, at 0.56%, leaving open the question of whethergreater long-term growth expectations are sufficient to explain affiliated ana-lysts’ more favorable recommendations.
This study also contributes to the literature on analyst affiliation and invest-ment recommendations. Similar to our study, Dugar and Nathan (1995) findthat recommendations by investment banker analysts are more favorable thanthose by unaffiliated analysts. In contrast to our study, they find no evidence ofstock price response to recommendations by affiliated or unaffiliated analysts.Our findings indicate that affiliated and unaffiliated analysts’ recommendationsare associated with significant return response, and suggest that their ability todetect a difference in returns in the announcement and post-announcementperiods may have been limited by their smaller sample size.
Recent studies by Lin and McNichols (1998) and Michaely and Womack(1996) find that affiliated analysts’ recommendations at the time of initial publicofferings are significantly more favorable than those of unaffiliated analysts. Ourfindings suggest that similar influences also affect analysts’ recommendations atthe time of seasoned equity offerings. Michaely and Womack document thatthree-day size-adjusted returns centered on the announcement of analysts’‘Strong buy’ and ‘Buy’ announcements are significantly more positive for unaf-filiated than affiliated analysts. We find that three-day size-adjusted returnscentered on the announcement of lead and unaffiliated analysts’ ‘Strong buy’and ‘Buy’ recommendations are not significantly different. However, the three-day returns associated with affiliated ‘Hold’ recommendations are significantlymore negative than those associated with unaffiliated ‘Hold’ recommendations,indicating that investors correct for greater bias in affiliated analysts’ ‘Hold’recommendations.
Michaely and Womack also find that IPOs recommended by affiliated ana-lysts substantially under-perform IPOs recommended by unaffiliated analystsover the two-year period following analysts’ recommendations. Dunbar et al.
104 H.-w. Lin, M.F. McNichols / Journal of Accounting and Economics 25 (1998) 101—127
(1997) document that when returns for ‘Buy’ recommendations are measured upto the date of a subsequent downgrade, but not beyond, only initial recommen-dations of analysts appear over-optimistic. We extend the methodologies inthese two studies by measuring returns to analysts’ recommendations only forthe period the recommendation is ‘live’. Specifically, we measure returns fromthe recommendation announcement to the analyst’s subsequent recommenda-tion, and do not include returns past the date an analyst has dropped coverageof the company or is no longer employed at the brokerage firm.
We find no difference between the post-announcement returns to lead under-writer and unaffiliated analysts’ recommendations issued in the two years afterseasoned equity offerings. Our evidence therefore indicates that although affili-ated analysts’ recommendations are more favorable, their ‘Strong buy’ and ‘Buy’recommendations are not more overoptimistic than those issued by unaffiliatedanalysts. If affiliated analysts intentionally bias their recommendations or ifissuing companies select banks as underwriters when their analyst’s view is morefavorable than other analysts, then affiliated recommendations should containgreater error. In such a case, one would expect a strategy of following affiliatedrecommendations literally to lead to weaker investment performance. Ourevidence indicates that if intentional or selection bias cause affiliated recommen-dations to contain greater error, offsetting forces, such as affiliated analysts’potentially greater access to information, reduce such error.
The paper proceeds as follows. Section 2 briefly describes the brokerage firmbusiness and discusses potential influences on analysts’ coverage and reportingdecisions. Section 3 presents our hypotheses. Section 4 describes the data andsample selection. Section 5 describes the research design and test results, andSection 6 concludes the paper.
2. Institutional background
2.1. Investment banks and underwriting deals
The investment banking or corporate finance department of an investmentbank helps a corporation issue securities to the public by acting as its under-writer in return for a commission comprised of an underwriting fee, a manage-ment fee and a selling concession. These fees are significant to both participatinginvestment bankers and the investment bank (Smith, 1991; Raghavan, 1996).Annual bonuses are typically a substantial portion of investment bankers’ totalcompensation, and depend on their contributions to deals done over the year(Eccles and Crane, 1988).
When a company decides to issue securities, it first selects one or moreinvestment bankers to manage the underwriting group or syndicate. Factors inthis choice include the reputation of the investment banker for conducting
H.-w. Lin, M.F. McNichols / Journal of Accounting and Economics 25 (1998) 101—127 105
offerings successfully, the investment banker’s understanding of the issuer’sindustry, the terms of the proposed offering, potential conflicts of interestrelating to the investment banker’s affiliation with the issuer’s competitors, andthe ability of the firm to provide research support after the offering. In additionto these factors, analysts’ forecasts and recommendations issued prior to under-writer selection may influence firms’ choice of underwriter directly, or becorrelated with factors in this choice.
Once the underwriters are selected, a working group is formed, including theissuer, the issuer’s counsel, the underwriters, the underwriters’ counsel and theissuer’s independent accountants. This group holds an organizational meetingto determine such matters as the structure of the offering, the time schedule forthe offering, over-allotment options, and the amount of capital to be offered. Theissuer, with the assistance of the working group, prepares a preliminary prospec-tus and files a registration statement. Over the next few weeks to months, theSEC reviews the registration statement (Weiss, 1993). Once approved, theregistration statement is effective and the offering may be sold to the public.
The concern that analysts affiliated with underwriters might issue overlyfavorable forecasts and recommendations prior to an offering is a motivation forSEC rule 10b-6. It is aimed at curbing artificial stimulation of the market duringdistributions of securities (Sonsini, 1988). The ‘quiet period’ begins when theissuer reaches an understanding with an investment bank that it will underwritean offering and typically ends 25 days following the offering. During this period,the investment bank’s analysts are precluded from issuing an earnings forecastor recommendation on the client’s stock, except when published as part ofa firm’s continuing research program covering industry or sub-industry groups.Furthermore, a recommendation issued by an affiliated analyst in such a publi-cation cannot be more favorable than the analyst’s previous recommendation(Jennings and Marsh, 1987, pp. 78—80).
2.2. Forces influencing analysts+ coverage and reporting decisions
Whether underwriting relationships cause financial analysts to issue overlyoptimistic forecasts and recommendations depends on several forces. To theextent that an analyst is concerned about his reputation, and his reputationdepends, at least in part, on the accuracy of his forecasts and recommendations,reputational considerations would increase analysts’ incentives to report truth-fully.
Other forces have also been hypothesized to influence analysts’ forecasts andrecommendations. For example, it has been argued that analysts have greaterincentives to issue ‘Buy’ recommendations than ‘Sell’ recommendations becausethe former generate greater trading volume. Francis and Philbrick (1993) sug-gest that analysts may deviate from truthful reporting to maintain good rela-tions with management of covered firms, because management is an important
106 H.-w. Lin, M.F. McNichols / Journal of Accounting and Economics 25 (1998) 101—127
source of information to analysts. McNichols and O’Brien (1997) hypothesizeand document that analysts avoid reporting negative information by cover-ing stocks for which their views are favorable. Because we expect theseforces to affect affiliated and unaffiliated analysts similarly, we use unaffiliatedanalysts as a control group. Differences between the forecasts and recommen-dations of affiliated and unaffiliated analysts’ should therefore reflectdifferences due to investment banking relationships incremental to these otherforces.
3. Hypotheses
The hypotheses we test focus on three related questions. First, we examinewhether lead and co-underwriter analysts issue more favorable forecasts andrecommendations than unaffiliated analysts in the period shortly before a cli-ent’s equity offering. Second, we examine how investors respond to affiliatedversus unaffiliated analysts’ recommendations. This test provides evidence onwhether the market perceives differences in the credibility of affiliated vs.unaffiliated analysts. Third, we examine the longer term investment returnsassociated with the recommendations of affiliated vs. unaffiliated analysts, toprovide evidence on whether affiliated analysts’ recommendations generateweaker investment performance.
3.1. Affiliated and unaffiliated analysts+ earnings forecasts and recommendations
There are two scenarios in which affiliated analysts’ research reports aremore favorable than those by unaffiliated analysts. First, analysts’ expectationsof the firm’s future prospects are likely to be a factor (or to be correlatedwith a factor) in an issuer’s choice of underwriter. We expect that morefavorable expectations by an investment bank’s research analyst affect under-writer expectations, resulting in more favorable deal terms. Also, issuers mayprefer not to do business with an investment bank whose analyst has issued anunfavorable report. We refer to this as the non-strategic bias scenario: analysts’forecasts and recommendations are a factor (or are correlated with a factor) inthe issuing companies’ underwriter selection, but analysts report their informa-tion non-strategically. Non-strategic reporting is expected if the benefits ofbiased reports are less than their costs. In this scenario, more favorable forecastsand recommendations are observed for lead-underwriter analysts than unaf-filiated analysts because of the choices made by issuing companies rather thananalysts.
In the strategic bias scenario, we assume that analysts’ forecasts and recom-mendations are a factor in an issuing company’s choice of underwriter, and thatanalysts issue more favorable forecasts and recommendations to increase their
H.-w. Lin, M.F. McNichols / Journal of Accounting and Economics 25 (1998) 101—127 107
investment bank’s chances of being selected as underwriter. We expect that,during the period of time after a company has decided to issue an equity offeringbut before it has chosen an underwriter, lead and co-underwriter analystsperceive a higher probability that their firm will be chosen as underwriter thananalysts at other investment banks.2 We therefore expect the benefits of issuinga more favorable report to be greater for such analysts than for unaffiliatedanalysts. By contrast, analysts at investment banks that do not expect to obtaina company’s underwriting business have less incentive to bias their reportsbecause the likelihood is low that the analyst will be rewarded for contributing(or punished for not contributing) to an equity deal.3
In each of these scenarios, lead and co-underwriter analysts (affiliated ana-lysts) issue more favorable research reports than unaffiliated analysts. Our firsthypothesis is as follows, stated in alternative form:
Hypothesis 1: Affiliated analysts’ research reports are more favorable thanthose by unaffiliated analysts.
3.2. Investor interpretation of affiliated and unaffiliated analysts+ recommendations
Given the potential for conflict of interest on the part of analysts, andselection bias induced by issuers’ choices, the informativeness of affiliatedanalysts’ recommendations is an open question. Affiliated recommendationsmay be perceived as more informative given affiliated analysts’ potentiallygreater access to proprietary information about the firm. Alternatively, if affili-ated analysts overstate the favorableness of their views or their banks areselected as underwriters when analysts’ views are more favorable than those ofother analysts, then favorable (unfavorable) affiliated recommendations may be
2For a sample of 7,295 equity offerings and initial public offerings, untabulated analysis indicatesthat the lead underwriter (co-underwriter) continues as lead (co-underwriter) in 64.6% (61.0%) of allsubsequent offerings. The lead (co-underwriter) continues as co-underwriter (lead) for 13.8% (8.2%)of subsequent offerings, so the total frequency of participation as lead or co-underwriter is 78.4% forlead underwriters and 69.2% for co-underwriters. Thus, once an underwriting relationship iscreated, there is a reasonable expectation of continuation.
3 It is also possible that affiliated analysts might choose not to report when their expectations areless favorable than those of unaffiliated analysts, leading to the finding that their reports are onaverage more favorable. However, issuing companies likely expect that their investment bank‘sresearch analysts will provide coverage when they issue securities. To test for the validity of thisscenario, we compared unaffiliated analysts’ recommendations for companies not followed byaffiliated analysts with those for companies followed by affiliated analysts, to assess whetheraffiliated analysts were more likely to cover better performing issuing firms, and found the ratings tobe insignificantly different.
108 H.-w. Lin, M.F. McNichols / Journal of Accounting and Economics 25 (1998) 101—127
perceived by investors as less (more) informative. These arguments motivate thefollowing hypothesis, stated in alternative form:
Hypothesis 2: The announcement returns associated with affiliated ‘Buy’(‘Hold’ and ‘Sell’) recommendations are less positive (more nega-tive) than those associated with comparable unaffiliated recom-mendations.
Because we expect that unaffiliated analysts’ recommendations are informative,observing less positive response to affiliated ‘Buy’ recommendations wouldsuggest that investors do not find these recommendations as informative asthose issued by unaffiliated analysts. Finding a more negative response toaffiliated ‘Hold’ or ‘Sell’ recommendations would indicate that investors findthese recommendations a more negative signal about firm value.
3.3. Longer term returns associated with affiliated and unaffiliated analysts+recommendations
Both the allegations that affiliated recommendations are overoptimistic andthe empirical findings, to be presented shortly, that affiliated recommendationsare more favorable than unaffiliated recommendations raise the possibility thatinvestors who follow affiliated recommendations experience poorer investmentperformance. If analysts’ recommendations have predictive ability, as suggestedby the findings of Womack (1996), then ‘Buy’ (‘Hold’ and ‘Sell’) recommenda-tions that are biased upward, either because of intentional misrepresentation byanalysts or selection by issuing companies, should be associated with lesspositive (more negative) future returns. These arguments motivate the followingalternate hypothesis:
Hypothesis 3: The post-announcement returns associated with affiliated ‘Buy’(‘Hold’ and ‘Sell’) recommendations are less positive (more nega-tive) than those associated with comparable unaffiliated recom-mendations.
Finding lower returns to following affiliated than unaffiliated recommendationssuggests affiliated recommendations contain an optimistic bias. However, to theextent investors adjust for such bias, they need not earn lower returns.
4. Data
The tests of our hypotheses require data on securities offerings, analysts’earnings forecasts and recommendations, analysts’ long-term earnings growth
H.-w. Lin, M.F. McNichols / Journal of Accounting and Economics 25 (1998) 101—127 109
forecasts, annual earnings per share (EPS), stock splits, and security prices. Wecollected information about public offerings in US markets by domestic issuersfrom the Securities Data Company, Inc. (SDC) Public Offering database. Dataon investment bank analysts’ earnings per share forecasts and recommendationswere provided by Research Holdings, Limited. Analysts’ long term earningsgrowth forecasts were collected from I/B/E/S. Annual EPS measures werecollected from the 1995 COMPUSTAT Annual Industrial database. Finally, data onsplit factors, split dates and security returns are provided by the 1996 Universityof Chicago Center for Research in Security Prices (CRSP) database.
Our samples of lead and co-underwriter-analyst earnings forecasts, growthforecasts and recommendations for each issuing company are matched to thoseissued by unaffiliated analysts, i.e., analysts at investment banks that did notserve as lead or co-underwriter of the issuing company’s equity securities duringthe 1985—94 period. The forecasts and recommendations for our tests of Hy-pothesis 1 must meet the following criteria:
1. forecasts or recommendations are made for companies that issued commonstock during 1989—94, and
2. forecasts or recommendations of lead or co-underwriter analysts are avail-able in the year prior to the public offering, and
3. a matching forecast or recommendation issued by an unaffiliated analystwithin sixty days of the affiliated forecast or recommendation is available.4
These criteria ensure availability of forecast or recommendation data for issuingcompanies by both an affiliated and unaffiliated analyst in the year prior to thepublic offering.
When there was more than one affiliated forecast or recommendation for anunderwriter-offering observation, the forecast or recommendation made on theday closest to the offering date was included in the sample. Similarly, when therewas more than one unaffiliated forecast or recommendation within sixty days ofthe respective affiliated forecast, the unaffiliated forecast issued most closely tothe date of the affiliated forecast was chosen.
To calculate deflators for forecasts, we require that data on price and stocksplits of the issuing companies are available on the CRSP tape. To be included inthe stock-price tests, daily returns and size deciles must be available from theCRSP file.
Table 1 documents that there were 2,400 seasoned equity offerings in USmarkets by domestic issuers during the 1989—1994 period. For the companies
4Growth forecasts are issued less frequently than earnings forecasts or recommendations. For thisreason, we require a matching unaffiliated growth forecast within 365 days of the affiliated growthforecast for our primary analysis. Similar results are obtained for a smaller sample when we requirethe matching growth forecasts be issued within 100 days of the affiliated forecast.
110 H.-w. Lin, M.F. McNichols / Journal of Accounting and Economics 25 (1998) 101—127
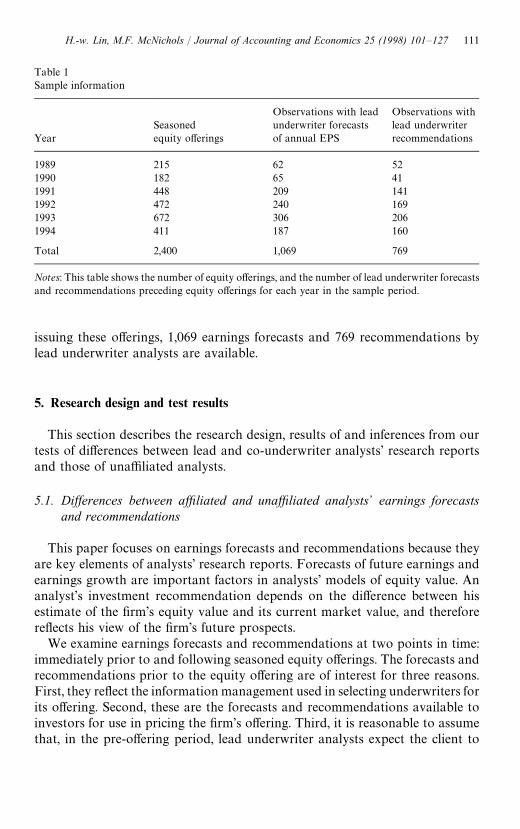
Table 1Sample information
YearSeasonedequity offerings
Observations with leadunderwriter forecastsof annual EPS
Observations withlead underwriterrecommendations
1989 215 62 521990 182 65 411991 448 209 1411992 472 240 1691993 672 306 2061994 411 187 160
Total 2,400 1,069 769
Notes: This table shows the number of equity offerings, and the number of lead underwriter forecastsand recommendations preceding equity offerings for each year in the sample period.
issuing these offerings, 1,069 earnings forecasts and 769 recommendations bylead underwriter analysts are available.
5. Research design and test results
This section describes the research design, results of and inferences from ourtests of differences between lead and co-underwriter analysts’ research reportsand those of unaffiliated analysts.
5.1. Differences between affiliated and unaffiliated analysts+ earnings forecastsand recommendations
This paper focuses on earnings forecasts and recommendations because theyare key elements of analysts’ research reports. Forecasts of future earnings andearnings growth are important factors in analysts’ models of equity value. Ananalyst’s investment recommendation depends on the difference between hisestimate of the firm’s equity value and its current market value, and thereforereflects his view of the firm’s future prospects.
We examine earnings forecasts and recommendations at two points in time:immediately prior to and following seasoned equity offerings. The forecasts andrecommendations prior to the equity offering are of interest for three reasons.First, they reflect the information management used in selecting underwriters forits offering. Second, these are the forecasts and recommendations available toinvestors for use in pricing the firm’s offering. Third, it is reasonable to assumethat, in the pre-offering period, lead underwriter analysts expect the client to
H.-w. Lin, M.F. McNichols / Journal of Accounting and Economics 25 (1998) 101—127 111
issue equity and expect their firm to bid for the underwriting business. Thus, thisis a time period in which analysts’ incentives to curry favor with a prospectiveunderwriting client should be most pronounced. Therefore, under the strategicbias scenario, we expect more favorable affiliated forecasts and recommenda-tions in this time period. However, under the non-strategic bias scenario, we alsoexpect more favorable affiliated forecasts and recommendations in this timeperiod, if issuing companies choose underwriters on the basis of their views oftheir future prospects, and these views are correlated with their analysts’ fore-casts and recommendations.
Although we expect that affiliated analysts are likely to anticipate forthcomingofferings, and that their last pre-offering forecasts and recommendations reflect this,analysts’ uncertainty about their affiliation in the pre-offering period can reduce thepower of our tests. To assess the robustness of our findings to this potentialuncertainty, we examine analysts’ earnings forecasts and recommendations in thepost-offering period, at which time analysts know their affiliation with certainty.
Our tests compare the forecasts and recommendations of three groups ofanalysts: lead underwriter analysts, co-underwriter analysts and unaffiliatedanalysts. Because of the role of relationships between investment banks andissuing companies, we expect lead and co-underwriter banks have a higher exante probability of selection than unaffiliated banks (Eccles and Crane, 1988). Inthe strategic bias scenario, lead and co-underwriter analysts would therefore beexpected to issue more favorable forecasts and recommendations than unaf-filiated analysts. Alternatively, in the selection bias scenario, issuing companies’choice of lead and co-underwriter banks is affected by their analysts’ expecta-tions relative to other banks’ analysts.
To test whether affiliated analysts’ forecasts are greater than those of unaf-filiated analysts, we match the affiliated analyst’s forecast made most immediate-ly prior to the public offering date with the forecast issued by an unaffiliatedanalyst on the date closest to the affiliated analyst’s forecast date.5 Our researchdesign therefore controls for differences in the characteristics of firms thataffiliated versus unaffiliated analysts choose to cover. We test whether the meanand median differences between pairs of affiliated and unaffiliated analysts’forecasts are positive for current year earnings per share, EPS, subsequent yearEPS, and the five-year earnings growth rate, GRO¼¹H. We define F½1 andF½2 as an analyst’s forecast of current and subsequent year EPS, respectively,deflated by the firm’s share price on the day prior to the earlier of the twoforecast dates for each matched pair.
Table 2 presents the results of our test of Hypothesis 1 using F½1,price-deflated forecasts of the current year’s annual EPS, for all matched pairs.
5We also require that unaffiliated forecasts and recommendations (growth forecasts) be issuedwithin 60 (365) days of the respective affiliated analyst’s, and prior to the offering.
112 H.-w. Lin, M.F. McNichols / Journal of Accounting and Economics 25 (1998) 101—127
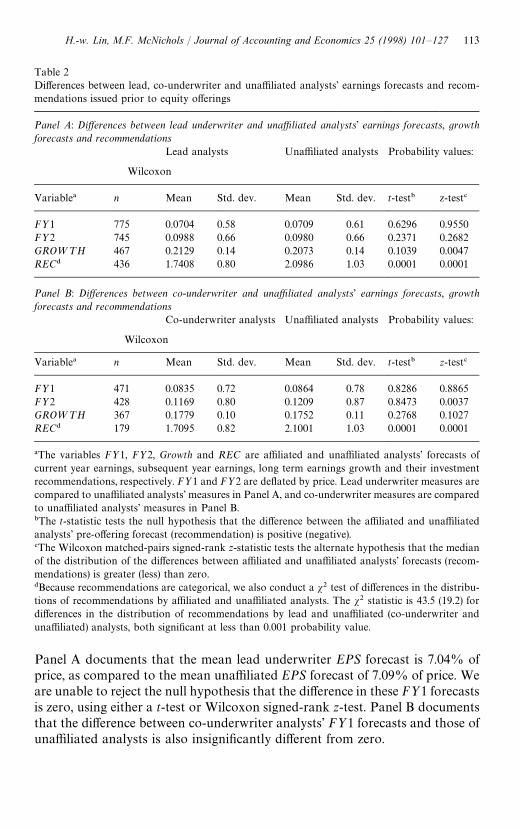
Table 2Differences between lead, co-underwriter and unaffiliated analysts’ earnings forecasts and recom-mendations issued prior to equity offerings
Panel A: Differences between lead underwriter and unaffiliated analysts’ earnings forecasts, growthforecasts and recommendations
Lead analysts Unaffiliated analysts Probability values:
Wilcoxon
Variable! n Mean Std. dev. Mean Std. dev. t-test" z-test#
F½1 775 0.0704 0.58 0.0709 0.61 0.6296 0.9550F½2 745 0.0988 0.66 0.0980 0.66 0.2371 0.2682GRO¼¹H 467 0.2129 0.14 0.2073 0.14 0.1039 0.0047REC$ 436 1.7408 0.80 2.0986 1.03 0.0001 0.0001
Panel B: Differences between co-underwriter and unaffiliated analysts’ earnings forecasts, growthforecasts and recommendations
Co-underwriter analysts Unaffiliated analysts Probability values:
Wilcoxon
Variable! n Mean Std. dev. Mean Std. dev. t-test" z-test#
F½1 471 0.0835 0.72 0.0864 0.78 0.8286 0.8865F½2 428 0.1169 0.80 0.1209 0.87 0.8473 0.0037GRO¼¹H 367 0.1779 0.10 0.1752 0.11 0.2768 0.1027REC$ 179 1.7095 0.82 2.1001 1.03 0.0001 0.0001
!The variables F½1, F½2, Growth and REC are affiliated and unaffiliated analysts’ forecasts ofcurrent year earnings, subsequent year earnings, long term earnings growth and their investmentrecommendations, respectively. F½1 and F½2 are deflated by price. Lead underwriter measures arecompared to unaffiliated analysts’ measures in Panel A, and co-underwriter measures are comparedto unaffiliated analysts’ measures in Panel B."The t-statistic tests the null hypothesis that the difference between the affiliated and unaffiliatedanalysts’ pre-offering forecast (recommendation) is positive (negative).#The Wilcoxon matched-pairs signed-rank z-statistic tests the alternate hypothesis that the medianof the distribution of the differences between affiliated and unaffiliated analysts’ forecasts (recom-mendations) is greater (less) than zero.$Because recommendations are categorical, we also conduct a s2 test of differences in the distribu-tions of recommendations by affiliated and unaffiliated analysts. The s2 statistic is 43.5 (19.2) fordifferences in the distribution of recommendations by lead and unaffiliated (co-underwriter andunaffiliated) analysts, both significant at less than 0.001 probability value.
Panel A documents that the mean lead underwriter EPS forecast is 7.04% ofprice, as compared to the mean unaffiliated EPS forecast of 7.09% of price. Weare unable to reject the null hypothesis that the difference in these F½1 forecastsis zero, using either a t-test or Wilcoxon signed-rank z-test. Panel B documentsthat the difference between co-underwriter analysts’ F½1 forecasts and those ofunaffiliated analysts is also insignificantly different from zero.
H.-w. Lin, M.F. McNichols / Journal of Accounting and Economics 25 (1998) 101—127 113

As Table 2 shows, the results for subsequent year earnings forecasts, F½2, aregenerally similar to those for current year earnings forecasts. Although they arenot independent tests, they reinforce the patterns documented for F½1. PanelA documents that the mean lead underwriter F½2 forecast is 9.88% of price, ascompared to the mean unaffiliated F½2 forecast of 9.80% of price. The meansand medians of these F½2 forecasts are insignificantly different, as are the meansof co-underwriter analysts’ and unaffiliated analysts’ F½2 forecasts. The mediandifference between co-underwriter and unaffiliated analysts’ F½2 forecasts,however, is significantly positive, suggesting a general tendency for co-under-writer analysts’ earnings forecasts to exceed those of unaffiliated analysts bya small amount.6
Table 2 also documents that the mean growth forecast, GRO¼¹H, issuedby lead-underwriter analysts is 21.29%, as compared to the mean growthforecast of 20.73% issued by unaffiliated analysts. The statistical testsindicate that the mean difference is marginally significant, with a one-tailedprobability value of 0.10, and the median difference is significantly positive, witha one-tailed p-value of 0.0047. Panel B documents a mean difference of 0.27percent between earnings growth forecasts of co-underwriter and unaffiliatedanalysts, and slightly weaker statistical results. The mean difference is positivewith a probability value 0.28, and the median is positive with a probabilityvalue 0.10.
The difference between affiliated and unaffiliated analysts’ growth forecasts issmaller than the 4% difference documented by Dechow et al. (1998). Ourconjecture is that this difference arises because design does not match by firm. Itis possible that the greater differences they observe reflect the fact that affiliatedanalysts are more likely than unaffiliated analysts to cover smaller firms, whosegrowth rates likely are higher.
Our final analysis related to Hypothesis 1 examines analysts’ recommenda-tions, REC. The recommendations data are coded numerically by ResearchHoldings, Ltd., with values from 1 to 5, where ‘Strong buy’ is coded 1, ‘Buy’ iscoded 2, ‘Hold’ is coded 3, ‘Sell’ is coded 4 and ‘Strong sell’ is coded 5. Wehypothesize that the distributions of lead and co-underwriter analysts’ re-commendations will be shifted toward more favorable (lower-numbered) recom-mendations, relative to the respective comparison distributions of unaffiliatedrecommendations. We present parametric and nonparametric statistics forcomparability with our tests of differences in the mean and median values of
6The difference in these findings does not appear to be due to influential observations as similarparametric results are observed when observations above (below) the 99th (1st) percentile areexcluded. The nonparametric findings are also corroborated by sign test results that indicate 214 outof 373 non-zero differences are positive, with a probability value of 0.0025.
114 H.-w. Lin, M.F. McNichols / Journal of Accounting and Economics 25 (1998) 101—127
F½1, F½2 and GRO¼¹H. However, because the recommendation data arecategorical, we also report s2 tests of differences in the distributions of therecommendation categories.
Table 2 presents strong evidence that affiliated recommendations are morefavorable than unaffiliated recommendations. Panel A documents that thedifference between lead underwriter and unaffiliated recommendations is signifi-cantly negative, with both the t-statistic and z-statistic significant at less than0.0001. The difference between lead and unaffiliated recommendations is signifi-cantly negative, as indicated by the associated t-statistic of !6.11. The s2 (4)statistic for a test of differences in the distributions of affiliated and unaffiliatedanalysts’ recommendations is 43.5, which is significant at a probability value lessthan 0.0001. Untabulated statistics indicate that 47.0% of lead underwriterrecommendations are ‘Strong buy’, 32.8% are ‘Buy’, 19.5% are ‘Hold’, 0.5% are‘Sell’ and 0.2% are ‘Strong sell’. In contrast, 37.4% of lead underwriter recom-mendations are ‘Strong buy’, 23.9% are ‘Buy’, 33.0% are ‘Hold’, 3.0% are ‘Sell’and 2.8% are ‘Strong sell’. Therefore, the s2 test results reflect a more favorabledistribution of recommendations by lead than unaffiliated analysts. PanelB documents similar findings for the recommendations of co-underwriter ana-lysts relative to unaffiliated analysts.
To summarize, Table 2 documents three key findings. First, there is a strikingdifference in the favorableness of affiliated versus unaffiliated analysts’ recom-mendations. Second, the findings for co-underwriter analysts are generallysimilar to those for lead underwriter analysts, in that their recommendationsand their growth forecasts to a lesser degree are more favorable than those ofunaffiliated analysts. This finding suggests that the forces that influence leadunderwriter analysts’ forecasts and recommendations influence those of co-underwriter analysts similarly. Third, affiliated and unaffiliated analysts differmost for the variables that are longer term and more difficult to compare toactual outcomes, investment recommendations and 5-year growth forecasts.
To determine whether our findings are due to analysts’ uncertainty as to theirstatus as underwriter in the pre-offering period, we repeat the tests in Table 2using F½1, F½2, GRO¼¹H and REC based on the first post-offering an-nouncement of the respective forecasts or recommendations. The untabulatedfindings are consistent with those in Table 2. Specifically, the F½1 and F½2forecasts of lead and co-underwriter analysts are not significantly different fromthose of unaffiliated analysts, but the growth forecasts and recommendations oflead and of co-underwriter analysts are significantly more favorable than thoseof unaffiliated analysts.
The differing results for shorter-term earnings forecasts versus longer-termgrowth forecasts and investment recommendations are consistent with twointerpretations. First, if management of an issuing company selects an under-writer on the basis of the valuation the underwriter offers, and the valuationdepends substantially upon longer term earnings expectations, then analysts
H.-w. Lin, M.F. McNichols / Journal of Accounting and Economics 25 (1998) 101—127 115
may agree on short-term earnings but have different longer term expectationsand recommendations for the company. Relatedly, if the issuing company selectsan underwriter on the basis of its analyst’s reports, then our findings suggest thatmanagement is more concerned with recommendations than earnings forecasts.This may arise because an analyst’s recommendation summarizes his view ofwhether the company is overvalued or undervalued, which relates more directlyto the company’s stock price than do earnings forecasts.
Second, it is likely that manipulation of a growth forecast or an investmentrecommendation is more difficult for investors to detect than manipulation of anearnings forecast. The outcome of an earnings forecast, EPS, is realized on anannual basis. In contrast, the outcome of a long term earnings growth forecast isrevealed over 5 years, and the outcome of an investment recommendationdepends on the investment horizon and the expected rate of return, and these areoften not specified. It can therefore be less costly to an analyst to issue overop-timistic growth forecasts and recommendations than overoptimistic earningsforecasts. On the other hand, investors are concerned with returns to recommen-dations, and the effect of overoptimistic recommendations on an analyst’sreputation for stock-picking may offset the potentially lower cost of manipula-tion due to differences in detectability.
To provide additional evidence on the characteristics of lead underwriter andunaffiliated analysts’ recommendations, Table 3 shows the mean recommenda-tions for the three years preceding and following seasoned equity offerings. Eventhree years prior to an offering, the lead analysts’ recommendations are morefavorable than those of unaffiliated analysts. Both lead and unaffiliated analysts’recommendations become increasingly favorable through time, peaking in the6 months after the offering. The number of analysts issuing recommendationsincreases after seasoned equity offerings, and the increase is most striking forlead underwriter analysts who issued 1,268 recommendations in months 0 to 6,compared to a maximum of 574 for any six month period prior to the offering.7
Table 3 documents that lead underwriter analysts’ recommendations aresignificantly more favorable than unaffiliated analysts’ recommendations for thethree years before and after the offering. However, the greatest differences inrecommendations occur in the 18 months preceding and 6 months followingequity offerings. This pattern is consistent with both the non-strategic andstrategic bias hypotheses. If an issuing company selects the investment bankwhose analyst has the most favorable view, analysts are likely to have relatively
7Because our recommendation data cover the same period as our offering data, observations3 years before (after) an offering are only available for 1992—94 (1989—92) offerings. Thus, the numberof lead analysts covering a company through the six-year period cannot be inferred from Table 3.However, this is not likely to affect the increase in coverage from !6 months to 0 to months 0 to6 significantly.
116 H.-w. Lin, M.F. McNichols / Journal of Accounting and Economics 25 (1998) 101—127
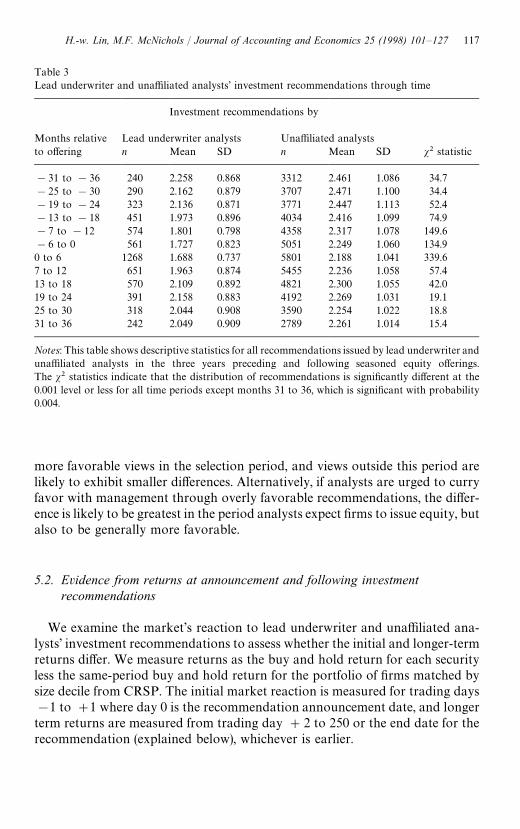
Table 3Lead underwriter and unaffiliated analysts’ investment recommendations through time
Investment recommendations by
Months relative Lead underwriter analysts Unaffiliated analyststo offering n Mean SD n Mean SD s2 statistic
!31 to !36 240 2.258 0.868 3312 2.461 1.086 34.7!25 to !30 290 2.162 0.879 3707 2.471 1.100 34.4!19 to !24 323 2.136 0.871 3771 2.447 1.113 52.4!13 to !18 451 1.973 0.896 4034 2.416 1.099 74.9!7 to !12 574 1.801 0.798 4358 2.317 1.078 149.6!6 to 0 561 1.727 0.823 5051 2.249 1.060 134.90 to 6 1268 1.688 0.737 5801 2.188 1.041 339.67 to 12 651 1.963 0.874 5455 2.236 1.058 57.413 to 18 570 2.109 0.892 4821 2.300 1.055 42.019 to 24 391 2.158 0.883 4192 2.269 1.031 19.125 to 30 318 2.044 0.908 3590 2.254 1.022 18.831 to 36 242 2.049 0.909 2789 2.261 1.014 15.4
Notes: This table shows descriptive statistics for all recommendations issued by lead underwriter andunaffiliated analysts in the three years preceding and following seasoned equity offerings.The s2 statistics indicate that the distribution of recommendations is significantly different at the0.001 level or less for all time periods except months 31 to 36, which is significant with probability0.004.
more favorable views in the selection period, and views outside this period arelikely to exhibit smaller differences. Alternatively, if analysts are urged to curryfavor with management through overly favorable recommendations, the differ-ence is likely to be greatest in the period analysts expect firms to issue equity, butalso to be generally more favorable.
5.2. Evidence from returns at announcement and following investmentrecommendations
We examine the market’s reaction to lead underwriter and unaffiliated ana-lysts’ investment recommendations to assess whether the initial and longer-termreturns differ. We measure returns as the buy and hold return for each securityless the same-period buy and hold return for the portfolio of firms matched bysize decile from CRSP. The initial market reaction is measured for trading days!1 to #1 where day 0 is the recommendation announcement date, and longerterm returns are measured from trading day #2 to 250 or the end date for therecommendation (explained below), whichever is earlier.
H.-w. Lin, M.F. McNichols / Journal of Accounting and Economics 25 (1998) 101—127 117
We model the relation between returns and recommendations as follows:
Ret"a1SB
L#a
2BL#a
3H
L#a
4SB#a
5B#a
6H#a
7S#e, (1)
defining
SB " an indicator variable equal to one if the recommendation is ‘Strong buy’and 0 otherwise
B " an indicator variable equal to one if the recommendation is ‘Buy’ and0 otherwise
H " an indicator variable equal to one if the recommendation is ‘Hold’ and0 otherwise
S " an indicator variable equal to one if the recommendation is ‘Sell’ or‘Strong sell’ and 0 otherwise
The variables subscripted by ¸ equal one if the respective recommendation isissued by a lead underwriter analyst, and zero otherwise. Because there wereonly 11 lead ‘Sell’ recommendations, these were grouped with lead ‘Hold’recommendations.8 The coefficients a
1, a
2and a
3thus reflect the incremental
mean returns associated with lead underwriter analysts’ recommendations rela-tive to unaffiliated analysts’ recommendations, and the t-statistics for thesecoefficients indicate the significance of the difference in the mean market reac-tions for lead and unaffiliated analysts.
We estimate the model for the sample of all lead and unaffiliated recom-mendations in the first and second years after the offering. We focus onrecommendations following seasoned equity offerings to examine the returns toan implementable investment strategy. Following investment recommendationsbefore a seasoned equity offering would not be implementable and would likelyfavor affiliated analysts since firms are documented to have substantial positivestock price performance prior to seasoned equity offerings (Korajczyk et al.,1990).
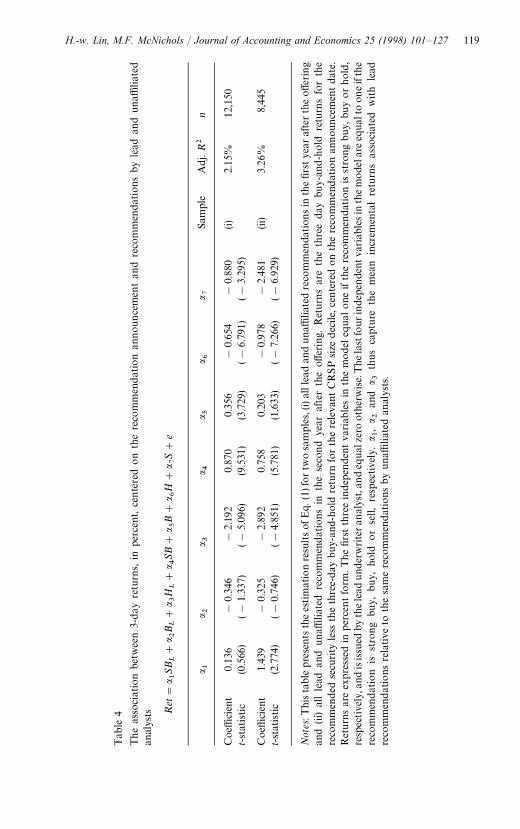
Table 4 presents the estimation results for Eq. (1), where returns are measuredover a 3-day window centered on the recommendation date. The estimationresults for all lead and unaffiliated recommendations in the first year indicatea significant positive response to unaffiliated ‘Strong buy’ (t"9.531) and ‘Buy’recommendations (t"3.729), and significant negative response to ‘Hold’(t"!6.791) and ‘Sell’ recommendations (t"!3.295). The evidence indicatesthat investors view analysts’ recommendations as informative. The evidence alsosuggests that investors undo bias in ‘Hold’ recommendations. That is, theyinterpret unaffiliated ‘Hold’ recommendations as negative rather than neutral,information about a stock. The coefficients a
1and a
2are not significantly
8We have examined the sensitivity of our results by separately estimating a coefficient for lead‘Sell’ recommendations and none of our conclusions are affected.
118 H.-w. Lin, M.F. McNichols / Journal of Accounting and Economics 25 (1998) 101—127
Tab
le4
The
asso
ciat
ion
betw
een
3-day
retu
rns,
inpe
rcen
t,ce
nte
red
on
the
reco
mm
endat
ion
announ
cem
ent
and
reco
mm
enda
tion
sby
lead
and
unaffi
liat
edan
alys
ts Ret"
a 1SBL#
a 2BL#
a 3HL#
a 4SB#
a 5B#
a 6H#
a 7S#
e
a 1a 2
a 3a 4
a 5a 6
a 7Sa
mple
Adj.
R2
n
Coe
ffici
ent
0.13
6!
0.34
6!
2.19
20.
870
0.35
6!
0.65
4!
0.88
0(i)
2.15
%12
,150
t-st
atistic
(0.5
66)
(!1.
337)
(!5.
096)
(9.5
31)
(3.7
29)
(!6.
791)
(!3.
295)
Coe
ffici
ent
1.43
9!
0.32
5!
2.89
20.
758
0.20
3!
0.97
8!
2.48
1(ii
)3.
26%
8,44
5t-st
atistic
(2.7
74)
(!0.
746)
(!4.
851)
(5.7
81)
(1.6
33)
(!7.
266)
(!6.
929)
Not
es:T
hista
ble
pre
sents
the
estim
atio
nre
sultsof
Eq.(
1)fo
rtw
osa
mple
s,(i)
alll
ead
and
una
ffilia
ted
reco
mm
enda
tionsin
the
first
year
afte
rth
eoffe
ring
and
(ii)
all
lead
and
unaffi
liate
dre
com
men
dat
ions
inth
ese
cond
year
afte
rth
eoff
erin
g.R
eturn
sar
eth
eth
ree
day
buy-
and-h
old
retu
rns
for
the
reco
mm
ended
secu
rity
less
the
thre
e-day
buy
-and
-hol
dre
turn
for
the
rele
vant
CR
SP
size
dec
ile,c
ente
red
onth
ere
com
men
dat
ion
annou
nce
men
tda
te.
Ret
urns
are
expre
ssed
inper
centfo
rm.T
hefirs
tth
ree
inde
penden
tva
riab
les
inth
em
odel
equa
lone
ifth
ere
com
men
dation
isst
rong
buy,
buy
or
hol
d,
resp
ective
ly,a
ndis
issu
edby
thele
adund
erw
rite
ran
alys
t,an
deq
ual
zero
other
wise.
The
last
four
inde
pende
ntva
riab
lesin
them
ode
lare
equa
lto
oneif
the
reco
mm
endat
ion
isst
rong
buy,
buy
,ho
ldor
sell,
resp
ective
ly.
a 1,a 2
and
a 3th
usca
pture
the
mea
nin
crem
enta
lre
turn
sas
soci
ated
with
lead
reco
mm
endat
ions
rela
tive
toth
esa
me
reco
mm
endat
ions
by
una
ffiliat
edan
alys
ts.
H.-w. Lin, M.F. McNichols / Journal of Accounting and Economics 25 (1998) 101—127 119
different from zero, suggesting that investors do not view lead ‘Buy’ recommen-dations as less informative than unaffiliated ‘Buy’ recommendations.
In contrast, the coefficient a3, reflecting the incremental market reaction
to lead ‘Hold’ recommendations, is !2.2%, and is significantly negative(t"!5.096).9 The evidence therefore suggests that the market interprets anaffiliated ‘Hold’ to mean ‘Sell’ to a greater degree than an unaffiliated ‘Hold’.This finding is more consistent with the strategic than non-strategic bias scen-ario. If issuing companies select the underwriter whose analyst has the mostfavorable view, one would expect more positive announcement effects to allunaffiliated recommendations. The finding of a more negative reaction only foraffiliated ‘Hold’ recommendations suggests affiliated analysts strategically avoid‘Sell’ recommendations to maintain client relations.
Table 4 also presents the estimation results for recommendations in thesecond year after the seasoned equity offering and documents a similar patternto the results for the first year sample. Specifically, returns to unaffiliated ‘Strongbuy’ recommendations are significantly positive, and returns to unaffiliated‘Hold’ and ‘Sell’ recommendations are significantly negative. The reaction tolead ‘Strong buy’ recommendations is greater than that for unaffiliated analysts,suggesting affiliated analysts may have an information advantage. As in the firstyear after the offering, the returns associated with lead ‘Hold’ recommendationsare significantly more negative than those associated with unaffiliated ‘Hold’recommendations.
We examine the longer-term returns to an investment recommendation overthe life of the investment recommendation or 250 trading days, whichever isshorter.10 Table 5 presents a transition matrix for all initial and subsequentratings in the year after seasoned equity offerings. Subsequent ratings includeseveral categories in addition to recommendations from ‘Strong buy’ to ‘Sell’.Specifically, for some firm-analyst combinations, there may be only one recom-mendation in the year following the seasoned equity offering, and therefore nosubsequent recommendation (category 6). In this case, we consider the initialrecommendation valid for 250 trading days. Category 7 includes cases where theanalyst covering a sample firm issues an initial recommendation but then leavesthe brokerage firm. The date the analyst leaves the firm is used to indicate theend of the ‘life’ of the recommendation. The database also indicates that anopinion is not available, or that the analyst is no longer covering the stock
9This finding is not due to the aggregation of lead ‘Hold’ and ‘Sell’ recommendations. When thelead ‘Sell’ recommendations are included separately in the model, untabulated statistics indicate thatthe coefficient that reflects the incremental returns associated with lead ‘Hold’ recommendations, a
3,
is !0.023, and the t-statistic is !5.34.
10Dunbar et al. (1997) take a related approach by separately calculating the returns to ‘Buy’recommendations that have been downgraded.
120 H.-w. Lin, M.F. McNichols / Journal of Accounting and Economics 25 (1998) 101—127
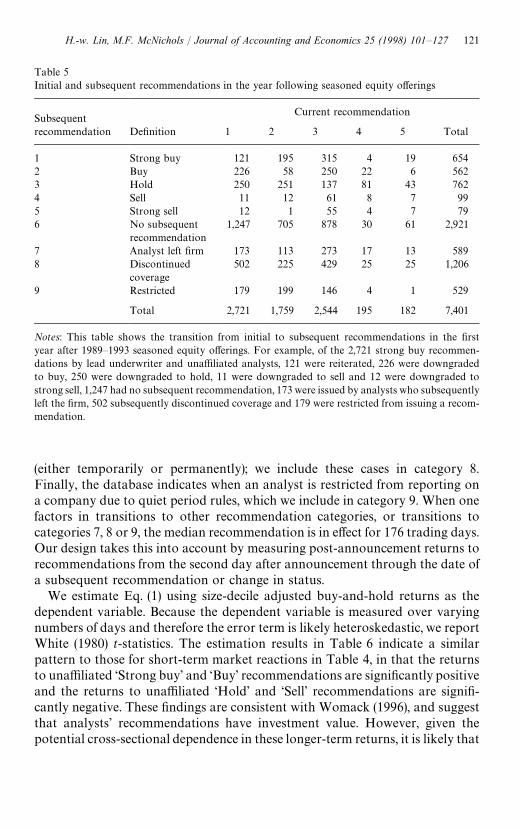
Table 5Initial and subsequent recommendations in the year following seasoned equity offerings
SubsequentCurrent recommendation
recommendation Definition 1 2 3 4 5 Total
1 Strong buy 121 195 315 4 19 6542 Buy 226 58 250 22 6 5623 Hold 250 251 137 81 43 7624 Sell 11 12 61 8 7 995 Strong sell 12 1 55 4 7 796 No subsequent
recommendation1,247 705 878 30 61 2,921
7 Analyst left firm 173 113 273 17 13 5898 Discontinued
coverage502 225 429 25 25 1,206
9 Restricted 179 199 146 4 1 529
Total 2,721 1,759 2,544 195 182 7,401
Notes: This table shows the transition from initial to subsequent recommendations in the firstyear after 1989—1993 seasoned equity offerings. For example, of the 2,721 strong buy recommen-dations by lead underwriter and unaffiliated analysts, 121 were reiterated, 226 were downgradedto buy, 250 were downgraded to hold, 11 were downgraded to sell and 12 were downgraded tostrong sell, 1,247 had no subsequent recommendation, 173 were issued by analysts who subsequentlyleft the firm, 502 subsequently discontinued coverage and 179 were restricted from issuing a recom-mendation.
(either temporarily or permanently); we include these cases in category 8.Finally, the database indicates when an analyst is restricted from reporting ona company due to quiet period rules, which we include in category 9. When onefactors in transitions to other recommendation categories, or transitions tocategories 7, 8 or 9, the median recommendation is in effect for 176 trading days.Our design takes this into account by measuring post-announcement returns torecommendations from the second day after announcement through the date ofa subsequent recommendation or change in status.
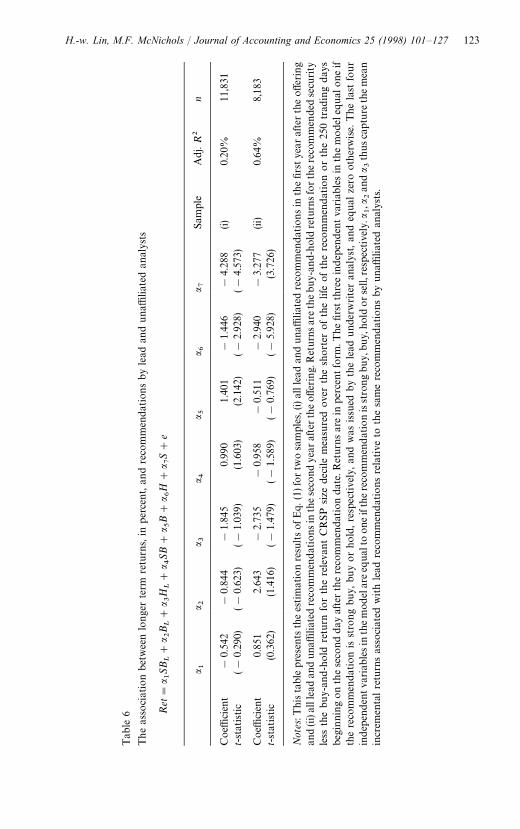
We estimate Eq. (1) using size-decile adjusted buy-and-hold returns as thedependent variable. Because the dependent variable is measured over varyingnumbers of days and therefore the error term is likely heteroskedastic, we reportWhite (1980) t-statistics. The estimation results in Table 6 indicate a similarpattern to those for short-term market reactions in Table 4, in that the returnsto unaffiliated ‘Strong buy’ and ‘Buy’ recommendations are significantly positiveand the returns to unaffiliated ‘Hold’ and ‘Sell’ recommendations are signifi-cantly negative. These findings are consistent with Womack (1996), and suggestthat analysts’ recommendations have investment value. However, given thepotential cross-sectional dependence in these longer-term returns, it is likely that
H.-w. Lin, M.F. McNichols / Journal of Accounting and Economics 25 (1998) 101—127 121
the t-statistics are overstated. Furthermore, our measures of returns are beforetransaction costs. Accordingly, although these data suggest that analysts are, onaverage, able to identify mispriced securities, it is not clear these findings wouldbe observed after controlling for transactions costs and cross-sectional depend-ence.11 However, the analysis is informative about the difference betweenaffiliated and unaffiliated analysts’ ability to make recommendations that gener-ate abnormal returns. Specifically, as in Table 4, the returns to lead ‘Strong buy’and ‘Buy’ recommendations are insignificantly different from the returns tounaffiliated ‘Strong buy’ and ‘Buy,’ respectively. In contrast to Table 4, thelonger term returns to lead ‘Hold’ recommendations are also insignificantlydifferent, suggesting that the more negative implications of lead ‘Hold’ recom-mendations are reflected in price in the three-day announcement period.
We also examine the returns to recommendations in the second year after theoffering, to assess whether the similar performance of first year lead andunaffiliated ‘Buy’ recommendations is due to the measurement period. Becausenegative abnormal returns to seasoned equity offering firms are documented byLoughran and Ritter (1995) to be more pronounced in year 2 than year 1, theevidence from year 1 may not capture periods with the greatest potential fordifferences in returns. As Table 6 shows, the longer-term returns to unaffiliated‘Strong buy’ and ‘Buy’ recommendations in year 2 are not significantlypositive, as for year 1. However, similar to the evidence for year 1, the returns toaffiliated recommendations are insignificantly different from those of unaf-filiated analysts. In particular, the incremental returns to lead ‘Strong buy’ and‘Buy’ recommendations are positive, though not significantly so, and suggestinvestors would not have earned lower returns following lead analysts’ ‘Buy’recommendations.12 As for year 1, the longer-term returns to lead ‘Hold’recommendations are negative, but insignificantly different from those of unaf-filiated analysts.
The return behavior in the announcement and post-announcement periodsbears on recent findings by Dechow et al. (1998). They test whether investorscorrect for bias in analysts’ growth forecasts, and find that growth expectationsin price are inconsistent with adjustment by investors. In contrast, we find thatinvestors do correct bias in unaffiliated analysts’ ‘Hold’ recommendations.
11For further discussion of methodological issues in measuring abnormal returns over longhorizons, see Barber and Lyon (1997) and Kothari and Warner (1997).
12One caveat to the interpretation of these results is that our design compares the returns to leadunderwriter and unaffiliated analysts’ recommendations for firms issuing seasoned equity offerings.Our design thus holds the stocks constant and compares returns to recommendations, and thereforedoes not reflect differences in analysts’ stock-picking ability. An alternative design is to examine thereturns to all the recommendations of a sample of analysts, allowing different coefficients for theaffiliated and unaffiliated recommendations. This would better reflect differences in the stocksanalysts select to cover.
122 H.-w. Lin, M.F. McNichols / Journal of Accounting and Economics 25 (1998) 101—127
Tab
le6
The
asso
ciat
ion
bet
wee
nlo
nge
rte
rmre
turn
s,in
per
cent,
and
reco
mm
endat
ions
byle
adan
dunaffi
liate
dan
alys
ts
Ret"
a 1SBL#
a 2BL#
a 3HL#
a 4SB#
a 5B#
a 6H#
a 7S#
e
a 1a 2
a 3a 4
a 5a 6
a 7Sa
mple
Adj.
R2
n
Coe
ffici
ent
!0.
542
!0.
844
!1.
845
0.99
01.
401
!1.
446
!4.
288
(i)0.
20%
11,8
31t-st
atistic
(!0.
290)
(!0.
623)
(!1.
039)
(1.6
03)
(2.1
42)
(!2.
928)
(!4.
573)
Coe
ffici
ent
0.85
12.
643
!2.
735
!0.
958
!0.
511
!2.
940
!3.
277
(ii)
0.64
%8,
183
t-st
atistic
(0.3
62)
(1.4
16)
(!1.
479)
(!1.
589)
(!0.
769)
(!5.
928)
(3.7
26)
Not
es:T
hista
ble
pre
sents
the
estim
atio
nre
sultsof
Eq.(
1)fo
rtw
osa
mple
s,(i)
alll
ead
and
una
ffilia
ted
reco
mm
enda
tionsin
the
first
year
afte
rth
eoffe
ring
and
(ii)
alll
ead
and
una
ffilia
ted
reco
mm
endat
ionsin
these
cond
year
afte
rth
eoff
erin
g.R
eturn
sar
eth
ebuy-
and-
hol
dre
turn
sfo
rth
ere
com
men
ded
secu
rity
less
the
buy-
and-h
old
retu
rnfo
rth
ere
leva
nt
CR
SP
size
deci
lem
easu
red
over
the
short
erofth
elife
ofth
ere
com
men
dat
ion
or
the
250
trad
ing
day
sbe
ginni
ng
on
the
seco
nd
day
afte
rth
ere
com
men
dat
ion
date
.Ret
urns
are
inpe
rcen
tfo
rm.T
hefirs
tth
ree
indep
enden
tva
riab
lesin
the
mode
lequal
one
ifth
ere
com
men
dation
isst
rong
buy
,bu
yor
hold
,re
spec
tive
ly,an
dw
asissu
edby
the
lead
unde
rwrite
ran
alys
t,an
deq
ual
zero
other
wise.
The
last
four
indep
enden
tva
riab
lesin
them
odel
areeq
ualt
oon
eif
there
com
men
dat
ion
isst
rong
buy,
buy,
hold
orse
ll,re
spec
tive
ly.a
1,a2an
da 3
thusca
ptu
reth
em
ean
incr
emen
talre
turn
sas
soci
ated
with
lead
reco
mm
endat
ions
rela
tive
toth
esa
me
reco
mm
endat
ions
byun
affilia
ted
anal
ysts
.
H.-w. Lin, M.F. McNichols / Journal of Accounting and Economics 25 (1998) 101—127 123
Furthermore, we find that investors correct for greater bias in affiliated analysts’‘Hold’ recommendations relative to those of unaffiliated analysts. Why investorsdiffer in their ability to correct for biases in growth forecasts and recommenda-tions remains an intriguing question for future research.
Finally, to examine whether our findings on the association between returnsand affiliated and unaffiliated analysts’ investment recommendations are in-fluenced by differences in their tendencies to reiterate recommendations, werepeated the analyses in Tables 4 and 6 using alternative definitions of analysts’recommendations. Specifically, we define ‘Buy’ recommendations to be thosethat are upgrades to ‘Buy’ or ‘Strong buy’, ‘Uphold’ recommendations to bethose that are upgrades to ‘Hold’, ‘Downhold’ recommendations to be thosethat are downgrades to ‘Hold’ and ‘Sell’ recommendations to be those that aredowngrades to ‘Sell’. The untabulated findings are consistent with those re-ported in Tables 4 and 6. Specifically, affiliated analysts’ ‘Downhold’ ratings areconsidered a significantly more negative signal about firms’ future prospectsthan those of unaffiliated analysts. Furthermore, the longer-term returns toaffiliated analysts’ recommendations are insignificantly different from those tounaffiliated analysts’ recommendations.
6. Summary and conclusions
This paper examines the effect of investment banks’ underwriting relation-ships on analysts’ earnings forecasts and recommendations for a sample of 2,400seasoned equity offerings issued in 1989—1994. The findings indicate that leadand co-underwriter analysts’ growth forecasts and particularly their recommen-dations are significantly more favorable than those of unaffiliated analysts,although their near-term earnings forecasts are generally not. These findingsmay reflect the greater incentives of affiliated analysts to issue overly favorablerecommendations to maintain client relations. The findings may also reflect theissuing companies’ incentives to select as underwriter the investment bankwhose analysts have more favorable views.
The paper also examines whether investors respond differently to the an-nouncement of affiliated versus unaffiliated analysts’ recommendations, andwhether affiliated analysts’ more favorable recommendations, if followed lit-erally, would lead to poorer investment performance. We find that the an-nouncement returns to lead ‘Hold’ recommendations are significantly morenegative than unaffiliated ‘Hold recommendations, but find no difference in theannouncement period returns to lead and unaffiliated analysts’ ‘Strong buy’ and‘Buy’ recommendations. These findings indicate that investors perceive a ‘Hold’recommendation from an affiliated analyst as significantly more negative in-formation about a stock’s prospects than a ‘Hold’ recommendation from anunaffiliated analyst. One would expect more positive announcement effects to all
124 H.-w. Lin, M.F. McNichols / Journal of Accounting and Economics 25 (1998) 101—127
unaffiliated recommendations if issuing companies select the analysts with themost favorable views. This finding therefore suggests that affiliated analystsstrategically avoid ‘Sell’ recommendations to maintain client relations. Finally,we find no difference in the post-announcement returns associated with affiliatedvs. unaffiliated analysts’ recommendations. The data therefore suggest thatalthough affiliated analysts’ recommendations are more favorable on average,an investor would not experience weaker investment performance by followingtheir recommendations than by following unaffiliated recommendations.
The questions addressed in this study are of interest to accounting researchersfor several reasons. First, the role of accounting disclosures depends on thecharacteristics of competing information sources such as analysts’ reports.Much of the literature considers analysts as non-strategic information acquirersand providers, though an emerging view emphasizes the importance of under-standing analysts’ incentives. This study furthers our understanding of analysts’incentives, and their consequences for reported earnings forecasts, growth fore-casts and recommendations. Our study’s findings are relevant to researchers inaccounting, finance and economics who rely on analyst forecast data as a proxyfor investors’ earnings expectations. In spite of substantial suggestion in thefinancial press that affiliated analysts are overoptimistic, our findings indicatethat affiliated analysts’ forecasts of earnings are generally not more optimisticthan those made by unaffiliated analysts. However, our findings indicate thataffiliated analysts’ growth forecasts and particularly their recommendations aremore favorable than those of unaffiliated analysts.
Our findings are also relevant to investors. A ‘Hold’ recommendation from anunaffiliated analyst is considered a negative signal about a firm’s prospects, anda ’Hold’ recommendation from the lead underwriter analyst is considered to beeven more negative. Our findings indicate that investors view ‘Strong Buy’ and‘Buy’ recommendations of lead and unaffiliated analysts similarly, and that thelonger-term returns experienced following lead and unaffiliated recommenda-tions are similar.
Finally, our findings are relevant for regulators. Given the allegations thataffiliated analysts’ reports are influenced by underwriting relationships in theperiod surrounding an offering, some researchers have suggested that regulatorslengthen the quiet period, the period during which affiliated analysts are notpermitted to issue forecasts and recommendations.13 We find that affiliatedanalysts’ recommendations are informative, and find no evidence that investorsin seasoned equity offerings experience weaker investment performance byfollowing affiliated recommendations. Our findings therefore indicate thatlengthening the quiet period for seasoned equity offerings would deprive inves-tors of access to information and provide no offsetting benefit.
13See Shayne and Soderquist (1995), and Michaely and Womack (1997).
H.-w. Lin, M.F. McNichols / Journal of Accounting and Economics 25 (1998) 101—127 125
Acknowledgements
We thank Tom Elliott, Dan Hill and Jeff Kemp of Research Holdings Ltd. forproviding data used in this study and for many helpful discussions. We thankChris Jones for his assistance in programming. Maureen McNichols gratefullyacknowledges the support of the Bob and Marilyn Jaedicke Faculty Fellowshipand of the Financial Research Initiative of the Stanford Graduate School ofBusiness. The authors appreciate the many constructive suggestions of S.P.Kothari (the editor) and Charles M.C. Lee (the referee). The authors also thankMary Barth, Bill Beaver, Vic Bernard, George Foster, Patricia Hughes, TomLys, Nahum Melumad, Patricia O’Brien, Jim Patell, Katherine Schipper, ScottStickel, and workshop participants at the University of Chicago, Harvard,Northwestern, Notre Dame and Stanford University for helpful comments.
References
Ali, A., 1996. Bias in analysts’ earnings forecasts as an explanation for the long-run underperfor-mance of stocks following equity offerings. Unpublished working paper, University of Arizona.
Barber, B., Lyon, J., 1997. Detecting long-run abnormal stock returns: The empirical power andspecification of test statistics. Journal of Financial Economics 43, 341—372.
Browning, E.S., 1995. Please don’t talk to the bearish analyst. The Wall Street Journal, May 2, Cl.Dechow, P., Hutton, A., Sloan, R., 1998. The relation between affiliated analysts’ long-term earnings
forecasts and the overpricing of equity offerings. Unpublished working paper, Harvard Univer-sity.
Dorfman, D.,1991. Ex-Kidder analyst: firm choked reports. USA Today, December 9, 4b.Dorfman, J., 1995. Ranking the analysts: A tougher year for the all-stars. The Wall Street Journal,
June 20, C1.Dorfman, J., McGough, R., 1993. Some question if analysts are worth their pay. The Wall Street
Journal, September 15, R11.Dugar, A., Nathan, S., 1995. The effects of investment banking relationships on financial analysts’
earnings forecasts and investment recommendations. Contemporary Accounting Research 12,131—660.
Dunbar, C., Hwang, C.-Y., Shastri, K., 1997. Underwriter analyst recommendations: conflict ofinterest or rush to judgment? Unpublished working paper, University of Pittsburgh.
Eccles, R.G., Crane, D.B., 1988. Doing deals investment banks at work. Harvard Business SchoolPress.
Francis, J., Philbrick, D., 1993. Analysts’ decisions as products of a multi-task environment. Journalof Accounting Research 31, 216—230.
Hansen, R., Sarin, A., 1996. Is honesty the best policy? An examination of security analyst forecastbehavior around seasoned equity offerings. Unpublished working paper, Santa Clara University.
Jennings, R.W., Marsh, Jr., H., 1987. Securities regulation: cases and materials. The FoundationPress, Inc.
Konrad, W., 1989. Are analysts putting their mouths where the money is? Business Week, December18, 118.
Korajczyk, R.A., Lucas, D., McDonald, R., 1990. Understanding stock price behavior around thetime of equity issues. In: Glenn Hubbard, R. (Ed.) Asymmetric Information, Corporate Finance,and Investment. University of Chicago Press, Chicago.
126 H.-w. Lin, M.F. McNichols / Journal of Accounting and Economics 25 (1998) 101—127
Kothari, S.P., Warner, J., 1997. Measuring long-horizon security price performance. Journal ofFinancial Economics 43, 301—339.
Lin, H.-w., McNichols, M., 1998. Analyst coverage of initial public offering firms. Unpublishedworking paper, Stanford University.
Loughran, T., Ritter, J.R., 1995. The new issues puzzle. The Journal of Finance 50, 23—51.McNichols, M., O’Brien, P. C., 1997. Self-selection and analyst coverage. Journal of Accounting
Research 35, 167—199 (in press).Michaely, R., Womack, K., 1996. Conflict of interest and the credibility of underwriter analyst
recommendations. Unpublished working paper, Cornell University.Raghavan, A., 1997. How one top analyst vaults ‘Chinese wall’ to do deals for firm. The Wall Street
Journal, 25 March.Raghavan, A., 1996. Boom in IPO market pushes underwriting fees to record $2.9 billion. The Wall
Street Journal, 1 July.Schism, L., Steinmetz, G., 1994. Conseco fires Merrill Lynch as underwriter. The Wall Street
Journal, 13 October, A2.Schultz, E., 1990. Wall Street grows treacherous for analysts who speak out. The Wall Street
Journal, 5 April, C1.Shayne, J., Soderquist, L., 1995. Inefficiency in the market for initial public offerings. Vanderbilt Law
Review 48, 965—983.Siconolfi, M., 1995. Many companies press analysts to steer clear of negative ratings. The Wall Street
Journal, 19 July, A1, A7.Siconolfi, M., 1992. At Morgan Stanley, analysts were urged to soften harsh views. The Wall Street
Journal, 14 July, A1, A6.Smith, R., 1991. As merger fees dry up, Wall Street thrives selling mountains of new stock. The Wall
Street Journal, 15 November, C1.Sonsini, L.W., 1988. Certain restrictions on market activities by underwriters and other participants
in a distribution, Rules 10b-6 and 10b-7. Securities Regulation Institute, January.Weiss, D.M., 1993. After the trade is made: processing securities transactions. New York Institute of
Finance.White, H., 1980. A heteroskedasticity-consistent covariance matrix estimator and a direct test for
heteroskedasticity. Econometrica 48, 817—838.Womack, K., 1996. Do brokerage analysts’ recommendations have investment value? The Journal of
Finance 51, 137—167.
H.-w. Lin, M.F. McNichols / Journal of Accounting and Economics 25 (1998) 101—127 127
Related Documents