Underwriter Reputation and the Quality of Certification: Evidence from High-Yield Bonds ! Christian Andres, WHU - Otto Beisheim School of Management * André Betzer, BUW - Schumpeter School of Business and Economics ** Peter Limbach, KIT - Karlsruhe Institute of Technology *** forthcoming Journal of Banking & Finance Abstract This paper provides primary evidence of whether certification via reputable underwriters is beneficial to investors in the corporate bond market. We focus on the high-yield bond market, in which certification of issuer quality is most valuable to investors owing to low liquidity and issuing firms’ high opacity and default risk. We find bonds underwritten by the most reputable underwriters to be associated with significantly higher downgrade and default risk. Investors seem to be aware of this relation, as we further find the private information conveyed via the issuer-reputable underwriter match to have a significantly positive effect on at-issue yield spreads. Our results are consistent with the market-power hypothesis, and contradict the traditional certification hypothesis and underlying reputation mechanism. JEL classification: G11, G14, G24 Keywords: borrowing costs, certification, downgrade and default risk, reputation, underwriting standards ! We thank Gerhard Arminger, Werner De Bondt, Hermann Elendner, Martin Fridson, Marc Goergen, Laura Gonzalez, Abe de Jong, Gunter Löffler, Lars Norden, Jörg Rocholl, Martin Ruckes, Richard Stiens (Morgan Stanley), Erik Theissen, and Marliese Uhrig-Homburg for insightful comments and discussions. We further thank seminar participants at Cardiff Business School, University of Mannheim, Università Cattolica Milan, Karlsruhe Institute of Technology, Rotterdam School of Management, and University of Wuppertal for helpful comments and discussions. * Address: WHU – Otto Beisheim School of Management, Burgplatz 2, 56179 Vallendar, Germany; email: [email protected] ** Corresponding author: Address: BUW – Schumpeter School of Business and Economics, Gaußstraße 20, 42119 Wuppertal, Germany; Phone: +49 (0)20 24 39 29 05, Fax: +49 (0)20 24 39 31 68 email: [email protected] *** Address: Karlsruhe Institute of Technology, Kaiserstraße 12, 76131 Karlsruhe, Germany; email: [email protected]

Welcome message from author
This document is posted to help you gain knowledge. Please leave a comment to let me know what you think about it! Share it to your friends and learn new things together.
Transcript
Underwriter Reputation and the Quality of Certification: Evidence from High-Yield Bonds!
Christian Andres, WHU - Otto Beisheim School of Management*
André Betzer, BUW - Schumpeter School of Business and Economics**
Peter Limbach, KIT - Karlsruhe Institute of Technology***
forthcoming Journal of Banking & Finance
Abstract
This paper provides primary evidence of whether certification via reputable underwriters is beneficial to investors in the corporate bond market. We focus on the high-yield bond market, in which certification of issuer quality is most valuable to investors owing to low liquidity and issuing firms’ high opacity and default risk. We find bonds underwritten by the most reputable underwriters to be associated with significantly higher downgrade and default risk. Investors seem to be aware of this relation, as we further find the private information conveyed via the issuer-reputable underwriter match to have a significantly positive effect on at-issue yield spreads. Our results are consistent with the market-power hypothesis, and contradict the traditional certification hypothesis and underlying reputation mechanism.
JEL classification: G11, G14, G24
Keywords: borrowing costs, certification, downgrade and default risk, reputation, underwriting standards
! We thank Gerhard Arminger, Werner De Bondt, Hermann Elendner, Martin Fridson, Marc Goergen, Laura Gonzalez, Abe de Jong, Gunter Löffler, Lars Norden, Jörg Rocholl, Martin Ruckes, Richard Stiens (Morgan Stanley), Erik Theissen, and Marliese Uhrig-Homburg for insightful comments and discussions. We further thank seminar participants at Cardiff Business School, University of Mannheim, Università Cattolica Milan, Karlsruhe Institute of Technology, Rotterdam School of Management, and University of Wuppertal for helpful comments and discussions.
*Address: WHU – Otto Beisheim School of Management, Burgplatz 2, 56179 Vallendar, Germany; email: [email protected] **Corresponding author: Address: BUW – Schumpeter School of Business and Economics, Gaußstraße 20, 42119 Wuppertal, Germany; Phone: +49 (0)20 24 39 29 05, Fax: +49 (0)20 24 39 31 68 email: [email protected] ***Address: Karlsruhe Institute of Technology, Kaiserstraße 12, 76131 Karlsruhe, Germany; email: [email protected]
1
1. Introduction
Significant cases of debt underwriting fraud over the past decade have called into question both
traditional theory (e.g., Booth and Smith 1986, Allen 1990) and empirical results that support the
certification hypothesis for the corporate bond market (Livingston and Miller 2000, Fang 2005).1
To determine whether the most reputable underwriters are necessarily associated with the
highest-quality underwriting standards, we study certification in the U.S. corporate bond market
between 2000 and 2008. Specifically, we examine whether high-yield bonds underwritten by
reputable (i.e., high-market-share) lead underwriters are associated with significantly higher or
lower downgrade and default risk. We further explore whether investors behave rationally in
pricing the risk associated with reputable underwriters when bonds are issued. We thus, in
contrast to most studies that deal with underwriters, test the certification hypothesis from the
investor’s point of view by asking whether certification benefits investors in the bond market.
The corporate bond market, particularly the high-yield segment, is an optimal test ground for our
study for the following reasons. First, our analysis uses data post enactment of the Gramm-
Leach-Bliley Act (GLBA) that repealed the Glass-Steagall Act in late 1999. The GLBA led to
intensified competition among underwriters and a sharp decrease in investment banking fees,
especially in the high-yield bond market in which commercial bank entry was strongest (Gande et
1 In a New York Times (August 25, 2002) article titled “Underwriting Fraud,” Citigroup, J.P. Morgan Chase, and
Merrill Lynch are blamed for misusing their reputations for their own and clients’ benefit to the detriment of
investors. The article mentions Citigroup’s involvement in a 2002 lawsuit brought by pension funds that had invested
12 billion dollars in WorldCom bonds and later claimed the bank had not adequately reviewed the state of
WorldCom's business due to conflicts of interest. “[T]here is no denying,” the article stated, “that prestigious banks
helped bankroll huge frauds that hurt millions of investors.” Relatedly, Gopalan et al. (2011) report that J.P. Morgan
syndicated a loan to Enron as its lead arranger just before the firm’s bankruptcy filing.
2
al. 1999, Geyfman and Yeager 2009, Shivdasani and Song 2011). Second, compared to
investment-grade bonds, high-yield bonds are particularly information-sensitive, low-liquidity
securities not sold exclusively on the basis of credit ratings (Datta et al. 1997, Fridson and
Garman 1998).2 Certification of issuer quality via underwriters is hence particularly valuable to
both issuing firms and investors in this segment (Puri 1999). Third, the vast majority of high-
yield bond investors, predominantly insurance companies and mutual and pension funds
(Standard & Poor’s 2007), are heavily regulated, engage only rarely in activism, and have rather
long investment horizons. Thus, the effects of underwriter reputation on bond downgrade and
default risk is highly important to these investors. Finally, issuing firms in the high-yield
segment, often private or smaller public firms, are generally less visible than investment-grade
issuers. Thus, with less reputational exposure, reputable underwriters may have less incentive to
conduct business properly (Rhee and Valdez 2009).3
According to the certification hypothesis, underwriters can help to reduce information
asymmetries between investors and the issuing firm by certifying issuer quality though their
reputation (see, e.g., Booth and Smith 1986). In contrast to the issuing firm, underwriters’
business model is based on repeated interaction with investors, which is why it pays for them to
build costly reputation. However, as described in Chemmanur and Fulghieri (1994), problems of
moral hazard can arise for underwriters with a very high reputation. They might have incentives
2 However, credit ratings are available and reduce the heterogeneity in the data. This allows for cleaner inferences on
underwriter reputation (Fang 2005).
3 The observation by Ljungqvist et al. (2006) that incentives to preserve reputation can be less constraining for banks
that specialize in underwriting debt as compared to equity implies a greater willingness to test investor credulity.
3
to “milk” their reputations to avoid the costs of strict evaluation (i.e., underwriting) standards.4 In
a study of equity IPOs, Chemmanur and Krishnan (2012) extent this reasoning and argue that the
focus of large and reputable underwriters may shift from certifying quality to maximizing the
issuer’s valuation (market-power hypothesis). In this paper, we examine whether the certification
hypothesis can still be upheld in the high-yield bond market post GBLA, a period of increased
competition and lower fees in the underwriting market (see, e.g. Gande et al. 1999). Relaxing
underwriting standards may be one potential response of underwriters to increased competition
for clients and league table positions in the wake of the repeal of the Glass-Steagall Act.5
Reducing screening incentives or, more generally, product quality in response to increased
competition and lower fees is consistent with the models of Bouvard and Levy (2009), Strausz
(2005), and Shapiro (1983) and empirical evidence provided by Shivdasani and Song (2011). The
latter show intensified competition in the wake of deregulation of the Glass-Steagall Act in 1996
to have adversely affected screening incentives of underwriters in the corporate bond market
between 1996 and 2000.
In contrast to existing literature that relies exclusively on pre-GLBA data, we find that the most
reputable underwriters increase rather than reduce issuing firms’ informational costs. This is in
4 Chemmanur and Fulghieri (1994) posit, theoretically, the existence of a U-shaped relation between underwriter
reputation and the quality of evaluation standards (i.e., certification quality).
5 Regarding league table competition, Golubov et al. (2012) observe that the investment banking industry seems to
be fixated on these rankings as they pursue future business, as documented in Rau (2000) and Bao and Edmans
(2011) for the M&A market. Anecdotal evidence associates competition for league table rankings with lower
underwriting standards. The Wall Street Journal observes in an article that reports that the industry’s most-respected
banks are rabid about staying in these rankings: “If you want to understand the Street at its absurd best, watch men
in Rolexes grub for credit for deals they barely worked on for clients who probably won't pay them” (see “Gaming
the Game: How the Street Plays the League Tables,” April 10, 2007).
4
line with our main finding that high-yield bonds underwritten by these banks are associated with
significantly higher downgrade and default risk. In particular, we report that bonds underwritten
by one of the Top 3 lead underwriters in the U.S. corporate bond market are significantly more
likely both to be downgraded in the short and medium term and to default. Calculating marginal
effects, we estimate the probability of a bond being downgraded within six or 24 months of issue
at 3% and 15%, respectively, larger if the lead underwriter is one of the Top 3. The probability
that the first rating action within the first three years of issue will be a downgrade is about 18%
higher for bonds underwritten by a Top 3 underwriter. The marginal effect for bond default is
about 2%. In line with the higher default probabilities we document, bonds underwritten by Top 3
lead underwriters experience significantly more downgrades (but not upgrades) both within the
first three years of issue and in general. These results account for endogeneity, and do not hinge
on the definition of underwriter reputation or use of binary or continuous variables measuring
reputation. Moreover, the results do not change when we include additional controls, use
additional rating performance variables, or examine subsamples of bonds by time to maturity.
In line with the increased downgrade and default risk associated with Top 3 lead underwriters, we
find investor evaluation of the underwriting standards of the Top 3 to have a significantly positive
effect on at-issue yield spreads. This finding is consistent with market efficiency, and suggests
that the issuer-reputable underwriter matching conveys price-relevant information to bond
investors. In other words, investors seem to be aware of this relation and demand a risk premium
through a higher yield spread. The most reputable underwriters thus increase rather than reduce
issuers’ informational costs and, hence, do not seem to fulfill a certification function. Following
Puri (1996), Fang (2005), and McCahery and Schwienbacher (2010), we use the inverse Mills
ratio for the choice of a Top 3 lead underwriter in the second-stage regressions (Heckman 1979)
to measure the pricing effect of underwriter evaluation standards (i.e., ability to certify issuer
5
quality). Our results suggest that investors generally should not, and do not, believe that at-stake
reputation capital incentivizes the most reputable underwriters to report client quality honestly.
Our findings, in providing primary evidence from the bond market in favor of the market-power
over the certification hypothesis, support recent results by Chemmanur and Krishnan (2012) and
McCahery and Schwienbacher (2010). The former find reputable underwriters to be associated
with equity IPOs priced further from intrinsic values, the latter, reputable lead arrangers in the
loan market to be associated with higher loan spreads. In general, our findings suggest that the
reputation mechanism does not work for the most reputable underwriters in the high-yield
segment of the bond market. Our results also corroborate Gopalan et al.’s (2011) conclusion for
the syndicated loan market—the structure of which is comparable to that of the high-yield bond
market, and in which the same banks are dominant—that the largest lead arrangers do not suffer a
loss of reputation when borrowers experience large-scale bankruptcies. As bonds underwritten by
dominant banks are associated with significantly higher downgrade and default risk, and these
banks stay on top of the league table throughout our sample period, our results seem to document
a similar pattern for the high-yield bond market. Certification may thus not be the most important
role played by large, reputable underwriters in instances of issuers for which risks associated with
placing bonds are higher and financing opportunities fewer, as is generally the case in the high-
yield bond market.6
In contrast to the most reputable (i.e. Top 3) underwriters, we find that bonds underwritten by one
of the Top 4 - Top 10 underwriters do not exhibit significantly higher downgrade or default risk.
Accordingly, bonds underwritten by one of the Top 4 - Top 10 underwriters, being significantly
6 That issuing firms’ transactional (as well as opportunity) costs may play an at least equally important role is
suggested by our first-stage regressions on lead underwriter choice (see Table 5), which find bond issue volume and
high-yield market sentiment to significantly drive the choice of a Top 3 lead underwriter.
6
less likely to be downgraded or to default, seem to be associated with lower informational costs
(and hence lower spreads). Our evidence further suggests that reputable underwriters actively
manage their evaluation standards (i.e., product quality) in response to client-specific reputational
exposure. When we restrict our sample to bonds issued by firms listed on the New York Stock
Exchange (NYSE) or American Stock Exchange (AMEX), we find the Top 3 lead underwriters to
be associated neither with significantly higher downgrade or default risk nor with significantly
higher informational costs, at bond issue. This finding, consistent with Rhee and Valdez (2009)
corroborates empirical results for the M&A market reported in Golubov et al. (2012).
Fang’s (2005) finding that more stringent criteria of prestigious banks acting as bond
underwriters reduce firms’ informational costs, which was generally consistent with earlier
empirical work that supports the traditional certification hypothesis, is contradicted by our study.
We attribute this discrepancy in results primarily to the fact that Fang (2005) and
contemporaneous studies examined bond issues in the pre-GLBA period (the 1990s and earlier)
when incentives were less adverse, owing to considerably less competition for investment
banking services. The GLBA has seemingly led reputable underwriters to reduce screening
incentives. The discrepancy between our and Fang’s (2005) results may also reflect her
examination of bond issues by larger, more visible stock-listed firms. Incentives to conduct
business properly being less adverse when underwriters face greater reputational exposure, it is
not surprising that her results are more supportive of the certification hypothesis. Finally, in
contrast to most previous studies of underwriter certification, we control for a larger number of
potential certification devices and bond features that have been shown to affect bond prices.
Controls include, among others, clawback provisions, LBOs, listing standards, seniority levels,
split ratings, and underwriter syndicates. Our analysis thus accounts for the coexistence of
certification devices and important bond features that have been neglected in earlier work. As a
7
consequence we are able to address the potential omitted variable bias in prior studies and draw
cleaner inferences about the certification role of underwriters.
The remainder of the paper is organized as follows. In section 2, we discuss the related literature
and derive testable hypotheses. An overview of the variables (including control variables)
employed in our study and the motivation for the choice of measures for bond rating performance
and underwriter reputation are provided in section 3. Data and methodology are discussed in
section 4, the multivariate analyses of bond performance and pricing in sections 5 and 6,
respectively. Our conclusions follow.
2. Literature and Hypotheses
The traditional certification hypothesis suggests that in repeat business reputable underwriters can
credibly certify issuer quality to less informed investors because they put their reputations at
stake when acting as certifiers (see, among others, Booth and Smith 1986, Titman and Trueman
1986, Allen 1990). Certification via reputable underwriters thus reduces issuing firms’
informational costs. The certification mechanism works because reputable banks set stricter
evaluation standards, that is, they incur higher costs to become insiders of the firms they certify
(Chemmanur and Fulghieri 1994). But because information production and stricter evaluation
standards are costly, moral hazard problems can occur. Chemmanur and Fulghieri’s (1994) model
documents that very prestigious underwriters - i.e. underwriters that incurred high costs in the
past to build up reputation - can have incentives to abuse their reputation, a phenomenon that the
authors describe as “reputation milking”. Specifically, high-reputation underwriters reduce the
cost of becoming insiders by lowering underwriting standards below the level their reputations
would suggest to outside investors. As a result, high-reputation underwriters can be associated
8
with high probabilities of incorrect evaluations.7 Recently, Chemmanur and Krishnan (2012)
further suggest the potential for collusion between issuers and large, reputable underwriters that
are able to attract, through their market power, a greater number of professional and retail
investors. In this case, the underwriters’ main role shifts from certifying quality to obtaining the
highest possible valuation for a security issue. The authors term this the market-power hypothesis
and provide empirical evidence using data on equity IPOs. They show IPOs backed by high-
reputation underwriters to be priced higher and further from intrinsic values. These results are in
line with those of other recent studies of the equity market that challenge the certification
hypothesis (e.g., Cooney et al. 2001, Logue et al. 2002).
With respect to corporate bonds, Fang (2005) provides empirical support for the certification
hypothesis for the 1991-2000 period. Controlling for endogenous matching between bond issuers
and lead underwriters, she finds that reputable underwriters reduce issuing firms’ informational
costs and earn economic rents on reputation. Livingston and Miller (2000) and Datta et al. (1997)
find reputable underwriters to have a significantly negative effect on bond yields, but their studies
do not account for self-selection. Results for the syndicated loan market are less conclusive.
Ross’s (2010) finding for the 2000-2003 period that the most dominant lead arrangers have a high
reputation for screening borrowers is inconsistent with Gopalan et al.’s (2011) results for the
1990-2006 period. The latter authors’ finding that the most dominant lead arrangers do not suffer
reputational losses (i.e., limited future syndication activity) when their borrowers experience
large-scale bankruptcies supports the market-power hypothesis and is corroborated by McCahery
and Schwienbacher (2010), who find reputable lead arrangers to be associated with significantly
higher loan spreads between 1987 and 2005.
7 Mathis et al. (2009) support, theoretically, the idea that certifiers with sufficiently good reputations “milk” those
reputations, and demonstrate the reputable rating agencies have incentives to inflate their ratings.
9
Results on underwriter certification may differ between the pre- and post-GLBA periods,
particularly for the corporate bond market, in which competition increased most strongly around
and after GLBA and was accompanied by sharp declines in underwriting fees (see, e.g., Gande et
al. 1999, Shivdasani and Song 2011). These observations are particularly important inasmuch as
Strausz (2005) shows honest certification to require high prices and monopolistic market
structures, in the absence of which, he argues, certifiers will be incentivized to accept bribes to
certify product or issuer quality. This is in line with Shapiro’s (1983) reasoning that it does not
pay to build a reputation for quality for products that need to be sold at a price level that
precludes earning reputation rents. Bouvard and Levy’s (2009) model is consistent with Mathis et
al.’s (2009) in documenting incentives for reputable certifiers to lower their evaluation standards
to attract future clients. Both models predict that competition reduces certifiers’ incentives to
maintain high-cost evaluation standards to protect their reputations.8
In sum, while evidence for the corporate bond market pre GLBA supports the certification
hypothesis, results of recent studies of the equity and syndicated loan markets are more consistent
with the market-power hypothesis. It is thus an empirical question whether certification in the
bond market works in the post-GLBA period. For the following reasons, this question is
particularly interesting for the high-yield segment of the bond market. On the one hand,
competition for underwriting services has been strongest in this segment (see, e.g., Gande et al.
1999) and market consolidation has produced large, and more dominant, banks (see, e.g.,
8 In line with these theories, empirical studies have documented aggressive fee schedules (Song 2004) and analyst
recommendations (Ljungqvist et al. 2006, Michaely and Womack 1999) to win underwriting mandates interpretable
as liquidations of reputation capital. With respect to the effect of competition on the quality of certification, Becker
and Milbourn (2011) find that, with increased competition resulting from the strengthening of Fitch as the third large
rating agency, the quality of credit ratings by incumbents Moody’s and Standard & Poor’s deteriorated significantly.
10
Ljungqvist et al. 2006). On the other hand, certification of issuer quality should be most
important for issuers and investors in this segment as high-yield bonds are information-sensitive,
low-liquidity securities not exclusively sold on credit ratings (see, e.g., Datta et al. 1997, Fridson
and Garman 1998, Puri 1999, Duarte-Silva 2010). Consequently, we test whether the certification
hypothesis can be supported for the post-GLBA high-yield bond underwriting market. If the
hypothesis holds, we expect reputable underwriters to be associated with superior bond rating
performance and the firms they certify with lower informational costs reflecting better
underwriting standards and screening incentives. We thus hypothesize as follows.
H1: High-yield bonds underwritten by reputable underwriters are associated with significantly
lower downgrade and default risk.
H2: Reputable underwriters reduce issuing firms’ informational costs, that is, they credibly
certify issuer quality in the high-yield bond market.
3. Variables Employed
In our analysis of the corporate bond market we take on the investors’ point of view, which is in
contrast to most of the existing literature (most papers, such as Fang (2005), put a focus on the
issuing firm). Therefore, we investigate in a first step which factors influence the rating
performance of high-yield bonds, whose investors are particularly affected by information and
default costs. This way, we attempt to answer the question of whether reputable/powerful lead
underwriters and their certification standards are informative to investors and whether the latter
benefit from certification in the short and long run. We then consider the determinants of firms’
borrowing costs at issuance in a second step to analyze whether underwriters certify issuer
quality and reduce issuers’ informational costs. In the analyses we control for multiple
certification mechanisms to avoid a potential omitted variable bias. Definitions of and

11
motivations for the variables we employ are provided below. Rating performance measures are
presented in section 3.1. We provide an overview of the largest underwriters in the U.S. bond
market and derive our measures for underwriter reputation and power in section 3.2. Control
variables are described in section 3.3.
3.1. Measures of Bond Performance and Borrowing Costs
With regard to short- and long-term bond performance, we screen the credit rating history of each
bond in our final sample via Capital IQ and construct binary variables related to the bonds’ rating
actions.9 The first, second, and third variable (denoted downgrade first 6/15/24 months) are set to
one if the bond’s credit rating was downgraded within the first six, 15, or 24 months,
respectively, of bond issue.10 This set of variables is used to measure short-term performance. To
measure medium- to long-term performance, we use a dummy set to one if a bond’s first rating
action within the first three years of issue is a downgrade (as opposed to an upgrade) (1st rating
action downgrade 3yrs), and a binary variable set to one if a bond’s first rating action,
independent of length of time since issue, is a downgrade (1st rating action downgrade). For
purposes of robustness, we also consider the first four years and first five years after bond issue.
The use of these variables is motivated by the literature on credit ratings. Lando and Skødeberg
(2002) and Güttler and Wahrenburg (2007), among others, show credit ratings to exhibit a 9 We define rating actions as upgrades or downgrades of credit ratings; watch-list actions and so forth are not
considered. Klein and Zur (2011) recently used variables for credit-rating actions to measure the impact of hedge
funds on bond performance.
10 In line with practitioners’ statements, we use these periods because reputable underwriters usually (try to) ensure
that the bonds they promote do not experience a downgrade within at least six and for as much as 12 months after
bond issue. For robustness purposes, we consider downgrades within the period of three years of bond issue
(downgrade first 3 yrs) and create a binary variable set to one if a bond’s rating is upgraded within 15 months
(upgrade first 15 months).
12
positive serial correlation when the initial rating change is a downgrade. We further find, when
we scan our sample, a strong tendency towards subsequent rating changes in the direction of the
initial change.11 As a last measure, we use an indicator variable (default) set to one if a bond
defaulted (the necessary rating history information ends in 2010). The use of default-related
variables to measure bond and firm performance is well established in the literature (see, for
example, Altman 1989, Puri 1994, and Gopalan et al. 2011). We use a continuous rating-
performance measure as an alternative to the aforementioned binary variables. For the first three
years after bond issue, and for the entire observation period (ending in 2010), we create for the
respective periods two variables defined as the number of downgrades minus the number of
upgrades (denoted downgrades minus upgrades (3yrs)).
With respect to the suitability of using rating-related variables to measure bond performance, the
existing literature shows rating downgrades, as opposed to upgrades, to have a significant
negative effect on bond prices (Wansley et al. 1992, Hand et al. 1992, Hite and Warga 1997).
Most studies report these effects to be particularly strong for bonds and issuers in the high-yield
bond segment. In this regard, Jorion et al. (2005) found that the exemption of rating agencies
from regulation FD (Reg FD) in 2000 afforded credit analysts at rating agencies access to
confidential information no longer available to other investors.12 They show that the information
content of credit ratings and price effect of downgrades increased significantly subsequent to the
introduction of Reg FD.
11 We provide evidence for the serial correlation of rating downgrades in our sample in specification 6 of Table 7.
12 Regulation Fair Disclosure, enacted in 2000 by the Securities and Exchange Commission (SEC) to eliminate
selective disclosure to privileged parties, requires that non-public information disclosed by U.S. public companies to
selected groups be simultaneously disclosed to the public. Disclosure of non-public information to rating agencies
was excluded from this rule until enactment of the Dodd-Frank Act (specifically, Section 939B) in 2010.
13
The structure of the investor base in the high-yield market, together with well documented price
reactions to rating downgrades, provide the rationale for using bond-rating variables. According
to Standard & Poor’s (2007), the largest groups of investors are mutual funds (35%), pension
funds (25%), and insurance companies (16%); CBOs/CDOs, hedge funds, and retail investors
comprise the balance. Not only are most of these groups long-term investors, but the three largest
investor groups are also strictly regulated with respect to investment in bonds. For example,
regulators demand that capital requirements for investments made by insurance companies be
based on a rating scoring system.13 Hence, rating downgrades either incur immediate costs due to
enhanced capital requirements or increase the probability of future costs in the event a notch-wise
downgrade does not directly engender a change in rating class (e.g., from BB to B). Additionally,
mark-to-market accounting can lead to costs associated with necessary write-downs. Finally, as
noted in Kisgen (2006), liquidity concerns are most significant in the speculative-grade bond
segment. Accordingly, Alexander et al. (2000) find that credit ratings affect bond liquidity in the
high-yield segment. As lower credit ratings are generally associated with less liquidity, rating
downgrades can increase the investors’ liquidity risk. In this context, Bao et al. (2011) document
that liquidity significantly affects bond yield spreads. In sum, rating-downgrade variables are
highly important to investors, are not affected by bond liquidity (whereas prices are), and
incorporate inside information for the sample period.
To measure firms’ borrowing costs, we use each bond’s initial benchmark spread, being the at-
issue yield spread in basis points over a U.S. Treasury security with similar maturity on the same
day (similar to Guedhami and Pittman 2008, and Livingston and Miller 2000).
13 For capital requirements, a credit rating of BB, assigned a value of 3, of B, assigned a value of 4, and of CCC,
assigned a value of 5, are associated with specific amounts of capital backing. For an overview of the use of credit
ratings in regulation, see Kisgen (2006).
14
3.2. League Tables and Measures of Underwriter Reputation
Before defining our measures of underwriter reputation (or, put differently, market power), we
present in Table 1 an overview of the largest underwriters in the U.S. bond market between 2000
and 2008 (our sample period). The source of the data is Bloomberg.
[Insert Table 1 about here]
Table 1 provides summary statistics for the ten largest (Top 10) underwriters in the U.S.
corporate bond market and identifies their respective league table positions in both the high-yield
and overall (including all, not only corporate, bond issues) bond markets. Although there is some
variation in the league table positions among the top 10 underwriters, the same ten banks appear
in each of the reported rankings.14 The two largest underwriters by market share, and the only
banks with double-digit market shares, J.P. Morgan Chase and Citi, hold the top two positions in
all three reported league tables. These underwriters have almost twice the market share held by
the underwriters in positions 3 and 4 in the corporate bond market. This market structure is
similar to that of the syndicated loan market, which is dominated by three lead arrangers, J.P.
Morgan Chase, Citi, and Bank of America (see Ross 2010). The same three banks hold the top
three positions in the high-yield bond underwriting market.
14 The market share held by the top 10 underwriters in the corporate bond market between 2000 and 2008 amounts to
nearly 90%. This is only slightly less than the market shares for the top 10 bond underwriters reported in Fang (2005)
and Livingston and Miller (2000) for the 1990s. Due to considerable market consolidation and entry by European
banks such as Deutsche Bank and UBS around and subsequent to the repeal of the Glass-Steagall Act in 1999 (see,
for example, Ljungqvist et al. 2006), the league table presented here differs from those presented in Fang (2005) and
Livingston and Miller (2000). Reflecting increased competition, the underwriter fees documented in Table 1, which
average 0.68%, are lower than those reported in Fang (2005) for the ten largest underwriters in the 1990s, which
average 1.06%.
15
We follow the literature (e.g., Ross 2010, Fang 2005) and measure a lead underwriter’s
reputation via its position in the league table for U.S. bond underwriters. We use primarily the
league table for all U.S. corporate bonds issued between 2000 and 2008 (as shown in Table 1). A
lead underwriter is classified as reputable (or powerful) if it is ranked among the top 3 in the
league table (variable denoted Top 3).15 This classification is applied in Ross (2010) and
McCahery and Schwienbacher (2010) who use a “Big 3” variable to measure lead arranger
reputation in the syndicated loan market. Due to the structure of the corporate bond underwriting
market described above, we follow the authors and also employ a Top 3 variable as our primary
measure. For purposes of robustness, we use several alternative classifications. First, in line with
Schenone (2004), we use a lead underwriter’s annual market share of U.S. corporate bond
underwriting (i.e., a continuous variable). Second, to account for the dominance of the two largest
bond underwriters, we employ, in unreported regressions, an indicator variable Top 2. Following
Fang (2005) and Livingston and Miller (2000), respectively, we use, in additional unreported
regressions, Top 8 and Top 10 indicator variables. To distinguish Top 3 from underwriters in the
group of the top 10 banks with lesser reputations, we use the dummy variable Top 4 - Top 10.
Third, we use the variable Top 3 annual set to one if a lead underwriter holds one of the top 3
positions in the annual league table for all U.S. corporate bonds in the year of bond issue. Finally,
again in unreported regressions, we use Top 3 indicator variables based on league tables for the
sample period for U.S. high-yield bonds (Top 3 HY) and all U.S. bond issues, not only corporate
bonds (Top 3 all). We follow Fang (2005) in defining the reputation of underwriter syndicates
with several reputable lead underwriters as the maximum of their lead underwriters’ reputations.
15 The use of a binary variable to measure reputation is necessary to adapt a variable for possible self-selection bias.
Besides, using a continuous variable for reputation, because it is required to measure reputation with precision and
have a constant effect on the dependent variables (see Fang 2005), is not preferable econometrically.
16
Our rationale for using annual underwriter market shares of the year of the bond issue (in
robustness tests) is that we want to capture the effects of lead underwriters’ efforts to generate
business to maintain or enhance their league table positions on the performance of the issued
bonds. The use of league tables for the sample period may instead reflect underwriters’ high
reputations and dominance in the bond market. Both league table competition and high
reputation/dominance can have adverse effects on underwriters’ certification standards and
screening efforts, as pointed out in section 2.
3.3. Control Variables
Our set of control variables, and motivation for our choice of measures for other certification
devices in the bond market, are described below.
Credit ratings: We examine the effects of two credit-rating variables on the pricing and
performance of corporate bonds. We use Standard & Poor’s (S&P) issue-specific credit rating on
notch level (rating) (e.g., Guedhami and Pittman 2008) and an indicator variable split rating
(Santos 2006, Livingston et al. 2008, Livingston and Zhou 2010) that takes a value of one if a
bond’s initial issue-specific S&P and Moody’s credit ratings differ. For robustness, we follow
Fang (2005) in using issue-specific credit ratings by Moody’s instead of S&P.
Number of underwriters: Cook et al. (2006) document underwriting syndicates to be important
for the marketing of securities, as underwriters engage in promotional efforts that can elevate
investor sentiment. Such marketing activity can be particularly important for high-yield bonds, as
placement issues incur relatively high risk for issuing firms and lead underwriters. Syndicate
members may produce information about an issue and engage in marketing activity. Corwin and
Schultz (2005) show offer prices in equity IPOs to be more likely to be revised in response to
information when syndicates have more underwriters. Shivdasani and Song (2011) find, in the
corporate bond market, that underwriters’ reputation-based incentives to screen issuer quality are
17
weakened by free-riding problems among the banks in underwriter syndicates. The foregoing
evidence suggests that syndicate size may affect both bond rating performance (via screening
incentives) and initial pricing (via information production and marketing). Hence, as in Puri
(1996), we control, in all regressions, for a bond’s number of underwriters (number
underwriters). For robustness, we use (in unreported regressions) the number of lead
underwriters.
NYSE/AMEX listing: According to Affleck-Graves et al. (1993), the minimum listing
requirements (e.g., timeliness of disclosure) for firms listed on the NYSE or AMEX are
substantially higher than for other listed firms. Moreover, several provisions of the corporate
governance standard exceed SEC requirements.16 Being listed on the NYSE or AMEX thus
certifies that a firm meets the exchanges’ quantitative and qualitative listing standards. Baker et
al. (1999) further find that NYSE listings are associated with increased firm visibility. We thus
assume both ex-ante and ex-post uncertainty and, hence, the borrowing costs of these firms to be
lower when they act as issuers in bond markets. Empirical evidence provided by Datta et al.
(1997) suggests that being listed on the NYSE or AMEX reduces borrowing costs in initial public
offerings of corporate bonds. We further expect, as a result of reduced uncertainty, rating
agencies’ initial ratings of bonds issued by firms listed on the NYSE or AMEX to be more
appropriate and the probability of subsequent corrections consequently lower.
Other controls: In addition to the aforementioned variables, we use several variables that have
been shown to impact initial yield spreads of high-yield corporate bonds and that we expect to
have an impact on bond performance. We control for callable bonds (using the variable callable)
(Livingston and Miller 2000), first-time issuer status (Gande et al. 1999), the BofA/Merrill Lynch
high-yield (HY) index spread over 10-year Treasuries (Fridson and Garman 1998), bond maturity 16 For instance, the number of outside directors or representation of independent directors on the audit committee.
18
(Helwege and Turner 1999), subordinated bonds17 (John et al. 2010), treasury spread, defined as
the yield differential of 10-year to 3-month U.S. Treasuries on the date of bond issue (Fridson
and Garman 1998), and zero or step-up coupon bonds (Fenn 2000). We also control for the
following, to date little researched, variables: equity clawback provisions (Goyal et al. 1998,
Daniels et al. 2009), leveraged buyouts (LBOs),18 and SEC Rule 144A issues (Fenn 2000,
Livingston and Zhou 2002). We control in all regressions for economic and industry effects using
indicator variables for years and industries (first-digit SIC codes). Although credit ratings should
largely capture accounting information, for purposes of robustness we control in some
regressions for issuing firm size (logarithm of total assets), leverage, and EBITDA margin. These
regressions contain fewer observations because, owing to the inclusion of private firms, we are
unable to obtain accounting data for all issuing firms in our sample. In unreported regressions, we
further control for public issuers (Livingston and Miller 2000) and whether a bond issuer
employs a Big 4 auditor (Deloitte Touche Tohmatsu, Ernst & Young, KPMG, and PWC) in the
17 Guedhami and Pittman (2008) and John et al. (2010) argue that evidence that subordinated bonds exhibit lower
initial yield spreads relative to senior bonds with similar credit ratings reflects Moody’s and Standard & Poor’s rating
policy of generally notching down subordinated bonds by two (S&P) or even three (Moody’s) notches relative to
senior bonds. Market disagreement regarding this practice can result in a correction being reflected in the initial yield
spread.
18 Saunders and Steffen (2011) document loan deals with private equity firm participation to be associated with
significantly higher costs. We control for LBOs using two indicator variables. We assign the value of one to the
variable LBO-5+5 if the issuing firm became the target of an LBO five years prior to or after the bond issue, and to
the indicator variable LBO-7 if the issuing firm became the target of an LBO up to seven years before the bond issue
date. We obtain data on LBOs from the Capital IQ database.

19
year of bond issue (similar to Guedhami and Pittman 2008).19 We use the NYSE/AMEX dummy
instead of the variable public to account for exchange-listed bond issuers, and, due to their high
correlation (0.71), do not use the two variables together in our main regressions.
Table 2 lists and defines all variables used in our analyses. Pair-wise correlations of the main
variables are shown in Table 3.
[Insert Tables 2 and 3 about here]
4. Data and Methodology
4.1 Sample Construction and Summary Statistics
Data on original U.S. high-yield corporate bonds issued between January 1, 2000 and September
15, 2008 (the Chapter 11 filing date of Lehman Brothers) with an available credit rating history
are collected from the Capital IQ (CIQ) database that provides rating histories for most bonds. In
line with prior research, we exclude convertible debt as well as bonds issued by financial
institutions. We check the data using Bloomberg to ensure that bonds are non-convertible,
original speculative-grade issues. We end up with a sample of 635 high-yield bond issues for
which initial bond prices and credit ratings are provided. Information about these bonds and the
respective issuers, such as first-time issuer status and initial split, is largely manually acquired
from the debt histories available in CIQ. Excluding all bonds for which we are unable to gather
full information leaves us with a final sample of 607 high-yield corporate bonds. The number of
19 Although some studies document that reputable auditors lower firms’ cost of debt (Mansi et al. 2004, Pittman and
Fortin 2004), the variable Big 4 auditor is, for the following reasons, used only in additional robustness checks. First,
information about the auditors employed is available for fewer than 590 bond issues, which would significantly limit
the number of observations in our regressions. Second, the variable Big 4 auditor has a sample mean of 0.94, that is,
virtually all bond issuers employ a reputable auditor. Third, it was recently shown by Guedhami and Pittman (2008)
that Big 4 auditors do not affect yield spreads or credit ratings of Rule 144A bonds.
20
issuing firms being 374, on average, each firm in our sample issues 1.6 bonds. As our sample
contains private issuers, full accounting and auditor data is not available for all observations.
Summary statistics including bond features and bonds’ initial credit ratings and rating
performance measures as well as issuer and underwriter characteristics are provided in Table 4,
which also provides an overview of descriptive statistics for the overall sample (column 1) and
arithmetic means for the groups of bonds that are (column 2) (are not, (column 3)) underwritten
by one of the Top 3 lead underwriters in the U.S. corporate bond market (variable Top 3). Results
of a t-test for differences in means between the two subsamples are reported in the last column.
[Insert Table 4 about here]
With regard to the main bond characteristics, we report a mean issue volume for the bonds in our
full sample of 289 million USD and a mean time to maturity of 93 months (about 7.7 years).
These numbers are comparable to the numbers reported in the (limited) existing empirical
literature using high-yield bond data. Alexander et al. (2000) report an average volume of 396
million USD and average time to maturity of 7.3 years for high-yield bonds traded on
NASDAQ’s FISP system. Fenn (2000) reports an average volume of 196.5 million USD and
average time to maturity of 9.8 years using data from the Securities Data Company (SDC). The
results of the differences in means tests reveal that bonds underwritten by Top 3 lead
underwriters, as compared to less reputable underwriters, are significantly larger in terms of
issuance volume (327 million vs. 256 million USD) but similar with respect to maturity. Except
for callability and clawback provisions, bonds in the two subsamples do not differ significantly
with respect to other bond characteristics.
Turning to bonds’ credit ratings and issuing firms’ characteristics, we document that 59% (28%)
of the high-yield bonds we examine have an at-issue credit rating of B (BB), slightly below the
fraction of 63% Fenn (2000) reports for the B-rated bonds in his sample. Further, 62% of the
21
bonds in our sample are issued by public firms. This number, while slightly lower, corresponds to
the fraction of about 70% in Fenn (2000). As we attempt to control for other certification devices
and factors that influence bond performance, we further gather information about whether a bond
is issued by a firm listed on the NYSE or AMEX and whether an issuer was the target of a
leveraged buyout (LBO) in the five years before or after bond issue. We find that 45% of the
bonds in our sample are issued by firms listed on the NYSE or AMEX and 20% of the bonds are
issued by firms targeted in an LBO in the five years before or after bond issue. The comparison
of subsamples by lead underwriter reputation reveals that bonds underwritten by one of the Top 3
underwriters are more frequently issued by public (69% vs. 56%) and NYSE/AMEX-listed (51%
vs. 40%) firms and less frequently issued by first-time issuers (17% vs. 27%). In addition, we
find underwriting syndicates led by Top 3 underwriters to be significantly larger (3.41 vs. 2.91).
The above comparison of the most important bond and issuer characteristics suggests that our
sample is representative of the population of U.S. high-yield bonds. The results of the tests for
differences in means reported in the last column of Table 4 reveal significant disparities between
bonds underwritten by Top 3 lead underwriters and those underwritten by underwriters with
lesser reputations. These differences are consistent with the differences between bonds
underwritten by reputable and less reputable underwriters reported in earlier studies such as Fang
(2005). The well-recognized issue of selection in the underwriting process is thus apparent in our
data. We address this issue in the next section and throughout our econometric analyses.
Before turning to the multivariate analyses, we discuss the effect of lead underwriters’
reputation/market power on the rating performance of the bonds in our sample. The univariate
results in Table 4 suggest significantly higher probabilities of downgrades in the short run for
22
bonds underwritten by Top 3 lead underwriters.20 In line with these findings, bonds underwritten
by more reputable underwriters experience significantly more downgrades than upgrades within
the first three years of bond issue (see the variable downgrades minus upgrades 3yrs). It is hence
not surprising that these bonds are also more likely to be downgraded and to default in the
medium to long term (see the variables 1st rating action downgrade (3/4 yrs) and default).
4.2 Issuer-Underwriter Matching
The foregoing results on subsample differences indicate that matching between a bond issuer and
lead underwriter is not a random process. In fact, Top 3 lead underwriters, on average, underwrite
bonds that differ significantly from those underwritten by underwriters with lesser reputations.
This may cause endogeneity problems in econometric analyses investigating the role of reputable
lead underwriters in the form of omitted variable bias due to self-selection. We address the well-
recognized issue of endogenous matching using a Heckman (1979) two-stage approach in the
manner of Ross (2010), Schenone (2004), and Puri (1996).21 We estimate in the first stage of the
Heckman approach selection equations for bonds’ most reputable lead underwriters following the
different definitions of underwriter reputation as defined in section 3.2. Specifically, the
dependent variables in the five selection equations are Top 3, Top 4 - Top 10, Top 3 annual, Top
20 As shown in Table 4, six percent of the bonds in our sample witness a rating downgrade within the first six months
after bond issue. The fraction is eight percent if a bond is underwritten by a Top 3 underwriter, while it is only four
percent for bonds underwritten by less reputable banks. Considering downgrades within 24 months after bond issue,
41 percent of the bonds underwritten by Top 3 underwriters witness at least one downgrade in two years, while the
fraction is only 26 percent for less reputable banks. The differences are not only economically meaningful, but also
statistically significant as indicated by the differences-in-means t-tests.
21 This approach is used in such other recent studies as Fernando et al. (2012), Golubov et al. (2012), and McCahery
and Schwienbacher (2010). Fang (2005) is the only study on certification in security markets (to the best of our
knowledge) that uses a switching regression model, i.e. a generalization of the Heckman approach.
23
3 all, and Top 3 HY. We then construct from these regressions inverse Mills ratios that are added
as control variables in the second-stage (OLS and probit) regressions reported in sections 5 and 6.
As suggested by Heckman (1979), this procedure solves the omitted variable (or self-selection)
bias caused by endogenous matching.
We generally follow the literature regarding the independent variables for the underwriter
selection equations (e.g., Fang 2005, Puri 1996) and control for: credit rating class (BB, B); bond
features guaranteed, redeemable, Rule 144A, and unsecured; whether the issuer is a public firm
or a first-time issuer; and whether the issuer was the target of an LBO within seven years prior to
the bond issue. We control for high-yield bond market sentiment using the variable HY index. We
thus use in the first-stage regression a number of variables that differ significantly for reputable
underwriters and underwriters with lesser reputations, as indicated by the results in Table 4.
Furthermore, as suggested by Li and Prabhala (2007), the first-stage regressions include variables
that are not in the second-stage equations. We use bond issue volume as our main instrument for
underwriter selection, as issuing firms in the high-yield bond market typically face higher
financial and refinancing risk and fewer financing opportunities. As a consequence, they are
likely to choose larger, more reputable underwriters when they plan to issue bonds with larger
volumes. As noted in Yasuda (2005), underwriters provide two direct services, (1) insurance for
unsold securities, and (2) assistance with the marketing, pricing, and selling of securities. Large
underwriters, owing to their more extensive investor networks, more reputable co-managers, and
the larger number of market participants they can attract (Chemmanur and Krishnan 2012), are
better able to provide these services and guarantee successful placement.22 The probability of
22 Empirical evidence provided by Chemmanur and Krishnan (2012) suggests that underwriters with large market
shares can attract more (professional and retail) investors and make retail investors more optimistic about firms’
24
choosing a large, reputable underwriter will consequently increase primarily with bond volume.23
Each selection equation is estimated using probit regressions with issuer-clustered standard errors
and contains year and industry controls. The regression results are reported in Table 5.
[Insert Table 5 about here]
The results in Table 5 generally corroborate the univariate findings reported in Table 4 and our
reasoning regarding the relation between issue volume and Top 3 underwriter choice. In
particular, Top 3 underwriters tend to underwrite larger bonds that are more likely to be issued by
public firms and less likely by first-time issuers. Top 3 underwriters are also more likely to be
chosen when the high-yield market sentiment is less favorable, that is, when firms’ financing
costs are potentially higher. All of these results are consistent with economic intuition.
Furthermore, a comparison of regression specifications (1) and (2) suggests different selection
criteria for Top 4 - Top 10 relative to Top 3 underwriters and emphasizes the latter’s special role.
Top 4 - Top 10 underwriters evidently tend not to underwrite large bond volumes in the high-
yield segment in which placement risk is particularly high. The likelihood of choosing a Top 4 -
Top 10 underwriter is significantly higher, moreover, when the high-yield market sentiment is
positive, as indicated by the negative regression coefficient of the variable HY index.
future prospects. Fernando et al. (2012) report that a variable used for issue size in their first-stage regressions on
reputable underwriter choice for equity issues has a large impact significant at the 1% level.
23 The significant positive correlation of 0.2 between the variables volume and Top 3 corroborates our reasoning (see
Table 3). In the event the variable volume measures effects not fully controlled for in the second-stage regressions, it
might not be a valid exclusion restriction. However, as recently noted in Golubov et al. (2012), exclusion restrictions
are not critical in the Heckman selection procedure (see also Li and Prabhala 2007).
25
5. Empirical Findings: Bond Performance and Lead Underwriter Reputation
In this section, we attempt to answer the question of whether certification via reputable lead
underwriters is beneficial or detrimental to bond investors. In particular, we test our first
hypothesis (H1) as presented in section 2. Therefore, we run multivariate analyses that test
reputable/powerful (Top 3) lead underwriters’ association with poor rating performance for high-
yield corporate bonds indicated by the univariate results presented in Table 4. Specifically, we
test hypothesis 1 by investigating the effect of reputable lead underwriters on bond rating
performance via probit regressions. We examine short-term bond performance using the three
variables downgrade first 6/15/24 months as dependent variables in section 5.1, medium- to long-
term bond performance using the three variables 1st rating action downgrade 3yrs, 1st rating
action downgrade, and default in section 5.2. Besides running basic probit regressions using the
continuous variable market share annual to measure lead underwriter reputation, we run probit
regressions in which we use the binary variable Top 3 and control for the Mills ratio (variable
Mills Top 3) that results from the first-stage regressions described in section 4.2 and shown in
Table 5. Additionally, in the spirit of Heckman (1979), we run “Heckprob” models that use a
maximum-likelihood (ML) estimation approach to simultaneously estimate first- and second-
stage regressions. The Heckprob approach calculates a Wald (Chi-square) test for independent
equations that indicates whether the first- and second-stage regressions can be estimated
independently. We report the resulting Wald test statistics in the regression tables. The Wald test
of independent equations is insignificant (except for specification (5) in Table 6, for which the
Wald test returns a p-value of 9.7%), which suggests that the error terms are not considerably
correlated and the two binary regressions can be run independently. Finally, in section 5.3, we
run OLS and two-stage Heckman regressions on the dependent variables downgrades minus
upgrades 3yrs and downgrades minus upgrades, defined as the number of downgrades minus the
26
number of upgrades within the first three years of bond issue, and over the lifetime of the bond,
respectively.
In the following, we estimate regressions in the form of equation (1) using either probit (sections
5.1 and 5.2) or OLS (section 5.3) regressions with the dependent variables (yi) described above.
yi = c0 + c1 Top 3i + c2 Number Underwritersi + c3 NYSE/AMEXi + c4 Ratingi + c5 Split Ratingi + Controls + ei (1)
5.1. Short-term Bond Performance
The regression results for short-term bond performance presented in Table 6 suggest that
reputable lead underwriters are associated with significantly poorer bond performance,
corroborating the univariate results reported in Table 4. To facilitate interpretation of our results,
we also report marginal effects. The probability that a bond experiences a rating downgrade is
about 3% higher within the first six months of bond issue if it is underwritten by a Top 3 lead
underwriter (specifications 1 and 2). This effect, significant at least at the 10% level, holds as
well for the downgrade probability within the first 15 months, which is about 7% higher for
bonds underwritten by Top 3 lead underwriters (specification 4). Within the first 24 months
(specifications 5 and 6), we find Top 3 lead underwriters to be associated with a 15% higher
downgrade probability, significant at the 1% level. When we measure reputation by the lead
underwriter’s annual market share (specifications 3 and 7), that is, using a continuous variable,
the results remain significant at least at the 5% level.
[Insert Table 6 about here]
We find with regard to our control variables that both credit-rating variables, rating (which
measures default risk) and split rating (which measures ambiguity in the rating process), have a
significantly positive effect on the probability of a bond rating downgrade within six and up to 24
months after issue. This result is in line with Livingston et al. (2008), who report that bonds with
27
initial split ratings exhibit a significantly higher probability of future rating revisions. Our finding
of a significantly lower downgrade probability, particularly in the first six months, for bonds with
longer maturity corroborates Helwege and Turner’s (1999) results that high-quality issuers in the
low-grade bond segment issue longer-maturity debt.
5.2. Medium- to Long-term Bond Performance
Regression results for medium- to long-term bond performance are presented in Table 7.
[Insert Table 7 about here]
Again, we look first at the effects of reputable lead underwriters. As can be seen in Table 7, the
variable Top 3 has a positive impact on the probability of a bond’s first rating action being a
downgrade, both within the first three years of issue (specifications 1 and 2) and in general
(specification 4). The corresponding coefficients of the Top 3 variable are significant at the 1%
level in all of these regressions. Marginal effects amount to approximately 18% for the three-
year, and 15.5% for the general probability of experiencing a rating downgrade as the first rating
action. Specifications (5) and (6) further suggest that bonds underwritten by Top 3 lead
underwriters are also more likely to default. The corresponding regression coefficients are
significant at the 1% and 5% level, respectively. Marginal effects for default probability are about
2%. Results remain significant at the 5% level when we use the variable annual market share
instead of the Top 3 dummy (specifications 3 and 7).
With respect to control variables, we provide empirical support for the serial correlation of rating
downgrades noted in section 3.1. When we use the variable 1st rating action downgrade 3yrs as
an explanatory variable in specification (6), the corresponding coefficient is positive and
significant at the 1% level. Similar results are obtained in unreported regressions in which we use
other rating downgrade variables. Regarding the credit rating variables rating and split rating, we
again document that both have a significantly positive impact on the downgrade probability
28
measures. However, in line with the literature and economic intuition, we find the variable rating
(which increases with better credit ratings) to have a significantly negative effect on default
probabilities in specifications (5)-(7). LBOs within five years prior to or after bond issue have a
significantly positive effect on downgrade probability, as indicated by the variable LBO-5+5
(specifications 1-4). Finally, we find bonds issued by firms listed on the NYSE or AMEX to be
less likely to experience rating downgrades and defaults. When we add, in unreported
regressions, the variable public, this effect remains significant at the 5% level, while the public
dummy is not significant. Results are similar when we use default as the dependent variable.
5.3. Downgrades minus Upgrades
Table 8 presents the regression results for the variables downgrades minus upgrades 3yrs and
downgrades minus upgrades. A positive value of one of these variables indicates that a bond had
more downgrades than upgrades over a given period of time (either the first three years after
bond issue or the entire observation period). Okashima and Fridson (2000) show that a ratio of
downgrades to upgrades has high explanatory power in the high-yield corporate bond market for
changes in default rate two to three quarters later.24 In this regard, we find in unreported
regressions that our variable downgrades minus upgrades 3yrs is positive and significant at the
1% level when included as an explanatory variable in the default regressions shown in Table 7
(specifications 5 and 6). It thus appears to be a good measure of default risk.
24 As some bonds in our sample do not have any downgrades or upgrades, we cannot use a simple downgrade-to-
upgrade ratio without losing observations. We thus use the difference between downgrades and upgrades. In
unreported probit regressions, we use as the dependent variable an indicator variable set to one if the number of
downgrades exceeds the number of upgrades. Results of these regressions corroborate the findings shown in this
section. When we run Tobit instead of OLS regressions, results shown in Table 8 do not change. Finally, using the
downgrade-to-upgrade ratio and fewer observations (not reported), results remain in line with those in Table 8.
29
[Insert Table 8 about here]
The results in Table 8 provide strong support for our univariate findings in Table 4, and
corroborate the foregoing results on downgrade and default probabilities. In particular, we find
that bonds underwritten by Top 3 lead underwriters experience considerably more downgrades in
the first three years after issue. The regression coefficient of the Top 3 variable is significant at
the 1% level in specifications (1) and (3), and remains significant at the 5% level when we
control for issuing firms’ accounting data in specification (4). Even when we consider
downgrades minus upgrades over the entire lifetime of a bond in specification (7), in which we
examine only bonds issued between 2000 and 2003 (i.e., with a rating history of at least seven
years), the coefficient of the Top 3 variable remains significant at the 10% level.
Two additional findings merit mention. As specification (5) shows, the significant increase in the
number of downgrades is driven by the most reputable/powerful (i.e., the Top 3) underwriters.
When we use the dummy Top 4 - Top 10 (for underwriters with lesser reputations/dominance
among the top 10 of the sample-period league table for corporate bonds), we find the
corresponding regression coefficient to be negative and significant at the 1% level (controlling
for endogeneity). In unreported regressions, we further find the indicator variable Top 10 to be
insignificant when used to explain the number of downgrades minus upgrades. This suggests that
the poor rating performance is a specific phenomenon of bonds underwritten by the most
reputable or most dominant bond underwriters. The findings for Top 3 and Top 4 - Top 10
underwriters together provide empirical evidence for the U-shape between underwriter reputation
and evaluation standards posited, theoretically, in Chemmanur and Fulghieri (1994). Second,
when we examine only bonds issued by firms listed on the NYSE or AMEX (i.e., by larger, more
visible issuers), we find that the regression coefficient of the Top 3 variable loses statistical
significance (specification (6)). This finding is in line with the reasoning that banks have stronger
30
incentives to conduct business properly when reputational exposure is greater (Rhee and Valdez
2009), and corroborates Golubov et al.’s (2012) findings for the M&A market. In the context of
our study, this suggests that reputable underwriters adjust the quality of their underwriting
standards in response to client-specific reputational exposure, a conclusion supported by the
results of additional unreported regressions. The coefficient estimate of the variable Top 3 loses
magnitude and statistical significance in all short-term and medium- to long-term regressions
described in sections 5.1 and 5.2 when we restrict the sample to firms listed on the NYSE or
AMEX.
The control variables we employ reveal a picture similar to that presented in Table 7. The credit
rating variables rating and split rating both have a significantly positive impact on the number of
downgrades minus upgrades. That the latter result is again in line with Livingston et al. (2008)
who suggest that split ratings necessitate more future rating revisions. The variable LBO-5+5 is
positive throughout all reported regressions, but significant only in specifications (4)-(7). Finally,
corroborating the results reported in Table 7, we find bonds issued by firms listed on the NYSE
or AMEX to have considerably lower values for the variable downgrades minus upgrades 3yrs.
The corresponding regression coefficients of the listing dummy variable are not only largely
negative in magnitude, but also significant at the 1% level in all specifications. When added, in
unreported regressions, the variable public has a positive and insignificant regression coefficient,
whereas the effect of the NYSE/AMEX listing remains significant at the 1% level. Results are
qualitatively similar when we consider the number of downgrades minus upgrades over the
complete observation period.
5.4. Robustness
Even though we control for endogeneity in the regressions shown in Tables 6, 7, and 8, which
also show satisfying values for R-squared and significant F- and Wald-statistics, we run a large
31
number of additional tests to ensure that our results are robust and have good explanatory power.
We present first the results of robustness tests in which we include additional control variables.
We then elaborate on the use of alternative measures of bond performance and subsample
analyses. Lastly, we examine the effects of different measures and levels of underwriter
reputation. For brevity, regression results are not shown.
Additional controls: Owing to the comparatively high correlation between the variables callable
and clawback (0.58) and callable and rating (-0.56), we estimate all specifications without the
variable callable. The results in Tables 6, 7, and 8 remain unchanged. The same holds when we
control for initial bond prices via the variable benchmark spread, which should capture the sum
of all information relevant to investors. As expected, we find the coefficient of benchmark spread
to be significantly positive in all regressions. Motivated by Fang (2005), who uses Moody’s
ratings (which may differ from S&P), we use Moody’s instead of S&P issue-specific credit
ratings. We then substitute the number of all bond underwriters for the number of lead
underwriters (Shivdasani and Song 2011), that is, only underwriters actively chosen by the bond
issuer. Results remain qualitatively unchanged. Lennox (1999) having shown that large auditors
provide more accurate signals of financial distress, and may hence affect initially assigned credit
ratings and potentially improve rating performance, we run regressions including the variable Big
4 auditor. Results do not change considerably, but the Big 4 variable, although insignificant in
almost all regressions, has a negative impact significant at the 10% level on downgrade first 24
months and downgrades minus upgrades 3yrs.
Finally, for the 571 bond issues for which we have information about covenants, we control for
the number of covenants attached to a bond. We do this because reputable lead underwriters
might negotiate better terms for their clients in the form of fewer covenants, which may lead to
poor rating performance due to less monitoring. Running Poisson regressions, we find that Top 3
32
lead underwriters do not significantly affect the number of covenants attached to a bond. This
result is in line with McCahery and Schwienbacher’s (2010) finding for the syndicated loan
market. The results on rating performance do not change significantly when we include the
number of bond covenants. Only when we use the variable downgrade first 15 months as the
dependent variable is the variable Top 3 no longer significant (only at the 12% level). The
number of covenants is insignificant in virtually all regressions.
Alternative measures of bond performance and subsample analyses: When we use the four
variables 1st rating action downgrade 4yrs/5yrs and downgrade 3yrs/5yrs as dependent variables
in equation (1), the regression coefficient of the variable Top 3 is positive and significant at the
1% level in all specifications. When we use the variable upgrade first 15 months as the dependent
variable, the coefficient of the Top 3 dummy is insignificant. We acknowledge a potential for
bias against Top 3 lead underwriters in recession years because the largest underwriters are most
likely to place a bond during such periods. As bonds might experience more downgrades by
virtue of being issued in times of economic hardship, we exclude from the sample bonds issued in
the recession years 2001 and 2008. Our findings remain qualitatively unchanged. Only in the
regressions that use the two variables downgrade first 15/24 months as dependent variables does
the Top 3 variable become insignificant (15 months) or lose significance (5% instead of 1%
level). Finally, because some of our performance measures might be biased against bonds issued
early in the sample, we rerun our analyses excluding all bonds issued during the 2000-2002
period. Results remain qualitatively unchanged.
Alternative measures and levels of reputation: When we use the variable Top 3 annual (see
section 3.2) instead of Top 3, our results remain significant in all regressions except those in
which 1st rating action downgrade and downgrade first 15 months are used as dependent
variables. When we use the variable Top 3 all, the results for short-term performance lose
33
significance, but the results for medium- to long-term performance remain significant at
conventional levels. When the variable Top 3 HY is used, the results remain significant except for
the dependent variables downgrade first 6/15 months and downgrades minus upgrades. As
variation in the foregoing Top 3 variables comes only from the third rank of each league table,
even for the annual league tables (!), we rerun all regressions using the variable Top 2. Results
remain significant except for the regressions in which we use the two short-run rating
performance measures downgrade first 6/15 months as dependent variables.
With respect to different levels of lead underwriter reputation, we find the variable Top 4 - Top
10 to have a significantly positive effect on bond rating performance (i.e., downgrades are less
likely), whereas the variables Top 8 and Top 10 do not significantly affect bond performance.
This result suggests that the top 3 classification is an appropriate cut-off point, and legitimates the
use of the binary Top 3 variable as the primary reputation measure beyond statistical reasons.
5.5. Interpretation of Results
In sum, the results reported above reject our first hypothesis (H1), which states that reputable
underwriters are associated with superior underwriting standards and, hence, lower downgrade
and default risk for the high-yield bonds they underwrite. In fact, our evidence suggests that the
most reputable lead underwriters are associated with significantly higher downgrade and default
risk in the high-yield corporate bond market. The possible interpretation that these underwriters
have below-average underwriting standards, albeit at odds with the traditional certification
hypothesis, is consistent with the market-power hypothesis and anecdotal evidence presented in
the introduction. Apparently, the most reputable banks are able to underwrite low-quality (high-
risk) issues without considerably harming their reputation and market share. This finding is
consistent with Gopalan et al.’s (2011) findings for the syndicated loan market, and suggests that
the most reputable underwriters, as predicted by Chemmanur and Fulghieri (1994), actually
34
“milk” their reputations when promoting generally more opaque speculative-grade issuers.
Compared to results for the corporate bond market for the 1990s, our findings further suggest that
reputable underwriters may have lowered underwriting standards (i.e., become more lenient) in
response to increased competition, particularly in the high-yield segment of the market,
consequent to the passage of GLBA. In this regard, our findings are in line with several
theoretical models that predict a negative effect of competition on incentives for honest
certification (e.g., Bouvard and Levy 2009, Mathis et al. 2009, Strausz 2005).
6. Empirical Findings: Firms’ Borrowing Costs and Lead Underwriter Reputation
Against the background of the previous results on bond performance, we investigate in this
section the extent to which reputable lead underwriters affect bond issuers’ informational costs.
We thereby test our second hypothesis (H2), which states that reputable (Top 3) lead underwriters
can credibly certify issuer quality to investors in the high-yield bond market. Given the
significantly positive relation between lead underwriter reputation and bonds’ downgrade and
default risk, we would expect Top 3 lead underwriters to be associated not with a reduction in
issuing firms’ informational costs, but rather with higher risk-adjusted borrowing costs in an
efficient market. To measure this effect as accurately as possible and avoid omitted variable bias,
controls for other certification devices that may affect initial bond spreads are required. We also
account for the endogenous matching described in section 4.2.
6.1. Using and Interpreting Inverse Mills Ratios in Bond Pricing Equations
Before discussing the results of our bond pricing regressions, we first review the interpretation of
the inverse Mills ratio used to correct for selection bias that can result from endogenous matching
of bond issuers with lead underwriters. As explained in Puri (1996), the information revealed to
bond investors by the endogenous but (at least partly) observable issuer-lead underwriter
35
matching can be evaluated by looking at the inverse Mills ratios in the second-stage regressions.
Puri (1996) states that selectivity models like the Heckman approach can be used to control for
factors linked to underwriter type and econometrically allow for isolating the information effect
of bank underwriting. Market participants, having rational expectations about underwriters’
private information and evaluation standards, should update these expectations given the
observable matching of issuers with lead underwriters. Stated differently, investors may update
their evaluations of banks’ underwriting standards on the basis of the issuer-underwriter (i.e.,
client-bank) matching they observe. In this way, we are able to measure the effect of underwriter
certification, that is, the value of a bank’s underwriting standards. This approach is in line with
McCahery and Schwienbacher (2010) and Fang (2005), the latter measuring the effect of
underwriter certification solely by interpreting the inverse Mills ratio.
6.2. Regression Results
We report in Table 9 the regression results of estimations of equation (2), our bond pricing
equation. This equation is estimated including an inverse Mills ratio (for the issuer-lead
underwriter matching) from the first-stage regressions explained in section 4.2 and shown in
Table 5. The dependent variable is a bond’s benchmark spread (abbreviated BS).
BSi = c0 + c1 Top 3i + c2 Number Underwrit.i + c3 NYSE/AMEXi + c4 Ratingi + c5 Split Ratingi + Controls + ei (2)
[Insert Table 9 about here]
As expected, the results presented in Table 9 reject our second hypothesis (H2). In regression
specifications (2) and (3), the inverse Mills ratio for the variable Top 3 is positive and significant
at the 1% level. When the variable Top 3 annual is used, the corresponding Mills ratio is positive
and significant at the 5% level (specification (4)). As described in section 6.1, we interpret the
inverse Mills ratio as bond investors’ aggregate evaluation of Top 3 lead underwriters’
36
underwriting standards. The results are in line with the findings reported in section 5. As the most
reputable (Top 3) lead underwriters in the high-yield segment are significantly associated with
poor bond performance (i.e., higher downgrade and default risk), investors that buy bonds
underwritten by these reputable banks demand compensation. Put differently, investors demand a
premium for the higher expected risk born by an average bond underwritten by a Top 3 lead
underwriter. This is consistent with the high-yield corporate bond market being efficient. This
conclusion is supported by the finding that the regression coefficients of the variable Top 4 - Top
10 as well as corresponding Mills ratio are negative. As the Top 4 - Top 10 underwriters are not
associated with higher downgrade and default risk (but rather the opposite), investors do not
demand compensation when these banks act as lead underwriters. We document in addition to
these findings that the inverse Mills ratio remains positive, but is smaller in magnitude and no
longer statistically significant, when we restrict the sample to bonds issued by firms listed on the
NYSE or AMEX (specification 5). This finding, which is in line with the result shown in
specification (6) in Table 8, suggests that reputable underwriters, when exposed to higher
reputational risk, provide higher-quality services. This result corroborates our conclusion that
reputable underwriters adjust the quality of their underwriting standards in response to client-
specific reputational exposure, and suggests that investors are aware of this mechanism (in line
with Golubov et al. 2012). Results remain significant when we control for Big 4 auditors (in
unreported regressions using fewer observations). In these specifications, the coefficient of the
Mills ratio for Top 4 - Top 10 lead underwriters remains negative, and even becomes significant
at the 5% level.
We examine in additional unreported regressions other measures of lead underwriter reputation.
Consistent with the results reported in section 5.4, we find the inverse Mills ratio for the variable
Top 2 to be significant at the 5% level and only slightly smaller in magnitude than the variable
37
Top 3 (when compared to specification 2). When we use the variables Top 3 All and Top 3 HY
(annual), the regression coefficients of the corresponding Mills ratios are significant at the 1%
and 5% level, respectively, and larger in magnitude than the coefficient of the Top 3 variable.
When we control for Big 4 auditors, the foregoing results remain significant.
For the control variables we employ, the regression coefficients of the variables HY index,
number underwriters, rating, subordinated (except for specification 5), and zero or step-up are
all significant at the 1% level throughout the reported regression specifications. These findings
are consistent with the existing literature (see, for example, Fenn 2000, Fridson and Garman
1998, John et al. 2003, John et al. 2010, and Livingston and Miller 2000). Also in line with the
literature (Helwege and Turner 1999, Livingston and Zhou 2010), we find (in most regression
specifications) the coefficient of the variable maturity to be significantly negative and the
coefficient of the variable split rating to be significantly positive. Finally, in line with Datta et al.
(1997), the dummy variable NYSE/AMEX is significantly negative in most specifications.
However, using the dummy variable public instead (in unreported regressions), we find the
corresponding coefficient to be larger in magnitude and even more significant, even as our other
results remain unchanged.
7. Conclusions
This study deals with the benefits of certification to investors in the corporate bond market.
Specifically, it asks whether bonds underwritten by reputable lead banks are associated with
significantly higher or lower downgrade and default risk, a question no study, to the best of our
knowledge, has yet attempted to answer. We choose as the optimal test ground for our study the
high-yield segment of the bond market, in which certification is highly important to investors and
issuers. We document corporate bonds underwritten by the most reputable lead underwriters to be
38
associated with significantly higher downgrade and default risk during our sample period of
2000-2008. We further document that the most reputable underwriters increase rather than
decrease issuing firms’ informational costs. This finding is consistent with the market efficiency
hypothesis and calls into question the traditional certification hypothesis and underlying
reputation mechanism. We thus corroborate Gopalan et al.’s (2011) finding that the reputation
mechanism does not work for the most dominant banks in the syndicated loan market.
Our results, although contrary to those of earlier empirical studies that use corporate bond data
for the 1990s, are in line with recent findings for the equity and loan markets that support the
market-power hypothesis. We conclude from this that reputable banks may have lowered their
underwriting standards to deal with significantly intensified competition among underwriters
resulting from the enactment of the Gramm-Leach-Bliley Act in late 1999. This conclusion is in
line with a number of theoretical and empirical studies as well as anecdotal evidence. Some
theoretical models posit the reduction of underwriting costs or attraction of new clients as
incentives for underwriters to lower their underwriting standards and “milk” their reputations. We
provide additional evidence for these models that suggests that reputable underwriters actively
manage their underwriting standards in response to client-specific reputational exposure. Bond
investors seem to be aware of this incentive scheme, as we document information about the
issuer-lead underwriter match to have a significant and positive impact on firms’ at-issue yield
spreads. This suggests that reduction of informational costs via certification is not necessarily the
most important role reputable lead underwriters play, at least in the high-yield bond market, in
which issuing firms have fewer financing opportunities and higher placement risks. It further
suggests that underwriters may be chosen for reasons other than their certifier reputation.
39
References
Affleck-Graves, J., Hedge, S.P., Miller, R.E., Reilly, F.K., 1993. The Effect of the Trading System on the Underwriting of Initial Public Offerings. Financial Management 22, 99-108.
Alexander, G.J., Edwards, A.K., Ferri, M.G., 2000. The Determinants of Trading Volume of High-Yield Corporate Bonds. Journal of Financial Markets 3, 177-204.
Allen, F., 1990. The Market for Information and the Origin of Financial Intermediation. Journal of Financial Intermediation 1, 3-30.
Altman, E.I., 1989. Measuring Corporate Bond Mortality and Performance. Journal of Finance 44, 909-922.
Baker, H.K., Powell, G.E., Weaver, D.G., 1999. Does NYSE Listing Affect Firm Visibility? Financial Management 28, 46-54.
Bao, J., Edmans, A., 2011. Do Investment Banks Matter for M&A Returns? Review of Financial Studies 24, 2286-2315.
Bao, J., Pan, J., Wang, J., 2011. The Illiquidity of Corporate Bonds. Journal of Finance 66, 911-946.
Becker, B., Milbourn, T., 2011. How Did Increased Competition Affect Credit Ratings? Journal of Financial Economics 101, 493-514.
Booth, J.R., Smith, R.L., 1986. Capital Raising, Underwriting, and the Certification Hypothesis. Journal of Financial Economics 15, 261-281.
Bouvard, M., Levy, R., 2009. Humouring Both Parties: A Model of Two-Sided Reputation. Working Paper, McGill University.
Chemmanur, T.J., Fulghieri, P., 1994. Investment Bank Reputation, Information Production, and Financial Intermediation. Journal of Finance 49, 57-79.
Chemmanur, T.J., Krishnan, K., 2012. Heterogeneous Beliefs, IPO Valuation, and the Economic Role of the Underwriter in IPOs. Financial Management 41, 769-811.
Cook, D.O., Kieschnick, R., Van Ness, R.A., 2006. On the Marketing of IPOs. Journal of Financial Economics 82, 35-61.
Cooney, J.W., Singh, A.K., Carter, R.B., Dark, F.H., 2001. IPO Initial Returns and Underwriter Reputation: Has the Inverse Relationship Flipped in the 1990s? Working Paper, University of Kentucky, Case Western Reserve, and Iowa State University.
40
Corwin, S.A., Schultz, P., 2005. The Role of IPO Underwriting Syndicates: Pricing, Information Production and Underwriter Competition. Journal of Finance 60, 443-486.
Daniels, K.N., Ejara, D., Vijayakumar, J., 2009. An Empirical Analysis of the Determinants and Pricing of Corporate Bond Clawbacks. Journal of Corporate Finance 15, 431-446.
Datta, S., Iskandar-Datta, M., Patel, A., 1997. The Pricing of Initial Public Offerings of Corporate Straight Debt. Journal of Finance 52, 379-396.
Duarte-Silva, T., 2010. The Market for Certification by External Parties: Evidence from Underwriting and Banking Relationships. Journal of Financial Economics 98, 568-582.
Fabozzi, F.J., 2010. Bond Markets, Analysis and Strategies. Pearson, New Jersey.
Fang, L.H., 2005. Investment Bank Reputation and the Price and Quality of Underwriting Services. Journal of Finance 60, 2729-2761.
Fenn, G.W., 2000. Speed of Issuance and the Adequacy of Disclosure in the 144A High-Yield Debt Market. Journal of Financial Economics 56, 383-405.
Fernando, C.S., Gatchev, V.A., May, A.D., Megginson, W.L., 2012. The Benefits of Underwriter Reputation to Banks and Equity Issuing Firms. Working Paper, University of Oklahoma.
Fridson, M.S., Garman, M.C., 1998. Determinants of Spreads on New High-Yield Bonds. Financial Analysts Journal 54, 28-39.
Gande, A., Puri, M., Saunders, A., 1999. Bank Entry, Competition, and the Market for Corporate Securities Underwriting. Journal of Financial Economics 54, 165-195.
Geyfman, V., Yeager, T.J., 2009. On the Riskiness of Universal Banking: Evidence from Banks in the Investment Banking Business Pre- and Post-GLBA. Journal of Money, Credit and Banking 41, 1649-1669.
Golubov, A., Petmezas, D., Travlos, N.G., 2012. When It Pays to Pay Your Investment Banker: New Evidence on the Role of Financial Advisors in M&As. Journal of Finance 67, 271-311.
Gopalan, R., Nanda, V., Yerramilli, V., 2011. Does Poor Performance Damage the Reputation of Financial Intermediaries? Evidence from the Loan Syndication Market. Journal of Finance 66, 2083-2120.
Goyal, V.K., Gollapudi, N., Ogden, J.P., 1998. A Corporate Bond Innovation of the 90s: The Clawback Provision in High-Yield Debt. Journal of Corporate Finance 4, 301-320.
Guedhami, O., Pittman, J., 2008. The Importance of IRS Monitoring to Debt Pricing in Private Firms. Journal of Financial Economics 90, 38-58.
41
Güttler, A., Wahrenburg, M., 2007. The Adjustment of Credit Ratings in Advance of Defaults. Journal of Banking and Finance 31, 751-767.
Hand, J.R.M., Holthausen, R.W., Leftwich, R.W., 1992. The Effect of Bond Rating Agency Announcements on Bond and Stock Prices. Journal of Finance 47, 733-752.
Heckman, J.J., 1979. Sample Selection as a Specification Error. Econometrica 47, 153-161.
Helwege, J., Turner, C.M., 1999. The Slope of the Credit Yield Curve for Speculative-Grade Issuers. Journal of Finance 54, 1869-1884.
Hite, G., Warga, A., 1997. The Effect of Bond-Rating Changes on Bond Price Performance. Financial Analyst Journal May/June, 35-51.
John, K., Lynch, A.W., Puri, M., 2003. Credit Ratings, Collateral, and Loan Characteristics: Implications for Yield. Journal of Business 76, 371-409.
John, K., Ravid, S.A., Reisel, N., 2010. The Notching Rule for Subordinated Debt and the Information Content of Debt Rating. Financial Management 39, 489-513.
Jorion, P., Liu, Z., Shi, C., 2005. Informational Effects of Regulation FD: Evidence from Rating Agencies. Journal of Financial Economics 76, 309-330.
Kisgen, D.J., 2006. Credit Ratings and Capital Structure. Journal of Finance 61, 1035-1072.
Klein, A., Zur, E., 2011. The Impact of Hedge Fund Activism on the Target Firm’s Existing Bondholders. Review of Financial Studies 24, 1735-1771.
Lando, D., Skødeberg, T.M., 2002. Analyzing Rating Transitions and Rating Drift with Continuous Observations. Journal of Banking and Finance 26, 423-444.
Lennox, C.S., 1999. Are Larger Auditors More Accurate than Small Auditors? Accounting and Business Research 29, 217-227.
Li, K., Prabhala, N.R., 2007. Self-Selection Models in Corporate Finance. In: Eckbo, B.E. (Ed.), Handbook of Corporate Finance: Empirical Corporate Finance, Vol. 1, North-Holland, Amsterdam.
Livingston, M., Miller, R.E., 2000. Investment Bank Reputation and the Underwriting of Nonconvertible Debt. Financial Management 29, 21-34.
Livingston, M., Zhou, L., 2002. The Impact of Rule 144A Debt Offerings Upon Bond Yields and Underwriter Fees. Financial Management 31, 5-27.
Livingston, M., Naranjo, A., Zhou, L., 2008. Split Bond Ratings and Rating Migration. Journal of Banking and Finance 32, 1613-1624.
42
Livingston, M., Zhou, L., 2010. Split Bond Ratings and Information Opacity Premium. Financial Management 39, 515-532.
Ljungqvist, A., Marston, F., Wilhelm, Jr., W.J., 2006. Competing for Securities Underwriting Mandates: Banking Relationships and Analyst Recommendations. Journal of Finance 61, 301-340.
Logue, D.E., Rogalski, R.J., Seward, J.K., Foster-Johnson, L., 2002. What Is Special about the Roles of Underwriter Reputation and Market Activities in Initial Public Offerings? Journal of Business 75, 213-243.
Mansi, S.A., Maxwell, W.F., Miller, D.P., 2004. Does Auditor Quality and Tenure Matter to Investors? Evidence from the Bond Market. Journal of Accounting Research 42, 755-793.
Mathis, J., McAndrews, J., Rochet, J.-C., 2009. Rating the Raters: Are Reputation Concerns Powerful Enough to Discipline Rating Agencies? Journal of Monetary Economics 56, 657-674.
McCahery, J., Schwienbacher, A., 2010. Bank Reputation in the Private Debt Market. Journal of Corporate Finance 16, 498-515.
Michaely, R., Womack, K.L., 1999. Conflict of Interest and the Credibility of Underwriter Analyst Recommendations. Review of Financial Studies 12, 653-686.
Okashima, K., Fridson, M., 2000. Downgrade/Upgrade Ratio Leads Default Rate. Journal of Fixed Income 10, 18-24.
Pittman, J.A., Fortin, S., 2004. Auditor Choice and the Cost of Debt Capital for Newly Public Firms. Journal of Accounting and Economics 37, 113-136.
Puri, M., 1994. The Long-Term Default Performance of Bank Underwritten Security Issues. Journal of Banking and Finance 18, 397-418.
Puri, M., 1996. Commercial Banks in Investment Banking: Conflict of Interest or Certification Role? Journal of Financial Economics 40, 373-401.
Puri, M., 1999. Commercial Banks as Underwriters: Implications for the Going Public Process. Journal of Financial Economics 54, 133-163.
Rau, R.P., 2000. Investment Bank Market Share, Contingent Fee Payments, and the Performance of Acquiring Firms. Journal of Financial Economics 56, 293-324.
Rhee, M., Valdez, M.E., 2009. Contextual Factors Surrounding Reputation Damage with Potential Implications for Reputation Repair. Academy of Management Review 34, 146-168.
Ross, D.G., 2010. The “Dominant Bank Effect”: How High Lender Reputation Affects the Information Content and Terms of Bank Loans. Review of Financial Studies 23, 2730-2756.
43
Santos, J.A.C., 2006. Why Firm Access to the Bond Market Differs Over the Business Cycle: A Theory and Some Evidence. Journal of Banking and Finance 30, 2715-2736.
Saunders, A., Steffen, S., 2011. The Costs of Being Private: Evidence from the Loan Market. Review of Financial Studies 24, 4091-4122.
Schenone, C., 2004. The Effect of Banking Relationships on the Firm’s IPO Underpricing. Journal of Finance 59, 2903-2958.
Shapiro, C., 1983. Premiums for High-Quality Products as Returns to Reputation. Quarterly Journal of Economics 98, 659-679.
Shivdasani, A., Song, W.-L., 2011. Breaking Down the Barriers: Competition, Syndicate Structures, and Underwriting Incentives. Journal of Financial Economics 99, 581-600.
Song, W.-L., 2004. The Industrial Organization of the Bond Underwriting Market with Bank Entry: Evidence from Underwriting Fees. Working Paper, Drexel University.
Standard and Poor’s, 2007. High-Yield Bond Market Primer. The McGraw-Hill Companies.
Strausz, R., 2005. Honest Certification and the Threat of Capture. International Journal of Industrial Organization 23, 45-62.
Titman, S., Trueman, B., 1986. Information Quality and the Valuation of New Issues. Journal of Accounting and Economics 8, 159-172.
Wansley, J.W., Glascock, J.L., Clauretie, T.M., 1992. Institutional Bond Pricing and Information Arrival: The Case of Bond Rating Changes. Journal of Business Finance and Accounting 19, 733-750.
Yasuda, A., 2005. Do Bank Relationships Affect the Firm’s Underwriter Choice in the Corporate-Bond Underwriting Market? Journal of Finance 60, 1259-1292.
Zorn, C., 2005. A Solution to Separation in Binary Response Models. Political Analysis 13, 157-
170.
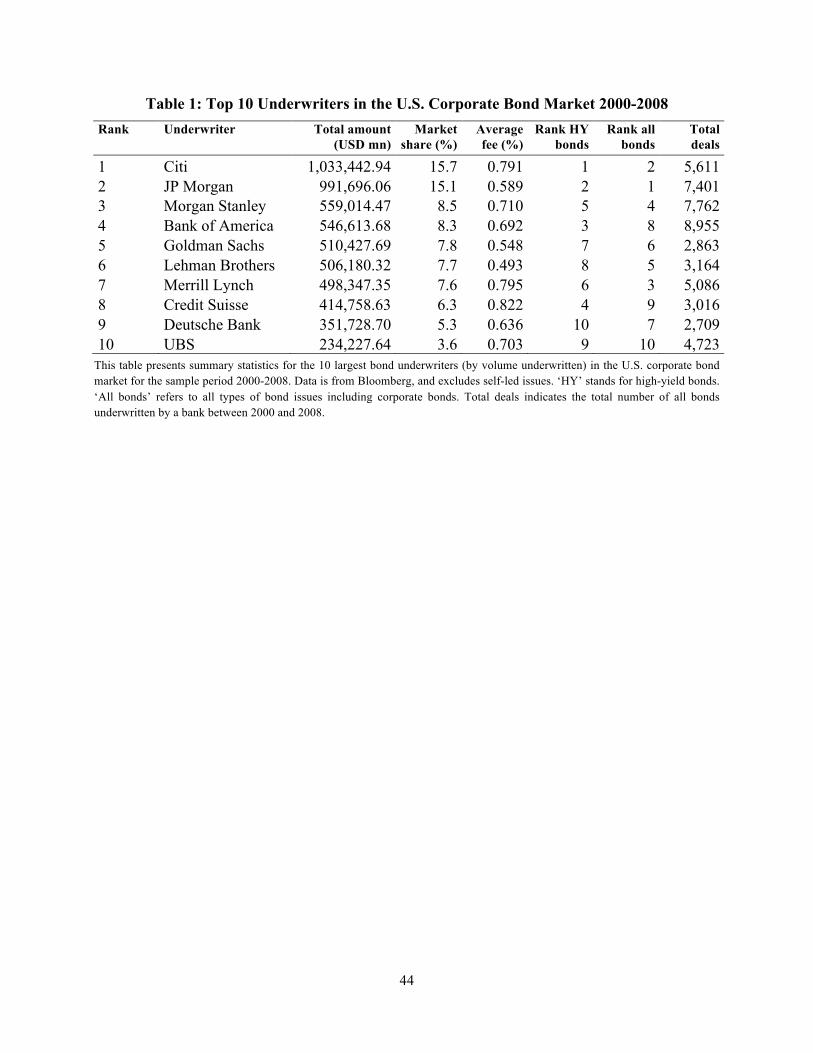
44
Table 1: Top 10 Underwriters in the U.S. Corporate Bond Market 2000-2008 Rank Underwriter Total amount
(USD mn) Market
share (%) Average fee (%)
Rank HY bonds
Rank all bonds
Total deals
1 Citi 1,033,442.94 15.7 0.791 1 2 5,611 2 JP Morgan 991,696.06 15.1 0.589 2 1 7,401 3 Morgan Stanley 559,014.47 8.5 0.710 5 4 7,762 4 Bank of America 546,613.68 8.3 0.692 3 8 8,955 5 Goldman Sachs 510,427.69 7.8 0.548 7 6 2,863 6 Lehman Brothers 506,180.32 7.7 0.493 8 5 3,164 7 Merrill Lynch 498,347.35 7.6 0.795 6 3 5,086 8 Credit Suisse 414,758.63 6.3 0.822 4 9 3,016 9 Deutsche Bank 351,728.70 5.3 0.636 10 7 2,709 10 UBS 234,227.64 3.6 0.703 9 10 4,723
This table presents summary statistics for the 10 largest bond underwriters (by volume underwritten) in the U.S. corporate bond market for the sample period 2000-2008. Data is from Bloomberg, and excludes self-led issues. ‘HY’ stands for high-yield bonds. ‘All bonds’ refers to all types of bond issues including corporate bonds. Total deals indicates the total number of all bonds underwritten by a bank between 2000 and 2008.
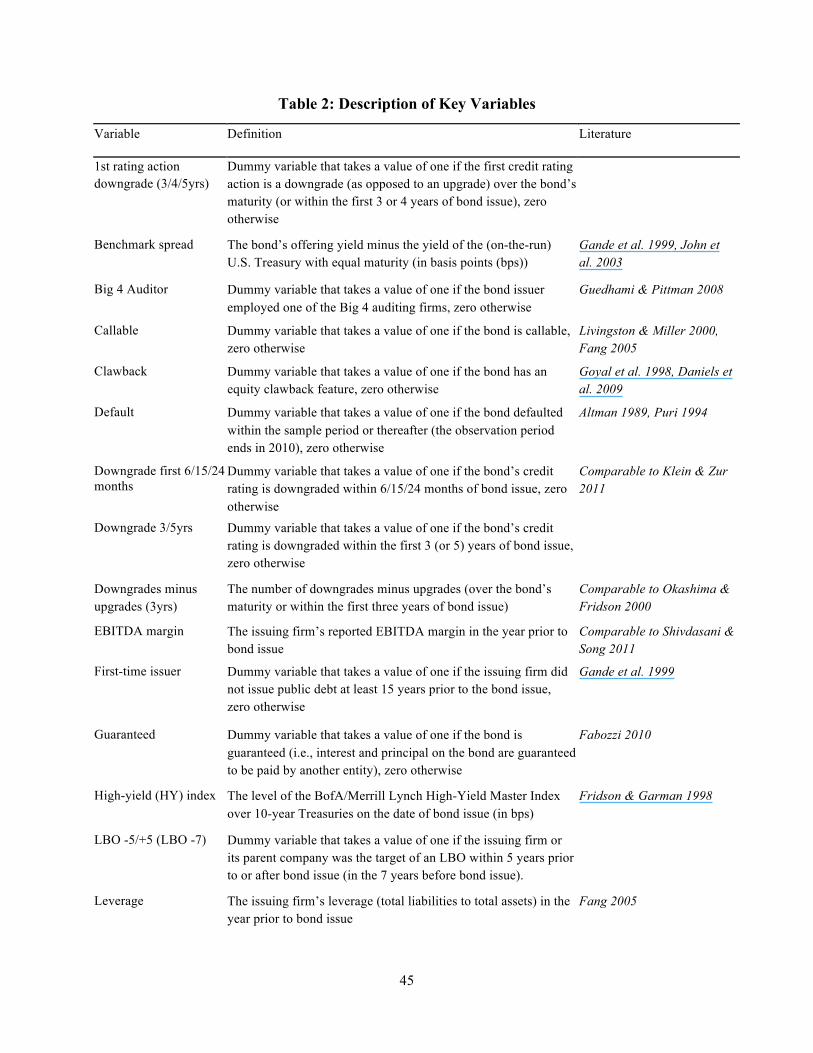
45
Table 2: Description of Key Variables
Variable Definition Literature
1st rating action downgrade (3/4/5yrs)
Dummy variable that takes a value of one if the first credit rating action is a downgrade (as opposed to an upgrade) over the bond’s maturity (or within the first 3 or 4 years of bond issue), zero otherwise
Benchmark spread The bond’s offering yield minus the yield of the (on-the-run) U.S. Treasury with equal maturity (in basis points (bps))
Gande et al. 1999, John et al. 2003
Big 4 Auditor Dummy variable that takes a value of one if the bond issuer employed one of the Big 4 auditing firms, zero otherwise
Guedhami & Pittman 2008
Callable Dummy variable that takes a value of one if the bond is callable, zero otherwise
Livingston & Miller 2000, Fang 2005
Clawback Dummy variable that takes a value of one if the bond has an equity clawback feature, zero otherwise
Goyal et al. 1998, Daniels et al. 2009
Default Dummy variable that takes a value of one if the bond defaulted within the sample period or thereafter (the observation period ends in 2010), zero otherwise
Altman 1989, Puri 1994
Downgrade first 6/15/24 months
Dummy variable that takes a value of one if the bond’s credit rating is downgraded within 6/15/24 months of bond issue, zero otherwise
Comparable to Klein & Zur 2011
Downgrade 3/5yrs Dummy variable that takes a value of one if the bond’s credit rating is downgraded within the first 3 (or 5) years of bond issue, zero otherwise
Downgrades minus upgrades (3yrs)
The number of downgrades minus upgrades (over the bond’s maturity or within the first three years of bond issue)
Comparable to Okashima & Fridson 2000
EBITDA margin The issuing firm’s reported EBITDA margin in the year prior to bond issue
Comparable to Shivdasani & Song 2011
First-time issuer Dummy variable that takes a value of one if the issuing firm did not issue public debt at least 15 years prior to the bond issue, zero otherwise
Gande et al. 1999
Guaranteed Dummy variable that takes a value of one if the bond is guaranteed (i.e., interest and principal on the bond are guaranteed to be paid by another entity), zero otherwise
Fabozzi 2010
High-yield (HY) index The level of the BofA/Merrill Lynch High-Yield Master Index over 10-year Treasuries on the date of bond issue (in bps)
Fridson & Garman 1998
LBO -5/+5 (LBO -7) Dummy variable that takes a value of one if the issuing firm or its parent company was the target of an LBO within 5 years prior to or after bond issue (in the 7 years before bond issue).
Leverage The issuing firm’s leverage (total liabilities to total assets) in the year prior to bond issue
Fang 2005
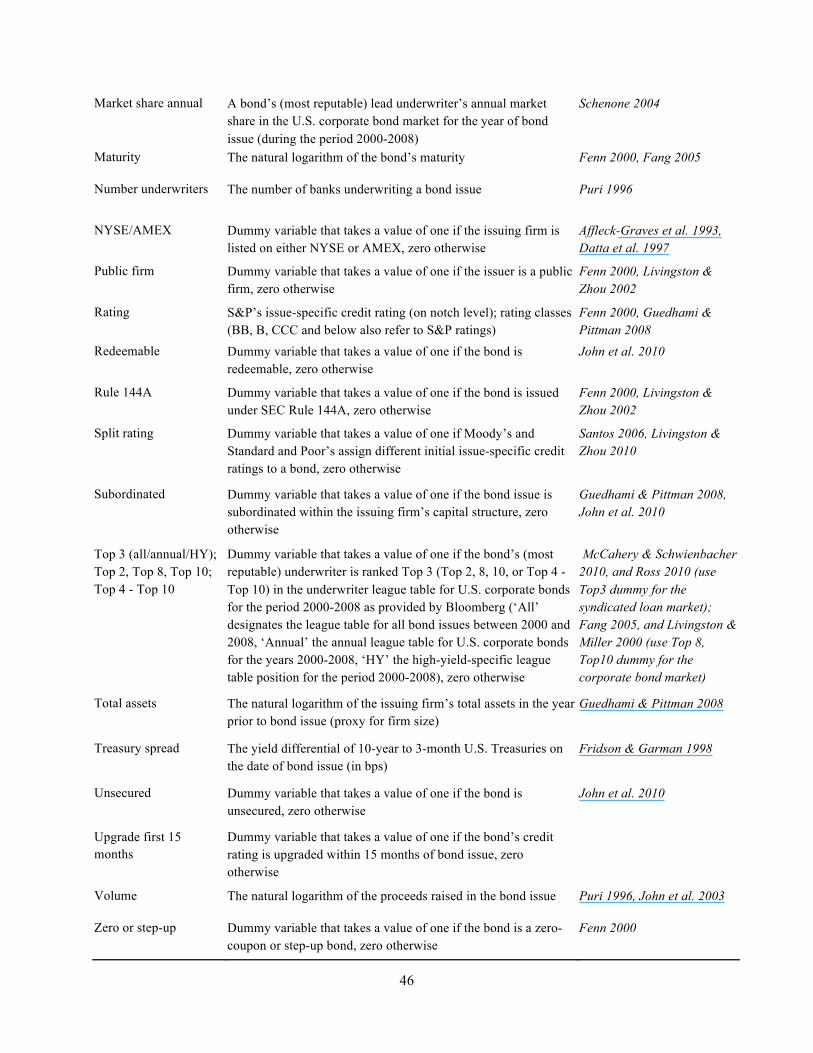
46
Market share annual A bond’s (most reputable) lead underwriter’s annual market share in the U.S. corporate bond market for the year of bond issue (during the period 2000-2008)
Schenone 2004
Maturity The natural logarithm of the bond’s maturity Fenn 2000, Fang 2005
Number underwriters The number of banks underwriting a bond issue Puri 1996
NYSE/AMEX Dummy variable that takes a value of one if the issuing firm is listed on either NYSE or AMEX, zero otherwise
Affleck-Graves et al. 1993, Datta et al. 1997
Public firm Dummy variable that takes a value of one if the issuer is a public firm, zero otherwise
Fenn 2000, Livingston & Zhou 2002
Rating S&P’s issue-specific credit rating (on notch level); rating classes (BB, B, CCC and below also refer to S&P ratings)
Fenn 2000, Guedhami & Pittman 2008
Redeemable Dummy variable that takes a value of one if the bond is redeemable, zero otherwise
John et al. 2010
Rule 144A Dummy variable that takes a value of one if the bond is issued under SEC Rule 144A, zero otherwise
Fenn 2000, Livingston & Zhou 2002
Split rating Dummy variable that takes a value of one if Moody’s and Standard and Poor’s assign different initial issue-specific credit ratings to a bond, zero otherwise
Santos 2006, Livingston & Zhou 2010
Subordinated Dummy variable that takes a value of one if the bond issue is subordinated within the issuing firm’s capital structure, zero otherwise
Guedhami & Pittman 2008, John et al. 2010
Top 3 (all/annual/HY); Top 2, Top 8, Top 10; Top 4 - Top 10
Dummy variable that takes a value of one if the bond’s (most reputable) underwriter is ranked Top 3 (Top 2, 8, 10, or Top 4 -Top 10) in the underwriter league table for U.S. corporate bonds for the period 2000-2008 as provided by Bloomberg (‘All’ designates the league table for all bond issues between 2000 and 2008, ‘Annual’ the annual league table for U.S. corporate bonds for the years 2000-2008, ‘HY’ the high-yield-specific league table position for the period 2000-2008), zero otherwise
McCahery & Schwienbacher 2010, and Ross 2010 (use Top3 dummy for the syndicated loan market); Fang 2005, and Livingston & Miller 2000 (use Top 8, Top10 dummy for the corporate bond market)
Total assets The natural logarithm of the issuing firm’s total assets in the year prior to bond issue (proxy for firm size)
Guedhami & Pittman 2008
Treasury spread The yield differential of 10-year to 3-month U.S. Treasuries on the date of bond issue (in bps)
Fridson & Garman 1998
Unsecured Dummy variable that takes a value of one if the bond is unsecured, zero otherwise
John et al. 2010
Upgrade first 15 months
Dummy variable that takes a value of one if the bond’s credit rating is upgraded within 15 months of bond issue, zero otherwise
Volume The natural logarithm of the proceeds raised in the bond issue Puri 1996, John et al. 2003
Zero or step-up Dummy variable that takes a value of one if the bond is a zero-coupon or step-up bond, zero otherwise
Fenn 2000
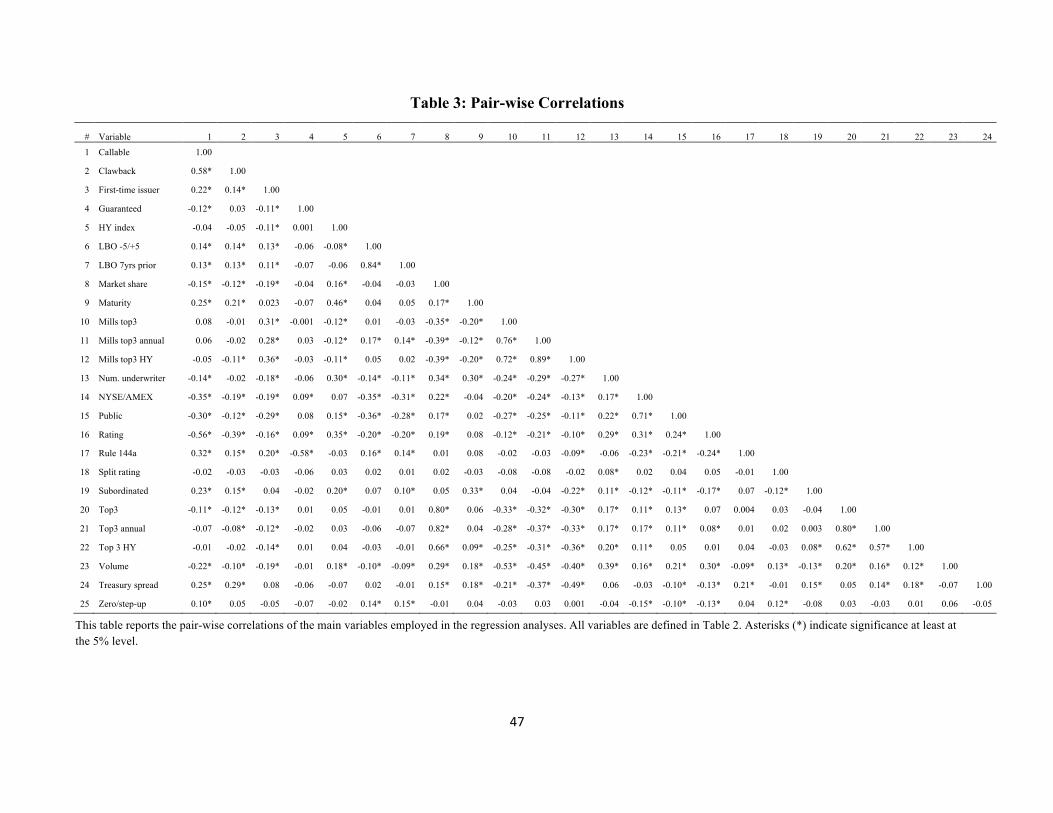
47
Table 3: Pair-wise Correlations
# Variable 1 2 3 4 5 6 7 8 9 10 11 12 13 14 15 16 17 18 19 20 21 22 23 24
1 Callable 1.00
2 Clawback 0.58* 1.00
3 First-time issuer 0.22* 0.14* 1.00
4 Guaranteed -0.12* 0.03 -0.11* 1.00
5 HY index -0.04 -0.05 -0.11* 0.001 1.00
6 LBO -5/+5 0.14* 0.14* 0.13* -0.06 -0.08* 1.00
7 LBO 7yrs prior 0.13* 0.13* 0.11* -0.07 -0.06 0.84* 1.00
8 Market share -0.15* -0.12* -0.19* -0.04 0.16* -0.04 -0.03 1.00
9 Maturity 0.25* 0.21* 0.023 -0.07 0.46* 0.04 0.05 0.17* 1.00
10 Mills top3 0.08 -0.01 0.31* -0.001 -0.12* 0.01 -0.03 -0.35* -0.20* 1.00
11 Mills top3 annual 0.06 -0.02 0.28* 0.03 -0.12* 0.17* 0.14* -0.39* -0.12* 0.76* 1.00
12 Mills top3 HY -0.05 -0.11* 0.36* -0.03 -0.11* 0.05 0.02 -0.39* -0.20* 0.72* 0.89* 1.00
13 Num. underwriter -0.14* -0.02 -0.18* -0.06 0.30* -0.14* -0.11* 0.34* 0.30* -0.24* -0.29* -0.27* 1.00
14 NYSE/AMEX -0.35* -0.19* -0.19* 0.09* 0.07 -0.35* -0.31* 0.22* -0.04 -0.20* -0.24* -0.13* 0.17* 1.00
15 Public -0.30* -0.12* -0.29* 0.08 0.15* -0.36* -0.28* 0.17* 0.02 -0.27* -0.25* -0.11* 0.22* 0.71* 1.00
16 Rating -0.56* -0.39* -0.16* 0.09* 0.35* -0.20* -0.20* 0.19* 0.08 -0.12* -0.21* -0.10* 0.29* 0.31* 0.24* 1.00
17 Rule 144a 0.32* 0.15* 0.20* -0.58* -0.03 0.16* 0.14* 0.01 0.08 -0.02 -0.03 -0.09* -0.06 -0.23* -0.21* -0.24* 1.00
18 Split rating -0.02 -0.03 -0.03 -0.06 0.03 0.02 0.01 0.02 -0.03 -0.08 -0.08 -0.02 0.08* 0.02 0.04 0.05 -0.01 1.00
19 Subordinated 0.23* 0.15* 0.04 -0.02 0.20* 0.07 0.10* 0.05 0.33* 0.04 -0.04 -0.22* 0.11* -0.12* -0.11* -0.17* 0.07 -0.12* 1.00
20 Top3 -0.11* -0.12* -0.13* 0.01 0.05 -0.01 0.01 0.80* 0.06 -0.33* -0.32* -0.30* 0.17* 0.11* 0.13* 0.07 0.004 0.03 -0.04 1.00
21 Top3 annual -0.07 -0.08* -0.12* -0.02 0.03 -0.06 -0.07 0.82* 0.04 -0.28* -0.37* -0.33* 0.17* 0.17* 0.11* 0.08* 0.01 0.02 0.003 0.80* 1.00
22 Top 3 HY -0.01 -0.02 -0.14* 0.01 0.04 -0.03 -0.01 0.66* 0.09* -0.25* -0.31* -0.36* 0.20* 0.11* 0.05 0.01 0.04 -0.03 0.08* 0.62* 0.57* 1.00
23 Volume -0.22* -0.10* -0.19* -0.01 0.18* -0.10* -0.09* 0.29* 0.18* -0.53* -0.45* -0.40* 0.39* 0.16* 0.21* 0.30* -0.09* 0.13* -0.13* 0.20* 0.16* 0.12* 1.00
24 Treasury spread 0.25* 0.29* 0.08 -0.06 -0.07 0.02 -0.01 0.15* 0.18* -0.21* -0.37* -0.49* 0.06 -0.03 -0.10* -0.13* 0.21* -0.01 0.15* 0.05 0.14* 0.18* -0.07 1.00
25 Zero/step-up 0.10* 0.05 -0.05 -0.07 -0.02 0.14* 0.15* -0.01 0.04 -0.03 0.03 0.001 -0.04 -0.15* -0.10* -0.13* 0.04 0.12* -0.08 0.03 -0.03 0.01 0.06 -0.05
This table reports the pair-wise correlations of the main variables employed in the regression analyses. All variables are defined in Table 2. Asterisks (*) indicate significance at least at the 5% level.
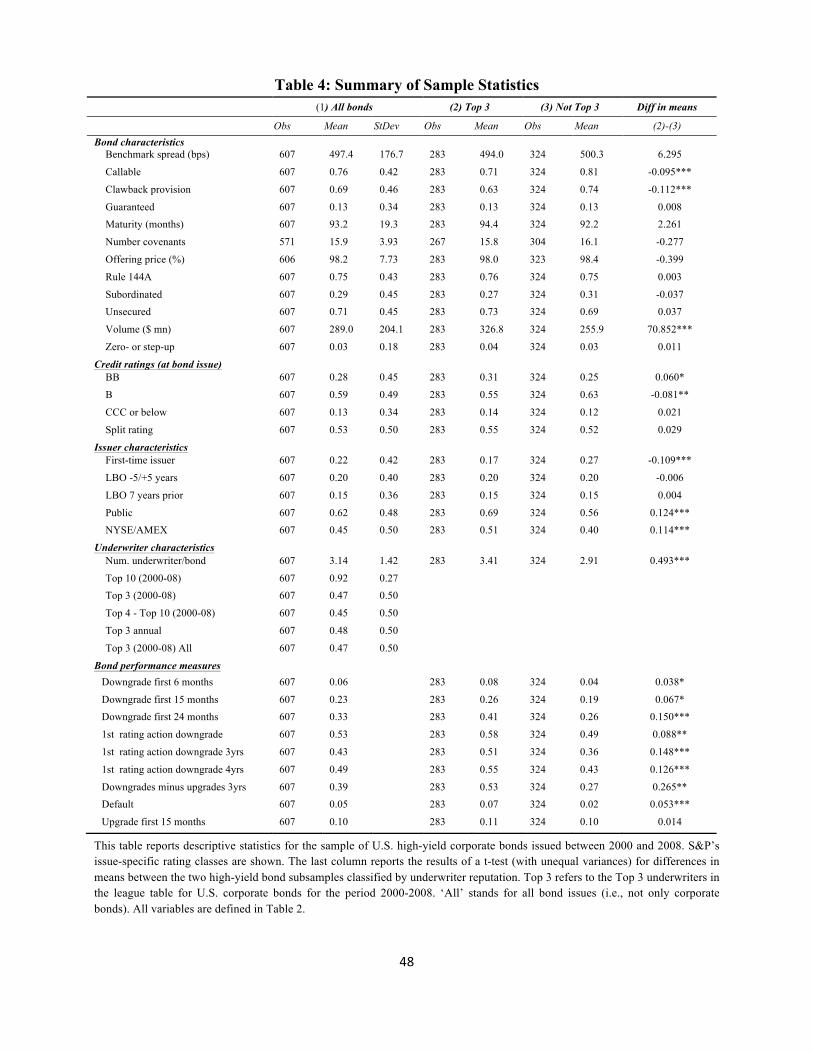
48
Table 4: Summary of Sample Statistics (1) All bonds (2) Top 3 (3) Not Top 3 Diff in means Obs Mean StDev Obs Mean Obs Mean (2)-(3) Bond characteristics
Benchmark spread (bps) 607 497.4 176.7 283 494.0 324 500.3 6.295
Callable 607 0.76 0.42 283 0.71 324 0.81 -0.095***
Clawback provision 607 0.69 0.46 283 0.63 324 0.74 -0.112***
Guaranteed 607 0.13 0.34 283 0.13 324 0.13 0.008 Maturity (months) 607 93.2 19.3 283 94.4 324 92.2 2.261
Number covenants 571 15.9 3.93 267 15.8 304 16.1 -0.277
Offering price (%) 606 98.2 7.73 283 98.0 323 98.4 -0.399
Rule 144A 607 0.75 0.43 283 0.76 324 0.75 0.003
Subordinated 607 0.29 0.45 283 0.27 324 0.31 -0.037 Unsecured 607 0.71 0.45 283 0.73 324 0.69 0.037
Volume ($ mn) 607 289.0 204.1 283 326.8 324 255.9 70.852***
Zero- or step-up 607 0.03 0.18 283 0.04 324 0.03 0.011
Credit ratings (at bond issue) BB 607 0.28 0.45 283 0.31 324 0.25 0.060*
B 607 0.59 0.49 283 0.55 324 0.63 -0.081**
CCC or below 607 0.13 0.34 283 0.14 324 0.12 0.021
Split rating 607 0.53 0.50 283 0.55 324 0.52 0.029
Issuer characteristics First-time issuer 607 0.22 0.42 283 0.17 324 0.27 -0.109***
LBO -5/+5 years 607 0.20 0.40 283 0.20 324 0.20 -0.006
LBO 7 years prior 607 0.15 0.36 283 0.15 324 0.15 0.004
Public 607 0.62 0.48 283 0.69 324 0.56 0.124*** NYSE/AMEX 607 0.45 0.50 283 0.51 324 0.40 0.114***
Underwriter characteristics Num. underwriter/bond 607 3.14 1.42 283 3.41 324 2.91 0.493***
Top 10 (2000-08) 607 0.92 0.27 Top 3 (2000-08) 607 0.47 0.50
Top 4 - Top 10 (2000-08) 607 0.45 0.50
Top 3 annual 607 0.48 0.50
Top 3 (2000-08) All 607 0.47 0.50
Bond performance measures Downgrade first 6 months 607 0.06 283 0.08 324 0.04 0.038*
Downgrade first 15 months 607 0.23 283 0.26 324 0.19 0.067* Downgrade first 24 months 607 0.33 283 0.41 324 0.26 0.150***
1st rating action downgrade 607 0.53 283 0.58 324 0.49 0.088**
1st rating action downgrade 3yrs 607 0.43 283 0.51 324 0.36 0.148***
1st rating action downgrade 4yrs 607 0.49 283 0.55 324 0.43 0.126***
Downgrades minus upgrades 3yrs 607 0.39 283 0.53 324 0.27 0.265** Default 607 0.05 283 0.07 324 0.02 0.053***
Upgrade first 15 months 607 0.10 283 0.11 324 0.10 0.014
This table reports descriptive statistics for the sample of U.S. high-yield corporate bonds issued between 2000 and 2008. S&P’s issue-specific rating classes are shown. The last column reports the results of a t-test (with unequal variances) for differences in means between the two high-yield bond subsamples classified by underwriter reputation. Top 3 refers to the Top 3 underwriters in the league table for U.S. corporate bonds for the period 2000-2008. ‘All’ stands for all bond issues (i.e., not only corporate bonds). All variables are defined in Table 2.
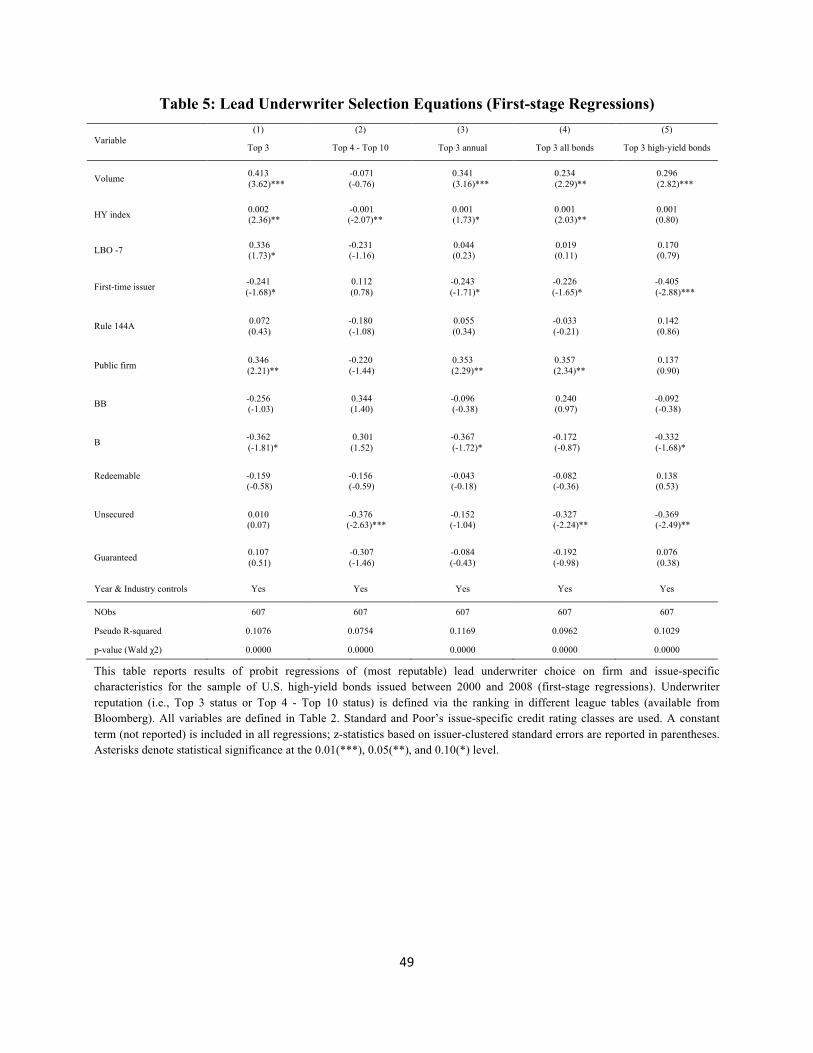
49
Table 5: Lead Underwriter Selection Equations (First-stage Regressions) (1) (2) (3) (4) (5) Variable
Top 3 Top 4 - Top 10 Top 3 annual Top 3 all bonds Top 3 high-yield bonds
Volume 0.413 (3.62)***
-0.071 (-0.76)
0.341 (3.16)***
0.234 (2.29)**
0.296 (2.82)***
HY index 0.002 (2.36)**
-0.001 (-2.07)**
0.001 (1.73)*
0.001 (2.03)**
0.001 (0.80)
LBO -7 0.336 (1.73)*
-0.231 (-1.16)
0.044 (0.23)
0.019 (0.11)
0.170 (0.79)
First-time issuer -0.241 (-1.68)*
0.112 (0.78)
-0.243 (-1.71)*
-0.226 (-1.65)*
-0.405 (-2.88)***
Rule 144A 0.072 (0.43)
-0.180 (-1.08)
0.055 (0.34)
-0.033 (-0.21)
0.142 (0.86)
Public firm 0.346 (2.21)**
-0.220 (-1.44)
0.353 (2.29)**
0.357 (2.34)**
0.137 (0.90)
BB -0.256 (-1.03)
0.344 (1.40)
-0.096 (-0.38)
0.240 (0.97)
-0.092 (-0.38)
B -0.362 (-1.81)*
0.301 (1.52)
-0.367 (-1.72)*
-0.172 (-0.87)
-0.332 (-1.68)*
Redeemable
-0.159 (-0.58)
-0.156 (-0.59)
-0.043 (-0.18)
-0.082 (-0.36)
0.138 (0.53)
Unsecured
0.010 (0.07)
-0.376 (-2.63)***
-0.152 (-1.04)
-0.327 (-2.24)**
-0.369 (-2.49)**
Guaranteed 0.107 (0.51)
-0.307 (-1.46)
-0.084 (-0.43)
-0.192 (-0.98)
0.076 (0.38)
Year & Industry controls Yes Yes Yes Yes Yes
NObs 607 607 607 607 607
Pseudo R-squared 0.1076 0.0754 0.1169 0.0962 0.1029
p-value (Wald χ2) 0.0000 0.0000 0.0000 0.0000 0.0000
This table reports results of probit regressions of (most reputable) lead underwriter choice on firm and issue-specific characteristics for the sample of U.S. high-yield bonds issued between 2000 and 2008 (first-stage regressions). Underwriter reputation (i.e., Top 3 status or Top 4 - Top 10 status) is defined via the ranking in different league tables (available from Bloomberg). All variables are defined in Table 2. Standard and Poor’s issue-specific credit rating classes are used. A constant term (not reported) is included in all regressions; z-statistics based on issuer-clustered standard errors are reported in parentheses. Asterisks denote statistical significance at the 0.01(***), 0.05(**), and 0.10(*) level.
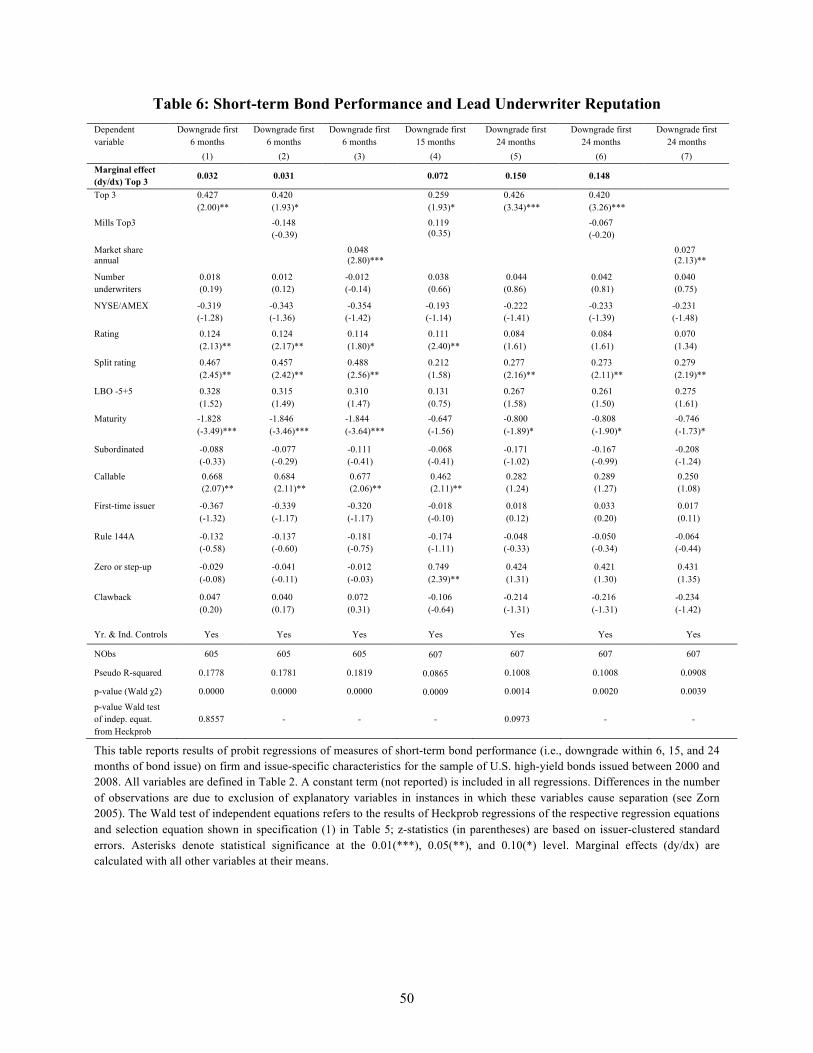
50
Table 6: Short-term Bond Performance and Lead Underwriter Reputation Dependent variable
Downgrade first 6 months
Downgrade first 6 months
Downgrade first 6 months
Downgrade first 15 months
Downgrade first 24 months
Downgrade first 24 months
Downgrade first 24 months
(1) (2) (3) (4) (5) (6) (7) Marginal effect (dy/dx) Top 3 0.032 0.031 0.072 0.150 0.148
Top 3 0.427 (2.00)**
0.420 (1.93)*
0.259 (1.93)*
0.426 (3.34)***
0.420 (3.26)***
Mills Top3 -0.148 (-0.39)
0.119 (0.35)
-0.067 (-0.20)
Market share annual
0.048 (2.80)***
0.027 (2.13)**
Number underwriters
0.018 (0.19)
0.012 (0.12)
-0.012 (-0.14)
0.038 (0.66)
0.044 (0.86)
0.042 (0.81)
0.040 (0.75)
NYSE/AMEX -0.319 (-1.28)
-0.343 (-1.36)
-0.354 (-1.42)
-0.193 (-1.14)
-0.222 (-1.41)
-0.233 (-1.39)
-0.231 (-1.48)
Rating 0.124 (2.13)**
0.124 (2.17)**
0.114 (1.80)*
0.111 (2.40)**
0.084 (1.61)
0.084 (1.61)
0.070 (1.34)
Split rating 0.467 (2.45)**
0.457 (2.42)**
0.488 (2.56)**
0.212 (1.58)
0.277 (2.16)**
0.273 (2.11)**
0.279 (2.19)**
LBO -5+5 0.328 (1.52)
0.315 (1.49)
0.310 (1.47)
0.131 (0.75)
0.267 (1.58)
0.261 (1.50)
0.275 (1.61)
Maturity
-1.828 (-3.49)***
-1.846 (-3.46)***
-1.844 (-3.64)***
-0.647 (-1.56)
-0.800 (-1.89)*
-0.808 (-1.90)*
-0.746 (-1.73)*
Subordinated -0.088 (-0.33)
-0.077 (-0.29)
-0.111 (-0.41)
-0.068 (-0.41)
-0.171 (-1.02)
-0.167 (-0.99)
-0.208 (-1.24)
Callable 0.668 (2.07)**
0.684 (2.11)**
0.677 (2.06)**
0.462 (2.11)**
0.282 (1.24)
0.289 (1.27)
0.250 (1.08)
First-time issuer -0.367 (-1.32)
-0.339 (-1.17)
-0.320 (-1.17)
-0.018 (-0.10)
0.018 (0.12)
0.033 (0.20)
0.017 (0.11)
Rule 144A -0.132 (-0.58)
-0.137 (-0.60)
-0.181 (-0.75)
-0.174 (-1.11)
-0.048 (-0.33)
-0.050 (-0.34)
-0.064 (-0.44)
Zero or step-up -0.029 (-0.08)
-0.041 (-0.11)
-0.012 (-0.03)
0.749 (2.39)**
0.424 (1.31)
0.421 (1.30)
0.431 (1.35)
Clawback
0.047 (0.20)
0.040 (0.17)
0.072 (0.31)
-0.106 (-0.64)
-0.214 (-1.31)
-0.216 (-1.31)
-0.234 (-1.42)
Yr. & Ind. Controls Yes Yes Yes Yes Yes Yes Yes NObs 605 605 605 607 607 607 607
Pseudo R-squared 0.1778 0.1781 0.1819 0.0865 0.1008 0.1008 0.0908
p-value (Wald χ2) 0.0000 0.0000 0.0000 0.0009 0.0014 0.0020 0.0039
p-value Wald test of indep. equat. from Heckprob
0.8557 - - - 0.0973 - -
This table reports results of probit regressions of measures of short-term bond performance (i.e., downgrade within 6, 15, and 24 months of bond issue) on firm and issue-specific characteristics for the sample of U.S. high-yield bonds issued between 2000 and 2008. All variables are defined in Table 2. A constant term (not reported) is included in all regressions. Differences in the number of observations are due to exclusion of explanatory variables in instances in which these variables cause separation (see Zorn 2005). The Wald test of independent equations refers to the results of Heckprob regressions of the respective regression equations and selection equation shown in specification (1) in Table 5; z-statistics (in parentheses) are based on issuer-clustered standard errors. Asterisks denote statistical significance at the 0.01(***), 0.05(**), and 0.10(*) level. Marginal effects (dy/dx) are calculated with all other variables at their means.
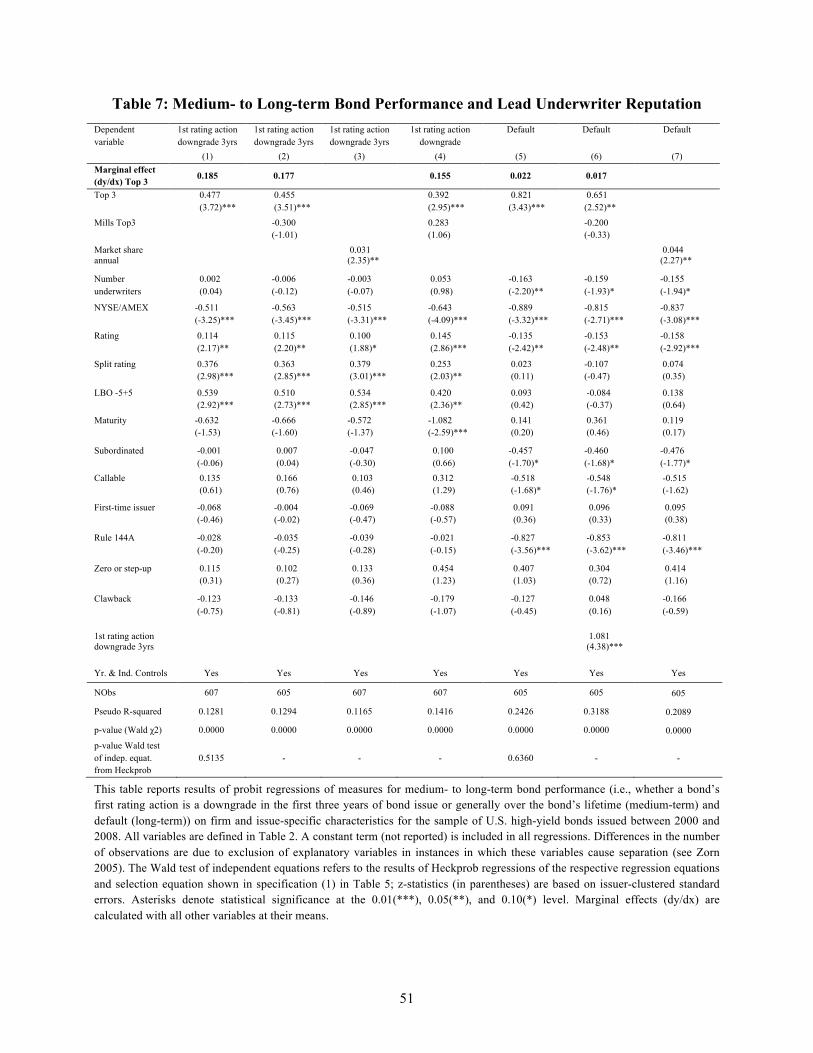
51
Table 7: Medium- to Long-term Bond Performance and Lead Underwriter Reputation Dependent variable
1st rating action downgrade 3yrs
1st rating action downgrade 3yrs
1st rating action downgrade 3yrs
1st rating action downgrade
Default Default Default
(1) (2) (3) (4) (5) (6) (7) Marginal effect (dy/dx) Top 3 0.185 0.177 0.155 0.022 0.017
Top 3 0.477 (3.72)***
0.455 (3.51)***
0.392 (2.95)***
0.821 (3.43)***
0.651 (2.52)**
Mills Top3 -0.300 (-1.01)
0.283 (1.06)
-0.200 (-0.33)
Market share annual
0.031 (2.35)**
0.044 (2.27)**
Number underwriters
0.002 (0.04)
-0.006 (-0.12)
-0.003 (-0.07)
0.053 (0.98)
-0.163 (-2.20)**
-0.159 (-1.93)*
-0.155 (-1.94)*
NYSE/AMEX -0.511 (-3.25)***
-0.563 (-3.45)***
-0.515 (-3.31)***
-0.643 (-4.09)***
-0.889 (-3.32)***
-0.815 (-2.71)***
-0.837 (-3.08)***
Rating 0.114 (2.17)**
0.115 (2.20)**
0.100 (1.88)*
0.145 (2.86)***
-0.135 (-2.42)**
-0.153 (-2.48)**
-0.158 (-2.92)***
Split rating 0.376 (2.98)***
0.363 (2.85)***
0.379 (3.01)***
0.253 (2.03)**
0.023 (0.11)
-0.107 (-0.47)
0.074 (0.35)
LBO -5+5 0.539 (2.92)***
0.510 (2.73)***
0.534 (2.85)***
0.420 (2.36)**
0.093 (0.42)
-0.084 (-0.37)
0.138 (0.64)
Maturity
-0.632 (-1.53)
-0.666 (-1.60)
-0.572 (-1.37)
-1.082 (-2.59)***
0.141 (0.20)
0.361 (0.46)
0.119 (0.17)
Subordinated -0.001 (-0.06)
0.007 (0.04)
-0.047 (-0.30)
0.100 (0.66)
-0.457 (-1.70)*
-0.460 (-1.68)*
-0.476 (-1.77)*
Callable 0.135 (0.61)
0.166 (0.76)
0.103 (0.46)
0.312 (1.29)
-0.518 (-1.68)*
-0.548 (-1.76)*
-0.515 (-1.62)
First-time issuer -0.068 (-0.46)
-0.004 (-0.02)
-0.069 (-0.47)
-0.088 (-0.57)
0.091 (0.36)
0.096 (0.33)
0.095 (0.38)
Rule 144A -0.028 (-0.20)
-0.035 (-0.25)
-0.039 (-0.28)
-0.021 (-0.15)
-0.827 (-3.56)***
-0.853 (-3.62)***
-0.811 (-3.46)***
Zero or step-up 0.115 (0.31)
0.102 (0.27)
0.133 (0.36)
0.454 (1.23)
0.407 (1.03)
0.304 (0.72)
0.414 (1.16)
Clawback
-0.123 (-0.75)
-0.133 (-0.81)
-0.146 (-0.89)
-0.179 (-1.07)
-0.127 (-0.45)
0.048 (0.16)
-0.166 (-0.59)
1st rating action downgrade 3yrs
1.081 (4.38)***
Yr. & Ind. Controls Yes Yes Yes Yes Yes Yes Yes NObs 607 605 607 607 605 605 605
Pseudo R-squared 0.1281 0.1294 0.1165 0.1416 0.2426 0.3188 0.2089
p-value (Wald χ2) 0.0000 0.0000 0.0000 0.0000 0.0000 0.0000 0.0000 p-value Wald test of indep. equat. from Heckprob
0.5135 - - - 0.6360 - -
This table reports results of probit regressions of measures for medium- to long-term bond performance (i.e., whether a bond’s first rating action is a downgrade in the first three years of bond issue or generally over the bond’s lifetime (medium-term) and default (long-term)) on firm and issue-specific characteristics for the sample of U.S. high-yield bonds issued between 2000 and 2008. All variables are defined in Table 2. A constant term (not reported) is included in all regressions. Differences in the number of observations are due to exclusion of explanatory variables in instances in which these variables cause separation (see Zorn 2005). The Wald test of independent equations refers to the results of Heckprob regressions of the respective regression equations and selection equation shown in specification (1) in Table 5; z-statistics (in parentheses) are based on issuer-clustered standard errors. Asterisks denote statistical significance at the 0.01(***), 0.05(**), and 0.10(*) level. Marginal effects (dy/dx) are calculated with all other variables at their means.
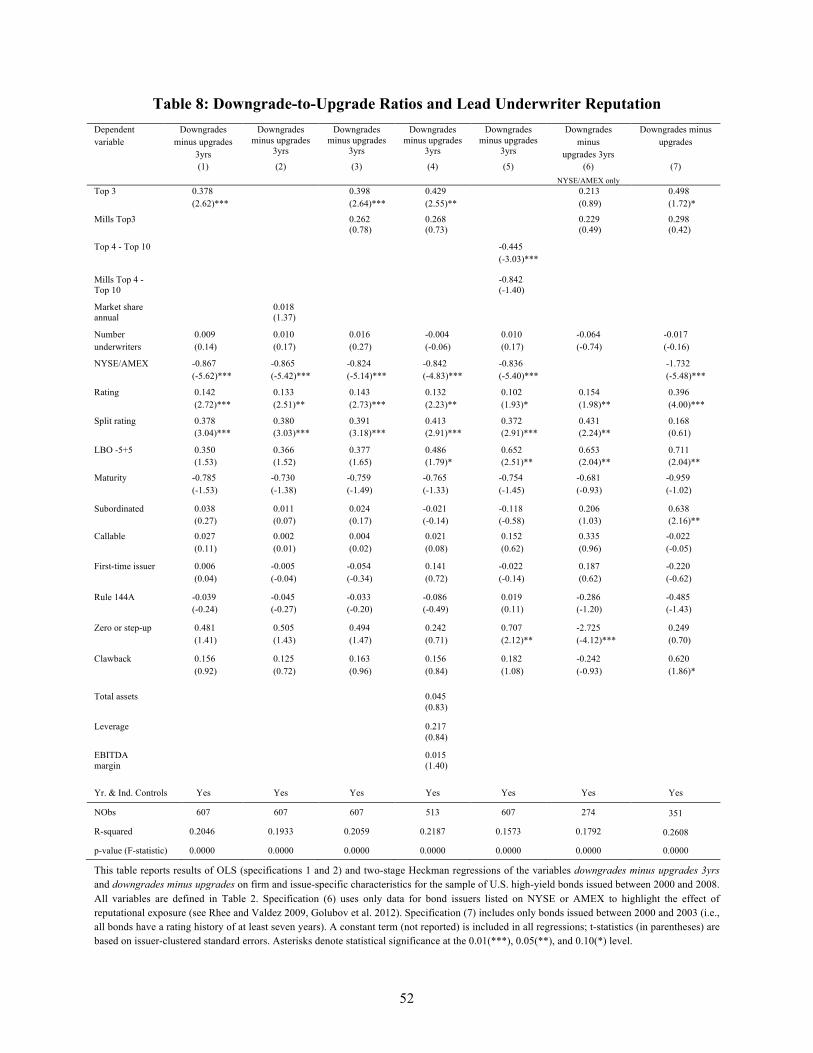
52
Table 8: Downgrade-to-Upgrade Ratios and Lead Underwriter Reputation Dependent variable
Downgrades minus upgrades
3yrs
Downgrades minus upgrades
3yrs Downgrades
minus upgrades 3yrs
Downgrades minus upgrades
3yrs Downgrades
minus upgrades 3yrs
Downgrades minus
upgrades 3yrs
Downgrades minus upgrades
(1) (2) (3) (4) (5) (6) NYSE/AMEX only
(7)
Top 3 0.378 (2.62)***
0.398 (2.64)***
0.429 (2.55)**
0.213 (0.89)
0.498 (1.72)*
Mills Top3 0.262 (0.78)
0.268 (0.73)
0.229 (0.49)
0.298 (0.42)
Top 4 - Top 10 -0.445 (-3.03)***
Mills Top 4 - Top 10
-0.842 (-1.40)
Market share annual
0.018 (1.37)
Number underwriters
0.009 (0.14)
0.010 (0.17)
0.016 (0.27)
-0.004 (-0.06)
0.010 (0.17)
-0.064 (-0.74)
-0.017 (-0.16)
NYSE/AMEX -0.867 (-5.62)***
-0.865 (-5.42)***
-0.824 (-5.14)***
-0.842 (-4.83)***
-0.836 (-5.40)***
-1.732 (-5.48)***
Rating 0.142 (2.72)***
0.133 (2.51)**
0.143 (2.73)***
0.132 (2.23)**
0.102 (1.93)*
0.154 (1.98)**
0.396 (4.00)***
Split rating 0.378 (3.04)***
0.380 (3.03)***
0.391 (3.18)***
0.413 (2.91)***
0.372 (2.91)***
0.431 (2.24)**
0.168 (0.61)
LBO -5+5 0.350 (1.53)
0.366 (1.52)
0.377 (1.65)
0.486 (1.79)*
0.652 (2.51)**
0.653 (2.04)**
0.711 (2.04)**
Maturity
-0.785 (-1.53)
-0.730 (-1.38)
-0.759 (-1.49)
-0.765 (-1.33)
-0.754 (-1.45)
-0.681 (-0.93)
-0.959 (-1.02)
Subordinated 0.038 (0.27)
0.011 (0.07)
0.024 (0.17)
-0.021 (-0.14)
-0.118 (-0.58)
0.206 (1.03)
0.638 (2.16)**
Callable 0.027 (0.11)
0.002 (0.01)
0.004 (0.02)
0.021 (0.08)
0.152 (0.62)
0.335 (0.96)
-0.022 (-0.05)
First-time issuer 0.006 (0.04)
-0.005 (-0.04)
-0.054 (-0.34)
0.141 (0.72)
-0.022 (-0.14)
0.187 (0.62)
-0.220 (-0.62)
Rule 144A -0.039 (-0.24)
-0.045 (-0.27)
-0.033 (-0.20)
-0.086 (-0.49)
0.019 (0.11)
-0.286 (-1.20)
-0.485 (-1.43)
Zero or step-up 0.481 (1.41)
0.505 (1.43)
0.494 (1.47)
0.242 (0.71)
0.707 (2.12)**
-2.725 (-4.12)***
0.249 (0.70)
Clawback
0.156 (0.92)
0.125 (0.72)
0.163 (0.96)
0.156 (0.84)
0.182 (1.08)
-0.242 (-0.93)
0.620 (1.86)*
Total assets 0.045 (0.83)
Leverage 0.217 (0.84)
EBITDA margin
0.015 (1.40)
Yr. & Ind. Controls Yes Yes Yes Yes Yes Yes Yes NObs 607 607 607 513 607 274 351
R-squared 0.2046 0.1933 0.2059 0.2187 0.1573 0.1792 0.2608
p-value (F-statistic) 0.0000 0.0000 0.0000 0.0000 0.0000 0.0000 0.0000 This table reports results of OLS (specifications 1 and 2) and two-stage Heckman regressions of the variables downgrades minus upgrades 3yrs and downgrades minus upgrades on firm and issue-specific characteristics for the sample of U.S. high-yield bonds issued between 2000 and 2008. All variables are defined in Table 2. Specification (6) uses only data for bond issuers listed on NYSE or AMEX to highlight the effect of reputational exposure (see Rhee and Valdez 2009, Golubov et al. 2012). Specification (7) includes only bonds issued between 2000 and 2003 (i.e., all bonds have a rating history of at least seven years). A constant term (not reported) is included in all regressions; t-statistics (in parentheses) are based on issuer-clustered standard errors. Asterisks denote statistical significance at the 0.01(***), 0.05(**), and 0.10(*) level.
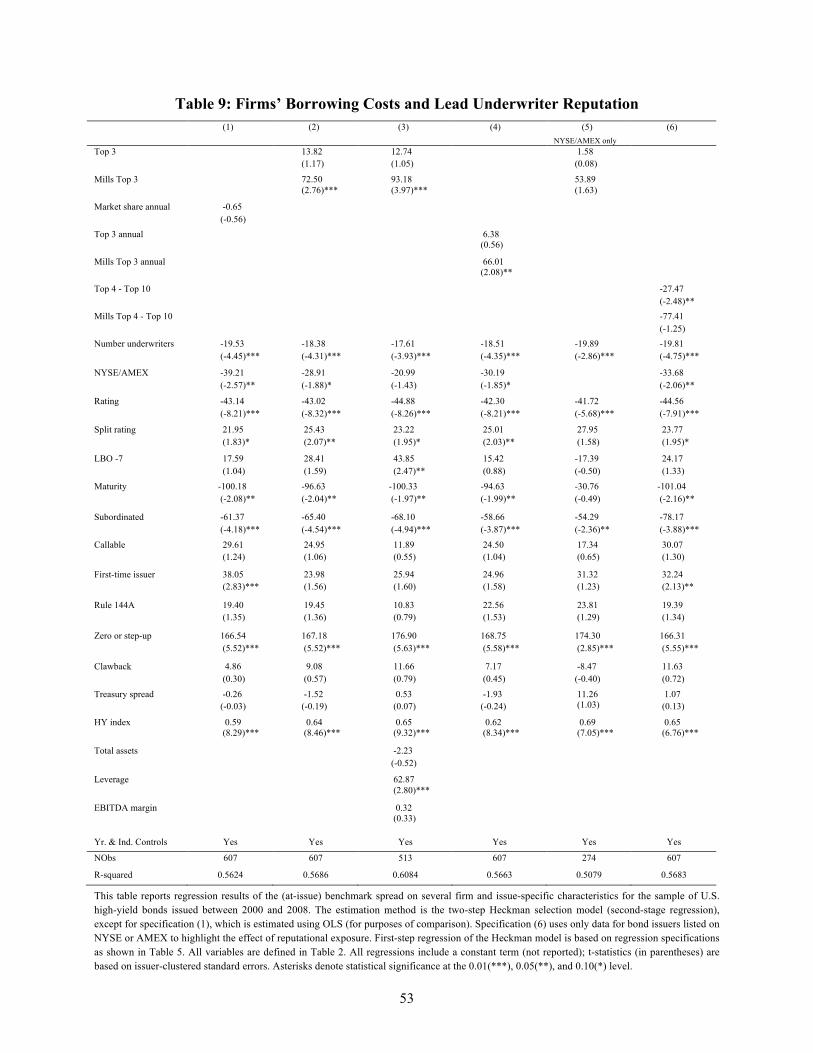
53
Table 9: Firms’ Borrowing Costs and Lead Underwriter Reputation
(1) (2) (3) (4) (5) NYSE/AMEX only
(6)
Top 3 13.82 (1.17)
12.74 (1.05)
1.58 (0.08)
Mills Top 3 72.50 (2.76)***
93.18 (3.97)***
53.89 (1.63)
Market share annual -0.65 (-0.56)
Top 3 annual 6.38 (0.56)
Mills Top 3 annual 66.01 (2.08)**
Top 4 - Top 10 -27.47 (-2.48)**
Mills Top 4 - Top 10 -77.41 (-1.25)
Number underwriters -19.53 (-4.45)***
-18.38 (-4.31)***
-17.61 (-3.93)***
-18.51 (-4.35)***
-19.89 (-2.86)***
-19.81 (-4.75)***
NYSE/AMEX -39.21 (-2.57)**
-28.91 (-1.88)*
-20.99 (-1.43)
-30.19 (-1.85)*
-33.68 (-2.06)**
Rating -43.14 (-8.21)***
-43.02 (-8.32)***
-44.88 (-8.26)***
-42.30 (-8.21)***
-41.72 (-5.68)***
-44.56 (-7.91)***
Split rating 21.95 (1.83)*
25.43 (2.07)**
23.22 (1.95)*
25.01 (2.03)**
27.95 (1.58)
23.77 (1.95)*
LBO -7 17.59 (1.04)
28.41 (1.59)
43.85 (2.47)**
15.42 (0.88)
-17.39 (-0.50)
24.17 (1.33)
Maturity
-100.18 (-2.08)**
-96.63 (-2.04)**
-100.33 (-1.97)**
-94.63 (-1.99)**
-30.76 (-0.49)
-101.04 (-2.16)**
Subordinated -61.37 (-4.18)***
-65.40 (-4.54)***
-68.10 (-4.94)***
-58.66 (-3.87)***
-54.29 (-2.36)**
-78.17 (-3.88)***
Callable 29.61 (1.24)
24.95 (1.06)
11.89 (0.55)
24.50 (1.04)
17.34 (0.65)
30.07 (1.30)
First-time issuer 38.05 (2.83)***
23.98 (1.56)
25.94 (1.60)
24.96 (1.58)
31.32 (1.23)
32.24 (2.13)**
Rule 144A 19.40 (1.35)
19.45 (1.36)
10.83 (0.79)
22.56 (1.53)
23.81 (1.29)
19.39 (1.34)
Zero or step-up 166.54 (5.52)***
167.18 (5.52)***
176.90 (5.63)***
168.75 (5.58)***
174.30 (2.85)***
166.31 (5.55)***
Clawback
4.86 (0.30)
9.08 (0.57)
11.66 (0.79)
7.17 (0.45)
-8.47 (-0.40)
11.63 (0.72)
Treasury spread -0.26 (-0.03)
-1.52 (-0.19)
0.53 (0.07)
-1.93 (-0.24)
11.26 (1.03)
1.07 (0.13)
HY index 0.59 (8.29)***
0.64 (8.46)***
0.65 (9.32)***
0.62 (8.34)***
0.69 (7.05)***
0.65 (6.76)***
Total assets -2.23 (-0.52)
Leverage 62.87 (2.80)***
EBITDA margin 0.32 (0.33)
Yr. & Ind. Controls Yes Yes Yes Yes Yes Yes NObs 607 607 513 607 274 607
R-squared 0.5624 0.5686 0.6084 0.5663 0.5079 0.5683
This table reports regression results of the (at-issue) benchmark spread on several firm and issue-specific characteristics for the sample of U.S. high-yield bonds issued between 2000 and 2008. The estimation method is the two-step Heckman selection model (second-stage regression), except for specification (1), which is estimated using OLS (for purposes of comparison). Specification (6) uses only data for bond issuers listed on NYSE or AMEX to highlight the effect of reputational exposure. First-step regression of the Heckman model is based on regression specifications as shown in Table 5. All variables are defined in Table 2. All regressions include a constant term (not reported); t-statistics (in parentheses) are based on issuer-clustered standard errors. Asterisks denote statistical significance at the 0.01(***), 0.05(**), and 0.10(*) level.
Related Documents