Underwater Photographic Lighting Using Light Emitting Diodes by Saul Rosser B.S. Mechanical Engineering and Computer Science Yale University 2001 Department of Ocean Engineering in Partial Fulfillment of the Requirements for the Degree of Masters of Science in Ocean Engineering at the Massachusetts Institute of Technology February 2003 MASSACHUSETTS INSTITUTE OF TECHNOLOGY JUL 1 5 2003 LIBRARIES 2003 Saul Rosser. All rights reserved. The author hereby grants to MIT permission to reproduce and distribute publicly paper and electronic copies of this thesis document in whole or in part. Signature of Certified by... A uthor.................................... Department of Ocean Engineering January 16, 2003 I / Chryssostomos Chryssostomidis Professor, Ocean Engineering Department Thesis Supervisor A ccepted by....................... ................. Arthur B)l aggeroer Chairman, Departmental Committee on Graduate Studies BARKER Submitted to the

Welcome message from author
This document is posted to help you gain knowledge. Please leave a comment to let me know what you think about it! Share it to your friends and learn new things together.
Transcript

Underwater Photographic Lighting Using LightEmitting Diodes
by
Saul Rosser
B.S. Mechanical Engineering and Computer Science
Yale University 2001
Department of Ocean Engineering in Partial Fulfillment ofthe Requirements for the Degree of
Masters of Science in Ocean Engineeringat the
Massachusetts Institute of Technology
February 2003
MASSACHUSETTS INSTITUTEOF TECHNOLOGY
JUL 1 5 2003
LIBRARIES
2003 Saul Rosser. All rights reserved.
The author hereby grants to MIT permission to reproduce and distribute publicly paperand electronic copies of this thesis document in whole or in part.
Signature of
Certified by...
A uthor....................................Department of Ocean Engineering
January 16, 2003
I / Chryssostomos ChryssostomidisProfessor, Ocean Engineering Department
Thesis Supervisor
A ccepted by....................... .................Arthur B)l aggeroer
Chairman, Departmental Committee on Graduate Studies
BARKER
Submitted to the

Underwater Photographic Lighting Using Light Emitting Diodes
Saul RosserSubmitted to the Department of Ocean Engineering in Partial Fulfillment of theRequirements for the Degree of Masters of Science in Ocean Engineering at the
Massachusetts Institute of TechnologyFebruary 2003
Abstract
This document describes experiments involving the use of Light Emitting Diodes
(LEDs) for underwater photographic illumination. In addition an overview of underwater
photographic systems, including light sources, lighting arrangements, cameras and image
processing algorithms, is provided. While this document is focused primarily on
photographic systems based on Autonomous Underwater Vehicles, many of the
considerations are applicable to manned and remotely operated submersibles. The use of
LEDs is motivated by several considerations including efficiency, size, spectral emission
characteristics, reliability and lifespan. A description of the current state of LED
technology is included, and the conclusion is reached that absolute efficiency in and of
itself does not provide an overwhelming argument for the use of LEDs. But, when LED
efficiency levels are combined with spectral emission characteristics, a strong argument
is indeed made for the use of LEDs for certain illumination purposes. The potential
advantages of the small size of LEDs is explored through experiments using distributed
LED arrays to produce more uniform illumination fields than are provided by traditional
light sources. It is seen that LEDs can provide a similar (and in some cases superior)
quality of illumination when compared with an incandescent lamp.
Supervisor: Chryssostomos Chryssostomidis, Professor of Ocean Engineering
2

The research described in this document was conducted in MIT Sea Grant's AutonomousUnderwater Vehicle (AUV) Laboratory. This lab is a part of the National Sea Grantprogram. Funding for research related expenses was provided by the Sea Grant Lab.Major funding was provided by the United States Navy's Office of Naval Research in theform of a National Defense Science and Engineering Graduate Fellowship. Significantguidance and assistance was provided by Prof. Chryssostomos Chryssostomidis as wellas the engineers in MIT's AUV Lab, especially Sam Desset. The author would also liketo acknowledge the assistance of Dr. Hanumant Singh and his graduate students ChrisRoman and Ryan Eustice from the Deep Submergence Laboratory at the Woods HoleOceanographic Institute. Valuable conversations were held with many others, includingPenny Chisholm and Al Bradley at Woods Hole, and engineers at General Dynamic'sElectric Boat Corporation.
The author can be reached at the permanent forwarding [email protected].
3

Table of Contents1) Introduction
i) Underwater Opticsa. Electromagnetic Spectrumb. Human Vision (Photopic) and Units of Measurec. Transmission in Clean and Dirty Waterd. Scattering: Backscatter and Forward Scattere. Refraction and Reflection
ii) Traditional Underwater Photographic Lightinga. Incandescent Lampsb. Halogen (Quartz) Lampsc. Flourescent Lampsd. High Intensity Discharge Lampse. Strobe Lightsf. Efficiency Datag. Techniques to Reduce Backscatterh. Light Manufacturers
iii) Camerasa. CCD Overviewb. Spectral Responsec. Color Imagingd. CCD Densitye. Resolutionf. Sensitivity and Dynamic Rangeg. System Speedh. Camera Manufacturers
iv) Post Processinga. Storage and Compressionb. Filteringc. Histogram Equalizationd. Edge/Corner Detectione. Mosaicing
v) Measurement of Optical Water Propertiesa. Ambient Light Measurementb. Absorbtion and Scattering Measurements
2) Overview of Light Emitting Diodesi) Emitter Designii) Optical - Mechanical Designiii) Improvement Trendsiv) Emitters Currently on the Market
4

3) Theoretical Look at Establishing Lighting Patterns Using LEDs.i) One-Dimensional Attenuation Calculationsii) Illumination Patternsvi) Example of Sizing a Light Source
4) Experimentsi) Design Considerations
a. Oil Housingsb. Pottingc. Focusing LEDs Underwater
ii) Prototype Constructioniii) Test Platform Constructioniv) Experiment and Results
a. Dry Testsb. Wet Experiments
5) Future Work and Conclusions
BibliographyAppendix
5

Chapter 1: Introduction
Light Emitting Diode (LED) technology has seen significant improvements in
recent years. Increased efficiency and output have allowed LEDs to grab a significant
(albeit still small) portion of the general illumination market. LEDs remain expensive, at
least in terms of purchase price, when compared to their competitors. But, in high-end
applications and especially in applications in which energy efficiency, reliability, spectral
output, or size are critical, LEDs often have a competitive advantage.
Autonomous Underwater Vehicles (AUVs) are such a high-end application, and
the efficiency, spectral output, and small size of LEDs make a strong argument for their
use in certain illumination roles on AUVs. As a specific example, the Odyssey class
vehicle "Xanthos" operated by the Massachusetts Institute of Technology currently uses a
50 watt incandescent lamp to provide artificial illumination. This 50 watts of
consumption compares to a total system load (with light off) of around 100 watts. Thus
reduction in the lighting power requirements for vehicles such as this will result in
significant increases in range and autonomy and thus significant cost savings. As shall be
shown, it is not simply in terms of absolute efficiency that LEDs show advantages over
many traditional light sources, but the fact that LED emissions are typically in a narrow
band of the electromagnetic spectrum means that light output can be concentrated at
wavelengths that transmit readily through water.
In addition to emission characteristics and efficiency, the small form factor of
LEDs could provide significant benefits. Not only is there the obvious benefit of reduced
total space requirements, but their discrete nature allows individual emitters or groups of
6
emitters to be spread out across the vehicle platform. As a result, the production of fairly
uniform illumination patterns is facilitated.
This paper begins with a thorough review of underwater photography
fundamentals. This includes a review of underwater optics, traditional lights and
cameras, as well as the post processing of data. Following this overview of underwater
photography, a description of the current state of technology in LED emitters is
presented. There is then a chapter describing computer-based models for the design and
analysis of light sources and lighting arrangements. Finally, the construction of an LED
light source is described along with experiments involving distributed light sources and
the comparison of the illumination fields provided by an incandescent lamp and an LED
array.
1.i: Underwater Optics
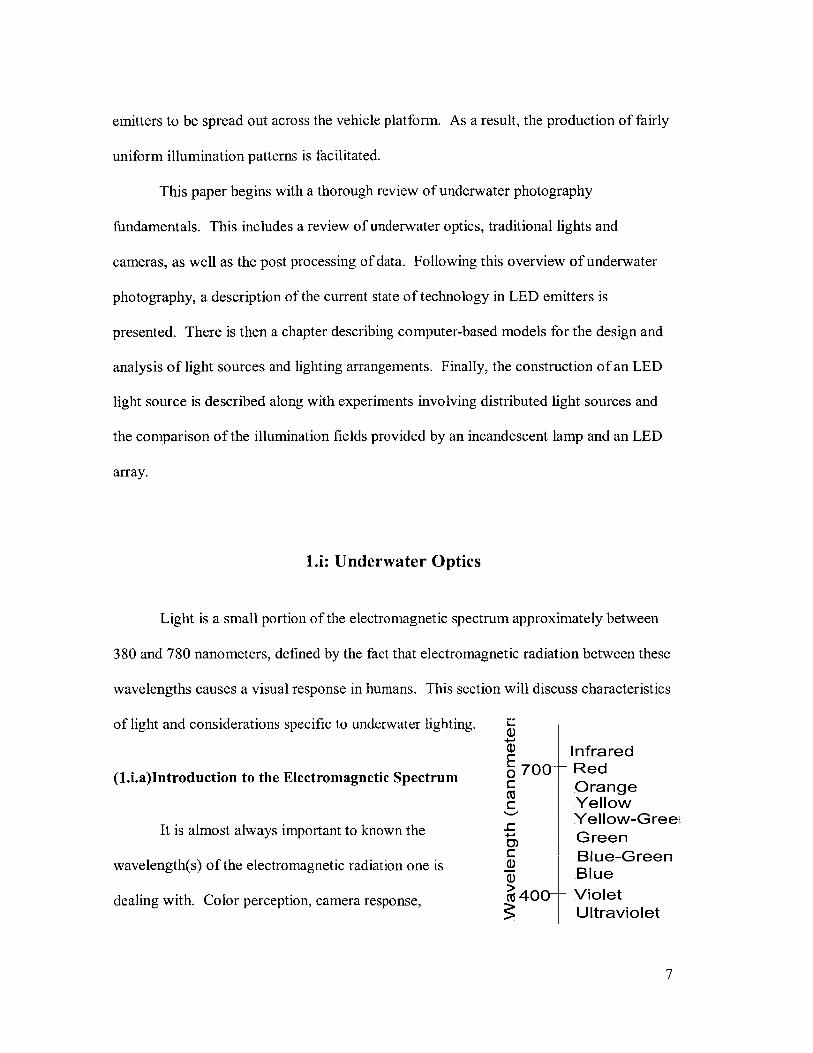
Light is a small portion of the electromagnetic spectrum approximately between
380 and 780 nanometers, defined by the fact that electromagnetic radiation between these
wavelengths causes a visual response in humans. This section will discuss characteristics
of light and considerations specific to underwater lighting.
InfraredE(1.i.a)Introduction to the Electromagnetic Spectrum 7O RedC Orange
YellowYellow-Greei
It is almost always important to known the GreenC Blue-Green
wavelength(s) of the electromagnetic radiation one is Blue
dealing with. Color perception, camera response, 400-- VioletUltraviolet
7

attenuation, refraction, and many other phenomena are wavelength dependent. It is also
important to realize that no sources emit light at a single wavelength, although colored
LEDs tend to emit over narrow bands of the spectrum. The figure shows the color
breakdown of the visible spectrum.
Because light is a combination of wavelengths, it is often necessary to use
numerical methods to integrate across the relevant portions of the spectrum when
performing calculations. Such integration is seen in the code for comparing light sources
that was developed for this report and is described in chapter 3.
(1.i.b)Human Photopic Vision and Units of Measure
If you do any significant calculations, the systems of units used by lighting
engineers will quickly annoy you. There are two sets of units: radiometric and photopic.
Radiometric units, as the name suggests, are a part of the metric system, and deal in units
such as Watts. Photopic units, on the other hand, attempt to account for the human visual
response. That is, values expressed in radiometric terms will tell you how much light
energy is striking a surface (for example), but photopic units will convey the intensity of
that light as perceived by humans. This is a significant difference because humans do not
have a uniform response to light across the visual spectrum.
In reality, not only does the human visual response depend on wavelength, but the
response varies from person to person. Therefore, it was necessary to develop a model of
the "typical" human response, for engineering purposes. This model was developed by
8

the Committee International de L'Eclairage, producing the International Luminosity
Function for Photopic vision, as seen below.
Inter. Photopic Luminosity FunctionCIE
1.0000.0.9000 ,* *00.8000 - *>, 0
0.7000-S 0.6000-e
w 0.50001e. 0.4000 *i 0.3000-*
0.20001S0.4000
350 400 450 500 550 600 650 700 750 800
Wavelength (nanometers)
This function is very idealized and does not account for many important aspects of
human vision. It also only accounts for photopic (normal) vision, as the function for
scotopic (low-light) vision is completely different. However, this function is useful in
that it allows for the translation between radiometric and photometric units. The
International Photopic Luminosity Function provides this translation according to the
formula L = ClVxEx. Where L is in units of Lumens, C is somewhere between 630 and
680 lm/W (assume 650 lm/W.), Vo is the relative human response at a given wavelength,
and E is the energy in Watts at that wavelength. Thus the summation of the product of V
and E across the spectrum provides the luminosity. The function is shown in tabular
form in the appendix for use in calculations (Keitz).
9

To help you work with both radiometric and photometric units, the table below
lists some common units of measure in both systems. The table was adapted from
Illumination Fundamentals by Alma Taylor.
RADIOMETRIC PHOTOMETRIC
QUANTITY Symbol Units Symbol UnitsWavelength X nanometer(nm) X nanometer(nm)Radiant & Luminous Energy Q watt-seconds(W-s) QV lumen-seconds(lm-s)Radiant & Luminous Energy U watt-seconds/M 3 U, lumen-seconds/ m3 (lm-s)
Density (W-s/m 3 ) (lm-s/m 3)Radiant & Luminous flux <D watts a), lumens
(power) (W) (im)Irradiance & Illuminance E watts/ M2 (W/ M2
) Ev lux(lx; lm/m 2) orFootcandle (fc; Im/ft 2)
Radiance & Luminance L watts/m2/steradian L1 Im/m2/sr
(W/ m2/sr)Radiant & Luminous I W/sr I, candela (cd; lm/sr)
Intensity
Illuminance is energy flux per unit area, irradiance is energy received at a surface per unit area, radiance isthe irradiance per unit solid angle, luminance is the illuminance per unit sold angle.
(1.i.c)Transmission in Clean and Dirty Water
As light travels through a material it experiences losses as electromagnetic energy
is transformed into other forms of energy, such as heat. The rate at which this occurs will
depend on the material, but it will also depend very significantly on the wavelength of the
light. For our purposes, we are most interested in the attenuation characteristics of water.
We start as a baseline with the attenuation characteristics of pure water, with the
understanding that all natural waters will have contaminants that will increase the
attenuation rate at all wavelengths. The figure below shows the transmittance properties
of pure water (Tabulated values are in the appendix.).
10

Transmittance of Pure WaterFrom: Marine Optics, Chap.3 1976. Elsev
00
0
0
0
100
90-
80
70
60-
50-
40-
30
20--
130350 400 450 500 550 600 650
Watelength (nm)
.0
700 750 800
As can be seen, transmittance in the short wavelength portion of the visible spectrum is
much greater than the transmittance in the high wavelength portion. It is therefore
apparent why large (clean) bodies of water typically appear blue. It should also be clear
why, in later sections, we will focus on using blue light for illumination.
In order to use transmittance and the related value of attenuation in calculations,
make use of the following two formulas.
I= Io(t)x and I = Ie-,
where I is the original light intensity, "x" is the distance traveled through the material,
"t" is the transmittance value, "a" is the attenuation coefficient, and I is the transmitted
light intensity.
1 1
E
A-_
a)
EC
0

The transmission rates shown above are for pure water. As mentioned
previously, natural water has lower rates of transmission at all wavelengths. But, how
much lower? A term often used is the "attenuation length" which is defined as the
reciprocal of the attenuation coefficient. It is also the length over which the radiant flux
is reduced to l/e (approximately 37% of the original). Duntley reports that in daylight
and horizontal viewing, a diver can detect dark objects at up to 4 attenuation lengths and
a light object at a maximum of 5 attenuation lengths. Some typical values for attenuation
coefficient, as provided by Duntley, are given below.
Location Attenuation Length (m)Caribbean Sea 9Pacific N. Equatorial Current 12Pacific Countercurrent 12Pacific Equatorial Divergence 10Pacific S. Equatorial Current 9Gulf of Panama 6Galapagos Island 4
In deep clear water, such as some
of the Pacific waters listed above,i. MORW4
attenuation properties are similar to those
for distilled water. For example, distilled *
water will have an attenuation length
around 11 meters for blue-green light at L.o" aLAND oN
575 nanometers. However, as with the
water in the Gulf of Panama or around the
Galapagos Island listed above, some Tj"S
w 400 OerOwaters will have transmission WAi.'NGm ;OAtj
12

characteristics that differ significantly from those of distilled water.
The figure shown (taken from Kinney et al.) provides another look at the
transmission characteristics of dirty water. The upper curve for water at Morisson
Springs very closely approximates the curve for pure water. It is seen that Gulf of
Mexico water also very closely approximates pure water for much of the spectrum.
However, dirty water can clearly greatly reduce the transmission rate. In addition, it is
seen that as a general trend the peak transmission point shifts to higher wavelengths the
dirtier the water.
(1.i.d)Scattering: Backscatter and Forward Scatter
Electromagnetic radiation is absorbed as a function of distance traveled, and as
just shown the rate of absorbtion in dirty water can be much greater than the rate of
absorbtion in pure water. Unfortunately, not only does dirty water absorb light more
rapidly, but suspended particles also reflect, or scatter, light. As a result, the distance
over which acceptable images can be taken is fundamentally limited. There are two types
of scattering that need to be dealt with. Forward scatter involves the deflection of light
rays at small angles from their initial path, while backscatter involves the reflection of
light back towards the source (and more importantly, the camera). Large efforts are often
taken to reduce the effects of backscatter, and these will be discussed in section (1.ii.g),
but the IESNA Lighting Handbook reports that regardless of what efforts are made to
reduce backscatter, blurring caused by forward scatter limits the range at which an image
can be taken to approximately 15 attenuation lengths. As will be discussed further in
section (3.ii), the limits due to backscatter are typically much more restricting.
13

(1.i.e) Refraction & Reflection
At the interface between two different materials, two important reactions can take
place. Reflection is familiar to all of us. For light incident on a polished, specular
surface, light is reflected at an angle equal to the incident angle (where "angle of
incidence" is defined as the angle from the perpendicular). On a rough surface, light is
reflected at multiple angles, but with the peak reflected intensity being at the same angle
as the angle of incidence. Finally, for a matte surface, light is reflected in the same
angular pattern irrespective of the angle of incidence. The model of a "lambertian"
scatterer is often used to describe reflection from a matte surface. Under this model the
intensity of reflected light goes as the cosine of the angle from the perpendicular.
Refraction occurs when light travels from one material into another. Indeed, at
the interface between two materials, refraction and reflection typically coexist. Both the
amount of reflection and the angle of refraction are determined by the relative indices of
refraction "n" of the two materials. "n" is the ratio of the speed of light in a vacuum to
the speed of light in the material, a value strictly greater than one. For light normally
incident to a boundary between two materials, the loss of transmitted intensity due to
reflection is given by r (n2 12 where "r" is the reflective loss, or the portion of the(n 2 + n)
light which is reflected.
14
The angle of refraction at the interface between two materials is defined as
follows n, sin(Q, )= n2 sin(Qi 2 ), where "ni" is the index of refraction of the respective
material, Q 1 is the angle of incidence of the incoming ray, and 22 is the angle of the
transmitted ray (again defined from the perpendicular).
Before moving on, we should note that the speed of light in a material, and thus
the refractive index, depends on the wavelength of the light. For extremely exacting
calculations, this must be taken into account, but for our purposes, this is of no great
significance.
1.ii: Traditional Artificial Lighting
This section first looks at the types of light sources commonly available to the
underwater optical engineer. Practices to improve the effectiveness of these light sources
in the underwater environment are then discussed.
(1.ii.a) Incandescent Lamps
An incandescent lamp, the traditional light bulb, consists of a filament (typically
tungsten) heated to the point of incandescence by an electric current. The special gas
composition in the glass envelope around the filament prevents the rapid combustion of
the filament. However, deterioration of the filament still takes place. This deterioration
can be seen in the darkening of the inner glass surface on well-used light bulbs as a result
of the deposition of filament material.
Incandescent lamps have a high output in the infrared region. This output is
clearly not useful for human vision, and while typical cameras will have a significant
1-5

response in the infrared, the transmission of infrared radiation through water is negligible.
Therefore, incandescent lamps experience large losses in underwater use.
Below is a plot of the output of a theoretical object known as a "Black Body". In
this particular case the Black Body has a temperature of 3000 degrees Kelvin.
3000 K Black BodyAprox. DSP&L Multi-SeaLite
1.00.910.8
3 0.70.60
a) 0.5--M 0.4-
n 0.30.20.10.01
400 600 800 1000 1200 1400 1600 1800 2000
wavelength (nm)
This plot is being shown because the spectral output of incandescent lamps is often given
in terms of a "color temperature". In this way, the spectral distribution of a light source
can be approximately represented by the spectral output of a theoretical "Black Body" at
a given temperature. For example, engineers at Deepsea Power and Light report that
their Multi-SeaLite does indeed fairly well match the output of a Black Body at 3000 K.
The equation for the output of a black body is
B (T)= 52hc2 1 where T is the "color temperature", h is Planck's constant
e AT--
(6.625*10A34 Joule-second), c is the speed of light in a vacuum (2.998*lOA8m/s), and k
is 1.381*10A-23 J/K.
16

(1.ii.b) Halogen (Quartz) Lamps
Halogen lamps are almost identical to traditional incandescent lamps, however the
"bulbs" are filled with a halogen gas. The result is a "halogen cycle" in which tungsten
from the filament evaporates, combines with the halogen, and eventually winds up back
on the filament rather than accumulating on the inner walls of the bulb. There are several
other differences as well. The color temperature of halogen lamps is typically higher
than that of traditional incandescents, which translates to a "whiter" or "cooler" light.
These lamps are often called "quartz" lamps because the bulbs are typically made of
quartz in order to withstand the higher operating temperatures. (Alma)
Indeed, heat dissipation is an important consideration for all light sources.
Numerous are the stories of people melting their underwater lighting system while
performing tests in the lab or on the deck of a ship.
(1.ii.c) Fluorescent Lamps
Fluorescent lamps are filled with low-pressure mercury vapor along with some
inert gas. Once an arc is initiated through the gas, ultraviolet radiation is emitted. This
radiation then interacts with phosphors on the inner surface of the glass bulb, producing
visible light. Fluorescent lamps require a ballast to provide the appropriate electric
supply to the lamp. These ballasts can either be magnetic or electronic, with the
electronic ballasts being more expensive, but superior in several regards, including
reducing flicker. (Alma)
17

We are all familiar with the linear fluorescent lamps used in many applications,
but recently there has been a strong development of so-called "compact fluorescent"
lamps. These are, not surprisingly, relatively small and plug into standard "Edison" style
light bases (ie, your standard screw in house bulb). They often, though not always,
consist of a single unit containing both ballast and fluorescent tube.
Fluorescents show efficiencies significantly greater than those of incandescents.
Unfortunately, there are several drawbacks. First, they have slow start up times and tend
to flicker during operation. They are also inherently complicated, like most other types
of light sources, when compared to an incandescent. However, with recent advances in
compact fluorescents and the continued drive to improve them for efficient household
lighting applications, it would not be surprising if the state of technology rises to the
point where compacts become a viable alternative for some continuous underwater
lighting applications.
(1.ii.d) High Intensity Discharge
A fluorescent lamp is a discharge lamp. That is, a current is passed through a gas
causing the emission of electromagnetic radiation. All discharge lamps have a ballast
which supplies the appropriate electrical conditions to the electrodes. Discharge lamps
also include HMI lamps and High Intensity Discharge (HID) lamps. These lamps
typically have significant starting times, and once the arc is established, they typically
require time to heat up before maximum output is achieved. Therefore, these are usually
not appropriate for strobe or cyclic applications. HMI lamps produce light with a
spectrum similar to natural sunlight and have become very popular for high end video
18

applications (such as documentary work). HID lamps are very similar to HMI lamps but
use a magnetic ballast rather than an electronic ballast. HID and HMI lamps provide
lumen outputs typically several times that of incandescents (see section 1.ii.f) and thus
are ideal for many Remotely Operated Vehicle illumination purposes. Unfortunately,
neither HID nor HMI lamps typically come in powers less than 100 watts, and thus their
application to AUVs is for the time being limited.
(1.ii.e) Strobe Lights
For AUV operations continuous video has significant drawbacks. Not only is
there the requirement to store and process all of the data produced by the video stream,
but there is also the need for continuous lighting. For both these reasons many AUV
developers are turning to still photography.
Still photography on AUVs typically requires that light be produced every few
seconds over a period of a few milliseconds. For this purpose, flash or strobe lights are
used. A standard flash consists of an arc-tube filled with Xenon gas through which a
current is passed producing a significant quantity of light. The current is supplied to the
arc-tube by a capacitor. Therefore, after each flash it can take several seconds for the
capacitor to charge before another flash can occur.
The xenon in the arc-tube does not normally conduct electricity. For a flash to
occur, the gas must be ionized. This is accomplished by a second, smaller, capacitor that
is discharged through a transformer producing a very high voltage. This high voltage is
supplied to a third electrode in the arc-tube, ionizing the gas. Once the gas is ionized, the
19

main capacitor discharges in a time frame on the order of a millisecond. The gas then de-
ionizes and the capacitor recharges.
(1.ii.f)Efficiency Data
Following is a chart of light types and their approximate range of efficiencies.
This data has been adapted from the IESNA Lighting Handbook and is reported to be
accurate as of 1994. It should be noted that most light manufacturers list efficiency in
terms of Lumens/Watt. This makes sense when light is being used for human vision.
However, for camera vision, especially monochromatic camera vision, we are primarily
interested in the amount of output in units of watts. Unfortunately, translating between
Lumens and Watts is difficult without the spectral characteristics of each light source.
Source Efficacies
Lumenst Watt (Lamp & Ballast)
0 20 40 60 80 100 120 140 160 180
Incandescent
ngsten Halogen
Halogen InfraredReflecting
Mercury Vapor CompactFlourescent (5-26
watt) CompactFlourescent (27-
Flourescent (full 40 Watt)size, U-Tube)
Metal HalideCompact Metal
HalideHigh Pressure
SodiumWhite Sodium
20

(1.ii.g) Techniques to Reduce Backscatter
A significant problem experienced with underwater lighting is backscattering,
which is manifested with the reflection of light towards the camera from suspended
particles in the water column. This can cause problems from a few bright spots in the
image, to a complete "silt-out". Several methods have been developed to minimize the
effect of backscatter and they will be described in this section. The fundamental idea in
all these approaches is to reduce the ratio of backscattered light to light reflected from the
target.
Light Separation
The most common approach to reducing backscatter is to simply separate the light
source and camera. The distance of
separation is typically limited to the Negligible Camera-Light SeparationLight Camera
dimensions of the camera platform,
but there are other possibilities as
will be discussed.
The fundamental reason that
separation is effective is that you are Significant Camera-Light Separation
Lght Cameramoving the highly illuminated body
of water in front of the light source
away from the front of the camera.
As can be seen in the two-
21

dimensional sketch, increased separation reduces the portion of the water column in front
of the camera that is directly illuminated. In addition, the very intense illumination
directly in front of the light source is moved away from the camera. As is also apparent
from these sketches, increased separation results in a penalty in terms of power
requirements.
Light separation distance is in no way limited to the dimensions of one's vehicle.
A single light source may cause problems, such as shadowing and uneven illumination.
Thus, it may make sense to provide multiple light sources, either on one vehicle, separate
vehicles, or via drop or "offload" lights. Cooperative vehicle operations have also
become a popular area of research in recent years. Multiple vehicle interactions have
been seen with towed sled based lighting systems working with an ROV based camera
system. Such a system was developed at the Institute for Exploration in Mystic, CT with
their ARGUS and Little Hercules vehicles. This system involves the placement of a high
definition video camera on Little Hercules (the ROV) which uses light produced by the
pair of 1200 watt HMI lights aboard ARGUS (the towed sled). The Institute for
Exploration has also developed what they call an "offload" light. This is a Deep Sea
Power and Light 1200 watt HMI lamp with a stand and batteries which is dropped from
the ARGUS sled. The light source is then controlled via acoustic modem, with
commands for pan, tilt, on/off, and drop weight release for recovery at the surface.
(Coleman et al.) It is not difficult to envision similar arrangements for AUVs. For
example, LED based "offload" lights scattered around a scene prior to an image being
taken. This concept may become much more appealing once LED prices drop to the
point that these lights could be considered disposable.
22

Laser Range Gating
The idea behind laser range gating is to very briefly "flash" a powerful light
source and then temporally isolate the return from the target. If this can be done
effectively, noise from backscatter will be all but eliminated. Unfortunately, this is not
easy to implement, which is why it is not widely used.
Swartz and Cummings (1991) gives the following promotion for laser range
gating. "Sensitive ICCD [Intensified Charge Coupled Device] cameras are now
commercially available which are able to be gated down to five nanoseconds. High peak
power, reliable lasers are capable of delivering pulses of comparable temporal width in
the blue/green spectral region. The marriage of the technologies allows the construction
of range gated underwater imaging systems with unprecedented performance. Such
systems have the advantages of: 1) being able to be made coaxial for compact packaging
since source-receiver separation is not required; 2) not imposing restrictions on platform
stability because system-target relative motion is extremely unlikely to effect the image
when a full frame is acquired in less than IOns; and 3) being highly insensitive to
background ambient or back lighting since the receiver is simply not "on" long enough to
integrate significant background which is dominated by the high peak power illumination
during the gate period." In terms of power requirements, there is no fundamental reason
why the total energy required by this sort of system need differ significantly from any
other still photography system [See chapter 5 for a discussion of still photography power
requirements.].
However, there seem to be several major difficulties with this approach. First,
you need to be able to incorporate and power the appropriate equipment on your vehicle.
23

Assuming your vehicle can support the equipment, you still have the problem of needing
to know fairly accurately your distance from the target. And, even if you know this, you
could suffer substantially if the target is not at a uniform distance from your vehicle.
That is, if the target is uneven ground, you would have to lengthen the gate period, and
thereby reintroduce some of the backscatter. Put another way, the less sure you are of the
distance to the target, the longer the gate period must be.
(1.ii.h) Light Manufacturers
Underwater Light Manufacturers:
Remote Ocean Systems, Deep Sea Power & Light, Carillo Underwater Systems, Deep
Sea Systems, Benthos, Insite Systems, Outland Technology.
Strobe Light Manufacturers:
Bron, Norman, Speedotron, Photogenic, Dyna-Lite, Foba, Elinchrom, Novatron,
Speedotron, Mole-Richardson, Photoflex, Quantum.
1.iii Cameras
This section provides an overview of camera technology along with a listing of
some prevalent camera manufacturers. Due to the high quality of modern Charge
Coupled Devices (CCDs), it is assumed that film cameras will not be desirable for most
applications. For purposes such as high quality motion picture film recording or ultra-
detailed surveys, a film camera might show some benefits. Indeed, the Institute for
24

Exploration in Mystic, CT used a film camera in addition to digital video and still
cameras on their towed sled during their year 2000 Black Sea expedition (Coleman et al.)
But, even some recent Hollywood pictures have been made completely without film,
providing a further indication that CCD based imaging has reached a high level of
maturity.
We begin with an overview of CCD technology. For another perspective, visit
www.ccd.com or one of the many books on the subject (see bibliography).
(1.iii.a) CCD Overview
While originally intended as a memory device, Charge Coupled Devices (CCDs)
have become a key player in the imaging market. Typically made on a silicon chip,
CCDs convert incident light to an electronic charge at each pixel ("picture element")
location, and the individual charges are then read out.
A photon striking the silicon causes an electron-hole pair to develop with a
probability given by the Quantum Efficiency (QE). The number of electron-hole pairs
produced is linearly dependent on the number of incident photons (ie, light intensity and
exposure time), and nonlinearly dependent on the wavelength. A CCD consists of an
imaging area, where the incident light is converted to charge, and some method of
readout.
There are many different types of CCD arrangements, but a typical configuration
will be described now.
25

00
-C
C/)
0
V
g IRegisters Shift Right ->
The above diagram shows the basic scheme for CCD charge readout. The charges
are produced in each CCD element (the portion labeled "Pixels"). Then, at the end of the
imaging period, the entire image is shifted down a row. The bottom row of pixels is now
contained in the row of horizontal registers. This row of registers is then shifted to the
right such that the bottom right element of the picture is placed in the output register.
This output register is put through an amplifier circuit and outputted by the CCD, to be
recorded (or displayed). Once this first pixel value is recorded, the row of registers is
again shifted so that the second pixel can be outputted. This shifting repeats until the
entire bottom row of the image has been recorded. Once this bottom row is recorded, the
entire image is shifted down again so that the second row from the bottom can be
recorded. This process repeats until the entire image has been outputted. The means of
shifting the elements from row to row or register to register is discussed in more detailed
26
L.4-
E
-0
00
A
OutputIRi ictehr
itV8

texts (see bibliography for cameras). Of course, there are a number of variations on this
basic scheme.
(1.iii.b) Spectral Response
Every CCD has a unique spectral response curve. The curve for the Remote
Ocean Systems' "Navigator" low light camera is shown here as an example.
Ros Navigator Spectral ResponseAdapted from data provdided by ROS
0.9-
0.8
0.7
0.61
co 0.51.50.41
0.2-0.1--0.0-
400 500 600 700 800 900 1000
waxelength (nm)
As is discussed in section (1.i), because of the attenuation properties of water, blue-green
light (in the range of 470-500 nm) is ideal for underwater lighting. While it is clear from
the spectral response curve for the navigator that this camera is most sensitive to light
with wavelengths over 600 nanometers, the response in the range of 470-500 nanometers
is still significant.
It is also apparent that the Navigator has a significant response in the infrared,
outside the visible spectrum. However, due to water's strong attenuation of
electromagnetic radiation in this portion of the spectrum, this high-wavelength response
27

is usually not beneficial to us. (ROS Navigator data provided by ROS technical support,
www.rosys.com.)
Note that the data for the Navigator presented above shows relative response,
rather than absolute quantum efficiency. See the section below on back-lighting for
approximate quantum efficiency values.
(1.iii.c) Color Imaging
Tri-linear sensors provide for color imaging by splitting the incoming light into
three paths, and shining it on three separate CCDs, each coated with a filter resulting in
the detection of red, green, or blue. This system has two obvious drawbacks: inherent
complexity, and the requirement of very accurate alignment of the optics. In addition,
there is a loss of sensitivity due to the splitting of the incoming light into three different
paths. This scheme is often used in high-end cameras. It should be noted that because
the response of CCDs in blue wavelengths is relatively low, in a tri-linear device, the
CCD with the blue filter requires significantly longer imaging times than the other two
sensors.
Color images can also be acquired by a single CCD, with adjacent pixels
detecting distinct wavelengths. This format has an obvious disadvantage of reduced
resolution for a given CCD size, but is of lower complexity and thus smaller size and
lower cost. A third, newly emerging, technology for color imaging consists of a layered
array in which each layer of the CCD measures and absorbs a different wavelength of the
incident light. This arrangement appears to allow for color imaging without either a
significant loss in resolution or a significant increase in complexity. Commercial models
28

of this type of device have been developed by the Foveon company in the form of the
FoveonX3. However, these devices are currently only available in consumer electronics
and have not made their way into high-end cameras.
(1.iii.d) CCD Density
Whether imaging in color or black and white, there is a tradeoff between the
density (number) of pixels on a chip and the sensitivity of that chip. This is obvious if
one considers that increased density reduces the surface area for each pixel. Of course, if
one wishes to increase the number of pixels, and thus the spatial resolution, without
detracting from sensitivity, one can simply build a larger CCD. Indeed CCDs with pixel
counts of 4096 x 4096 or larger have been reported to be commercially available, with
much larger CCDs having been produced for specialty applications such as astronomical
observatories (Janesick). However, there are two drawbacks to large devices. First, the
larger the device, the more expensive, in a highly nonlinear fashion. And, second,
assuming l6bit encoding, a 4096x4096 device will produce 3.3 megabytes of storage for
each image. This might not be a problem for collecting a few still frames, but for video
at 30 frames a second, storage constraints might quickly arise. Even worse, it requires
time to read all of this information off a CCD, which might greatly affect your frame rate.
The lesson here is that larger is not necessarily better, and it is important to consider how
much information (detail) you really need in your images.
(l.iii.e) Resolution
While the density and size of a CCD places limits on the resolution of a camera,
29

density and size figures do not tell us all we need to know. Other things, such as optics,
can greatly affect a camera's resolution. However, exactly how a camera manufacturer
achieves a certain resolution is unimportant. Rather, published resolution data can be
used directly to compare cameras. But, how is resolution determined? Following is a
listing of schemes for measuring, in one form or another, the resolution of a camera. This
listing has been adapted from Bloss et al.
Total number ofpixels - This is the density and size we have just discussed.
Lines per mm/lines per image height - This is more or less the standard method of
defining the resolution of a digital or video camera. Typically a camera's literature will
specify a certain number of horizontal lines of resolution (typically between 400 and
500). The actual measurement of "horizontal resolution" involves the use of specialized
and calibrated test equipment, the details of which are not of interest to us. However,
these values are generally reliable, and tell us most everything we need to know about a
camera's resolution.
Modulation transferfunction - This is an analog method and requires a special test chart
with sinusoidal gray values. This data, when combined with information on the number
of pixels per image allows you to calculate absolute system resolution.
Spatialfrequency response- Uses a test chart with a single border between black and
white regions.
30

Visual Impression - Human visual reactions are obviously a very subjective method of
determining an images resolution. A representative method would involve the use of a
test image with text printed on it. The test would then be to see at what dimensions (ie,
camera distance) the text is legible. An experiment involving human impression was
conducted by Kodak in the middle of the 2 0th century. The researchers were attempting
to determine the minimum exposure requirements for photographic film. Therefore, they
took a series of shots of a scene at different levels of exposure. They then asked people
to decide which shot represented the first "decent" image. Of course, people will have
many different opinions, but by using a large sample space (many people), useful results
can be obtained. (Hicks)
(1.iii.f) Sensitivity and Dynamic Range
Cameras typically state a minimum illumination level in terms of lux
(lumens/meterA2), which represents the minimum amount of light that must be incident
on the front plane of the camera for a decent image to be produced. This minimum light
level is affected by several factors. First, there is the ratio of the lens area to the CCD
area. Obviously a larger lens area will collect more light (all other things being equal).
But, more fundamentally, the minimum illumination level is determined by the ratio of
CCD output signal to system noise. Therefore, there are two clear avenues towards
decreasing light requirements: increase CCD response to incident light and decrease
noise levels. From our perspective, we really don't care how the manufacturer achieves
results and therefore we usually get all the information we need from published
31

specifications. But, for those readers who are interested in some details, a brief
discussion follows.
Increasing CCD Response
Backlighting
A backlit CCD is produced as follows. Make a normal CCD, grind down its
backside until the total thickness is on the order of 15 pim, and then mount the "front"
side of the CCD on a rigid substrate. In this way, the gate structures, which are usually
on the front surface of the CCD, no longer block incident photons.
9080 Back-Illum. AR
60 t)!! Back-IIlum. UVAR
0-
30 - Front lilum.
20-F Iront lllumn.
Anti-blooming
M = WO LO gh C R
UV WavelIe nqth (n m) IR
The above plot (taken from www.ccd.com) shows representative quantum
efficiency (see section below) curves for various types of CCDs. The substantial
improvement for back-illumination is clear. Note, anti-blooming will be discussed
shortly.
32

Silicon Intensified Target (SIT)
There are several models of extremely low-light-level cameras in which an
intensifier is placed in front of the CCD. Intensified cameras will typically have light
striking a film that causes the release of electrons. These electrons then enter channels in
which an individual electron will cause the release of many more electrons. This is an
effect similar to that in the avalanche photo-diode. These electrons then collect as charge
on the CCD. One of the drawbacks of this sort of system is that there must be a different
channel for electron multiplication attached to every single CCD pixel. This
fundamentally limits the resolution of the camera, as these channels can only be made so
small. On the other hand, the advantage is that intensified cameras show responses
hundreds to thousands of times that of traditional CCD cameras.
Decreasing Noise Levels
Black Current
Even without photons striking the CCD, all CCDs will produce a charge over
time. The rate at which this occurs depends significantly upon temperature, to the point
that a 5-6 Kelvin increase in temperature typically doubles the black current. Of course,
if one knows approximately what the black current (often called "black count", as it is
typically given as a count of the number of electrons produced per pixel) is, it can be
canceled. However the standard deviation of the black count is on the order of its square
root. Therefore, for low light imaging, it is important to have low black count. This is
typically achieved by cooling the CCD. Active cooling is expensive and cumbersome,
and therefore in most cameras we will consider, active cooling is not performed. When
33

active cooling is performed, it can be performed by air cooling via fans, liquid cooling
via cooling circuits, or other more exotic means. Most extensive cooling is reserved for
astronomy where low light levels and correspondingly long imaging times are required.
However, for cameras in common use underwater, it can be quite important to provide
adequate passive cooling in the form of heat sinks and surface area for thermal discharge.
Read Noise
Read noise can be viewed as the noise which occurs between the end of the
collection period and the writing of the image data to memory, or the recording on an
analog device (video tape, for example). This noise arises at several points. (1) The
"charge transfer efficiency" refers to the percentage of electrons transmitted from pixel to
pixel and register to register as a charge moves towards the output register. While typical
charge transfer efficiencies are extremely high, when considering the number of transfers
typically taking place, this efficiency can become important. (2) The output amplifier
produces significant noise in the signal. (3) Noise will be produced on all connections
and cabling. (4) If the signal is digitized, there will be non-negligible noise in the analog
to digital converter.
Dynamic Range
Typically the dynamic range of a camera is given, in decibel values, as the log of
the ratio of well depth to noise. The well depth is the total number of electron-hole pairs
that can be produced in each pixel (for example, 85,000.). As for noise, we are typically
34

concerned with readout noise and black current noise. Therefore, dynamic range is given
as 20 loge welldepthreadnoise + blackcurrentnoise)
One of the important considerations in relation to dynamic range is the amount of
memory used to record pixel levels. For example, with a well depth of 50,000 electrons
and a total noise of 20 electrons, it would be possible to differentiate 50000/20 = 2500
intensity levels. So, if you used 16 bits to encode the pixel value, you would be
attempting to differentiate 65,536 intensity levels. Obviously this would be hugely
wasteful. You would be much better off using 12 bits, and thus encoding 4096 levels.
Anti-Blooming
Pixels on a CCD have a limited "well-depth". After a pixel has become saturated,
what happens to additional charge? The answer is unfortunate. After saturation, the
charge begins to leak into adjacent pixels. This causes so-called "blooming", which can
be seen as a "halo" around bright spots in the image. To avoid this phenomenon, two
things can be done. Either avoid bright spot sources in the scene, or use an anti-blooming
CCD. These CCDs have unused buffer zones around each pixel element on the CCD.
Therefore, rather than the additional charge traveling to the adjacent pixel, it builds up in
this buffer zone. The obvious drawback is that this either reduces resolution, reduces
sensitivity, or requires a larger CCD. Note that this feature is not typically seen in
cameras of interest to the AUV world.
35

(1.iii.g) System Speed
The standard video camera produces composite video output. In the United
States, the frame rate is based on the standard wall power frequency of 60 Hz.
Composite video consists of two interlaced scans which combine to produce an entire
image and which, under the US standard take 1/3 0th of a second total. Therefore the total
frame rate is 30Hz. The standard video format also imposes constraints on resolution and
contrast often greater than the limitations imposed by the camera.
While video cameras will have a fairly standardized frame rate, for digital and
still cameras, the maximum frame rate can vary significantly. The frame rate is affected
by a number of considerations, but most of the details are not of concern to us. Rather, it
is simply important to assure that a camera meets your requirements. As a related
consideration, however, it is important when designing a system to consider how much
data you need and how much you can reasonably handle. That is, even if your camera
has a very high frame rate, a large resolution and large bit count per pixel (in a digital
system) can cause a huge burden on your system. Indeed the system, rather than the
camera, might prove the limiting factor on frame rate. One method of increasing frame
rate, or reducing system load, is to perform pixel binning. In this case, 4 or 9 pixels
might be combined (either averaged, or added) to produce a "superpixel". Some CCDs
are capable of performing this function themselves, and can thereby increase the CCD's
inherent frame rate. Otherwise, this can be accomplished in analog or digital circuitry off
the CCD.
36

(1.iii.h) Camera Manufacturers
Underwater Camera Manufacturers:
Ocean Imaging Systems, Remote Ocean Systems, Deep Sea Power & Light, Carillo
Underwater Systems, Deep Sea Systems, Benthos, Insite Systems, Outland Technology.
Digital Camera Manufacturers:
Cooke Corporation, Rover Industries, Hamamatsu, Q Imaging, Dalsa, Apogee Scientific
1.iv Post Processing
This section introduces the digital manipulation and storage of images. The
section begins by discussing formats for storing and compressing images. Methods of
"improving" the image, for both human viewing and as preparation for extraction of
information, are then presented.
(1.iv.a) Image and Video Storage and Compression Formats
CCD based cameras output a time series of voltages with a distinct voltage
corresponding to the illumination level at each pixel. These analog voltages are
converted into discrete values in the analog to digital converter of a digital camera.
The straightforward way of storing an image is therefore to simply represent the
voltages digitally and store that digital representation. For black and white images, this
corresponds to a gray-scale file, and for color images, this corresponds to an rgb file, in
which red, green, and blue pixel values are stored individually.
37

For color images, the rgb format is not the only possibility. Another standard
format is to represent an image in terms of hue, saturation, and value for each pixel (HSV
format). The hue specifies the color of the pixel, in other words, the pixels location in the
spectrum. The saturation represents the intensity of a color. So, a pure red would have a
high saturation value while a pure gray would have a saturation value of zero. Finally,
the value is the brightness of the pixel. The HSV format is specifically very useful when
one wishes to manipulate the intensity of an image. In MatLab, the conversion between
rgb and hsv formats is performed by the function rgb2hsvo.
Image files tend to be very large, and their transmission and storage can produce
large burdens on a system. Therefore, compressing an image is often extremely valuable.
When choosing a compression algorithm, there are several factors to consider. First, the
speed of the compression algorithm can be critical in real-time systems. In addition, it is
important to consider how much compression is required, and whether you are willing to
sacrifice some image quality to achieve that compression.
Standard lossless file compression schemes are well known and in many cases not
specific to image files. Some standard file compression formats, such as Huffman codes
can pay significant rewards. Other compression schemes, such as Lempel-Ziv-Welch
compression, provide little if any benefits. There are also a number of lossless
compression schemes designed specifically for image files. One method is to store the
differences between adjacent pixels rather than the pixel values themselves. The benefit
here is that differences are typically much smaller than the absolute pixel values and thus
require fewer bits for storage. Another method is to record a pixel value and then record
how many adjacent pixels have that same value. This is especially useful for binary
38

images and is used in fax machines. However, it is of less value in "real" images as
adjacent pixels rarely have identical values. In general, as a rule of thumb, lossless
compression can not reduce file sizes by more than 50%. A standard lossless image
storage format is TIFF. TIFF is actually not a single format. Rather, the header of a
TIFF file specifies the specific storage scheme within the file. This scheme may or may
not include compression.
If you are willing to accept some loss of exact pixel values, much greater
compression ratios can be achieved. A standard way of performing "lossy" compression
is the Joint Photographic Experts Group (jpeg) compression scheme. Jpeg is specifically
designed for human vision as it makes use of the fact that humans are much less apt to
notice small changes in color than we are to notice changes in brightness. To make use
of this characteristic of human vision, color and brightness are encoded separately. The
specific encoding primarily makes use of cosine series representations of the image. The
fidelity of the encoding is determined by the number of terms kept in the cosine series.
Compression rations of 100:1 can be achieved, but ratios of 10:1 typically produce little
or no noticeable alteration to the image (Russ, pg 128). It should be noted, however, that
gray-scale images do not compress nearly as well as color images under the jpeg scheme.
There are many other storage and compression schemes, but now the reader
should have a sense of the basic options and can learn more about specific formats as
necessary.
39

(1.iv.b) Noise Reduction and Filtering
The data contained in a digital image file (or at least the brightness data in color
images) corresponds to scene radiance. However, without very careful calibration it is
not possible to translate directly between image data and actual scene radiance. This
difficulty is compounded by noise and error that appear in the recording of digital images
at many stages. Error sources include, the CCD itself, the CCD's output amplifier,
analog transmission circuitry, the analog to digital converter, and then later even in the
transmission and storage of the digitized image file. In addition, such effects as
backscattering can cause the image plane irradiance to significantly diverge from the
scene radiance.
We will presently discuss ways of removing or attenuating both gaussian and
impulse noise, and in doing so will rely heavily on the work of Trucco & Verri. By
Gaussian noise, we are specifically referring to a "white, Gaussian, zero-mean stochastic
process". That is, with Gaussian noise, we are assuming that each image pixel value is
given by Iij = Iij + nij, where Iij corresponds directly to the image plane irradiance and nij
is a random variable with a zero-mean Gaussian distribution. Impulse noise, on the other
hand corresponds more to such effects as backscatter, or a defective pixel element in the
CCD. This is a case in which the value(s) of a given pixel or group of pixels in an image
file deviates significantly from the "true" value. Pixel values affected by impulse noise
often have the useful trait of varying greatly from their neighbors. Unfortunately, critical
image details such as edges and corners often also show this trait.
An algorithm for filtering an image to reduce noise will now be presented.
40

m m
If(i,j)= I*A= L A(h,k)I(i-h,j-k)m m
h=-- k=--2 2
where;
if is the filtered image of dimension N x M,
I is the original image,
A is the kernel of a linear filter,
* denotes convolution, and
m is an odd number less then N and M.
This algorithm results in each image pixel in the filtered image being a weighted sum of
the original image's values over a window around the filtered pixel. This algorithm is
implemented in MatLab as follows.
i= filter2(AI)
1The simplest linear filter is the mean filter with, for example, A = - 1 1 1 .
9
When a Gaussian kernel is used, we get Gaussian smoothing For reasons involving the
Fourier transform, the Gaussian kernel has better characteristics as a low-pass filter than
the mean filter. In addition, the Gaussian kernel has the advantage of being separable.
That is, convolving all rows and then all columns of the original image with a I-D
gaussian of standard deviation c is the equivalent of a convolution of the image with a 2-
D gaussion of the same cy. By sampling a real Gaussian, it is possible to create a real
Gaussian kernel. However, we are interested in efficiency as well, and thus an 1 -D
41

integer kernel such as a =[1 9 18 9 1] allows us to avoid floating point operations
(assuming the image consists of integer values).
It is also possible to approximate Gaussian smoothing by repeated linear filtering. For
1 2 11
example convolving the mask A = - 2 12 2 with In times is approximately24
1 2 1
equivalent to convolving with the Gaussian kernel with c-= .
Details of filtering can be found in various image processing texts.
(1.iv.c) Histogram Equalization
It is often the case that a scene is unevenly illuminated, or that the full dynamic
range of the camera is not utilized. In this case, it is often helpful to adjust the range of
an image to more fully reveal information to the viewer, or to prepare the image for
feature extraction.
Much information about an image can be
seen in the image's histogram. A histogram is
produced by first creating "bins" along the x-axis.
Each bin corresponds to a range of pixel
brightness values. The pixels are then sorted
according to their intensity into these different
"bins". Histogram y-values are therefore the
number of pixels per bin. In MatLab the imhist()
function provides the histogram. Often it is the
42

case that an image does not utilize the full dynamic range of a camera. In this case, the
histogram might show a strong weighting to one side or the other.
As an example of the usefulness of histogram equalization, the image shown was
taken by the ABE AUV from the Woods Hole Oceanographic Institute and shows a lava
flow. As can be seen, there is a strong bright strip through the middle of the image, while
the edges are quite dark.
This shows the effects of Final Histogram
an uneven illumination 1800016000
pattern. In addition, the 14000
12000-
histogram of the image as 10000j8000I
shown here under the title 600014000 -
"Original Histogram" 2000 i0 -
shows quite clearly that N
the full range of the image is not being utilized.
This specific histogram was generated with
MatLab's imhist() function and has the
brightness values grouped into 30 different
bins.
Histogram equalization works by taking
the original histogram and scaling pixel values
in a non-linear fashion so that the histogram of
the processed image has a desired shape. This
shape can take many forms, with the plot
43

shown here, entitled "Final Histogram", giving the results of fitting the pixel values to an
even profile. The resulting image, as obtained by running the histeq() function in
MatLab, is shown. In this image it can be seen that much detail is revealed throughout
the image. A related, and only slightly more complicated technique, is to break the image
into several sections and run histogram equalization on each section. This technique can
be very effective in canceling the negative effects of an uneven illumination pattern.
Unfortunately, histogram equalization distorts the illumination profile in an unnatural
way, and piecewise histogram equalization destroys any natural intensity variation which
might exist across the image
as a whole.
(1.iv.d) Edge and Corner
Detection
It is often useful to
have a computer
automatically find details
within an image. Standard
features to identify are edges
and corners. An example of edge
detection within an image is shown
here.
44

As presented in the text of Trucco & Verri, edge detection is typically performed
in three steps. First, filtering is performed to reduce noise. Then, edge enhancement
takes place. The fundamental characteristic of an edge is a strong gradient in image
brightness. The standard edge detector as developed by J. Canny, and as implemented in
the MatLab edgeo function, utilizes this strong gradient as follows. For each pixel, the
gradients in the x and y directions (Jx and Jy respectively) are computed. The sharpness
of the edge is then estimated according to the equation S =(Jx) 2 +(Jy) 2 . By finding S
for every pixel, we have a representation of edge sharpness across the entire image.
Now, we can process this in two steps to isolate the true edges. In order to do this, at
every pixel we must estimate the edges orientation according to the equation
o = acrc tan(-- . Knowing the orientation, we can traverse the region around anSJx
edge perpendicularly to the edge direction and suppress all but the maximum sharpness
value. Doing this for the entire image allows the production of a binary image showing
the precise location of edges. However, spot noise and other effects can cause spurious
edges to be "detected". In order to suppress these spurious results while not destroying
true edges, a technique called Hysteresis Thresholding is employed. This technique
involves the setting of a low and high threshold. The high threshold must be surpassed in
the sharpness image (S) for an edge to be considered. If this threshold is surpassed, the
algorithm then traces along the edge direction as long as the sharpness value remains
above the lower threshold. In this way, spurious edges are usually discarded, and true
edges can be traced and recorded intact.
45

While the Canny method is the standard method for edge detection, other methods
such as those developed by Sobel or Roberts may be considered for their simplicity.
Corners can also be detected, and Trucco & Verri present the following algorithm.
For each pixel, find the matrix C = ith E - (brightness)J E,E, E E, 2 x
over a window around the pixel. We will denote that window Q. Find the smaller
eigenvalue of C for each pixel, and if it is above a threshold, save the eigenvalue in a list.
Now, sort the list. Starting at the beginning of the list, for each element, delete all entries
later in the list that are within the pixel's window Q.
(1.iv.e) Mosaicing
Due to the rapid attenuation of electromagnetic energy in water, it is often
difficult or impossible to capture an entire scene of interest in a single photograph. As a
result, it is often necessary to join multiple images together in something akin to cutting
and pasting with scissors and glue. This can be done by hand in a fairly straightforward
manner. However, it is highly desirable to not only make this an automated process, but
also to have the computer improve the quality of the composite image.
One of the first problems in creating a photomosaic is establishing
correspondence between a series of images. This is assisted by carefully designing the
survey and assuring that there is sufficient overlap between images. Since relative
positions of the camera are typically not known, it is then necessary to establish
correspondence between specific points in the images. This can be assisted by such
algorithms as that for the detection of corners just described. However, in most cases it is
not yet possible to establish this correspondence without human input.
46

Once point correspondences are found the spacial transformations between
imaging perspectives can be determined, and image transformations can be performed.
With this accomplished, the images can be placed together. Unfortunately, uneven
illumination, and errors in alignment and transformations make it very difficult to join
two edges so as to hide the border between images.
The entire process of mosaic creation is non-trivial and the reader should refer to
the references (ie, Sawhney or Shum) for further details. Shown below is a mosaic image
of a whale skeleton created by Hanu Singh at the Woods Hole Oceanographic Institute.
1.v Measurement of Optical Water Properties
Optical water properties are divided into two types: inherent and apparent
properties. Inherent properties are the actual properties of water, such as the transmission
characteristics (as discussed in section 1.i). Apparent properties take into account the
natural illumination level of the water. There are numerous means of measuring these
properties, and some of the more important ones will be discussed here. When choosing
47

a photometric device, it is important to keep in mind that the more complicated the
device, the more difficult it will be to use and maintain.
(1.v.a) Ambient Light Measurement
A photometer measures light levels. There are numerous different configurations,
providing varying abilities to measure light at single wavelengths, several different
wavelengths, or across the entire visible spectrum.
A spectroradiometer measures irradiance (the quantity of light incident on a
surface) at various wavelengths, typically in the range of 400-700nm. Some units
measure at a fixed number of wavelengths by placing filters over the photo-detector.
Other units incorporate a grating monochromator or other device to provide continuous
measurement across a given wavelength range.
Companies such as Wetlabs and Sequoia Scientific produce this type of device.
(1.v.b) Absorbtion and Scattering Measurements
A transmissometer measures the transmission of
light in water. There is often an attempt to distinguish the
transmission losses due to absorbtion from those losses
caused by scattering. Some devices, however, make no
such attempt and measure the total effect of scattering
and absorbtion.
The basic underwater transmissometer has a
collimated beam shined on a photo-detector. By WetLabs C-StarTransmissometers
48

determining the difference between the radiant flux leaving the light source and that
reaching the detector, the total effect of absorbtion and scattering can be determined. The
figure to the right shows the basic form of a transmissometer for in situ measurement.
Kirk reports in his book that such a "simple" transmissometer with a wide angle detector
does quite a good job of measuring only losses due to absorbtion, as most scattered light
is indeed picked up by the detector. However, there are many variations of this basic
concept. Some devices have photo-detectors which only detect light over a very small
angle and thereby measure the total beam transmission (That is, the combined effects of
both absorbtion and scattering are measured.). Another form of this device, slightly more
complicated, involves a 3-D point source with a single detector at a fixed distance. The
3-D nature of the device means that, while scattering will have an effect on the path of
individual "rays" of light, on average the flux out of the sphere of water defined by the
distance of the fixed detector, will be nearly unaffected by scattering.
A spectrophotometer allows for the determination of transmission and/or
absorbtion characteristics at multiple wavelengths. The wavelengths measured depend
on the device, with price typically going up substantially as the number of wavelengths
increases. High-end devices allow for resolution on the order of a nanometer, while mid-
range devices might allow for measurements at 10 distinct (and device specific)
wavelengths. Spectrophotometers can cost $15,000 to $30,000.
There are also devices designed specifically to measure scattering. A typical
device would have photo-detectors positioned, or positionable, at various angles to a
collimated beam. In this way, the intensity of scattered light can be measured at different
angles. Devices such as this are used in the obvious way to learn about angular scattering
49

profiles. However, they can also be used to determine the size of suspended particles (as
scattering angles are dependent on particle size). As with all of these devices, there are
numerous versions designed for specific purposes, such as specifically measuring
backscatter. As of May, 2002, Sequoia Scientific offered a "Lisst-25" backscatter
sensor for approximately $9,000.
Another interesting device, known as a Light Scattering Sensor, is often referred
to as a "turbidity" meter. It does not provide a measurement of any fundamental water
property, but is a simple and relatively cheap means of getting a general sense of the
clarity of water. An LSS consists of an LED emitter which radiates at wavelengths above
800nm. This emitter is then placed next to a photo-detector. However, there is a "blind"
between the emitter and detector preventing direct illumination of the detector. In this
way, the signal generated by the detector is directly proportional to the turbidity of the
water (more particulate matter in the water results in greater scattering of light back to the
detector). In addition, because light in the range above 800nm is rapidly absorbed in
water, there is limited danger of reflection of emitted light from objects such as the
ground or the water surface. Finally, because the photo-detector is designed only to
respond to light in this wavelength range, at depths below 1-2 meters, daylight does not
effect the operation (Price, -$1000).
50

Chapter 2: Overview of Light Emitting Diodes
Since their origin at General Electric in the 1960s, Light Emitting Diodes have
improved considerably. In the 1970s, LEDs were widely adopted as indicator lights and
in numeric displays. Introduced in the latter portion of the 1980s, Organic Light Emitting
Diode (OLED) technology began to see extensive improvements in the 1990s due to
applications in flat panel displays. Also, in the 1990s, the traditional red LED was joined
by green and blue LEDs, with all types showing rapid improvements in efficiency and
output. (Bergh et al.)
This chapter will provide an introduction to the current state of LED technology.
The design of LEDs will be discussed, and then some currently available LEDs will be
presented along with their specifications. A list of LED manufacturers will follow.
2.i Emitter Design
The fundamental element of an LED is a p-n junction. As LED SeMiconductorCh ip
p and n regions
pictured to the right (drawing from Arizona State University
Department of Physics), a p-n junction consists of a region of positive L D-charge separated from a region of negative charge by a junction which
prevents the flow of electrons between the two regions. However, when a sufficient
voltage is applied across the p-n junction, in the proper orientation, electrons from the
negative side travel to the positive side. The negative and positive charges then combine
releasing electromagnetic radiation. Note that this combination of charges, and thus the
emission of light, occurs within the positively charged region, rather than at the junction.
51

The wavelength of the radiation and therefore the color of the emitted light is
dependent upon the material of the semi-conductor. The materials involved typically
include gallium, arsenic and phosphorous (ASU).
The efficiency and output of an emitting surface depends on several factors. It
depends on the material used for constructing the p-n junction. But, it also depends on
the mechanical geometry of the junction. That's because some of the photons emitted
within the material will be absorbed by the material itself. Thus designing emitting
structures to reduce this absorbtion is an important problem.
The discussion of LED semi-conductor chips could go on for volumes, but since
our goal is to use LEDs, not build them, all the information we need on output and
efficiency is available from manufacturer's specifications.
2.ii Optical - Mechanical Design
The semiconductor chip that makes up the heart of an LED is typically embedded
within an epoxy dome for protection. The angular emission pattern from the flat surface
of an LED's chip is approximately Lambertian (that is, dependent on the cosine of the
angle from the perpendicular to the surface). However, there is also light emitted from
the sides of the emitting material. The focusing of this light starts with the placement of
a small reflector around the emitting chip (see drawing, from ASU Department of
Physics). However, this reflector only affects that electromagnetic energy which is
emitted at large angles from the perpendicular to the surface. Therefore, the majority of
focusing is accomplished on the surface of the epoxy dome by means of refraction. As a
result, the shape of the dome greatly affects the focusing angles of the LED.
52

SCW However, it should be noted that while the LEDs we are
primarily interested in use their epoxy dome to focus the emitted
4 - light, other LEDs, such as those often used for indicator purposes,
have small particles embedded in the epoxy in order to spread the
emitted light, and destroy any focusing.
Attached to the semiconductor chip within an LED are two
electrical contacts that extend out of the epoxy enclosure. Often the negative contact is
shorter than the positive contact, but this is not always the case. These contacts can allow
for both the electrical and mechanical connection of the LED. However, it should be
noted that excessive force on these leads could cause them to disconnect from the
semiconductor chip. In addition, manufacturers warn that static electric discharge can
destroy the chip, although the author has never experienced this problem.
While the above description of an LED's structure is typical, there are numerous
variations. For example, it is possible to purchase LEDs without a reflector around the
emitter, or, in a few rare cases, LEDs that do not have the semiconductor chip embedded
in epoxy. Indeed, while the most typical form of LED has a 5mm epoxy dome with two
metal connections coming out the bottom, extremely high flux
LEDs tend to differ significantly from this format. Indeed, the
Luxeon 5-watt emitter shown to the right can be seen to have a
substantially different form.
53

2.iii LEDs on the Market
This section will
take a look at some 9-- "e P 'OLEDYellowPoye
LEDs available ~ ~ "alcge4- Unfjlered incandecent AlGaAs/GaAs n
commercially at the ReG
On~e nt A)G;As/GaAs
time of this writing RY2t "u- G2P:N Green-
(Fall 2002), with G rzn ORedSC
Blue
specific emphasis on G Py
1960 1970 1975 1910 1985 199 1995 2000LEDs emitting in the YEA2
blue-green portion of the spectrum. As can be seen in the plot (Bergh), red LEDs have
shown an impressive and steady increase in efficiency. This continued rapid
improvement in LED technology makes it clear that this section will be out of date the
minute it is written, and therefore no attempt will be made to provide complete coverage
of the LED market. However, a few examples of LEDs currently available will be
presented, and some of their important characteristics will be discussed. The section will
then conclude with a listing of manufacturers.
In order to evaluate and compare LEDs produced by different manufacturers, one
need simply compare their specification sheets and
price. Characteristics of interest include total output,la-25*C-
output efficiency, spectral profile, and response time. 2F
We will begin by looking at these characteristics for a 0. 6
0.4-single LED, and then make some comparisons with .
other LEDs.. 350 400 450 500 s550 600 650wavkngth X(n)
54

As an example, we will take a look at Nichia's NSPB500S. This LED nominally
runs off of a 3.5V supply voltage and draws 20mA. It has a 5mm epoxy dome and
produces blue light with a peak emission around 465nanometers. The spectral emission
curve is as shown above. As can be seen,8 Dirctivity (NSPBO(S))
the curve's half-width is very small
4 (-30nm), and the curve is nearly
symmetric. This is also a highly directed
I L source, with angular half-width of less than90 3W 00 0' .
RsndMtAZg&W 10 degrees (as seen in the "Directivity"
plot). However, it should be noted that Nichia produces other LEDs in this series with
larger angles of focus but otherwise identical to the NSPB500S.
The electromagnetic output of this LED at 3.5V supply voltage is nominally 0.007
watts, with forward current vs relative luminosity plotted here along with forward voltage
vs. forward current.
0 Forward Voltage vs.N Forward Current vs. Forward Ctrent
Relative Luminosity200;
35 -- 100 Ti =25"Q
3.0 , A25'* l' 50
2.5 2
2.0 10
3.5 -o 5
1.00.5
S2.5 3.0 3.5 4.0 4.5 5.00 20 40 60 80 100 120 Forward Voage VF(V)
Forward Curent D'P (mA) - -
In continuous operation, this LED produces approximately 0.007 watts, which
translates to about 9% efficiency. However, it is possible to pulse the LED at
55

significantly higher voltages for short periods of time.U Duty Ratio vs.
Specifically at 100 mA, a voltage of 4.7 volts is A lowable Forward Ctuent
obtained. The resulting electromagnetic output is
-10016.8 mW, with a corresponding efficiency of 3.6%.
50
So, while the output can be increased significantly, a
20high price is paid in terms of efficiency. In addition, I
output can only briefly be increased above
approximately 0.007 watts without destroying the LED. Nichia publishes the curve
shown for duty ratio vs. forward current, and notes that high current pulses should not
last more than 1 Oms.
NSPB series BlueROOM TEMPERATURE TEST
Test method : Ta=25degreesC
140
120
S1000
- 80
u60
S 40
20
0
-------- -
9;~ ~ ~ *7P
...... ~...
10 100Operating TimneIH
1000
LEDI M
-a- If=4
100
Finally, we turn to the
L longevity curve (Note that the
W upper curve represents a currentORA
of 20 mA and the lower
represents 40mA.) and see that
after 10,000 hours (or more than
a year) of operation at room
temperature and 20 mA, the LED00
still produces 60% of its original
output.
This LED by Nichia represents a typical "high power" blue LED on the market
today. There are several manufacturers which produce products with nearly identical
specifications, and sell them at prices from $2-$4.
56
1

Recently (October - November 2002), an LED marketed under the brand name
"Luxeon" became available on the market. Specifically, here will be discussed the
Luxeon 5-Watt Blue LED. According to its specifications, the LED produces 50-60
times the output of the LED just described, and its efficiency is 1-2
% better (-11% overall efficiency). The size of the emitting surface
is much larger than that of most LEDs, but the overall package size
is nearly identical. The downside is that since this LED consumes 5 Watts of power and
only produces around 0.5Watts of output, 4.5Watts of heat must be dissipated. This
requires a substantial heat sink (as can be seen in the picture to the right). In addition, as
the emitter warms up, its characteristics change to some extent. However, the point is
that significant improvements in LED technology continue to be made.
Section 3.i provides a framework for direct comparison of LEDs for underwater
photographic purposes. However, it is worth taking a moment to compare the
efficiencies of LEDs of different colors, without considering the effects of using these
devices in water. The details here are only given to provide the reader with an
appreciation for the differences between LEDs of different color. For specifics, the
reader should again turn to the specification sheets for products of interest.
Immediately below is a listing of LEDs tested in the lab by the LumiLEDS
company in early 2002 and as posted on their website at that time. Note that the tested
LEDs were in some case prototypes and not available for purchase. However, this listing
provides a comparison of the approximate capabilities for LEDs of different colors. The
efficiency of incandescent and fluorescent lamps has been included for reference. Recall
that photopic efficiency has to do withlight intensity as perceived by the human eye, in
57

units of lumens, while radiometric efficiency has to do with he total amount of
electromagnetic radiation in units of watts.
Color Photopic Efficiency (lumens/W) Radiometric Efficiency (W/W)
Red 50 0.77Red-Orange 65 0.37Green 50 0.077Blue 15 0.2White 30 ---Orange 100 0.31Incandescent 20 ---Flourescent 80
As can be seen, the radiometric efficiencies for Red LEDs is extremely high, reflecting
the maturity of red LED technology. It is also specifically worth noting that while a
green LED may appear several times brighter to a human viewer when compared to a
blue LED, the wattage output of a blue LED is (in the case of the data above) more than
twice that of the green LED.
Before concluding this section and chapter, a moment will be taken to describe
how LEDs can be used to produce white light. White light, of course, is a combination of
electromagnetic radiation spanning the visible portion of the electromagnetic spectrum.
LEDs, as has been shown, produce light with a very narrow peak in the electromagnetic
spectrum. Therefore, there are two approaches generally taken to produce "white" light.
The first approach is to combine LEDs of different colors into a single array. This
is similar to the way a color television produces white, by combining red, green, and blue
pixels. In interviews for an article by the Lighting Research Center (Bierman), industry
experts gave some perspective on the technique of combining colored LEDs. According
to the article, "'Mixing discrete color LEDs produces a poor white,' [Dave] Evans [a
58

Hewlett-Packard Technical Marketing Engineer] says. He suggests that people,
especially those with color-deficient vision, perceive the mixed LED white differently
than they perceive a broadband white because of the narrow spectral output of the
individual emitters." The same article also notes, "Peter Lemme, vice president of
engineering at Marktech Optoelectronics, thinks that the variation of LED color
properties due to manufacturing tolerances makes mixing individual LED chips
impractical because special tuning would be required for each product. In addition, the
various LED technologies experience different light output degradation rates that will
produce color shifts with time."
The second approach taken to producing white light with LEDs is to use the
spectrally narrow output of a (typically blue) LED to activate a phosphor which than
radiates energy at a much wider band of wavelengths. In many ways this is the same way
a fluorescent lamp produces white light. This approach produces a much "better" white,
but there is an inherent drawback. The efficiency of the LED is reduced by the imperfect
efficiency of the phosphor activation process.
This chapter will now conclude with a (partial) listing of LED manufacturers as
compiled by the Lighting Research Center.
American Bright - American Zettler - AND - Bright View Electronics Co. - ChicagoMiniature Lighting - China Semiconductor Corp. - Claires Technologies - Cotco
Holding - Cree Research - Den Phone Industrial Co. - Elma Electronics - GilwayTechnical Lamp - Mamamatsu Photonics - Hewlett-Packard - Hyoshi Electric -Kingbright - Ledtech - LEDtronics - Ledyoung Technology Corp. - Leotek Electronics
USA - Ligitek Electronics - Lite-On - Lumex - Marktech Optoelectronics - MCDElectronics - Mitsubishi Cable America - Mule Emergency Lighting - Nichia -Panasonic - Para Light - Photo General Electronics - QT Optoelectronics - Rohm
Electronics - Sharp Corp. Electronic Components Group - Shian Jinn Enterprise Co. -Siemens - Silonex Inc. Optoelectronics Division - Stanley Sun Opto - Toshiba -ToyodaGosei
59

Chapter 3: Calculating Light Patterns
This chapter presents numerical calculations of attenuation along with computer
modeling of illumination patterns. We begin with numerical computations of 1-
dimensional attenuation, spend a section numerically modeling illumination patterns, and
conclude with an example of a simple calculation to size a light source. The format of
many of these sections is that of a presentation and discussion of MatLab code. While
only segments of the code will be presented in this chapter, the entire code can be
consulted in the appendix.
3.i: One-Dimensional Attenuation Calculations
This section looks at the attenuation of light in water, with specific emphasis on
the wavelength dependence of the attenuation process. The code presented estimates the
energy that remains after light travels from a source, to a target five meters away, and
then back to a camera co-located with the source. In many ways this is similar to the
discussion that follows inLuxeon 5 Watt Blue Spectral Output
section 3.vi. However, the 0.9.
discussion here is focused on0.7 -
the integration of a light 0.6
0 05
sources entire output spectrum,12 0.4-
as well as the direct 03
0.2-
comparison of various light 0.1 -
sources. The presentation of 400 420 440 460 480 500 520 540
the MatLab code will now begin.
60

All calculations in this section are conducted with a discrete representation of the
relevant portion of the electromagnetic spectrum. Below is a discrete representation of
the spectral output of a Luxeon 5 Watt blue emitter. The representation is plotted here.
%luxeon 5-star blue emission spectra
xblue = [0 400 425 440 450 458 460 462 473 480 490 500 520 535 5000];yblue = [0 0 0.01 0.2 0.6 0.98 1 0.98 0.6 0.2 0.08 0.04 0.01 0 0];
By using discrete models of the spectral output of the various sources considered, and by
scaling the relative values according to the efficiency of the sources, these sources can be
directly compared.
After scaling the emission spectra according to absolute efficiency data as
provided by the manufacturers, the next step is to account for the attenuation which
occurs as the light travels from the source to the target.
%now we subject the emission to pure water absorbtion
%this section shows absorbtion effects on way to bottom/ground
for i = 1:length(ycolor)ycolor(i) = ycolor(i)*lookup(xcolor(i), xpwabs, ypwabs)^altitude;
end
In the above code, xpwabs and ypwabs are the vectors containing the x and y values of a
discretized pure water absorbtion spectrum. Variables xcolor and ycolor contain the x
and y values which at first represent the energy emitted by the source, and which, by the
time we are done, will represent the energy returned to the camera. The function
"lookup", provides linear interpolation of the ypwabs vector, returning, in this case, the
absorbtion values at the wavelength designated by xcolor(i). Note that the absorbtion
data is that presented in section 1.i.c. This code snippet is reducing the energy levels at
each wavelength according to the equation I' = *(transmssivity)Distance.
61

If decent data were available for ground reflectivity, the energy levels would now
be multiplied by that reflectivity at each wavelength. However, no decent data is
available, and so it is assumed (obviously incorrectly) that the ground or "target" is 100%
reflective at all wavelengths. While there is some data (see section 3.vi) which suggests a
typical ground reflectivity of 20%, since this calculation is making no attempt to account
for the angular spreading of the light source (as will be done in sections 3.ii - 3.v),
absolute values here are meaningless. Rather, what is needed here is data on the
wavelength dependence of the reflectivity, and this is unavailable.
This data is unavailable for two reasons. First, it would be fairly difficult to
obtain. It would require placing a light source with a known spectral output alongside a
spectral-photometer quite close to the target whose reflectance is being determined.
Second, and much more significant, even if you acquired ground reflectivity data at one
location, that data would not necessarily be valid at any other location.
After reflecting off the target, it is now time to subject the energy spectra to
another 5 meters of attenuation on the way back to the camera. This is done just as
before.
Upon reaching the camera, it is necessary to account for the wavelength
dependence of the camera's response. It is assumed that the camera is the Remote Ocean
Systems Navigator, whose response spectrum was shown in section (1.iii.b).
%now account for spectral response of camera
%note that response of camera is only known relatively
for i = 1:length(ycolor)ycolor(i) = ycolor(i)*lookup(xcolor(i), xcamera, ycamera);
end
This code works as before, with xcamera and ycamera containing the x and y values of
the camera response curve. It should be noted that the response data for the Navigator is
62

relative, rather than absolute, data. However, since we are only comparing sources in this
section, and not attempting to calculate absolute response, relative data is sufficient.
The final step is to integrate the response across the entire spectrum.
%now integrate camera response
integrand = 0;dw =1;for w = 350:dw:800 %integrating over spectrum
integrand = integrand + lookup(w, xcolor, ycolor)*dw;
end
Comparison of the integrated responses for different sources allows us to see the relative
efficiencies of the sources. Below are presented two sets of plots. The first set shows
the spectral output of a 50 Watt Deepsea Power and Light "Multi-Sealite", as well as the
spectral response of the camera due to the output of this light. It can be seen that vast
amounts of energy in the large wavelength portion of the spectrum are lost.
X 104 emitter output: deepsea 50 watt multi-sealite
x 10, camera response, Deepsea, integrated response = 001
666 -
5
4-4
3-
2 - 2-
1
200 400 600 800 100 1200 1400 1600 1800 2000 200 400 600 800 100 120 1400 10 180 2000
63

The next set of plots shows the output and camera response for the Luxeon 5 Watt blue
emitter. As can be seen in these plots, the spectral profile is much less affected by the
Luxeon 5 Watt Blue Spectral Output attenuation properties of water. The difference
0.9-between these two sets of plots provides a
0.8-
0.7- strong insight into why the narrow spectrum of-5 0.6-
9! -light emitting diodes is a significant advantage.0.4-
0.3- x 10-3 camera response, Luxeon Blue, integrated response 0.207
0.2-6-
0.1-
0 5-400 420 440 460 480 500 520 540
Wavelength, nm4-
3-
2-
1
400 420 440 460 480 500 520 540
The code presented here can be used to compare all sorts of different light
sources. As an example, below are the results of comparing several Luxeon 5 Watt
emitters with the Deepsea Power and Light 50 W Multi-Sealite.
Source Relative response (for uniform supply power)Luxeon -Green 0.02Luxeon -Blue 0.07Luxeon -Cyan 0.06DSPL 50 W 0.01
The relative responses are for unit power inputs, and while comparison of the responses
is meaningful, the absolute value of the responses is not. What we see is that the blue led
emitter shows almost an order of magnitude greater efficiency, when compared with the
incandescent, for a 5 meter target distance underwater.
64

3.ii: Illumination Patterns
This section presents a MatLab script for modeling illumination patterns provided
by various lighting arrangements. The script allows for construction of arrays of lights,
and for the placement of these arrays at locations above the imaging plane.
While this script can be used to model any type of light source, the motivation in
creating it was to model arrays of LEDs. Thus, the script begins by defining the angular
output of an LED.
%Single Source Angular Beam Pattern
anglevector = [0 3 5 10 20 30 60 90];
relativepower = [1 0.9 0.73 0.32 0.05 0.02 0.01 01;
totalpower = 0.024; %Watts
"Anglevector" and "relativepower" are respectively the x and y components of the
angular emission profile for the Nichia NSPB500S LED that was modeled in this case.
After scaling the relative power values entered above to absolute power, the script
creates a "target" surface.
%Set up "Target" Grid
boxsize = 0.01; %meters = 1 cm
targetsize = 400; %number of boxes in target
target = zeros(targetsize, targetsize);
%Note: Upper left corner, ie, box (1,1) is at
%Global Position (0,0,0)
This target surface is a grid of squares of
dimension "boxsize". Later in the script, the
illumination level in each box will be
calculated in a deterministic fashion. Note
that this is different than the way Light
Tools operates, in that Light Tools operates
in a probabilistic or Monte Carlo fashion.
65

The next step is to position sources above the target. This is accomplished as
follows. A matrix is created with each row corresponding to a source, and containing the
x,y, and z positions of the source as well as the rotations of the source about the x and z-
axis. Note that the symmetry of the sources allows us to ignore the rotations about the y-
axis. Because we are interested in creating arrays of LEDs and positioning these above
the target, a subroutine was written to produce arrays of LEDs (such as the real array
shown). The header for the subroutine file is shown below.
%createarray.m
%This function creates a matrix of sources at a given location
%inputs are as follows:
%sources - the source vector, to which new sources will be appended
%numsources - number of previously defined sources
%numcolumns, numrows - establishes array size (only rectangular arrays
possible)%rowspacing, columnspacing - spacing of array elements in x & ydimensions respectively
%xpos, ypos - position of "upper left most" element in array%zpos - for simplicity it is assumed that all elements in array are at
same altitude
%yangle, zangle - rotation angles (radians) around y,z axis
respectively
%outputs are as follows:
%sources - and updated source vector, where each element of vector is
defined as follows% ... sources(i,:) = [xpositiion, yposition , zposition, yangle,
zangle];
With the inputs as described above, the subroutine than creates an array of LEDs of the
specified size by placing each element of the array into the "sources" vector as follows.
for 1 = (numsources+l) : (numsources + numrows*numcolumns)sources(l, :) = [xpos + rowspacing*xcount, ypos +
columnspacing*ycount, zpos, yangle, zangle];
xcount = xcount+1;ycount = ycount+l;
end
With this subroutine created, calls to createarray.m can be made to place arrays at any
desired position above the target.
66

With the sources now placed, the remainder of the script goes through the entire
source array determining the contribution of each source to the illumination level in every
element of the target grid. Thus, the script becomes computationally intensive with the
following three for-loops.
for k = 1:numsources; %loop through all sources
for i = 1:targetsize %loop through x-positions of target
for j = 1:targetsize %loop through y-positions
Within these for-loops, the distance from the source to the specific target location
being considered is determined as follows.
%Determine distance and angle
%horizdistance is horizontal distance from current source
%to current "box"%horizdistance = sqrt((sources(k,1) -i)^2 + (sources(k,2)- j)^2);
%totaldistance from current source to current "box"
totaldistance = sqrt((horizdistance)^2 + (sources(k,3))^2);
%absangle is angle of source from target box
absangle = acos(sources(k,3)/totaldistance);
Recall that the "sources" matrix has rows containing [xposition, yposition, zposition,
xrotation, yrotation]. In addition to distance, the angle of the source relative to the
perpendicular of the target element is also determined.
Because the LEDs need not be pointing straight down at the target, it is necessary
to adjust the angular output in the direction of each target location by the rotation of the
LEDs. This is done using rotation matrices of the following form.
%y-rotation matrixRy = [cos(sources(k,4)) 0 sin(sources(k,4));
0 1 0;-sin(sources(k,4)) 0 cos(sources(k,4))];
%x-rotation matrix
Rz = [cos(sources(k,5)) -sin(sources(k,5)) 0;
sin(sources(k,5)) cos(sources(k,5)) 0;
0 0 1];
67

In this manner, the direction of a specific target location relative to the perpendicular to
the LED can be determined. This is necessary to determine the LED output in the
direction of that target location.
With this output determined, it only remains to scale the output of the LED at that
angle by the distance to and angle of the specific target location.
%"output" is output from source at given angle
output = lookup(relativeangle, anglevector, abspower);
%addition to target value is output value adjusted for angle of surface
%and distance to target box.
target(i,j) = target(i,j) +output*cos(absangle)/(boxsize*totaldistance)^2;
The code shown above uses the angle of the target location relative to the LED's
perpendicular to get the absolute power output of the LED in that direction. This output
power is then scaled according to the cosine of the angle determined by the LED's
location relative to the perpendicular to the target location. The power is then further
reduced by noting that energy density decreases as one over the square of the distance
traveled. Finally, this scaled energy is added to the energy emitted by other LEDs and
incident on the specific target location.
With the illumination pattern determined across the entire target grid for each
LED, the illumination pattern for the entire distributed array is determined. Following
are presented LED positions and rotations and the resulting illumination patterns.
68

Arrangement 1: Four clusters of 27 wide angle LEDs positioned off the vehicle. Rear
LEDs are rotated forward 15 degrees. Front LEDs are rotated forward 35 degrees. Height
is 70". In the sketch to the right, the square
represents the camera location (ie, the center of E
the image), and the circles represent the light36"
positions. The output of the calculations is
directly below. In this output, you see that the
illumination pattern spans the width of the camera 20"
field of view, but that at the upper edge of the
image, the illumination level has dropped off36"
significantly.
casowIssdprofles
69

Arrangement 2: Four clusters of 27 wide angle
LEDs each. Front LEDs 14" from centerline, Drotated 40 degrees forward and 45 degrees about
vertical axis. Rear LEDs 12.5" from centerline, 36"
rotated 60 degrees forward, 50 degrees about
vertical axis. This arrangement is intended to
represent a lighting pattern which can be20"
achieved within the physical constraints of an
Odyssey class vehicle. Output is directly below.
In this case, we see that the illumination level not only decreases significantly at the top
of the image, but the pattern does not span the width well either. Later in this paper we
will see that while these calculations suggest that arrangement 2 is significantly worse
than arrangement 1, our experiments did not bear this out.
calculatedprofile6.jpg
Calcidated Profile S
70

3.iii: Example of Sizing a Light Source
In this section, a "simple" calculation is presented for the sizing of a light source.
A specific LED source is used as an example, although the considerations taken here are
applicable to other sources. After the calculation is completed, a moment is taken to
consider the error in these calculations. It is seen that the error is extreme, due to the
fundamentally complex and varying underwater environment.
We now begin the calculation of the illumination level at a camera faceplate with
illumination provided by an LedTronics 40 LED cluster using 470nm LEDs. The part
number for this light source is L640-OPB-014N. The camera and source are assumed to
be co-located at 5 meters above the "target". All 40 LEDs are also assumed to be co-
located (a very good approximation considering the small size of the cluster).
LedTronics reports 3000 mcd output per LED for narrow angle (12-15 degree)
LEDs. LedTronics further reports that wide angle LEDs can have output per solid angle
(ie, candela values) reduced up to 15 times as compared to narrow angle LEDs.
Therefore, in the worst case the cluster produces an intensity of 3000/15 = 200 mcd.
"mcd" stands for milli-candela where a candela = 1
lumen/steradian, and a steradian is defined as A/r 2 , with A beingr
alpha the surface area of the portion of the sphere subtended by the
cone with internal angle ot. The drawing to the left shows a two-
dimensional view of this inherently three-dimensional concept.
In this drawing, A is the area of the curved surface bounded by the cone-sphere
intersection.
71

For this example, the camera
used is taken to be the Remote Ocean
System's Navigator. ROS reports that 100-00
the Navigator Camera has a viewing angle of approximately 1000, as defined above. The
"cone"l seen by the camera therefore defines a solid angle greater than
(tan 50) r = 4.5 steradians. Therefore, the total illumination emitted into the "viewing
cone" of the camera is approximately (4.5steradians)*(40 LEDs)*(200mcd) = 36 lumens.
In clean water, the transmittance of light at 470nm is approximately 98.2 % over a
meter of travel. Therefore, over 5 meters of travel to the target, 36 lumens will be
reduced to 36*(0.982)5 = 32.9 lumens.
It is now assumed that the target is a Lambertian
Scatterer, which means that it has an illuminationtheta
profile proportional to cos(0) (as defined to the right),
and that the target reflects 100% of incident light. The
former assumption is probably valid, however, the latter is decidedly not valid, and must
be remembered when considering the results of these calculations.
It has been calculated that 32.9 lumens are reflected from the target and it has
been assumed that the reflection angles go as I*cos(0). Therefore we wish to find I, the
reflected intensity at 0 = 0. For simplicity, we assume that all 32.9 lumens are reflecting
from a single point directly below the camera (This assumption shall be amended
shortly.). Integrating I*cos(0) over the unit hemisphere and setting the result equal to
32.9 lumens will provide an equation for I.
72

f* cos(O)* (r2 2;sin(O)IO =32.9lumens
Where (r2 2zsin(6)dO is the differential surface area of a sphere. With r =1,
"/2
rl fsin(20)dO = 32.9lumens , or I = 222candela.0
Therefore, at a distance of 5 meters, with some of the attenuation as yet unaccounted for,
222 Candelathe camera will see a light level of 2 = 8.9lux. Now, factoring in the losses
(5meters)2
over 5 meters of travel back to the camera, we have 8.9*(0.982)2 = 8.1 lux. Remote
Ocean Systems reports a minimum light level requirement of 3x10 3 lux. Even with all
the approximations we made, this suggests sufficient light. But, we should take a
moment to comment on the errors introduced by our approximations.
First, we have the approximation that all light reflects off a central point on the
target directly below the camera and light. At the far edge of the imaged area, the
illumination level will be reduced by a factor of cos(50), and the reflected light level by a
factor of cos(50) as well. Since cos 2(50) = 0.4, we see a reduction in illumination at the
camera of 60% in the worst case (ie, 3.24 lux remaining).
Second, we must account for differences in water clarity. Duntley, 1977, reports
a range of water clarities ranging from attenuation lengths of 12m for Pacific deep ocean
waters to 4 meters for waters around the Galapagos islands. Four-meter water
corresponds to a transmittance value of 0.796 (or 79.6% per meter). Admittedly, Duntley
does not report what wavelength he measured these values at. Nevertheless, we conclude
that in this relatively dirty water, we see a loss of lux at the camera face of one order of
73

magnitude. Therefore, with these considerations we might expect as low as 0.3 lux at the
camera face.
While there are many other sources of error in this analysis, the remaining critical
one is the unknown reflectance of the "target". Kongsberg Simrad reports a "typical"
reflectance factor of 0.2 ("Underwater TV Cameras, Approximate Viewing Ranges",
1994). Unfortunately, Kongsberg Simrad gives no indication of how this value was
obtained. But, if this value for reflectance is believed, we lose another order of
magnitude and could have a camera faceplate illumination level as low as 0.06 lux. Of
course, this is still an order of magnitude above the stated minimum for the Navigator.
The conclusion must be reached that one 40 LED blue cluster is probably enough
light for a 5 meter flight altitude with the ROS Navigator camera. However, it should
also be clear that there is no way to know for sure without running actual experiments
with the camera and light in the water.
74

Chapter 4 Experiment
This chapter describes experiments in the construction of a submersible LED
array and the deployment of that array on a test platform. The purpose of these
experiments was two fold. First, we hoped to verify the suitability of the LED array for
lighting purposes. And second, we wished to experiment with distributed lighting
arrangements.
It was hoped that the LED array would provide sufficient light and a decent
illumination pattern. However, there was concern about both these issues. In addition,
there were concerns that the extremely wide-angle illumination provided by the "de-
focused" LEDs would cause backscattering problems. Recall that the focusing which
typically occurs at the surface of an LED's epoxy dome, when the LED is in air, is
destroyed when the LED is placed in water.
It was discovered that at short ranges (1-3) meters, the LED did provide sufficient
power for illumination. However, the unfocused LEDs did provide an inferior lighting
pattern when compared to an incandescent. This was seen most notably in the form of a
significant "hot spot" in the middle of the illumination pattern. In addition, distributed
arrays of LEDs were seen to hold great promise, and particularly to fix the problem of
poor focus of an LED array.
This chapter will begin with an overview of some considerations for designing an
LED based light. The design and construction of a prototype LED array will then be
discussed. Finally, the testing of that prototype as well as the testing of distributed
lighting arrangements will then be presented.
75

4.i Design Considerations
This section describes a few considerations related to the construction of an LED
based light source. Specific emphasis is given to the protection of LEDs from the aquatic
environment and to the focusing of LED light.
Of course, the design of an LED based light is highly dependent upon the current
state of technology. For example, for our experiments it was decided to use LEDs
producing on the order of 0.01 Watts per emitter. At the time, these were commonly
available, fairly high flux, emitters. However, 6-8 months after these emitters were
chosen, a new generation of LEDs are just coming on the market, with a single emitter
producing 50-60 times as much output as those chosen for these experiments. Along
with significantly greater output, this new generation shows slightly increased efficiency.
The lesson is that while some of the considerations discussed here are not dependent on
the current state of technology, others are and this should be kept in mind.
LEDs consist of an emitting surface, attached to electrical connections, and
embedded in an epoxy. Because of this design, LEDs can naturally withstand extreme
hydostatic pressure. As a result, LEDs need only have some minimal mechanical
protection as well as isolation of their exposed electrical contacts from the corrosive
marine environment.
(4.i.a) Oil Housings
One way to provide both the mechanical and corrosive protection required is to
enclose the entire LED array in an oil filled housing. There are several advantages to this
approach. First, many subsea systems, such as the AUVs being designed and built at
76

MBARI, already have extensive oil systems and therefore it would be fairly easy to
design an oil based housing into the system. Oil housings provide protection from the
corrosive saltwater environment as well as the mechanical isolation of the LEDs. An oil
filled housing also takes advantage of the inherent pressure tolerance of the LEDs and
thus the housing need not be able to "hold back" the pressure.
However, there are several drawbacks. Building a housing automatically causes a
substantial increase in the size of the light fixture. In addition, while mineral oils are
available with optical clarity similar to that of clear water, there will be a reduction in the
emitters efficiency due to absorbtion and reflection caused by the "glass" which provides
an optical connection between the inside and outside of the housing. However, for many
vehicle designers the major drawback is the mess and continual headache that comes
from dealing with oil and maintaining and oil system.
(4.i.b) Potting
Potting LEDs in a rubber or epoxy overcomes many of the drawbacks of an oil
filled housing. There are too many types of potting materials to discuss them all, but a
few will be mentioned here. Some discussion will be made of potting techniques, but the
reality is that effective potting is an art form and simply takes practice and experience.
Embedding LEDs in a pourable material allows the LEDs to be placed in almost
any arrangement desired. However, in every potted arrangement this author has seen
actually constructed, all of the emitters are pointed in the same direction. In addition, the
"heads" of the LEDs typically protrude out of the potting compound so as to be fully
77

exposed to the surrounding environment. While common, neither of these features is
necessary.
The discrete nature of LEDs presents the possibility of arranging the individual
emitters in more imaginary ways. One possibility is to vary the orientation of the LEDs
in an array so as to provide a more uniform illumination field. Other possibilities include
creating strips of LEDs embedded in a flexible rubber that could be placed in any desired
location across the body of the vehicle. The point is not to advocate any of these ideas
specifically, but rather to encourage the reader to consider many different possibilities.
It is also possible to completely embed the LEDs in a clear material so that no part
of the LED is exposed to the surrounding environment. This would require an optically
very clear material, which brings us to the question of what sorts of materials can be
used. Materials considered for this project included epoxies, acrylic, and rubbers.
For epoxies, West System Epoxy was specifically experimented with. Epoxies
come in two parts, a resin and a hardener. When combined an exothermic reaction
develops and the epoxy cures. It is important to take care to mix the parts sufficiently so
that the entire mass of epoxy cures. For deep submergence applications it is also worth
making an effort to reduce the formation of bubbles. First, this means being careful to
avoid the introduction of air into the epoxy during the stirring process. In addition,
placing the poured mixture in a vacuum will draw out many of the bubbles. When cured,
the epoxy forms a hard solid that is nearly transparent but has a slightly yellow
appearance. The major difficulty encounter with epoxies was that the curing reaction is
extremely exothermic. As a result, when curing a pot of more than about a half of a cup,
78
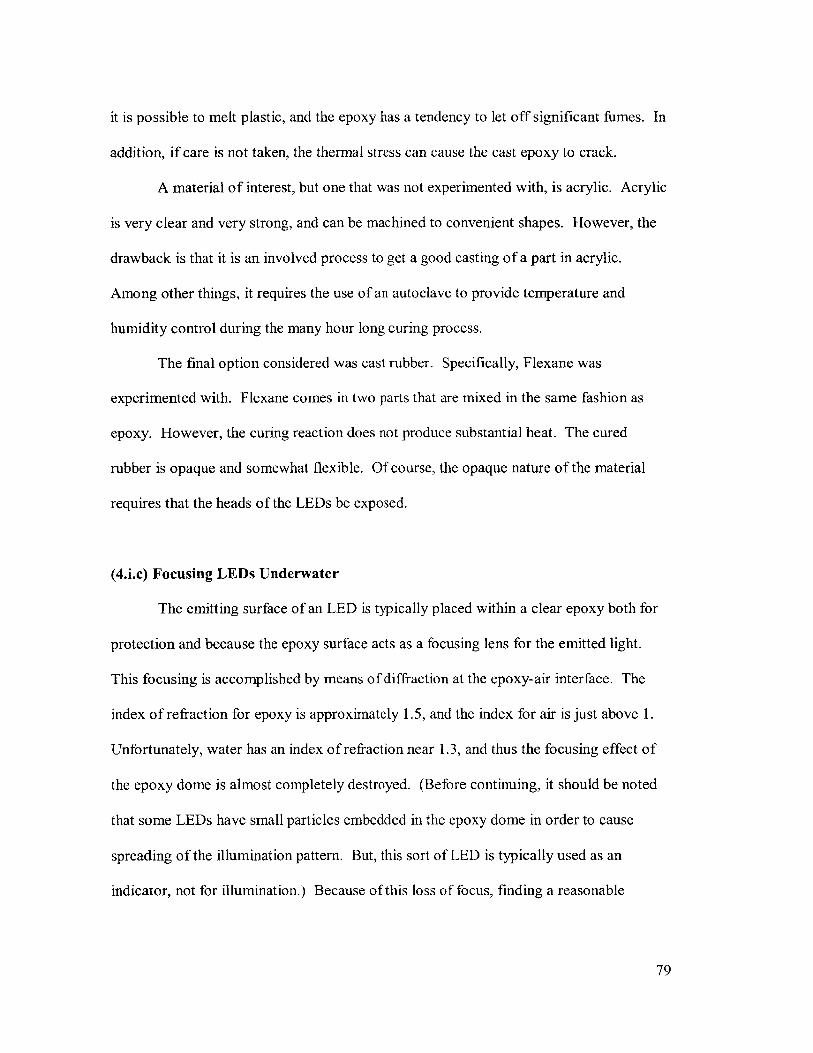
it is possible to melt plastic, and the epoxy has a tendency to let off significant fumes. In
addition, if care is not taken, the thermal stress can cause the cast epoxy to crack.
A material of interest, but one that was not experimented with, is acrylic. Acrylic
is very clear and very strong, and can be machined to convenient shapes. However, the
drawback is that it is an involved process to get a good casting of a part in acrylic.
Among other things, it requires the use of an autoclave to provide temperature and
humidity control during the many hour long curing process.
The final option considered was cast rubber. Specifically, Flexane was
experimented with. Flexane comes in two parts that are mixed in the same fashion as
epoxy. However, the curing reaction does not produce substantial heat. The cured
rubber is opaque and somewhat flexible. Of course, the opaque nature of the material
requires that the heads of the LEDs be exposed.
(4.i.c) Focusing LEDs Underwater
The emitting surface of an LED is typically placed within a clear epoxy both for
protection and because the epoxy surface acts as a focusing lens for the emitted light.
This focusing is accomplished by means of diffraction at the epoxy-air interface. The
index of refraction for epoxy is approximately 1.5, and the index for air is just above 1.
Unfortunately, water has an index of refraction near 1.3, and thus the focusing effect of
the epoxy dome is almost completely destroyed. (Before continuing, it should be noted
that some LEDs have small particles embedded in the epoxy dome in order to cause
spreading of the illumination pattern. But, this sort of LED is typically used as an
indicator, not for illumination.) Because of this loss of focus, finding a reasonable
79

method of focusing LEDs underwater is an important problem. A few proposals will be
presented here.
There are two "obvious" ideas for focusing an LED: place a lens in front of it or
place a mirror behind it. After all, a lens (which is in fact the surface of the epoxy dome)
is how LEDs are normally focused in air, and mirrors are how many other light sources
are focused. Unfortunately, it is not as easy as it sounds.
The ideal solution for focusing an LED would be to redesign the epoxy dome
shape specifically to work with the index of refraction of water. While this is technically
possible, from an economic point of view, it does not seem to be a viable option.
Therefore, there are two other ways to use a lens to focus an LED. The first is to place a
single large lens in front of an array of LEDs. This is simple and effective. The
drawback is that the lens would have to be quite large. Indeed, in order to get decent
focus, the array of LEDs must approximate a point source in comparison with the
dimensions of the lens. If an array of 40 LEDs is 2 inches in diameter, the lens to focus
this array must be quite large indeed. Therefore, the second possibility, and the one that
is much more appealing is to place an individual lens over each LED. This is a
significant improvement, because the lens' dimensions are now driven by the dimensions
of the individual LEDs actual emitting surface, which is extremely small.
In addition to lenses, it would be possible to use
a reflecting surface, such as a parabolic reflector, to
focus the light from LEDs. Because, LEDs only emit
light into one hemisphere, the emitting surface would
have to face the reflector as seen in the sketch.
80

Unfortunately, we again encounter the problem of the large size of reflector that would be
required for an array of LEDs to approximate a point source. And, because of the
dimensions of a typical LEDs acrylic dome, making individual reflectors for each LED
does not seem to be a viable option. That is, as can be seen in the sketch, the acrylic
dome itself will block much of the light if the reflector is not sufficiently large and
sufficiently far away from the LED.
Another, conceptually simple, method for placing focused LEDs underwater is to
simply place the LED(s) inside a pressure housing. In this way, the epoxy domes are
exposed to air, and the refraction based focusing still takes place. Unfortunately, there
are two major drawbacks. First, a pressure housing will necessarily be significantly
larger than the LED array by itself. And second, a pressure housing represents another
mode of failure that could endanger the vehicle itself due to a change in buoyancy.
4.ii Prototype Construction
After considering the issues discussed above, as well as
a few false starts, a plan was developed for producing a
working prototype of a submersible LED based light for
photographic illumination. It was decided to pot an array
of LEDs in Flexane and to not attempt to focus them.
Flexane was chosen for ease of use and relative flexibility.
And it was decided that focusing the LEDs was not
necessary due to a cameras generally wide angle of view
(The ROS Navigator with wide angle lens has a viewing
many others, and making
DDDDDDDD
00000000
00000000
00000000
00000000
00000000
81

angle of approximately 100 degrees.).
After completing the sizing calculations presented in section 3.iii, it was decided
to use 60 Nichia NSPB series LEDs. These LEDs have nearly the same specifications as
those available from LEDtronics, but were available at a much lower price.
Because the specific arrangement of the LEDs in a small array does not
significantly effect the illumination
pattern at a distance of several meters,
the LEDs were arranged in a grid pattern
as shown above. Sufficient space was
allowed between the LEDs for
connecting the LEDs electrically, and to
allow for the contraction of the entire
array under pressure.
000000000000000000000000 000000000 00.300' -O.I
0 0.300"
0000
Because Flexane is an opaque
material, it was necessary to have the
LED domes stick out of the potting
material. A benefit of this necessity is
that the domes themselves could be
used to hold the LEDs in position
during the potting process. With this
consideration as the guiding design
feature, a mold was built out of nylon
and UHMW (Ultra-High Molecular
82
00000000
00F-
O O 00

Weight Polyethylene). An image of the mold (with one half of the upper walls removed)
is shown here. As can be seen in the image, as well as in the drawings below, holes were
drilled on a CNC milling machine in a regular pattern on the bottom surface. The LEDs
were then pressed into these holes and wired together. An underwater cable was then
placed through the hole drilled into the sidewall pieces. Again, this can be seen in the
above picture. The diameter of this hole is dependent on the diameter of the cable, and
should be chosen so as to squeeze the cable tightly.
The nominal desired voltage across each
LED is 3.5volts, with a current of 0.2amps.
Therefore, wiring 3 LEDs in series with a 7.7ohm+12V +12
resistor resulted in a supply voltage requirement
of approximately l2volts. Every row of six LEDs ground
was wired according to the diagram shown, with the leads of the LEDs directly soldered
together, and the resistors directly soldered to the LEDs on either end of each row.
With the array connected and the underwater cable in place, the surfaces of the
mold were lubricated, and the mold was bolted together. The cable and wires were then
primed with FL20 Primer and the appropriate quantity of Flexane was measured. In
order to avoid excessive air entrapment during mixing, a shaft with a wing-nut attached
to its end was placed into the chuck of a drillpress. The wing-nut served as a paddle
which mixed the Flexane while the shaft cleanly broke the air-Flexane interface without
drawing in excessive amounts of air. After mixing thoroughly, the Flexane was poured
into the mold and bolts were inserted in the Flexane with their threads exposed to
facilitate mounting the potted array on a vehicle. Finally, the mold was placed inside a
83

vacuum chamber and sucked down
to -5psi relative pressure.
Unexpectedly, this caused a
significant quantity of air to be
drawn out of the underwater cable
and bubble out of the Flexane. The
initially vigorous bubbling soon
subsided, although some small bubbles are still noticeable on the surface of the cured
Flexane.
The picture shows a view of the finished LED array. As can be seen, there is a
substantial amount of rubber around the LEDs. The mold was made this large in order to
avoid making mistakes on this prototype. However, with more care, the total size of this
light could be reduced by approximately 60%.
4.iii Test Platform Construction
A platform was constructed for the
testing of lighting arrangements. The
basic platform as pictured to the right is in
the shape of MIT's Odyssey vehicle. The
platform was intended to provide a means
of testing lighting arrangements within the
Odyssey framework. It was further modified to provide the ability to test arrangements
with the lights off the vehicle.
84

The platform has buoyancy spheres on the top and weights on the bottom to
provide stability. In addition, there are attachment points for a camera and lights in
various positions around the vehicle.
Camera
ights
z
Crane
Camera
attachment point
Lights
The schematic to the left shows the
general layout of the camera and lights for one
of the tests performed. In this arrangement,
crossbeams are attached to the platform, and
four lights of 27 LEDs each are placed
outboard of the Odyssey style frame. The two
arrangements tested in this manner were the
same as those modeled numerically in section
3.iii.
In addition, the platform was wired for
mounting of the LED array described in the previous section
as well as a 50 watt incandescent lamp in the position shown
to the right. This is the standard illumination arrangement
on an Odyssey vehicle (as well as on many other vehicles),
and allowed for the comparison of the illumination provided
by an LED array with that provided by a 50 watt Deep Sea
Power and Light Multi-SeaLite. 0 LightDifferent cameras were used for different parts of the experiments. Test were first
performed in air. The platform was hoisted on a crane and the lights were shined on the
floor. Images were then taken of the lighting patterns. For these experiments, a color
85

underwater video camera was used. As will be seen, this camera was not sufficiently
sensitive for imaging with LEDs at altitudes above -2 meters. Therefore, another camera
had to be used for in-water experiments.
The plan for in-water testing was to hang the platform off the side of the docks at
the Woods Hole Oceanographic Institute with power supplied from the dock and image
recording taking place on the dock as well. Efforts were made to use a Pixelfly Camera
(by the Cooke Corporation) for submerged experiments. However, this camera did not
function when attached to the long power and data cable required to reach from the dock
down into the water. As a result, the standard Odyssey camera, a Remote Ocean Systems
"Navigator" was used. This is an intensified black and white video camera. It provides
clear images at extremely low light levels. Unfortunately, the pictures taken is not of the
same quality as the Pixelfly, and the fact that it has video output means that a frame
grabber must be used to capture still images. This results in a further reduction in image
quality.
4.iv Experiment and Results
This section will present the details and results of the experiments run with the
light sources and test platform described in the previous sections. Tests in air will be
described first, followed by tests in water.
86

(4.iv.a) Dry Tests
First in a lab and then in a larger room with a crane, the test platform was
suspended at various heights and with various lighting arrangements. A few of the more
interesting arrangements will now be described.
Experiment 1
Description: 60 LED array positioned 54" away from camera, light rotated 15 degrees
forward. The height off the ground is 70". This image shows the highly focused output
of LEDs in air. This shows the difficulty in arranging this light source out of the water,
as in water the focus will be destroyed and the lighting pattern completely changed.
I Gamer
54",
o Light
Experiment 2
Description: Four clusters of 27 wide angle LEDs positioned off the vehicle. Rear LEDs
are rotated forward 15 degrees. Front LEDs are rotated forward 35 degrees. Height is
70". While multiple bright spots can clearly be seen on the bottom portion of the image,
the illumination field does extend to the top of the image. It can be seen, however, that
87

the sides of the image are not well illuminated. This is partially because the illumination
level is lower on the sides, and partially because in the limited lab space available,
shipping crates are in the way and casting a bit of a shadow.
36"
20"
36"
Experiment 3
Description: Same arrangement as in Experiment 2, but at height of 80". A grid pattern
was laid out on the floor and the lighting pattern was measured. The image below to the
left shows the measured lighting pattern as interpolated using MatLab. Two things are
immediately noted about this image. First, it is really dark, and second there is a grid
pattern on the floor. The grid pattern (pieces of tape) was used for measuring the
illumination pattern over half the image, assuming symmetry. The darkness of the image
is a result of the low sensitivity of the camera. More specifically, the complete darkness
88

around the image edges represents the illumination level falling below the cameras noise
level.
89

Experiment 4
Description: Four clusters of 27 wide angle LEDs each. Front LEDs 14" from
centerline, rotated 40 degrees forward and 45 degrees about vertical axis. Rear LEDs
12.5" from centerline, rotated 60 degrees forward, 50 degrees about vertical axis. This
arrangement is intended to represent a lighting pattern which can be achieved within the
physical constraints of an Odyssey class vehicle. Discussion: When compared to the
previous experiments, these results show that the difference between having the lights
somewhat outboard of the vehicle and on the vehicle proper is limited.
D Iightmeters.jpgfightmeter .jpg
T rial 6 Llahl Meter Readinos
36"
20"
_j
90
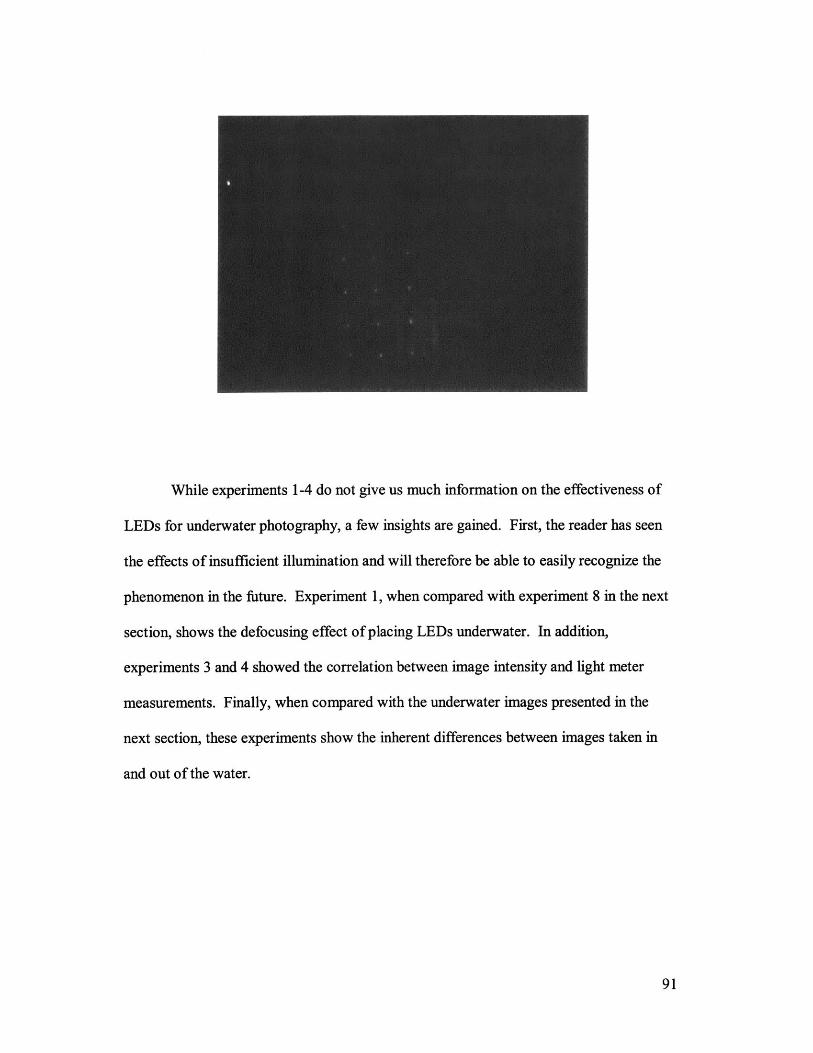
While experiments 1-4 do not give us much information on the effectiveness of
LEDs for underwater photography, a few insights are gained. First, the reader has seen
the effects of insufficient illumination and will therefore be able to easily recognize the
phenomenon in the future. Experiment 1, when compared with experiment 8 in the next
section, shows the defocusing effect of placing LEDs underwater. In addition,
experiments 3 and 4 showed the correlation between image intensity and light meter
measurements. Finally, when compared with the underwater images presented in the
next section, these experiments show the inherent differences between images taken in
and out of the water.
91

(4.iv.b) Wet Experiments
After testing lighting arrangements
in air, the test platform was mounted on a
forklift and hung off the side of a dock at
theWoods Hole Oceanographic Institute.
The camera used for these experiments
was a Remote Ocean System's Navigator
with a wide-angle lens. Because the
ground below the dock was rather
featureless, a checkerboard test pattern
with individual squares of one inch
dimension was placed in the camera field
of view. In addition, a shipping pallet was placed next to the test pattern to provide a
target with larger typical dimensions. The drawback of placing this test pattern in the
image, as will be seen, was that the brightness of the white squares caused the camera to
automatically scale the darker background of the natural bottom out of the image.
The specific lighting arrangements and results will be presented now. As will be
seen, the low clarity of the water prevented decent images from being taken at distances
more than six feet.
Experiment 5
Description: This is an image taken during the day with no artificial illumination to
provide a baseline for comparison of image quality. It was taken at 3:50 pm Dec. 10,
92

2002 with the sun at 15 degrees above the horizon. The total water depth was 9 feet, and
the camera was positioned 4 feet off the bottom.
Experiment 6
Description: Here are two images taken during twilight
(4:20 pm Dec. 10, 2002). The image on the left was taken
with no lights on, and the image on the right was taken with
illumination from the 60 LED array described previously. The LED was positioned 2
feet horizontally and 1.5 feet vertically from the camera, angled forward 30 degrees. In
the sketch, the rectangle represents camera position and circle represents light position.
These images are intended to provide a perspective on the difference between backscatter
from a "point" source and backscatter from an even illumination field. Note that in all
experiments with the 60 LED array, the supply voltage was 12 volts and the current was
0.36 amps.
93

Experiment 7
Description: The rest of the images discussed in this
document were taken in the dark of night. The first image
shown below shows an image taken with no artificial
illumination. It can be seen that the light level is below the
noise level of the camera. The images in this section were taken with the camera 6 feet
off the bottom, with the camera and lights arranged as in experiment 6. In this
experiment, the 60 LED array and 50 watt Deep Sea Power and Light Halogen
Incandescent lamp were collocated. The image on the left was taken with incandescent
illumination, the image on the right with LED illumination.
94

Experiment 8
Description: Identical to experiment 7, but at a height of 3
feet. No baseline (zero illumination) image was taken.
Image on left is incandescent. Image on right is LED. The
superior focus of the incandescent lamp can be seen in the
smaller "hot spot" on the test pattern and in the appearance of the pallet.
95

Experiment 9
Description: The lighting arrangement is identical to
experiments 7 and 8, but camera is at a height of 9 feet.
The incandescent image is on the left. The LED image is
on the right. These images show the limitations in imaging distance due to backscatter.
Note that the side of the dock is seen in the images and should be ignored. In both
images, the test pattern is barely visible, although it is slightly more visible in the LED
image.
Experiment 10
Description: The LED light was moved to the back of the test platform to make a total
horizontal separation distance of 55". The camera and
light were at the same height off the ground. The image
on the left corresponds to an altitude of 6 feet while the
image to the right corresponds to 3 feet. These images (when compared to those in
experiments 7 and 8) show the advantages in terms of decreased backscatter that comes
with increased separation distance. In addition, the lighting pattern is improved.
96
SOIREE - -

Experiment 11
Description: This is an experiment in spread lighting using
four arrays of 27 wide angle LEDs each, with each LED
supplied nominally with 3.5 volts and 0.2 amps. They are
contained in masonry jars and positioned on beams off the
Odyssey style platform as shown. The lights are 3 feet from 0
the platform centerline and on lines 36.5" and 55" aft of the camera position. The
forward lights are rotated forward 25 degrees and the aft lights are rotated forward 15
degrees. The image on the left was taken at a height of 6 feet and the image on the right
was taken at a height of 3 feet. It is clear that the illumination pattern is much more even
(and specifically free of hot spots) than is achieved by a single light source. However, it
is also clear that the illumination does not extend as far as the pallet
97

Experiment 12
Description: This is also an experiment in spread lighting. It is
intended to represent a lighting arrangement that could be achieved D
within the confines of an Odyssey class vehicle. The lighting
arrangement is as shown, with the lights at 36.5" aft of the camera
spread 14" from the centerline, rotated 40 degrees forward and 45
degrees outward, and those at 55" aft of the camera spread 12.5"
from the centerline, rotated 60 degrees forward and 50 degrees
outward. The image on the left was taken at 6 feet and the image on the right was taken
at 3 feet. Both images do show that the lighting pattern was not quite balanced properly
98

The above experiments allow us to draw a number of conclusions. Experiment 10
showed that a full 6 feet of separation between the LED light source and camera provides
an adequate illumination pattern with a single LED array. This experiment also suggests
that a single array of 60 LEDs is ready for deployment on an Odyssey vehicle, when used
in conjunction with a Navigator camera. Experiment 8 showed that further work on
improving the overall focus of an LED array is still needed. However, experiment 10
showed that further separation between light and camera tended to reduce the "hot spot"
which was the major artifact of the poor focusing of the LEDs. Finally, experiments 11
and 12 showed the benefits of a spread array of LEDs. Specifically, within the Odyssey
framework, experiment 12 showed a more even illumination pattern than achieved in any
other experiment and therefore indicates that the specific spread array of LEDs used is a
preferred arrangement on Odyssey vehicles.
99

Chapter 5: Future Work and Conclusions
This final chapter will present conclusions in regard to cameras, the suitability of
Odyssey vehicles for photography, and Light Emitting Diodes. Specific emphasis will be
placed on areas of future development.
Cameras
The experiments with LEDs described in this document involved continuous light
sources being used for video illumination. As discussed previously, power and data
storage requirements make a strong argument for the use of still photography on AUVs.
Therefore, the critical next step in the development of LEDs for underwater photographic
illumination is their inclusion in still photography systems, and their intermittent
operation.
With LEDs, this is not a fundamentally challenging requirement, as intermittent
operation requires only the turning on and off of a power source. The potential, however,
is huge. As a concrete example, the maximum integration time for one of the Cooke
Corporation's Pixelfly camera is 10 milliseconds. Therefore, even if a picture is taken as
often as every second, the duty ratio is at most 1/100.
MIT's Odyssey Vehicles
The 60 LED array developed for this thesis is ready for deployment on Odyssey
vehicles in conjunction with the ROS Navigator camera. The preferred arrangement for a
single array of emitters has the camera and light separated by a full 1.5-2 meters. Of
100

even greater utility, however, would be a spread array in the manner described in this
document (section 4.iv.b experiments 11 and 12) and as shown here.
While the limited maneuverability, and corresponding flight
altitude requirements, of the Odyssey class vehicles limits their utility El
as camera platforms, they can still be used in this capacity.
As mentioned above, a digital still camera system is preferred
to a video system. For MIT's Xanthos vehicle (the current Odyssey
style vehicle that supports photography) to switch to still photography
will require the purchase of a digital camera and appropriate housing,
inclusion of a camera driver card in the PC 104 stack, allocation of sufficient hard drive
space for image storage, and potentially the resizing of the artificial light source for the
camera chosen.
Light Emitting Diodes
A single array of 60 LEDs has been constructed and is ready for deployment on
Odyssey vehicles. Experiments have shown that the lighting pattern produced by this
array is comparable to that of an incandescent lamp. In addition, a spread array of LEDs
has been shown to even out the illumination pattern and eliminate the "hot spots".
However, the ability to focus individual LEDs underwater has not yet been achieved.
While this is not critical for imaging purposes as imaging fundamentally requires a wide
angle lighting source, it could be very useful for optical communication systems.
We have seen that some types of LEDs show impressive efficiency
characteristics. However, for underwater use, it has been shown that the most important
101

characteristic (in regards to efficiency) is the narrow spectral bands over which LEDs
emit light. This narrow emission curve allows the energy of LEDs to be emitted in the
portion of the spectrum that transmits most readily in water. As a result of this, the
effectiveness of LEDs for continuous illumination is impressive. Specifically, it has been
shown that the 50 watt incandescent Lamp now in use on MIT's Xanthos vehicle can be
replaced with a 5 watt LED array. But, as just discussed, even more exciting are the
potential power savings of intermittent operation.
We conclude with an ordered listing of the top priorities for future development.
-Deploy 60 LED array on Xanthos.
-Switch Xanthos to digital still photography system.
-Deploy spread array of LEDs.
-Develop means of focusing LEDs underwater.
102

Bibliography for Underwater Optics (section 1.i)
Keitz, H. Light Calculations and Measurements: An introduction to the System ofQuantities and Units in Light-Technology and to Photometry. 2nd Edition. St.Martin's Press, 1971.
Jerlow, N. Marine Optics. Elsevier Oceanography Series, No. 14. Amsterdam:Elsevier. 1976.
Kinney, J. Luria, S. and Weitxman, D. "Visibility of Colors Underwater",J.Opt.Soc.Am. 57(6):802-809. 1967.
Smith, P. Underwater Photography, Scientific and EngineeringApplications. Van Nostrand Reinhold Company, New York, 1984.
Spinrad, R. "Underwater Imagining, photography and Visibility", San Diego:Proceedings Society of Photo-optical Engineers, July 23, 1991.
Duntley, S.Q. "An overview of the basic parameters controlling underwater visibility",Oceans '77 Conference Record, Los Angeles October 17-19 1977.
Bibliography for Lighting (section 1.ii)Coleman et al., "Design and Implementation of Advanced Underwater Imaging Systems
for Deep Sea Marine Archaeological Surveys ". Institute for Exploration, Mystic,CT. 2000.
Stachiw, J.D. and Gray, K "Light Housings for Deep SubmergenceApplications", Part I, Report TR-532; Part II, Report TR-559. Naval CivilEngineering Laboratory. 1967.
Taylor, Alma. "Illumination Fundamentals", Lighting Research Center, RennsalaerPolytechnic Institute, 2000.
Lighting Handbook Reference & Application. 8th edition. Illuminating EngineeringSociety of North America. New York, 1995.
Swartz, B. and Cummings, J. "Laser range-gated underwater imaging includingpolarization discrimination". Proceedings: Underwater Imaging, Photography,and Visibility. The International Society for Optical Engineering. pg. 42-56. SanDiego, 1991.
Edgerton, H.E. "Electronic Flash, Strobe". Third Edition, MIT Press, Cambridge, MA1987.
Bibliography for Cameras (section 1.iii)Janesick, J. Scientific Charge Coupled Devices. SPIE Washington, 2001
103

Kodak. Technical Overview: CCD Technology. TIB 4131 June, 1998.
Bloss et. al, "CMOS Active Pixel Sensor with a Chess-Pattern Pixel Layout."
Fraunhofer Institut Integrated Circuits, D-91058 Erlangen, Germany, 2001.
Hicks and Schultz. Perfect Exposure. Watson-Guptill Publications, New York, 1999.
"CCD University" www.ccd.com
Bibliography for Post-Processing (section 1.iv)Russ, J. The Image Processing Handbook. 2 "d Edition. CRC Press, 1995.
Trucco, E. and Verri, A. Introductory Techniques for 3-D Computer Vision. Prentice-Hall. New Jersey, 1998.
Canny, J. "A Computational Approach to Edge Detection", IEEE Transactions on
Pattern Analysis and Machine Intelligence, Vol. PAMI-8, pp. 679-698, 1986.
Shum, H. and Szeliski, R. "Construction and Refinement of Panoramic Mosaics with
Global and Local Alignment", Microsoft Research.
Can, A. et al. "A Feature-Based Technique for Joint, Linear Estimation of High-OrderImage-to-Mosaic Transformations: Application to Mosaicing the Curved HumanRetina", IEEE, 2000.
Reddy, B. and Chatterji, B. "An FFT-Based Technique for Translation, Rotation, andScale-Invariant Image Registration", IEEE Transactions on Image Processing,August 1996.
Brown, L. "A Survey of Image Registration Techniques".ACM Computing Surveys,December 1992.
Sawhney, H and Hsu, S. and Kumar, R. "Robust Video Mosaicing through TopologyInference and Local to Global Alignment", Proceedings of the EuropeanConference on Computer vision, 1998.
Bibliography for Optical Water Properties (section 1.v)
Chisholm, S. (Professor at MIT) Personal Interview,May 2002.
Kitchen, J. (Representative of WetLabs.) Personal Interview, May 2002.
104

Kirk, John. Light and Photosynthesis in Aquatic Ecosystems. Cambridge UniversityPress, Cambridge, 1994.
Bibliography for LED Overview (Chapter 2)Bergh, Arpad, et al. "The Promise and Challenge of Solid-State Lighting." Physics
Today, Pg. 42-47, December, 2001.
Bierman, Andrew. "LEDS: From Indicators to Illuminators?" Lighting Research CenterWebsite. Downloaded Nov. 13, 2002.
ASU Department of Physics, "What is inside an LED?" Arizona State University websitewww.asu.edu, November 2002.
hBibliography for Lighting Calculations (Chapter 3)Jaffe, J. "Computer Modeling and the Design of Optimal Underwater Imaging Systems",
IEEE Journal of Oceanic Engineering, pg. 10 1-1 11, April 1990.
Mcglamery, B., "A computer model for underwater camera systems." Ocean Optics VI,S.Q. Duntley, Ed., SPIE, 1979.
105
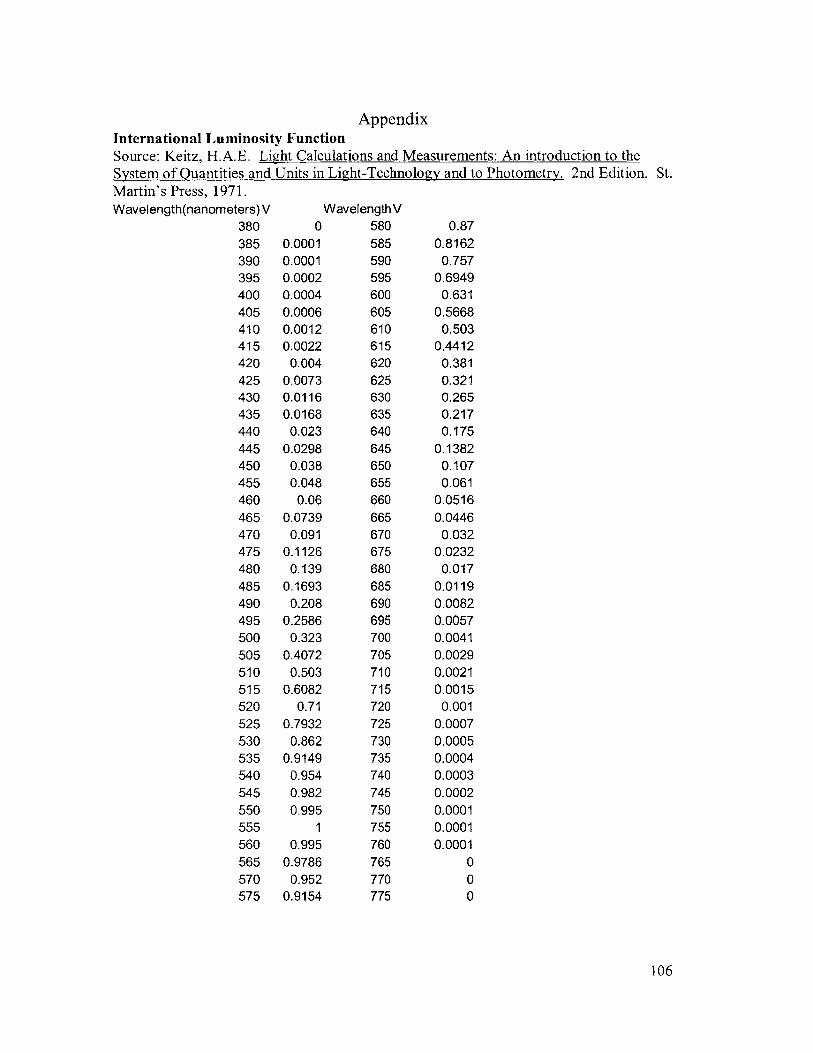
AppendixInternational Luminosity FunctionSource: Keitz, H.A.E. Light Calculations and Measurements: An introduction to theSystem of Quantities and Units in Light-Technology and to Photometry. 2nd Edition. St.Martin's Press, 1971.Wavelength(nanometers)V WavelengthV
380 0 580 0.87385 0.0001 585 0.8162390 0.0001 590 0.757395 0.0002 595 0.6949400 0.0004 600 0.631405 0.0006 605 0.5668410 0.0012 610 0.503415 0.0022 615 0.4412420 0.004 620 0.381425 0.0073 625 0.321430 0.0116 630 0.265435 0.0168 635 0.217440 0.023 640 0.175445 0.0298 645 0.1382450 0.038 650 0.107455 0.048 655 0.061460 0.06 660 0.0516465 0.0739 665 0.0446470 0.091 670 0.032475 0.1126 675 0.0232480 0.139 680 0.017485 0.1693 685 0.0119490 0.208 690 0.0082495 0.2586 695 0.0057500 0.323 700 0.0041505 0.4072 705 0.0029510 0.503 710 0.0021515 0.6082 715 0.0015520 0.71 720 0.001525 0.7932 725 0.0007530 0.862 730 0.0005535 0.9149 735 0.0004540 0.954 740 0.0003545 0.982 745 0.0002550 0.995 750 0.0001555 1 755 0.0001560 0.995 760 0.0001565 0.9786 765 0570 0.952 770 0575 0.9154 775 0
106

Transmissivity of Pure WaterSource: Marine Optics, Chap. 3, 1976 Elsevier Science PublisherWavelength Trans mittance(%/m)
375 95.6400 95.8425 96.8450 98.1475 98.2500 96.5525 96550 93.3575 91.3600 83.3625 79.6650 75675 69.3700 60.7725 29750 9775 9800 18
Computer Code
%colorcomp.m%code to compare different color emitters%just compares color spectrum, but not angles of emission
%This first section defines parameters.
%note that all spectra must be defined in x-y pairs%outside of range, spectra are padded by zero values%luxeon 5-star blue emiision spectraxblue = [0 400 425 440 450 458 460 462 473 480 490 500 520 535 5000];yblue = [0 0 0.01 0.2 0.6 0.98 1 0.98 0.6 0.2 0.08 0.04 0.01 0 0];luxblueeff = 0.1;%luxeon 5-star green emission spectraxgreen = [0 450 475 500 512 525 530 535 550 565 580 610 670 5000];ygreen = [0 0 0.1 0.22 0.6 0.95 1 0.9 0.5 0.2 0.1 0.02 0 0];luxgreeneff = 0.04;%luxeon 5-star cyan emission spectraxcyan = [0 440 450 475 480 490 505 520 535 545 555 570 590 5000];ycyan = [0 0 0.02 0.1 0.2 0.6 1 0.6 0.2 0.1 0.05 0.01 0 0];luxcyaneff = 0.091;%Single wavelength test data followsxsingle = [0 608 609 610 611 5000];ysingle = [0 0 1 10 0];singeff= 0.31;%deepsea power and light 50-watt multi-sealite%note that this output is actual output, so doesn't need correction%hence efficiacy = 1;
107

%note, above 1000 camera response is 0, so output doesn't matter%YOU MUST COMMENT OUT rescaling line below if running for this light%ydeepsea has been scaled for 1 watt output (ie, /50)xdeepsea = [0 300 400 600 794 950 1200 1590 1990 5000];ydeepsea = [0 0 0.0026 0.0165 0.0296 0.0329 0.0270 0.0188 0.0132 0]/50;deepseaeff= 1;%camera spectral responsexcamera = [0 400 450 500 550 600 620 650 700 750 800 850 900 950 1000 5000];ycamera = [0.5 0.5 0.75 0.95 0.935 0.98 1 0.9 0.75 0.57 0.44 0.3 0.24 0.13 0.05 0];
%plain water transmittance valuesxpwabs = [0 375 400 425 450 475 500 525 550 575 600 625 650 675 700 725 750 775 800 5000];ypwabs = [95.6 95.6 95.8 96.8 98.1 98.2 96.5 96 93.3 91.3 83.3 79.6 75 69.3 60.7 29 9 9 18 18];ypwabs = ypwabs/100; %converting from percentage%%%%%%%%%%%%%%%%%%%%%%%%%%%%%%%%%%%%%%%%%%%%%%%%%%%%%%%%%%%%%%%%%%%%%now we set run specific valuesxcolor = xblue;ycolor = yblue;
inputwatts = 1;efficacy = singeff; % = (watts of light output)/(watts of electricity)outputwatts = efficacy*inputwatts; %Since we are only looking at relative values, this doesn't matter
%this is actual output of lightaltitude = 5; %in meters%%%%%%%%%%%%%%%%%%%%%%%%%%%%%%%%%%%%%%%%%%%%%%%%%%%%%%%%%%%%%%%%%%%%%set spectral output such that integral of output is 'outputwatts'%start by integrating over spectrum
integrand = 0;dw=1;for w = 350:dw:1200 %integrating over spectrum
integrand = integrand + lookup(w, xcolor, ycolor)*dw;end
%comment out following line if running for deepsea power and light's multi-sealiteycolor = ycolor*outputwatts/integrand;
%subplot(3,2, 1)%plot(xcolor(2:(length(xcolor)-1)), ycolor(2:(length(xcolor)-I)))%title('emitter output: deepsea 50 watt multi-sealite');%%%%%%%%%%%%%%%%%%%%%%%%%%%%%%%%%%%%%%%%%%%%%%%%%%%%%%%%%%%%%%%%%%%%%%now we subject it to pure water absorbtion%this section shows absorbtion on way to bottom/groundfor i = 1:length(ycolor)
ycolor(i)= ycolor(i)*lookup(xcolor(i), xpwabs, ypwabs)^altitude;end%subplot(3,2,2), plot(xcolor(2:(length(xcolor)-1 )), ycolor(2:(length(xcolor)-1)))
%title('bottom irradiance');
%%%%%%%%%%%%%%%%%%%%%%%%%%%%%%%%%%%%%%%%%%%%%%%%%%%%%%%%%%%%%%%%%%%%%here we would account for spectral absorbtivity of bottom
108

%but for lack of data, assume ground is completely reflective
%subplot(3,2,3), plot(xcolor(2:(length(xcolor)-l)), ycolor(2:(length(xcolor)-1)))
%title(bottom radiance');
%%%%%%%%%%%%%%%%%%%%%%%%%%%%%%%%%%%%%%%%%%%%%%%%%%%%%%%%%%%%%%%%%%%%%now we subject it to pure water absorbtion%this section shows absorbtion on way from bottom to camerafor i = 1:length(ycolor)
ycolor(i)= ycolor(i)*lookup(xcolor(i), xpwabs, ypwabs)^altitude;end%subplot(3,2,4), plot(xcolor(2:(length(xcolor)-1)), ycolor(2:(length(xcolor)-1)))
%title('camera irradiance');
%%%%%%%%%%%%%%%%%%%%%%%%%%%%%%%%%%%%%%%%%%%%%%%%%%%%%%%%%%%%%%%%%%%%now account for spectral response of camera%note that response of camera is only know relativelyfor i = 1:length(ycolor)
ycolor(i)= ycolor(i)*lookup(xcolor(i), xcamera, ycamera);end
%%%%%%%%%%%%%%%%%%%%%%%%%%%%%%%%%%%%%%%%%%%%%%%%%%%%%%%%%%%%%%%%%%%%now integrate camera responseintegrand = 0;dw =1;for w = 350:dw:800 %integrating over spectrum
integrand = integrand + lookup(w, xcolor, ycolor)*dw;end
%subplot(3,2,5)plot(xcolor(2:(length(xcolor)-1)), ycolor(2:(length(xcolor)- 1)))title(sprintf('camera response, Luxeon Blue, integrated response %3.2f, integrand));
%Beam Pattern Modeling
%Single Source Angular Beam Patternanglevector = [0 3 5 10 20 30 60 90];relativepower = [1 0.9 0.73 0.32 0.05 0.02 0.01 0];totalpower = 0.024; %Watts
%Integration over hemisphere to get absolute power curveintegrand = 0;dtheta = 0.001;for theta = 0:dtheta:(pi/2)
relativepowervalue = lookup(theta, anglevector, relativepower);integrand = integrand + 2*pi*sin(theta)*relativepowervalue*dtheta;
end
109

%And Scale power curve accordinglyabspower = relativepower*totalpower/integrand;
%Set up "Target" Gridboxsize = 0.01; %meters = 1 cmtargetsize = 400; %number of boxes in targettarget = zeros(targetsize, targetsize);%Note: Upper left corner, ie, box (1,1) is at%Global Position (0,0,0)
%%%%%%%%%%%%%%%%%%%%%%%%%%%%%%%%%%%%%%%%%%%%%%%%%%%%%%%%%%%%%%%%%Position Sources%A source vector with each entry being a vector consisting of% [xposition, yposition, zposition, xtheta, ztheta]%Note, all dimensions are in terms of "boxsize"numsources = 0;sources = zeros(1,5);[sources, numsources] = createarray(sources, numsources, 1, 1, 1, 1, targetsize/2, targetsize/4, targetsize/2,pi/4, 0);[sources, numsources] = createarray(sources, numsources, 1, 1, 1, 1, targetsize/2, 3*targetsize/4,targetsize/2, 0, 0);
%%%%%%%%%%%%%%%%%%%%%%%%%%%%%%%%%%%%%%%%%%%%%%%%%%%%%%%%%%%%%%%%Main Loop through entire gridfor k = 1:numsources; %loop through all sources
for i = l:targetsizefor j = 1:targetsize
% i = targetsize/2;% j = targetsize/4;
%%%%%%%%%%%%%%%%%%%%%%%%%%%%%%%%%%%%%%%%%%%%%%%%%%%
%Determine distance and angle%horizdistance is horizontal distance from current source%to current "box"
horizdistance = sqrt((sources(k, 1) -i)A2 + (sources(k,2)- j)^2);%totaldistance from current source to current "box"totaldistance = sqrt((horizdistance)^2 + (sources(k,3))^2);%absangle is angle of source from target boxabsangle = acos(sources(k,3)/totaldistance);
%%%%%%%%%%%%%%%%%%%%%%%%%%%%%%%%%%%%%%%%%%%%%%%%%%%
%Find illuminance%First, adjust angle in regard to source rotation%y-rotation matrixRy = [cos(sources(k,4)) 0 sin(sources(k,4));
0 1 0;-sin(sources(k,4)) 0 cos(sources(k,4))];
%x-rotation matrixRz = [cos(sources(k,5)) -sin(sources(k,5)) 0;
sin(sources(k,5)) cos(sources(k,5)) 0;0 0 1];
110

%rotatevector and normalizerotatedvector = [(i-sources(k, 1)) (j-sources(k,2)) sources(k,3)]*Ry*Rz;rotatedvector = rotatedvector/norm(rotatedvector);
%and find anglerelativeangle = acos(dot(rotatedvector, [0 0 1]));
%"output" is output from source at given angleoutput = lookup(relativeangle, anglevector, abspower);%addition to target value is output value adjusted for angle of surface%and distance to target box.%SAUL, make sure this line is correct.target(i,j) = target(i,j) + output*cos(absangle)/(boxsize*totaldistance)A2;
endend
end
pcolor(target), axis('off)shading interp
%lookup.m%generic lookup table%takes x and y values and searches through them until input value is found%performs linear interpolation between nearest values
function[retumvalue]= lookup(input, xvalues, yvalues)
x = [xvalues'];
y = [yvalues'];
i = 2;
while x(i) < input
end
gap x(i) - x(i-1);dy = y(i) - y(i-1);
dx = input - x(i-1);
%linear interpolation between data pointsreturnvalue = y(i-1) + dy*dx/gap;
%createarray.m%This function creates a matrix of sources at a given location%inputs are as follows:%sources - the source vector, to which new sources will be appended%numsources - number of previously defined sources%numcolumns, numrows - establishes array size (only rectangular arrays possible%rowspacing, columnspacing - spacing of array elements in x & y dimensions respectively
111

%xpos, ypos - position of "upper left most" element in array%zpos - for simplicity it is assumed that all elements in array are at same altitude%yangle, zangle - rotation angles (radians) around yz axis respectively%outputs are as follows:%sources - and updated source vector, where each element of vector is defined as follows% ... sources(i,:)= [xpositiion, yposition , zposition, yangle, zangle];
function [sources, numsources] = createarray(sources, numsources, numrows, numcolumns, rowspacing,columnspacing, xpos, ypos, zpos, yangle, zangle);
xcount = 0;ycount= 0;
for I = (numsources+1):(numsources + numrows*numcolumns)sources(l,:) = [xpos + rowspacing*xcount, ypos + columnspacing*ycount, zpos, yangle, zangle];xcount = xcount+1;ycount = ycount+1;
end
numsources = numsources + numrows*numcolumns;
112
Related Documents