University of South Florida Scholar Commons Graduate eses and Dissertations Graduate School 2006 Underwater FRP repair of corrosion damaged prestressed piles Kwangsuk Suh University of South Florida Follow this and additional works at: hp://scholarcommons.usf.edu/etd Part of the American Studies Commons is Dissertation is brought to you for free and open access by the Graduate School at Scholar Commons. It has been accepted for inclusion in Graduate eses and Dissertations by an authorized administrator of Scholar Commons. For more information, please contact [email protected]. Scholar Commons Citation Suh, Kwangsuk, "Underwater FRP repair of corrosion damaged prestressed piles" (2006). Graduate eses and Dissertations. hp://scholarcommons.usf.edu/etd/2717

Welcome message from author
This document is posted to help you gain knowledge. Please leave a comment to let me know what you think about it! Share it to your friends and learn new things together.
Transcript
University of South FloridaScholar Commons
Graduate Theses and Dissertations Graduate School
2006
Underwater FRP repair of corrosion damagedprestressed pilesKwangsuk SuhUniversity of South Florida
Follow this and additional works at: http://scholarcommons.usf.edu/etd
Part of the American Studies Commons
This Dissertation is brought to you for free and open access by the Graduate School at Scholar Commons. It has been accepted for inclusion inGraduate Theses and Dissertations by an authorized administrator of Scholar Commons. For more information, please [email protected].
Scholar Commons CitationSuh, Kwangsuk, "Underwater FRP repair of corrosion damaged prestressed piles" (2006). Graduate Theses and Dissertations.http://scholarcommons.usf.edu/etd/2717
Underwater FRP Repair of Corrosion Damaged Prestressed Piles
by
Kwangsuk Suh
A dissertation submitted in partial fulfillment of the requirements for the degree of
Doctor of Philosophy Department of Civil and Environmental Engineering
College of Engineering University of South Florida
Major Professor: Rajan Sen, Ph.D. A. Gray Mullins, Ph.D.
William C. Carpenter, Ph.D. Autar K. Kaw, Ph.D.
Kandethody M. Ramachandran, Ph.D.
Date of Approval: May 2, 2006
Keywords: corrosion rate, steel loss, load test, carbon, glass, field
© Copyright 2006, Kwangsuk Suh

ACKNOWLEDGMENTS
I would like to express my sincere appreciation to the people who have
encouraged and supported me in the process of completing this work.
I am deeply grateful to Drs. Rajan Sen and Austin G. Mullins for their guidance,
help, and inspiration throughout my graduate years. They helped me at every step in my
academic career. Without them, none of my accomplishments would have been possible.
I also thank Drs. William C. Carpenter, Autar K. Kaw and Kandethody M.
Ramachandran who contributed their valuable time and knowledge to assist me.
I would also thanks my research team members, especially Danny Winters and
Michael Stokes.
I also gratefully acknowledge the support from the Florida Department of
Transportation in funding this research project.
Finally, I thank my family members and friends across the Pacific Ocean for their
consistent love and support. Most importantly, I wish to thank my loving wife who
makes every moment in my life enlightening.
i
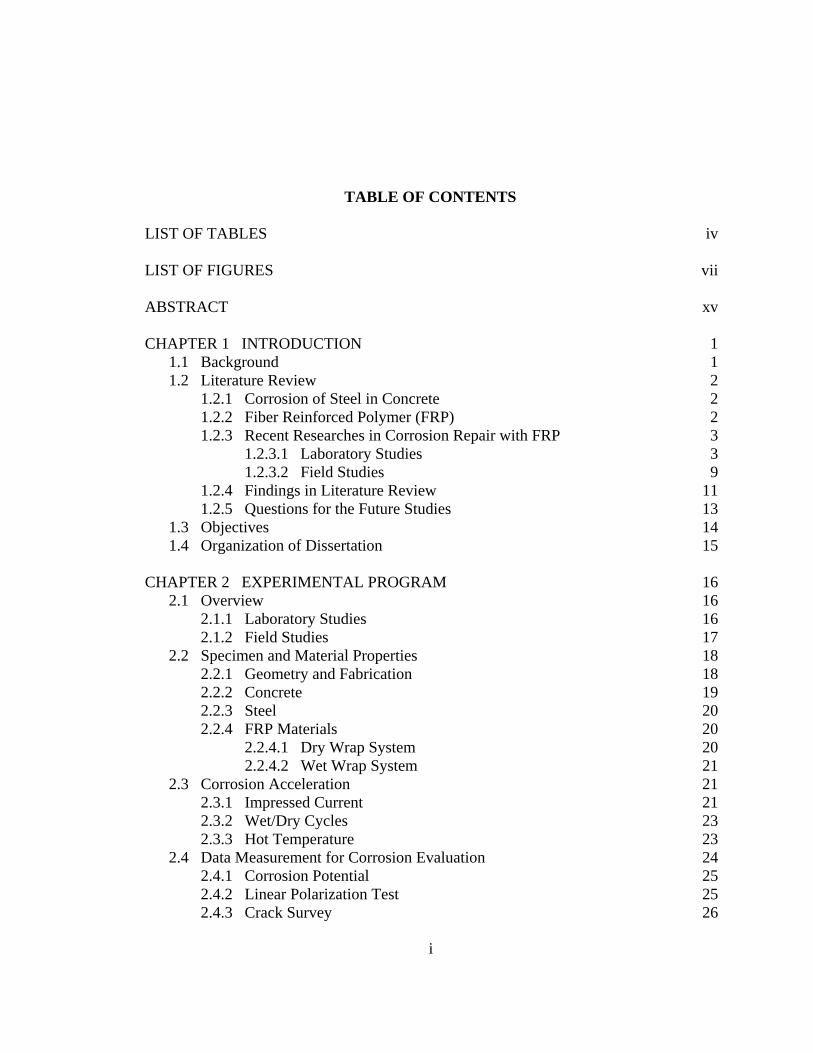
TABLE OF CONTENTS LIST OF TABLES LIST OF FIGURES ABSTRACT CHAPTER 1 INTRODUCTION
1.1 Background 1.2 Literature Review 1.2.1 Corrosion of Steel in Concrete 1.2.2 Fiber Reinforced Polymer (FRP) 1.2.3 Recent Researches in Corrosion Repair with FRP
1.2.3.1 Laboratory Studies 1.2.3.2 Field Studies
1.2.4 Findings in Literature Review 1.2.5 Questions for the Future Studies 1.3 Objectives 1.4 Organization of Dissertation
CHAPTER 2 EXPERIMENTAL PROGRAM 2.1 Overview
2.1.1 Laboratory Studies 2.1.2 Field Studies
2.2 Specimen and Material Properties 2.2.1 Geometry and Fabrication 2.2.2 Concrete 2.2.3 Steel 2.2.4 FRP Materials 2.2.4.1 Dry Wrap System 2.2.4.2 Wet Wrap System
2.3 Corrosion Acceleration 2.3.1 Impressed Current 2.3.2 Wet/Dry Cycles 2.3.3 Hot Temperature
2.4 Data Measurement for Corrosion Evaluation 2.4.1 Corrosion Potential 2.4.2 Linear Polarization Test 2.4.3 Crack Survey
iv
vii
xv
11222339
11131415
16161617181819202020212121232324252526
ii
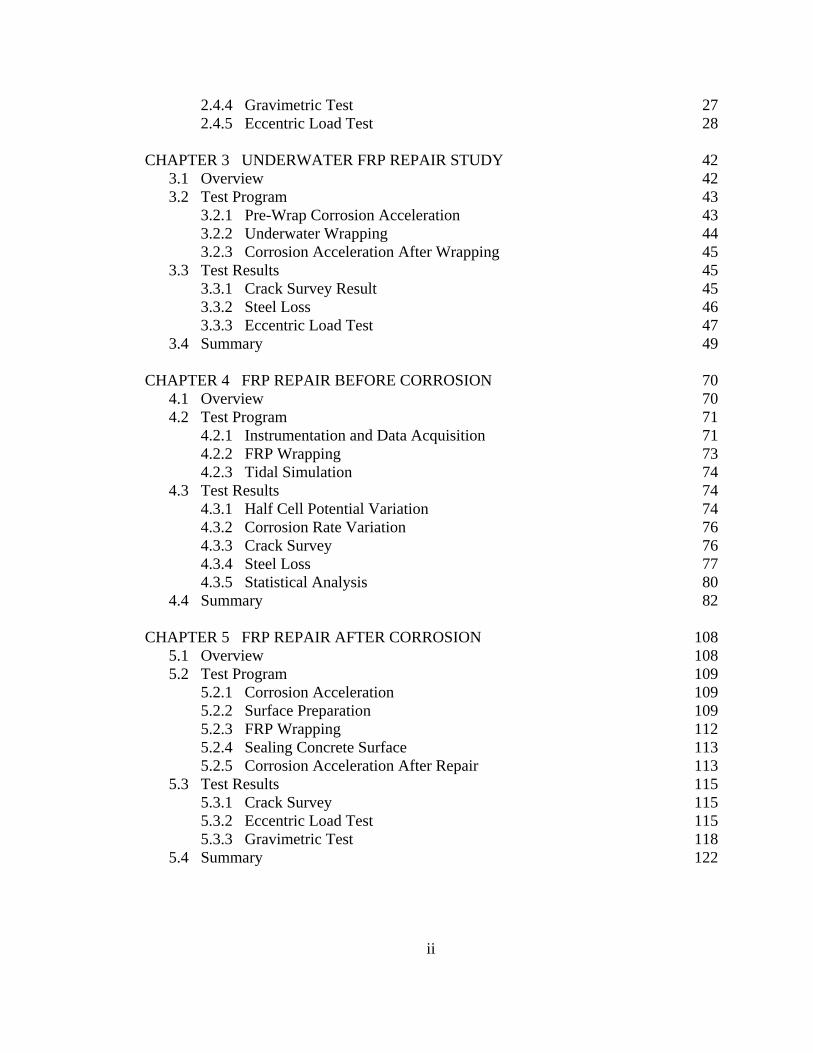
2.4.4 Gravimetric Test 2.4.5 Eccentric Load Test
CHAPTER 3 UNDERWATER FRP REPAIR STUDY
3.1 Overview 3.2 Test Program
3.2.1 Pre-Wrap Corrosion Acceleration 3.2.2 Underwater Wrapping 3.2.3 Corrosion Acceleration After Wrapping
3.3 Test Results 3.3.1 Crack Survey Result 3.3.2 Steel Loss 3.3.3 Eccentric Load Test
3.4 Summary
CHAPTER 4 FRP REPAIR BEFORE CORROSION 4.1 Overview 4.2 Test Program
4.2.1 Instrumentation and Data Acquisition 4.2.2 FRP Wrapping 4.2.3 Tidal Simulation
4.3 Test Results 4.3.1 Half Cell Potential Variation 4.3.2 Corrosion Rate Variation 4.3.3 Crack Survey 4.3.4 Steel Loss 4.3.5 Statistical Analysis
4.4 Summary
CHAPTER 5 FRP REPAIR AFTER CORROSION 5.1 Overview 5.2 Test Program
5.2.1 Corrosion Acceleration 5.2.2 Surface Preparation 5.2.3 FRP Wrapping 5.2.4 Sealing Concrete Surface 5.2.5 Corrosion Acceleration After Repair
5.3 Test Results 5.3.1 Crack Survey 5.3.2 Eccentric Load Test 5.3.3 Gravimetric Test
5.4 Summary
2728
4242434344454545464749
70707171737474747676778082
108108109109109112113113115115115118122
iii
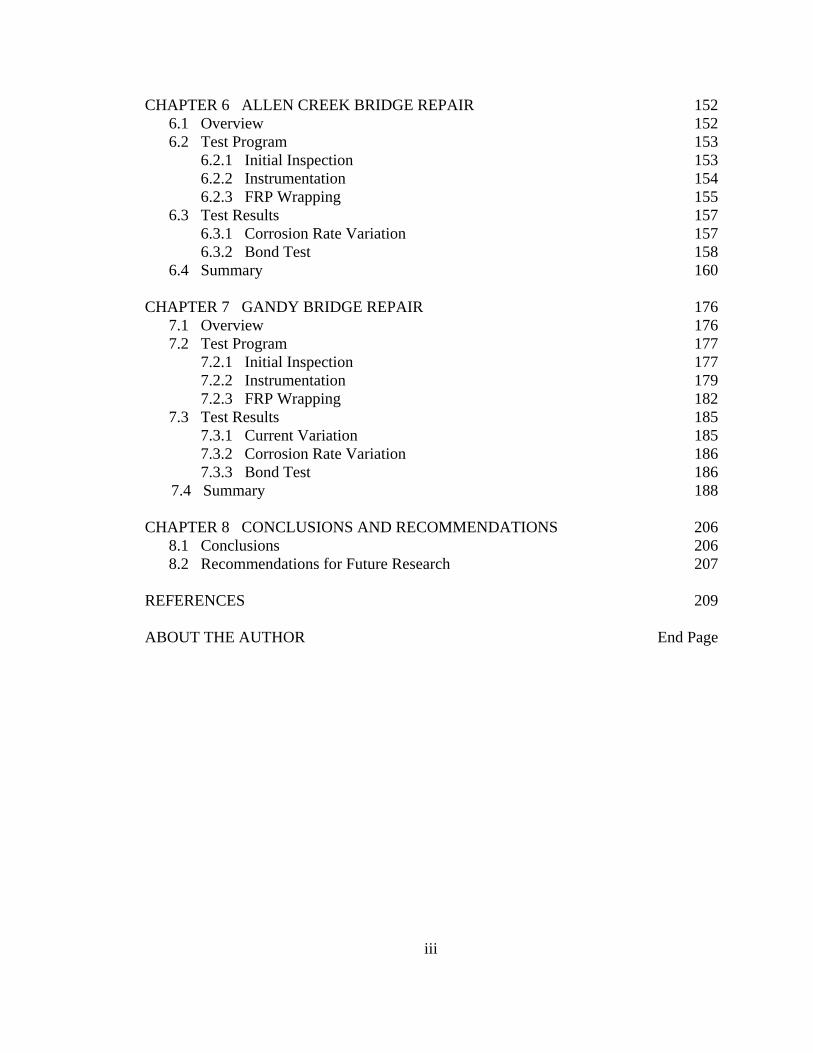
CHAPTER 6 ALLEN CREEK BRIDGE REPAIR 6.1 Overview 6.2 Test Program
6.2.1 Initial Inspection 6.2.2 Instrumentation 6.2.3 FRP Wrapping
6.3 Test Results 6.3.1 Corrosion Rate Variation 6.3.2 Bond Test
6.4 Summary
CHAPTER 7 GANDY BRIDGE REPAIR 7.1 Overview 7.2 Test Program
7.2.1 Initial Inspection 7.2.2 Instrumentation 7.2.3 FRP Wrapping
7.3 Test Results 7.3.1 Current Variation 7.3.2 Corrosion Rate Variation 7.3.3 Bond Test
7.4 Summary
CHAPTER 8 CONCLUSIONS AND RECOMMENDATIONS 8.1 Conclusions 8.2 Recommendations for Future Research
REFERENCES ABOUT THE AUTHOR
152152153153154155157157158160
176176177177179182185185186186188
206206207
209
End Page
iv
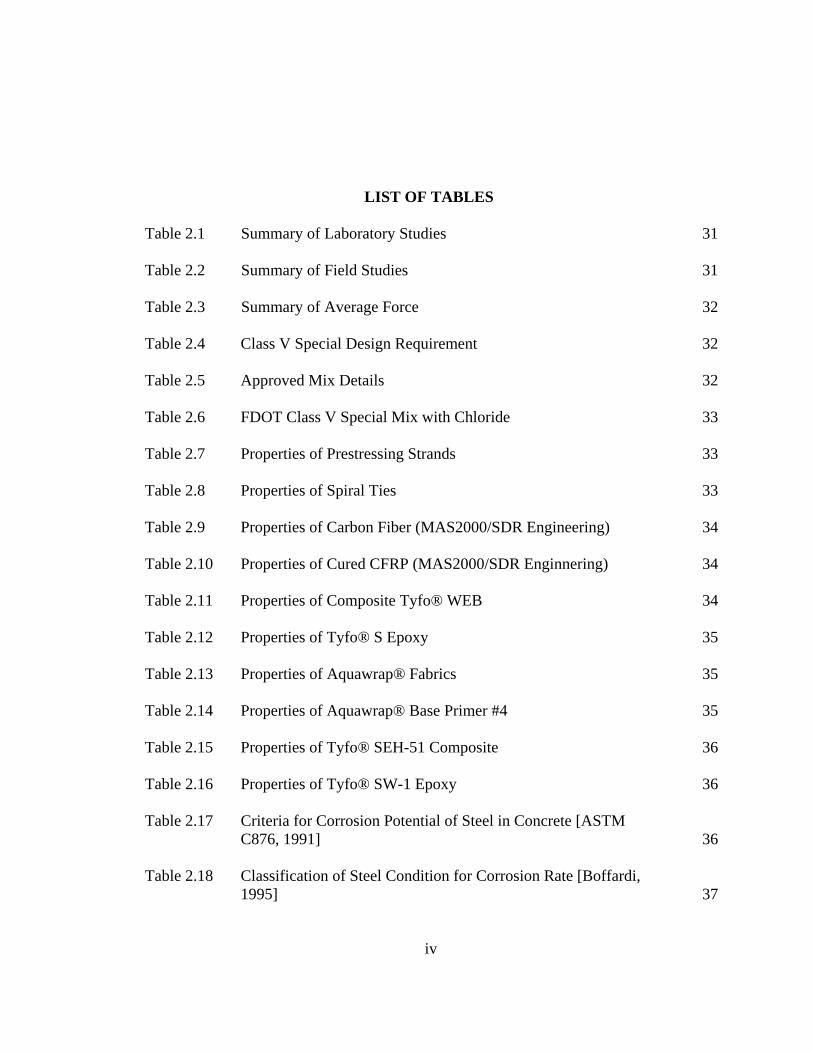
LIST OF TABLES Table 2.1 Summary of Laboratory Studies Table 2.2 Summary of Field Studies Table 2.3 Summary of Average Force Table 2.4 Class V Special Design Requirement Table 2.5 Approved Mix Details Table 2.6 FDOT Class V Special Mix with Chloride Table 2.7 Properties of Prestressing Strands Table 2.8 Properties of Spiral Ties Table 2.9 Properties of Carbon Fiber (MAS2000/SDR Engineering) Table 2.10 Properties of Cured CFRP (MAS2000/SDR Enginnering) Table 2.11 Properties of Composite Tyfo® WEB Table 2.12 Properties of Tyfo® S Epoxy Table 2.13 Properties of Aquawrap® Fabrics Table 2.14 Properties of Aquawrap® Base Primer #4 Table 2.15 Properties of Tyfo® SEH-51 Composite Table 2.16 Properties of Tyfo® SW-1 Epoxy Table 2.17 Criteria for Corrosion Potential of Steel in Concrete [ASTM C876, 1991] Table 2.18 Classification of Steel Condition for Corrosion Rate [Boffardi, 1995]
31
31
32
32
32
33
33
33
34
34
34
35
35
35
36
36
36
37
v
Table 3.1 Specimen Details of Underwater Wrap Study Table 3.2 Crack Information After 125 Days Exposure Table 3.3 Crack Information After Another 125 Days Post-Repair Exposure Table 3.4 Result of Gravimetric Test
Table 3.5 Summary of Eccentric Load Test Result Table 3.6 Result of Concrete Cylinder Test Table 3.7 Actual Steel Loss of 6ft Specimens at Targeted Steel Loss Table 3.8 Summary of Eccentric Load Test Table 4.1 Specimen Details for Study of FRP Wrap Before Corrosion Table 4.2 Crack Survey Result of Control Specimens Table 4.3 Gravimetric Test Results of Controls Table 4.4 Gravimetric Test Results of CFRP Wrapped Specimens Table 4.5 Gravimetric Test Results of GFRP Wrapped Specimens Table 4.6 Averaged Steel Loss of Each Specimen (unit: %) Table 4.7 Comparison of Steel Loss Between the Wrapped (n=16) and Unwrapped (n=6) Specimens Table 4.8 Comparison of Steel Loss Between the Specimens Wrapped with Carbon Fiber (n=8) and with Glass Fiber (n=8) Table 4.9 Comparison of Steel Loss Among Specimens with Different Numbers of Layers Table 5.1 Specimen Details for Study of FRP Wrap After Corrosion Table 5.2 Result of Crack Survey on Controls at the End of the Study Table 5.3 Summary of Eccentric Load Test Table 5.4 Results of Gravimetric Test for Controls (#60 and #61)
51
51
52
52
53
53
54
54
84
84
85
86
87
88
89
89
89
125
126
126
127
vi
Table 5.5 Results of Gravimetric Test for Full Repair/2 layer/36 in Table 5.6 Results of Gravimetric Test for Minimal/1 layer/36 in Table 5.7 Result of Gravimetric Test for Minimal /2 layer/36 in Table 5.8 Results of Gravimetric Test for Minimal/3 layer/36 in Table 5.9 Results of Gravimetric Test for Minimal/2 layer/60 in Table 5.10 Maximum Steel Loss for Different Repair Schemes Table 5.11 Number of Broken Wires in Strands from Different Repair Methods (excluding unsealed specimens) Table 6.1 Details on Test Piles Table 6.2 Result of Chloride Content Test Table 6.3 Summary of Bond Test Result on Witness Panel (unit:psi) Table 6.4 Summary of Bond Test Result (unit:psi) Table 7.1 Test Program Table 7.2 Result of Chloride Content Analysis Table 7.3 Bond Strength Between FRP and Concrete (unit: psi)
128
129
130
131
132
133
133
162
162
163
163
190
190
191
vii
LIST OF FIGURES Figure 2.1 Specimen Geometry Figure 2.2 Regular Concrete Pour (L) and Daraccel Added Concrete Pour (R) Figure 2.3 Tidal Cycle (L) and Water Pump & Floating Switches (R) Figure 2.4 Crack Survey Figure 2.5 Gravimetric Test Figure Figure 2.6 Strand Nomenclature Figure 2.7 Roller-Swivel Assembly with Eccentricity Figure 2.8 Specimen Setup Figure 2.9 Damaged End (L) and Repaired End (R) Figure 2.10 Strain Gage and LVDT Installation Figure 3.1 Specimen Set-up for Impressed Current Corrosion Acceleration Figure 3.2 Voltage Variation During Corrosion Acceleration Figure 3.3 CFRP Wrapping in the Water Figure 3.4 Voltage Variation of Post-Wrap Corrosion Accelerated Specimen Figure 3.5 Crack Pattern of #11 Specimen at After 125 days Exposure Figure 3.6 Crack Patterns of (a) #20, (b) #21, (c) #22 and (d) #23 Figure 3.7 Crack Patterns of (a) #24, (b) #25, (c) #26 and (d) #27 Figure 3.8 Crack Change of #22 Specimen at 50% of Targeted Steel Loss
38
39
39
39
40
40
40
41
41
41
55
55
56
56
57
58
59
60
viii
Figure 3.9 Crack Change of #23 Specimen at 50% of Targeted Steel Loss Figure 3.10 Crack Patterns of Wrapped Specimens at 50% of Targeted Steel Loss Figure 3.11 Strands from Control # 11 After 25% Targeted Corrosion. Retrieval (top) and After Cleaning (bottom) Figure 3.12 Failure of Unwrapped Control at 0% Steel Loss Figure 3.13 Load vs Lateral Deflection Plot for Initial Controls Figure3.14 Load vs Strain Variation Plot for Initial Controls Figure 3.15 Failure of Unwrapped Controls After 125 Days Exposure Figure 3.16 Failure of Wrapped Controls After 125 Days Exposure Figure 3.17 Load vs Lateral Deflection Plot of Specimens After 125 Days Exposure Figure 3.18 Load vs Strain Variation of Specimens After 125 Days Exposure Figure 3.19 Failure of Unwrapped Controls After 250 Days Exposure Figure 3.20 Failure of Wrapped Specimens After 250 Days Exposure Figure 3.21 Load vs Lateral Deflection Plot of Specimens After 250 Days Exposure Figure 3.22 Load vs Strain Variation of Specimens After 250 Days Exposure Figure 3.23 Change of Load Capacity Figure 4.1 Position of ATR Probes and Thermocouple Figure 4.2 Data Measurement Set-up Figure 4.3 Carbon Fiber Wrapping Figure 4.4 Glass Fiber Wrapping Figure 4.5 Setting for Outdoor Specimens
61
62
63
63
64
64
65
65
66
66
67
67
68
68
69
90
91
91
91
92
ix
Figure 4.6 Setting for Indoor Specimens Figure 4.7 Variation of Averaged Potential Data at Middle Figure 4.8 Effect of CFRP Layers on Potential at Middle Figure 4.9 Effect of GFRP Layers on Potential at Middle Figure 4.10 Potential Variation at Top – A Side Figure 4.11 Potential Variation at Top – C Side Figure 4.12 Potential Variation at Middle – A Side Figure 4.13 Potential Variation at Middle – C Side Figure 4.14 Potential Variation at Bottom – A Side Figure 4.15 Potential Variation at Bottom – C Side Figure 4.16 Potential Change at Three Levels in Outdoor Control Specimen Figure 4.17 Potential Change at Three Levels in Indoor Control Specimen Figure 4.18 Potential Change at Three Levels in 2 Layer GFRP Wrapped Specimen Figure 4.19 Potential Change at Three Levels in 4 Layer GFRP Wrapped Specimen Figure 4.20 Potential Change at Three Levels in 2 Layer CFRP Wrapped Specimen Figure 4.21 Potential Change at Three Level in 4 Layer CFRP Wrapped Specimen Figure 4.22 Variation of Corrosion Rate Figure 4.23 Effect of CFRP Layers on Corrosion Rate Figure 4.24 Effect of GFRP Layers on Corrosion Rate Figure 4.25 Crack Pattern in Indoor Controls #39 (L) and #49 (R)
92
93
93
94
94
95
95
96
96
97
97
98
98
99
99
100
100
101
101
102
x
Figure 4.26 Crack Pattern in Outdoor Controls (a) #38, (b) #44, (c) #45, (d) #46 Figure 4.27 Exposed Steel in Unwrapped Control Specimens Figure 4.28 Exposed Steel in Wrapped Specimens Figure 4.29 Distribution of Corrosion Products in Unwrapped Specimens Figure 4.30 Effect of CFRP Wrap on Maximum Steel Loss (unit: %) Figure 4.31 Effect of GFRP Wrap on Maximum Steel Loss (unit: %) Figure 4.32 Average Steel Loss in Strand Figure 4.33 Actual Steel Loss vs Corrosion Rate Figure 5.1 Removing Contaminated Concrete Figure 5.2 Cleaning Specimens Figure 5.3 Application of Corrosion Inhibitor Figure 5.4 Application of Patching Materials Figure 5.5 Application of Minimal Surface Preparation Figure 5.6 Wrapped Specimens Figure 5.7 Sealed and Unsealed Piles Figure 5.8 Sealing of Concrete Surface on the Top Figure 5.9 UV Paint Coated Piles Figure 5.10 Set-up of Post-Repair Corrosion Acceleration Figure 5.11 Set-up of Specimens in the Tank Figure 5.12 Unwrapped (L) and Wrapped (R) Specimens After the Exposure Figure 5.13 Propagation of Cracks in #60 Specimen Before (L) and After (R) Accelerated Hot Water Simulated Cycles
103
104
104
105
105
106
106
107
134
134
135
135
136
136
136
137
137
138
139
139
140
xi
Figure 5.14 Propagation of Cracks in #61 Specimen Before (L) and After (R) Accelerated Hot Water Simulated Cycles Figure 5.15 Propagation of Cracks of #28 Specimen Before (L) and After (R) Accelerated Hot Water Simulated Cycles Figure 5.16 Propagation of Cracks of #29 Specimen Before (L) and After (R) Accelerated Hot Water Simulated Cycles Figure 5.17 Cylinder Test Results for the Eccentric Load Test Figure 5.18 Failure of Unwrapped Controls Figure 5.19 Load vs Deflection Plot for Unwrapped Controls Figure 5.20 Load vs Strain Variation for Unwrapped Controls Figure 5.21 Failure of Full Repair/36in/CFRP Specimens Figure 5.22 Load vs Deflection Plot for Full Repair/36in/CFRP Specimens Figure 5.23 Load vs Strain Variation for Full Repair/36in/CFRP Specimens Figure 5.24 Failure of Minimal Repair/36in/CFRP Specimens Figure 5.25 Load vs Deflection Plot for Minimal Repair/36in/CFRP Specimens Figure 5.26 Load vs Strain Variation for Minimal Repair/36in/CFRP Specimens Figure 5.27 Failure of Minimal Repair/72in/CFRP Specimens Figure 5.28 Load vs Deflection Plot for Minimal Repair/72in/CFRP Specimens Figure 5.29 Load vs Strain Variation for Minimal Repair/36in/CFRP Specimens Figure 5.30 Change in Ultimate Load Capacity After Exposure to Hot Water Tank Figure 5.31 Corrosion Product Distribution of Unwrapped Specimens Figure 5.32 Retrieved Strands and Ties of Unwrapped Specimens
140
141
141
142
142
143
143
144
144
145
145
146
146
147
147
148
148
149
149
xii
Figure 5.33 Retrieved Strands and Ties of Full Repair/2 layer/ 36in/CFRP Specimens Figure 5.34 Maximum Steel Loss Increase in Strands Wrapped with 2 CFRP Layers Figure 5.35 Maximum Steel Loss Increase in Strands Wrapped 36 in Figure 5.36 Relationship Between Number of Broken Wires and Actual Steel Loss Figure 6.1 View of Allen Creek Bridge Figure 6.2 Elevation View of Allen Creek Bridge Figure 6.3 Instrumentation Details Figure 6.4 Stainless Steel Rods Installation Figure 6.5 Ground Rod Installation Figure 6.6 Linear Polarization Test Figure 6.7 Schematic Drawing for Connections of LP Test Figure 6.8 Scaffolding Installation Figure 6.9 Surface Preparation (L) and CFRP Application (R) Figure 6.10 Hydraulic Cement Application Figure 6.11 Grinding Edges Figure 6.12 Application of CFRP Wrap in the Water Figure 6.13 Application of GFRP Wrap in the Water Figure 6.14 Corrosion Rate Measurements in Dry-Wrapped Piles Figure 6.15 Corrosion Rate Measurements in Wet-Wrapped Piles Figure 6.16 Comparison of Dry and Wet-Wrapped Systems Figure 6.17 Comparison of Corrosion Rate of Wet-Wrap Glass and Controls
149
150
150
151
164
164
165
166
166
167
167
168
168
168
169
169
170
170
171
171
172
xiii
Figure 6.18 Pull-Out Test on Witness Panels Figure 6.19 Bond Test in Progress Figure 6.20 Bond Tests at Dry-Wrap Repaired Piles Figure 6.21 Bond Tests at Wet-Wrap Repaired Piles Figure 6.22 Average Bond Strength After 26 Months Figure 6.23 Maximum Bond Strength After 2 Years Figure 7.1 View of Pier 208 at Gandy Bridge Figure 7.2 Wrap and Instrumentation Detail Figure 7.3 Initial Surface Potential Distribution (mV vs CSE) Figure 7.4 Rebar Probe Figure 7.5 Commercial Probe Manufactured by Concorr, Inc Figure 7.6 Rebar Probe Installation Figure 7.7 Commercial Probe Installation Figure 7.8 Junction Box Installation Figure 7.9 Interaction Diagram of 20in x 20in Prestressed Pile. Figure 7.10 Scaffolding Around a Pile Figure 7.11 Patching Damaged Pile (P1) Figure 7.12 Surface Preparation Figure 7.13 CFRP Application (Aquawrap®) Figure 7.14 GFRP Application (Tyfo® wrap) Figure 7.15 View of Unwrapped Control and Wrapped Piles Figure 7.16 Current Flow Measurement Between PR-A and PR-D Figure 7.17 Variation of Corrosion Rate at the Top of the Piles
173
173
174
174
175
175
192
193
194
195
195
196
196
197
197
198
198
199
199
200
200
201
201
xiv
Figure 7.18 Variation of Corrosion Rate at the Bottom of the Piles Figure 7.19 Installed Dollies on Pile2 (L) and Pile3(R) Figure 7.20 Bond Test on Pile2 (all epoxy failure) Figure 7.21 Bond Test on Pile3 (all epoxy failure) Figure 7.22 Averaged FRP-Concrete Bond Strength Figure 7.23 Maximum FRP-Concrete Bond Strength
202
202
203
204
205
205
xv
UNDERWATER FRP REPAIR OF CORROSION DAMAGED
PRESTRESSED PILES
Kwangsuk Suh
ABSTRACT
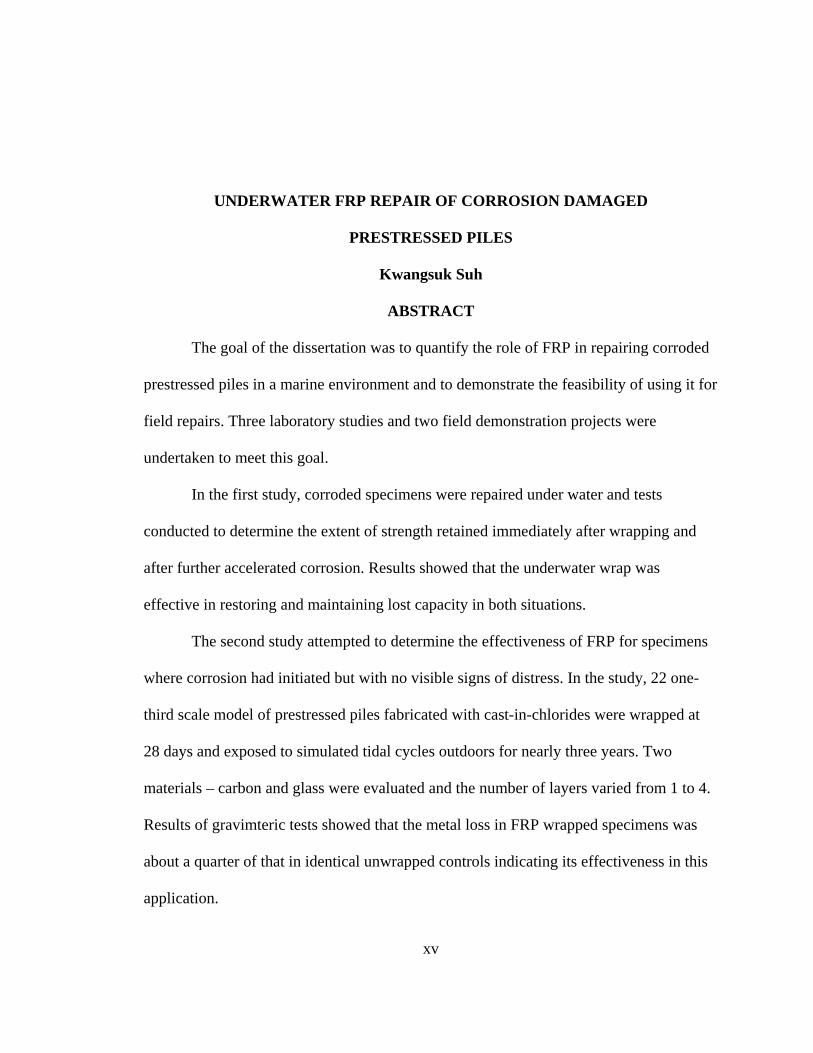
The goal of the dissertation was to quantify the role of FRP in repairing corroded
prestressed piles in a marine environment and to demonstrate the feasibility of using it for
field repairs. Three laboratory studies and two field demonstration projects were
undertaken to meet this goal.
In the first study, corroded specimens were repaired under water and tests
conducted to determine the extent of strength retained immediately after wrapping and
after further accelerated corrosion. Results showed that the underwater wrap was
effective in restoring and maintaining lost capacity in both situations.
The second study attempted to determine the effectiveness of FRP for specimens
where corrosion had initiated but with no visible signs of distress. In the study, 22 one-
third scale model of prestressed piles fabricated with cast-in-chlorides were wrapped at
28 days and exposed to simulated tidal cycles outdoors for nearly three years. Two
materials – carbon and glass were evaluated and the number of layers varied from 1 to 4.
Results of gravimteric tests showed that the metal loss in FRP wrapped specimens was
about a quarter of that in identical unwrapped controls indicating its effectiveness in this
application.
xvi
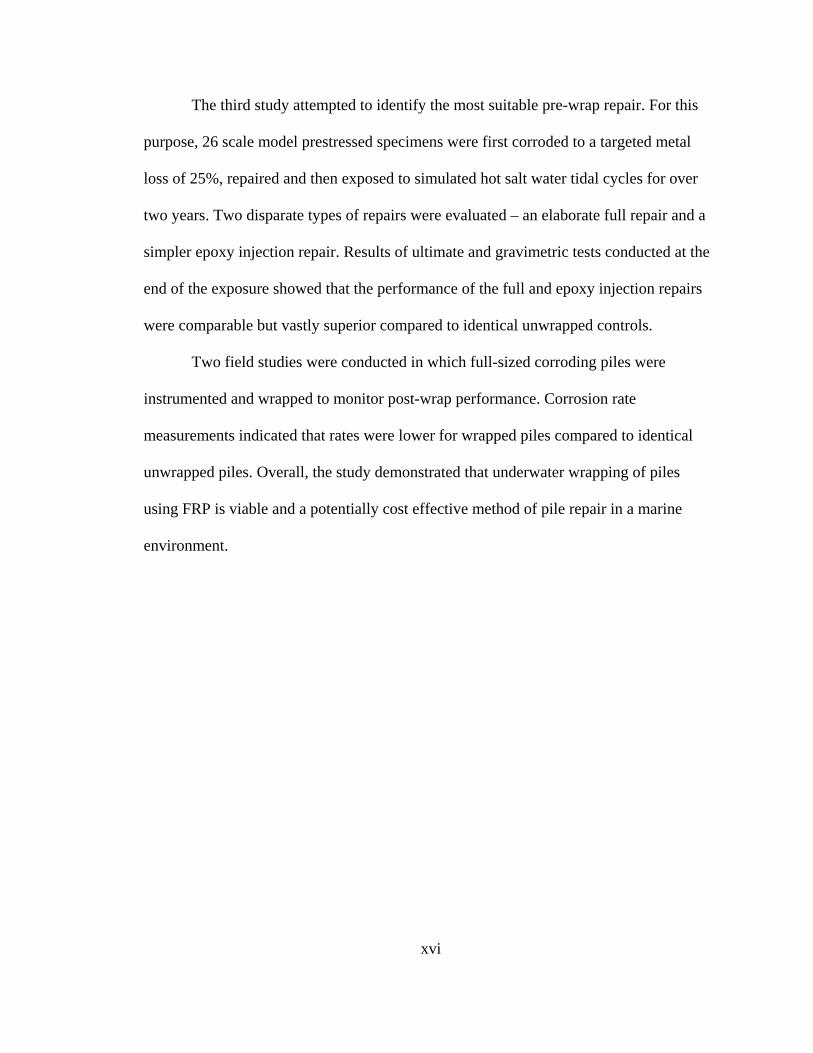
The third study attempted to identify the most suitable pre-wrap repair. For this
purpose, 26 scale model prestressed specimens were first corroded to a targeted metal
loss of 25%, repaired and then exposed to simulated hot salt water tidal cycles for over
two years. Two disparate types of repairs were evaluated – an elaborate full repair and a
simpler epoxy injection repair. Results of ultimate and gravimetric tests conducted at the
end of the exposure showed that the performance of the full and epoxy injection repairs
were comparable but vastly superior compared to identical unwrapped controls.
Two field studies were conducted in which full-sized corroding piles were
instrumented and wrapped to monitor post-wrap performance. Corrosion rate
measurements indicated that rates were lower for wrapped piles compared to identical
unwrapped piles. Overall, the study demonstrated that underwater wrapping of piles
using FRP is viable and a potentially cost effective method of pile repair in a marine
environment.
1
CHAPTER 1
INTRODUCTION
1.1 Background
Corrosion of steel reinforcement is one of the most important factors responsible
for premature deterioration of bridge piles exposed to a marine environment. Damage is
characterized by cracking, spalling and delamination of the cross-section that results in
loss of strength and ductility.
Traditionally, corrosion damage is repaired by “chip and patch” methods in which
the deteriorated concrete is removed, the corroded steel cleaned, and patching material
applied. However, as the electro-chemical nature of corrosion is not addressed they are
not durable. The re-repair of corrosion damage is very common worldwide. As a result
there has been interest in alternative methods such as the use of fiber reinforced polymer
(FRP) wraps.
FRPs are light weight corrosion-resistant materials that can restore lost structural
capacity. The light weight means that repairs can be carried out quickly without the need
for heavy equipment. Despite higher material costs, as labor, mobilization and installation
costs are lower they can be cost effective. However, as FRP serve as barrier elements to
the ingress of oxygen, chlorides and moisture that drive the corrosion reactions, FRP
repairs can only slow down but not stop corrosion from continuing.
2
Many studies have been conducted to investigate the role of FRP in corrosion
repair though most studies focused on its effect on reinforced concrete elements. While
the corrosion process in reinforced and prestressed concrete elements are similar, its
effect is more detrimental in prestressed concrete since it uses less steel and
consequently, the impact of section loss is proportionately greater [Bentur et al., 1997].
Given the increasing use of prestressed concrete in buildings and bridges, more research
on corrosion mitigation aspects of FRP is needed.
1.2 Literature Review
1.2.1 Corrosion of Steel in Concrete
Alkalinity of concrete usually provides embedded steel good protection from
corrosion by forming a thin passive layer on its surface. Once this passive layer is broken
by carbonation or by chlorides, it permits the movement of electrons from one surface of
steel to another. The site that produces electrons on the surface of steel is called an anode
and the site that consumes these electrons is called the cathode. This flow of current
makes steel dissolve and corrode. The dissolved steel (ferrous ions, Fe2+) forms corrosion
product (hydrated ferric oxide, Fe2O3H20), commonly referred to as rust by going through
several chemical reactions with oxygen and water. When it becomes hydrated ferric
oxide (Fe2O3H20), the increase of volume is about ten fold. Expansion forces generated
due to the corrosion products lead to cracking, spalling and delamination of concrete
[Broomfield, 1997].
1.2.2 Fiber Reinforced Polymer (FRP)
FRP is a composite material that consists of high strength fibers embedded in a
resin matrix. FRP may be classified as carbon fiber reinforced polymer (CFRP), glass
3
fiber reinforced polymer (GFRP), and aramid fiber reinforced polymer (AFRP)
depending on the fiber used. Because of its high strength, light weight, environmental
resistance, externally applied FRP system has been used for restoring and enhancing the
concrete structures since the 1980s [ACI 440, 2002].
It is believed that there are two general advantages in repairing corrosion-
damaged concrete using FRP. First, some corrosion inducing factors can be controlled
by wrapping the concrete with FRP. FRP wraps applied on concrete appear to delay
corrosion by preventing the penetration of chlorides, oxygen and water into concrete.
Secondly, confining pressure of FRP wrapping restrains the volume expansion of
corrosion product generated. This can change the electro-chemistry inside the wrap and
thereby alter the corrosion characteristic of the steel.
1.2.3 Recent Researches in Corrosion Repair with FRP
1.2.3.1 Laboratory Studies
Badawi et al. (2005)
In this study, carbon fiber laminates were used for repairing corrosion-damaged
reinforced concrete beams 6in wide, 10in deep and 126in long. A total of 8 beams with
two different schemes were exposed to impressed current (150 µA/cm2) to accelerate
corrosion of the embedded reinforcement. After 1000 hours, two beams were repaired
with CFRP U-wrap strips with a 6.7in spacing and the impressed current applied for
another 2000 hours. To monitor the corrosion of the reinforcement, crack width and
expansion strain were measured during the test. Every 1000 hours, two beams were
gravimetrically tested to determine the actual steel loss data.
4
Based on the results of the study, it was concluded that CFRP U-wrap reduced
corrosion expansion by 65 – 70% and actual steel loss was decreased by 33 – 35%.
Wheat et al. (2005)
The University of Texas performed an experimental study to investigate the
effectiveness of FRP wrapping in corrosion damaged reinforced concrete columns. Forty
two cylindrical columns 3ft in length and 10in diameter were cast and exposed to
simulated tidal cycles in 3.5% of salt water. It was found that the chloride content in FRP
wrapped specimens was lower than that in the identical unwrapped specimens.
Interestingly, it was found that water was trapped inside the wrap at a location that was
always submerged.
Wang al. (2004)
The purpose of this study was to evaluate the performance of CFRP strip for
strengthening corrosion-damaged beams. Twenty four reinforced concrete beams with
20cm × 30cm × 350cm of dimension were cast using two different concrete mixes. Some
beams were initially exposed to impressed current and then partially immersed in sodium
chloride solution to accelerate corrosion of reinforcement. Others were naturally corroded
under room environment. Corrosion potential and corrosion rate were measured during
the exposure test to estimate the diameter reduction of embedded rebar using Faraday’s
Law. After the exposure, seventeen specimens were repaired with the combination of
10cm CFRP strip on tension side and 10cm wide U-shaped CFRP strips with a 20cm
spacing along the beam. All beams were tested for measuring their post-repair load
carrying capacity.
5
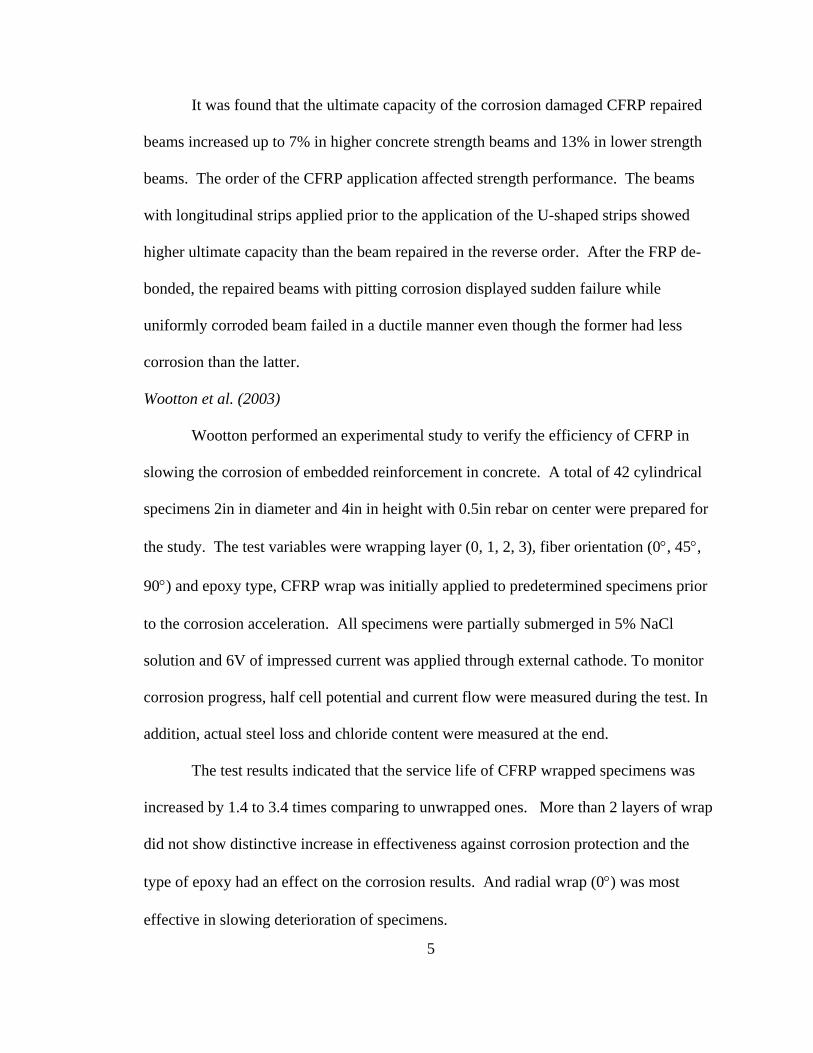
It was found that the ultimate capacity of the corrosion damaged CFRP repaired
beams increased up to 7% in higher concrete strength beams and 13% in lower strength
beams. The order of the CFRP application affected strength performance. The beams
with longitudinal strips applied prior to the application of the U-shaped strips showed
higher ultimate capacity than the beam repaired in the reverse order. After the FRP de-
bonded, the repaired beams with pitting corrosion displayed sudden failure while
uniformly corroded beam failed in a ductile manner even though the former had less
corrosion than the latter.
Wootton et al. (2003)
Wootton performed an experimental study to verify the efficiency of CFRP in
slowing the corrosion of embedded reinforcement in concrete. A total of 42 cylindrical
specimens 2in in diameter and 4in in height with 0.5in rebar on center were prepared for
the study. The test variables were wrapping layer (0, 1, 2, 3), fiber orientation (0°, 45°,
90°) and epoxy type, CFRP wrap was initially applied to predetermined specimens prior
to the corrosion acceleration. All specimens were partially submerged in 5% NaCl
solution and 6V of impressed current was applied through external cathode. To monitor
corrosion progress, half cell potential and current flow were measured during the test. In
addition, actual steel loss and chloride content were measured at the end.
The test results indicated that the service life of CFRP wrapped specimens was
increased by 1.4 to 3.4 times comparing to unwrapped ones. More than 2 layers of wrap
did not show distinctive increase in effectiveness against corrosion protection and the
type of epoxy had an effect on the corrosion results. And radial wrap (0°) was most
effective in slowing deterioration of specimens.
6
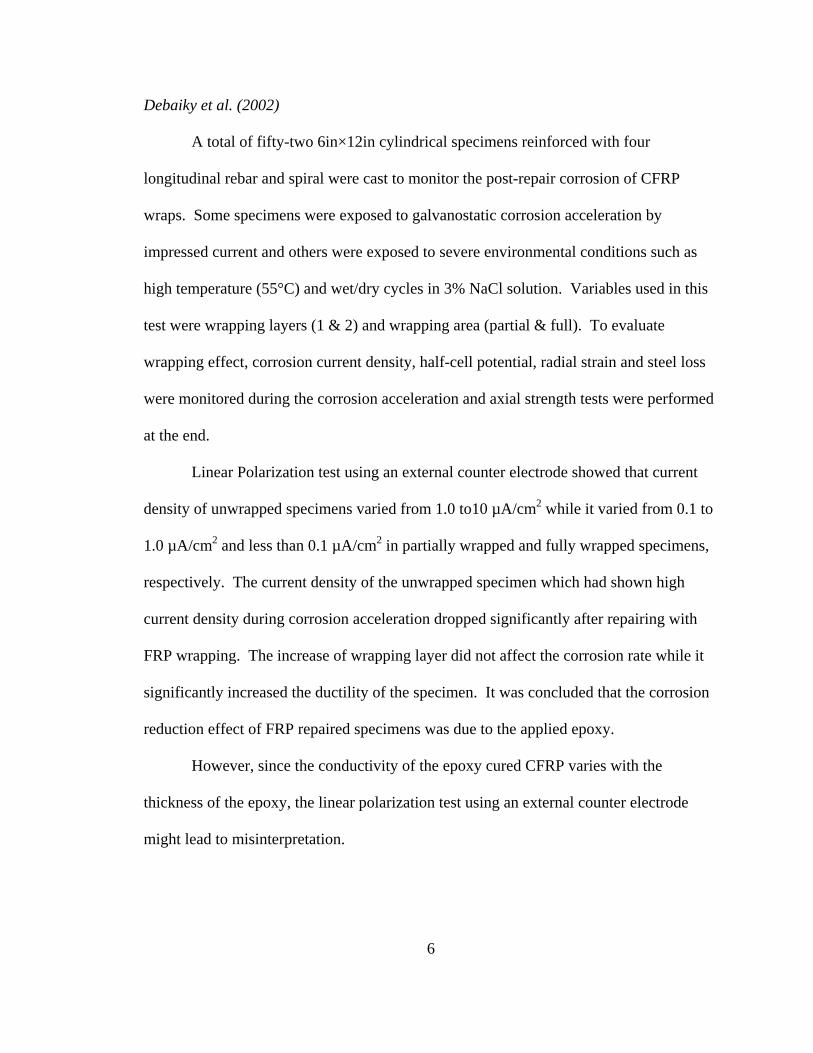
Debaiky et al. (2002)
A total of fifty-two 6in×12in cylindrical specimens reinforced with four
longitudinal rebar and spiral were cast to monitor the post-repair corrosion of CFRP
wraps. Some specimens were exposed to galvanostatic corrosion acceleration by
impressed current and others were exposed to severe environmental conditions such as
high temperature (55°C) and wet/dry cycles in 3% NaCl solution. Variables used in this
test were wrapping layers (1 & 2) and wrapping area (partial & full). To evaluate
wrapping effect, corrosion current density, half-cell potential, radial strain and steel loss
were monitored during the corrosion acceleration and axial strength tests were performed
at the end.
Linear Polarization test using an external counter electrode showed that current
density of unwrapped specimens varied from 1.0 to10 µA/cm2 while it varied from 0.1 to
1.0 µA/cm2 and less than 0.1 µA/cm2 in partially wrapped and fully wrapped specimens,
respectively. The current density of the unwrapped specimen which had shown high
current density during corrosion acceleration dropped significantly after repairing with
FRP wrapping. The increase of wrapping layer did not affect the corrosion rate while it
significantly increased the ductility of the specimen. It was concluded that the corrosion
reduction effect of FRP repaired specimens was due to the applied epoxy.
However, since the conductivity of the epoxy cured CFRP varies with the
thickness of the epoxy, the linear polarization test using an external counter electrode
might lead to misinterpretation.
7
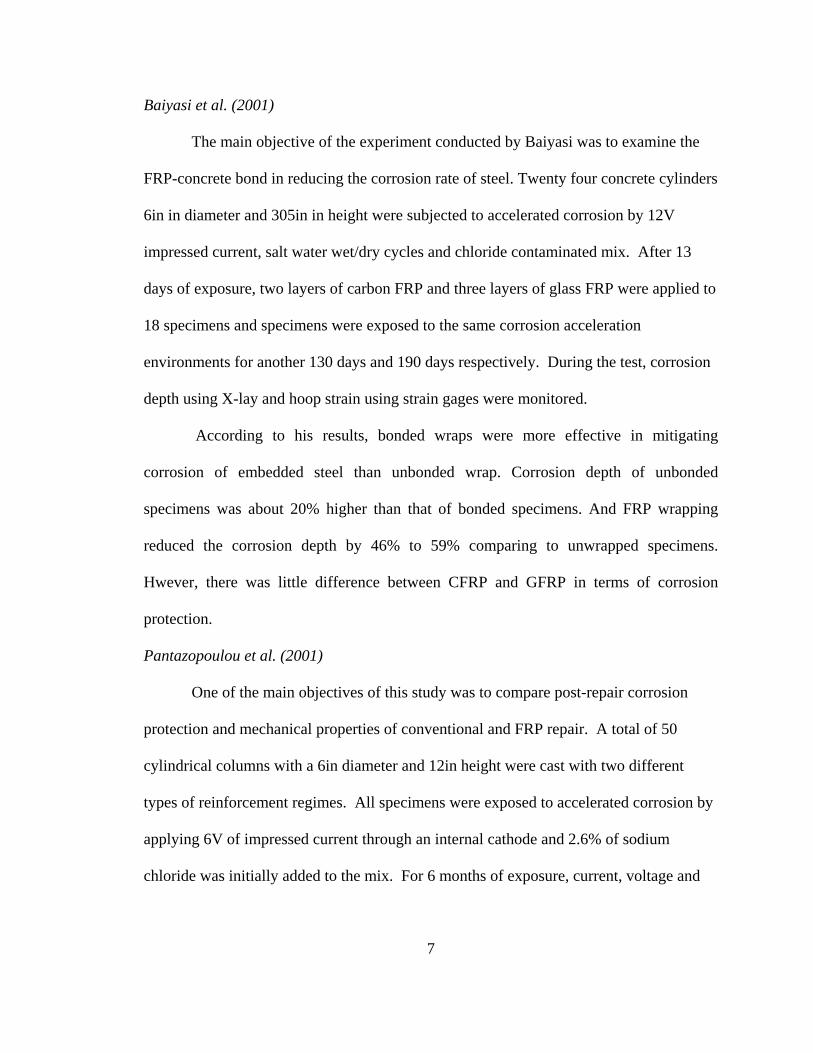
Baiyasi et al. (2001)
The main objective of the experiment conducted by Baiyasi was to examine the
FRP-concrete bond in reducing the corrosion rate of steel. Twenty four concrete cylinders
6in in diameter and 305in in height were subjected to accelerated corrosion by 12V
impressed current, salt water wet/dry cycles and chloride contaminated mix. After 13
days of exposure, two layers of carbon FRP and three layers of glass FRP were applied to
18 specimens and specimens were exposed to the same corrosion acceleration
environments for another 130 days and 190 days respectively. During the test, corrosion
depth using X-lay and hoop strain using strain gages were monitored.
According to his results, bonded wraps were more effective in mitigating
corrosion of embedded steel than unbonded wrap. Corrosion depth of unbonded
specimens was about 20% higher than that of bonded specimens. And FRP wrapping
reduced the corrosion depth by 46% to 59% comparing to unwrapped specimens.
Hwever, there was little difference between CFRP and GFRP in terms of corrosion
protection.
Pantazopoulou et al. (2001)
One of the main objectives of this study was to compare post-repair corrosion
protection and mechanical properties of conventional and FRP repair. A total of 50
cylindrical columns with a 6in diameter and 12in height were cast with two different
types of reinforcement regimes. All specimens were exposed to accelerated corrosion by
applying 6V of impressed current through an internal cathode and 2.6% of sodium
chloride was initially added to the mix. For 6 months of exposure, current, voltage and
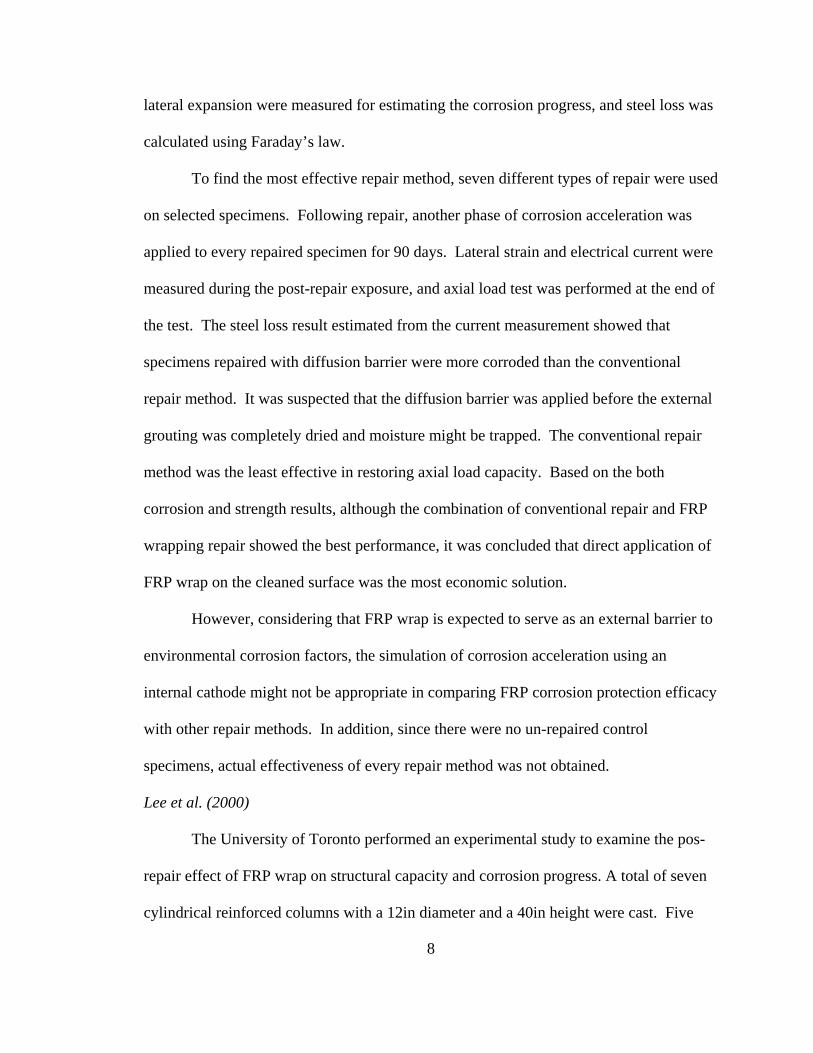
8
lateral expansion were measured for estimating the corrosion progress, and steel loss was
calculated using Faraday’s law.
To find the most effective repair method, seven different types of repair were used
on selected specimens. Following repair, another phase of corrosion acceleration was
applied to every repaired specimen for 90 days. Lateral strain and electrical current were
measured during the post-repair exposure, and axial load test was performed at the end of
the test. The steel loss result estimated from the current measurement showed that
specimens repaired with diffusion barrier were more corroded than the conventional
repair method. It was suspected that the diffusion barrier was applied before the external
grouting was completely dried and moisture might be trapped. The conventional repair
method was the least effective in restoring axial load capacity. Based on the both
corrosion and strength results, although the combination of conventional repair and FRP
wrapping repair showed the best performance, it was concluded that direct application of
FRP wrap on the cleaned surface was the most economic solution.
However, considering that FRP wrap is expected to serve as an external barrier to
environmental corrosion factors, the simulation of corrosion acceleration using an
internal cathode might not be appropriate in comparing FRP corrosion protection efficacy
with other repair methods. In addition, since there were no un-repaired control
specimens, actual effectiveness of every repair method was not obtained.
Lee et al. (2000)
The University of Toronto performed an experimental study to examine the pos-
repair effect of FRP wrap on structural capacity and corrosion progress. A total of seven
cylindrical reinforced columns with a 12in diameter and a 40in height were cast. Five
9
specimens were exposed to accelerated corrosion for 49 weeks and three of them were
repaired with two layers of carbon fiber. After repair, designated specimens were
subjected to further corrosion acceleration to monitor the post-repair effect of FRP.
The performance of FRP was evaluated by axial strength test, linear polarization
test and lateral expansion strain measurement. The strength test showed that the ultimate
load capacity of the FRP repaired corrosion-damaged specimen was increased by 28%
and its ductility was increased by 600% with respect to the control specimen. Even
though the steel loss estimated from Faraday’s Law became twice in the specimen
exposed to post-repair corrosion acceleration, its strength capacity was not decreased. It
was found that the corrosion rate was significantly decreased after FRP repair due to
deficiency of oxygen and moisture.
However, in this study, the steel loss was just estimated by Faraday’s Law that
overestimates steel loss. In addition, since the repaired area was perfectly isolated from
the environment by epoxy coating, it might be different with actual field repair in which a
significant amount of concrete is exposed to the elements.
It was recommended that 2% of sodium chloride mix by the cement weight, 1day-
2.5 days of wet/dry cycles and 12V of impressed current were the optimum regime for
laboratory corrosion acceleration.
1.2.3.2 Field Studies
Alampalli (2005)
The New York State Department of Transportation (NYSDOT) performed a field
research on the correlation between surface preparation method and corrosion mitigation
in repairing corrosion damaged bridge pier columns with CFRP. The selected bridge was
10
located over Hudson River in Troy and built in 1969. It had 8 spans composed of steel
girders and a concrete deck. Three rectangular columns with corrosion damage were
wrapped with one layer of bi-directional glass fiber after three different surface
preparations. In one column, the contaminated concrete was removed at least 1in over
the rebar, in another column, the removal was conducted only to the rebar depth and no
removal was conducted in the third column. Corrosion progress was monitored by pre-
installed corrosion probes and humidity-temperature probes.
Corrosion rate measurements were performed every 3 months. The rates initially
increased then gradually reduced before finally becoming constant. Based on four years
of monitoring, it was concluded that FRP was effective in controlling corrosion of steel
and there was no difference in different surface preparations. The corrosion rat variation
was not related with the temperature change.
However, in this study, no instrumented control was used to compare the efficacy
of the FRP wrap in corrosion rate variation.
Berver et al. (2002)
Embedded electrochemical technique was demonstrated in this study for
measuring the corrosion rate in FRP repaired bridge. A total of 12 corrosion damaged
bridges due to the deicing salt were selected for the study. All bridges were evaluated by
measuring the half cell potential, permeability and chloride. Prior to the GFRP wrapping
repair, commercial probes were installed in damaged pile caps to allow measurement of
the post-wrap corrosion rate using linear polarization.
11
The linear polarization test result indicated that wrap did not arrest corrosion of
steel and the corrosion rate fluctuated due to temperature and relative moisture in the
environment.
Halstead et al. (2000)
The NYSDOT conducted a field repair study using FRP wrapping on the Court
Street Bridge in 1998. The selected square reinforced columns had longitudinal cracks
on the surface and were partially spalled and delaminated. Corrosion progress of
embedded steel was monitored by measuring the external expansion strain, humidity and
temperature as well as the corrosion rate using linear polarization and embedded probes.
The result of the corrosion rate measurement suggested that FRP wrap did not
stop the increase of corrosion rate and its variation was consistent with the fluctuation of
the temperature. However, since only FRP wrapped piles were instrumented, it was not
possible to obtain the relative effectiveness of the FRP wrapping in corrosion resistance.
1.2.4 Findings in Literature Review
Corrosion Protection or Mitigation
• FRP wrap of corrosion damaged beams decreased the actual steel loss by 33 –
35% and the corrosion expansion by 65 to 70% [Badwai et al. 2005].
• FRP wrap increased the service life of reinforced cylinders by 36 to 375%
[Wootton et al. 2003].
• FRP wrap decreased the corrosion current density by 10 times at least and actual
steel loss by 62% [Debaiky et al. 2002].
• FRP wrap decreased the corrosion depth by 46 to 59% [Baiyasi et al. 2001].
• CFRP wrap decreased the corrosion rate by 50% [Lee et al. 2000].
12
• GFRP wrap did not arrest the corrosion rate in corrosion damaged pile cap
[Berver et al 2002].
• FRP wrap in the actual bridge pile did not stop the increase of the corrosion rate
[Halstead et al. 2002].
Strength Capacity Restoration
• FRP U –strip increased the ultimate load capacity by 7 to 13% [Wang et al. 2004].
• FRP wrap increased the ductility under the axial load by 200% at least [Debaiky
et al. 2002].
• CFRP wrap increased the ultimate load capacity by 28% and the ductility by
600% [Lee et al. 2000].
Wrapping Layer
• Two layers was more effective than one layer, however three layers were not
more effective than two layers [Wootton et al. 2003].
• The efficacy of one layer was better than two layers in steel loss reduction
however the ductility under the axial load was in proportion to the wrap layer
[Debaiky et al 2002].
Wrapping Area
• Full wrap was more effective than partial wrap in decreasing corrosion rate
[Debaiky et al, 2002].
• Half wrap increased the corrosion product distribution in unwrapped area of
wrapped specimen [Mullins et al. 2001].
13
Wrapping Configuration
• FRP wrap is more effective than the application of epoxy coat only [Wootton et
al. 2003].
• The combination of patching and FRP wrap was most effective [Pantazopoulou et
al. 2001].
• Surface preparation with GFRP wrap did not affect the corrosion rate of the actual
bridge column [Alampalli 2005].
1.2.5 Questions for the Future Studies
• Most corrosion repair studies performed in the laboratory showed that FRP wrap
decreased the corrosion of steel in corrosion damaged reinforced elements.
However, the results of field study did not support the conclusions of lab studies
and instrumented unwrapped control for comparison was not used in the field
studies.
• Results of many studies based on the Faraday’s Law to estimate the steel loss. It
might overestimate the actual steel loss and the efficacy of the FRP wrap in
corrosion mitigation.
• Partial wrap was less effective than full wrap and might have a negative effect on
the unwrapped area. However, it may not always possible to wrap the structure
fully. Therefore, it will be important to find the optimal wrapping area.
• There were very few of studies about the surface preparation performed prior to
FRP wrap. It needs more study to find the optimal surface preparation method
with FRP wrap.
14
• Most FRP studies were performed using reinforced concrete elements corroded by
deicing salt.
• The results of wrap layer in corrosion protection were varied and did not give a
clear answer. Therefore, a study considering the effect of number of wrap layer is
needed.
• Most lab studies focused on the efficacy of FRP system material required totally
dry condition for its application and cure. Recently, new FRP system have been
developed that can be applied in water. However, there have been few studies to
evaluate its efficacy for corrosion protection.
1.3 Objectives
The goals of the study were: (1) to investigate the efficacy of CFRP and GFRP
wrap in delaying corrosion of prestressed steel, (2) to find the role of the FRP wrapping
layers, (3) to investigate the role of pre-wrap repair on the subsequent FRP corrosion
mitigation performance, (4) to quantify the post-wrap performance of FRP used for
repairing the corrosion damaged prestressed concrete element, (5) to find an optimal
configuration of FRP wrap repair method, (6) to evaluate the efficacy of underwater
wrapping method in corrosion protection and strength restoration, and (7) to evaluate the
feasibility of using FRP for repairing corrosion damaged piles in field studies.
To achieve these objectives, three experimental studies were performed in the
laboratory and, based on the preliminary results of the laboratory studies, field repair
investigations were conducted in two different bridges.
15
1.4 Organization of Dissertation
This dissertation contains of eight chapters. Chapter 2 provides an overview of
the entire project, and Chapter 3 presents details on underwater wrapping study. The
study on the FRP wrap applied prior to occurrence of corrosion was provided in Chapter
4, and the post-FRP repair study with various surface preparation is presented in Chapter
5. Two field FRP repair studies are provided in Chapter 6 and 7. Finally, conclusions
and recommendations are discussed in Chapter 8.
16
CHAPTER 2
EXPERIMENTAL PROGRAM
2.1 Overview
The overall goal of this study was to assess the effectiveness of FRP wrap in
restoring the strength capacity and mitigating the corrosion of corrosion damaged
prestressed structures. To meet this goal, three laboratory studies and two field studies
were performed using different FRP materials and repair methods. An overview of the
studies are summarized in Tables 2.1 and 2.2.
2.1.1 Laboratory Studies
To obtain the information about the effectiveness of FRP in repairing the
corrosion damaged prestressed elements, a total of three different laboratory studies were
performed. The purpose of the first laboratory study was to verify the efficacy of
underwater wrapping method for repairing the corrosion damaged prestressed element.
Specimens were exposed to the corrosion acceleration regime for 125 days, selected
corroded specimens were then wrapped in water and exposed to the corrosion
acceleration scheme for another 125 days. Eccentric load column tests were performed
with wrapped and unwrapped specimens to compare their capacity. Details of this study
are presented in Chapter 3. The second laboratory study was performed to find the
effectiveness of FRP wrapping applied before the occurrence of corrosion of steel.
17
To obtain the information, newly fabricated, chloride-contaminated prestressed
specimens were wrapped using glass or carbon fiber at 28 days. All wrapped and
unwrapped specimens were exposed outdoors to simulated salt water wet-dry cycles for
about 3 years. Corrosion progress was monitored by corrosion probes embedded in every
specimen before the concrete pour. At the end of the study, all specimens were
gravimetrically tested to measure the actual steel loss. This study is described in Chapter
4.
The final experimental study was conducted to find out the role of pre-wrap repair
of corrosion damaged prestressed piles on subsequent FRP wrapping performance.
Specimens were exposed to impressed current for 125 days to obtain 25% steel loss and
then selected specimens were repaired using two extreme – an elaborate and a simple –
schemes prior to application of the FRP wrap. FRP wrapped specimens and unwrapped
controls were exposed to hot temperature, 100% of humidity, and salt water wet-dry
cycles for about 2 years. At the end of the study, the strength capacity and the corrosion
state of specimens was evaluated by eccentric load and gravimetric tests. Details on this
study are presented in Chapter 5.
2.1.2 Field Studies
Two field demonstration studies were conducted to evaluate the effectiveness of
two alternate systems (1) a “dry” wrap requiring cofferdam construction for preventing
water contact during the FRP application and cure, and (2) a “wet” wrap that could be
applied and cured in water. In the first study both dry and wet wrap systems were used on
eight prestressed concrete piles in Allen Creek Bridge, Clearwater, FL. The progress of
corrosion was monitored by performing a linear polarization test using embedded probes
18
in selected piles prior to the wrap. In addition, to compare the bond strength of each
system, pull out tests were conducted. All procedures and results for this study are
described in Chapter 6.
In the second study, two alternate wet wrap systems were evaluated for repairing
corroded piles on the Gandy Bridge, Tampa, FL. A total of three prestressed concrete
piles were wrapped and piles were instrumented to allow measurement of the corrosion
rate through linear polarization. Details on this study are presented in Chapter 7.
2.2 Specimen and Material Properties
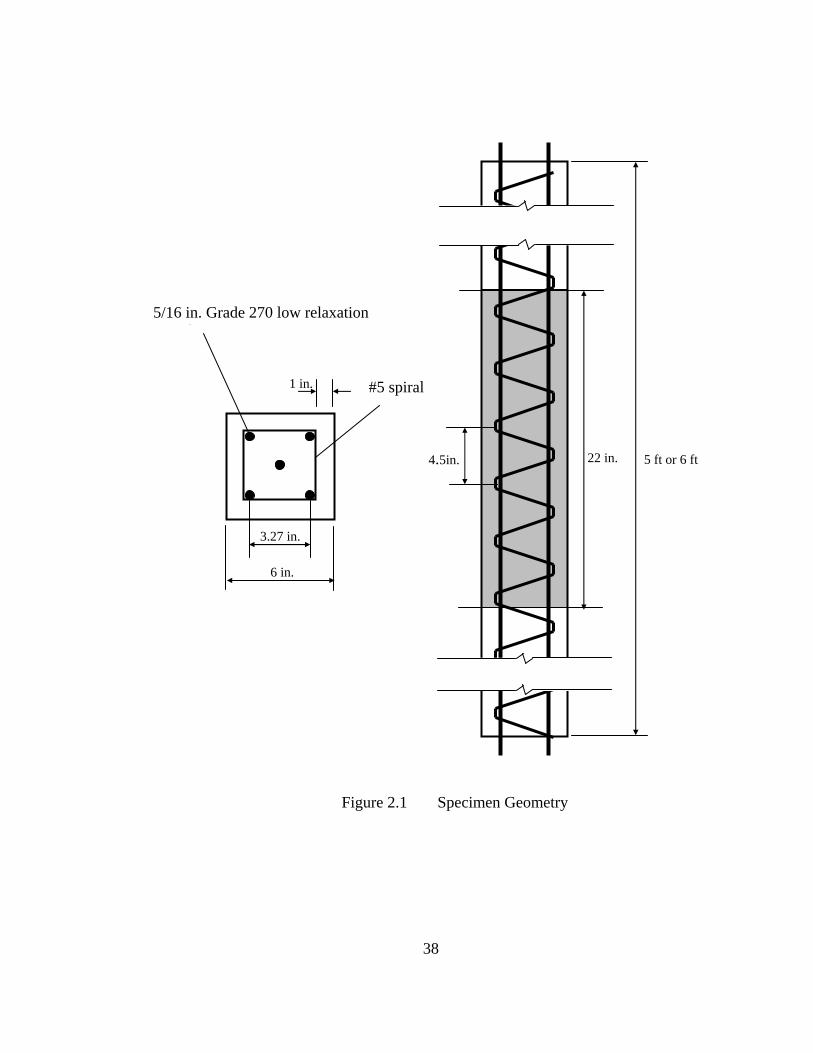
2.2.1 Geometry and Fabrication
The three laboratory studies used one-third scale models of 18in square
prestressed piles that had been found to be representative of piles observed to corrode in a
marine environment in the previous USF study [Sen, et al. 1999; Fisher, et al. 2000].
All specimens were prestressed by four 5/16in low relaxation Grade 270 strands.
The 6in x 6in cross-section was a 1/3rd scale model of 18in prestressed piles. A fifth
unstressed strand was provided at the center of the cross-section to serve as an internal
cathode for an impressed current accelerated corrosion scheme used. A 22in segment at
the center of the specimen was cast with 3% chloride ions to model the “splash zone”.
Class V special concrete. was used and the concrete cover was 1 inch. #5 gage spirals
spaced 4.5in on centers were provided in the chloride contaminated region. The geometry
of specimens is shown in Fig. 2.1. Specimens were either 5ft or 6ft long. The 5ft
specimens were used for measuring the actual steel loss due to corrosion by gravimetric
test and the 6ft specimens were used for the assessment of strength capacity by eccentric
column testing.
19
Specimens were cast in two pours at a month interval considering time schedule
of each studies. The form for the test specimens was fabricated over the three foot wide
flat region of the double-T bed. A single line was formed by using two sets of 4in x 6in
steel angles. The correct width was maintained by welding headers at intervals
corresponding to the different member lengths for the two pours. The details on
fabrication procedures are shown in other publication [Suh et al. 2005]. The strands were
tensioned using a prestressing jack and a hand operated hydraulic pump. The force placed
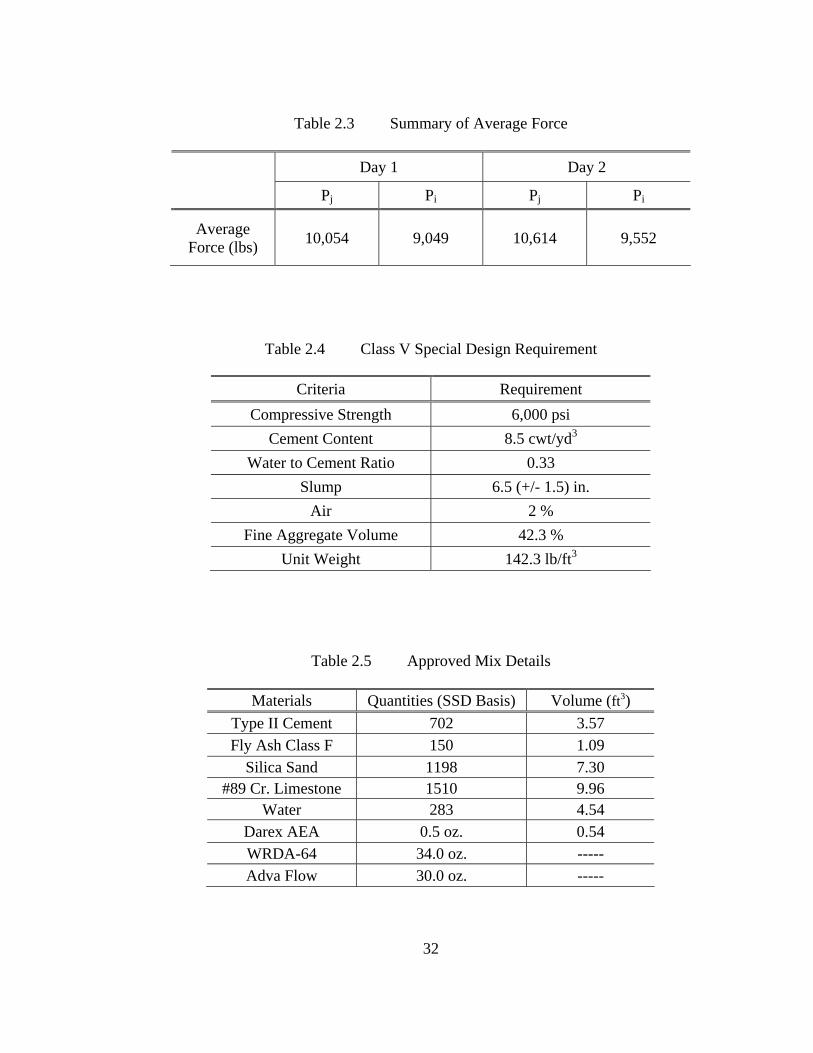
on each strand was monitored using load cells. The target force in each strand was 11.5
kips and the averaged actual forces are summarized in Table 2.3.
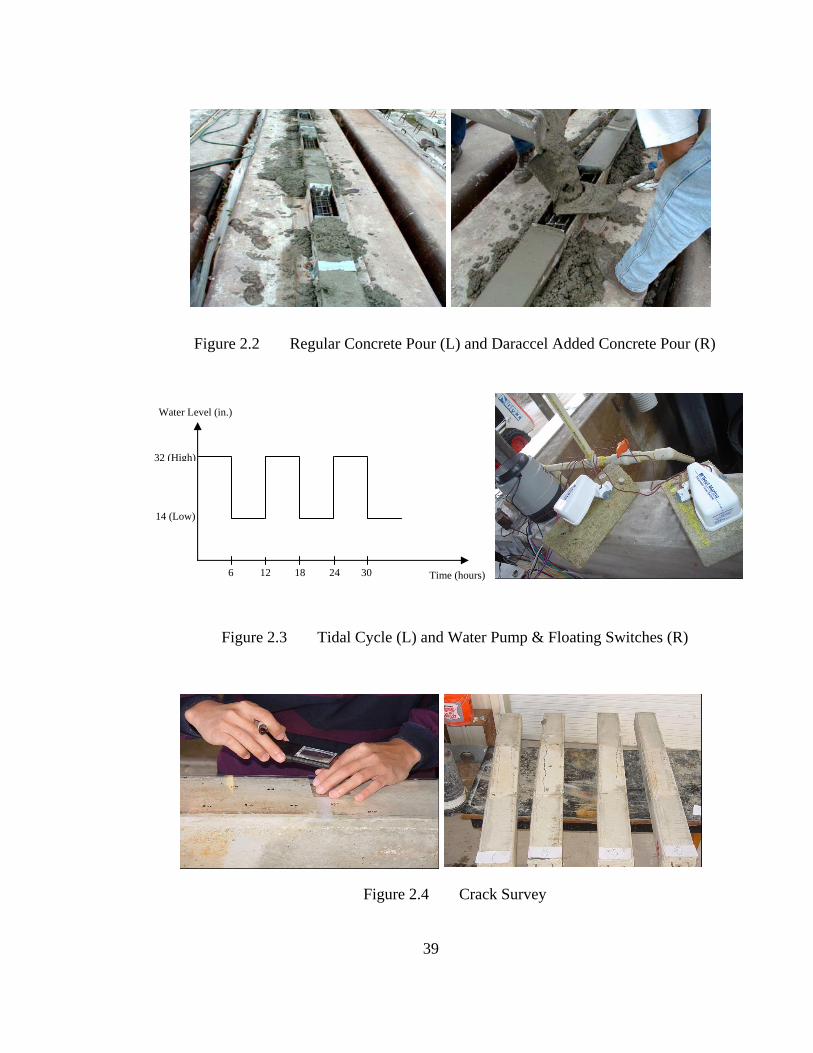
The regular FDOT Class V special mix was first placed followed by a second
batch in which the chloride-contaminated FDOT Class V Special mix was installed in the
22in zone between galvanized barriers. Chloride contaminated concrete was made using
Daraccel chloride admixture (Fig. 2.2).
The prestressing force was released 6 and 11 days after the first and second
concrete pour, respectively. On each occasion, four cylinders – two regular and two
chloride contaminated – were tested to determine the compressive strength. The
compressive strength was 3,700psi for both types of concrete for the first pour.
Compressive strengths were higher for the second because of the greater time and also
warming trends. The average compressive strength for the regular concrete was about
6,050psi and that for the chloride contaminated concrete, 4,975psi.
2.2.2 Concrete
Two types of concrete mix were used for regular and chloride-contaminated
concrete. For the both concretes, the mix design which complied with FDOT Class V
20
Special standards was used. The requirements and approved mix details are summarized
in the Tables 2.4 -5.
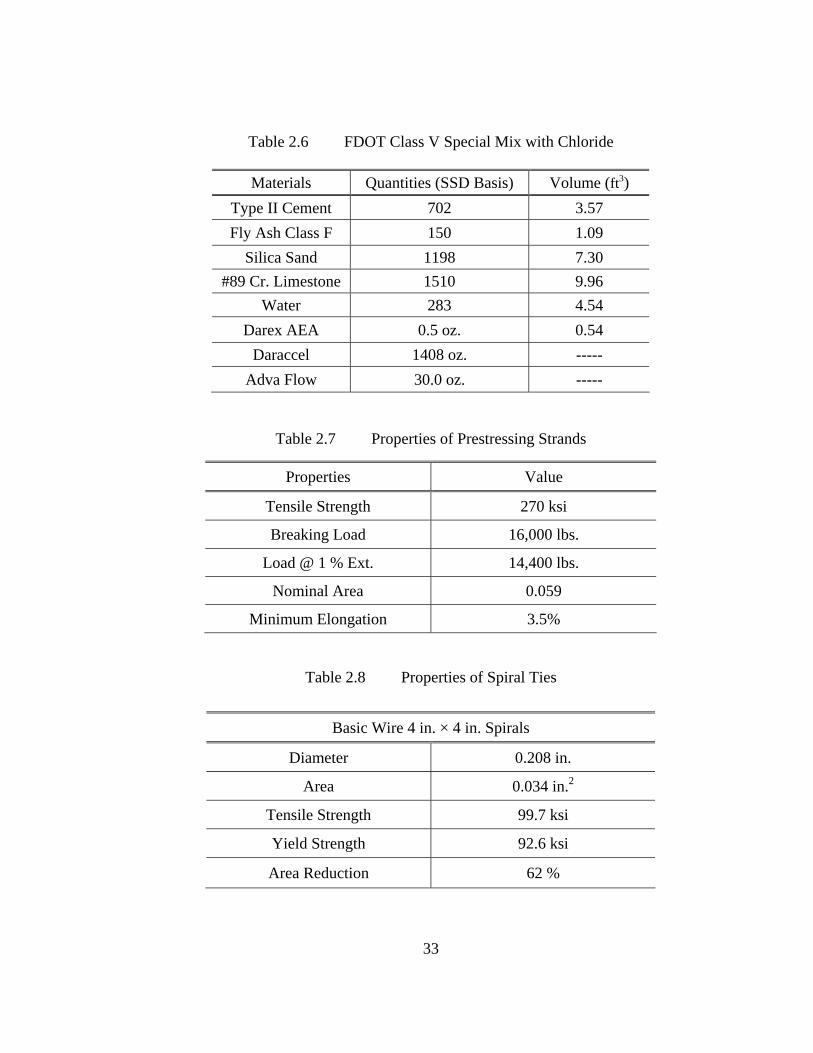
To make chloride contaminated concrete, 1408oz of Daraccel was added to the
regular concrete mix design to be 3% by weight of cementitious material. Each ounce of
Daraccel provides about 0.0182lb of chloride ions. As shown in Table 2.6, the difference
between regular and chloride contaminated concrete mixture was Darraccel and WRDA-
64. Both Daraccel and WRDA-64 were served as water reducing agents, however
Daraccel provides chloride ions help the acceleration of corrosion of steel in concrete.
2.2.3 Steel
For the prestressing, low relaxation, Grade 270 steel strands with 5/16in diameter
were used in this study. The manufacturer’s technical data are shown in Table 2.7. The
spiral reinforcement presented in Table 2.8 was fabricated with #5 gauge steel.
2.2.4 FRP Materials
Two different FRP systems – dry wrap and wet wrap systems – were used for
these studies. The dry wrap FRP system based on the epoxy required totally dry
conditions for its application and cure while the wet wrap FRP system could be applied in
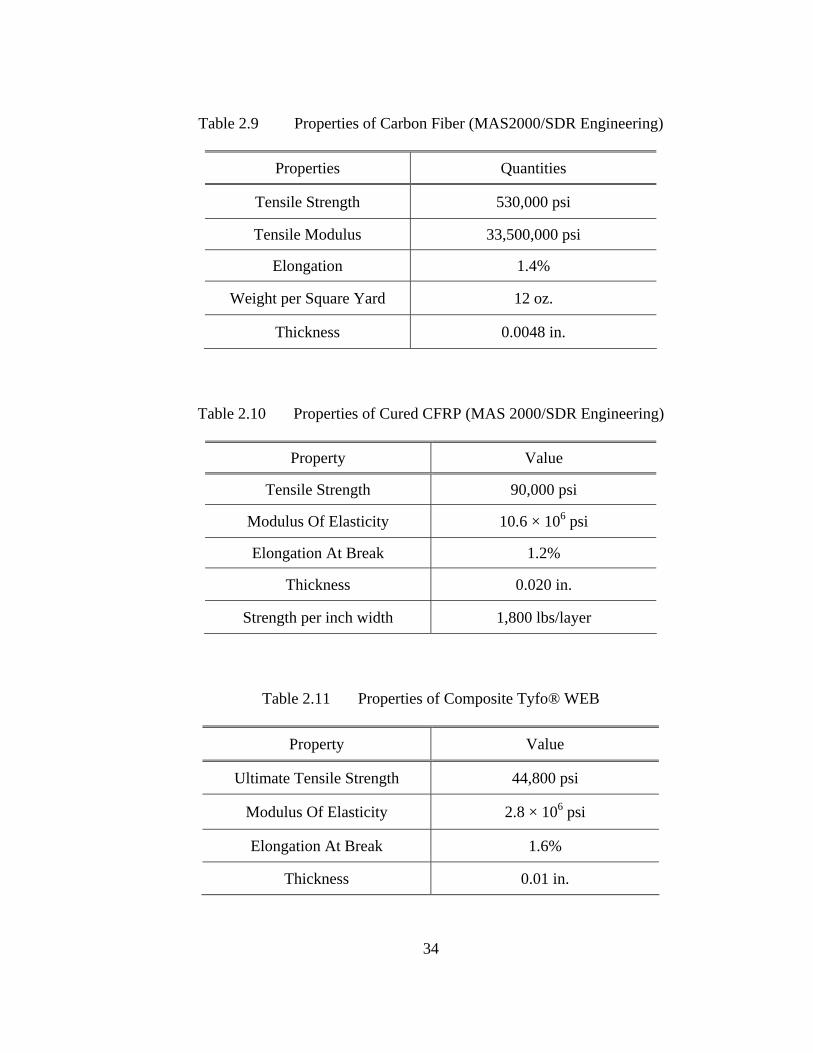
water. The various FRP systems for each study are provided in Table 2.1 and 2.2.
2.2.4.1 Dry Wrap System
For the dry wrap system, two different types of materials - carbon fiber reinforced
polymer (CFRP) provide by SDR Engineering and Tyfo® WEB glass fiber reinforced
polymer manufactured by Fyfo Co. LLC. - were used for wrapping prestressed specimens
in this study. CFRP is a 0°/90° bi-directional weave carbon fabric. The material
properties of the fiber and the cured laminate are listed in Tables 2.9-2.10.
21
The Tyfo® WEB Composite is composed of Tyfo® WEB reinforcing fabric and
Tyfo® S Epoxy. Tyfo® WEB is a 0°/90° bi-directional weave glass fabric and its
material properties provided by the manufacturer, Fyfe Co. LLC, are summarized in
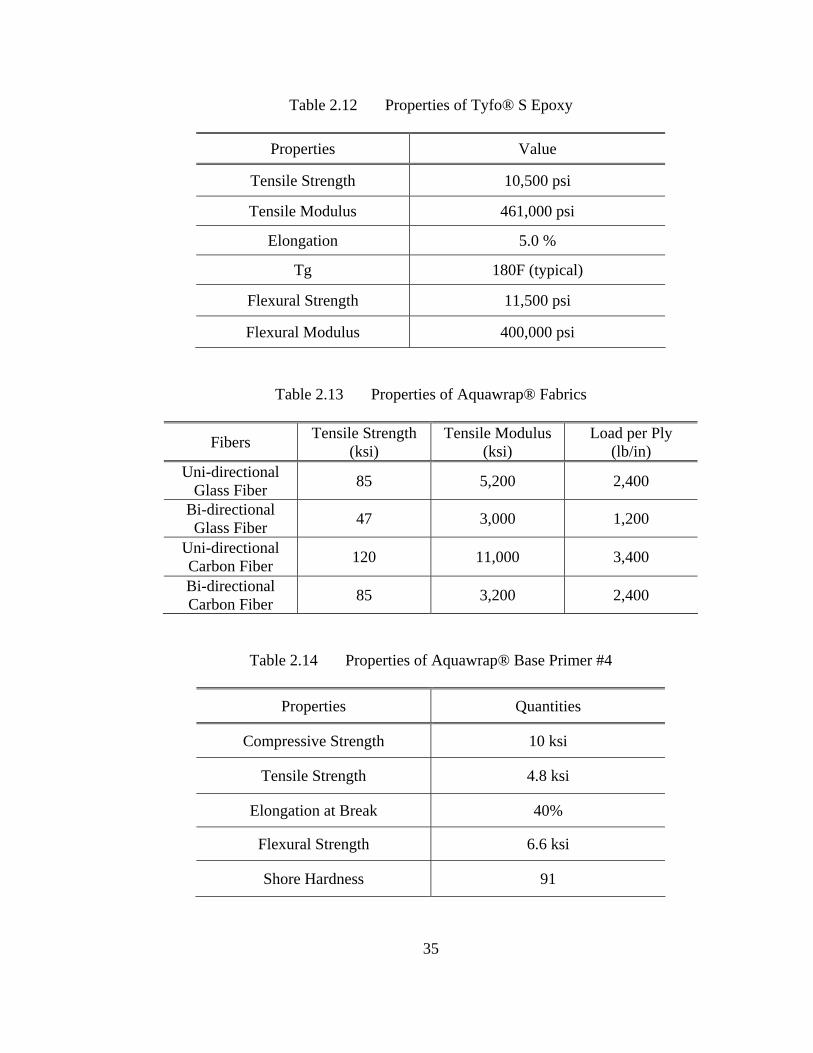
Table 2.11. Details on the Tyfo® S Epoxy are given in Table 2.12.
2.2.4.2 Wet Wrap System
Two different systems – Air Logistics and Fyfe - were used for the wet-wrap. The
Air Logistics system is a pre-preg. All materials in this system were manufactured and
provided by them. Details of the carbon fiber material used in the Air Logistics system
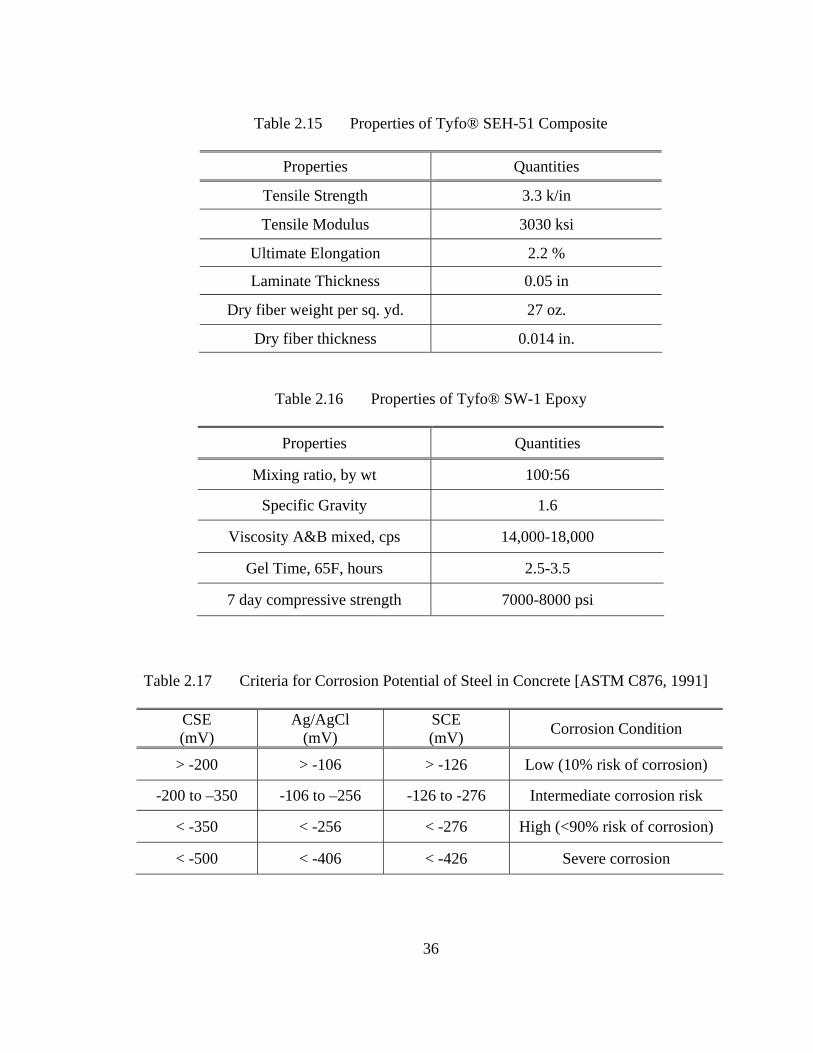
are summarized in Table 2.13-3.14. For the Fyfe wrap, only fiberglass was used. Tyfo®
SEH-51A, a custom weave, uni-directional glass fabric is normally used with Tyfo-S
Epoxy. However, for the underwater application in Gandy Bridge, Tyfo® SW-1
underwater epoxy was used. As this is not a pre-preg, it has to be mixed at the site and
the FRP fabric impregnated just prior to use. Properties of materials as provided by the
manufacturer are summarized in Table 2.15 – 16.
2.3 Corrosion Acceleration
To simulate corrosion of embedded prestressed steel, it was necessary to develop
a system that could accelerate corrosion. In the studies, three different corrosion
acceleration systems were used. These systems are summarized in Table 2.1.
2.3.1 Impressed Current
Many researchers (Pantazopoulou, Baiyasi, Lee, Debaiky, Wotton etc.) have used
applied current in laboratory tests to accelerate corrosion of steel. The applied current
system can be a constant voltage or a constant current system. Applied voltage system is
easy to use because it just needs a DC power supply. However, its current tends fluctuate
22
due to changes in the resistance of the steel and it is hard to predict the mass loss of steel
in specimens using Faraday’s law unless the current for the entire application period is
known. Constant current systems require special circuitry that adjusts the voltage so that
the current is kept constant.
Lee [1998] used a constant voltage system to accelerate corrosion of steel in
specimens. A 6V potential was initially applied and it was increased to 12V after 33
weeks. When the applied voltage was 6V, the corrosion current varied from 100 to
150mA. When the voltage was increased to 12V, the current showed an abrupt increase;
however, it returned to the initial range, 100 to 150mA.
A constant current system was used by Almusallam et al [1996] to accelerate
corrosion of reinforcing steel in concrete slab. A constant current of 2A was applied to
the steel using a direct current rectifier.
In this study, a constant current system was used. The accelerated corrosion
scheme utilized was similar to that used in an earlier research project [Mullins et al.
2001]. In that study, impressed current was applied for 125 days to attain 25% of steel
loss. In the setup, all specimens were exposed to a constant current of 110mA reached
gradually over 6 days to minimize the localized corrosion. The applied current and the
corresponding voltage were manually monitored.
The center strand served as a cathode while the other four strands attached
electrically to the ties served as the anode. This arrangement was used since it permitted
specimens to be corroded even after they had been wrapped. A soaker hose-sponge
system was used to apply continuous moisture to the specimens to reduce the resistivity
of the concrete.
23
2.3.2 Wet/Dry Cycles
Water and oxygen are critically important for the corrosion reactions to be
sustained. Water in the concrete pores increases diffusion of chloride ions by capillary
action. When relative humidity (RH) in concrete is around 90 to 95%, chloride plays
most effectively [Tuutti, 1982]. However, the diffusion of oxygen becomes faster in dry
concrete. With this reason, wet-dry cycle has been used for accelerating the corrosion of
steel in concrete [Broomfield, 1997].
Thompson [1998] checked the corrosion rate and corrosion potential with varying
relative humidity as 43, 75 and 98%. When RH increased from 75 to 98%, there was a
large increase in the corrosion rate, however, little change was found in corrosion
potential.
Lee [1998] tried to determine the effective wet-dry cycle by varying a cycle
frequency and a time ratio of wet to dry duration. The most effective ratio of time cycle
of wet to dry suggested by this researcher was 1 day to 2.5 days.
In this project, selected specimens were placed in a tank and two separate
simulated salt water tidal cycles were applied. The difference of water level between
high and low tide was 18in. The water level was changed every six hours to simulate the
actual tidal change in the seawater and it was controlled by a water pump and floating
switch (Fig. 2.2). This set up was used in studies described in Chapter 4 and Chapter 5.
2.3.3 Hot Temperature
Large diurnal and seasonal temperature changes may create stresses on the
concrete surface that can lead to the formation of micro-cracks in the concrete. Chloride
24
can penetrate into steel in concrete through these micro-cracks and promote corrosion of
steel.
Taheri and Breugel [1998] studied the effect of temperature on the penetration of
chloride in concrete. Large beams (0.4m × 0.75m × 6m) were made, and one of them
was subjected to heating-cooling cycle changing from 20 to 60°C and wet-dry cycles.
Another beam was only subjected to wet-dry cycles. According to their study, the
chloride penetration depth of the beam which was subjected to temperature changes, was
two times more than that of the other beam.
Thompson [1998] examined the correlation between temperature and corrosion
rate using three different temperatures, 4, 21 and 38°C. As the temperature was
increased, the corrosion rate increased; however, the potential became more positive.
For the study presented in Chapter 5, hot temperature was used to accelerate the
corrosion of steel. Selected specimens were placed in an insulated tank whose
temperature was kept between 52 to 60°C. Details are presented in Chapter 5.
2.4 Data Measurement for Corrosion Evaluation
To evaluate and estimate the corrosion condition of embedded prestressed steel,
several data measurement methods were used. During the corrosion acceleration
exposure, electro chemical corrosion measurement methods such as half cell potential
and linear polarization test were used to monitor corrosion. At the end of the test,
selected specimens were mechanically tested for measuring the strength capacity and
actual steel loss.
25
2.4.1 Corrosion Potential
When no external current flows, a potential of metal can be measured with respect
to a reference electrode. The potential reading represents a voltage difference between
metal and reference electrode. That is called the corrosion potential. Copper/copper
sulphate (CSE), silver/silver chloride (Ag/AgCl), and saturated calomel (SCE) are usually
used as reference electrodes for steel in concrete [Bentur, 1997].
The value of corrosion potential can be used for the prediction of corrosion risk of
steel. It is usually believed that the more negative potentials represent the more corrosion
of steel. However, when there is little oxygen (saturated conditions), the corrosion
potential shows very negative value without corrosion of steel [Broomfield, 1997].
Criteria for corrosion of steel in concrete are represented in Table 2.17.
In the studies, corrosion potential measurements were performed with a
copper/copper sulfate reference electrode. They were used for the “Study of FRP Repair
before Corrosion” presented in Chapter 4 and for initial corrosion measurement in the
two field studies (Chapter 6 and 7).
2.4.2 Linear Polarization Test
The polarization test is used to measure the corrosion rate of steel in concrete. In
a corrosion environment of steel in concrete, anodic and cathodic currents are balanced at
the corrosion potential. When current is applied from external source, the potential is
changed and this change is called polarization. The change of potential is positively
associated with the applied current. The slope at the corrosion potential of the potential-
current density curve is called the polarization resistance and it is inversely proportional
to the corrosion rate. Polarization resistance Rp (Ω⋅cm2 ) is given by:
26
Rp = ∇E / ∇i | i=0 (Eq. 2.1)
where ∇E is a change in potential and ∇i is a applied current.
ASTM G59-91 shows the method for measuring the polarization resistance.
Concrete has a high resistance against current flowing, so the resistance value of concrete
itself should be considered for exact calculation of polarization resistance. Usually, Rp is
corrected by subtracting the concrete resistance from original Rp.
The corrosion rate Icorr (µA/cm2) is represented by the relation between
polarization resistance and constant B varying 26 to 52mV depending on the condition of
steel:
Icorr = B / Rp (Eq. 2.2)
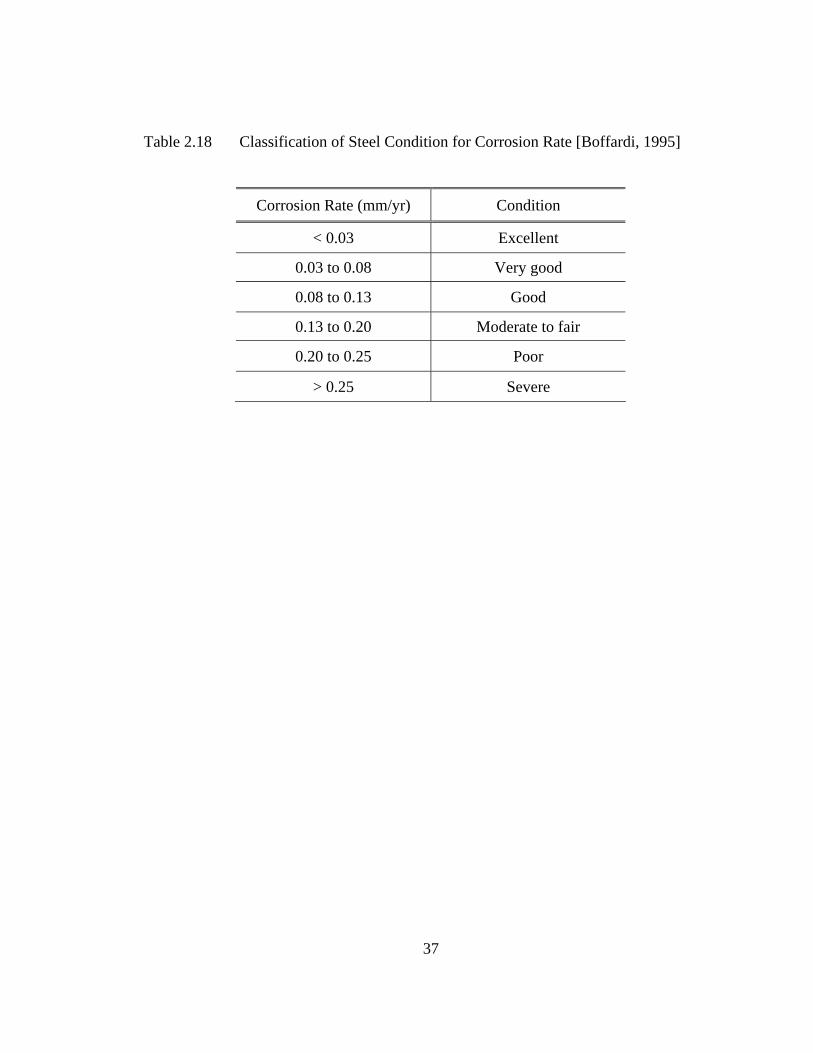
Icorr can be converted to section loss of steel per year. Corrosion current 1µA/cm2 is equal
to 11.6µm/year section loss of steel [Broomfield, 1997]. Condition of steel depending on
corrosion rate is classified in Table 2.18.
In the studies, a PR monitor manufactured by Cortest Instrument System was used
for performing on-site linear polarization tests.
2.4.3 Crack Survey
The volume increase of corrosion products generates expansive stresses in the
surrounding concrete and creates cracks in the concrete cover. These cracks are closely
related with the corrosion rate of steel. Cracks in cover concrete accelerate corrosion by
providing direct routes for oxygen, carbon dioxide and chloride ions to steel in concrete.
It is believed that corrosion of steel positively correlates to crack width in concrete.
Martin [1969] found that the correlation between crack width and corrosion rate
continued for just a limited time. However, it is not easy to find the exact correlation
27
between crack width and corrosion rate since the crack width is influenced by properties
of corrosion products and the depth of concrete cover
In these studies, the location of cracks in every specimen was mapped by tracing
them onto a plastic sheet. This was then plotted on a 2in x 2in grid (Fig. 2.3).
2.4.4 Gravimetric Test
Despite its weakness of overestimating actual loss [Lee, 1998], Faraday’s Law
has been used for estimating mass loss of steel. The current flow between anode and
cathode is converted to mass loss of steel:
m = Fn
tiA⋅⋅⋅ (eq. 2.3)
where m is a mass loss of steel, A is an atomic weight (55.85g/mol for steel), i is a
current (Amperes), t is a time (seconds) applied current, n is valence (2 for steel), and F
is a Faraday’ constant (96487coulombs).
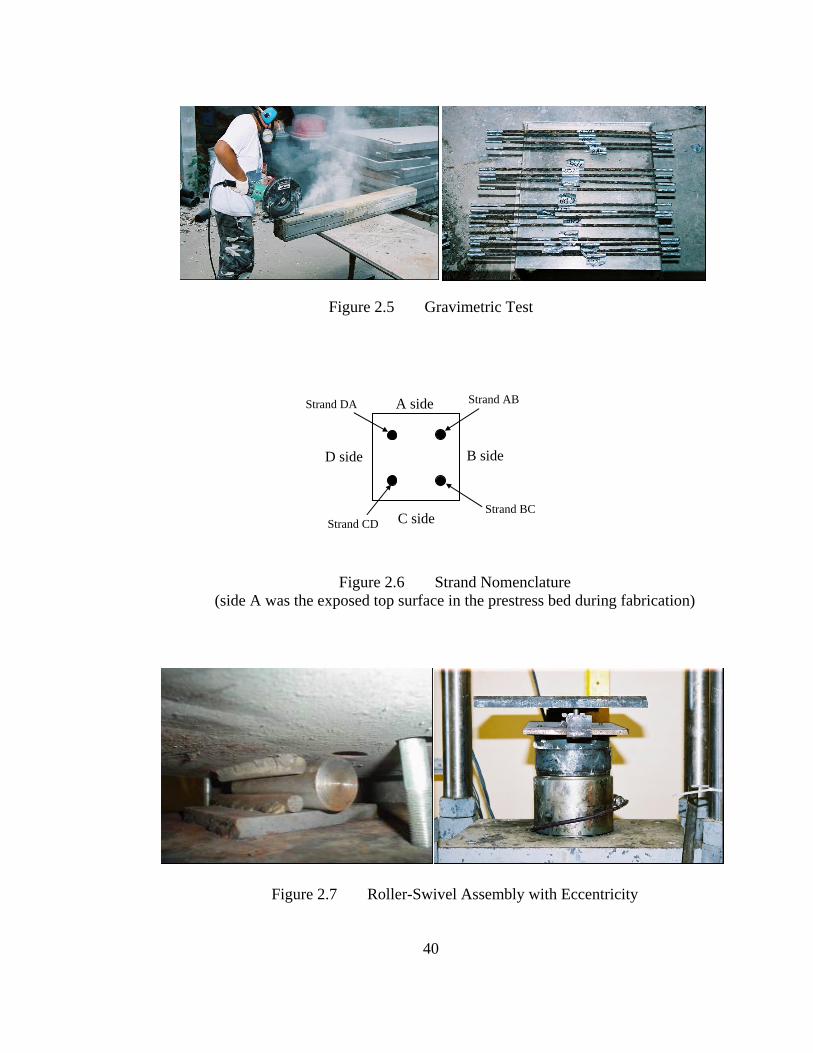
A gravimetric test is used to measure the exact mass loss of steel. The corroded
steel is retrieved from concrete, cleaned and its weight compared with that of its original
weight (Fig. 2.4). The cleaning has to be carried out in accordance with ASTM G1-90.
However, this was found to be unsuitable for cleaning prestressing strands because
corrosion products remained between the seven wires that make up a strand. To remove
the corrosion product completely, the seven wires of each strand were separated for
cleaning and reassembled again. The gravimetric test method was used in all three
laboratory studies. For convenience, four strands were identified AB, BC, CD and DA as
shown in Fig. 2.5.
28
2.4.5 Eccentric Load Test
To measure strength capacity of corrosion-damaged specimens, selected
specimens were tested under an eccentrically applied load. This method was used for the
“Underwater Wrapping Study” provided in Chapter 3 and the “Study of FRP Repair after
Corrosion” in Chapter 5.
Test Set Up
The eccentric load test was conducted using two roller-swivel assemblies, one for
each end of the column. The steel swivel was composed of two 8in diameter
hemispherical members designed to rotate in any direction [ Fisher et al. 2000]. A roller
with a 1.5in diameter and 6in length was placed between two steel plate and four
cylindrical guide rods were welded on plates to ensure that the roller could only rotate in
one direction. The roller was bolted to the swivel and a 16in x 16in square steel plate
bolted to the roller-swivel assembly to provide a flat contact surface with the specimen.
The roller was placed exactly 1.2in from the centerline of specimen to provide an
eccentricity ratio, e/h of 0.2 for the 6in square specimens (Fig. 2.7).
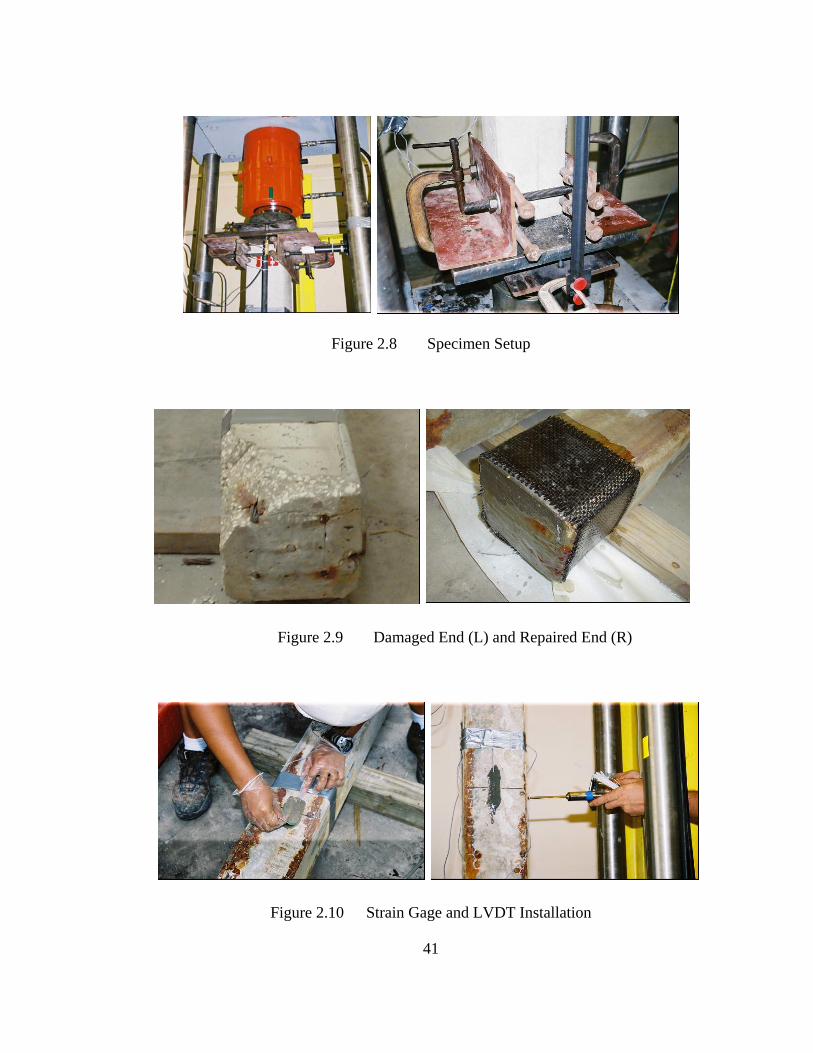
One roller-swivel assembly was placed on the load cell at the bottom and the
other was attached to the piston ram of a hydraulic cylinder with a 300ton capacity at the
top (Fig. 2.8). The ends of specimen were positioned on a flat steel plate so that the
applied load was uniformly distributed. To prevent premature end failure, 6in steel plates
were attached to both ends of the specimens and fixed with bolts. The exact position of
the column in the test frame was adjusted by monitoring the strain readings under the
nominal loading.
29
Specimen Preparation
The concrete surface in contact with the steel plate at the ends had to be smooth
so that uniform load was applied. Therefore, strands protruding from the concrete at the
ends had to be cut off and the surface ground to a smooth finish. Initially, the strands
protruding at the bottom end were cut and epoxy coated to prevent corrosion. The strands
protruding at the top end however could not be cut since they were required to allow
electrical connection to the impressed current accelerated corrosion scheme. As a result,
cracks and concrete spalling developed during the time the specimen was being corroded
outdoors. To prevent premature end failure, the spalled concrete was patched using Sika
611 and an epoxy based CFRP system wrapped over a 6in depth at the end. After curing,
the concrete surface at both ends were ground to provide a flat surface for testing (Fig.
2.9).
Instrumentation
To monitor strain changes on the concrete surface, PL-60-11-1L strain gages were
attached to the concrete surface. A total of 12 strain gages were mounted at three levels –
12in from each end and at the middle - on all four faces of specimen. Before strain gages
were attached, concrete surfaces were ground smooth and cleaned using acetone. Axial
deflections were measured using two LVDTs having a 0.2in stroke. Lateral deflections
were measured using four LVDTs with a 4in stroke. These were placed 18in apart (Fig.
2.10).
Test Procedures
A MEGADAC 3100 data acquisition system was used for monitoring and
recording data from all the strain gages, LVDTs, and loads. A 300ton load cell

30
manufactured by GEOKON was used to measure the load. The load was applied by a
hydraulic jack connected to an electrically operated pump. The hydraulic jack was
manufactured by Force Resources, Inc. and had a 300ton and 13in stroke capacity.
After checking all the connections to the MEGADAC system, data was initialized
to zero. The position of the column inside the test frame was adjusted by monitoring
measured strains and calculated. When the specimen was positioned correctly, the load
was monotonically increased.
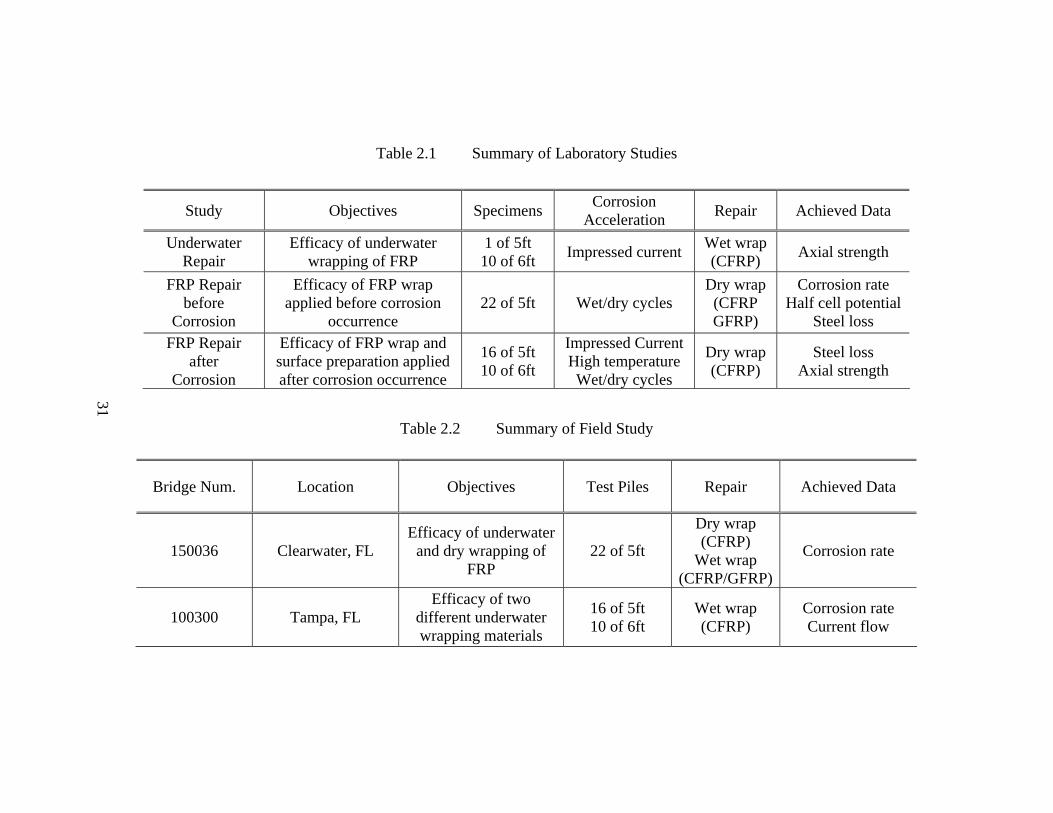
Table 2.1 Summary of Laboratory Studies
Table 2.2 Summary of Field Study
Study Objectives Specimens Corrosion Acceleration Repair Achieved Data
Underwater Repair
Efficacy of underwater wrapping of FRP
1 of 5ft 10 of 6ft Impressed current Wet wrap
(CFRP) Axial strength
FRP Repair before
Corrosion
Efficacy of FRP wrap applied before corrosion
occurrence 22 of 5ft Wet/dry cycles
Dry wrap (CFRP GFRP)
Corrosion rate Half cell potential
Steel loss FRP Repair
after Corrosion
Efficacy of FRP wrap and surface preparation applied after corrosion occurrence
16 of 5ft 10 of 6ft
Impressed Current High temperature Wet/dry cycles
Dry wrap (CFRP)
Steel loss Axial strength
Bridge Num. Location Objectives Test Piles Repair Achieved Data
150036 Clearwater, FL Efficacy of underwater
and dry wrapping of FRP
22 of 5ft
Dry wrap (CFRP)
Wet wrap (CFRP/GFRP)
Corrosion rate
100300 Tampa, FL Efficacy of two
different underwater wrapping materials
16 of 5ft 10 of 6ft
Wet wrap (CFRP)
Corrosion rate Current flow
31
32
Table 2.3 Summary of Average Force
Day 1 Day 2
Pj Pi Pj Pi
Average Force (lbs) 10,054 9,049 10,614 9,552
Table 2.4 Class V Special Design Requirement
Table 2.5 Approved Mix Details
Materials Quantities (SSD Basis) Volume (ft3) Type II Cement 702 3.57 Fly Ash Class F 150 1.09
Silica Sand 1198 7.30 #89 Cr. Limestone 1510 9.96
Water 283 4.54 Darex AEA 0.5 oz. 0.54 WRDA-64 34.0 oz. ----- Adva Flow 30.0 oz. -----
Criteria Requirement Compressive Strength 6,000 psi
Cement Content 8.5 cwt/yd3 Water to Cement Ratio 0.33
Slump 6.5 (+/- 1.5) in. Air 2 %
Fine Aggregate Volume 42.3 % Unit Weight 142.3 lb/ft3
33
Table 2.6 FDOT Class V Special Mix with Chloride
Materials Quantities (SSD Basis) Volume (ft3) Type II Cement 702 3.57 Fly Ash Class F 150 1.09
Silica Sand 1198 7.30 #89 Cr. Limestone 1510 9.96
Water 283 4.54 Darex AEA 0.5 oz. 0.54
Daraccel 1408 oz. ----- Adva Flow 30.0 oz. -----
Table 2.7 Properties of Prestressing Strands
Table 2.8 Properties of Spiral Ties
Properties Value
Tensile Strength 270 ksi
Breaking Load 16,000 lbs.
Load @ 1 % Ext. 14,400 lbs.
Nominal Area 0.059
Minimum Elongation 3.5%
Basic Wire 4 in. × 4 in. Spirals
Diameter 0.208 in.
Area 0.034 in.2
Tensile Strength 99.7 ksi
Yield Strength 92.6 ksi
Area Reduction 62 %
34
Table 2.9 Properties of Carbon Fiber (MAS2000/SDR Engineering)
Properties Quantities
Tensile Strength 530,000 psi
Tensile Modulus 33,500,000 psi
Elongation 1.4%
Weight per Square Yard 12 oz.
Thickness 0.0048 in.
Table 2.10 Properties of Cured CFRP (MAS 2000/SDR Engineering)
Property Value
Tensile Strength 90,000 psi
Modulus Of Elasticity 10.6 × 10⁶ psi
Elongation At Break 1.2%
Thickness 0.020 in.
Strength per inch width 1,800 lbs/layer
Table 2.11 Properties of Composite Tyfo® WEB
Property Value
Ultimate Tensile Strength 44,800 psi
Modulus Of Elasticity 2.8 × 10⁶ psi
Elongation At Break 1.6%
Thickness 0.01 in.
35
Table 2.12 Properties of Tyfo® S Epoxy
Properties Value
Tensile Strength 10,500 psi
Tensile Modulus 461,000 psi
Elongation 5.0 %
Tg 180F (typical)
Flexural Strength 11,500 psi
Flexural Modulus 400,000 psi
Table 2.13 Properties of Aquawrap® Fabrics
Fibers Tensile Strength (ksi)
Tensile Modulus (ksi)
Load per Ply (lb/in)
Uni-directional Glass Fiber 85 5,200 2,400
Bi-directional Glass Fiber 47 3,000 1,200
Uni-directional Carbon Fiber 120 11,000 3,400
Bi-directional Carbon Fiber 85 3,200 2,400
Table 2.14 Properties of Aquawrap® Base Primer #4
Properties Quantities
Compressive Strength 10 ksi
Tensile Strength 4.8 ksi
Elongation at Break 40%
Flexural Strength 6.6 ksi
Shore Hardness 91
36
Table 2.15 Properties of Tyfo® SEH-51 Composite
Properties Quantities
Tensile Strength 3.3 k/in
Tensile Modulus 3030 ksi
Ultimate Elongation 2.2 %
Laminate Thickness 0.05 in
Dry fiber weight per sq. yd. 27 oz.
Dry fiber thickness 0.014 in.
Table 2.16 Properties of Tyfo® SW-1 Epoxy
Properties Quantities
Mixing ratio, by wt 100:56
Specific Gravity 1.6
Viscosity A&B mixed, cps 14,000-18,000
Gel Time, 65F, hours 2.5-3.5
7 day compressive strength 7000-8000 psi
Table 2.17 Criteria for Corrosion Potential of Steel in Concrete [ASTM C876, 1991]
CSE (mV)
Ag/AgCl (mV)
SCE (mV) Corrosion Condition
> -200 > -106 > -126 Low (10% risk of corrosion)
-200 to –350 -106 to –256 -126 to -276 Intermediate corrosion risk
< -350 < -256 < -276 High (<90% risk of corrosion)
< -500 < -406 < -426 Severe corrosion
37
Table 2.18 Classification of Steel Condition for Corrosion Rate [Boffardi, 1995]
Corrosion Rate (mm/yr) Condition
< 0.03 Excellent
0.03 to 0.08 Very good
0.08 to 0.13 Good
0.13 to 0.20 Moderate to fair
0.20 to 0.25 Poor
> 0.25 Severe
38
Figure 2.1 Specimen Geometry
#5 spiral
5/16 in. Grade 270 low relaxation d
6 in.
1 in.
3.27 in.
5 ft or 6 ft 22 in. 4.5in.
39
Figure 2.2 Regular Concrete Pour (L) and Daraccel Added Concrete Pour (R)
Figure 2.3 Tidal Cycle (L) and Water Pump & Floating Switches (R)
Figure 2.4 Crack Survey
Time (hours)
Water Level (in.)
6 12 18 24 30
32 (High)
14 (Low)
40
Figure 2.5 Gravimetric Test
Figure 2.6 Strand Nomenclature (side A was the exposed top surface in the prestress bed during fabrication)
Figure 2.7 Roller-Swivel Assembly with Eccentricity
A side
C side
B sideD side
Strand CD
Strand DA
Strand BC
Strand AB
41
Figure 2.8 Specimen Setup
Figure 2.9 Damaged End (L) and Repaired End (R)
Figure 2.10 Strain Gage and LVDT Installation
42
CHAPTER 3
UNDERWATER FRP REPAIR STUDY
3.1 Overview
Since FRP strengthening is a bond-critical application, the goal of this
experimental study was to evaluate the effectiveness of the underwater FRP-concrete
bond through ultimate load column tests. Additionally, gravimetric tests were undertaken
to verify the extent of metal loss due to accelerated corrosion. A total of 11 specimens
were utilized in this study (Table 3.1). Ten of these were 6ft long column specimens that
were used in ultimate load tests. An additional 5ft specimen was used for gravimetric
testing. Of the ten column specimens, four were wrapped and six were unwrapped
controls. Targeted steel loss levels were 25% and 50%.
Two series of tests were carried out. In the first series, specimens were corroded
to a targeted metal loss level of 25%, wrapped and tested. In this series, a total of six
specimens were tested – four controls and two wrapped specimens. The four unwrapped
controls corresponded to 0% metal loss (#18, #19) and 25% metal loss (#20, #21). These
specimens provided baseline data that could be used to assess the performance of the two
wrapped specimens (#24, #25) that had previously been corroded to the same 25%
targeted metal loss. Results from these tests provide an immediate measure of the
enhanced performance due to FRP wrapping. Additionally, an identically corroded 5ft
specimen (#11) was tested gravimetrically to establish the actual metal loss.
43
In the second series, four column specimens were tested. Two of these were
wrapped (#26, #27) and two were unwrapped controls (#22, 23). The wrapped specimens
were first corroded for 125 days, repaired with FRP and then subjected to further
accelerated corrosion to attain a targeted metal loss levels of 50%. The unwrapped
controls were subjected to the same regime. At the end of the exposure period, all
specimens were tested eccentrically to determine residual capacities. At these high levels
of corrosion, it is not possible to retrieve corroded steel and therefore no attempt was
made to conduct gravimetric testing.
3.2 Test Program
3.2.1 Pre-Wrap Corrosion Acceleration
As described in Chapter 2, all specimens were exposed to a constant current of
110mA reached gradually over 6 days to minimize the localized corrosion (Fig. 3.1). The
applied current and corresponding voltage was monitored manually.
The center strand served as a cathode while the other four strands attached
electrically to the ties served as the anode. This arrangement was used since it permitted
specimens to be corroded even after they had been wrapped. A soaker hose-sponge
system was used to apply continuous moisture to the specimens to reduce the resistivity
of the concrete.
Impressed current was applied for 125 days to attain a 25% of steel loss which
had been consistently reached in a previous study [Mullins, 2001] There was a steep
increase in voltage over the first six days as the impressed current gradually increased to
110mA. After that, increased internal concrete resistance due to corrosion products and
cracking led to an increase in the voltage since the current remained constant (Fig. 3.2).
44
3.2.2 Underwater Wrapping
After 125 days of exposure, gravimetric testing was conducted on one specimen
(#11) to verify actual steel loss. Another five specimens were wrapped in salt water
using Aquawrap Repair System developed by Air Logistics. All five specimens were
wrapped over a 3ft length in the middle using 2 layers of a bi-directional carbon fiber.
Four of these wrapped specimens were later tested to failure under eccentric loading. The
fifth was used to evaluate the FRP-concrete substrate bond using pull out tests. The
properties of the materials used for the underwater wrapping were given in Chapter 2.
To simulate underwater FRP wrapping of corrosion-damaged piles in salt water, a
6ft x 10ft x 3.5ft fiberglass tank was built. It was filled with 3.5% salt water to a depth of
3ft. The surfaces of the five specimens to be wrapped were prepared and sharp edges
rounded to a radius of 0.5in using a hand grinder. All five specimens were placed upright
inside the tank as shown in Fig. 3.3 to simulate actual wrapping conditions.
The procedure for wrapping the specimens under water was as follows.
1. Mix the base primer composed of a red colored part A and a clear
brown colored part B completely.
2. Apply the primer to the prepared pile surface.
3. Wrap the 4in wide bi-directional carbon fiber spirally over the primer-
coated area in two continuous layers without overlap.
4. Place one layer of the 6in wide glass fiber veil over the carbon fiber
with a 2in overlap to consolidate the wrap and provide the better finish.
5. Place the blue colored plastic stretch film over the veil and puncture its
surface with a sharp tool to allow gases to escape.
45
6. Remove the stretch film after curing completely (1 day).
7. Apply the mixed base primer over the veil for the protection of the
wrap against ultra violet radiation.
3.2.3 Corrosion Acceleration After Wrapping
Two wrapped (#26, #27) and two unwrapped (#22, #23) specimens were
subjected to acceleration corrosion following completion of the wrapping operation to
monitor the post-wrap corrosion behavior. As before, 110mA of impressed current was
applied to all four specimens for another 125 days and sponge-water soaker system used
to lower concrete resistivity. The applied current and voltage was manually monitored
throughout the study everyday. Fig. 3.4 shows the variation of voltage with time for
another 125 days – the targeted time for attaining 50% metal loss. There was a steep
increase in voltage for the first six days as the impressed current gradually increased to
110mA. Compared to the pre-wrap corrosion acceleration, however, the value of voltage
was much higher but its rate of increase was gentler.
3.3 Test Results
3.3.1 Crack Survey Result
Crack surveys were performed on all nine specimens at 25% targeted steel loss.
The location of cracks was mapped by tracing them onto a plastic sheet. This was then
plotted on a 2in x 2in grid. Table 3.2 shows a summary of the crack survey results of all
specimens after 125 days corrosion acceleration exposure. Cracks in 5ft specimen (#11)
were greater than those for the 6ft specimens in terms of their numbers, maximum length,
and maximum width. Although they were under the same corrosion acceleration scheme
and had the same 22in of chloride contaminated area, the specimen size seemed to affect
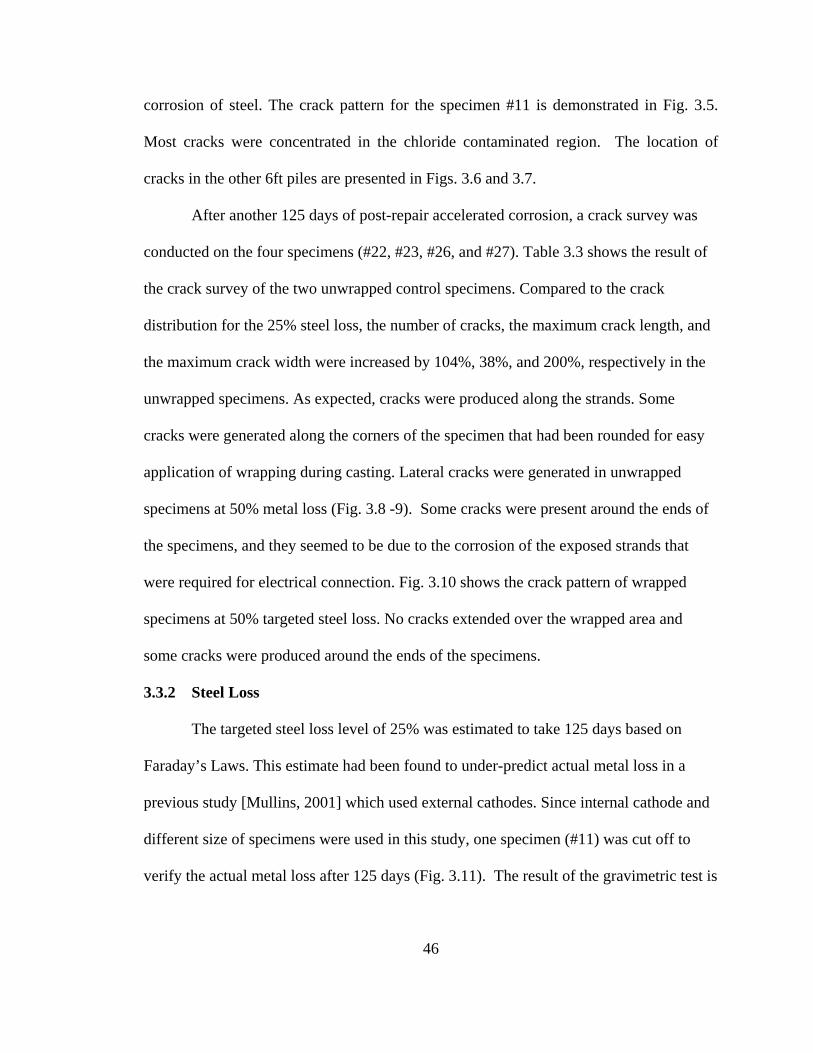
46
corrosion of steel. The crack pattern for the specimen #11 is demonstrated in Fig. 3.5.
Most cracks were concentrated in the chloride contaminated region. The location of
cracks in the other 6ft piles are presented in Figs. 3.6 and 3.7.
After another 125 days of post-repair accelerated corrosion, a crack survey was
conducted on the four specimens (#22, #23, #26, and #27). Table 3.3 shows the result of
the crack survey of the two unwrapped control specimens. Compared to the crack
distribution for the 25% steel loss, the number of cracks, the maximum crack length, and
the maximum crack width were increased by 104%, 38%, and 200%, respectively in the
unwrapped specimens. As expected, cracks were produced along the strands. Some
cracks were generated along the corners of the specimen that had been rounded for easy
application of wrapping during casting. Lateral cracks were generated in unwrapped
specimens at 50% metal loss (Fig. 3.8 -9). Some cracks were present around the ends of
the specimens, and they seemed to be due to the corrosion of the exposed strands that
were required for electrical connection. Fig. 3.10 shows the crack pattern of wrapped
specimens at 50% targeted steel loss. No cracks extended over the wrapped area and
some cracks were produced around the ends of the specimens.
3.3.2 Steel Loss
The targeted steel loss level of 25% was estimated to take 125 days based on
Faraday’s Laws. This estimate had been found to under-predict actual metal loss in a
previous study [Mullins, 2001] which used external cathodes. Since internal cathode and
different size of specimens were used in this study, one specimen (#11) was cut off to
verify the actual metal loss after 125 days (Fig. 3.11). The result of the gravimetric test is
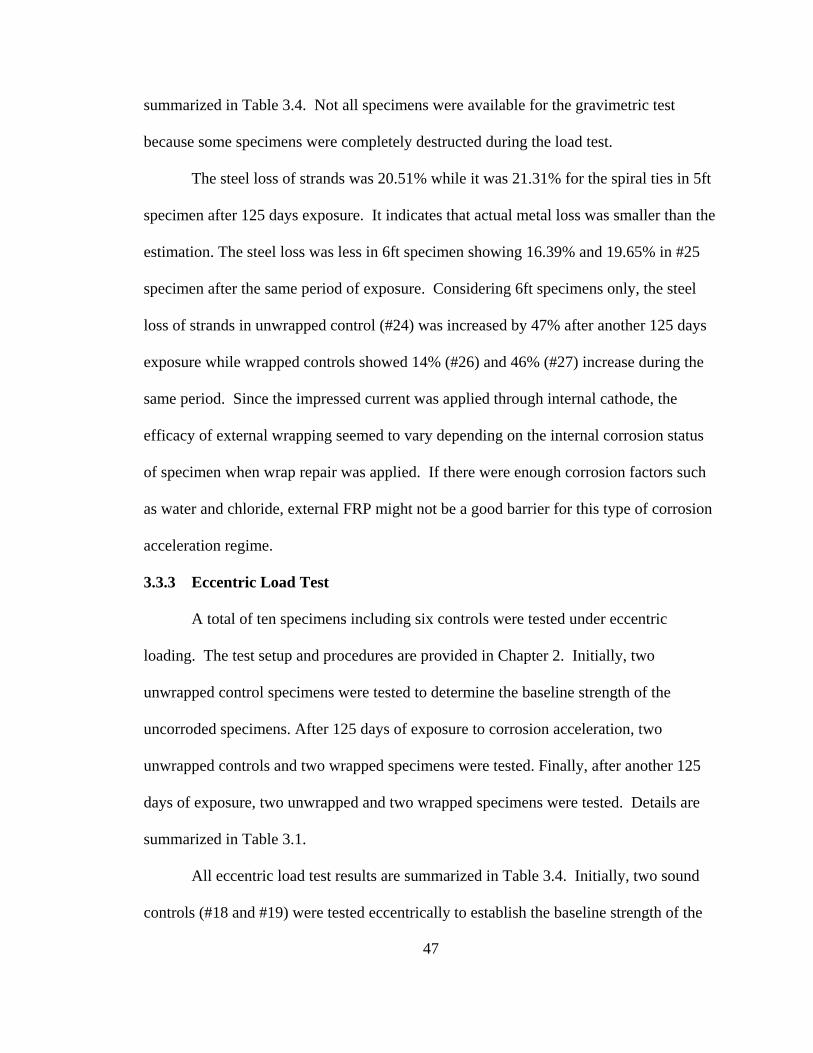
47
summarized in Table 3.4. Not all specimens were available for the gravimetric test
because some specimens were completely destructed during the load test.
The steel loss of strands was 20.51% while it was 21.31% for the spiral ties in 5ft
specimen after 125 days exposure. It indicates that actual metal loss was smaller than the
estimation. The steel loss was less in 6ft specimen showing 16.39% and 19.65% in #25
specimen after the same period of exposure. Considering 6ft specimens only, the steel
loss of strands in unwrapped control (#24) was increased by 47% after another 125 days
exposure while wrapped controls showed 14% (#26) and 46% (#27) increase during the
same period. Since the impressed current was applied through internal cathode, the
efficacy of external wrapping seemed to vary depending on the internal corrosion status
of specimen when wrap repair was applied. If there were enough corrosion factors such
as water and chloride, external FRP might not be a good barrier for this type of corrosion
acceleration regime.
3.3.3 Eccentric Load Test
A total of ten specimens including six controls were tested under eccentric
loading. The test setup and procedures are provided in Chapter 2. Initially, two
unwrapped control specimens were tested to determine the baseline strength of the
uncorroded specimens. After 125 days of exposure to corrosion acceleration, two
unwrapped controls and two wrapped specimens were tested. Finally, after another 125
days of exposure, two unwrapped and two wrapped specimens were tested. Details are
summarized in Table 3.1.
All eccentric load test results are summarized in Table 3.4. Initially, two sound
controls (#18 and #19) were tested eccentrically to establish the baseline strength of the
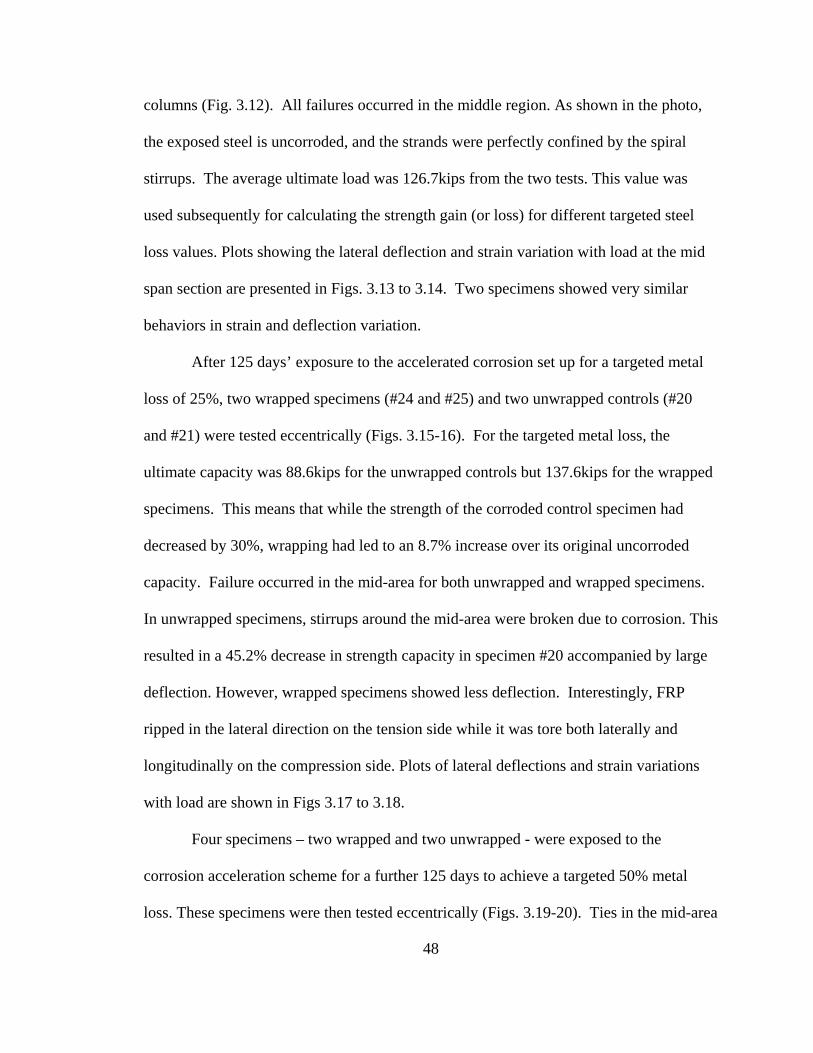
48
columns (Fig. 3.12). All failures occurred in the middle region. As shown in the photo,
the exposed steel is uncorroded, and the strands were perfectly confined by the spiral
stirrups. The average ultimate load was 126.7kips from the two tests. This value was
used subsequently for calculating the strength gain (or loss) for different targeted steel
loss values. Plots showing the lateral deflection and strain variation with load at the mid
span section are presented in Figs. 3.13 to 3.14. Two specimens showed very similar
behaviors in strain and deflection variation.
After 125 days’ exposure to the accelerated corrosion set up for a targeted metal
loss of 25%, two wrapped specimens (#24 and #25) and two unwrapped controls (#20
and #21) were tested eccentrically (Figs. 3.15-16). For the targeted metal loss, the
ultimate capacity was 88.6kips for the unwrapped controls but 137.6kips for the wrapped
specimens. This means that while the strength of the corroded control specimen had
decreased by 30%, wrapping had led to an 8.7% increase over its original uncorroded
capacity. Failure occurred in the mid-area for both unwrapped and wrapped specimens.
In unwrapped specimens, stirrups around the mid-area were broken due to corrosion. This
resulted in a 45.2% decrease in strength capacity in specimen #20 accompanied by large
deflection. However, wrapped specimens showed less deflection. Interestingly, FRP
ripped in the lateral direction on the tension side while it was tore both laterally and
longitudinally on the compression side. Plots of lateral deflections and strain variations
with load are shown in Figs 3.17 to 3.18.
Four specimens – two wrapped and two unwrapped - were exposed to the
corrosion acceleration scheme for a further 125 days to achieve a targeted 50% metal
loss. These specimens were then tested eccentrically (Figs. 3.19-20). Ties in the mid-area
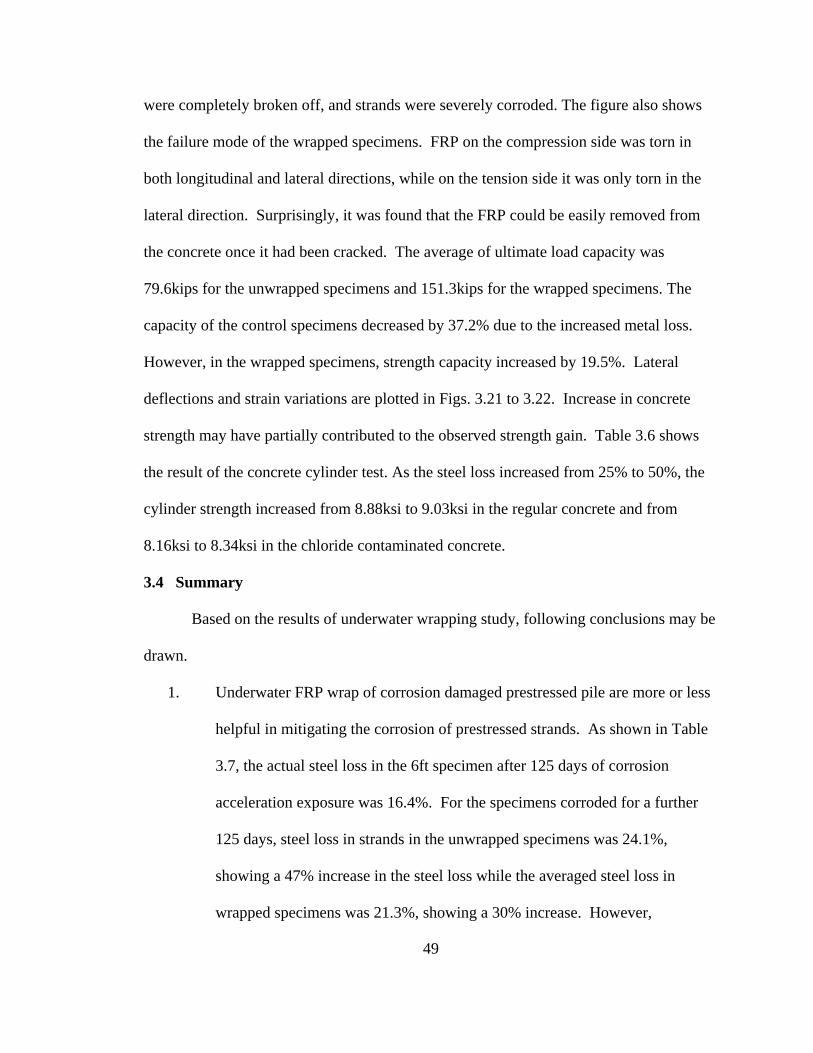
49
were completely broken off, and strands were severely corroded. The figure also shows
the failure mode of the wrapped specimens. FRP on the compression side was torn in
both longitudinal and lateral directions, while on the tension side it was only torn in the
lateral direction. Surprisingly, it was found that the FRP could be easily removed from
the concrete once it had been cracked. The average of ultimate load capacity was
79.6kips for the unwrapped specimens and 151.3kips for the wrapped specimens. The
capacity of the control specimens decreased by 37.2% due to the increased metal loss.
However, in the wrapped specimens, strength capacity increased by 19.5%. Lateral
deflections and strain variations are plotted in Figs. 3.21 to 3.22. Increase in concrete
strength may have partially contributed to the observed strength gain. Table 3.6 shows
the result of the concrete cylinder test. As the steel loss increased from 25% to 50%, the
cylinder strength increased from 8.88ksi to 9.03ksi in the regular concrete and from
8.16ksi to 8.34ksi in the chloride contaminated concrete.
3.4 Summary
Based on the results of underwater wrapping study, following conclusions may be
drawn.
1. Underwater FRP wrap of corrosion damaged prestressed pile are more or less
helpful in mitigating the corrosion of prestressed strands. As shown in Table
3.7, the actual steel loss in the 6ft specimen after 125 days of corrosion
acceleration exposure was 16.4%. For the specimens corroded for a further
125 days, steel loss in strands in the unwrapped specimens was 24.1%,
showing a 47% increase in the steel loss while the averaged steel loss in
wrapped specimens was 21.3%, showing a 30% increase. However,
50
impressed current using an internal cathode might not be an appropriate
corrosion acceleration method to study the efficacy of external FRP wrap.
2. Underwater FRP wrap is effective in increasing the structural capacity of
corrosion damaged elements (see Table 3.8, Fig. 3.23). The eccentric load
capacity was decreased 30% and 37.2% in unwrapped controls after 125 days
and 250 days of corrosion exposure while it was increased 8.7% and 19.5% by
repairing with FRP in the water. In unwrapped specimens, the load capacity
was decreased with the increase of actual steel loss; however, in the wrapped
specimens, the load capacity was increased even though its steel loss was
increased. It might be assumed that the concrete strength and corrosion
localization were controlling factors for those specimens.
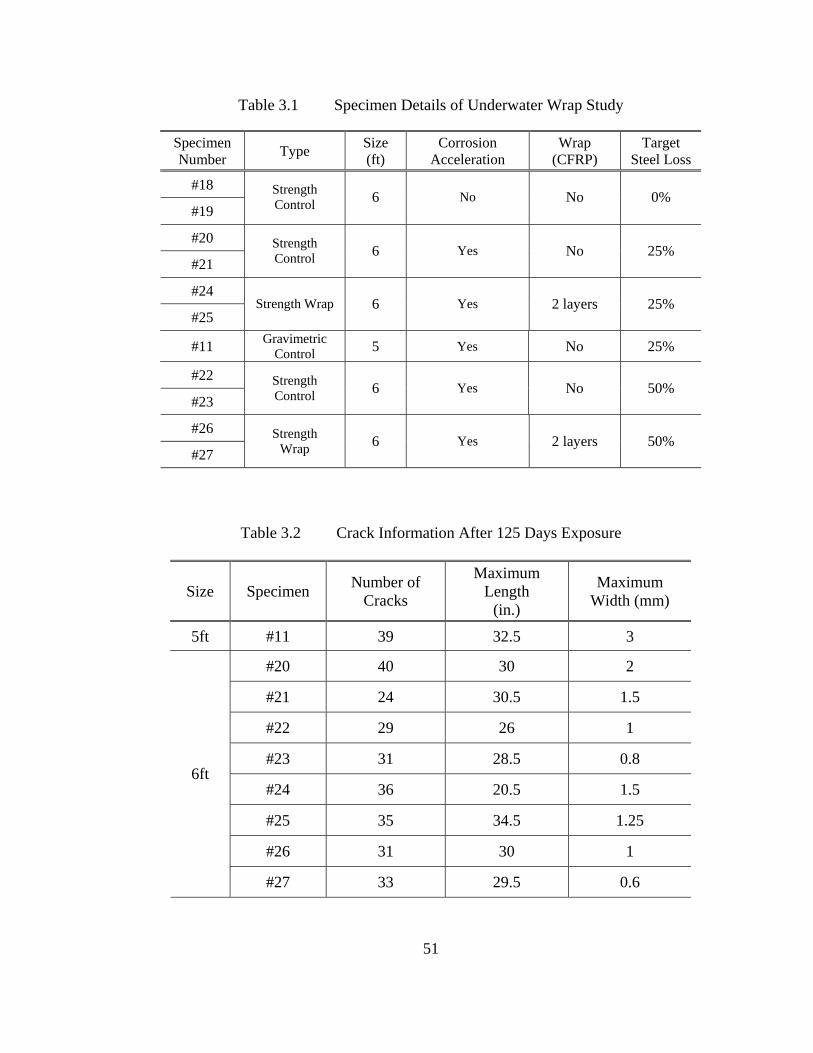
51
Table 3.1 Specimen Details of Underwater Wrap Study
Table 3.2 Crack Information After 125 Days Exposure
Size Specimen Number of Cracks
Maximum Length
(in.)
Maximum Width (mm)
5ft #11 39 32.5 3
#20 40 30 2
#21 24 30.5 1.5
#22 29 26 1
#23 31 28.5 0.8
#24 36 20.5 1.5
#25 35 34.5 1.25
#26 31 30 1
6ft
#27 33 29.5 0.6
Specimen Number Type Size
(ft) Corrosion
Acceleration Wrap
(CFRP) Target
Steel Loss
#18
#19 Strength Control 6 No No 0%
#20
#21 Strength Control 6 Yes No 25%
#24
#25 Strength Wrap 6 Yes 2 layers 25%
#11 Gravimetric Control 5 Yes No 25%
#22
#23 Strength Control 6 Yes No 50%
#26
#27 Strength
Wrap 6 Yes 2 layers 50%
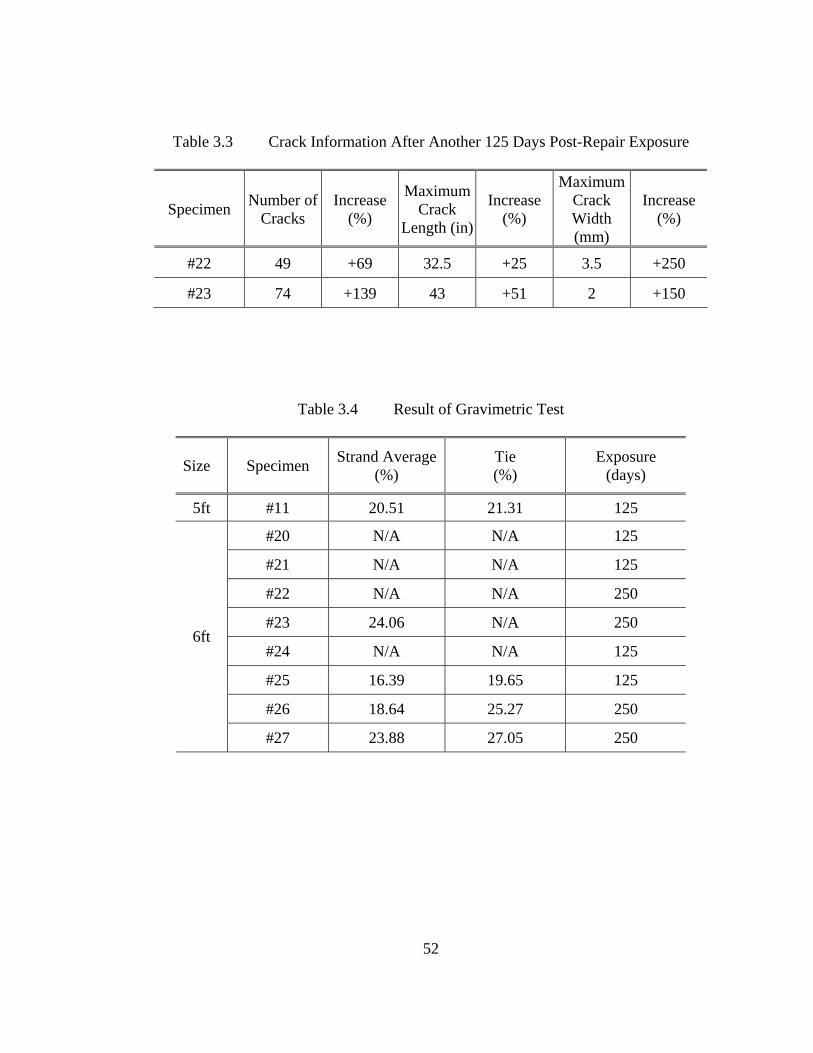
52
Table 3.3 Crack Information After Another 125 Days Post-Repair Exposure
Specimen Number of Cracks
Increase (%)
Maximum Crack
Length (in)
Increase (%)
Maximum Crack Width (mm)
Increase (%)
#22 49 +69 32.5 +25 3.5 +250
#23 74 +139 43 +51 2 +150
Table 3.4 Result of Gravimetric Test
Size Specimen Strand Average (%)
Tie (%)
Exposure (days)
5ft #11 20.51 21.31 125
#20 N/A N/A 125
#21 N/A N/A 125
#22 N/A N/A 250
#23 24.06 N/A 250
#24 N/A N/A 125
#25 16.39 19.65 125
#26 18.64 25.27 250
6ft
#27 23.88 27.05 250
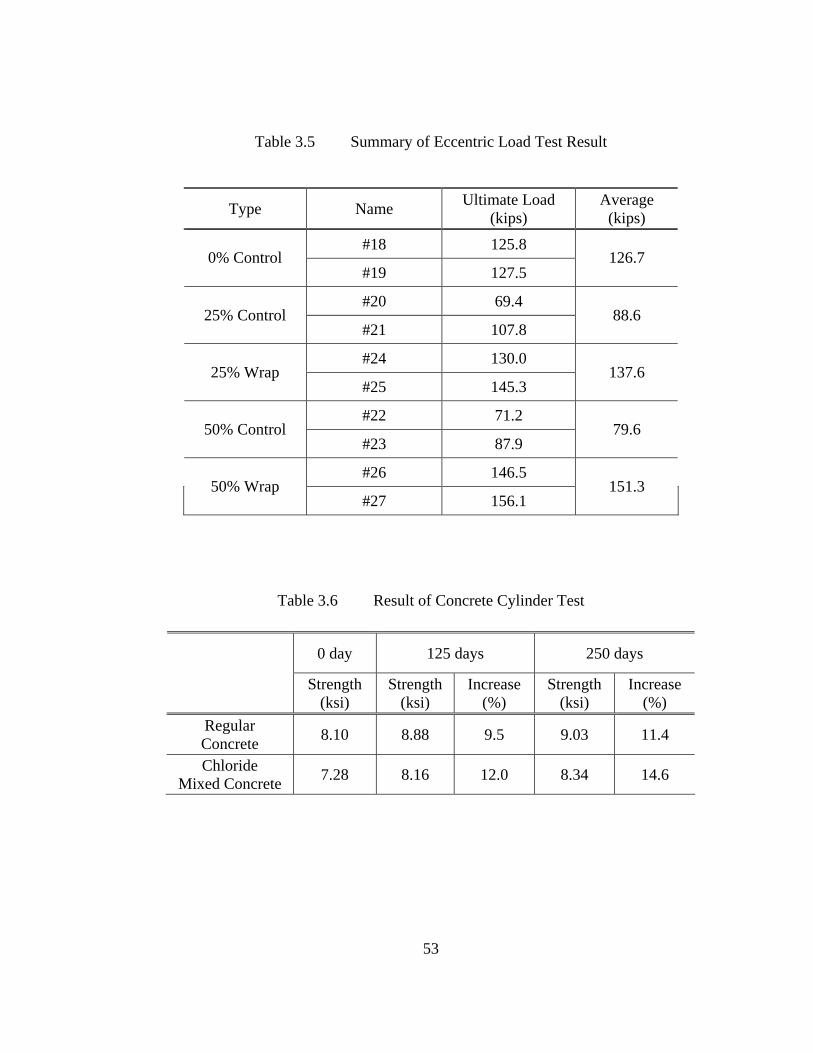
53
Table 3.5 Summary of Eccentric Load Test Result
Table 3.6 Result of Concrete Cylinder Test
Type Name Ultimate Load (kips)
Average (kips)
#18 125.8 0% Control
#19 127.5 126.7
#20 69.4 25% Control
#21 107.8 88.6
#24 130.0 25% Wrap
#25 145.3 137.6
#22 71.2 50% Control
#23 87.9 79.6
#26 146.5 50% Wrap
#27 156.1 151.3
0 day 125 days 250 days
Strength (ksi)
Strength (ksi)
Increase (%)
Strength (ksi)
Increase (%)
Regular Concrete 8.10 8.88 9.5 9.03 11.4
Chloride Mixed Concrete 7.28 8.16 12.0 8.34 14.6

54
Table 3.7 Actual Steel Loss of 6ft Specimens at Targeted Steel Loss
125 days 250 days (Unwrapped) 250 days (Wrapped)
Steel Loss (%)
Steel Loss (%)
Increase (%)
Steel Loss (%)
Increase (%)
Strands 16.4 24.1 +47 21.3 +29.9
Tie 19.7 NA NA 26.2 +33.0
Table 3.8 Summary of Eccentric Load Test
0 day 125 days 250 days
Ultimate
Load (kips)
Ultimate Load (kips)
Increase (%)
Ultimate Load (kips)
Increase (%)
Unwrapped 126.7 88.6 -30.0 79.6 -37.2
Wrapped NA 137.6 +8.7 151.3 +19.5
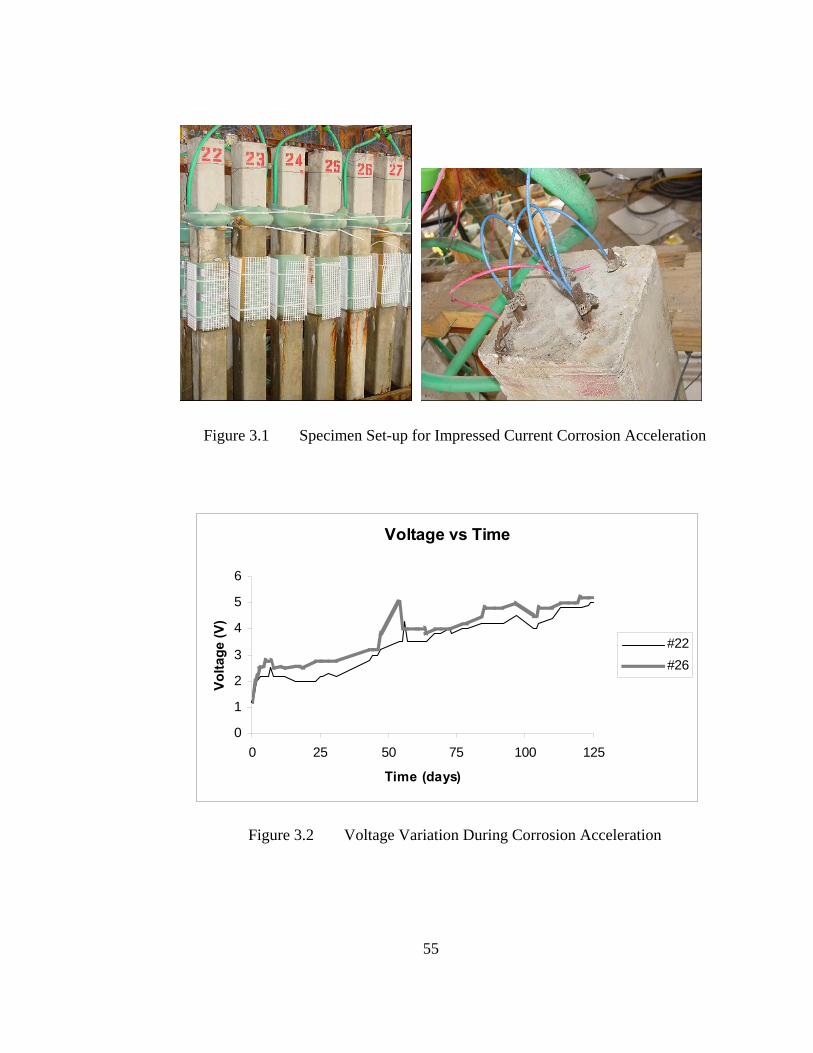
55
Figure 3.1 Specimen Set-up for Impressed Current Corrosion Acceleration
Figure 3.2 Voltage Variation During Corrosion Acceleration
Voltage vs Time
0
1
2
3
4
5
6
0 25 50 75 100 125
Time (days)
Volta
ge (V
)
#22#26
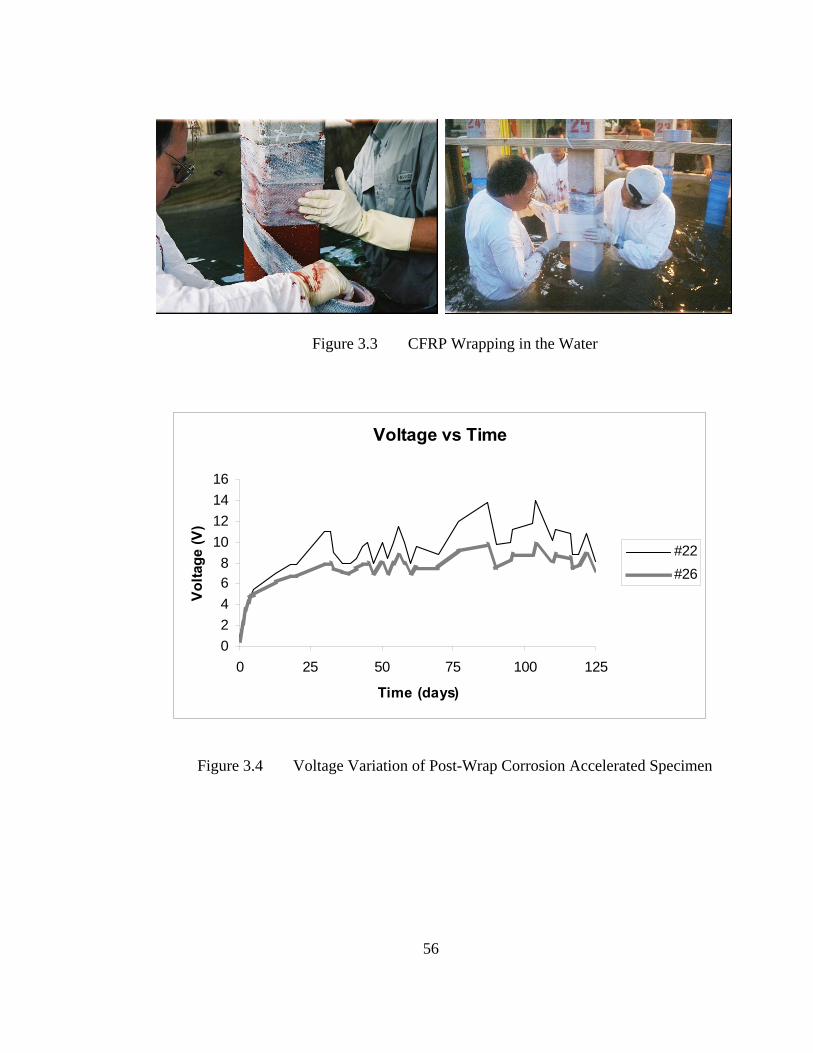
56
Figure 3.3 CFRP Wrapping in the Water
Figure 3.4 Voltage Variation of Post-Wrap Corrosion Accelerated Specimen
Voltage vs Time
02468
10121416
0 25 50 75 100 125
Time (days)
Vol
tage
(V)
#22#26
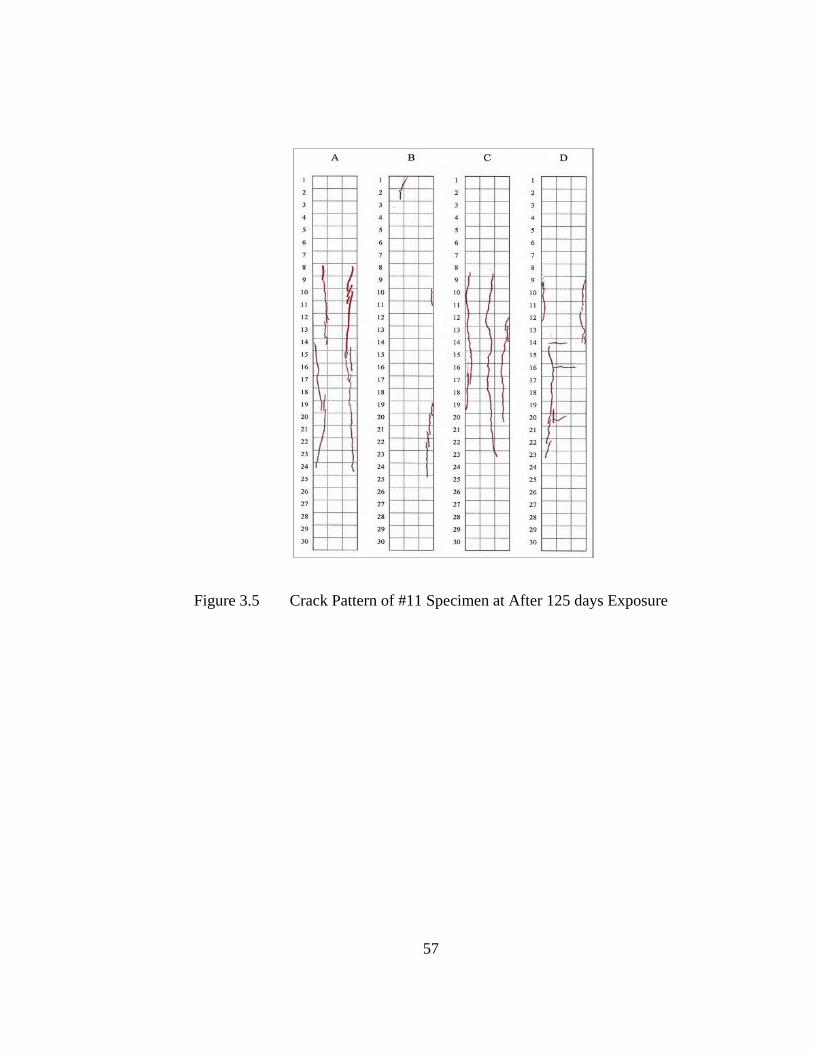
57
Figure 3.5 Crack Pattern of #11 Specimen at After 125 days Exposure
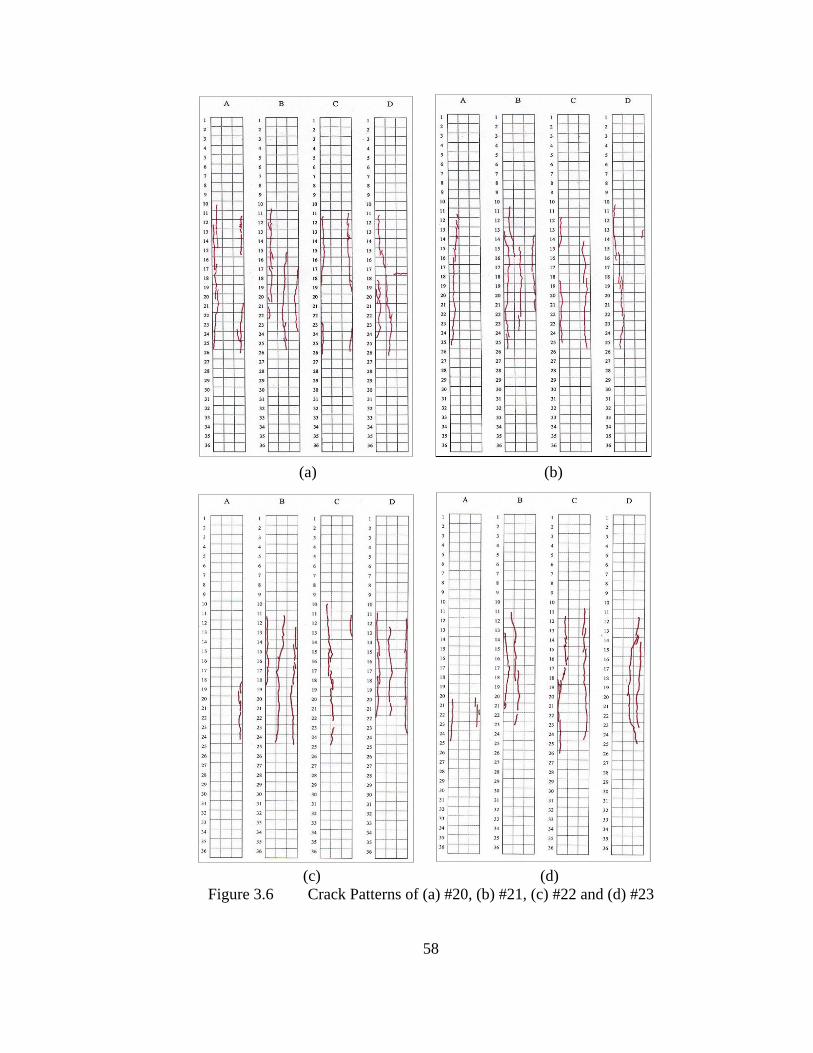
58
(a) (b)
(c) (d) Figure 3.6 Crack Patterns of (a) #20, (b) #21, (c) #22 and (d) #23
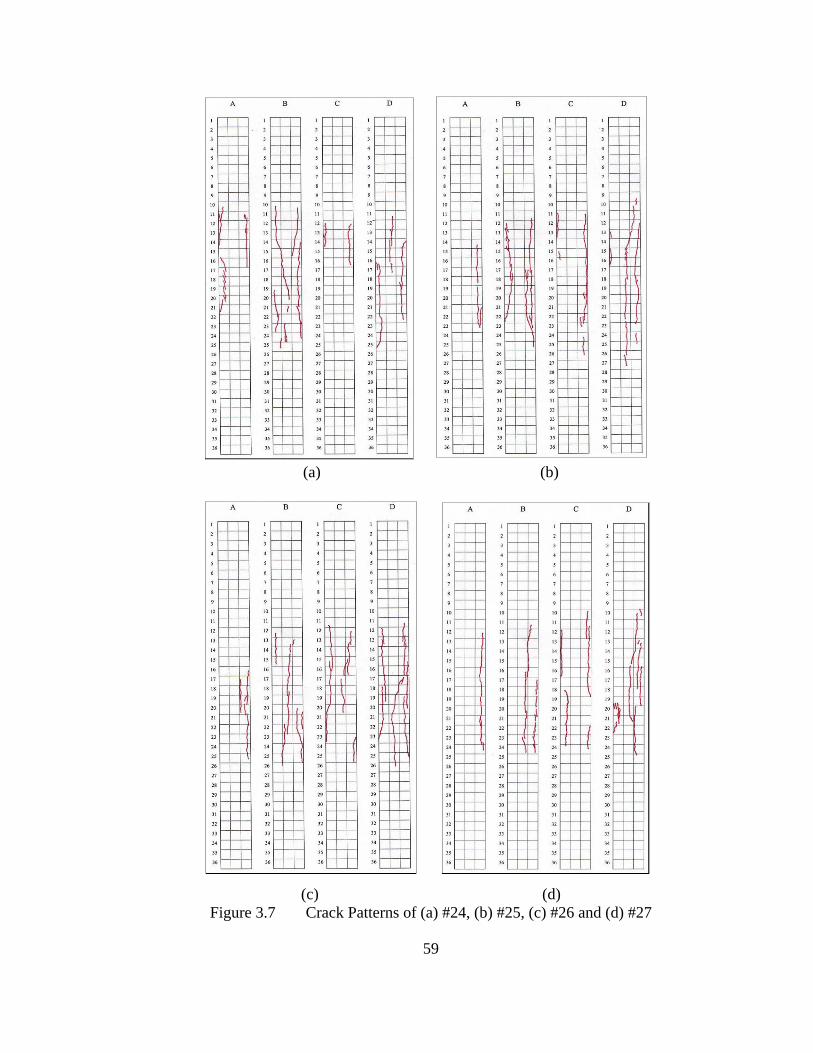
59
(a) (b)
(c) (d) Figure 3.7 Crack Patterns of (a) #24, (b) #25, (c) #26 and (d) #27
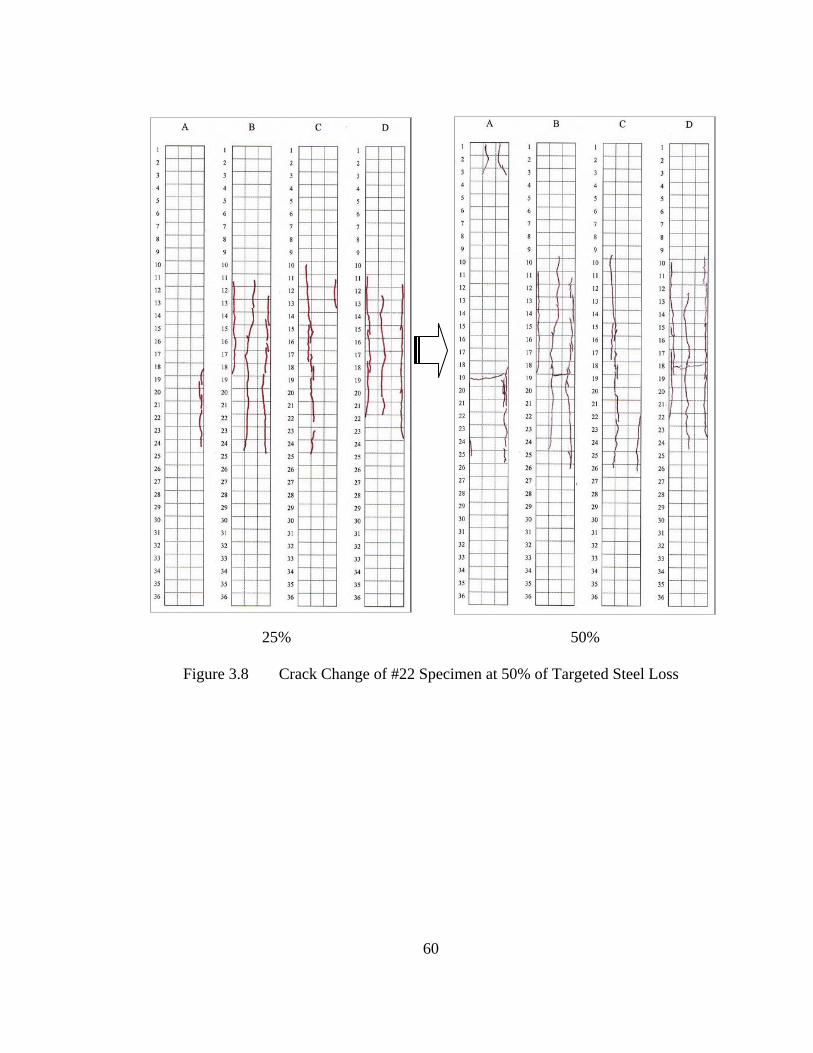
60
25% 50%
Figure 3.8 Crack Change of #22 Specimen at 50% of Targeted Steel Loss
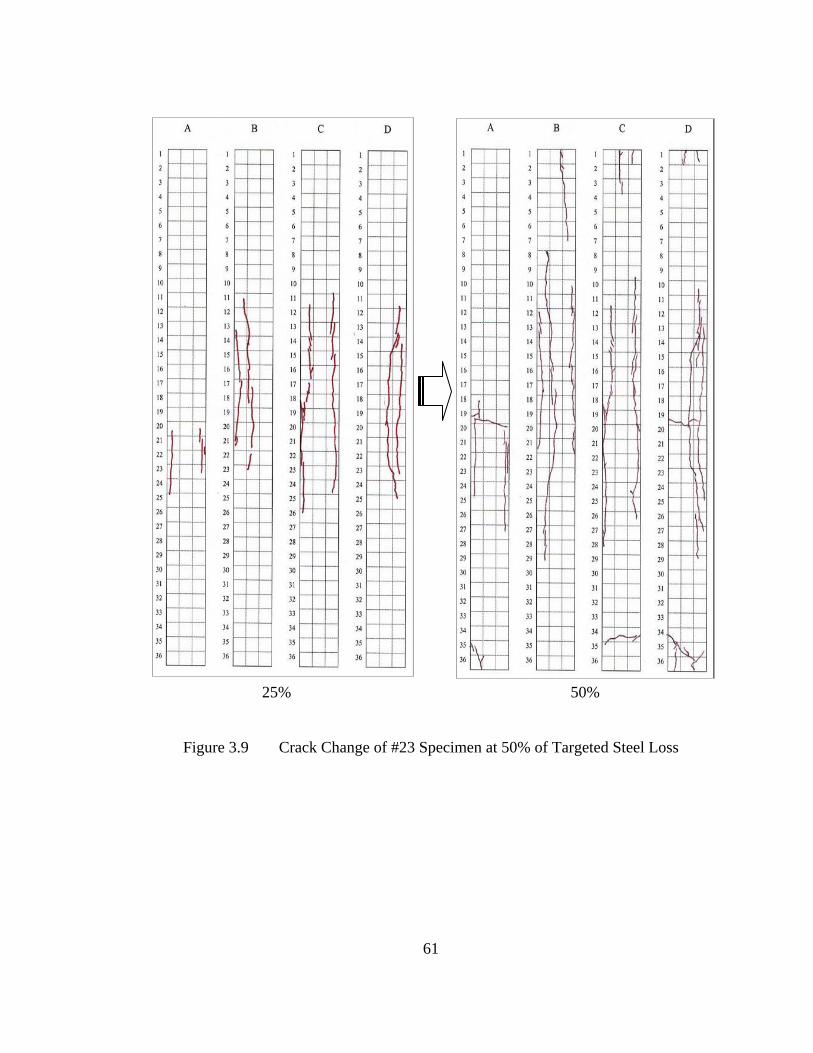
61
25% 50%
Figure 3.9 Crack Change of #23 Specimen at 50% of Targeted Steel Loss
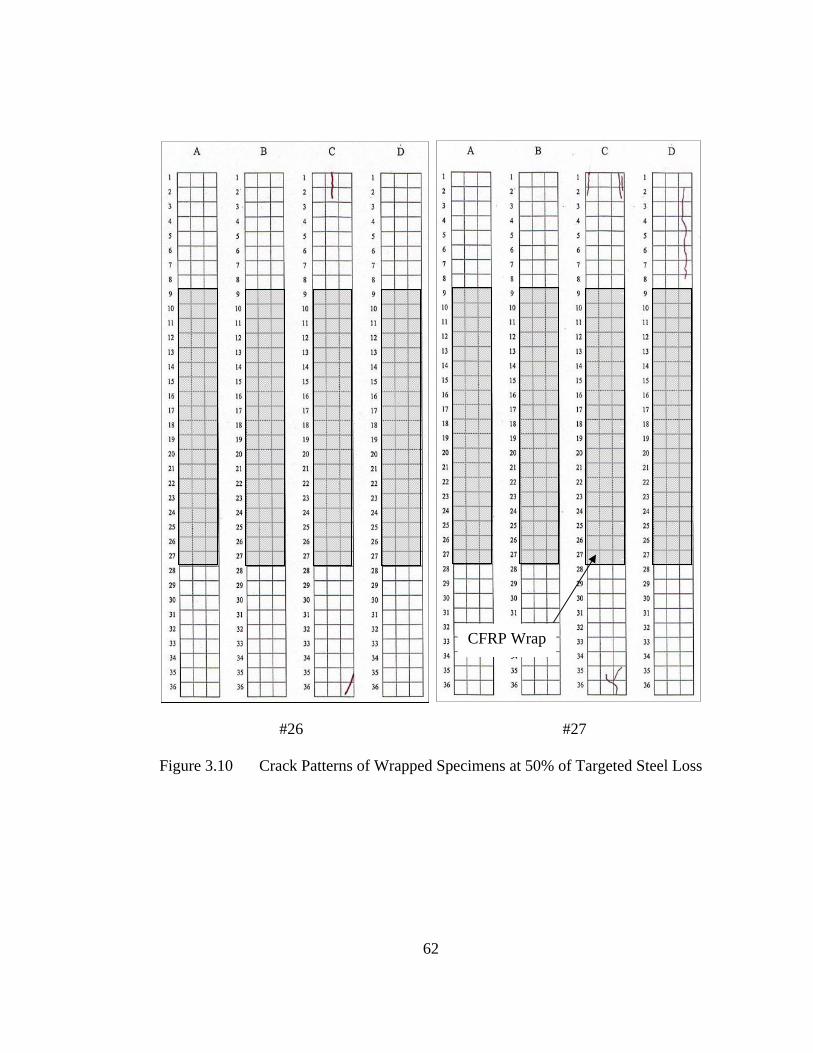
62
CFRP Wrap
#26 #27
Figure 3.10 Crack Patterns of Wrapped Specimens at 50% of Targeted Steel Loss
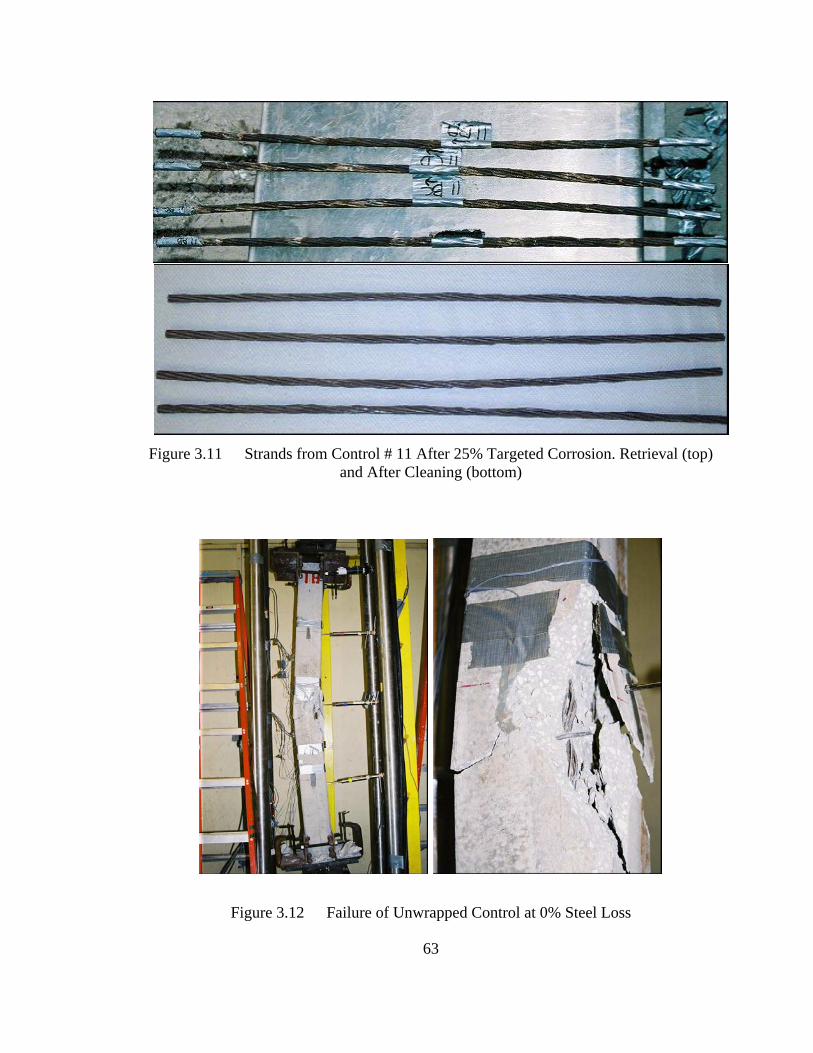
63
Figure 3.11 Strands from Control # 11 After 25% Targeted Corrosion. Retrieval (top)
and After Cleaning (bottom)
Figure 3.12 Failure of Unwrapped Control at 0% Steel Loss
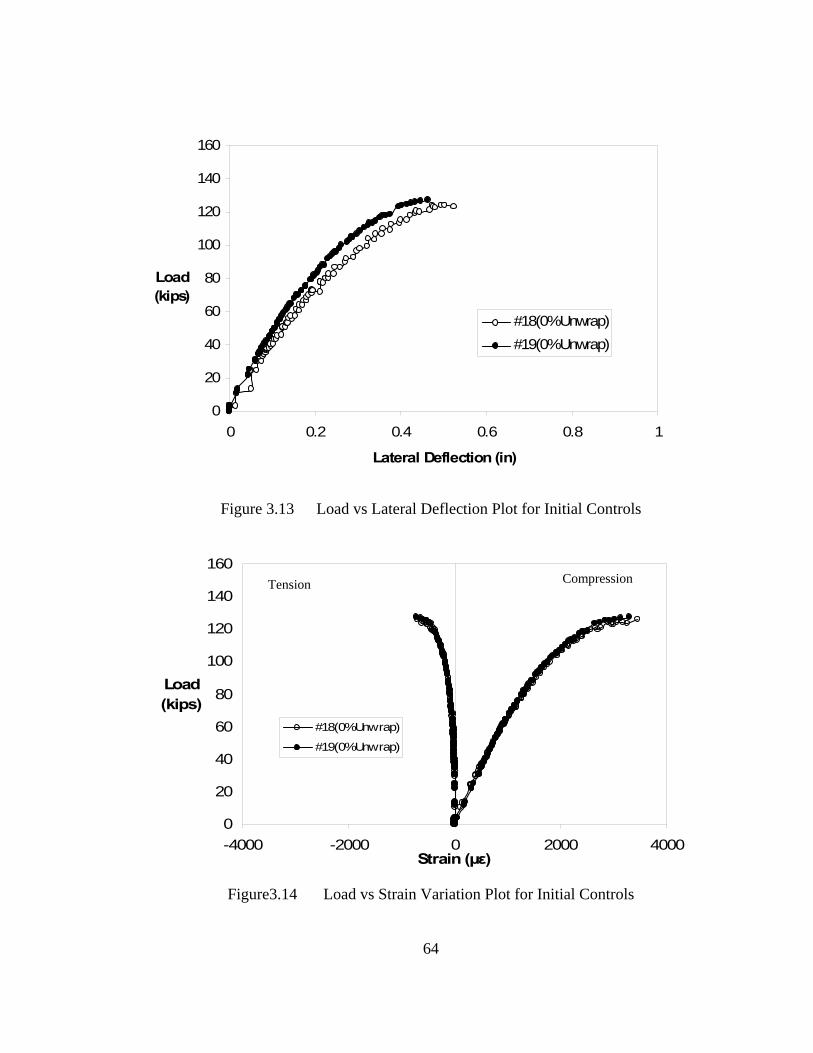
64
Figure 3.13 Load vs Lateral Deflection Plot for Initial Controls
Figure3.14 Load vs Strain Variation Plot for Initial Controls
0
20
40
60
80
100
120
140
160
0 0.2 0.4 0.6 0.8 1
Lateral Deflection (in)
Load (kips)
#18(0%Unwrap)#19(0%Unwrap)
0
20
40
60
80
100
120
140
160
-4000 -2000 0 2000 4000Strain (µε)
Load (kips)
#18(0%Unwrap)
#19(0%Unwrap)
Compression Tension
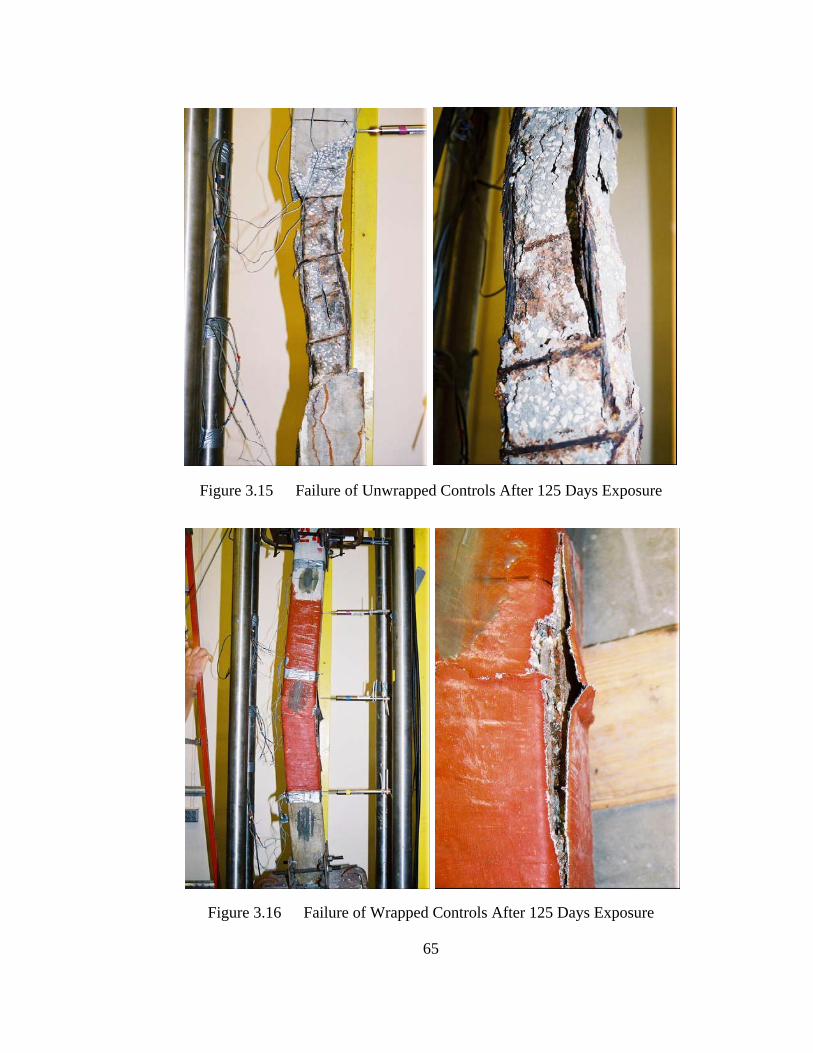
65
Figure 3.15 Failure of Unwrapped Controls After 125 Days Exposure
Figure 3.16 Failure of Wrapped Controls After 125 Days Exposure
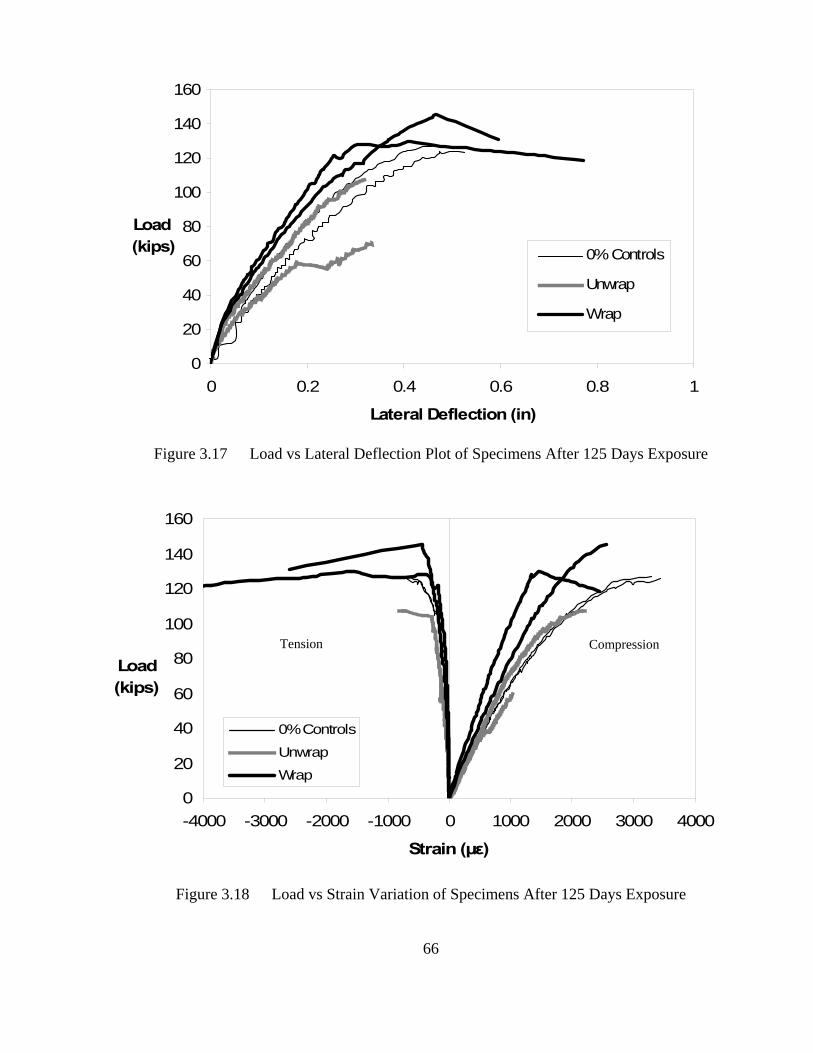
66
Figure 3.17 Load vs Lateral Deflection Plot of Specimens After 125 Days Exposure
Figure 3.18 Load vs Strain Variation of Specimens After 125 Days Exposure
0
20
40
60
80
100
120
140
160
0 0.2 0.4 0.6 0.8 1
Lateral Deflection (in)
Load (kips) 0% Controls
Unwrap
Wrap
0
20
40
60
80
100
120
140
160
-4000 -3000 -2000 -1000 0 1000 2000 3000 4000
Strain (µε)
Load (kips)
0% Controls
UnwrapWrap
Compression Tension
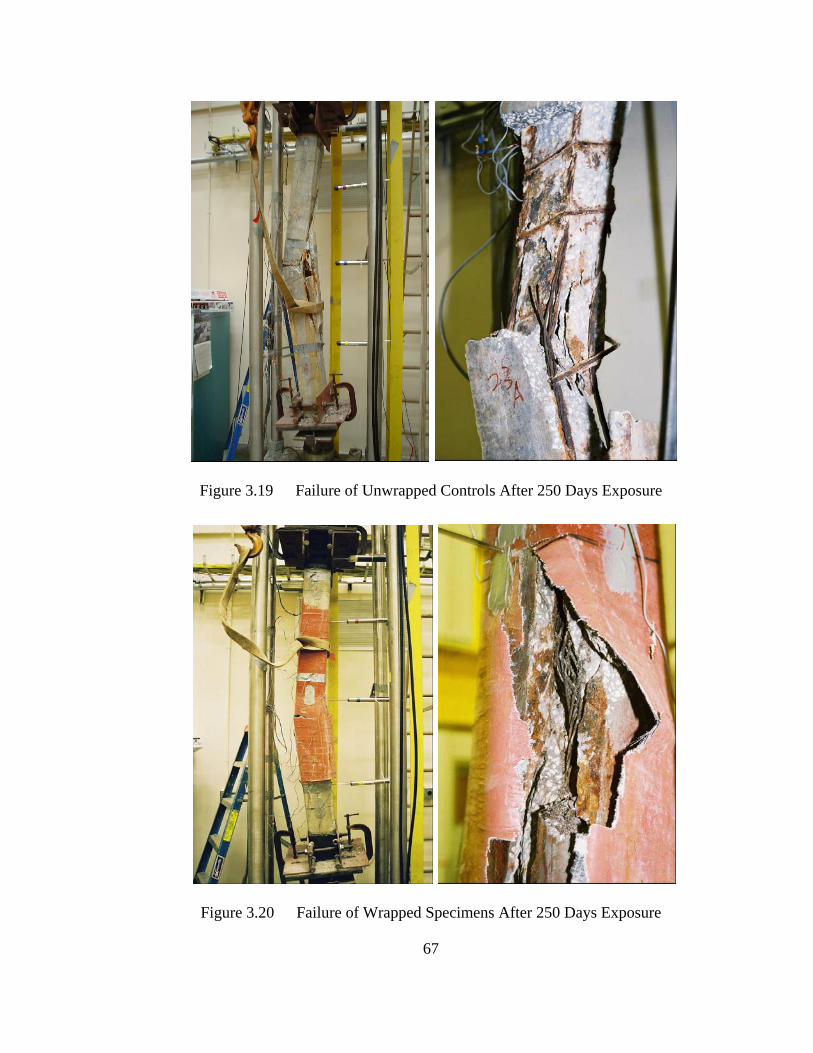
67
Figure 3.19 Failure of Unwrapped Controls After 250 Days Exposure
Figure 3.20 Failure of Wrapped Specimens After 250 Days Exposure
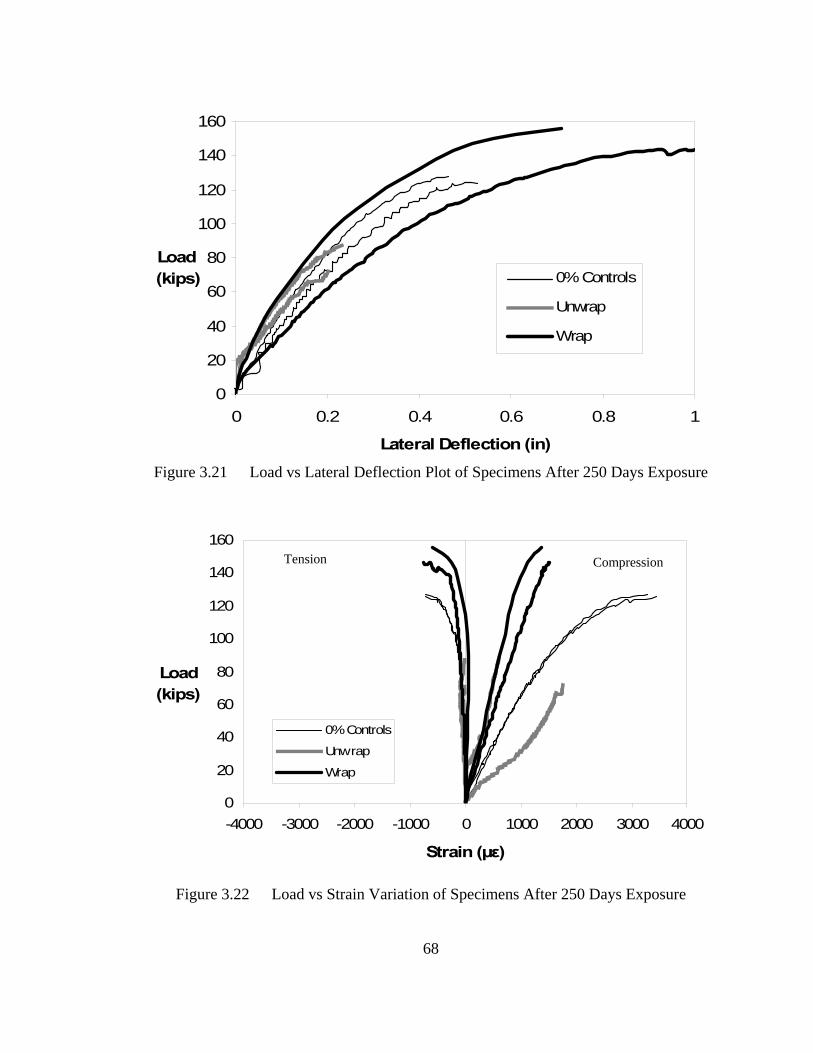
68
Figure 3.21 Load vs Lateral Deflection Plot of Specimens After 250 Days Exposure
Figure 3.22 Load vs Strain Variation of Specimens After 250 Days Exposure
0
20
40
60
80
100
120
140
160
0 0.2 0.4 0.6 0.8 1
Lateral Deflection (in)
Load (kips) 0% Controls
Unwrap
Wrap
0
20
40
60
80
100
120
140
160
-4000 -3000 -2000 -1000 0 1000 2000 3000 4000
Strain (µε)
Load (kips)
0% Controls
Unwrap
Wrap
Compression Tension
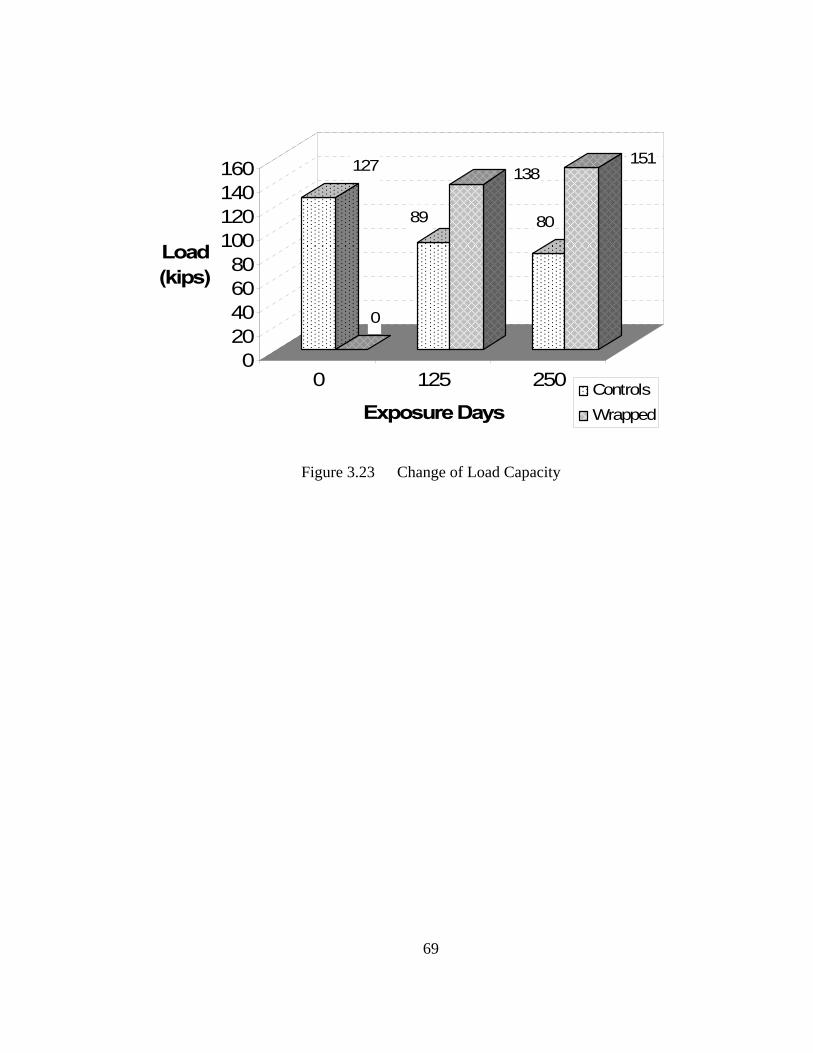
69
Figure 3.23 Change of Load Capacity
127
0
89
138
80
151
020406080
100120140160
Load (kips)
0 125 250
Exposure DaysControlsWrapped
70
CHAPTER 4
FRP REPAIR BEFORE CORROSION
4.1 Overview
FRP will be used in corrosion mitigation applications in which chloride ions from
salt water have in all likelihood penetrated to the level of the steel and destroyed the
passive layer that normally protects steel in concrete’s alkaline environment. The aim of
the laboratory study was to assess the extent to which the FRP material was effective in
such applications, that is, in delaying or preventing the occurrence of corrosion in
chloride-contaminated concrete exposed to tidal cycles under ambient conditions.
Variables investigated include (1) fiber type (2) number of FRP layers (3)
environment. Experimental parameters were selected to reflect actual Florida conditions.
A total of 22, five ft specimens were used in the study (Fig. 2.1). Sixteen of these
were wrapped and remaining six unwrapped specimens were used as controls. A 22in
length in the central region of all specimens had 3% chloride ion that was introduced
during fabrication. Two different environments were investigated – an outdoor
environment subjected to diurnal and seasonal fluctuations in temperature and humidity
and a laboratory environment where specimens were under more uniform conditions. In
both environments, specimens were exposed to wet/dry cycles in salt water.
Two different fiber types – carbon and glass – were evaluated (material properties
– Tables 4.19-22) Consequently, half the specimens were wrapped using bi-directional
71
CFRP and the other half using bi-directional GFRP. The number of FRP layers
varied from 1 to 4. Details are summarized in Table 4.1. To allow corrosion performance
to be monitored, each specimen was instrumented using reference electrodes and
thermocouples. Reference electrodes allow measurement of the corrosion potential and
the corrosion rate using linear polarization. Thermo-couples allow temperature inside the
concrete to be measured. Activated titanium reference electrodes (ATR) were used; their
number varied from 2 to 6 (Fig. 4.1).
4.2 Test Program
4.2.1 Instrumentation and Data Acquisition
Corrosion potential provides a measure of whether a specimen is corroding or not.
The ATR reference electrodes used were calibrated against standard copper-copper
sulfate reference electrodes. Generally, reference electrodes are placed on the surface of
concrete to allow measurement of the corrosion potential. However, environmental
factors such as concrete resistance, humidity, and junction contamination can affect the
potential reading. For this reason, embedded reference electrodes such as those used in
this study are recommended for long term measurement of corrosion potential.
ATR reference electrodes were fabricated at USF from titanium rods. The
procedure for making these ATR reference electrodes is as follows [Castro, 1996 ]:
1. Cut titanium rod in 5cm long pieces.
2. Drill 0.06in (1.5mm) diameter hole at one end of the titanium segment to a depth
of 0.24in (6mm).
3. Insert a stripped wire into the hole drilled in the titanium rod and crimp.
72
4. Coat both ends of the titanium rod with EP-308 epoxy leaving an exposed
titanium length of about 1.57in (40mm).
Half cell potentials of all the specimens were measured using a high impedance
voltmeter (MCM LC-1). To calibrate the titanium reference electrodes, a copper-copper
sulfate reference electrode (CSE) was used. In the calibration, the negative terminal of
the voltmeter was connected to a copper-copper sulfate reference electrode while the
positive terminal was connected to the titanium reference electrode. The voltage
measured is the calibration constant. Potential measurements were usually taken weekly
initially with the first potential reading taken 24 days after the specimens were cast.
Linear polarization measurements were made using a PR Monitor manufactured
by Cortest Instrument Systems. This has a three-electrode probe comprising a reference,
working, and counter electrode. A PR monitor measures the polarization resistance of the
electrochemical system in a specimen. The polarization resistance is inversely
proportional to the corrosion rate and allows the corrosion rate of the steel to be
estimated. Concrete resistivity was measured using a soil resistance meter (Nilson 400).
The polarized area was assumed to be the same as the chloride-contaminated area (22in
length). The ATR reference electrodes were soldered to a pre-made channel box to allow
measurements to be made accurately and quickly. Thermocouples embedded in the
concrete to measure temperature were hooked to a starlogger data acquisition system.
Temperature data was measured and recorded every hour. Figure 4.2 shows the set-up of
the data measurement.
73
4.2.2 FRP Wrapping
Sixteen specimens were wrapped using FRP exactly 28 days after casting.
Wrapping was applied over a 36in length in the central region of the specimen. This
meant that the FRP extended 7in above and below the boundary of the 22in chloride
contaminated region. Eight specimens were wrapped with bi-directional carbon fiber
reinforced polymer (CFRP) provided by SDR Engineering, Inc. And the other eight were
wrapped using Tyfo® Web Composite and Tyfo® S epoxy donated by Fyfe, Co.
Tyfo® Web Composite system is a bi-directional glass fiber reinforced polymer
(GFRP) manufactured by Fyfe, Co. LLC. Material properties of FRP and epoxies are
presented in Chapter 2. The number of layers was varied from 1-4 (two specimens for
each different layer) using the recommended lap lengths. For the CFRP this was 2in,
whereas for the GFRP it was 6in.
The recommended procedure for wrapping was followed. Fyfe provided
assistance for wrapping their specimens. The CFRP material had been used before and
directions provided by the supplier were followed. Prior to wrapping all specimens were
cleaned and the surfaces and edges made smooth using a grinder. Dust and concrete
particles produced due to grinding were removed using acetone . Resin and hardener
were proportioned by volume and poured in a clean dry bucket. For the Fyfe system, the
proportion was 100:42 while for the carbon system the corresponding volume ratio was
3:1. The two components were thoroughly mixed (5 minutes at 400-600rpm for Fyfe and
3 minutes at 400rpm for carbon) using a stirrer that was attached to a drill. The epoxy
was uniformly coated on the concrete surface using roller brush and the precut FRP
sheets were wrapped around the concrete using a roller to remove the air bubbles. To
74
make sure there was complete bond between layers, another epoxy coat was applied over
the installed sheets before successive FRP layers were wrapped. To protect the FRP wrap
from UV, two coats of external latex paint having a grey color were applied over the
wrapping area (Figs. 4.3-4).
4.2.3 Tidal Simulation
A total of twenty specimens (16 wrapped and 4 unwrapped controls) vertically
positioned inside a 6ft × 10ft × 4ft tank that was placed outdoors (Fig.4.5). In addition,
two unwrapped specimens were placed in an indoor tank in a controlled environment
(Fig. 4.6). All outdoor and indoor specimens were subjected to simulated tidal cycles in
3.5% salt water. The water level at high tide was 32in from the bottom and at low tide it
was 14in. This meant that a 2in length of the wrap was always submerged in water. The
water level was changed every 6 hours, and was controlled by a water pump and floating
switch
4.3 Test Results
4.3.1 Half Cell Potential Variation
The first potential reading was taken 24 days after pouring concrete. Wrapping
was conducted on the 28th day and wet/dry cycles started on the 111th day after the
concrete was cast. Fig. 4.7 shows the change in the averaged half cell potential measured
at the middle in four different types of specimens. All readings were more negative than
350mV, indicating that there was a 90% probability of corrosion. The readings showed a
big drop right after the start of wet/dry cycles possibly because of the availability of
water. Potential changes were similar for the first 300 days. However, after 350 days the
potential of the unwrapped control specimens became more negative while potential
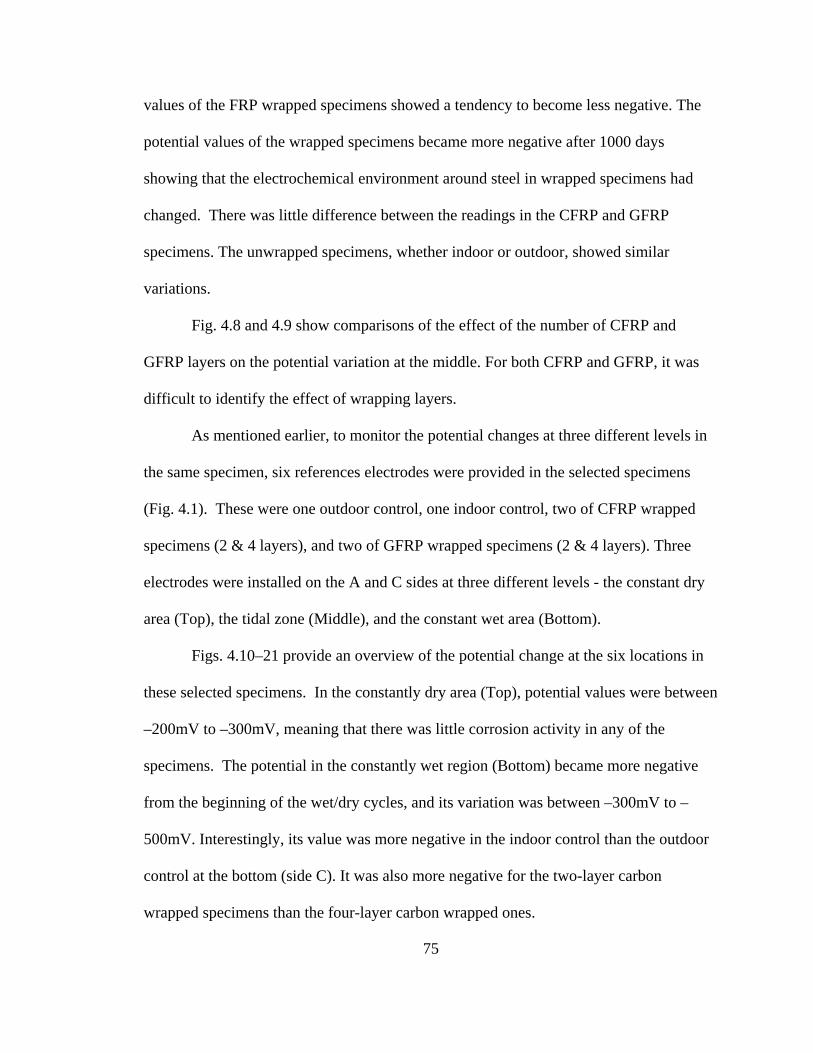
75
values of the FRP wrapped specimens showed a tendency to become less negative. The
potential values of the wrapped specimens became more negative after 1000 days
showing that the electrochemical environment around steel in wrapped specimens had
changed. There was little difference between the readings in the CFRP and GFRP
specimens. The unwrapped specimens, whether indoor or outdoor, showed similar
variations.
Fig. 4.8 and 4.9 show comparisons of the effect of the number of CFRP and
GFRP layers on the potential variation at the middle. For both CFRP and GFRP, it was
difficult to identify the effect of wrapping layers.
As mentioned earlier, to monitor the potential changes at three different levels in
the same specimen, six references electrodes were provided in the selected specimens
(Fig. 4.1). These were one outdoor control, one indoor control, two of CFRP wrapped
specimens (2 & 4 layers), and two of GFRP wrapped specimens (2 & 4 layers). Three
electrodes were installed on the A and C sides at three different levels - the constant dry
area (Top), the tidal zone (Middle), and the constant wet area (Bottom).
Figs. 4.10–21 provide an overview of the potential change at the six locations in
these selected specimens. In the constantly dry area (Top), potential values were between
–200mV to –300mV, meaning that there was little corrosion activity in any of the
specimens. The potential in the constantly wet region (Bottom) became more negative
from the beginning of the wet/dry cycles, and its variation was between –300mV to –
500mV. Interestingly, its value was more negative in the indoor control than the outdoor
control at the bottom (side C). It was also more negative for the two-layer carbon
wrapped specimens than the four-layer carbon wrapped ones.
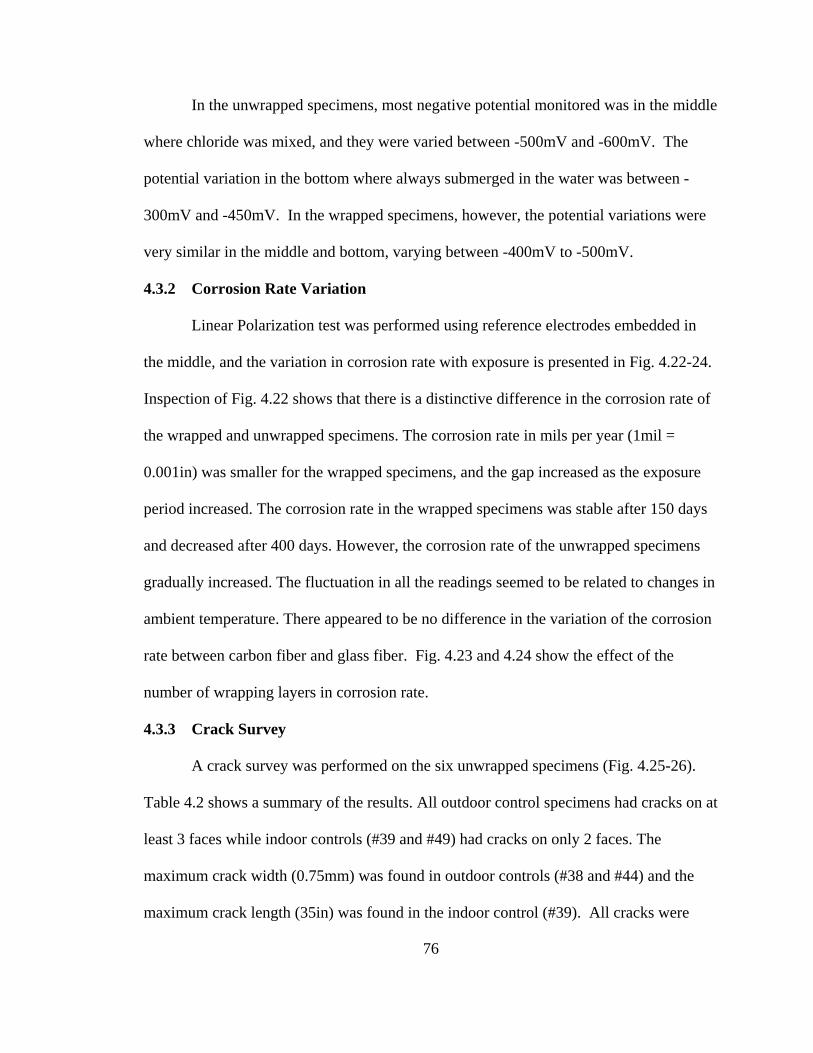
76
In the unwrapped specimens, most negative potential monitored was in the middle
where chloride was mixed, and they were varied between -500mV and -600mV. The
potential variation in the bottom where always submerged in the water was between -
300mV and -450mV. In the wrapped specimens, however, the potential variations were
very similar in the middle and bottom, varying between -400mV to -500mV.
4.3.2 Corrosion Rate Variation
Linear Polarization test was performed using reference electrodes embedded in
the middle, and the variation in corrosion rate with exposure is presented in Fig. 4.22-24.
Inspection of Fig. 4.22 shows that there is a distinctive difference in the corrosion rate of
the wrapped and unwrapped specimens. The corrosion rate in mils per year (1mil =
0.001in) was smaller for the wrapped specimens, and the gap increased as the exposure
period increased. The corrosion rate in the wrapped specimens was stable after 150 days
and decreased after 400 days. However, the corrosion rate of the unwrapped specimens
gradually increased. The fluctuation in all the readings seemed to be related to changes in
ambient temperature. There appeared to be no difference in the variation of the corrosion
rate between carbon fiber and glass fiber. Fig. 4.23 and 4.24 show the effect of the
number of wrapping layers in corrosion rate.
4.3.3 Crack Survey
A crack survey was performed on the six unwrapped specimens (Fig. 4.25-26).
Table 4.2 shows a summary of the results. All outdoor control specimens had cracks on at
least 3 faces while indoor controls (#39 and #49) had cracks on only 2 faces. The
maximum crack width (0.75mm) was found in outdoor controls (#38 and #44) and the
maximum crack length (35in) was found in the indoor control (#39). All cracks were
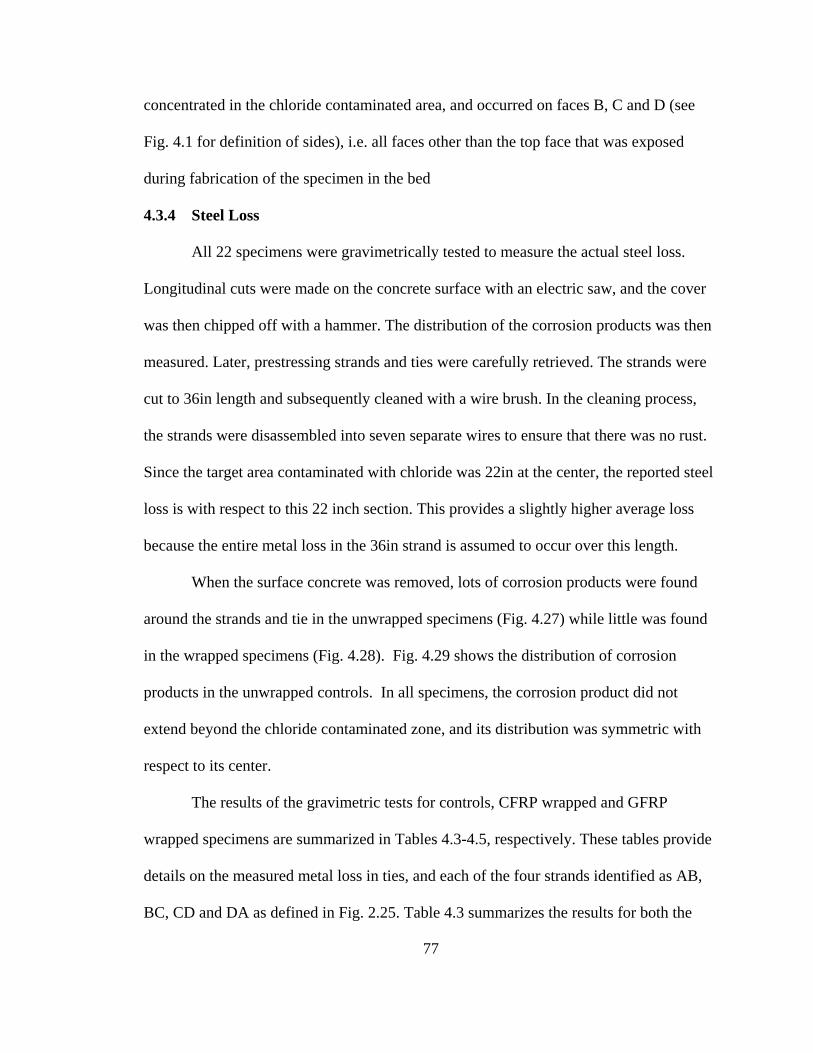
77
concentrated in the chloride contaminated area, and occurred on faces B, C and D (see
Fig. 4.1 for definition of sides), i.e. all faces other than the top face that was exposed
during fabrication of the specimen in the bed
4.3.4 Steel Loss
All 22 specimens were gravimetrically tested to measure the actual steel loss.
Longitudinal cuts were made on the concrete surface with an electric saw, and the cover
was then chipped off with a hammer. The distribution of the corrosion products was then
measured. Later, prestressing strands and ties were carefully retrieved. The strands were
cut to 36in length and subsequently cleaned with a wire brush. In the cleaning process,
the strands were disassembled into seven separate wires to ensure that there was no rust.
Since the target area contaminated with chloride was 22in at the center, the reported steel
loss is with respect to this 22 inch section. This provides a slightly higher average loss
because the entire metal loss in the 36in strand is assumed to occur over this length.
When the surface concrete was removed, lots of corrosion products were found
around the strands and tie in the unwrapped specimens (Fig. 4.27) while little was found
in the wrapped specimens (Fig. 4.28). Fig. 4.29 shows the distribution of corrosion
products in the unwrapped controls. In all specimens, the corrosion product did not
extend beyond the chloride contaminated zone, and its distribution was symmetric with
respect to its center.
The results of the gravimetric tests for controls, CFRP wrapped and GFRP
wrapped specimens are summarized in Tables 4.3-4.5, respectively. These tables provide
details on the measured metal loss in ties, and each of the four strands identified as AB,
BC, CD and DA as defined in Fig. 2.25. Table 4.3 summarizes the results for both the
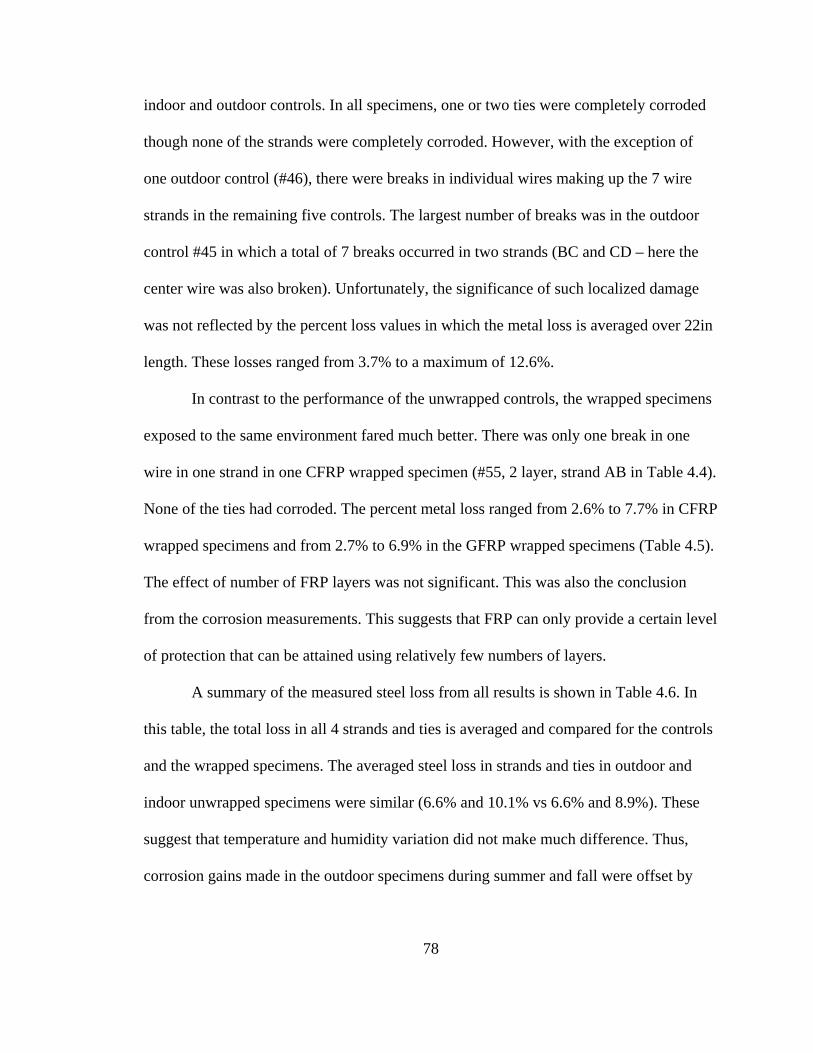
78
indoor and outdoor controls. In all specimens, one or two ties were completely corroded
though none of the strands were completely corroded. However, with the exception of
one outdoor control (#46), there were breaks in individual wires making up the 7 wire
strands in the remaining five controls. The largest number of breaks was in the outdoor
control #45 in which a total of 7 breaks occurred in two strands (BC and CD – here the
center wire was also broken). Unfortunately, the significance of such localized damage
was not reflected by the percent loss values in which the metal loss is averaged over 22in
length. These losses ranged from 3.7% to a maximum of 12.6%.
In contrast to the performance of the unwrapped controls, the wrapped specimens
exposed to the same environment fared much better. There was only one break in one
wire in one strand in one CFRP wrapped specimen (#55, 2 layer, strand AB in Table 4.4).
None of the ties had corroded. The percent metal loss ranged from 2.6% to 7.7% in CFRP
wrapped specimens and from 2.7% to 6.9% in the GFRP wrapped specimens (Table 4.5).
The effect of number of FRP layers was not significant. This was also the conclusion
from the corrosion measurements. This suggests that FRP can only provide a certain level
of protection that can be attained using relatively few numbers of layers.
A summary of the measured steel loss from all results is shown in Table 4.6. In
this table, the total loss in all 4 strands and ties is averaged and compared for the controls
and the wrapped specimens. The averaged steel loss in strands and ties in outdoor and
indoor unwrapped specimens were similar (6.6% and 10.1% vs 6.6% and 8.9%). These
suggest that temperature and humidity variation did not make much difference. Thus,
corrosion gains made in the outdoor specimens during summer and fall were offset by
79
lower corrosion rates in winter and spring. In contrast, specimens inside the laboratory
corroded at a more or less uniform rate throughout the exposure period.
The performance of the wrapped specimens was much better. The average metal
loss in strands was 3.3% for carbon and 3.4% for . For the ties, average metal loss was
6.9% for carbon and 6.3% for glass, compared to 10.1% for the outdoor controls.
The effect of number of FRP layers beyond two layers was minimal. as the
number of layers increased. Overall, the results for carbon and glass were comparable,
with glass providing slightly better protection for the ties, and the carbon slightly better
for the strands.
The results are re-plotted in Fig. 4.30-31 to compare the relative performance of
carbon and glass with respect to controls. In these plots, the worst performance for the
controls is compared against the worst performance for the wrapped specimen. For
example, the highest metal loss in the control was in strand CD in specimen #39 shown in
bold in Table 4.3. That for the ties was in specimen #38 in the same table. Similarly, for
the CFRP wrapped specimens the largest metal loss in strands was 4.4% for 1 layer
(specimen # 58 in Table 4.4) and 3.4% (specimen #55 in Table 4.4). For ties, the largest
loss 2 layer was 6.1% (specimen #55 in Table 4.4). Values for glass wrapped specimens
were similarly obtained from Table 4.5. The results show that the maximum metal loss
in strands in wrapped specimens was about 1/3rd the corresponding maximum metal loss
in the unwrapped controls. The improvement was somewhat less – about 50% - for the
ties. The performance did not improve when the number of FRP layers exceeded two.
Also, the performance of carbon and glass were comparable. Steel loss of strands might
be different according to their position in the casting bed. The result of the crack survey
80
(Fig. 4.25–26) showed that cracks were more concentrated along the strands BC and CD
that were located at the bottom in the casting bed. To determine if the position of the
strand has an effect on how much it corroded, the average steel loss of each strand was
calculated for the unwrapped controls and the CFRP and GFRP wrapped specimens. This
is shown in Fig. 4.32. The steel loss was highest in strand CD and second highest in
strand BC among the control specimens. In the wrapped specimens, however, all strands
showed a similar level of steel loss.
Corrosion rate measurement is widely used for assessing deterioration in
embedded steel non-destructively. To verify the effectiveness of these measurements, the
corrosion rate reading obtained in this study is compared against measured metal loss
from the gravimetric testing. The actual steel loss of strands in 22 specimens is compared
with the final corrosion rate values taken at the middle of the specimens. This is shown
in Fig. 4.33 for the corrosion rate.
4.3.5 Statistical Analysis
Visual inspection of all figures shows the benefit of FRP wrapping for slowing
down the occurrence of corrosion of steel. However, to confirm this effect, statistical
analyses were conducted using an averaged actual strand loss presented in Tables 4.3-5.
To examine whether wrapping is effective in reducing steel loss, the amount of steel loss
between the wrapped specimens (sample number, n=16) and unwrapped ones (n=6) were
compared (see Table 4.7). The wrapped specimens were shown to lose an average of
5.71 gram (standard deviation, SD=0.35), whereas the amount of steel loss of the
unwrapped ones was averaged 11.1 (SD=0.98). To test whether the mean difference
between the two groups was statistically significant, t tests were conducted using
81
statistical software, SPSS. The computed t score is a statistical value that determines the
size of the difference between two mean scores. The significance is determined by p
value, which indicates probability that the observed difference is due to chance. The
greater t value, the more significance. When the probability is lower than 0.05, the t
value is determined as statistically significant. To differentiate the degree of p value
significance, 0.01 and 0.001 levels of significance are also used. As shown in Table 4.7,
the difference in the amount of steel loss between the two groups was found to be
significant at 0.001 level (t= 19.4, p < .001). The significant t value of 19.4 indicates that
the mean difference between the two groups is statistically meaningful. The unwrapped
specimens lost a significantly greater amount of steel compared to those wrapped ones.
The finding confirms the effectiveness of wrapping in reducing steel loss.
To identify whether the types of wrapping materials have impacts on steel loss,
the two groups of specimens, those wrapped with carbon fiber (n=8) and those wrapped
with glass fiber (n=8), were compared in their amount of steel loss (Table 4.8). A t test
was conducted to quantify the difference between the two group means. The average
amount of steel loss was 5.63 (SD=0.31) in the specimens wrapped with carbon fiber, and
that in those wrapped with glass fiber was 5.78 (SD=0.40). The t test result was shown to
be not significant (t = 0.83, p > .05). The obtained t value of 0.83 The result indicates
that there was no meaningful difference between the two groups in the amount of steel
loss. It implies that both carbon fiber and glass fiber are equally beneficial for reducing
steel loss when they were used as wrapping materials.
The final analysis was conducted to assess whether the number of layer impacts
steel loss (Table 4.9). Because there were four groups (specimens with one layer,
82
specimens with two layers, specimens with three layers, and specimens with four layers),
ANOVA (analysis of variance) was used to determine the significance of group mean
differences. An ANOVA, also called an F test, is similar to the t test. The major
difference is that whereas the t test measures the difference between the means of two
groups, ANOVA tests the difference between the means of more than two groups. The
average steel loss was 5.95 (SD=0.19) for specimens with one layer, 5.42 (SD=0.20) for
specimens with two layers, 5.85 (SD=0.31) for specimens with three layers, and 5.61
(SD=0.47) for specimens with four layers, respectively. The result from ANOVA
showed that the F value was not statistically significant (F=2.17, p > .05). The finding
indicates that the number of layer does not have any significant impact on steel loss.
4.4 Summary
Based on the results of this experimental study, following conclusions may be
drawn.
1. The result of corrosion monitoring for 3 years showed that FRP wrapped
specimens had consistently lower readings for corrosion potential (Fig. 4.7)
and corrosion rate (Fig. 4.22) compared to unwrapped specimens when
exposed to the same environment. Moreover, in wrapped specimens, the
variation of corrosion potential moved towards less negative readings and the
corrosion rate gradually decreased with exposure. It means that FRP
wrapping was very effective in delaying the occurrence of corrosion in
prestressed strands. The performance of both carbon and glass were similar,
and it was independent of the number of FRP layers. Although readings for
83
outdoor controls seemed to be affected by temperature change, there was little
difference in the overall readings of outdoor and indoor controls.
2. The measured metal loss in wrapped specimens was lower than that in
unwrapped controls exposed to the same environment and its result are
visually shown in Figure 4.30-31.
3. The statistical analysis based on the strand weight loss confirmed the efficacy
of FRP wrapping. The steel loss difference between wrapped and unwrapped
specimens was statistically significant indicating that FRP wrapping was very
effective in delaying the corrosion of steel. . Both CFRP and GFRP were
equally effective in corrosion protection. In addition, the statistical analysis
showed that the number of wrapping layer did not affect steel loss.
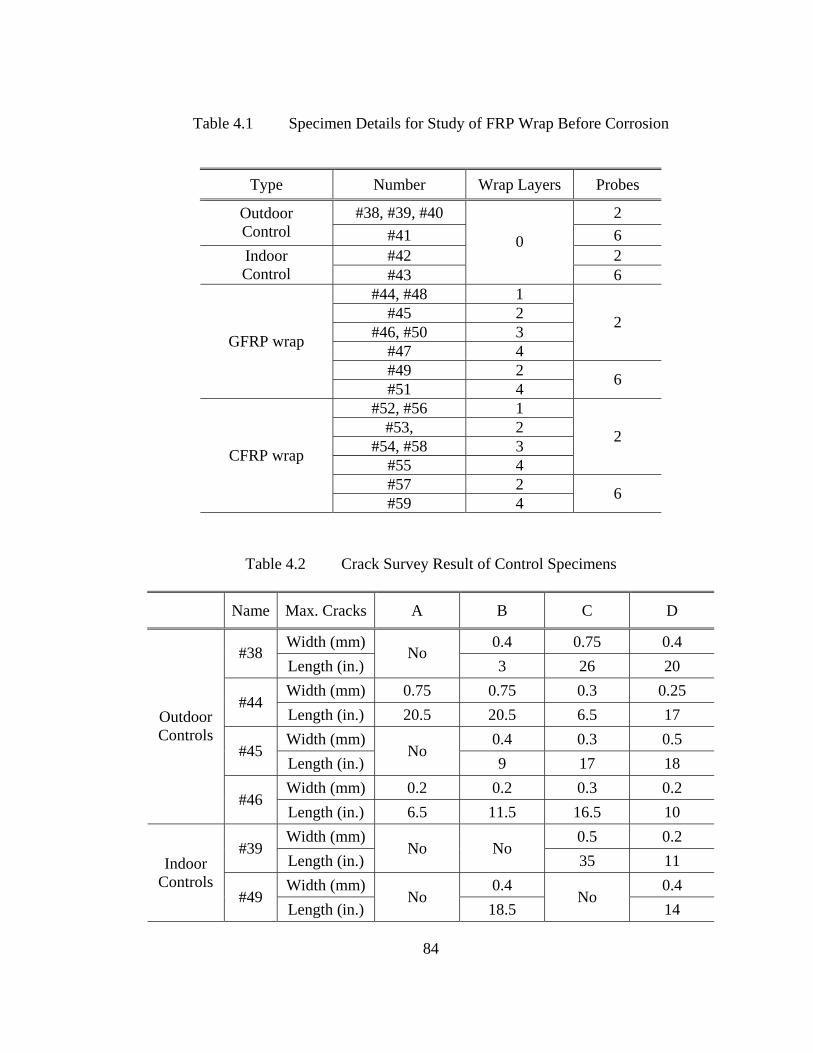
84
Table 4.1 Specimen Details for Study of FRP Wrap Before Corrosion
Table 4.2 Crack Survey Result of Control Specimens
Name Max. Cracks A B C D
Width (mm) 0.4 0.75 0.4 #38
Length (in.) No
3 26 20 Width (mm) 0.75 0.75 0.3 0.25
#44 Length (in.) 20.5 20.5 6.5 17 Width (mm) 0.4 0.3 0.5
#45 Length (in.)
No 9 17 18
Width (mm) 0.2 0.2 0.3 0.2
Outdoor Controls
#46 Length (in.) 6.5 11.5 16.5 10 Width (mm) 0.5 0.2
#39 Length (in.)
No No 35 11
Width (mm) 0.4 0.4 Indoor
Controls #49
Length (in.) No
18.5 No
14
Type Number Wrap Layers Probes
#38, #39, #40 2 Outdoor Control #41 6
#42 2 Indoor Control #43
0
6 #44, #48 1
#45 2 #46, #50 3
#47 4
2
#49 2
GFRP wrap
#51 4 6
#52, #56 1 #53, 2
#54, #58 3 #55 4
2
#57 2
CFRP wrap
#59 4 6
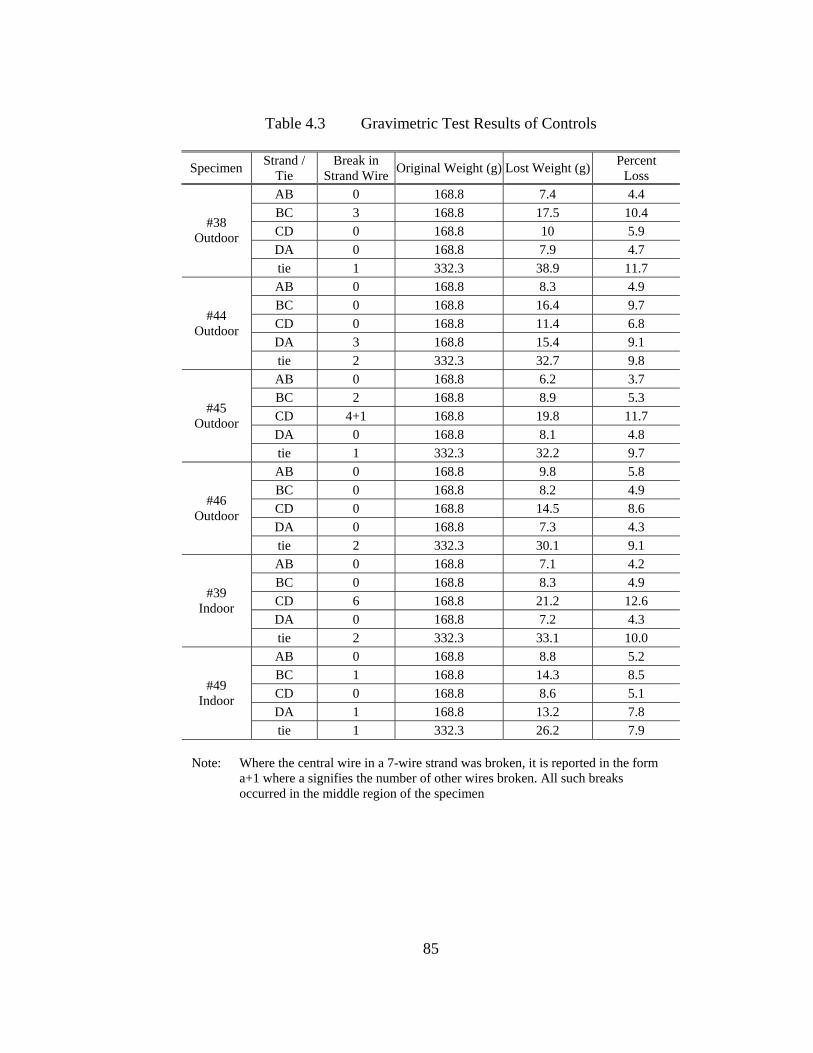
85
Table 4.3 Gravimetric Test Results of Controls
Specimen Strand /
Tie Break in
Strand Wire Original Weight (g) Lost Weight (g) Percent Loss
AB 0 168.8 7.4 4.4 BC 3 168.8 17.5 10.4 CD 0 168.8 10 5.9 DA 0 168.8 7.9 4.7
#38 Outdoor
tie 1 332.3 38.9 11.7 AB 0 168.8 8.3 4.9 BC 0 168.8 16.4 9.7 CD 0 168.8 11.4 6.8 DA 3 168.8 15.4 9.1
#44 Outdoor
tie 2 332.3 32.7 9.8 AB 0 168.8 6.2 3.7 BC 2 168.8 8.9 5.3 CD 4+1 168.8 19.8 11.7 DA 0 168.8 8.1 4.8
#45 Outdoor
tie 1 332.3 32.2 9.7 AB 0 168.8 9.8 5.8 BC 0 168.8 8.2 4.9 CD 0 168.8 14.5 8.6 DA 0 168.8 7.3 4.3
#46 Outdoor
tie 2 332.3 30.1 9.1 AB 0 168.8 7.1 4.2 BC 0 168.8 8.3 4.9 CD 6 168.8 21.2 12.6 DA 0 168.8 7.2 4.3
#39 Indoor
tie 2 332.3 33.1 10.0 AB 0 168.8 8.8 5.2 BC 1 168.8 14.3 8.5 CD 0 168.8 8.6 5.1 DA 1 168.8 13.2 7.8
#49 Indoor
tie 1 332.3 26.2 7.9 Note: Where the central wire in a 7-wire strand was broken, it is reported in the form
a+1 where a signifies the number of other wires broken. All such breaks occurred in the middle region of the specimen
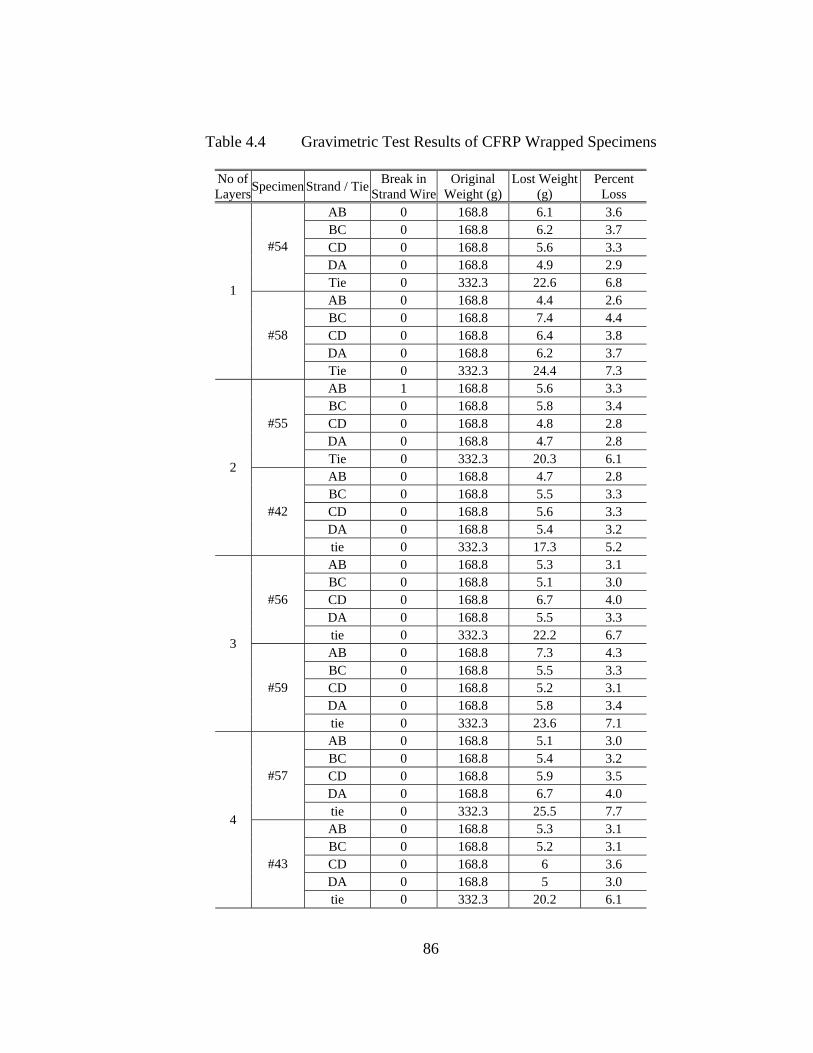
86
Table 4.4 Gravimetric Test Results of CFRP Wrapped Specimens
No of LayersSpecimen Strand / Tie Break in
Strand WireOriginal
Weight (g)Lost Weight
(g) Percent
Loss AB 0 168.8 6.1 3.6 BC 0 168.8 6.2 3.7 CD 0 168.8 5.6 3.3 DA 0 168.8 4.9 2.9
#54
Tie 0 332.3 22.6 6.8 AB 0 168.8 4.4 2.6 BC 0 168.8 7.4 4.4 CD 0 168.8 6.4 3.8 DA 0 168.8 6.2 3.7
1
#58
Tie 0 332.3 24.4 7.3 AB 1 168.8 5.6 3.3 BC 0 168.8 5.8 3.4 CD 0 168.8 4.8 2.8 DA 0 168.8 4.7 2.8
#55
Tie 0 332.3 20.3 6.1 AB 0 168.8 4.7 2.8 BC 0 168.8 5.5 3.3 CD 0 168.8 5.6 3.3 DA 0 168.8 5.4 3.2
2
#42
tie 0 332.3 17.3 5.2 AB 0 168.8 5.3 3.1 BC 0 168.8 5.1 3.0 CD 0 168.8 6.7 4.0 DA 0 168.8 5.5 3.3
#56
tie 0 332.3 22.2 6.7 AB 0 168.8 7.3 4.3 BC 0 168.8 5.5 3.3 CD 0 168.8 5.2 3.1 DA 0 168.8 5.8 3.4
3
#59
tie 0 332.3 23.6 7.1 AB 0 168.8 5.1 3.0 BC 0 168.8 5.4 3.2 CD 0 168.8 5.9 3.5 DA 0 168.8 6.7 4.0
#57
tie 0 332.3 25.5 7.7 AB 0 168.8 5.3 3.1 BC 0 168.8 5.2 3.1 CD 0 168.8 6 3.6 DA 0 168.8 5 3.0
4
#43
tie 0 332.3 20.2 6.1
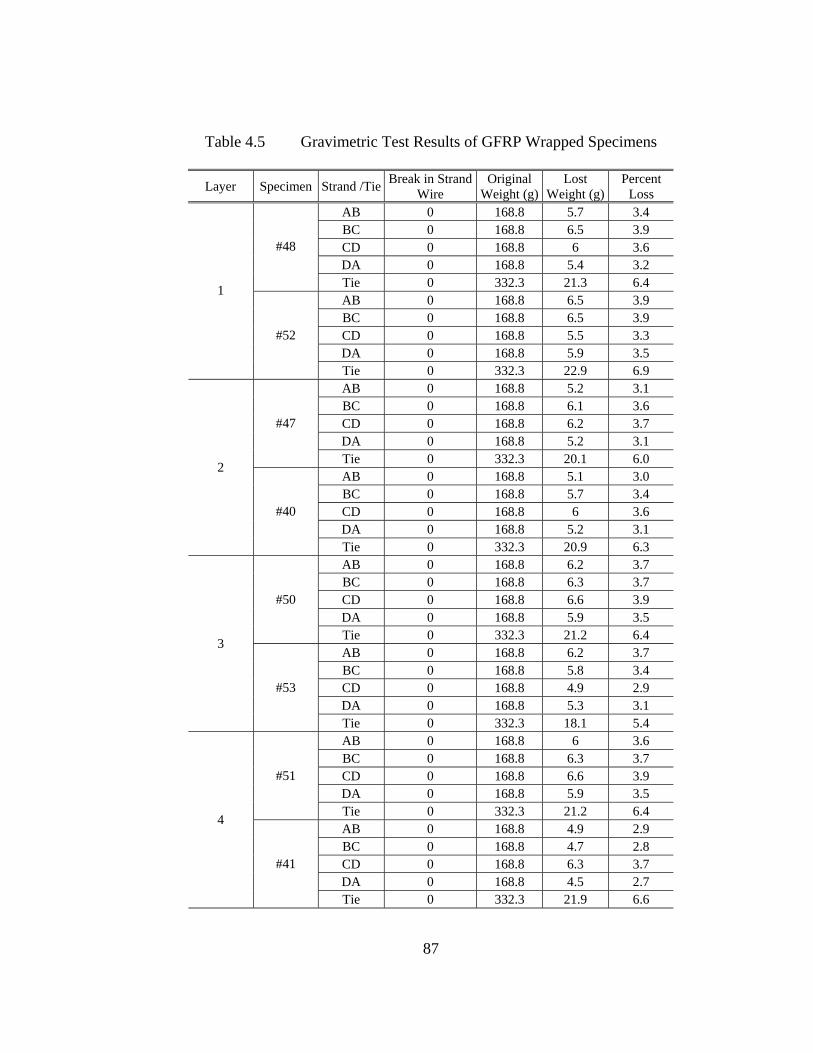
87
Table 4.5 Gravimetric Test Results of GFRP Wrapped Specimens
Layer Specimen Strand /Tie Break in Strand Wire
Original Weight (g)
Lost Weight (g)
Percent Loss
AB 0 168.8 5.7 3.4 BC 0 168.8 6.5 3.9 CD 0 168.8 6 3.6 DA 0 168.8 5.4 3.2
#48
Tie 0 332.3 21.3 6.4 AB 0 168.8 6.5 3.9 BC 0 168.8 6.5 3.9 CD 0 168.8 5.5 3.3 DA 0 168.8 5.9 3.5
1
#52
Tie 0 332.3 22.9 6.9 AB 0 168.8 5.2 3.1 BC 0 168.8 6.1 3.6 CD 0 168.8 6.2 3.7 DA 0 168.8 5.2 3.1
#47
Tie 0 332.3 20.1 6.0 AB 0 168.8 5.1 3.0 BC 0 168.8 5.7 3.4 CD 0 168.8 6 3.6 DA 0 168.8 5.2 3.1
2
#40
Tie 0 332.3 20.9 6.3 AB 0 168.8 6.2 3.7 BC 0 168.8 6.3 3.7 CD 0 168.8 6.6 3.9 DA 0 168.8 5.9 3.5
#50
Tie 0 332.3 21.2 6.4 AB 0 168.8 6.2 3.7 BC 0 168.8 5.8 3.4 CD 0 168.8 4.9 2.9 DA 0 168.8 5.3 3.1
3
#53
Tie 0 332.3 18.1 5.4 AB 0 168.8 6 3.6 BC 0 168.8 6.3 3.7 CD 0 168.8 6.6 3.9 DA 0 168.8 5.9 3.5
#51
Tie 0 332.3 21.2 6.4 AB 0 168.8 4.9 2.9 BC 0 168.8 4.7 2.8 CD 0 168.8 6.3 3.7 DA 0 168.8 4.5 2.7
4
#41
Tie 0 332.3 21.9 6.6
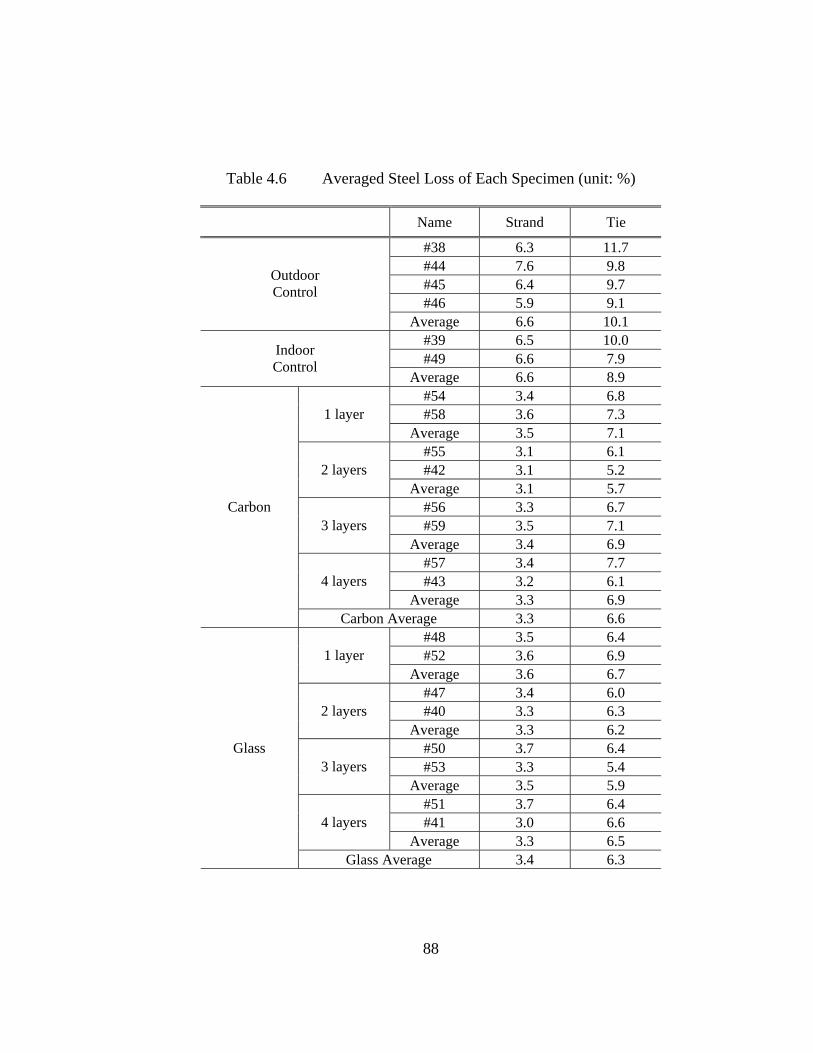
88
Table 4.6 Averaged Steel Loss of Each Specimen (unit: %)
Name Strand Tie
#38 6.3 11.7 #44 7.6 9.8 #45 6.4 9.7 #46 5.9 9.1
Outdoor Control
Average 6.6 10.1 #39 6.5 10.0 #49 6.6 7.9 Indoor
Control Average 6.6 8.9
#54 3.4 6.8 #58 3.6 7.3 1 layer
Average 3.5 7.1 #55 3.1 6.1 #42 3.1 5.2 2 layers
Average 3.1 5.7 #56 3.3 6.7 #59 3.5 7.1 3 layers
Average 3.4 6.9 #57 3.4 7.7 #43 3.2 6.1 4 layers
Average 3.3 6.9
Carbon
Carbon Average 3.3 6.6 #48 3.5 6.4 #52 3.6 6.9 1 layer
Average 3.6 6.7 #47 3.4 6.0 #40 3.3 6.3 2 layers
Average 3.3 6.2 #50 3.7 6.4 #53 3.3 5.4 3 layers
Average 3.5 5.9 #51 3.7 6.4 #41 3.0 6.6 4 layers
Average 3.3 6.5
Glass
Glass Average 3.4 6.3
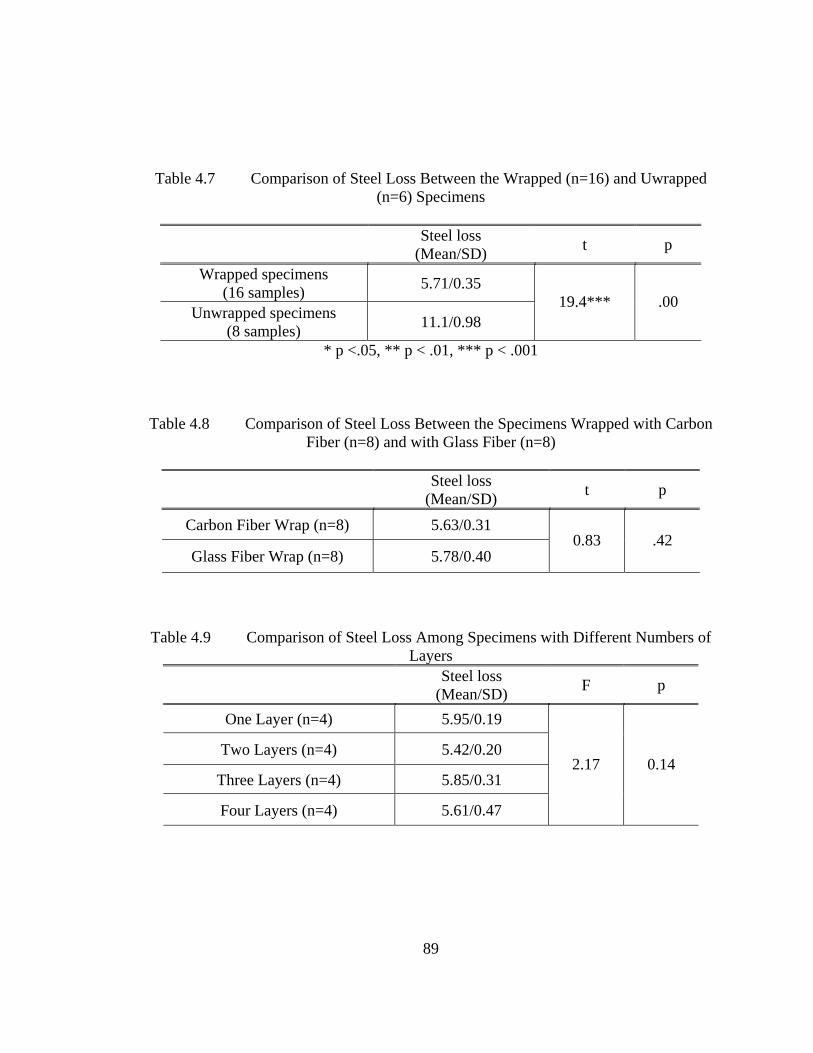
89
Table 4.7 Comparison of Steel Loss Between the Wrapped (n=16) and Uwrapped (n=6) Specimens
Steel loss (Mean/SD) t p
Wrapped specimens (16 samples) 5.71/0.35
Unwrapped specimens (8 samples) 11.1/0.98
19.4*** .00
* p <.05, ** p < .01, *** p < .001
Table 4.8 Comparison of Steel Loss Between the Specimens Wrapped with Carbon Fiber (n=8) and with Glass Fiber (n=8)
Steel loss (Mean/SD) t p
Carbon Fiber Wrap (n=8) 5.63/0.31
Glass Fiber Wrap (n=8) 5.78/0.40 0.83 .42
Table 4.9 Comparison of Steel Loss Among Specimens with Different Numbers of Layers
Steel loss (Mean/SD) F p
One Layer (n=4) 5.95/0.19
Two Layers (n=4) 5.42/0.20
Three Layers (n=4) 5.85/0.31
Four Layers (n=4) 5.61/0.47
2.17 0.14
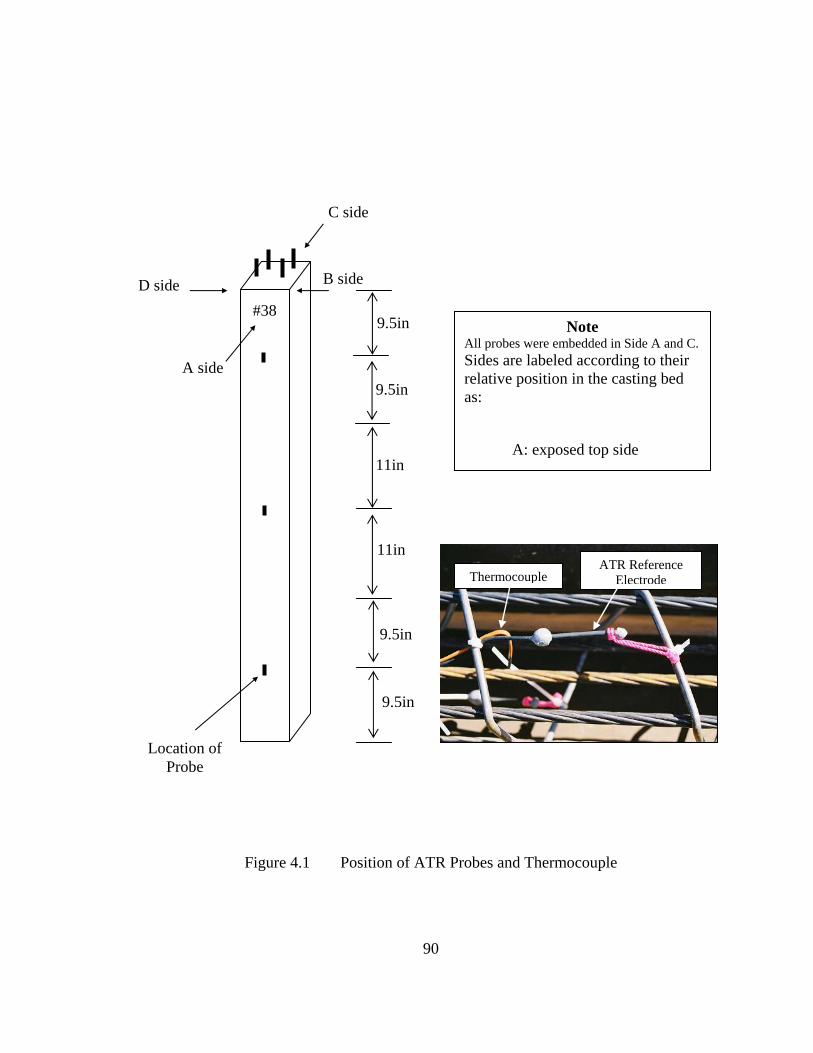
90
Figure 4.1 Position of ATR Probes and Thermocouple
ATR Reference ElectrodeThermocouple
Note All probes were embedded in Side A and C. Sides are labeled according to their relative position in the casting bed as:
A: exposed top side
#38 D side
C side
B side
A side
11in
11in
9.5in
9.5in
9.5in
9.5in
Location of Probe
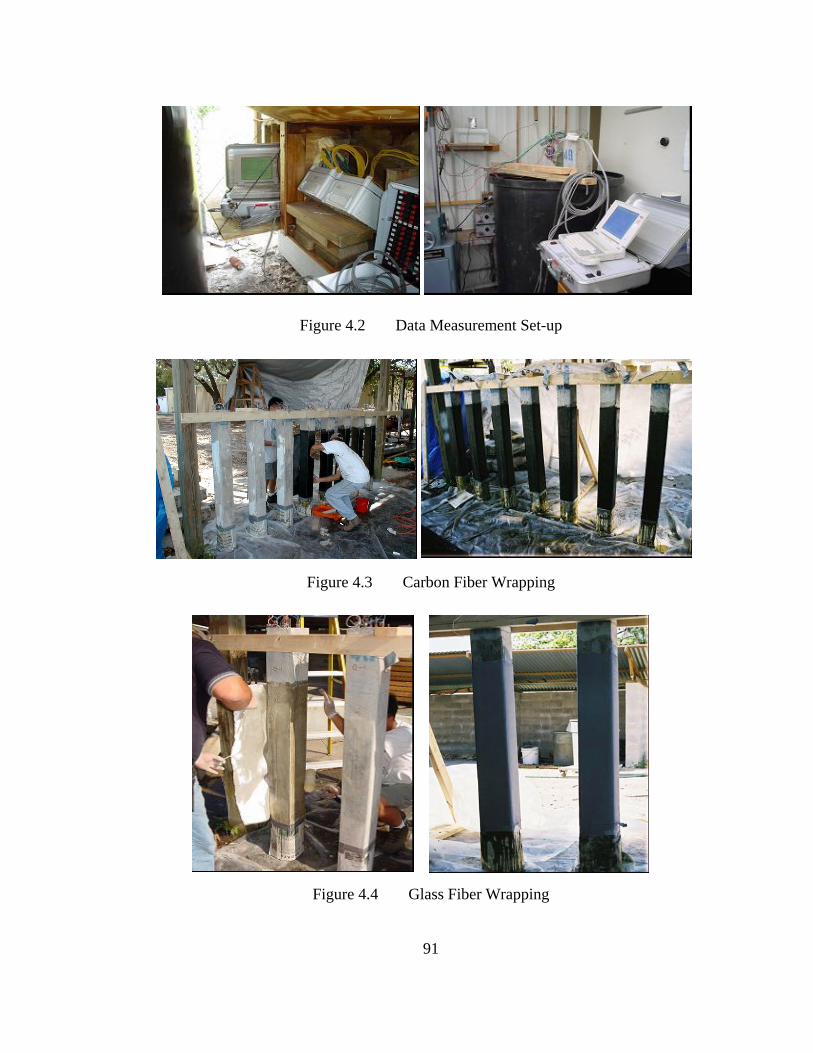
91
Figure 4.2 Data Measurement Set-up
Figure 4.3 Carbon Fiber Wrapping
Figure 4.4 Glass Fiber Wrapping
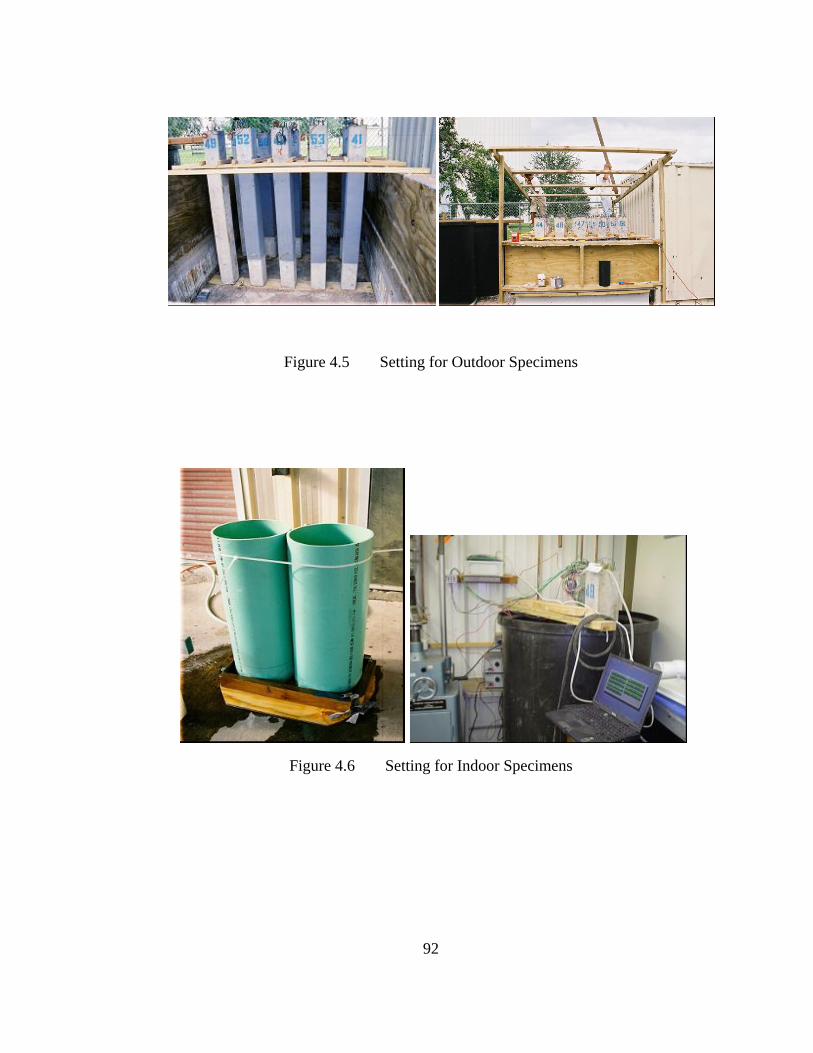
92
Figure 4.5 Setting for Outdoor Specimens
Figure 4.6 Setting for Indoor Specimens
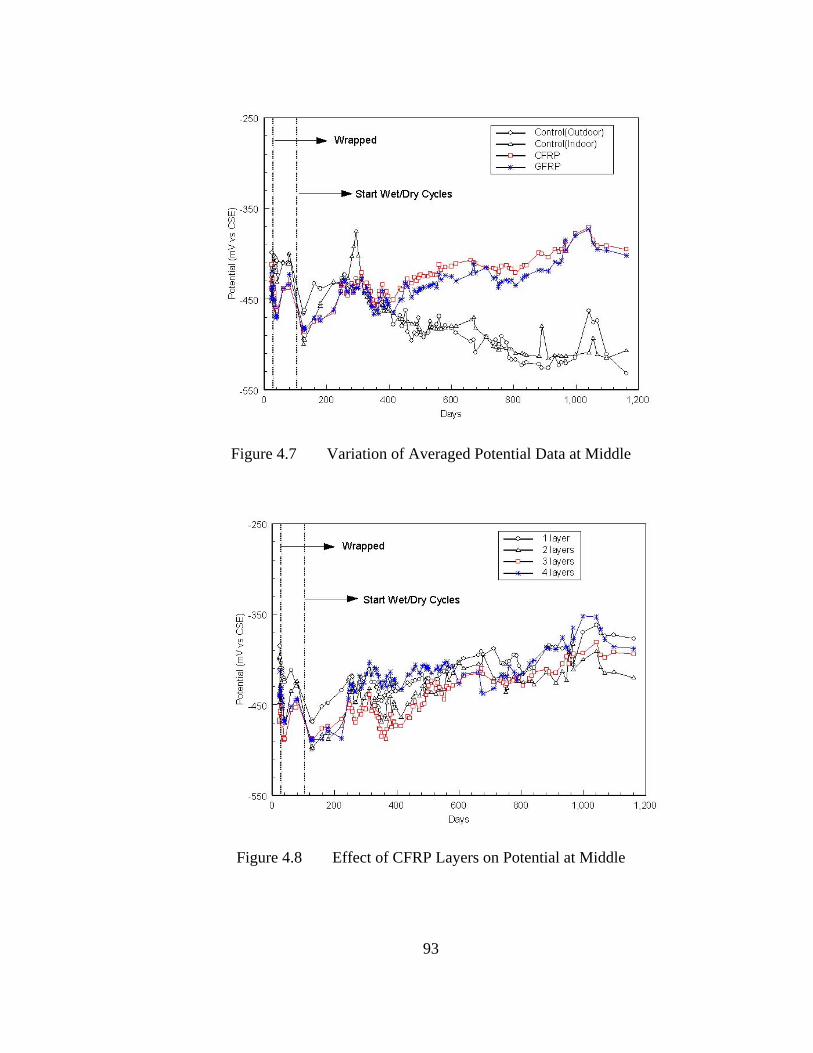
93
Figure 4.7 Variation of Averaged Potential Data at Middle
Figure 4.8 Effect of CFRP Layers on Potential at Middle
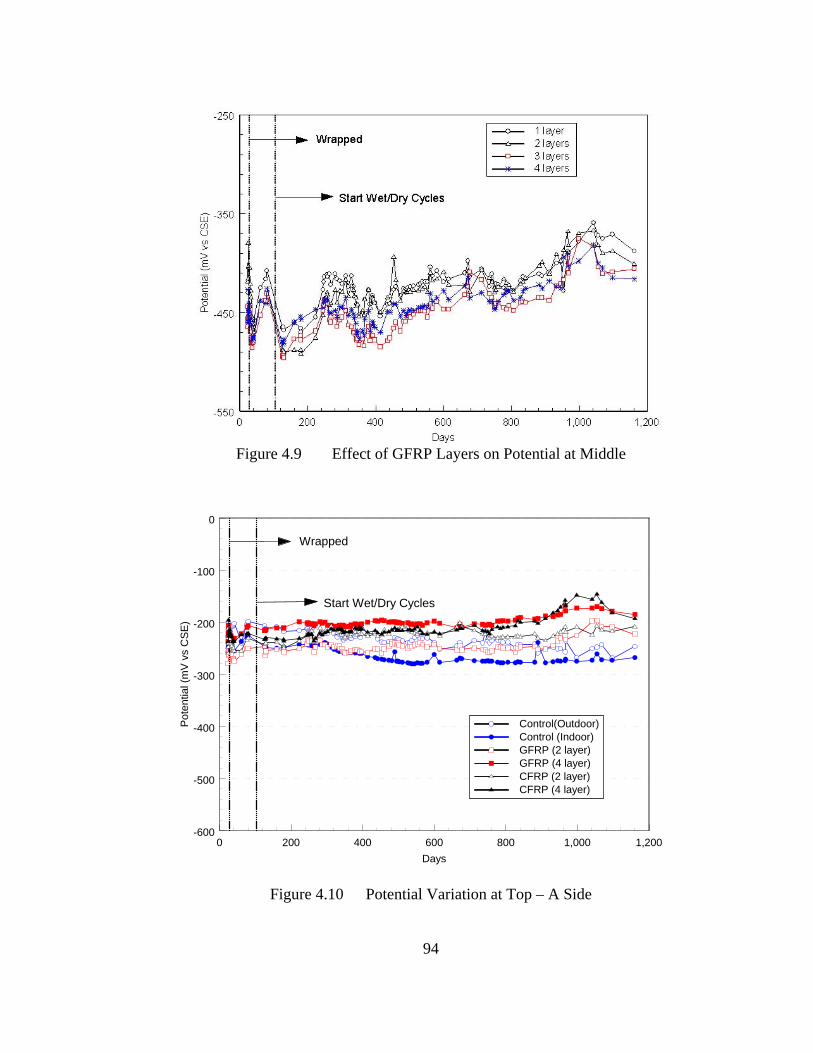
94
0 200 400 600 800 1,000 1,200Days
-600
-500
-400
-300
-200
-100
0
Pote
ntia
l (m
V vs
CSE
)
Control(Outdoor)Control (Indoor)GFRP (2 layer)GFRP (4 layer)CFRP (2 layer)CFRP (4 layer)
Wrapped
Start Wet/Dry Cycles
Figure 4.9 Effect of GFRP Layers on Potential at Middle
Figure 4.10 Potential Variation at Top – A Side
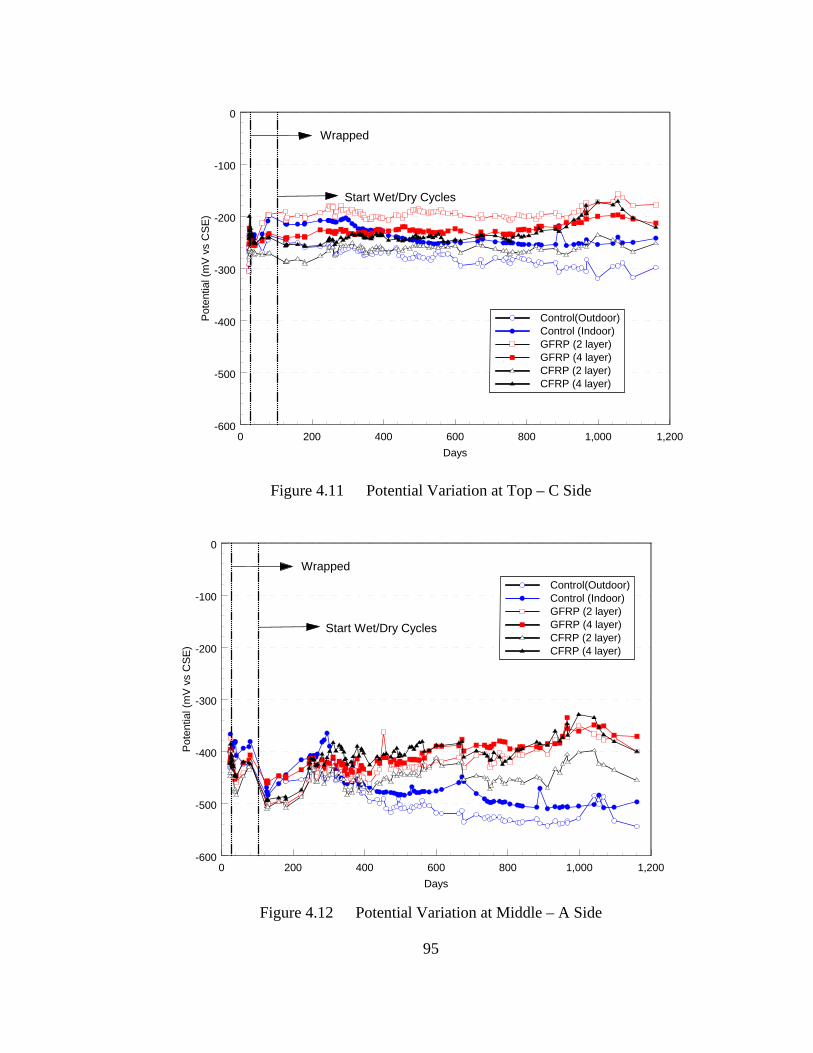
95
0 200 400 600 800 1,000 1,200Days
-600
-500
-400
-300
-200
-100
0
Pote
ntia
l (m
V vs
CSE
)
Control(Outdoor)Control (Indoor)GFRP (2 layer)GFRP (4 layer)CFRP (2 layer)CFRP (4 layer)
Wrapped
Start Wet/Dry Cycles
0 200 400 600 800 1,000 1,200Days
-600
-500
-400
-300
-200
-100
0
Pote
ntia
l (m
V vs
CSE
)
Control(Outdoor)Control (Indoor)GFRP (2 layer)GFRP (4 layer)CFRP (2 layer)CFRP (4 layer)
Wrapped
Start Wet/Dry Cycles
Figure 4.11 Potential Variation at Top – C Side
Figure 4.12 Potential Variation at Middle – A Side
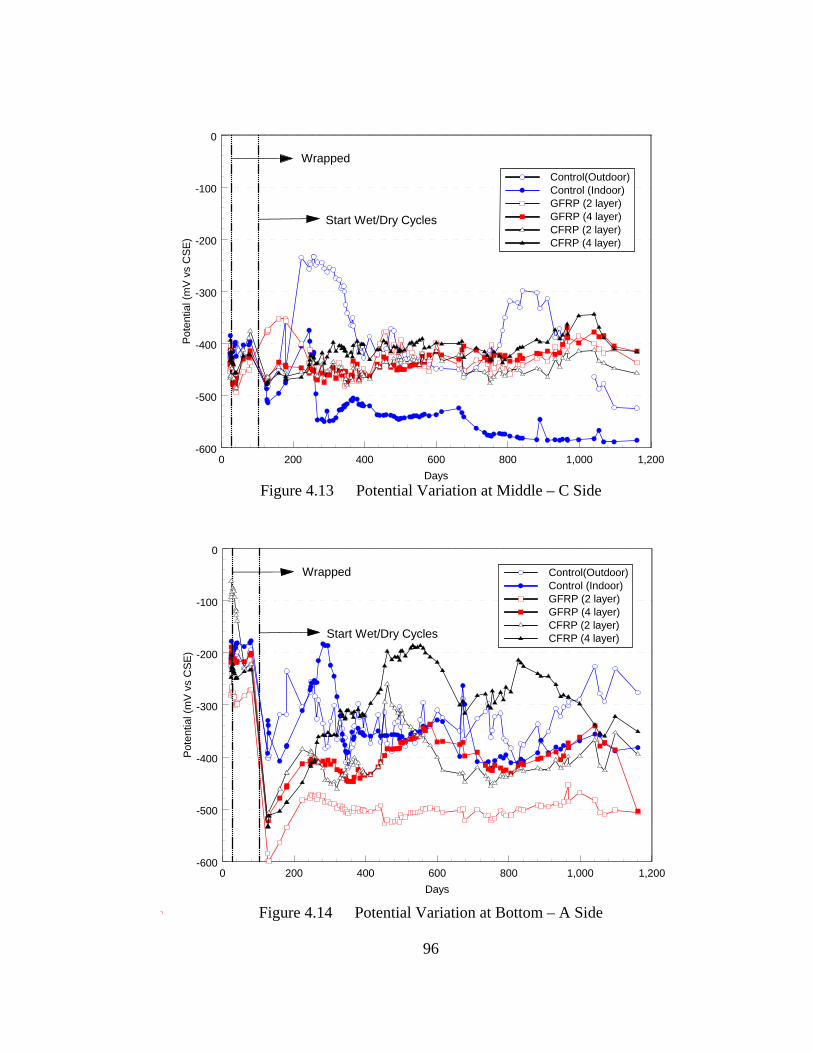
96
0 200 400 600 800 1,000 1,200Days
-600
-500
-400
-300
-200
-100
0
Pote
ntia
l (m
V vs
CSE
)Control(Outdoor)Control (Indoor)GFRP (2 layer)GFRP (4 layer)CFRP (2 layer)CFRP (4 layer)
Wrapped
Start Wet/Dry Cycles
0 200 400 600 800 1,000 1,200Days
-600
-500
-400
-300
-200
-100
0
Pote
ntia
l (m
V vs
CSE
)
Control(Outdoor)Control (Indoor)GFRP (2 layer)GFRP (4 layer)CFRP (2 layer)CFRP (4 layer)
Wrapped
Start Wet/Dry Cycles
Figure 4.13 Potential Variation at Middle – C Side
Figure 4.14 Potential Variation at Bottom – A Side
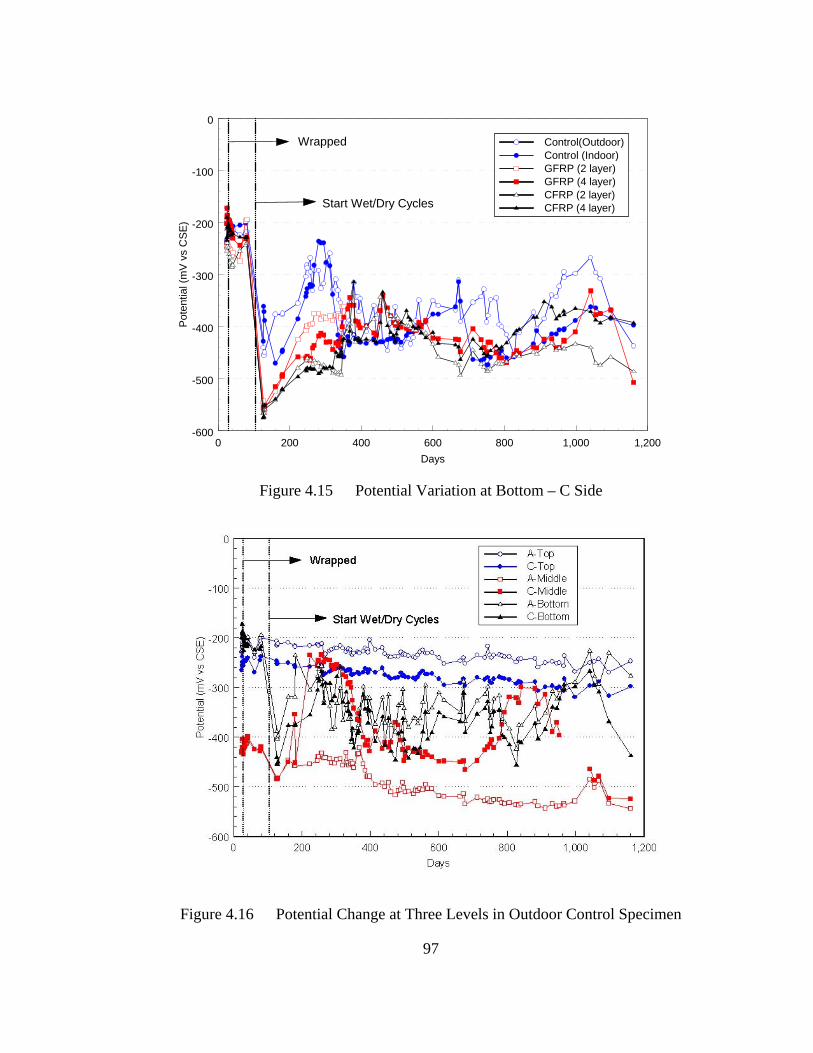
97
0 200 400 600 800 1,000 1,200Days
-600
-500
-400
-300
-200
-100
0
Pote
ntia
l (m
V vs
CSE
)
Control(Outdoor)Control (Indoor)GFRP (2 layer)GFRP (4 layer)CFRP (2 layer)CFRP (4 layer)
Wrapped
Start Wet/Dry Cycles
Figure 4.15 Potential Variation at Bottom – C Side
Figure 4.16 Potential Change at Three Levels in Outdoor Control Specimen
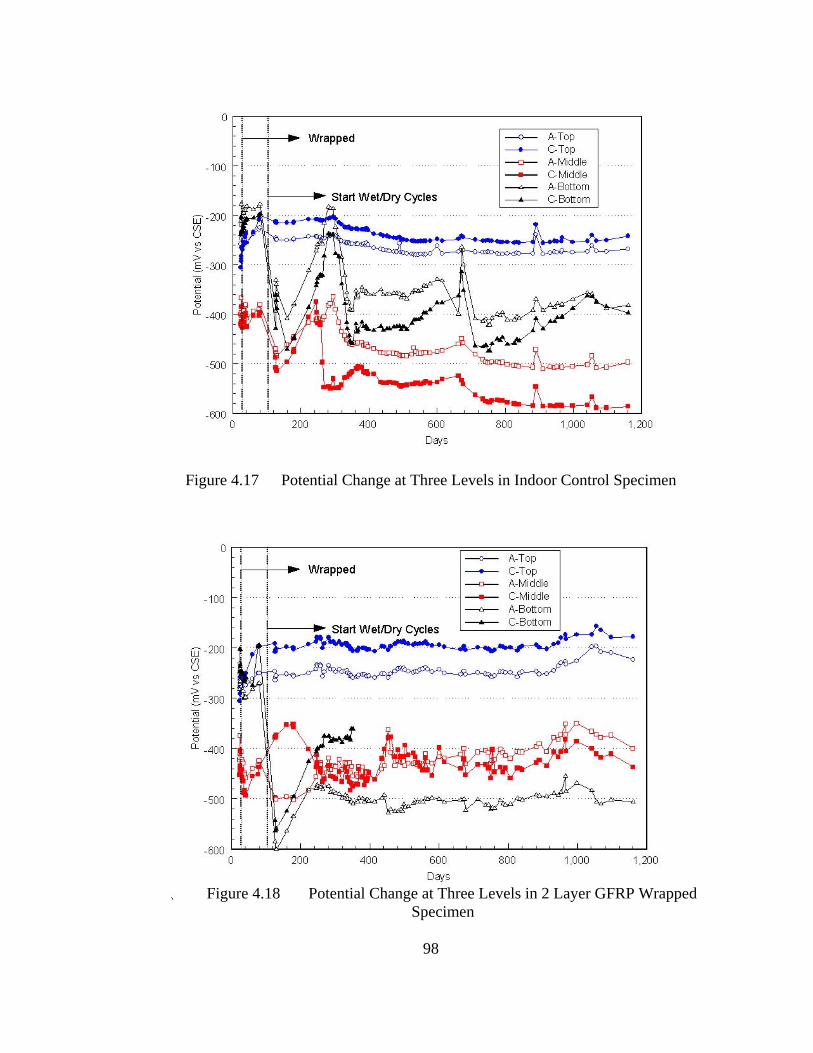
98
Figure 4.17 Potential Change at Three Levels in Indoor Control Specimen
Figure 4.18 Potential Change at Three Levels in 2 Layer GFRP Wrapped Specimen
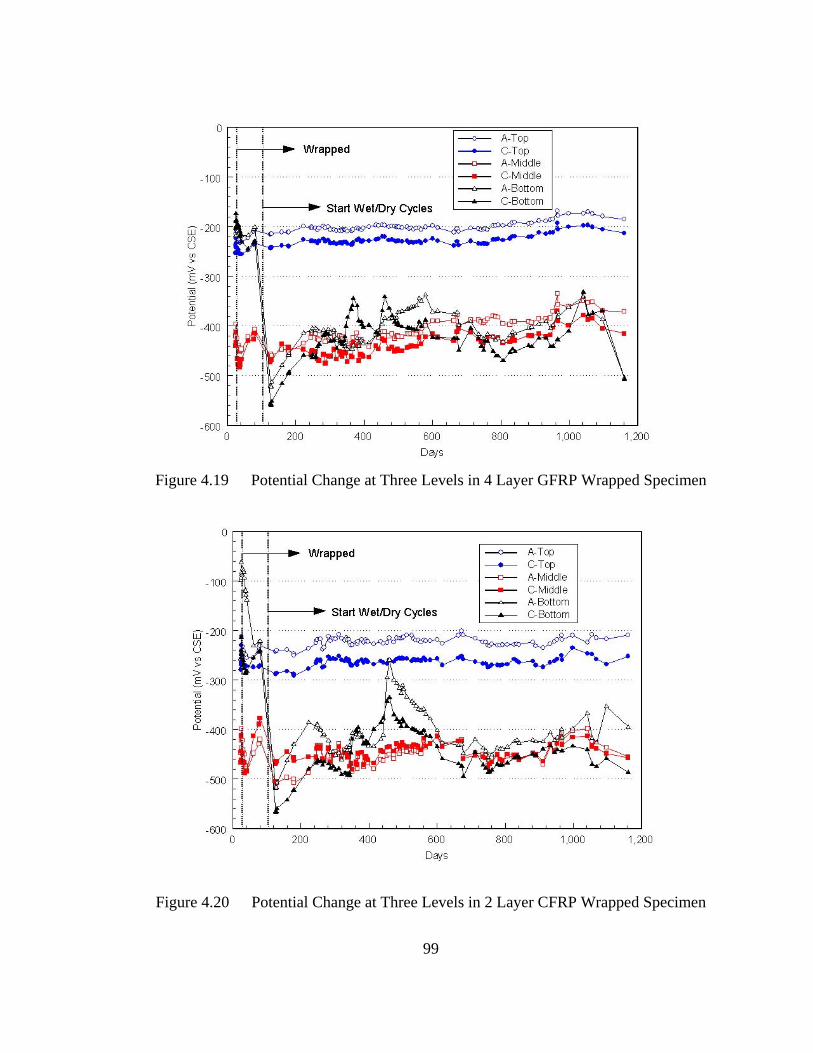
99
Figure 4.19 Potential Change at Three Levels in 4 Layer GFRP Wrapped Specimen
Figure 4.20 Potential Change at Three Levels in 2 Layer CFRP Wrapped Specimen
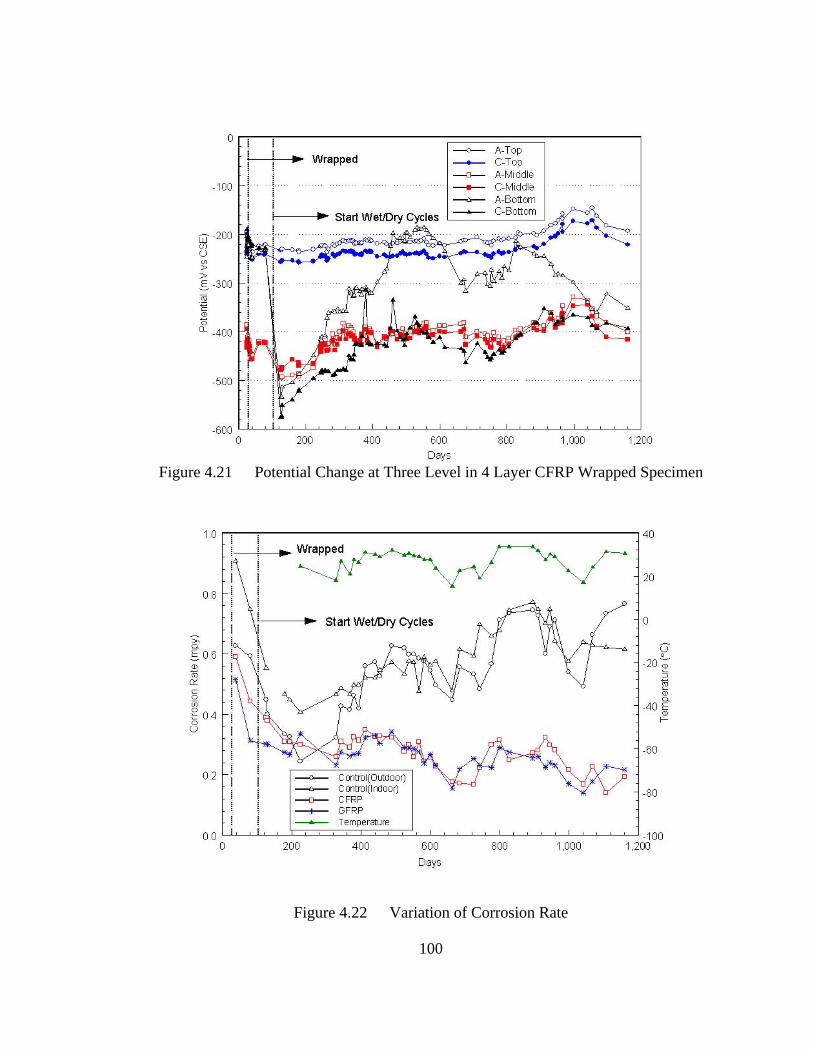
100
Figure 4.21 Potential Change at Three Level in 4 Layer CFRP Wrapped Specimen
Figure 4.22 Variation of Corrosion Rate
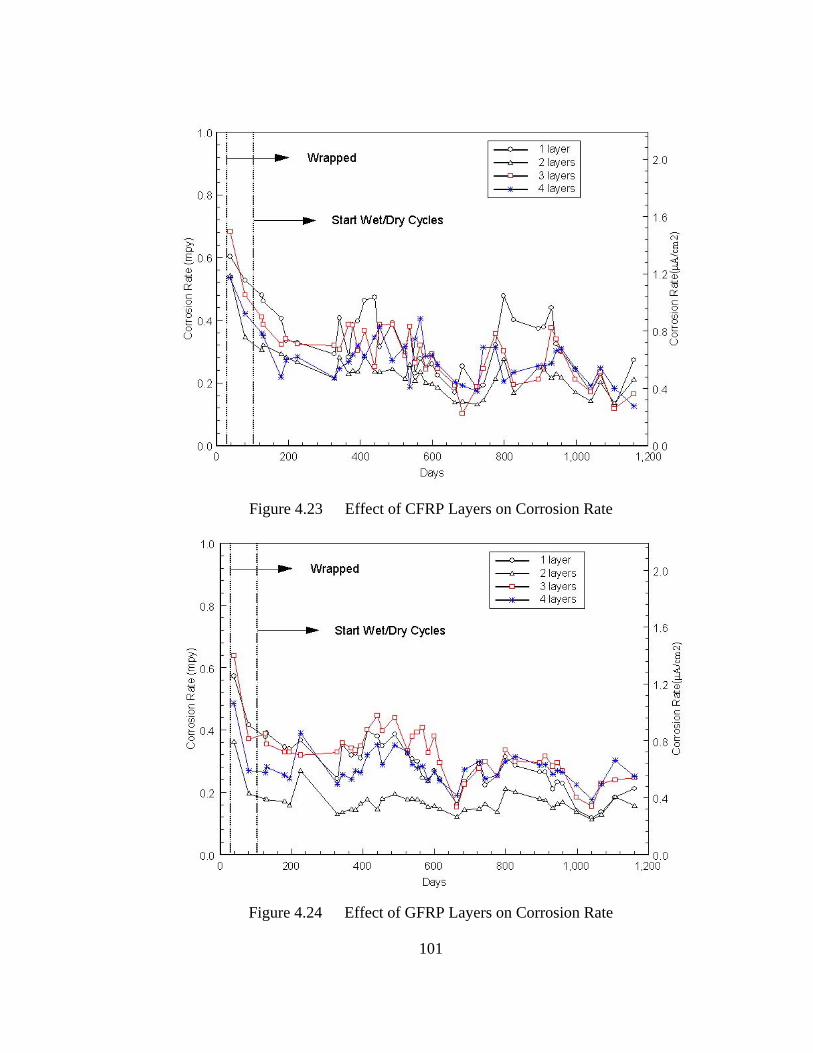
101
Figure 4.23 Effect of CFRP Layers on Corrosion Rate
Figure 4.24 Effect of GFRP Layers on Corrosion Rate
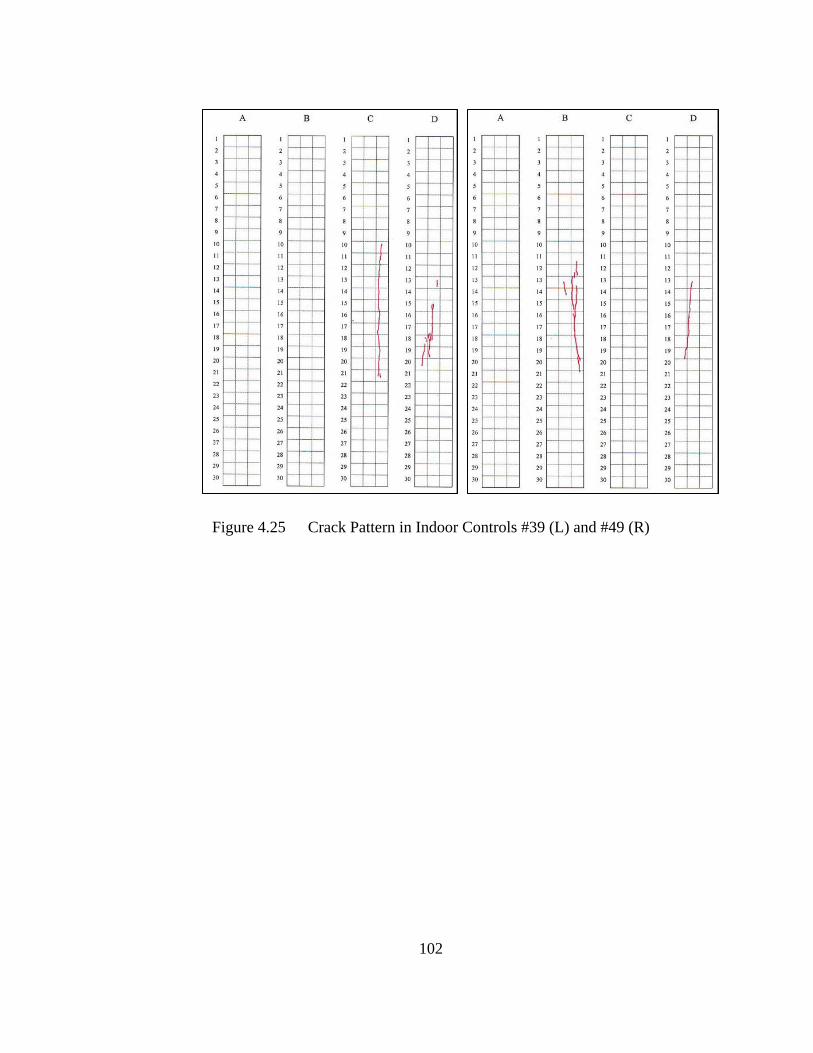
102
Figure 4.25 Crack Pattern in Indoor Controls #39 (L) and #49 (R)
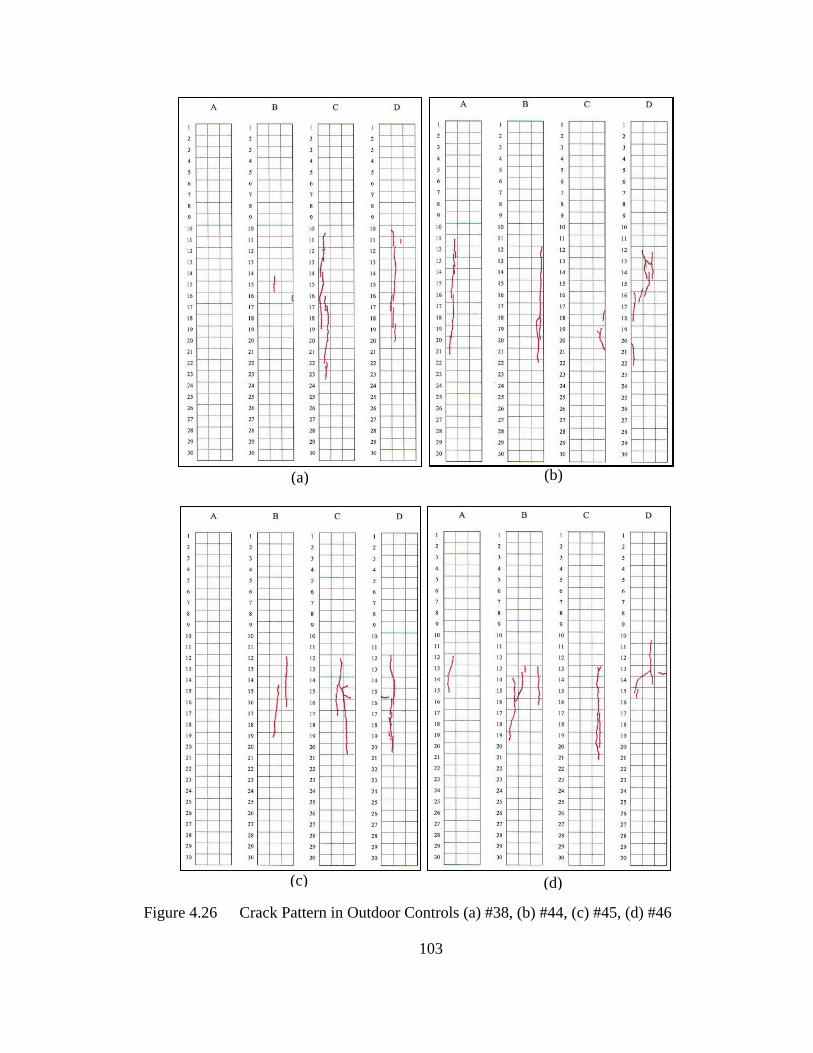
103
Figure 4.26 Crack Pattern in Outdoor Controls (a) #38, (b) #44, (c) #45, (d) #46
(a) (b)
(c) (d)
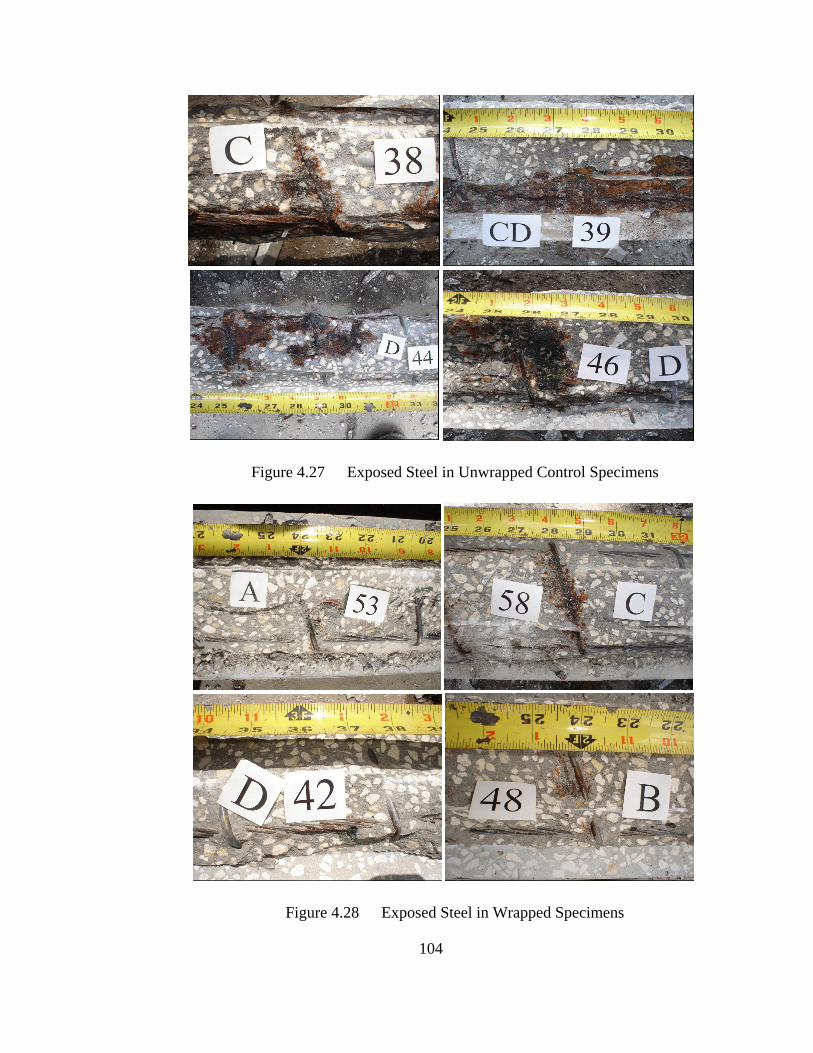
104
Figure 4.27 Exposed Steel in Unwrapped Control Specimens
Figure 4.28 Exposed Steel in Wrapped Specimens
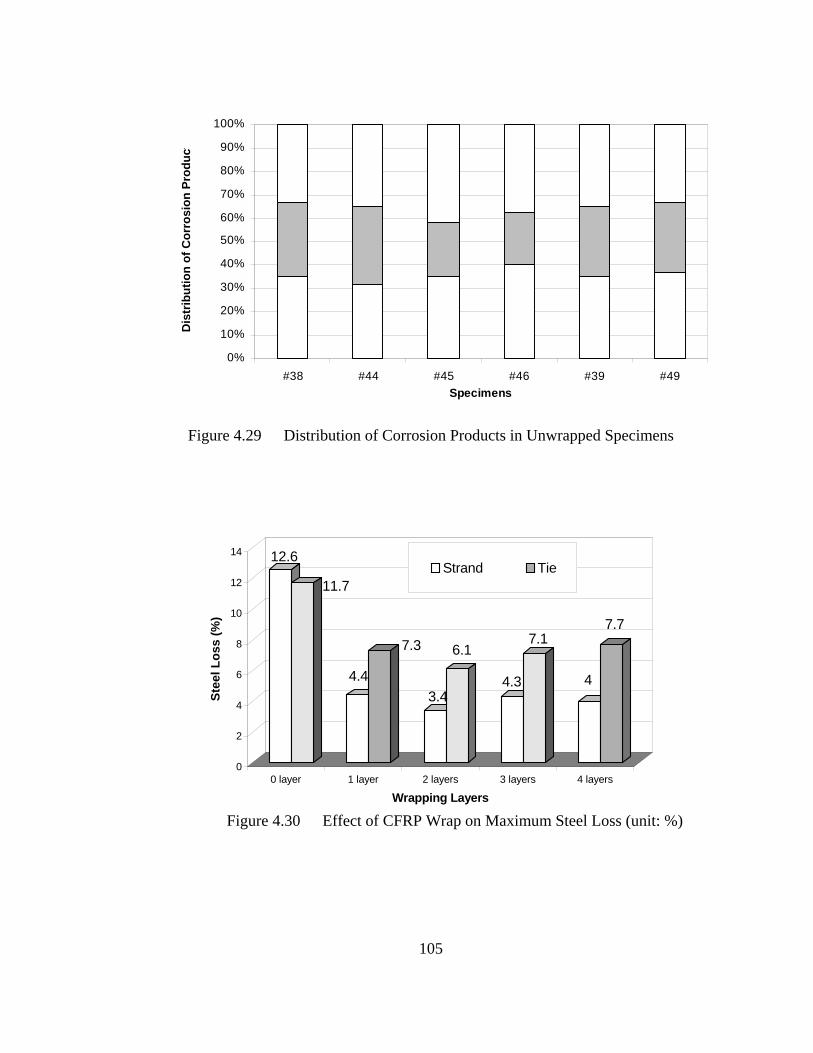
105
0%
10%
20%
30%
40%
50%
60%
70%
80%
90%
100%
#38 #44 #45 #46 #39 #49Specimens
Dis
trib
utio
n of
Cor
rosi
on P
rodu
ct
12.6
11.7
4.4
7.3
3.4
6.1
4.3
7.1
4
7.7
0
2
4
6
8
10
12
14
Stee
l Los
s (%
)
0 layer 1 layer 2 layers 3 layers 4 layers
Wrapping Layers
Strand Tie
Figure 4.29 Distribution of Corrosion Products in Unwrapped Specimens
Figure 4.30 Effect of CFRP Wrap on Maximum Steel Loss (unit: %)
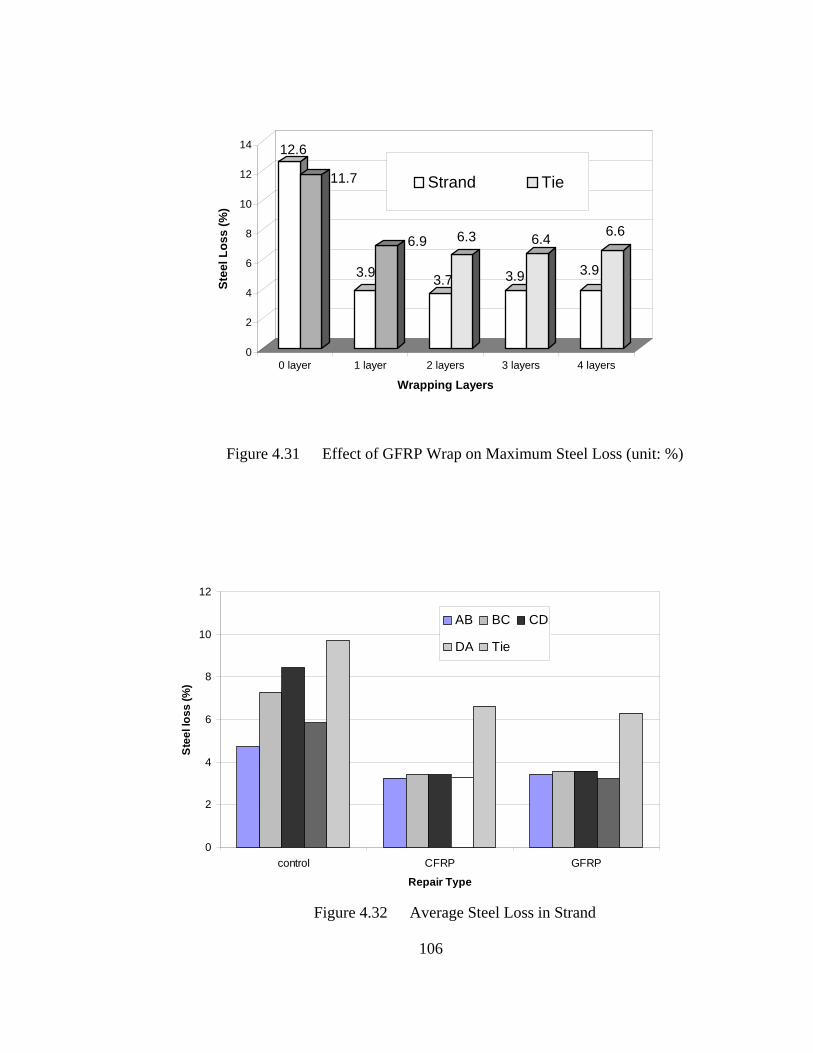
106
12.6
11.7
3.9
6.9
3.7
6.3
3.9
6.4
3.9
6.6
0
2
4
6
8
10
12
14
Stee
l Los
s (%
)
0 layer 1 layer 2 layers 3 layers 4 layers
Wrapping Layers
Strand Tie
0
2
4
6
8
10
12
control CFRP GFRP
Repair Type
Ste
el lo
ss (%
)
AB BC CD
DA Tie
Figure 4.31 Effect of GFRP Wrap on Maximum Steel Loss (unit: %)
Figure 4.32 Average Steel Loss in Strand
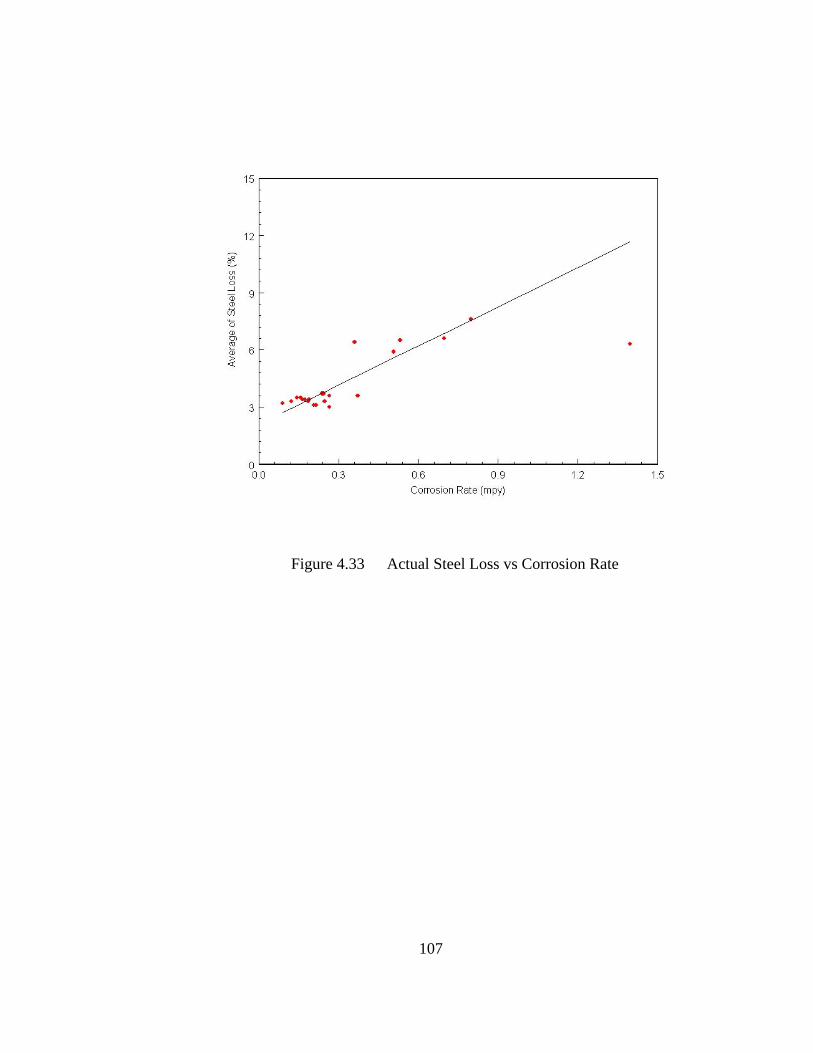
107
Figure 4.33 Actual Steel Loss vs Corrosion Rate
108
CHAPTER 5
FRP REPAIR AFTER CORROSION
5.1 Overview
The economics of using FRP is strongly influenced by surface preparation. If too
much surface preparation is required for the FRP repair to be effective, costs are
inevitably higher. If too little surface preparation is carried out and performance is poor,
FRP is unlikely to be used. For this reason it is important to establish the role of surface
preparation in FRP repair efficiency through strength and gravimetric testing.
The parameters investigated in this study were based on practices used in earlier
demonstration projects. In some instances, pre-wrap repairs were kept to a minimum, e.g.
only cracks were sealed whereas in others, elaborate procedures were followed for
repairing corrosion damage. Additionally, as there had been reports that moisture ingress
through the top of a specimen could be detrimental, the effect of sealing the top of a
member was investigated. Finally, the performance of full vs partial wrap was evaluated.
A total of 26 prestressed concrete specimens were used in this study (Table 5.1).
In addition, another specimen (#11) from the underwater wrapping study was used to
establish metal loss prior to wrapping through gravimetric testing. All specimens were
chloride contaminated over a 22in length during casting to accelerate corrosion of steel.
Ten of the specimens were 6ft and the remaining sixteen, 5ft. The 6ft specimens were
earmarked for strength testing at the end of the exposure period while the 5ft specimens
109
were used for verifying steel loss through gravimetric testing. Four of the
specimens were unwrapped controls whereas the remaining twenty two were wrapped
with 1 to 3 layers of carbon fiber.
The specimens were initially subjected to a constant current accelerated corrosion
regime for 125 days to attain a targeted metal loss of 25%. Of the 22 specimens that were
repaired using FRP, only five specimens - two 6ft (#30, #31) and three 5ft (#62, #63 and
#64) were given “full” repairs. In such repairs, the chloride contaminated concrete was
removed, the strands cleaned, bonding agents applied and new material used to re-form
the section. Subsequently, the repaired section was wrapped using two CFRP layers over
36 in. length in the middle. For the other 17 specimens wrapped, surface preparation was
limited to sealing the cracks using epoxy. Different wrapping schemes used are listed in
Table 5.1.
5.2 Test Program
5.2.1 Corrosion Acceleration
As the other laboratory studies, all 26 specimens were exposed to a constant
current accelerated corrosion scheme. A 110mA current was impressed for 125 days to
attain the 25% targeted steel loss.
5.2.2 Surface Preparation
After the targeted corrosion exposure, a total of 22 specimens including eight 6ft
specimens and fourteen 5ft specimens were wrapped using carbon fiber. Four other
unwrapped specimens served as controls. Prior to application of wrapping, two different
surface preparation methods – full and minimal – were conducted for selected specimens.
For full surface preparation, specimens were thoroughly cleaned as required for
110
conventional corrosion repair excepting that chloride contaminated concrete was not
removed from under the strands since this could result in failure of the specimens.
Deteriorated concrete was removed, embedded strands cleaned, a corrosion inhibitor
applied and the section re-formed using repair material. For the minimal surface
preparation, only the surface of the concrete was cleaned and all cracks sealed using
epoxy. Following FRP wrapping, the concrete surface in selected specimens was sealed
Full Surface Preparation
Three 5ft specimens (#62, #63 and #64) and two 6ft specimens (#30 and #31)
were fully repaired prior to wrapping. The procedure used was as follows:
Contaminated concrete was chipped out using an air chisel connected to an air
compressor (Fig. 5.1). The delaminated concrete cover was completely removed to
expose all the prestressing strands and ties. Some of steel ties were severely corroded and
broke off easily. All concrete surfaces and strands were cleaned using sand blasting.
Dust and debris were removed by compressed air and strands were cleaned again using
acetone (Fig. 5.2)
After sandblasting, Sika Armatec 110 EpoCem manufactured by Sika Corporation
was applied as a corrosion inhibitor. The purpose of applying the corrosion inhibitor was
to protect the steel from water and chloride penetration. Sika Armatec 110 EpoCem is
composed of epoxy-resin (component A), polyamine (component B), and a blend of
Portland cements and sands (component C). It acted not only as a corrosion inhibitor, but
also as a bonding agent to facilitate bond of the repair material to the existing hardened
concrete. The application procedure was as follows (Fig. 5.3).
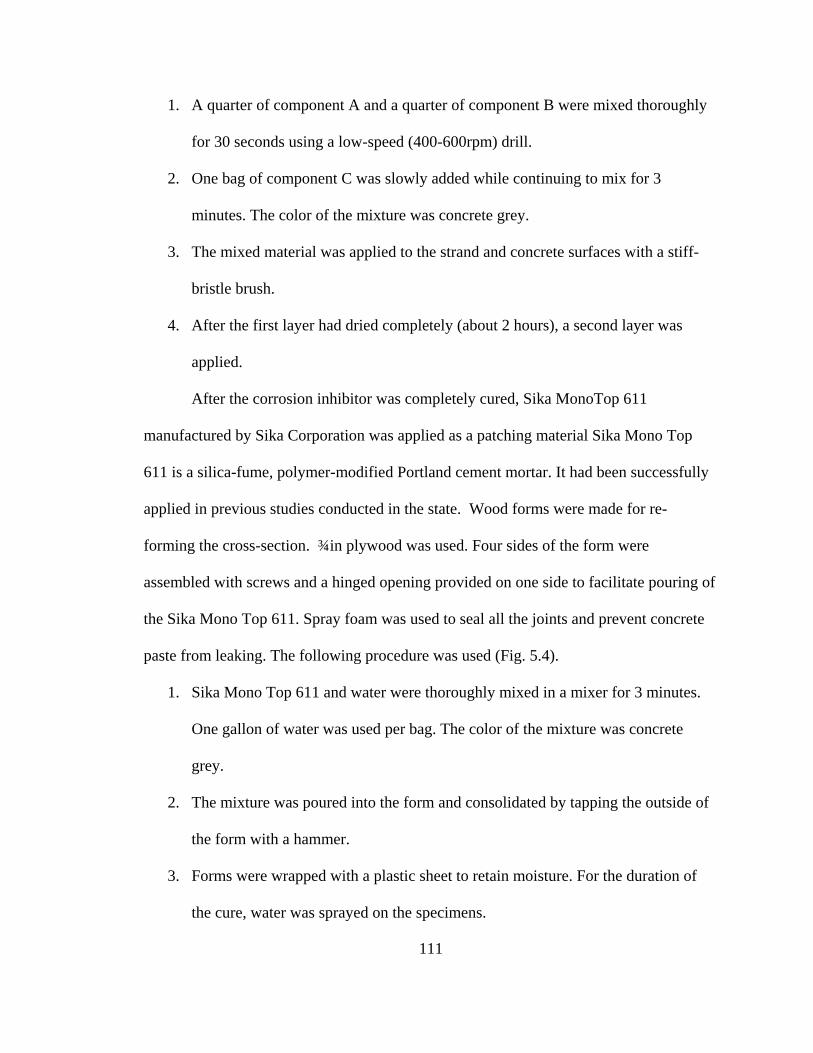
111
1. A quarter of component A and a quarter of component B were mixed thoroughly
for 30 seconds using a low-speed (400-600rpm) drill.
2. One bag of component C was slowly added while continuing to mix for 3
minutes. The color of the mixture was concrete grey.
3. The mixed material was applied to the strand and concrete surfaces with a stiff-
bristle brush.
4. After the first layer had dried completely (about 2 hours), a second layer was
applied.
After the corrosion inhibitor was completely cured, Sika MonoTop 611
manufactured by Sika Corporation was applied as a patching material Sika Mono Top
611 is a silica-fume, polymer-modified Portland cement mortar. It had been successfully
applied in previous studies conducted in the state. Wood forms were made for re-
forming the cross-section. ¾in plywood was used. Four sides of the form were
assembled with screws and a hinged opening provided on one side to facilitate pouring of
the Sika Mono Top 611. Spray foam was used to seal all the joints and prevent concrete
paste from leaking. The following procedure was used (Fig. 5.4).
1. Sika Mono Top 611 and water were thoroughly mixed in a mixer for 3 minutes.
One gallon of water was used per bag. The color of the mixture was concrete
grey.
2. The mixture was poured into the form and consolidated by tapping the outside of
the form with a hammer.
3. Forms were wrapped with a plastic sheet to retain moisture. For the duration of
the cure, water was sprayed on the specimens.
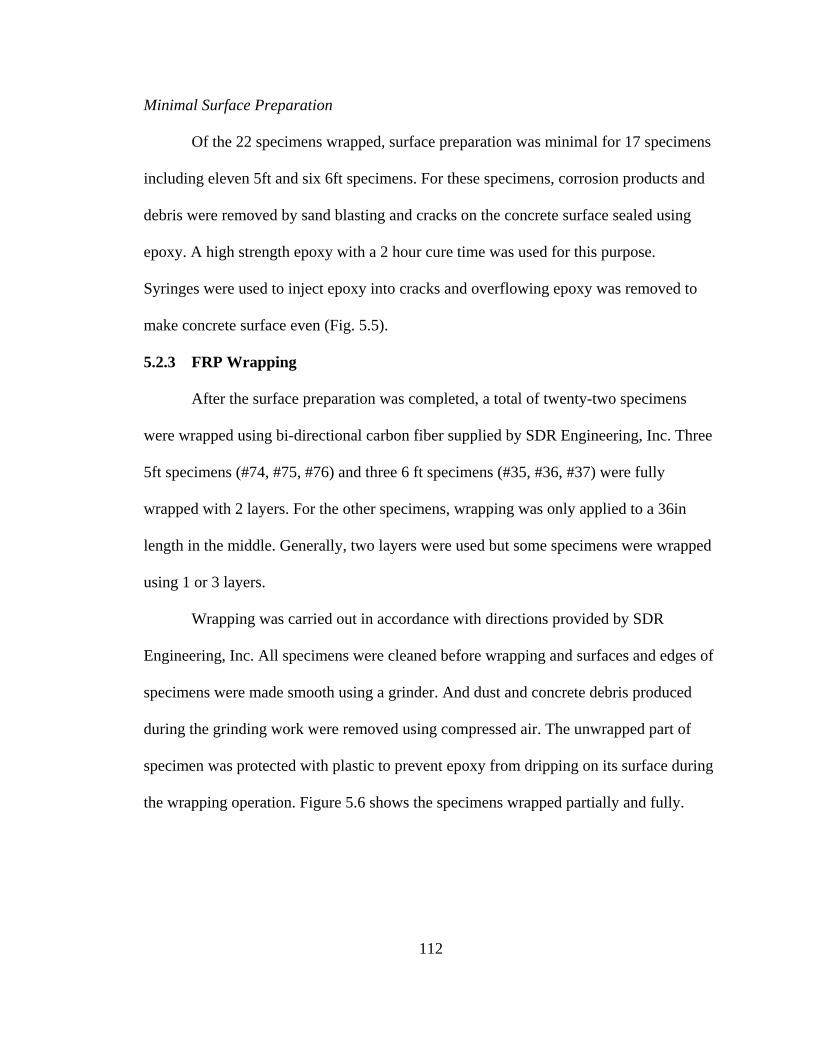
112
Minimal Surface Preparation
Of the 22 specimens wrapped, surface preparation was minimal for 17 specimens
including eleven 5ft and six 6ft specimens. For these specimens, corrosion products and
debris were removed by sand blasting and cracks on the concrete surface sealed using
epoxy. A high strength epoxy with a 2 hour cure time was used for this purpose.
Syringes were used to inject epoxy into cracks and overflowing epoxy was removed to
make concrete surface even (Fig. 5.5).
5.2.3 FRP Wrapping
After the surface preparation was completed, a total of twenty-two specimens
were wrapped using bi-directional carbon fiber supplied by SDR Engineering, Inc. Three
5ft specimens (#74, #75, #76) and three 6 ft specimens (#35, #36, #37) were fully
wrapped with 2 layers. For the other specimens, wrapping was only applied to a 36in
length in the middle. Generally, two layers were used but some specimens were wrapped
using 1 or 3 layers.
Wrapping was carried out in accordance with directions provided by SDR
Engineering, Inc. All specimens were cleaned before wrapping and surfaces and edges of
specimens were made smooth using a grinder. And dust and concrete debris produced
during the grinding work were removed using compressed air. The unwrapped part of
specimen was protected with plastic to prevent epoxy from dripping on its surface during
the wrapping operation. Figure 5.6 shows the specimens wrapped partially and fully.
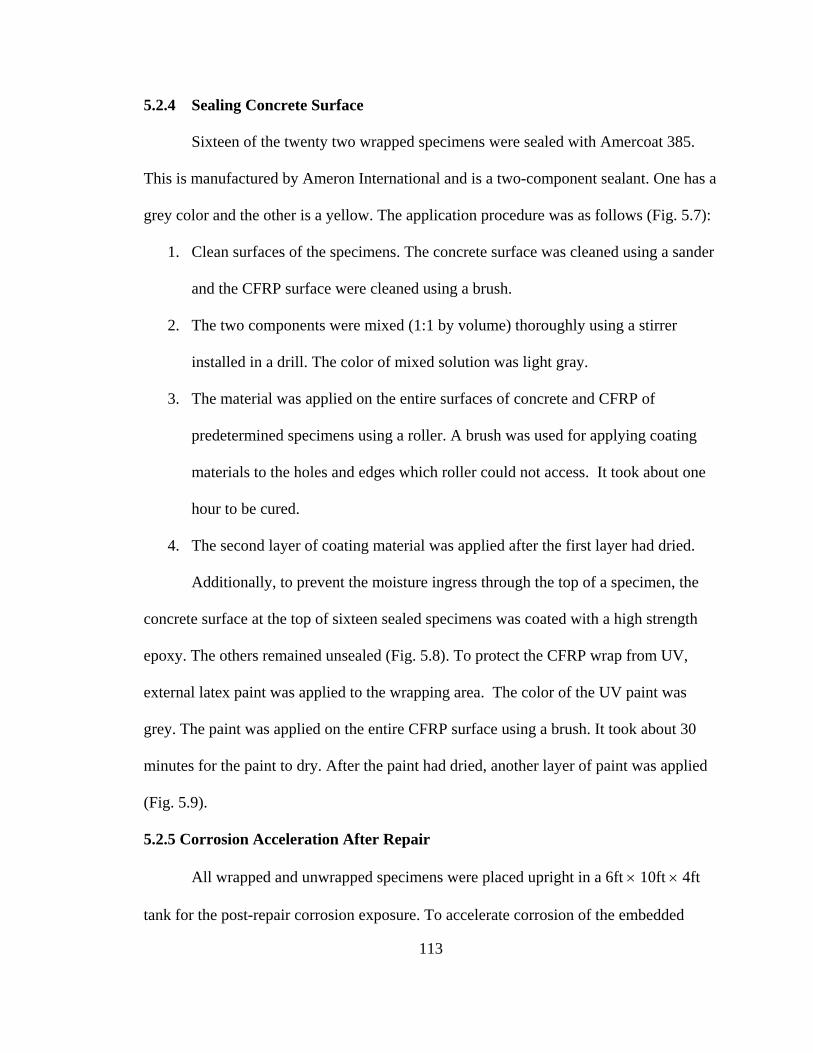
113
5.2.4 Sealing Concrete Surface
Sixteen of the twenty two wrapped specimens were sealed with Amercoat 385.
This is manufactured by Ameron International and is a two-component sealant. One has a
grey color and the other is a yellow. The application procedure was as follows (Fig. 5.7):
1. Clean surfaces of the specimens. The concrete surface was cleaned using a sander
and the CFRP surface were cleaned using a brush.
2. The two components were mixed (1:1 by volume) thoroughly using a stirrer
installed in a drill. The color of mixed solution was light gray.
3. The material was applied on the entire surfaces of concrete and CFRP of
predetermined specimens using a roller. A brush was used for applying coating
materials to the holes and edges which roller could not access. It took about one
hour to be cured.
4. The second layer of coating material was applied after the first layer had dried.
Additionally, to prevent the moisture ingress through the top of a specimen, the
concrete surface at the top of sixteen sealed specimens was coated with a high strength
epoxy. The others remained unsealed (Fig. 5.8). To protect the CFRP wrap from UV,
external latex paint was applied to the wrapping area. The color of the UV paint was
grey. The paint was applied on the entire CFRP surface using a brush. It took about 30
minutes for the paint to dry. After the paint had dried, another layer of paint was applied
(Fig. 5.9).
5.2.5 Corrosion Acceleration After Repair
All wrapped and unwrapped specimens were placed upright in a 6ft × 10ft × 4ft
tank for the post-repair corrosion exposure. To accelerate corrosion of the embedded
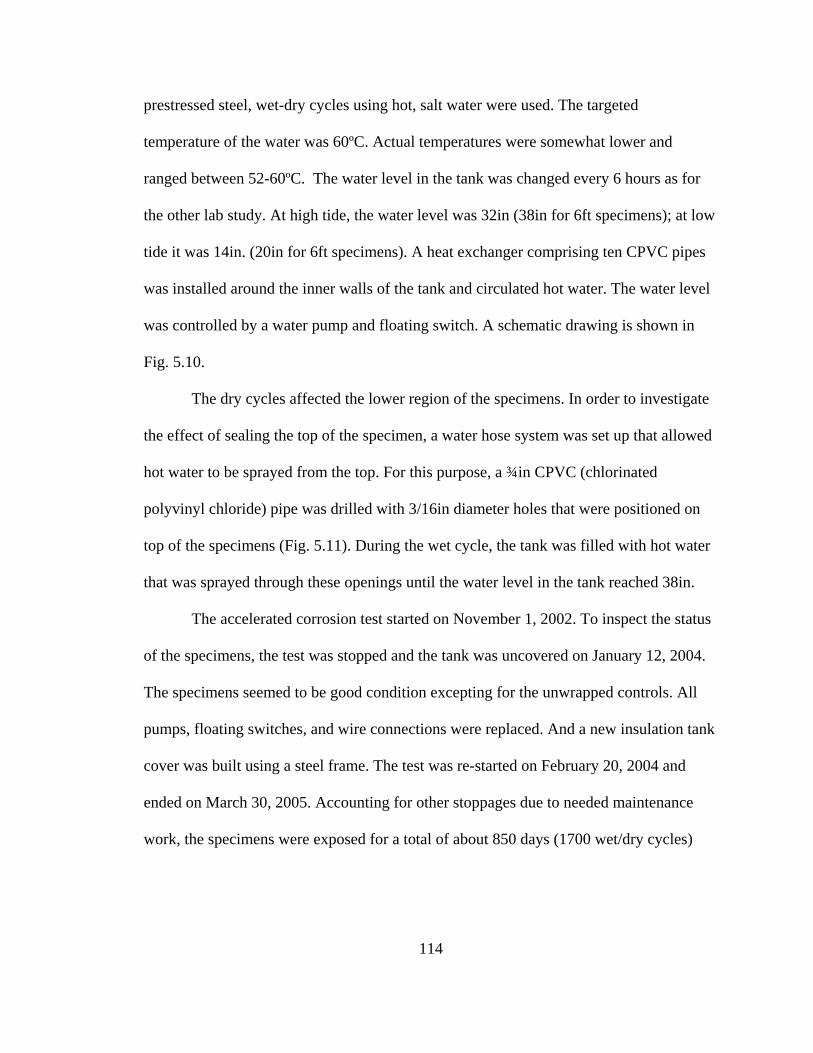
114
prestressed steel, wet-dry cycles using hot, salt water were used. The targeted
temperature of the water was 60ºC. Actual temperatures were somewhat lower and
ranged between 52-60ºC. The water level in the tank was changed every 6 hours as for
the other lab study. At high tide, the water level was 32in (38in for 6ft specimens); at low
tide it was 14in. (20in for 6ft specimens). A heat exchanger comprising ten CPVC pipes
was installed around the inner walls of the tank and circulated hot water. The water level
was controlled by a water pump and floating switch. A schematic drawing is shown in
Fig. 5.10.
The dry cycles affected the lower region of the specimens. In order to investigate
the effect of sealing the top of the specimen, a water hose system was set up that allowed
hot water to be sprayed from the top. For this purpose, a ¾in CPVC (chlorinated
polyvinyl chloride) pipe was drilled with 3/16in diameter holes that were positioned on
top of the specimens (Fig. 5.11). During the wet cycle, the tank was filled with hot water
that was sprayed through these openings until the water level in the tank reached 38in.
The accelerated corrosion test started on November 1, 2002. To inspect the status
of the specimens, the test was stopped and the tank was uncovered on January 12, 2004.
The specimens seemed to be good condition excepting for the unwrapped controls. All
pumps, floating switches, and wire connections were replaced. And a new insulation tank
cover was built using a steel frame. The test was re-started on February 20, 2004 and
ended on March 30, 2005. Accounting for other stoppages due to needed maintenance
work, the specimens were exposed for a total of about 850 days (1700 wet/dry cycles)
115
5.3 Test Results
When the targeted exposure time was reached, all specimens were taken out of the
tank, and tests were conducted to evaluate their corrosion statues. As shown in Fig. 5.12,
unwrapped controls appeared to be severely corroded while the wrapped specimens were
in good condition judging from external appearances. Crack surveys were performed on
the four unwrapped controls (two 5ft and two 6ft) to determine the progression of cracks
due to exposure. Sixteen 5ft specimens (14 wrapped and 2 controls) were then
gravimetrically tested. Eccentric load test was conducted on the remaining ten (8
wrapped and 2 controls) 6ft specimens.
5.3.1 Crack Survey
Crack surveys were conducted on the two 5ft (#60 and #61) and the two 6ft
controls (#28 and #29). Results are summarized in Table 5.2. The size and length of the
cracks were very similar in both the 5ft and 6ft specimens. The maximum crack width
varied from 2.5mm to 3mm and the maximum crack length ranged from 35in. to 39in.
Fig. 5.13–5.16 show the change in crack pattern on the unwrapped control
specimens before and after exposure to simulated hot water tidal cycles. As expected,
cracks were concentrated in the middle (the chloride contaminated region) and
propagated to the lower part of the specimens. Transverse cracks were found on every
face of the 5ft specimens and the concrete surface was delaminated.
5.3.2 Eccentric Load Test
A total of ten 6ft specimens including two unwrapped controls and eight wrapped
ones were tested under eccentric load to establish strength loss due to exposure. The
compressive strength of concrete measured right before the eccentric load test was 9ksi
116
and 7.8ksi respectively for regular concrete and chloride contaminated concrete (Fig.
5.17).
Unwrapped Controls
Fig. 5.18 shows the setup and the failure mode for the two unwrapped controls
(#28 and #29). Both specimens failed in the middle area, and their failure modes were
similar. The ultimate load capacities of #28 and #29 specimens were 61.7kips and
61.4kips. From the failed section, it appeared that remained tie was very little. and most
strands were completely corroded in the middle of specimens. Fig. 5.19 shows a plot of
the lateral deflection with load at mid span for both the specimens. Their ultimate load
capacity was almost half of their original capacity (0% steel loss). Plots showing the
strain variation with load are presented in Fig. 5.20.
Full Repair/2layer/36in/CFRP
Two 6ft specimens (#30 and #31) were fully repaired before CFRP wrapping.
The deteriorated concrete was removed, corroded steel cleaned and coated with a
corrosion inhibitor, and special patching material applied to re-form the cross-section.
After the patch had cured, the two specimens were wrapped in the middle with 2 layers of
CFRP. The exposed concrete was sealed. The failure modes for specimens #30 and #31
are shown in Fig. 5.21. In both cases, premature failure occurred unexpectedly at the
ends. The plot of the lateral deflection and strain with load at mid span is presented in
Fig. 5.22-23. The maximum loads were 79.1kips and 106.4kips, respectively. In these
specimens only cracks on the surface concrete were sealed with epoxy prior to wrap with
two layers of CFRP on the center (36in length). The exposed concrete surface of
specimens #32 and #33 was sealed while specimen #34 was left unsealed.
117
Minimal Repair/2 layer/ 36in CFRP
Fig. 5.24 shows the failure modes of #32 and #34 specimens. As in the previous
case, end failure occurred in specimens #32 and #33 at 97.1kips and 87.3kips,
respectively. However, specimen #34 failed at mid span at an ultimate load of 96.2kips.
Exposed ties appeared to have corroded completely but strands were intact. The plot of
mid-span lateral deflection and stain variation with load for all three specimens is shown
in Figs. 5.25-26.
Minimal Repair/ 2 layer/ 72in CFRP
Another three specimens (#35, #36, and #37) were identical to the ones reported
in the previous section except that the CFRP wrap was applied over the entire length. The
exposed concrete in specimens #35 and #36 was sealed while that in #37 specimen was
not sealed. The failure mode of the tested specimens is shown in Fig. 5.27. Failure
occurred in the chloride contaminated region at mid span in all three specimens. The
CFRP was ruptured in the lateral direction on the tension side and it ripped in both the
lateral and longitudinal directions on the compression side. The ultimate load capacity
was 96.6kips, 84.5kips and 88.5kips for #35, #36 and #37, respectively. The sealing
appeared to have little or no effect on strength. Fig. 5.28 shows variation in the mid-span
lateral deflection with load in all three specimens. In contrast to specimens wrapped over
a 36 in. length, the fully wrapped specimens showed larger deformation at failure. Plots
showing the strain variation with load are presented in 5.29.
The ultimate load capacities for all the specimens are summarized in Table 5.3.
Considering that the average ultimate load capacity of unwrapped specimen before the
exposure of hot-water corrosion acceleration was 88.6kips (Table 3.5), the ultimate load
118
capacity of the unwrapped control specimens decreased by 30.6%. However, the
corresponding averaged capacities of the wrapped piles exceeded their original capacity
despite premature failure at the ends in specimens #30, #31, #32 and #33 (Fig. 5.30).
This exposure was extremely severe since specimens were subjected to a steamy,
high temperature environment for over 2 years. Based on the result of load test, it could
be said that FRP bond was effective in increasing the axial load capacity of corroded
piles despite the extreme exposure. The highest capacity was attained with full repair.
The loads could have been higher but for the end failure. However, the epoxy seal did not
affect strength. Full wrap did not increase capacity but improved ductility.
5.3.3 Gravimetric Test
A total of sixteen 5ft specimens including 14 wrapped and 2 unwrapped controls
were gravimetrically tested to measure the actual steel loss due to corrosion and to
evaluate the effectiveness of different repair methods. Of the 14 wrapped specimens,
three were wrapped over the entire length while the remaining 11 were wrapped over 3ft.
In gravimetric testing, the surface concrete was first removed to measure the distribution
of corrosion products and then strands and ties were retrieved. The retrieved strands were
cut to 3ft length. The seven wires that make a strand were carefully disassembled and
after each wire had been cleaned using a wire brush, the strand was re-assembled and its
weight accurately measured to determine metal loss
Since the chloride contaminated length was 22in. all metal losses reported are
averaged over this length for consistency. The crack pattern indicates that some corrosion
occurred outside this region. Thus, the average metal loss reported will be slightly higher.
119
The unwrapped controls were severely corroded and the concrete surface delaminated.
The strands and ties in the middle section in both specimens were completely corroded as
shown in Fig.5.31. This is shown more clearly in Fig. 5.32 which shows the eight
retrieved strands and ties from both these specimens.
Unwrapped Controls
The results from the gravimetric test for these unwrapped controls are
summarized in Table 5.4. The maximum loss in a strand was 86.5% (#61-BC) while the
maximum loss in the tie was 87.4% (#60). The averaged steel losses of strands in #60 and
#61 specimens were 82.3% and 77.9%, respectively.
Full Repair/ 2 layer/ 36in CFRP
For the full repaired specimens, deteriorated concrete was removed, the strands
completely cleaned, coated with corrosion inhibitor, patched, and then wrapped with 2
layers of CFRP over a 36in length. Exposed concrete in the specimens #62 and #63 were
sealed while the specimen #64 was not. Fig. 5.33 shows the retrieved strands and ties.
The total measured steel loss is summarized in Table 5.5. The maximum steel loss in the
strand was 23.4% (#63-DA) and it was 25.1% in the ties. The average steel loss in the
strands was 22%, 22% and 20.7% in #62, #63, and #64, respectively. The metal loss in
the unsealed specimen (#64) was slightly smaller. Note N/A in Table 5.5 for ties signifies
that the ties had corroded before wrapping.
Minimal Repair/ 1 layer/ 36in CFRP
For the specimens #65 and #66, the only cracks were filled with epoxy and one
layer of CFRP was used to wrap over 36in. The maximum metal loss in the strands was
27.3% (#66-BC), and it was 23.9% (#65) in the ties (Table 5.6). The average steel loss in
120
the strands in #65 and #66 were 24.2% and 25.3% respectively. Many wires in the strands
were completely corroded. This was especially the case for specimen #65 in which 93%
of the wires in the strands were broken due to corrosion and #66 where 61% of the wires
were broken.
Minimal Repair/ 2 layer/ 36in CFRP
Specimens #67, #68 and #69 were similar to the previous set except that instead
of one layer, two CFRP layers were used. In addition, a third specimen, #69 was not
sealed with epoxy. The maximum loss in the strands was 24.1% (#67-AB) and it was
24.4% (#69) in the ties (Table 5.7). The average steel loss in the strands was 22.3%
(#67), 20.8% (#68) and 20.3% (#69). The steel loss in the sealed specimens was
marginally higher than that in the unsealed specimen. In the unsealed specimen, 61% of
wires in strands were broken, and 36% (#67) and 46% (#68) of wires were broken in
sealed specimens
Minimal Repair/ 3 layer/ 36in CFRP
Specimens #70, #71 and #72 were identical to the previous set except that three
CFRP layers were bonded to epoxy repaired specimens. The maximum loss in the strands
was 34.4 % (#71-DA), and it was 24.% (#70) in the ties (Table 5.8). The average steel
loss in the strands was 22.4% (#70), 27.6% (#71) and 21% (#72). The steel loss in the
sealed specimens (#70, #71) was higher than that in the unsealed specimen (#72). Forty-
three and Eighty-six percent of wires were disconnected in #43 and #71, respectively. In
unsealed pile, 57% of wires were broken.
121
Minimal Repair/ 2 layer/ 60in CFRP
Specimens #74, #75 and #76 were similar to #67-#69 (2 layers, 36in.) except that
the entire length was wrapped. While exposed surfaces in specimens #74 and #75 were
sealed, #76 was not sealed. The maximum loss in the strands was 24.9% (#76-BC) and it
was 29.3% (#74) in the ties (Table 5.9). The average steel loss in the strands was 22.1%
(#74), 20.7% (#75) and 21.4% (#76). And about 57% and 43% of wires in strands were
broken in specimen #74 and #75, while 46% of wires was disconnected in unsealed
specimen #76.
The maximum incremental steel losses in the strands and ties for the different
repair methods are summarized in Table 5.10. For convenience, only results for the
sealed specimens are shown in this table. Assuming that the maximum steel loss in the
strand and ties in the unwrapped specimens before exposure to the hot-water tidal cycles
was 22.3% and 21.3%, respectively. This gives an incremental loss of 64.2% for the
strand and 66.1% for the tie. Incremental losses for other types of repairs were similarly
determined from the values reported in Tables 5.5-5.9 and are summarized in Table 5.10.
Note these are the averaged losses over the 22in chloride contaminated section.
Fig. 5.34 plots the increase in steel loss in strands in controls and specimens
wrapped with two CFRP layers using data in Table 5.10. Compared to the miniscule
incremental losses in the wrapped specimens, the controls sustained significant (64.2%)
metal loss. This was because the control specimens were cracked. The combination of
full repair and wrap performed best marginally (1.1% increase). And full wrapping was
slightly more effective than the 36in wrapping. However, epoxy repairs were remarkably
effective (1.7% (full - 60in) or 1.8% (partial – 36in) vs 1.1% for full repair).
122
Fig. 5.35 shows the role of the number of CFRP wrap layers in preventing
incremental metal loss in the strands when epoxy repairs were used and the wrap covered
36in. Two layers (1.8%) were more effective than one layer (5%); however, three layers
were less effective (12.1%). This could be because the base level corrosion assumed to be
22.3% was higher. Table 5.11 summarizes information on the number of prestressing
wires that completely corroded as a result of the exposure.
Fig. 5.36 shows the correlation between numbers of broken wires and averaged
actual steel loss. The horizontal axis represents the sum of broken wires in the strands in
each specimen and the vertical axis shows the averaged metal loss of four strands. This
graph shows that all four strands might be completely corroded if the steel loss is over
30%.
5.4 Summary
Based on the information presented in this study the following conclusions can be
drawn:
1. Both the strength and gravimetric test results clearly show that the
performance of the wrapped specimens was vastly superior to the
unwrapped controls even though some of the wrapped specimens failed
prematurely at the ends in the column tests and therefore the true capacity
gain could not be determined. Nonetheless, the capacities of all the
wrapped specimens exceeded the original capacity despite the very severe
environment.
2. While the capacity of the unwrapped piles was 30% less than the original
capacity, this was much higher than that could be expected given its
123
significantly higher metal loss from gravimetric testing. This could be
because the localized metal loss was lower at the critical location where
failure occurred under eccentric loading.
3. The gravimetric tests showed that the wrapped specimens sustained much
lower metal loss compared to the unwrapped controls . This is not
surprising given that the unwrapped specimens were heavily cracked that
allowed corrosion products to be washed away while providing continuous
access to moisture and oxygen. Overall, the results conclusively
demonstrated the effectiveness of FRP in restoring the capacity of severely
corroded specimens.
4. Full repairs required significant amount of surface preparation compared
to the resin injection repair. However, the overall results from both
column and gravimetric testing showed that their performance was
comparable. Photographs of retrieved strands following exposure to 1700
simulated tidal cycles at 60oC from both the full and the resin injection
repair compare favorably with that of the pre-wrap control.
5. The relationship between strength and metal loss due to corrosion is
complex because of the influence of other factors such as the bond
between concrete and deteriorated steel. If bond is adversely affected,
strength reductions can be much lower. Moreover, as the corroded steel is
less ductile, the mode of failure can also be affected. For this reason, the
results of this study are only applicable for steel losses that are within the
range that was measured (22.3% in the strands and 21.3% in the ties) in
124
this study. Should metal loss be higher, alternate strategies, i.e. enlarging
the section may need to be considered.
6. Two other side studies were conducted to compare the effect of full vs.
partial wrap and also the effect of sealing and not sealing the top of the
specimens. The results from the strength tests indicated similar capacities.
The result of gravimetric tests for sealed and unsealed specimens are
comparable for both full and partial wrap, sealed or unsealed. This is
because the chloride contaminated region extended to 22in and the partial
wrap extended 7in above and below this region. Beyond this region not
much corrosion could have taken place.
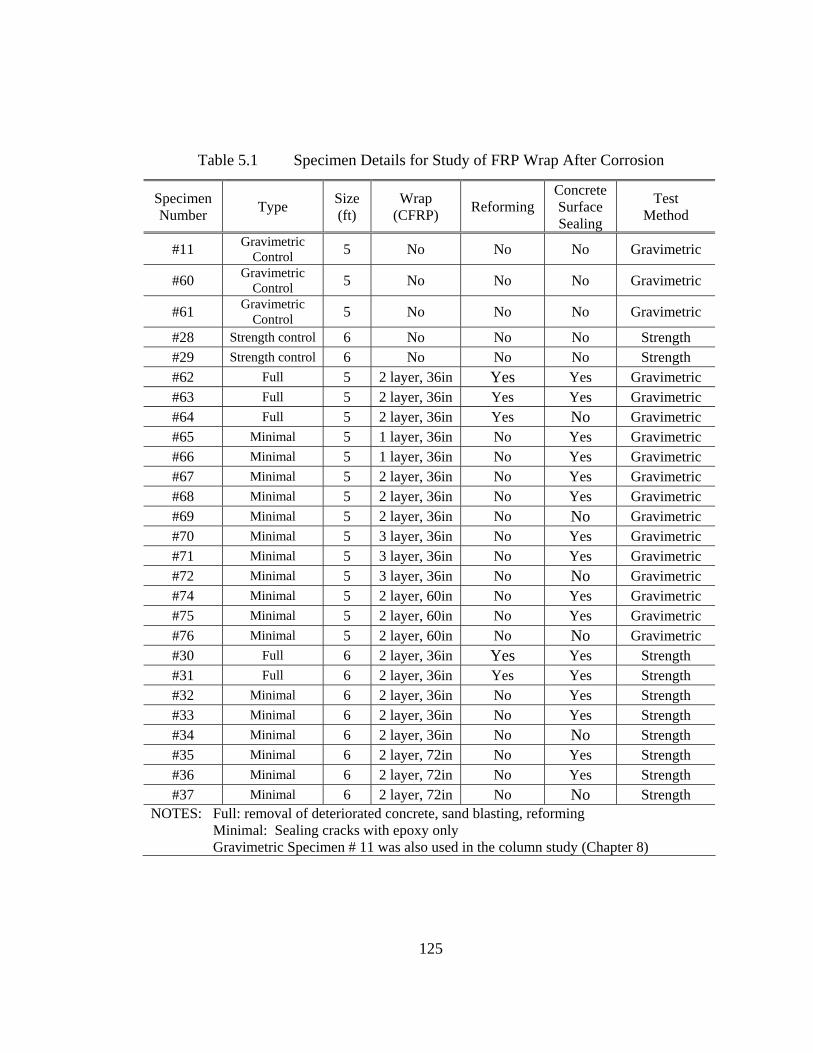
125
Table 5.1 Specimen Details for Study of FRP Wrap After Corrosion
Specimen Number Type Size
(ft) Wrap
(CFRP) Reforming Concrete Surface Sealing
Test Method
#11 Gravimetric Control 5 No No No Gravimetric
#60 Gravimetric Control 5 No No No Gravimetric
#61 Gravimetric Control 5 No No No Gravimetric
#28 Strength control 6 No No No Strength #29 Strength control 6 No No No Strength #62 Full 5 2 layer, 36in Yes Yes Gravimetric #63 Full 5 2 layer, 36in Yes Yes Gravimetric #64 Full 5 2 layer, 36in Yes No Gravimetric #65 Minimal 5 1 layer, 36in No Yes Gravimetric #66 Minimal 5 1 layer, 36in No Yes Gravimetric #67 Minimal 5 2 layer, 36in No Yes Gravimetric #68 Minimal 5 2 layer, 36in No Yes Gravimetric #69 Minimal 5 2 layer, 36in No No Gravimetric #70 Minimal 5 3 layer, 36in No Yes Gravimetric #71 Minimal 5 3 layer, 36in No Yes Gravimetric #72 Minimal 5 3 layer, 36in No No Gravimetric #74 Minimal 5 2 layer, 60in No Yes Gravimetric #75 Minimal 5 2 layer, 60in No Yes Gravimetric #76 Minimal 5 2 layer, 60in No No Gravimetric #30 Full 6 2 layer, 36in Yes Yes Strength #31 Full 6 2 layer, 36in Yes Yes Strength #32 Minimal 6 2 layer, 36in No Yes Strength #33 Minimal 6 2 layer, 36in No Yes Strength #34 Minimal 6 2 layer, 36in No No Strength #35 Minimal 6 2 layer, 72in No Yes Strength #36 Minimal 6 2 layer, 72in No Yes Strength #37 Minimal 6 2 layer, 72in No No Strength
NOTES: Full: removal of deteriorated concrete, sand blasting, reforming Minimal: Sealing cracks with epoxy only Gravimetric Specimen # 11 was also used in the column study (Chapter 8)
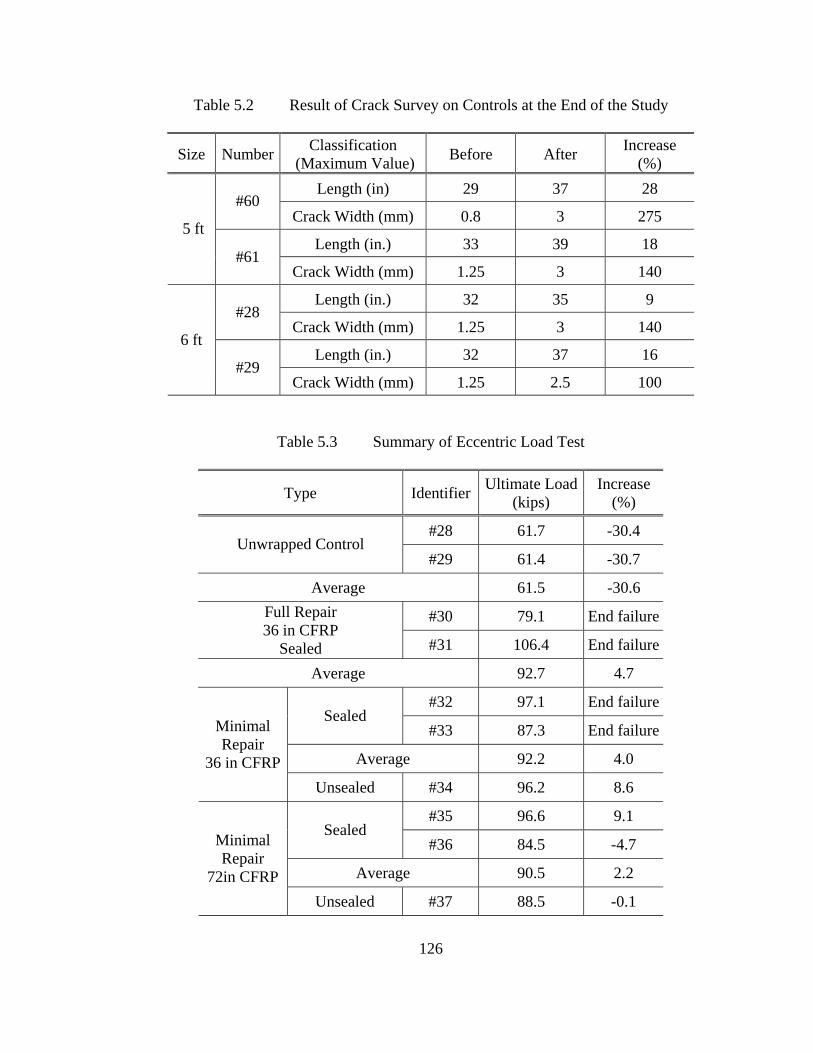
126
Table 5.2 Result of Crack Survey on Controls at the End of the Study
Size Number Classification (Maximum Value) Before After Increase
(%) Length (in) 29 37 28
#60 Crack Width (mm) 0.8 3 275
Length (in.) 33 39 18 5 ft
#61 Crack Width (mm) 1.25 3 140
Length (in.) 32 35 9 #28
Crack Width (mm) 1.25 3 140
Length (in.) 32 37 16 6 ft
#29 Crack Width (mm) 1.25 2.5 100
Table 5.3 Summary of Eccentric Load Test
Type Identifier Ultimate Load (kips)
Increase (%)
#28 61.7 -30.4 Unwrapped Control
#29 61.4 -30.7
Average 61.5 -30.6
#30 79.1 End failureFull Repair 36 in CFRP
Sealed #31 106.4 End failure
Average 92.7 4.7
#32 97.1 End failureSealed
#33 87.3 End failure
Average 92.2 4.0
Minimal Repair
36 in CFRP Unsealed #34 96.2 8.6
#35 96.6 9.1 Sealed
#36 84.5 -4.7
Average 90.5 2.2
Minimal Repair
72in CFRP Unsealed #37 88.5 -0.1
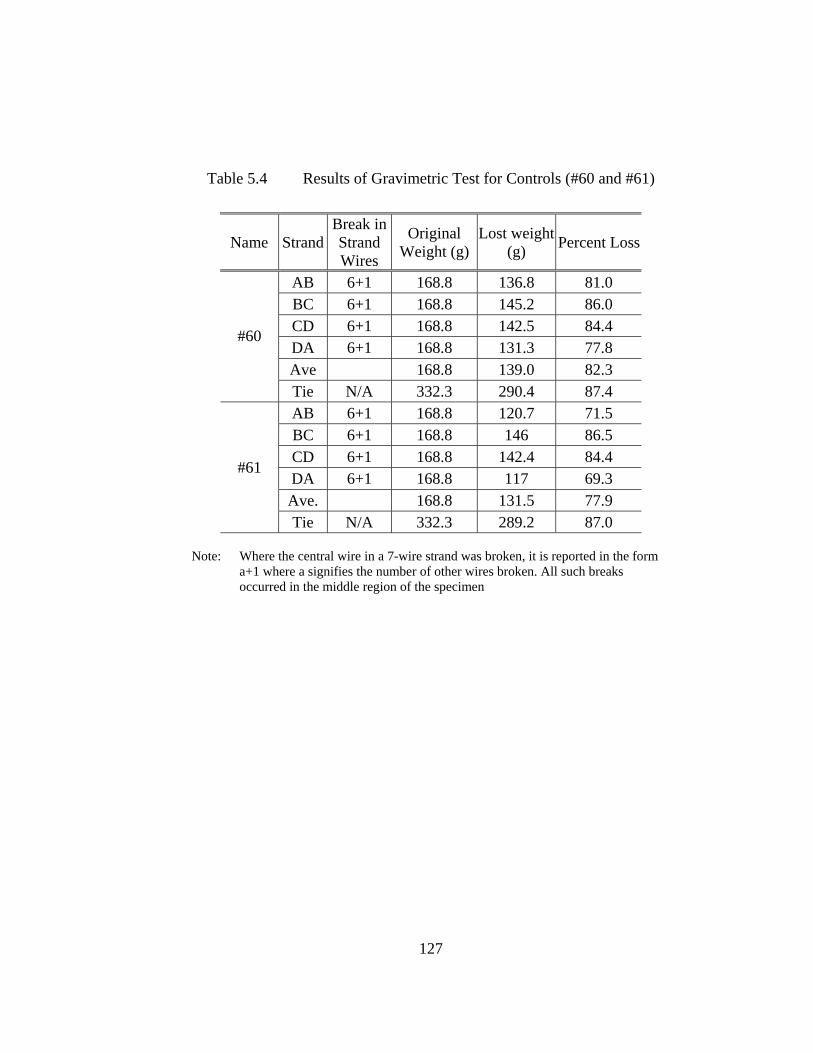
127
Table 5.4 Results of Gravimetric Test for Controls (#60 and #61)
Note: Where the central wire in a 7-wire strand was broken, it is reported in the form a+1 where a signifies the number of other wires broken. All such breaks occurred in the middle region of the specimen
Name Strand Break in Strand Wires
Original Weight (g)
Lost weight (g) Percent Loss
AB 6+1 168.8 136.8 81.0 BC 6+1 168.8 145.2 86.0 CD 6+1 168.8 142.5 84.4 DA 6+1 168.8 131.3 77.8 Ave 168.8 139.0 82.3
#60
Tie N/A 332.3 290.4 87.4 AB 6+1 168.8 120.7 71.5 BC 6+1 168.8 146 86.5 CD 6+1 168.8 142.4 84.4 DA 6+1 168.8 117 69.3 Ave. 168.8 131.5 77.9
#61
Tie N/A 332.3 289.2 87.0
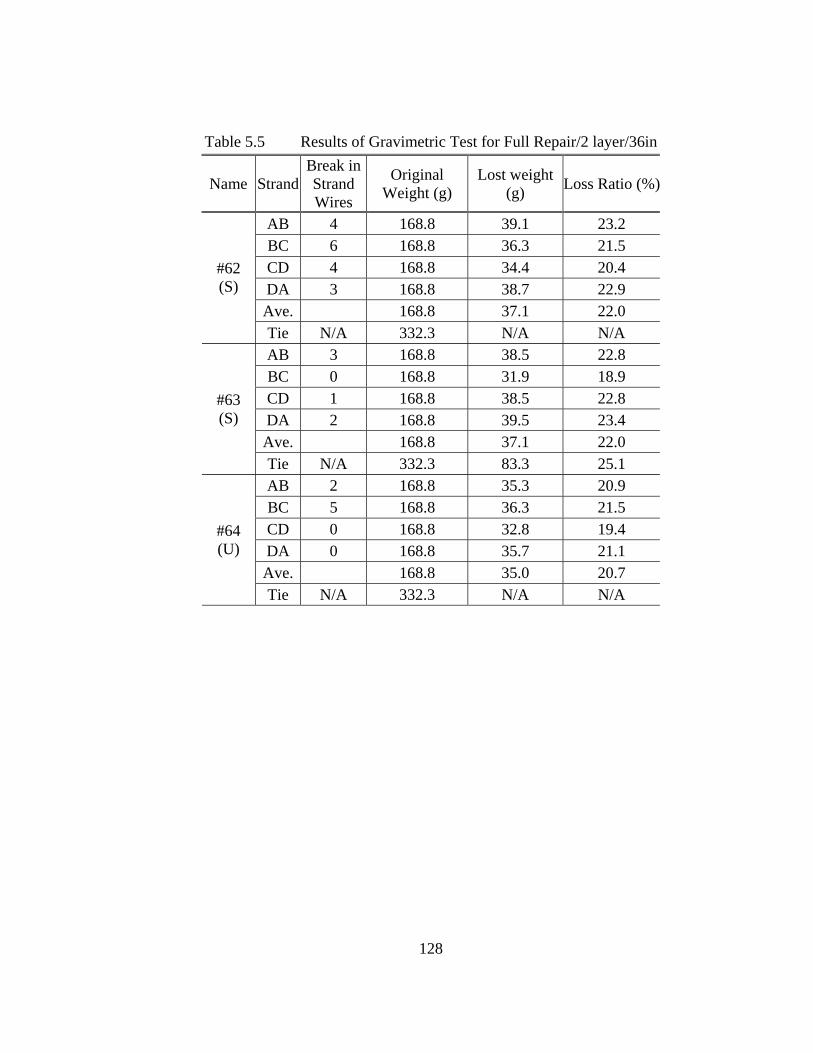
128
Table 5.5 Results of Gravimetric Test for Full Repair/2 layer/36in
Name Strand Break in Strand Wires
Original Weight (g)
Lost weight (g) Loss Ratio (%)
AB 4 168.8 39.1 23.2 BC 6 168.8 36.3 21.5 CD 4 168.8 34.4 20.4 DA 3 168.8 38.7 22.9 Ave. 168.8 37.1 22.0
#62 (S)
Tie N/A 332.3 N/A N/A AB 3 168.8 38.5 22.8 BC 0 168.8 31.9 18.9 CD 1 168.8 38.5 22.8 DA 2 168.8 39.5 23.4 Ave. 168.8 37.1 22.0
#63 (S)
Tie N/A 332.3 83.3 25.1 AB 2 168.8 35.3 20.9 BC 5 168.8 36.3 21.5 CD 0 168.8 32.8 19.4 DA 0 168.8 35.7 21.1 Ave. 168.8 35.0 20.7
#64 (U)
Tie N/A 332.3 N/A N/A
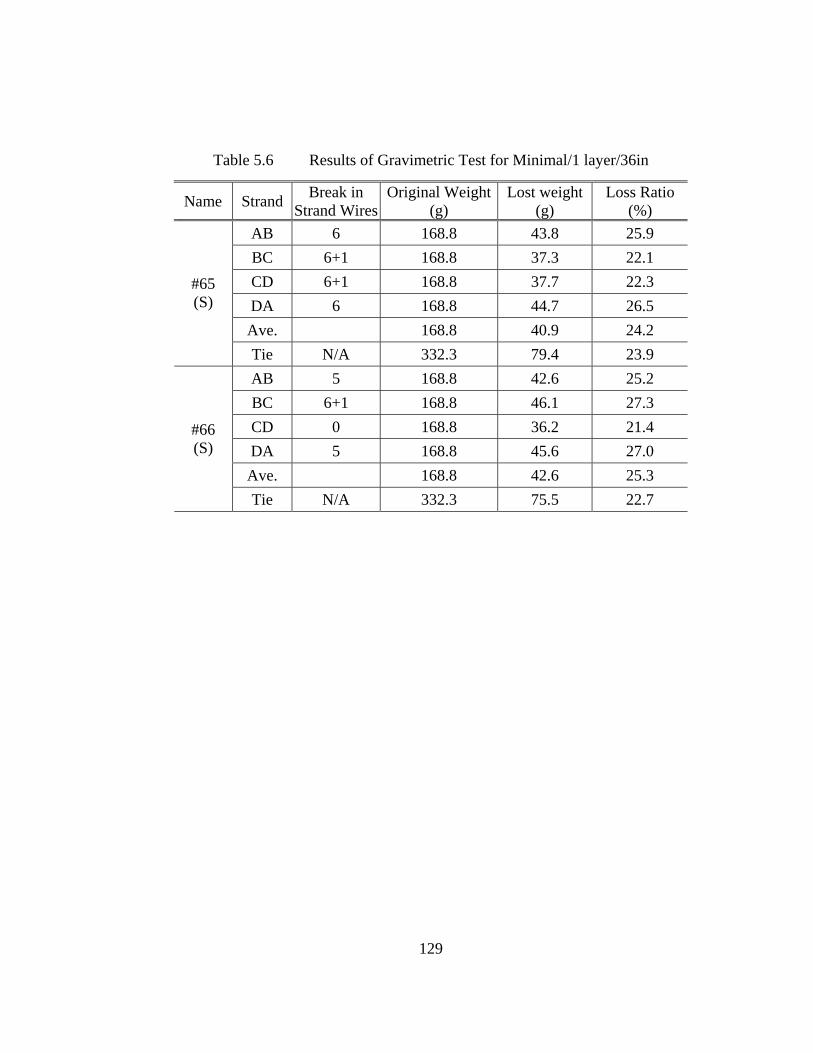
129
Table 5.6 Results of Gravimetric Test for Minimal/1 layer/36in
Name Strand Break in Strand Wires
Original Weight (g)
Lost weight (g)
Loss Ratio (%)
AB 6 168.8 43.8 25.9 BC 6+1 168.8 37.3 22.1 CD 6+1 168.8 37.7 22.3 DA 6 168.8 44.7 26.5 Ave. 168.8 40.9 24.2
#65 (S)
Tie N/A 332.3 79.4 23.9 AB 5 168.8 42.6 25.2 BC 6+1 168.8 46.1 27.3 CD 0 168.8 36.2 21.4 DA 5 168.8 45.6 27.0 Ave. 168.8 42.6 25.3
#66 (S)
Tie N/A 332.3 75.5 22.7
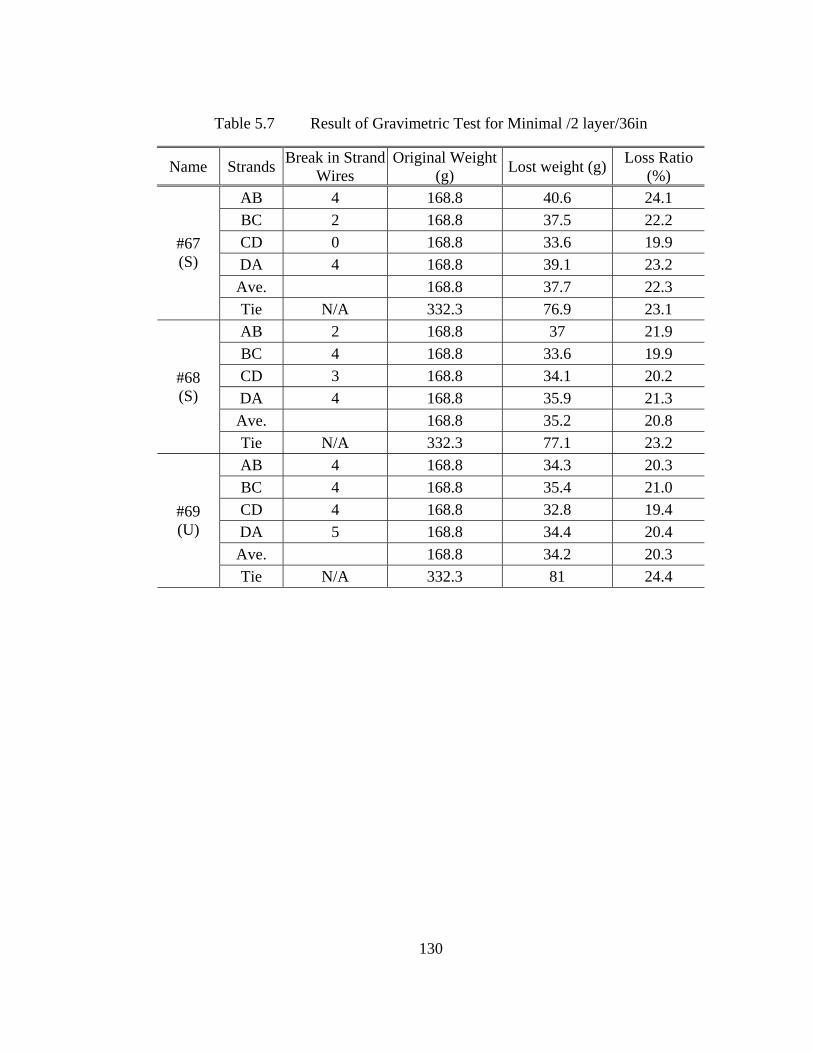
130
Table 5.7 Result of Gravimetric Test for Minimal /2 layer/36in
Name Strands Break in Strand Wires
Original Weight (g) Lost weight (g) Loss Ratio
(%) AB 4 168.8 40.6 24.1 BC 2 168.8 37.5 22.2 CD 0 168.8 33.6 19.9 DA 4 168.8 39.1 23.2 Ave. 168.8 37.7 22.3
#67 (S)
Tie N/A 332.3 76.9 23.1 AB 2 168.8 37 21.9 BC 4 168.8 33.6 19.9 CD 3 168.8 34.1 20.2 DA 4 168.8 35.9 21.3 Ave. 168.8 35.2 20.8
#68 (S)
Tie N/A 332.3 77.1 23.2 AB 4 168.8 34.3 20.3 BC 4 168.8 35.4 21.0 CD 4 168.8 32.8 19.4 DA 5 168.8 34.4 20.4 Ave. 168.8 34.2 20.3
#69 (U)
Tie N/A 332.3 81 24.4
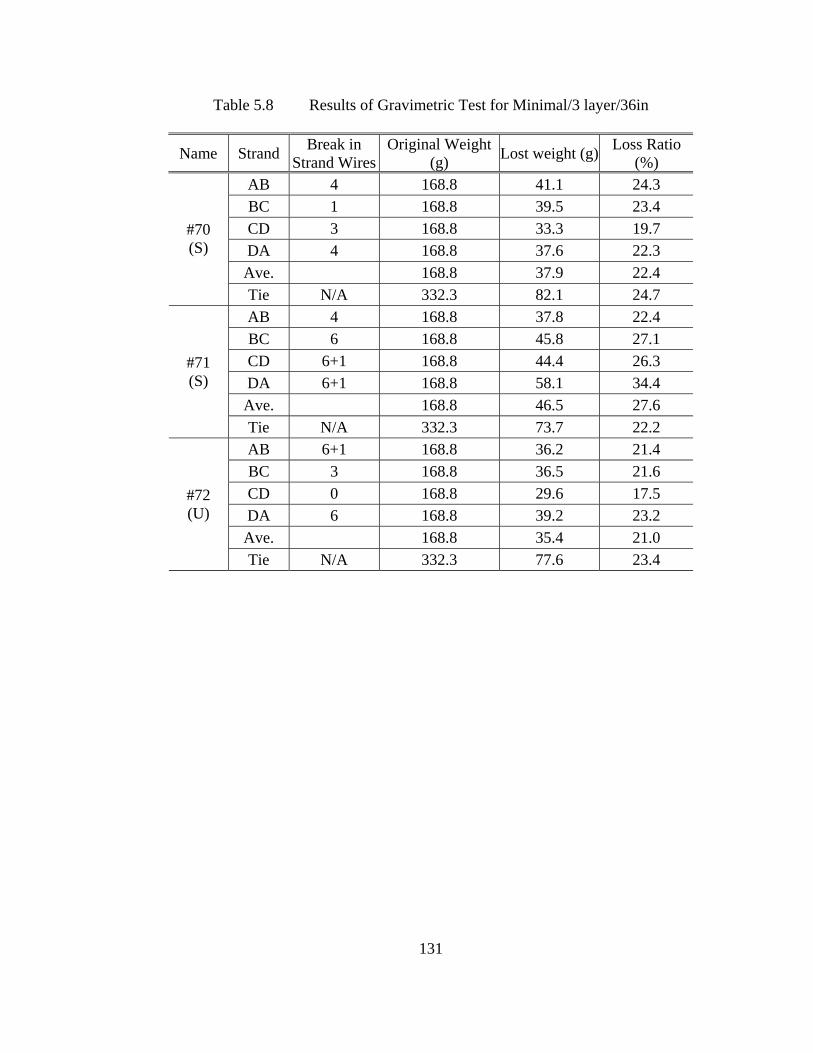
131
Table 5.8 Results of Gravimetric Test for Minimal/3 layer/36in
Name Strand Break in Strand Wires
Original Weight (g) Lost weight (g) Loss Ratio
(%) AB 4 168.8 41.1 24.3 BC 1 168.8 39.5 23.4 CD 3 168.8 33.3 19.7 DA 4 168.8 37.6 22.3 Ave. 168.8 37.9 22.4
#70 (S)
Tie N/A 332.3 82.1 24.7 AB 4 168.8 37.8 22.4 BC 6 168.8 45.8 27.1 CD 6+1 168.8 44.4 26.3 DA 6+1 168.8 58.1 34.4 Ave. 168.8 46.5 27.6
#71 (S)
Tie N/A 332.3 73.7 22.2 AB 6+1 168.8 36.2 21.4 BC 3 168.8 36.5 21.6 CD 0 168.8 29.6 17.5 DA 6 168.8 39.2 23.2 Ave. 168.8 35.4 21.0
#72 (U)
Tie N/A 332.3 77.6 23.4
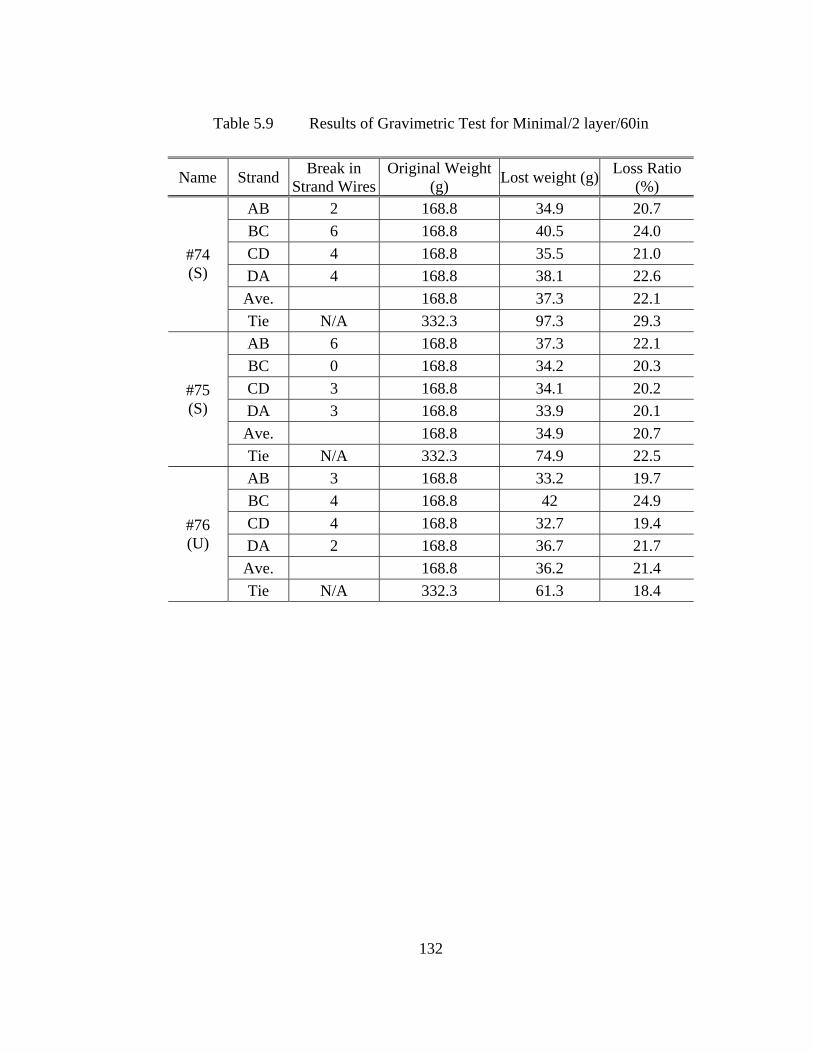
132
Table 5.9 Results of Gravimetric Test for Minimal/2 layer/60in
Name Strand Break in Strand Wires
Original Weight (g) Lost weight (g) Loss Ratio
(%) AB 2 168.8 34.9 20.7 BC 6 168.8 40.5 24.0 CD 4 168.8 35.5 21.0 DA 4 168.8 38.1 22.6 Ave. 168.8 37.3 22.1
#74 (S)
Tie N/A 332.3 97.3 29.3 AB 6 168.8 37.3 22.1 BC 0 168.8 34.2 20.3 CD 3 168.8 34.1 20.2 DA 3 168.8 33.9 20.1 Ave. 168.8 34.9 20.7
#75 (S)
Tie N/A 332.3 74.9 22.5 AB 3 168.8 33.2 19.7 BC 4 168.8 42 24.9 CD 4 168.8 32.7 19.4 DA 2 168.8 36.7 21.7 Ave. 168.8 36.2 21.4
#76 (U)
Tie N/A 332.3 61.3 18.4
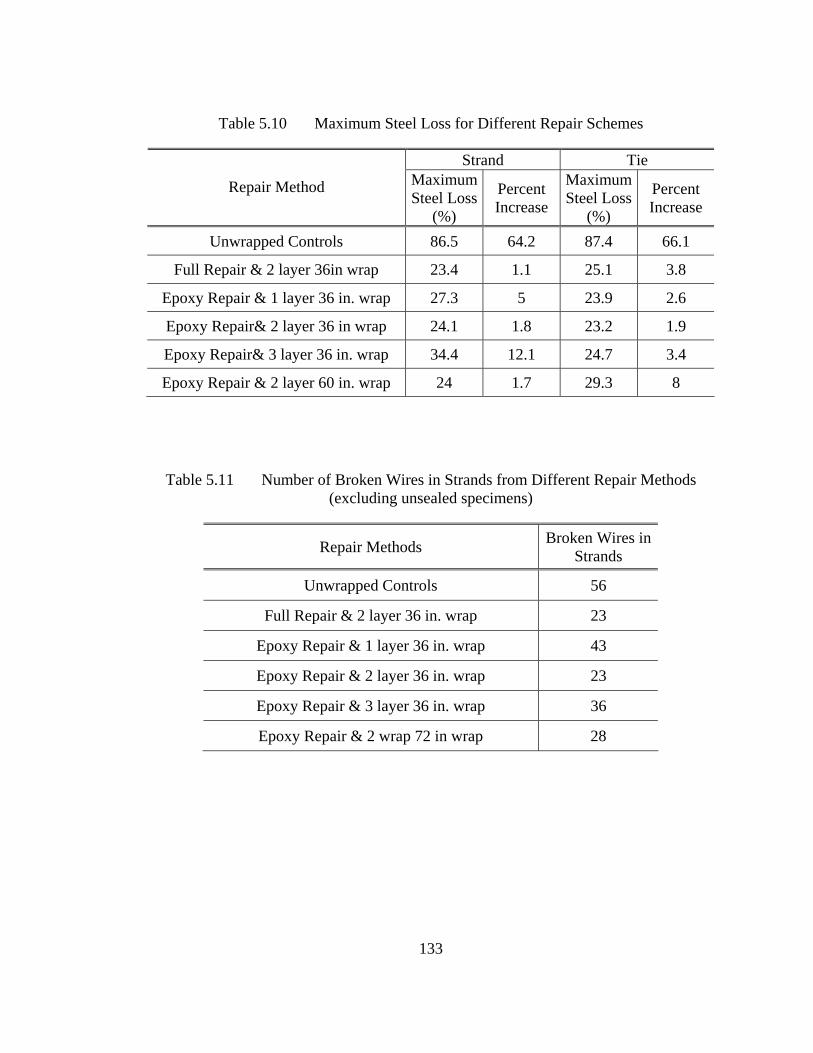
133
Table 5.10 Maximum Steel Loss for Different Repair Schemes
Table 5.11 Number of Broken Wires in Strands from Different Repair Methods
(excluding unsealed specimens)
Strand Tie
Repair Method Maximum Steel Loss
(%)
Percent Increase
Maximum Steel Loss
(%)
Percent Increase
Unwrapped Controls 86.5 64.2 87.4 66.1
Full Repair & 2 layer 36in wrap 23.4 1.1 25.1 3.8
Epoxy Repair & 1 layer 36 in. wrap 27.3 5 23.9 2.6
Epoxy Repair& 2 layer 36 in wrap 24.1 1.8 23.2 1.9
Epoxy Repair& 3 layer 36 in. wrap 34.4 12.1 24.7 3.4
Epoxy Repair & 2 layer 60 in. wrap 24 1.7 29.3 8
Repair Methods Broken Wires in Strands
Unwrapped Controls 56
Full Repair & 2 layer 36 in. wrap 23
Epoxy Repair & 1 layer 36 in. wrap 43
Epoxy Repair & 2 layer 36 in. wrap 23
Epoxy Repair & 3 layer 36 in. wrap 36
Epoxy Repair & 2 wrap 72 in wrap 28
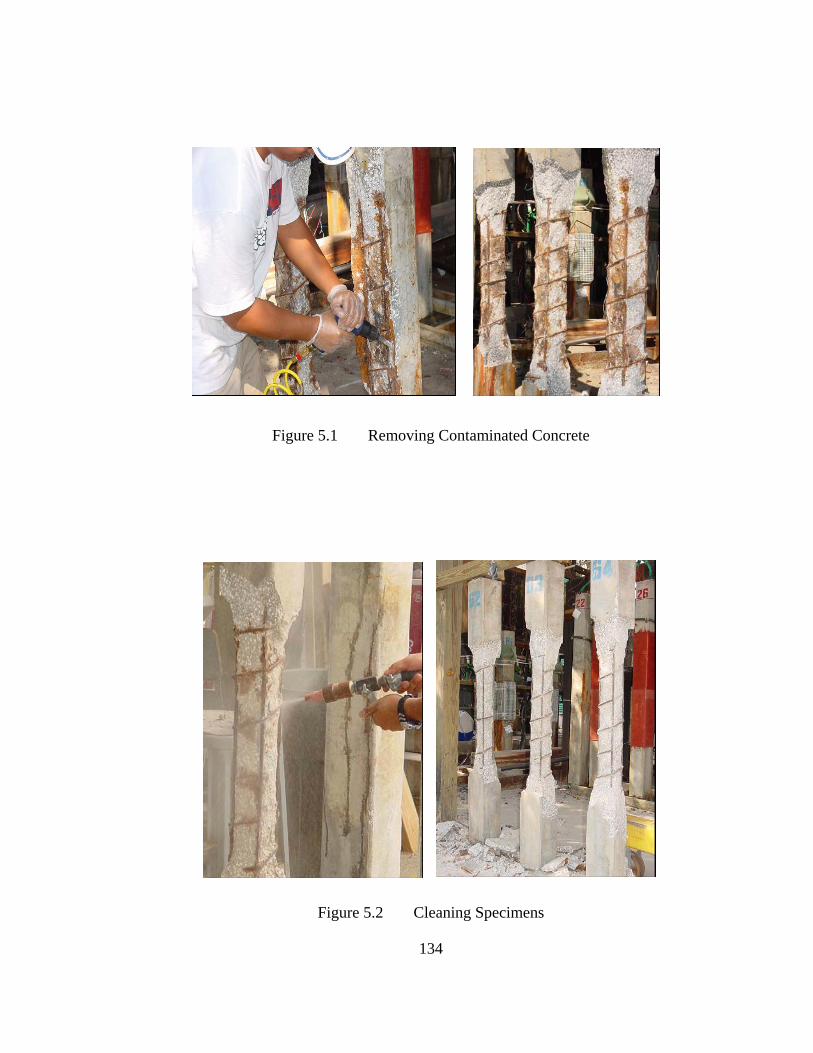
134
Figure 5.1 Removing Contaminated Concrete
Figure 5.2 Cleaning Specimens
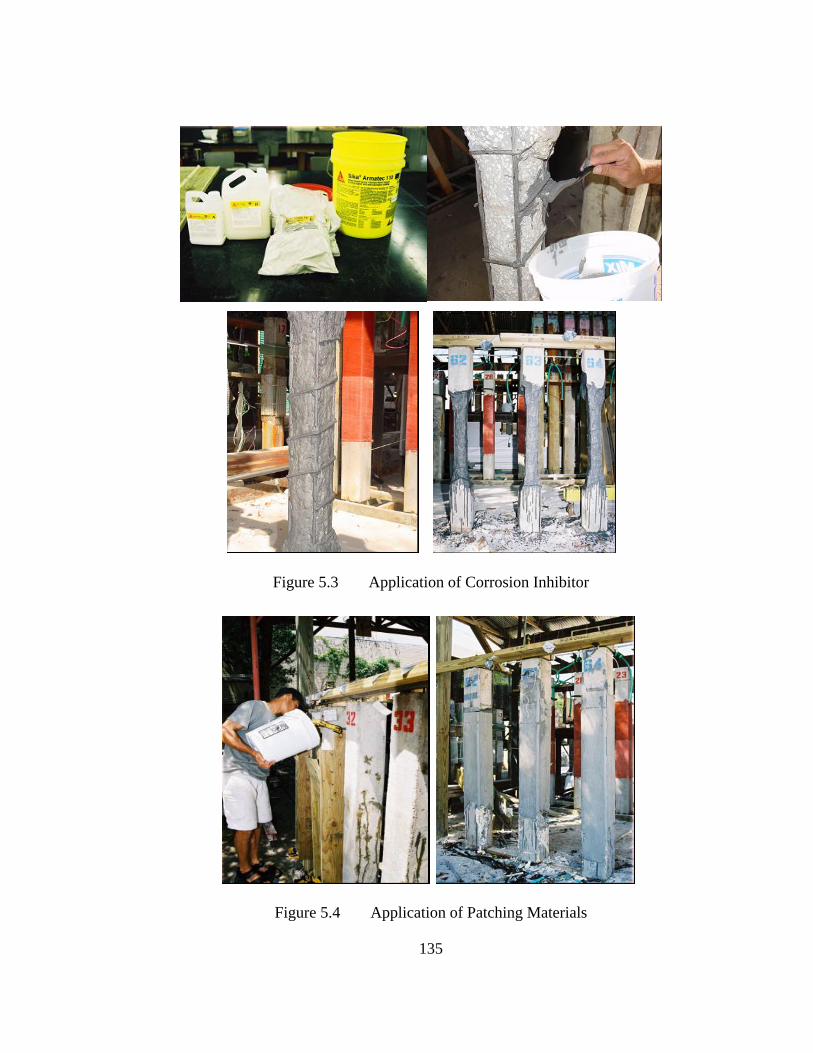
135
Figure 5.3 Application of Corrosion Inhibitor
Figure 5.4 Application of Patching Materials
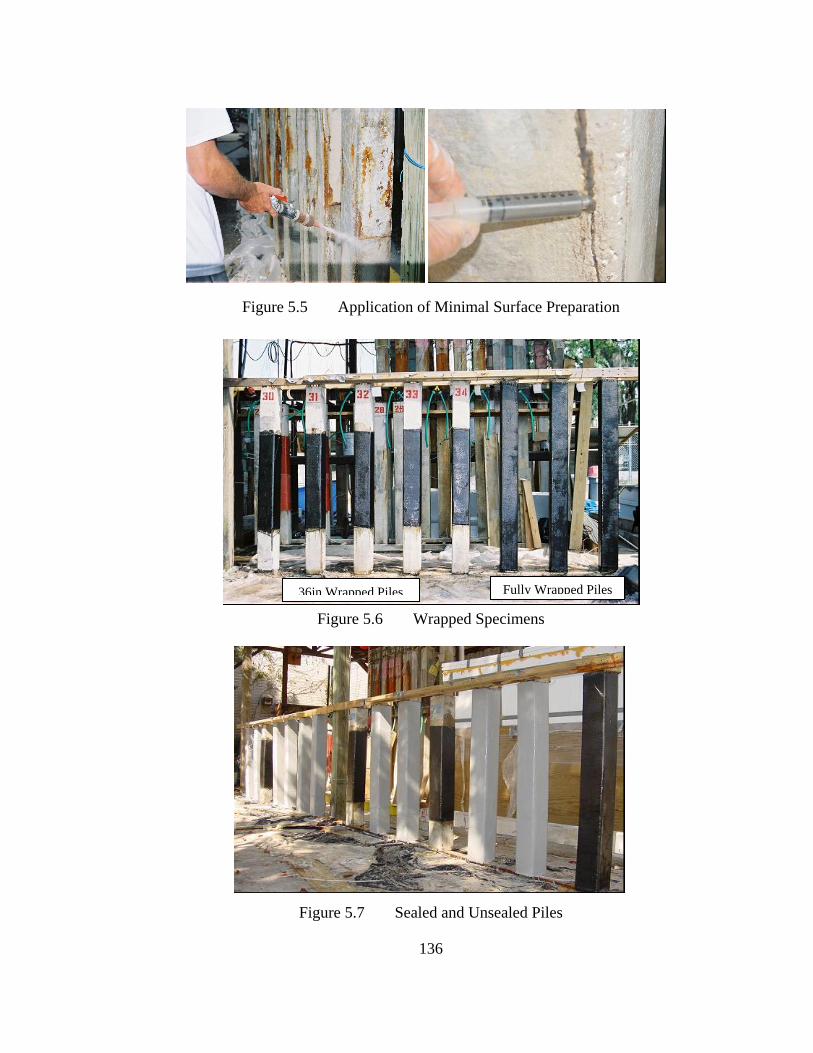
136
Figure 5.5 Application of Minimal Surface Preparation
Figure 5.6 Wrapped Specimens
Figure 5.7 Sealed and Unsealed Piles
Fully Wrapped Piles 36in Wrapped Piles
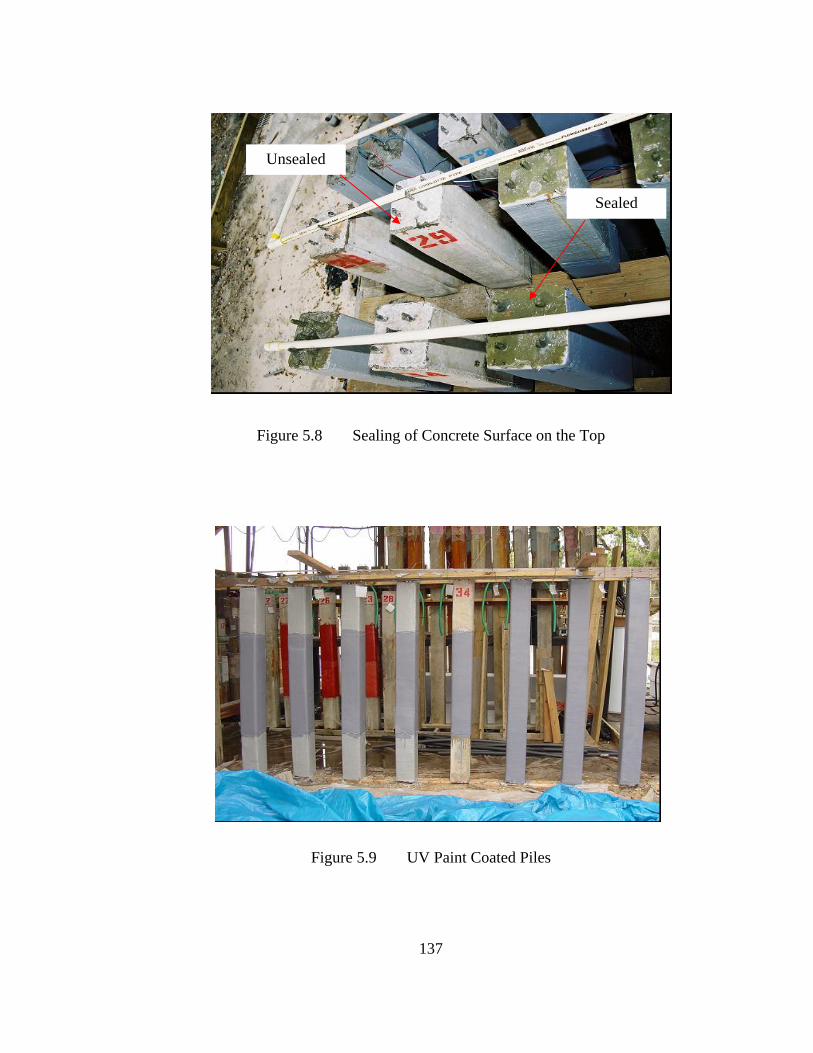
137
Figure 5.8 Sealing of Concrete Surface on the Top
Figure 5.9 UV Paint Coated Piles
Sealed
Unsealed
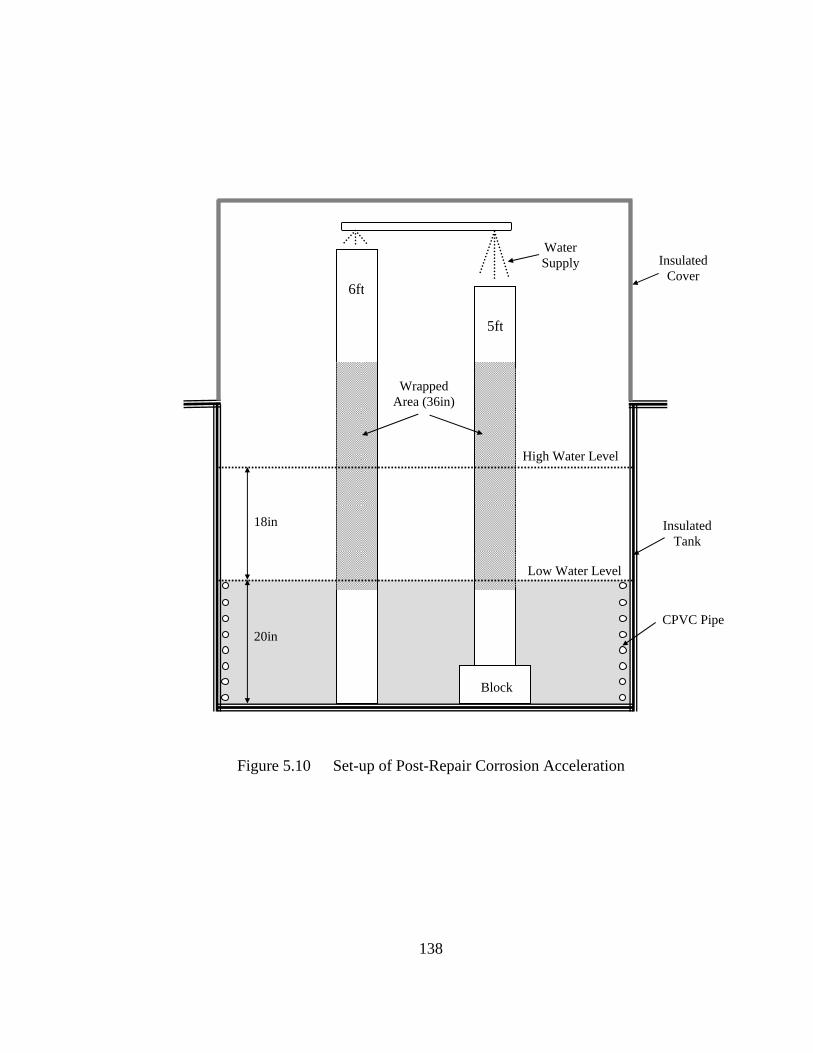
138
Figure 5.10 Set-up of Post-Repair Corrosion Acceleration
Low Water Level
High Water Level
6ft
5ft
Block
20in
18in
Wrapped Area (36in)
Water Supply Insulated
Cover
Insulated Tank
CPVC Pipe
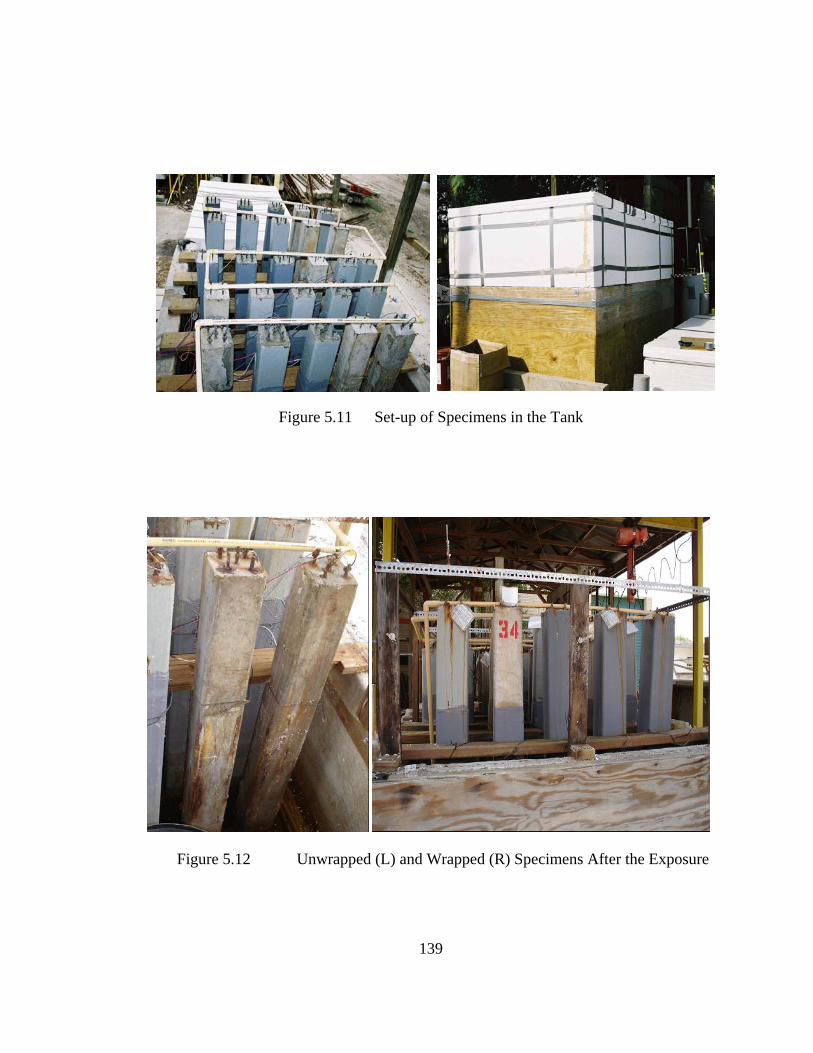
139
Figure 5.11 Set-up of Specimens in the Tank
.
Figure 5.12 Unwrapped (L) and Wrapped (R) Specimens After the Exposure
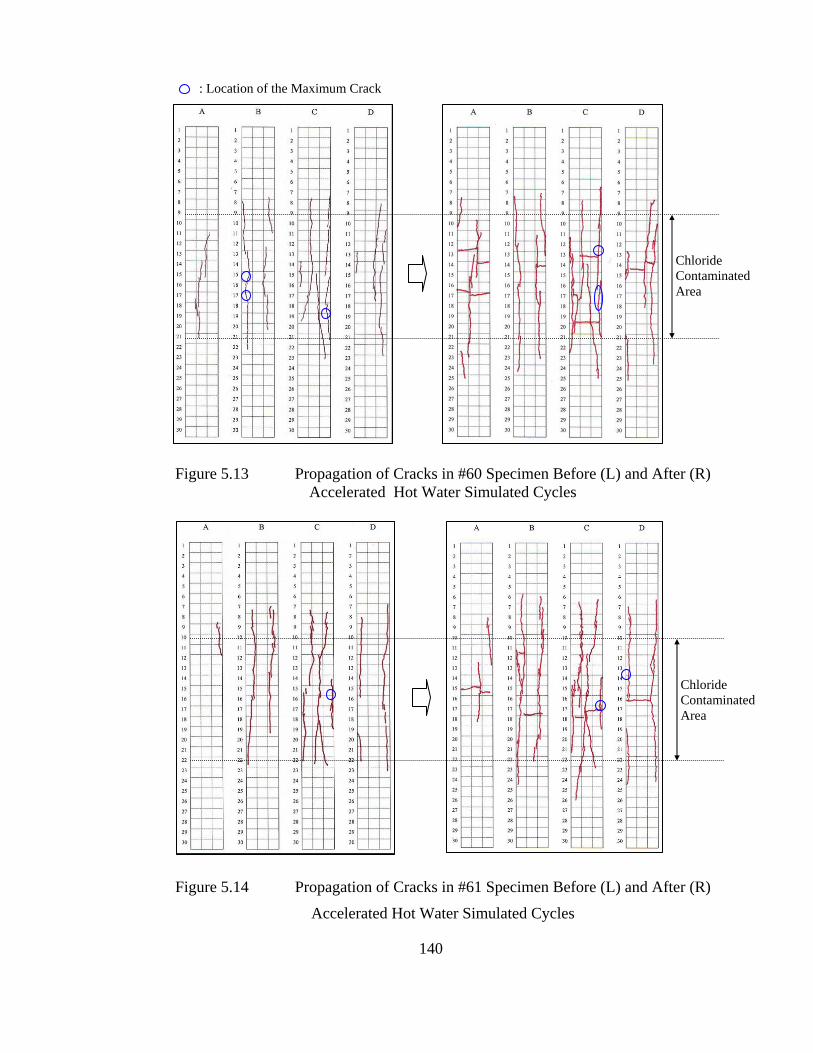
140
Figure 5.13 Propagation of Cracks in #60 Specimen Before (L) and After (R) Accelerated Hot Water Simulated Cycles
Figure 5.14 Propagation of Cracks in #61 Specimen Before (L) and After (R)
Accelerated Hot Water Simulated Cycles
Chloride Contaminated Area
: Location of the Maximum Crack
Chloride Contaminated Area
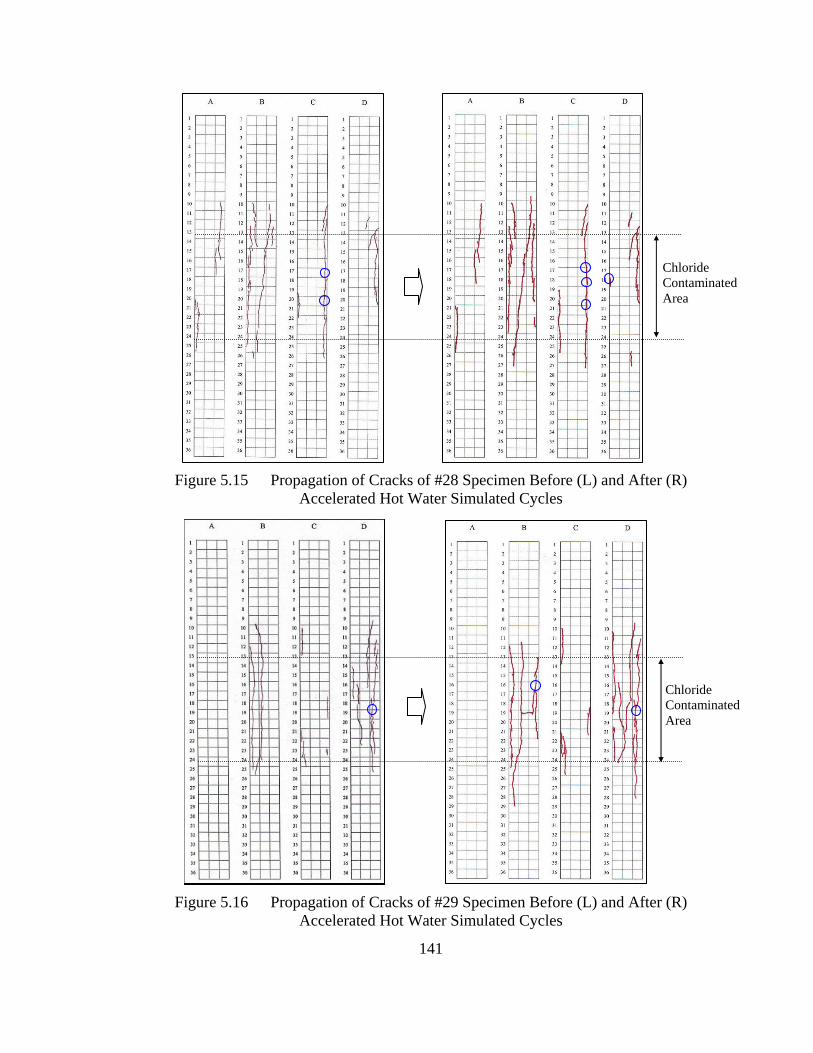
141
Figure 5.15 Propagation of Cracks of #28 Specimen Before (L) and After (R) Accelerated Hot Water Simulated Cycles
Figure 5.16 Propagation of Cracks of #29 Specimen Before (L) and After (R) Accelerated Hot Water Simulated Cycles
Chloride Contaminated Area
Chloride Contaminated Area
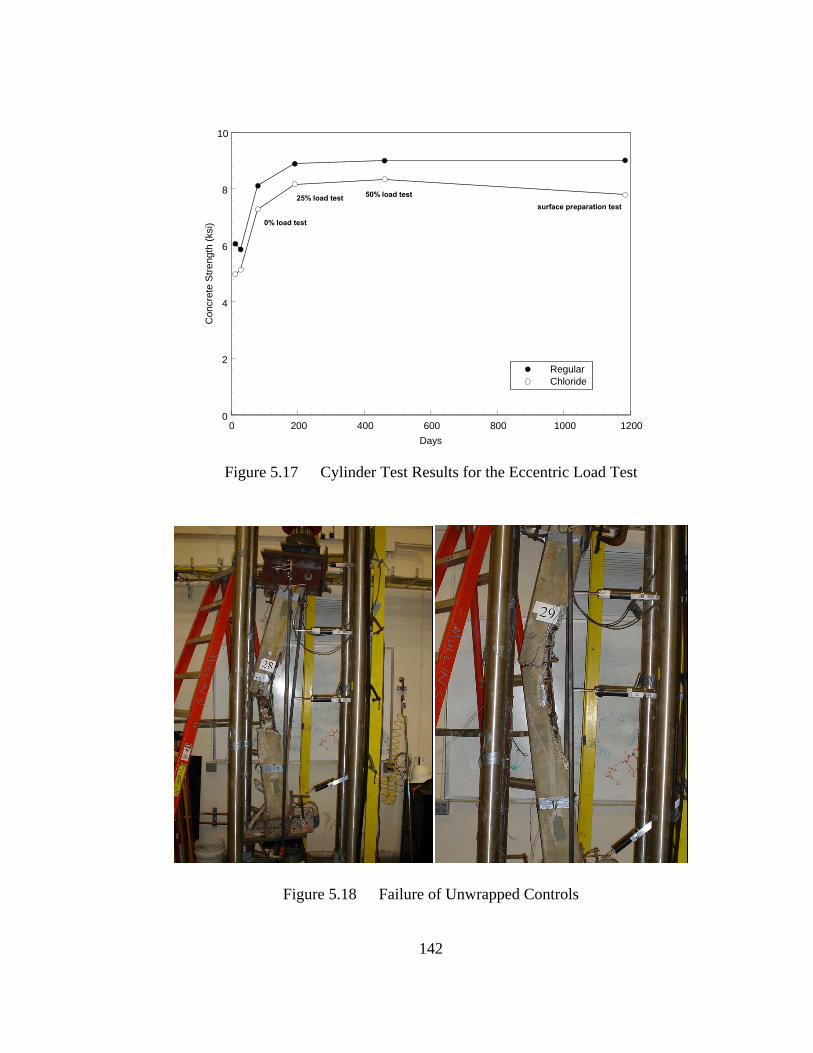
142
0 200 400 600 800 1000 1200Days
0
2
4
6
8
10
Con
cret
e St
reng
th (k
si)
RegularChloride
0% load test
25% load test 50% load testsurface preparation test
Figure 5.17 Cylinder Test Results for the Eccentric Load Test
Figure 5.18 Failure of Unwrapped Controls
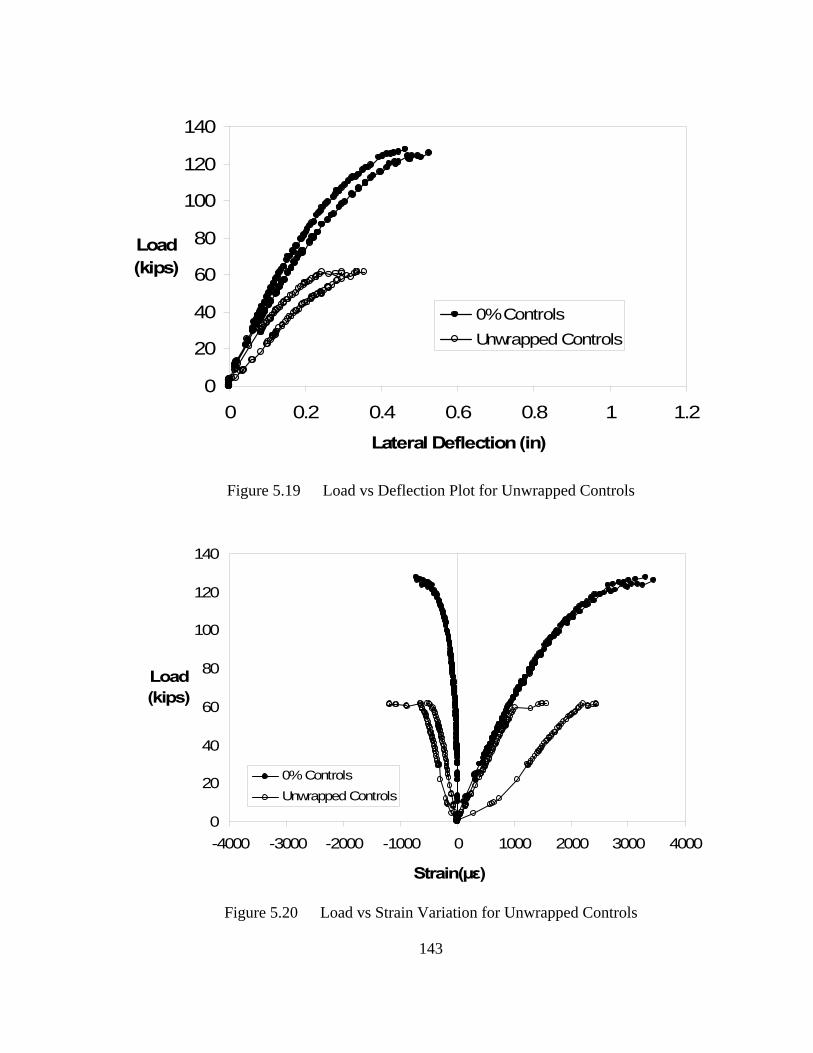
143
Figure 5.19 Load vs Deflection Plot for Unwrapped Controls
Figure 5.20 Load vs Strain Variation for Unwrapped Controls
0
20
40
60
80
100
120
140
0 0.2 0.4 0.6 0.8 1 1.2Lateral Deflection (in)
Load(kips)
0% ControlsUnwrapped Controls
0
20
40
60
80
100
120
140
-4000 -3000 -2000 -1000 0 1000 2000 3000 4000
Strain(µε)
Load (kips)
0% ControlsUnwrapped Controls
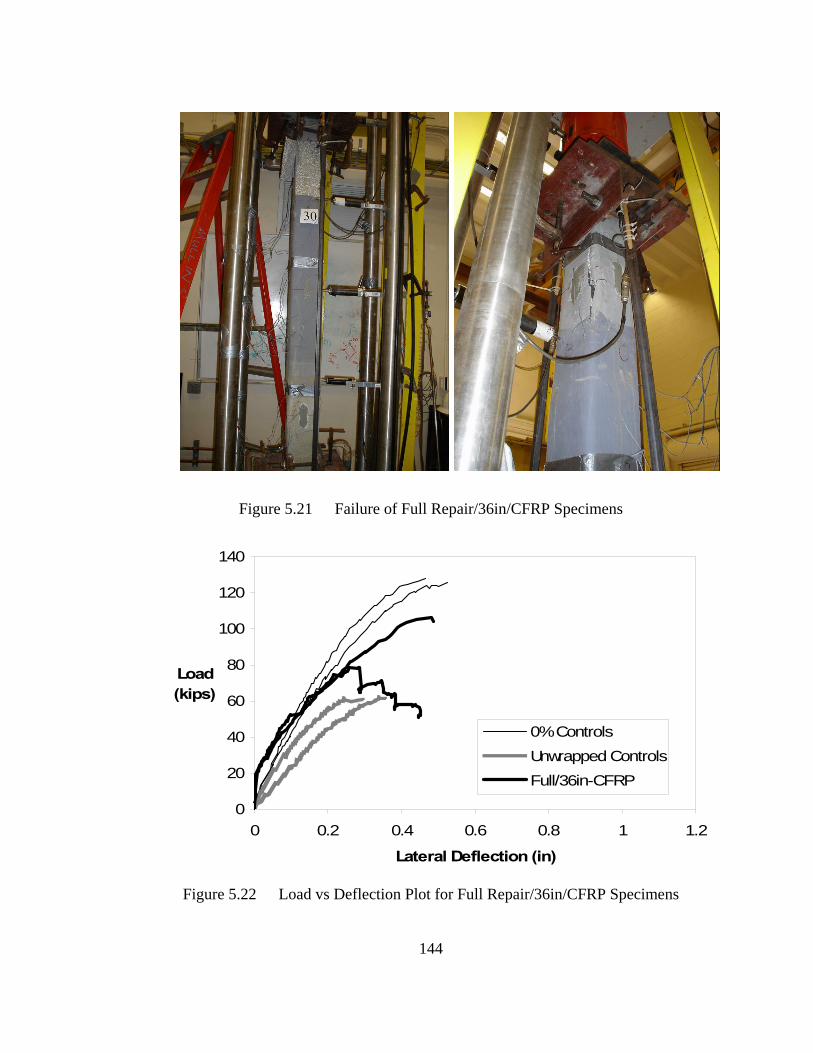
144
Figure 5.21 Failure of Full Repair/36in/CFRP Specimens
Figure 5.22 Load vs Deflection Plot for Full Repair/36in/CFRP Specimens
0
20
40
60
80
100
120
140
0 0.2 0.4 0.6 0.8 1 1.2
Lateral Deflection (in)
Load(kips)
0% ControlsUnwrapped ControlsFull/36in-CFRP
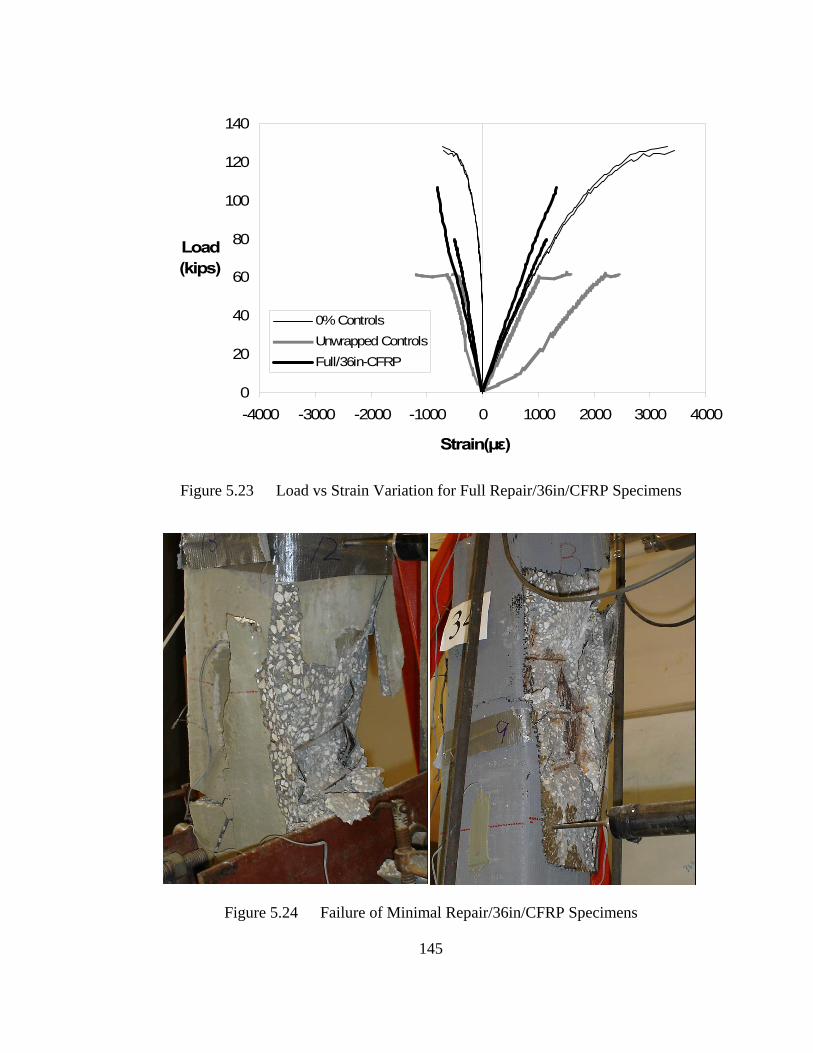
145
Figure 5.23 Load vs Strain Variation for Full Repair/36in/CFRP Specimens
Figure 5.24 Failure of Minimal Repair/36in/CFRP Specimens
0
20
40
60
80
100
120
140
-4000 -3000 -2000 -1000 0 1000 2000 3000 4000
Strain(µε)
Load (kips)
0% ControlsUnwrapped ControlsFull/36in-CFRP
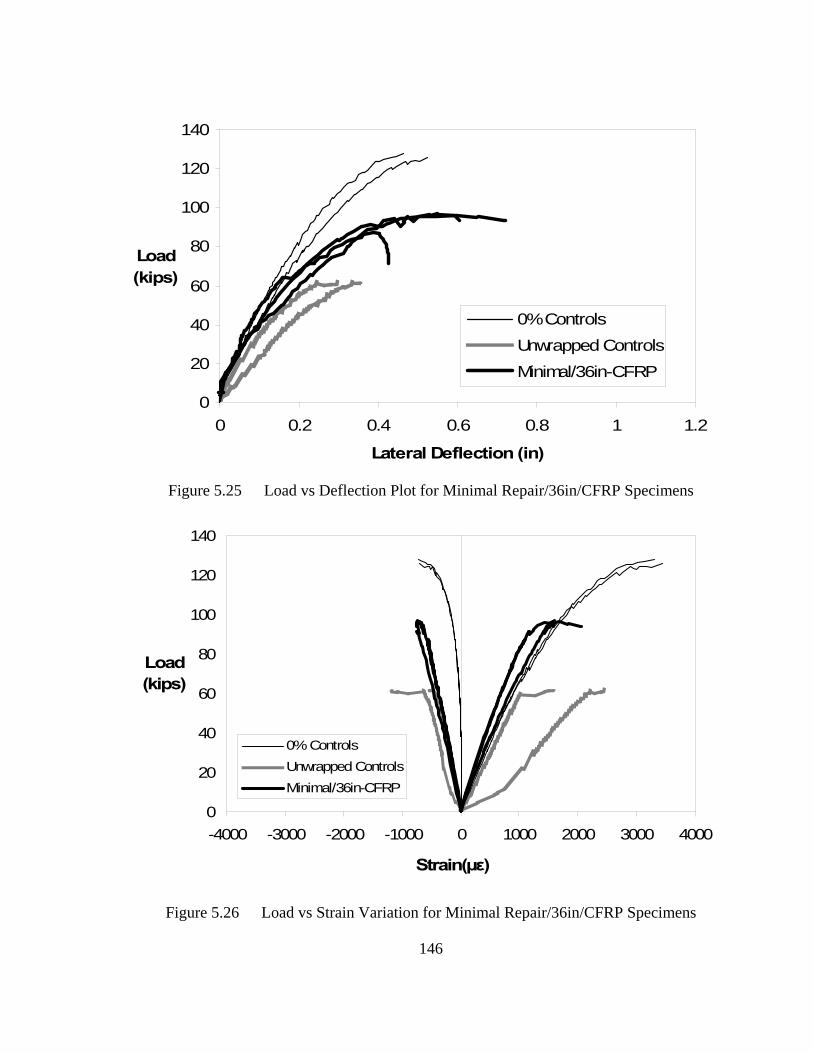
146
Figure 5.25 Load vs Deflection Plot for Minimal Repair/36in/CFRP Specimens
Figure 5.26 Load vs Strain Variation for Minimal Repair/36in/CFRP Specimens
0
20
40
60
80
100
120
140
0 0.2 0.4 0.6 0.8 1 1.2
Lateral Deflection (in)
Load(kips)
0% ControlsUnwrapped ControlsMinimal/36in-CFRP
0
20
40
60
80
100
120
140
-4000 -3000 -2000 -1000 0 1000 2000 3000 4000
Strain(µε)
Load (kips)
0% ControlsUnwrapped ControlsMinimal/36in-CFRP
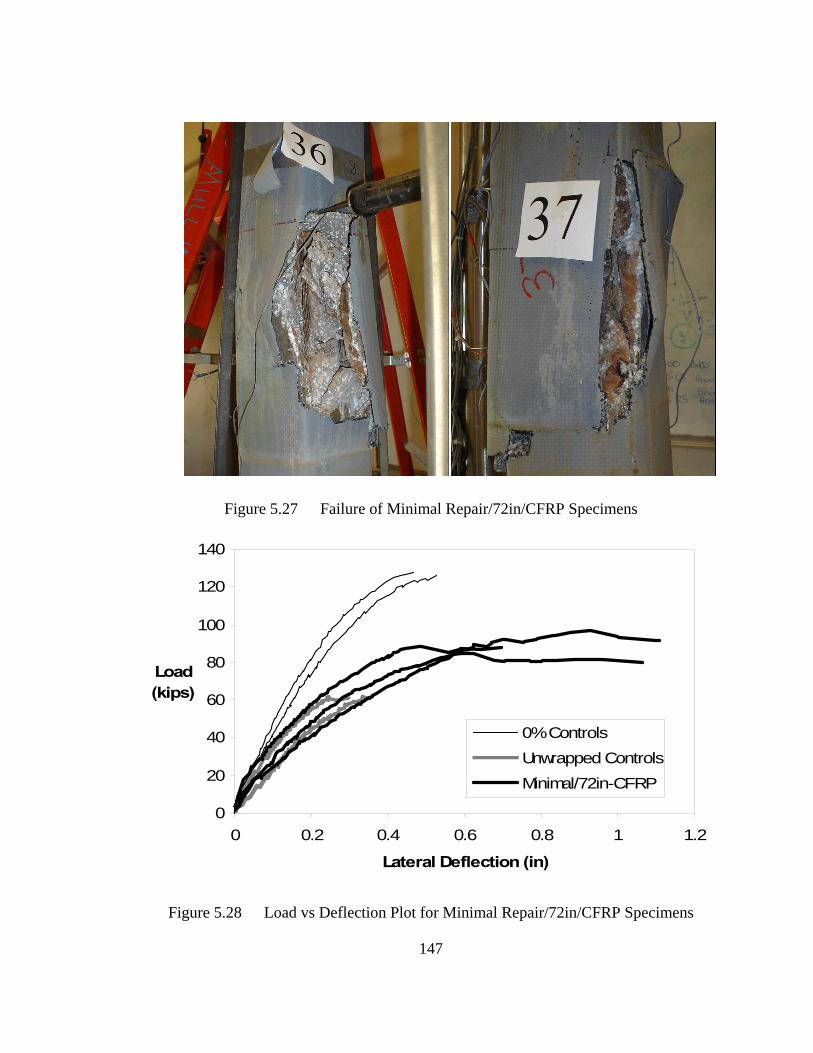
147
Figure 5.27 Failure of Minimal Repair/72in/CFRP Specimens
Figure 5.28 Load vs Deflection Plot for Minimal Repair/72in/CFRP Specimens
0
20
40
60
80
100
120
140
0 0.2 0.4 0.6 0.8 1 1.2
Lateral Deflection (in)
Load(kips)
0% ControlsUnwrapped ControlsMinimal/72in-CFRP
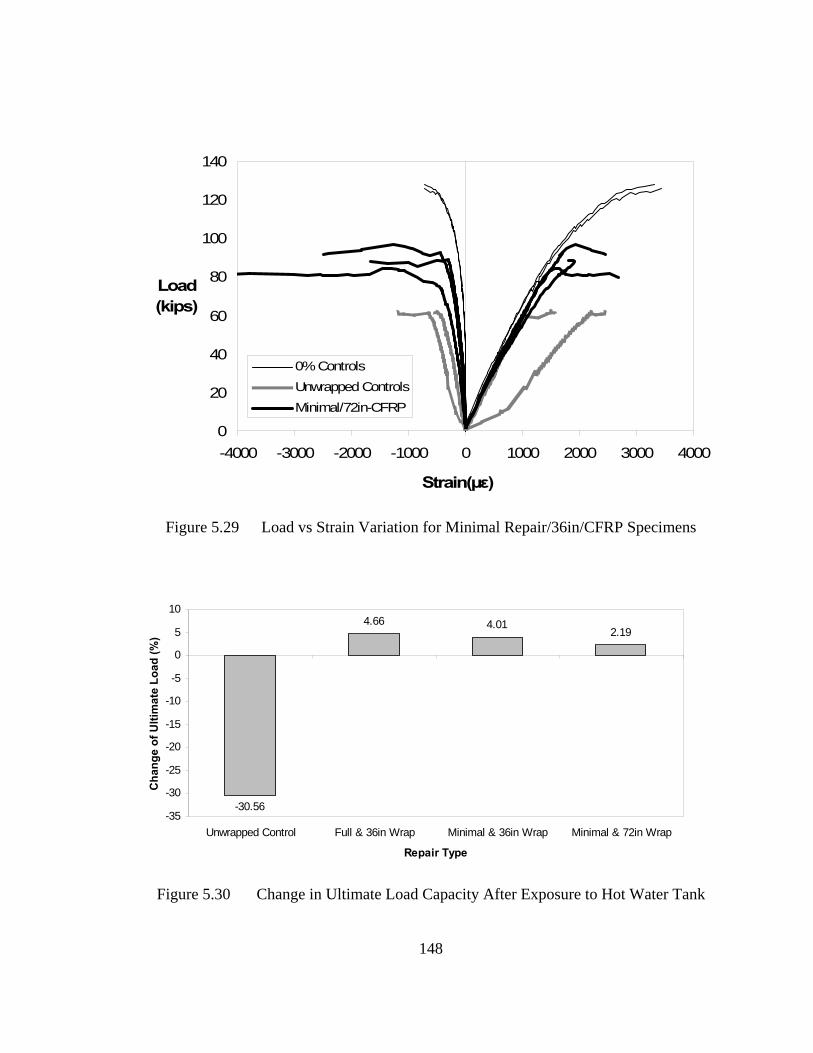
148
-30.56
4.66 4.012.19
-35
-30
-25
-20
-15
-10
-5
0
5
10
Unwrapped Control Full & 36in Wrap Minimal & 36in Wrap Minimal & 72in Wrap
Repair Type
Cha
nge
of U
ltim
ate
Load
(%)
Figure 5.29 Load vs Strain Variation for Minimal Repair/36in/CFRP Specimens
Figure 5.30 Change in Ultimate Load Capacity After Exposure to Hot Water Tank
0
20
40
60
80
100
120
140
-4000 -3000 -2000 -1000 0 1000 2000 3000 4000
Strain(µε)
Load (kips)
0% ControlsUnwrapped ControlsMinimal/72in-CFRP
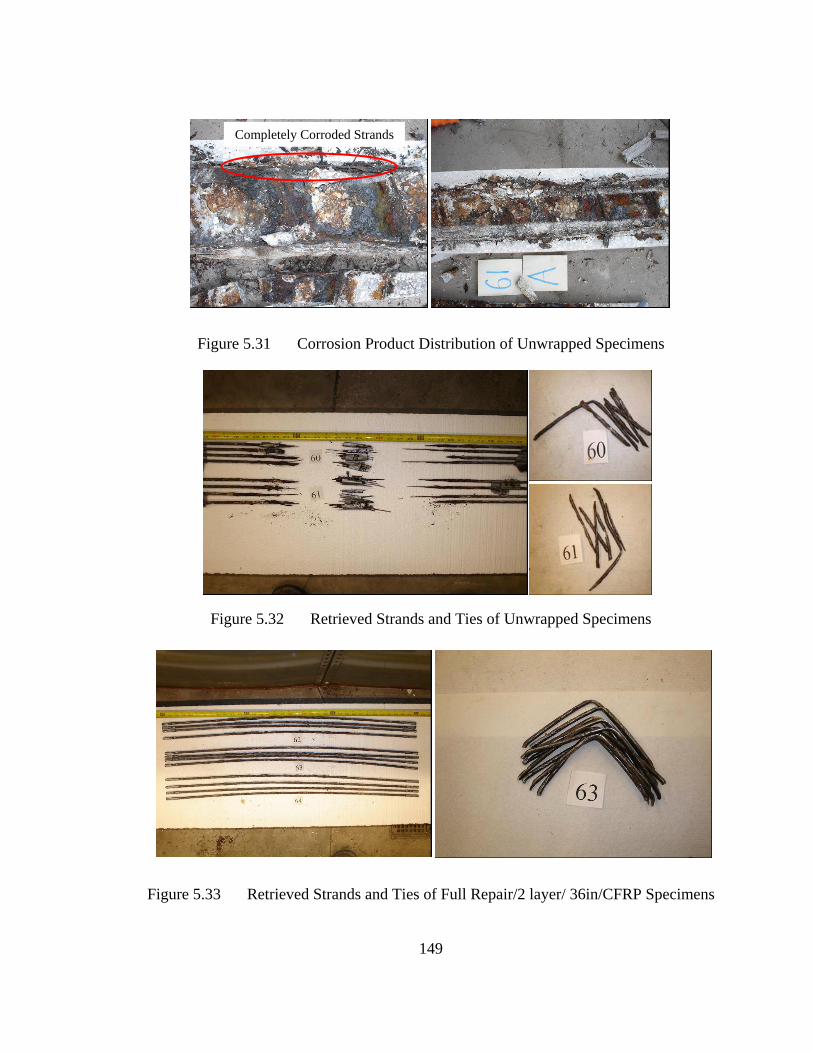
149
Completely Corroded Strands
Figure 5.31 Corrosion Product Distribution of Unwrapped Specimens
Figure 5.32 Retrieved Strands and Ties of Unwrapped Specimens Figure 5.33 Retrieved Strands and Ties of Full Repair/2 layer/ 36in/CFRP Specimens
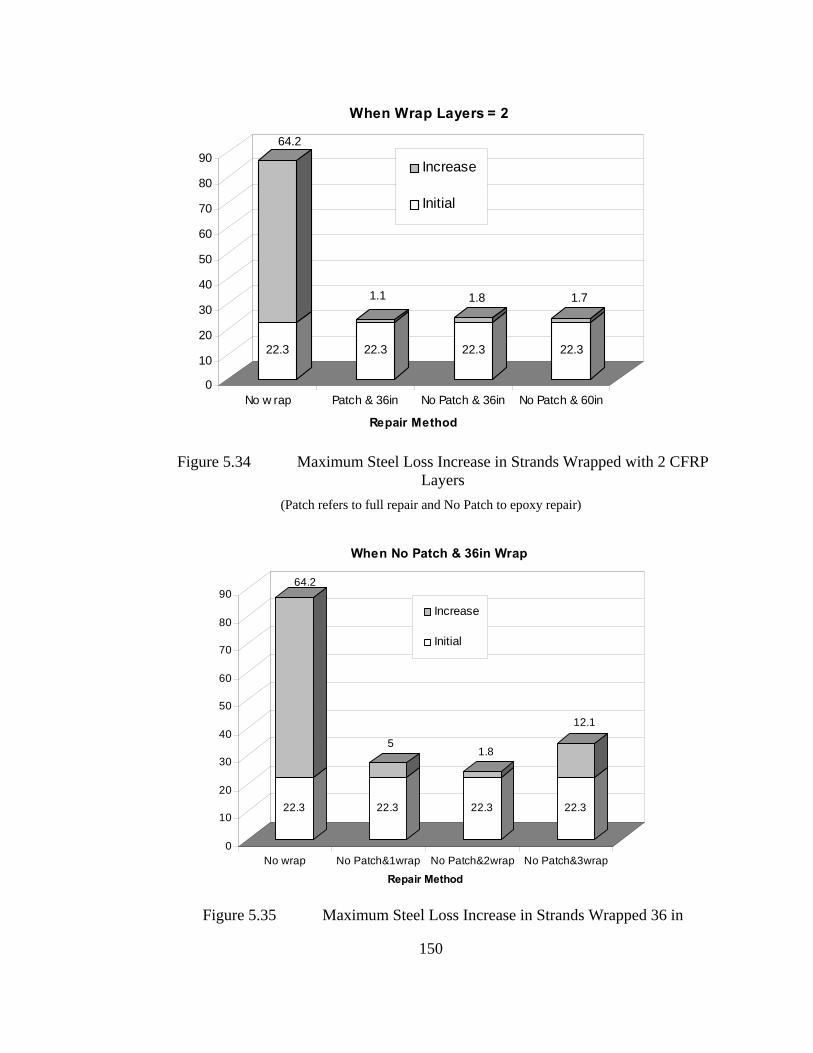
150
22.3
64.2
22.3
1.1
22.3
1.8
22.3
1.7
0
10
20
30
40
50
60
70
80
90
No w rap Patch & 36in No Patch & 36in No Patch & 60in
Repair Method
When Wrap Layers = 2
Increase
Initial
22.3
64.2
22.3
5
22.3
1.8
22.3
12.1
0
10
20
30
40
50
60
70
80
90
No wrap No Patch&1wrap No Patch&2wrap No Patch&3wrap
Repair Method
When No Patch & 36in Wrap
Increase
Initial
Figure 5.34 Maximum Steel Loss Increase in Strands Wrapped with 2 CFRP
Layers (Patch refers to full repair and No Patch to epoxy repair)
Figure 5.35 Maximum Steel Loss Increase in Strands Wrapped 36 in
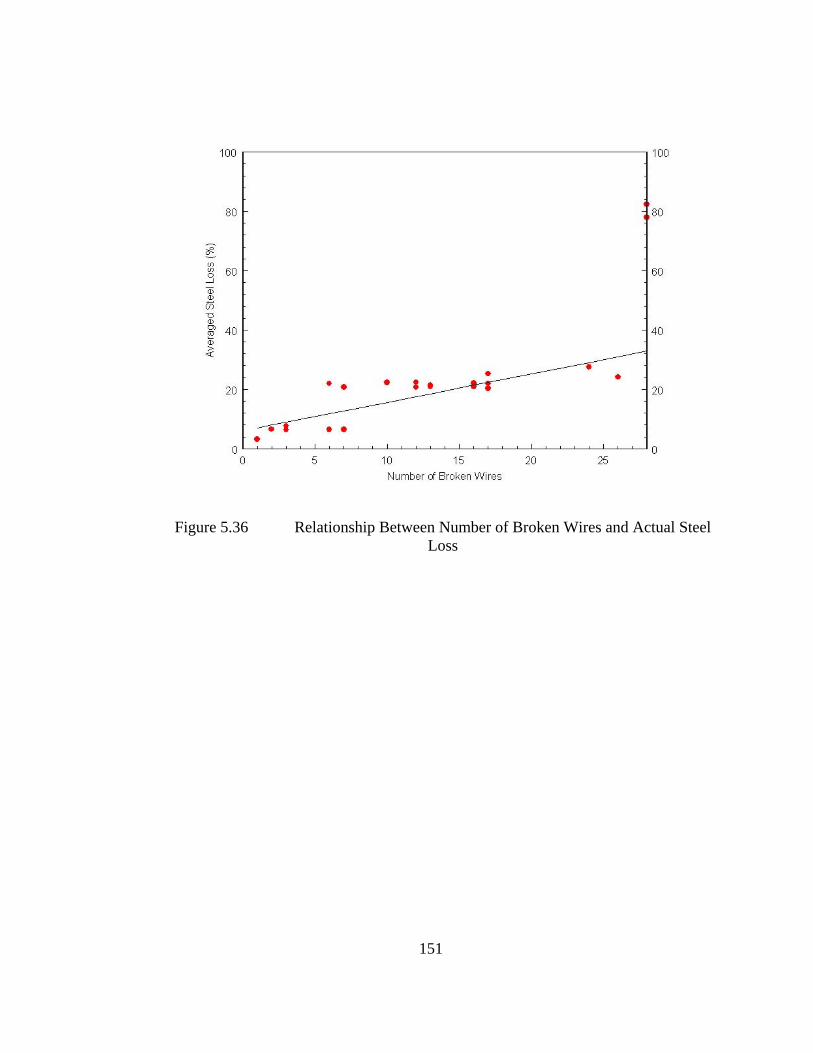
151
Figure 5.36 Relationship Between Number of Broken Wires and Actual Steel Loss
152
CHAPTER 6
ALLEN CREEK BRIDGE REPAIR
6.1 Overview
The structure selected by the Florida Department of Transportation for the first
field demonstration project was the Allen Creek Bridge (#150036) located in Clearwater,
Florida (Figs. 6.1-2). It met critical access requirements, e.g. shallow waters, proximity to
the university, yet provided an aggressive environment with a long history of severe
substructure corrosion problems in piles.
Allen Creek Bridge is located on the busy US 19 highway 1.5 miles north of SR
686. Originally constructed in 1951, it was supported on 20in x 20in reinforced concrete
piles. In 1982, the bridge was widened to accommodate additional traffic lanes. The
widened section is supported by 14in x 14in piles that were prestressed by eight ½in
Grade 270 stress relieved strands.
All piles are spaced 15ft apart in the North-South direction and 6.5ft apart in the
East-West direction. A total of ten 14in ×14in prestressed piles located on the East side of
the bridge were selected for the study. Details are summarized in Table 6.1. Two piles of
the ten piles B1 and G1 were used as controls. Another four piles (E1, E2, F1, F2) were
wrapped using the Aquawrap system of AirLogistics Inc. The remaining four piles C1,
C2, D1, D2 were repaired by MAS2000 CFRP wrap system developed by SDR
Engineering. Details of their study may be found in another publication[Suh et al. 2005].
153
The waters from the creek flow east into Old Tampa Bay that in turn joins the
Gulf of Mexico to the south. The environment is very aggressive; all the reinforced
concrete piles from the original construction have been rehabilitated several times. At
low tide, the water level in the deepest portion of the creek was about 2.6ft. Maximum
high tide is about 6ft. This shallow depth meant that the underwater wrap would not
require divers and could be carried out on a ladder.
6.2 Test Program
6.2.1 Initial Inspection
A preliminary inspection of the piles revealed no visible signs of corrosion. The
delamination test by tapping pile surfaces with a hammer showed no hollow sound in any
of the piles. To evaluate the initial corrosion state, several piles were instrumented to
allow half-cell potential and the corrosion rate to be assessed.
Two concrete cores were taken to the level of the steel to determine the chloride
variation. The first sample was at the elevation corresponding to high tide. The second
was 3ft above high tide. The total chloride was determined at every inch down to the
level of the steel by Florida Department of Transportations’s State Materials Office.
Results that they provided are summarized in Table 6.2 indicating that the chloride
threshold for corrosion was easily exceeded at the high tide location. The chloride level
varied between 6.71-5.59lb/cy. Values were much greater 3ft above high tide where it
was 12.53lb/cy in the initial inch of cover and reducing to 0.86lb/cy in the vicinity of the
prestressing steel. This is typical of chloride variation observed in specimens exposed to
tidal waters – it is always much higher above the high tide region. This information is
useful in assessing the extent of the pile wrap above the high water line.
154
6.2.2 Instrumentation
A total of six piles (B2, C1, D1, E2, F1, G1) were instrumented for monitoring
corrosion progress of prestressed steel. As shown Figure 6.3, 42in long, 3/16in diameter,
316 stainless steel bars were embedded in each pile face. A ¼in × 45in × 7/8in groove
was made using a grinder on the four surfaces of the piles that were instrumented. The
stainless steel bars were inserted in the groove and mortar was used to close the groove
(Fig. 6.4).
Although all strands could be physically connected to one another by ties, four
grounding bars were installed on each of the four faces of the piles to ensure electric
continuity. A 2in diameter, 3in deep hole was cored on the surface of the concrete using
a center-hole drill. A four inch length of 316 stainless steel bar were brazed on to the
strand (Fig. 6.5). The holes were filled with mortar.
The instrumentation system allowed linear polarization and half cell potential
measurement to be carried out. These were performed once a week prior to wrapping and
once every two weeks after wrapping. A PR Monitor manufactured by Cortest
Instrument Systems, Inc. was used to perform on-site linear polarization measurements
using a three-electrode probe comprising a reference, working, and counter electrode. PR
monitor measures the polarization resistance of electrochemical system in the pile. As the
polarization resistance is inversely proportional to the corrosion rate, the corrosion rate of
steel can be estimated. Each of the four stainless steel embedded bars was used as a
reference electrode with the other three serving as counter electrodes. Therefore, the
polarization test was conducted four times per pile changing the reference electrode in
turn and averaging the data (Figs. 6.6-7). Assuming that only the same length of
155
prestressed steel strand with counter electrode was polarized (46in length), the polarized
steel area was calculated as 4534cm2.
6.2.3 FRP Wrapping
Dry Wrap (Mas 2000 by SDR Engineering)
Four piles were wrapped with 2 or 4 layers of CFRP by SDR Engineering, Inc.
Since the materials used for these piles needed complete dry condition for application and
curing, a cofferdam was installed for CFRP wrapping (Fig. 6.8). Prior to application of
wrap, concrete surface and edges were ground, cleaned, and completely dried (Fig. 6.9).
Pre-cut bi-directional CFRP strips were applied by epoxy saturated roller with 2in.
overlap and exposed surface of CFRP was coated with Sikagard 62 for UV Protection.
The cofferdam was removed after the epoxy was cured completely. Details of SDR’s
work may be found in the final report [Suh et al. 2005].
Wet Wrap (Aquawrap ® by AirLogistics, Inc.)
Wet wrapping system was applied to anther four piles. Before wrapping, holes
and chipped concrete were filled using hydraulic cement (Fig. 6.10). Depressions on the
pile surface were filled with cement paste and sharp edges were rounded using a air
pressure operated grinder (Fig. 6.11). All dust and debris were cleaned by pressure
washer.
Aquawrap is a pre-preg system developed by Air Logistics Inc. It uses a unique
water-activated urethane resin that cures under water. Two types of fibers - carbon and
glass - were used. In this system, both unidirectional and bi-directional fibers were used.
The unidirectional fibers were applied to increase axial capacity and the bi-directional
fibers were used to add both longitudinal and transverse capacity. The capacities of the
156
fibers were selected to match those used for the alternate repair using a cofferdam
system.
Two layers of carbon fiber were applied to pile F1 and F2. The wrapping
procedure is given below (Fig. 6.12):
1. Mix base primer parts A and B completely
2. Apply mixed primer to the concrete surface uniformly by hand.
3. Apply one layer of a 12in × 60in unidirectional carbon fiber pre-preg strip
longitudinally on each face.
4. Apply mixed primer to the surface of the unidirectional carbon fiber.
5. Apply bi-directional pre-preg carbon fiber spirally for two continuous
layers without overlap.
6. Apply one layer of a glass fiber veil with a 2in overlap to consolidate and
provide a smooth finish.
7. Apply a plastic wrap and make tiny holes to allow gaseous products
formed during curing to escape.
8. Remove plastic wrap after curing for one day and apply mixed primer to
the surface of glass fiber veil to provide UV protection.
Four layers of GFRP were applied to E1 and E2. The procedure used was
identical excepting that a greater number of GFRP layers were required. It is described
below (Fig. 6.13):
1. Mix base primer parts A and B completely.
2. Apply mixed primer to the concrete surface
157
3. Apply two layers of 12in × 60in unidirectional glass fiber pre-pregs to
each of the four faces of the pile.
4. Apply mixed primer to the surface of the unidirectional glass fiber.
5. Apply 12in, wide bi-directional glass fiber pre-preg spirally for four
continuous layers.
6. Apply one layer of glass fiber veil to provide a smooth finish.
7. Apply a plastic wrap and puncture holes to allow gaseous products to
escape.
Remove plastic wrap after curing for one day and apply mixed primer to the
surface of glass fiber veil to provide UV protection.
6.3 Test Results
6.3.1 Corrosion Rate Variation
The variation of the corrosion rates in the dry-wrapped (Mas 2000) system and
the wet-wrapped (Aquawrap) system are shown in Fig. 6.14-15. In both cases, the
variation in the ambient temperature at the time of the reading is shown in the same plots.
Inspection of Fig. 6.14 shows that while all the piles were at a similar initial corrosion
state, the corrosion rate (in mils – 0.001in per year) in the dry-wrapped piles were
consistently lower following wrapping. The readings have remained stable, and there was
no significant difference in the performance of the piles wrapped using two or four
carbon layers. However, the corrosion rate for both controls showed a great deal of
fluctuation that did not seem closely related the variation in the ambient temperatures.
For the wet-wrapped system (Fig. 6.15), the corrosion rates for carbon matched those for
the dry-wrapped system in Fig. 6.14. However, the performance of the fiberglass was
158
much poorer and comparable to that of the unwrapped controls. This is shown clearly in
Fig. 6.16 and 6.17 that compare the two systems with each other and the controls.
6.3.2 Bond Test
Two series of pullout tests were conducted to evaluate the FRP/concrete bond. In
both series, an Elcometer106 adhesion tester was used in conjunction with a 1.456in
diameter dolly. In the initial series, on-site pull-out tests were performed on witness
panels in two piles (H1, I1) (Fig. 6.18). These specially created 2ft wide panels were
located in the dry upper part of the pile during the original wrapping operation using both
carbon and glass fiber. The second series was conducted 26 months after the piles had
been wrapped.
The FRP witness panels on the east and west faces of the piles were scored using
1¾ in. diameter diamond drill bit operated by a magnetic drill. The surfaces of the scored
FRP were cleaned using coarse sand paper and the dust was removed with clean water.
Sikadur 32 Hi-Mod was used for bonding dollies to the surface of the scored FRP. The
same amount of Part A and B were mixed for 3 minutes using a low speed drill. A pre-
drilled wood block into which the dolly could be fitted and a tie wrap were used to secure
the dollies in place as the epoxy cured. Bond tests were carried out after the epoxy had
cured for 7 days.
Table 6.3 summarizes the results of the pullout tests. The bond of FRP to the
concrete substrate was found to be very poor. The scored FRP debonded by itself from
concrete surface in three of the four test regions. In the other test area, there was
debonding between fibers.
159
Since marine growth developed within a few months of the wrap, a second series
of tests were conducted in May 2005, more than 26 months after the original wrap using
the same sized dollies and the Elcometer 106 Adhesion Tester. A total of four piles were
selected for the test to encompass both the “dry” (Mas2000) and “wet” (Aquawrap)
wraps. For testing the dry-wrap repair, piles C2 (2 layer carbon) and D1 (4 layer carbon)
were selected. For testing the wet-wrap systems, piles E1 (4 layer glass) and F2 (2 layer
carbon) were selected. The tests were conducted on two faces per pile at two different
levels – in the dry and the tidal region (Fig. 6.19). Instead of Sikadur 32 Hi-Mod epoxy
used in the first series, a faster curing epoxy (Power-Fast+) manufactured by Powers
Fasteners, Inc. was used for bonding the dollies to the FRP. This took 15 minutes to dry
and cured in 24 hours to provide a maximum bond strength of 3000 psi.
The results of the tests are summarized in Table 6.4. Of the sixteen tests
conducted, 13 were epoxy failures and the remaining 3, layer failures. Epoxy failures
refer to failures where the dolly separates from the concrete at its interface. This type of
failure occurred in the dry system (Fig. 6.20). In layer failure, one FRP layer separates
from its adjoining layer indicating that the bond between the FRP layers was poorer than
its bond to concrete. Such failures only occurred in the wet system (Fig. 6.21). Both types
of failures are indicative of poor bond in systems that are referred to as ‘bond-critical’,
i.e. where the performance of the FRP relies exclusively on its bond to the concrete
substrate. In this application in which the FRP was wrapped completely around the pile is
part “contact-critical” and part “bond-critical”.
The performance of the dry system was vastly superior to the wet system.
Compared to the maximum 145psi failure bond stress at the top of the pile in the wet
160
system, the corresponding maximum for the dry system was 362.4psi. The results also
show considerable variation at the bottom, e.g. 58psi and 174psi. The bond values for the
wet wrap system were quite poor especially at the bottom where the value was 29psi and
in one case, zero. The latter case was for carbon. Nonetheless, the corrosion rate
measurements for the carbon wrap from both dry and wet systems were comparable. This
suggests that in corrosion mitigation applications where the FRP is continuous over the
circumference, the level of bond required is smaller compared to that needed for flexural
strengthening in beams and slabs where it is only applied to one surface.
Fig. 6.22 shows the average bond values while the Fig. 6.23 shows the maximum
values. This is included because of the large scatter in the measured data. Inspection of
Fig. 6.22 shows that the average bond stresses from the wet wrap are a small fraction of
that for the dry wrap. This difference is somewhat smaller when the maximum values are
compared as in Fig. 6.23.
6.4 Summary
Based on the results in the Allen Creek Bridge study, the following conclusions
can be drawn:
1. Underwater FRP wrapping is viable. Surface preparation, especially grinding
sharp corners under water can be problematic. Pre-preg systems with water-
activated epoxies allowed piles to be wrapped in under an hour.
2. The innovative instrumentation system installed for monitoring the corrosion
performance of the piles works well. However, it takes time to be stabilized
before the test.
3. Corrosion rate measurements over 2 years indicate the corrosion rate was lower
161
for FRP wrapped piles compared to unwrapped controls. Readings were carbon
from for both “dry” (with cofferdam) and “wet” wrap (underwater epoxies) were
comparable. The performance for 2 and 4 layer wraps were similar. Results from
the wet wrap using fiberglass fluctuated over time and was not as good.
Considering that the corrosion rate of fiberglass wrapped pile was initially high,
the underwater wrapping might not be proper method in the corrosion control of
highly corroded structure. Another explanation is the possibility of insufficient
epoxy during the wrapping performance.
4. The bond between FRP and concrete was much better for the dry wrap compared
to the wet wrap. For the wet wrap, the carbon bonded better to the concrete
surface than the fiber glass. It was better in the region that was usually dry than in
the submerged regions. However, all failures were epoxy failures that occurred at
the FRP/concrete interface or interlayer failures. Despite the much poorer bond
for the wet system, the corrosion rate measurements over two years indicated that
the performance of the dry and wet systems for the carbon wrap was comparable.
This suggests that bond may not be as all-important in corrosion mitigation
applications where the role of the FRP is to serve as a barrier against intrusion of
deleterious materials and also to contain the expansive forces set up due to
corrosion.
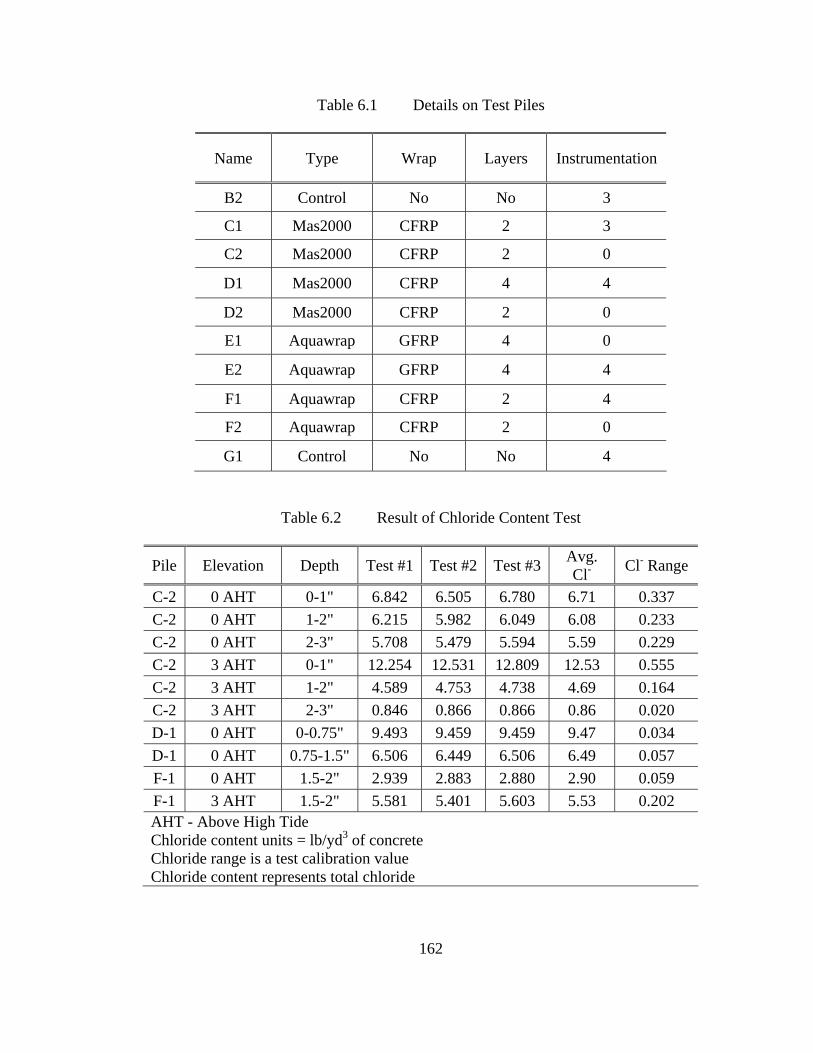
162
Table 6.1 Details on Test Piles
Name Type Wrap Layers Instrumentation
B2 Control No No 3
C1 Mas2000 CFRP 2 3
C2 Mas2000 CFRP 2 0
D1 Mas2000 CFRP 4 4
D2 Mas2000 CFRP 2 0
E1 Aquawrap GFRP 4 0
E2 Aquawrap GFRP 4 4
F1 Aquawrap CFRP 2 4
F2 Aquawrap CFRP 2 0
G1 Control No No 4
Table 6.2 Result of Chloride Content Test
Pile Elevation Depth Test #1 Test #2 Test #3 Avg. Cl- Cl- Range
C-2 0 AHT 0-1" 6.842 6.505 6.780 6.71 0.337 C-2 0 AHT 1-2" 6.215 5.982 6.049 6.08 0.233 C-2 0 AHT 2-3" 5.708 5.479 5.594 5.59 0.229 C-2 3 AHT 0-1" 12.254 12.531 12.809 12.53 0.555 C-2 3 AHT 1-2" 4.589 4.753 4.738 4.69 0.164 C-2 3 AHT 2-3" 0.846 0.866 0.866 0.86 0.020 D-1 0 AHT 0-0.75" 9.493 9.459 9.459 9.47 0.034 D-1 0 AHT 0.75-1.5" 6.506 6.449 6.506 6.49 0.057 F-1 0 AHT 1.5-2" 2.939 2.883 2.880 2.90 0.059 F-1 3 AHT 1.5-2" 5.581 5.401 5.603 5.53 0.202 AHT - Above High Tide Chloride content units = lb/yd3 of concrete Chloride range is a test calibration value Chloride content represents total chloride
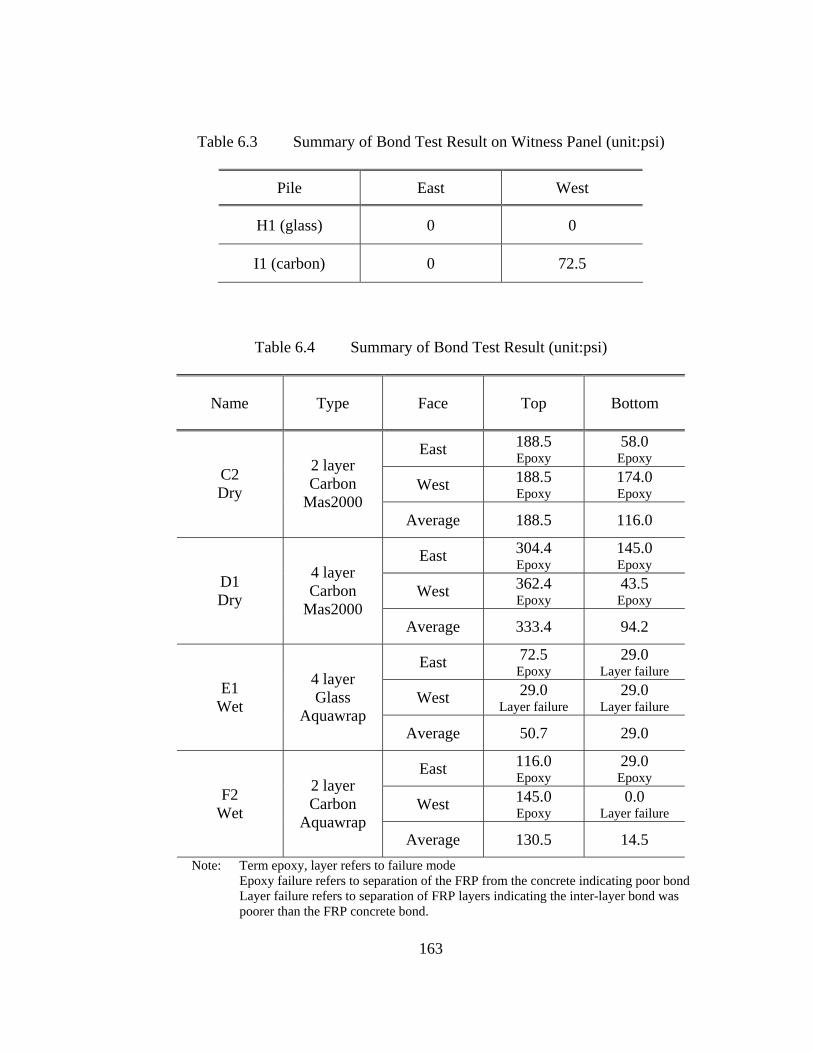
163
Table 6.3 Summary of Bond Test Result on Witness Panel (unit:psi)
Pile East West
H1 (glass) 0 0
I1 (carbon) 0 72.5
Table 6.4 Summary of Bond Test Result (unit:psi)
Name Type Face Top Bottom
East 188.5 Epoxy
58.0 Epoxy
West 188.5 Epoxy
174.0 Epoxy
C2 Dry
2 layer Carbon
Mas2000 Average 188.5 116.0
East 304.4 Epoxy
145.0 Epoxy
West 362.4 Epoxy
43.5 Epoxy
D1 Dry
4 layer Carbon
Mas2000 Average 333.4 94.2
East 72.5 Epoxy
29.0 Layer failure
West 29.0 Layer failure
29.0 Layer failure
E1 Wet
4 layer Glass
Aquawrap Average 50.7 29.0
East 116.0 Epoxy
29.0 Epoxy
West 145.0 Epoxy
0.0 Layer failure
F2 Wet
2 layer Carbon
Aquawrap Average 130.5 14.5
Note: Term epoxy, layer refers to failure mode Epoxy failure refers to separation of the FRP from the concrete indicating poor bond
Layer failure refers to separation of FRP layers indicating the inter-layer bond was poorer than the FRP concrete bond.
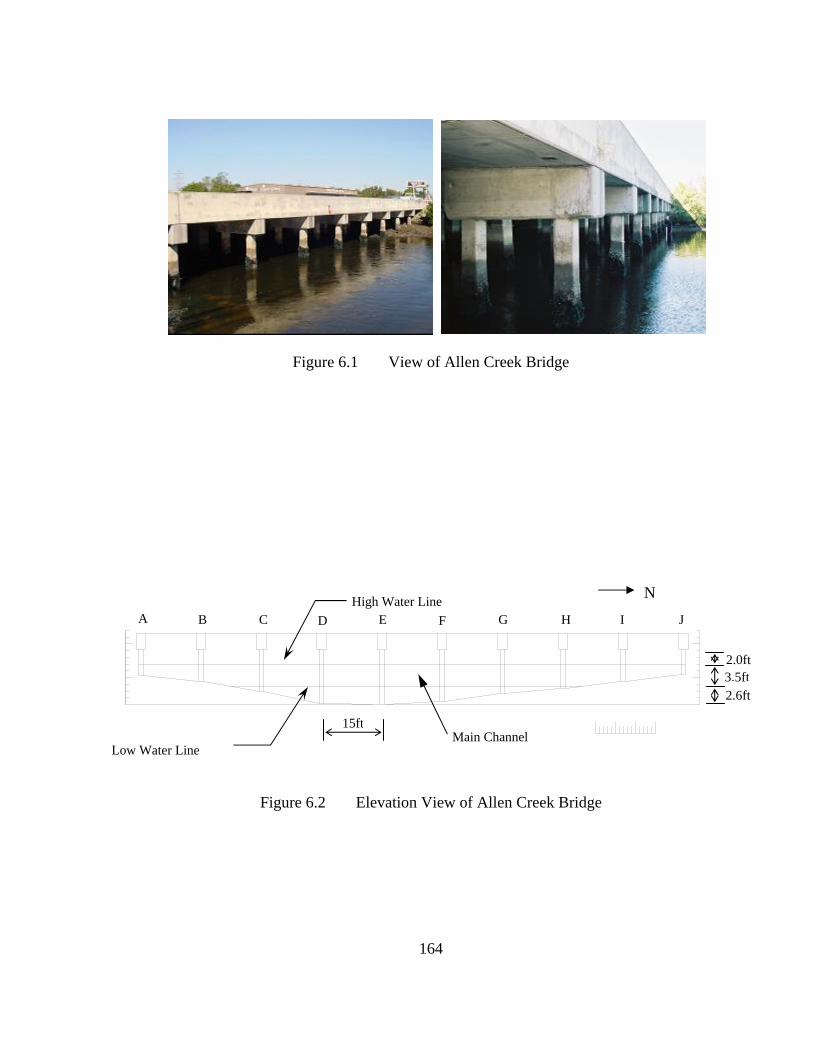
164
Figure 6.1 View of Allen Creek Bridge
Figure 6.2 Elevation View of Allen Creek Bridge
2.0ft 3.5ft2.6ft
15ft
High Water Line
Low Water Line Main Channel
A J I H G F E D C B
N
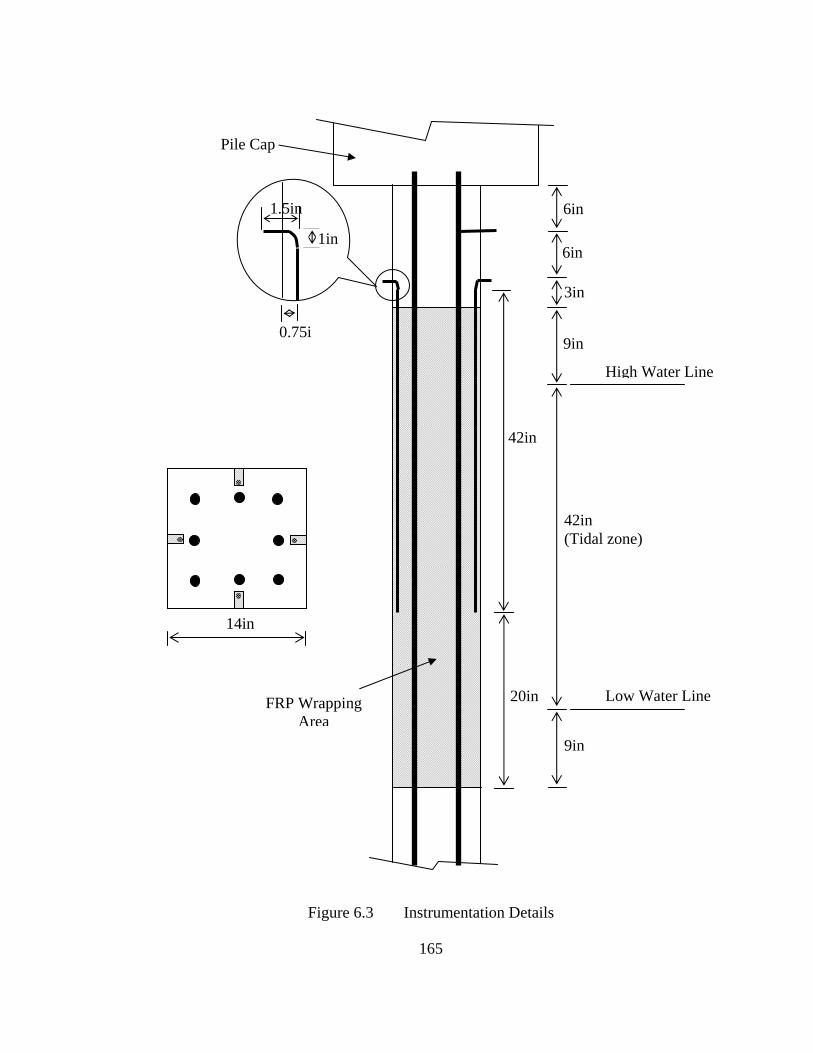
165
Figure 6.3 Instrumentation Details
14in
42in (Tidal zone)
6in
6in
3in
9in
9in
42in
20in
1.5in
1in
0.75i
Pile Cap
FRP Wrapping Area
High Water Line
Low Water Line
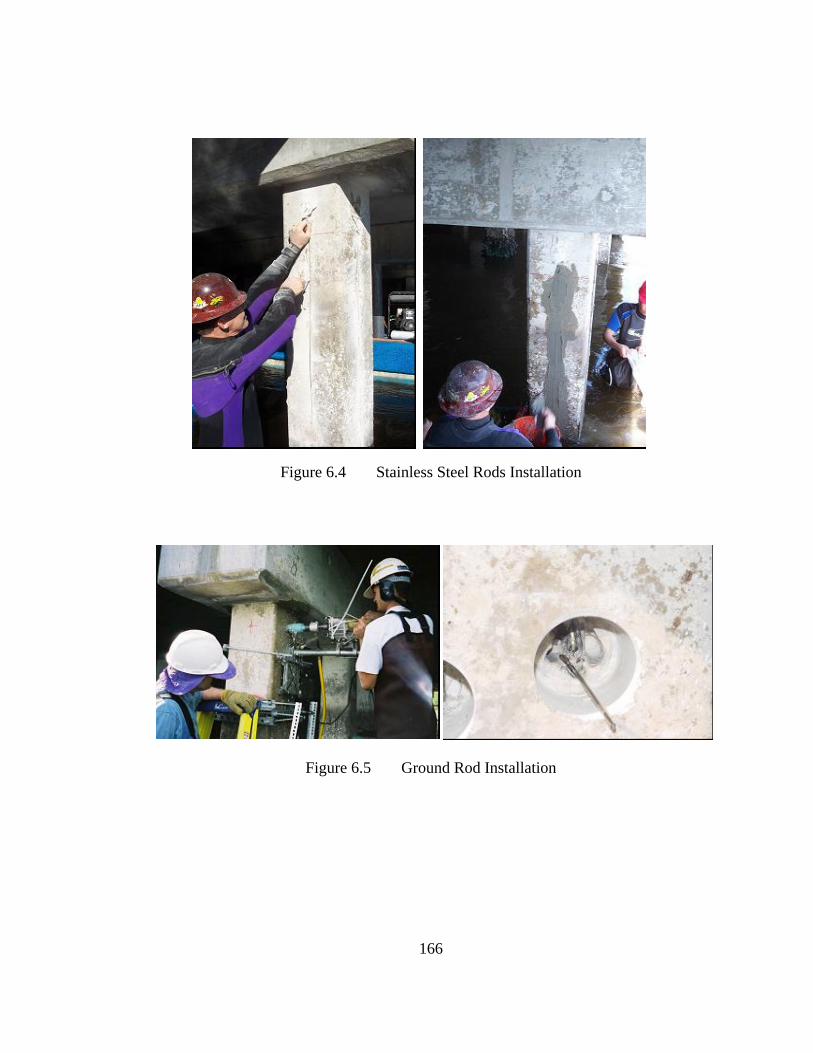
166
Figure 6.4 Stainless Steel Rods Installation
Figure 6.5 Ground Rod Installation
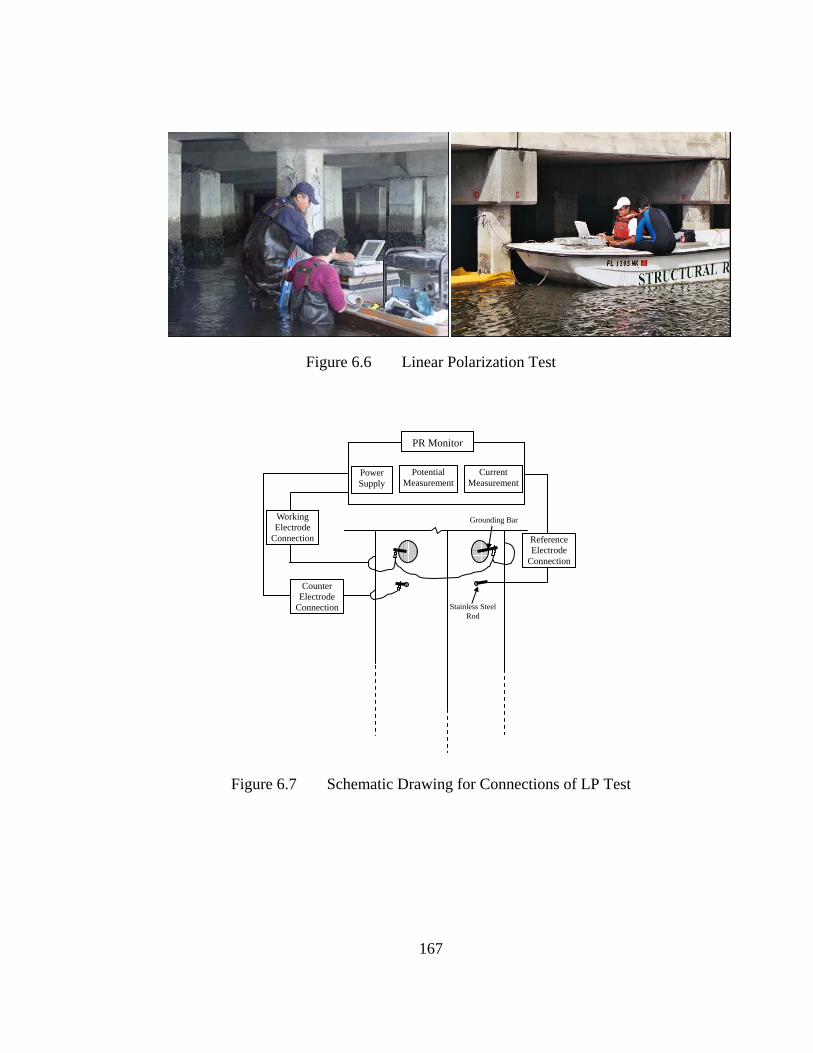
167
Figure 6.6 Linear Polarization Test
Figure 6.7 Schematic Drawing for Connections of LP Test
Power Supply
Potential Measurement
Current Measurement
PR Monitor
Working Electrode
Connection Reference Electrode
Connection
Counter Electrode
Connection Stainless Steel Rod
Grounding Bar
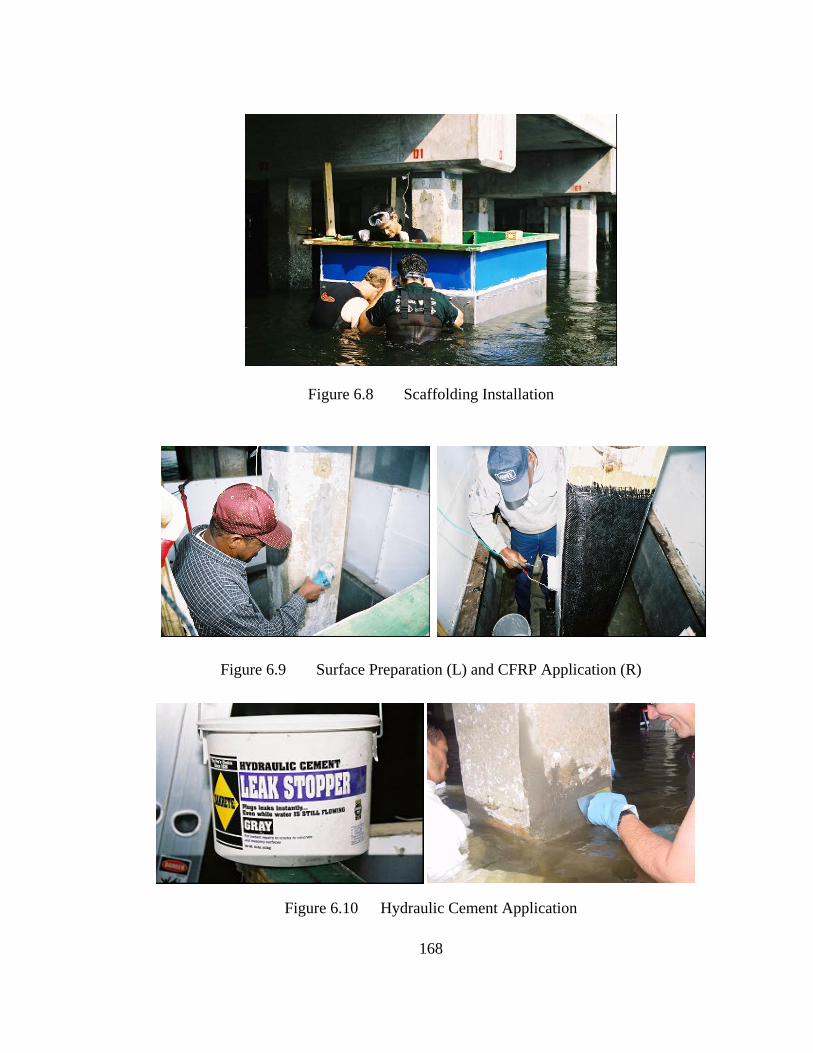
168
Figure 6.8 Scaffolding Installation
Figure 6.9 Surface Preparation (L) and CFRP Application (R)
Figure 6.10 Hydraulic Cement Application
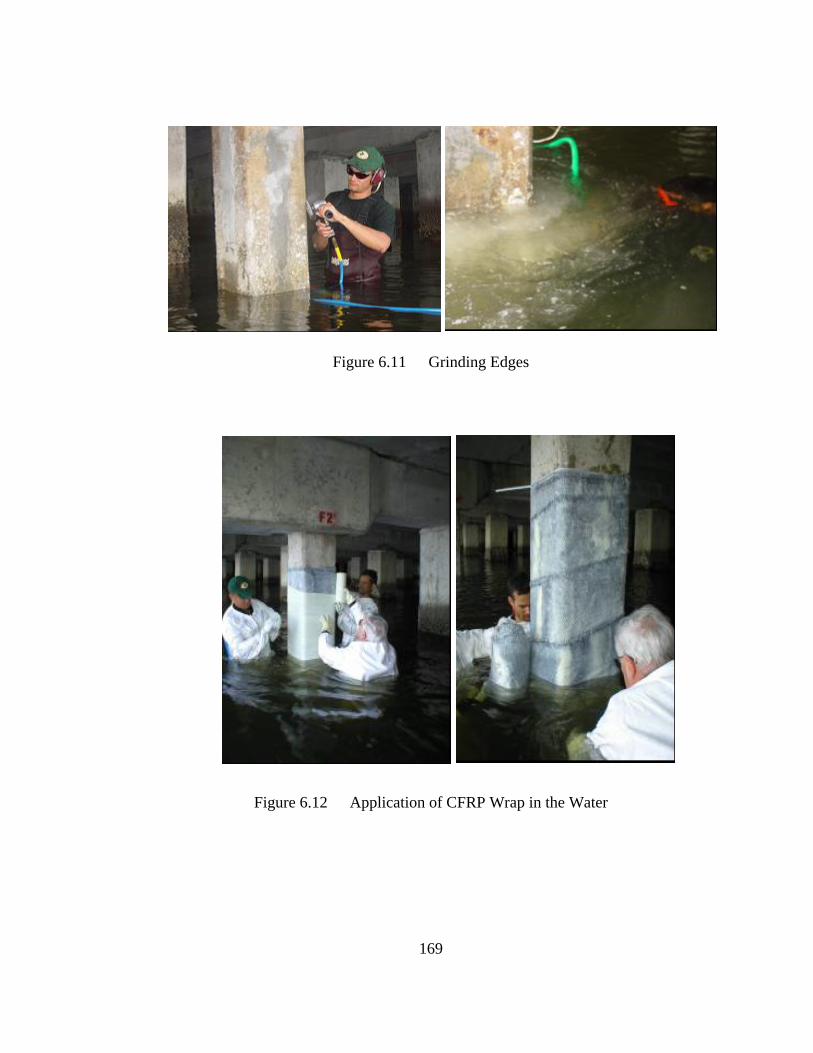
169
Figure 6.11 Grinding Edges
Figure 6.12 Application of CFRP Wrap in the Water
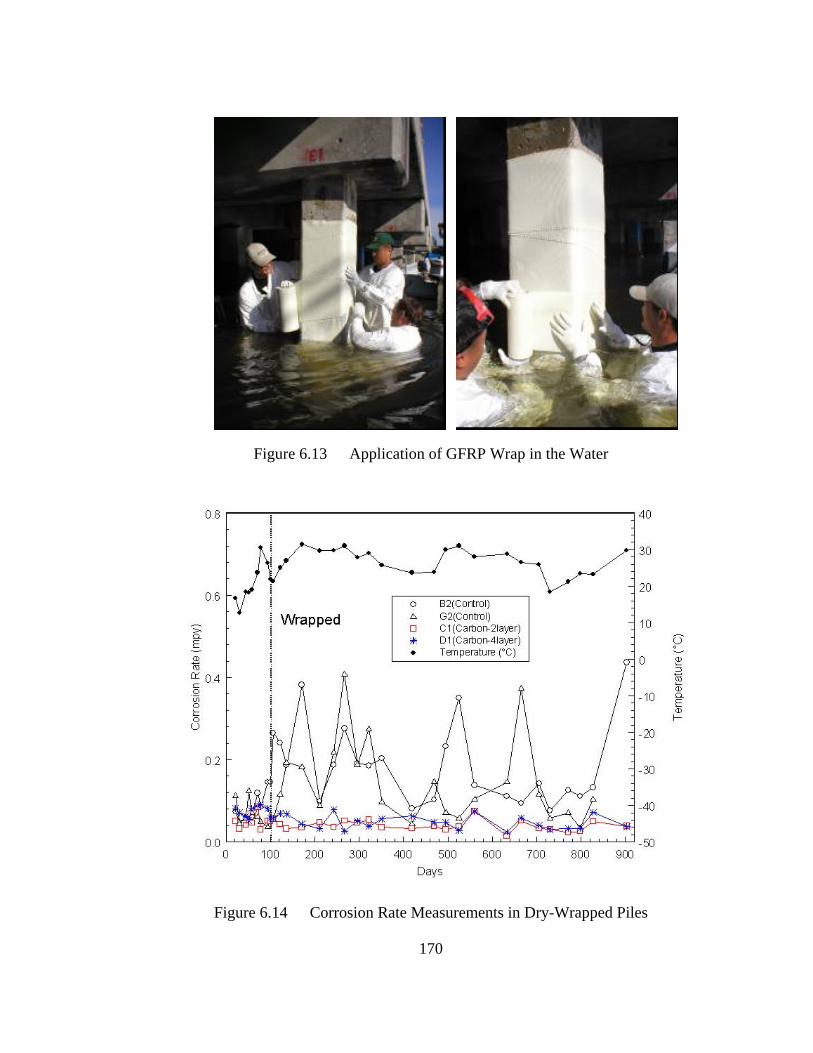
170
Figure 6.13 Application of GFRP Wrap in the Water
Figure 6.14 Corrosion Rate Measurements in Dry-Wrapped Piles
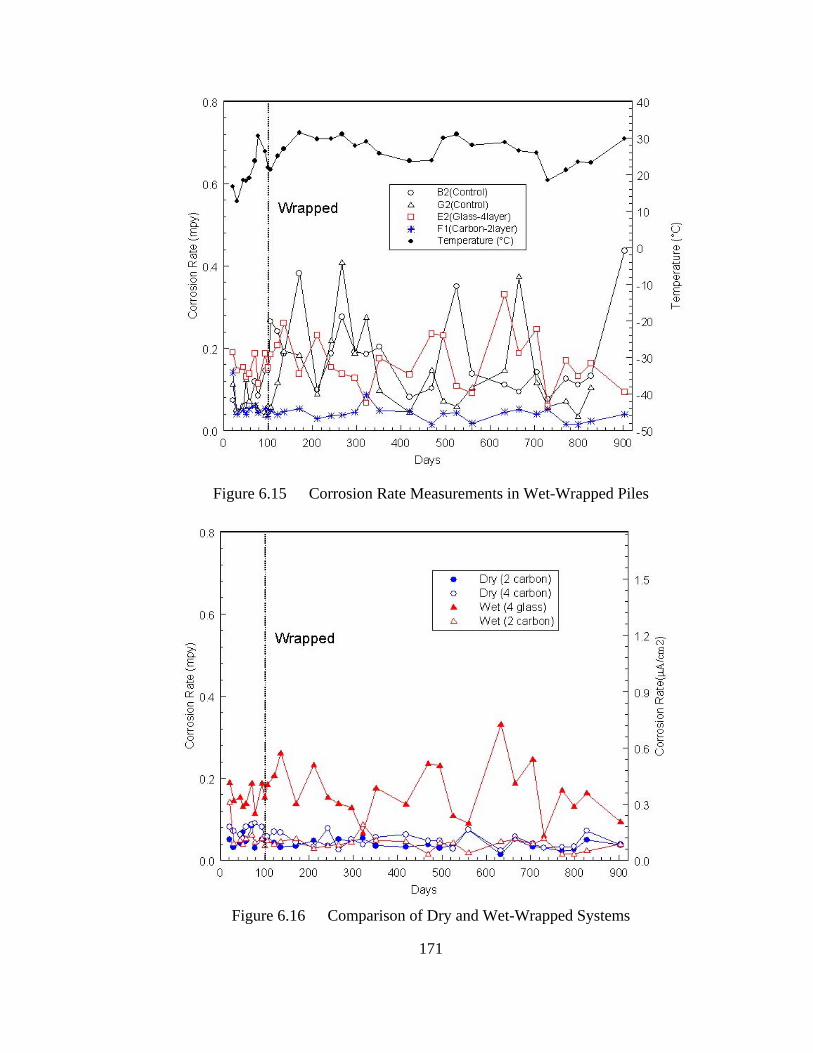
171
Figure 6.15 Corrosion Rate Measurements in Wet-Wrapped Piles
Figure 6.16 Comparison of Dry and Wet-Wrapped Systems
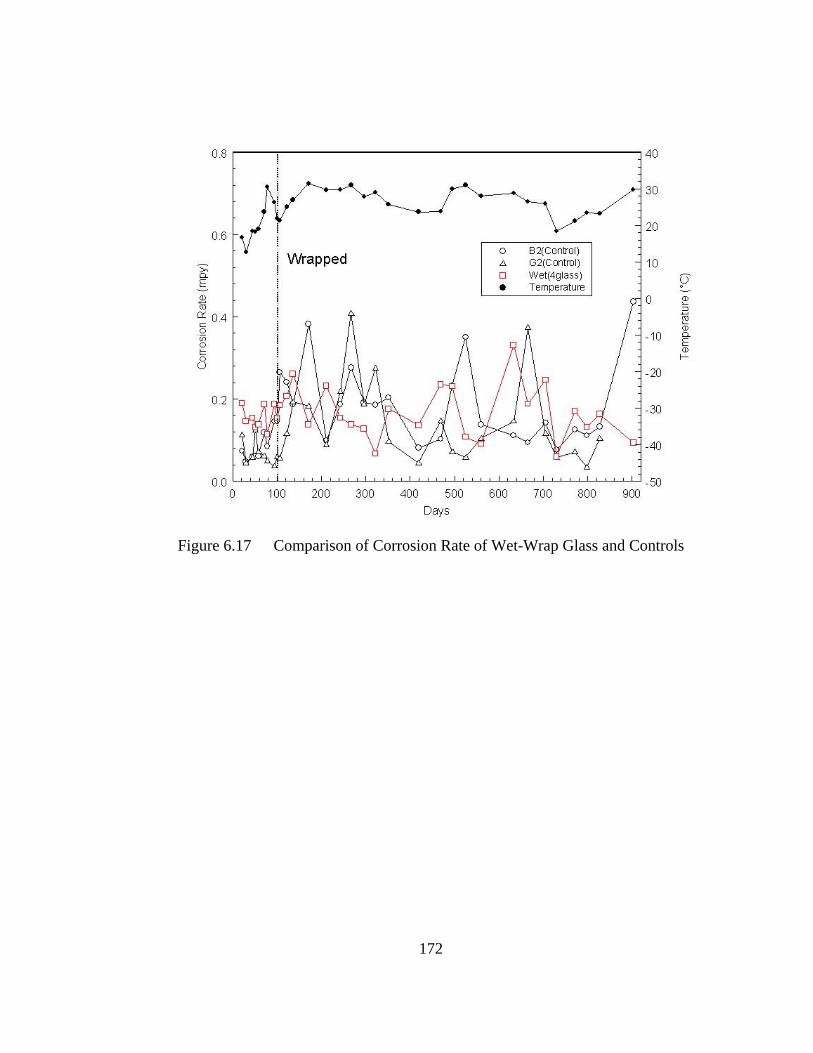
172
Figure 6.17 Comparison of Corrosion Rate of Wet-Wrap Glass and Controls
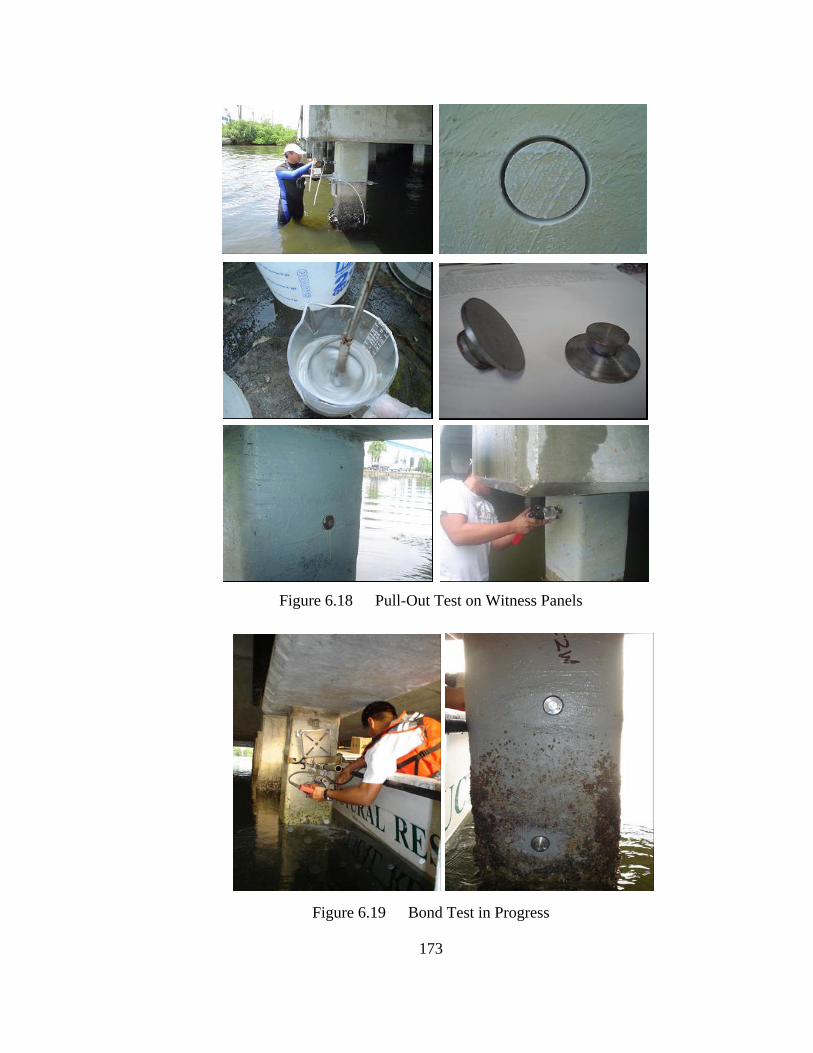
173
Figure 6.18 Pull-Out Test on Witness Panels
Figure 6.19 Bond Test in Progress
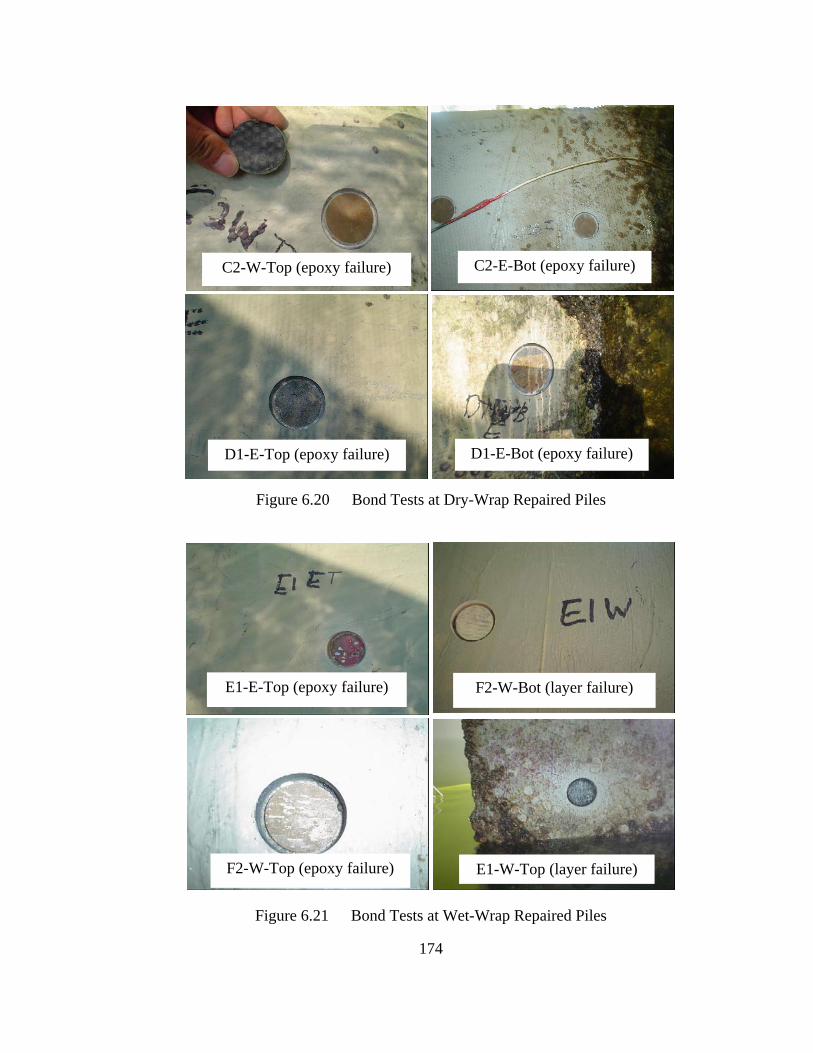
174
D1-E-Bot (epoxy failure)
C2-W-Top (epoxy failure) C2-E-Bot (epoxy failure)
D1-E-Top (epoxy failure)
E1-E-Top (epoxy failure)
E1-W-Top (layer failure)
F2-W-Bot (layer failure)
F2-W-Top (epoxy failure)
Figure 6.20 Bond Tests at Dry-Wrap Repaired Piles
Figure 6.21 Bond Tests at Wet-Wrap Repaired Piles
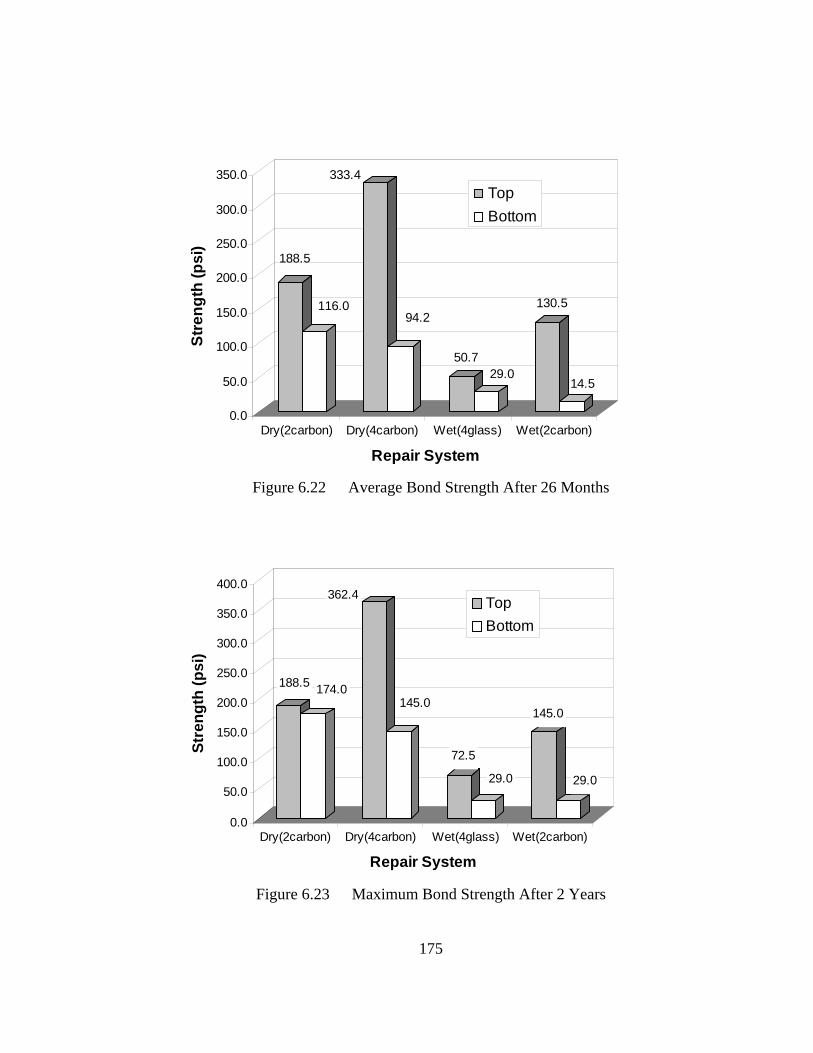
175
188.5 174.0
362.4
145.0
72.5
29.0
145.0
29.0
0.0
50.0
100.0
150.0
200.0
250.0
300.0
350.0
400.0
Stre
ngth
(psi
)
Dry(2carbon) Dry(4carbon) Wet(4glass) Wet(2carbon)
Repair System
TopBottom
188.5
116.0
333.4
94.2
50.729.0
130.5
14.5
0.0
50.0
100.0
150.0
200.0
250.0
300.0
350.0
Stre
ngth
(psi
)
Dry(2carbon) Dry(4carbon) Wet(4glass) Wet(2carbon)
Repair System
TopBottom
Figure 6.22 Average Bond Strength After 26 Months
Figure 6.23 Maximum Bond Strength After 2 Years
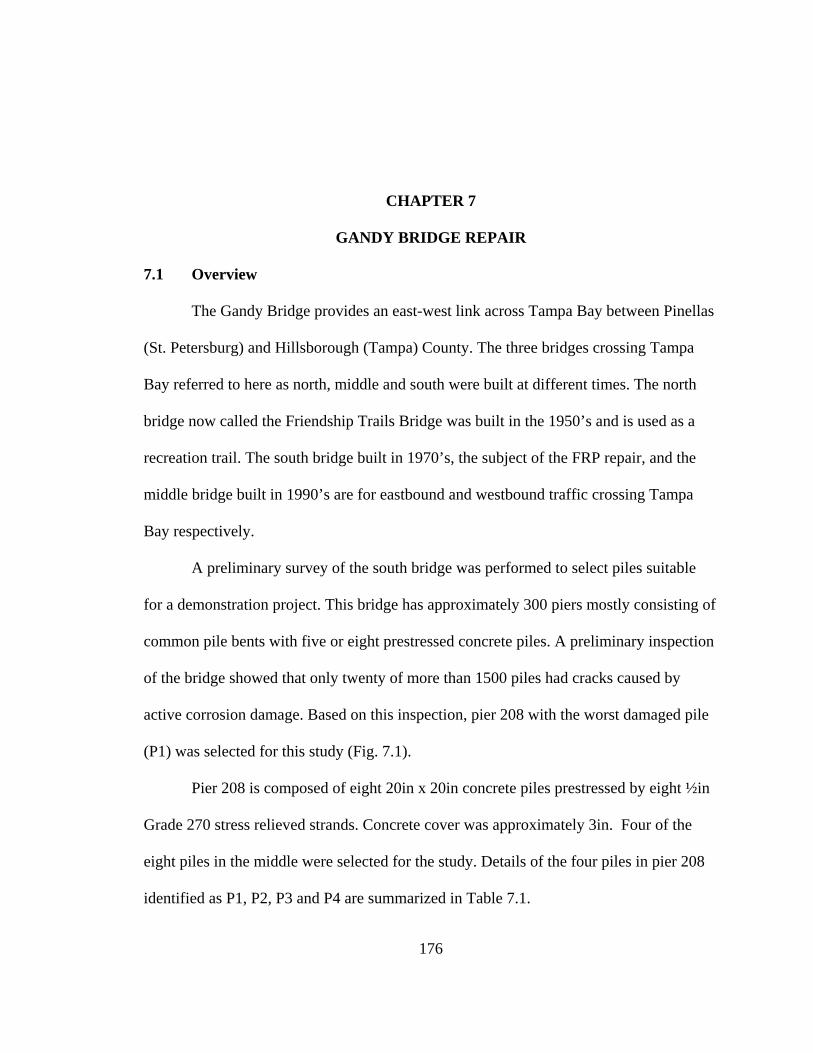
176
CHAPTER 7
GANDY BRIDGE REPAIR
7.1 Overview
The Gandy Bridge provides an east-west link across Tampa Bay between Pinellas
(St. Petersburg) and Hillsborough (Tampa) County. The three bridges crossing Tampa
Bay referred to here as north, middle and south were built at different times. The north
bridge now called the Friendship Trails Bridge was built in the 1950’s and is used as a
recreation trail. The south bridge built in 1970’s, the subject of the FRP repair, and the
middle bridge built in 1990’s are for eastbound and westbound traffic crossing Tampa
Bay respectively.
A preliminary survey of the south bridge was performed to select piles suitable
for a demonstration project. This bridge has approximately 300 piers mostly consisting of
common pile bents with five or eight prestressed concrete piles. A preliminary inspection
of the bridge showed that only twenty of more than 1500 piles had cracks caused by
active corrosion damage. Based on this inspection, pier 208 with the worst damaged pile
(P1) was selected for this study (Fig. 7.1).
Pier 208 is composed of eight 20in x 20in concrete piles prestressed by eight ½in
Grade 270 stress relieved strands. Concrete cover was approximately 3in. Four of the
eight piles in the middle were selected for the study. Details of the four piles in pier 208
identified as P1, P2, P3 and P4 are summarized in Table 7.1.
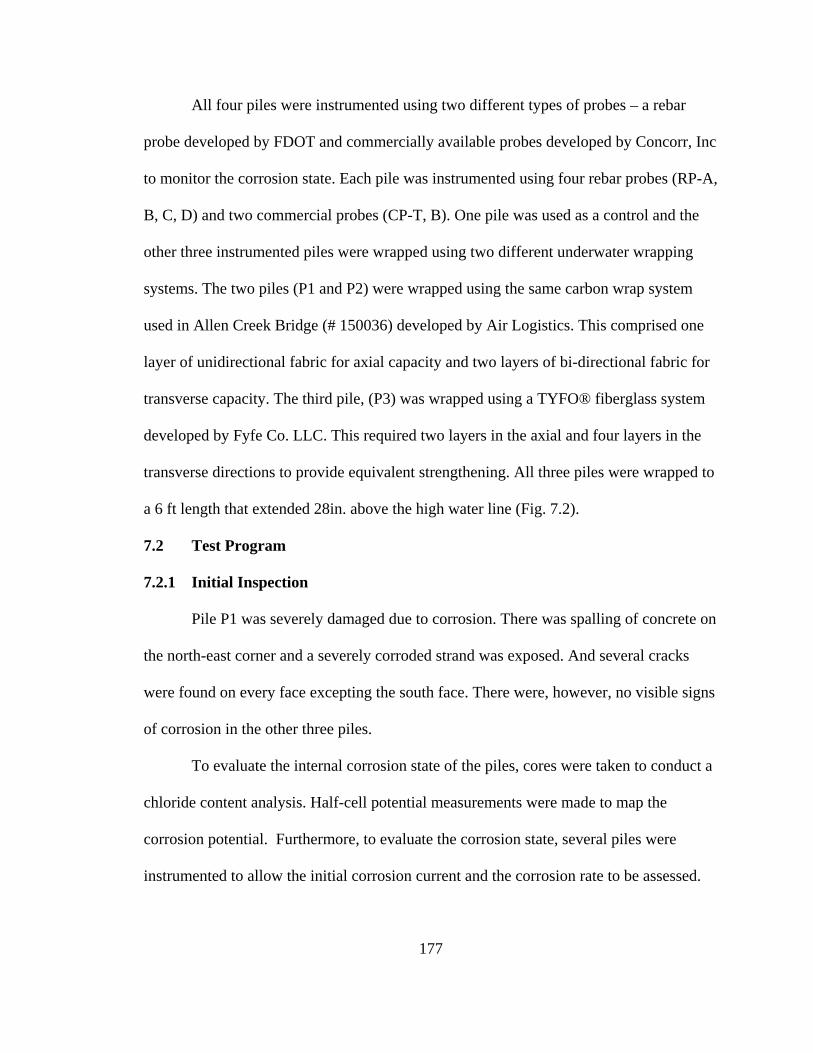
177
All four piles were instrumented using two different types of probes – a rebar
probe developed by FDOT and commercially available probes developed by Concorr, Inc
to monitor the corrosion state. Each pile was instrumented using four rebar probes (RP-A,
B, C, D) and two commercial probes (CP-T, B). One pile was used as a control and the
other three instrumented piles were wrapped using two different underwater wrapping
systems. The two piles (P1 and P2) were wrapped using the same carbon wrap system
used in Allen Creek Bridge (# 150036) developed by Air Logistics. This comprised one
layer of unidirectional fabric for axial capacity and two layers of bi-directional fabric for
transverse capacity. The third pile, (P3) was wrapped using a TYFO® fiberglass system
developed by Fyfe Co. LLC. This required two layers in the axial and four layers in the
transverse directions to provide equivalent strengthening. All three piles were wrapped to
a 6 ft length that extended 28in. above the high water line (Fig. 7.2).
7.2 Test Program
7.2.1 Initial Inspection
Pile P1 was severely damaged due to corrosion. There was spalling of concrete on
the north-east corner and a severely corroded strand was exposed. And several cracks
were found on every face excepting the south face. There were, however, no visible signs
of corrosion in the other three piles.
To evaluate the internal corrosion state of the piles, cores were taken to conduct a
chloride content analysis. Half-cell potential measurements were made to map the
corrosion potential. Furthermore, to evaluate the corrosion state, several piles were
instrumented to allow the initial corrosion current and the corrosion rate to be assessed.
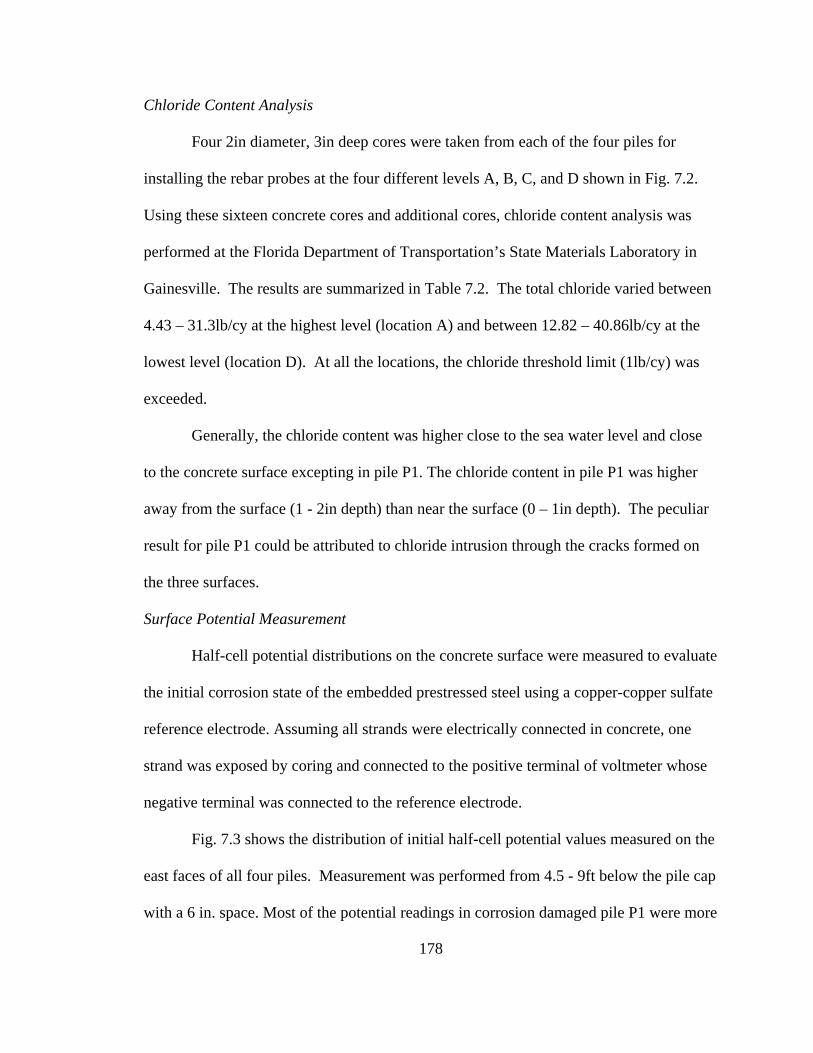
178
Chloride Content Analysis
Four 2in diameter, 3in deep cores were taken from each of the four piles for
installing the rebar probes at the four different levels A, B, C, and D shown in Fig. 7.2.
Using these sixteen concrete cores and additional cores, chloride content analysis was
performed at the Florida Department of Transportation’s State Materials Laboratory in
Gainesville. The results are summarized in Table 7.2. The total chloride varied between
4.43 – 31.3lb/cy at the highest level (location A) and between 12.82 – 40.86lb/cy at the
lowest level (location D). At all the locations, the chloride threshold limit (1lb/cy) was
exceeded.
Generally, the chloride content was higher close to the sea water level and close
to the concrete surface excepting in pile P1. The chloride content in pile P1 was higher
away from the surface (1 - 2in depth) than near the surface (0 – 1in depth). The peculiar
result for pile P1 could be attributed to chloride intrusion through the cracks formed on
the three surfaces.
Surface Potential Measurement
Half-cell potential distributions on the concrete surface were measured to evaluate
the initial corrosion state of the embedded prestressed steel using a copper-copper sulfate
reference electrode. Assuming all strands were electrically connected in concrete, one
strand was exposed by coring and connected to the positive terminal of voltmeter whose
negative terminal was connected to the reference electrode.
Fig. 7.3 shows the distribution of initial half-cell potential values measured on the
east faces of all four piles. Measurement was performed from 4.5 - 9ft below the pile cap
with a 6 in. space. Most of the potential readings in corrosion damaged pile P1 were more
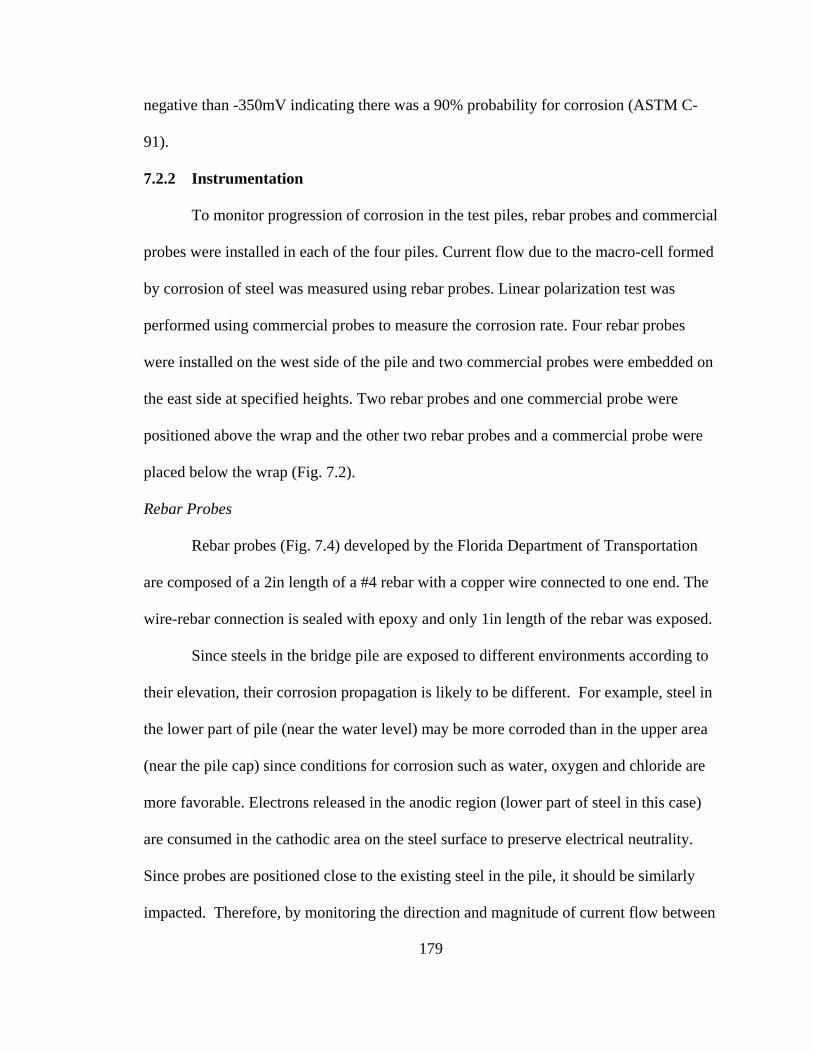
179
negative than -350mV indicating there was a 90% probability for corrosion (ASTM C-
91).
7.2.2 Instrumentation
To monitor progression of corrosion in the test piles, rebar probes and commercial
probes were installed in each of the four piles. Current flow due to the macro-cell formed
by corrosion of steel was measured using rebar probes. Linear polarization test was
performed using commercial probes to measure the corrosion rate. Four rebar probes
were installed on the west side of the pile and two commercial probes were embedded on
the east side at specified heights. Two rebar probes and one commercial probe were
positioned above the wrap and the other two rebar probes and a commercial probe were
placed below the wrap (Fig. 7.2).
Rebar Probes
Rebar probes (Fig. 7.4) developed by the Florida Department of Transportation
are composed of a 2in length of a #4 rebar with a copper wire connected to one end. The
wire-rebar connection is sealed with epoxy and only 1in length of the rebar was exposed.
Since steels in the bridge pile are exposed to different environments according to
their elevation, their corrosion propagation is likely to be different. For example, steel in
the lower part of pile (near the water level) may be more corroded than in the upper area
(near the pile cap) since conditions for corrosion such as water, oxygen and chloride are
more favorable. Electrons released in the anodic region (lower part of steel in this case)
are consumed in the cathodic area on the steel surface to preserve electrical neutrality.
Since probes are positioned close to the existing steel in the pile, it should be similarly
impacted. Therefore, by monitoring the direction and magnitude of current flow between
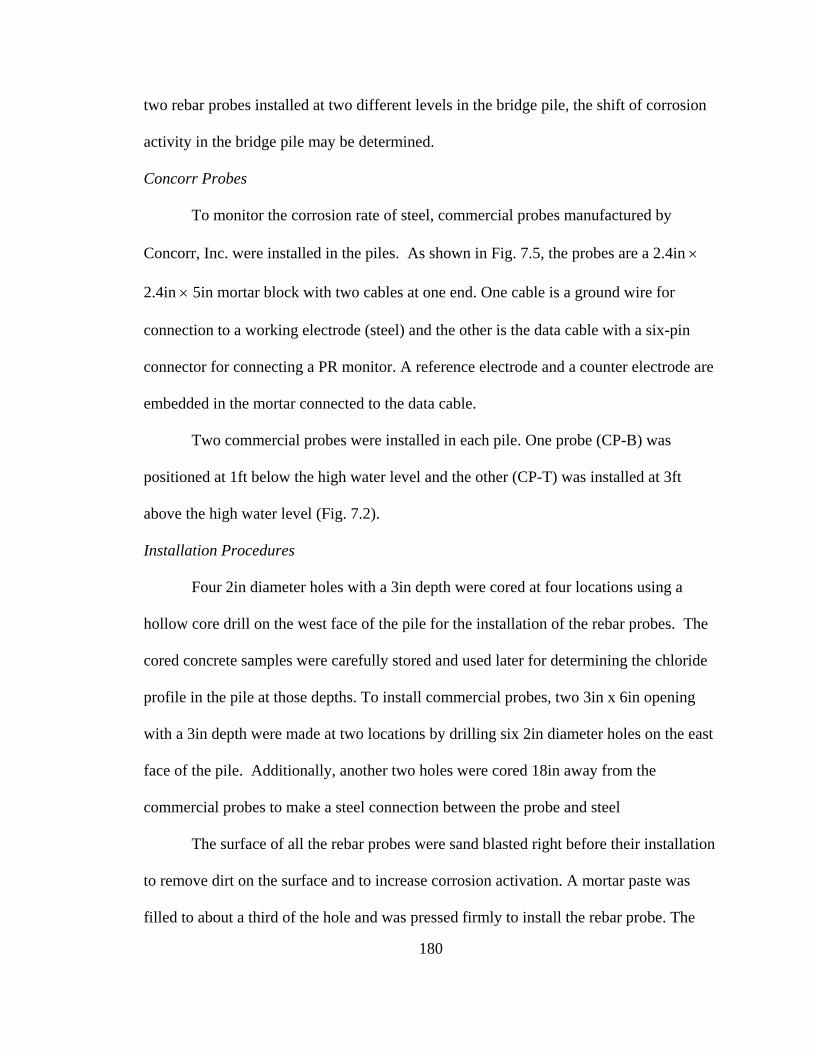
180
two rebar probes installed at two different levels in the bridge pile, the shift of corrosion
activity in the bridge pile may be determined.
Concorr Probes
To monitor the corrosion rate of steel, commercial probes manufactured by
Concorr, Inc. were installed in the piles. As shown in Fig. 7.5, the probes are a 2.4in ×
2.4in × 5in mortar block with two cables at one end. One cable is a ground wire for
connection to a working electrode (steel) and the other is the data cable with a six-pin
connector for connecting a PR monitor. A reference electrode and a counter electrode are
embedded in the mortar connected to the data cable.
Two commercial probes were installed in each pile. One probe (CP-B) was
positioned at 1ft below the high water level and the other (CP-T) was installed at 3ft
above the high water level (Fig. 7.2).
Installation Procedures
Four 2in diameter holes with a 3in depth were cored at four locations using a
hollow core drill on the west face of the pile for the installation of the rebar probes. The
cored concrete samples were carefully stored and used later for determining the chloride
profile in the pile at those depths. To install commercial probes, two 3in x 6in opening
with a 3in depth were made at two locations by drilling six 2in diameter holes on the east
face of the pile. Additionally, another two holes were cored 18in away from the
commercial probes to make a steel connection between the probe and steel
The surface of all the rebar probes were sand blasted right before their installation
to remove dirt on the surface and to increase corrosion activation. A mortar paste was
filled to about a third of the hole and was pressed firmly to install the rebar probe. The
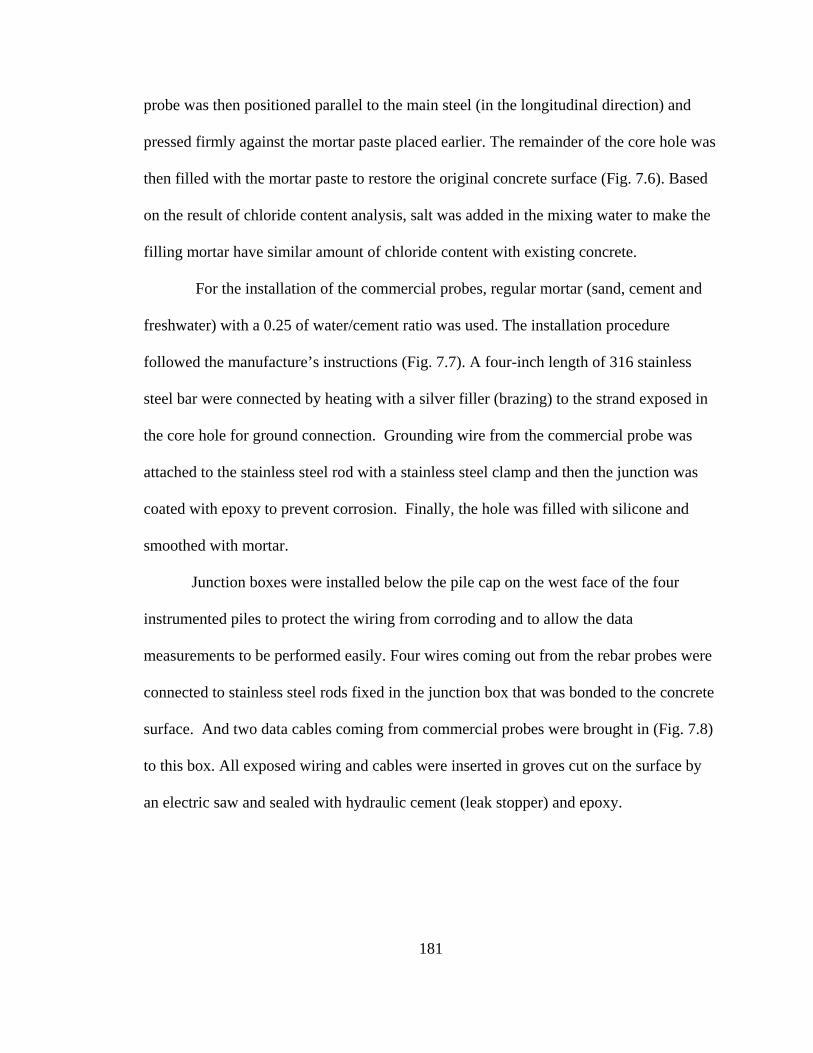
181
probe was then positioned parallel to the main steel (in the longitudinal direction) and
pressed firmly against the mortar paste placed earlier. The remainder of the core hole was
then filled with the mortar paste to restore the original concrete surface (Fig. 7.6). Based
on the result of chloride content analysis, salt was added in the mixing water to make the
filling mortar have similar amount of chloride content with existing concrete.
For the installation of the commercial probes, regular mortar (sand, cement and
freshwater) with a 0.25 of water/cement ratio was used. The installation procedure
followed the manufacture’s instructions (Fig. 7.7). A four-inch length of 316 stainless
steel bar were connected by heating with a silver filler (brazing) to the strand exposed in
the core hole for ground connection. Grounding wire from the commercial probe was
attached to the stainless steel rod with a stainless steel clamp and then the junction was
coated with epoxy to prevent corrosion. Finally, the hole was filled with silicone and
smoothed with mortar.
Junction boxes were installed below the pile cap on the west face of the four
instrumented piles to protect the wiring from corroding and to allow the data
measurements to be performed easily. Four wires coming out from the rebar probes were
connected to stainless steel rods fixed in the junction box that was bonded to the concrete
surface. And two data cables coming from commercial probes were brought in (Fig. 7.8)
to this box. All exposed wiring and cables were inserted in groves cut on the surface by
an electric saw and sealed with hydraulic cement (leak stopper) and epoxy.
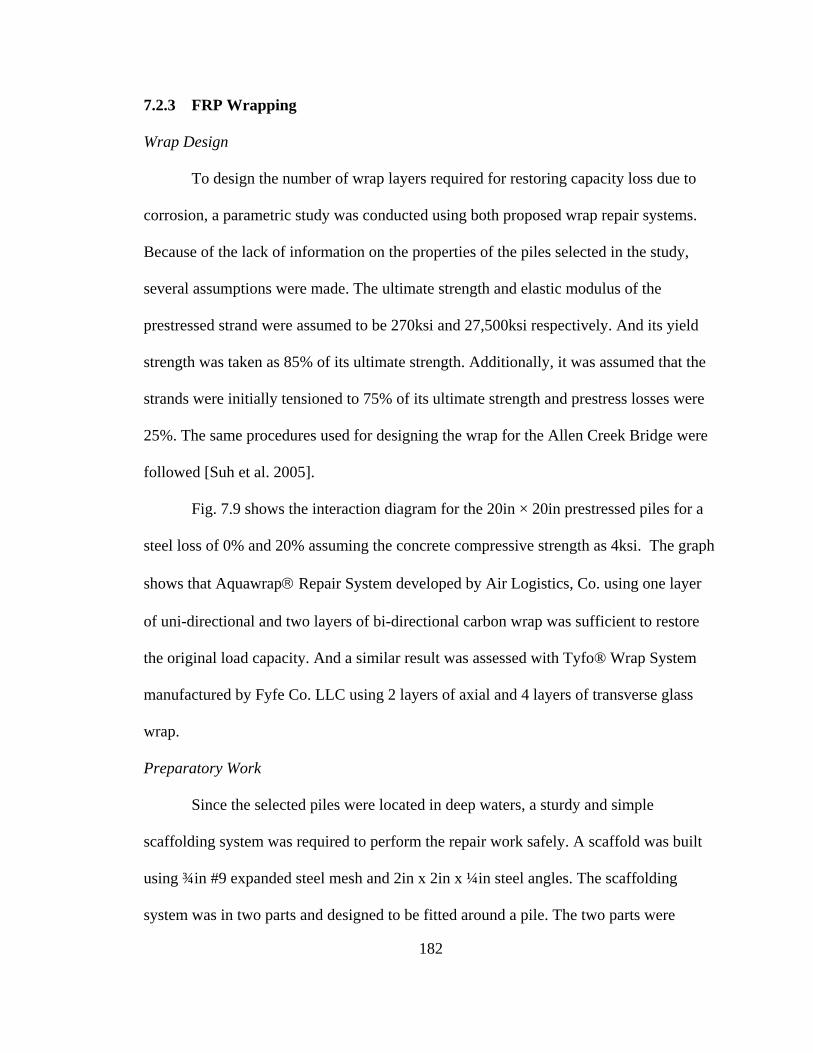
182
7.2.3 FRP Wrapping
Wrap Design
To design the number of wrap layers required for restoring capacity loss due to
corrosion, a parametric study was conducted using both proposed wrap repair systems.
Because of the lack of information on the properties of the piles selected in the study,
several assumptions were made. The ultimate strength and elastic modulus of the
prestressed strand were assumed to be 270ksi and 27,500ksi respectively. And its yield
strength was taken as 85% of its ultimate strength. Additionally, it was assumed that the
strands were initially tensioned to 75% of its ultimate strength and prestress losses were
25%. The same procedures used for designing the wrap for the Allen Creek Bridge were
followed [Suh et al. 2005].
Fig. 7.9 shows the interaction diagram for the 20in × 20in prestressed piles for a
steel loss of 0% and 20% assuming the concrete compressive strength as 4ksi. The graph
shows that Aquawrap® Repair System developed by Air Logistics, Co. using one layer
of uni-directional and two layers of bi-directional carbon wrap was sufficient to restore
the original load capacity. And a similar result was assessed with Tyfo® Wrap System
manufactured by Fyfe Co. LLC using 2 layers of axial and 4 layers of transverse glass
wrap.
Preparatory Work
Since the selected piles were located in deep waters, a sturdy and simple
scaffolding system was required to perform the repair work safely. A scaffold was built
using ¾in #9 expanded steel mesh and 2in x 2in x ¼in steel angles. The scaffolding
system was in two parts and designed to be fitted around a pile. The two parts were
183
assembled in the field and scaffold was suspended over the pile cap using steel chains
(Fig. 7.10).
Due to corrosion of steel, there was delamination and spalling of the surface
concrete in pile P1. Prior to the application of FRP wrap, the lost concrete section was
reformed using Tyfo® PUWECC manufactured by FYFE Co. LLC. Tyfo® PUWECC is
a cement-based patching material designed to be worked in water. After the exposed
surface of the steel and concrete were cleaned by sand blasting, fresh water was applied
to the surface to make them damp for achieving proper bond. Tyfo® PUWECC paste
mixed with fresh water was poured into a wooden mold attached on the targeted corner
by a clamp (Fig. 7.11). All procedures followed manufacture’s instructions.
The marine growth on the surface of all the piles was removed with a scraper and
the surface cleaned with a sand blaster and a grinder operated by air pressure. Projecting
parts of concrete surface were chipped using a hammer and chisel, and depressions were
filled with hydraulic cement. All four corners were chamfered and were ground to a ¾in
radius using a grinder. Just prior to wrapping, all surfaces were pressure washed using
fresh water to remove all dust, debris, and remaining marine growth (Fig. 7.12).
Aquawrap® Application (AirLogistics Co.)
Two piles (P1 and P2) were wrapped using Aquawrap® Repair System developed
by Air Logistics, Co. Both piles were wrapped using one layer of unidirectional carbon
fiber and two layers of bi-directional carbon fibers. The procedures for wrapping the piles
using Aquawrap® Repair System were same with the Allen Creek Bridge repair (Fig.
7.13).
184
Tyfo® Wrap Application (Fyfe Co. LLC)
Only one pile (P3) was wrapped using the Tyfo® Wrap System manufactured by
Fyfe Co. LLC. It comprised a SEH-51A fiberglass fabric, SEH-51AR fiberglass fabric
and Tyfo® SW-1 epoxy. Both SEH-51A fiberglass and SEH-51AR fiberglass are uni-
directional glass fiber having exactly same material properties excepting that their weave
directions have a difference of 90°. This means that even though the wrapping was
applied transversely (easier) using SEH-5AR, the fibers would be oriented vertically and
strengthen the pile in the longitudinal direction. Tyfo® SW-1 is a two component epoxy
developed for underwater use. In this study, two layers of SEH-51AR fabric were
applied for axial capacity and four layers of SEH-51A were applied for transverse
capacity. Unlike Air Logistics’ System that was a ‘pre-preg’, the fibers had to be
impregnated with resin on site. The procedures for wrapping the piles using Tyfo® Wrap
System were as follows (Fig. 7.14).
1. Tyfo® SEH-51A fabric was cut into twelve 24in × 90in pieces for transverse
capacity.
2. Tyfo® SEH-51AR was cut into four 24in × 90in pieces and two 36in × 90in
pieces for axial capacity.
3. Tyfo® SW-1 was mixed using a low speed drill for 5 minutes.
4. Half of the Tyfo® SEH-51A fabric cut in step (i) and half of Tyfo® SEH-
51AR fabric cut in step (ii) were saturated with Tyfo® SW-1 epoxy. Two
quarts of epoxy was used for saturating one piece of fabric and each piece was
made into a roll afterwards for easy transport and application.
185
5. Three 24in × 90in Tyfo® SEH-51A fabric pieces were applied laterally
without overlap for transverse capacity.
6. Another three 24in × 90in Tyfo® SEH-51A fabric pieces were applied
laterally without overlap for transverse capacity.
7. Two 24in × 90in pieces and one 36in × 90in piece Tyfo® SEH-51AR fabric
were applied laterally with 6 in. overlap for axial capacity.
8. Repeat steps from iii to vii.
Place a plastic film over the wrap to protect wrap during curing.
7.3 Test Results
7.3.1 Current Variation
Four sets of corrosion measurements were taken before application of the FRP
wrap to assess the initial corrosion state of the piles. Corrosion monitoring included the
measurement of the current flow between the rebar probes using an ammeter (Extech
RMS multimeter with 2% accuracy) and a linear polarization test using the embedded
commercial probes and a PR monitor. After wrapping, five additional sets of data were
taken. The magnitude and direction of the current flowing between the two probes
embedded at different elevation may provide information on the change in corrosion in
the pile. Fig. 7.16 shows the variation of current flow between rebar probeA (RP-A) and
rebar probeD (RP-D) in all four piles. The RP-A is located in the unwrapped area and
RP-D is embedded in the wrapped concrete (Fig. 7.2). RP-A was connected to the
negative terminal of the ammeter and RP-D was connected to the positive terminal.
Since the lower region in the pile might be more corroded than the upper region at
the initial stage, the current was expected to flow from RP-D to RP-A showing a positive
186
value on the ammeter. Fig. 7.16 shows that initially the current flow in Pile1 and Pile2
was positive meaning that RP-D was more active in corrosion than RP-A. After
wrapping, however, the magnitude of current flow decreased and finally the direction of
current flow reversed as expected. On the other hand, there was little change in the
direction of current flow in Pile3 and Pile4.
7.3.2 Corrosion Rate Variation
Linear polarization tests were performed using the commercial probes installed at
the top (CP-T) and bottom (CP-B) of the piles. CP-T was embedded 3 ft above the high
water level and CP-T was located 1 ft below the high water level. The result of the
corrosion rate measurements using CP-T is shown in Fig. 7.17. As expected, the variation
in the corrosion rate in the top part of the piles was very small. Since seawater could not
reach this area, corrosion might not be active. The rate was highest in Pile1 that had been
severely damaged. Fig. 7.18 shows the variation of the corrosion rate in the tidal zone of
the piles. The corrosion rate in the bottom part was much higher than in the top part for
every pile, especially the previously damaged pile. After wrapping, however, the values
showed a tendency to be stabilized in Pile2 and Pile3 while it was still unstable in Pile1.
There has been no difference in corrosion rate between the wrapped and unwrapped piles.
7.3.3 Bond Test
A total of twelve tests were carried out to evaluate the FRP/concrete bond in May
2005 nearly 6 months after the application of the FRP wrap. Tests were conducted on two
piles (Pile2 - Aquawrap and Pile3 - Tyfo), two faces (north and south) and at three
different elevations as shown in Fig. 7.19. Three 1.75in diameter holes were scored on
the two FRP surfaces using a diamond drill bit. Since the test area was exposed to tide
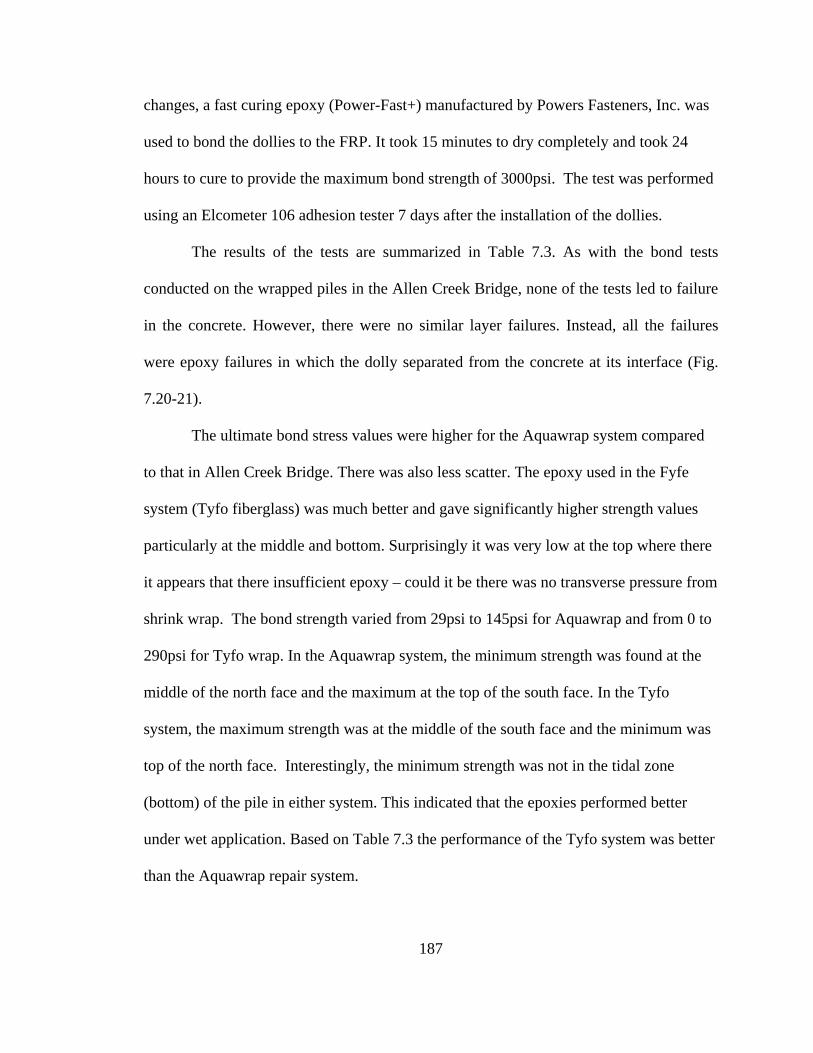
187
changes, a fast curing epoxy (Power-Fast+) manufactured by Powers Fasteners, Inc. was
used to bond the dollies to the FRP. It took 15 minutes to dry completely and took 24
hours to cure to provide the maximum bond strength of 3000psi. The test was performed
using an Elcometer 106 adhesion tester 7 days after the installation of the dollies.
The results of the tests are summarized in Table 7.3. As with the bond tests
conducted on the wrapped piles in the Allen Creek Bridge, none of the tests led to failure
in the concrete. However, there were no similar layer failures. Instead, all the failures
were epoxy failures in which the dolly separated from the concrete at its interface (Fig.
7.20-21).
The ultimate bond stress values were higher for the Aquawrap system compared
to that in Allen Creek Bridge. There was also less scatter. The epoxy used in the Fyfe
system (Tyfo fiberglass) was much better and gave significantly higher strength values
particularly at the middle and bottom. Surprisingly it was very low at the top where there
it appears that there insufficient epoxy – could it be there was no transverse pressure from
shrink wrap. The bond strength varied from 29psi to 145psi for Aquawrap and from 0 to
290psi for Tyfo wrap. In the Aquawrap system, the minimum strength was found at the
middle of the north face and the maximum at the top of the south face. In the Tyfo
system, the maximum strength was at the middle of the south face and the minimum was
top of the north face. Interestingly, the minimum strength was not in the tidal zone
(bottom) of the pile in either system. This indicated that the epoxies performed better
under wet application. Based on Table 7.3 the performance of the Tyfo system was better
than the Aquawrap repair system.
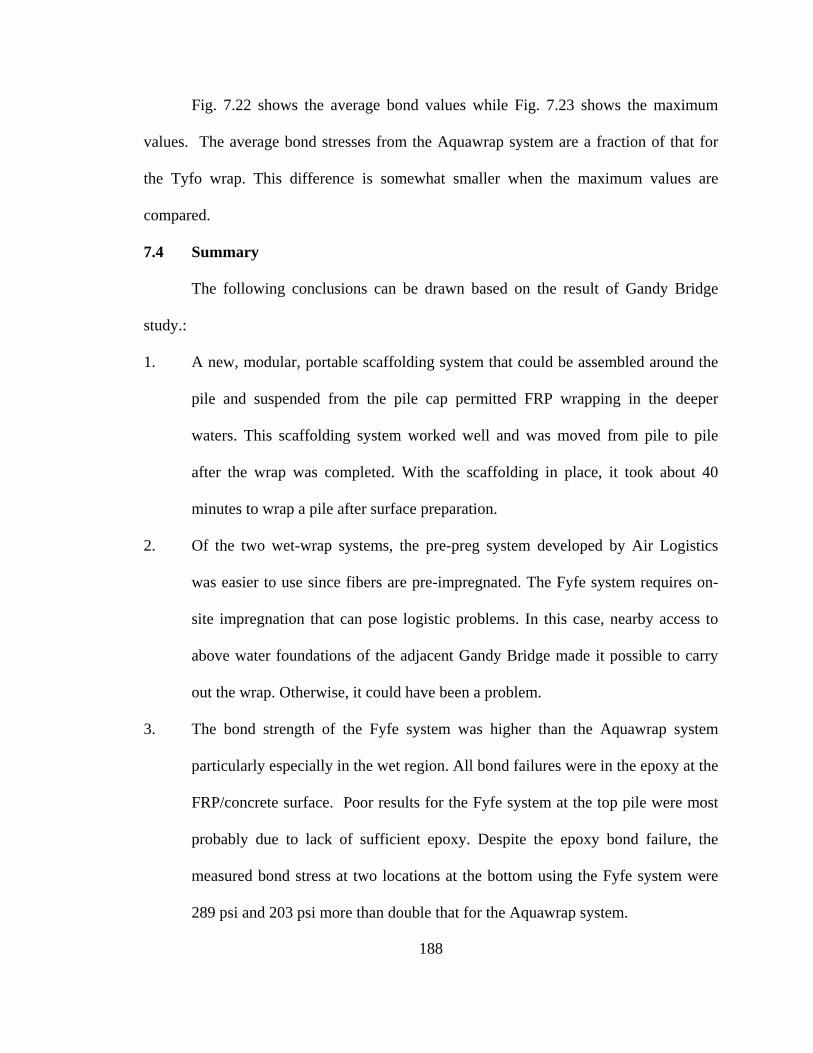
188
Fig. 7.22 shows the average bond values while Fig. 7.23 shows the maximum
values. The average bond stresses from the Aquawrap system are a fraction of that for
the Tyfo wrap. This difference is somewhat smaller when the maximum values are
compared.
7.4 Summary
The following conclusions can be drawn based on the result of Gandy Bridge
study.:
1. A new, modular, portable scaffolding system that could be assembled around the
pile and suspended from the pile cap permitted FRP wrapping in the deeper
waters. This scaffolding system worked well and was moved from pile to pile
after the wrap was completed. With the scaffolding in place, it took about 40
minutes to wrap a pile after surface preparation.
2. Of the two wet-wrap systems, the pre-preg system developed by Air Logistics
was easier to use since fibers are pre-impregnated. The Fyfe system requires on-
site impregnation that can pose logistic problems. In this case, nearby access to
above water foundations of the adjacent Gandy Bridge made it possible to carry
out the wrap. Otherwise, it could have been a problem.
3. The bond strength of the Fyfe system was higher than the Aquawrap system
particularly especially in the wet region. All bond failures were in the epoxy at the
FRP/concrete surface. Poor results for the Fyfe system at the top pile were most
probably due to lack of sufficient epoxy. Despite the epoxy bond failure, the
measured bond stress at two locations at the bottom using the Fyfe system were
289 psi and 203 psi more than double that for the Aquawrap system.
189
4. The two instrumentation systems appear to be working well. The rebar probe
showed a change in the direction of current flow for the most severely corroded
pile but not in the other two. The linear polarization measurements were taken,
but it is too early to draw conclusions on the effect of FRP wrapping on corrosion
of steel.
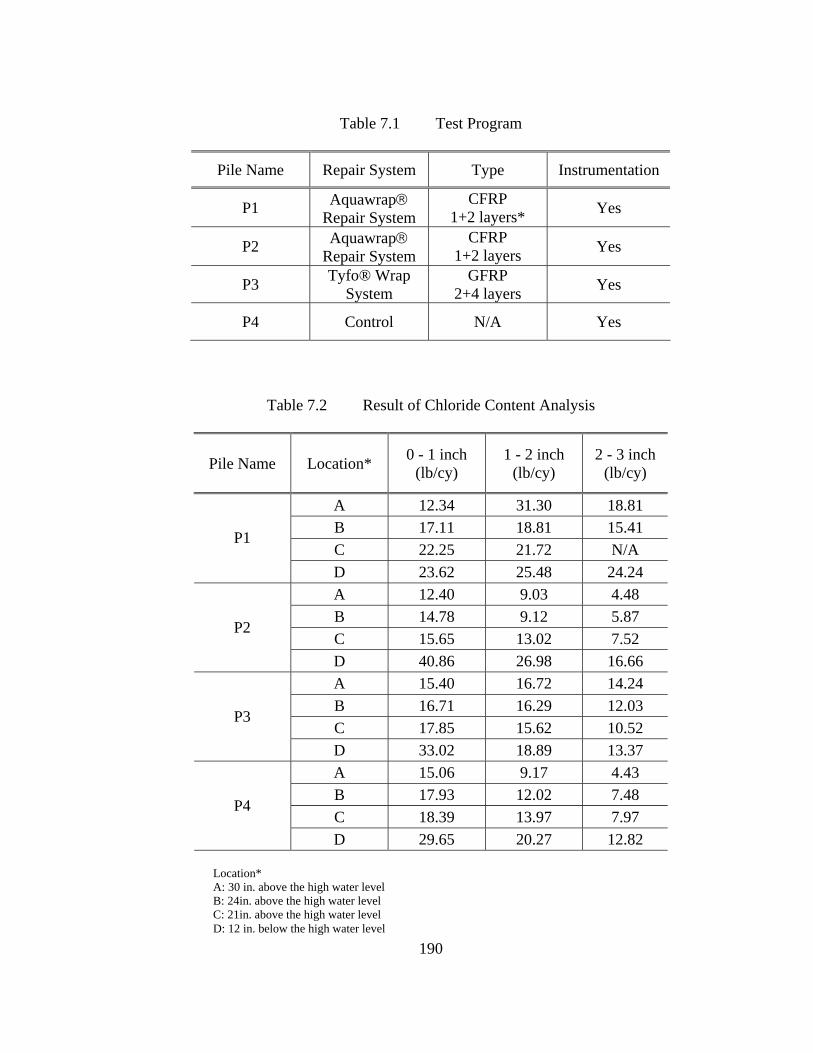
190
Table 7.1 Test Program
Pile Name Repair System Type Instrumentation
P1 Aquawrap® Repair System
CFRP 1+2 layers* Yes
P2 Aquawrap® Repair System
CFRP 1+2 layers Yes
P3 Tyfo® Wrap System
GFRP 2+4 layers Yes
P4 Control N/A Yes
Table 7.2 Result of Chloride Content Analysis
Pile Name Location* 0 - 1 inch (lb/cy)
1 - 2 inch (lb/cy)
2 - 3 inch (lb/cy)
A 12.34 31.30 18.81 B 17.11 18.81 15.41 C 22.25 21.72 N/A
P1
D 23.62 25.48 24.24 A 12.40 9.03 4.48 B 14.78 9.12 5.87 C 15.65 13.02 7.52
P2
D 40.86 26.98 16.66 A 15.40 16.72 14.24 B 16.71 16.29 12.03 C 17.85 15.62 10.52
P3
D 33.02 18.89 13.37 A 15.06 9.17 4.43 B 17.93 12.02 7.48 C 18.39 13.97 7.97
P4
D 29.65 20.27 12.82
Location* A: 30 in. above the high water level B: 24in. above the high water level C: 21in. above the high water level D: 12 in. below the high water level
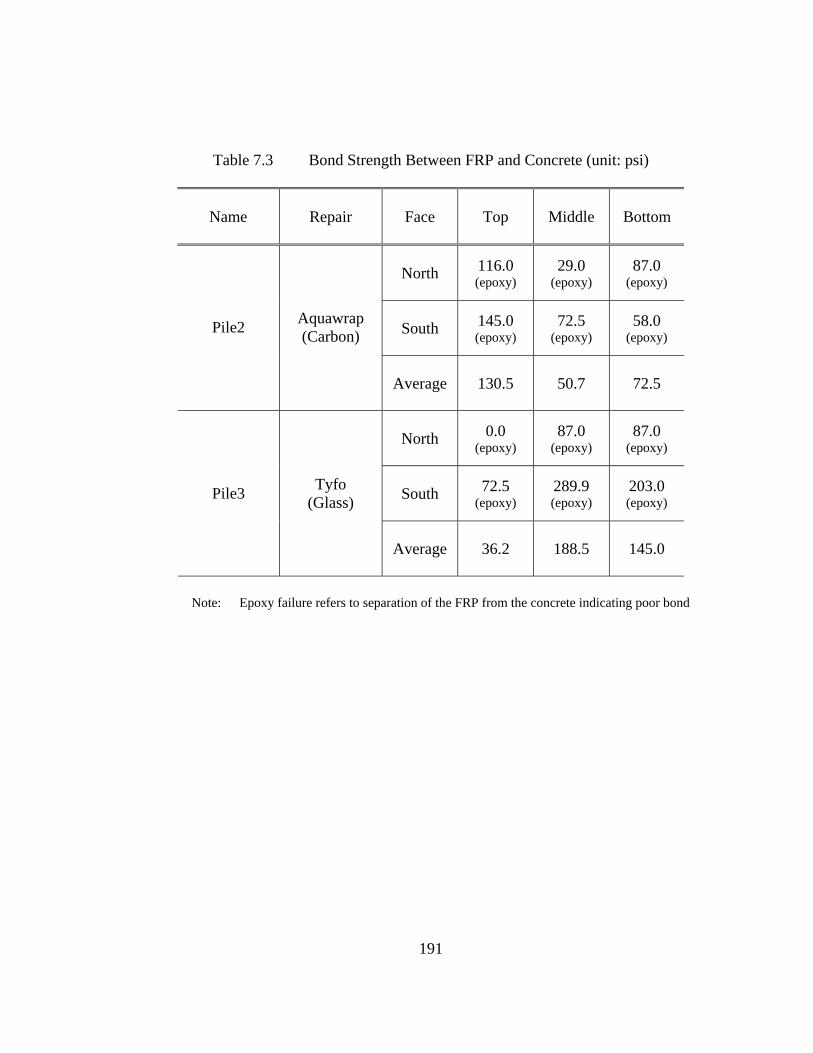
191
Table 7.3 Bond Strength Between FRP and Concrete (unit: psi)
Name Repair Face Top Middle Bottom
North 116.0 (epoxy)
29.0 (epoxy)
87.0 (epoxy)
South 145.0 (epoxy)
72.5 (epoxy)
58.0 (epoxy)
Pile2 Aquawrap (Carbon)
Average 130.5 50.7 72.5
North 0.0 (epoxy)
87.0 (epoxy)
87.0 (epoxy)
South 72.5 (epoxy)
289.9 (epoxy)
203.0 (epoxy) Pile3 Tyfo
(Glass)
Average 36.2 188.5 145.0
Note: Epoxy failure refers to separation of the FRP from the concrete indicating poor bond
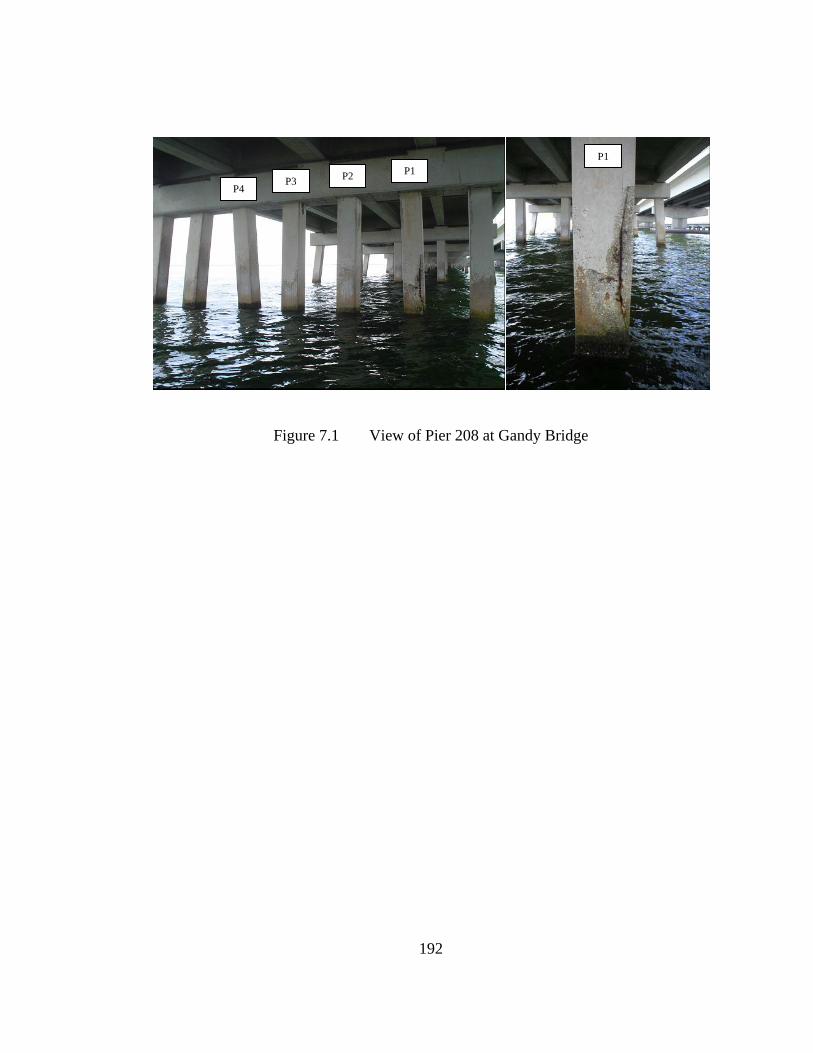
192
Figure 7.1 View of Pier 208 at Gandy Bridge
P1 P1
P2 P3 P4
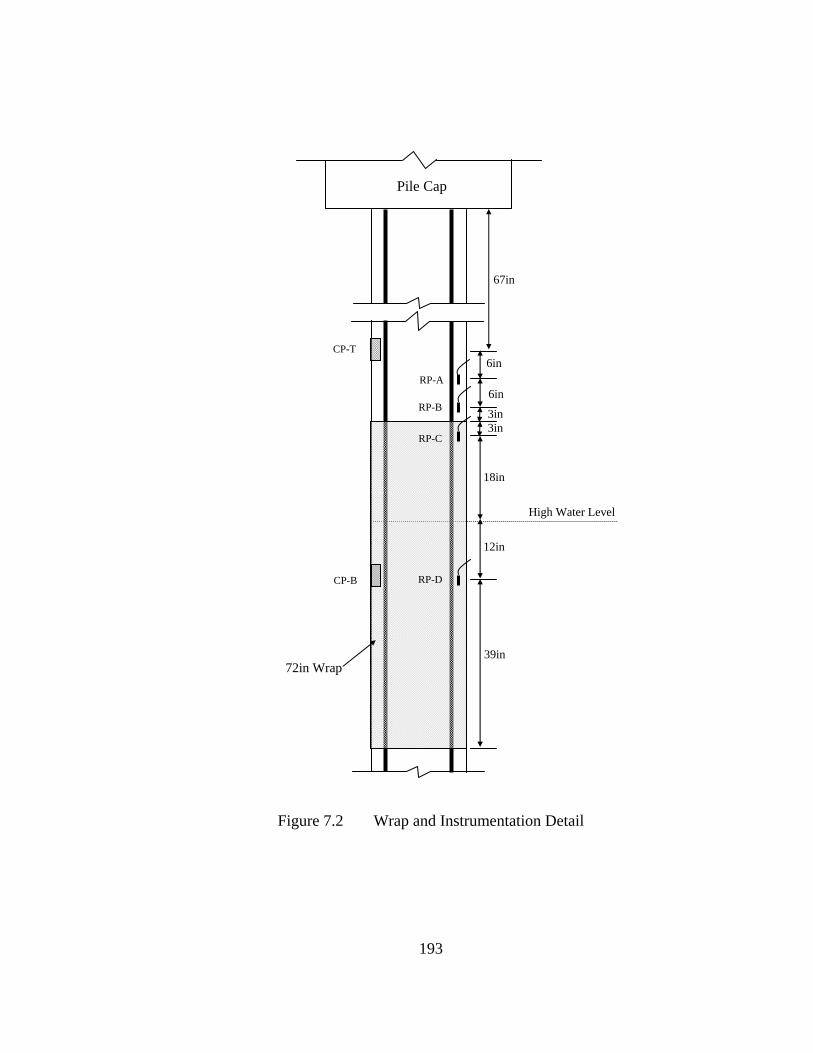
193
Figure 7.2 Wrap and Instrumentation Detail
Pile Cap
High Water Level
39in
12in
18in
3in3in
6in
67in
6in
72in Wrap
RP-D
RP-B
RP-A
RP-C
CP-B
CP-T
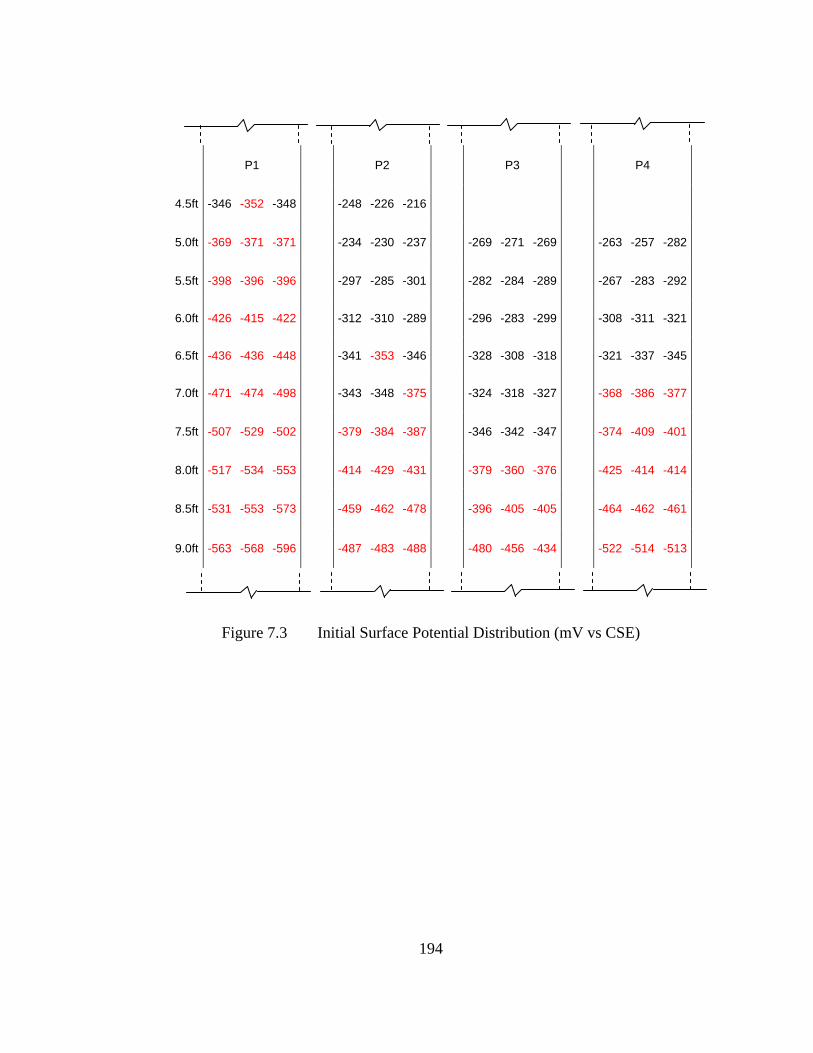
194
Figure 7.3 Initial Surface Potential Distribution (mV vs CSE)
P1 P2 P3 P4
4.5ft -346 -352 -348 -248 -226 -216
5.0ft -369 -371 -371 -234 -230 -237 -269 -271 -269 -263 -257 -282
5.5ft -398 -396 -396 -297 -285 -301 -282 -284 -289 -267 -283 -292
6.0ft -426 -415 -422 -312 -310 -289 -296 -283 -299 -308 -311 -321
6.5ft -436 -436 -448 -341 -353 -346 -328 -308 -318 -321 -337 -345
7.0ft -471 -474 -498 -343 -348 -375 -324 -318 -327 -368 -386 -377
7.5ft -507 -529 -502 -379 -384 -387 -346 -342 -347 -374 -409 -401
8.0ft -517 -534 -553 -414 -429 -431 -379 -360 -376 -425 -414 -414
8.5ft -531 -553 -573 -459 -462 -478 -396 -405 -405 -464 -462 -461
9.0ft -563 -568 -596 -487 -483 -488 -480 -456 -434 -522 -514 -513
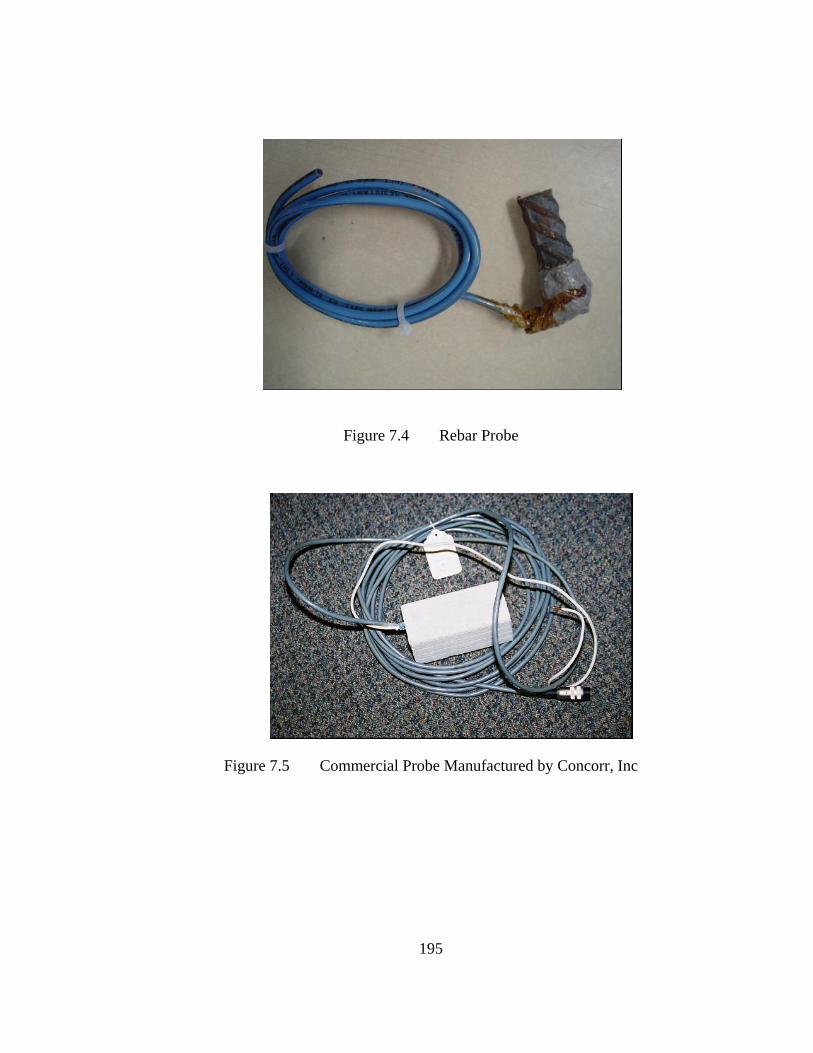
195
Figure 7.4 Rebar Probe
Figure 7.5 Commercial Probe Manufactured by Concorr, Inc
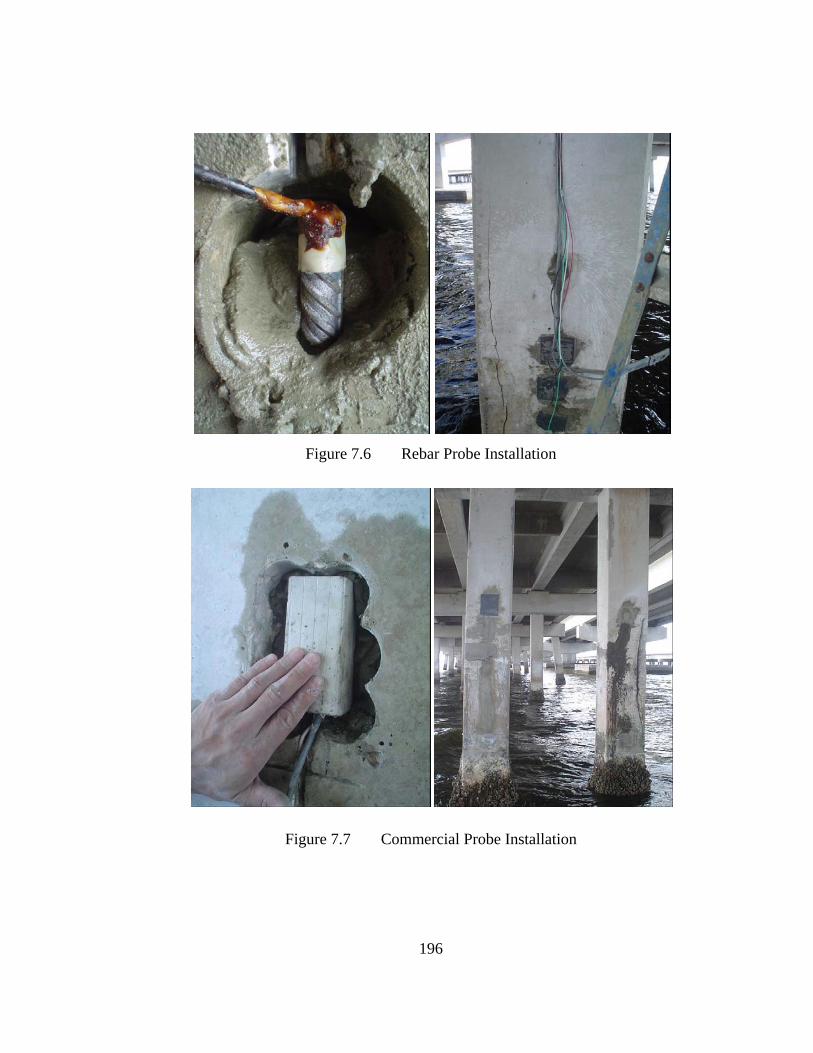
196
Figure 7.6 Rebar Probe Installation
Figure 7.7 Commercial Probe Installation
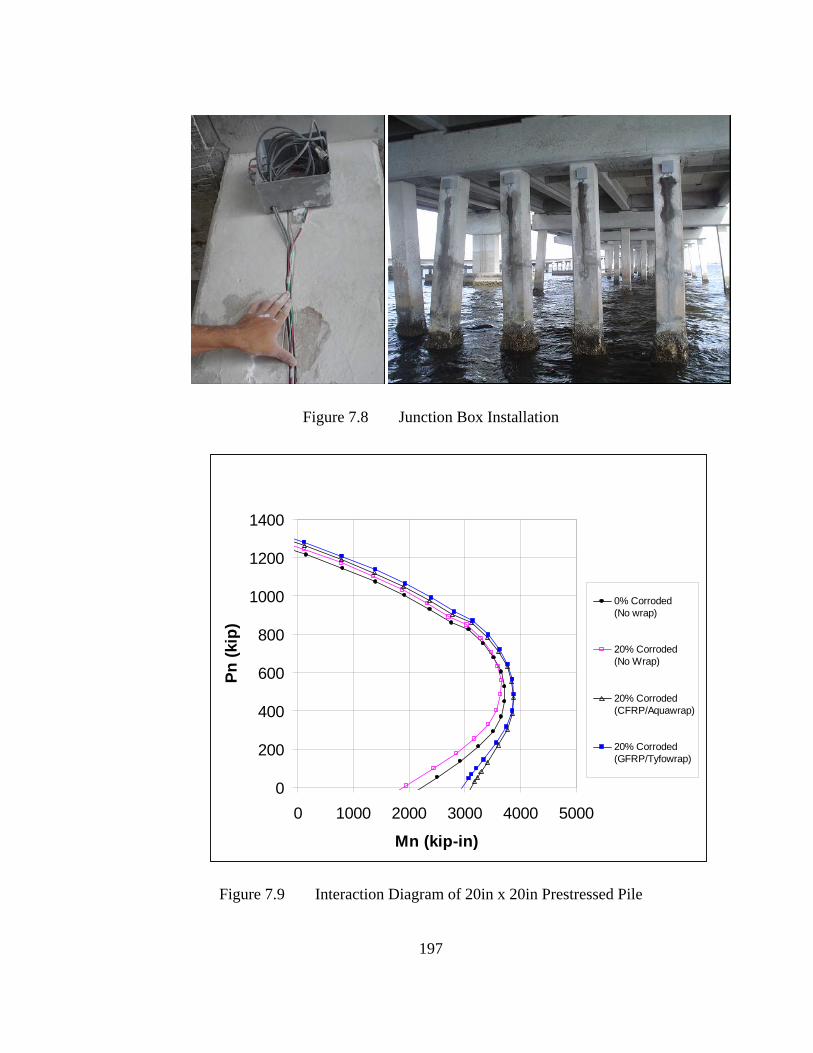
197
Figure 7.8 Junction Box Installation
Figure 7.9 Interaction Diagram of 20in x 20in Prestressed Pile
0
200
400
600
800
1000
1200
1400
0 1000 2000 3000 4000 5000
Mn (kip-in)
Pn (k
ip)
0% Corroded (No wrap)
20% Corroded (No Wrap)
20% Corroded(CFRP/Aquawrap)
20% Corroded(GFRP/Tyfowrap)
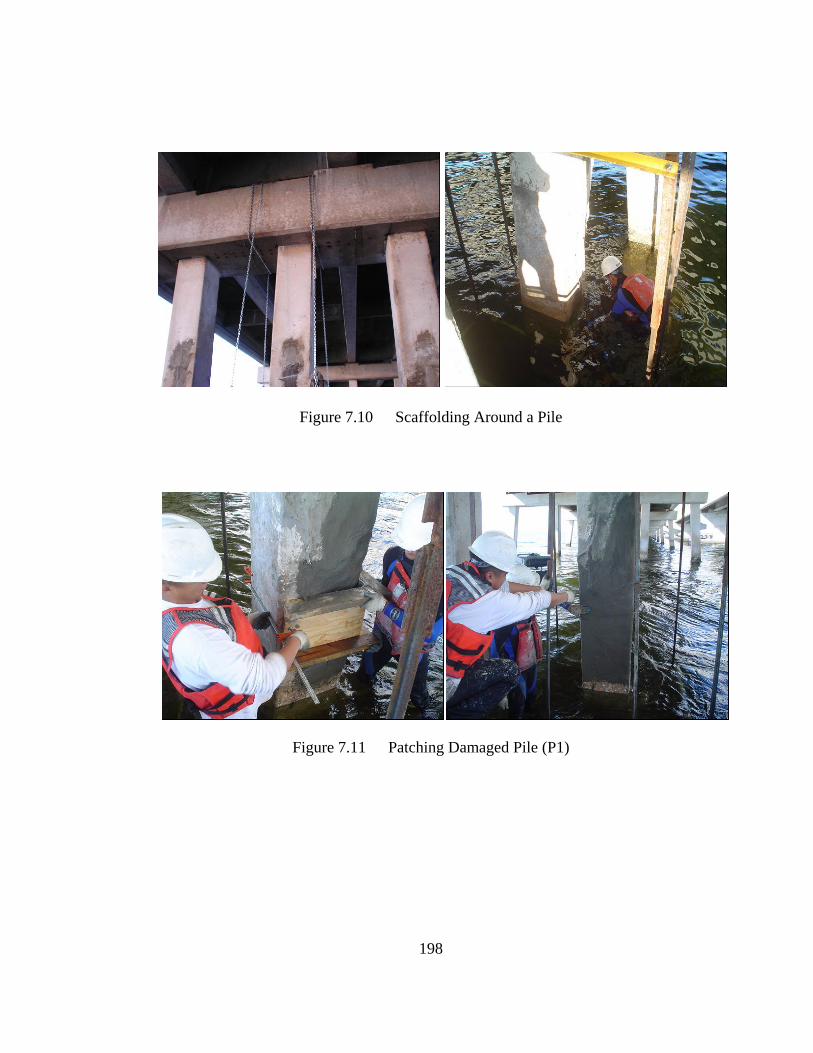
198
Figure 7.10 Scaffolding Around a Pile
Figure 7.11 Patching Damaged Pile (P1)
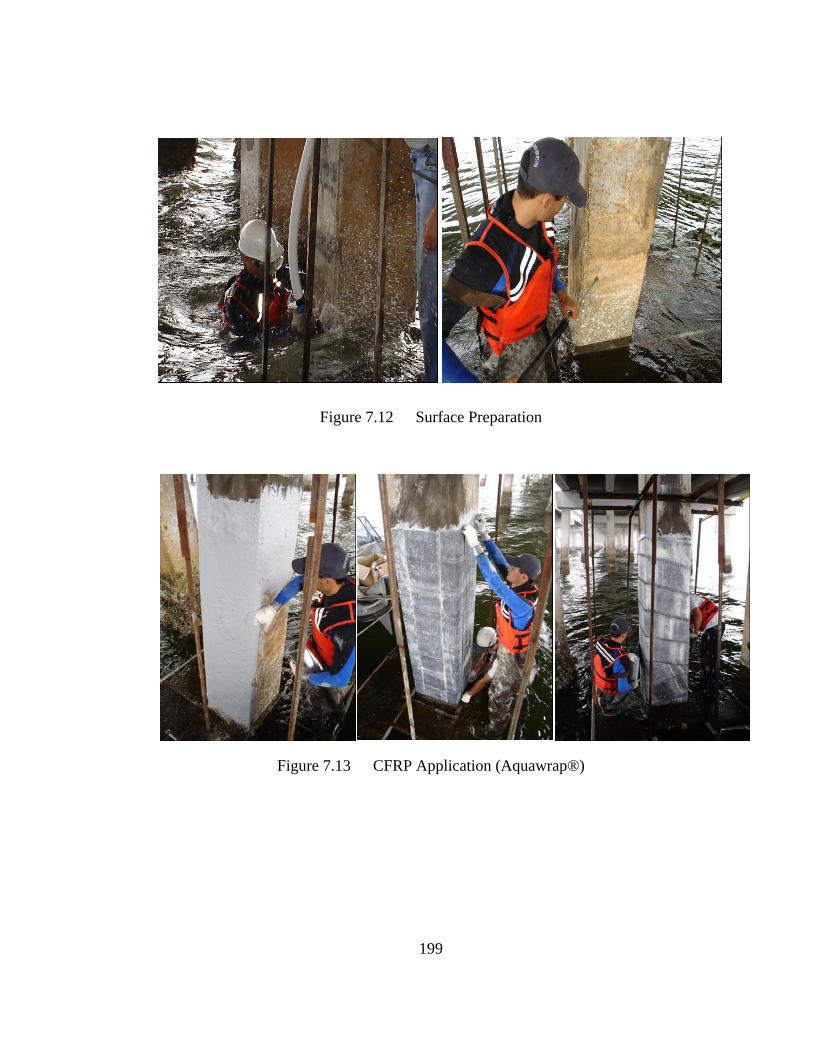
199
Figure 7.12 Surface Preparation
Figure 7.13 CFRP Application (Aquawrap®)
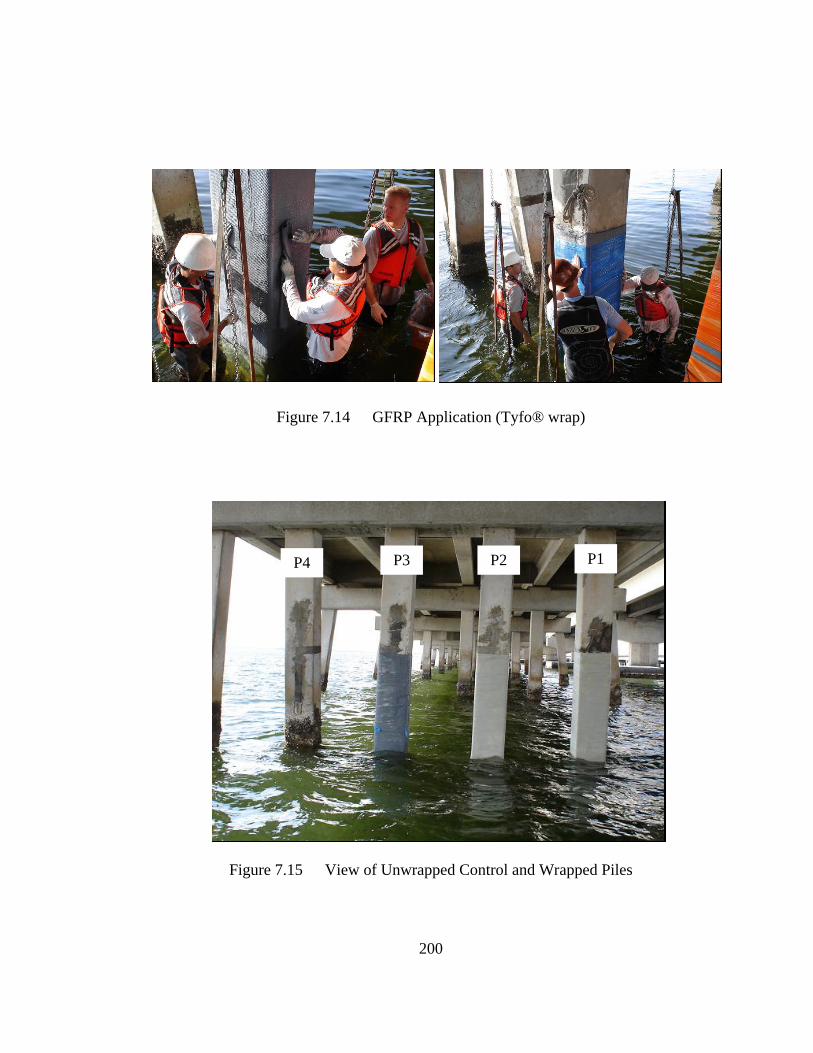
200
Figure 7.14 GFRP Application (Tyfo® wrap)
Figure 7.15 View of Unwrapped Control and Wrapped Piles
P1 P2 P3 P4
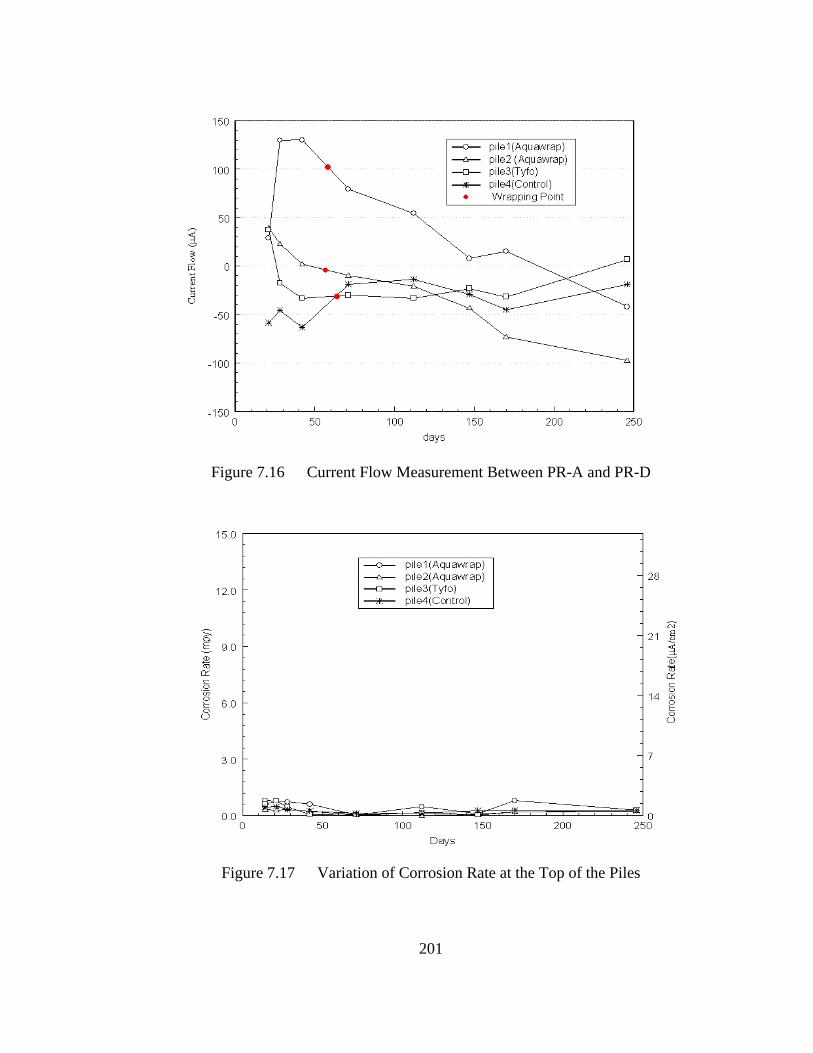
201
Figure 7.16 Current Flow Measurement Between PR-A and PR-D
Figure 7.17 Variation of Corrosion Rate at the Top of the Piles
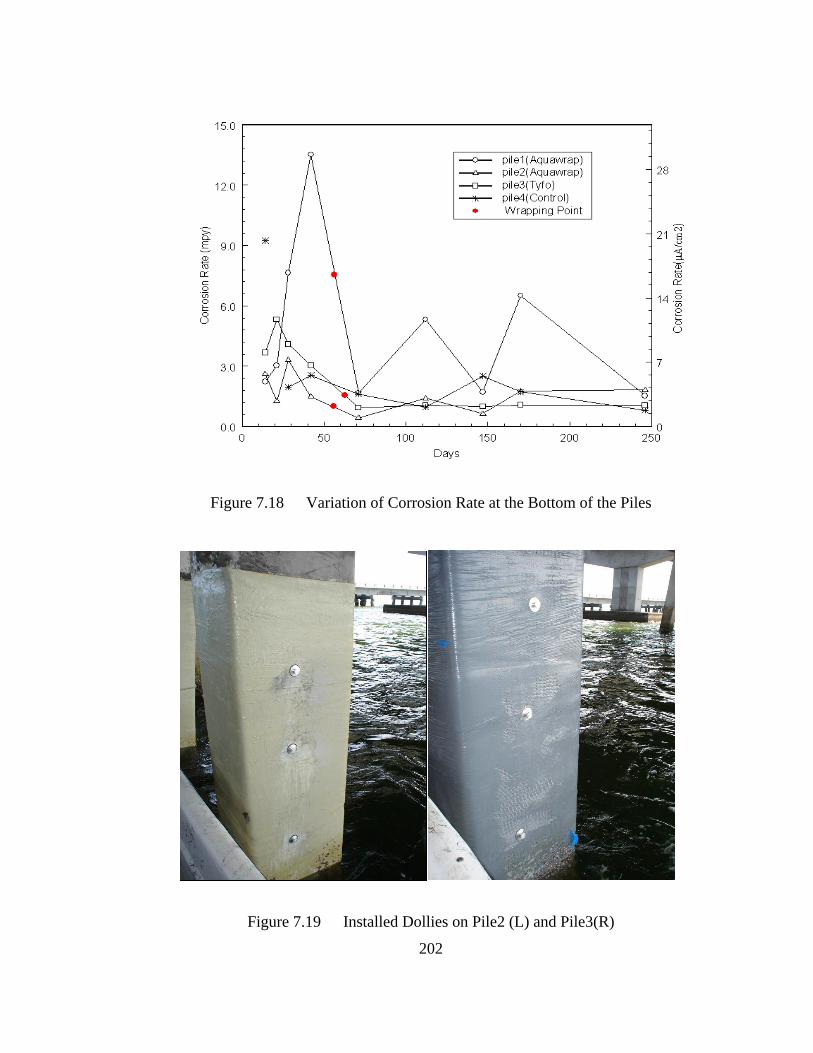
202
Figure 7.18 Variation of Corrosion Rate at the Bottom of the Piles
Figure 7.19 Installed Dollies on Pile2 (L) and Pile3(R)
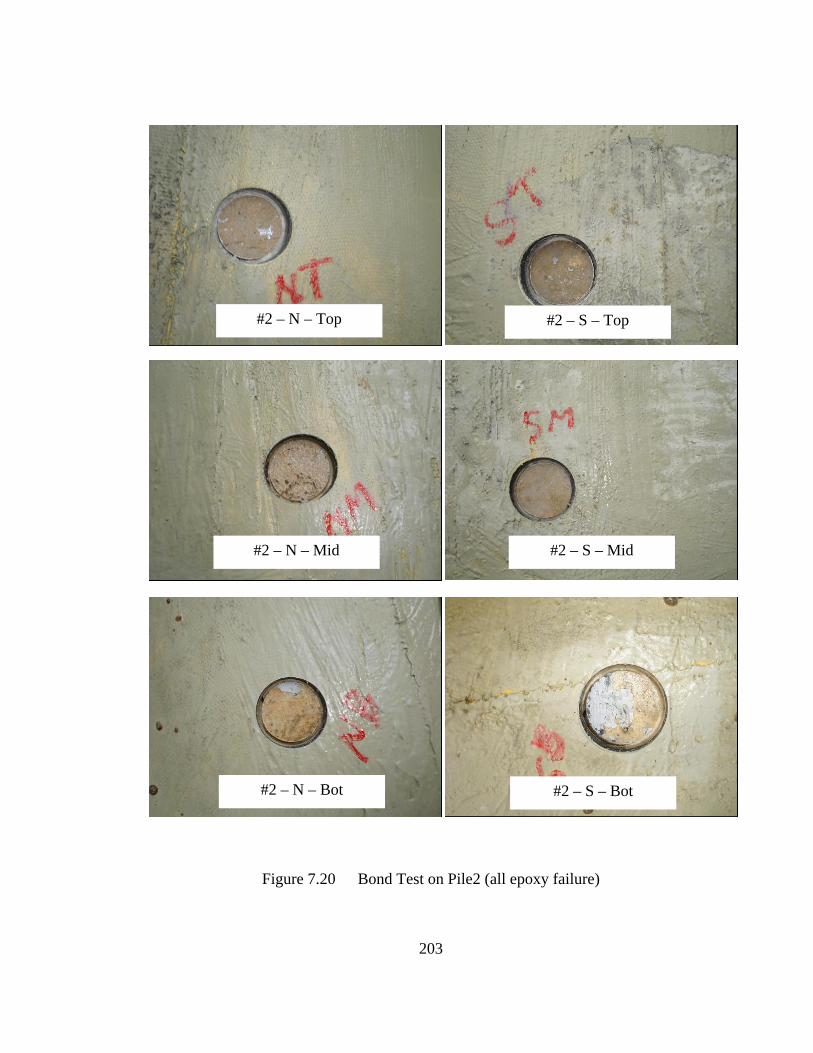
203
#2 – N – Top #2 – S – Top
#2 – N – Mid #2 – S – Mid
#2 – N – Bot #2 – S – Bot
Figure 7.20 Bond Test on Pile2 (all epoxy failure)
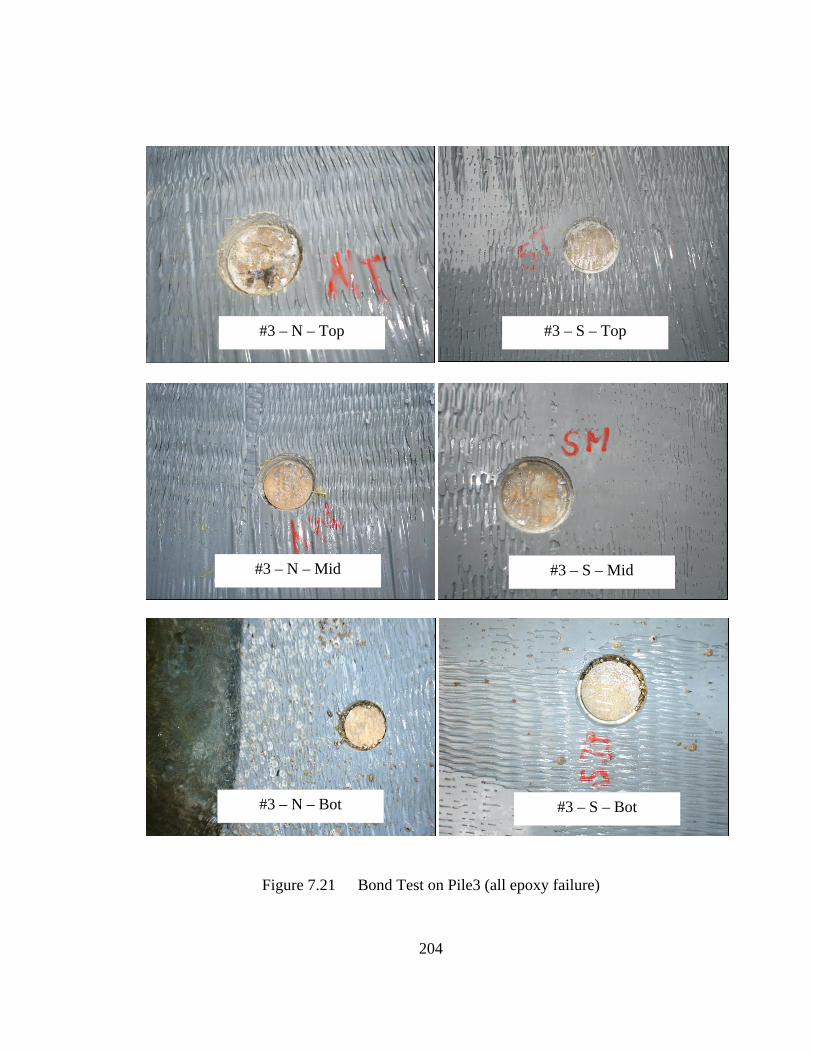
204
#3 – N – Top #3 – S – Top
#3 – N – Mid #3 – S – Mid
#3 – N – Bot #3 – S – Bot
Figure 7.21 Bond Test on Pile3 (all epoxy failure)
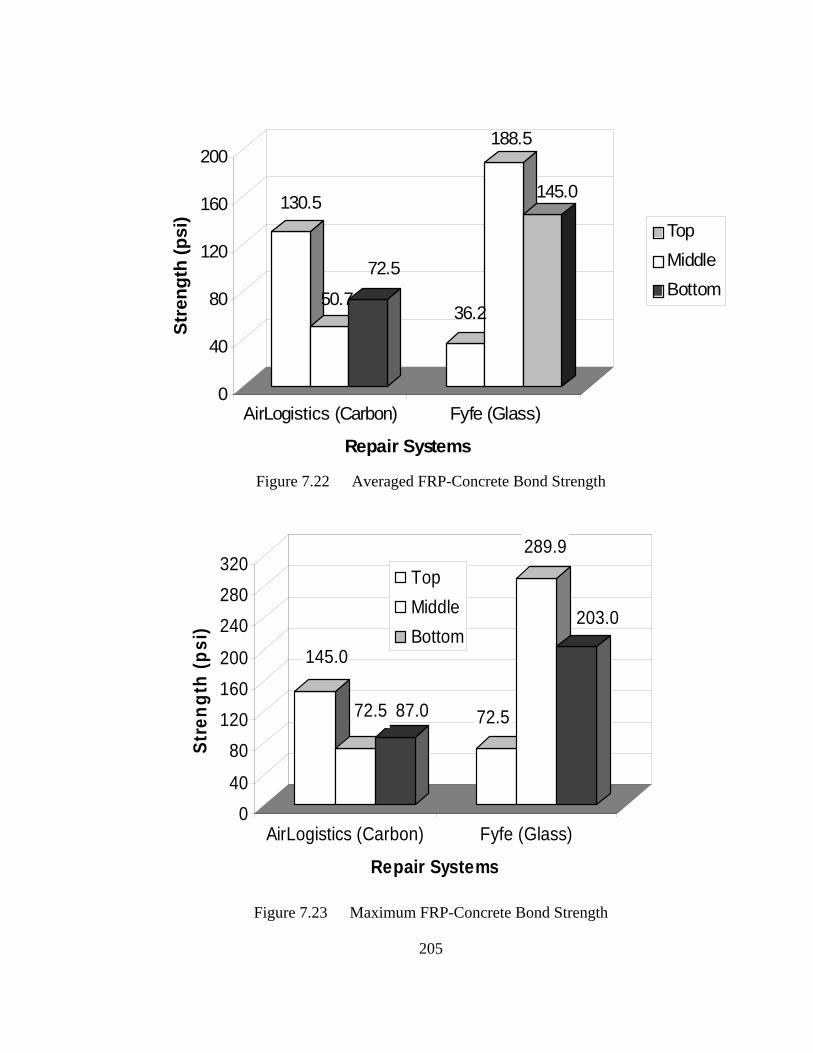
205
130.5
50.7
72.5
36.2
188.5
145.0
0
40
80
120
160
200St
reng
th (p
si)
AirLogistics (Carbon) Fyfe (Glass)
Repair Systems
TopMiddleBottom
145.0
72.5 87.0 72.5
289.9
203.0
040
80120160200
240280320
Stre
ngth
(psi
)
AirLogistics (Carbon) Fyfe (Glass)
Repair Systems
TopMiddleBottom
Figure 7.22 Averaged FRP-Concrete Bond Strength
Figure 7.23 Maximum FRP-Concrete Bond Strength
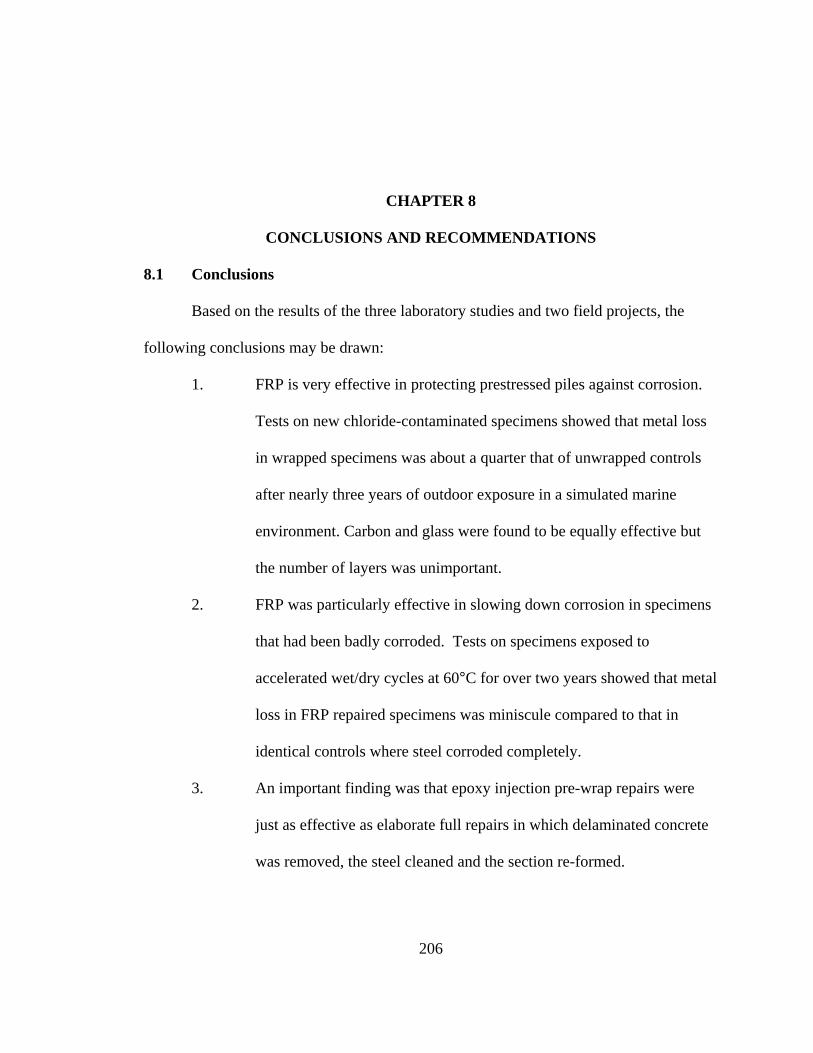
206
CHAPTER 8
CONCLUSIONS AND RECOMMENDATIONS
8.1 Conclusions
Based on the results of the three laboratory studies and two field projects, the
following conclusions may be drawn:
1. FRP is very effective in protecting prestressed piles against corrosion.
Tests on new chloride-contaminated specimens showed that metal loss
in wrapped specimens was about a quarter that of unwrapped controls
after nearly three years of outdoor exposure in a simulated marine
environment. Carbon and glass were found to be equally effective but
the number of layers was unimportant.
2. FRP was particularly effective in slowing down corrosion in specimens
that had been badly corroded. Tests on specimens exposed to
accelerated wet/dry cycles at 60°C for over two years showed that metal
loss in FRP repaired specimens was miniscule compared to that in
identical controls where steel corroded completely.
3. An important finding was that epoxy injection pre-wrap repairs were
just as effective as elaborate full repairs in which delaminated concrete
was removed, the steel cleaned and the section re-formed.
207
4. Corrosion rate measurements indicted that embedded reference
electrodes can provide reliable information on the corrosion
performance of wrapped specimens.
5. Ultimate load tests showed that FRP wrapping was effective in restoring
and increasing strength capacity of corrosion damaged piles
6. Full wrap and partial wrap did not show big differences in their
corrosion protection performance. This was probably because the partial
wrap extended beyond the chloride contaminated region. In field
applications, the length of the wrap above the water line should be
similarly extended to include this region.
7. Underwater wrap using the newly developed pre-preg system was
effective in increasing and restoring structural capacity of corrosion
damaged prestressed steel elements. The pre-preg simplifies
application and reduces the time required for wrapping. However, the
FRP-concrete bond was not good though this can be improved with
appropriate surface treatment. This method is very promising because of
the ease with which repairs can be carried out.
8. The unique instrumentation system developed for monitoring the
corrosion rate of piles in the Allen Creek Bridge was both inexpensive
and robust. It worked well.
8.2 Recommendations for Future Research
Based on the findings of this study, the following need to be investigated in the
future:
208
1. Some of the results were perplexing, e.g. role of the number of wrap
layers. It is difficult to accept that two layers were more effective than
three or four layers. This needs to be investigated further.
2. New techniques need to be developed to improve the FRP-concrete bond
in underwater applications. The role of marine growth on the FRP
wrapping and its subsequent performance needs to be evaluated.
3. The design of the FRP system needs to be further refined to take into
consideration experimental results of corrosion expansion and new
confinement models for non-circular sections.
209
REFERENCES Alampalli, S. (2005). "Effectiveness of FRP Materials with Alternative Concrete Removal Strategies for Reinforced Concrete Bridge Column Wrapping." International journal of Materials & Product Technology 23(3/4): 338-347. Almusallam, A.A., Algahtani, A.S., Aziz, A.R. et al. (1996), “Effect of Reinforcement Corrosion on Flexural Behavior of Concrete,” Journal of Materials in Civil Engineering, pp. 123-127. ASTM C876-91 (1999), “Standard Test Methods for Half-Cell Potentials of Uncoated Reinforcing Steel in Concrete,” American Society for Testing and Materials, Philadelphia, PA. ASTM G1-90 (1990), “Standard Practice for Preparing, Cleaning, and Evaluating Corrosion Test Specimens,” American Society for Testing and Materials, Philadelphia, pp. 25-31. ASTM G59-97 (1997), “Standard Test Method for Conducting Potentiodynamic Polarization Resistance Measurements,” American Society for Testing and Materials, Philadelphia, PA. Badawi, M. and K. Soudki (2005). "Control of Corrosion-Induced Damaged in Reinforced Concrete Beams Using Carbon Fiber-Reinforced Polymer Laminates." Journal of Composites for Construction 9(2): 195-201. Baiyasi, M. I. and R. S. Harichandran (2001). Corrosion and Wrap Strains in Concrete Bridge Columns Repaired with FRP Wraps. Washington, D.C., Transportation Research Board. Bentur, A., Diamond, S, and Berke, N.S. (1997), Steel Corrosion in Concrete: Fundamentals and Civil Engineering Practice, 1st Edition, E & FN Spon, London. Berver, E., H. G. Wheat, et al. (2002). Composite Wrapping as a Means of Corrosion Mitigation. 12th International Offshore and Polar Engineering Conference, Kitakyushu, Japan. Boffardi, B.P. (1995), “Water Treatments,” Corrosion Tests and Standards: Application and Interpretation, Baboian, R., Editor, American Society for Testing and Materials, Philadelphia, pp.697-704.
210
Broomfield, J.P. (1997), Corrosion of Steel in Concrete, 1st Edition, E & FN Spon, London. Chaallal, O. and Shahawy, M. (2000), “Performance of Fiber-Reinforced Polymer-Wrapped Reinforced Concrete Column under Combined Axial-Flexural Loading,” ACI Structural Journal, Vol. 97, No. 4, pp. 659-668. Castro, P., A. A. Sagues, et al. (1996). "Characterization of Activated Titanium Solid Reference Electrodes for Corrosion Testing of Steel in Concrete." Corrosion 52(8): 609-617. Debaiky, A. S., M. F. Green, et al. (2002). "Carbon Fiber-Reinforced Polymer Wraps for Corrosion Control and Rehabilitation of Reinforced Concrete Columns." ACI Materials Journal 99(2): 129-137. Fisher, J., G. Mullins, et al. (2000). Strength of Repaired Pile, Final Report Submitted to the Florida Department of Transportation. Halstead, J. P., J. S. O'connor, et al. (2000). Evaluating FRP Wrap with NDT Methods. Structural Materials Technology IV: NDT conference. Lee, C. (1998), Accelerated Corrosion and Repair of Reinforced Concrete Columns Using CFRP Sheets, M. Eng. Thesis, Department of Civil Eng., University of Toronto, Toronto, ON, Canada. Lee, C., Bonacci, J.F., Thomas, M.D.A., Maalej, M. et al. (2000), “Accelerated Corrosion and Repair of Reinforced Concrete Columns Using Carbon Fiber Reinforced Polymer Sheets,” Canadian Journal of Civil Engineering, Vol. 27, pp.941-948. Locke, C.E. and Siman, A. (1980), “Electrochemistry of Reinforcing Steel in Salt-Contaminated Concrete,” Corrosion Reinforcing Steel in Concrete, ASTM STP 713, D.E. Tonini and J.M. Gaidis, Eds., American Society for Testing and Materials, pp.3-16. Measurements Group, Inc. (2001). www.measurementsgroup.com. Mullins, G., R. Sen, et al. (2001). Load Capacity of Corroded Pile Bents, Final Report Submitted to the Florida Department of Transportation. Newman, K. and Newman, J.B. (1971), “Failure Theories and Design Criteria for Plain Concrete,” Proceedings of International Civil Engineering Material Conference on Structure, Solid Mechanics, and Engineering Design, Wiley Interscience, New York, NY, pp. 936-995.
211
Pantazopoulou, S.J., Bonacci, J.F., Hearn, N. et al.(1996), “Repair of Corrosion-Damaged Concrete Using ACM,” Proceedings of 2nd Internaitonal ACMBS Conference, Montreal, pp. 457-463. Pantazopoulou, S. J., J. F. Bonacci, et al. (2001). "Repair of Corrosion-Damaged Columns with FRP Wraps." Journal of Composites for Construction 5(1): 3-11. Restrepol, J.I. and DeVino, B. (1996), “Enhancement of the Axial Load Carrying Capacity of Reinforced Concrete Columns by Means of Fiberglass-Epoxy Jackets,” Proceedings of the First International Conference on Composites in Infrastructure, Montreal, pp. 547-553. Richart, F.E., Brandtzaeg, A, and Brown, R.L. (1928), “A Study of the Failure of Concrete Under Combined Compressive Stresses,” Engineering Experiment Station, Bulletin No. 185, pp.104. Samaan, M., Mirmiran, A., and Shahawy, M. (1998), “Model of Concrete Confined by Fiber Composites,” Journal of Structural Engineering, ASCE, Vol. 124, No. 9, pp. 1025-1031. SDR Engineering, Inc. (2001). www.sdrengineering.com. Sen, R, Mullins, G, and Snyder, D. (1999), “Ultimate Capacity of Corrosion Damaged Piles,” Final Report submitted to Florida Department of Transportation, March. Sika Corporation (1997). Material Data Sheet of Sika 52. Suh, K., G. Mullins, Sen, R., and Winters, D. (2005). Use of FRP for Corrosion Mitigation Applications in a Marine Environment, Final Report Submitted to the Florida Department of Transportation. Taheri, A. and Breugel, K.V. (1998), “Effect of severe environment on Chloride Ingress into Concrete Structures,” Proceedings of the 2nd International Conference on Concrete under Severe Conditions, Norway, pp. 606-615. Thompson, N.G., Lankard, D.R. and Virmani, Y.P. (1998), “Variables that Affect the Corrosion of Steel in Concrete,” Proceedings of the 2nd International Conference on Concrete under Severe Conditions, Norway, pp. 656-667. Tuutti, K. (1982), Corrosion of Steel in Concrete, Swedish Cement and Concrete Research Institute, Stockholm.
212
Wang, C., C. Shih, et al. (2004). "Rehabilitation of Cracked and Corroded Reinforced Concrete Beams with Fiber-Reinforced Plastic Patches." Journal of Composites for Construction 8(3): 219-228. Wheat, H. G., J. O. Jirsa, et al. (2005). "Monitoring Corrosion Protection Provided by Fiber Reinforced Composites." International journal of Materials & Product Technology 23(3/4): 372-388. Wootton, I. A., L. K. Spainhour, et al. (2003). "Corrosion of Steel Reinforcement in Carbon Fiber-Reinforced Polymer Wrapped Concrete Cylinders." Journal of Composites for Construction 7(4): 339-347.
ABOUT THE AUTHOR
Kwangsuk Suh received a Bachelor’s Degree in Architectural Engineering from
Hanyang University in 2000 and a M.S. in Civil Engineering from University of South
Florida in 2002. He entered the Ph.D. program at the University of South Florida in
2002. While in the M.S. and Ph.D. programs at the University of South Florida, he was
actively involved in several research projects funded by the Florida Department of
Transportation and the Hillsborough County, and coauthored several journal papers and
reports.
Related Documents