Understanding Water Conservation in Williamstown: Protecting a “Plentiful” Resource Danielle Diuguid GEOS 20 ampus May 18 th , 2010 6: Renewable Energy & the Sustainable C Profs. Stephanie Boyd and David Dethier

Welcome message from author
This document is posted to help you gain knowledge. Please leave a comment to let me know what you think about it! Share it to your friends and learn new things together.
Transcript

Understanding Water Conservation in Williamstown:
Protecting a “Plentiful” Resource
Danielle Diuguid
GEOS 20 ampus May 18th, 2010
6: Renewable Energy & the Sustainable CProfs. Stephanie Boyd and David Dethier

1
Introduction “When the well’s run dry, we know the worth of water.”
-Benjamin Franklin, Poor Richard's Almanac.
Our world faces a global water crisis today. Less than 1% of the water on the planet can
be accessed for human use (water.org). According to the World Water Council, an international
organization committed to water conservation practice and advocacy, the global population
tripled in the past century, yet the world-wide water use increased six times that amount
(worldwatercouncil.org). As the global population continues to increase, and advancements in
technology and urbanization demand greater amounts of water use, the available water resources
will deplete at rapid, unsustainable rates, leaving the world to face a catastrophe that threatens
both human and environmental health.
However, Ben Franklin’s quote embodies one of the greatest difficulties facing the
contemporary movement for water conservation. For many communities and populations
throughout the world, water conservation does not appear to be a pressing issue, and is therefore
often overlooked. In reality, more than one-in-six people world-wide do not have access to clean
drinking water, while more than two-in-six people suffer from insufficient sanitation (World
Health Organization). Because these water shortages are concentrated in certain geographic areas
world-wide, only specific populations are forced to face the tangible effects of water scarcity.
Figure 1 depicts this reality, illustrating the regions facing the highest levels of “stress” due to
lack of water resources. Because of the variance between regional access to water, each
community handles water conservation differently, based on the current local needs of the
region.

Figure 1: Diagram Indicating Regions that are “WaterStressed” Throughout the World
Illustrates the scale of global water scarcity, where the quantity of water
removed from the ecosystem puts the population at risk.
My project focuses on this issue from a local perspective, analyzing the philosophy and
practice of water conservation in Williamstown. With limited background knowledge on the
subject, I chose to approach the issue of water conservation in Williamstown as an exploration of
the water system and its relationship to the residents of the Berkshire community. How
important is the topic of water conservation to the Williamstown community? To answer this
question, I collected information on Williamstown’s water distribution, collection, and
restoration, and the ways in which water conservation procedures have been integrated into the
residents of Williamstown daily routine. After extensive research on the local water system, I
sought to make suggestions that would help both Williams and Williamstown improve the
2

3
transparency of the local water system, while locating areas to advance water conservation
practice and awareness.
Setting
Local water conservation policy often depends on the geology of the region and therefore
the extent that the community has access to potable water. Massachusetts is fortunate enough to
be a “water-rich” region in the United States. Berkshire County specifically, is part of the Hoosic
watershed, which comprises communities throughout Massachusetts, New York, and Vermont
and eventually connects to the Hudson River basin.
Even with a plentiful watershed system and consequently sufficient access to freshwater,
the state still implements policies to manage the use of clean water and wastewater
(Massachusetts DEP). In Williamstown specifically, the Department of Public Works supervises
the distribution of water to 75-80% of the town residents. Williamstown possesses a
groundwater system that consists of three wells as the source of the town’s water. Cole Avenue
hosts two of the three wells, while the third well is situated within Linear Park, at the intersection
of the Hoosic and Green Rivers (Interview with Tim Kaiser).
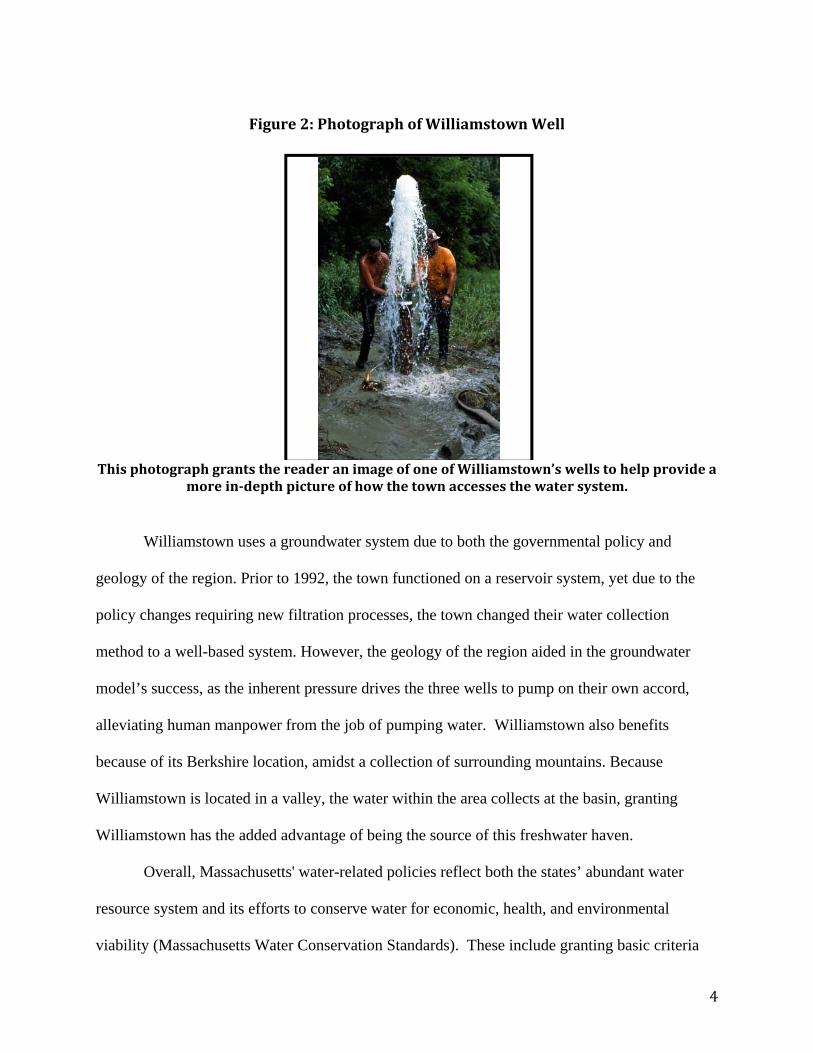
Figure 2: Photograph of Williamstown Well
This photograph grants the reader an image of one of Williamstown’s wells to help provide a
more indepth picture of how the town accesses the water system.
Williamstown uses a groundwater system due to both the governmental policy and
geology of the region. Prior to 1992, the town functioned on a reservoir system, yet due to the
policy changes requiring new filtration processes, the town changed their water collection
method to a well-based system. However, the geology of the region aided in the groundwater
model’s success, as the inherent pressure drives the three wells to pump on their own accord,
alleviating human manpower from the job of pumping water. Williamstown also benefits
because of its Berkshire location, amidst a collection of surrounding mountains. Because
Williamstown is located in a valley, the water within the area collects at the basin, granting
Williamstown has the added advantage of being the source of this freshwater haven.
4
Overall, Massachusetts' water-related policies reflect both the states’ abundant water
resource system and its efforts to conserve water for economic, health, and environmental
viability (Massachusetts Water Conservation Standards). These include granting basic criteria
and advice on topics such as planning, metering, residential use, institutional use, and education
and outreach.
Data and Narrative
The narrative and data for this project consists of multiple sections. As I approached this
project with the intention to understand the water system and issues surrounding conservation,
the narrative reveals the information gathered through my interactions with Tim Kaiser,
Stephanie Boyd, and Ken Jensen.
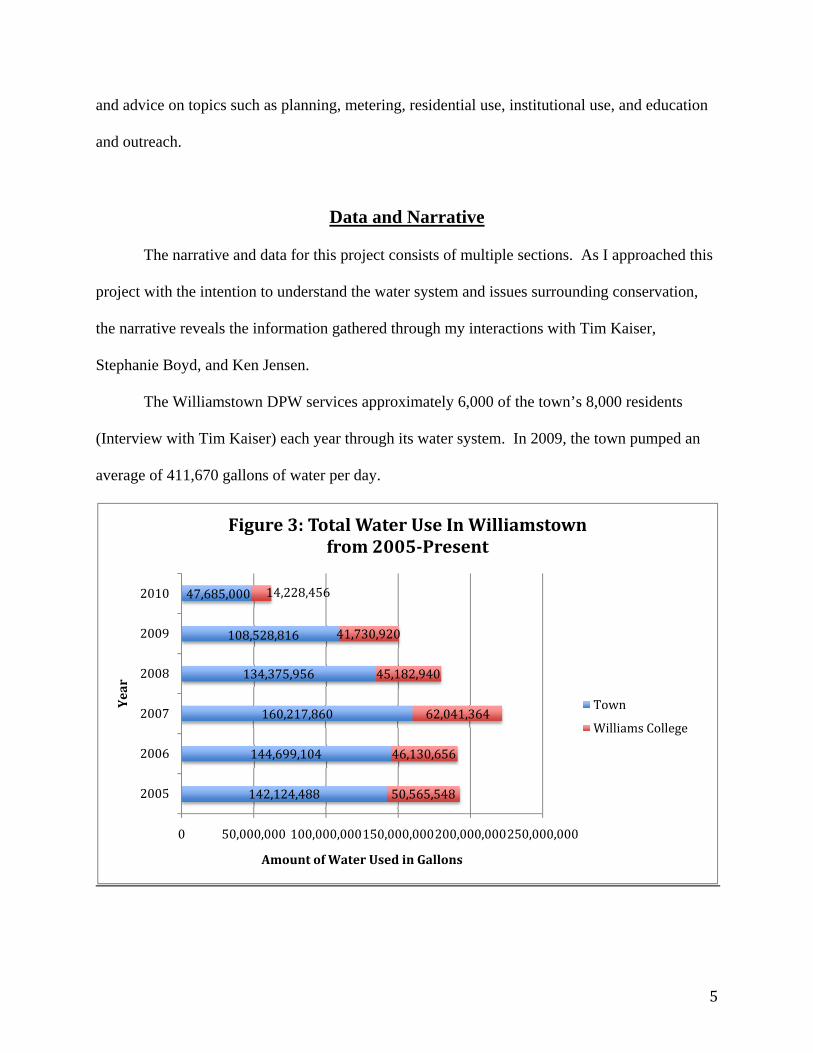
The Williamstown DPW services approximately 6,000 of the town’s 8,000 residents
(Interview with Tim Kaiser) each year through its water system. In 2009, the town pumped an
average of 411,670 gallons of water per day.
5
142,124,488
144,699,104
160,217,860
134,375,956
108,528,816
47,685,000
50,565,548
46,130,656
62,041,364
45,182,940
41,730,920
14,228,456
0 50,000,000 100,000,000150,000,000200,000,000250,000,000
2005
2006
2007
2008
2009
2010
Amount of Water Used in Gallons
Year
Figure 3: Total Water Use In Williamstown from 2005Present
Town
Williams College
As Figure 3 depicts above, the town has witnessed an overall decrease in water
consumption since 2005. By separating Williams College from the total town resident
population, one can note that both the residents and the institution have made efforts to reduce
their total water consumption. Due to time constraints, I could not collect sufficient information
to explain the rise in water use in 2007, however the general trend supports Tim Kaiser’s
affirmations about the successful water conservation efforts in Williamstown. One should note
that the water use for 2010 in this figure runs through May 20, 2010.
6
2.51
2.61
2.98
3.12
3.26
3.37
1.91
2.11
2.13
2.2
2.21
2.38
2.28
2.58
2.34
3.19
2.87
2.54
0 5
2005
2006
2007
2008
2009
2010
Cost of Water in Dollars
Year
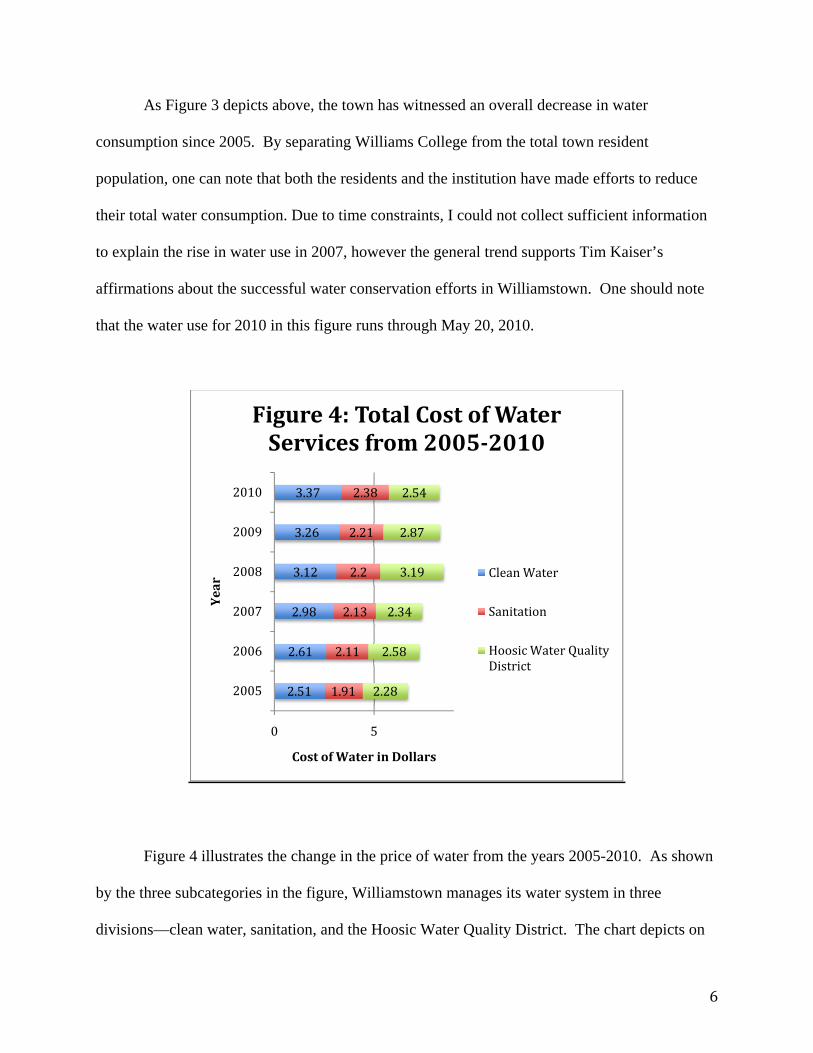
Figure 4: Total Cost of Water Services from 20052010
Clean Water
Sanitation
Hoosic Water Quality District
Figure 4 illustrates the change in the price of water from the years 2005-2010. As shown
by the three subcategories in the figure, Williamstown manages its water system in three
divisions—clean water, sanitation, and the Hoosic Water Quality District. The chart depicts on

an overall increase in the cost of water for each of the three subdivisions over the six-year time
frame.
7
2005 2006 2007 2008 2009Dining Total 620,840 554,268 391,952 302,192 325,380Central Plant Total 2,839,408 4,908,376 4,678,740 2,836,416 3,469,972Education Total 14,543,364 17,103,020 17,003,536 16,829,252 15,166,448Student Housing Total 16,832,244 18,771,808 16,667,684 15,399,076 14,399,748
05,000,00010,000,00015,000,00020,000,00025,000,00030,000,00035,000,00040,000,00045,000,000
Total Gallons of Water Used
Year
Figure 5: Distribution of Water Between Facilitiesat Williams College from 2005‐2009
Figure 5 shows the breakdown of water use at Williams College from 2005-2009.
Williams separates their water metering based on the types of buildings at the institution. As the
table within the chart reveals, a gradual decrease in water use occurred throughout all types of
buildings on campus from 2006-2009. The town monitors the water metering system at Williams
every three months, totaling four collections of data throughout each year.

Figure 6: Water Use and Cost from 20052010 in Dodd House at Williams College
8
Figure 7: Water Use and Cost from 20052010 in Morley Science Center & Schow at Williams College
Figures 6 and 7 above grant a closer analysis at water use at two specific buildings on
campus. While Figure 6 shows a steady decrease in water use throughout the five-year time
period, the data in Figure 7 does not reveal any apparent trend. Overall, the data received for
Morley Science Center & Schow best reflects the information provided in Figure 1, which
illustrates an increase in water use for 2007, but less use overall.
9
Discussion
Water conservation in Williamstown proved to be a more complex issue than I originally
expected for numerous reasons. In many ways, the Williams community has made significant
strides in the past twenty-five years. Some of these modifications can be attributed to the
changes in national water conservation policy. For example, the 1992 policy change requiring
toilet flush systems to use a maximum of 1.6 gallons per flush saved thousands of gallons per
year for the residents who switched to the new toilet model. In addition to national policy
change, the increased effort in water reduction by Williams College also deserves substantial
credit. According to Tim Kaiser, ten years ago, Williams’ water consumption comprised 30% of
the total town water usage. He claims that, the college currently uses a mere 10% of the town’s
total water use. Even in the past year, Tim Kaiser asserts that the town has reduced its
consumption by 9% since 2009.
However, the information provided in Tim’s conversation with me reveals the first
obstacle that Williamstown needs to address in terms of water conservation: the issue of data
collection and reporting. Tim presented me with numerous statistics on Williamstown water use
throughout the extent of this project. As shown above, he painted an overall picture of
continuous effort done by Williamstown and its residents to work towards reducing water use.
Yet, the assortment of data I collected for the same overall topics proved to be inconsistent with
each other. The greatest example of this can be seen through Williams College’s water use over
the past five years. As stated above, Tim Kaiser informed me that Williams College’s current
water use comprises 10% of Williamstown’s total use. However, with a closer analysis of the
numbers depicted in Figure 3 and Appendix A, one can calculate that Williams College’s water
use for 2009 was 27.8% and for 2008 was 25.2% of the town’s total use. In addition, the amount
10
of water use for Williams overall differed amongst the data granted by the Zilkha Center and the
Department of Public Works (DPW). The Zilkha Center claims Williams College’s total use to
be 33,361,548 gallons while the DPW states 41,730,920 gallons as the total. Without an accurate
account for our metering and data collection for water use, the process of quantifying the amount
of water that Williamstown conserves proves to be impossible. Other inconsistencies can be seen
through Figure 7, where the fluctuating metering makes the data on Morley Science Center, the
building with the highest water consumption rates, nearly impossible to interpret. The
infrequency of the meter monitoring also proves to be a hindrance when locating patterns or
trends in water use throughout each day, month, season, or year.
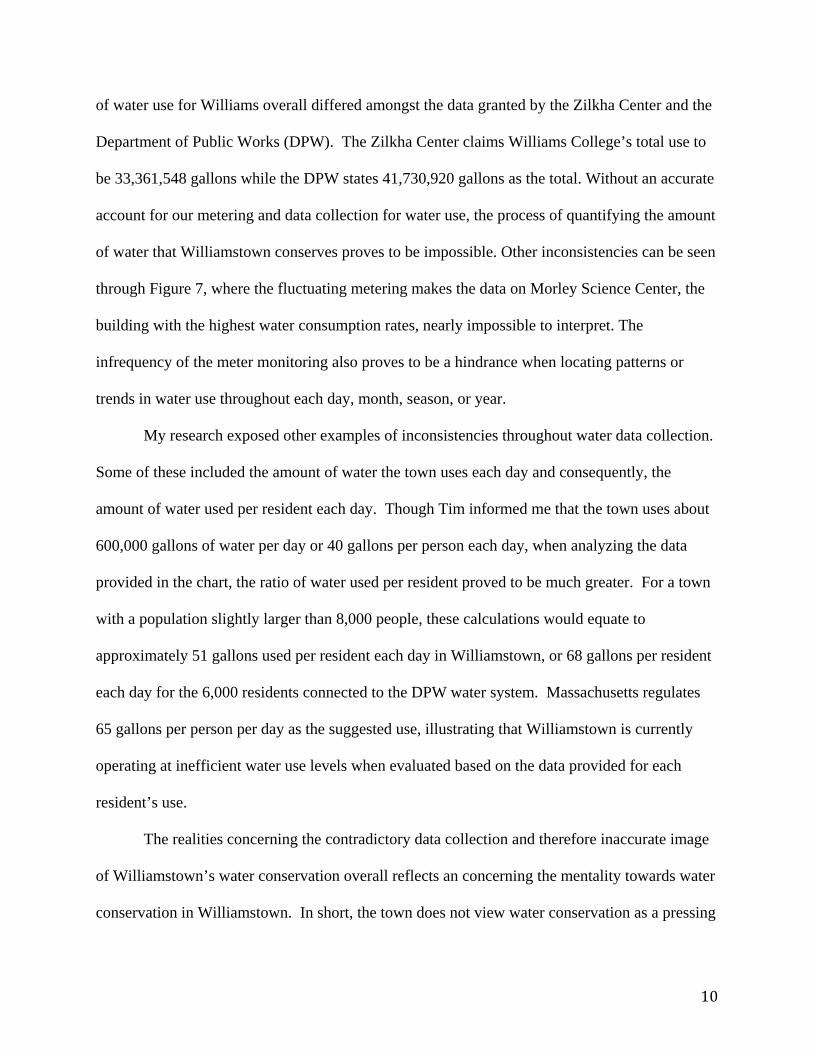
My research exposed other examples of inconsistencies throughout water data collection.
Some of these included the amount of water the town uses each day and consequently, the
amount of water used per resident each day. Though Tim informed me that the town uses about
600,000 gallons of water per day or 40 gallons per person each day, when analyzing the data
provided in the chart, the ratio of water used per resident proved to be much greater. For a town
with a population slightly larger than 8,000 people, these calculations would equate to
approximately 51 gallons used per resident each day in Williamstown, or 68 gallons per resident
each day for the 6,000 residents connected to the DPW water system. Massachusetts regulates
65 gallons per person per day as the suggested use, illustrating that Williamstown is currently
operating at inefficient water use levels when evaluated based on the data provided for each
resident’s use.
The realities concerning the contradictory data collection and therefore inaccurate image
of Williamstown’s water conservation overall reflects an concerning the mentality towards water
conservation in Williamstown. In short, the town does not view water conservation as a pressing
11
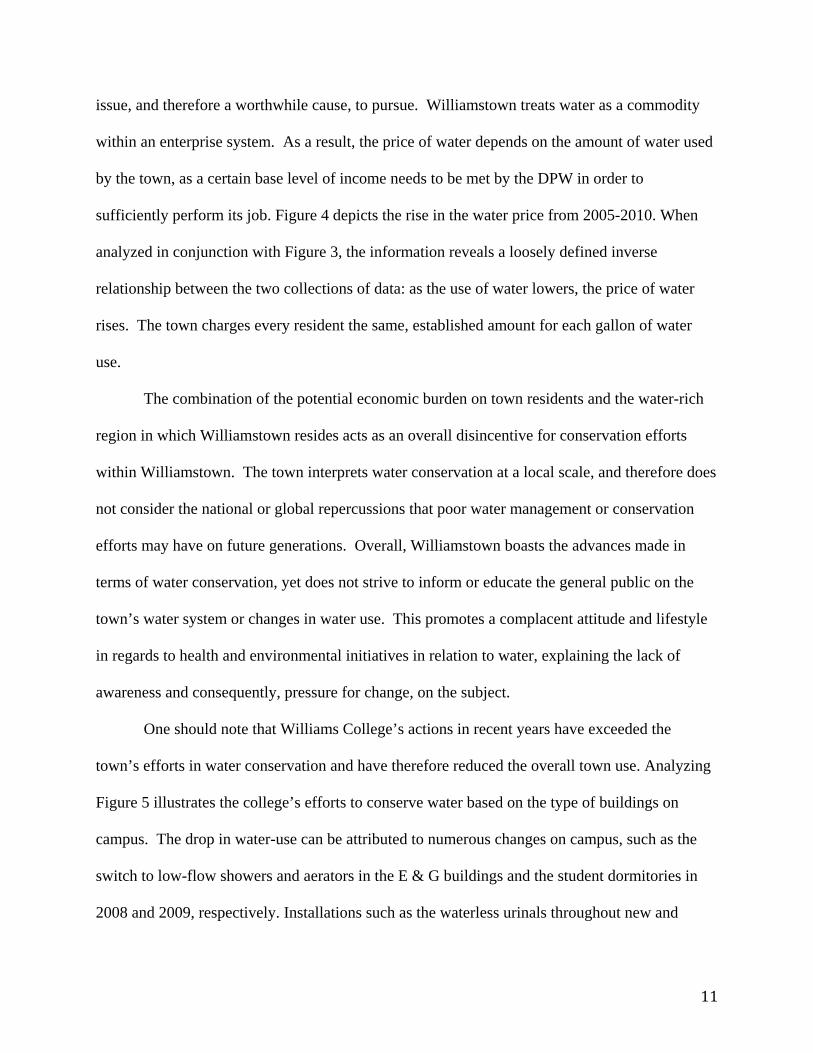
issue, and therefore a worthwhile cause, to pursue. Williamstown treats water as a commodity
within an enterprise system. As a result, the price of water depends on the amount of water used
by the town, as a certain base level of income needs to be met by the DPW in order to
sufficiently perform its job. Figure 4 depicts the rise in the water price from 2005-2010. When
analyzed in conjunction with Figure 3, the information reveals a loosely defined inverse
relationship between the two collections of data: as the use of water lowers, the price of water
rises. The town charges every resident the same, established amount for each gallon of water
use.
The combination of the potential economic burden on town residents and the water-rich
region in which Williamstown resides acts as an overall disincentive for conservation efforts
within Williamstown. The town interprets water conservation at a local scale, and therefore does
not consider the national or global repercussions that poor water management or conservation
efforts may have on future generations. Overall, Williamstown boasts the advances made in
terms of water conservation, yet does not strive to inform or educate the general public on the
town’s water system or changes in water use. This promotes a complacent attitude and lifestyle
in regards to health and environmental initiatives in relation to water, explaining the lack of
awareness and consequently, pressure for change, on the subject.
One should note that Williams College’s actions in recent years have exceeded the
town’s efforts in water conservation and have therefore reduced the overall town use. Analyzing
Figure 5 illustrates the college’s efforts to conserve water based on the type of buildings on
campus. The drop in water-use can be attributed to numerous changes on campus, such as the
switch to low-flow showers and aerators in the E & G buildings and the student dormitories in
2008 and 2009, respectively. Installations such as the waterless urinals throughout new and

12
recently renovated buildings have also impacted water-use on campus. The third major impact on
water reduction throughout Williams involves various repairs around campus. The condensation
and leakage that occurred within the steam plant and central plant prior to repairs wasted large
amounts of clean water. As depicted in the decrease in central plant water use from 2007 to
2008, one can quantify the amount of water conserved by upgrading aspects of buildings.
Even with these important changes in Williams’ water conservation efforts, a
conversation with Ken Jensen about the subject proved that the economics of water use acts as a
deterrent for change at Williams College as well. Water conservation does not seem to be
Williams Facilities’ main concern, and without any outside pressure to question the potential for
conservation projects, the topic becomes a second thought and priority for the school to
undertake. However, with a mere probing of areas to pursue on campus, Ken Jensen generated a
list of projects that facilities can tackle in the future. These initiatives, as well as overarching
themes regarding water conservation through a broader lens, encompass my recommendations
and conclusion upon the completion of my research for this project.
Recommendations and Conclusions
In order to monitor and manage the water use at Williams College and throughout
Williamstown, the current metering system must be improved. This might involve more
frequent screenings of water use as well as a differentiated water monitoring system. These two
improvements would allow for more accurate data in addition to a precise analysis of where the
water is used throughout each building and around campus. A more targeted water conservation
approach could manifest from these changes, as opposed to a broader analysis of the issues
involved, and therefore result in tangible change.

13
While altering the town’s metering and regulation system is crucial to accessing accurate
data for change, this modification still proves to be an insular approach to water conservation. In
order to transform the system, Williamstown must increase the transparency of the issue. The
Massachusetts Conservation Standards requires the town to provide education and outreach to its
residents in order to promote water conservation awareness. Williamstown must address this
concern to promote the issue in some form. In this instance, Williamstown should take advantage
of its institutional resources, as Williams College can act as a model for innovative water
conservation techniques. Though this should not be the town’s only solution, as much of the
population has no affiliation with the private college in any regard, it can act as one method to
encourage wise water use. I have divided my ideas for water conservation projects at Williams
into three sections, designating the potential feasibility of the task. These include undertakings
from promoting awareness to potentially institutionalizing gray or rain water systems at
Williams.
My small-scale projects revolve around promoting the overall awareness of the issue.
This could involve placing posters with facts on local and global water use and waste in
bathroom stalls or other key locations on campus. Members of the Williams community can
begin to generate discussions through Thursday Night Group, the Zilkha Center, or even
Williams Students Online. This information can also include advice on facility-related issues,
such as reporting leaks throughout campus. As of now, leaks are only monitored once per year
throughout the dormitories, so if the school provided more accessible information, then the
potential for greater efforts at water conservation would at least be available to all. With the new
Environmental Science and Policy major, another method of promoting awareness would be to
incorporate the material more regularly into class curriculums.

14
The medium-scale projects for Williams to undertake involve a greater exploration of
toilets at Williams. I discovered that Williams has yet to finish renovating all of the toilets on
campus to 1.6 gallon flush systems. My primary suggestion would be to convert the 128 toilets
currently operating with systems that flush anywhere from 2-5 gallons to the legislated 1.6 gallon
toilet. My second recommendation in terms of toilet improvements would be to convert all tank
toilets on campus into dual flush systems. According to Ken Jensen, 162 tank toilets around
campus (Appendix B) can be converted to dual flush. In addition, the Zilkha Center can start
exploring the feasibility of the dual flush-system in manual, flush-valve toilets in addition to the
tank toilets. Finally, my third project involves an investigation of the benefits and disadvantages
of manual and automatic toilets with respect to water conservation. This project might address
the factors involved in determining this answer, such as the amount of times flushed and the
levels of repairs necessary, and the ways in which can Williams begin to acquire data on this
issue.
My large-scale projects suggest exploring the feasibility of incorporating reusable water
solutions throughout campus, such as gray water and rainwater systems. Would it be possible to
start to catch and store rainwater at Williams? This initiative could explore whether rain water
irrigation might be beneficial for the athletic fields at Williams, and what obstacles might impede
a change of that caliber to the college’s water and facility initiatives. Other areas to investigate
include the renovation of old or construction of new buildings on campus, and the potential for
grey water technology to be incorporated into these plans, as well as the projects implemented at
comparable institutions to Williams.
While one can force changes amongst our community by altering the showerheads and
toilet-flushing systems, without creating some sort of incentive to conserve or disincentive to use
15
water, the overall mindset and approach towards water conservation might be difficult to change.
This not only requires a vastly improved awareness program, but potentially local and state
policy changes to override the current enterprise system in regards to water. Other models to be
considered would be a block-pricing system for water, which intends to deter discretionary water
use. This would allocate a certain amount of water per resident at a minimum price up to a
specific figure, and would then charge a higher price for water beyond the fixed amount.
(Interview with Ralph Bradburd). Other countries subsidize water to account for their vast
distributions of income. This would allow for public works departments to charge an appropriate,
higher price for water without hurting the poor (Interview with Ralph Bradburd). Yet, even with
these economic models established in other regions of the world, no community or nation has a
fully successful water conservation system to replicate. The overall culture and attitude must
change towards water conservation in order to initiate both local and global movement towards a
wet and sustainable future.
\

16
Text References and References Cited
Commonwealth of Massachusetts, 2006, Water Conservation Standards p. 5-17; 27-32. 2003, Environmental Water Scarcity Index by Basin: Water Resources E-Atlas. Interview with Tim Kaiser. April 30, 2010. Interview with Ken Jensen. May 11, 2010. Interview with Ralph Bradburd. May 19, 2010. http://www.epa.gov/region2/library/quotes.htm. Environmental Quotes. Content Last Updated:
4/15/2009. Visited: 5/17/2010. http://water.org/learn-about-the-water-crisis/facts/. Water Facts. Content Last Updated: 2010.
Visited: 5/15/2010. http://www.worldwatercouncil.org/index.php?id=25&L=onf...blurLink(this). Water Crisis by
World Water Council. Copyright: 2005. Visited: 5/15/2010. http://www.who.int/water_sanitation_health/monitoring/jmp2005/en/index.html. Water for Life:
Making it Happen. Copyright 2006. Visited 5/16/2010. http://www.mass.gov/dep/water/resources/watercon.htm#conserve. Water Conservation. Visited:
5/16/2010. http://www.mass.gov/dep/water/local.htm. Sustainable Water Resources. Visited 5/16/2010. http://williamstown.ws/ Town of Williamstown. Visited 5/17/2010.

17
Appendices
Appendix A: Raw Data Information to Accompany Figure 3— Includes Figures for Total Town Use Each Year
2005 2006 2007 2008 2009 2010
Town Water Use (gallons)
142,124,488 144,699,104 160,217,860 134,375,956 108,528,816 47,685,000
Williams College (gallons)
50,565,548 46,130,656 62,041,364 45,182,940 41,730,920 14,228,456
TOTAL (ga lons) l
192,690,036 190,829,760 222,259,224 179,558,896 150,259,736 61,913,456
Appena t
dix B: Location and Amount of Toilets on l Flush Systems # Of Toilet Convert
C hat Can Be Converted to DuampusBuilding s toDodd 70
Poker Flats 12 Currier 1 2
Thompson 1 0Garfield 8
Center for D l Economics evelopmenta 8 Woodbridge 4
Related Documents