Understanding USDA Corn and Soybean Production Forecasts: An Overview of Methods, Performance and Market Impacts by Darrel L. Good and Scott H. Irwin

Welcome message from author
This document is posted to help you gain knowledge. Please leave a comment to let me know what you think about it! Share it to your friends and learn new things together.
Transcript
Understanding USDA Corn and Soybean Production Forecasts: An Overview of Methods, Performance and
Market Impacts
by
Darrel L. Good and Scott H. Irwin
Understanding USDA Corn and Soybean Production Forecasts: An Overview of Methods, Performance and Market Impacts
by
Darrel L. Good and Scott H. Irwin 1
October 2003 Updated: January 2004
AgMAS Project Research Report 2003-07
1 Darrel L. Good and Scott H. Irwin are Professors in the Department of Agricultural and Consumer Economics at the University of Illinois at Urbana-Champaign. The authors appreciate the research assistance of Thorsten Egelkraut and Olga Isengildina in assembling the data used for this study. Rich Allen of NASS provided valuable information about NASS crop forecasting procedures. This material is based upon work supported by the Economic Research Service, U.S. Department of Agriculture, under Project No. 43-3AEK-8-80106. Any opinions, findings, conclusions, or recommendations expressed in this publication are those of the authors and do not necessarily reflect the view of the U.S. Department of Agriculture.
Understanding USDA Corn and Soybean Production Forecasts: An Overview of Methods, Performance and Market Impacts
Abstract
The purpose of this report is to improve understanding of USDA crop forecasting
methods, performance and market impact. A review of USDA’s forecasting procedures and methodology confirmed the objectivity and consistency of the forecasting process over time. No changes in methodology occurred in 2003. Month-to-month changes in corn and soybean production forecasts from 1970 through 2003 indicated little difference in magnitude and direction of monthly changes over time. USDA production forecast errors were largest in August and smaller in subsequent forecasts. There appeared to be no trend in the size or direction of forecast errors over time. On average, USDA corn production forecasts were more accurate than private market forecasts over 1970-2003, with the exception of August forecasts since the mid-1980s. Private market forecasts in soybeans were more accurate than USDA forecasts for August, regardless of the time period considered. As the growing season progresses the USDA’s relative accuracy in soybeans improved. USDA corn production forecasts had the largest impact on corn futures prices in August and recent price reactions have been somewhat larger than historical reactions. For soybeans, the largest reactions in futures prices occurred in August and September, but recent reactions have been large in October. Overall, the analysis suggests the USDA performs reasonably well in generating crop production forecasts for corn and soybeans.
Understanding USDA Corn and Soybean Production Forecasts: An Overview of Methods, Performance and Market Impacts
Introduction
There appears to be continuing misunderstanding of US Department of Agriculture (USDA) motives, methods and procedures used to arrive at production forecasts for US corn and soybean crops. This was vividly illustrated by comments from producers, commodity analysts and farm market advisory services following the release of the August 2003 forecasts. For example, we recently received the following e-mail inquiry from a farmer:
“I have a question concerning the August and the September crop production reports. A friend told me that the numbers that came out in the August report, which were lower than many predicted, were utilizing a weather forecast for a hotter and drier 30 day outlook, as of August 1 (the forecast would have been for the month of August). He said that the USDA was trying to use a new system, which would take into account the weather forecast, along with the usual crop conditions and yield checks. I was under the assumption that the August crop report took field surveys as of August 1, and then assumed average weather for the rest of the growing season. If my friend was correct, then this could potentially mean that the dropping crop conditions have already been factored in, and that the September report may only have a slight revision downward.”
Market analysts, as represented below, also echoed these concerns:
“There has been considerable dismay in the industry as to USDA’s August corn and soybean estimates. Most do not see them as real objective analysis…We think that NASS just missed it by being too conservative with an immature corn and soy crop.”
These comments nicely illustrate the importance placed on USDA crop forecasts by market participants and the potential for misunderstanding of the methods used to produce the forecasts. Some in the agricultural community apparently even believe that the USDA manipulates crop forecasts to fulfill some mystical objectives that are contrary to the best interest of farmers. There is clearly a need for a better understanding of all aspects of the USDA crop production forecasting process.
The objectives of this report are to 1) provide an overview of the forecasting process for
corn and soybean production used by the USDA, 2) present monthly production forecasts for the 1970 through 2003 corn and soybean crops, 3) examine relationships in the monthly changes in production forecasts, 4) examine errors in the USDA forecasts, 5) compare USDA forecasts to private market forecasts and 6) examine the price response to USDA forecasts and the relationship of the responses to report “surprises.” This information should improve understanding of USDA crop forecasting methods, performance and market impact.
2
USDA Forecasting Process
The USDA uses a highly sophisticated and well-documented procedure to generate its crop production forecasts.1 All phases of the process are conducted by the National Agricultural Statistics Service (NASS), an agency within the USDA. For corn and soybeans, production forecasts are released in August, September, October, and November.2 Final estimates are published in January.
The USDA generates crop production forecasts based on estimates of planted and
harvested acreage and two types of yield indications, a farmer-reported survey and objective measurements. The acreage figures are obtained from the June Agricultural Survey, conducted during the first two weeks of June and reported at the end of June. The June Survey is based on a large farm operator list frame and a separate and independent area frame survey. These acreage estimates are used in subsequent production forecasts until there is evidence (survey or other) to alter the acreage estimates.3 The farmer and objective yield “probability” surveys use the same sampling, survey and estimation procedures from year-to-year. This allows yield and production forecasts to be compared over time. Rich Allen, Deputy Administrator for Programs & Products and Chair, Agricultural Statistics Board, NASS, confirmed that there has been no change in forecasting procedures for the 2003 crops (Allen, 2003).
The farmer-reported yield survey is conducted for states with significant corn and
soybean production. In 2003, 33 states were surveyed for corn and 29 for soybeans. Farmers included in the yield survey are randomly selected from the list frame (essentially a list of names, addresses and phone numbers) of individuals that responded to the June Agricultural Survey. This assures that farmers included in the yield surveys are growing the crop of interest. Farmers are asked monthly (August through November) for a subjective prediction of their final corn and soybean yields. While the list frame changes across years, reflecting changing farming arrangements, the same individuals are surveyed each month for a particular crop year.
Farmer-reported yield surveys are conducted primarily by Computer Assisted Telephone
Interviewing (CATI), but some data are collected by mail and by face-to-face interviews. The USDA has determined that farmers tend to make conservative (low) yield predictions, especially early in the season, so the survey results for each month are compared to survey results at the same time during the past 10 years and the final average yields for those years. Thus, the final farmer-reported yield for a given month is adjusted to reflect that fact that farmers consistently are conservative over time.
The objective yield survey for corn and soybeans typically is conducted only for the
seven most important production states. These "speculative" states generate about 70 percent of US production for each of the crops. The objective yield survey is based on an area-frame
1 This section draws heavily from Egelkraut et al. (2003). 2 The USDA also published corn and soybean production forecasts for July until the mid-1980s. 3 The USDA announced on September 29, 2003 that it will begin using the Farm Service Agency’s (FSA) certified acreage information for the October crop report. Previously, this information was not available until the end of the year, and thus, could only be incorporated into January estimates.
3
sampling design, where fields are randomly selected from the total land area used in production of a given crop. Mirroring the procedure for the farmer-reported yield survey, fields for the objective yield survey are randomly selected from the larger number surveyed in USDA’s June Agricultural Survey. Note that sample fields are selected with a probability proportional to their size.
Objective yields are obtained from two independently located plots in each randomly
selected field. Physical counts and measurements of the number of plants and production per plant are conducted. Yield per acre is generated for the field after standardizing for row widths, moisture content and harvest loss. Objective yield indications are derived from models based on observations over the last five years for the corresponding months compared with end of season yields. Separate monthly models are constructed by maturity stage so forecast adjustments are automatically made for early or late maturing crops.
It is important to note that accuracy of the objective yield indications can change through
the growing and harvest seasons. Early in the season, the yield indications are influenced by assumed relationships between plant counts and fruit numbers, and an assumed fruit weight adjusted for moisture content and harvest loss. As the season progresses, fruit counts become known. At the end of the season, plots are harvested, and yields are calculated based on actual grain weights and harvest losses. In addition, an interview is conducted with the farm operator immediately after harvest to determine acres actually harvested and the yield realized in the sample field.
As noted earlier, yield forecasts are developed monthly from August through November.
The data on both yield surveys are collected during the last week of the month previous to the survey month and the first few days of the survey month, generally from the 25th of the previous month through the 3rd of the survey month. Yield forecasts then reflect crop conditions at the beginning of the survey month. The crop production forecasts are based on the assumption of normal growing conditions for the remainder of the season as reflected by historical records. The USDA does not incorporate any weather forecasts or factor in crop conditions as reflected by weekly crop progress reports.
The farmer and objective yield indications are combined in a multistage process
employing statistical and judgmental techniques. Before the actual "lock-up" that precedes the release of a crop report, all available acreage data and farmer-reported yield indications for non-speculative states are reviewed. One part of this review is comparison of yield recommendations for a given state with adjoining states to see if they demonstrate consistency, based on the weather that has already occurred. If there is a need to discuss recommendations with a state office, this can be done but no information is exchanged about yield indications for other states. By the time lock-up occurs, harvested acreage for all states and yields for non-speculative states have been set.
The lock-up for USDA crop reports occurs the night before a report is released. The
recommendations and comments for speculative states are transmitted as encrypted data files which are locked in a safe until the lock-up area is secured. For these states, yield indications are available from both the farmer-reported survey and the objective yield survey. During lock-up, the Agricultural Statistics Board reviews all the indications, and in consultation with commodity
4
statisticians, determines production forecasts for speculative states. Regional production forecasts are then determined. The final step is the generation of national production forecasts. The process used to determine final production estimates is described by Gardner (1992) this way:
“A NASS board in Washington then assesses all the indicators of yield, including the estimates of a month earlier. This is not done using a pre-specified formula---in which case a computer could replace the NASS board---but through a consensus of the Board members based on their experience and the full information before them. (p. 1068)
After the Agricultural Statistics Board moves to another crop, a commodity statistician, and usually one other Board member, completes the review of individual state indications, recommendations, and analyses and adjusts final state figures if necessary. For a complete description of the production forecasting process, see “The Yield Forecasting Program of NASS”, SMB Staff Report Number SMB 98-01, USDA, NASS, Statistical Methods Branch, July 1998. USDA Forecast Performance
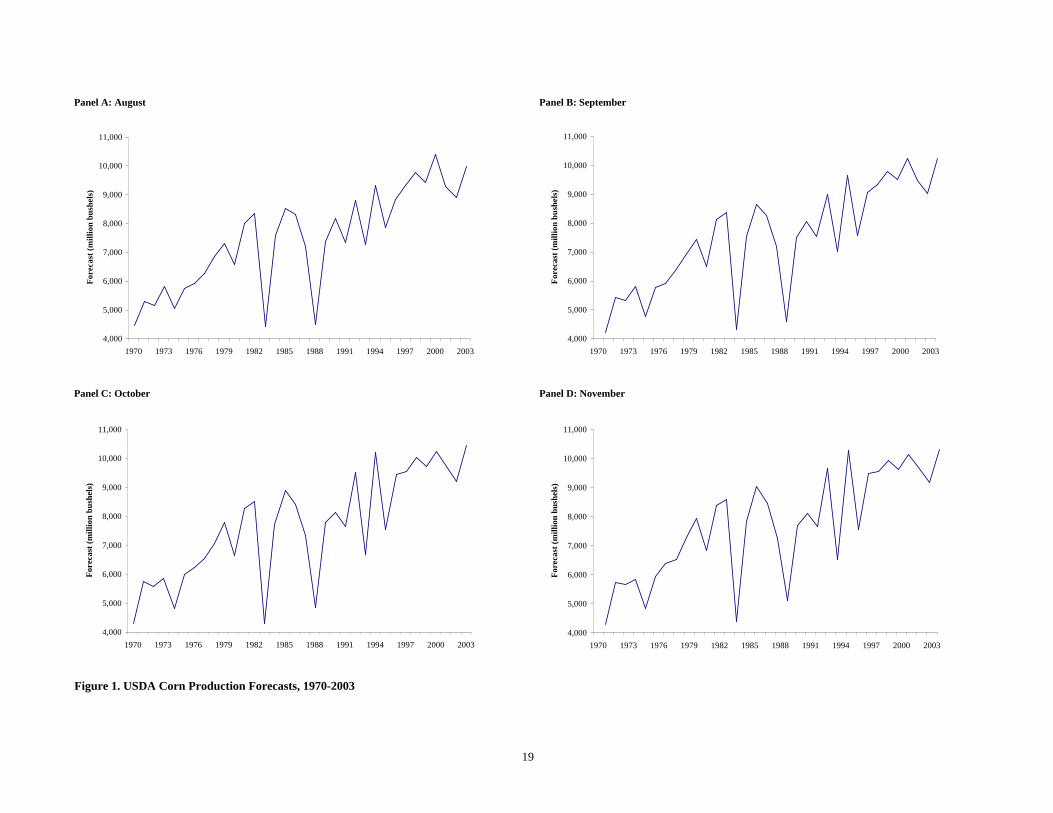
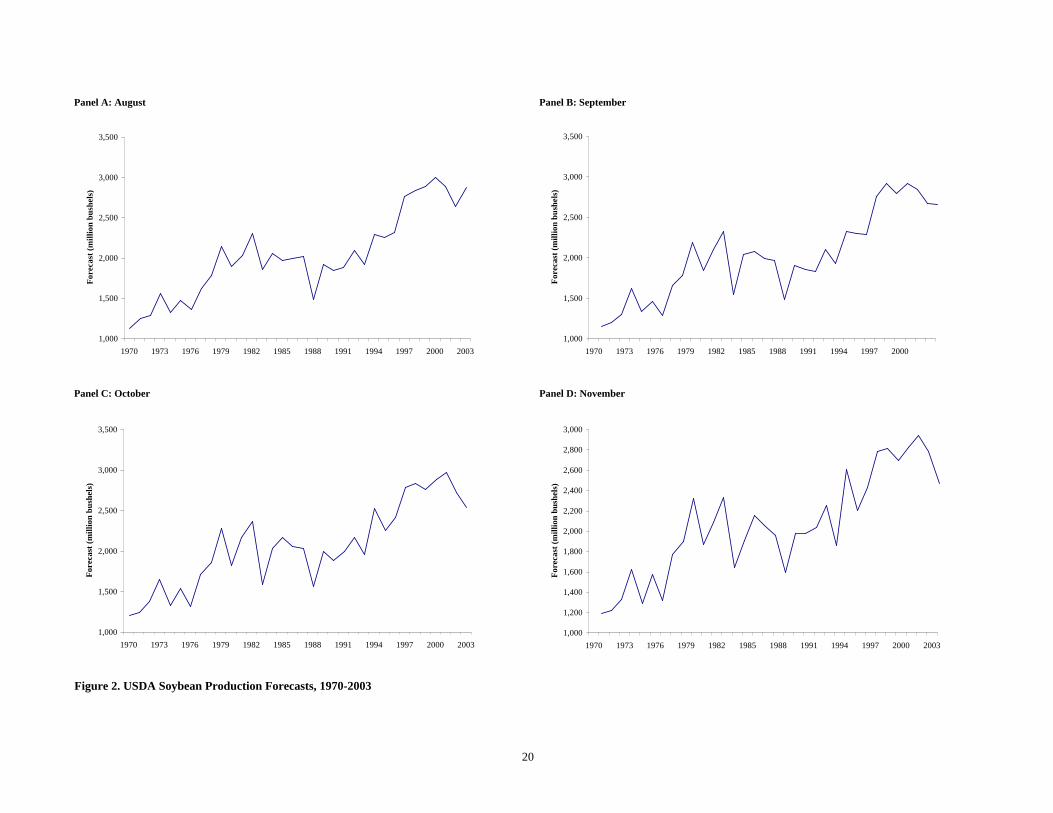
Corn and soybean production forecasts provided by the USDA for the 34-year period covering 1970-2003 are presented in Figures 1 and 2. Production forecasts are shown for August, September, October and November of each year. As noted in the previous section, a July forecast was made until the mid-1980s, but is not considered here in order to have a consistent set of forecasts for the entire period. USDA crop production estimates released in January of the year after harvest generally are considered to be “final” estimates. While January estimates may be subsequently revised based on stocks reports or agricultural census data, such changes tend to be rather small.4
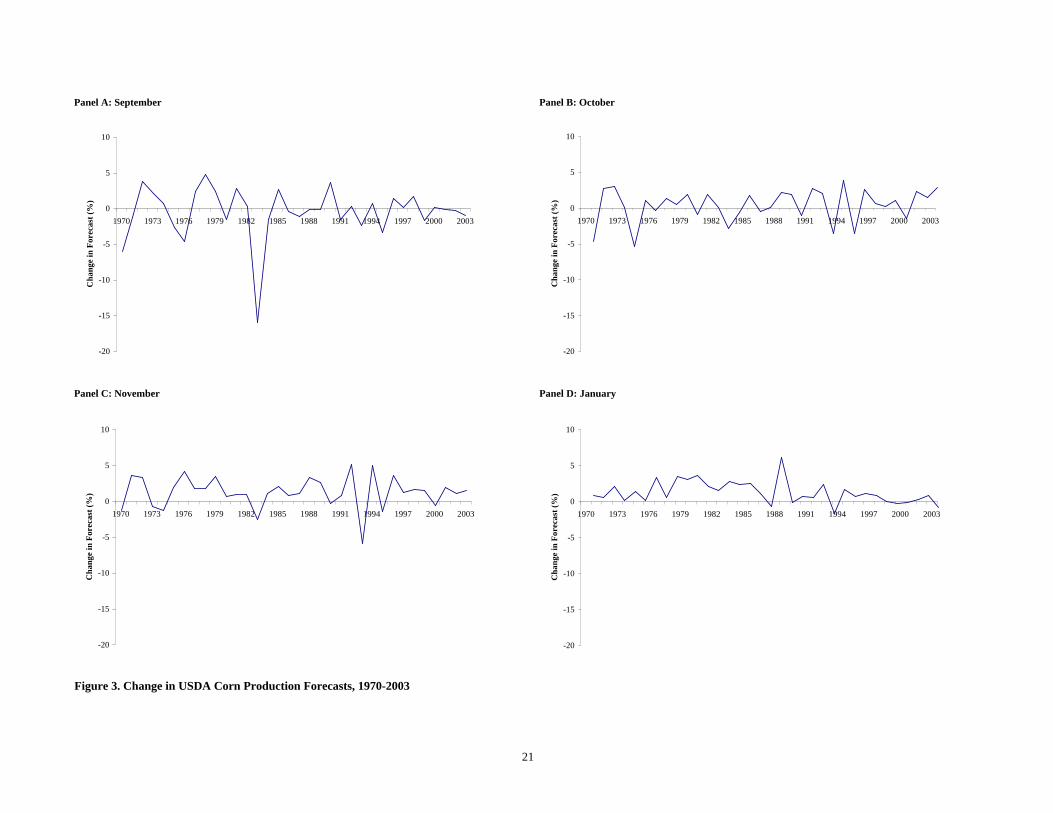
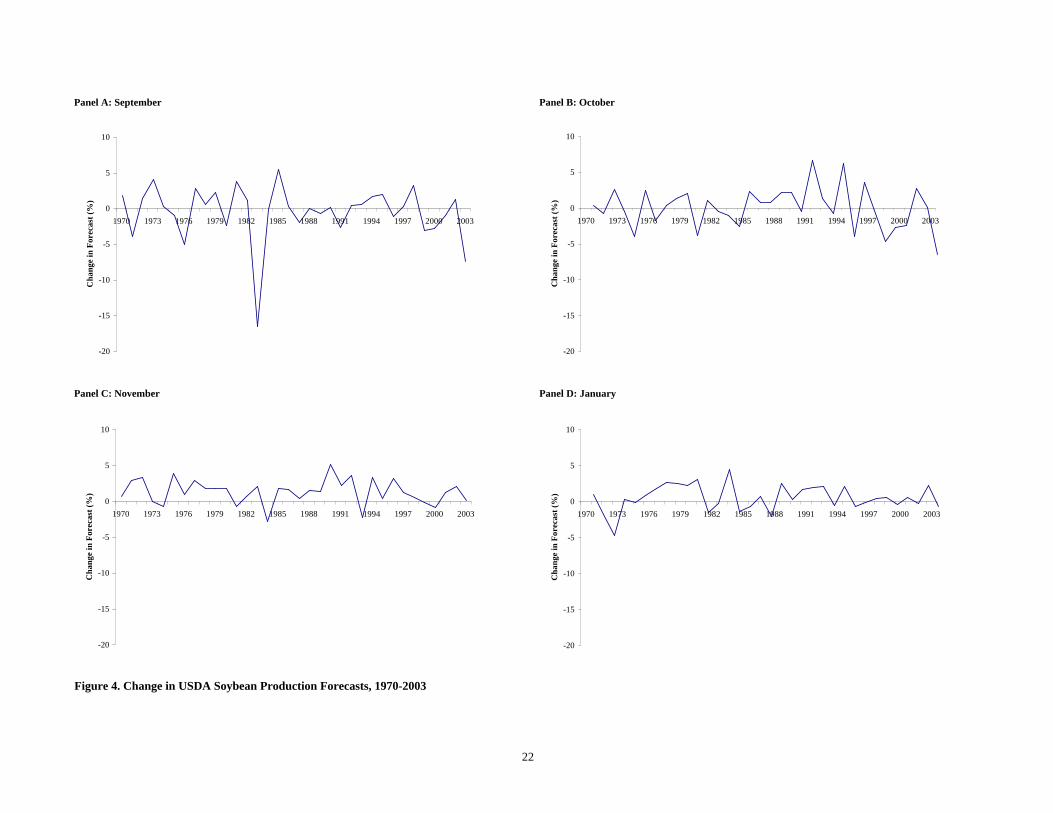
Changes in the monthly production forecasts relative to the previous month’s forecast are
presented in Figures 3 and 4 for corn and soybeans, respectively.5 Before proceeding further, it is important to emphasize that the term “change in forecast” is not meant to imply that the USDA revises monthly forecasts. As discussed in the previous section, the USDA makes the best possible interpretation of production potential each month based upon available information. In other words, the USDA makes a “fresh” or “new” forecast each month.
Returning to Figures 3 and 4, the change in forecasts is presented in percentage terms,
rather than in bushels, in order to standardize for increasing crop size over time. A positive change represents a larger forecast in the current month relative to the previous month and vice versa. The September change for both corn and soybeans was very large in 1983. For a given month, however, there appears to be little difference in the magnitude of monthly changes over time. In addition, there appears to be no change in the pattern or direction of monthly changes
4 The official track record of USDA crop production forecasts can be found in the publication at: http://usda.mannlib.cornell.edu/data-sets/crops/96120/. 5 Please see the appendix to this report for all computational formulas.
5
over time. It is not surprising that the size of forecast changes tends to diminish across the forecasting cycle (e.g., September corn changes versus January corn changes).
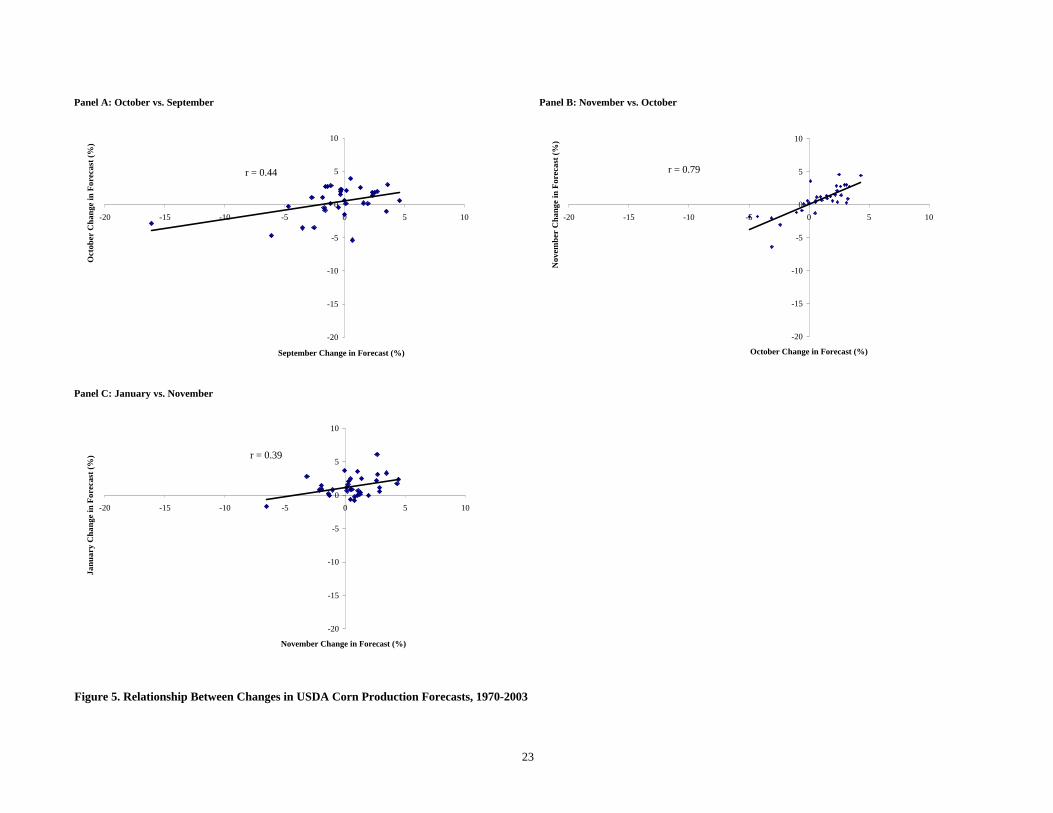
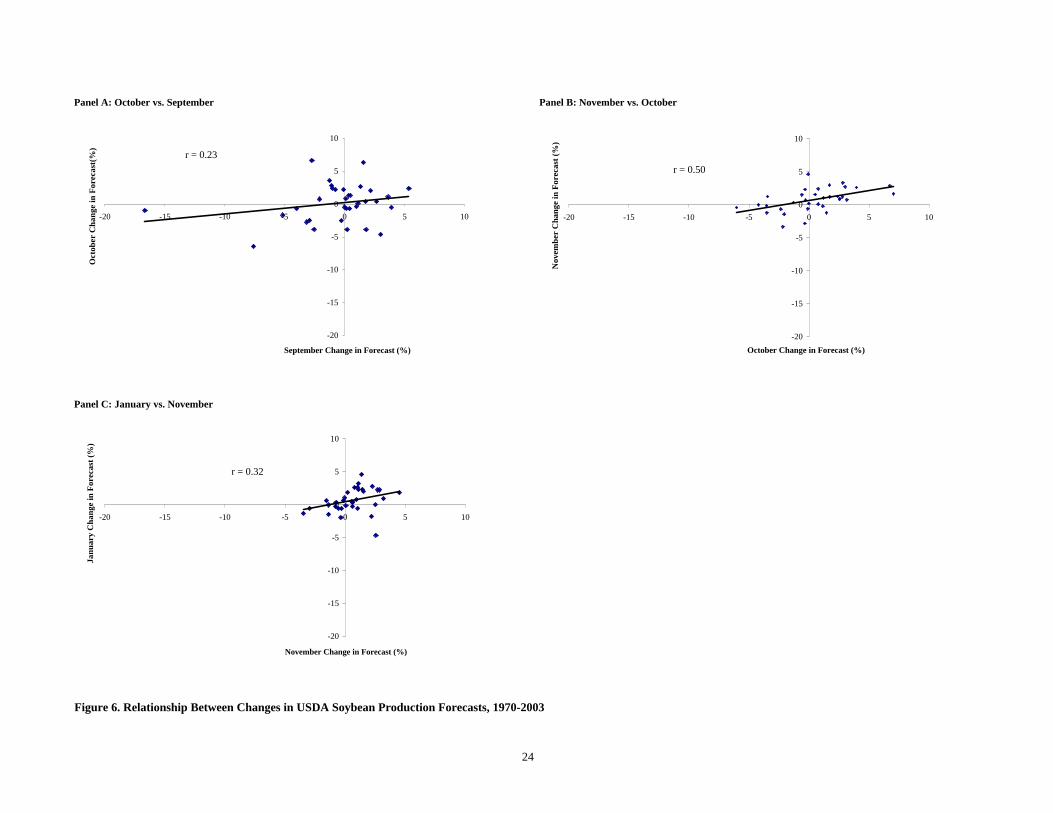
Figures 5 and 6 illustrate the relationship between changes in monthly production
forecasts. The figures address the question of whether the size and direction of change in October forecasts, for example, is correlated to the size and direction of change in September forecasts. The results indicate that there is a positive relationship in the monthly changes for both corn and soybeans. The magnitude of the relationship is indicated by the correlation coefficient (r). A correlation coefficient of +1 indicates a perfect positive correlation in monthly forecast changes and a coefficient of 0 indicates no correlation in monthly changes (A coefficient of -1 indicates perfectly negative correlation.) Correlations in corn are moderate for October versus September and January versus November changes and high for November versus October changes. The average correlation across all three comparisons for corn is 0.54, which indicates substantial “smoothing” of changes in corn production forecasts. Relationships are more limited in soybeans, where the highest correlation is 0.50 (November versus October changes). The average correlation across all three comparisons for soybeans is 0.35, indicating a moderate amount of smoothing of soybean production forecasts across months.6
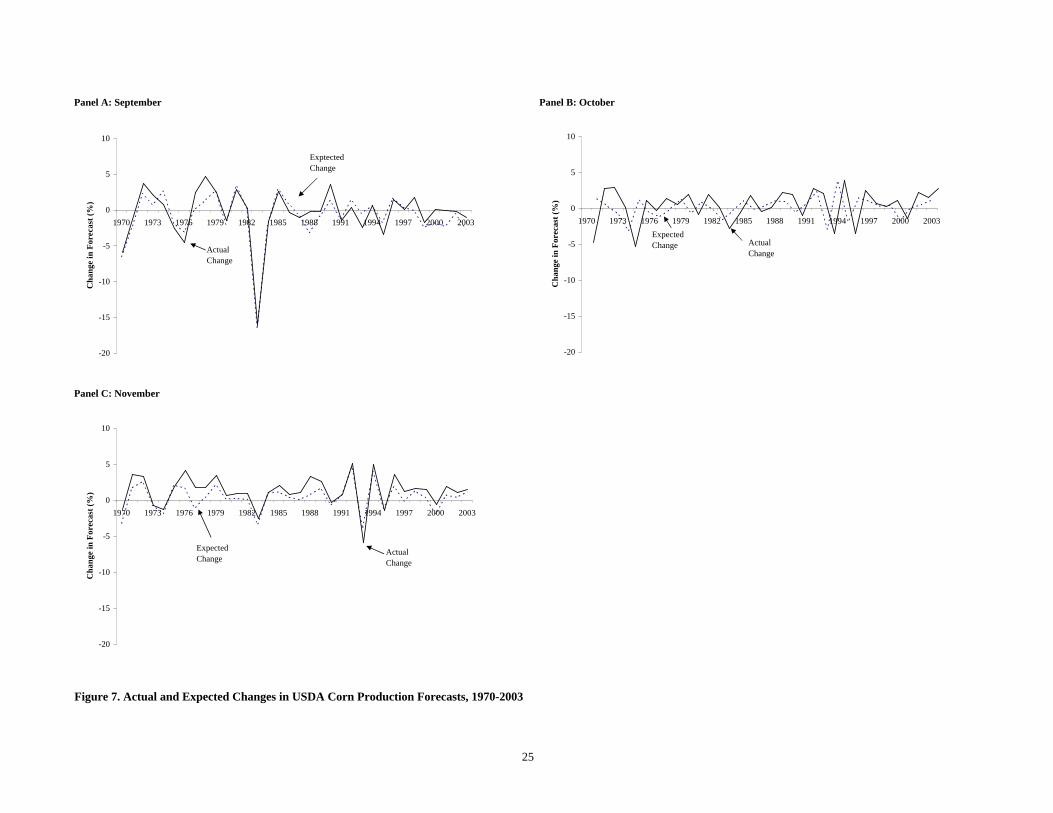
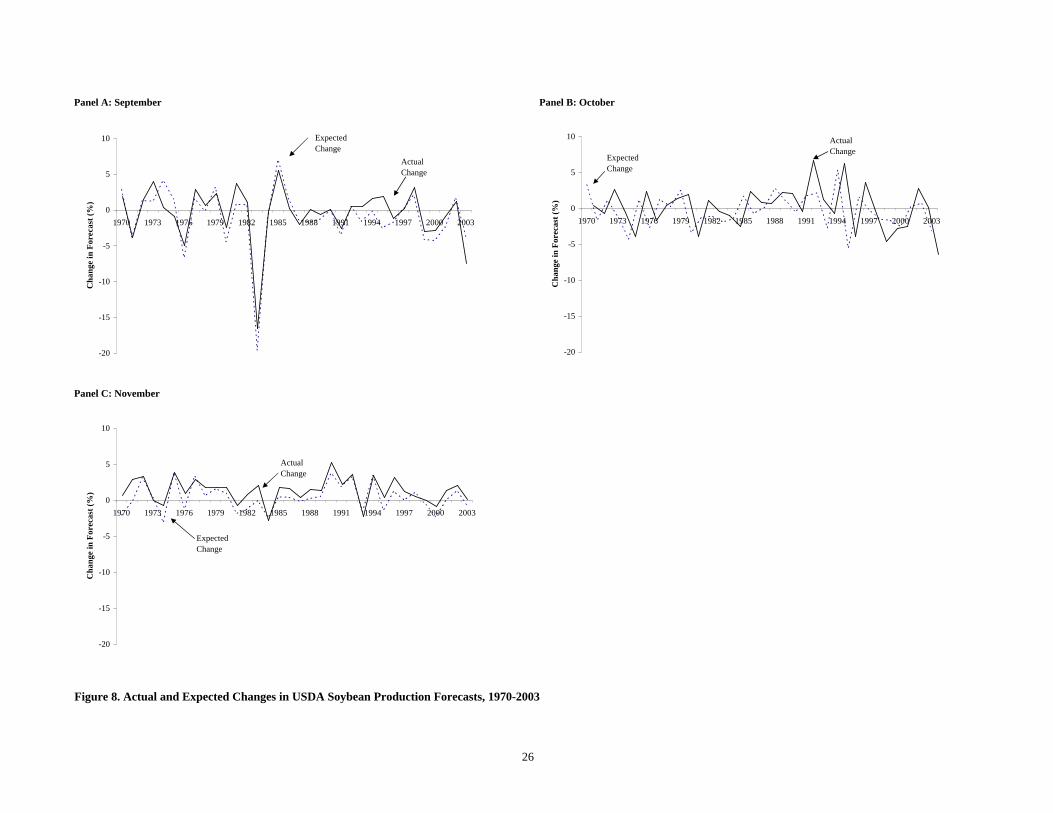
Figures 7 and 8 illustrate the magnitude of monthly changes in corn and soybean
production forecasts relative to the changes expected by private market analysts. For the period 1970 through 2000, the expected private market changes are represented by an average of the changes in production forecasts by Conrad Leslie and Sparks Companies, Inc. Forecasts from these two firms are selected because they generally were considered to be the most influential and were widely-reported in the popular press during this period. The two firms used different procedures and sources for estimating crop size (Egelkraut et al., 2003). In addition, the history of forecasts by these two firms is available for an extended period of time. For the period 2001 through 2003, the expected private market changes are represented by changes in the “average trade guess” as reported by Oster/Dow Jones (ODJ). The change was made because Conrad Leslie discontinued his service after 2000. Note that Sparks forecasts are included in the ODJ averages. For the most part, both the direction and the magnitude of changes in monthly USDA corn and soybean production forecasts have been well anticipated by the private sector. This suggests that private analysts are able to anticipate and incorporate any “smoothness” in USDA changes into their own forecasts.
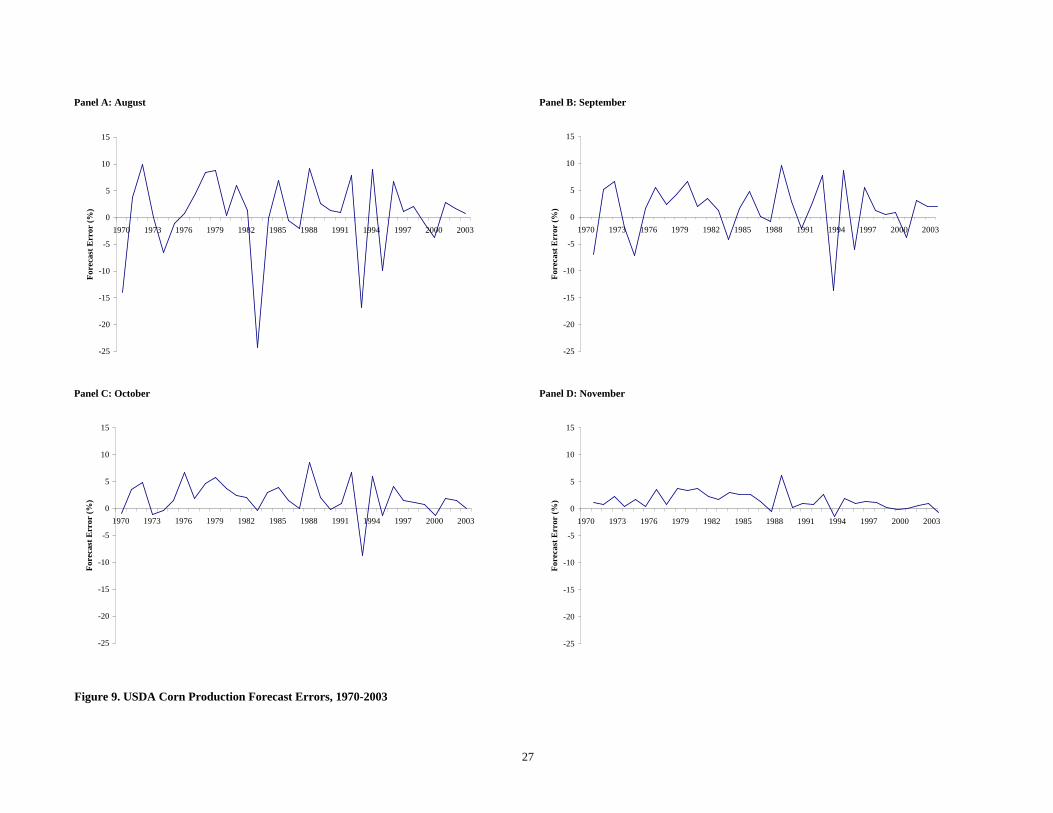
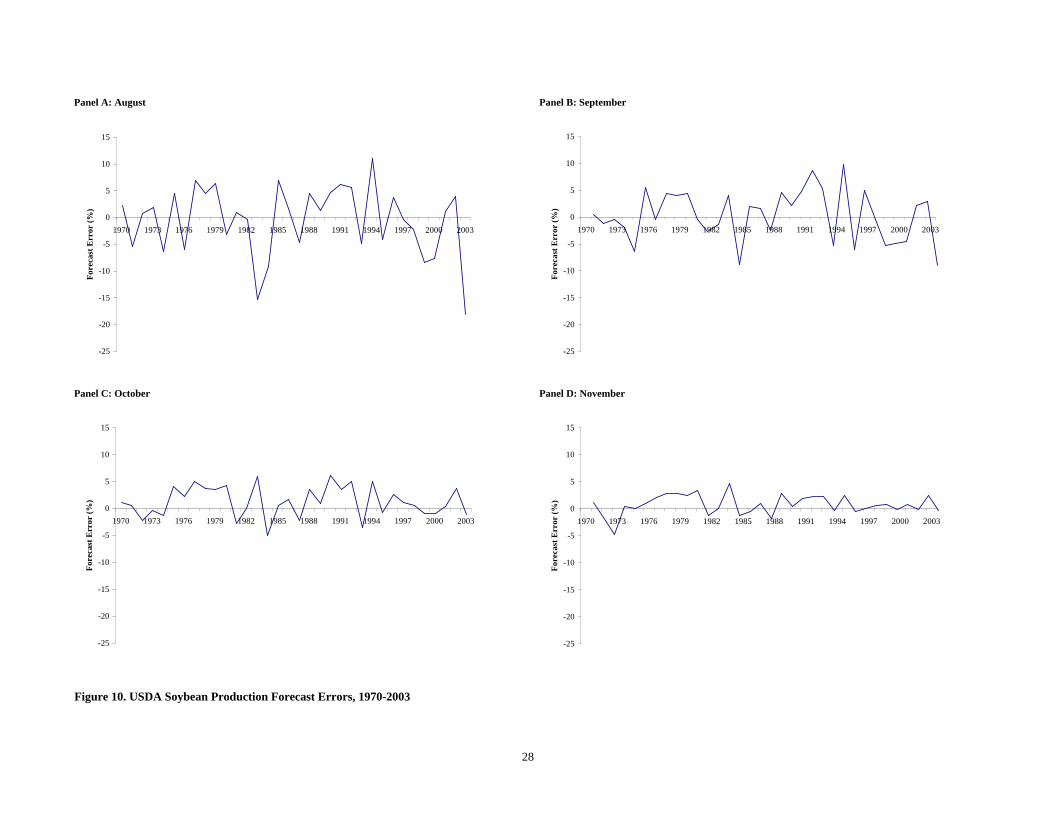
The previous analysis indicates that the pattern of changes in USDA corn and soybean
production forecasts has been stable over time and that the private sector anticipates the changes reasonably well. However, there is still the question of the accuracy of monthly forecasts. Following previous studies (e.g., Garcia et al., 1997; Egelkraut et al., 2003), the accuracy of the August, September, October and November forecasts is measured against the January estimate. The percentage errors in each of the monthly forecasts are presented in Figures 9 and 10 for the 1970 through 2003 corn and soybean crops, respectively. Not surprisingly, errors generally are
6 See Isengildina, Irwin and Good (2003) for a thorough analysis of the relationship between forecast changes in both corn and soybeans. They find that the positive correlations in forecast changes are statistically significant. This is consistent with Gardner’s (1992) argument that, “If the current estimate is substantially different from earlier estimates there is a tendency not to adjust the prior NASS estimates fully to rely only on the current month’s information.” (p. 1068) Isengildina, Irwin and Good discuss several possible explanations for the observed smoothing of changes in USDA corn and soybean production forecasts.
6
largest in August and become smaller in subsequent forecasts, reflecting improving information on actual crop size. In every case, the average forecast error is near zero, indicating USDA forecasts do not tend to be too high or too low on average. There also does not appear to be any discernable trend in the size of forecast errors through the years. Finally, it is interesting to note that, on average, the magnitude of percentage forecast errors for corn and soybeans in the same month are about equal.
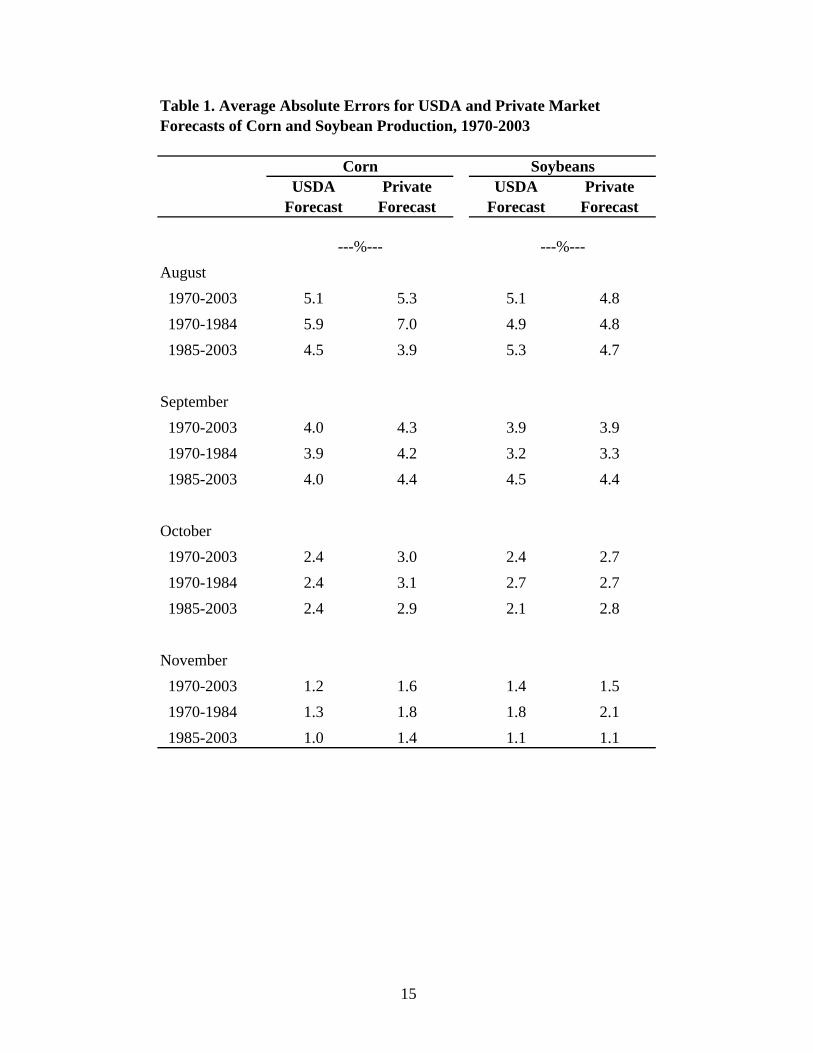
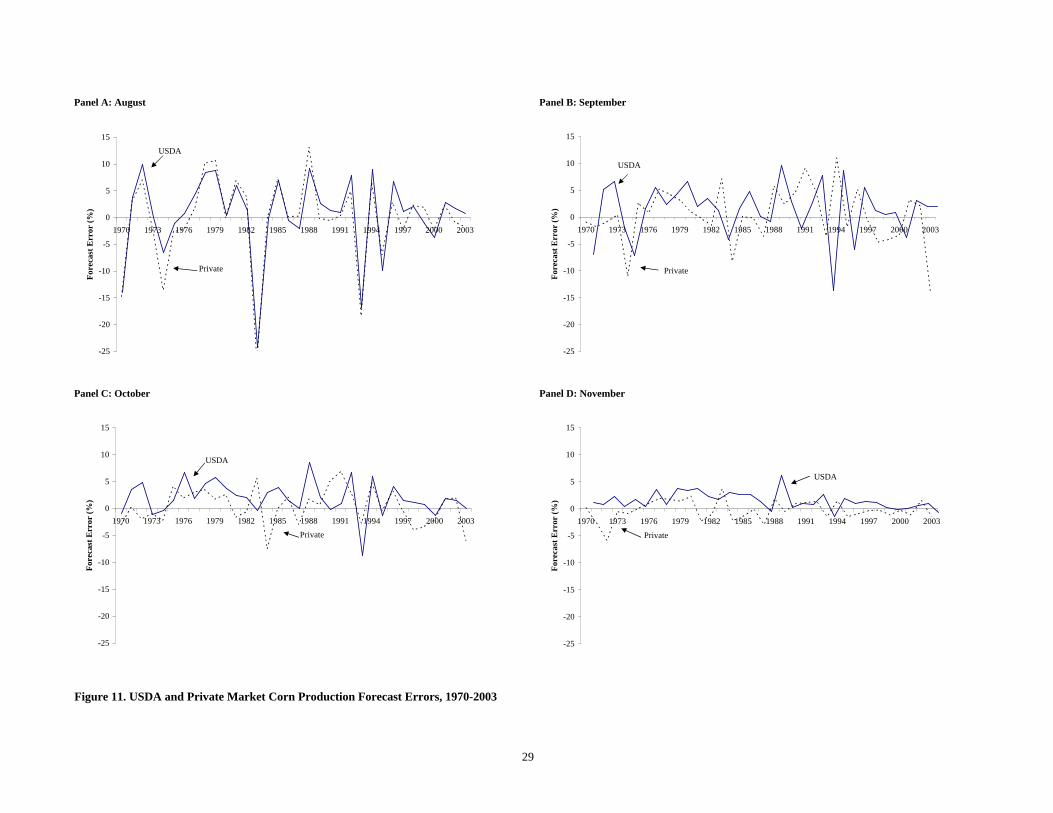
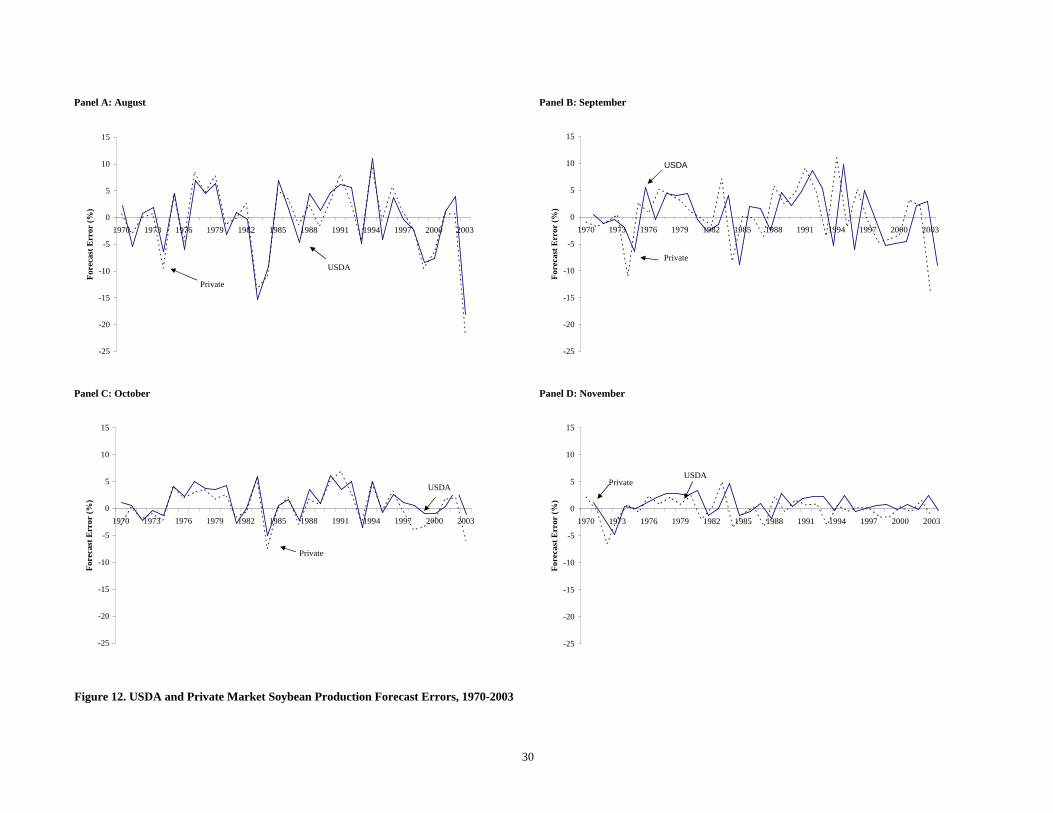
Corn and soybean forecast errors for the USDA and private market are compared in Figures 11 and 12, respectively. The figures suggest that USDA and private forecast errors are about the same magnitude, especially so for soybeans. However, there are times when the forecast errors diverge sharply. It turns out that there are some important trends in the relative forecasting accuracy of the USDA and private market over this period, but it can be difficult to see just looking at the figures. The trends are more easily discernable in Table 1, which presents average absolute percentage errors for the USDA and private market forecasts. These calculations treat negative and positive forecast errors the same. In other words, the direction of error does not matter, only the distance from the final value. The average absolute error is reported for the entire 1970-2003 period and for two sub-periods, 1970-1984 and 1985-2003.7 In corn, the relative forecasting accuracy of the USDA was superior in every case, except August in the latter sub-period. USDA forecasts in corn also improved more quickly than the private market as the growing season progressed. The one trouble spot for the USDA in corn was August forecast accuracy since the mid-1980s. Since that time, private market forecasts have been more accurate by an average of 0.6 percentage points, not an inconsequential difference. This reflects a sharp improvement in August private sector forecast accuracy relative to the USDA over the last three decades.
The relative forecasting comparisons for soybeans are a bit more surprising. Private market forecasts were more accurate than USDA forecasts for August, regardless of the time period considered. Paralleling the results for corn, private market forecasts of August soybean production since the mid-1980s have been more accurate by an average of 0.6 percentage points. As the growing season progresses the USDA’s relative accuracy improved, with the USDA having average absolute percentage errors about equal to or smaller than the private market for September, October and November soybean forecasts.8 Overall, the analysis presented in this section suggests the USDA performs reasonably well in generating crop production forecasts for corn and soybeans. There is nonetheless room for improvement. Commenting on similar forecast accuracy results, Egelkraut et al. (2003), offer this suggestion:
7 The 1984/1985 breakpoint is suggested by empirical results found in Fortenbery and Sumner (1993) and Garcia et al. (1997). 8 See Egelkraut et al. (2003) for a thorough analysis of USDA forecast accuracy in both corn and soybeans. Their investigation is based on several measures of forecast accuracy, including the average absolute error measure considered here. Results are not sensitive to which measure of forecast accuracy is considered. They also conduct statistical tests of the differences in forecast accuracy and examine in detail the question of structural change in relative forecast accuracy.
7
“The improved performance by the private agencies for August for both crops during the most recent years, and the ability of the private agencies to generate relatively accurate forecasts in soybeans suggest that it might be useful for USDA to investigate expanding the scope of their subjective yield analysis to incorporate a wider range of market and industry participants. Such a strategy, if proved effective, might lead to improved crop production forecasts.” (p. 94)
Market Impact of USDA Forecasts
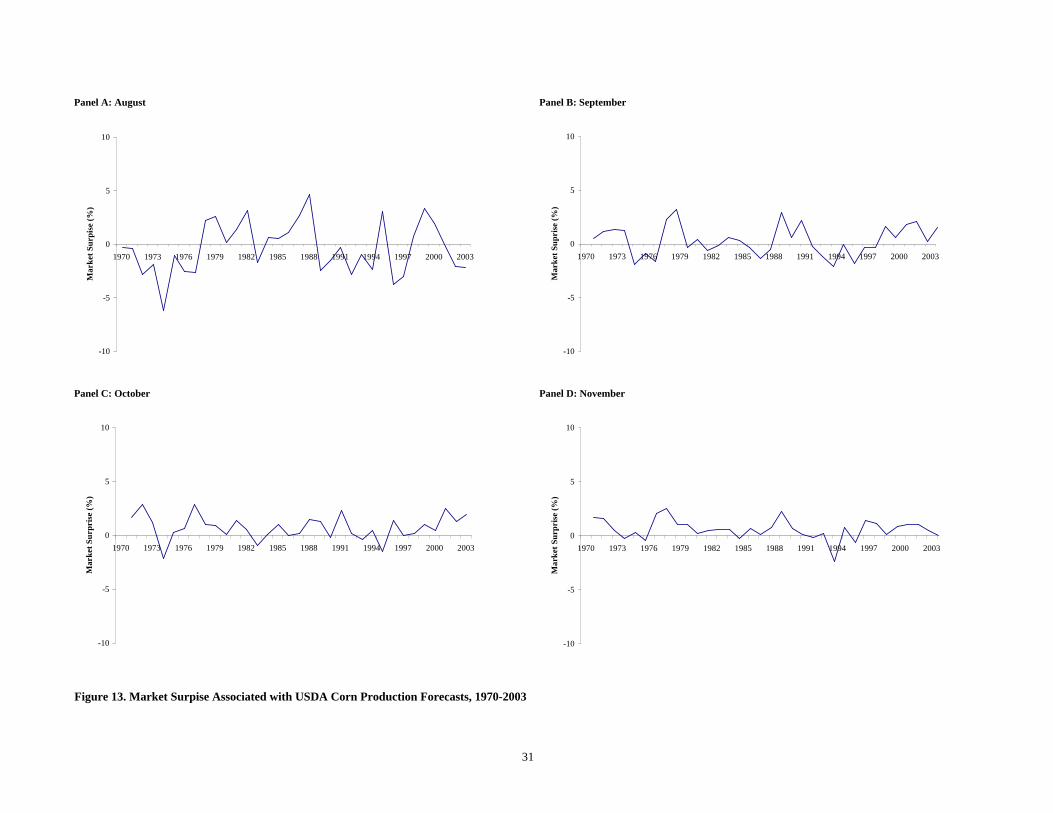
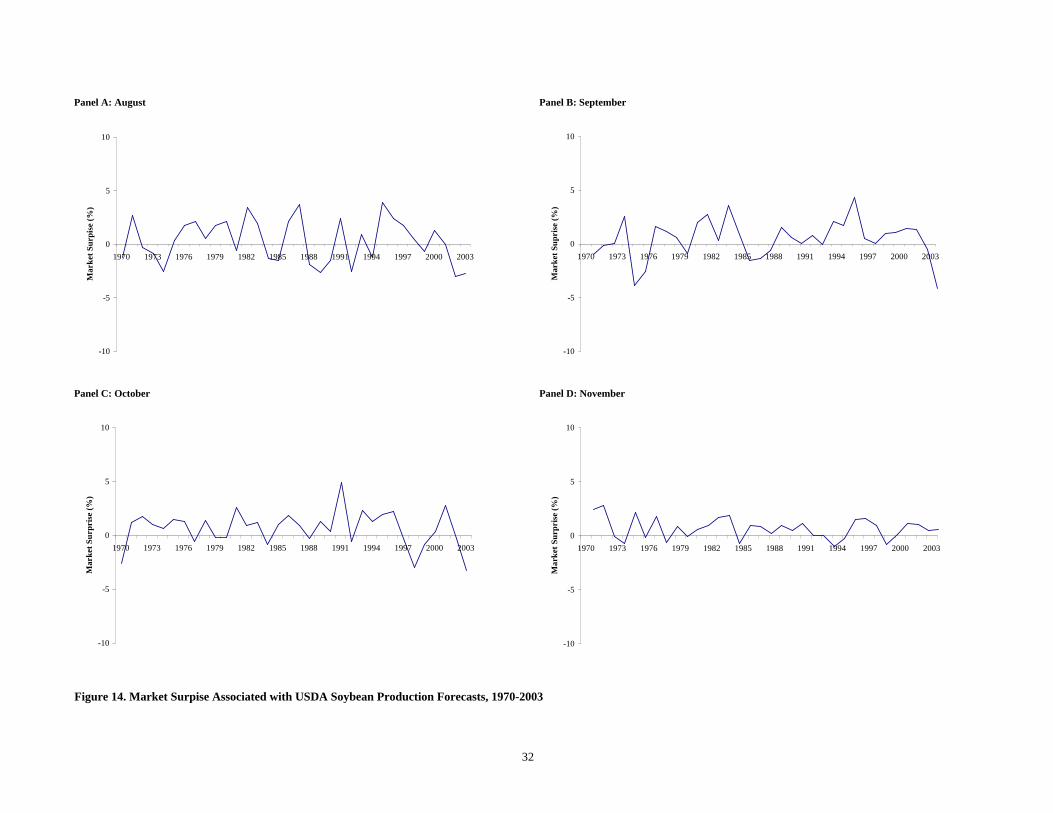
Theoretically, the price impact of USDA corn and soybean production forecasts should be determined by how well the market anticipates the forecasts. If the market perfectly anticipates USDA production forecasts, then, under the theory of efficient markets, prices will not change. If the market does not perfectly anticipate the forecasts, prices will change in relation to the degree that the market is “surprised” by the new information. To compute surprises, a measure of market expectations is needed. Once again, private market forecasts are represented by an average of Conrad Leslie and Sparks Companies, Inc. forecasts from 1970-2000 and ODJ averages for 2001-2003.9 Figures 13 and 14 show the percentage difference between monthly USDA production forecasts and the monthly private market forecasts.10 This difference is an estimate of the market surprise for each crop report. A positive surprise number is considered “bearish” because the USDA forecast is larger than the market expectation. Likewise, a negative surprise number is considered “bullish” because the USDA forecast is smaller than the market expectation. Earlier it was shown that the private sector anticipates much of the information in crop reports (see Figures 7 and 8). However, this does not mean the private sector anticipates the information entirely, as is dramatically illustrated in Figures 13 and 14. Market surprises tend to be largest in August and smallest in November for both corn and soybeans. This makes sense as there is more uncertainty about crop conditions earlier in the growing season. There does not appear to be any obvious trends in market surprises across crop years.
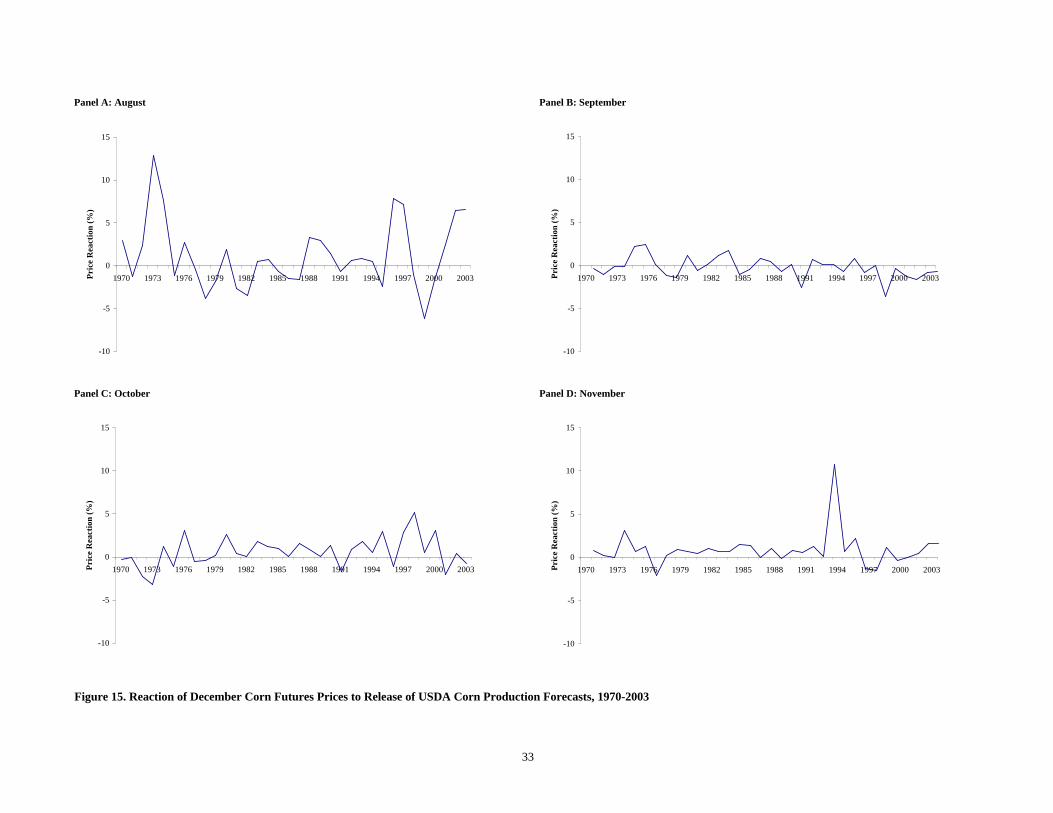
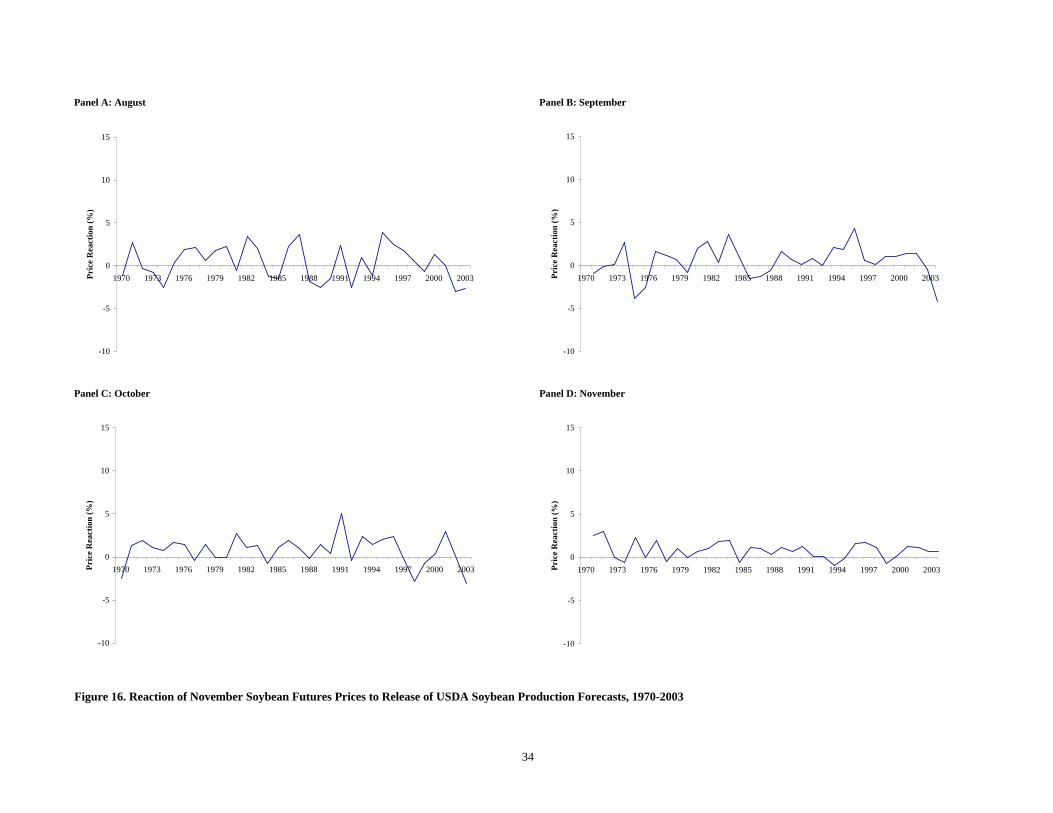
The price impact of corn and soybean production forecasts is presented in Figures 15 and 16, respectively. Price impact is indicated by the reaction of December corn futures and November soybean futures (as measured by the first non-limit opening or closing price) immediately after the release of the USDA production forecasts.11 For corn, the largest reaction in December futures occurs following the August report. Interestingly, recent price reactions have been somewhat larger than historical reactions, except for 1973. Reactions have been relatively small in September, larger in October, and very small in November, with a dramatic exception in 1993. For soybeans, price reactions have had similar magnitudes in August and
9 Both firms typically release their forecasts to customers five to seven days prior to the release of USDA crop reports. This should allow the market adequate time to digest the information and incorporate it into prices. 10 Market surprises are not presented for January crop reports due to limited availability of data on private market expectations for this month. 11 Data on the cash price reaction to the release of USDA crop production forecasts for a number of commodities, including corn and soybeans, can be found in the publication at: http://www.usda.gov/nass/pubs/histdata.htm.
8
September. Price reactions in October were relatively small through the 1980s (with the exception of 1970), but have generally been larger in recent years. Price reactions to the November forecasts have been relatively small and the pattern has changed little over time. 12
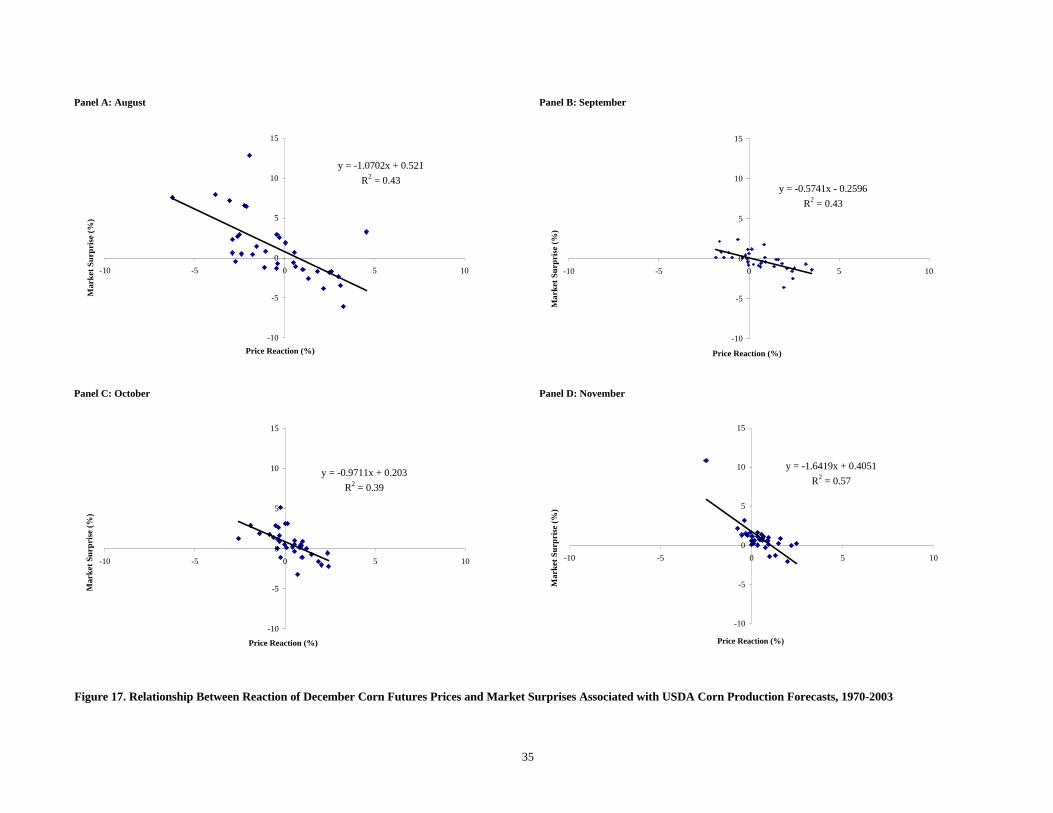
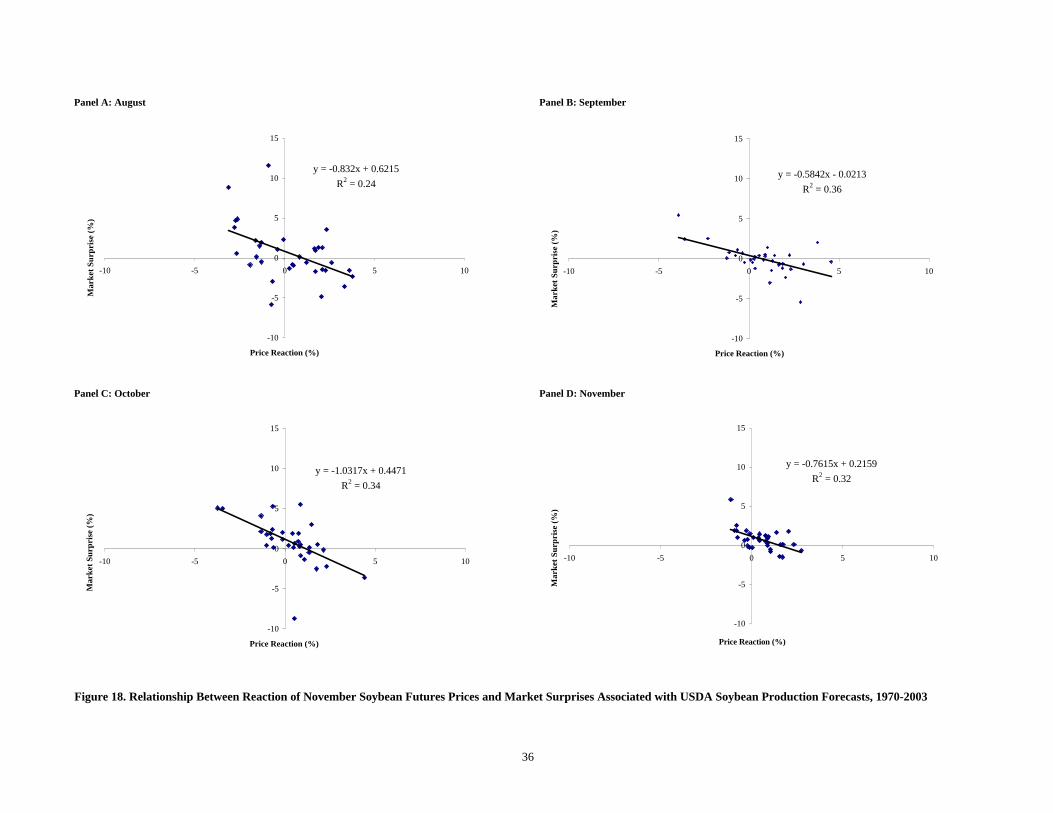
Figures 17 and 18 illustrate the relationship between price reactions in the futures market and the calculated surprises in the USDA forecasts. As expected, there is a negative relationship between the direction of the surprise and the direction of price reaction for both corn and soybeans. In other words, bullish reports (negative surprises) tend to lead to price increases and bearish reports (positive surprises) tend to lead to price decreases. The relationships are somewhat stronger for corn than soybeans, with the variation of surprises in the USDA production forecasts explaining 39 to 57 percent of the variation of the immediate change in corn prices and 24 to 36 percent of the variation of the immediate change in soybean prices (as indicated by R2 statistics). The strongest relationship is found in November for corn and September for soybeans. Slopes of the estimated lines vary by forecast month but equal, on average, about -1.00 for corn and -0.80 for soybeans. This means a one-percentage point bearish (bullish) surprise leads, on average, to about a one-percentage point decrease (increase) in corn futures prices and a 0.8 percentage point decrease (increase) in soybean futures prices. The relatively wide scatter of price reactions for a given level of surprise indicates the approximate nature of these relationships.
Price impacts illustrated in this section provide strong evidence that market participants
view USDA corn and soybean production forecasts as important new information.13 This further suggests that USDA forecasts improve economic welfare by moving prices closer to the “true” market equilibrium. Having said this, it is important to point out that earlier forecast performance results appear to contradict some of the price impact results. The forecast performance results indicate that private market forecasts early in the season (August) for both crops are now more accurate than USDA forecasts. At the same time, corn and soybean futures prices continue to react to the release of these same USDA forecasts. There is some evidence that the price reaction in corn has actually increased in recent years. Garcia et al. (1997) suggest a plausible explanation for this difference in results. They argue that market participants have different perceptions of the riskiness of USDA and private market forecasts. Theoretical models suggest that informed, private traders may behave strategically with regard to the release of forecasts in advance of public announcements. Thus, it may be reasonable for market 12 From 1970-1984, only USDA corn and soybean production forecasts were announced on report release dates, and therefore, the price impact shown in Figures 15 and 16 over this time period can be attributed solely to the USDA production forecasts. From 1985 onwards, USDA corn and soybean production reports were released simultaneously with World Agricultural Supply and Demand Estimate (WASDE) reports. This means price reaction over 1985-2003 may be attributed to the information contained in both the corn and soybean production forecasts and WASDE estimates. While it is impossible to disentangle the differential impact of the production forecasts and WASDE estimates with available data, the consistency of the price reactions over the entire 1970-2003 time period suggests the bulk of the price impact over 1985-2003 should be credited to the USDA corn and soybean production forecasts. For a detailed discussion of this issue see Irwin et al. (2003). 13 The analysis in this report focuses only on the reaction of futures prices to the release of USDA crop reports. Market participants’ uncertainty about future price levels can also be impacted by USDA forecasts. Irwin et al. (2002) find that implied volatility in options markets declines sharply after the release of corn and soybean production forecasts, indicating that the forecasts not only impact the level of prices but also reduce uncertainty about future price levels.
9
participants to regard USDA forecasts as less risky than private market forecasts. Since market participants make decisions based on both expected return and risk, USDA crop production forecasts that change perceptions of risk but not expected return would nonetheless still impact prices. This certainly is an issue that deserves further research. The 2003 Experience
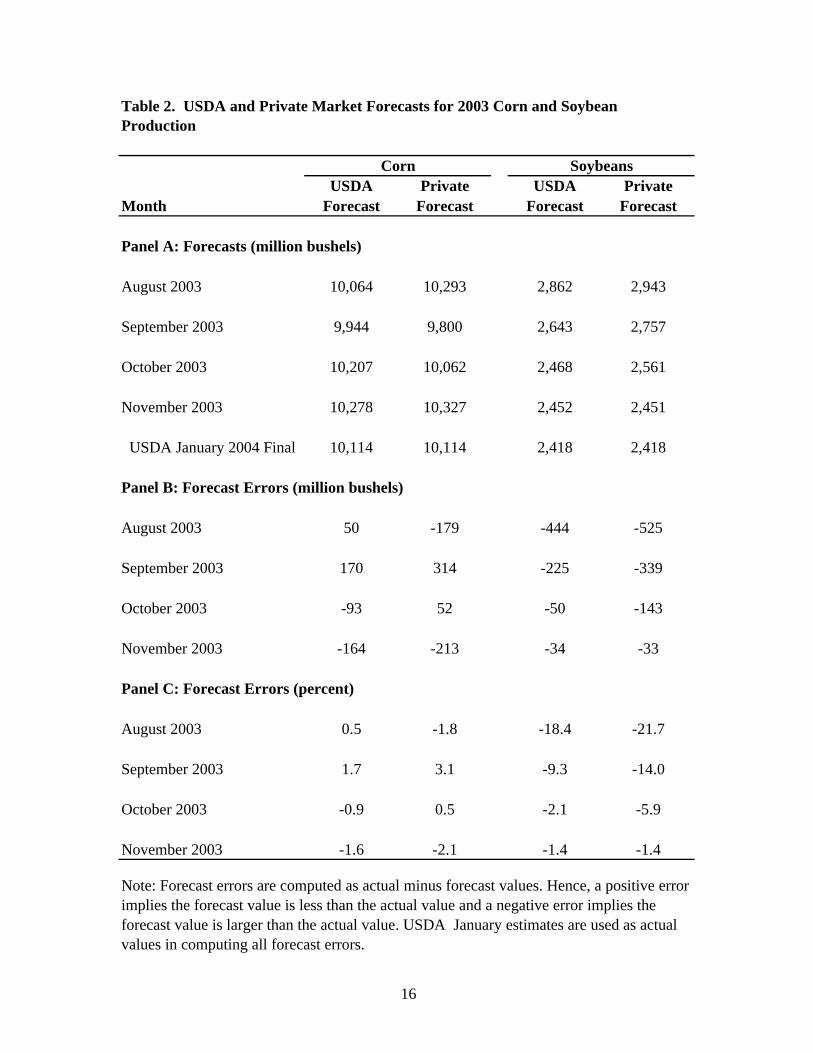
USDA forecasts and corresponding private market forecasts for 2003 are presented in panel A of Table 2. The final January estimate for corn and soybeans in 2003 also is presented for comparison purposes. For corn, the USDA forecast was smaller than the private forecast in August, larger in September and October and smaller in November. For soybeans, USDA forecasts were smaller or equal to private forecasts in each of the four months. These patterns are consistent with the long-run tendency of market surprises to be mildly correlated across release months. The average month-to-month correlation of surprises is about 0.40 in the corn market and about 0.30 in the soybean market. Whether this tendency is economically significant has yet to be determined.
Forecast errors associated with USDA and private production forecasts for 2003 are
presented in panel B (million bushels) and panel C (percent) of Table 2. The comparisons reveal that the USDA generally provided more accurate forecasts of corn and soybean production in 2003. In six of the eight possible comparisons, forecast errors for the USDA were substantially smaller (in absolute terms) than private market errors. This outcome was not surprising for the October and November forecasts given the long-term accuracy trends for later season forecasts. What did stand out was the superior performance of the USDA for early season forecasts in both corn and soybeans, which contrasts with the long-term trends in accuracy for these months. In corn, the USDA August 2003 forecast error was 1.3 percentage points smaller (in absolute terms) than the private market forecast error, the best relative performance by the USDA over the last decade. In soybeans, the USDA August 2003 forecast error was 3.3 percentage points smaller (in absolute terms) than the private market forecast error, the best relative performance by the USDA over the entire 1970-2003 time period. Relative performance for September 2003 soybeans, where the USDA had a 4.7 percentage point smaller forecast error, also was the best since 1970. Overall, the forecasting performance of the USDA in 2003 relative to the private market was quite strong.
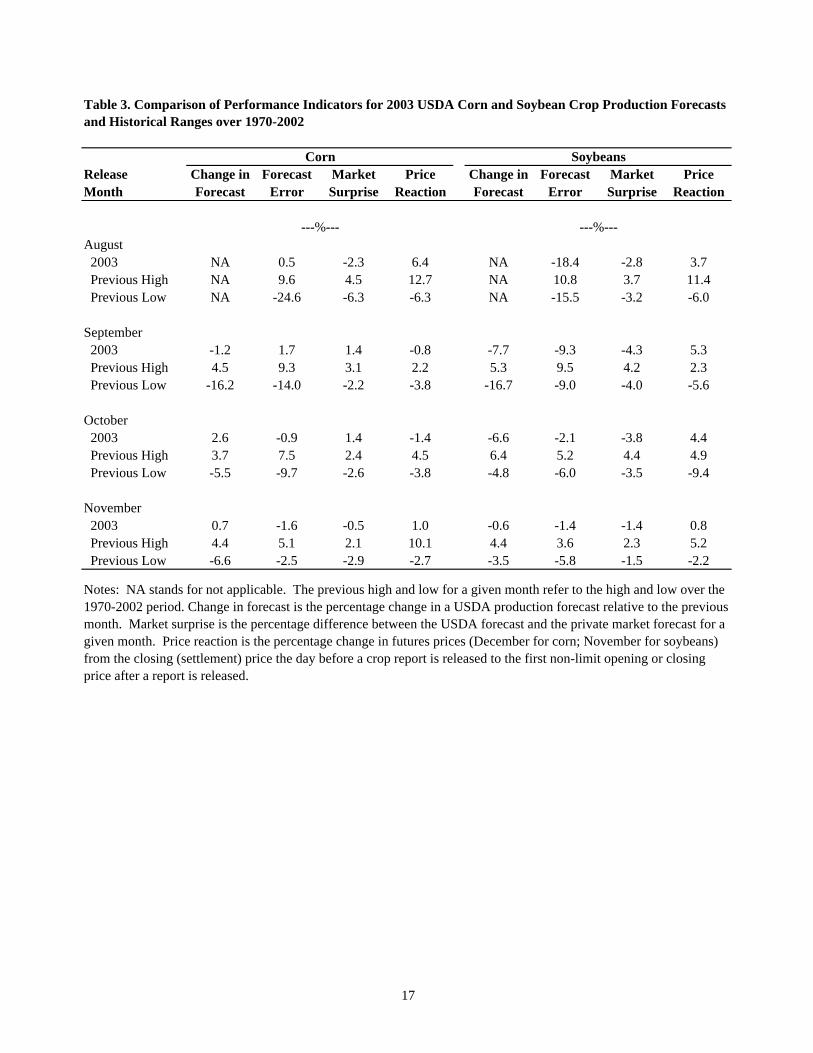
Further perspective on the 2003 USDA corn and soybean crop production forecasts is
provided by the information found in Table 3. Four key indicators are presented: 1) change in forecasts (where applicable), 2) forecast errors, 3) market surprises and 3) resulting price reactions. The value for 2003 is compared in each case to the previous high and low values over 1970-2002. Based upon a comparison of the absolute value in 2003 to the absolute value of previous highs and lows, none of the 2003 values in corn fell outside the historical ranges found in the table.14 In other words, the magnitude of changes in forecasts, forecast errors, market surprises and price reactions in 2003 for the corn market were well within the historical experience of the last three decades. Results are more striking in soybeans. In four cases (August: forecast error; September: forecast error; September: market surprise; October: change
14 This comparison treats positive and negative values equally.
10
in forecast) magnitudes were record large. Several other cases were near record highs in terms of magnitude. It is important to note than even in the cases where new records were set in soybeans, with one exception, the difference between the new record value and old record value was relatively small. The exception is the August forecast error which was 2.9 percentage points larger than the previous record forecast error for in that month. While the August 2003 forecast error for the USDA in soybeans certainly was large by historical standards, as discussed above, it was nonetheless substantially smaller than the private market forecast error for August. Therefore, it seems reasonable to argue that even though 2003 saw some major surprises with regard to USDA soybean production forecasts, the experience generally was not dramatically different than what has been seen before.
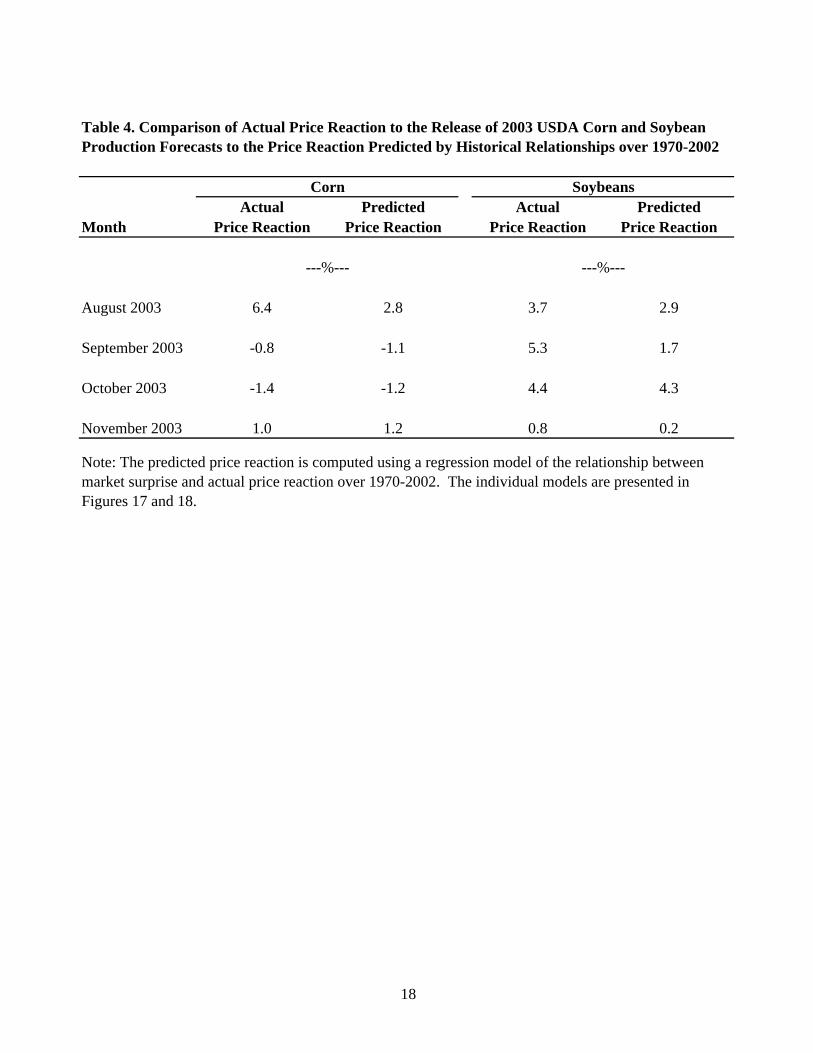
Additional perspective is provided by the price reaction comparisons found in Table 4. The actual price reaction for each of the 2003 production forecasts is the same as that presented in Table 3. Predicted price reactions for each month are based on the regression equations estimated from historical data (presented earlier in Figures 17 and 18). In each of the eight cases, the direction of price reaction predicted by the regression equations is the same as that actually observed. In six of the eight cases, the magnitude of actual price reactions is reasonably close to the predicted magnitude. In the other two cases (August 2003 corn and September 2003 soybeans), the actual magnitude is substantially underestimated.15 It is not surprising that some of the predictions are off substantially, given the relatively modest “fits” of the estimated regression models. However, the large errors in these two cases are within historical experience, which can be seen through inspection of Figures 17 and 18.
Overall, despite many claims to the contrary, the results presented in this section indicate 2003 USDA corn and soybean production forecasts generally were within historical ranges in terms of magnitude of changes, forecast errors, market surprises and price reactions. The September and October soybean forecasts were major market surprises, and the market’s price reactions confirmed this, but they were not unprecedented. Summary and Conclusions
Recent comments from producers and others suggest that there has been an ongoing misunderstanding of the USDA’s methodology for arriving at corn and soybean production forecasts. The purpose of this report is to improve understanding of USDA crop forecasting methods, performance and market impact.
The USDA uses a highly sophisticated and well-documented procedure to generate its
crop production forecasts. For corn and soybeans, production forecasts are released in August, September, October, and November, with final estimates published in January. The USDA generates production forecasts based on estimates of planted and harvested acreage and two types of yield indications, a farmer-reported survey and objective measurements. A review of
15 Two changes can be made to the regression models that may improve the accuracy of the predicted price changes. Garcia et al. (1997) recommend including market surprises for both crops in the regression models (e.g., corn price reaction is based on both corn and soybean market surprises) and pooling observations across all forecast months. Using this revised model, the August corn price change is predicted to be 3.2 percent, closer to the observed price reaction, but still substantially smaller.
11
USDA’s forecasting procedures and methodology confirmed the objectivity and consistency of the forecasting process over time. No changes in methodology occurred in 2003.
Month-to-month changes in USDA corn and soybean production forecasts from 1970
through 2003 indicated little difference in magnitude and direction of monthly changes over time. The size of the monthly changes tended to diminish across the forecasting cycle (August through November). There was a positive relationship in the size and direction of forecast changes across months in both corn and soybeans, with the largest correlations found in corn. Monthly changes in USDA forecasts have been anticipated reasonably well by the private sector. As measured against the production estimate in January after harvest, USDA production forecast errors were largest in August and smaller in subsequent forecasts. There appeared to be no trend in the size or direction of forecast errors over the study period.
On average, USDA corn production forecasts were more accurate than private market forecasts over 1970-2003. One exception in corn was the August forecast in the most recent time period, 1985-2003. The forecasting comparisons for soybeans were a bit more surprising. Private market forecasts in soybeans were more accurate than USDA forecasts for August regardless of the time period considered. As the growing season progresses the USDA’s relative accuracy improved, with USDA forecast errors in soybeans about equal to or smaller than private market errors for September, October and November.
USDA corn production forecasts had the largest impact on corn futures prices in August and recent price reactions have been somewhat larger than historical reactions. For soybeans, the largest reaction in futures prices occurred in August and September, but recent reactions have been large in October. As predicted by economic theory, there was a negative relationship between the direction of forecast surprises and the direction of price reactions for both corn and soybeans, with a somewhat stronger relationship for corn than for soybeans.
Overall, the forecasting performance of the USDA in 2003 relative to the private market was quite strong, particularly for early season corn and soybean production forecasts in August and September. Furthermore, despite many claims to the contrary, the August, September, October and November 2003 USDA corn and soybean forecasts generally were within or near historical ranges in terms of magnitude of changes, forecast errors, market surprises and price reactions. The September and October soybean forecasts were major market surprises, and the market’s price reactions showed this, but they were not unprecedented.
The analysis presented in this report suggested the USDA performs reasonably well in
generating crop production forecasts for corn and soybeans. There was strong evidence that market participants view USDA corn and soybean production forecasts as important new information. There is nonetheless room for improvement. In particular, the USDA may want to consider expanding the scope of the subjective yield surveys to incorporate a wider range of market and industry participants.
12
References Allen, Rich. “Personal E-Mail Communication.” September-October 2003. Egelkraut, T.M., P. Garcia, S.H. Irwin and D.L. Good. “An Evaluation of Crop Forecast
Accuracy for Corn and Soybeans: USDA and Private Information Services.” Journal of Agricultural and Applied Economics 35(2003):79-95.
Fortenbery, T. R. and D.A. Sumner. “The Effects of USDA Reports in Futures and Options
Markets.” Journal of Futures Markets 13(1993):157-173. Garcia, P., S.H. Irwin, R.M. Leuthold, and L. Yang. "The Value of Public Information in
Commodity Futures Markets." Journal of Economic Behavior and Organization 32(1997): 559-570.
Gardner, B. L. "How the Data We Make Can Unmake Us: Annals of Factology." American
Journal of Agricultural Economics 74(1992): 1066-1075. Irwin, S.H., D.L. Good, J.K. Gomez and O. Isengildina. “The Value of USDA Outlook
Information: An Investigation Using Event Study Analysis.” Final Research Report, Economic Research Service, US Department of Agriculture, December 2002.
Isengildina, O., S.H. Irwin and D.L. Good. “Are Revisions to USDA Crop Production Forecasts
Smoothed?” Working Paper, Department of Agricultural and Consumer Economics, University of Illinois at Urbana-Champaign, October 2003.
NASS. Historical Track Records:United States Crop Production. National Agricultural
Statistics Service, US Department of Agriculture, April 2003. http://usda.mannlib.cornell.edu/data-sets/crops/96120/
NASS. Price Reactions After USDA Crop Reports. National Agricultural Statistics Service, US
Department of Agriculture, Pr Rc 1(03), March 2003. http://www.usda.gov/nass/pubs/histdata.htm.
NASS/SMB. The Yield Forecasting Program of NASS. National Agricultural Statistics Service,
US Department of Agriculture, Staff Report SMB 98-01, 1998.
13
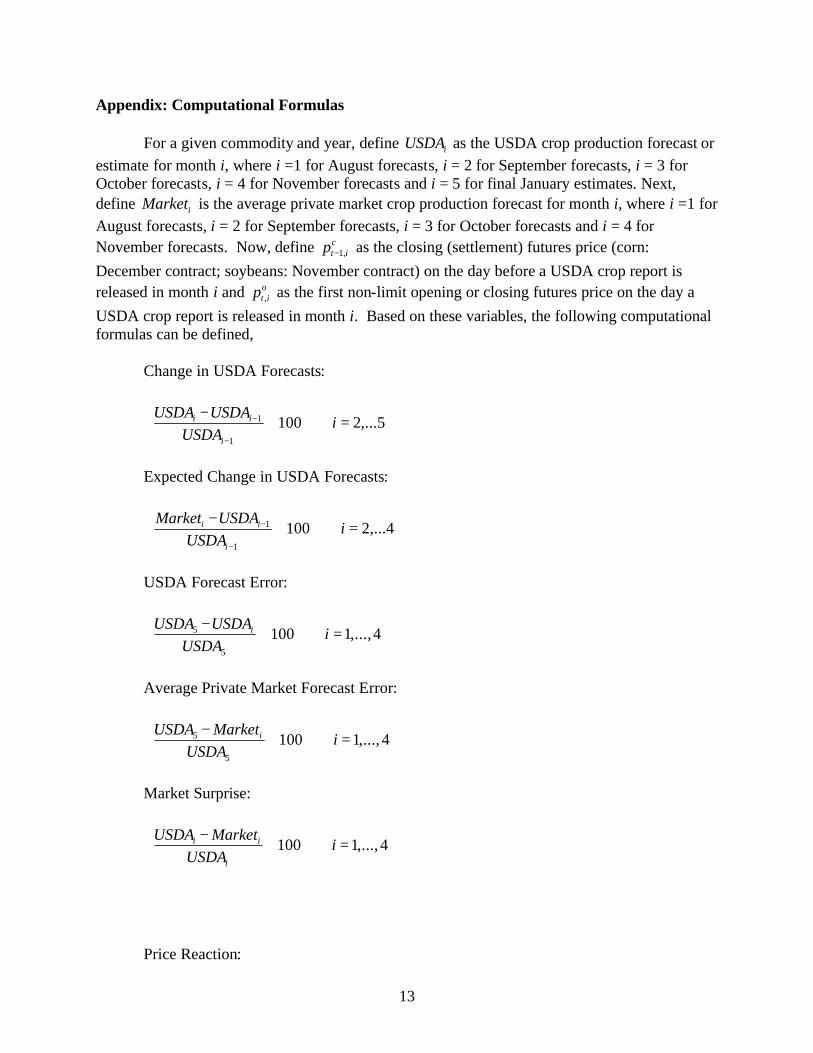
Appendix: Computational Formulas
For a given commodity and year, define iUSDA as the USDA crop production forecast or estimate for month i, where i =1 for August forecasts, i = 2 for September forecasts, i = 3 for October forecasts, i = 4 for November forecasts and i = 5 for final January estimates. Next, define iMarket is the average private market crop production forecast for month i, where i =1 for August forecasts, i = 2 for September forecasts, i = 3 for October forecasts and i = 4 for November forecasts. Now, define 1,
ct ip − as the closing (settlement) futures price (corn:
December contract; soybeans: November contract) on the day before a USDA crop report is released in month i and ,
ot ip as the first non-limit opening or closing futures price on the day a
USDA crop report is released in month i. Based on these variables, the following computational formulas can be defined,
Change in USDA Forecasts:
1
1
100 2,...5i i
i
USDA USDAi
USDA−
−
−⋅ =
Expected Change in USDA Forecasts:
1
1
100 2,...4i i
i
Market USDAi
USDA−
−
−⋅ =
USDA Forecast Error:
5
5
100 1,...,4iUSDA USDAi
USDA −
⋅ =
Average Private Market Forecast Error:
5
5
100 1,..., 4iUSDA Marketi
USDA −
⋅ =
Market Surprise:
100 1,..., 4i i
i
USDA Marketi
USDA −
⋅ =
Price Reaction:
14
, 1,
1,
100 1,..., 4o ct i t i
ct i
p pi
p−
−
−⋅ =
Finally, note that the computational formula for price reaction technically only applies to crop reports released between May 1994 and October 2003. During this time period, reports were released at 8:30 am EST, before the start of futures trading on the release date. The computational formula is changed slightly for crop reports released between August 1970 and April 1994. During this earlier time period, reports were released at 3:00 pm EST, after the close of trading on the release date. As a result, day t-1 has to be re-defined as the date a crop report is released and day t as the day after release.
USDA Private USDA PrivateForecast Forecast Forecast Forecast
August
1970-2003 5.1 5.3 5.1 4.8
1970-1984 5.9 7.0 4.9 4.8
1985-2003 4.5 3.9 5.3 4.7
September
1970-2003 4.0 4.3 3.9 3.9
1970-1984 3.9 4.2 3.2 3.3
1985-2003 4.0 4.4 4.5 4.4
October
1970-2003 2.4 3.0 2.4 2.7
1970-1984 2.4 3.1 2.7 2.7
1985-2003 2.4 2.9 2.1 2.8
November
1970-2003 1.2 1.6 1.4 1.5
1970-1984 1.3 1.8 1.8 2.1
1985-2003 1.0 1.4 1.1 1.1
Corn Soybeans
Table 1. Average Absolute Errors for USDA and Private Market Forecasts of Corn and Soybean Production, 1970-2003
---%--- ---%---
15
USDA Private USDA PrivateMonth Forecast Forecast Forecast Forecast
Panel A: Forecasts (million bushels)
August 2003 10,064 10,293 2,862 2,943
September 2003 9,944 9,800 2,643 2,757
October 2003 10,207 10,062 2,468 2,561
November 2003 10,278 10,327 2,452 2,451
USDA January 2004 Final 10,114 10,114 2,418 2,418
Panel B: Forecast Errors (million bushels)
August 2003 50 -179 -444 -525
September 2003 170 314 -225 -339
October 2003 -93 52 -50 -143
November 2003 -164 -213 -34 -33
Panel C: Forecast Errors (percent)
August 2003 0.5 -1.8 -18.4 -21.7
September 2003 1.7 3.1 -9.3 -14.0
October 2003 -0.9 0.5 -2.1 -5.9
November 2003 -1.6 -2.1 -1.4 -1.4
Table 2. USDA and Private Market Forecasts for 2003 Corn and Soybean Production
Corn Soybeans
Note: Forecast errors are computed as actual minus forecast values. Hence, a positive error implies the forecast value is less than the actual value and a negative error implies the forecast value is larger than the actual value. USDA January estimates are used as actual values in computing all forecast errors.
16
Release Change in Forecast Market Price Change in Forecast Market PriceMonth Forecast Error Surprise Reaction Forecast Error Surprise Reaction
August 2003 NA 0.5 -2.3 6.4 NA -18.4 -2.8 3.7 Previous High NA 9.6 4.5 12.7 NA 10.8 3.7 11.4 Previous Low NA -24.6 -6.3 -6.3 NA -15.5 -3.2 -6.0
September 2003 -1.2 1.7 1.4 -0.8 -7.7 -9.3 -4.3 5.3 Previous High 4.5 9.3 3.1 2.2 5.3 9.5 4.2 2.3 Previous Low -16.2 -14.0 -2.2 -3.8 -16.7 -9.0 -4.0 -5.6
October 2003 2.6 -0.9 1.4 -1.4 -6.6 -2.1 -3.8 4.4 Previous High 3.7 7.5 2.4 4.5 6.4 5.2 4.4 4.9 Previous Low -5.5 -9.7 -2.6 -3.8 -4.8 -6.0 -3.5 -9.4
November 2003 0.7 -1.6 -0.5 1.0 -0.6 -1.4 -1.4 0.8 Previous High 4.4 5.1 2.1 10.1 4.4 3.6 2.3 5.2 Previous Low -6.6 -2.5 -2.9 -2.7 -3.5 -5.8 -1.5 -2.2
Table 3. Comparison of Performance Indicators for 2003 USDA Corn and Soybean Crop Production Forecasts and Historical Ranges over 1970-2002
Notes: NA stands for not applicable. The previous high and low for a given month refer to the high and low over the 1970-2002 period. Change in forecast is the percentage change in a USDA production forecast relative to the previous month. Market surprise is the percentage difference between the USDA forecast and the private market forecast for a given month. Price reaction is the percentage change in futures prices (December for corn; November for soybeans) from the closing (settlement) price the day before a crop report is released to the first non-limit opening or closing price after a report is released.
Corn Soybeans
---%--- ---%---
17
Month
August 2003
September 2003
October 2003
November 2003
Note: The predicted price reaction is computed using a regression model of the relationship between market surprise and actual price reaction over 1970-2002. The individual models are presented in Figures 17 and 18.
Predicted
2.8
-1.1
1.2
2.9
1.7
0.2
Price Reaction
1.0 0.8
6.4
-0.8
-1.4 -1.2 4.4
Price ReactionActual
3.7
5.3
4.3
Corn Soybeans
Table 4. Comparison of Actual Price Reaction to the Release of 2003 USDA Corn and Soybean Production Forecasts to the Price Reaction Predicted by Historical Relationships over 1970-2002
---%--- ---%---
Actual PredictedPrice Reaction Price Reaction
18
Panel A: August Panel B: September
Panel C: October Panel D: November
Figure 1. USDA Corn Production Forecasts, 1970-2003
4,000
5,000
6,000
7,000
8,000
9,000
10,000
11,000
1970 1973 1976 1979 1982 1985 1988 1991 1994 1997 2000 2003
For
ecas
t (m
illio
n bu
shel
s)
4,000
5,000
6,000
7,000
8,000
9,000
10,000
11,000
1970 1973 1976 1979 1982 1985 1988 1991 1994 1997 2000 2003
For
ecas
t (m
illio
n bu
shel
s)
4,000
5,000
6,000
7,000
8,000
9,000
10,000
11,000
1970 1973 1976 1979 1982 1985 1988 1991 1994 1997 2000 2003
For
ecas
t (m
illio
n bu
shel
s)
4,000
5,000
6,000
7,000
8,000
9,000
10,000
11,000
1970 1973 1976 1979 1982 1985 1988 1991 1994 1997 2000 2003
For
ecas
t (m
illio
n bu
shel
s)
19
Panel A: August Panel B: September
Panel C: October Panel D: November
Figure 2. USDA Soybean Production Forecasts, 1970-2003
1,000
1,500
2,000
2,500
3,000
3,500
1970 1973 1976 1979 1982 1985 1988 1991 1994 1997 2000 2003
For
ecas
t (m
illio
n bu
shel
s)
1,000
1,500
2,000
2,500
3,000
3,500
1970 1973 1976 1979 1982 1985 1988 1991 1994 1997 2000
For
ecas
t (m
illio
n bu
shel
s)
1,000
1,500
2,000
2,500
3,000
3,500
1970 1973 1976 1979 1982 1985 1988 1991 1994 1997 2000 2003
For
ecas
t (m
illio
n bu
shel
s)
1,000
1,200
1,400
1,600
1,800
2,000
2,200
2,400
2,600
2,800
3,000
1970 1973 1976 1979 1982 1985 1988 1991 1994 1997 2000 2003
For
ecas
t (m
illio
n bu
shel
s)
20
Panel A: September Panel B: October
Panel C: November Panel D: January
Figure 3. Change in USDA Corn Production Forecasts, 1970-2003
-20
-15
-10
-5
0
5
10
1970 1973 1976 1979 1982 1985 1988 1991 1994 1997 2000 2003
Cha
nge
in F
orec
ast (
%)
-20
-15
-10
-5
0
5
10
1970 1973 1976 1979 1982 1985 1988 1991 1994 1997 2000 2003
Cha
nge
in F
orec
ast (
%)
-20
-15
-10
-5
0
5
10
1970 1973 1976 1979 1982 1985 1988 1991 1994 1997 2000 2003
Cha
nge
in F
orec
ast (
%)
-20
-15
-10
-5
0
5
10
1970 1973 1976 1979 1982 1985 1988 1991 1994 1997 2000 2003
Cha
nge
in F
orec
ast (
%)
21
Panel A: September Panel B: October
Panel C: November Panel D: January
Figure 4. Change in USDA Soybean Production Forecasts, 1970-2003
-20
-15
-10
-5
0
5
10
1970 1973 1976 1979 1982 1985 1988 1991 1994 1997 2000 2003
Cha
nge
in F
orec
ast (
%)
-20
-15
-10
-5
0
5
10
1970 1973 1976 1979 1982 1985 1988 1991 1994 1997 2000 2003
Cha
nge
in F
orec
ast (
%)
-20
-15
-10
-5
0
5
10
1970 1973 1976 1979 1982 1985 1988 1991 1994 1997 2000 2003
Cha
nge
in F
orec
ast (
%)
-20
-15
-10
-5
0
5
10
1970 1973 1976 1979 1982 1985 1988 1991 1994 1997 2000 2003
Cha
nge
in F
orec
ast (
%)
22
Panel A: October vs. September Panel B: November vs. October
Panel C: January vs. November
Figure 5. Relationship Between Changes in USDA Corn Production Forecasts, 1970-2003
r = 0.44
-20
-15
-10
-5
0
5
10
-20 -15 -10 -5 0 5 10
September Change in Forecast (%)
Oct
ober
Cha
nge
in F
orec
ast (
%)
r = 0.79
-20
-15
-10
-5
0
5
10
-20 -15 -10 -5 0 5 10
October Change in Forecast (%)
Nov
embe
r C
hang
e in
For
ecas
t (%
)
r = 0.39
-20
-15
-10
-5
0
5
10
-20 -15 -10 -5 0 5 10
November Change in Forecast (%)
Janu
ary
Cha
nge
in F
orec
ast (
%)
23
Panel A: October vs. September Panel B: November vs. October
Panel C: January vs. November
Figure 6. Relationship Between Changes in USDA Soybean Production Forecasts, 1970-2003
r = 0.23
-20
-15
-10
-5
0
5
10
-20 -15 -10 -5 0 5 10
September Change in Forecast (%)
Oct
ober
Cha
nge
in F
orec
ast(
%)
r = 0.50
-20
-15
-10
-5
0
5
10
-20 -15 -10 -5 0 5 10
October Change in Forecast (%)
Nov
embe
r C
hang
e in
For
ecas
t (%
)
r = 0.32
-20
-15
-10
-5
0
5
10
-20 -15 -10 -5 0 5 10
November Change in Forecast (%)
Janu
ary
Cha
nge
in F
orec
ast (
%)
24
Panel A: September Panel B: October
Panel C: November
Figure 7. Actual and Expected Changes in USDA Corn Production Forecasts, 1970-2003
-20
-15
-10
-5
0
5
10
1970 1973 1976 1979 1982 1985 1988 1991 1994 1997 2000 2003
Cha
nge
in F
orec
ast (
%)
-20
-15
-10
-5
0
5
10
1970 1973 1976 1979 1982 1985 1988 1991 1994 1997 2000 2003
Cha
nge
in F
orec
ast (
%)
ActualChange
ExpectedChange
-20
-15
-10
-5
0
5
10
1970 1973 1976 1979 1982 1985 1988 1991 1994 1997 2000 2003
Cha
nge
in F
orec
ast (
%)
ActualChange
ExpectedChange
ActualChange
ExptectedChange
25
Panel A: September Panel B: October
Panel C: November
Figure 8. Actual and Expected Changes in USDA Soybean Production Forecasts, 1970-2003
-20
-15
-10
-5
0
5
10
1970 1973 1976 1979 1982 1985 1988 1991 1994 1997 2000 2003
Cha
nge
in F
orec
ast (
%)
-20
-15
-10
-5
0
5
10
1970 1973 1976 1979 1982 1985 1988 1991 1994 1997 2000 2003
Cha
nge
in F
orec
ast (
%)
ActualChange
ExpectedChange
-20
-15
-10
-5
0
5
10
1970 1973 1976 1979 1982 1985 1988 1991 1994 1997 2000 2003
Cha
nge
in F
orec
ast (
%)
ActualChange
ExpectedChange
ActualChange
ExpectedChange
26
Panel A: August Panel B: September
Panel C: October Panel D: November
Figure 9. USDA Corn Production Forecast Errors, 1970-2003
-25
-20
-15
-10
-5
0
5
10
15
1970 1973 1976 1979 1982 1985 1988 1991 1994 1997 2000 2003
For
ecas
t Err
or (%
)
-25
-20
-15
-10
-5
0
5
10
15
1970 1973 1976 1979 1982 1985 1988 1991 1994 1997 2000 2003
For
ecas
t Err
or (%
)
-25
-20
-15
-10
-5
0
5
10
15
1970 1973 1976 1979 1982 1985 1988 1991 1994 1997 2000 2003
For
ecas
t Err
or (%
)
-25
-20
-15
-10
-5
0
5
10
15
1970 1973 1976 1979 1982 1985 1988 1991 1994 1997 2000 2003
For
ecas
t Err
or (%
)
27
Panel A: August Panel B: September
Panel C: October Panel D: November
Figure 10. USDA Soybean Production Forecast Errors, 1970-2003
-25
-20
-15
-10
-5
0
5
10
15
1970 1973 1976 1979 1982 1985 1988 1991 1994 1997 2000 2003
For
ecas
t Err
or (%
)
-25
-20
-15
-10
-5
0
5
10
15
1970 1973 1976 1979 1982 1985 1988 1991 1994 1997 2000 2003
For
ecas
t Err
or (%
)
-25
-20
-15
-10
-5
0
5
10
15
1970 1973 1976 1979 1982 1985 1988 1991 1994 1997 2000 2003
For
ecas
t Err
or (%
)
-25
-20
-15
-10
-5
0
5
10
15
1970 1973 1976 1979 1982 1985 1988 1991 1994 1997 2000 2003
For
ecas
t Err
or (%
)
28
Panel A: August Panel B: September
Panel C: October Panel D: November
Figure 11. USDA and Private Market Corn Production Forecast Errors, 1970-2003
-25
-20
-15
-10
-5
0
5
10
15
1970 1973 1976 1979 1982 1985 1988 1991 1994 1997 2000 2003
For
ecas
t Err
or (%
)
-25
-20
-15
-10
-5
0
5
10
15
1970 1973 1976 1979 1982 1985 1988 1991 1994 1997 2000 2003
For
ecas
t Err
or (%
)
USDA
Private
-25
-20
-15
-10
-5
0
5
10
15
1970 1973 1976 1979 1982 1985 1988 1991 1994 1997 2000 2003
For
ecas
t Err
or (%
)
USDA
Private
-25
-20
-15
-10
-5
0
5
10
15
1970 1973 1976 1979 1982 1985 1988 1991 1994 1997 2000 2003
For
ecas
t Err
or (%
)
USDA
Private
Private
USDA
29
Panel A: August Panel B: September
Panel C: October Panel D: November
Figure 12. USDA and Private Market Soybean Production Forecast Errors, 1970-2003
-25
-20
-15
-10
-5
0
5
10
15
1970 1973 1976 1979 1982 1985 1988 1991 1994 1997 2000 2003
For
ecas
t Err
or (%
)
-25
-20
-15
-10
-5
0
5
10
15
1970 1973 1976 1979 1982 1985 1988 1991 1994 1997 2000 2003
For
ecas
t Err
or (%
)
USDA
Private
-25
-20
-15
-10
-5
0
5
10
15
1970 1973 1976 1979 1982 1985 1988 1991 1994 1997 2000 2003
For
ecas
t Err
or (%
)
USDA
Private
-25
-20
-15
-10
-5
0
5
10
15
1970 1973 1976 1979 1982 1985 1988 1991 1994 1997 2000 2003
For
ecas
t Err
or (%
)
USDAPrivate
Private
USDA
30
Panel A: August Panel B: September
Panel C: October Panel D: November
Figure 13. Market Surpise Associated with USDA Corn Production Forecasts, 1970-2003
-10
-5
0
5
10
1970 1973 1976 1979 1982 1985 1988 1991 1994 1997 2000 2003
Mar
ket S
urpi
se (%
)
-10
-5
0
5
10
1970 1973 1976 1979 1982 1985 1988 1991 1994 1997 2000 2003
Mar
ket S
upri
se (%
)
-10
-5
0
5
10
1970 1973 1976 1979 1982 1985 1988 1991 1994 1997 2000 2003
Mar
ket S
urpr
ise
(%)
-10
-5
0
5
10
1970 1973 1976 1979 1982 1985 1988 1991 1994 1997 2000 2003M
arke
t Sur
pris
e (%
)
31
Panel A: August Panel B: September
Panel C: October Panel D: November
Figure 14. Market Surpise Associated with USDA Soybean Production Forecasts, 1970-2003
-10
-5
0
5
10
1970 1973 1976 1979 1982 1985 1988 1991 1994 1997 2000 2003
Mar
ket S
urpi
se (%
)
-10
-5
0
5
10
1970 1973 1976 1979 1982 1985 1988 1991 1994 1997 2000 2003
Mar
ket S
upri
se (%
)
-10
-5
0
5
10
1970 1973 1976 1979 1982 1985 1988 1991 1994 1997 2000 2003
Mar
ket S
urpr
ise
(%)
-10
-5
0
5
10
1970 1973 1976 1979 1982 1985 1988 1991 1994 1997 2000 2003M
arke
t Sur
pris
e (%
)
32
Panel A: August Panel B: September
Panel C: October Panel D: November
Figure 15. Reaction of December Corn Futures Prices to Release of USDA Corn Production Forecasts, 1970-2003
-10
-5
0
5
10
15
1970 1973 1976 1979 1982 1985 1988 1991 1994 1997 2000 2003Pri
ce R
eact
ion
(%)
-10
-5
0
5
10
15
1970 1973 1976 1979 1982 1985 1988 1991 1994 1997 2000 2003Pri
ce R
eact
ion
(%)
-10
-5
0
5
10
15
1970 1973 1976 1979 1982 1985 1988 1991 1994 1997 2000 2003Pri
ce R
eact
ion
(%)
-10
-5
0
5
10
15
1970 1973 1976 1979 1982 1985 1988 1991 1994 1997 2000 2003Pri
ce R
eact
ion
(%)
33
Panel A: August Panel B: September
Panel C: October Panel D: November
Figure 16. Reaction of November Soybean Futures Prices to Release of USDA Soybean Production Forecasts, 1970-2003
-10
-5
0
5
10
15
1970 1973 1976 1979 1982 1985 1988 1991 1994 1997 2000 2003Pri
ce R
eact
ion
(%)
-10
-5
0
5
10
15
1970 1973 1976 1979 1982 1985 1988 1991 1994 1997 2000 2003Pri
ce R
eact
ion
(%)
-10
-5
0
5
10
15
1970 1973 1976 1979 1982 1985 1988 1991 1994 1997 2000 2003Pri
ce R
eact
ion
(%)
-10
-5
0
5
10
15
1970 1973 1976 1979 1982 1985 1988 1991 1994 1997 2000 2003Pri
ce R
eact
ion
(%)
34
Panel A: August Panel B: September
Panel C: October Panel D: November
Figure 17. Relationship Between Reaction of December Corn Futures Prices and Market Surprises Associated with USDA Corn Production Forecasts, 1970-2003
y = -1.0702x + 0.521R2 = 0.43
-10
-5
0
5
10
15
-10 -5 0 5 10
Price Reaction (%)
Mar
ket S
urpr
ise
(%)
y = -0.5741x - 0.2596R2 = 0.43
-10
-5
0
5
10
15
-10 -5 0 5 10
Price Reaction (%)
Mar
ket S
urpr
ise
(%)
y = -0.9711x + 0.203R2 = 0.39
-10
-5
0
5
10
15
-10 -5 0 5 10
Price Reaction (%)
Mar
ket S
urpr
ise
(%)
y = -1.6419x + 0.4051R2 = 0.57
-10
-5
0
5
10
15
-10 -5 0 5 10
Price Reaction (%)
Mar
ket S
urpr
ise
(%)
35
Panel A: August Panel B: September
Panel C: October Panel D: November
Figure 18. Relationship Between Reaction of November Soybean Futures Prices and Market Surprises Associated with USDA Soybean Production Forecasts, 1970-2003
y = -0.832x + 0.6215R2 = 0.24
-10
-5
0
5
10
15
-10 -5 0 5 10
Price Reaction (%)
Mar
ket S
urpr
ise
(%)
y = -0.5842x - 0.0213R2 = 0.36
-10
-5
0
5
10
15
-10 -5 0 5 10
Price Reaction (%)
Mar
ket S
urpr
ise
(%)
y = -1.0317x + 0.4471R2 = 0.34
-10
-5
0
5
10
15
-10 -5 0 5 10
Price Reaction (%)
Mar
ket S
urpr
ise
(%)
y = -0.7615x + 0.2159R2 = 0.32
-10
-5
0
5
10
15
-10 -5 0 5 10
Price Reaction (%)
Mar
ket S
urpr
ise
(%)
36
Related Documents