Understanding Uncertainties in Model-Based Predictions of Aedes aegypti Population Dynamics Chonggang Xu 1 *, Mathieu Legros 1 , Fred Gould 1 , Alun L. Lloyd 2 1 Department of Entomology, North Carolina State University, Raleigh, North Carolina, United States of America, 2 Department of Mathematics and Biomathematics Graduate Program, North Carolina State University, Raleigh, North Carolina, United States of America Abstract Background: Aedes aegypti is one of the most important mosquito vectors of human disease. The development of spatial models for Ae. aegypti provides a promising start toward model-guided vector control and risk assessment, but this will only be possible if models make reliable predictions. The reliability of model predictions is affected by specific sources of uncertainty in the model. Methodology/Principal Findings: This study quantifies uncertainties in the predicted mosquito population dynamics at the community level (a cluster of 612 houses) and the individual-house level based on Skeeter Buster, a spatial model of Ae. aegypti, for the city of Iquitos, Peru. The study considers two types of uncertainty: 1) uncertainty in the estimates of 67 parameters that describe mosquito biology and life history, and 2) uncertainty due to environmental and demographic stochasticity. Our results show that for pupal density and for female adult density at the community level, respectively, the 95% prediction confidence interval ranges from 1000 to 3000 and from 700 to 5,000 individuals. The two parameters contributing most to the uncertainties in predicted population densities at both individual-house and community levels are the female adult survival rate and a coefficient determining weight loss due to energy used in metabolism at the larval stage (i.e. metabolic weight loss). Compared to parametric uncertainty, stochastic uncertainty is relatively low for population density predictions at the community level (less than 5% of the overall uncertainty) but is substantially higher for predictions at the individual-house level (larger than 40% of the overall uncertainty). Uncertainty in mosquito spatial dispersal has little effect on population density predictions at the community level but is important for the prediction of spatial clustering at the individual-house level. Conclusion/Significance: This is the first systematic uncertainty analysis of a detailed Ae. aegypti population dynamics model and provides an approach for identifying those parameters for which more accurate estimates would improve model predictions. Citation: Xu C, Legros M, Gould F, Lloyd AL (2010) Understanding Uncertainties in Model-Based Predictions of Aedes aegypti Population Dynamics. PLoS Negl Trop Dis 4(9): e830. doi:10.1371/journal.pntd.0000830 Editor: Scott O’Neill, The University of Queensland, Australia Received March 12, 2010; Accepted August 31, 2010; Published September 28, 2010 Copyright: ß 2010 Xu et al. This is an open-access article distributed under the terms of the Creative Commons Attribution License, which permits unrestricted use, distribution, and reproduction in any medium, provided the original author and source are credited. Funding: This work was funded by National Institutes of Health (NIH) grant R01-AI54954-0IA2, and through the Regents of the University of California from the Foundation for the National Institutes of Health Grand Challenges in Global Health initiative. Discussions fostered by the NIH RAPIDD program improved our analysis. The funders had no role in study design, data collection and analysis, decision to publish, or preparation of the manuscript. Competing Interests: The authors have declared that no competing interests exist. * E-mail: [email protected] Introduction Aedes aegypti is one of the most important mosquito vectors of human viral diseases. It causes approximately 50 million cases of dengue fever per year, 500,000 cases of dengue hemorrhagic fever (DHF) or dengue shock syndrome (DSS), and approximately 12,500 fatalities annually [1,2]. Currently, there is no effective vaccine available and the only means for limiting dengue outbreaks is vector control. For a better understanding of mosquito population dynamics and more efficient vector and disease control, researchers have built mathematical models that incor- porate fundamental biological and ecological mechanisms affect- ing mosquito population dynamics. A pioneering model was developed by Gilpin & McClelland [3] to predict how larval development is affected by food density, larval weight and temperature. Although Gilpin & McClelland’s model was based on larvae in an artificial laboratory environment and did not simulate the whole life cycle of Ae. aegypti, their model was significant in providing the first biologically realistic approach for predicting larval population dynamics. Based on Gilpin & McClelland’s model, Focks et al. [4] developed a life history model (CIMSiM) to predict in-field population dynamics for Ae. aegypti. This model incorporated detailed biological processes (survival, physiological developments, food-regulated body weight growth, and fecundities) and environ- mental factors (temperature and humidity) for four different life stages: eggs, larvae, pupae and adults. It has been applied to a number of villages and city environments, including locations in Thailand and the US [5]. By coupling CIMSiM with an epidemiological simulation model (DENSiM), it is possible to make predictions about disease dynamics [6]. The model has also been scaled up to global levels to predict the potential effects of climatic change on mosquito population distributions and potential disease risks [7]. www.plosntds.org 1 September 2010 | Volume 4 | Issue 9 | e830

Welcome message from author
This document is posted to help you gain knowledge. Please leave a comment to let me know what you think about it! Share it to your friends and learn new things together.
Transcript

Understanding Uncertainties in Model-Based Predictionsof Aedes aegypti Population DynamicsChonggang Xu1*, Mathieu Legros1, Fred Gould1, Alun L. Lloyd2
1 Department of Entomology, North Carolina State University, Raleigh, North Carolina, United States of America, 2 Department of Mathematics and Biomathematics
Graduate Program, North Carolina State University, Raleigh, North Carolina, United States of America
Abstract
Background: Aedes aegypti is one of the most important mosquito vectors of human disease. The development of spatialmodels for Ae. aegypti provides a promising start toward model-guided vector control and risk assessment, but this will onlybe possible if models make reliable predictions. The reliability of model predictions is affected by specific sources ofuncertainty in the model.
Methodology/Principal Findings: This study quantifies uncertainties in the predicted mosquito population dynamics at thecommunity level (a cluster of 612 houses) and the individual-house level based on Skeeter Buster, a spatial model of Ae.aegypti, for the city of Iquitos, Peru. The study considers two types of uncertainty: 1) uncertainty in the estimates of 67parameters that describe mosquito biology and life history, and 2) uncertainty due to environmental and demographicstochasticity. Our results show that for pupal density and for female adult density at the community level, respectively, the95% prediction confidence interval ranges from 1000 to 3000 and from 700 to 5,000 individuals. The two parameterscontributing most to the uncertainties in predicted population densities at both individual-house and community levels arethe female adult survival rate and a coefficient determining weight loss due to energy used in metabolism at the larval stage(i.e. metabolic weight loss). Compared to parametric uncertainty, stochastic uncertainty is relatively low for populationdensity predictions at the community level (less than 5% of the overall uncertainty) but is substantially higher forpredictions at the individual-house level (larger than 40% of the overall uncertainty). Uncertainty in mosquito spatialdispersal has little effect on population density predictions at the community level but is important for the prediction ofspatial clustering at the individual-house level.
Conclusion/Significance: This is the first systematic uncertainty analysis of a detailed Ae. aegypti population dynamicsmodel and provides an approach for identifying those parameters for which more accurate estimates would improve modelpredictions.
Citation: Xu C, Legros M, Gould F, Lloyd AL (2010) Understanding Uncertainties in Model-Based Predictions of Aedes aegypti Population Dynamics. PLoS NeglTrop Dis 4(9): e830. doi:10.1371/journal.pntd.0000830
Editor: Scott O’Neill, The University of Queensland, Australia
Received March 12, 2010; Accepted August 31, 2010; Published September 28, 2010
Copyright: � 2010 Xu et al. This is an open-access article distributed under the terms of the Creative Commons Attribution License, which permits unrestricteduse, distribution, and reproduction in any medium, provided the original author and source are credited.
Funding: This work was funded by National Institutes of Health (NIH) grant R01-AI54954-0IA2, and through the Regents of the University of California from theFoundation for the National Institutes of Health Grand Challenges in Global Health initiative. Discussions fostered by the NIH RAPIDD program improved ouranalysis. The funders had no role in study design, data collection and analysis, decision to publish, or preparation of the manuscript.
Competing Interests: The authors have declared that no competing interests exist.
* E-mail: [email protected]
Introduction
Aedes aegypti is one of the most important mosquito vectors of
human viral diseases. It causes approximately 50 million cases of
dengue fever per year, 500,000 cases of dengue hemorrhagic fever
(DHF) or dengue shock syndrome (DSS), and approximately
12,500 fatalities annually [1,2]. Currently, there is no effective
vaccine available and the only means for limiting dengue
outbreaks is vector control. For a better understanding of mosquito
population dynamics and more efficient vector and disease
control, researchers have built mathematical models that incor-
porate fundamental biological and ecological mechanisms affect-
ing mosquito population dynamics. A pioneering model was
developed by Gilpin & McClelland [3] to predict how larval
development is affected by food density, larval weight and
temperature. Although Gilpin & McClelland’s model was based
on larvae in an artificial laboratory environment and did not
simulate the whole life cycle of Ae. aegypti, their model was
significant in providing the first biologically realistic approach for
predicting larval population dynamics.
Based on Gilpin & McClelland’s model, Focks et al. [4]
developed a life history model (CIMSiM) to predict in-field
population dynamics for Ae. aegypti. This model incorporated
detailed biological processes (survival, physiological developments,
food-regulated body weight growth, and fecundities) and environ-
mental factors (temperature and humidity) for four different life
stages: eggs, larvae, pupae and adults. It has been applied to a
number of villages and city environments, including locations in
Thailand and the US [5]. By coupling CIMSiM with an
epidemiological simulation model (DENSiM), it is possible to
make predictions about disease dynamics [6]. The model has also
been scaled up to global levels to predict the potential effects of
climatic change on mosquito population distributions and
potential disease risks [7].
www.plosntds.org 1 September 2010 | Volume 4 | Issue 9 | e830

The CIMSiM model does not account for spatial heterogene-
ities in the mosquito population and its environment, and the
dispersal of mosquitoes across this environment [8]. Recently, in
view of the potential importance of spatial dispersal for mosquito
population dynamics and vector control [9,10], new spatial models
have been developed [11,12]. Based on their spatial model, Otero
et al. [11] predicted that dispersal could be a significant factor
impacting the seasonal population dynamics of Ae. aegypti in
Buenos Aires, Argentina where the environment is marginal for
this mosquito species. Magori et al. [12], using the stochastic and
spatially explicit Skeeter Buster model, predicted that dispersal
among houses would decrease spatial variations in mosquito
densities caused by heterogeneity in the larval habitats among
houses in tropical areas. Results from the Skeeter Buster model
[12] also indicated that dispersal could impact the efficiency of
some transgenic approaches for replacing native mosquito
genotypes with engineered genotypes that do not transmit dengue
[13,14,15].
Spatial models of Ae. aegypti could provide an important advance
toward model-guided vector control and risk assessment. Attempts
to compare the outcomes of different types of control strategies
(e.g., physical removal of breeding sites, chemical control using
adulticidal spraying of houses or larvicidal treatment of water-filled
containers, and biological control of releasing transgenic mosqui-
toes for replacing native mosquito genotypes), used either in
isolation or in combination, may require the use of models that
include detailed descriptions of underlying biological processes. As
a result, complex models are being increasingly used in disease and
population modeling contexts. However, such models are
analytically less tractable than their simple counterparts and can
have many different sources of uncertainties, which may affect the
reliability of predictions. There are four types of uncertainty in a
model [16,17]: 1) uncertainty in the model structure; 2)
uncertainty in the parameter estimates; 3) uncertainties in data
inputs for the model; and 4) stochastic uncertainty (i.e., the
variability that results from environmental and demographic
stochasticity). The first three types of uncertainty are generally
reducible to some extent (i.e. uncertainty can be reduced given
higher quality data and a better understanding of the system being
simulated), while stochastic uncertainty is generally irreducible
[18]. It is possible that the combination of these uncertainties will
result in model predictions that are less reliable than acceptable to
researchers and practitioners working to suppress dengue. This
makes uncertainty analysis indispensible for complex models.
To evaluate the reliability of predictions made by Skeeter Buster
model, we quantify uncertainties in the predicted Ae. aegypti
population dynamics at the community level (a cluster of 612
houses) and the individual-house level. We focus on uncertainties
in model predictions resulting from parametric uncertainty and
stochasticity. In addition to quantifying overall parametric
uncertainty, we also quantify proportions of uncertainty in model
predictions contributed by specific model parameters using an
advanced uncertainty analysis technique, the improved Fourier
Amplitude Sensitivity Test (FAST) [19,20,21]. This should enable
a better understanding of the factors contributing to uncertainty,
and could enable targeting of parameters with high uncertainty
contributions for more accurate empirical quantification. Al-
though uncertainties in model structures and data inputs could
also be important, it would be difficult to estimate them with
currently available information.
Materials and Methods
Model descriptionIn this section, we only provide an overview of Skeeter Buster.
For a more detailed description of the model see Magori et al.
[12]. Skeeter Buster simulates the biological development of four
life stages of Ae. aegypti: eggs, larvae, pupae and adults. The model
assumes that larval growth and survival are regulated by the
amount of food available in water-filled containers in and around
houses. The time from egg hatch to pupation and the period taken
for each gonotrophic cycle (the egg production/laying cycles of
female adults) are mainly determined by temperature-dependent
development rates [22]. The pupation time also depends on larval
weight, which is calculated using a weight gain model based on the
work of Gilpin and McClelland [3]. Fecundity is assumed to be
related to female adult weight [4,23] (see Table S1). The
survivorship of each life stage is dependent on temperature (see
Figure S1), and survivorship of adults and eggs is also dependent
on humidity (see Figure S2). The daily survival probability within
the optimum range of environmental factors is termed the nominal
survival rate. Egg hatching is dependent on water level change in
the container. Skeeter Buster tracks the water temperature and
water level for all containers based on container characteristics
(e.g., size of opening), precipitation and air temperature.
Study area descriptionIn this study, we use environmental and spatial habitat data
from the city of Iquitos, Peru (see Figure S3 for air temperature
inputs) as a follow-up to Legros et al. [24] that uses data from this
city to examine predictions of the basic model. Detailed
descriptions of the study area have been provided in earlier
studies [25,26]. A mosquito survey using four-month long
sampling circuits within the city, linked to a geographic
information system, has been conducted since 1998. The survey
recorded the proportion of water-filled containers holding pupae,
the number of pupae, and the number of captured adults [25].
We simulate a district in the city with 612 houses as in Legros
et al. [24]. Food inputs for different types of water containers are
parameterized so that pupal densities simulated by Skeeter Buster
(using default parameter values in Table S1, S2, S3, S4, S5, the
assumed most likely values based on data and experiences) fit
pupal data in the mosquito survey conducted in Iquitos [24] (see
Author Summary
Dengue is one of the most important insect-vectoredhuman viral diseases. The principal vector is Aedes aegypti,a mosquito that lives in close association with humans.Currently, there is no effective vaccine available and theonly means for limiting dengue outbreaks is vector control.To help design vector control strategies, spatial models ofAe. aegypti population dynamics have been developed.However, the usefulness of such models depends on thereliability of their predictions, which can be affected bydifferent sources of uncertainty including uncertainty inthe model parameter estimation, uncertainty in the modelstructure, measurement errors in the data fed into themodel, individual variability, and stochasticity in theenvironment. This study quantifies uncertainties in themosquito population dynamics predicted by SkeeterBuster, a spatial model of Ae. aegypti, for the city ofIquitos, Peru. The uncertainty quantification should enableus to better understand the reliability of model predic-tions, improve Skeeter Buster and other similar models bytargeting those parameters with high uncertainty contri-butions for further empirical research, and therebydecrease uncertainty in model predictions.
Uncertainty Analysis of an Ae. aegypti Model
www.plosntds.org 2 September 2010 | Volume 4 | Issue 9 | e830
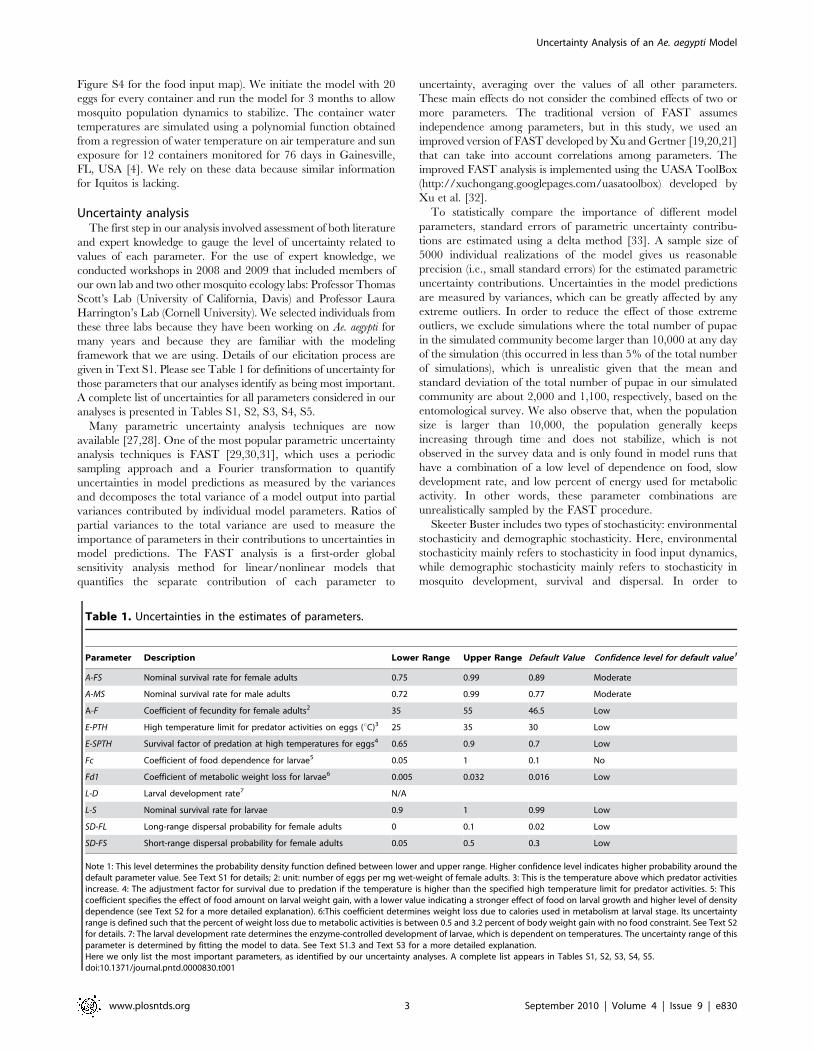
Figure S4 for the food input map). We initiate the model with 20
eggs for every container and run the model for 3 months to allow
mosquito population dynamics to stabilize. The container water
temperatures are simulated using a polynomial function obtained
from a regression of water temperature on air temperature and sun
exposure for 12 containers monitored for 76 days in Gainesville,
FL, USA [4]. We rely on these data because similar information
for Iquitos is lacking.
Uncertainty analysisThe first step in our analysis involved assessment of both literature
and expert knowledge to gauge the level of uncertainty related to
values of each parameter. For the use of expert knowledge, we
conducted workshops in 2008 and 2009 that included members of
our own lab and two other mosquito ecology labs: Professor Thomas
Scott’s Lab (University of California, Davis) and Professor Laura
Harrington’s Lab (Cornell University). We selected individuals from
these three labs because they have been working on Ae. aegypti for
many years and because they are familiar with the modeling
framework that we are using. Details of our elicitation process are
given in Text S1. Please see Table 1 for definitions of uncertainty for
those parameters that our analyses identify as being most important.
A complete list of uncertainties for all parameters considered in our
analyses is presented in Tables S1, S2, S3, S4, S5.
Many parametric uncertainty analysis techniques are now
available [27,28]. One of the most popular parametric uncertainty
analysis techniques is FAST [29,30,31], which uses a periodic
sampling approach and a Fourier transformation to quantify
uncertainties in model predictions as measured by the variances
and decomposes the total variance of a model output into partial
variances contributed by individual model parameters. Ratios of
partial variances to the total variance are used to measure the
importance of parameters in their contributions to uncertainties in
model predictions. The FAST analysis is a first-order global
sensitivity analysis method for linear/nonlinear models that
quantifies the separate contribution of each parameter to
uncertainty, averaging over the values of all other parameters.
These main effects do not consider the combined effects of two or
more parameters. The traditional version of FAST assumes
independence among parameters, but in this study, we used an
improved version of FAST developed by Xu and Gertner [19,20,21]
that can take into account correlations among parameters. The
improved FAST analysis is implemented using the UASA ToolBox
(http://xuchongang.googlepages.com/uasatoolbox) developed by
Xu et al. [32].
To statistically compare the importance of different model
parameters, standard errors of parametric uncertainty contribu-
tions are estimated using a delta method [33]. A sample size of
5000 individual realizations of the model gives us reasonable
precision (i.e., small standard errors) for the estimated parametric
uncertainty contributions. Uncertainties in the model predictions
are measured by variances, which can be greatly affected by any
extreme outliers. In order to reduce the effect of those extreme
outliers, we exclude simulations where the total number of pupae
in the simulated community become larger than 10,000 at any day
of the simulation (this occurred in less than 5% of the total number
of simulations), which is unrealistic given that the mean and
standard deviation of the total number of pupae in our simulated
community are about 2,000 and 1,100, respectively, based on the
entomological survey. We also observe that, when the population
size is larger than 10,000, the population generally keeps
increasing through time and does not stabilize, which is not
observed in the survey data and is only found in model runs that
have a combination of a low level of dependence on food, slow
development rate, and low percent of energy used for metabolic
activity. In other words, these parameter combinations are
unrealistically sampled by the FAST procedure.
Skeeter Buster includes two types of stochasticity: environmental
stochasticity and demographic stochasticity. Here, environmental
stochasticity mainly refers to stochasticity in food input dynamics,
while demographic stochasticity mainly refers to stochasticity in
mosquito development, survival and dispersal. In order to
Table 1. Uncertainties in the estimates of parameters.
Parameter Description Lower Range Upper Range Default Value Confidence level for default value1
A-FS Nominal survival rate for female adults 0.75 0.99 0.89 Moderate
A-MS Nominal survival rate for male adults 0.72 0.99 0.77 Moderate
A-F Coefficient of fecundity for female adults2 35 55 46.5 Low
E-PTH High temperature limit for predator activities on eggs (uC)3 25 35 30 Low
E-SPTH Survival factor of predation at high temperatures for eggs4 0.65 0.9 0.7 Low
Fc Coefficient of food dependence for larvae5 0.05 1 0.1 No
Fd1 Coefficient of metabolic weight loss for larvae6 0.005 0.032 0.016 Low
L-D Larval development rate7 N/A
L-S Nominal survival rate for larvae 0.9 1 0.99 Low
SD-FL Long-range dispersal probability for female adults 0 0.1 0.02 Low
SD-FS Short-range dispersal probability for female adults 0.05 0.5 0.3 Low
Note 1: This level determines the probability density function defined between lower and upper range. Higher confidence level indicates higher probability around thedefault parameter value. See Text S1 for details; 2: unit: number of eggs per mg wet-weight of female adults. 3: This is the temperature above which predator activitiesincrease. 4: The adjustment factor for survival due to predation if the temperature is higher than the specified high temperature limit for predator activities. 5: Thiscoefficient specifies the effect of food amount on larval weight gain, with a lower value indicating a stronger effect of food on larval growth and higher level of densitydependence (see Text S2 for a more detailed explanation). 6:This coefficient determines weight loss due to calories used in metabolism at larval stage. Its uncertaintyrange is defined such that the percent of weight loss due to metabolic activities is between 0.5 and 3.2 percent of body weight gain with no food constraint. See Text S2for details. 7: The larval development rate determines the enzyme-controlled development of larvae, which is dependent on temperatures. The uncertainty range of thisparameter is determined by fitting the model to data. See Text S1.3 and Text S3 for a more detailed explanation.Here we only list the most important parameters, as identified by our uncertainty analyses. A complete list appears in Tables S1, S2, S3, S4, S5.doi:10.1371/journal.pntd.0000830.t001
Uncertainty Analysis of an Ae. aegypti Model
www.plosntds.org 3 September 2010 | Volume 4 | Issue 9 | e830

understand the importance of stochastic uncertainty, we quantify it
by carrying out a second model run for each of the 5000
parameter sets sampled by FAST and examining differences in
predicted population densities between pairs of model runs (see
Text S4 for technical details). This involves a total of 10,000
simulations. In total, using five desktop computers (Intel Xeon
class CPU running at 2.8 GHz), it takes about two weeks to
complete the described FAST analysis for this model.
Results
FAST analysis shows that the median predicted pupal density at
the community level (i.e., the total number of pupae in the 612
houses simulated) is around 2000 (Figure 1 c, in which the median
is based on 5000 simulations using parameter sets sampled by
FAST). This is equivalent to about 3.27 pupae per house, close to
the average of 3.54 pupae per house in the survey data [25]. The
median predicted population density of female adults at the
community level is about 1900 (Figure 1 d and e) and the median
population density of male adults is about 1200 at the community
level (Figure 1 f), resulting in a median of about 5 adults per house.
The median population density of male adults is about two thirds
of that of female adults due to the lower survival rate of male
adults (see Table S1). There are more adults than pupae because
the adult stage lasts longer than the pupal stage.
Uncertainty in population density at the community levelOur results show that with the inclusion of uncertainties in
biological parameters and stochastic uncertainty resulting from
environmental and demographic stochasticity, the Skeeter Buster
model provides community-level predictions of mosquito popula-
tion density within a reasonable range (Figure 1). The 95%
confidence interval of the population density at the community level
of 612 houses ranges from about 20,000 to 100,000 for both eggs
and larvae (Figure 1 a,b), from 1000 to 3000 for pupae (Figure 1c),
from 400 to 1700 for nulliparous female adults (Figure 1 d), from
300 to 3200 for parous female adults (Figure 1 e), and from 500 to
2200 for male adults (Figure 1f). Levels of uncertainty remain
roughly constant over time as a result of constrained food inputs.
For important parameters contributing to the uncertainty in
predicted population density averaged over the second simulation
year at each life stage, please see Figure 2 and Tables S6, S7, S8,
S9, S10, S11. Generally, uncertainty in model parameters explains
about 80% or more of the uncertainty in the model predictions.
The uncertainty not explained by the main effects includes two
components: 1) interactions among parameters; and 2) environ-
mental and demographic stochasticity simulated in the model
resulting from natural and individual variability. Of all the
parameters in the model, four stand out as very important for most
life stages. They are the nominal survival rate for female adults and
for larvae, the coefficient of metabolic weight loss, and the larval
development rate. The nominal survival rate for female adults
accounts for about 72%, 70%, 40%, 24%, 18% and 14% of
uncertainty in the predicted egg density, parous female adult
density, larval density, nulliparous female adult density, male adult
density, and pupal density, respectively. There are relatively strong
nonlinear effects of nominal female adult survival rate on the
predicted population density of parous female adults, egg and
larvae (Figure 3). The strong nonlinear effect of female adult
survival rate on parous female adult density results from the fact
that this daily survival rate is multiplied repeatedly throughout the
life stage of parous female adults. Therefore a large value can have
a much stronger effect on parous female adult density than a small
value of this survival rate. Given that egg and larval population
densities are mainly determined by the density of parous female
adults, both of these densities also experience a strong nonlinear
dependence on the female adult survival rate (Figure 2).
The coefficient of metabolic weight loss accounts for 21%, 16%,
14%, 8%, and 3% of uncertainty in the predicted pupal density,
nulliparous female adult density, male adult density, larval density,
and parous female adult density, respectively. The coefficient of
metabolic weight loss is important for two reasons. First, when
metabolic weight loss is high, less of the energy obtained from
consuming food is available for larval growth, which could result
in smaller larval body sizes and a smaller number of mosquitoes
given the same amount of food (See Figure S5 for a detailed
illustration of the effect of coefficient of metabolic weight loss on
predicted population size). Second, a large metabolic weight loss
can result in a relatively long larval development time as is
dependent on larval weight, leading to a lower overall survival rate
at the larval stage and a reduced number of mosquitoes. For larvae
and parous female adults , because the nominal survival rate of
female adults has more dominant effects, the coefficient of
metabolic weight loss become less important.
The nominal survival rate of larvae accounts for 18%, 17%,
12%, 6%, 3%, and 2% of uncertainty in the prediction of
nulliparous female adult density, pupal density, male adult density,
larval density, parous female adult density, and egg density,
respectively. The nominal survival rate of larvae is an important
factor determining the outcome of development from eggs to
adults as a result of the relatively long development time of larvae.
For parous female adult and egg density, nominal survival rate of
larvae becomes less important since they are less dependent on the
larval stage. The larval development rate explains about 7%, 6%,
4% and 2% of uncertainty in the prediction of pupal density,
nulliparous female adult density, male adult density, and parous
female adult density, respectively. The development rate is
important because it can affect the duration of larval stage, which
can affect the overall larval survival (a longer larval development
time may lead to a lower overall survival rate at the larval stage ,
given a fixed rate of daily survival probability).
Our results also show that parameters of predator activities for
eggs (high temperature limit of predator activities and the survival
factor of predation at high temperatures) are very important
sources of uncertainty in the predicted population density at the
larval stage (Figure 2 b), but are not so important for other life
stages. This is because egg survival only affects the early larval
stage. For the late larval, pupal and adult life stages, other limiting
factors are more important (e.g., coefficient of metabolic weight
loss, larval and female adult survival rate).
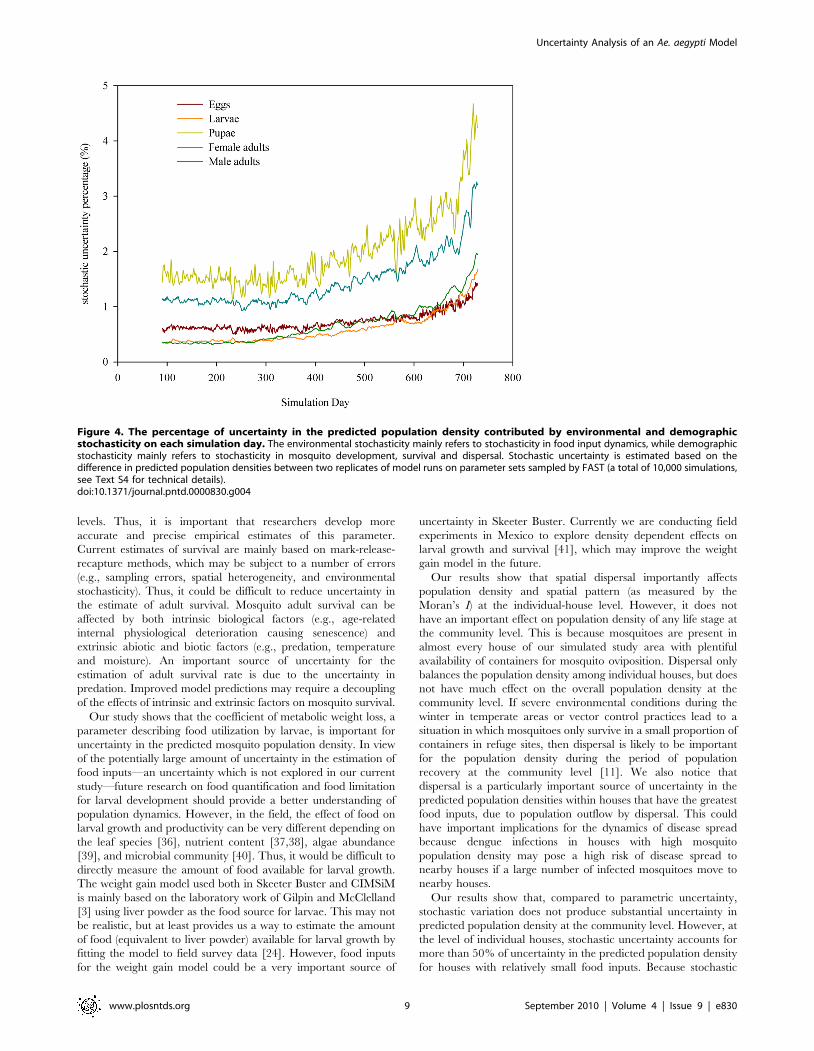
Our results show that for each life stage, stochastic uncertainty
accounts for less than 5% of uncertainty in the predicted
community-level population density on each day throughout the
two-year simulation period (Figure 4). This suggests that stochastic
uncertainty is relatively low compared to parametric uncertainty
for community-level population dynamics. The stochastic uncer-
tainty increases slightly through simulation time due to the
accumulation of stochasticity in food input dynamics, dispersal,
development and survival. The stochastic uncertainty contribution
is relatively higher for pupae and male adults compared to other
life stages, largely as a consequence of their smaller population
sizes leaving them more prone to stochastic environmental
perturbations (e.g., low temperatures).
Uncertainty in predicted population density at theindividual-house level
In this section, we quantify uncertainty in the predicted
population densities for each individual house at a time close to
Uncertainty Analysis of an Ae. aegypti Model
www.plosntds.org 4 September 2010 | Volume 4 | Issue 9 | e830

Figure 1. Uncertainties in the predicted population density for different life stages at the community level. In each panel, the centralline represents the median of predicted population density based on outputs of simulations carried out using 5000 parameter sets sampled by FAST.The yellow, green, blue and grey bands represent the 50%, 75% and 95% confidence interval of the prediction, respectively.doi:10.1371/journal.pntd.0000830.g001
Uncertainty Analysis of an Ae. aegypti Model
www.plosntds.org 5 September 2010 | Volume 4 | Issue 9 | e830
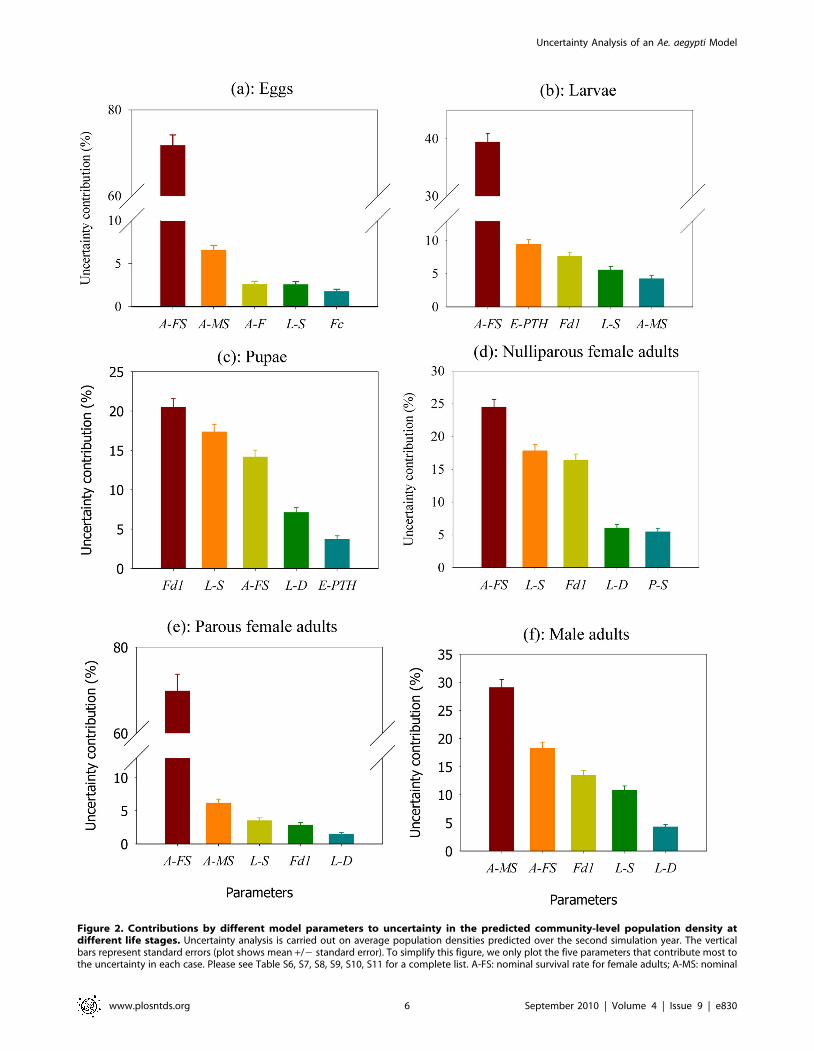
Figure 2. Contributions by different model parameters to uncertainty in the predicted community-level population density atdifferent life stages. Uncertainty analysis is carried out on average population densities predicted over the second simulation year. The verticalbars represent standard errors (plot shows mean +/2 standard error). To simplify this figure, we only plot the five parameters that contribute most tothe uncertainty in each case. Please see Table S6, S7, S8, S9, S10, S11 for a complete list. A-FS: nominal survival rate for female adults; A-MS: nominal
Uncertainty Analysis of an Ae. aegypti Model
www.plosntds.org 6 September 2010 | Volume 4 | Issue 9 | e830
the end of simulation period (simulation day 720). Means,
standard deviations and coefficients of variation (CV) of
population density are calculated for each individual house to
measure the spatial uncertainty, based on 5,000 simulations using
the parameter sets sampled by FAST. Proportions of uncertainty
in the predicted population density at each individual house
contributed by different parameters are estimated using FAST,
and the proportion of uncertainty contributed by stochasticity is
estimated using two replicates of the FAST sample (see Text S4).
Our results show that the standard deviation of predicted
mosquito population density for each life stage is low for houses
where the mean population density is relatively low (the main text
only presents results for the female adult population distribution,
see Figure 5 a, b; see Figure S6, S7, S8, S9 for male adult, egg,
larval and pupal distributions). However, the corresponding
coefficient of variation and the proportion of stochastic uncertainty
are much higher (Figure 5 c, d and Figure S6, S7, S8, S9 c, d). It is
noticeable that stochasticity explains more than 50% of uncer-
tainty in the predicted population density in every house for all life
stages except for larvae. For the larval density prediction, the
proportion of stochastic uncertainty is high (.40%) for most of the
houses, except for a few houses with relatively large food inputs
(Figure S8). The proportion of stochastic uncertainty at the
individual-house level is substantially higher than that at the
community level at the same simulation day (,5%) (see Figure 4).
In terms of parametric contributions to uncertainty in the
predicted population density, the nominal survival rate for female
adults is important for all houses except for a few houses where the
proportion of stochastic uncertainty is very high (Figure 5 e and
Figure S6, S7, S8, S9 e). The coefficient of metabolic weight loss
and larval survival rate are more important where there is a
relatively larger amount of food inputs either in the house, or in
neighboring houses (Figure 5 f, g and Figure S6, S7, S8, S9). This
is because relatively larger food inputs can lead to a higher
population density so that the coefficient of metabolic weight loss
and larval survival rate can have more important effects on local
larval and pupal population density. Our results show that spatial
dispersal is much more important for population densities in those
few houses where the food inputs are large (Figure 5 h and Figure
S6, S7, S8, S9) compared to other houses with small food inputs.
The main reason for this is that a high dispersal rate will result in a
large number of mosquitoes spreading out from these houses. For
houses with small food inputs, dispersal may still contribute to the
population dynamics (due to the in-flow of dispersing mosquitoes
from houses with relatively large food inputs) but to a lesser extent
as a result of stochasticity in dispersal. The effect of short-range
dispersal on population density is much weaker for pupae (See
Figure S9 h), which depends more on the amount of food held by
water containers in and around the house.
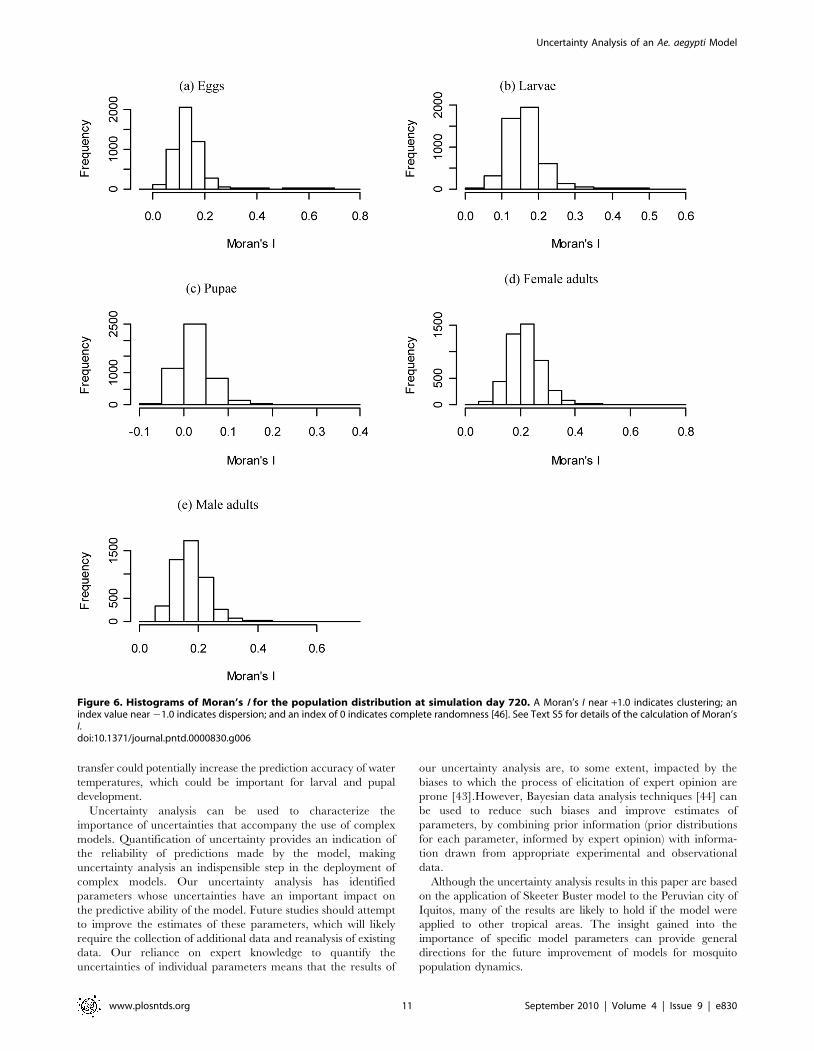
Our results show that distributions of female and male adults
are spatially clustered (Figure 5a and Figure S6 a). The clustering
of egg distribution is similar to that of female adults (Figure 5a and
Figure S7 a), while larvae and pupae are less clustered (Figure S8 a
and Figure S9 a). This is because larvae and pupae are more
dependent on the water containers and the amount of food they
hold, neither of which is clustered in the model input. Based on a
spatial statistic of Moran’s I (see Text S5) calculated for each
individual simulation (Figure 6), we show that there is no
significant spatial clustering for pupae (the p-values for Moran’s
I are not shown but are mostly larger than 0.05), while there is
some degree of spatial clustering for other life stages.
Applying FAST analysis to the level of spatial clustering of
female adults as measured by Moran’s I, our results show that the
most important factor affecting spatial clustering is the coefficient
of metabolic weight loss (Figure 7 a). Other important parameters
include the nominal survival rate for larvae and for female adults,
the short-range and long-range dispersal probabilities for female
adults, and the coefficient of food dependence [a coefficient
specifying the effect of food inputs in water-containers on larval
body weight gain, with a lower value indicating a stronger effect of
food on larval growth and a higher level of density dependence
(see Text S2 for more explanations)]. If we superimpose the hot
spots of houses with large food inputs as identified by a Gi*(d)
statistic [34,35] (see Text S5) onto the female adult population
density map (Figure 7 b), we can see that high female adult
population densities generally occur at or near houses with large
food inputs. This suggests that high local population density
(determined by food inputs, survival rate, coefficient of metabolic
weight loss, and coefficient of food dependence) and spatial
dispersal (determined by mosquito longevity and dispersal
probability) are both important for forming the spatial clustering
pattern as measured by the Moran’s I statistic. If we calculate the
semi-variance of female adult distribution (a statistic to measure
the strength of spatial autocorrelation, see Text S5 for details,
using the spatial distribution of mean population densities at each
individual house which are based on parameter sets sampled by
FAST), we can show that the semi-variance stabilizes at a distance
of 40–50 meters (or, equivalently, 4–5 houses) (Figure 7 c). This
suggests that, even though the spatial distribution of food input is
not clustered at the level of individual houses, the distribution of
adult mosquitoes may have clustering patterns if houses with large
amount of food inputs are within a distance of 4–5 houses. This
distance is close to that obtained in a previous empirical study
indicating that the mosquito data for Iquitos exhibits a weak
spatial clustering of Ae. aegypti at a distance of 30 meters [26].
Temporal variability of population densityTo gain a better understanding of the population dynamics of
Ae. aegypti, we also examine factors contributing to the temporal
variability at the community and the individual house level.
Temporal variability may result from stochastic uncertainty,
biological development cycles, environmental factors (e.g., tem-
perature) and temporal dynamics of food in water-filled contain-
ers. For the temporal variability of population dynamics at the
community level, our results show that important parameters
include the temperature limits for survival and predation of eggs,
the gonotrophic development rate, and the nominal survival rate
for female adults (See Text S6). Additionally, at the individual-
house level, the spatial dispersal of adult mosquitoes and the
coefficient of food dependence are also important parameters (see
Text S7).
Discussion
Our results show that uncertainty in the estimate of nominal
survival rate for female adults is the most important source of
uncertainty for the prediction of population densities of all life
stages by Skeeter Buster at both community and individual-house
survival rate for male adults; A-F: coefficient of fecundity for female adults; E-PTH: high temperature limit for predator activities on eggs (uC); E-SPTH:survival factor of predation at high temperatures for eggs; Fc: coefficient of food dependence for larvae; Fd1: coefficient of metabolic weight loss forlarvae; L-D: larval development rate; L-S: nominal survival rate for larvae. See Table 1 for a detailed explanation of each parameter.doi:10.1371/journal.pntd.0000830.g002
Uncertainty Analysis of an Ae. aegypti Model
www.plosntds.org 7 September 2010 | Volume 4 | Issue 9 | e830
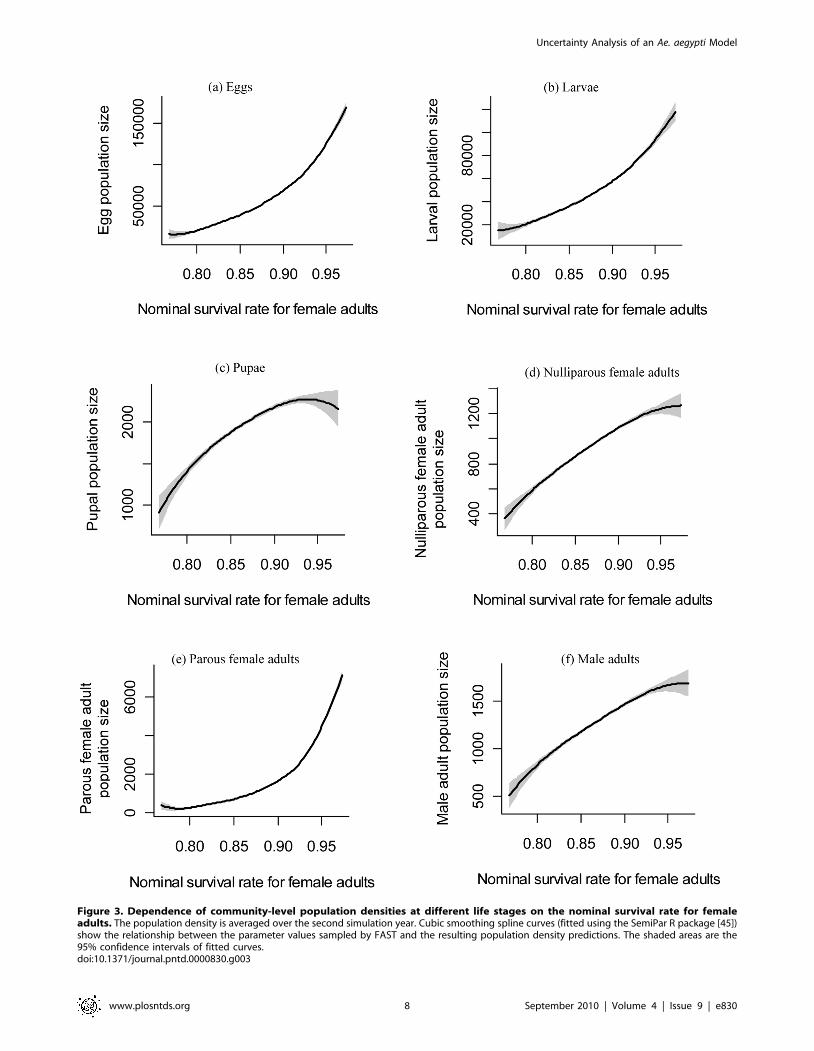
Figure 3. Dependence of community-level population densities at different life stages on the nominal survival rate for femaleadults. The population density is averaged over the second simulation year. Cubic smoothing spline curves (fitted using the SemiPar R package [45])show the relationship between the parameter values sampled by FAST and the resulting population density predictions. The shaded areas are the95% confidence intervals of fitted curves.doi:10.1371/journal.pntd.0000830.g003
Uncertainty Analysis of an Ae. aegypti Model
www.plosntds.org 8 September 2010 | Volume 4 | Issue 9 | e830
levels. Thus, it is important that researchers develop more
accurate and precise empirical estimates of this parameter.
Current estimates of survival are mainly based on mark-release-
recapture methods, which may be subject to a number of errors
(e.g., sampling errors, spatial heterogeneity, and environmental
stochasticity). Thus, it could be difficult to reduce uncertainty in
the estimate of adult survival. Mosquito adult survival can be
affected by both intrinsic biological factors (e.g., age-related
internal physiological deterioration causing senescence) and
extrinsic abiotic and biotic factors (e.g., predation, temperature
and moisture). An important source of uncertainty for the
estimation of adult survival rate is due to the uncertainty in
predation. Improved model predictions may require a decoupling
of the effects of intrinsic and extrinsic factors on mosquito survival.
Our study shows that the coefficient of metabolic weight loss, a
parameter describing food utilization by larvae, is important for
uncertainty in the predicted mosquito population density. In view
of the potentially large amount of uncertainty in the estimation of
food inputs—an uncertainty which is not explored in our current
study—future research on food quantification and food limitation
for larval development should provide a better understanding of
population dynamics. However, in the field, the effect of food on
larval growth and productivity can be very different depending on
the leaf species [36], nutrient content [37,38], algae abundance
[39], and microbial community [40]. Thus, it would be difficult to
directly measure the amount of food available for larval growth.
The weight gain model used both in Skeeter Buster and CIMSiM
is mainly based on the laboratory work of Gilpin and McClelland
[3] using liver powder as the food source for larvae. This may not
be realistic, but at least provides us a way to estimate the amount
of food (equivalent to liver powder) available for larval growth by
fitting the model to field survey data [24]. However, food inputs
for the weight gain model could be a very important source of
uncertainty in Skeeter Buster. Currently we are conducting field
experiments in Mexico to explore density dependent effects on
larval growth and survival [41], which may improve the weight
gain model in the future.
Our results show that spatial dispersal importantly affects
population density and spatial pattern (as measured by the
Moran’s I) at the individual-house level. However, it does not
have an important effect on population density of any life stage at
the community level. This is because mosquitoes are present in
almost every house of our simulated study area with plentiful
availability of containers for mosquito oviposition. Dispersal only
balances the population density among individual houses, but does
not have much effect on the overall population density at the
community level. If severe environmental conditions during the
winter in temperate areas or vector control practices lead to a
situation in which mosquitoes only survive in a small proportion of
containers in refuge sites, then dispersal is likely to be important
for the population density during the period of population
recovery at the community level [11]. We also notice that
dispersal is a particularly important source of uncertainty in the
predicted population densities within houses that have the greatest
food inputs, due to population outflow by dispersal. This could
have important implications for the dynamics of disease spread
because dengue infections in houses with high mosquito
population density may pose a high risk of disease spread to
nearby houses if a large number of infected mosquitoes move to
nearby houses.
Our results show that, compared to parametric uncertainty,
stochastic variation does not produce substantial uncertainty in
predicted population density at the community level. However, at
the level of individual houses, stochastic uncertainty accounts for
more than 50% of uncertainty in the predicted population density
for houses with relatively small food inputs. Because stochastic
Figure 4. The percentage of uncertainty in the predicted population density contributed by environmental and demographicstochasticity on each simulation day. The environmental stochasticity mainly refers to stochasticity in food input dynamics, while demographicstochasticity mainly refers to stochasticity in mosquito development, survival and dispersal. Stochastic uncertainty is estimated based on thedifference in predicted population densities between two replicates of model runs on parameter sets sampled by FAST (a total of 10,000 simulations,see Text S4 for technical details).doi:10.1371/journal.pntd.0000830.g004
Uncertainty Analysis of an Ae. aegypti Model
www.plosntds.org 9 September 2010 | Volume 4 | Issue 9 | e830

uncertainty is generally irreducible, it could be very difficult to
improve the precision of mosquito population density in
individual houses even if we could substantially reduce paramet-
ric uncertainty in the future. Although stochastic uncertainty is
high at the individual-house level, our results indicate that the
spatial clustering pattern as measured by Moran’s I is jointly
determined by the food input, the food utilization by mosquitoes,
the spatial dispersal of adult mosquitoes, and their longevity as
determined by the survival rate. This suggests that the spatial
model can be used to predict the spatial clustering of population
density at the individual-house level given the spatial distribution
of containers.
Uncertainty in the model structure and in model data inputs
(e.g., container data) can both be important sources of uncertainty.
We did not quantify those uncertainties in this study mainly due to
the lack of currently available information. One example of
structural uncertainty is in the water temperature calculations.
The Skeeter Buster model uses a polynomial regression to
calculate water temperature using air temperature and container
shading based on data from Florida. An alternative approach has
been provided by Kearney et al. [42] who coupled transient-state
energy and mass balance equations to calculate daily temperature
cycles in containers differing in size, catchment and degree of
shading. This type of biophysical model of energy and mass
Figure 5. Uncertainty in the predicted female adult population density at the individual-house level on simulation day 720. For eachindividual house, we quantify uncertainty in the predicted population density (as is described by the (a) mean, (b) standard deviation, and (c)coefficient of variation of predicted population density across the parameter sets sampled by FAST), (d) the proportion of uncertainty contributed bystochasticity, and (e–h) the proportions of uncertainty contributed by specific model parameters. To simplify this figure, only parameters withuncertainty contributions in any house larger than 5% are plotted.doi:10.1371/journal.pntd.0000830.g005
Uncertainty Analysis of an Ae. aegypti Model
www.plosntds.org 10 September 2010 | Volume 4 | Issue 9 | e830
transfer could potentially increase the prediction accuracy of water
temperatures, which could be important for larval and pupal
development.
Uncertainty analysis can be used to characterize the
importance of uncertainties that accompany the use of complex
models. Quantification of uncertainty provides an indication of
the reliability of predictions made by the model, making
uncertainty analysis an indispensible step in the deployment of
complex models. Our uncertainty analysis has identified
parameters whose uncertainties have an important impact on
the predictive ability of the model. Future studies should attempt
to improve the estimates of these parameters, which will likely
require the collection of additional data and reanalysis of existing
data. Our reliance on expert knowledge to quantify the
uncertainties of individual parameters means that the results of
our uncertainty analysis are, to some extent, impacted by the
biases to which the process of elicitation of expert opinion are
prone [43].However, Bayesian data analysis techniques [44] can
be used to reduce such biases and improve estimates of
parameters, by combining prior information (prior distributions
for each parameter, informed by expert opinion) with informa-
tion drawn from appropriate experimental and observational
data.
Although the uncertainty analysis results in this paper are based
on the application of Skeeter Buster model to the Peruvian city of
Iquitos, many of the results are likely to hold if the model were
applied to other tropical areas. The insight gained into the
importance of specific model parameters can provide general
directions for the future improvement of models for mosquito
population dynamics.
Figure 6. Histograms of Moran’s I for the population distribution at simulation day 720. A Moran’s I near +1.0 indicates clustering; anindex value near 21.0 indicates dispersion; and an index of 0 indicates complete randomness [46]. See Text S5 for details of the calculation of Moran’sI.doi:10.1371/journal.pntd.0000830.g006
Uncertainty Analysis of an Ae. aegypti Model
www.plosntds.org 11 September 2010 | Volume 4 | Issue 9 | e830
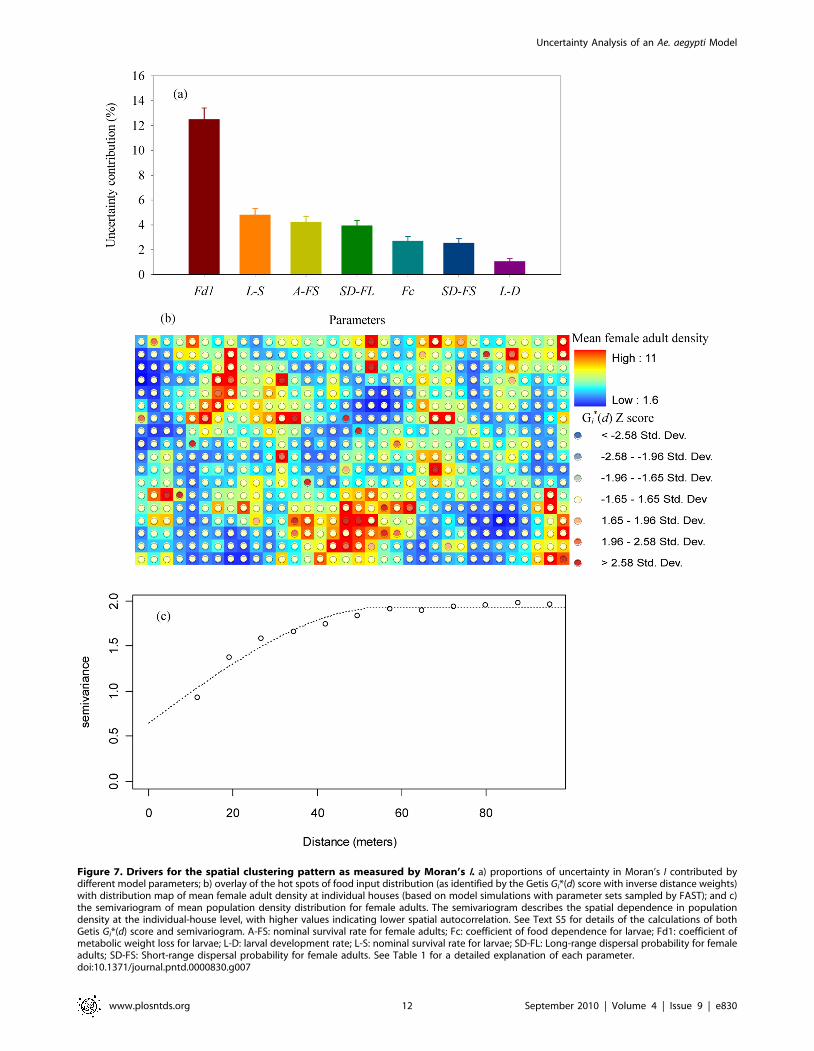
Figure 7. Drivers for the spatial clustering pattern as measured by Moran’s I. a) proportions of uncertainty in Moran’s I contributed bydifferent model parameters; b) overlay of the hot spots of food input distribution (as identified by the Getis Gi*(d) score with inverse distance weights)with distribution map of mean female adult density at individual houses (based on model simulations with parameter sets sampled by FAST); and c)the semivariogram of mean population density distribution for female adults. The semivariogram describes the spatial dependence in populationdensity at the individual-house level, with higher values indicating lower spatial autocorrelation. See Text S5 for details of the calculations of bothGetis Gi*(d) score and semivariogram. A-FS: nominal survival rate for female adults; Fc: coefficient of food dependence for larvae; Fd1: coefficient ofmetabolic weight loss for larvae; L-D: larval development rate; L-S: nominal survival rate for larvae; SD-FL: Long-range dispersal probability for femaleadults; SD-FS: Short-range dispersal probability for female adults. See Table 1 for a detailed explanation of each parameter.doi:10.1371/journal.pntd.0000830.g007
Uncertainty Analysis of an Ae. aegypti Model
www.plosntds.org 12 September 2010 | Volume 4 | Issue 9 | e830
Supporting Information
Text S1 Parametric uncertainty quantification.
Found at: doi:10.1371/journal.pntd.0000830.s001 (0.23 MB
DOC)
Text S2 Parameter estimation for the larval weight gain model.
Found at: doi:10.1371/journal.pntd.0000830.s002 (0.09 MB
DOC)
Text S3 Parameter estimation for the enzyme kinetics model.
Found at: doi:10.1371/journal.pntd.0000830.s003 (0.07 MB
DOC)
Text S4 Quantification of stochastic uncertainty.
Found at: doi:10.1371/journal.pntd.0000830.s004 (0.04 MB
DOC)
Text S5 Spatial statistics.
Found at: doi:10.1371/journal.pntd.0000830.s005 (0.04 MB
DOC)
Text S6 Temporal variability of population density at the
community level.
Found at: doi:10.1371/journal.pntd.0000830.s006 (0.06 MB
DOC)
Text S7 Temporal variability of population density at the
individual-house level.
Found at: doi:10.1371/journal.pntd.0000830.s007 (0.63 MB
DOC)
Figure S1 Survival factor as a function of temperature. The
survival factor ranges between 0 and 1 and is multiplied with
nominal survival rate to get the temperature-dependent survival
rate. Tmin is the minimum temperature for survival, below which
the low temperature has a strong effect on mosquito survival (the
survival factor is generally less than 0.05); Tlow is the low
temperature limit below which is suboptimal for mosquito survival;
Thigh is the high temperature limit above which is suboptimal for
mosquito surivival; Tmax is the maximum temperature for survival,
above which the high temperature has a very strong effect on
mosquito survival (the survival factor is generally less than 0.05).
Found at: doi:10.1371/journal.pntd.0000830.s008 (0.07 MB TIF)
Figure S2 Survival factor as a function of saturation deficit (SD).
The survival factor ranges between 0 and 1 and is multiplied with
nominal survival rate to get the humidity-dependent survival rate.
SDlow is the low saturation deficit limit below which saturation
deficit has little effect on mosquito survival. The survival rate
decreases linearly between SDlow and SDhigh, the high saturation
deficit limit above which the saturation deficit has a strong effect
on mosquito survival (survival factor is low).
Found at: doi:10.1371/journal.pntd.0000830.s009 (0.06 MB TIF)
Figure S3 Histograms of air and water temperatures (degrees
Celsius) in Iquitos for year 2000. The container water tempera-
tures are simulated using a polynomial function obtained from a
regression of water temperature on air temperature and sun
exposure for 12 containers monitored for 76 days in Gainesville,
FL, USA [4]. The water temperature is calculated assuming a sun
exposure of 0.5 for the container.
Found at: doi:10.1371/journal.pntd.0000830.s010 (0.49 MB TIF)
Figure S4 Sum of daily food input from different containers
(Unit: mg/day) at individual houses. Each block/cell represents a
single house. The food inputs are fitted to the pupal data in the
mosquito survey at individual houses in Iquitos [23]. The food
inputs are not spatially clustered based on the Moran’s I statistic
[46] using inverse distance weights (I = 0.005, p-value = 0.82).
Found at: doi:10.1371/journal.pntd.0000830.s011 (0.21 MB TIF)
Figure S5 Dependence of community-level population density
on coefficient of metabolic weight loss at different life stages. The
curves are fitted to the scatter plot of parameter values sampled by
FAST and the corresponding predicted population densities using
cubic smoothing splines with the SemiPar R package [45]. The
shaded areas are the 95% confidence intervals of the fitted lines.
Found at: doi:10.1371/journal.pntd.0000830.s012 (0.58 MB TIF)
Figure S6 Uncertainty in the predicted male adult population
density at the individual-house level on simulation day 720. For
each individual house, we quantify uncertainty in the predicted
population density (as is jointly described by the (a) mean, (b)
standard deviation, and (c) coefficient of variation of predicted
population density across the parameter sets sampled by FAST),
(d) the proportion of uncertainty contributed by stochasticity, and
(e–i) the proportions of uncertainty contributed by specific model
parameters. To simplify this figure, only parameters with
uncertainty contributions in any house larger than 5% are plotted.
Found at: doi:10.1371/journal.pntd.0000830.s013 (1.47 MB
TIF)
Figure S7 Uncertainty in the predicted egg density at the
individual-house level on simulation day 720. For each individual
house, we quantify uncertainty in the predicted population density
(as is jointly described by the (a) mean, (b) standard deviation, and
(c) coefficient of variation of predicted population density across
the parameter sets sampled by FAST), (d) the proportion of
uncertainty contributed by stochasticity, and (e–g) the proportions
of uncertainty contributed by specific model parameters. To
simplify this figure, only parameters with uncertainty contributions
in any house larger than 5% are plotted.
Found at: doi:10.1371/journal.pntd.0000830.s014 (1.75 MB TIF)
Figure S8 Uncertainty in the predicted larval population density
at the individual-house level on simulation day 720. For each
individual house, we quantify uncertainty in the population density
(as is jointly described by the (a) mean, (b) standard deviation, and
(c) coefficient of variation of predicted population density across
the parameter sets sampled by FAST), (d) the proportion of
uncertainty contributed by stochasticity, and (e–g) the proportions
of uncertainty contributed by specific model parameters. To
simplify this figure, only parameters with uncertainty contributions
in any house larger than 5% are plotted.
Found at: doi:10.1371/journal.pntd.0000830.s015 (1.67 MB TIF)
Figure S9 Uncertainty in the predicted pupal density at the
individual-house level on simulation day 720. For each individual
house, we quantify uncertainty in the predicted population density
(as is jointly described by the (a) mean, (b) standard deviation, and
(c) coefficient of variation of predicted population density across
the parameter sets sampled by FAST), (d) the proportion of
uncertainty contributed by stochasticity, and (e–h) the proportions
of uncertainty contributed by specific model parameters. To
simplify this figure, only parameters with maximum uncertainty
contributions larger than 5% in any house are plotted except for
panel (h), which is shown for the comparison of mosquito dispersal
importance at different life stages.
Found at: doi:10.1371/journal.pntd.0000830.s016 (1.67 MB TIF)
Table S1 Uncertainties in the estimates of parameters for adults.
Found at: doi:10.1371/journal.pntd.0000830.s017 (0.11 MB
DOC)
Table S2 Uncertainties in the estimates of parameters for larvae
and pupae.
Uncertainty Analysis of an Ae. aegypti Model
www.plosntds.org 13 September 2010 | Volume 4 | Issue 9 | e830

Found at: doi:10.1371/journal.pntd.0000830.s018 (0.09 MB
DOC)
Table S3 Uncertainties in the estimates of parameters for egg
survival and hatching.
Found at: doi:10.1371/journal.pntd.0000830.s019 (0.09 MB
DOC)
Table S4 Uncertainties in the estimates of parameters for larval
weight gain.
Found at: doi:10.1371/journal.pntd.0000830.s020 (0.06 MB
DOC)
Table S5 Uncertainties in the estimates of parameters for
mosquito dispersal.
Found at: doi:10.1371/journal.pntd.0000830.s021 (0.07 MB
DOC)
Table S6 Uncertainty contributions (%) by different model
parameters for predicted egg population density at the community
level.
Found at: doi:10.1371/journal.pntd.0000830.s022 (0.05 MB
DOC)
Table S7 Uncertainty contributions (%) by different model
parameters for predicted larval population density at the
community level.
Found at: doi:10.1371/journal.pntd.0000830.s023 (0.05 MB
DOC)
Table S8 Uncertainty contributions (%) by different model
parameters for predicted pupal population density at the
community level.
Found at: doi:10.1371/journal.pntd.0000830.s024 (0.05 MB
DOC)
Table S9 Uncertainty contributions (%) by different model
parameters for the predicted population density of nulliparous
female adults at the community level.
Found at: doi:10.1371/journal.pntd.0000830.s025 (0.05 MB
DOC)
Table S10 Uncertainty contributions (%) by different model
parameters for the predicted population density of parous female
adults at the community level.
Found at: doi:10.1371/journal.pntd.0000830.s026 (0.04 MB
DOC)
Table S11 Uncertainty contributions (%) by different model
parameters for the predicted population density of male adults at
the community level.
Found at: doi:10.1371/journal.pntd.0000830.s027 (0.05 MB
DOC)
Acknowledgments
We thank all the members in Professor Thomas Scott’s Lab from the
University of California at Davis, and all the members in Professor Laura
Harrington’s Lab from Cornell University, who provided useful expert
knowledge for the estimation of uncertainties in model parameters. We also
thank three anonymous reviewers for their very helpful comments which
greatly improved this paper.
Author Contributions
Conceived and designed the experiments: CX ML FG ALL. Performed the
experiments: CX ML. Analyzed the data: CX. Contributed reagents/
materials/analysis tools: CX ML FG ALL. Wrote the paper: CX ML FG
ALL.
References
1. Kyle JL, Harris E (2008) Global Spread and Persistence of Dengue. Annu RevMicrobiol 62: 71–92.
2. WHO (2009) Dengue and dengue haemorrhagic fever - Fact Sheet 117. http://www.who.int/mediacentre/factsheets/fs117/en/.
3. Gilpin ME, McClelland GAH (1979) Systems-analysis of the yellow fever
mosquito Aedes aegypti. Forts Zool 25: 355–388.
4. Focks DA, Haile DG, Daniels E, Mount GA (1993) Dynamic life table model of
Aedes aegypti (Diptera: Culicidae) - Analysis of the literature and modeldevelopment. J Med Entomol 30: 1003–1017.
5. Focks DA, Haile DG, Daniels E, Mount GA (1993) Dynamic life table model forAedes aegypti (Diptera: Culicidae) - Simulation and validation. J Med Entomol 30:
1018–1028.
6. Focks DA, Daniels E, Haile DG, Keesling JE (1995) A simulation model of theepidemiology of urban dengue fever - Literature analysis, model development,
preliminary validation and samples of simulation results. Am J Trop Med Hyg
53: 489–506.
7. Hopp M, Foley J (2001) Global-scale relationships between climate and thedengue fever vector, Aedes aegypti. Clim Change 48: 441–463.
8. Service MW (1997) Mosquito (Diptera : Culicidae) dispersal - the long and shortof it. J Med Entomol 34: 579–588.
9. Reiter P (2007) Oviposition, dispersal, and survival in Aedes aegypti: implications
for the efficacy of control strategies. Vector Borne Zoonot Dis 7: 261–274.
10. Scott TW, Morrison AC (2008) Longitudinal field studies will guide a paradigm
shift in dengue prevention. In: Atkinson PW, ed. Vector Biology, Ecology andControl. Washington, DC: The National Academies Press. pp 139–161.
11. Otero M, Schweigmann N, Solari HG (2008) A stochastic spatial dynamicalmodel for Aedes aegypti. Bull Math Biol 70: 1297–1325.
12. Magori K, Legros M, Puente ME, Focks DA, Scott TW, et al. (2009) Skeeter
Buster: a stochastic, spatially-explicit modeling tool for studying Aedes aegypti
population replacement and population suppression strategies. Plos Neglect
Trop Dis 3: e508.
13. James AA (2005) Gene drive systems in mosquitoes: rules of the road. Trends
Parasitol 21: 64–67.
14. Gould F, Magori K, Huang YX (2006) Genetic strategies for controlling
mosquito-borne diseases. Am Sci 94: 238–246.
15. Olson KE, Alphey L, Carlson JO, James AA (2006) Genetic approaches inAedes aegypti for control of dengue: an overview. In: Knols BGJ, Louis C, eds.
Bridging Laboratory and Field Research for Genetic Control of Disease Vectors.
pp 77–87.
16. Turley MC, Ford ED (2009) Definition and calculation of uncertainty inecological process models. Ecol Model 220: 1968–1983.
17. Li H, Wu J (2006) Uncertainty analysis in ecological studies: an overview. In:Wu J, Jones KB, Li H, Loucks OL, eds. Scaling and Uncertainty Analysis in
Ecology. , Netherlands: Springer. pp 44–66.
18. Melbourne BA, Hastings A (2009) Highly variable spread rates in replicated
biological invasions: fundamental limits to predictability. Science 325:1536–1539.
19. Xu C, Gertner GZ (2010) Understanding and comparisons of different sampling
approaches for the Fourier Amplitudes Sensitivity Test (FAST). Comput Stat
Data Anal;In Press: 10.1016/j.csda.2010.1006.1028.
20. Xu C, Gertner GZ (2008) A general first-order global sensitivity analysismethod. Reliab Eng Syst Safe 93: 1060–1071.
21. Xu C, Gertner GZ (2007) Extending a global sensitivity analysis technique
to models with correlated parameters. Comput Stat Data Anal 51: 5579–
5590.
22. Sharpe PJH, DeMichele DW (1977) Reaction kinetics of poikilothermdevelopment. J Theor Biol 64: 649–670.
23. Nayar JK, Sauerman DM (1975) The effects of nutrition on survival andfecundity in Florida mosquitoes. Part. 3. Utilization of blood and sugar for
fecundity. J Med Entomol 12: 220–225.
24. Legros M, Magori K, Morrison A, Xu C, Scott TW, et al. (In Review) Case
studies as a step towards the validation of Skeeter Buster, a detailed simulationmodel of aedes aegypti populations.
25. Morrison AC, Gray K, Getis A, Astete H, Sihuincha M, et al. (2004) Temporal
and geographic patterns of Aedes aegypti (Diptera : Culicidae) production inIquitos, Peru. J Med Entomol 41: 1123–1142.
26. Getis A, Morrison AC, Gray K, Scott TW (2003) Characteristics of the spatialpattern of the dengue vector, Aedes aegypti, in Iquitos, Peru. Am J Trop Med Hyg
69: 494–505.
27. Saltelli A, Ratto M, Tarantola S, Campolongo F (2005) Sensitivity analysis for
chemical models. Chem Rev 105: 2811–2826.
28. Saltelli A, Chan K, Scott M (2000) Sensitivity Analysis. West Sussex: John Wileyand Sons. pp 467.
29. Cukier RI, Fortuin CM, Shuler KE, Petschek AG, Schaibly JH (1973) Study ofthe sensitivity of coupled reaction systems to uncertainties in rate coefficients. I.
Theory. J Chem Phys 59: 3873–3878.
30. Cukier RI, Levine HB, Shuler KE (1978) Nonlinear sensitivity analysis of
multiparameter model systems. J Comput Phys 26: 1–42.
Uncertainty Analysis of an Ae. aegypti Model
www.plosntds.org 14 September 2010 | Volume 4 | Issue 9 | e830

31. Cukier RI, Schaibly JH, Shuler KE (1975) Study of the sensitivity of coupled
reaction systems to uncertainties in rate coefficients. III. Analysis of the
approximations. J Chem Phys 63: 1140–1149.
32. Xu C, Gertner G, Chen M (2008) UASA Toolbox—Uncertainty and Sensitivity
Analysis Toolbox. Version 0.9.1.0.
33. Xu C, Gertner GZ (2010) Reliability of global sensitivity indices. J Stat Comput
Simul;In Press: doi:10.1080/00949655.00942010.00509317.
34. Getis A, Ord JK (1992) The analysis of spatial association by use of distance
statistics. Geogr Anal 24: 189–206.
35. Ord JK, Getis A (1995) Local spatial autocorrelation statistics - distributional
issues and an application. Geogr Anal 27: 286–306.
36. Reiskind MH, Greene KL, Lounibos LP (2009) Leaf species identity and
combination affect performance and oviposition choice of two container
mosquito species. Ecol Entomol 34: 447–456.
37. Walker ED, Lawson DL, Merritt RW, Morgan WT, Klug MJ (1991) Nutrient
dynamics, bacterial populations, and mosquito productivity in tree hole
ecosystems and microcosms. Ecology 72: 1529–1546.
38. Merritt RW, Dadd RH, Walker ED (1992) Feeding behavior, natural food, and
nutritional relationships of larval mosquitos. Annu Rev Entomol 37: 349–376.
39. Barrera R, Amador M, Clark GG (2006) Ecological factors influencing Aedes
aegypti (Diptera : Culicidae) productivity in artificial containers in Salinas, PuertoRico. J Med Entomol 43: 484–492.
40. Kaufman MG, Bland SN, Worthen ME, Walker ED, Klug MJ (2001) Bacterial
and fungal biomass responses to feeding by larval Aedes triseriatus (Diptera :Culicidae). J Med Entomol 38: 711–719.
41. Walsh RK, Facchinelli L, Willoquet JR, Compean JGB, Gould F (In Review)Assessing the impact of density dependence in field populations of Aedes aeygpti.
42. Kearney M, Porter WP, Williams C, Ritchie S, Hoffmann AA (2009) Integrating
biophysical models and evolutionary theory to predict climatic impacts onspecies’ ranges: the dengue mosquito Aedes aegypti in Australia. Funct Ecol 23:
528–538.43. Kuhnert PM, Martin TG, Griffiths SP (2010) A guide to eliciting and using
expert knowledge in Bayesian ecological models. Ecol Lett 13: 900–914.44. Gelman A (2004) Bayesian data analysis. Boca RatonFlorida: Chapman & Hall/
CRC. 668 p.
45. Wand MP, Coull BA, French JL, Ganguli B, Kammann EE, et al. (2005)SemiPar 1.0. R package. http://cran.r-project.org.
46. Moran PAP (1950) Notes on continuous stochastic phenomena. Biometrika 37:17–23.
Uncertainty Analysis of an Ae. aegypti Model
www.plosntds.org 15 September 2010 | Volume 4 | Issue 9 | e830
Related Documents