1 Understanding transcriptional regulation by integrative analysis of transcription factor binding data Chao Cheng 1,2 , Roger Alexander 1,2 , Renqiang Min 1,2 , Jing Leng 2 , Kevin Y. Yip 1,2,3 , Joel Rozowsky 1,2 , Koon-kiu Yan 1,2 , Xianjun Dong 4 , Sarah Djebali 5 , Yijun Ruan 6 , Carrie A Davis 7 , Piero Carninci 8 , Timo Lassman 8 , Thomas R. Gingeras 7 , Roderic Guigó Serra 5 , Ewan Birney 9 , Zhiping Weng 4 , Michael Snyder 10 , Mark Gerstein 1,2,11 * 1. Department of Molecular Biophysics and Biochemistry, Yale University, 260 Whitney Avenue, New Haven, CT 06520, USA 2. Program in Computational Biology and Bioinformatics, Yale University, 260 Whitney Avenue, New Haven, CT 06520, USA 3. Department of Computer Science and Engineering, The Chinese University of Hong Kong, Shatin, New Territories, Hong Kong 4. Program in Bioinformatics and Integrative Biology, Department of Biochemistry and Molecular Pharmacology, University of Massachusetts Medical School, Worcester, Massachusetts, USA. 5. Center for Genomic Regulation (CRG) and UPF, Dr. Aiguader, 88, 08003 Barcelona, Spain 6. Genome Institute of Singapore, Singapore 138672 7. Cold Spring Harbor Laboratory, Cold Spring Harbor, NY, USA 8. RIKEN Omics Science Center, Yokohama Institute, Yokohama, Kanagawa, Japan 9. European Bioinformatics Institute (EMBL-EBI), Hinxton, Cambridgeshire, United Kingdom 10. Department of Genetics, Stanford University School of Medicine, Stanford, California, United States of America 11. Department of Computer Science, Yale University, 260 Whitney Avenue, New Haven, CT 06520, USA *Correspondence: Mark B Gerstein. Email: [email protected] Abstract Statistical models have been used to quantify the relationship between gene expression and transcription factor (TF) binding signals. Here we apply the models to the large-scale data generated by the ENCODE project to study transcriptional regulation by TFs. Our results reveal notable difference in the prediction accuracy of expression levels of transcription start sites (TSSs) captured by different technologies and RNA extraction protocols. In general, the expression levels of TSSs with high CpG content are more predictable than those with low CpG content. For genes with alternative TSSs, the expression levels of downstream TSSs are more predictable than those of the upstream ones. Different TF categories and specific TFs vary substantially in their contributions to predicting expression. Between two cell lines, the differential expression of TSS can be precisely reflected by the difference of TF binding signals in a quantitative manner, arguing against the conventional on-and-off model of TF binding. Finally, we explore the relationships between TF binding signals and other chromatin features such as histone modifications and DNase hypersensitivity for determining expression. The models imply that these features regulate transcription in a highly coordinated manner. Introduction

Welcome message from author
This document is posted to help you gain knowledge. Please leave a comment to let me know what you think about it! Share it to your friends and learn new things together.
Transcript

1
Understanding transcriptional regulation by integrative
analysis of transcription factor binding data
Chao Cheng
1,2, Roger Alexander
1,2, Renqiang Min
1,2, Jing Leng
2, Kevin Y. Yip
1,2,3, Joel
Rozowsky1,2, Koon-kiu Yan1,2, Xianjun Dong4, Sarah Djebali5, Yijun Ruan6, Carrie A Davis7,
Piero Carninci8, Timo Lassman8, Thomas R. Gingeras7, Roderic Guigó Serra5, Ewan Birney9,
Zhiping Weng4, Michael Snyder10, Mark Gerstein1,2,11*
1. Department of Molecular Biophysics and Biochemistry, Yale University, 260 Whitney
Avenue, New Haven, CT 06520, USA
2. Program in Computational Biology and Bioinformatics, Yale University, 260 Whitney
Avenue, New Haven, CT 06520, USA
3. Department of Computer Science and Engineering, The Chinese University of Hong Kong,
Shatin, New Territories, Hong Kong
4. Program in Bioinformatics and Integrative Biology, Department of Biochemistry and
Molecular Pharmacology, University of Massachusetts Medical School, Worcester,
Massachusetts, USA.
5. Center for Genomic Regulation (CRG) and UPF, Dr. Aiguader, 88, 08003 Barcelona,
Spain
6. Genome Institute of Singapore, Singapore 138672
7. Cold Spring Harbor Laboratory, Cold Spring Harbor, NY, USA
8. RIKEN Omics Science Center, Yokohama Institute, Yokohama, Kanagawa, Japan
9. European Bioinformatics Institute (EMBL-EBI), Hinxton, Cambridgeshire, United
Kingdom
10. Department of Genetics, Stanford University School of Medicine, Stanford, California,
United States of America
11. Department of Computer Science, Yale University, 260 Whitney Avenue, New Haven,
CT 06520, USA
*Correspondence: Mark B Gerstein. Email: [email protected]
Abstract
Statistical models have been used to quantify the relationship between gene expression and
transcription factor (TF) binding signals. Here we apply the models to the large-scale data
generated by the ENCODE project to study transcriptional regulation by TFs. Our results
reveal notable difference in the prediction accuracy of expression levels of transcription start
sites (TSSs) captured by different technologies and RNA extraction protocols. In general, the
expression levels of TSSs with high CpG content are more predictable than those with low
CpG content. For genes with alternative TSSs, the expression levels of downstream TSSs are
more predictable than those of the upstream ones. Different TF categories and specific TFs
vary substantially in their contributions to predicting expression. Between two cell lines, the
differential expression of TSS can be precisely reflected by the difference of TF binding
signals in a quantitative manner, arguing against the conventional on-and-off model of TF
binding. Finally, we explore the relationships between TF binding signals and other
chromatin features such as histone modifications and DNase hypersensitivity for determining
expression. The models imply that these features regulate transcription in a highly
coordinated manner.
Introduction

2
Transcription factors (TFs) are critical for the transcriptional regulation of gene expression
(Takahashi and Yamanaka 2006; Vaquerizas et al. 2009). In human, they represent the largest
family of proteins, accounting for around 10% of genes (Babu et al. 2004). There are two
types of TFs: general and sequence-specific. The former TFs act cooperatively with RNA
polymerase II and are ubiquitously involved in the transcription of a large fraction of genes
(Lee and Young 2000). The latter TFs bind specific subsets of target genes, leading to distinct
spatiotemporal patterns of gene expression (Kadonaga 2004). Although systematic gene
expression quantification has been available for a decade from microarray experiments
(Schena et al. 1995), only recently has the genome-wide identification of TF binding sites
become possible owing to the development of chromatin immunoprecipitation followed by
microarray (ChIP-chip) and sequencing (ChIP-seq) technologies (Johnson et al. 2007; Ren et
al. 2000).
In several previous studies, statistical models were constructed to study the regulatory
functions of TF on gene expression based on the gene expression and TF binding data (Cheng
and Gerstein 2011; Ouyang et al. 2009). These studies showed that TF binding signals around
the transcription start sites (TSSs) of genes are predictive of gene expression levels with fairly
high accuracy. But these studies have the following limitations. First, estimates of gene
expression have relied on probes (microarray) or sequence reads (RNA-seq) spread across a
gene, possibly across multiple unknown isoforms of that gene. It is often difficult to
accurately determine the expression level of each transcript based on such a kind of data,
which limits the predictive power of these models. Second, the numbers of TFs used in these
models were quite limited and perhaps not representative (12 TFs in both studies). Third, the
TF binding data were available for only a single cell line, so it was not possible to investigate
the specificity of the models by examining the degree to which differential TF binding
between two conditions affects differential expression of genes in those conditions.
Fortunately, the ENCODE project has generated a large amount of data that enable us to
overcome all these limitations (The-ENCODE-Consortium 2012). In addition to expression
quantification of transcripts from RNA-seq (Wang et al. 2009) and RNA-PET experiments
(Luo et al. 2012; Ruan et al. 2007), the consortium has also used Cap Analysis of Gene
Expression (CAGE) to quantify the expression levels of >130,000 TSSs (annotated by
GENCODE). In contrast to RNA-seq, CAGE is a technology that directly measures the
transcriptional signal at the TSS of genes (Lassmann and Carninci 2012; Shiraki et al. 2003).
In total, the expression data include 267 expression profiles, representing RNA samples in
multiple cell lines that are extracted from different cellular components using different RNA
extraction protocols. Moreover, the ENCODE project has generated >400 TF binding profiles
for more than 120 human TFs or transcription related proteins, including both general and
sequence-specific TFs (Gerstein et al. 2012). The completeness of the ENCODE data enable
us to study the transcriptional regulation of TFs more accurately and comprehensively.
In this study, we apply our previously developed model (Cheng and Gerstein 2011) to the
ENCODE data to better understand transcriptional regulation. We quantify the relationship
between TF binding signals around TSS and the expression level of TSS measured by
different technologies, and we study the relative contribution of different TF categories and of
individual TFs. We compare the regulatory difference between different types of TSS. We
also show that differential expression of genes can be determined largely by the differential
binding of TFs. Finally, we explore how TFs coordinate with other chromatin features (e.g.
chromatin modifications and DNase hypersensitivity) to regulate transcription.
Results
Relating TF binding signals to gene expression levels

3
The ENCODE project has performed a large-scale analysis of gene expression and
transcription factor (TF) binding in multiple human cell lines. In the gene expression data, the
transcription levels of ~130,000 GENCODE-annotated TSSs were quantified using three
different technologies: cap analysis of gene expression (CAGE) RNA-PET and RNA-seq in
multiple cellular components, and with several different RNA extraction protocols.
Meanwhile, the binding sites of ~120 TFs in the human genome were determined by ChIP-
seq experiments (Gerstein et al. 2012). These data sets enable us to investigate the
relationship between TF binding and gene expression in a systematic and quantitative manner.
We have previously shown in mouse that the expression levels of transcripts can be
accurately reflected by TF binding signals in their TSS regions (Cheng and Gerstein 2011). In
this study, we aim at validating this result using data from CAGE that directly measures the
expression levels of TSSs, and to investigate the influences of different technologies and
RNA extraction methods on TSS expression quantification. We constructed models to
quantify the ability of TF binding signals to statistically predict the expression levels of
promoters. Unless stated otherwise, we represent the binding strength of a TF in a promoter
by its average ChIP-seq signal in a 100bp region centered on the TSS. We combined the TSS
expression data with TF binding data and then divided them into a training dataset and a test
dataset. A model was trained on the training dataset and then applied to the test data to predict
the expression levels of TSSs (see “Methods” for details). The relationship between
expression and TF binding was quantified by the correlation between predicted and actual
expression levels (R), or by the coefficient of determination (R2), the percentage of variance
of gene expression explained by the model. In order to evaluate the stability of our results, we
built models using four different machine-learning methods: random forest (RF), support
vector regression (SVR), multivariate adaptive regression splines (MARS) and multiple linear
regression (MLR). Performance of the first three methods was roughly comparable, and was
better than MLR, implying a non-linear relationship between TF binding and TSS expression
(Supplementary Figure S1). In this article, to simplify presentation we focus on results from
the RF method for models with multiple predictors and the SVR method for models with a
single predictor (see “Methods” for details). Results from different methods are highly
consistent and lead to the same conclusions, e.g. the relative importance of different TFs for
predicting gene expression.
Our results indicate that TF binding signals around the TSS are informative for “predicting”
their expression levels. For example, Figure 1A shows the consistency between predicted and
actual expression levels of TSSs measured by CAGE of whole cell Poly A+ RNA in K562
cells. TF binding accounts for at least 67% of the variance of expression levels (R2=0.67). In
total, there are 267 promoter expression profiles representing 12 different human cell lines in
our dataset. The performance of the model is not directly comparable between cell lines,
because different numbers of TF binding datasets are available for different cell lines. Since
the most complete data were from K562, we chose this cell line for further analysis. The
expression levels of a large fraction of TSSs (~50% on average) are not detected (RPKM=0)
in any of these K562 datasets. Thus, we developed a more complicated model that first
classifies TSSs into expressed and non-expressed categories and then adopts a regression
model to predict the expression levels for the expressed TSSs only (The-ENCODE-
Consortium 2012). When applied to the TF data, this model achieves results very consistent
with the methods without a classification step in terms of the R2 value and the relative
importance of different TFs. We therefore focus on the classification-free models in the rest
of this analysis.
We compared the impact of different technologies, cellular components and RNA extraction
protocols on the “prediction accuracy” of models. We used the binding signals of 40 TFs to
predict each of the 57 K562 expression profiles and compared the resulting accuracies in
terms of R2 values. We found that the highest predictive accuracy was achieved for TSS

4
expression data from CAGE (Figure 1B). RNA-seq, as a method for quantifying expression at
the transcript level, seems unable to precisely capture the expression levels of TSSs.
Furthermore, prediction accuracies vary significantly among different RNA extraction
protocols with Poly A+ > Poly A- > Total RNA (Figure 1C). No obvious difference was
observed between the prediction accuracies for expression data from different cellular
components (Figure 1D). It can also be seen that expression levels of promoters with high
CpG content (HCP) are easier to predict than those with low CpG content (LCP). We will
investigate the effect of CpG content on gene expression in more detail below.
Contribution of different TFs to the regulation of gene expression
The ENCODE project has generated ChIP-seq data for a large number of DNA binding
proteins. These proteins can be roughly classified into six different categories, including
sequence specific TFs (TFSS), general or non-specific TFs (TFNS), chromatin structure
factors (ChromStr), chromatin remodeling factors (ChromRem), histone methyltransferases
(HISase) and Pol3-associated factors (Pol3F) (Supplementary Table S1). For each TF, we
constructed a model of expression prediction using it as the single predictor. We compared
their capability for predicting expression levels of TSSs in K562 (e.g. whole cell poly A+
RNA). We found that individually, TFs in the TFNS category were significantly more
predictive than proteins in other groups (P=0.004, t-test), whereas proteins from the
ChromRem and Pol3F categories were significantly less predictive (P=0.0004 and P=0.006,
respectively, t-test) (Figure 2A and Supplementary Table S1). TFs in the TFNS category are
implicated in general transcriptional regulation. For instance, the TATA-binding protein (TBP)
is a common subunit required by all three of the human RNA polymerases, I, II and III
(Kornberg 2007). Binding of these general TFs is essential for transcriptional initiation of
most promoters, and therefore it makes sense that their binding signals have the highest
predictive capabilities for gene expression. In contrast, it is expected that TFs in the Pol3F
category are in general less predictive, because RNA Pol III is involved in initiating
transcription of only a small fraction of promoters.
For each of the 40 TFSSs assayed in K562, we investigated its individual predictive power in
a degenerate model that uses this TF as a single predictor (Figure 2B). Strikingly, each TF
alone can predict TSS expression levels of all genes with fairly high accuracy. As shown, the
binding signal of MAX alone can explain 55% of the variance in expression of all TSS, which
is only ~12% lower than the variance explained by the full model (67%). The R2 in a
degenerate model indicates the power of a TF for predicting expression individually. In the
full model, the relative importance of TFs for predicting the expression levels of promoters is
roughly reflected by their Relative Importance score (RI score, see “Methods”) (Figure 2C).
We use the standard RI metrics of different machine learning methods, which indicate the
contribution of TFs after considering their inter-correlations in a model, and thus provide
complementary information to the individual predictive power. Specifically, in a random
forest model the RI of a TF is calculated as the increase of prediction error (%IncMSE) when
binding data for this TF is permuted. In general, highly predictive TFs have more binding
peaks, particularly in the TSS proximal regions. We found in the full model that the top five
most important TFs in K562 are YY1, E2F4, MYC, MAX and ELF1. We also examined the
effect of TF-TF interaction on the predictive accuracy. Our results indicated that including
interaction terms in the model did not lead to further improvement.
In principle, we would expect the binding of transcriptional activators to positively correlate
with gene expression levels, and a negative correlation for transcriptional repressors.
Surprisingly, we observe a positive correlation between the expression level of TSSs and the
binding signal of most ENCODE TFs (Supplementary Table S2). For instance, the binding of
REST, which represses neuronal genes in non-neuronal tissues (Schoenherr and Anderson
1995), is positively correlated with gene expression (ρ=0.70). This implies that TF occupancy
alone may not be sufficient to determine the function of a TF at a locus, as has been

5
demonstrated in a recent study (Lickwar et al. 2012). For many TFs, their binding signal in a
DNA region may simply reflect the accessibility of the local chromatin structure.
The effect of promoter CpG content on gene expression
The CpG content of promoters in eukaryotes has been shaped by DNA methylation (Deaton
and Bird 2011). Cytosines in CpG dinucleotides can be methylated to form 5-methylcytosine,
which undergoes a high rate of mutation into uracil. Meanwhile, methylation of CpG sites
within the promoter is a critical regulatory mechanism to inactivate a gene (Pai et al. 2011).
As a consequence, genes repressed in germ-line cells or early developmental stages tend to
have lower CpG content in their promoters (Deaton and Bird 2011). When genes are
repressed by methylation of CpG cytosines in their promoters, those cytosines tend to mutate
to uracil, so there is a sort of “evolutionary arms race” between CpG-based repression and
mutation to uracil that lowers CpG content.
We calculated normalized CpG content for all GENCODE promoters (see “Methods”). As
shown in Figure 3A, normalized CpG content follows a bimodal distribution, based on which
we divided promoters into two classes: high CpG promoters (HCP) and low CpG promoters
(LCP). HCP promoters are more highly expressed than LCP promoters as measured by
CAGE experiments in all expression profiles. For example, in K562 whole cell Poly A+ RNA,
62% of HCP promoters are expressed, while only 15.5% of LCP promoters are expressed
(Figure 3B). Furthermore, among the expressed TSSs, the expression level of HCP promoters
is significantly higher than that of LCP promoters (Figure 3C).
We have shown in Figure 1 that the expression levels of HCP promoters are easier to predict
than those of LCP promoters. We further compared the relative importance of each TF for
predicting the expression levels of HCP and LCP promoters. As shown in Figure 3D, the
relative importance (RI) scores for the HCP model are generally greater than those for the
LCP model, consistent with the higher predictive accuracy of the HCP model. The orders of
the RI scores in the two models are roughly consistent, with the exception of E2F4. In the
HCP model, E2F4 is the second most important TF, but in the LCP model its relative
importance is very low. Consistently, the average binding signal of E2F4 at the TSS site is
lower in LCP promoters than in HCP promoters (Figure 3E). The binding signal of E2F4
alone accounts for 47% of the variance of expression levels for HCP promoters, but only 14%
for LCP promoters (Figure 3F). This finding implies that the regulation of E2F4 on gene
expression might be affected by the status of CpG sites. In fact, it has been demonstrated that
E2F binding can be regulated by CpG methylation (Campanero et al. 2000).
In promoters whose low expression level is mediated by CpG methylation, the methylated
CpG dinucleotides have a relatively high chance to mutate into UpG. Especially for
promoters repressed in germ line cells or in early developmental stages, such mutations can
be passed on to the next generation, resulting in a reduction in CpG content in that promoter
region in future generations. We examined the correlation coefficient of normalized CpG
content with expression levels of promoters in different cell lines. We found that the best
correlation was obtained in H1HESC (H1 human embryonic stem cells), indicating that CpG
content best reflects promoter expression status in this cell line. This indicates that gene
expression and DNA methylation in germ line cells or early developmental stages might be
more similar to H1HESC than other cell lines. We also examined the effect of using CpG
content for classifying expressed and non-expressed promoters. As shown in Figure 3H, this
method of classification achieves its highest accuracy (AUC=0.82, see “Methods” for details)
in H1HESC, with much lower accuracy in HEPG2 cells.
Regulation of alternative TSS by TFs

6
Many genes have multiple transcriptional start sites. Specifically, ~35% of genes annotated
by GENCODE possess more than one TSS (Harrow et al. 2012). To investigate whether there
are systematic differences in the regulation of different classes of TSS, we selected all genes
with alternative TSSs and collected the first and the second TSS of these genes to form two
TSS sets (the average distance between the first and the second TSS is 236 bp). Then we
constructed separate models for the first TSS and the second TSS sets. Using expression data
from the CAGE and RNA-PET experiments, we achieved higher predictive accuracy for the
second TSS set (Figure 4). The same trend was observed in RNA-seq data only when the
short RNA extraction protocol was adopted. Higher prediction accuracy was achieved for the
first TSS set for RNA-seq data using other RNA extraction protocols. It is unlikely that these
results are caused by the CpG content issue, because the two TSS sets are similar in their CpG
contents (56.2% and 55.2 of TSSs in the first and second set, respectively, are HCPs).
Moreover, there is no significant difference in their expression levels between the two TSS
sets. Our results imply that expression levels of the downstream TSS might rely more on TF
regulation, while other chromatin features might have more influence on the transcription of
the first TSS. In addition, the relative importance of TFs is different between the two models
(Supplementary Figure S2). For instance, MXI1 is the second most predictive TF in the
model for the first TSS set, but it shows only a low relative importance in the model for the
second TSS set. Thus, there might exist distinct regulatory mechanisms between the first and
the other TSSs as suggested in (Davuluri et al. 2008; Wray et al. 2003).
Correlation of differential gene expression with differential TF binding
TF binding is regulated in a cell-type specific manner, so we expect that in two different cell
lines, differential TF binding should be correlated with differential TSS expression. We
investigated this hypothesis using the data in K562 and GM12878, which were derived from
erythroleukemia cells and normal lymphoblastoid cells, respectively. We selected promoters
with more than four-fold expression difference between the two cell lines and constructed a
K562-specific model (K-model) and a GM12878-specific model (G-model) (use 22 shared
TFs in both models). When applied to whole cell Poly A+ RNA expression data, the K-model
explains 55% of the variance in expression level of promoters in K562, but only 16% of the
variance in GM12878 (Figure 5A). Similarly, the G-model accounts for much more variance
of expression in GM12878 (49%) than in K562 (34%). Moreover, TFs exhibit different
relative importance in the two cell lines. For example, SP1 shows relatively stronger effect on
gene expression in GM12878, whereas MAX and ETS1 have stronger effect in K562 (Figure
5C).
We next examined the effectiveness of predicting differential expression based on differential
binding of TFs in promoter regions. The binding differences (log2) in K562 versus GM12878
were calculated for 22 TFs for which the ChIP-seq data were available in both cell lines. A
model using those differences as predictors explains 53% of the variance in expression
differences (log2 ratios) of TSSs between K562 and GM12878 (whole cell Poly A+ RNA
extraction) (Figure 5B). We also explored the relative importance of TFs in the differential
expression model. Interestingly, we find that the TFs important for differential expression (e.g
YY1) are in general those that are important in both the K-model and the G-model. TFs with
higher RI scores in only one cell line (e.g. SP1, MAX and ETS1) show quite limited
contributions to predicting differential expression of promoters (Figure 5C).
In addition to the regression models, we also constructed classification models. Specifically,
we selected 4,493 K562 specific (log2(K562/GM12878)>2) and 8,183 GM12878 specific
(log2(GM12878/K562)>2) TSSs, and examined the capability of each individual TF for
discriminating these two TSS categories (using the TF as the single classifier). As shown in
Figure 5D, all of these TFs can classify the two TSS categories, with YY1 achieving the
highest classification accuracy (AUC=0.86). Similar results were achieved when different
thresholds were used to select K562 and GM12878 specific TSSs.

7
Relationship between histone modifications and TF binding signals
We have previously shown that both TF binding and histone modification are predictive of
expression levels of genes (Cheng and Gerstein 2011; Cheng et al. 2011b). In fact, at
promoter regions TF binding signals and histone modification signals are highly correlated.
Active genes are generally bound by transcriptional activators in their promoters, and
associated with strong signals of active histone marks in their promoters and gene bodies. We
thus quantified the relationship between histone modifications and TF binding signals using
the predictive models. We find that histone modification can be predicted accurately by the
binding signals of TFs at the TSS regions. As shown in Figure 6, the TF binding signal at the
TSS of genes can predict H3K4me3 signals around the TSS with very high accuracy (R2=
0.85). It is also highly predictive of the signals of other histone marks, such as H3K9ac and
H3K79me3 (see Supplementary Figure S3). More interestingly, the TF binding signals can
predict the patterns of histone marks, i.e. the positions where they are located. For example,
the best prediction accuracy was achieved right at the TSS for H3K4me3, which is known to
be a mark for active promoters (Koch et al. 2007). In contrast, high predictive accuracy was
obtained at the TSS and in the transcribed region of genes for H3K36me3, which is a histone
mark for the gene body (Kolasinska-Zwierz et al. 2009). The relative importance of TFs is
different for predicting different histone modification types, but MAX, YY1, ETS1 and E2F6
are generally the most informative ones (see Supplementary Figure S4 and Supplementary
Table S3).
Interplay between TF binding and other chromatin features for regulating gene
expression
The expression levels of promoters are strongly correlated with the local chromatin structure
around the promoter regions. On one hand, chromatin structure is largely determined by
nucleosome density (Lee et al. 2007) and histone modifications (Kouzarides 2007), which are
in turn influenced by TFs (Narlikar et al. 2002). On the other hand, chromatin structure
influences accessibility of the underlying DNA to TFs (Li et al. 2007). The chromatin
structure of DNA can be captured by two technologies: DNase hypersensitivity (Follows et al.
2006; Sabo et al. 2006) and Formaldehyde-Assisted Isolation of Regulatory Elements (FAIRE)
experiments (Giresi et al. 2007). We thus applied models to investigate the relationships
between gene expression and TF binding (including both TFSSs and TFNSs), histone
modifications, DNase and FAIRE data generated by ENCODE. Given the TFSS binding data
and another chromatin feature X (where X can be histone modification, general TF binding,
DNase, FAIRE, or nucleosome occupancy data), we constructed five models to calculate the
fractions of variance of promoter expression levels (R2) explained by TFSS binding data
alone (TFSS model), X data alone (X model), a combination of TFSS binding and X data
(TFSS+X model), the additional variance explained by TFSS binding data after considering
the X data (TFSS|X model), and the additional variances explained by X data after
considering the TFSS binding data (X|TFSS model) (Figure 7 and Supplementary Table S4).
The binding data of sequence specific TFs and general TFs (Pol II, TATA-binding proteins
etc) account for at least 74% of the variance in gene expression levels (the TFSS+TFNS
model). The remaining variance of gene expression levels (26%) is mainly determined by
post-transcriptional regulation. General TFs alone account for 73% of variance (the TFNS
model), and explain 8% additional variance after considering the sequence specific TF
binding data (the TFNS|TFSS model). This 8% additional variance is basically what is
regulated at the transcriptional level but not captured by the binding data of those 40 TFSSs in
the TFSS model, e.g. distal regulation by enhancers and regulation contributed by other
factors. After taking into account general TF binding, the additional variance contributed by
TFSS binding (the TFSS|TFNS model) is very limited (3%).

8
After considering the histone modification data, binding of TFSS accounts for a further 13%
of additional variance in gene expression levels (the TFSS|HM model), and 8% vice versa
(the HM|TFSS model). This suggests that the contributions of TFSS binding and histone
modification to aggregate expression of TSS are highly but not completely redundant. Each
provides extra information that is not accounted for by the other. We note that here we only
use histone modification signals at the TSS regions (100bp). Since histone modifications
affect a broad region around genes, the actual variance that can be explained by the HM
model should be even larger (Cheng et al. 2011b; Dong et al. 2012).
The additional variance explained by TFSS binding data after considering the data of DNase
(the TFSS|Dnase model), FAIRE (the TFSS|FAIRE model) and nucleosome occupancy (the
TFSS|Nucleosome model) are 16, 23 and 37%, respectively. In contrast, after taking into
account the TFSS binding data, the additional variance further explained by these other
chromatin features are negligible (<1%), and including them in a model cannot further
improve the prediction accuracy for TSS expression. In fact, a combined model including all
these five categories of features leads to an accuracy of R2=0.74.
Discussion
TFs and histone modifications are two critical factors that coordinately regulate gene
transcription. The regulatory mechanisms of these and other factors are summarized in Figure
8. First, TFs and histone modifications can regulate the initiation of transcription by
interacting with RNA polymerase and other general TFs and recruiting them to the TSS (see
points 5,6,7, and 8 in Figure 8), or by changing the accessibility of promoters to them via
modulating chromatin structure (see points 3 and 4 in Figure 8) (Li et al. 2007; Mitchell and
Tjian 1989). This regulation is achieved with the assistance of chromatin modifiers and other
chromatin- associated proteins, e.g. proteins that specifically recognize and bind modified
histones (Kouzarides 2007). For these reasons, TF binding data, histone modification data,
and the data that capture local chromatin structure (e.g. DNase and FAIRE) are all predictive
of the expression levels of genes (Figure 7). Second, these factors are inter-related and
coordinately participate in transcriptional regulation. For example, TFs such as YY1 can
influence histone modifications by recruiting histone modifiers to a DNA region (Yang et al.
1997); and conversely, histone modifications can affect TF binding by directly recruiting
them or indirectly by changing the accessibility of DNA regions to them (Li et al. 2007). As a
consequence, TF binding and histone modification signals are often highly correlated in TSS
proximal regions. Due to this high coordination, they share a similar amount of information
for ‘predicting’ gene expression levels (Cheng and Gerstein 2011); i.e., they are redundant.
Third, the transcription status of genes can in turn affect the TF binding and histone
modifications by interacting with TFs and histone modifiers (Okitsu et al. 2010). A recent
study shows that TAF3, the TBP-associated core promoter factor, interact with CTCF to form
DNA loops that connect core promoters with promoter-distal sites, implying that general TFs
might be regulate chromatin structure of distal regions (Liu et al. 2011). This feedback
complicates the cause and effect relationship between TF binding, histone modifications and
gene expression. Taken together with previous studies, our analysis reveals a highly
coordinated system for regulation of gene expression that consists of TFs, histone
modifications, RNA Polymerase and other chromatin-related proteins.
In previous studies, it has been shown that TF binding and histone modifications are
predictive of expression levels of mRNA transcripts measured by RNA-seq or microarrays
(Cheng and Gerstein 2011; Ouyang et al. 2009). These studies also showed that expression
levels from RNA-seq could be more accurately predicted than those from microarrays,
indicating the higher precision of the former. In eukaryotes, many genes have multiple
9
transcripts, which might start from different TSS. Technically, it is often difficult to quantify
precisely the expression level of each transcript by RNA-seq or microarray. We overcame this
problem in this study by focusing on TSS regions, relating TF binding signal around TSS
with expression levels of TSS. CAGE is by nature the technology to quantify expression
levels of TSS. For RNA-PET and RNA-seq data, we also calculate the TSS expression levels
by focusing on TSS proximal regions. Overall, at the TSS level we obtained higher predictive
accuracy compared to those models for predicting expression of transcripts. Our results also
suggest that CAGE can best capture the expression levels of TSS. In addition, the accuracy of
TSS expression quantification is also dependent on the RNA-extraction protocol being used,
with highest performance achieved in Poly A+ RNA. For RNA-seq data the expression levels
for TSS and transcript are both available, and we find that the TF models can predict
transcript expression with a slightly higher accuracy than TSS expression (Supplementary
Table S5). This indicates that RNA-seq, unlike CAGE, more accurately quantifies the
expression levels for transcripts than for TSSs.
TF binding signals used in the TF models capture regulatory information at the transcriptional
level. Gene expression levels, however, are also determined by post-transcriptional factors
like mRNA degradation. It is therefore more difficult for the TF model to predict the
expression levels of genes that are regulated strongly at the post-transcriptional level. We
performed gene ontology (GO) analysis on poorly predicted genes (i.e. genes with the largest
residuals in the TF model). We find significant enrichment for some GO categories, e.g.
involvement in cell cycle control (Supplementary Table S6). In addition, TSSs whose
expression levels are underestimated by the TF model (
y ) y ) tend to have higher expression
variance across different cell lines.
We have previously shown that the histone modification model for gene expression prediction
is tissue specific (Cheng and Gerstein 2011). In this work, we show that the TF model is also
tissue specific, or more precisely cell line specific (Figure 5A). The best prediction accuracy
is achieved when the TF binding data and TSS expression data from the same cell line are
used. Note that to predict the expression in a cell line, we always use the TF binding data
from the same cell line, although the model might be trained from the other cell line. Thus the
higher performance of the model in the matched cell line is not caused by differential TF
binding; instead, it reflects the different regulatory mechanisms between K562 and GM12878.
In addition, TFs show different relative importance in different cell lines. A TF might be
active and exhibit significant influence on gene expression in K562, but inactive with little
effect on gene expression in GM12878. For example, SP1 shows relatively stronger effect on
gene expression in GM12878 than in K562, while MAX and ETS1 show the opposite trend.
Conventionally, TF binding is often regarded as an on/off event. However, Figure 5B shows
that the differential expression of TSS can be precisely reflected by the difference of TF
binding signals between two cell lines. This suggests that a quantitative way of TF binding
should be used for studying the TF-gene regulatory relationship (Biggin 2011; Cheng et al.
2011a).
Based on normalized CpG content, TSSs can be categorized into HCPs and LCPs. TSSs in
the former class tend to have higher expression levels. Our results show that the expression
levels of HCPs can be more accurately predicted than those of LCPs by TF binding signals.
We also find that the relative importance of some TFs is different between HCPs and LCPs.
Methylation of CpG sites around TSS can represent another mechanism of gene expression
regulation. In fact, it has been shown that binding of E2F factors was affected by the
methylation status of their binding sites (Campanero et al. 2000; Landolin et al. 2010). Thus,
the difference between the HCP model and the LCP model might reflect cooperation between
TF binding and DNA methylation for transcriptional regulation.
10
The first TSS of a gene might be recognized in a different way from the other TSSs by the
transcriptional machinery. For instance, it might recognize different TSSs independently, or
alternatively, it tends to recognize the most upstream TSS but skip it in certain frequency to
initiate transcription at a downstream TSS. A recent study of the glucocorticoid (GR) and
estrogen (ER) nuclear receptors (Voss et al. 2011) found that GR is a “driver” TF, while ER
is a “passenger” TF that benefits from “assisted loading” from GR. It was posited that driver
TFs bind to closed but breathing chromatin and recruits chromatin remodeling factors to open
the chromatin fully. Passenger TFs only bind to chromatin that has been opened already by
driver TFs or some other chromatin remodeling mechanism, so they benefit from assisted
loading. In our study of the first and second TSS of genes, we were better able to model the
second TSS from TF binding data. We also found that YY1 best predicts expression of the set
of first TSS. It is known that YY1 can recruit chromatin remodeling factors as expected from
a driver TF (Yang et al. 1997). These facts lead us to postulate that, for most genes, driver
TFs bind to the first TSS and recruit chromatin remodelers, which then open the chromatin
around the second TSS. This hypothesis can explain the relative predictive power of our
models: when a passenger TF binds near the second TSS, its power to predict second TSS
expression is boosted by the fact that chromatin remodeling has already occurred near the first
TSS. Likewise, some of the predictive power of TF binding at the first TSS goes to predict
transcription of the second TSS.
We show here that TF binding is highly predictive of gene expression levels using human
ENCODE data, and we have previously shown the same using mouse data (Cheng and
Gerstein 2011). In yeast several studies have been performed to relate gene expression with
motif existence, TF-DNA binding data or histone modification data (Kurdistani et al. 2004;
Yuan et al. 2006). For example, Yuan et al. constructed a linear regression model to predict
transcription rates of yeast genes (Yuan et al. 2006). They showed that three types of histone
acetylations alone accounted for 18% of the variance (R2=0.18) of transcription rates, and the
R2 increased to 33% if TF binding motif and nucleosome occupancy data were also included
in the model. Furthermore, Li et al. showed in another study that TF binding was predictive of
intrinsic expression noise of yeast genes, indicating that TF binding impacts not only the
levels but also the fluctuation of gene expression (Li et al. 2010). In addition, many other
studies focused on identifying regulatory motifs or TFs underlying a biological process via
combining expression data with TF binding data or sequence motif analysis (Conlon et al.
2003; Li and Zhan 2008; Tsai et al. 2005; Yu et al. 2003). In the future, with more data
available, it would be more practical to perform similar analysis in higher organisms.
Methods
Data processing All of the data used in this work were generated by the ENCODE project. The expression
data of GENCODE TSSs were produced using three different technologies (CAGE, RNA-
PET, and RNA-seq). The data include a total of 267 expression profiles, representing
expression profiles for RNA samples in 12 different cell lines extracted from 6 different
cellular components (whole cell, cytosolic, nuclear and nuclear sub-compartments, namely
chromatin, nucleoplasm and nucleolus) using 4 different protocols (Poly A+, Poly A-, total,
and short RNA). Note that the samples are not evenly collected from different cell lines; a
large fraction of them are from K562 and GM12878. To facilitate the comparison of data
from different technologies, the RNA sequencing data were processed to obtain expression
levels of the TSSs (Lassmann and Carninci 2012). The RNA-PET expression of a TSS is
defined as the total number of 5’ tags within a 101 bp window centered on the TSS. For
RNA-seq experiments, the expression level of a TSS is calculated as the sum of expression
levels of all transcripts initiated from it. TSS expression levels are normalized and represented
as RPM (reads per million) for CAGE, RNA-PET and short RNA-seq data, or RPKM (reads
per kilobase per million) for long RNA-seq (Poly A+, Poly A- and total RNA) data. The
11
expression levels of transcripts (based on GENCODE v7 annotation) were measured as
RPKM and calculated using the software FLUX CAPACITOR.
The genome-wide TF binding data were obtained from ChIP-seq experiments. The data
include >400 binding profiles, representing the binding of >120 TFs and chromatin factors in
many different cell lines. Again, the most complete data were available from K562 and
GM12878. We calculated the binding strengths of each TF at all of the GENCODE TSSs.
Specifically, we calculated and averaged the number of reads covering a 100bp DNA region
centering on each TSS, resulting in the binding signal for this TSS. We choose the 100bp
region for two reasons: (1) we have previously shown that TF binding signals in a narrowed
DNA region around TSS achieves the highest prediction accuracy; (2) for genes with multiple
TSSs the average distance between the first and the second TSSs is approximately 200bp. In
fact, when we increased the window size from 100 to 300, 500 until 1500bp, we observed a
gradual decrease of predictive accuracy by the TF model (Supplementary Figure S5).
The other datasets, including histone modification, DNase I hypersensitivity, FAIRE and
nucleosome occupation, were also generated by the ENCODE project using high-throughput
sequencing technologies. The data were processed in the same way as for the TF binding data.
The human promoters/TSSs were annotated by the GENCODE project, version 7 (Harrow et
al. 2012). In this work, we focus our analysis on ~130,000 high confidence TSSs.
Categorization of DNA binding proteins
In this work, we mainly focus on using sequence specific TFs for predicting the expression
levels of promoters. In some cases, however, the model was extended to general TFs and
other DNA binding proteins. Basically, we categorized the DNA binding proteins with ChIP-
seq data available into 6 categories: sequence specific TFs (TFSS), general or non-specific
TFs (TFNS), chromatin structure factors (ChromStr), chromatin remodeling factors
(ChromRem), histone methyltransferases (HISase) and Pol3-associated factors (Pol3F)
Models for predicting TSS expression levels
To understand the relationship between TF binding signals and the expression levels of
promoters, we constructed predictive models based on 4 different machine-learning methods:
RF (random forest), MARS (multivariate adaptive regression splines), SVR (support vector
regression) and MLR (multivariate linear regression). In these models, the binding signals
(the average read coverage at each nucleotide) in a particular bin (e.g. the 100-bp bin at the
TSS) for a set of TFs (e.g. sequence specific TFs) were used as the predictors to predict the
response variable Y (i.e. the expression levels of promoters). The promoter expression levels
are distributed over an exponential range, so to stabilize variance we use log2-transformed
values as the response variable with 0.03 as pseudo-count.
To evaluate the performance of the predictive models, we randomly selected 2000 promoters
as the training data and the remaining as the test data. A model was trained on the training
data and applied to predicting the expression levels of promoters in the test data (
?Y i). The
predictive accuracy of the model can be measured by the correlation (R) between the
predicted values (
?Y i) and the actual experimental expression levels (Yi). Predictive accuracy
can also be measured by the coefficient of determination (R2), the fraction of variance of gene
expression explained by the model, which is defined as follows

12
R2 1(y i ?y i)
2
i(y i y )2
i
, where
y is the mean gene expression level.
For each model, we generated 10 groups of training and test data, and averaged the resulting
R or R2 as the predictive accuracy. The variation of R/ R
2 is low, indicating that the training
dataset with 2000 promoters is large enough to achieve stable predictions.
To estimate the predictive power of an individual TF, we predicted the expression levels
using a SVR model with the binding signal of the TF as the single predictor. It is also
informative to show the relative contribution of each predictor in a model with multiple
predictors. We use the “%IncMSE” (increase of mean squared error) calculated from the
Random Forest method to represent the relative importance (RI) of TFs. Specifically, the
values of each TF of the test data were permuted and the prediction error (mean squared error
of all genes) in the test data was re-calculated using the original model. Compared to the un-
permuted data, permutation of a TF will in general result in increase of prediction error. Such
an increase (i.e. %IncMSE) is used as a measurement of relative importance of a TF in the
model (Breiman 2001). A TF with higher IncMSE value relative to other TFs in the model
has higher importance for predicting gene expression level.
The R packages “randomForest”, “earth” and “e1071” were utilized to implement these
models (CRAN 2011).
Models for predicting differential gene expression
In the differential gene expression model, the response variable ‘Y’ was calculated as the log2
ratio of the expression levels in K562 versus GM12878 (log2 K562/GM12878); and the
predictors ‘Xs’ were calculated as the log ratio of binding signals between the two cell lines.
The predictors in this model are 22 TFs for which the binding data are available for both the
K562 and GM12878 cell lines. The pseudo-count (0.03) was used during the calculation to
avoid extreme values caused by small expression levels. The same approaches as described in
the preceding section were used for evaluating model performance and calculating relative
importance of TFs.
Classification of promoters specific to K562 and GM12878
In addition to the regression models, we also constructed classification models to examine the
effectiveness of classifying individual TSS as either K562-specific or GM12878-specific
TSSs based on the strength of TF binding signals. We first identified K562-specific and
GM12878-specific TSSs according to their expression in Poly A+ RNA extracted from whole
cells. Promoters expressed with >4 fold higher levels in one cell line versus the other were
defined as cell-type specific TSSs. We constructed models using RF and SVM (support
vector machine) to classify the two types of TSSs. The classification accuracy was measured
by the AUC (Area Under the ROC curve) in the cross-validation data, where the ROC curve
(receiver operating characteristic) is a graphic plot of the sensitivity versus 1-specificity. The
AUC takes a value within [0, 1], with a greater value indicating higher performance of a
classification model.
Models for predicting histone modifications
We also constructed models to predict histone modification signal at different positions
relative to the TSS by using the TF binding signal in 100bp bins around the TSS as the
predictors. With these models, we examined the power of TF binding signals for inferring
histone modification signals of 12 different types, including H3K4me1, H3K4me2, H3K4me3,
H3K36me3, H3K9me1, H3K9me3, H3K27me3, H4K20me1, H3K79me2, H3K9ac, H3K27ac
13
and H2az. The DNA regions around TSS ([-4kb, 4kb]) were divided into 80 bins, each of
100bp in size. For each bin the histone modification signals associated with promoters were
examined by the models. In these models the response variable Y (histone modification signal)
was log2 transformed.
Models for understanding the relationships of different chromatin features
The expression levels of promoters are correlated with chromatin structure, which is
influenced by histone modifications, nucleosome occupancy, and TF binding. Chromatin
structure can also be captured by DNase I hypersensitivity and FAIRE data. Thus, all of these
chromatin features are predictive of the expression levels of promoters. Using the ENCODE
data, we investigated the relationship of five groups of chromatin features (general TF
binding, histone modification, Nucleosome occupancy, DNase I hypersensitity, and FAIRE
signals with the TFSS binding features in the context of predicting gene expression levels.
For each group X, we constructed five different models. Three of the models use chromatin
features in the group X (the X model), the binding signals of TFSS (the TFSS model), or a
combination of them (the TFSS+X model) as the predictors, respectively. In the remaining
two models, we examined the predictive power of features in X after considering the TFSS
binding signals (the X|TFSS model), and vice versa (the TFSS|X model). Specifically, for the
X|TFSS model, we first predicted the expression levels of promoters (
?Y ) based on the
binding signals, and then use the features in X to predict the residuals (
Y ?Y ). We calculated
the R2 for each of the five models. The R2 of the X|TFSS model indicates the additional
variance explained by the chromatin features in group X after already taking into account the
TFSS binding signal.
Calculation of normalized CpG content
We calculated the normalized CpG content of all GENCODE promoters in 2kb DNA regions
centered around their TSSs using the method described in Saxonov et al (Saxonov et al. 2006).
Briefly, the normalized CpG content is calculated by dividing the observed number of CpG
dinucleotides by the expected number in a promoter. Normalized CpG contents for promoters
followed a bimodal distribution (Figure 3A). Setting the cutoff value between low and high
normalized CpG to 0.4 best separated the two peaks in the distribution. Promoters with a
normalized CpG content above the cut-off value were classified as high CpG content
promoters (HCP), and the remaining promoters were classified as low CpG content promoters
(LCP). Approximately, the normalized CpG content reflects the existence of CpG island
nearby a TSS or not (e.g. many HCPs are located nearby a CpG island). It considers the CpG
enrichment in the DNA regions centering directly on the TSS, and thereby is more practical
than the CpG island based method for classifying promoters.
Data Access All data are publicly available on the UCSC genome browser
(http://genome.ucsc.edu/ENCODE/downloads.html).
Acknowledgments
We thank the ENCODE consortium for the rich data and insightful discussions. We also
thank Dr. Anshul Kundaje and Dr. Ben Brown for valuable comments and suggestions. We
acknowledge support from the NIH and from the AL Williams Professorship funds.
References:
14
Babu, M.M., N.M. Luscombe, L. Aravind, M. Gerstein, and S.A. Teichmann. 2004. Structure and evolution of transcriptional regulatory networks. Curr Opin Struct Biol 14: 283-291.
Biggin, M.D. 2011. Animal transcription networks as highly connected, quantitative continua. Dev Cell 21: 611-626.
Breiman, L. 2001. Random Forests. Machine Learning 45: 5-32. Campanero, M.R., M.I. Armstrong, and E.K. Flemington. 2000. CpG methylation as a
mechanism for the regulation of E2F activity. Proc Natl Acad Sci U S A 97: 6481-6486.
Cheng, C. and M. Gerstein. 2011. Modeling the relative relationship of transcription factor binding and histone modifications to gene expression levels in mouse embryonic stem cells. Nucleic Acids Res.
Cheng, C., R. Min, and M. Gerstein. 2011a. TIP: A probabilistic method for identifying transcription factor target genes from ChIP-seq binding profiles. Bioinformatics 27: 3221-3227.
Cheng, C., K.K. Yan, K.Y. Yip, J. Rozowsky, R. Alexander, C. Shou, and M. Gerstein. 2011b. A statistical framework for modeling gene expression using chromatin features and application to modENCODE datasets. Genome Biol 12: R15.
Conlon, E.M., X.S. Liu, J.D. Lieb, and J.S. Liu. 2003. Integrating regulatory motif discovery and genome-wide expression analysis. Proc Natl Acad Sci U S A 100: 3339-3344.
CRAN. 2011. R: A Language and Environment for Statistical Computing, pp. {R Development Core Team}.
Davuluri, R.V., Y. Suzuki, S. Sugano, C. Plass, and T.H. Huang. 2008. The functional consequences of alternative promoter use in mammalian genomes. Trends Genet 24: 167-177.
Deaton, A.M. and A. Bird. 2011. CpG islands and the regulation of transcription. Genes Dev 25: 1010-1022.
Dong, X., M. Greven, A. Kundaje, S. Djebali, B.J. Brown, C. Cheng, M. Gerstein, G.R. Serra, E. Birney, and Z. Weng. 2012. Correlating histone modifications and gene expression. Genome Res Submitted.
Follows, G.A., P. Dhami, B. Gottgens, A.W. Bruce, P.J. Campbell, S.C. Dillon, A.M. Smith, C. Koch, I.J. Donaldson, M.A. Scott et al. 2006. Identifying gene regulatory elements by genomic microarray mapping of DNaseI hypersensitive sites. Genome Res 16: 1310-1319.
Gerstein, B.M., A. Kundaje, M. Hariharan, G.S. Landt, K. Yan, C. Cheng, J.X. Mu, E. Khurana, J. Rozowsky, R. Alexander et al. 2012. Analysis of the Human Regulatory Code and Network using ENCODE Data. Nature.
Giresi, P.G., J. Kim, R.M. McDaniell, V.R. Iyer, and J.D. Lieb. 2007. FAIRE (Formaldehyde-Assisted Isolation of Regulatory Elements) isolates active regulatory elements from human chromatin. Genome Res 17: 877-885.
Harrow, J., A. Frankish, M.J. Gonzalez, E. Tapanari, M. Diekhans, F. Kokocinski, B. Aken, D. Barrell, A. Zadissa, S. Searle et al. 2012. GENCODE: The reference human genome annotation for the ENCODE project. submitted.
Johnson, D.S., A. Mortazavi, R.M. Myers, and B. Wold. 2007. Genome-wide mapping of in vivo protein-DNA interactions. Science 316: 1497-1502.
Kadonaga, J.T. 2004. Regulation of RNA polymerase II transcription by sequence-specific DNA binding factors. Cell 116: 247-257.
Koch, C.M., R.M. Andrews, P. Flicek, S.C. Dillon, U. Karaoz, G.K. Clelland, S. Wilcox, D.M. Beare, J.C. Fowler, P. Couttet et al. 2007. The landscape of histone modifications across 1% of the human genome in five human cell lines. Genome Res 17: 691-707.
Kolasinska-Zwierz, P., T. Down, I. Latorre, T. Liu, X.S. Liu, and J. Ahringer. 2009. Differential chromatin marking of introns and expressed exons by H3K36me3. Nat Genet 41: 376-381.
15
Kornberg, R.D. 2007. The molecular basis of eukaryotic transcription. Proc Natl Acad Sci U S A 104: 12955-12961.
Kouzarides, T. 2007. Chromatin modifications and their function. Cell 128: 693-705. Kurdistani, S.K., S. Tavazoie, and M. Grunstein. 2004. Mapping global histone acetylation
patterns to gene expression. Cell 117: 721-733. Landolin, J.M., D.S. Johnson, N.D. Trinklein, S.F. Aldred, C. Medina, H. Shulha, Z. Weng, and
R.M. Myers. 2010. Sequence features that drive human promoter function and tissue specificity. Genome Res 20: 890-898.
Lassmann, T. and P. Carninci. 2012. Cage analysis of cell compartments specific coding and non-coding RNA. submitted.
Lee, T.I. and R.A. Young. 2000. Transcription of eukaryotic protein-coding genes. Annu Rev Genet 34: 77-137.
Lee, W., D. Tillo, N. Bray, R.H. Morse, R.W. Davis, T.R. Hughes, and C. Nislow. 2007. A high-resolution atlas of nucleosome occupancy in yeast. Nat Genet 39: 1235-1244.
Li, B., M. Carey, and J.L. Workman. 2007. The role of chromatin during transcription. Cell 128: 707-719.
Li, H. and M. Zhan. 2008. Unraveling transcriptional regulatory programs by integrative analysis of microarray and transcription factor binding data. Bioinformatics 24: 1874-1880.
Li, J., R. Min, F.J. Vizeacoumar, K. Jin, X. Xin, and Z. Zhang. 2010. Exploiting the determinants of stochastic gene expression in Saccharomyces cerevisiae for genome-wide prediction of expression noise. Proc Natl Acad Sci U S A 107: 10472-10477.
Lickwar, C.R., F. Mueller, S.E. Hanlon, J.G. McNally, and J.D. Lieb. 2012. Genome-wide protein-DNA binding dynamics suggest a molecular clutch for transcription factor function. Nature 484: 251-255.
Liu, Z., D.R. Scannell, M.B. Eisen, and R. Tjian. 2011. Control of embryonic stem cell lineage commitment by core promoter factor, TAF3. Cell 146: 720-731.
Luo, J.O., J.M. Fullwood, Y.J. Koh, L. Veeravalli, S. Djebali, R. Guigo, C. Davis, T. Gingeras, A. Shahab, Y. Ruan et al. 2012. RNA-PET for accurate delineation of transcriptional units and gene fusion events submitted.
Mitchell, P.J. and R. Tjian. 1989. Transcriptional regulation in mammalian cells by sequence-specific DNA binding proteins. Science 245: 371-378.
Narlikar, G.J., H.Y. Fan, and R.E. Kingston. 2002. Cooperation between complexes that regulate chromatin structure and transcription. Cell 108: 475-487.
Okitsu, C.Y., J.C. Hsieh, and C.L. Hsieh. 2010. Transcriptional activity affects the H3K4me3 level and distribution in the coding region. Mol Cell Biol 30: 2933-2946.
Ouyang, Z., Q. Zhou, and W.H. Wong. 2009. ChIP-Seq of transcription factors predicts absolute and differential gene expression in embryonic stem cells. Proc Natl Acad Sci U S A 106: 21521-21526.
Pai, A.A., J.T. Bell, J.C. Marioni, J.K. Pritchard, and Y. Gilad. 2011. A genome-wide study of DNA methylation patterns and gene expression levels in multiple human and chimpanzee tissues. PLoS Genet 7: e1001316.
Ren, B., F. Robert, J.J. Wyrick, O. Aparicio, E.G. Jennings, I. Simon, J. Zeitlinger, J. Schreiber, N. Hannett, E. Kanin et al. 2000. Genome-wide location and function of DNA binding proteins. Science 290: 2306-2309.
Ruan, Y., H.S. Ooi, S.W. Choo, K.P. Chiu, X.D. Zhao, K.G. Srinivasan, F. Yao, C.Y. Choo, J. Liu, P. Ariyaratne et al. 2007. Fusion transcripts and transcribed retrotransposed loci discovered through comprehensive transcriptome analysis using Paired-End diTags (PETs). Genome Res 17: 828-838.
16
Sabo, P.J., M.S. Kuehn, R. Thurman, B.E. Johnson, E.M. Johnson, H. Cao, M. Yu, E. Rosenzweig, J. Goldy, A. Haydock et al. 2006. Genome-scale mapping of DNase I sensitivity in vivo using tiling DNA microarrays. Nat Methods 3: 511-518.
Saxonov, S., P. Berg, and D.L. Brutlag. 2006. A genome-wide analysis of CpG dinucleotides in the human genome distinguishes two distinct classes of promoters. Proc Natl Acad Sci U S A 103: 1412-1417.
Schena, M., D. Shalon, R.W. Davis, and P.O. Brown. 1995. Quantitative monitoring of gene expression patterns with a complementary DNA microarray. Science 270: 467-470.
Schoenherr, C.J. and D.J. Anderson. 1995. The neuron-restrictive silencer factor (NRSF): a coordinate repressor of multiple neuron-specific genes. Science 267: 1360-1363.
Shiraki, T., S. Kondo, S. Katayama, K. Waki, T. Kasukawa, H. Kawaji, R. Kodzius, A. Watahiki, M. Nakamura, T. Arakawa et al. 2003. Cap analysis gene expression for high-throughput analysis of transcriptional starting point and identification of promoter usage. Proc Natl Acad Sci U S A 100: 15776-15781.
Takahashi, K. and S. Yamanaka. 2006. Induction of pluripotent stem cells from mouse embryonic and adult fibroblast cultures by defined factors. Cell 126: 663-676.
The-ENCODE-Consortium. 2012. The ENCODE Consortium. Integrative Analysis of the Human Genome submitted.
Tsai, H.K., H.H. Lu, and W.H. Li. 2005. Statistical methods for identifying yeast cell cycle transcription factors. Proc Natl Acad Sci U S A 102: 13532-13537.
Vaquerizas, J.M., S.K. Kummerfeld, S.A. Teichmann, and N.M. Luscombe. 2009. A census of human transcription factors: function, expression and evolution. Nat Rev Genet 10: 252-263.
Voss, T.C., R.L. Schiltz, M.H. Sung, P.M. Yen, J.A. Stamatoyannopoulos, S.C. Biddie, T.A. Johnson, T.B. Miranda, S. John, and G.L. Hager. 2011. Dynamic exchange at regulatory elements during chromatin remodeling underlies assisted loading mechanism. Cell 146: 544-554.
Wang, Z., M. Gerstein, and M. Snyder. 2009. RNA-Seq: a revolutionary tool for transcriptomics. Nat Rev Genet 10: 57-63.
Wray, G.A., M.W. Hahn, E. Abouheif, J.P. Balhoff, M. Pizer, M.V. Rockman, and L.A. Romano. 2003. The evolution of transcriptional regulation in eukaryotes. Mol Biol Evol 20: 1377-1419.
Yang, W.M., Y.L. Yao, J.M. Sun, J.R. Davie, and E. Seto. 1997. Isolation and characterization of cDNAs corresponding to an additional member of the human histone deacetylase gene family. J Biol Chem 272: 28001-28007.
Yu, H., N.M. Luscombe, J. Qian, and M. Gerstein. 2003. Genomic analysis of gene expression relationships in transcriptional regulatory networks. Trends Genet 19: 422-427.
Yuan, G.C., P. Ma, W. Zhong, and J.S. Liu. 2006. Statistical assessment of the global regulatory role of histone acetylation in Saccharomyces cerevisiae. Genome Biol 7: R70.
17
Figure Captions
Figure 1: Accuracy of the TF model for predicting TSS expression levels. (A) Consistency of
predicted values with expression levels measured by CAGE in Poly A+ RNA samples
extracted from whole cells. (B) Comparison of predictive accuracies of the TF model for
expression data generated by three different technologies: CAGE, RNA-PET and RNASeq.
(C) Comparison of predictive accuracies of the TF model for expression data from three
different RNA extraction protocols: Poly A+, Poly A- and total RNA. (D) Comparison of
predictive accuracies of the TF model for expression data in different cellular components. In
(B-D), only data sets from K562 are used. The binding signals of 40 TFSSs are used as
predictors. HCP and LCP are high and low CpG content promoters, respectively. Separate
models are constructed for ALL, HCP and LCP categories.
Figure 2: The capabilities of different TFs to predict TSS expression level. (A) Comparison of
the predictive accuracies of individual DNA binding proteins in six different categories. “*”
indicates that the predictive powers of TFs in a corresponding category are significantly
different from those of the other TFs. (B) The predictive accuracy of using each individual
TFSS as the single predictor. (C) The relative importance of each TFSS in the Random Forest
model. The calculation is based on the CAGE expression data in Poly A+ RNA samples
extracted from K562 whole cells. Note that TFSS labels are shared by (B) and (C).
Figure 3: The relationship between promoter CpG content and expression level. (A) The
distribution of normalized CpG content for all human GENCODE TSSs. (B) The fraction of
expressed TSSs in HCPs and LCPs. (C) The distributions of expression levels of expressed
HCPs and LCPs. (D) The relative importance of each TF in the HCP- and LCP-specific
models. (E) The aggregated binding signals of E2F4 around the TSS of HCPs and LCPs. (F)
The predictive accuracies of HCP- and LCP-specific models using E2F4 as the single
predictors. (G) The Spearman correlation coefficients between normalized CpG content and
expression levels in different cell lines (CAGE data for Poly A+ RNA from whole cells). (H)
The accuracies of using normalized CpG content to classify expressed and nonexpressed
promoters in H1HESC and HEPG2. In (B-F), the CAGE expression data for RNA extracted
from K562 whole cells are used.
Figure 4: Comparison of accuracies of the TF model for predicting expression level of the
first and second TSS of genes. The binding signals of 40 TFSSs are used as the predictors and
only promoters from genes with at least two TSS are included in the models. The calculation
is based on expression data from K562. RNA-seq (s) and RNA-seq (o) represent RNA-seq
data using small-RNA extraction protocol and other protocols, respectively.
Figure 5: Cell line specificity of the TF model. (A) Models trained and tested on data from the
same cell line result in higher predictive accuracies. K Model and G Model represent models
trained with data from K562 and GM12878, respectively. (B) Consistency of predicted log2
fold changes with the experimentally measured differences between K562 and GM12878.
Differential binding of 22 TFs are used as the predictors in a predictive model of differential
expression. (C) The relative importance of TFs in K562- and GM12878-specific models as
well as the predictive model for differential expression. (D) The power of each individual TF
for classifying K562- and GM12878-specific promoters (log2 fold change >2). CAGE
expression data in Poly A+ RNA extracted from K562 and GM12878 whole cells were used
in the calculation.
Figure 6: The effectiveness of TF binding signals for predicting histone modification patterns
around the TSS of promoters. The binding signals of 40 TFSSs are used as the predictors.
Both the TF binding and the histone modification data are from K562.
18
Figure 7: The relationship of the TFSS binding data with five types of chromatin features for
predicting promoter expression. For each type of chromatin feature, we constructed five
models to calculate the fraction of variance of promoter expression levels explained by the
TFSS alone (TFSS), by each feature alone (X), by a combination of TFSS and feature X
(TFSS+X), as well as the additional variance explained by TFSS after taking feature X into
account (TFSS|X) and vice versa (X|TFSS). Feature X represents general transcription factors
(TFNS), histone modifications (HM), DNase signal, FAIRE signal, or nucleosome occupancy.
CAGE expression data in Poly A+ RNA extracted from K562 whole cells were used in the
calculation.
Figure 8: Regulatory mechanism of TF binding, histone modification and other chromatin
features on gene expression.

Figure1
Figure 1: Accuracy of the TF model for predicting the expression levels of promoters. (A)Consistency of predicted values with CAGE measured expression levels in Poly A+ RNA sampleextracted from the whole cells. (B) Comparison of predictive accuracies of the TF model forexpression data by three technologies: CAGE, diTAG and RNASeq. (C) Comparison of predictiveaccuraciesoftheTFmodelforexpressiondatafromthreedifferentRNAextractionprotocols:PolyA+,PolyAandtotalRNA.(D)Comparisonofpredictiveaccuraciesof theTFmodel forexpressiondata in different cellular components. In (BD), only data sets from K562 are used. The bindingsignalsof40TFSSsareusedaspredictors.HCPandLCParehighand lowCpGcontentpromoters,respectively.

Figure2
Figure 2: The Capabilities of different TFs for predict expression levels of promoters. (A)Comparison of the predictive accuracies of individual DNA binding protein in six differentcategories.(B)ThepredictiveaccuracyofusingeachindividualTFSSasthesinglepredictor.(C)TherelativeimportanceofeachTFSSintheRFbasedmodel.CalculationisbasedontheCAGEexpressiondatainPolyA+RNAsampleextractedfromtheK562wholecells.

Figure3
Figure 3: The relationship between CpG contents and expression levels of promoters. (A) Thedistribution normalized CpG content for all human Gencode promoters. (B) The fractions ofexpressedpromotersinHCPsandLCPs.(C)ThedistributionsofexpressionlevelsoftheexpressedHCPsandLCPs.(C)TherelativeimportanceofeachTFintheHCPandLCPspecificmodels.(E)TheaggregatedbindingsignalsofE2F4aroundtheTSSofHCPsandLCPs.(F)ThepredictiveaccuraciesofHCPandLCPspecificmodelsusingE2F4as thesinglepredictors. (G)TheSpearmancorrelationcoefficientsbetweennormalizedCpGcontentandexpressionlevelsindifferentcelllines(CAGEdataforPolyA+RNAfromwholecells). (H)TheaccuraciesofusingnormalizedCpGcontent toclassifyexpressedandnonexpressedpromotersinH1HESCandHEPG2.In(BF),theCAGEexpressiondataforRNAextractedfromK562wholecellsareused.
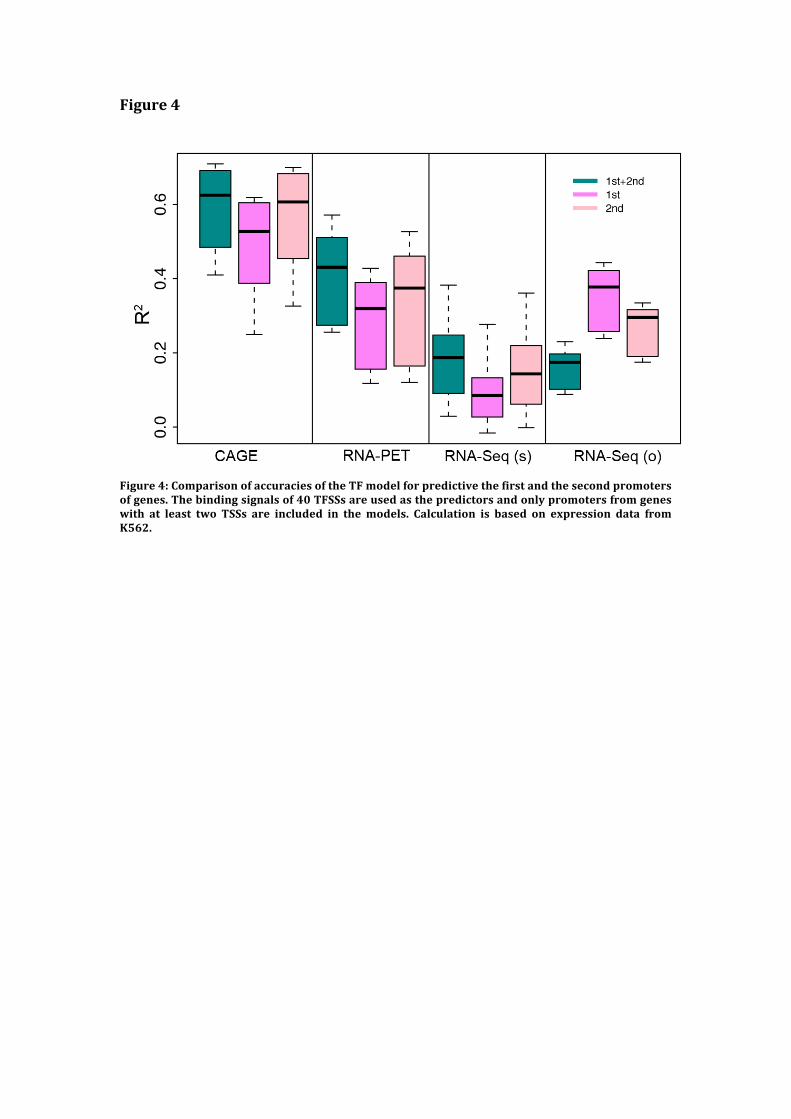
Figure4
Figure4:ComparisonofaccuraciesoftheTFmodelforpredictivethefirstandthesecondpromotersofgenes.Thebindingsignalsof40TFSSsareusedasthepredictorsandonlypromotersfromgeneswith at least two TSSs are included in themodels. Calculation is based on expression data fromK562.

Figure5
Figure5:Cell line specificityof theTFmodel. (A)Models trainedwithdata from thematchedcelllinesresultinhigherpredictiveaccuracies.KModelandGModelrepresentmodeltrainedwithdatain K562 and GM12878, respectively. (B) Consistency of predicted log2 fold changes with theexperimentalmeasureddifferencesbetweenK562andGM12878.Thedifferentialbindingof22TFsareusedasthepredictorsindifferentialexpressionpredictivemodel.(C)TherelativeimportanceofTFs inK562,GM12878specificmodelsaswellas thedifferentialexpressionpredictivemodel. (D)Thepower of each individualTF for classifyingK562 andGM12878 specific promoters (log2 foldchange >2). CAGE expression data in Poly A+ RNA extracted from the whole cells of K562 andGM12878areusedinthecalculation.

Figure6
Figure 6: The effectiveness of the TF binding signals for predicting histonemodification patternsaroundtheTSSofpromoters.Thebindingsignalsof40TFSSsareusedasthepredictors.BoththeTFbindingandthehistonemodificationdataarefromK562.

Figure7
Figure 7: The relationship of the TFSS binding data with five types of chromatin features forexpression prediction of promoters. For each type of chromatin features, we constructed fivemodelstocalculatedthefractionofvarianceofpromoterexpressionlevelsexplainedbytheTFSSsalone(T),bytheXfeaturesalone(X),byacombinationofTFSSsandXfeatures(T+X),aswellastheadditional variance explained by TFSSs after taking X features into account (T|X) and vice versa(X|T).TheCAGEexpressiondatainPolyA+RNAextractedfromtheK562wholecellsareusedinthecalculation.

Figure8
Figure8:Abiologicalmodeloftranscriptionalregulation.
Related Documents


![[VI]. Post-Transcriptional Processing and Post-Transcriptional Control of Gene Expression](https://static.cupdf.com/doc/110x72/56815a87550346895dc7f921/vi-post-transcriptional-processing-and-post-transcriptional-control-of-gene.jpg)