Understanding TOA flux variations A. E. Dessler Department of Atmospheric Sciences Texas A&M University Wednesday, April 27, 2011

Welcome message from author
This document is posted to help you gain knowledge. Please leave a comment to let me know what you think about it! Share it to your friends and learn new things together.
Transcript
Understanding TOA flux variations
A. E. DesslerDepartment of Atmospheric Sciences
Texas A&M University
Wednesday, April 27, 2011

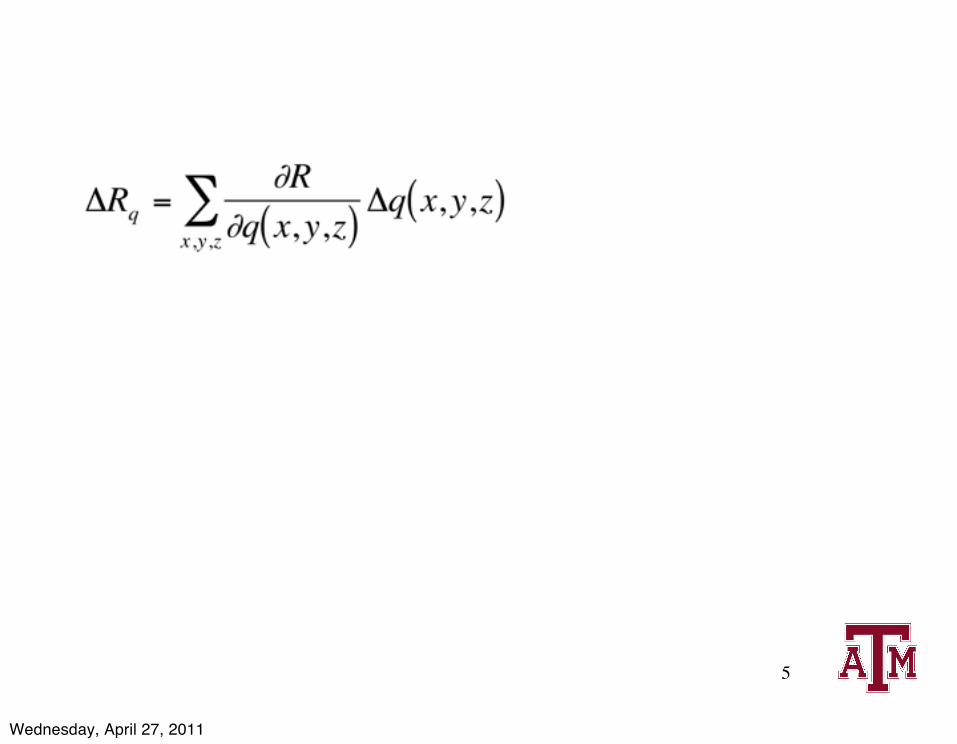
∆R
∆Ts
... to better understand climate sensitivity
e.g., Forster and Gregory, 2006; Lin et al., JQSRT, 2010; Murphy, 2010all fluxes in this analysis are downward positive
Wednesday, April 27, 2011
3
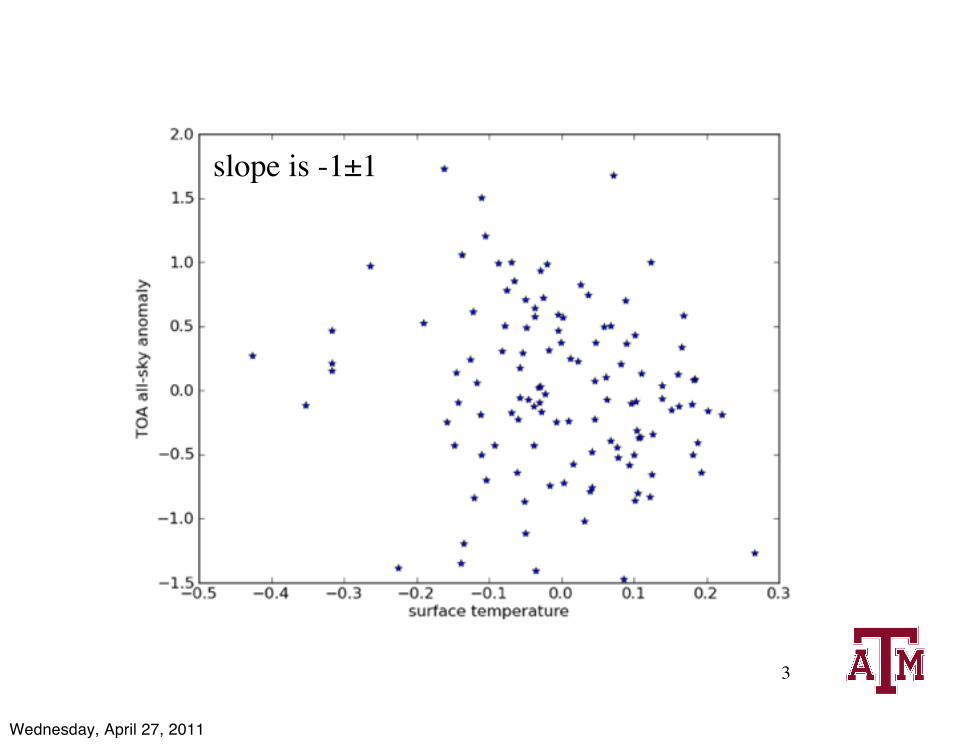
slope is -1±1
Wednesday, April 27, 2011
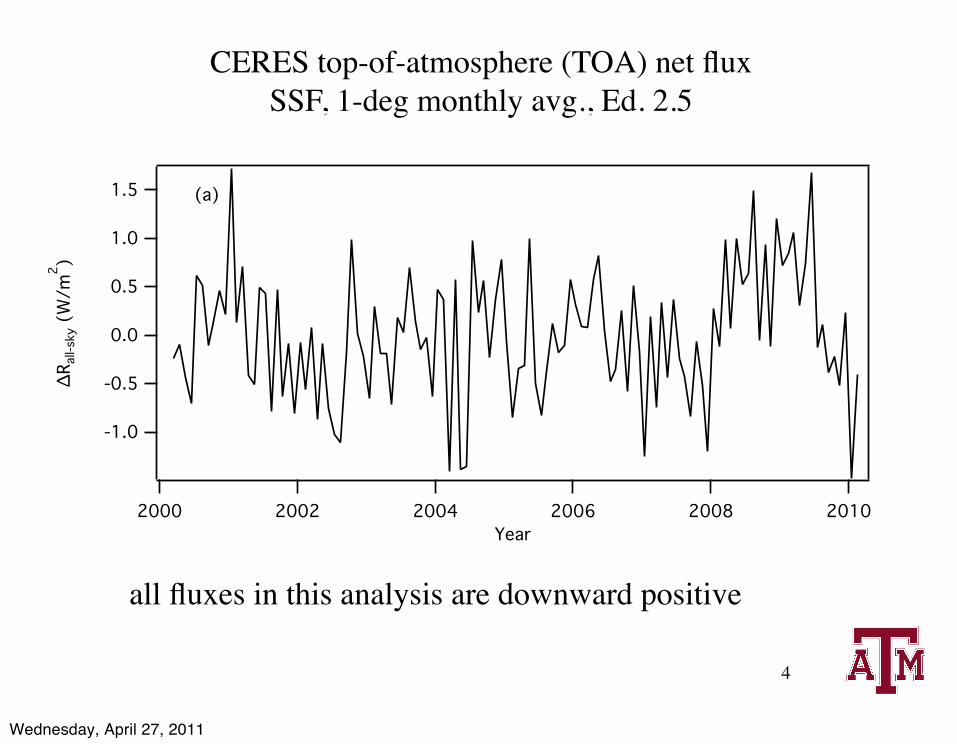
CERES top-of-atmosphere (TOA) net fluxSSF, 1-deg monthly avg., Ed. 2.5
all fluxes in this analysis are downward positive
4
1.5
1.0
0.5
0.0
-0.5
-1.0
∆Rall
-sky
(W/m
2 )
201020082006200420022000Year
(a)
Wednesday, April 27, 2011
5
Wednesday, April 27, 2011
5
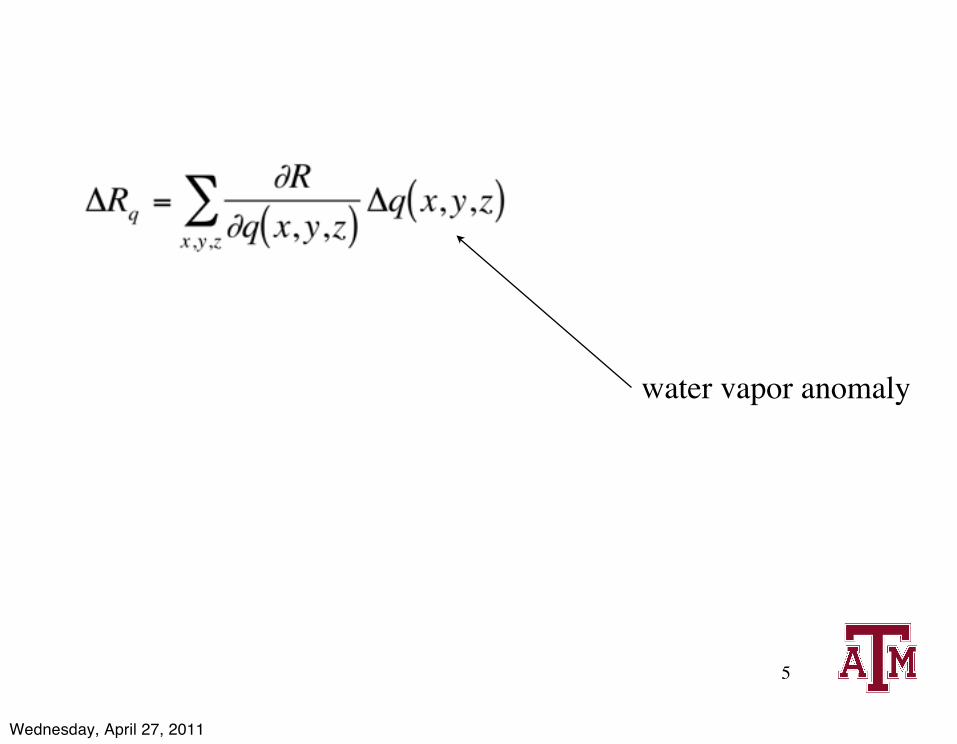
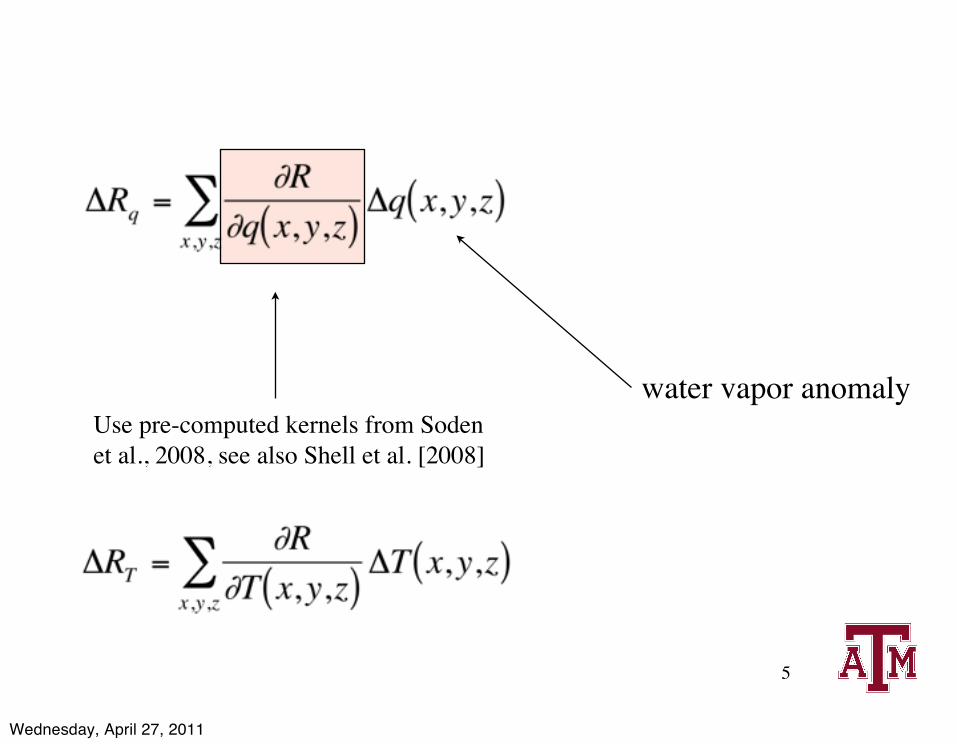
water vapor anomaly
Wednesday, April 27, 2011
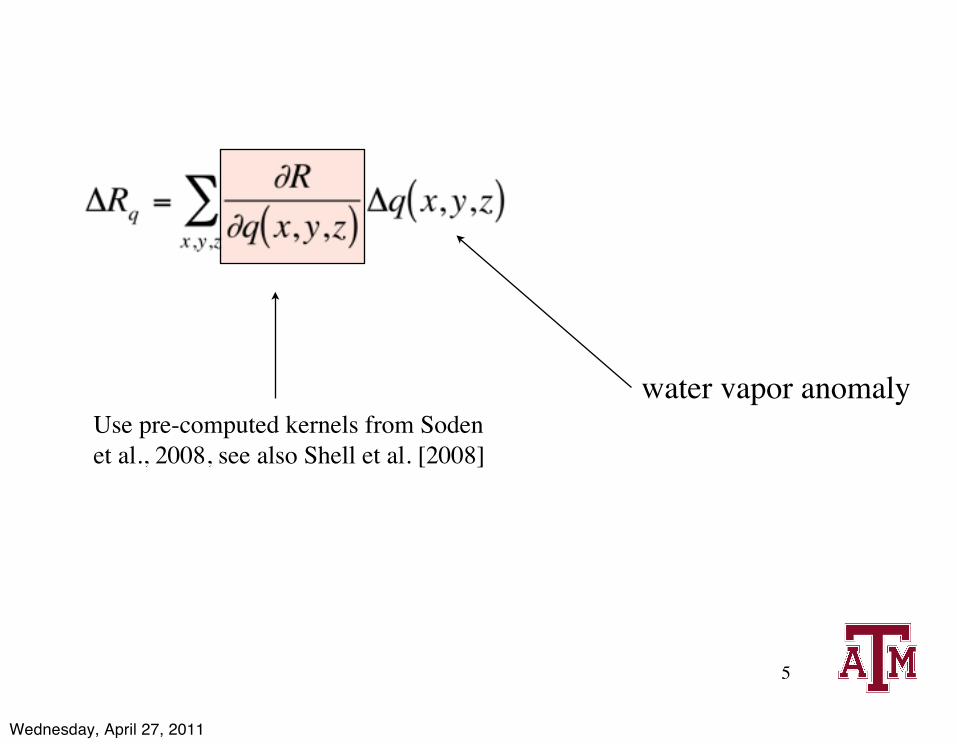
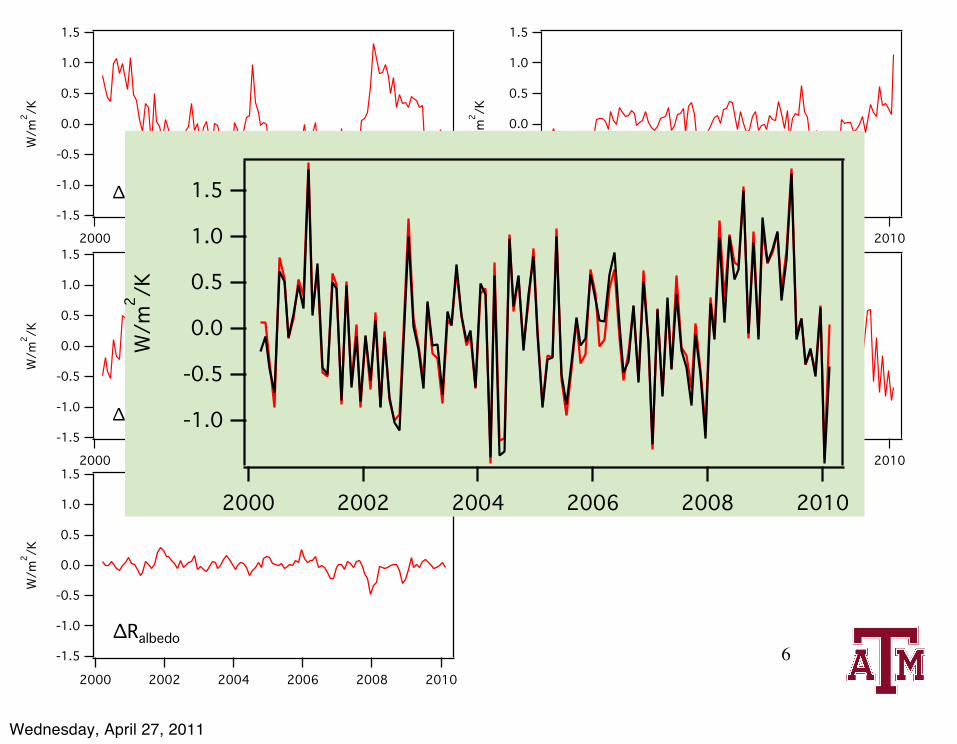
Use pre-computed kernels from Soden et al., 2008, see also Shell et al. [2008]
5
water vapor anomaly
Wednesday, April 27, 2011
Use pre-computed kernels from Soden et al., 2008, see also Shell et al. [2008]
5
water vapor anomaly
Wednesday, April 27, 2011
6
-1.5
-1.0
-0.5
0.0
0.5
1.0
1.5W/m
2 /K
201020082006200420022000
∆RT-1.5
-1.0
-0.5
0.0
0.5
1.0
1.5
W/m
2 /K
201020082006200420022000
∆Rq
-1.5
-1.0
-0.5
0.0
0.5
1.0
1.5
W/m
2 /K
201020082006200420022000
∆RcloudLW
1.5
1.0
0.5
0.0
-0.5
-1.0
W/m
2 /K201020082006200420022000
∆RcloudSW
-1.5
-1.0
-0.5
0.0
0.5
1.0
1.5
W/m
2 /K
201020082006200420022000
∆Ralbedo
1.5
1.0
0.5
0.0
-0.5
-1.0
W/m
2 /K
201020082006200420022000
Wednesday, April 27, 2011

-0.4
-0.3
-0.2
-0.1
0.0
0.1
0.2
K
201020082006200420022000
Surface temperature
1.00.80.60.40.20.0-0.2-0.4-0.6
W/m
2 /K
201020082006200420022000
∆Rq
7
Wednesday, April 27, 2011
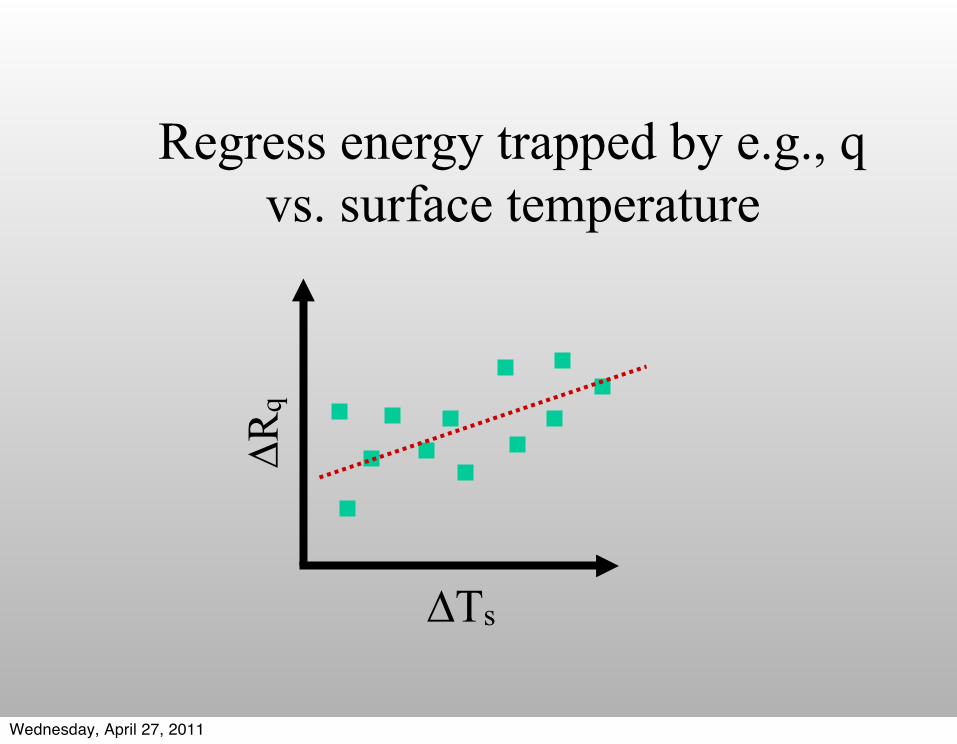
∆Rq
∆Ts
Regress energy trapped by e.g., q vs. surface temperature
Wednesday, April 27, 2011

-0.4
-0.3
-0.2
-0.1
0.0
0.1
0.2
K
201020082006200420022000
Surface temperature
1.00.80.60.40.20.0-0.2-0.4-0.6
W/m
2 /K
201020082006200420022000
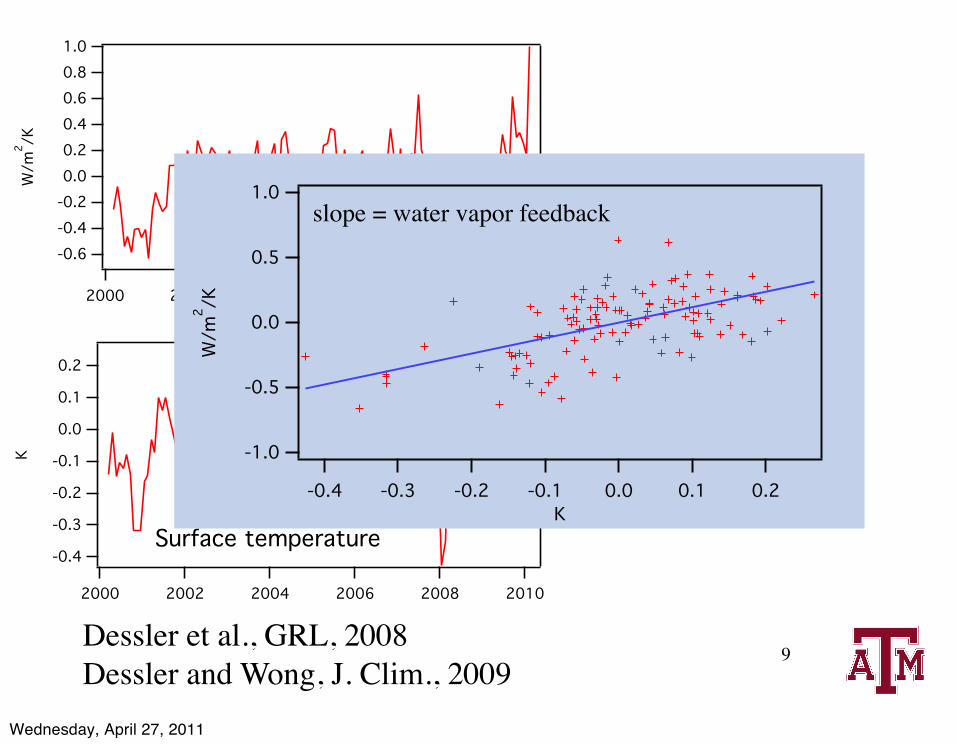
∆Rq
9Dessler et al., GRL, 2008Dessler and Wong, J. Clim., 2009
Wednesday, April 27, 2011
-0.4
-0.3
-0.2
-0.1
0.0
0.1
0.2
K
201020082006200420022000
Surface temperature
1.00.80.60.40.20.0-0.2-0.4-0.6
W/m
2 /K
201020082006200420022000
∆Rq
9
-1.0
-0.5
0.0
0.5
1.0W/m
2 /K
-0.4 -0.3 -0.2 -0.1 0.0 0.1 0.2K
slope = water vapor feedback
Dessler et al., GRL, 2008Dessler and Wong, J. Clim., 2009
Wednesday, April 27, 2011
10
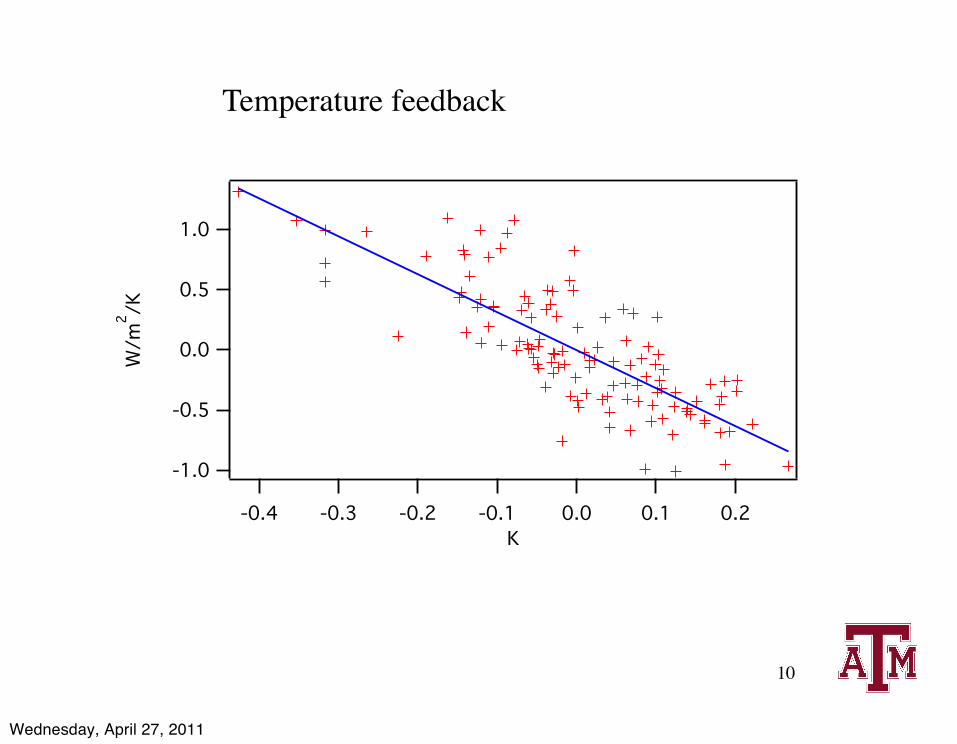
Temperature feedback
1.0
0.5
0.0
-0.5
-1.0
W/m
2 /K
-0.4 -0.3 -0.2 -0.1 0.0 0.1 0.2K
Wednesday, April 27, 2011
11
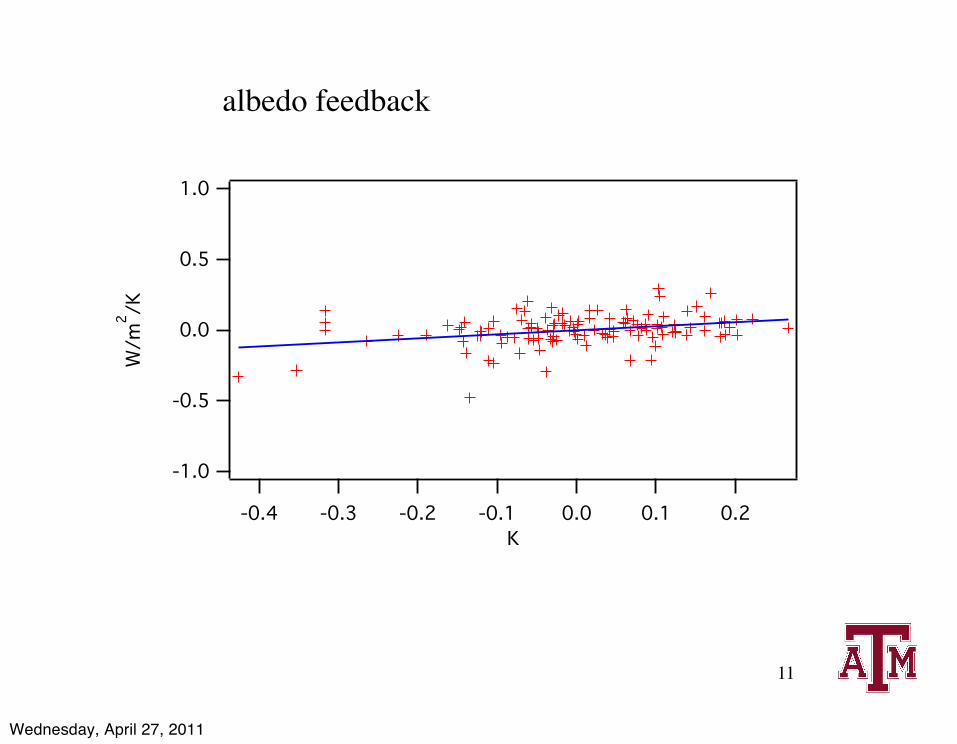
albedo feedback
-1.0
-0.5
0.0
0.5
1.0
W/m
2 /K
-0.4 -0.3 -0.2 -0.1 0.0 0.1 0.2K
Wednesday, April 27, 2011
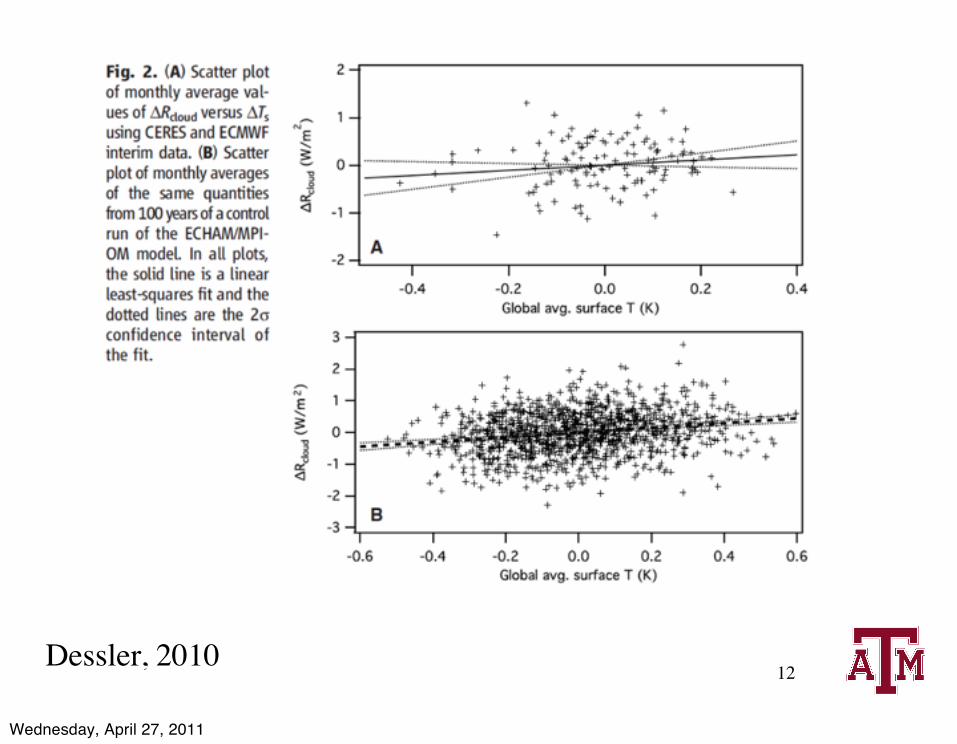
12Dessler, 2010
Wednesday, April 27, 2011
13
-2
-1
0
1
2
W/m
2 /K
-0.4 -0.3 -0.2 -0.1 0.0 0.1 0.2K
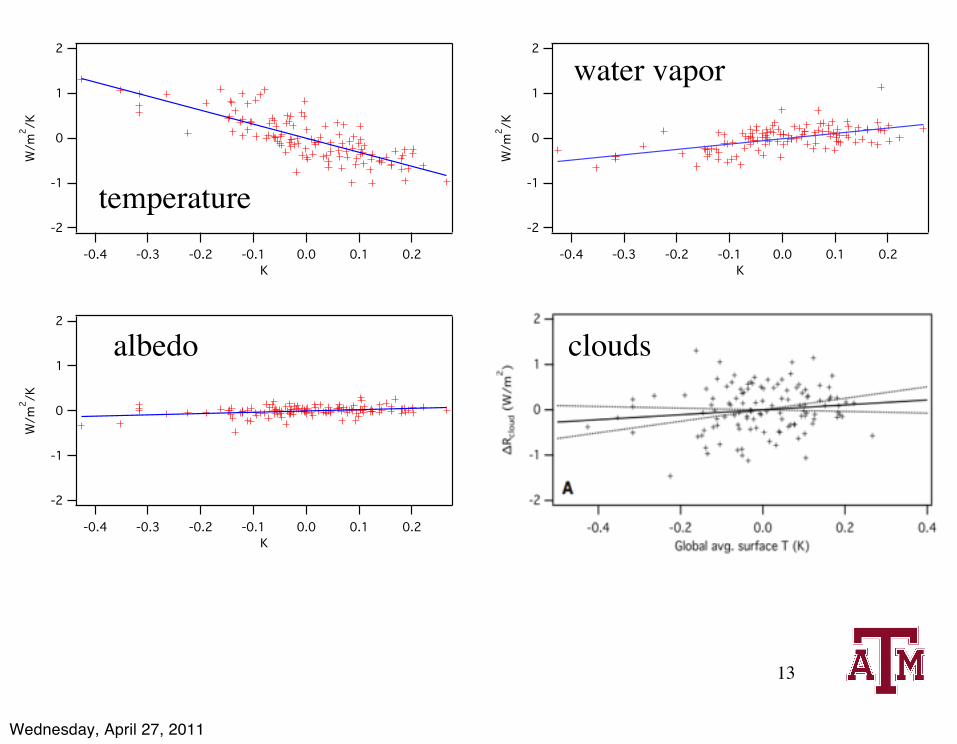
water vapor
-2
-1
0
1
2
W/m
2 /K
-0.4 -0.3 -0.2 -0.1 0.0 0.1 0.2K
-2
-1
0
1
2W/m
2 /K
-0.4 -0.3 -0.2 -0.1 0.0 0.1 0.2K
temperature
albedo clouds
Wednesday, April 27, 2011
-2
-1
0
1
2
W/m
2 /K
-0.4 -0.3 -0.2 -0.1 0.0 0.1 0.2K
14
-2
-1
0
1
2
W/m
2 /K
-0.4 -0.3 -0.2 -0.1 0.0 0.1 0.2K
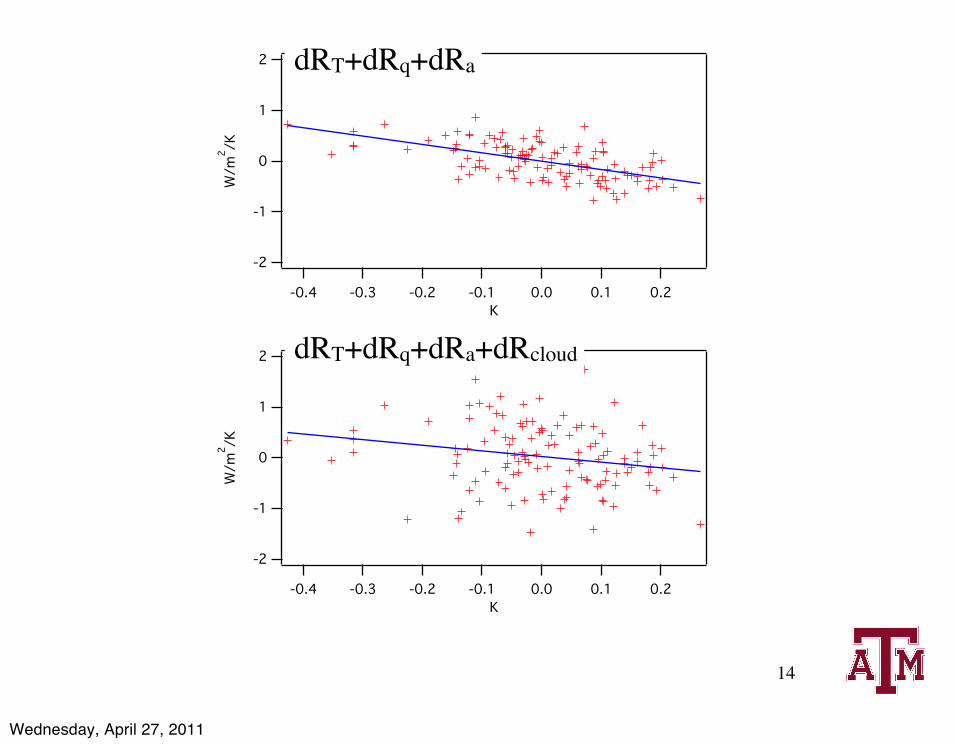
dRT+dRq+dRa
dRT+dRq+dRa+dRcloud
Wednesday, April 27, 2011
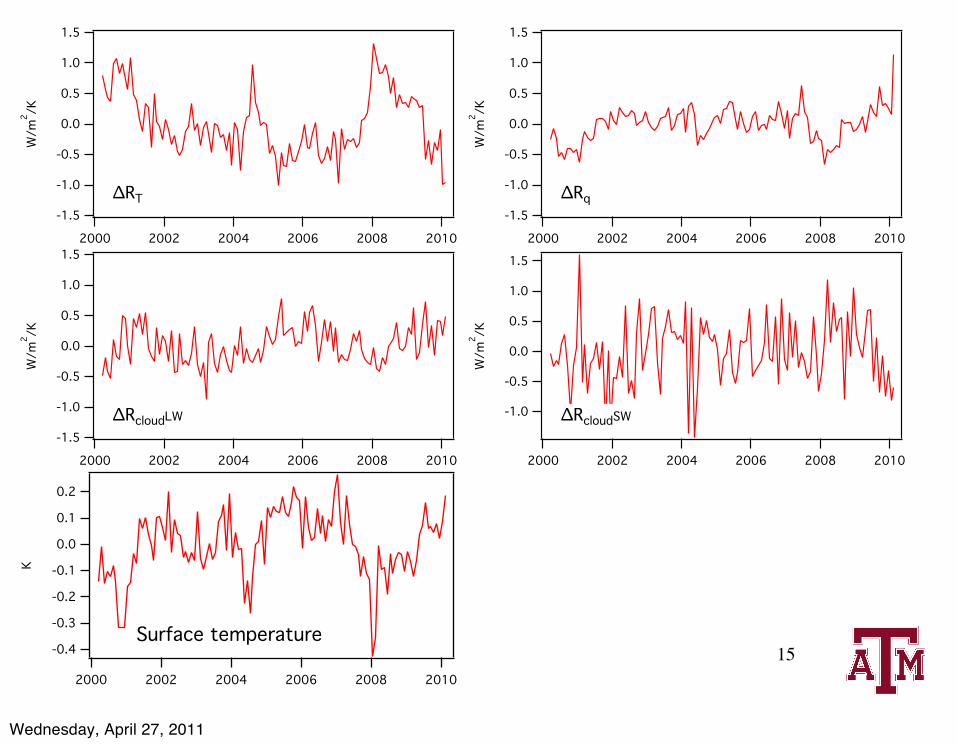
15
-1.5
-1.0
-0.5
0.0
0.5
1.0
1.5W/m
2 /K
201020082006200420022000
∆RT-1.5
-1.0
-0.5
0.0
0.5
1.0
1.5
W/m
2 /K
201020082006200420022000
∆Rq
-1.5
-1.0
-0.5
0.0
0.5
1.0
1.5
W/m
2 /K
201020082006200420022000
∆RcloudLW
1.5
1.0
0.5
0.0
-0.5
-1.0
W/m
2 /K201020082006200420022000
∆RcloudSW
-0.4
-0.3
-0.2
-0.1
0.0
0.1
0.2
K
201020082006200420022000
Surface temperature
Wednesday, April 27, 2011
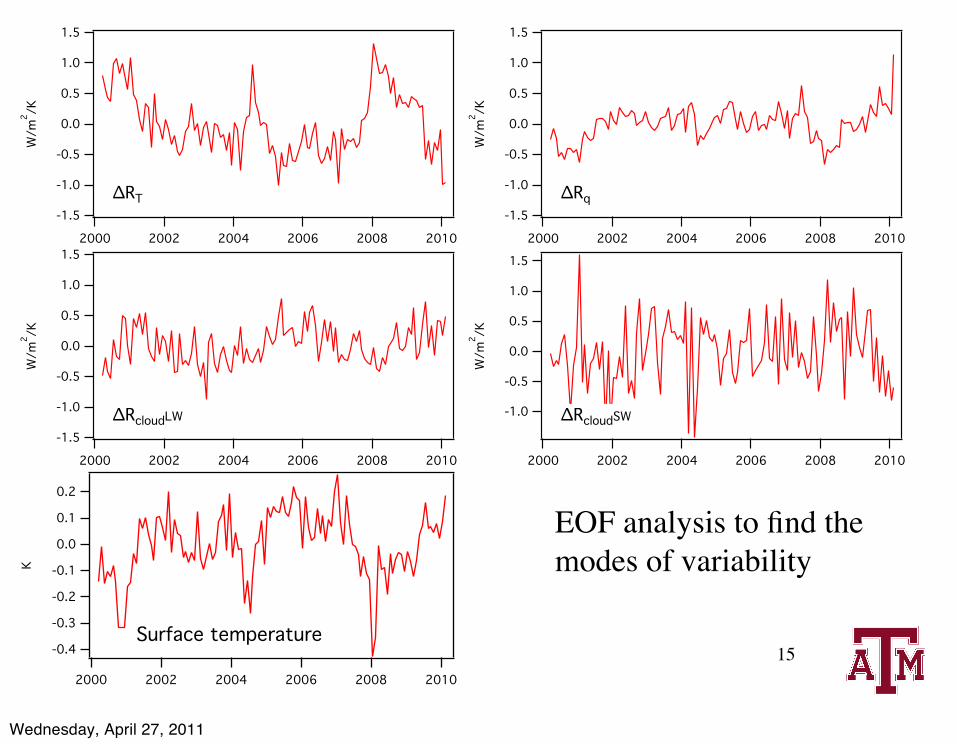
15
-1.5
-1.0
-0.5
0.0
0.5
1.0
1.5W/m
2 /K
201020082006200420022000
∆RT-1.5
-1.0
-0.5
0.0
0.5
1.0
1.5
W/m
2 /K
201020082006200420022000
∆Rq
-1.5
-1.0
-0.5
0.0
0.5
1.0
1.5
W/m
2 /K
201020082006200420022000
∆RcloudLW
1.5
1.0
0.5
0.0
-0.5
-1.0
W/m
2 /K201020082006200420022000
∆RcloudSW
-0.4
-0.3
-0.2
-0.1
0.0
0.1
0.2
K
201020082006200420022000
Surface temperature
EOF analysis to find themodes of variability
Wednesday, April 27, 2011
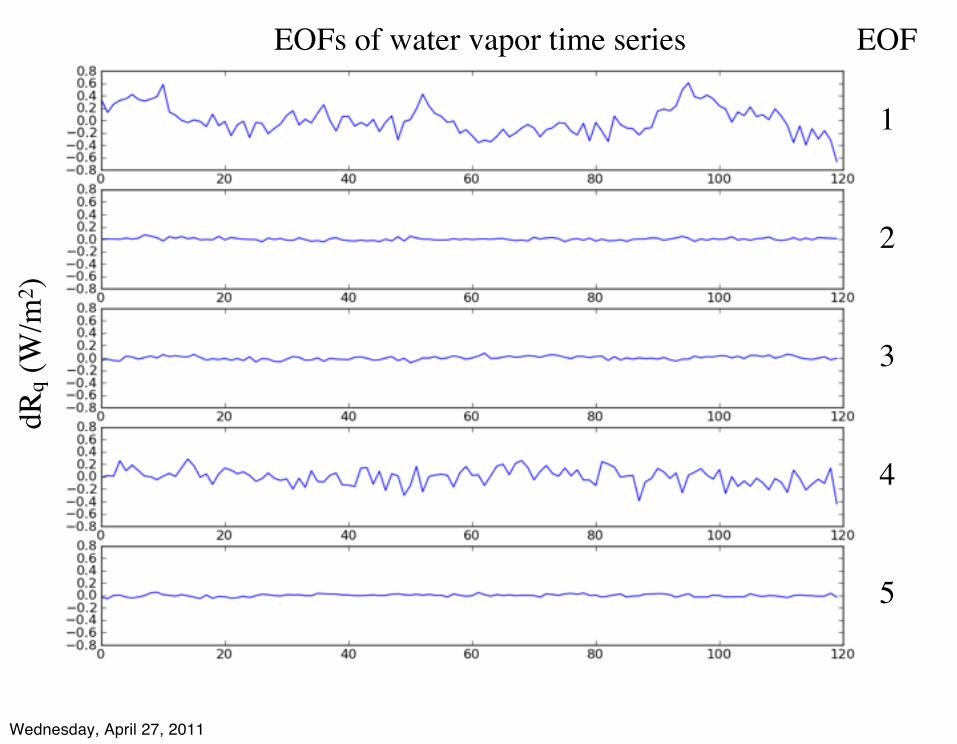
52%
25%
12%
8%
3%
16
EOF
1
2
3
4
5
dRq (
W/m
2 )EOFs of water vapor time series
Wednesday, April 27, 2011

17
Ts: 0.10 K
dRT: -0.46 W/m2
dRq: 0.22 W/m2
dRcloudLW: 0.15 W/m2
dRcloudSW: -0.22 W/m2
Explains 52% of variance
Wednesday, April 27, 2011

52%
25%
12%
8%
3%
18
EOF
1
2
3
4
5
dRq (
W/m
2 )EOFs of water vapor time series
Wednesday, April 27, 2011

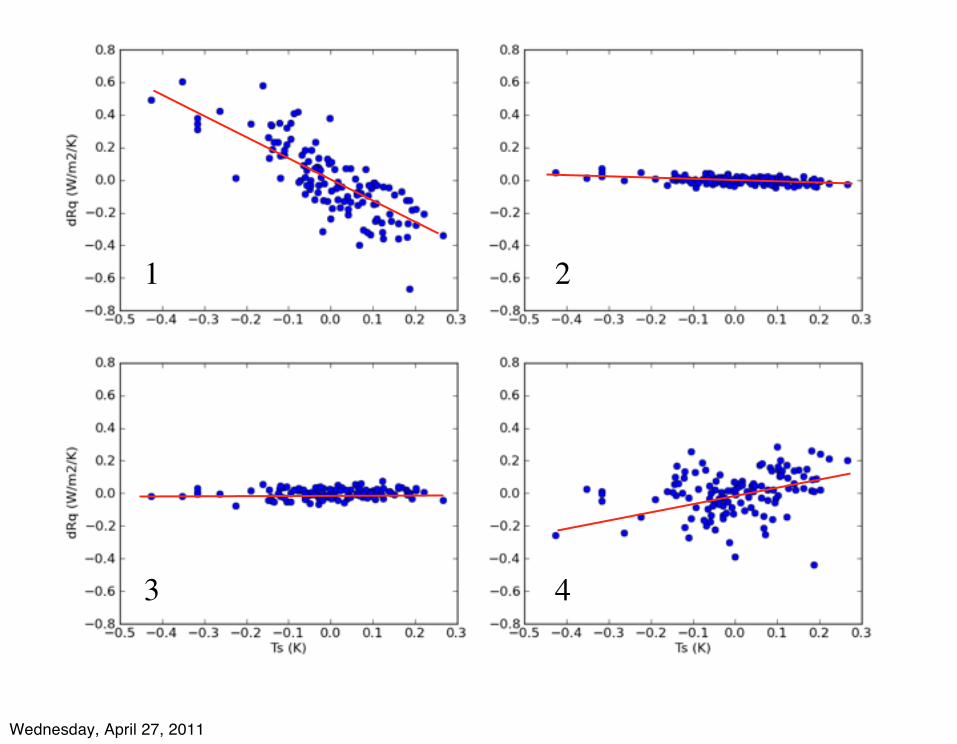
19
1 2
3 4
Wednesday, April 27, 2011
19
1 2
3 4
Wednesday, April 27, 2011

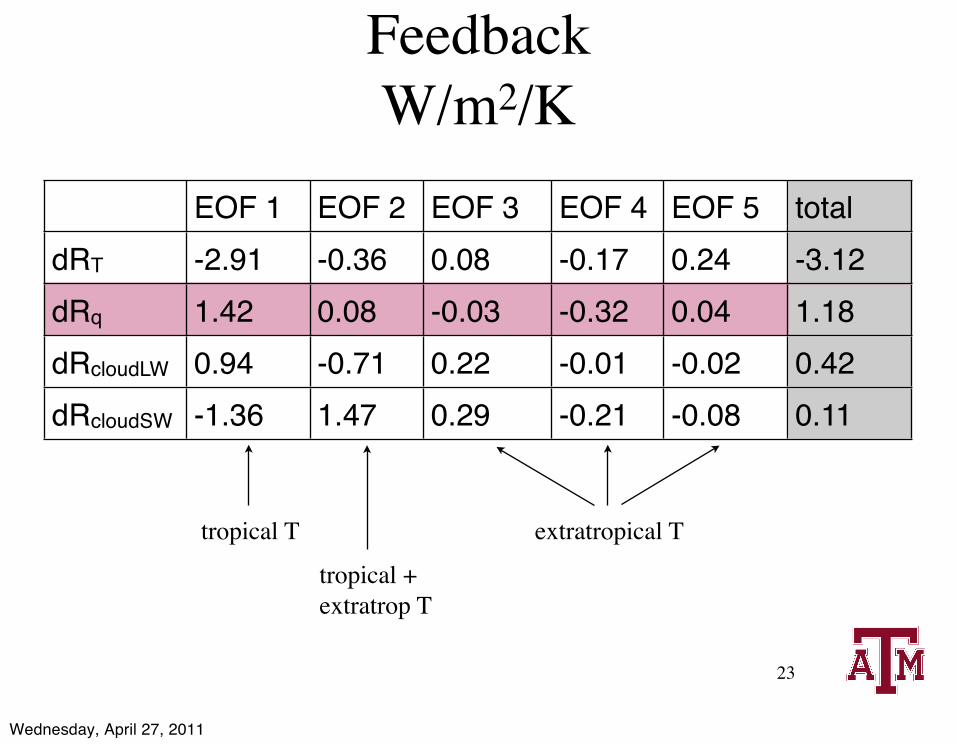
FeedbackW/m2/K
20
EOF 1 EOF 2 EOF 3 EOF 4 EOF 5 totaldRT -2.91 -0.36 0.08 -0.17 0.24 -3.12dRq 1.42 0.08 -0.03 -0.32 0.04 1.18dRcloudLW 0.94 -0.71 0.22 -0.01 -0.02 0.42dRcloudSW -1.36 1.47 0.29 -0.21 -0.08 0.11
tropical T
tropical +extratrop T
extratropical T
52% 25% 12% 8% 3%
Wednesday, April 27, 2011

EOF 1 EOF 2 EOF 3 EOF 4 EOF 5 totaldRT -2.91 -0.36 0.08 -0.17 0.24 -3.12dRq 1.42 0.08 -0.03 -0.32 0.04 1.18dRcloudLW 0.94 -0.71 0.22 -0.01 -0.02 0.42dRcloudSW -1.36 1.47 0.29 -0.21 -0.08 0.11
FeedbackW/m2/K
21
tropical T
tropical +extratrop T
extratropical T
Wednesday, April 27, 2011
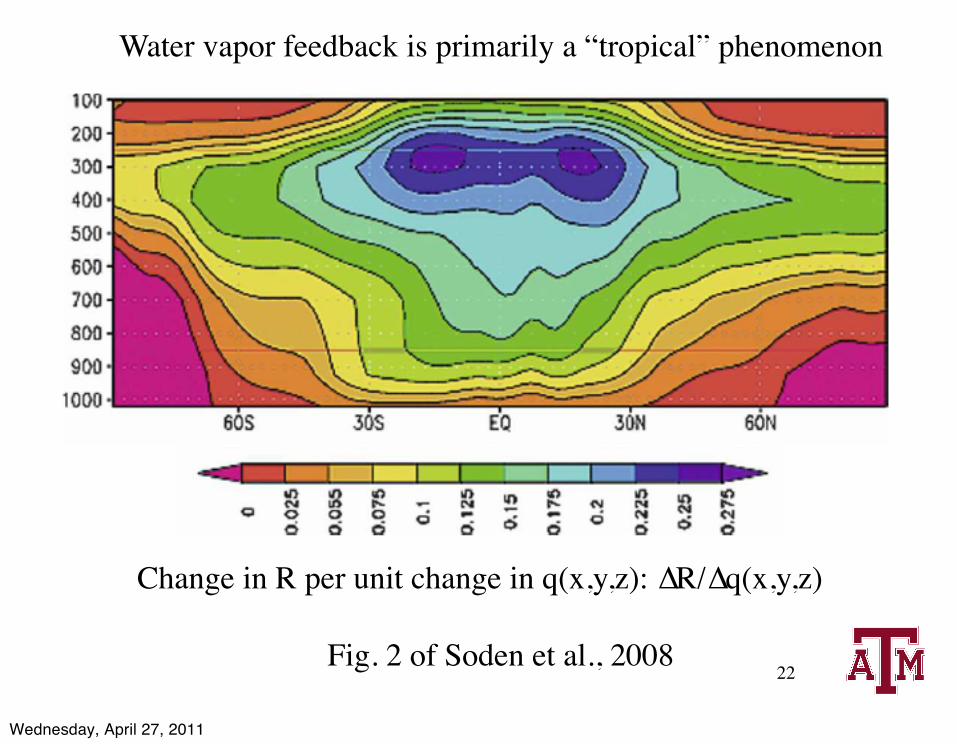
22Fig. 2 of Soden et al., 2008
Water vapor feedback is primarily a “tropical” phenomenon
Change in R per unit change in q(x,y,z): ∆R/∆q(x,y,z)
Wednesday, April 27, 2011
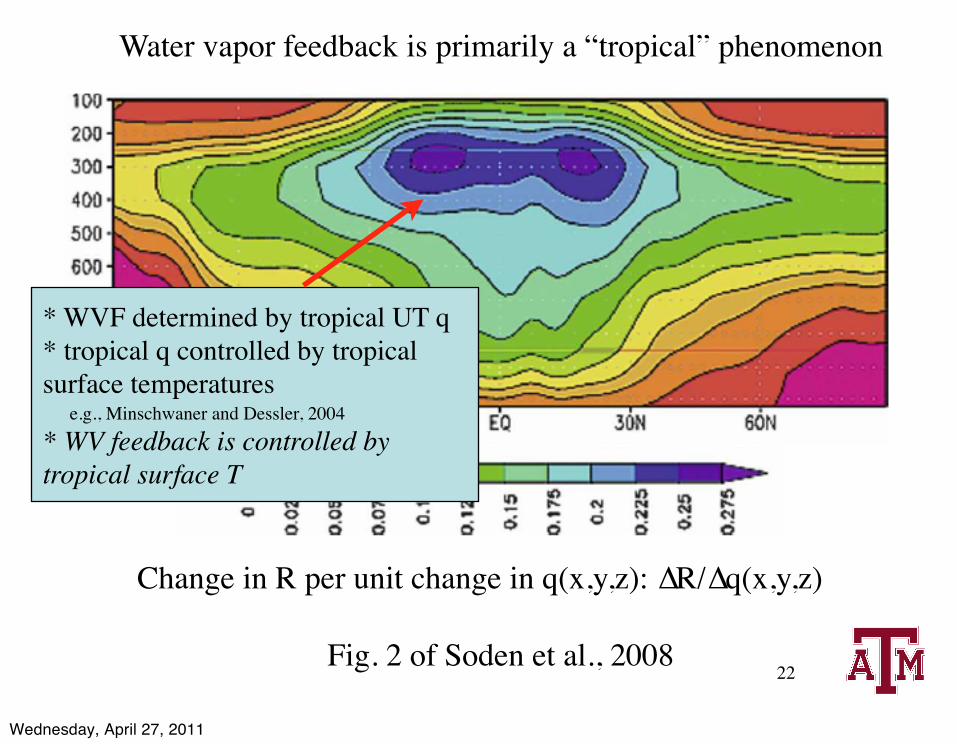
22Fig. 2 of Soden et al., 2008
Water vapor feedback is primarily a “tropical” phenomenon
Change in R per unit change in q(x,y,z): ∆R/∆q(x,y,z)
* WVF determined by tropical UT q* tropical q controlled by tropical surface temperatures
e.g., Minschwaner and Dessler, 2004* WV feedback is controlled by tropical surface T
Wednesday, April 27, 2011
EOF 1 EOF 2 EOF 3 EOF 4 EOF 5 totaldRT -2.91 -0.36 0.08 -0.17 0.24 -3.12dRq 1.42 0.08 -0.03 -0.32 0.04 1.18dRcloudLW 0.94 -0.71 0.22 -0.01 -0.02 0.42dRcloudSW -1.36 1.47 0.29 -0.21 -0.08 0.11
FeedbackW/m2/K
23
tropical T
tropical +extratrop T
extratropical T
Wednesday, April 27, 2011
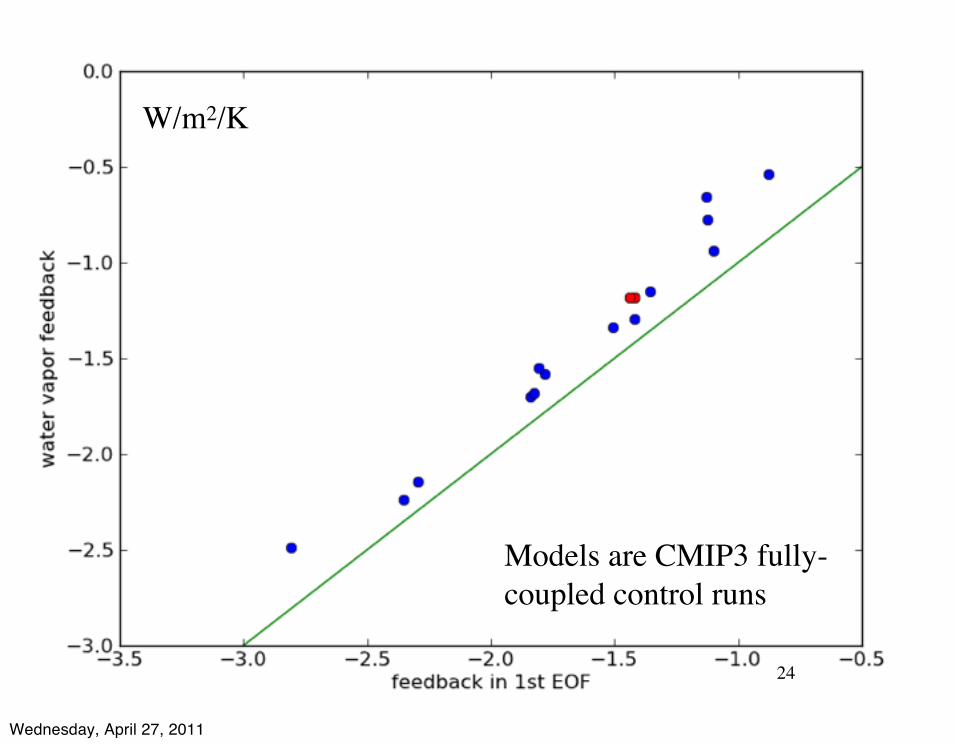
24
W/m2/K
Models are CMIP3 fully-coupled control runs
Wednesday, April 27, 2011

EOF 1 EOF 2 EOF 3 EOF 4 EOF 5 totaldRT -2.91 -0.36 0.08 -0.17 0.24 -3.12dRq 1.42 0.08 -0.03 -0.32 0.04 1.18dRcloudLW 0.94 -0.71 0.22 -0.01 -0.02 0.42dRcloudSW -1.36 1.47 0.29 -0.21 -0.08 0.11
FeedbackW/m2/K
25
tropical T
tropical +extratrop T
extratropical T
Wednesday, April 27, 2011
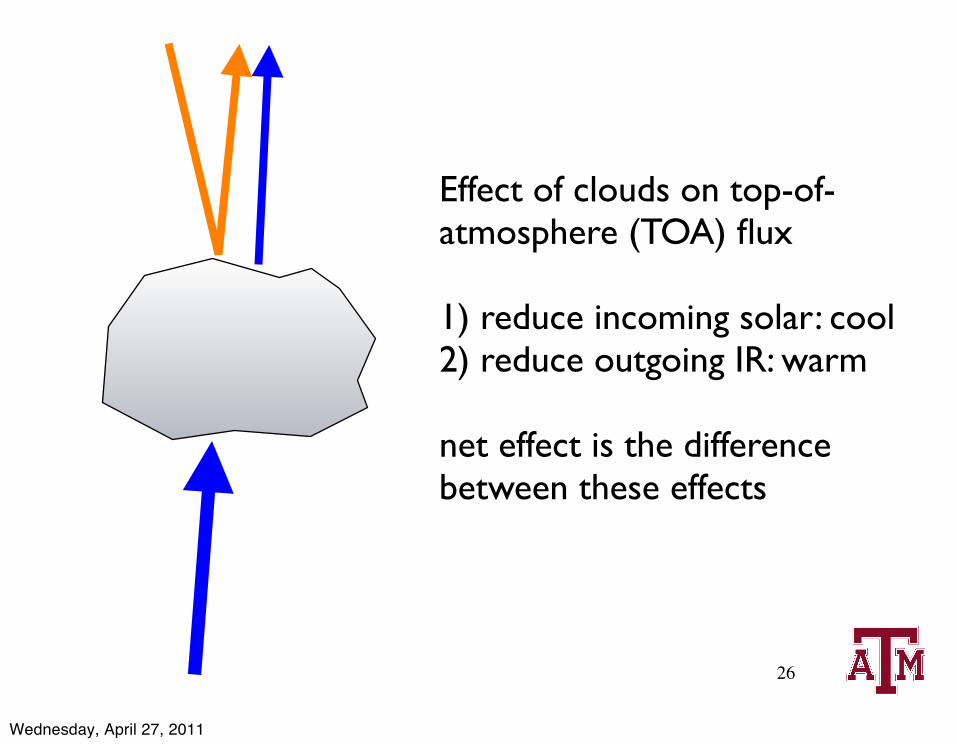
Effect of clouds on top-of-atmosphere (TOA) flux
1) reduce incoming solar: cool2) reduce outgoing IR: warm
net effect is the differencebetween these effects
26
Wednesday, April 27, 2011

in today’s atmosphere, clouds reduce net energy in to the Earth by 20 W/m2 (also known as cloud radiative forcing)
how will this change in a future climate?
if changing clouds further reduce TOA downward net flux, this is a negative feedback
if changing clouds increase TOA downward net flux, this is a positive feedback
Wednesday, April 27, 2011
28
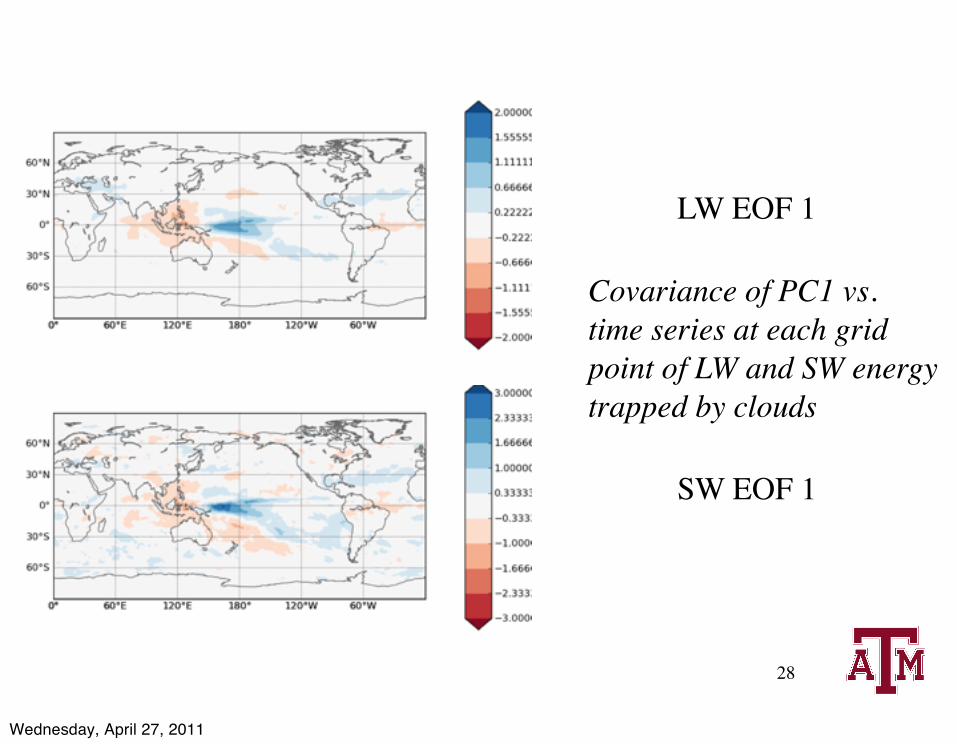
LW EOF 1
SW EOF 1
Covariance of PC1 vs.time series at each grid point of LW and SW energy trapped by clouds
Wednesday, April 27, 2011

Conclusions• Clouds that make it difficult to accurately
determine how TOA flux anomaly varies with surface temperature– they correlate poorly with surface T– next steps: use EOF analysis to gain insight into
the factors that regulate clouds– goal is to improve estimate of clouds vs. T
• Water vapor and temperature are well behaved
29
Wednesday, April 27, 2011

30
LW EOF 2
SW EOF 2
Wednesday, April 27, 2011
31
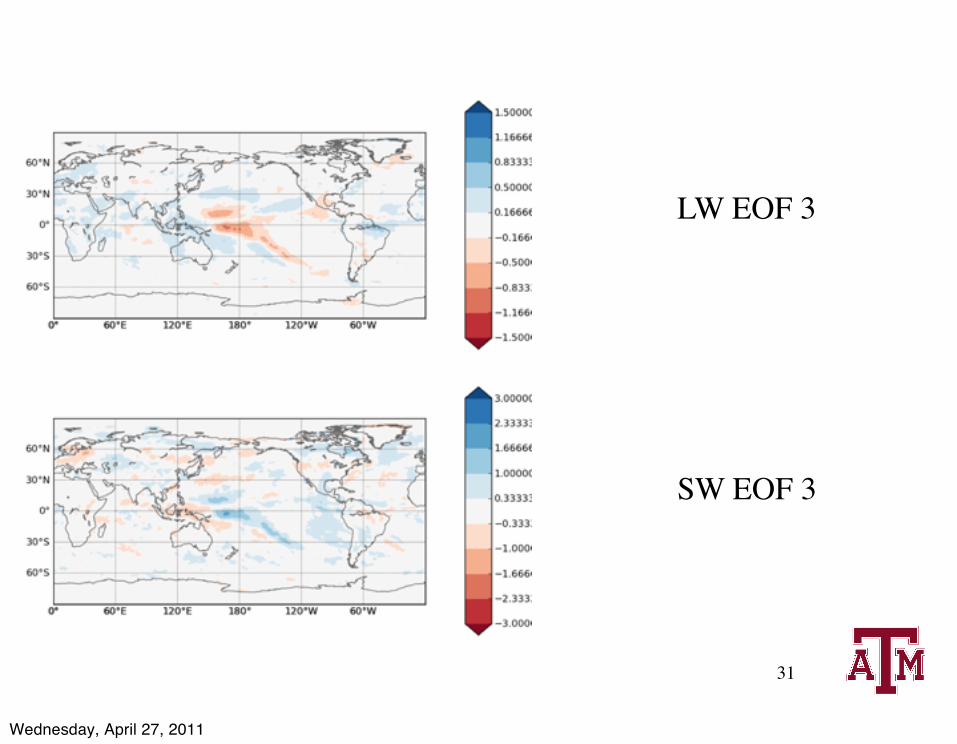
LW EOF 3
SW EOF 3
Wednesday, April 27, 2011
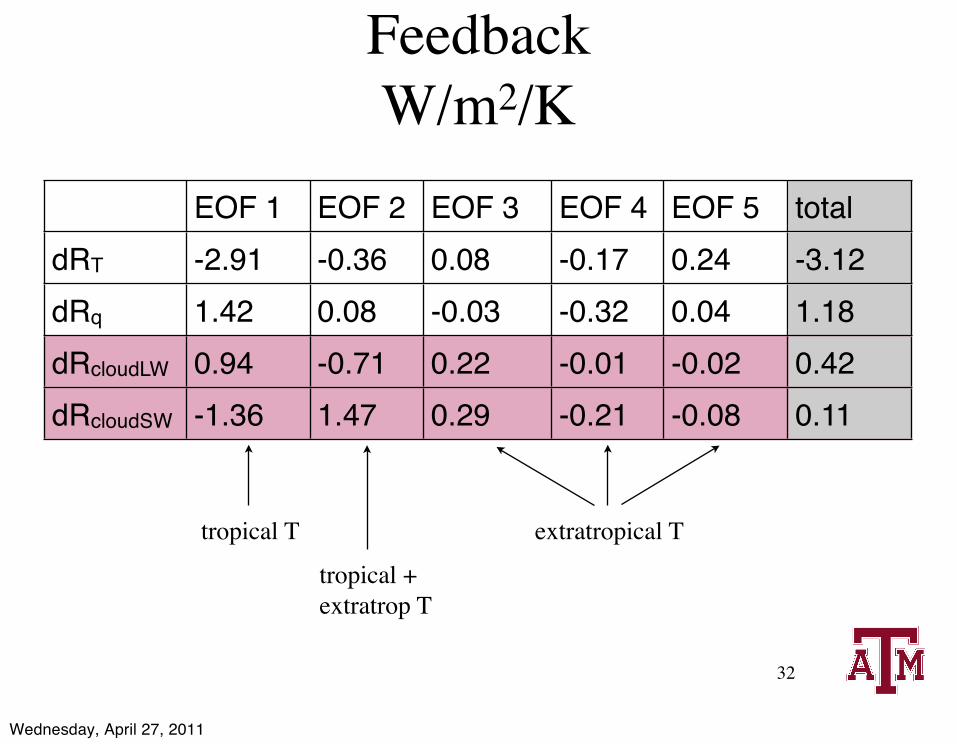
EOF 1 EOF 2 EOF 3 EOF 4 EOF 5 totaldRT -2.91 -0.36 0.08 -0.17 0.24 -3.12dRq 1.42 0.08 -0.03 -0.32 0.04 1.18dRcloudLW 0.94 -0.71 0.22 -0.01 -0.02 0.42dRcloudSW -1.36 1.47 0.29 -0.21 -0.08 0.11
FeedbackW/m2/K
32
tropical T
tropical +extratrop T
extratropical T
Wednesday, April 27, 2011

33
Wednesday, April 27, 2011

34
Wednesday, April 27, 2011

35
Wednesday, April 27, 2011

36
slope is -1±1
Wednesday, April 27, 2011
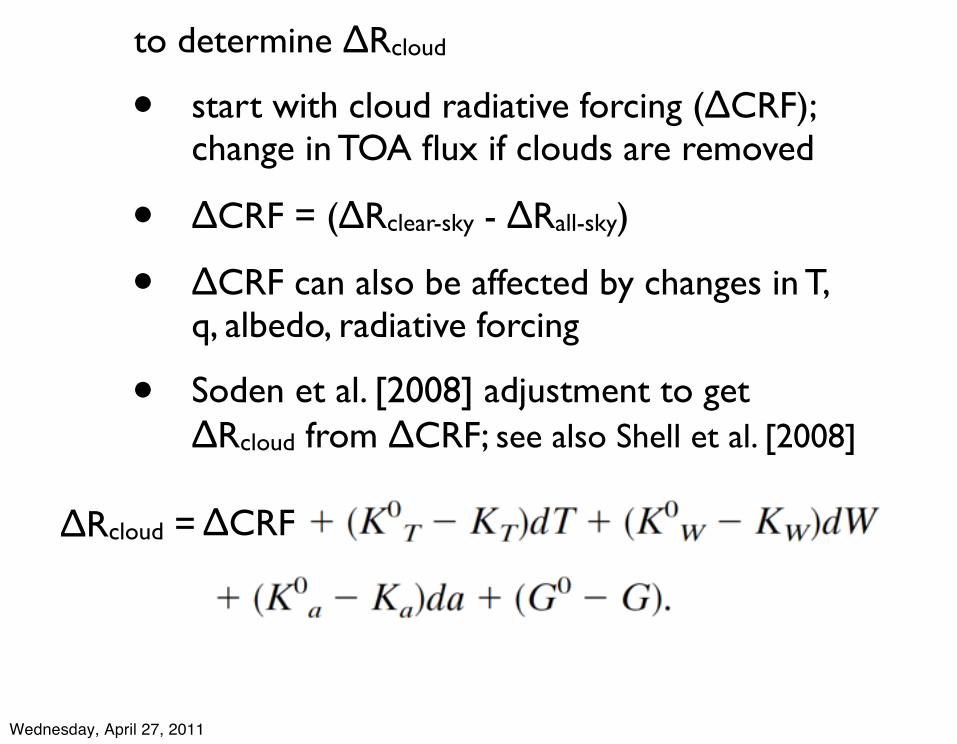
• start with cloud radiative forcing (∆CRF); change in TOA flux if clouds are removed
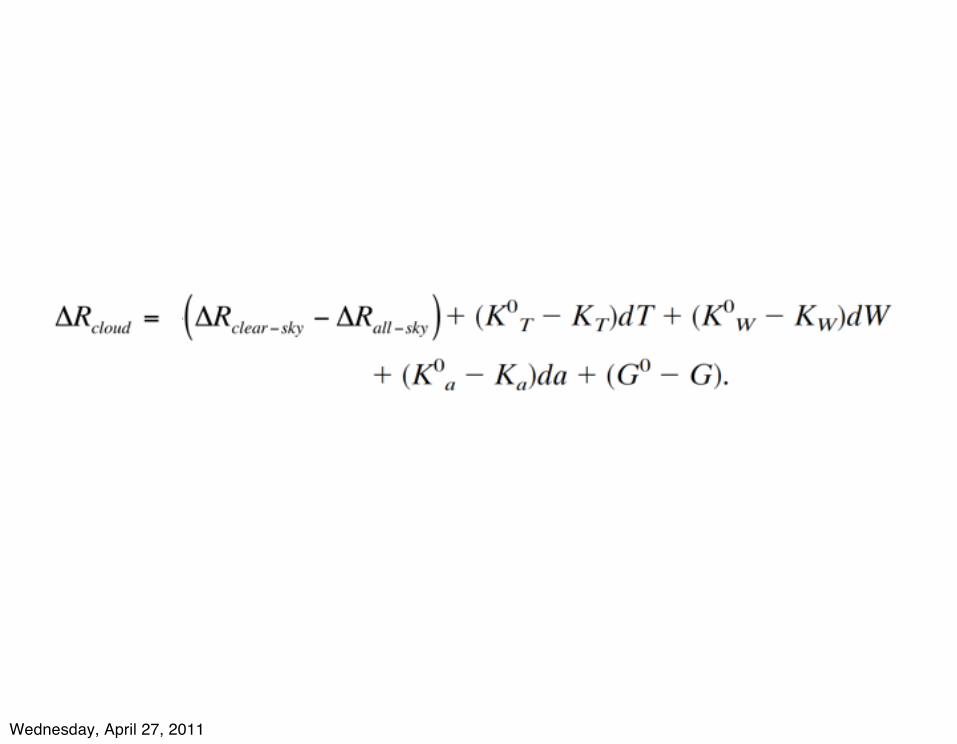
• ∆CRF = (∆Rclear-sky - ∆Rall-sky)
• ∆CRF can also be affected by changes in T, q, albedo, radiative forcing
• Soden et al. [2008] adjustment to get ∆Rcloud from ∆CRF; see also Shell et al. [2008]
to determine ∆Rcloud
∆CRF∆Rcloud =
Wednesday, April 27, 2011
Wednesday, April 27, 2011
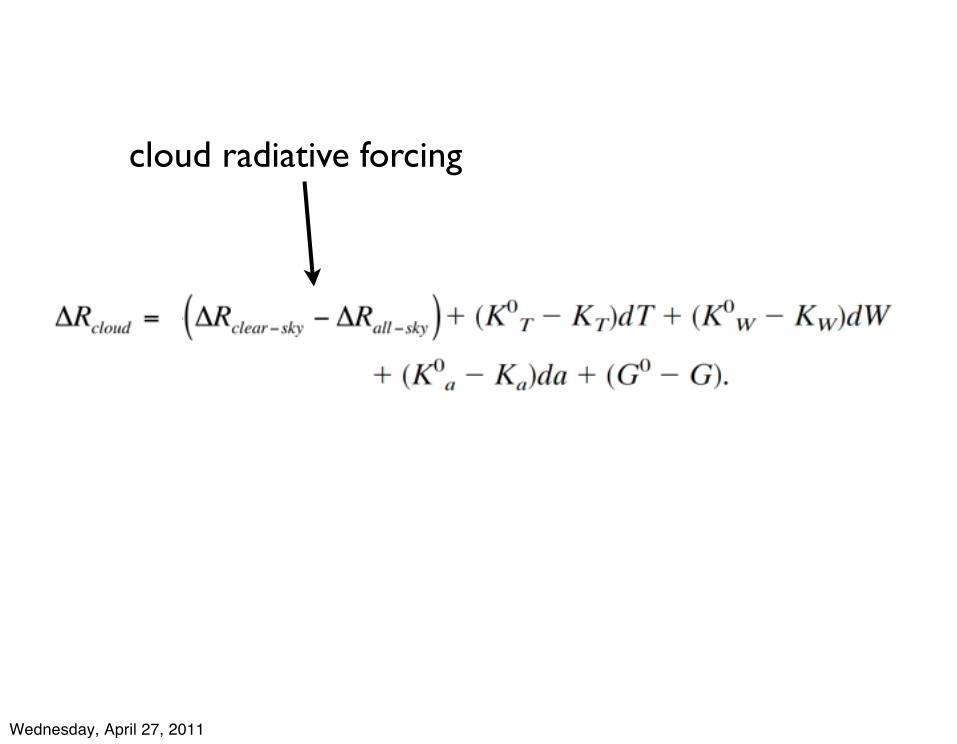
cloud radiative forcing
Wednesday, April 27, 2011
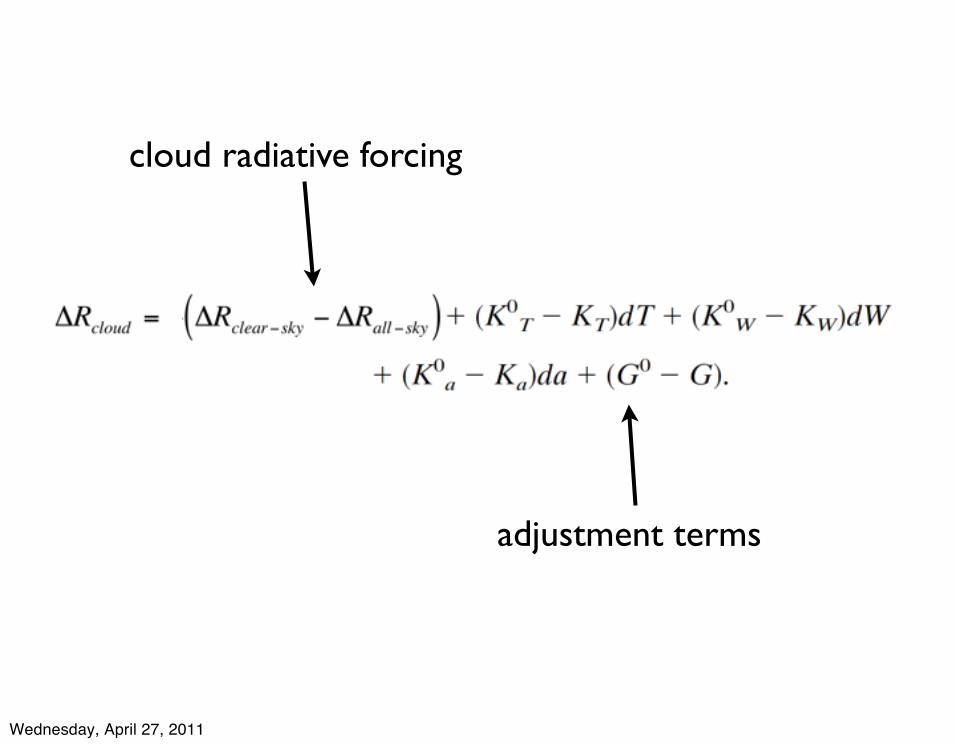
cloud radiative forcing
adjustment terms
Wednesday, April 27, 2011
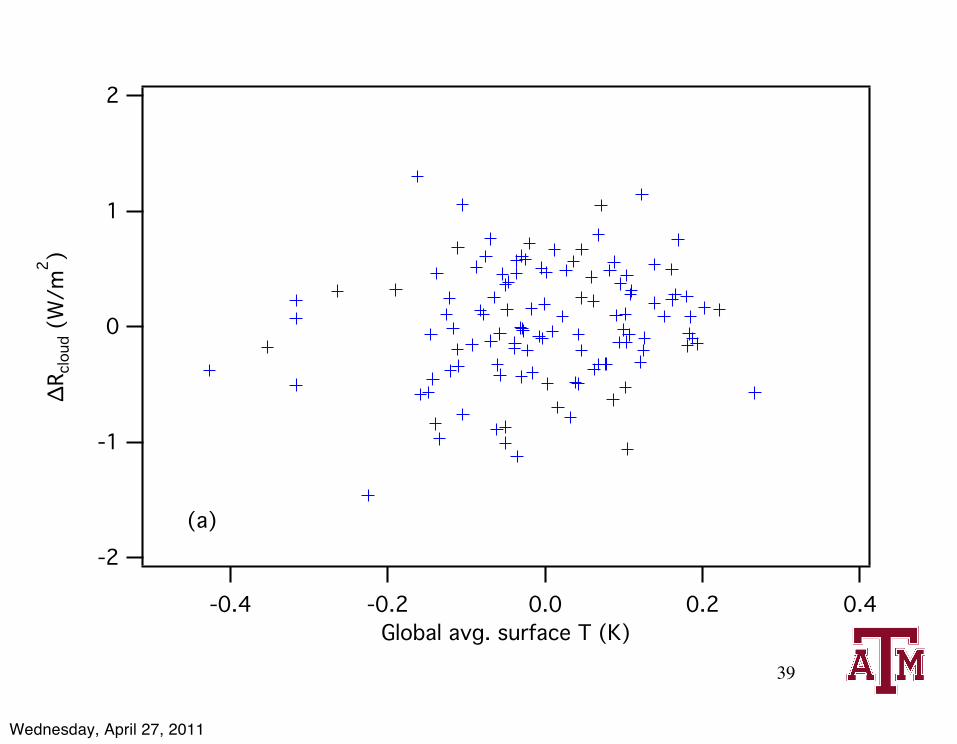
39
-2
-1
0
1
2
∆Rcl
oud (
W/m
2 )
-0.4 -0.2 0.0 0.2 0.4Global avg. surface T (K)
(a)
Wednesday, April 27, 2011
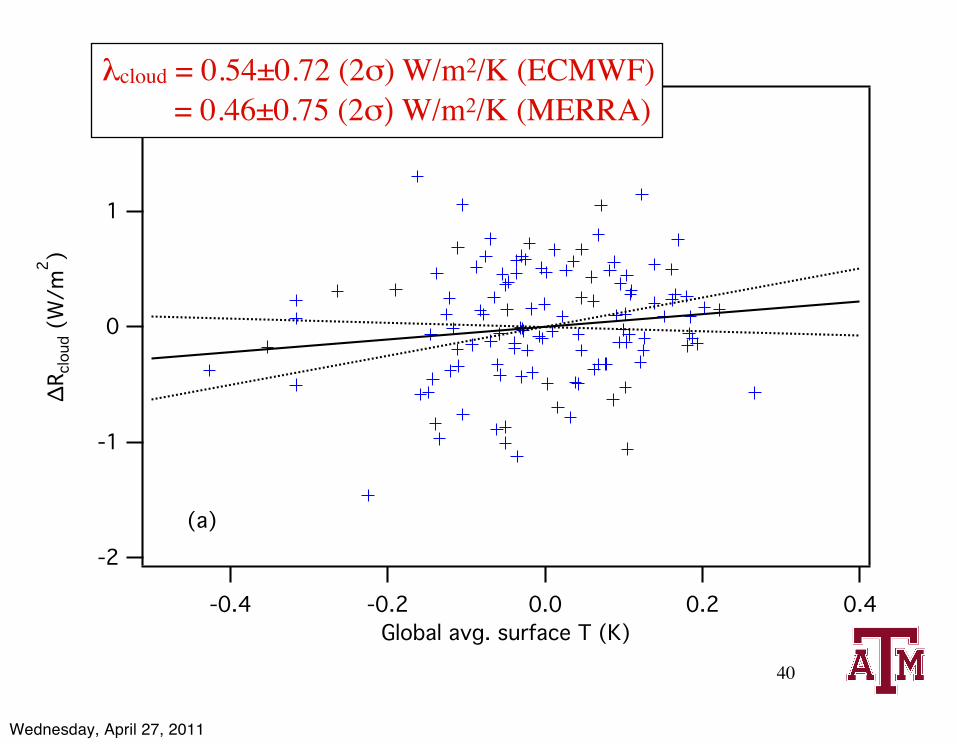
40
-2
-1
0
1
2
∆Rcl
oud (
W/m
2 )
-0.4 -0.2 0.0 0.2 0.4Global avg. surface T (K)
(a)
λcloud = 0.54±0.72 (2σ) W/m2/K (ECMWF) = 0.46±0.75 (2σ) W/m2/K (MERRA)
Wednesday, April 27, 2011
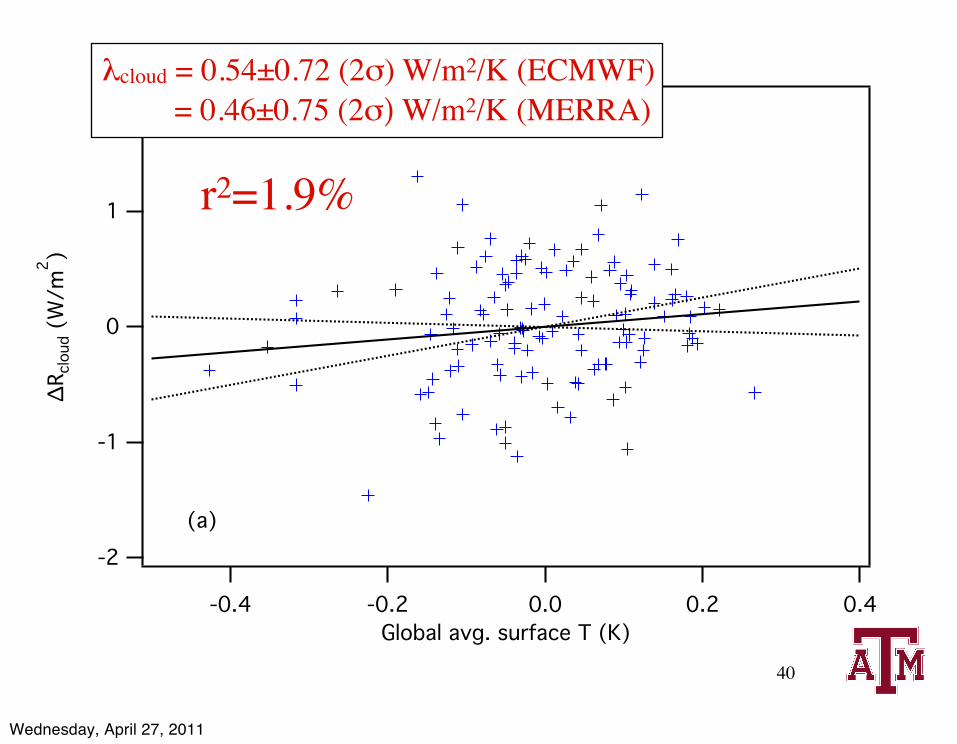
40
-2
-1
0
1
2
∆Rcl
oud (
W/m
2 )
-0.4 -0.2 0.0 0.2 0.4Global avg. surface T (K)
(a)
λcloud = 0.54±0.72 (2σ) W/m2/K (ECMWF) = 0.46±0.75 (2σ) W/m2/K (MERRA)
r2=1.9%
Wednesday, April 27, 2011

A few lessons
• This scatter is real• Another few years of data will not help• We must study modes of cloud variations
that are NOT related to surface T variations– e.g., MJO
• Models correctly simulate the scatter
41
Wednesday, April 27, 2011

λcloud = 0.74±0.20 W/m2/K; r2 = 4%MPI ECHAM5
42
-3
-2
-1
0
1
2
3
∆Rcl
oud (
W/m
2)
-0.6 -0.4 -0.2 0.0 0.2 0.4 0.6Global avg. surface T (K)
(b)
Wednesday, April 27, 2011

43
short-term cloud feedback intercomparison
1.25
1.00
0.75
0.50
0.25
0.00
-0.25
∆Rcl
oud/∆T
s (W
/m2 /K
)
ECMWF+C MERRA+C PCM IPSL INMCM3 UKMO MPI CCSM GFDL2.0 GFDL2.1
(a)
Wednesday, April 27, 2011

Lessons
Wednesday, April 27, 2011

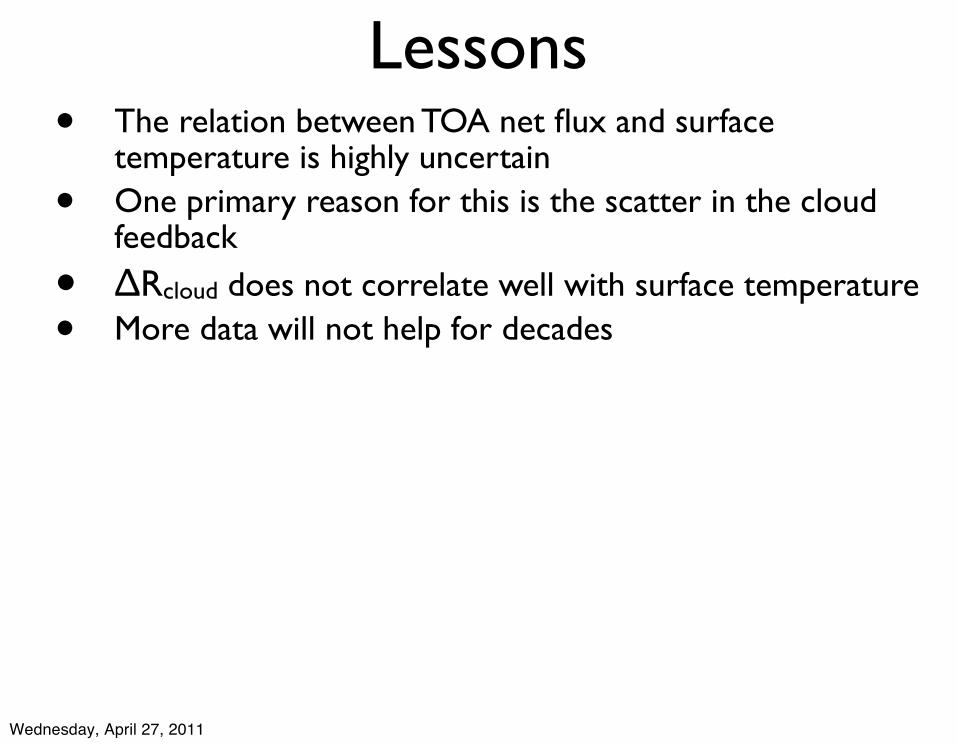
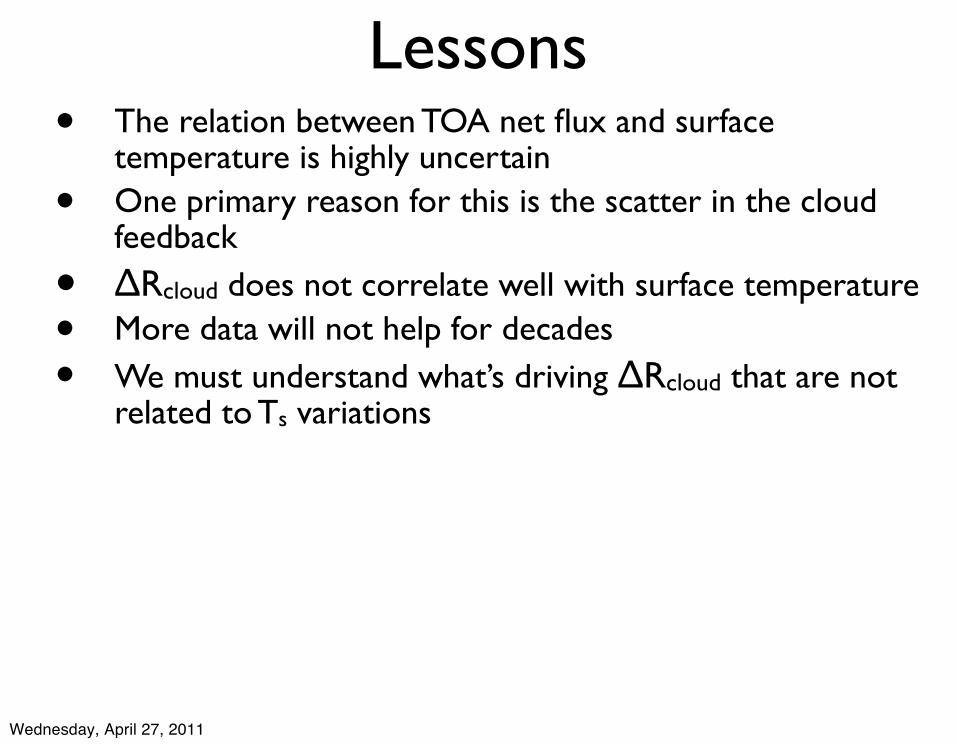
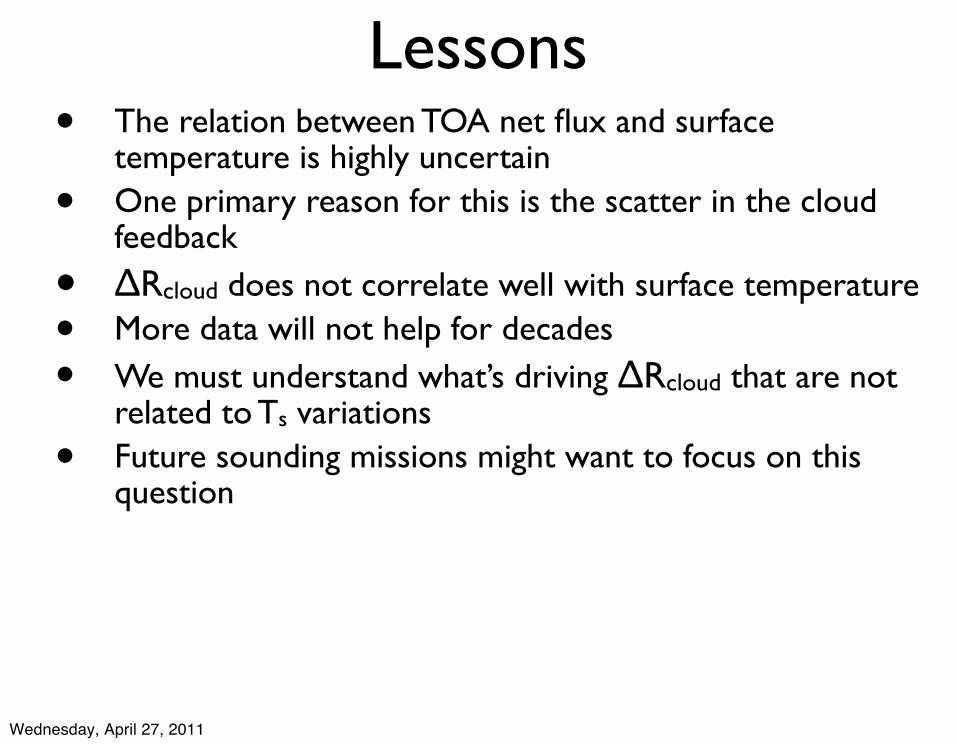
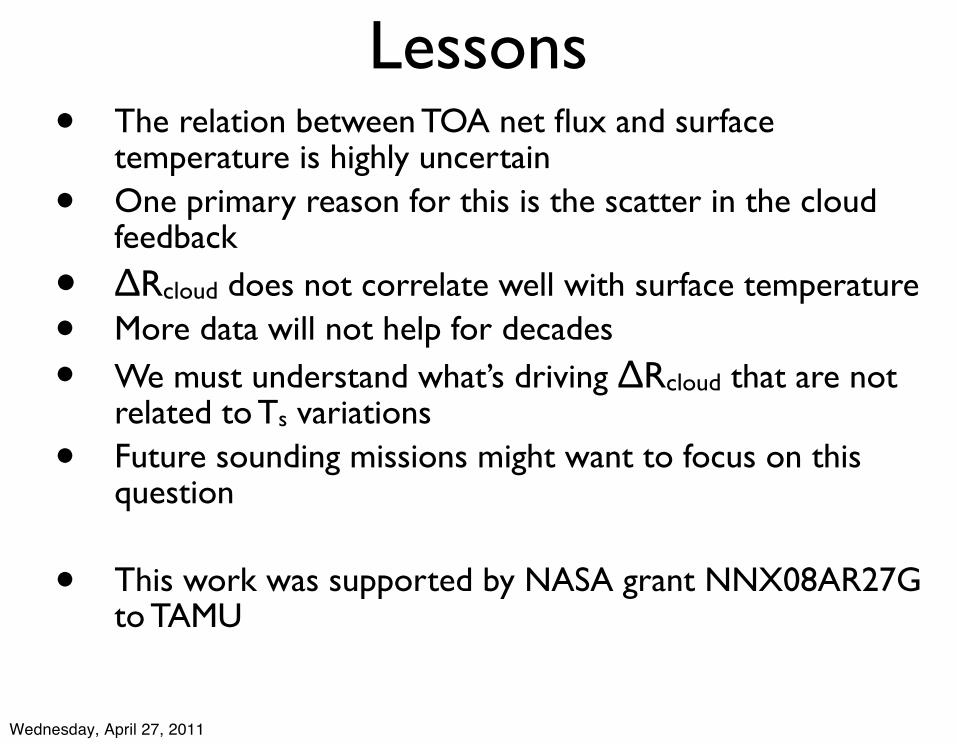
Lessons• The relation between TOA net flux and surface
temperature is highly uncertain
Wednesday, April 27, 2011

Lessons• The relation between TOA net flux and surface
temperature is highly uncertain
• One primary reason for this is the scatter in the cloud feedback
Wednesday, April 27, 2011
Lessons• The relation between TOA net flux and surface
temperature is highly uncertain
• One primary reason for this is the scatter in the cloud feedback
• ∆Rcloud does not correlate well with surface temperature
Wednesday, April 27, 2011
Lessons• The relation between TOA net flux and surface
temperature is highly uncertain
• One primary reason for this is the scatter in the cloud feedback
• ∆Rcloud does not correlate well with surface temperature
• More data will not help for decades
Wednesday, April 27, 2011
Lessons• The relation between TOA net flux and surface
temperature is highly uncertain
• One primary reason for this is the scatter in the cloud feedback
• ∆Rcloud does not correlate well with surface temperature
• More data will not help for decades
• We must understand what’s driving ∆Rcloud that are not related to Ts variations
Wednesday, April 27, 2011

Lessons• The relation between TOA net flux and surface
temperature is highly uncertain
• One primary reason for this is the scatter in the cloud feedback
• ∆Rcloud does not correlate well with surface temperature
• More data will not help for decades
• We must understand what’s driving ∆Rcloud that are not related to Ts variations
• Future sounding missions might want to focus on this question
Wednesday, April 27, 2011
Lessons• The relation between TOA net flux and surface
temperature is highly uncertain
• One primary reason for this is the scatter in the cloud feedback
• ∆Rcloud does not correlate well with surface temperature
• More data will not help for decades
• We must understand what’s driving ∆Rcloud that are not related to Ts variations
• Future sounding missions might want to focus on this question
• This work was supported by NASA grant NNX08AR27G to TAMU
Wednesday, April 27, 2011
45
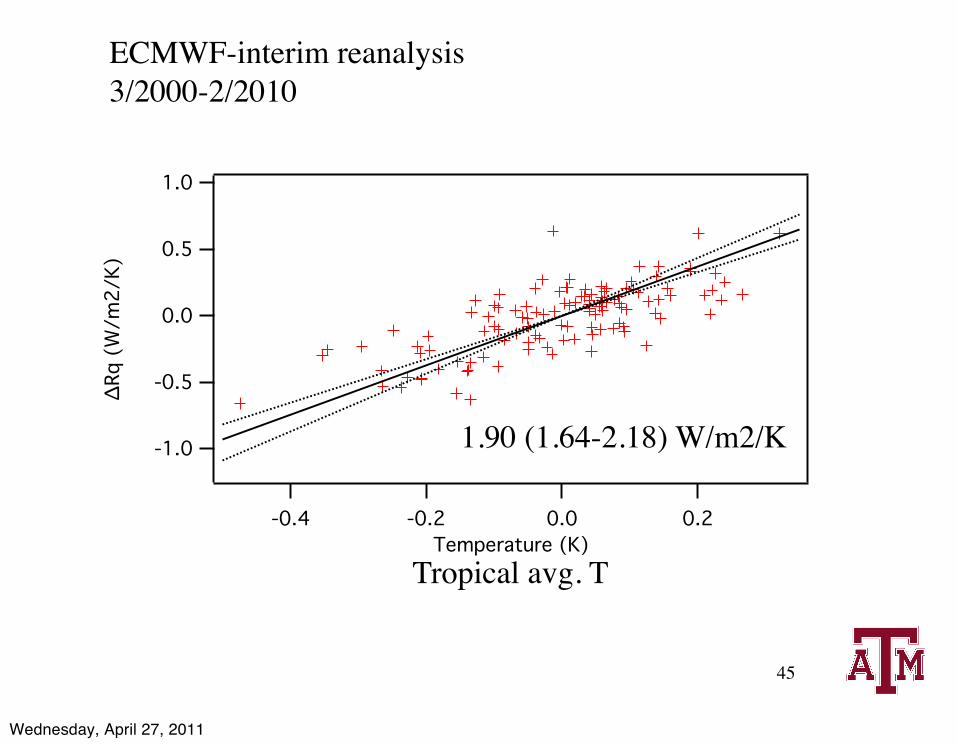
ECMWF-interim reanalysis3/2000-2/2010
-1.0
-0.5
0.0
0.5
1.0
∆Rq
(W/m
2/K)
-0.4 -0.2 0.0 0.2Temperature (K)
Tropical avg. T
1.90 (1.64-2.18) W/m2/K
Wednesday, April 27, 2011
46
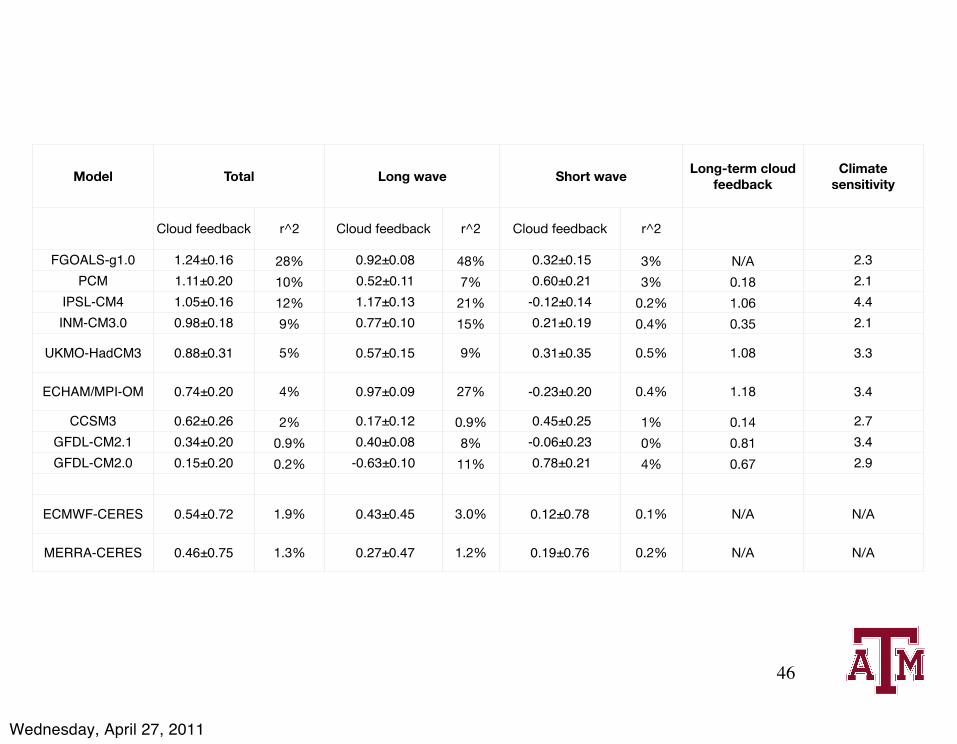
Model TotalTotal Long waveLong wave Short waveShort waveLong-term cloud
feedbackClimate
sensitivity
Cloud feedback r^2 Cloud feedback r^2 Cloud feedback r^2
FGOALS-g1.0 1.24±0.16 28% 0.92±0.08 48% 0.32±0.15 3% N/A 2.3PCM 1.11±0.20 10% 0.52±0.11 7% 0.60±0.21 3% 0.18 2.1
IPSL-CM4 1.05±0.16 12% 1.17±0.13 21% -0.12±0.14 0.2% 1.06 4.4INM-CM3.0 0.98±0.18 9% 0.77±0.10 15% 0.21±0.19 0.4% 0.35 2.1
UKMO-HadCM3 0.88±0.31 5% 0.57±0.15 9% 0.31±0.35 0.5% 1.08 3.3
ECHAM/MPI-OM 0.74±0.20 4% 0.97±0.09 27% -0.23±0.20 0.4% 1.18 3.4
CCSM3 0.62±0.26 2% 0.17±0.12 0.9% 0.45±0.25 1% 0.14 2.7GFDL-CM2.1 0.34±0.20 0.9% 0.40±0.08 8% -0.06±0.23 0% 0.81 3.4GFDL-CM2.0 0.15±0.20 0.2% -0.63±0.10 11% 0.78±0.21 4% 0.67 2.9
ECMWF-CERES 0.54±0.72 1.9% 0.43±0.45 3.0% 0.12±0.78 0.1% N/A N/A
MERRA-CERES 0.46±0.75 1.3% 0.27±0.47 1.2% 0.19±0.76 0.2% N/A N/A
Wednesday, April 27, 2011
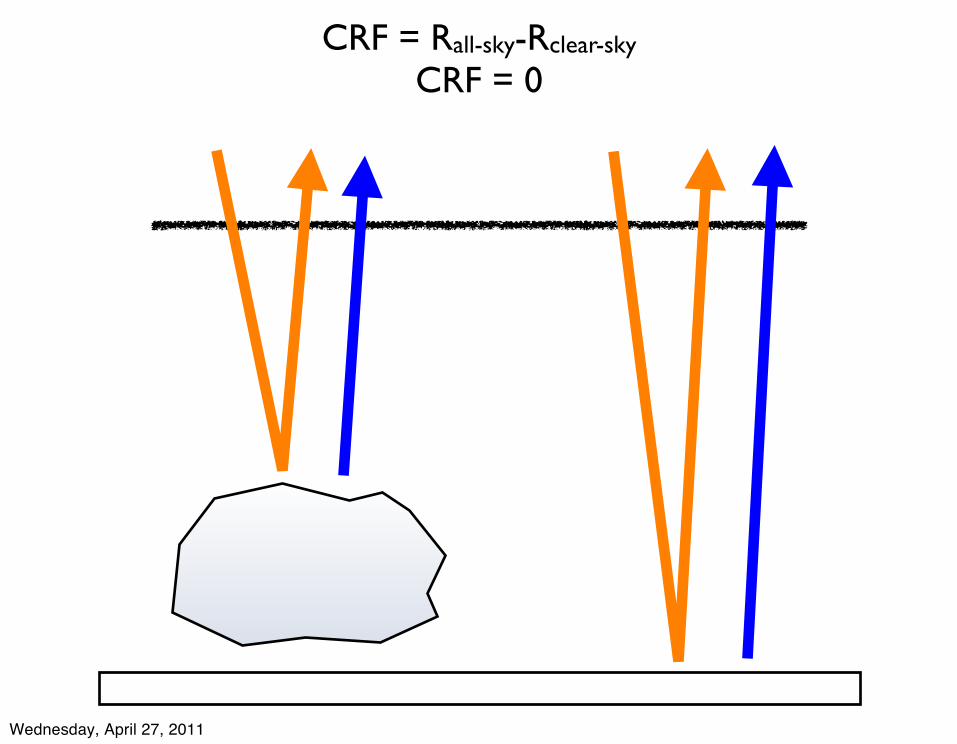
CRF = Rall-sky-Rclear-sky
CRF = 0
Wednesday, April 27, 2011
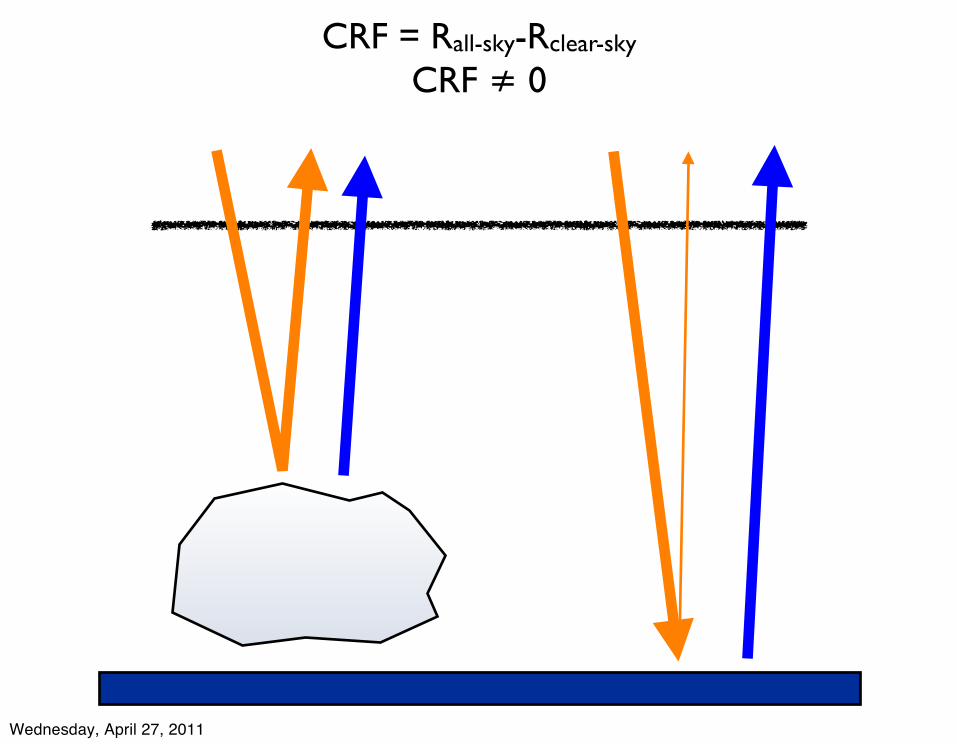
CRF = Rall-sky-Rclear-sky
CRF ≠ 0
Wednesday, April 27, 2011
Related Documents


![world.toagroup.com...the natural world and is very effective in creating a country style. TOA Prairie TOA TOA TOA 851B TOA C] TOA 12 04 Make you feel like adventures in Africa. with](https://static.cupdf.com/doc/110x72/5f0a99557e708231d42c6c3c/world-the-natural-world-and-is-very-effective-in-creating-a-country-style.jpg)