Understanding the Poisoning, Aging and Degradation of Low-temperature Fuel Cell Electrocatalysts using in situ X-ray Absorption Spectroscopy by Badri Shyam B.E. Chemical Engineering 2005, R.V. College of Engineering, Bangalore, India A Dissertation submitted to The Faculty of Columbian College of Arts and Sciences of The George Washington University in partial satisfaction of the requirements for the degree of Doctor of Philosophy May 16 th , 2010 Dissertation directed by David E. Ramaker Columbian Professor of Chemistry

Welcome message from author
This document is posted to help you gain knowledge. Please leave a comment to let me know what you think about it! Share it to your friends and learn new things together.
Transcript
Understanding the Poisoning, Aging and Degradation of Low-temperature Fuel Cell Electrocatalysts using in situ X-ray Absorption Spectroscopy
by Badri Shyam
B.E. Chemical Engineering 2005, R.V. College of Engineering, Bangalore, India
A Dissertation submitted to
The Faculty of Columbian College of Arts and Sciences
of The George Washington University in partial satisfaction of the requirements for the degree of Doctor of Philosophy
May 16th, 2010
Dissertation directed by
David E. Ramaker
Columbian Professor of Chemistry
ii
The Columbian College of Arts and Sciences of The George Washington University
certifies that Badri Shyam has passed the Final Examination for the degree of Doctor of
Philosophy as of March 25th, 2010. This is the final and approved form of the
dissertation.
Understanding the Poisoning, Aging and Degradation of Low-temperature Fuel Cell Electrocatalysts using in situ X-ray Absorption Spectroscopy
Badri Shyam
Dissertation Research Committee:
David E. Ramaker, Columbian Professor of Chemistry, Dissertation Director
Akos Vertes, Professor of Chemistry and of Biochemistry & Molecular
Biology, Committee member
Vladislav Sadtchenko, Associate Professor of Chemistry, Committee member
Stuart Licht, Professor of Chemistry, Committee member

iii
© Copyright 2010 by Badri Shyam
All rights reserved.

iv
Dedication
To Mum and Dad

v
Acknowledgments
First and foremost, I would like to take this opportunity to offer my sincerest
gratitude and thanks to Dr. Ramaker for being such a wonderful mentor and role-model. I
consider myself extremely fortunate to have worked closely with someone like him.
Always interested, invested, curious and in child-like wonder about the workings of the
world, he has inspired me to keep probing and keep asking questions, both big and small.
I would venture to say that our interactions represented the very best that academic life
anywhere has to offer. I was constantly reminded that it is indeed a beautiful thing to
pursue a passion with someone who cares deeply, to be together lost in thought and
completely absorbed in a problem, and finally, to always hold yourself to the highest
standards of integrity and quality of work. It is due to him that I can say that graduate
school at GW has been a most fulfilling experience. Needless to say, Dr. Ramaker has
left an indelible mark on the way I will teach and carry out research. For that and much
more, I am truly grateful.
I would like to thank the Chemistry Department and the Columbian College of Arts &
Sciences at GW for the fellowships and awards that funded my education here. None of it
would have been possible without their generous support. I would like to specially thank
the department and its’ members for providing a cheerful and spirited work environment
which made me feel so much at home in my lab and around the department. I think that
Shanna in particular, has single-handedly been responsible for most of the smooth
functioning of the chemistry department office. On good days or bad, she was always
there with a word of encouragement and a smile, and willing to help with any official
vi
paperwork at all times. As an international student, the amount of paperwork can be
overwhelming at times and I thank her for just being there whenever anything had to be
processed to ensure that it all went off smoothly. I will dearly miss her lively company.
I would like to thank the readers, Prof. Vertes and Prof. Sadtchenko for their careful
and critical proof-reading during the preparation of the final draft of the dissertation.
Thank you for your time and willingness to serve as readers amidst your busy schedules.
Within the Ramaker research group, I would like to thank Frances and Danny for
teaching me how to use the IFEFFIT suite to analyze XAS data. They both patiently
worked through a number of examples with me just as I was coming up the learning
curve during my first few semesters in school. Their expert assistance and companionship
is greatly appreciated. I would also like to acknowledge fellow current group members,
Anna and Maryam for their friendship, camaraderie and assistance in numerous ways
over the last few years. I have really enjoyed our time together and look forward to
keeping in touch in the years to come.
I have also been fortunate to work with a number of excellent researchers over the
last five years. In particular, I have benefited tremendously from our close collaboration
with Prof. Sanjeev Mukerjee’s group at Northeastern University. Tom and Joe taught me
most of what I know about running in situ XAS experiments even as navigating through
the maze of wires, equipment and software at the beamlines proved a real challenge
during my first few trips to the synchrotron facility. Their expertise was handed down to
me very generously. In particular, I have had the pleasure of working closely with Tom
on a number of research projects. Three of them are presented as complete chapters in
this dissertation. Our relationship has progressed from being colleagues to one of warm

vii
friendship and I really hope that we will create opportunities to collaborate on fun
research problems down the road. I would like to thank Sanjeev for inviting me to work
with his group in the summer of 2008. It was one of the most fruitful and fun summers I
have had during grad school – one outcome being that since then, I have collaborated
with nearly everyone working on fuel cells within their group on various projects that
really pushed me to learn more and take on more challenging problems. Another research
group we collaborated with over the last couple of years is Prof. Yu Ye Tong’s research
group at Georgetown University. Our research areas overlapped at a very exciting point
and led to an interesting finding in the electrochemistry of stabilized nanoparticles. I
thank Ceren, now Dr.Ceren Susut, for all her assistance with running the electrochemistry
and never failing to provide me with interesting catalyst samples for my trips up to
Brookhaven.
While teaching labs and doing research can be a daunting task, in my opinion, it is
also one of the most fulfilling and rewarding things a graduate student can experience.
After my first semester of teaching, I decided I would teach for the rest of graduate
school and I thank Dr. Ramaker and Dr. King for being simply and wholeheartedly
supportive of my decision. I have to thank, in particular, Dr. King for trusting an
engineer-turned-physical chemist to handle an organic chemistry lab session. I would like
to extend my deepest gratitude to him for all the support and encouragement he has
offered me in more ways than one. I have always admired his articulation and clarity of
expression that are hallmarks of all his lectures for the lab sessions. While I surely cannot
measure his impact on my pedagogical outlook, I learnt from him that if one can be
caring, fun, warm and always have time for your students, all of this while being chair of

viii
the department, it is surely the least you can expect of yourself as a graduate teaching
assistant. I would also like to mention that handling labs without Mr. Kingsbury or
Anthony (the man) would just not have been near as fun. Thanks for your competent
assistance and lively company during all those lab sessions I’ve been in and out of in the
last five years.
I have also been very lucky to have had some truly exceptional students in my lab
sessions. Owing to overlapping interests, perspectives and values, strong friendships with
some of them seemed inevitable and resulted in many memorable moments, both within
and outside of Corcoran Hall. In particular, I’d like to mention Stephen, with whom I
have had many intellectually refreshing conversations over coffee outside Starbucks, or
on random late-night walks around GW. Jeff and Alex – you are both wonderful people
and I feel very fortunate to have shared such a close friendship with both of you. Jeff
insisted that I stay at his childhood home in Watertown during my research stint at
Northeastern University two summers ago. I will always cherish our discussions and
walks around Harvard Square, our frequent trips to the Watertown Public Library and our
repeated playing of George Harrison’s ‘All Things Must Pass’ on the old record player
upstairs. Nan, Jeff’s grandma, cared for me as if I were a grandson myself and ensured
that I was eating and sleeping properly during my time there. In short, it was a perfect
summer and I couldn’t have planned it better if I tried. Thanks for everything.
I would also like to acknowledge a significant role my uncle, Govind Mama, played
in igniting my deep-seated interest for research. I was only eight or nine years old when
he took all the kids in our family to the Raman Research Institute in Bangalore for the
screening of a documentary. It was one of the several critically acclaimed National

ix
Geographic Specials shot by the legendary wildlife film-maker, Hugo Van Lawick; and it
completely blew my mind. The excitement and thrill of observing wild cats and big game
in their natural habitat, scenes of collecting, documenting and compiling volumes of data
in their tents, sweeping shots of the African Savannah and dramatic scenes of survival in
the wild, all of it presented larger than life on a giant screen in the auditorium made a
tremendous impact on me. Ever since that day, I would go to the Institute regularly and
watch many more such documentaries. And I had made up my mind on what I wanted to
do – study things. I thank him for opening up my little world.
I am grateful for the many powerful influences and examples I have had, both within
the family and among wonderful family friends; not the least among them were my
parents’ role in my education. They provided a great atmosphere of books and music and
over the years, let me read indiscriminately without once suggesting that I finish my
schoolwork first. I thank them both, and my dear sister, Niti, for being in constant support
and happiness for everything I choose to do.
Finally, I wish to acknowledge the unconditional friendships that have been extended
to me by many wonderful people I got to know at GW. It would not be too much of a
stretch to say that my quality of life here would have been severely impacted if it weren’t
for all of you. Five years and thousands of miles away from home can be a significant
challenge for anyone and you all made sure that I didn’t feel a thing. Kartik and Anton
were among my first close friends here and were largely responsible for easing my
transition to life in Washington. Anton’s parents (and Ellaine, of course) welcomed me
into their home and always made sure that I was well-fed and had a reading corner during
any breaks or extended holidays. I will truly miss their warm company and will always

x
have fond memories of all our times together. Nick, Erikka, Chris and Holly – three
holidays that stand out for me during grad school are the ones I’ve spent at your homes.
Your friendship has been invaluable in so many ways. Thanks for being there always and
for your constant reminders that there is a life outside the lab. As peers I look up to, Nick
and Karah have been two simply fantastic people and I was so lucky that their labs were
just down the hall from my own lab. Research interests aside, Nick and I share a deep
passion for teaching and I have learnt many a thing from him during our many
discussions and jam sessions over late night cups of tea. I am particularly grateful to him
for letting me stay over at his place during the crazy snowstorm as he ensured that I had
plenty to eat, giant amounts of orange juice to drink and no snow to plow while I was
working feverishly to finish my dissertation on time. Karah’s enthusiasm for research is
so visible that it is outright contagious. Her leadership during the planning of the
symposium at the ACS National Meeting at Salt Lake City was commendable and I thank
her for all that she has been for me, both as a colleague and as a friend. There are so
many more people I have to mention, but among them – Shelley, Oana, Jeff (the
Platonist), Benny, Shishir, Frank & Caroline, Zach, Neely, Joanna, Julie, Deep, Dinesh,
Baji … I thank them all for their constant friendship and company. I am especially
grateful for every one of them for being there for me when I had to be home one winter
break when Mom took really ill. Their love and support during my time in graduate
school here at GW have meant more to me than they will ever know. If I have left anyone
out here, please forgive me for it. I am sure you are aware of your role, just as anyone
else acknowledged here, in making my time in Washington a really special one.
xi
Abstract
Understanding the Poisoning, Aging and Degradation of Low-temperature Fuel Cell Electrocatalysts using in situ X-ray Absorption Spectroscopy
In situ x-ray absorption spectroscopy (XAS) was employed in this dissertation to
probe the poisoning and degradation of platinum (and Pt-based) electrocatalysts under
realistic operating conditions. XAS is a high-energy spectroscopic technique able to
provide both structural and electronic information, and therefore is uniquely suited to
study electrocatalysts in operando. The conventional EXAFS analysis was combined
with the novel ∆µ-XANES method to provide both nanoparticle morphology and
adsorbate coverages on commercially available fuel cell catalysts. The spectroscopic data
were complemented with data from electrochemical techniques such as cyclic
voltammetry (CV) and chronoamperometry (CA), along with rotating disk electrode
(RDE) and copper underpotential deposition (Cu upd) experiments.
The loss of catalytic activity in a fuel cell with age occurs through two chief
processes: poisoning of active surface sites and loss of surface sites through particle
morphological changes, coalescence and aggregation. All of these processes were
investigated using spectroscopic and electrochemical techniques. The poisoning of Pt/C
electrocatalysts by chloride and ruthenium ions was studied using in situ XAS. RDE
experiments show unequivocally that adsorbed chloride drastically hinders the Pt
reactivity by blocking active surface sites and by increasing the overpotential for the
oxygen reduction reaction (ORR) by approximately 85 mV for every 10-fold increase in
chloride concentration. Through the use of the Δμ-XANES method, we were able to
provide direct spectroscopic evidence for site-specific adsorption of Cl- ions on the 3-fold
sites of the (111) planes of Pt nanoparticles, although some of the adsorbed chloride are
xii
forced into bridged or atop sites by strong lateral interactions at high Cl coverage.
It has been established in the literature that ruthenium ions are released into the
electrolyte as a result of degradation of PtRu anode catalysts. The electrochemistry,
electron-spin resonance (ESR) and XAS results reported in this thesis collectively
confirm earlier findings that these species travel through the polymer membrane and
deposit onto Pt/C cathodes, decreasing the ORR activity. ESR results show that the Ru
ions deposited in the membrane alter the hydration levels and transport properties of the
membrane. The deposition of Ru on the Pt cathode was found to be most severe at open
circuit potential (ca. 0.95 V vs. RHE), when the surface is partially covered with O
anions, which may induce a Coulombic attraction for the Ru cations. Comparisons
between the experimental Δμ-XANES results and full multiple scattering calculations
using the FEFF 8.0 code on Pt6 model clusters suggest that the Ru species adsorb
primarily in 3-fold sites on the Pt surface. Semi-quantitative estimates of the Ru coverage
on the Pt/C catalysts, the first such estimate using XAS, are shown to be in good
agreement with other studies in the literature.
An in situ XAS study at both the Pt L3 and Ru K edges on the stability of two
commercial PtRu catalysts aged through voltammetric cycling, along with
chronoamperometry results, reveals that the initial morphology of the PtRu nanoparticles
plays a major role in the catalysts long term stability. Δμ-XANES analysis was carried
out to follow the site number changes with aging, while EXAFS analysis provided
structural information on the changing composition and morphology of the catalysts. It
was found that the samples with larger, more oxidized Ru islands on the nanoparticle
surface are less susceptible to Ru dissolution than those with smaller, more metallic Ru
xiii
islands. Further, as expected, the smaller Ru islands grew faster than their more oxidized
counterparts. These findings and other insights provide an increased understanding of the
observed changes in the methanol oxidation CVs with aging.
Polyvinyl Pyrrolidone (PVP) is a widely used organic capping agent that is also used
to prevent coalescence and aggregation in nanoparticles, effectively slowing the aging
process that commonly occurs during catalysis. While it is generally accepted that a small
amount of PVP (ca. 5-10 wt. %) remains closely associated with the synthesized
nanoparticles to retain their shape, it has been generally assumed that the PVP itself does
not alter the catalytic activity of the Pt. We report that PVP-capped Pt/C nanoparticles
display a remarkable enhancement of their methanol oxidation activity over plain Pt/C
nanoparticles with the exact same size and nanostructure, corroborating a recent study on
Pt black catalysts. Thus the PVP capping agent not only stabilizes the nanoparticles
against aging, but also plays a role, presumably through a ligand effect, in enhancing the
Pt catalytic activity for certain reactions. An in situ XAS study aimed at directly probing
the PVP-Pt interaction reveals that this interaction is potential-dependent: a more neutral
PVP-Pt interaction (PVPN) exists at lower potentials (V < 0.60 V vs. RHE) and changes
to a stronger interaction at higher potentials, involving charge-transfer (PVPCT) from the
PVP to Pt. Theoretical FEFF 8.0 calculations modeling the PVPCT/Pt suggest that the
PVPCT bonds to platinum in atop sites, while the PVPN appears to be either more mobile
or not in registry on the surface. Further, CV data suggests that the PVPN preferentially
blocks H adsorption at sites on the (100) faces.
xiv
Table of Contents
Dedication .......................................................................................................................... iv
Acknowledgments............................................................................................................... v
Abstract .............................................................................................................................. xi
List of Figures ................................................................................................................ xviii
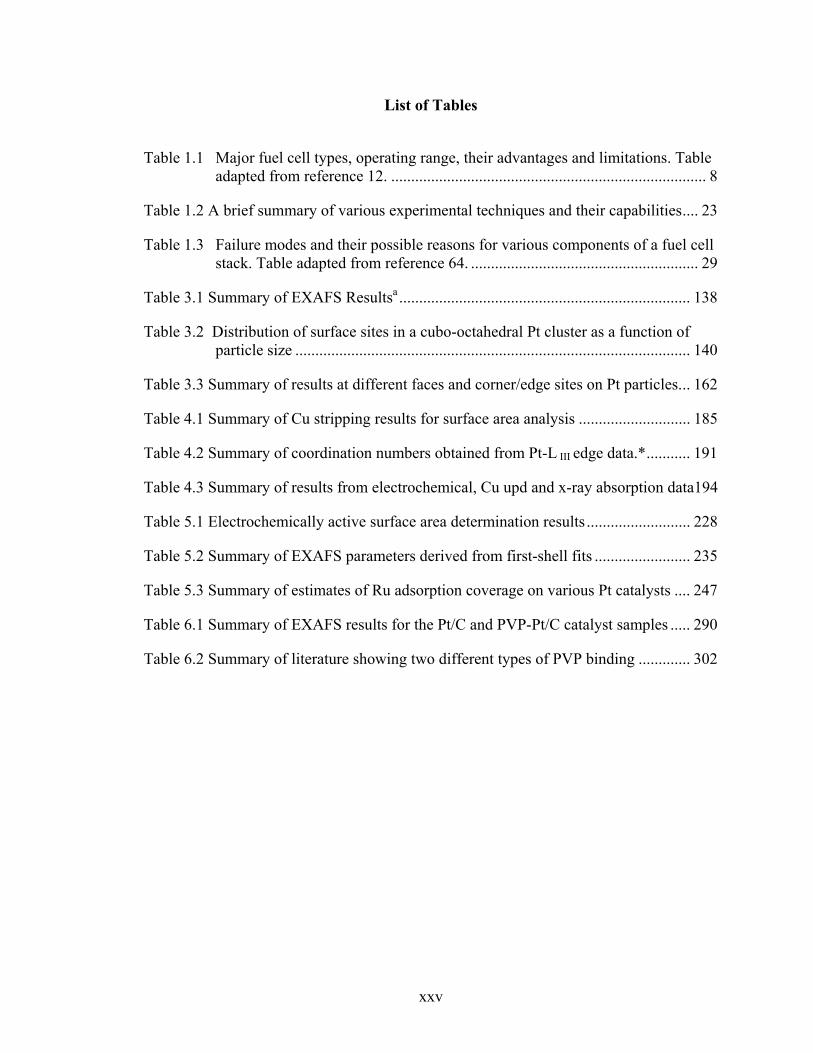
List of Tables .................................................................................................................. xxv
List of Abbreviations…………………………………………………………..............xxvi Chapter 1............................................................................................................................. 1
Introduction......................................................................................................................... 1
1.1 Fuel Cells .................................................................................................................. 2 1.1.1 A brief history of energy technologies prior to and leading to the fuel cell ...... 2 1.1.2 The historical development of the fuel cell........................................................ 5 1.1.3 The basic operating principles of the fuel cell ................................................. 12 1.1.4 Problems keeping the direct methanol fuel cell from commercialization ....... 14 1.1.5 Active areas of low-temperature fuel cell research.......................................... 16
1.2 Characterization of Fuel Cell Catalysts .................................................................. 19 1.2.1 The importance of in operando studies - bridging the structure and pressure gaps in heterogeneous catalysis ................................................................................ 19 1.2.2 Summary of Characterization Techniques...................................................... 22
1.3 Electrocatalyst Degradation .................................................................................... 27 1.3.1 Particle dissolution and growth........................................................................ 30
1.3.1.1 The thermodynamics of dissolution. ......................................................... 30 1.3.1.2 The mechanism for degradation. .............................................................. 32 1.3.1.3 Effects of metal alloying on degradation. ................................................. 38
1.3.2 Degradation of support .................................................................................... 39 1.3.2.1 Dissolution of carbon................................................................................ 39 1.3.1.2 Alternatives to carbon support.................................................................. 41
1.4 Organization of the Dissertation ............................................................................. 43 1.5 References............................................................................................................... 47
Chapter 2........................................................................................................................... 59
In situ X-ray Absorption Spectroscopy: Experiment, Theory and Analysis .................... 59
2.1 XAS – An overview................................................................................................ 59 2.2 Synchrotron Radiation and Experimental methods ................................................ 62
2.2.1 In situ spectroelectrochemical cell for XAS experiments: aspects of design and development ....................................................................................................... 71
xv
2.3 Principles of x-ray absorption spectroscopy........................................................... 76 2.3.1 Historical note on the development of the theory of the x-ray absorption spectrum.................................................................................................................... 82 2.3.2 A mathematical description of the EXAFS region .......................................... 86
2.4 EXAFS analysis ...................................................................................................... 91 2.5 XANES analysis ..................................................................................................... 97
2.5.1 The ∆μ-XANES method .................................................................................. 98 2.5.2 Data analysis .................................................................................................... 98
2.6 In situ vs. in operando XAS on electrodes and electrocatalysts – a literature review..................................................................................................................................... 104 2.7 References............................................................................................................. 111
Chapter 3......................................................................................................................... 123
An Investigation into the Competitive and Site-Specific Nature of Anion Adsorption on Pt Using In Situ X-ray Absorption Spectroscopy........................................................... 123
3.1 Introduction........................................................................................................... 123 3.2 Experimental ......................................................................................................... 128
3.2.1 Electrochemical Characterization .................................................................. 128 3.2.2 In Situ XAS Data Collection.......................................................................... 129 3.2.3 EXAFS and Δμ analysis ................................................................................ 130 3.2.4 Alignment and normalization of XAS data ................................................... 130
3.3 Results and Discussion ......................................................................................... 131 3.3.1 Electrochemical Characterization .................................................................. 131 3.3.2 EXAFS Results .............................................................................................. 136 3.3.3 Δμ-XANES Results ....................................................................................... 144 3.3.4 The 0.4 - 0.7 V region.................................................................................... 149 3.3.5 Chloride adsorption and rearrangement......................................................... 150 3.3.6 Water activation on low index Pt planes, corners and edges......................... 154 3.3.7 Interplay of bisulfate and halide ions on Pt ................................................... 157
3.4 Summary and Conclusions ................................................................................... 160 3.5 Acknowledgments................................................................................................. 164 3.6 References............................................................................................................. 165
Chapter 4......................................................................................................................... 170
Effect of RuOxHy Island Size on PtRu Particle Aging in Methanol ............................... 170
4.1 Introduction........................................................................................................... 170 4.2 Experimental Methods and Data Analysis............................................................ 175
4.2.1 Electrode preparation and XAS cell assembly............................................... 175 4.2.2 In Situ XAS measurements............................................................................ 176 4.2.3 Electrochemical Measurements .................................................................... 178 4.2.4 XANES and EXAFS analysis....................................................................... 179 4.2.5 FEFF 8.0 calculations ................................................................................... 181
4.3 Results.................................................................................................................. 182
xvi
4.3.1 Electrochemical Characterization .................................................................. 182 4.3.2 EXAFS.......................................................................................................... 187 4.3.3 Δµ-XANES Analysis .................................................................................... 190
4.4 Discussion ............................................................................................................ 198 4.4.1 Oxidation state of Ru islands ......................................................................... 198 4.4.2 Ru dissolution and agglomeration ................................................................. 199 4.4.3 Pt dissolution and agglomeration................................................................... 201 4.4.4 Interpretation of CO stripping curve changes................................................ 202
4.5 Conclusions........................................................................................................... 203 4.7 References............................................................................................................. 205
Chapter 5......................................................................................................................... 210
Fundamental Aspects of Spontaneous Cathodic Deposition of Ru onto Pt/C Electrocatalysts and Membranes under Direct Methanol Fuel Cell Operating Conditions: An In situ X-ray Absorption Spectroscopy and Electron Spin Resonance Study .......... 210
5.1 Introduction........................................................................................................... 210 5.2 Experimental Section ............................................................................................ 217
5.2.1 Electrochemical Characterization .................................................................. 217 5.2.2 Flow-through Cell Design.............................................................................. 219 5.2.4 EXAFS Analysis............................................................................................ 223 5.2.5 Δμ Analysis.................................................................................................... 224 5.2.6 Electron Spin Resonance ............................................................................... 225
5.3 Results and Discussion ......................................................................................... 227 5.3.1 Electrochemical Characterization .................................................................. 227 5.3.2 EXAFS Analysis............................................................................................ 231 5.3.3 Experimental Δμ Analysis ............................................................................. 237 5.3.4 FEFF Modeling.............................................................................................. 244 5.3.5 Deposition time dependence and coverage.................................................... 250 5.3.6 ESR results..................................................................................................... 252
5.4 Summary and Conclusions ................................................................................... 256 5.5 References............................................................................................................. 259
Chapter 6......................................................................................................................... 266
Probing the Influence of Polyvinyl Pyrrolidone (PVP) on Supported Platinum Electrocatalysts in 0.1M HClO4 Using in situ X ray Absorption Spectroscopy............. 266
6.1 Introduction........................................................................................................... 266 6.2 Experimental ......................................................................................................... 272
6.2.1 Catalyst synthesis........................................................................................... 272 6.2.2 XAS - sample preparation and data collection .............................................. 273 6.2.3 Electrochemical measurements...................................................................... 274
6.3 EXAFS analysis .................................................................................................... 275 6.4 XANES analysis ................................................................................................... 277
6.4.1 FEFF 8.0 modeling and theoretical calculations............................................ 278
xvii
6.5 Results................................................................................................................... 279 6.6 Discussion ............................................................................................................. 291
6.6.1 How does the PVP increase the Δμ-XANES signal above 0.5 V? ................ 291 6.6.2 The PVP-Pt binding site via FEFF calculations ............................................ 297 6.6.3 Further evidence for a change of PVP interaction from EXAFS results. ...... 299 6.6.4 Evidence for two forms of bonded PVP from other spectroscopic techniques................................................................................................................................. 301 6.6.5 Does the PVP-Pt interaction affect the metal nanoparticle?.......................... 303
6.6.5.1 Previously reported results:..................................................................... 303 6.6.5.2 Evidence from current work: .................................................................. 304
6.6.5.2.1 PVPN at lower potentials .................................................................. 305 6.6.5.2.2 PVPCT at higher potentials ............................................................... 306
6.6.6 Selective or preferential binding of PVP to certain low-index Pt planes (other reports) .................................................................................................................... 310
6.7 Conclusions........................................................................................................... 312 6.8 References............................................................................................................. 314
Chapter 7......................................................................................................................... 324
Conclusions..................................................................................................................... 324
7.1 Poisoning of Pt/C nanoparticles............................................................................ 328 7.1.1 Chloride poisoning......................................................................................... 328 7.1.2 Ru dissolution and poisoning......................................................................... 330
7.2 PtRu electrocatalyst degradation through morphological changes....................... 331 7.3 Probing the interaction between a stabilizing agent (PVP) and Pt/C electrocatalysts..................................................................................................................................... 333 7.4 Some limitations of XAS (experiment and theory) .............................................. 335 7.5 Looking ahead....................................................................................................... 338 7.5 References............................................................................................................. 341
Biography……………………………………………………………………………… 343 Publications……………………………………………………………………………..345 Conference Presentations……………………………………………………………….346
xviii
List of Figures
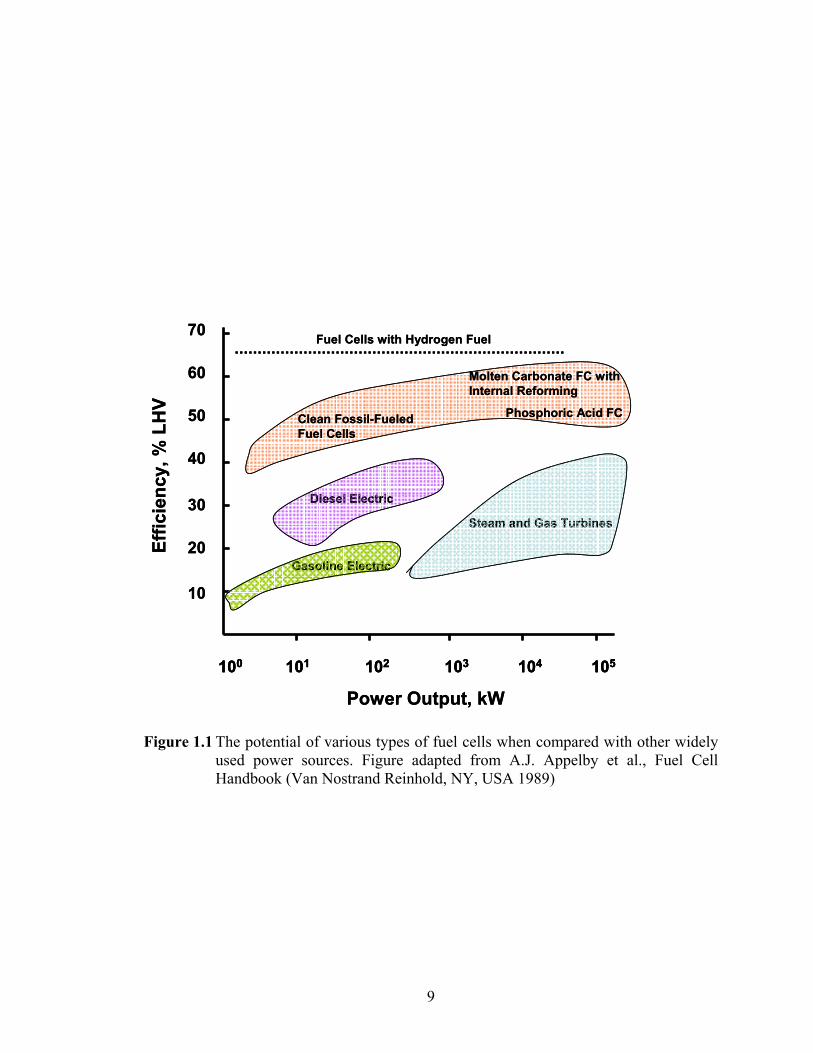
Figure 1.1 The potential of fuel cells as a power source when compared with other petroleum-based sources. Figure adapted from A.J. Appelby et al., Fuel Cell Handbook (Van Nostrand Reinhold, NY, USA 1989) ..................................... 9
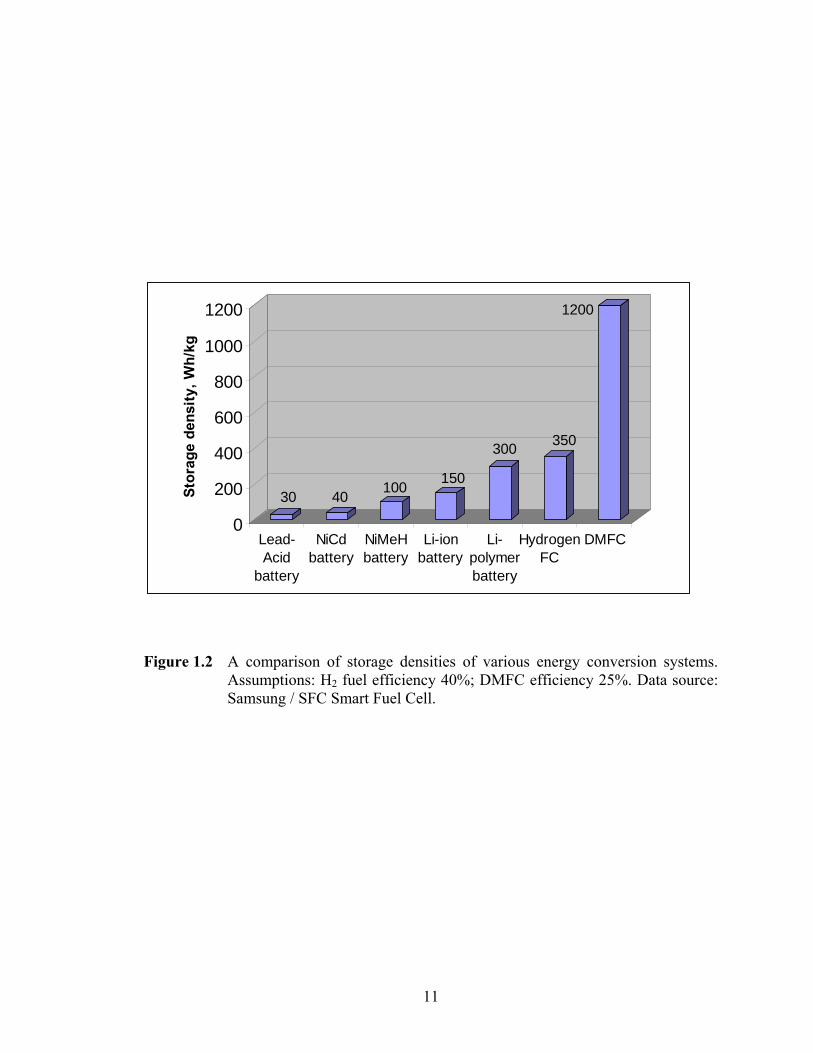
Figure 1.2 A comparison of storage densities of various energy conversion systems. Assumptions: H2 fuel efficiency 40%; DMFC efficiency 25%. Data source: Samsung / SFC Smart Fuel Cell ..................................................................... 11
Figure 1.3 Schematic of a Proton Exchange Membrane (PEM) fuel cell. Adapted from Energy & Environment, MIT Newsletter March 2005 ................................... 13
Figure 1.4 Various mechanisms of catalyst deactivation (loss of active surface area) seen in low-temperature fuel cells. Figure adapted from Shao-Horn et al.62.......... 35
Figure 1.5 Mechanism of degradation in a carbon-supported platinum catalyst showing both, Ostwald ripening and role of carbon in serving as a channel for electronic transport. Figure adapted from a study by Virkar et al.61............... 42
Figure 2.1 The National Synchrotron Light Source located at Brookhaven National Lab, Long Island, N.Y. Picture credit: Courtesy of NSLS, Brookhaven National Laboratory....................................................................................................... 64
Figure 2.2 A schematic of a double-crystal monochromator commonly used to tune the energy of the photon beam.............................................................................. 65
Figure 2.3 Schematic of experimental setup at the beamline showing the two principal methods of collecting XAS data: transmission and fluorescence. .................. 68
Figure 2.4 A typical in situ XAS experiment setup. Shown here is a flow-through in situ XAS cell setup (center) at beamline X-3B at the NSLS. The gas ionization detectors are visible at the bottom of the picture and the cryostat-cooled, solid-state fluorescence detector is seen on the left. ................................................ 69
Figure 2.5 A schematic of an X-ray absorption spectrum over a large energy range showing the K, LI and LII edges. Note that the assignment of edge energies starts from the highest-energy transition......................................................... 77
Figure 2.6 Fundamental processes occurring during an x-ray absorption event a. Excitation of a core-level electron and b. backscattering of the ejected photoelectron due to neighboring atoms surrounding the absorber atom....... 79
xix
Figure 2.7 The various types of backscattering that occur during an absorption event.... 81
Figure 2.8 A reproduction of of an early x-ray absorption spectrum showing assignments of characteristic features that are seen in the EXAFS region of the spectrum………………………………………………………………….. ..84
Figure 2.9 Example of a muffin-tin potential (solid black line) that is frequently used to
compute a theoretical EXAFS spectrum......................................................... 90
Figure 2.10 Common adsorption site geometries seen for many small molecule adsorbates...................................................................................................... 102
Figure 2.11 Adsorbate-induced redistribution of electronic charge on substrate metal atoms closest to the adsorbate. Note that the adsorption reduces the electron density between the surface Pt atoms. .......................................................... 103
Figure 3.1 ORR polarization curves and Tafel plots. (a) ORR polarization curves (anodic sweep) for 30 wt% Pt/C on a glassy carbon disk in O2 saturated 1M HClO4 and 1M HClO4 + 10-3 M KCl at 20oC using a sweep rate of 20 mV s-1. The inset includes 1M HClO4 + 10-2 M KCl (dotted); (b) Mass transfer corrected Tafel plots taken at 900 RPM for 30 wt% Pt/C in 1M HClO4 (circles), 1M HClO4 + 10-3 M KCl (triangles), and 1M HClO4 + 10-2 M KCl (squares). All current densities utilize geometric surface area. ........................................... 133
Figure 3.2 Cyclic Voltammograms of 30 wt% Pt/C (E-TEK) in Ar-saturated 1M HClO4 (solid), 1M HClO4 + 10-3 M KCl (dashed) and 1M HClO4 + 10-2 M KCl (dotted) with a scan rate of 50 mV s-1 on a 5 mm glassy carbon RDE tip at 0 RPM. The vertical lines indicate potentials at which EXAFS measurements were made ..................................................................................................... 135
Figure 3.3 Fourier Transformed EXAFS for 30 wt% Pt/C in 1M HClO4 at 0.54 V vs. RHE measured in situ at the Pt-L3 edge. Phase and amplitude parameters were fit using those generated with IFEFFIT 1.2.9 and sample data. Single shell (Pt-Pt) fit, (1.5 < k < 15.8 Å-1, k2 weighted), performed in R-space. ........... 137
Figure 3.4 Variation of the ratio of population of various coordination sites on the surface of clusters and the total number of surface sites as a function of the particle size of the cluster. Calculations were performed using the methodology developed by Benfield.48 Also shown for comparison is the evolution of the total coordination number and those of the individual sites. All calculations were made using a cubo-octahedron model cluster. ..................................... 142
Figure 3.5 EXAFS results showing change in Pt-Pt coordination as a function of electrode potential for Pt/C electrocatalyst in (a) clean 1M HClO4, (b) 1M HClO4 + 10-3 M Cl and (c) 1M HClO4 + 10-2 M Cl. ................................... 143
Figure 3.6 Pt L3 edge Δμ = μ(V, xM Cl-) - μ(0.54 V clean) spectra for 30 wt% Pt/C in 1M HClO4 and the indicated KCl concentrations......................................... 146
xx
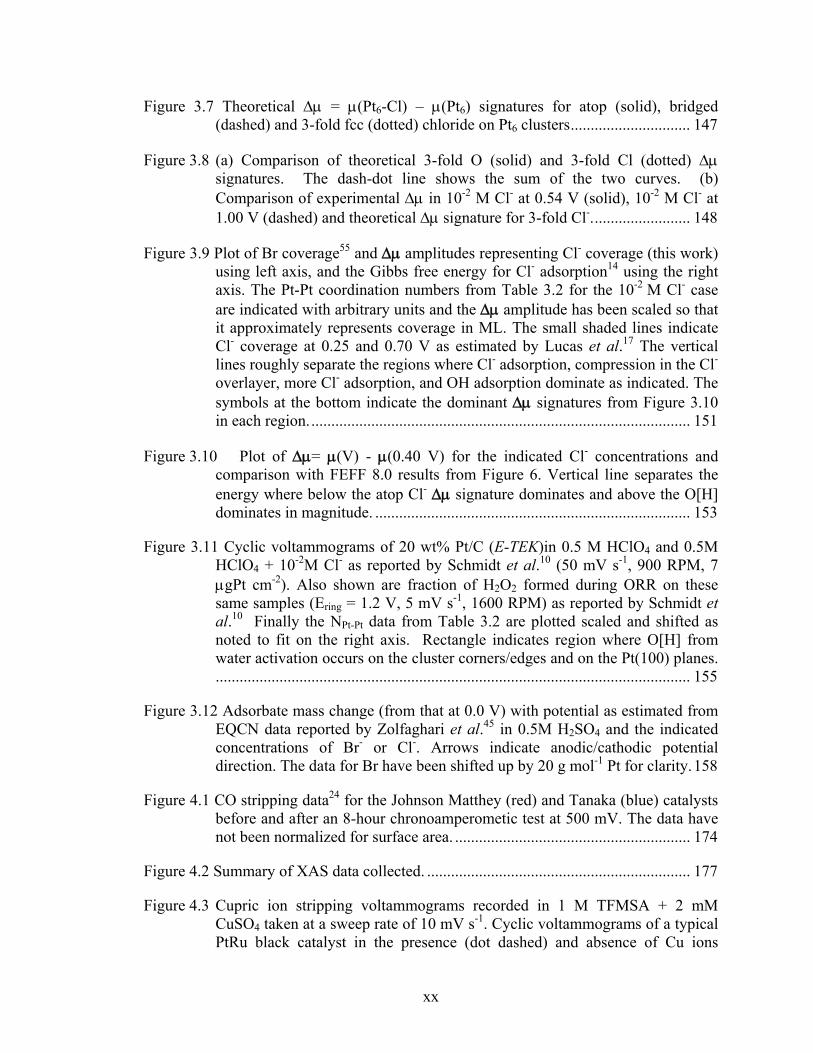
Figure 3.7 Theoretical Δμ = μ(Pt6-Cl) – μ(Pt6) signatures for atop (solid), bridged (dashed) and 3-fold fcc (dotted) chloride on Pt6 clusters.............................. 147
Figure 3.8 (a) Comparison of theoretical 3-fold O (solid) and 3-fold Cl (dotted) Δμ signatures. The dash-dot line shows the sum of the two curves. (b) Comparison of experimental Δμ in 10-2 M Cl- at 0.54 V (solid), 10-2 M Cl- at 1.00 V (dashed) and theoretical Δμ signature for 3-fold Cl-......................... 148
Figure 3.9 Plot of Br coverage55 and Δμ amplitudes representing Cl- coverage (this work) using left axis, and the Gibbs free energy for Cl- adsorption14 using the right axis. The Pt-Pt coordination numbers from Table 3.2 for the 10-2 M Cl- case are indicated with arbitrary units and the Δμ amplitude has been scaled so that it approximately represents coverage in ML. The small shaded lines indicate Cl- coverage at 0.25 and 0.70 V as estimated by Lucas et al.17 The vertical lines roughly separate the regions where Cl- adsorption, compression in the Cl- overlayer, more Cl- adsorption, and OH adsorption dominate as indicated. The symbols at the bottom indicate the dominant Δμ signatures from Figure 3.10 in each region................................................................................................ 151
Figure 3.10 Plot of Δμ= μ(V) - μ(0.40 V) for the indicated Cl- concentrations and comparison with FEFF 8.0 results from Figure 6. Vertical line separates the energy where below the atop Cl- Δμ signature dominates and above the O[H] dominates in magnitude. ............................................................................... 153
Figure 3.11 Cyclic voltammograms of 20 wt% Pt/C (E-TEK)in 0.5 M HClO4 and 0.5M HClO4 + 10-2M Cl- as reported by Schmidt et al.10 (50 mV s-1, 900 RPM, 7 μgPt cm-2). Also shown are fraction of H2O2 formed during ORR on these same samples (Ering = 1.2 V, 5 mV s-1, 1600 RPM) as reported by Schmidt et al.10 Finally the NPt-Pt data from Table 3.2 are plotted scaled and shifted as noted to fit on the right axis. Rectangle indicates region where O[H] from water activation occurs on the cluster corners/edges and on the Pt(100) planes........................................................................................................................ 155
Figure 3.12 Adsorbate mass change (from that at 0.0 V) with potential as estimated from EQCN data reported by Zolfaghari et al.45 in 0.5M H2SO4 and the indicated concentrations of Br- or Cl-. Arrows indicate anodic/cathodic potential direction. The data for Br have been shifted up by 20 g mol-1 Pt for clarity.158
Figure 4.1 CO stripping data24 for the Johnson Matthey (red) and Tanaka (blue) catalysts before and after an 8-hour chronoamperometic test at 500 mV. The data have not been normalized for surface area. ........................................................... 174
Figure 4.2 Summary of XAS data collected. .................................................................. 177
Figure 4.3 Cupric ion stripping voltammograms recorded in 1 M TFMSA + 2 mM CuSO4 taken at a sweep rate of 10 mV s-1. Cyclic voltammograms of a typical PtRu black catalyst in the presence (dot dashed) and absence of Cu ions
xxi
(dotted) showing the various underpotentially deposited regions on both Pt and Ru sites as well as the bulk Cu deposition region.................................. 183
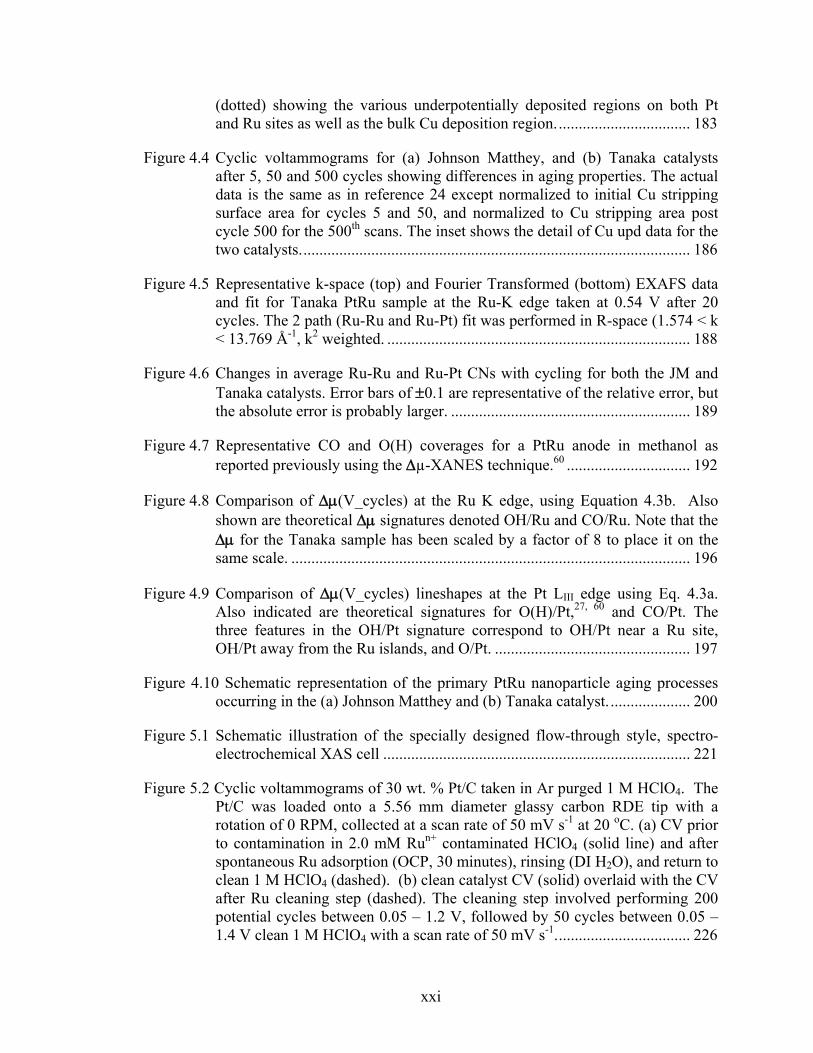
Figure 4.4 Cyclic voltammograms for (a) Johnson Matthey, and (b) Tanaka catalysts after 5, 50 and 500 cycles showing differences in aging properties. The actual data is the same as in reference 24 except normalized to initial Cu stripping surface area for cycles 5 and 50, and normalized to Cu stripping area post cycle 500 for the 500th scans. The inset shows the detail of Cu upd data for the two catalysts.................................................................................................. 186
Figure 4.5 Representative k-space (top) and Fourier Transformed (bottom) EXAFS data and fit for Tanaka PtRu sample at the Ru-K edge taken at 0.54 V after 20 cycles. The 2 path (Ru-Ru and Ru-Pt) fit was performed in R-space (1.574 < k < 13.769 Å-1, k2 weighted. ............................................................................ 188
Figure 4.6 Changes in average Ru-Ru and Ru-Pt CNs with cycling for both the JM and Tanaka catalysts. Error bars of ±0.1 are representative of the relative error, but the absolute error is probably larger. ............................................................ 189
Figure 4.7 Representative CO and O(H) coverages for a PtRu anode in methanol as reported previously using the Δµ-XANES technique.60 ............................... 192
Figure 4.8 Comparison of Δμ(V_cycles) at the Ru K edge, using Equation 4.3b. Also shown are theoretical Δμ signatures denoted OH/Ru and CO/Ru. Note that the Δμ for the Tanaka sample has been scaled by a factor of 8 to place it on the same scale. .................................................................................................... 196
Figure 4.9 Comparison of Δμ(V_cycles) lineshapes at the Pt LIII edge using Eq. 4.3a. Also indicated are theoretical signatures for O(H)/Pt,27, 60 and CO/Pt. The three features in the OH/Pt signature correspond to OH/Pt near a Ru site, OH/Pt away from the Ru islands, and O/Pt. ................................................. 197
Figure 4.10 Schematic representation of the primary PtRu nanoparticle aging processes occurring in the (a) Johnson Matthey and (b) Tanaka catalyst. .................... 200
Figure 5.1 Schematic illustration of the specially designed flow-through style, spectro-electrochemical XAS cell ............................................................................. 221
Figure 5.2 Cyclic voltammograms of 30 wt. % Pt/C taken in Ar purged 1 M HClO4. The Pt/C was loaded onto a 5.56 mm diameter glassy carbon RDE tip with a rotation of 0 RPM, collected at a scan rate of 50 mV s-1 at 20 oC. (a) CV prior to contamination in 2.0 mM Run+ contaminated HClO4 (solid line) and after spontaneous Ru adsorption (OCP, 30 minutes), rinsing (DI H2O), and return to clean 1 M HClO4 (dashed). (b) clean catalyst CV (solid) overlaid with the CV after Ru cleaning step (dashed). The cleaning step involved performing 200 potential cycles between 0.05 – 1.2 V, followed by 50 cycles between 0.05 – 1.4 V clean 1 M HClO4 with a scan rate of 50 mV s-1.................................. 226
xxii
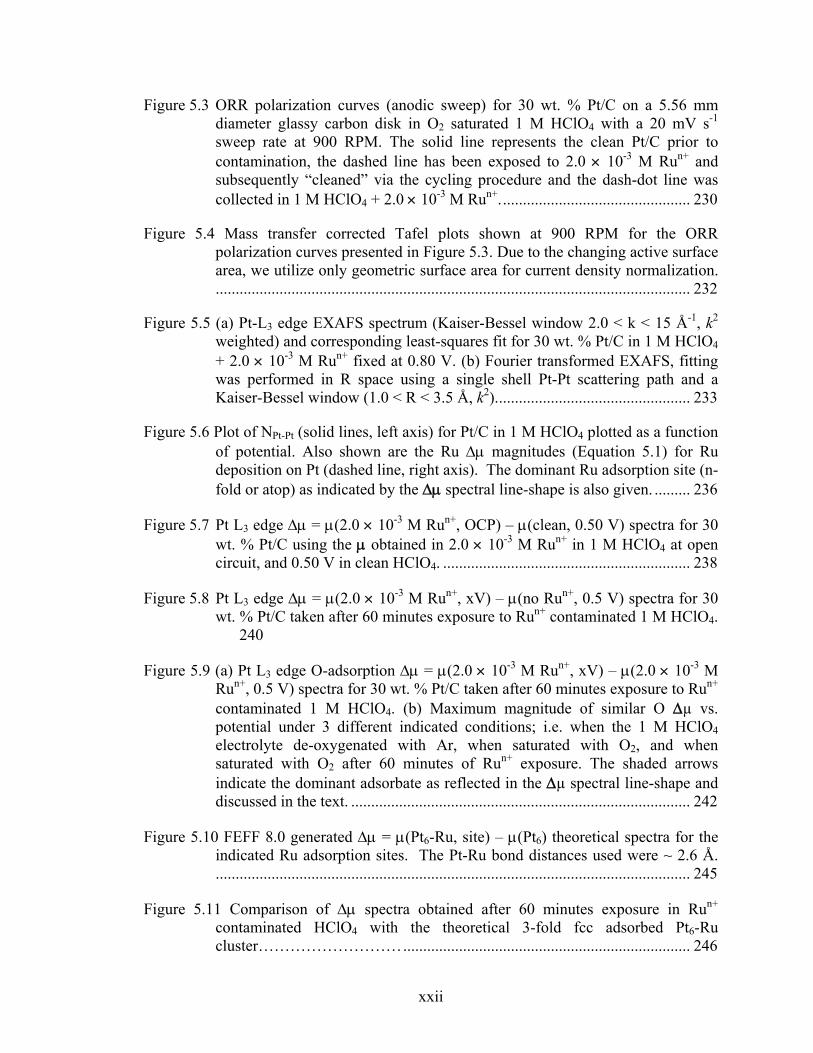
Figure 5.3 ORR polarization curves (anodic sweep) for 30 wt. % Pt/C on a 5.56 mm diameter glassy carbon disk in O2 saturated 1 M HClO4 with a 20 mV s-1 sweep rate at 900 RPM. The solid line represents the clean Pt/C prior to contamination, the dashed line has been exposed to 2.0 × 10⁻³ M Run+ and subsequently “cleaned” via the cycling procedure and the dash-dot line was collected in 1 M HClO4 + 2.0 × 10⁻³ M Run+................................................ 230
Figure 5.4 Mass transfer corrected Tafel plots shown at 900 RPM for the ORR polarization curves presented in Figure 5.3. Due to the changing active surface area, we utilize only geometric surface area for current density normalization........................................................................................................................ 232
Figure 5.5 (a) Pt-L3 edge EXAFS spectrum (Kaiser-Bessel window 2.0 < k < 15 Å-1, k2 weighted) and corresponding least-squares fit for 30 wt. % Pt/C in 1 M HClO4 + 2.0 × 10⁻³ M Run+ fixed at 0.80 V. (b) Fourier transformed EXAFS, fitting was performed in R space using a single shell Pt-Pt scattering path and a Kaiser-Bessel window (1.0 < R < 3.5 Å, k2)................................................. 233
Figure 5.6 Plot of NPt-Pt (solid lines, left axis) for Pt/C in 1 M HClO4 plotted as a function of potential. Also shown are the Ru Δμ magnitudes (Equation 5.1) for Ru deposition on Pt (dashed line, right axis). The dominant Ru adsorption site (n-fold or atop) as indicated by the Δμ spectral line-shape is also given. ......... 236
Figure 5.7 Pt L3 edge Δμ = μ(2.0 × 10⁻³ M Run+, OCP) – μ(clean, 0.50 V) spectra for 30 wt. % Pt/C using the μ obtained in 2.0 × 10⁻³ M Run+ in 1 M HClO4 at open circuit, and 0.50 V in clean HClO4. .............................................................. 238
Figure 5.8 Pt L3 edge Δμ = μ(2.0 × 10⁻³ M Run+, xV) – μ(no Run+, 0.5 V) spectra for 30 wt. % Pt/C taken after 60 minutes exposure to Run+ contaminated 1 M HClO4. 240
Figure 5.9 (a) Pt L3 edge O-adsorption Δμ = μ(2.0 × 10⁻³ M Run+, xV) – μ(2.0 × 10⁻³ M Run+, 0.5 V) spectra for 30 wt. % Pt/C taken after 60 minutes exposure to Run+ contaminated 1 M HClO4. (b) Maximum magnitude of similar O Δµ vs. potential under 3 different indicated conditions; i.e. when the 1 M HClO4 electrolyte de-oxygenated with Ar, when saturated with O2, and when saturated with O2 after 60 minutes of Run+ exposure. The shaded arrows indicate the dominant adsorbate as reflected in the Δµ spectral line-shape and discussed in the text. ..................................................................................... 242
Figure 5.10 FEFF 8.0 generated Δμ = μ(Pt6-Ru, site) – μ(Pt6) theoretical spectra for the indicated Ru adsorption sites. The Pt-Ru bond distances used were ~ 2.6 Å........................................................................................................................ 245
Figure 5.11 Comparison of Δμ spectra obtained after 60 minutes exposure in Run+ contaminated HClO4 with the theoretical 3-fold fcc adsorbed Pt6-Ru cluster………………………........................................................................ 246
xxiii
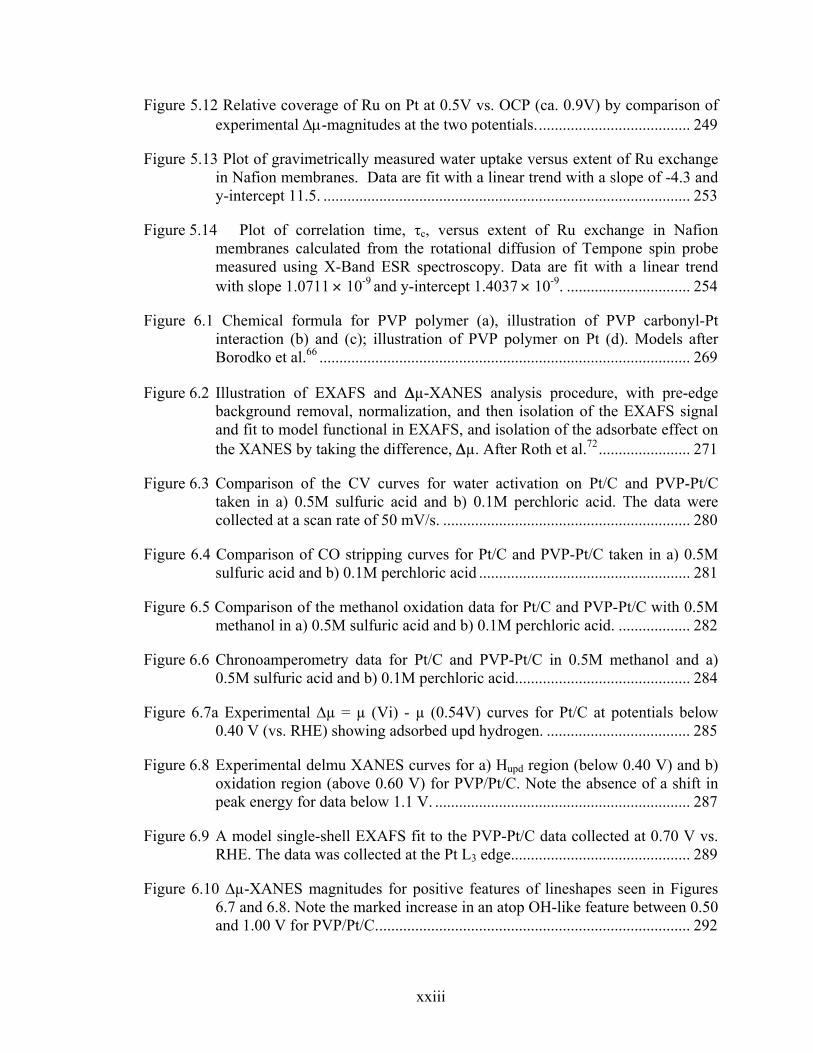
Figure 5.12 Relative coverage of Ru on Pt at 0.5V vs. OCP (ca. 0.9V) by comparison of experimental Δμ-magnitudes at the two potentials....................................... 249
Figure 5.13 Plot of gravimetrically measured water uptake versus extent of Ru exchange in Nafion membranes. Data are fit with a linear trend with a slope of -4.3 and y-intercept 11.5. ............................................................................................ 253
Figure 5.14 Plot of correlation time, τc, versus extent of Ru exchange in Nafion membranes calculated from the rotational diffusion of Tempone spin probe measured using X-Band ESR spectroscopy. Data are fit with a linear trend with slope 1.0711 × 10⁻⁹ and y-intercept 1.4037 × 10⁻⁹. ............................... 254
Figure 6.1 Chemical formula for PVP polymer (a), illustration of PVP carbonyl-Pt interaction (b) and (c); illustration of PVP polymer on Pt (d). Models after Borodko et al.66 ............................................................................................. 269
Figure 6.2 Illustration of EXAFS and Δµ-XANES analysis procedure, with pre-edge background removal, normalization, and then isolation of the EXAFS signal and fit to model functional in EXAFS, and isolation of the adsorbate effect on the XANES by taking the difference, Δµ. After Roth et al.72....................... 271
Figure 6.3 Comparison of the CV curves for water activation on Pt/C and PVP-Pt/C taken in a) 0.5M sulfuric acid and b) 0.1M perchloric acid. The data were collected at a scan rate of 50 mV/s. .............................................................. 280
Figure 6.4 Comparison of CO stripping curves for Pt/C and PVP-Pt/C taken in a) 0.5M sulfuric acid and b) 0.1M perchloric acid ..................................................... 281
Figure 6.5 Comparison of the methanol oxidation data for Pt/C and PVP-Pt/C with 0.5M methanol in a) 0.5M sulfuric acid and b) 0.1M perchloric acid. .................. 282
Figure 6.6 Chronoamperometry data for Pt/C and PVP-Pt/C in 0.5M methanol and a) 0.5M sulfuric acid and b) 0.1M perchloric acid............................................ 284
Figure 6.7a Experimental ∆µ = µ (Vi) - µ (0.54V) curves for Pt/C at potentials below 0.40 V (vs. RHE) showing adsorbed upd hydrogen. .................................... 285
Figure 6.8 Experimental delmu XANES curves for a) Hupd region (below 0.40 V) and b) oxidation region (above 0.60 V) for PVP/Pt/C. Note the absence of a shift in peak energy for data below 1.1 V. ................................................................ 287
Figure 6.9 A model single-shell EXAFS fit to the PVP-Pt/C data collected at 0.70 V vs. RHE. The data was collected at the Pt L3 edge............................................. 289
Figure 6.10 ∆µ-XANES magnitudes for positive features of lineshapes seen in Figures 6.7 and 6.8. Note the marked increase in an atop OH-like feature between 0.50 and 1.00 V for PVP/Pt/C............................................................................... 292

xxiv
Figure 6.11 Theoretical FEFF 8.0 calculations for atop (1-fold) and 3-fold bonded PVP-Pt/C. .............................................................................................................. 298
Figure 6.12 EXAFS fit results showing changes in Pt-Pt coordination number,NPt-Pt, as a function of applied potential. Also shown (on right) for comparison are the delmu magnitudes originally shown in Figure 6.10...................................... 307
xxv
List of Tables
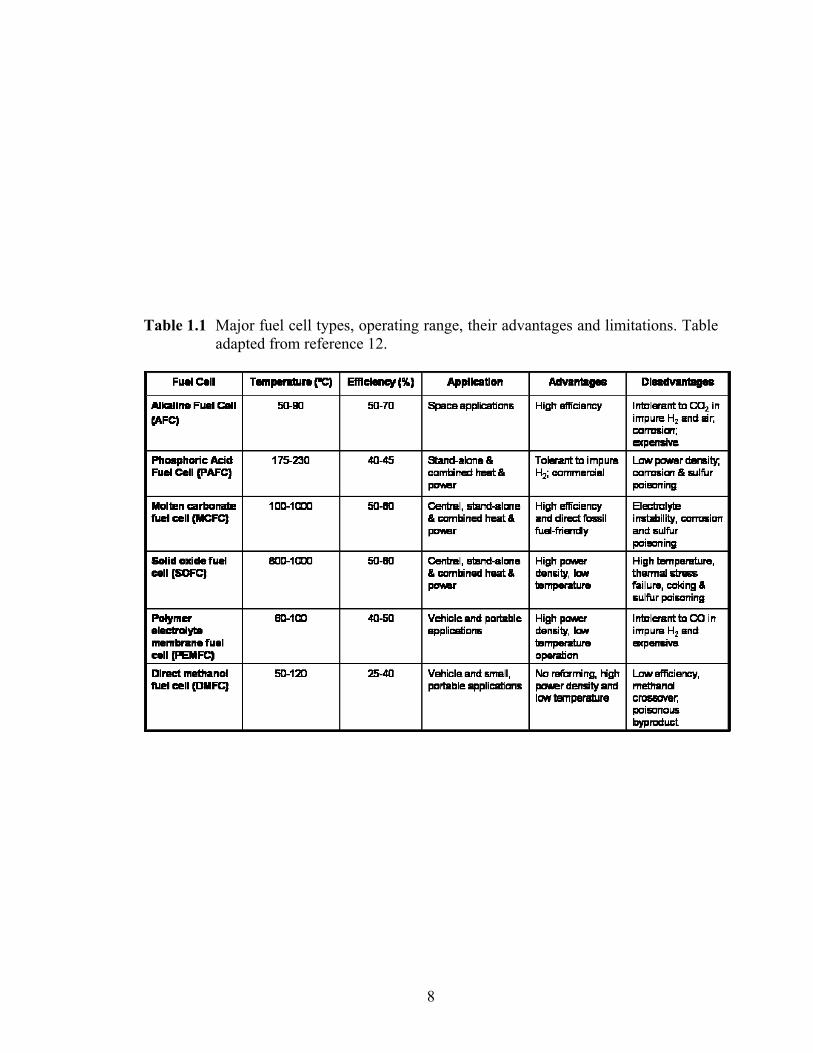
Table 1.1 Major fuel cell types, operating range, their advantages and limitations. Table adapted from reference 12. ............................................................................... 8
Table 1.2 A brief summary of various experimental techniques and their capabilities.... 23
Table 1.3 Failure modes and their possible reasons for various components of a fuel cell stack. Table adapted from reference 64. ......................................................... 29
Table 3.1 Summary of EXAFS Resultsa ......................................................................... 138
Table 3.2 Distribution of surface sites in a cubo-octahedral Pt cluster as a function of particle size ................................................................................................... 140
Table 3.3 Summary of results at different faces and corner/edge sites on Pt particles... 162
Table 4.1 Summary of Cu stripping results for surface area analysis ............................ 185
Table 4.2 Summary of coordination numbers obtained from Pt-L III edge data.*........... 191
Table 4.3 Summary of results from electrochemical, Cu upd and x-ray absorption data194
Table 5.1 Electrochemically active surface area determination results .......................... 228
Table 5.2 Summary of EXAFS parameters derived from first-shell fits ........................ 235
Table 5.3 Summary of estimates of Ru adsorption coverage on various Pt catalysts .... 247
Table 6.1 Summary of EXAFS results for the Pt/C and PVP-Pt/C catalyst samples ..... 290
Table 6.2 Summary of literature showing two different types of PVP binding ............. 302
xxvi
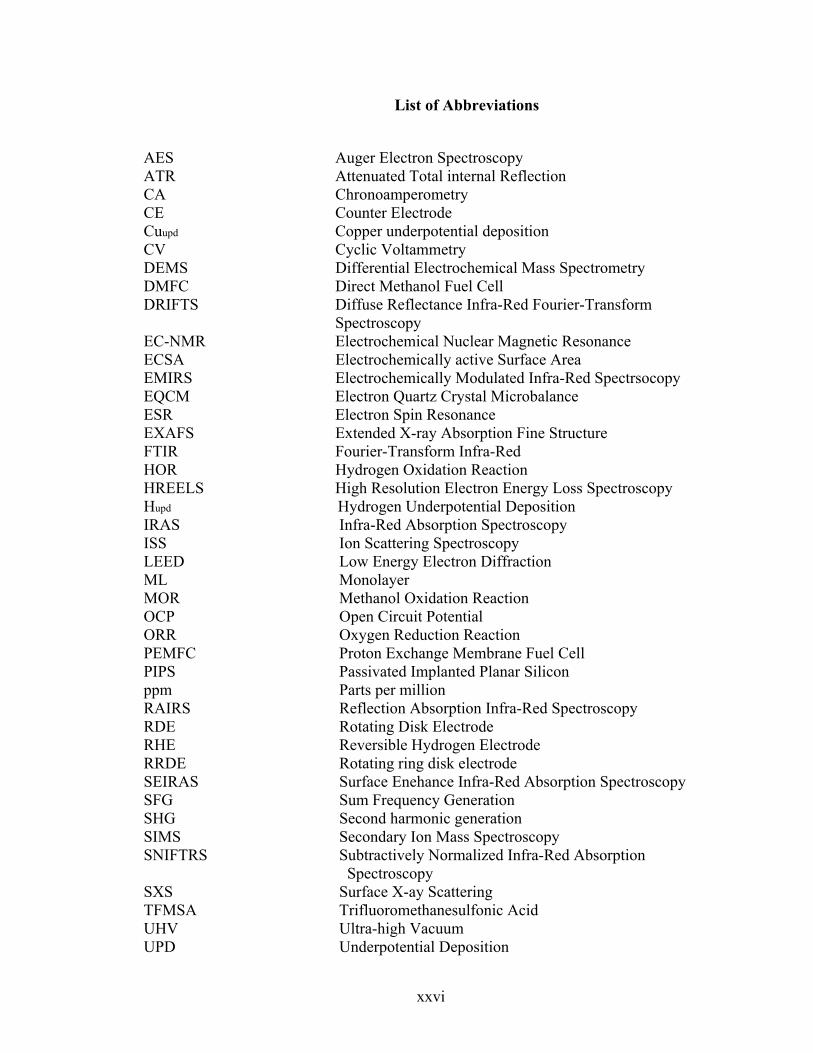
List of Abbreviations
AES Auger Electron Spectroscopy ATR Attenuated Total internal Reflection CA Chronoamperometry CE Counter Electrode Cuupd Copper underpotential deposition CV Cyclic Voltammetry DEMS Differential Electrochemical Mass Spectrometry DMFC Direct Methanol Fuel Cell DRIFTS Diffuse Reflectance Infra-Red Fourier-Transform Spectroscopy EC-NMR Electrochemical Nuclear Magnetic Resonance ECSA Electrochemically active Surface Area EMIRS Electrochemically Modulated Infra-Red Spectrsocopy EQCM Electron Quartz Crystal Microbalance ESR Electron Spin Resonance EXAFS Extended X-ray Absorption Fine Structure FTIR Fourier-Transform Infra-Red HOR Hydrogen Oxidation Reaction HREELS High Resolution Electron Energy Loss Spectroscopy Hupd Hydrogen Underpotential Deposition IRAS Infra-Red Absorption Spectroscopy ISS Ion Scattering Spectroscopy LEED Low Energy Electron Diffraction ML Monolayer MOR Methanol Oxidation Reaction OCP Open Circuit Potential ORR Oxygen Reduction Reaction PEMFC Proton Exchange Membrane Fuel Cell PIPS Passivated Implanted Planar Silicon ppm Parts per million RAIRS Reflection Absorption Infra-Red Spectroscopy RDE Rotating Disk Electrode RHE Reversible Hydrogen Electrode RRDE Rotating ring disk electrode SEIRAS Surface Enehance Infra-Red Absorption Spectroscopy SFG Sum Frequency Generation SHG Second harmonic generation SIMS Secondary Ion Mass Spectroscopy SNIFTRS Subtractively Normalized Infra-Red Absorption
Spectroscopy SXS Surface X-ay Scattering TFMSA Trifluoromethanesulfonic Acid UHV Ultra-high Vacuum UPD Underpotential Deposition

xxvii
UV Ultraviolet Vis Visible WE Working Electrode XANES X-ray Absorption Near Edge Structure XAS X-ray Absorption Spectroscopy XRD X-ray Diffraction XPS X-ray Photoelectron Spectroscopy
1
Chapter 1
Introduction
This thesis aims to understand some of the different forms of degradation that occur
on low-temperature Pt and Pt-based fuel cell electrocatalysts using in situ x-ray
absorption spectroscopy. In this chapter, a broad albeit brief history of the predominant
energy technologies that were extant before the invention of the fuel cell and a short
history of fuel cell technologies are first presented. This is followed by a section on the
operating principles of low-temperature fuel cells and challenges facing their
commercialization, highlighting electrocatalyst degradation as one such major challenge.
A discussion of the experimental techniques used in heterogeneous catalysis that are
bridging surface science and catalytic studies is then presented. The chapter concludes
with a literature review summarizing our current state-of-knowledge on electrocatalyst
degradation in low-temperature fuel cells. All topics relating to x-ray absorption
spectroscopy, the primary technique utilized in this work, and its application to study
electrocatalysts will be taken up in chapter 2.
2
1.1 Fuel Cells
1.1.1 A brief history of energy technologies prior to and leading to the fuel cell
The energy demands of modern-day society are met chiefly through the strategic
utilization of energy-rich fossil fuels, such as coal, petroleum and natural gas, or from
nuclear fuels, and more recently through the harnessing of alternate renewable sources
such as that obtained from solar, wind, geo-thermal, and tidal waves. While early man’s
energy sources were primarily those occurring in nature, such as wind, running water,
and muscle power of domesticated livestock (even human muscle power), a paradigm
shift in the use of energy occurred in the late 17th century in Britain, when the expansive
power of steam was discovered and harnessed mainly through the pioneering works of
Savery, Newcomen, Watt and Trevithick, 1 paving the way for the Industrial Age. Life
was transformed completely, and ever since modern society has depended heavily on
powered machinery and engines for all its needs.
Somewhere around the same time, the Italian biologist Luigi Galvani discovered that
an electric current was obtained when two different metals were inserted into the muscles
of a frog, and speculated that it was due to an ‘animal electric fluid’ that was present in
living creatures. Following up on Galvani’s discovery, Alessandro Volta invented the
‘Voltaic Pile’, made of an alternating stack of Zinc and Copper disks separated by
cardboard disks soaked in vinegar, 2 and in 1800 demonstrated the nature of the newly
discovered effect to the French Academy of Sciences. He termed the strange ‘force’
Electromotive Force (emf), a term in use even in the current literature to indicate voltage
3
or more correctly, a potential difference. The Voltaic pile is widely acknowledged as the
first battery.∗ (see footnote)
The nature of the emf and its chemical effects were carefully investigated by Michael
Faraday, the protégé of one of the giants of 19th century chemistry, Sir Humphrey Davy.
Starting in 1832, he discovered the fundamental laws of electrolysis viz. that the quantity
of an element electrodeposited under a given potential is directly proportional to both, the
quantity of electric charge passed through it as well as the atomic mass of the element
itself. The work of Volta and Faraday paved the way for the invention of the first primary
cell in 1836: the Daniell Cell. It had two liquid electrolytes and produced a steadier
current than the Voltaic Pile. The lead-acid battery, the first secondary battery, was
invented in 1859 by the French physicist Gaston Planté.2 Lead acid batteries are still
widely used in automobiles and back-up power systems.
It is remarkable that little could be done to improve upon the simple chemistry of the
robust lead acid battery, and apart from a few minor additions and improvements, it has
stayed virtually unchanged to this day. While a wide variety of batteries, capable of
delivering power across the complete spectrum of applications, are now used
ubiquitously, the development of this fascinating field is not discussed any further here;
instead, as warranted in a dissertation concerning fuel cells, we will briefly outline the
historical development of the fuel cell. (see Section 1.1.2)
∗ Some historians claim that a primitive version of a battery already existed in the Baghdad Battery found in 1936 by archaeologist Wilhelm Konig. The clay jar, dating back to the Parthian period (250 B.C. - 250 A.D.), contained two different metal ‘electrodes’ and space for a liquid, which was possibly a fruit juice, wine or even vinegar. It is speculated that it was used for either medical reasons or even to electroplate gold onto other metals

4
It was around the same period as development of the battery that Sir William Grove
invented the Fuel Cell (1839),3 a device that would produce electricity from hydrogen
and oxygen, which were combined to produce an electric current; essentially a ‘reverse
hydrolysis’ process. For close to a century after, there was little progress on fuel cells, if
any, and this can be attributed to the rapid and widespread availability of electricity
produced through an application of the principles of electromagnetic induction (also due
to Faraday, ca. 1831), the discovery of petroleum, and the subsequent development of the
Internal Combustion (I.C.) engine during the latter half of the 19th century. The
generation and widespread distribution of electricity was due to the efforts of Nikola
Tesla, George Westinghouse and Thomas Alva Edison, amongst whom bitter legal
disputes concerning priority of ideas in the generation and distribution of direct and
alternating current ensued. Notwithstanding all of this, in 1896, the city of Buffalo, N.Y.
was powered by electricity transmitted from a hydroelectric generator installed at Niagara
Falls, N.Y., 26 miles away, heralding the electric age.
Meanwhile, rapid developments in the I.C. engine were also taking place following
major theoretical and engineering advances. Frenchman Nicolas Sadi Carnot delineated
the thermodynamic principles of a cyclic process operating between two temperatures in
his seminal work Reflexions on the motive power of fire published in 1824, a work which
impacted literally all future progress in thermodynamics. After some engineering
advances by a number of people, Jean-Joseph Étienne Lenoir in 1860, built the first mass-
produced I.C. engine. 4 In what was a definitive turning point for the development of I.C.
engines, the four-stroke and two-stroke cycles for an I.C. engine were designed and
refined in the last three decades of the 19th century by Nikolaus Otto, Gottlieb Daimler,
5
Wilhelm Maybach and Karl Benz; 4, 5 finally, the compression-ignition engine (more
commonly known as the Diesel engine) was invented by Rudolph Diesel in 1893, which
was improved upon to its near-present form by inventor Charles F. Kettering. 6
The development of engines running on either gasoline or diesel secured a demand
for petroleum that has only risen exponentially over the past century. However, this is
clearly unsustainable as not only are the Earths’ reserves of fossil fuel limited, but more
importantly, the combustion of coal and petroleum releases large amounts of CO and CO2
into the atmosphere, upsetting the natural balance of our delicate ecosystem that supports
all life on earth. It is hoped that clean battery technology and fuel cells of one kind or
another, powered through a sustainable energy grid (which will most definitely involve
solar energy) will one day replace most of current technology running on various forms
of coal and petroleum.
1.1.2 The historical development of the fuel cell
The first resurgence in fuel cell research after Grove’s invention in 1839 came with
the work of Ludwig Mond and Charles Langer (1889), who was using coal to develop a
Direct Coal Fuel Cell (DCFC). Here, a gas was derived from coke and coal which could
be used as a fuel.7 However, impurities in the gas quickly poisoned the platinum catalyst
and made the process prohibitively expensive, as the catalyst had to be replaced often or
the loading had to be increased substantially to derive any power from the device. DCFCs
were also investigated by W.W. Jacques in the U.S. and Prof. Baur and his students at the
Swiss Federal Institute of Technology (ETH), Zurich, where considerable progress was
6
made on various kinds of electrolytes and cell-designs.8 Their effort was eventually
abandoned due to a host of practical problems.
In 1933, Sir Francis Bacon developed the first practical fuel cell – the Alkaline Fuel
Cell (AFC).9 However, corrosion of the components of this fuel cell was a major problem
associated with the AFC. After subsequent improvements in both design and choice of
materials, the technology was licensed to Pratt & Whitney in 1959; this became the
precursor to the AFCs developed for the first Apollo mission (and all following space
missions) in the early 1960s. The space mission led to rapid advances in both AFC and
Phosphoric Acid Fuel Cell (PAFC) technology.
The PAFC was invented by William Grubb of General Electric in 1955. 10, 11
However, the two major drawbacks of the PAFC were a) the limited lifetime of the
polymer electrolyte membrane, which was susceptible to acid attack and oxidative
degradation, and b) the high Pt loadings required. The AFC did not have the latter
problem, as it was operated at higher temperatures, and due to increased reaction kinetics,
required lower Pt catalyst loadings. It is noteworthy that for a long time, i.e. until the
early part of this decade, PAFCs were the only fuel cells that were commercially
available and in use for stand-alone power generation. Many commercial PAFCs were
used, for instance, as critical back-up power systems in large factories, banks etc. where a
power outage on the grid could mean serious consequences in cost and liability. Also, it
is remarkable that some of the fuel cells developed in the 1960s for the space missions
are still in operation today, more than four decades later! A resurgence in research on fuel
cell technology, which had peaked during the ‘space age’, along with research into
sustainable and renewable energy, came in the wake of the drop in the worldwide supply
7
of oil in the 1970s due to the OPEC oil embargo. However, research momentum soon
plummeted again following the drop in government tax incentives for such companies,
and due to the widespread availability and low-cost of oil and natural gas through the
1980s. Over the last couple of decades however, there has been a strong, concerted
worldwide research effort to help bring fuel cells (along with solar and wind energy) to
the market. Governments, especially in the U.S. and Europe working with national labs,
research institutes and universities have established both, short-term and long-term goals
for the target costs of materials and the performance level of catalysts (for e.g. loading)
required to make fuel cells a cost-effective, viable alternate technology to meet our
growing energy demands, as well as to decrease our dependence on petroleum, and set
our sights on a cleaner and greener energy future.
Over the years, many different fuel cell types have been developed. A summary of the
major fuel cell types available today, their operating range, advantages and disadvantages
etc. are shown in Table 1.1.12 From the table, it is quite apparent that low-temperature
fuel cells (20-120 ºC) hold significant promise for widespread application, especially the
portable energy market. Shown in Figure 1.1 are the efficiencies of various fuel cell types
against I.C. engines.
Even considering losses at the system level, the operating efficiency of many fuel
cells are well above the 50-60% mark and as such, may be twice as efficient as even the
best I.C. engines, and thus hold considerable promise as alternate or even mainstream
energy conversion sources. Fuel cells, unlike I.C. engines, also have no moving parts
which makes them less susceptible to mechanical wear and tear. Further note that while
the performance of the DMFC is only around a-half to a-third that of the PEMFC, for
8
Table 1.1 Major fuel cell types, operating range, their advantages and limitations. Table adapted from reference 12.
9
100 101 102 103 104 105
10
20
30
40
50
60
70
Gasoline Electric
Steam and Gas Turbines
Diesel Electric
Phosphoric Acid FCClean Fossil-Fueled Fuel Cells
Molten Carbonate FC with Internal Reforming
Fuel Cells with Hydrogen Fuel
Power Output, kW
Effic
ienc
y, %
LH
V
100 101 102 103 104 105100 101 102 103 104 105
10
20
30
40
50
60
70
Gasoline Electric
Steam and Gas Turbines
Diesel Electric
Phosphoric Acid FCClean Fossil-Fueled Fuel Cells
Molten Carbonate FC with Internal Reforming
Fuel Cells with Hydrogen Fuel
Power Output, kW
Effic
ienc
y, %
LH
V
Figure 1.1 The potential of various types of fuel cells when compared with other widely used power sources. Figure adapted from A.J. Appelby et al., Fuel Cell Handbook (Van Nostrand Reinhold, NY, USA 1989)
10
portable applications, it still offers considerable advantages. The fact that methanol is a
liquid under typical operating conditions (room temperature, atmospheric pressure) is
advantageous from a systemic standpoint and more importantly, is readily compatible
with the existing gasoline distribution infrastructure.
Four of the six atoms in the methanol molecule are hydrogen, which makes it quite an
energy-rich source of fuel; it is also easily synthesized with available industrial
processes.13 Some other advantages over, for e.g. the state-of-the-art lithium ion batteries,
include it being environmentally-clean, allows fast recharge-cycles, and has a long
lifetime.14 Shown in Figure 1.2 is a comparison of the storage densities of the different
battery technologies alongside those of the PEMFC and DMFC. If these numbers are
achievable on a large-scale, it is seen that low-temperature fuel cells clearly possess an
edge over existing battery technologies.
In short, the performance of most fuel cells as they stand is more than competitive
when compared with many battery types and I.C. engines. Only the durability and
economic issues of low-temperature fuel cells keep them from entering the market. They
have to compete with the usual lifetimes of 10,000-15,000 hours commonly seen in I.C.
engines used in cars and bikes all over the world. Some mature fuel cell technologies
have already met the stringent demands placed on operating lifetimes. For instance, some
200 kW PAFC systems built by UTC Power routinely operate for over 20,000 hours,15
but such impressive limits are still to be realized for the principal low-temperature fuel
cells, viz., PEMFCs and DMFCs.
As this dissertation will focus on efforts to understand at a molecular-level, the aging
and degradation of electrocatalysts in DMFCs, the following section will aim to provide a
11
30 40 100 150
300 350
1200
0
200
400
600
800
1000
1200
Stor
age
dens
ity, W
h/kg
Lead-Acid
battery
NiCdbattery
NiMeHbattery
Li-ionbattery
Li-polymerbattery
HydrogenFC
DMFC
Figure 1.2 A comparison of storage densities of various energy conversion systems. Assumptions: H2 fuel efficiency 40%; DMFC efficiency 25%. Data source: Samsung / SFC Smart Fuel Cell.
12
more detailed picture into the basic operating principles of low-temperature PEMFCs
followed by a brief introduction to the Direct Methanol Fuel Cell, and finally, some of
the main challenges and prospects faced by this technology.
1.1.3 The basic operating principles of the fuel cell
In its most basic form, the fuel cell is an electrochemical energy conversion device
which ‘burns’ a fuel (hydrogen-based) electrochemically in a controlled manner using an
oxidant (usually oxygen or air). Some of the common hydrogen-rich fuels being explored
for use in low-temperature fuel cells include methanol (CH3OH), ethanol (C2H5OH) and
sodium borohydride (NaBH4). However, for sake of brevity and relevance, we will
discuss only the H2/O2 PEM fuel cell (PEMFC) and the Direct Methanol Fuel Cell
(DMFC). The functional center is much the same for both types of fuel cells and is called
the membrane electrode assembly (MEA), which consists of an anode, a polymer
electrolyte membrane (also known as proton exchange membrane) and a cathode. A
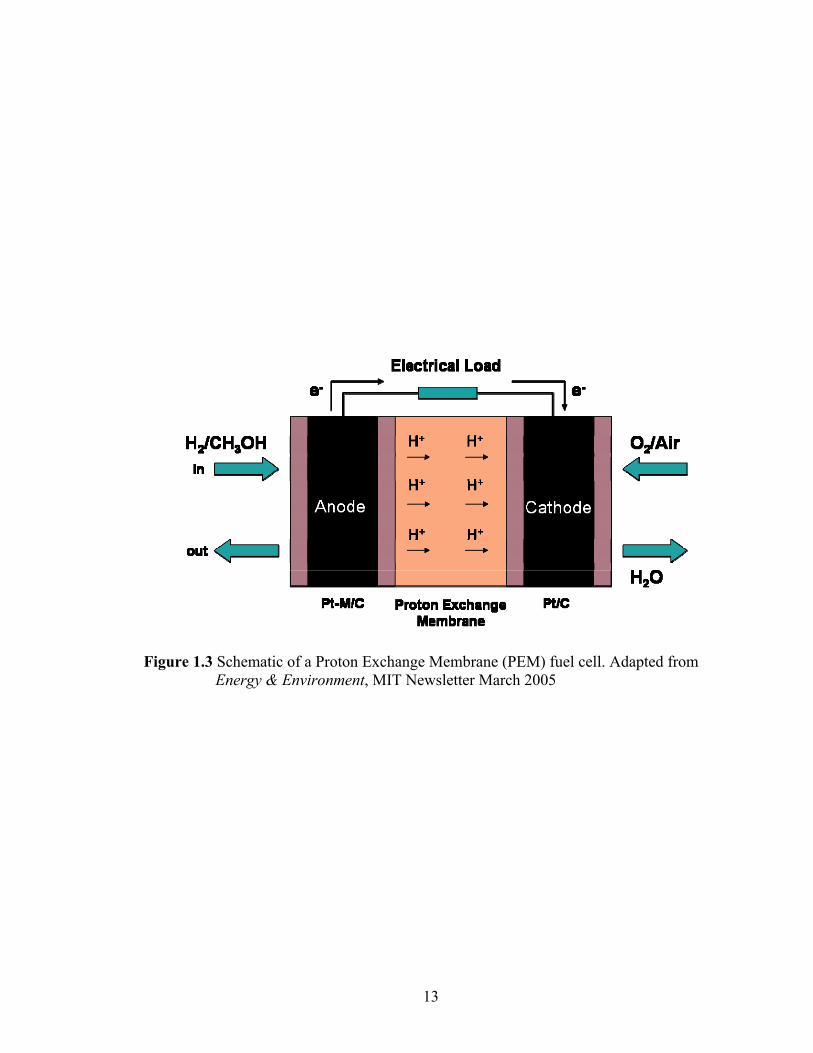
schematic of a typical fuel cell with MEA architecture is shown in Figure 1.3. The
primary reactions of interest occurring at the anode and cathode are as follows - 16
Anode: H2 2H+ + 2e- (PEMFC) E0 = 0.00 V
CH3OH +H2O CO2 + 6H+ + 6e- (DMFC) E0 = 0.046 V
Cathode: 3/2 O2 + 6H+ + 6e- 3H2O E0 = 1.23 V
Overall: 2H2 + O2 2H2O (PEMFC) E0 = 1.23 V
CH3OH + 3/2O2 CO2 + 2H2O (DMFC) E0 = 1.18 V
13
Figure 1.3 Schematic of a Proton Exchange Membrane (PEM) fuel cell. Adapted from Energy & Environment, MIT Newsletter March 2005
14
Thus, at the anode, hydrogen is dissociated into protons on a catalyst (typically a Pt-M
alloy catalyst) which can then travel through the electrolyte known as the polymer
electrolyte membrane (PEM) onto the cathode side of the cell. The electrons released
from the oxidation reaction on the anode are conducted away electronically out of the cell
and directed into the desired application (electric load). The electric circuit is closed by
allowing these electrons to recombine with the incoming protons and the supplied oxygen
on the cathode, reducing oxygen (on a Pt catalyst) effectively to pure water. If there is
carbon in the fuel (methanol, ethanol), an additional oxidation product viz. CO2 is also
formed. The CO2 produced is rejected by the acidic membrane and remains as a product
on the anode side and is typically removed by the circulating methanol.17 Note that in
case of the DMFC, six electrons are released on oxidation of one molecule of methanol
when compared to only two electrons in case of H2 in a PEMFC.
1.1.4 Problems keeping the direct methanol fuel cell from commercialization
Currently, some of the major challenges in the development of DMFCs include:
a) Poor anode kinetics: The poisoning of the catalyst surface by intermediates
and by-products of methanol dissociation 18 causes severe overpotential losses relative to
the Hydrogen Oxidation Reaction (HOR), of ca. 200-300 mV. 19 On pure platinum,
which is still the best catalyst for methanol dissociation, the anode potential may have to
be raised to as much as 0.60 V to completely oxidize the impurities and byproducts of
methanol dissociation resulting in dramatic loss in cell potential. While significant
progress has been made over the last 15-20 years to develop more efficient
electrocatalysts to reduce the overpotential losses on the anode, the strategy has nearly
always been to alloy the Pt catalyst with more oxophilic elements such as Ru, Sn, Ti, Pb
15
etc. 20 whereby the adsorbed O(H) groups on these elements assist in the oxidation of the
adsorbed species (chiefly CO) through a synergistic mechanism. This effect, termed the
bi-functional mechanism, was first studied in the context of CO oxidation on platinum by
Bockris and Wroblowa 21, most notably by Watanabe and Motoo 22, 23 and, Janssen and
Moolhuysen. 24 To date, the most effective anode catalyst remains a 1:1 alloy of platinum
and ruthenium. 25
b) Methanol crossover: A second problem is the slow but definite ‘crossover’ of
methanol to the cathode, leading to a drastic reduction in operating cell potential and
lifetime. This phenomenon is widely known as ‘methanol crossover’. A similar reaction
to that of the anodic reaction occurs on the cathode side, wherein methanol is oxidized on
the Pt catalyst to CO2 and H2O alongside the oxygen reduction reaction, leading to a
‘mixed potential’. The overpotential loss and rate of methanol crossover has been
estimated by several researchers; 26-28 the overpotential loss is estimated to be of the order
of 100-120 mV. This is in addition to the losses already incurred on the cathode due to
sluggish ORR kinetics. In practice, the cathode potential rarely exceeds 1.0 V (theoretical
ORR potential is 1.23 V) and is chiefly due to the poisoning of available Pt sites by OHads
and the associated water-dipole layer that cannot be easily penetrated by molecular O2.
c) Electrode stability: The stability of both the anode and cathode catalysts and
the reduced methanol oxidation activity are major concerns with the DMFC. Further
degradation studies and advances in our understanding, as well as the development of
novel materials with enhanced stability, will be discussed in greater detail in a separate
section (see Electrocatalyst degradation below)
16
d).Cost: While DMFCs are fairly rugged, quite clean and efficient, the costs are
still prohibitively expensive for widespread application (also true of the PEMFC).
1.1.5 Active areas of low-temperature fuel cell research
Several advances are yet to made on many fronts if low-temperature fuel cells are to
be commercialized and remain competitive with existing energy technologies. Some key
areas include: 12
1. Membranes: Some of the major improvements required of membrane technology
are the development of rugged, high-temperature membranes, membranes with
sufficiently high proton conductivity but lower permeability to reduce methanol
crossover and finally, reducing costs.
2. Catalyst loading: While dramatic reductions in electrocatalyst loadings have
been achieved over the past decade, the cost (and availability) of platinum is an
ever- present concern in the fuel cell community.∗ (see footnote) Attempts to
∗ “It has sometimes been suggested that the full exploitation of low temperature fuel cells may be limited by the availability of the platinum-group metals. Mike Steel (Johnson Matthey) posed the question of how much platinum is likely to be required, and whether the increased demand can be met. Bill Ford of the Ford Motor Company has forecast that by 2025, one quarter of all light vehicles will be powered by hydrogen. Assuming that each car will require about 75 kW of fuel cell power, and using the U.S. Department of Energy target of 0.2 g kW−1 of platinum, Mike Steel estimated that platinum demand for fuel cell cars could be 150–300 tons per year by 2025. This compares with a production rate of 180 tons per year in 2000, and proven reserves of 5000 tons, with inferred reserves of 30,000 tons of platinum, but does not include platinum recovered and recycled, a practice already developed for automotive emissions control catalysts in the advanced economies of the world. He concluded that platinum is a key catalyst for PEMFC development, and that there should be sufficient resources available to meet the needs for the foreseeable future.”
Source: The Eighth Grove Fuel Cell Symposium Developing a fuel cell manufacturing industry;
D. S. Cameron, Platinum Metals Review, 48 (1), 2004, 32-37
17
continually derive acceptable performance with lower loadings is a continuing
research effort. There have also been a number of groups working on the
development of non-precious metal catalysts. While some of them have
comparable performance to that of platinum and its alloys, none of them have the
requisite stability to operate for long hours in a fuel cell environment.
3. CO-tolerant anode catalysts: PtRu black is still the best catalyst as far as CO-
tolerance is concerned. However, research into developing more efficient anode
catalysts to better the benchmark set by PtRu alloy catalysts has and continues to
be an active research area.
4. Bipolar plate materials: Non-porous graphite is the material of choice for the
bipolar plates in fuel cell stacks owing to their excellent conductivity, reasonable
chemical resistance and mechanical properties. However, machining graphite is
both expensive and time-intensive. Further, while they have good chemical
stability compared to most materials, they are still not completely immune to
chemical attack from the acid in the environment, which leads to slow dissolution
of parts of the plates and reduces the operating lifetime of the fuel cell stack.
5. Engineering concerns: Bipolar plate design to reduce mass-transfer limitations
and system design, which includes standard fuel cell stack components such as
fuel cell processor, pumps, membrane humidifiers, pressure controllers, gas
membrane separators (for e.g., to separate CO from H2 in the feed stream), are
also active fields of engineering research.
6. Durability and lifetime of fuel cells: It was mentioned earlier that fuel cells are
immune to any mechanical stress and degradation. While this is true, owing to the
18
very nature of its activity, they are certainly affected by various kinds of chemical
degradation, which manifests as a loss in activity due to irreversible changes
happening on the surfaces of these electrocatalysts. As mentioned earlier, a
proven operating lifetime of 1000-2000 hours is a minimum requirement if
DMFCs have to be competitive in the portable applications market. In some cases,
the requirement may exceed 8000-10,000 hours.
Thus, all aspects of degradation in membranes, stack components and electrocatalysts
(and their supports) need to be thoroughly explored and significant gains have to be
made before any of these low-temperature fuel cells are to hold their position in the
portable power sector. Many companies have invested significant resources and have
directed some of their efforts into developing DMFCs for commercial applications.
Some of them are listed below-13
1. Ball Aerospace & Technologies 2. Direct Methanol Fuel Cell Corp.
3. Giner Electrochemical systems 4. Plug Power
5. Fideris (formerly Lynntech Industries) 6. Manhattan Scientifics
7. MTI Micro Fuel Cells 8. Medis Technologies
9. Motorola Labs 10. NEC
11. PolyFuel 12. Yuasa Corp.
13. Samsung (AIT) 14. Toshiba
19
1.2 Characterization of Fuel Cell Catalysts
1.2.1 The importance of in operando studies - bridging the structure and
pressure gaps in heterogeneous catalysis
The catalyst is arguably the most critical component in the fuel cell. The word
‘catalysis’ was first coined by the great Swedish chemist Jons Jakob Berzelius in 1836
(from the Greek word ‘katalein’ meaning ‘to dissolve’ or ‘to break down’) when he stated
“Catalytic power means that substances are able to awake affinities that are asleep at a
particular temperature by their mere presence and not by their own affinity”.29, 30 Thus,
the word is used to describe the property by which the rate of a particular reaction is
accelerated by a substance, while it itself is not consumed (we will see later that given
our current understanding of catalytic processes, this is not entirely correct). Most
catalysts are impressive in what they can do to speed up reactions. Some catalysts are
known to increase the rates of particular reactions by more than a factor of 1010, i.e. 10
billion-fold. It is even more fascinating that catalysts favor a certain reaction pathway
over another, a property called its ‘selectivity’. They are indispensible in society today as
they are used in virtually all industries to aid in the manufacture of important chemicals,
many of them which are essential to modern life. These chemicals are eventually used to
make products ranging from cosmetics and medicinal compounds to polymers such as
plastics and foams. Some widely used catalysts include iron powder in the Haber-Bosch
process to produce ammonia, Pt to convert saturated alkanes to aromatic and branched
hydrocarbons, Co, Ni, Fe and Ru to hydrogenate CO to produce methane and other
valuable organic compounds (Fischer-Tropsch synthesis) such as alcohols, aldehydes and
20
acids; Co and Mo compounds in the hydro-desulfurization of petroleum and coal, and
zeolites for petroleum cracking etc. Many processes occurring in nature, including
photosynthesis, and most of the biological processes in our own bodies (chiefly as
enzymes) are catalytic. Catalysts exist in myriad chemical and physical forms such as
metals (pure or as alloys), oxides, nitrides, and sulfides; they may be single-phase or
multi-phase. They can be amorphous or crystalline. Catalysts can be metallic,
semiconducting or insulating; they may be in the form of a fine gauze, or powder-like or
even a suspension of particles in a slurry. Catalysts also play key roles in energy
production, transformation, storage and utilization.31
The catalysis field may be broadly categorized into two main types of catalysis:
homogeneous catalysis and heterogeneous catalysis. In homogeneous catalysis, the
reactants and catalyst are in the same phase (or form a uniform phase when mixed
together) whereas in heterogeneous catalysis, reactions occur on a solid surface. Due to
the difficulty in separating and eventually removing the reagents and products from the
catalysts, most industrial processes are designed to employ heterogeneous catalysts. It has
been reported that products obtained via some form of heterogeneous catalysis accounts
for more than 25% of the world’s total GDP.32
Every heterogeneous catalytic reaction, by definition involves a surface, be it a solid-
liquid interface or a solid-gas interface. However, even the simplest of such reactions can
be very complex at the molecular level and a full understanding of a reaction mechanism
is arrived often, only through the use of a number of techniques which are complimentary
in nature. Such studies would ideally include both experimental and theoretical methods.
Further, information at the macroscopic level, such as physical properties (viscosity,
21
density, tensile strength etc.) and reaction rates, have to be measured and correlated with
microscopic/molecular phenomena – indeed, this is the very goal of physical chemistry
itself. The realization of this objective within the field of catalysis will also naturally lead
to what many consider the ‘Holy Grail’ of catalysis i.e. the rational design of catalysts to
catalyze any given reaction, with a 100 % selectivity and maximum theoretically possible
yield.
Given that heterogeneous catalysis is the field of study of reactions at interfaces and
surfaces, one would imagine that surface science can and should provide substantial
insights into the way catalysts work. However, heterogeneous catalysis is largely an
empirical science and for various reasons, progress in the discipline and our fundamental
understanding of catalytic processes on surfaces lagged developments in industry by
years.
Two widely acknowledged barriers to using surface science methods to understand
catalytic behavior still exist in one form or another, viz. the ‘structure-gap’ and the
‘pressure-gap’.31, 33-36 They are discussed briefly here in order to fully appreciate how
close researchers have come towards nearly eliminating them and in the process,
unraveling the secrets of heterogeneous catalytic processes.
Industrial catalysts are often supported and highly dispersed, containing particles a
few nanometers across and having any number of defects, kinks, terraces, corners and
edges etc., while model studies in surface science are carried out on clean, single-crystal
surfaces having a preferred orientation (e.g. Pt(111), Ni(100) etc.) and are of the order of
several microns to a few millimeters in size. This forms the basis for the ‘structure-gap’
that exists between the two disciplines. As for the ‘pressure-gap’, surface science studies
22
traditionally involve the use of clean surfaces under ultra-high vacuum (UHV) systems
wherein pressures lower than 10-10 Torr are routinely used; most industrial processes are
designed to take place at high pressures, or under atmospheric pressure (760 Torr), at the
very least. A cursory glance at these numbers immediately reveals that this pressure gap
exceeds a factor of 1012. Thus the conditions for traditional ‘surface science’ and catalysis
in industry could not be further apart. Yet, significant advances have been made to
correlate molecular-level detail gleaned chiefly from spectroscopic studies with kinetic
and thermodynamic data. It must be stressed here that these studies did achieve what they
set out to do – observe species on surfaces and understand how they behave or react
under the conditions of experiment. Our understanding of catalysis on various catalysts
at a molecular level, albeit at low pressures and model surfaces, was put on solid ground
by these studies.
Attempts to bridge these gaps have involved the classic ‘before-after’ approach which
continues to prove important in many studies. Careful comparisons of the two data sets
were made in order to extrapolate the results to the catalytic process, often leading to
proposed reaction mechanism(s) that nevertheless proved hard to validate. Numerous
analytical techniques were developed to overcome this problem, some of which are taken
up in greater detail in the following section.
1.2.2 Summary of Characterization Techniques
Very few techniques are capable of providing molecular-level information on
electrocatalysts under operating conditions, as they often require specially-prepared
surfaces, vacuum conditions, or other special environments, such as those summarized in
Table 1.2. In situ studies of model systems have been carried out using newly- developed
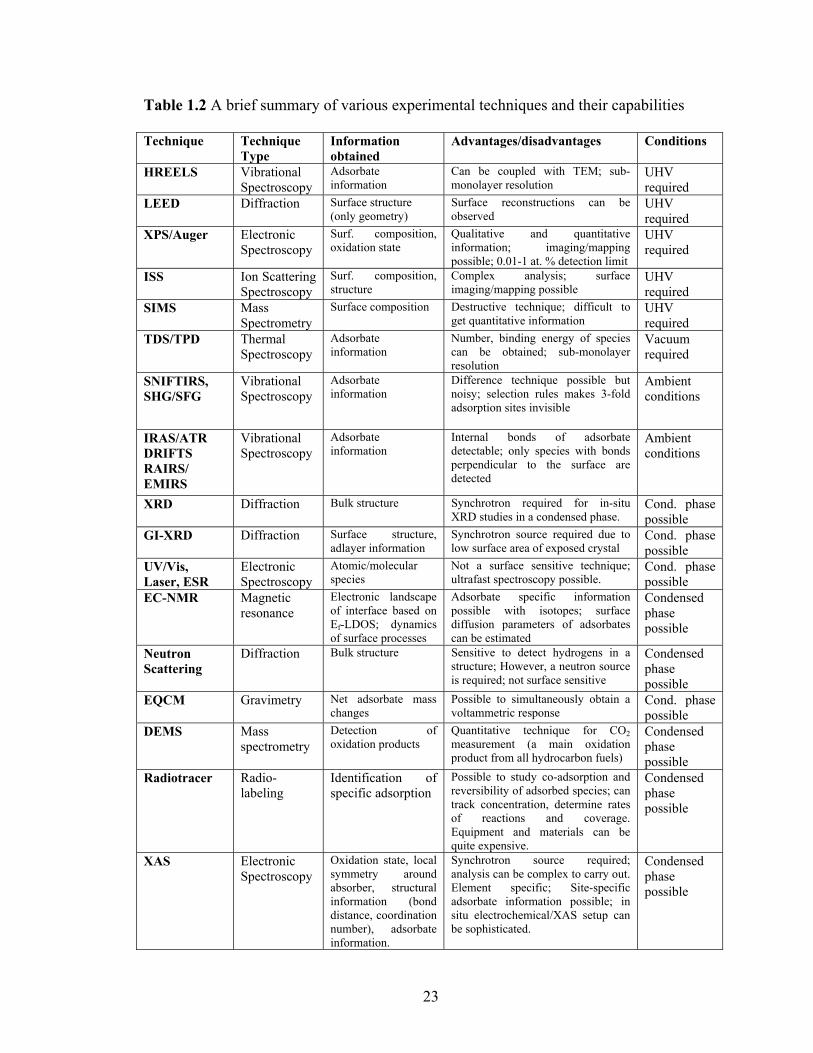
23
Table 1.2 A brief summary of various experimental techniques and their capabilities
Technique Technique Type
Information obtained
Advantages/disadvantages Conditions
HREELS Vibrational Spectroscopy
Adsorbate information
Can be coupled with TEM; sub-monolayer resolution
UHV required
LEED Diffraction Surface structure (only geometry)
Surface reconstructions can be observed
UHV required
XPS/Auger Electronic Spectroscopy
Surf. composition, oxidation state
Qualitative and quantitative information; imaging/mapping possible; 0.01-1 at. % detection limit
UHV required
ISS Ion Scattering Spectroscopy
Surf. composition, structure
Complex analysis; surface imaging/mapping possible
UHV required
SIMS Mass Spectrometry
Surface composition Destructive technique; difficult to get quantitative information
UHV required
TDS/TPD Thermal Spectroscopy
Adsorbate information
Number, binding energy of species can be obtained; sub-monolayer resolution
Vacuum required
SNIFTIRS, SHG/SFG
Vibrational Spectroscopy
Adsorbate information
Difference technique possible but noisy; selection rules makes 3-fold adsorption sites invisible
Ambient conditions
IRAS/ATR DRIFTS RAIRS/ EMIRS
Vibrational Spectroscopy
Adsorbate information
Internal bonds of adsorbate detectable; only species with bonds perpendicular to the surface are detected
Ambient conditions
XRD Diffraction Bulk structure Synchrotron required for in-situ XRD studies in a condensed phase.
Cond. phase possible
GI-XRD Diffraction Surface structure, adlayer information
Synchrotron source required due to low surface area of exposed crystal
Cond. phase possible
UV/Vis, Laser, ESR
Electronic Spectroscopy
Atomic/molecular species
Not a surface sensitive technique; ultrafast spectroscopy possible.
Cond. phase possible
EC-NMR Magnetic resonance
Electronic landscape of interface based on Ef-LDOS; dynamics of surface processes
Adsorbate specific information possible with isotopes; surface diffusion parameters of adsorbates can be estimated
Condensed phase possible
Neutron Scattering
Diffraction Bulk structure Sensitive to detect hydrogens in a structure; However, a neutron source is required; not surface sensitive
Condensed phase possible
EQCM Gravimetry Net adsorbate mass changes
Possible to simultaneously obtain a voltammetric response
Cond. phase possible
DEMS Mass spectrometry
Detection of oxidation products
Quantitative technique for CO2 measurement (a main oxidation product from all hydrocarbon fuels)
Condensed phase possible
Radiotracer Radio-labeling
Identification of specific adsorption
Possible to study co-adsorption and reversibility of adsorbed species; can track concentration, determine rates of reactions and coverage. Equipment and materials can be quite expensive.
Condensed phase possible
XAS Electronic Spectroscopy
Oxidation state, local symmetry around absorber, structural information (bond distance, coordination number), adsorbate information.
Synchrotron source required; analysis can be complex to carry out. Element specific; Site-specific adsorbate information possible; in situ electrochemical/XAS setup can be sophisticated.
Condensed phase possible
24
x-ray spectroscopies, such as thermal desorption spectroscopy and molecular beam
studies, along with optical and magnetic spectroscopic techniques at high pressures.35
Valuable information on catalytic activity and the role of steps, edges and corners,
defect, adatoms (promoters and inhibitors), and ensemble effects etc. have been
established using some of these techniques. It can be seen from Table 1.2 (a compilation
from various sources) that while many techniques like XPS, LEED, HREELS and ion
beam scattering techniques are very powerful techniques to understand surface
phenomena, they can only be used under ultra-high vacuum conditions. Other vibrational
techniques like SFG, SNIFTRS, FTIR, SEIRAS etc. may be applied to study catalysts at
normal pressures and even in solution, but owing to the selection rules, are quite
insensitive to adsorbates that are not oriented in a specific way on the surface. Further,
except for a few surface-sensitive IR techniques, most of them will also probe many ionic
species in the liquid electrolyte, making it impossible to separate out the contribution
from adsorbed vs. non-adsorbed ions. Also, adsorbed OH, a chemically important species
in many electrocatalytic reactions, cannot be discerned with IR techniques as there is also
a significant number of these species in any aqueous electrolyte layer around the catalyst.
Diffraction techniques provide primarily structural information and are not as effective
on nanoparticle catalysts, which do not possess long range order. Gravimetric techniques,
like EQCN, can provide some information on the extent of adsorption but unlike
spectroscopic techniques, cannot be used to probe the nature of the interaction between
the surface and adsorbate. Thus, XAS, as a high-energy spectroscopic technique that can
provide both electronic and structural information, seems uniquely positioned to probe
electrocatalysts.
25
The study of chemical processes on surfaces has had a long and distinguished history.
Some of the major contributions to heterogeneous catalysis that have been awarded the
Nobel Prize include Paul Sabatier’s contribution for developing catalysts for the
hydrogenation of organic compounds (1912), Fritz Haber for “the synthesis of ammonia
from its elements” (1918) and Irving Langmuir (1932) for his seminal contributions to a
number of areas within surface science.37 He is also credited with having laid the
foundations for the very field itself. The next award for research in surface science only
came in 2007, after a period of 75 years, with the recognition going to Gerhard Ertl “for
his studies of chemical processes on solid surfaces”.37 Major advances in vacuum science
and semiconductor technology led to new experimental techniques in the 1950s and
1960s; Ertl took advantage of many of these techniques (primarily LEED) and even
developed many methods to systematically and thoroughly study important reactions
such as the adsorption of hydrogen on metal surfaces,38-41 the production of NH3 from N2
and H2, and the oxidation of CO on platinum,37 (and references therein) to name a few.
His theoretical and experimental investigations have greatly contributed to our
understanding of catalytic reactions on surfaces.37 Gabor Somorjai’s research group at
UC Berkeley has also contributed significantly to the field. A sampling of some research
‘firsts’ from his group include the first observation of a surface reconstruction,42 the first
observation of a catalytic reaction on a single crystal surface at atmospheric pressure,43
the first determination of an absolute turnover rate in heterogeneous catalysis etc. 44 Over
the years, they have also developed a number of surface-science techniques 45-50 which
are widely used in many groups around the world today.
26
It must be mentioned here that the majority of this research, albeit important, has been
mainly around the solid-gas interface while inroads into understanding catalysis in the
condensed phase has remained quite intractable as only a few techniques (SEIRAS and
XAS being notable exceptions) can provide sufficient element specific, molecular level
information to elucidate a surface reaction mechanism. However, the increased
availability of resources at advanced synchrotron sources, and thus access to extremely
high intensity photon beams, has greatly facilitated in situ catalysis experiments and
research in the last decade has yielded unprecedented insight into the nature of catalysis
during operation. Many groups, including our own, are carrying out studies on the
middle-ground between surface science and heterogeneous catalysis, working to
completely bridge the two disciplines together. It is hoped that these studies will
eventually provide an understanding of catalysis like never before; an understanding that
will prove indispensible to solving our energy and environmental concerns.
The work described in this dissertation is an attempt to make a small addition to the
body of information that is steadily being accumulated in this fascinating area of
chemistry viz., in situ and in operando spectroscopic studies in electrocatalysis. We use
in situ x-ray absorption spectroscopy (XAS) to probe electrocatalysts under conditions
typically encountered during catalysis. We shall see in the next (and subsequent chapters)
how XAS is uniquely positioned as a technique to provide molecular-level insights into
the nature of catalytic activity, the experimental and theoretical methods used to collect
and analyze XAS data, and describe some of our findings on the nature of poisoning,
degradation and aging of electrocatalysts used in state-of-the-art fuel cells today.
27
1.3 Electrocatalyst Degradation
It was stated earlier that a catalyst is defined as a substance that accelerates a
chemical reaction without itself being consumed. This statement is not entirely true as it
is well-known that catalysts do not remain unaffected. They have definite lifetimes which
may vary from minutes to over a few years.31, 35 Many processes are designed so as to be
able to reuse some or all of the catalyst used through a separate ‘regeneration’ step. Given
that all catalytic activity lies in a catalysts’ ability to aid in the breaking and forming of
strong bonds between reactants, it is not surprising that over extended periods of time,
they are susceptible to some form of degradation or deterioration on an atomic scale. For
instance, at high temperatures, platinum particles tend to grow, decreasing the effective
surface area and hence reducing the mass specific activity (activity normalized to mass)
of the catalyst.33 Surfaces studied using techniques like Low Energy Electron Diffraction
(LEED), High Resolution Electron Energy Loss Spectroscopy (HREELS), Scanning
Tunneling Microscopy (STM) and Transmission Electron Microscopy (TEM) reveal that
atoms near the surface of metals undergo some form of rearrangement on exposure to
certain adsorbates, and also suggest that this process is reversible.35 This phenomenon is
known as ‘reconstruction’. This could be an additional factor in the aging or roughening
of metal particles, especially in solid-gas catalytic systems. Several studies of the aging
of platinum and other metals in gas phase catalysis exist in the literature.51-55 Our
interests lie chiefly in electrocatalysis, i.e. catalysis at the solid-liquid interface under the
application of an electric field or external potential. We will thus focus on aging
phenomena insofar as it applies to electrocatalysis in fuel cell electrodes.
28
Platinum and its alloys (commonly dispersed on high-surface area carbon supports)
are widely used as electrocatalysts in fuel cells. Substantial reductions in the loading used
for fuel cell electrodes have been achieved through the careful optimization of the surface
properties and microstructure of the electrodes. These electrodes have comparable
performance to unsupported catalysts of much higher Pt loading but nevertheless suffer a
loss in activity over time. The extent of loss is dependent on a number of factors
including electrolyte, operating conditions or temperature, humidity, poisons and
impurities in fuel and oxidant, potential and current conditions, and even whether it
operates continuously or intermittently. Specifically, loss in the electrochemically active
surface area (ECSA) has been observed under both, steady state and potential cycling
conditions and has been reported in a number of studies.56-59 Most of the loss in activity
(or ECSA) has been attributed chiefly to Pt metal dissolution, especially at higher
potentials (V > 0.80 V vs. RHE).60-63 This dissolved Pt (or alloyed metal, M) can then
redeposit on other particles of the same metal, or deposit on other metal particles
eventually increasing the average particle size distribution on the electrode/catalyst layer;
it can also diffuse into the membrane, forming crystallites on being reduced with the
traveling protons, or even traveling all the way through and depositing onto the cathode.
Many of these causes of electrocatalyst degradation will be taken up in greater detail in a
separate section. Chapters 4 and 5 in this thesis deal exclusively with these issues as
investigated using commercial PtRu catalysts and lend further confirmatory evidence to
studies in the literature.
While we will be focusing on the nature and causes of electrocatalyst degradation, it
is nevertheless instructive to be acquainted with all possible forms of degradation and
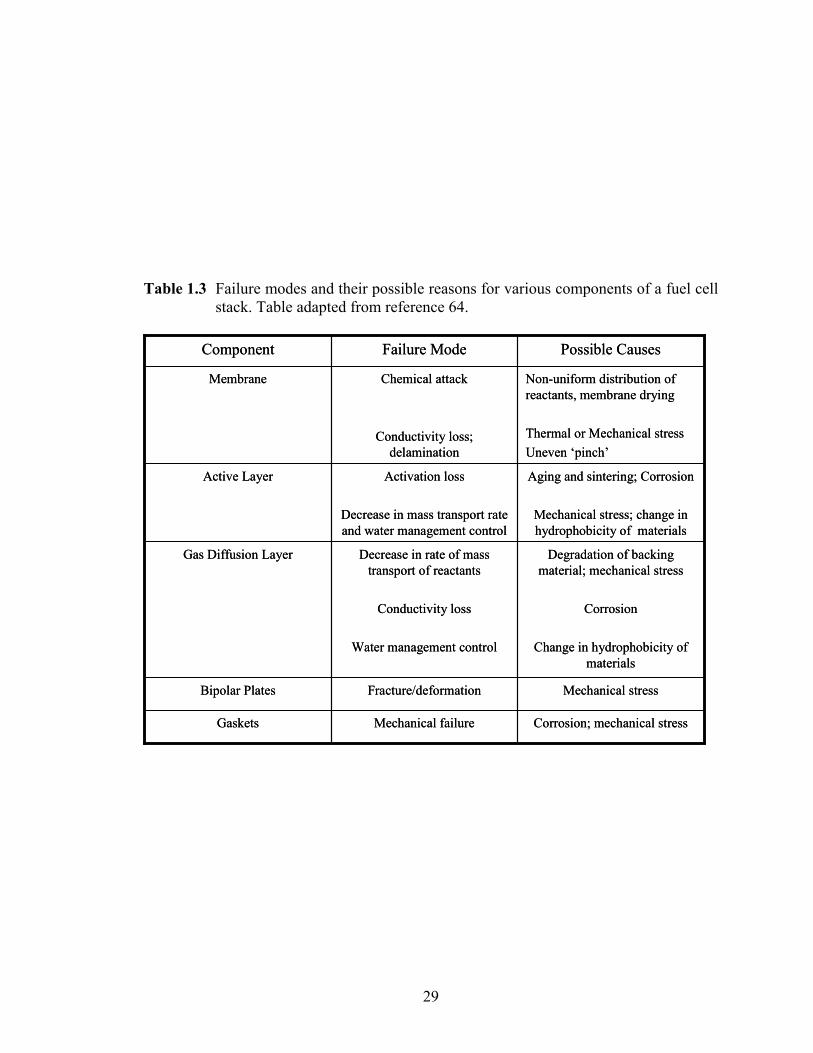
29
Table 1.3 Failure modes and their possible reasons for various components of a fuel cell stack. Table adapted from reference 64.
Corrosion; mechanical stressMechanical failureGaskets
Mechanical stressFracture/deformationBipolar Plates
Degradation of backing material; mechanical stress
Corrosion
Change in hydrophobicity of materials
Decrease in rate of mass transport of reactants
Conductivity loss
Water management control
Gas Diffusion Layer
Aging and sintering; Corrosion
Mechanical stress; change in hydrophobicity of materials
Activation loss
Decrease in mass transport rate and water management control
Active Layer
Non-uniform distribution of reactants, membrane drying
Thermal or Mechanical stressUneven ‘pinch’
Chemical attack
Conductivity loss; delamination
Membrane
Possible CausesFailure ModeComponent
30
reasons for failure leading to limited lifetimes in fuel cell systems. Some of the most
important causes are listed in Table 1.3.
1.3.1 Particle dissolution and growth
1.3.1.1 The thermodynamics of dissolution.
A Pourbaix diagram indicates the thermodynamically stable species (at 25 ºC) at
equilibrium, of a given element in an aqueous environment under various conditions of
pH and electrode potential as determined by the well-known Nernst equation65, 66, E = Eº
- RT/nF ln [H+], where Eº is the cell potential under standard conditions, and the other
symbols have their usual meanings. Thus, in order to determine the tendency for a metal
to go into solution (or remain as is), one need only look up the Pourbaix atlas for the
element concerned. Several studies on the solubility of Pt under equilibrium conditions in
aqueous electrolyte exist in the literature.56, 67-72
A brief survey of studies on Pt dissolution under various conditions of pH,
temperature, electrolyte and potential leads to the following key findings –
1. The solubility of Pt increases with pH, suggesting a dissolution mechanism that is
basic in nature.
2. The metal solubility increases with temperature, also indicating that it is an
endothermic process.
3. The solubility increases with electrode potential up until around 1.10 V (vs. RHE)
after which it levels off or decreases, consistent with the formation of surface
oxides which leads to passivisation of the surface, thereby slowing down the
dissolution.
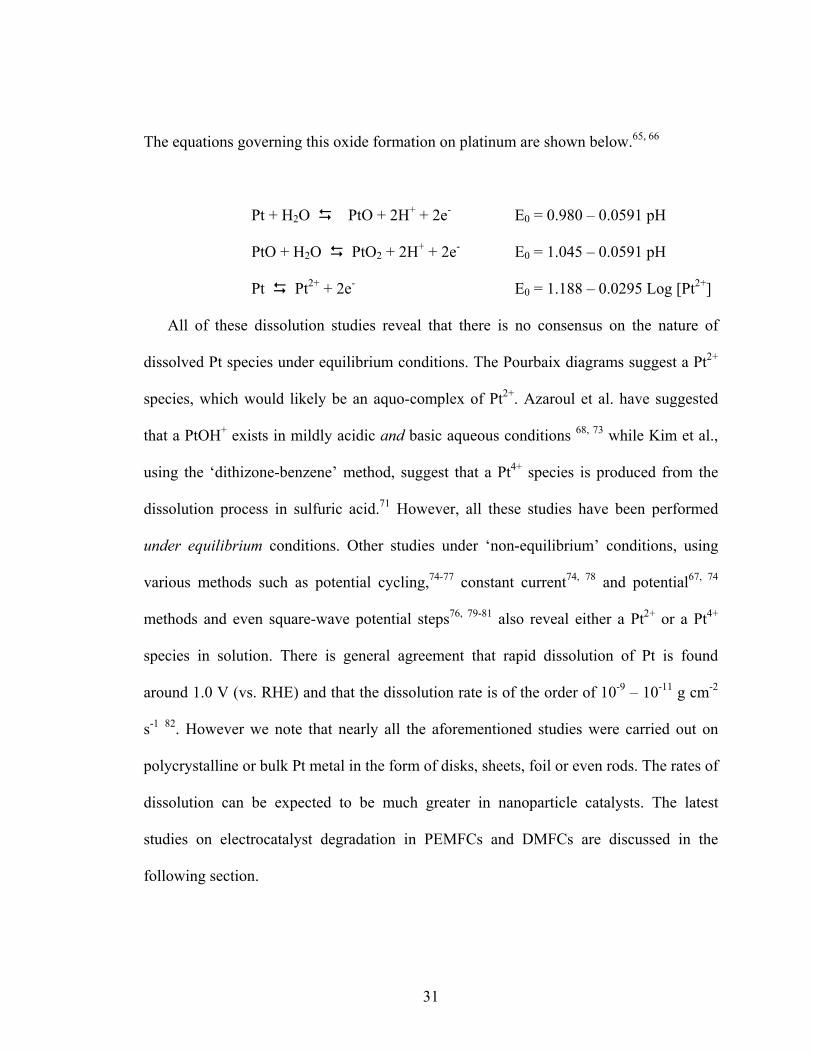
31
The equations governing this oxide formation on platinum are shown below.65, 66
Pt + H2O PtO + 2H+ + 2e- E0 = 0.980 – 0.0591 pH
PtO + H2O PtO2 + 2H+ + 2e- E0 = 1.045 – 0.0591 pH
Pt Pt2+ + 2e- E0 = 1.188 – 0.0295 Log [Pt2+]
All of these dissolution studies reveal that there is no consensus on the nature of
dissolved Pt species under equilibrium conditions. The Pourbaix diagrams suggest a Pt2+
species, which would likely be an aquo-complex of Pt2+. Azaroul et al. have suggested
that a PtOH+ exists in mildly acidic and basic aqueous conditions 68, 73 while Kim et al.,
using the ‘dithizone-benzene’ method, suggest that a Pt4+ species is produced from the
dissolution process in sulfuric acid.71 However, all these studies have been performed
under equilibrium conditions. Other studies under ‘non-equilibrium’ conditions, using
various methods such as potential cycling,74-77 constant current74, 78 and potential67, 74
methods and even square-wave potential steps76, 79-81 also reveal either a Pt2+ or a Pt4+
species in solution. There is general agreement that rapid dissolution of Pt is found
around 1.0 V (vs. RHE) and that the dissolution rate is of the order of 10-9 – 10-11 g cm-2
s-1 82. However we note that nearly all the aforementioned studies were carried out on
polycrystalline or bulk Pt metal in the form of disks, sheets, foil or even rods. The rates of
dissolution can be expected to be much greater in nanoparticle catalysts. The latest
studies on electrocatalyst degradation in PEMFCs and DMFCs are discussed in the
following section.
32
1.3.1.2 The mechanism for degradation.
Over the last 4-5 years, significant interest has been generated within the fuel cell
community towards lifetime studies and fundamental aspects of electrocatalyst
degradation. There is a growing body of information that strongly suggests that Pt
dissolution (or alloyed metal dissolution) is one of the primary causes of degradation of
PEM fuel cells and is largely responsible for their limited lifetime. However, a
mechanistic understanding of the dissolution process still eludes the community, or more
precisely, more fundamental studies are called for in this area before any general
conclusions can be drawn and solutions proposed. A survey of the current body of
literature in this area follows.
One of the earliest studies calling attention to the aging and degradation in low-
temperature fuel cell electrodes was a paper by Wendt et al. in 1996. While the paper
chiefly addressed optimization and modeling of catalyst utilization, a section on the
“ageing and ageing prevention in low-temperature fuel cells” already recognized that
platinum dissolution and agglomeration, as well as oxidative loss of anodic supports
would be a primary means of catalyst degradation. Citing a number of previous studies
on binary and ternary Pt-M alloys, they suggested that alloying of platinum
electrocatalysts would be an efficient way to mitigate the effects of platinum
dissolution.83 However, this approach has now been widely discussed in the literature
(see Section 1.3.1.3). An in situ XAS study by Hwang and Strehblow showed clearly that
platinum is coordinated to more oxygen atoms at higher potentials, in good agreement
with anodic oxidation currents seen in cyclic voltammetric experiments. They also
concluded that platinum crystallization must have occurred as the particle size,
33
determined from NPt-Pt values in EXAFS analysis, showed a clear increase. However, this
conclusion may be in error as it would be highly unlikely that the average particle size
nearly doubles after just a single voltammetric cycle.84 We have carried out similar
experiments on two commercial PtRu catalysts (see chapter 4) and find that the particle
size does increase, but only after 20-40 cycles and not any sooner.
In 2004, a study by Wilkinson’s group at Ballard Power Systems reported the effect
of various operating conditions on aging and degradation in PEMFCs and DMFCs. Some
conditions of operation included varying reactant flow, conditions of temperature and
humidity. They found that the lifetime of the fuel cells may vary from 1000 hours to as
much as 13,000 hours depending on just operating conditions, a very significant finding
85. Various studies on the durability of different kinds of fuel cells carried out before 2003
were summarized and presented in a book chapter entitled, ‘Durability’ in the Handbook
of Fuel Cell Technology and Applications. 86
Key evidence for the existence of ruthenium dissolution losses from a PtRu anode
catalyst was first provided by Piela et al. 87 Darling and Meyers provided the first detailed
theoretical model of the aging process as modeled using dissolution and re-deposition
processes. They found that platinum oxidation has a significant effect on the stability in a
PEMFC environment and also found that start-up and shut-down events accelerate the
metal loss from electrodes. 60 Ferreira et al. carried out studies on a Pt/C catalyst in 0.5M
H2SO4 at 80 ºC and found that Pt dissolution increased with potential from 0.8-1.1 V (vs.
RHE) and that loss in ECSA was much higher at OCP (ca.0.95 V) than under potential
control. They also found that coarsening of the catalyst surface and new Pt crystallites in
the membrane occur through Ostwald ripening and H+ ion encounters in the membrane,
34
respectively.56, 62, 63 Our study on the spontaneous deposition of Ru onto Pt under DMFC
operating conditions (see chapter 5) corroborate their findings, as it was found that
ruthenium ions deposit onto a Pt surface much more readily at OCP than under potential
control, thereby accelerating the degradation process on cathodes. These and other
commonly observed degradation phenomena leading to deactivation in supported metal
catalysts are shown in Figure 1.4.
The stability of low-index and nanofaceted single crystal Pt surfaces has been studied
using cyclic voltammetry (CV), atomic force microscopy (AFM) and inductively-coupled
plasma mass spectrometry (ICP-MS) by Komanicky, Markovic, Myers and others. In
agreement with previous studies mentioned above, it was found that an oxide layer
passivates the surface at higher potentials, lowering dissolution whereas the nanofaceted
surfaces underwent increased dissolution at high potentials. Among the low-index single
crystal faces studied, increased dissolution was found at both 0.65 V and 1.15 V when
compared with 0.95 V for both the Pt(111) and Pt(110) surface. However, while the
dissolution is lowest at 0.95 V for the Pt(111) surface, the rate of dissolution on the
Pt(100) surface decreases uniformly with increasing potential. The authors attribute this
to increased passivisation due to the larger affinity for oxygen on the Pt(100) face over
the Pt(111) surface.67
Place-exchange is the phenomenon by which at high potentials, oxygen goes
subsurface i.e. beneath the surface layer of platinum exposing a fresh layer of Pt atoms to
the surface. Not surprisingly, this is believed to accelerate the rate of Pt dissolution with
cycling as the fresh surface layer of Pt atoms are now susceptible to further oxidation and
dissolution.57
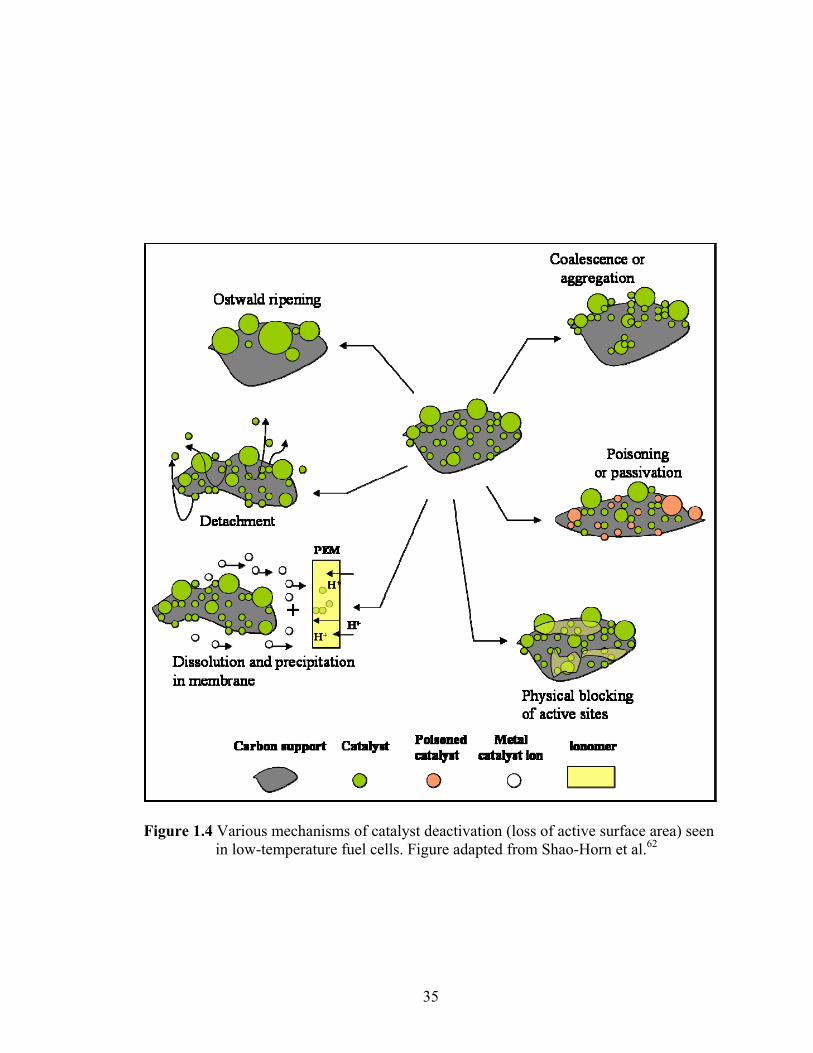
35
Figure 1.4 Various mechanisms of catalyst deactivation (loss of active surface area) seen in low-temperature fuel cells. Figure adapted from Shao-Horn et al.62
36
Yasuda et al. published a number of papers on the subject of Pt and Ru dissolution from
catalysts in PEM fuel cells. They presented compelling evidence for Pt dissolution on the
anode, diffusion through the membrane and deposition at the membrane-cathode
interface by reduction with dissolved hydrogen.88-90
In another study on anode catalysts, various commercially available PtRu catalyst of
varying Ru content were investigated for aging signs in 0.5 M H2SO4 through potential
cycling. They found that the rate of degradation increased with increasing the upper limit
of potential between which the material was cycled. Also, the different catalysts showed
different aging properties and they proposed that the aging differences were due to levels
of crystallinity and surface state but were unable to provide any conclusive evidence for
the same.91
In a similar study on PtRu black anode catalysts (see Chapter 4), we too found that
the aging properties on two different commercial PtRu catalysts were quite different and
using XAS, CO stripping data, Copper under-potential deposition (UPD) measurements
and CVs, were able to attribute the difference in aging mechanisms to the Ru island size
on the catalysts: they were quite large in one case (Tanaka TEC90110) while smaller and
more uniformly alloyed in the other (Johnson-Matthey HiSpec6000).92
Molecular dynamic modeling on Pt catalysts revealed that Pt nanocrystallites can
undergo additional dissolution through electric interaction between the crystallites and
the polarized polymer electrolyte under operating conditions. It was found that this would
lead to a local increase in temperature, increasing the rate of oxidative attack on the
membranes.93 The long term effects of exposure to heat, contact with methanol solution
and CO2 were also reported to cause degradation due to ‘delamination’, a process by
37
which the membrane electrode assembly comes apart when the Nafion ™ membrane
detaches from either of the electrodes, thereby losing contact with the catalyst layer and
causing serious, often irreversible damage.94 Note that this form of degradation is
completely different from many of the other forms of degradation discussed thus far.
Studies using x-ray photoelectron spectroscopy (XPS) and time-of-flight secondary
ion mass spectrometry (TOF-SIMS) showed that loss of Ru is more apparent and
damaging to anodes than Pt dissolution. The Ru species migrated to the cathode side
through the membrane and was found to be deposited chiefly as a RuOx species at the
interface between the cathode catalyst layer and the gas diffusion layer95. Temperature
effects on Pt/C catalysts have also been studied. The degradation observed revealed
straightforwardly that increased temperatures lead to decreased cell lifetimes. As with
previous studies, the degradation was manifest as loss of Pt ECSA and the deposition of
Pt in the membranes; the cathode too was affected, as indicated by the increased particle
size of the Pt layer in the cathode.96
Despite the possibility of exploiting the higher catalytic activity at elevated
temperatures, one problem is effectively traded for another as the effects of degradation
are accelerated as well. Thus, caution must be exercised before proposing apparently
simplistic solutions such as operation at higher temperatures in order to derive better
performance from fuel cells. Further, adequate research into membranes which can
perform well at high temperatures would be necessary before such a move can be used to
tackle the problem of catalyst degradation in PEMFCs.
38
1.3.1.3 Effects of metal alloying on degradation.
A number of alloyed electrocatalysts for both, anodes and cathodes, have
exhibited superior performance when compared to Pt/C 97-112 and efforts to enhance the
performance of oxidation (hydrogen, methanol and ethanol) and the ORR continues to be
an active research area. This enhancement in activity has been attributed to two principal
effects: a structural effect and an electronic or ligand effect. Alloying changes the Pt-Pt
bond distance and is known to affect both, the bond distances in the metals (and thus,
metal-adsorbate bonding geometry) 113-115 and naturally, the electronic properties of the
surface. While performance is no doubt important, note that most of the alloying
elements tend to be more oxophilic in nature (for instance, compared to platinum) and
thus, would be likely to undergo more severe dissolution if any of these atoms should be
near the surface of the catalysts. Yet, some studies have shown that, for instance, PtCo
catalysts are more stable than unalloyed platinum catalysts 116 while others, including
work described in this dissertation (chapter 4) have found evidence of significant
degradation in many alloy catalyst systems.117-121 Clearly, synthesis methods, size,
composition, internal-structure, surface morphology and operating conditions are all
expected to influence the performance and aging characteristics of alloy catalysts.
Understanding such aging phenomena will definitely prove more complicated than
studying single-component systems.
A review of the stability of alloy electrocatalysts has recently been published by
Antolini et al.122 They report that, in general, PtCr and PtCo alloys tend to be more stable
than PtV, PtNi or PtFe alloys but all the various factors just mentioned make a systematic
and rigorous comparison across studies by different research groups nearly impossible.

39
Finally, in situ studies, especially using element-specific techniques such as XAS, will
prove to be invaluable in studying aging phenomena in alloy catalysts. It is hoped that
detailed theoretical and in situ experimental investigations of catalyst aging processes on
various alloy catalyst systems of comparable size and synthesized using the same
procedure, will eventually lead to a more sound understanding of electrocatalyst
degradation.
1.3.2 Degradation of support
1.3.2.1 Dissolution of carbon.
Apart from the metal catalyst itself undergoing dissolution, the high surface area
carbon supports widely used in all PEMCs and DMFCs are also known to undergo
significant degradation. The oxidation of carbon proceeds according to the reaction - 123
C + 2H2O CO2 + 4H+ + 4e- E0 = 0.207 V (vs. RHE)
While the oxidation potential is low enough to be in the operating cell potential
window of many types of fuel cells, it is kinetically not favored, and therefore occurs
very slowly, especially at lower temperatures encountered in PEMFCs and DMFCs.
However, even minute amounts of support corrosion are sufficient to cause long term
degradation through eventual erosion of the carbon support, isolating the Pt islands
electronically from the electrode. This can lead to loss in ECSA either through loss of
contact with the surface or agglomeration as the small portions of the catalyst are no
longer highly dispersed on the support. An excellent survey of carbon corrosion in
PEMFCs as well as other types of fuel cells has been given by Borup et al.82 However, a
brief account of papers published since their review article (2007) was published is given
here.

40
Effects of carbon support and humidification of platinum electrocatalysts have
revealed that the rate of carbon loss (oxidative) increases rapidly with humidification.
Further, it has been found that graphitized carbon black is much more stable than un-
graphitized supports suggesting that carbon surface chemistry is also a critical factor in
the long-term stability of supported metal catalysts.124 Degradation of carbon supports in
PEMFC cathodes as studied with in situ scanning tunneling microscopy (STM) revealed
surface oxide formation that started on steps/edge sites and progressed onto terrace sites.
The corrosion was aggravated in the presence of the Pt catalyst as well as oxygen in the
environment. 125 A study by Virkar et al. (see Figure 1.5) showed unequivocally that
carbon supports play an instrumental role in their own degradation by serving as a
channel for electronic transport between the dissolving Pt nanoparticles, effectively
creating local electrochemical cells on the anode itself (much like concentration cells
found in many cases of corrosion). A likely mechanism which accounts for both,
corrosion of carbon support as well as the Ostwald ripening of supported Pt particles was
given. The study also showed that a small concentration of Ptn+ (n = +2 or +4) ions may
have a significant effect on the roughening of the electrode surface by promoting the
dissolution/re-deposition of Pt by Ostwald ripening. They conclude by suggesting that
operation at elevated temperatures (above 100 ºC) could mitigate the problem. 61 That Pt
and carbon when present together and in close contact cause more dissolution as well as
carbon corrosion has also been observed by other groups.126-129
Carbon support oxidation on the cathode is likely to be more severe than on the anode
due to the increased availability of molecular O2 in the oxidant. This was confirmed in a
study on the structural degradation of PEMFC cathodes by Young et al.130 The catalyst
41
layer was subjected to 30 hour stress tests wherein the potential was cycled from 0.1 to
1.5 V (vs. RHE). The results clearly showed that the carbon sub-layer in the GDL and
cathode catalyst layer were thinned-down due to oxidative corrosion, effectively reducing
the Pt surface area on the cathode catalysts. This in-turn affected the ohmic resistance,
oxygen mass transport and the water-management properties of the cathode. Aging
studies of Pt/glassy carbon electrodes investigated through potential cycling also showed
a loss in the ECSA, as evidenced by a shift in the CO oxidation peak potential. They also
provided evidence through AFM images for Pt dissolution, coalescence and migration
and also suggested that carbon oxidation, apart from the Pt dissolution and redeposition,
could be contributing to the roughness of the surface during aging. 131
1.3.1.2 Alternatives to carbon support.
It is quite unlikely that more noble and electrocatalytically active elements for fuel
cell technology will be discovered as gold and platinum are arguably the most noble of
all known metals. Fairly large reserves of the platinum group metals exist when
compared to say, the rare earths, which, should they turn out to possess novel catalytic
properties, would still be a futile developmental effort. However, alternate supports
which are more stable than carbon offer some hope for addressing the degradation
problem. In the hope of extending the operating lifetimes of catalysts in fuel cells, various
forms of carbon, treated supports and even modified carbon supports have been
researched in order to reduce the extent of carbon corrosion just described. More novel
alternatives are also being pursued in order to avoid using carbon altogether. Some
materials explored to date include nanotubes of all kinds 132-134 (for two recent reviews on
use of nanotubes in catalysis and as fuel cell supports, see references 135 and 136), oxide
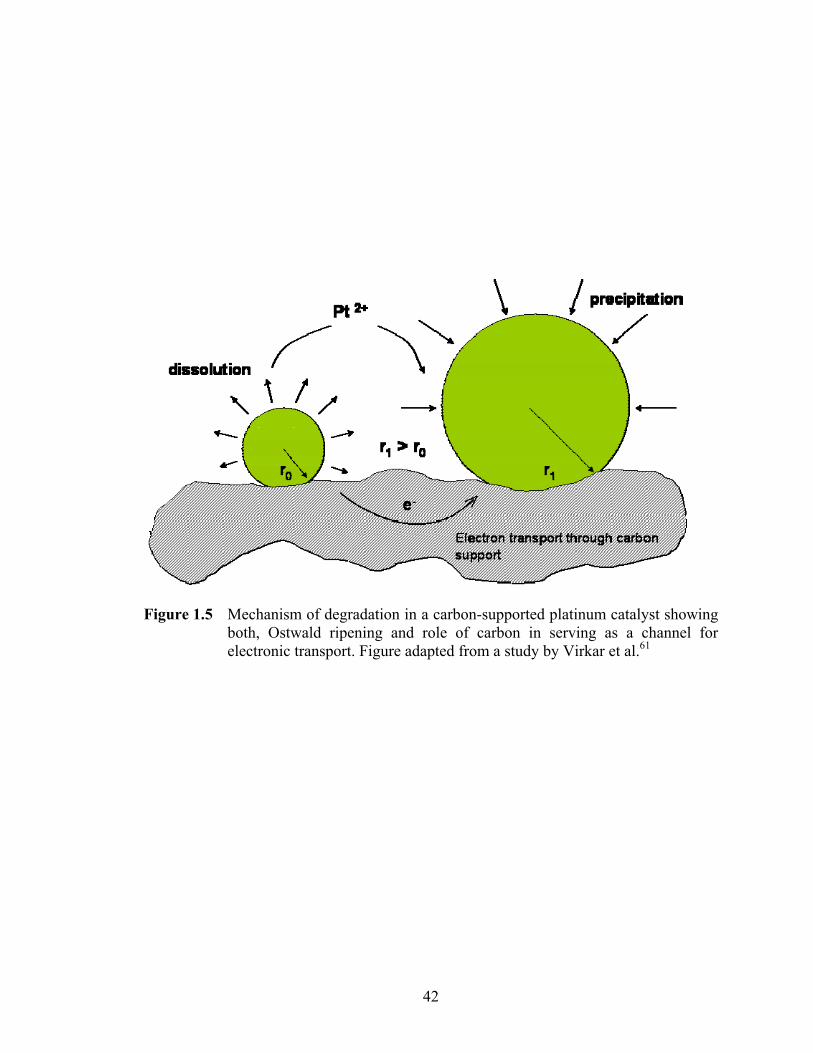
42
Figure 1.5 Mechanism of degradation in a carbon-supported platinum catalyst showing both, Ostwald ripening and role of carbon in serving as a channel for electronic transport. Figure adapted from a study by Virkar et al.61

43
materials,137 silicon,138 conducting polymers,139-141 nonconductive whisker-like
materials,142, 143 and even conductive diamond.144, 145 This area of research was briefly
mentioned here as it is directly relevant to the overall theme of the dissertation, viz. the
understanding of fundamental aspects of aging and degradation in fuel cells, especially
low-temperature fuel cells such as PEMFCs and DMFCs because very often, the catalysts
are supported in order to obtain better dispersion leading to higher surface areas.
However, a detailed treatment of the various avenues being explored to mitigate
degradation in fuel cells is out of scope of this dissertation. The interested reader is
referred to an excellent, comprehensive review article which covers many of the topics on
degradation in fuel cells discussed in this chapter.82
1.4 Organization of the Dissertation
In chapter 2 of this thesis we present a summary of the x-ray absorption technique,
the primary method utilized in this work to provide new insights into the aging and
poisoning of electrocatalysts. The principles of x-ray absorption spectroscopy are
presented along with details of EXAFS analysis as well as analysis of XANES data using
the ∆µ-XANES method. The experimental details for the in situ XAS experiments and
aspects of design and development of in situ spectroelectrochemical cells used in all of
our studies are discussed at length. Following these sections, a brief literature survey of
the development of XAS as a mature technique and a powerful in situ spectroscopy is
also presented.
Chapters 3, 4 and 5 describe studies on the two principal forms of electrocatalyst
degradation viz. loss of ECSA by a) poisoning of active catalytic sites and b) through
44
morphological changes occurring in the electrocatalysts. An in situ XAS study on the
poisoning of Pt/C catalysts by chloride ions was studied and reported in chapter 3. RDE
experiments show unequivocally that adsorbed chloride drastically affects the catalysis
by blocking active surface sites and increases the overpotential for the oxygen reduction
reaction (ORR) by approximately 85 mV for every 10-fold increase in chloride
concentration. Through the use of the Δμ-XANES method, direct spectroscopic evidence
was obtained for the site-specific adsorption of Cl- ions on 3-fold sites on the (111)
planes of Pt nanoparticles. A re-interpretation of previous studies in the literature
alongside our findings reveal interesting details on the complex interplay among
adsorption of commonly encountered ions such as OH-, Cl-, O2- and HSO4
-.
The aging properties of two commercial PtRu catalysts as observed through
voltammetric cycling and chronoamperometry is described in Chapter 4. From both, the
∆μ-XANES method and EXAFS analysis of the catalysts at both the Pt L3 and Ru K
edges, we found that the morphology of the alloy catalysts viz. the difference in the
RuOxHy island size on the two catalysts, could account for the difference in activity and
aging behavior of the catalysts. Characteristic of an Ostwald ripening process, smaller Ru
islands on the surface, which were largely metallic in nature were found to undergo
significant dissolution and redeposition to form larger Ru islands. Larger Ru islands (on
the other commercial catalyst) were heavily oxidized to begin with and were much more
stable. In summary, a mechanistic model for the likely aging mechanisms for the two
catalysts is also proposed. The model accounts for the changes in voltammetric features
of the two commercial catalysts that are observed on continual cycling for up to 500
45
cycles as well as explains the CO stripping data collected on the two catalysts before and
after chronoamperometric aging at 0.5 V for 8 hours.
Chapter 5 builds on the previous chapter and contains studies on the adverse effects
on the ORR due to poisoning of the cathode by Run+ ions that are formed as a result of
metal dissolution of PtRu anode catalysts (such as studied in chapter 4). The ∆μ-XANES
analysis for Ru deposition on Pt/C electrocatalysts involving comparison between
experimental results and theoretical full-multiple scattering calculations using the FEFF
8.0 code revealed that the poisoning was primarily of the site-blocking type wherein the
ions adsorb on the platinum surface in 3-fold hollow sites, blocking active sites for the
catalytic activity of the supported Pt catalysts. The electrochemistry, electron-spin
resonance (ESR) and EXAFS results in our studies collectively indicate that these species
travel through the polymer membrane and deposit onto Pt/C cathodes, affecting the
membrane as well as decreasing the ORR activity. ESR results show that Ru ions, when
present in the membrane, alter the hydration levels and transport properties of the
membrane. Interestingly, the deposition of Ru on Pt was found to be most severe at open
circuit potential (ca. 0.95 V vs. RHE). These and other findings are discussed in detail in
this chapter.
Chapter 6 describes a fundamental investigation into the interaction between a widely
used stabilizing agent and supported platinum electrocatalysts. Nanoparticles are
stabilized by the addition of certain functional polymers that prevent their agglomeration
or coalescence, effectively increasing the lifetime of the nanoparticle catalysts by
preserving their particle size distribution. Polyvinyl Pyrrolidone (PVP) is one such
polymer widely used in this capacity as a capping agent to not only prevents the
46
agglomeration of the metal nanoparticles, but to also aid in the synthesis of specifically-
shaped nanoparticles. In this chapter, the interaction between PVP and platinum is
directly probed in 0.1M HClO4 using the ∆μ-XANES method. In agreement with
previous studies in the literature, we found that the PVP binds to the platinum chiefly via
the free carbonyl groups of the pyrrolidone rings of the polymer. The binding site-
specificity of the method also allowed us to determine that the PVP binds to the platinum
surface at the atop sites. Finally, results on the effect of residual PVP on the catalytic
activity of platinum towards the oxidation of methanol and formic acid are presented and
discussed.
47
1.5 References
1. Steam Engine, History of. The World Book Encyclopedia 18 (So-Sz), 883 (1989).
2. History of the Battery. The World Book Encyclopedia 2 (B) (1989).
3. Grove, W. R. On voltaic series and the combination of gases by platinum. Phil. Mag. Ser. 2, 127-130 (1839).
4. Development of the Gasoline Engine. The World Book Encyclopedia 8 (G) (1989).
5. Important dates in automobile history. The World Book Encyclopedia 1 (A) (1989).
6. Grosser, M. Diesel: The Man and the Engine. Atheneum Press (1978).
7. Ludwig Mond and C. Langer, A new form of gas battery, Proceedings of the Royal Society of London 46 (1889).
8. E. Baur, J. T. Z. Elektrochem. Angew. Phys. Chem. 39 (1933).
9. F.T. Bacon, T. M. F. Review Lecture: The Development and Practical Application of Fuel Cells. Proceedings of the Royal Society of London, Series A, Mathematical and Physical Sciences 334, 431 (1973).
10. W.T. Grubb, L. W. N., Batteries with Solid Ion-Exchange Membrane Electrolytes, Journal of the Electrochemical Society 107, 131 (1960).
11. Grubb, W. T. U.S. Pat. 2, 913, 511 (1959).
12. Kamaruzzaman Sopian, W. R. W. D. Challenges and future developments in proton exchange membrane fuel cells. Renewable Energy 31, 719-727 (2006).
13. George Apanel, E. J. Direct methanol fuel cells - ready to go commercial? Fuel Cells Bulletin, 12-17 (2004).
14. Buchmann, I. The Fuel Cell: is it ready? Batteries in a Portable World (2001).
15. Perry, M. L. & Fuller, T. F. A Historical Perspective of Fuel Cell Technology in the 20th Century. Journal of The Electrochemical Society 149, S59-S67 (2002).
16. M.P. Hogarth, T. R. R. Catalysis for Low Temperature Fuel Cells. Platinum Metals Review 46, 146-164 (2002).
48
17. Zaidi, S. M. J. Technology of Direct Methanol Fuel Cell - Progress and Future Prospects. 6th Saudi Engineering Conference Proceedings, KFUPM, Dhahran 2, 215-230 (2002).
18. R. Parson, V. d. N. Methanol oxidation on platinum electrodes. Journal of Electroanalytical Chemistry 257, 9-13 (1988).
19. A. K. Shukla, R. K. R, Methanol-Resistant Oxygen-Reduction Catalysts for Direct Methanol Fuel Cells. Annual Reviews in Materials Research 33, 155 (2003).
20. A. Anderson, E. G., S. Seong Systematic Theoretical Study of Alloys of Platinum for Enhanced Methanol Fuel Cell Performance. Journal of The Electrochemical Society 143, 2075-2082 (1996).
21. J. O'M. Bockris, H. W., Electrocatalysis, Journal of Electroanalytical Chemistry 7 (6), 428 (1964).
22. M. Watanabe, S. M., Electrocatalysis by ad-atoms : Part III. Enhancement of the oxidation of carbon monoxide on platinum by ruthenium ad-atoms, Journal of Electroanalytical Chemistry 60 (3), 275 (1975).
23. S. Motoo, M. W., Electrocatalysis by Sn and Ge ad-atoms. Journal of Electroanalytical Chemistry 69, 429 (1976).
24. M.M.P. Janssen, P. M., Platinum—tin catalysts for methanol fuel cells prepared by a novel immersion technique, by electrocodeposition and by alloying. Electrochimica Acta 21, 861-869 (1976).
25. S. Gottesfeld, P. Z. Advances in Materials for DMFC systems. 122-124 (1999).
26. John Cruikshank, K. S. The degree and effect of methanol crossover in the direct methanol fuel cell. Journal of Power Sources 70, 40-42 (1998).
27. T.H. Kin, W. Y. S., C.C. Yang, George Yu. Estimating the methanol crossover rate of PEM and the efficiency of DMFC via current transient analysis. Journal of Power Sources 161, 1183-1186 (2006).
28. Keith Scott, A. K. S. Direct Methanol Fuel Cells: Fundamentals, Problems and Perspectives. Modern Aspects of Electrochemistry 40, Chapter 4, 127 (2005).
29. Roberts, M. W. Birth of the catalytic concept (1800-1900). Catalysis Letters 67, 1-4 (2000).
30. Jr., R. L. B. Heterogeneous catalysis before 1934. Heterogeneous Catalysis (ACS Symposium Series) 1, 3-12 (1983).
49
31. Sleight, A. W. Heterogeneous Catalysts. Science 208, 895-900 (1980).
32. Editors: Avelino Corma, F. V. M., S. Mendioroz, J.L.G. Fierro. Proceedings of the 12th International Congress on Catalysis Studies in Surface Science and Catalysis, 83 (2000).
33. Robinson, A. L. Heterogeneous Catalysis: Can Surface Science Contribute? Science 185, 772-774 (1974).
34. White, J. M. Surface Science of Heterogeneous Reactions. Science 218, 429-433 (1982).
35. Yin, Y. et al. Formation of Hollow Nanocrystals Through the Nanoscale Kirkendall Effect. Science 304, 711-714 (2004).
36. Maugh, T. H. Catalysis: "No Longer a Black Art". Science 219, 474-477 (1983).
37. Scientific Background on the Nobel Prize in Chemistry 2007. Kungl. Ventenskapsakademien, The Royal Swedish Academy of Sciences (2007).
38. H. Conrad, G. E., E.E. Latta. Adsorption of hydrogen on palladium single crystal surfaces. Surface Science 41, 435-446 (1974).
39. K. Christmann, G. E., T. Pignet. Adsorption of hydrogen on a Pt(111) surface Surface Science 54, 365-392 (1976).
40. Christmann, K., Schober, O., Ertl, G. & Neumann, M. Adsorption of hydrogen on nickel single crystal surfaces. The Journal of Chemical Physics 60, 4528-4540 (1974).
41. Christmann, K., Behm, R. J., Ertl, G., Hove, M. A. V. & Weinberg, W. H. Chemisorption geometry of hydrogen on Ni(111): Order and disorder. The Journal of Chemical Physics 70, 4168-4184 (1979).
42. S. Hagstrom, H. B. L., G.A. Somorjai. Surface Structures on the Clean Pt(100) Surface. Physical Review Letters 15, 491-493 (1965).
43. D.R. Kahn, E. E. P., G.A. Somorjai The Hydrogenolysis of Cyclopropane on a Platinum Stepped Single Crystal at Atmospheric Pressure. Journal of Catalysis 34, 294-306 (1974).
44. P.S. Cremer, X. S., Y.R. Shen, G.A. Somorjai. The First Measurement of an Absolute Surface Concentration of Reaction Intermediates in Ethylene. Catalysis Letters 40, 143-145 (1996).
50
45. D.W. Blakely, E. I. K., B.A. Sexton, G.A. Somorjai. New Instrumentation and Techniques to Monitor Chemical Surface Reactions on Single Crystals over a Wide Pressure Range (10-8-105 Torr) in the Same Apparatus. Journal of Vacuum Science and Technology 13, 1091 (1976).
46. D.E. Gardin, G. A. S. An Ultrahigh Vacuum Chamber Equipped with a Liquid Phase Reaction Cell. Reveiw of Scientific Instruments 64, 1304 (1993).
47. J.A. Jensen, K. B. R., Y. Chen, M. Salmeron, G.A. Somorjai. High Pressure, High Temperature Scanning Tunneling Microscopy. Journal of Vacuum Science 17, 1080 (1999).
48. L.A. West, E. I. K., G.A. Somorjai. Molecular Beam Scattering from Single Crystal Surfaces under Ultrahigh Vacuum Conditions. Journal of Vacuum Science and Technology 8, 430-436 (1971).
49. S.T. Ceyer, W. J. S., G.A. Somorjai. Design of a Molecular Beam Surface Scattering Apparatus for Velocity and Angular Distribution Measurements, Journal of Vacuum Science and Technology 19, 726 (1981).
50. P.S. Cremer, B. J. M., M. Salmeron, Y.R. Shen, G.A. Somorjai. Monitoring Surfaces on the Molecular Level during Catalytic Reactions at High Pressure by Sum Frequency Generation Vibrational Spectroscopy and Scanning Tunneling Microscopy. Catalysis Letters 34, 11-18 (1995).
51. Mariella Moldovan, S. R., Gregory M. Morrison, Milagros Gomez, M. Antonia Palachios. Impact of ageing on the distribution of platinum group elements and catalyst poisoning elements in automobile catalysts. Surface and Interface Analysis 35, 354-359 (2003).
52. C. G. Myers, W. H. L., P. B. Weisz. Aging of Platinum Reforming Catalysts. Industrial & Engineering Chemistry Research 53, 299-302 (1961).
53. J.H. Vleeming, B. F. M. K., G.B. Marin. Effect of platinum particle size and catalyst support on the platinum catalyzed selective oxidation of carbohydrates. Catalysis Letters 46, 187-194 (1997).
54. Jonas Andersson, M. A., Lisa Eurenius, Eva Olsson, Magnus Skoglundh. Deactivation of diesel oxidation catalysts: Vehicle- and synthetic aging correlations. A report by the Volvo Corporation and Chalmers University of Technology, Sweden (2006).
55. J.H. Vleeming; G.B. Marin, F. O., P. Courtine, B.F.M. Kuster. Graphite-supported platinum catalysts - Effects of gas and aqueous phase treatments. Journal of Catalysis 166, 148-159 (1997).
51
56. Ferreira, P. J. et al. Instability of Pt/C Electrocatalysts in Proton Exchange Membrane Fuel Cells. Journal of The Electrochemical Society 152, A2256-A2271 (2005).
57. Merzougui, B. & Swathirajan, S. Rotating Disk Electrode Investigations of Fuel Cell Catalyst Degradation Due to Potential Cycling in Acid Electrolyte. Journal of The Electrochemical Society 153, A2220-A2226 (2006).
58. M. Fowler, R. F. M., J.C. Amphlett, B.A. Peppley, P.R. Roberge (Eds: W. Vielstich, H.A. Gasteiger, A. Lamm). Handbook of Fuel Cells: Fundamentals, Technology and Applications. 33, 663 (2003).
59. Antolini, E., Formation, microstructural characteristics and stability of carbon supported platinum catalysts for low temperature fuel cells. Journal of Materials Science 38, 2995 (2003).
60. Darling, R. M. & Meyers, J. P. Mathematical Model of Platinum Movement in PEM Fuel Cells. Journal of The Electrochemical Society 152, A242-A247 (2005).
61. Virkar, A. V. & Zhou, Y. Mechanism of Catalyst Degradation in Proton Exchange Membrane Fuel Cells. Journal of The Electrochemical Society 154, B540-B547 (2007).
62. Y. Shao-Horn, W. C. S., S. Chen, P.J. Ferreira, E.F. Holby, D. Morgan. Instability of Supported Platinum Nanoparticles in Low-Temperature Fuel Cells. Topics in Catalysis 46, 285-305 (2007).
63. Ferreira, P. J. & Shao-Horn, Y. Formation Mechanism of Pt Single-Crystal Nanoparticles in Proton Exchange Membrane Fuel Cells. Electrochemical and Solid-State Letters 10, B60-B63 (2007).
64. C.M. Rangel, R. A. S., T.I. Paiva. Materials aging mechanisms and performance impact in PEM fuel cells. Journal of New Materials for Electrochemical Systems 12, 119-122 (2009).
65. Pourbaix, M. Atlas of Electrochemical Equilibria in Aqueous Solutions (Pergamon Press, London, 1966).
66. M.J.N. Pourbaix, J. V. M., N. de Zoubov. Electrochemical Properties of the Platinum Metals. Platinum Metals Review 47-53 (1959).
67. Komanicky, V. et al. Stability and Dissolution of Platinum Surfaces in Perchloric Acid. Journal of the Electrochemical Society 153, B446-B451 (2006).
52
68. M. Azaroul, B. R., P. Freyssinet, J.R. Disnar. Solubility of platinum in aqueous solutions at 25°C and pHs 4 to 10 under oxidizing conditions. Geochimica et Cosmochimica Acta 65, 4453 (2001).
69. F.W. Bowles, A. P. G., D.J. Vaughan, S.J. Norris. Chronique de la Recherche Miniere 529, 65 (1995).
70. Bindra, P., Clouser, S. J. & Yeager, E. Platinum Dissolution in Concentrated Phosphoric Acid. Journal of The Electrochemical Society 126, 1631-1632 (1979).
71. J.H. Kim, A. I., S. Mitsushima, N. Kamiya, K. Ota. Catalytic activity of titanium oxide for oxygen reduction reaction as a non-platinum catalyst for PEFC. Electrochimica Acta 52, 2492 (2007).
72. Wood, S. A. Experimental determination of the hydrolysis constants of Pt2+ and Pd2+ at 25°C from the solubility of Pt and Pd in aqueous hydroxide solutions. Geochimica et Cosmochimica Acta 55, 1759 (1991).
73. M. Azaroul, B. R., P. Freyssinet, J.R. Disnar. Response to the comment by R. H. Byrne on “Solubility of platinum in aqueous solutions at 25°c and pHs 4 to 10 under oxidizing conditions” (2001) Geochim. Cosmochim. Acta 65, 4453–4466. Geochimica et Cosmochimica Acta 67, 2511 (2003).
74. G. Benke, W. G. The Electrochemical Dissolution of Platinum. Hydrometallurgy 64, 205 (2002).
75. D.C. Johnson, D. T. N., S. A ring-disk electrode study of the current/potential behaviour of platinum in 1.0 M sulphuric and 0.1 M perchloric acids Bruckenstein. Electrochimica Acta 15, 1493 (1970).
76. K. Kinoshita, J. T. L., P. Stonehart, Potential Cycling Effects on Platinum Electrocatalyst Surfaces. Journal of Electroanalytical Chemistry 48, 157 (1973).
77. D.A.J. Rand, R. W. A study of the dissolution of platinum, palladium, rhodium and gold electrodes in 1 M sulphuric acid by cyclic voltammetry. Journal of Electroanalytical Chemistry 35, 209 (1972).
78. K. -I. Ota, S. N., N. Kamiya. Dissolution of Platinum Anodes in Sulfuric Acid Solution. Journal of Electroanalytical Chemistry 257, 205 (1988).
79. A.J. Arvia, J. C. C., E. Custidiano, C.L. Perdriel, W.E. Triaca. Electrochemical Faceting of Metal Electrodes. Electrochimica Acta 31, 1359 (1986).
80. J. C. Canullo, W. E. T., A.J. Arvia, Electrochemical faceting of single crystal platinum electrodes. Journal of Electroanalytical Chemistry 200, 397 (1986).
53
81. W.A. Egli, A. V., W.E. Triaca, A.J. Arvia. The development of facetting and roughening at platinum polyfacetted single-crystal electrodes in a chloroplatinic acid solution. Applied Surface Science 68, 583 (1993).
82. Rod Borup, J. M., Bryan Pivovar, Yu Seung Kim, Rangachary Mukundan, Nancy Garland, Deborah Meyers, Mahlon Wilson, Fernando Garzon, David Wood, Piotr Zelenay, Karren More, Ken Stroh, Tom Zawodzinski, James Boncella, James E. McGrath, Minoru Inaba, Kenji Miyatake, Michio Hori, Knichiro Ota, Zempachi Ogumi, Seizo Miyata, Atshushi Nishikata, Zyun Siroma, Yoshiharu Uchimoto, Kazuaki Yasuda, Ken-ichi Kimijima, Norio Iwashita. Scientific Aspects of Polymer Electrolyte Fuel Cell Durability and Degradation. Chemical Reviews 107, 3904-3951 (2007).
83. Wendt, H., Brenscheidt, T., Fischer, A. & Kendall, K. Optimization and Modelling of Fuel Cell Electrodes with Emphasis upon Catalyst Utilization Ageing Phenomena and Ageing Prevention [and Discussion]. Philosophical Transactions of the Royal Society of London. Series A: Mathematical, Physical and Engineering Sciences 354, 1627-1641 (1996).
84. B.J. Hwang, Y. W. S., J.F. Lee, P. Borthen. H.H. Strehblow. In situ EXAFS investigation of carbon-supported Pt clusters under potential control. J. Synchrotron Rad. 8, 484-486 (2001).
85. Shanna D. Knights, K. M. C., Jean St-Pierre, David P. Wilkinson. Aging Mechanisms and Lifetime of PEMFC and DMFC. Journal of Power Sources 127, 127-134 (2004).
86. David P. Wilkinson, J. S.-P. Durability. Handbook of Fuel Cell Technology and Applications 3 Ch. 47, 611-626 (2003).
87. Piela, P., Eickes, C., Brosha, E., Garzon, F. & Zelenay, P. Ruthenium Crossover in Direct Methanol Fuel Cell with Pt-Ru Black Anode. Journal of The Electrochemical Society 151, A2053-A2059 (2004).
88. Kazuaki Yasuda, A. T., Tomoki Akita, Tsutomu Ioroi, Zyun Siroma. Platinum dissolution and depostion in the polymer electrolyte membrane of a PEM fuel cell as studied by potential cycling. Physical Chemistry Chemical Physics 8, 746-752 (2006).
89. T. Akita, A. T., J. Maekawa, Z. Siroma, K. Tanaka, M. Kohyama, K. Yasuda. Analytical TEM study of Pt particle deposition in the proton-exchange membrane of a membrane-electrode-assembly. Journal of Power Sources 159, 461 (2006).
90. Yasuda, K., Taniguchi, A., Akita, T., Ioroi, T. & Siroma, Z. Characteristics of a Platinum Black Catalyst Layer with Regard to Platinum Dissolution Phenomena
54
in a Membrane Electrode Assembly. Journal of The Electrochemical Society 153, A1599-A1603 (2006).
91. Yamada, H., Shimoda, D., Matsuzawa, K., Tasaka, A. & Inaba, M. Stability of Pt-Ru/C Catalysts: Effects of Ru Content. ECS Transactions 11, 325-334 (2007).
92. Arruda, T. M., Shyam, B., Ziegelbauer, J. M., Ramaker, D. E. & Mukerjee, S. In situ XAS Investigation of Electrocatalyst Surface Poisoning by Halides. ECS Transactions 11, 903 (2007).
93. Zhou, X. Degradation of Pt Catalysts in PEFCs: A New Perspective from Molecular Dynamic Modeling. Electrochemical and Solid-State Letters 11, B59-B62 (2008).
94. Soowhan Kim, B. K. A., M.M. Mench. Physical degradation of membrane electrode assemblies undergoing freeze/thaw cycling: Diffusion media effects. Journal of Power Sources 179, 140-146 (2008).
95. Wang, C. et al. Three-Dimensional Superlattices Built from (M4In16S33)10- (M = Mn, Co, Zn, Cd) Supertetrahedral Clusters. J. Amer. Chem. Soc. 123, 11506-11507 (2001).
96. Bi, W. & Fuller, T. F. Temperature Effects on PEM Fuel Cells Pt/C Catalyst Degradation. Journal of The Electrochemical Society 155, B215-B221 (2008).
97. Fernandez, J. L., Walsh, D. A. & Bard, A. J. Thermodynamic Guidelines for the Design of Bimetallic Catalysts for Oxygen Electroreduction and Rapid Screening by Scanning Electrochemical Microscopy. M−Co (M: Pd, Ag, Au). Journal of the American Chemical Society 127, 357-365 (2004).
98. Geng, D. & Lu, G. Dependence of Onset Potential for Methanol Electrocatalytic Oxidation on Steric Location of Active Center in Multicomponent Electrocatalysts. The Journal of Physical Chemistry C 111, 11897-11902 (2007).
99. Stamenkovic, V., Schmidt, T. J., Ross, P. N. & Markovic, N. M. Surface Composition Effects in Electrocatalysis: Kinetics of Oxygen Reduction on Well-Defined Pt3Ni and Pt3Co Alloy Surfaces. The Journal of Physical Chemistry B 106, 11970-11979 (2002).
100. Ohtani, T., Takeuchi, H., Koh, K. & Kaneko, T. Electrical properties and phase transitions of TlCu3S2 and BaCu2S2. J. Alloys Comp. 317-318, 201-207 (2001).
101. Stamenkovic, V. R., Mun, B. S., Mayrhofer, K. J. J., Ross, P. N. & Markovic, N. M. Effect of Surface Composition on Electronic Structure, Stability, and Electrocatalytic Properties of Pt-Transition Metal Alloys: Pt-Skin versus Pt-

55
Skeleton Surfaces. Journal of the American Chemical Society 128, 8813-8819 (2006).
102. Zhang, J., Vukmirovic, M. B., Xu, Y., Mavrikakis, M. & Adžić, R. R. Controlling the Catalytic Activity of Platinum Monolayer Electrocatalyst from Oxygen Reduction with Different Substrates. Angew. Chem. Int. Ed. 44, 2132-2135 (2005).
103. Liu, Z. et al. PtMo Alloy and MoOx@Pt Core−Shell Nanoparticles as Highly CO-Tolerant Electrocatalysts. Journal of the American Chemical Society 131, 6924-6925 (2009).
104. Park, J. & Cheon, J. Synthesis of “Solid Solution” and “Core-Shell” Type Cobalt-Platinum Magnetic Nanoparticles via Transmetalation Reactions. J. Am. Chem. Soc. 123, 5743-5746 (2001).
105. Yeh, Y.-C. et al. Pd−C−Fe Nanoparticles Investigated by X-ray Absorption Spectroscopy as Electrocatalysts for Oxygen Reduction. Chemistry of Materials 21, 4030-4036 (2009).
106. Shao, M.-H., Sasaki, K. & Adzic, R. R. Pd−Fe Nanoparticles as Electrocatalysts for Oxygen Reduction. Journal of the American Chemical Society 128, 3526-3527 (2006).
107. Strasser, P. Combinatorial Optimization of Ternary Pt Alloy Catalysts for the Electrooxidation of Methanol. Journal of Combinatorial Chemistry 10, 216-224 (2008).
108. Jeon, T.-Y. et al. Influence of Oxide on the Oxygen Reduction Reaction of Carbon-Supported Pt−Ni Alloy Nanoparticles. The Journal of Physical Chemistry C 113, 19732-19739 (2009).
109. Murthi, V. S., Urian, R. C. & Mukerjee, S. Oxygen Reduction Kinetics in Low and Medium Temperature Acid Environment: Correlation of Water Activation and Surface Properties in Supported Pt and Pt Alloy Electrocatalysts. J. Phys. Chem. B 108, 11011-11023 (2004).
110. Yang, H., Vogel, W., Lamy, C. & Alonso-Vante, N. Structure and Electrocatalytic Activity of Carbon-Supported Pt−Ni Alloy Nanoparticles Toward the Oxygen Reduction Reaction. The Journal of Physical Chemistry B 108, 11024-11034 (2004).
111. Fernandez, J. L., Raghuveer, V., Manthiram, A. & Bard, A. J. Pd−Ti and Pd−Co−Au Electrocatalysts as a Replacement for Platinum for Oxygen Reduction in Proton Exchange Membrane Fuel Cells. Journal of the American Chemical Society 127, 13100-13101 (2005).
56
112. Yang, H., Alonso-Vante, N., Leger, J.-M. & Lamy, C. Tailoring, Structure, and Activity of Carbon-Supported Nanosized Pt−Cr Alloy Electrocatalysts for Oxygen Reduction in Pure and Methanol-Containing Electrolytes. The Journal of Physical Chemistry B 108, 1938-1947 (2004).
113. Jalan, V. & Taylor, E. J. Importance of Interatomic Spacing in Catalytic Reduction of Oxygen in Phosphoric Acid. Journal of The Electrochemical Society 130, 2299-2302 (1983).
114. Mavrikakis, M., Hammer, B. & Nørskov, J. K. Effect of Strain on the Reactivity of Metal Surfaces. Physical Review Letters 81, 2819 (1998).
115. F.A. Pedersen, J. G., J. K. Norskov. Understanding the Effect of Steps, Strain, Poisons, and Alloying: Methane Activation on Ni Surfaces. Catalysis Letters 105, 9-13 (2005).
116. P. Yu, M. P., P. Plasse. Journal of Power Sources 144, 11 (2005).
117. Holstein, W. L. & Rosenfeld, H. D. In-Situ X-ray Absorption Spectroscopy Study of Pt and Ru Chemistry during Methanol Electrooxidation†. The Journal of Physical Chemistry B 109, 2176-2186 (2004).
118. Ziegelbauer, J. M., Gatewood, D., Gullá, A. F., Ramaker, D. E. & Mukerjee, S. X-ray Absorption Spectroscopy Studies of Water Activation on an RhxSy Electrocatalyst for ORR Applications. Electrochem. Solid-State Lett. 9, A430-A434 (2006).
119. Mayrhofer, K. J. J., Hartl, K., Juhart, V. & Arenz, M. Degradation of Carbon-Supported Pt Bimetallic Nanoparticles by Surface Segregation. Journal of the American Chemical Society 131, 16348-16349 (2009).
120. H.R. Colon-Mercado, B. N. P. Stability of platinum based alloy cathode catalysts in PEM fuel cells. Journal of Power Sources 155, 253 (2006).
121. Ma, Y. & Balbuena, P. B. Surface Properties and Dissolution Trends of Pt3M Alloys in the Presence of Adsorbates. The Journal of Physical Chemistry C 112, 14520-14528 (2008).
122. E. Antolini, J. R. C. S., E.R. Gonzalez. The stability of Pt–M (M = first row transition metal) alloy catalysts and its effect on the activity in low temperature fuel cells: A literature review and tests on a Pt–Co catalyst. Journal of Power Sources 160, 957 (2006).
123. Kinoshita, K. Particle Size Effects for Oxygen Reduction on Highly Dispersed Platinum in Acid Electrolytes. J. Electrochem. Soc. 137, 845-848 (1990).
57
124. Stevens, D. A., Hicks, M. T., Haugen, G. M. & Dahn, J. R. Ex Situ and In Situ Stability Studies of PEMFC Catalysts. Journal of The Electrochemical Society 152, A2309-A2315 (2005).
125. Matsumoto, M., Manako, T. & Imai, H. Degradation of Carbon Supports in PEFC Cathode Electrode Investigated by Electrochemical STM: Effects of Platinum and Oxygen on Enhanced Carbon Corrosion. ECS Transactions 16, 751-760 (2008).
126. Roen, L. M., Paik, C. H. & Jarvi, T. D. Electrocatalytic Corrosion of Carbon Support in PEMFC Cathodes. Electrochemical and Solid-State Letters 7, A19-A22 (2004).
127. Paik, C. H., Jarvi, T. D. & O'Grady, W. E. Extent of PEMFC Cathode Surface Oxidation by Oxygen and Water Measured by CV. Electrochemical and Solid-State Letters 7, A82-A84 (2004).
128. K. Kinoshita, J. B. Determination of carbon surface oxides on platinum-catalyzed carbon. Carbon 12 (5), 525 (1974).
129. Yu, P. T., Gu, W., Makharia, R., Wagner, F. T. & Gasteiger, H. A. The Impact of Carbon Stability on PEM Fuel Cell Startup and Shutdown Voltage Degradation. ECS Transactions 3, 797-809 (2006).
130. Young, A. P., Stumper, J. & Gyenge, E. Characterizing the Structural Degradation in a PEMFC Cathode Catalyst Layer: Carbon Corrosion. Journal of The Electrochemical Society 156, B913-B922 (2009).
131. Gu, Y. et al. Aging Studies of Pt/Glassy Carbon Model Electrocatalysts. Journal of The Electrochemical Society 156, B485-B492 (2009).
132. Bessel, C. A., Laubernds, K., Rodriguez, N. M. & Baker, R. T. K. Graphite Nanofibers as an Electrode for Fuel Cell Applications. The Journal of Physical Chemistry B 105, 1115-1118 (2001).
133. T. Maiyalagan, B. V., U. Varadaraju. Nitrogen containing carbon nanotubes as supports for Pt – Alternate anodes for fuel cell applications. Electrochemistry Communications 7, 905 (2005).
134. B. Rajesh, V. K., S. Karthikeyan, K.R. Thampi, J.M. Bonard, B. Viswnathan. Pt–WO3 supported on carbon nanotubes as possible anodes for direct methanol fuel cells. Fuel 81, 2177 (2002).
135. P. Serp, M. C., P. Kalck. Carbon nanotubes and nanofibers in catalysis. Applied Catalysis A 253 (2), 337 (2003).
58
136. K. Lee, J. J. Z., H.J. Wang, D.P. Wilkinson. Progress in the synthesis of carbon nanotube- and nanofiber-supported Pt electrocatalysts for PEM fuel cell catalysis. Journal of Applied Electrochemistry 36, 507-522 (2006).
137. Huang, S.-Y., Ganesan, P., Park, S. & Popov, B. N. Development of a Titanium Dioxide-Supported Platinum Catalyst with Ultrahigh Stability for Polymer Electrolyte Membrane Fuel Cell Applications. Journal of the American Chemical Society 131, 13898-13899 (2009).
138. Hayase, M., Kawase, T. & Hatsuzawa, T. Miniature 250 mu m Thick Fuel Cell with Monolithically Fabricated Silicon Electrodes. Electrochemical and Solid-State Letters 7, A231-A234 (2004).
139. G. Wu, L. L., J.H. Li, B. Q. Xu. Polyaniline-carbon composite films as supports of Pt and PtRu particles for methanol electrooxidation Carbon 43, 2579 (2005).
140. Lefebvre, M. C., Qi, Z. & Pickup, P. G. Electronically Conducting Proton Exchange Polymers as Catalyst Supports for Proton Exchange Membrane Fuel Cells. Electrocatalysis of Oxygen Reduction, Hydrogen Oxidation, and Methanol Oxidation. Journal of The Electrochemical Society 146, 2054-2058 (1999).
141. Swathirajan, S. & Mikhail, Y. M. Methanol Oxidation on Platinum-Tin Catalysts Dispersed on Poly(3-methyl)thiophene Conducting Polymer. Journal of The Electrochemical Society 139, 2105-2110 (1992).
142. Bonakdarpour, A. et al. Studies of Transition Metal Dissolution from Combinatorially Sputtered, Nanostructured Pt1-x Mx (M = Fe, Ni; 0 < x < 1) Electrocatalysts for PEM Fuel Cells. J. Electrochem. Soc. 152, A61-A72 (2005).
143. M.K. Debe (Eds: W. Vielstich, A. L., H.A. Gasteiger) Handbook of Fuel Cell Technology and Applications, John Wiley and Sons, N.Y. (2003).
144. Wang, J. & Swain, G. M. Fabrication and Evaluation of Platinum/Diamond Composite Electrodes for Electrocatalysis. J. Electrochem. Soc. 150, E24-E32 (2003).
145. Lee, Y. J., Wang, F., Mukerjee, S., McBreen, J. & Grey, C. P. 6Li and 7Li magic-angle spinning nuclear magnetic resonance and in situ X-ray diffraction studies of the charging and discharging of LixMn2O4 at 4 V. J. Electrochem. Soc. 147, 803-812 (2000).
59
Chapter 2
In situ X-ray Absorption Spectroscopy: Experiment, Theory and
Analysis
2.1 XAS – An overview
It was mentioned in chapter 1 that x-ray absorption spectroscopy (XAS) is uniquely
positioned to study catalysts as they function, under realistic operating conditions. XAS
has a singular advantage over most other spectroscopic techniques in that one uses x-rays
to probe the system under study. X-rays belong to that part of the electromagnetic
spectrum, more poetically called ‘Maxwell’s rainbow’, having energies of the order of 1-
100 keV. Further, the core-level binding energies of most elements are well-separated in
energy and lie in this very range, making it possible to probe virtually all elements and
their compounds using XAS. By choosing a particular energy range, one can selectively
probe only the element of interest, making it an element-specific technique. X-rays
possessing energies beyond for e.g. the 2-3 keV energy range, are less susceptible to
absorption by many compounds of lighter elements, including for instance, water (H2O).
This a particularly important advantage as many important catalytic processes in nature
60
and those employed in various industries occur in solution. Another interesting aspect of
XAS is that the mean free path of a photoelectron (electron ejected by a photon-electron
interaction) is of the order of 8-10 Å. Thus, one is able to effectively probe the immediate
environment of any material without placing any constraints on its structural properties.
This allows one to study all kinds of compounds under various conditions including
polymers, molten salts, nanoparticles, minerals and enzymes; it has also been used in
unexpected, fascinating areas such as identifying historical inks in pigments found on
archeological remains and in famous paintings etc.
In recent years, XAS has been used to attack some very significant problems and in
the future this will surely increase. Examples include understanding the structure-
function relationship of one of most highly conserved of all proteins, Cytochrome C,1, 2 to
obtaining the most-likely structure of the photosynthetic Mn4Ca cluster,3-8 to even
revealing the local structure of water.9-11 It is also interesting to note that the timeframe of
the entire absorption event (excitation of the core-level electron and filling of the core-
hole by another electron) is of the order of a femtosecond.12,13 An x-ray absorption
spectrum is therefore very much like a snapshot of the molecule and its environment
(discussed in greater detail in ‘Principles of XAS’ section). In the near future, one will be
able to collect ultra-fast, time-resolved XAS data, which will revolutionize the study of
catalysis, as one can then observe both, structural changes and changes in oxidation state
of the catalyst during catalytic activity. Some very recent breakthroughs 14-17 and review
articles, most notably by Chergui and co-workers, highlight the progress and potential for
this field of spectroscopy.18-21 Considering all the advantages mentioned above, XAS
offers direct promise for the in situ studies of catalytic reactions 12, 22, 23 and indeed, has
61
already proven its worth as evidenced by the large number of studies using XAS that are
published every year.
In our research group, as well as most of the work described in this thesis, the many
advantages of XAS are suitably brought to bear on the study of electrocatalysis.
Electrocatalysts as used in fuel cells are typically nanoparticles dispersed on a high-
surface area support, commonly carbon, and are present in an electrolyte of some kind.
The electrolyte may be in the form of a polymer electrolyte membrane (PEM), such as
Nafion™ 117, or an acid such as phosphoric acid (in PAFCs). As nanoparticle catalysts
are typically between 2-5 nm, they do not possess long-range order and thus, cannot be
adequately probed by x-ray diffraction (XRD), which might otherwise be the technique
of choice to obtain structural information. Transmission electron microscopy (TEM)
provides great detail on nanoparticle morphology but is, as of today, chiefly useful for ex
situ studies of such catalysts. However, over the last decade, several groups have been
making progress in studying the solid-liquid interface using in-situ TEM.24-28 The
presence of electrolyte however greatly enhances the inelastic scattering of the electron
beam and does not allow one to obtain images with atomic-level resolution as is possible
in air. As was briefly mentioned earlier, the presence of a liquid layer around the catalyst
rules out a good many spectroscopic techniques as well, including all those that require
ultra-high vacuum or low pressures (XPS, Auger, HREELS) and low-energy
spectroscopic techniques (Raman, IR, FTIR, UV-Vis spectroscopy). Several modified
vibrational spectroscopic techniques for in situ electrochemical measurements such as
second harmonic generation (SHG), sum-frequency generation (SFG), subtractively-
normalized FTIR spectroscopy (SNIFTIRS), attenuated total reflectance (ATR) and
62
surface-enhanced infra-red absorption spectroscopy (SEIRAS), to name a few, exist, but
are severely limited in their applicability and the information they provide. In most of
these techniques, the signal-noise ratio can be quite low and observations of three-fold
adsorption sites are not possible due to dipole selection rules imposed on the
measurement by the processes.29 Further, many of these methods cannot be used in a
working fuel cell containing a fair number of additional components around the catalyst
layer including high surface area carbon support, electrolyte layer, graphite current
collector plates, a plastic body etc. Finally, while some of these techniques may be well-
suited to study CO adsorption on nanoparticle catalysts,29 to the best of our knowledge,
none of them can actually follow changes in the adsorption of H, OH or O, all very
important adsorbates in the study of electrocatalytic processes. These adsorbates however
can be followed with XAS, specifically using the ∆μ-XANES technique developed by
Ramaker and Koningsberger.30-33 Apart from getting surface-specific information about
adsorbates, valuable structural information from the fine structure (EXAFS region) is also
obtained which complements very well, the information contained in the XANES region.
2.2 Synchrotron Radiation and Experimental methods
The majority of x-ray absorption experiments around the world are carried out at a
synchrotron facility (see Figure 2.1). A synchrotron provides researchers with
exceptionally high-intensity photons for their experiments. Radiation from all parts of the
electromagnetic spectrum are obtained through synchrotron radiation, though it is
primarily used for producing x-rays; in many synchrotrons, super bright ultraviolet (UV),
visible (Vis) and infra-red (IR) radiation are also produced for spectroscopic studies. One
63
of the added advantages at such a facility is the ability to obtain either linearly or
circularly polarized light for dichroism studies, making a host of magnetic and surface
studies possible. A cone of synchrotron radiation is produced when electrons are
accelerated to very high velocities (v ≈ c) and is a consequence of the laws of
electromagnetism. Within the framework of the classical theory of electromagnetism as
described by Maxwell’s equations, the principle of conservation of energy requires that
an accelerating charge should emit radiation. Synchrotrons are almost always in the shape
of a ‘ring’ so that a current of electrons can be kept circulating such that they undergo
acceleration at all points of their trajectory. As electrons are injected into the ring at high
energy, they are continuously accelerated towards the center of the ring, and therefore
emit radiation tangentially to the path of the electrons. Strong, carefully designed
magnetic fields are used to keep the electrons going around the storage ring in circular
motion. Third generation synchrotron facilities also make use of specialized injection
devices such as undulators and wigglers to obtain radiation of very high intensity.
X-rays of very high energy (ca. 100 keV or greater) may also be produced in such
facilities, albeit at the expense of some intensity of the photon beam. All experimental
stations are located at the periphery of the ring to collect the photons and channel them
into the sample under study. Continuous x-rays over a large energy range are produced
by the synchrotron and sophisticated beamline optics allows one to manipulate the beam
for various experimental techniques. A key feature of every beamline is the ability to
obtain monochromatic x-rays. This optical arrangement called a monochromator
typically consists of two single crystals of very high purity that are arranged in parallel so
as to select particular energies out of the x-ray beam, and is shown in Figure 2.2.
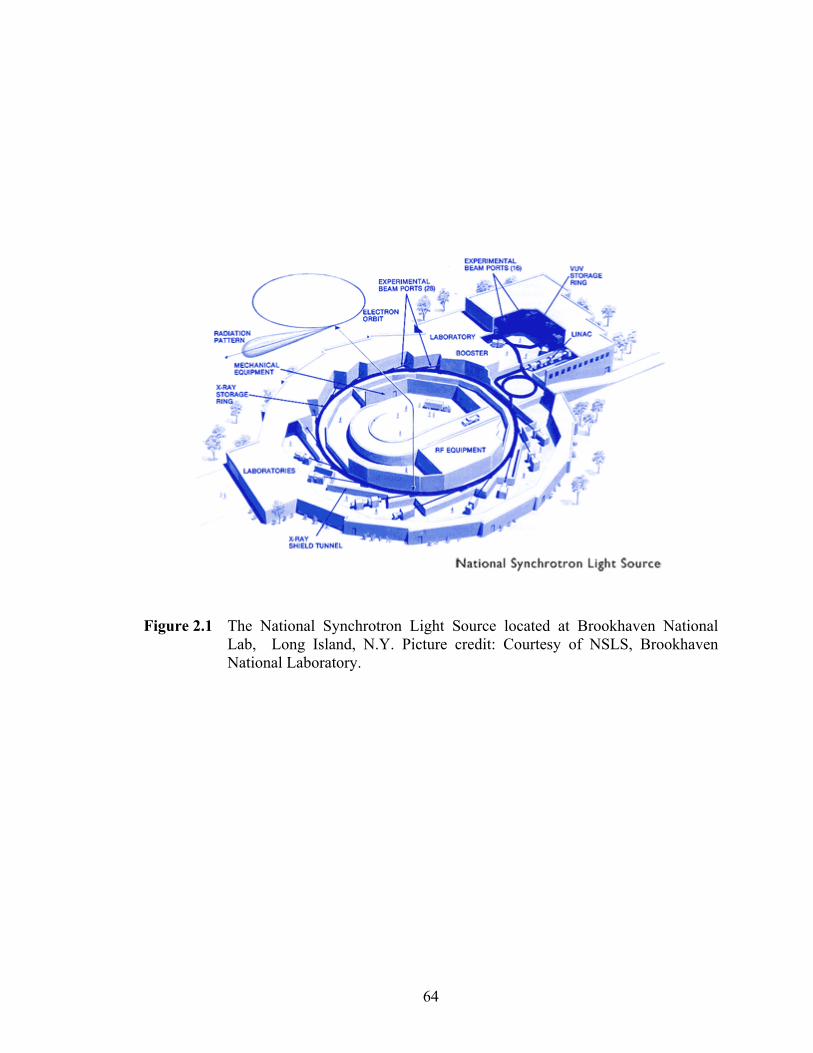
64
Figure 2.1 The National Synchrotron Light Source located at Brookhaven National
Lab, Long Island, N.Y. Picture credit: Courtesy of NSLS, Brookhaven National Laboratory.
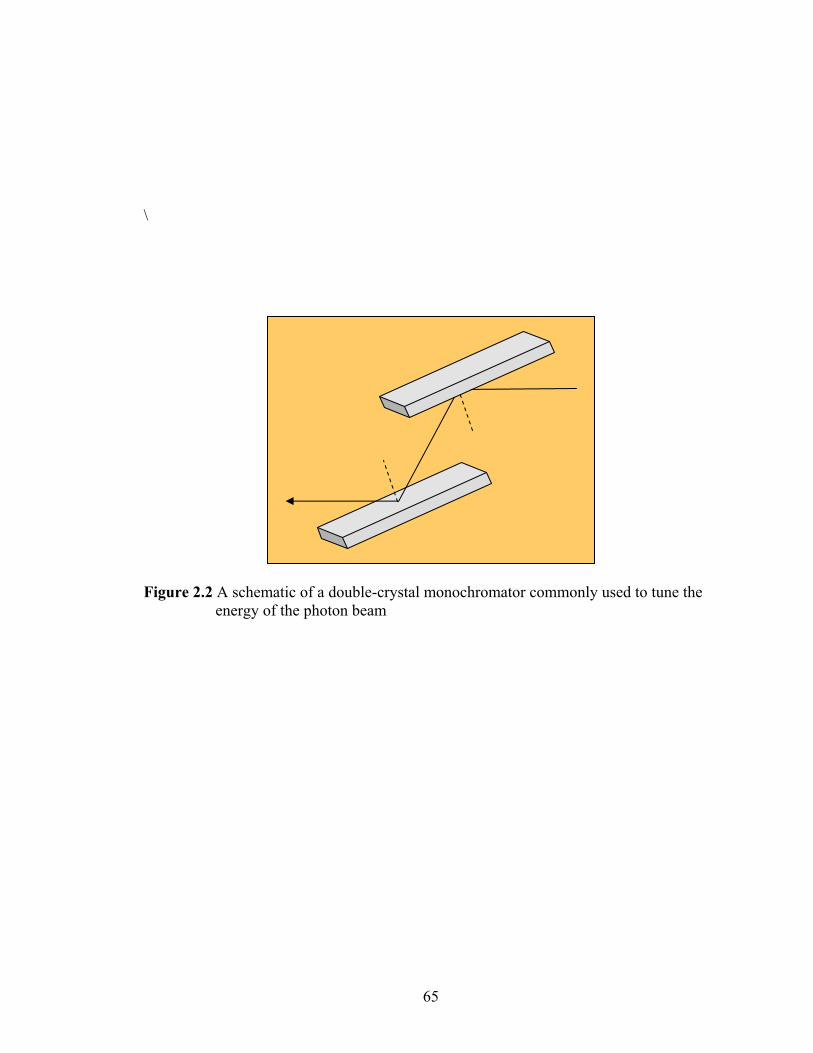
65
\
Figure 2.2 A schematic of a double-crystal monochromator commonly used to tune the energy of the photon beam
66
The energy selection is effected by varying the angle (θ) between the x-rays and the
crystal as only x-rays satisfying Bragg’s law at that angle continue on to constitute the x-
ray beam used in the experiment –
nλ = 2dhkl Sin θ (Eq. 2.1)
where dhkl is the lattice spacing of the crystal and the other terms have their usual
meanings. It is due to the monchromator that experimenters can ‘scan’ a sample over a
wide range of energies to obtain a full EXAFS spectrum. The angles of the
monochromator are also used to control the higher harmonics that are usually present in
the beam. These harmonics can adversely affect any absorption spectrum and have to be
eliminated or ‘rejected’ as far as possible before any photons impinge on the sample.
Depending on the nature of the sample being studied, x-ray absorption data are
collected in either transmission mode or fluorescence mode (Figure 2.3). In transmission
mode, all the three detectors viz. one for the incident beam (I0), one for the transmitted
beam (It) and finally, the detector for the collecting data on the reference foil. For
concentrated samples, data are collected in transmission mode while fluorescence data
are collected on low-concentration or dilute samples. Experiments are carried out in
transmission mode when an absorption height of ~1 can be obtained (ideally) on the
sample of interest. However, if the maximum absorption height obtained is ~ 0.2 or
lower, owing to a much lower signal-noise ratio, it is advisable to collect data in
fluorescence mode instead. In order to determine if you have enough material for an XAS
measurement, the theoretical absorption step height for the sample has to be calculated.
Tables containing photoabsorption data and effective cross-sections for the various
elements over a wide range of energies can be used to calculate a theoretical absorption
67
step height for any compound and are available in the following references.34-40
Alternatively, it is also quite convenient to use the HEPHAESTUS program to calculate
the absorption step heights for your samples.41 It is available as part of the IFEFFIT
suite,42 a set of programs developed specially for the XAS community. This suite and
other useful programs for analysis of XAS data is available free of charge at their
homepage: http://cars9.uchicago.edu/~ravel/software/Welcome.html.
In transmission mode, a three-detector setup is used to record the initial and
transmitted intensities, respectively. The detectors in this case are gas-ionization detectors
which produce a current whenever the gas in the detector is ionized by the photon beam.
This weak current is then amplified and correlated with the intensity of the x-ray beam
using an appropriate calibration procedure and finally converted to digital form through a
voltage-frequency converter. Typical gains used in the amplifiers are of the order of 108
V/A. The most commonly used gases in detectors include helium, nitrogen and argon.
Mixtures of helium and nitrogen are used for low energy x-rays whereas argon is used for
higher energy x-rays. Shown in Figure 2.4 is a typical in situ XAS experimental setup,
like the kind that was used for work described in this thesis. This setup is located at
beamline X-3B at the National Synchrotron Light Source (NSLS), Brookhaven National
Lab in Upton, N.Y. where all XAS data for our experiments are collected.

68
Figure2.3 Schematic of experimental setup at the beamline showing the two principal methods of collecting XAS data: transmission and fluorescence.
I0 It Iref
If
sample foil
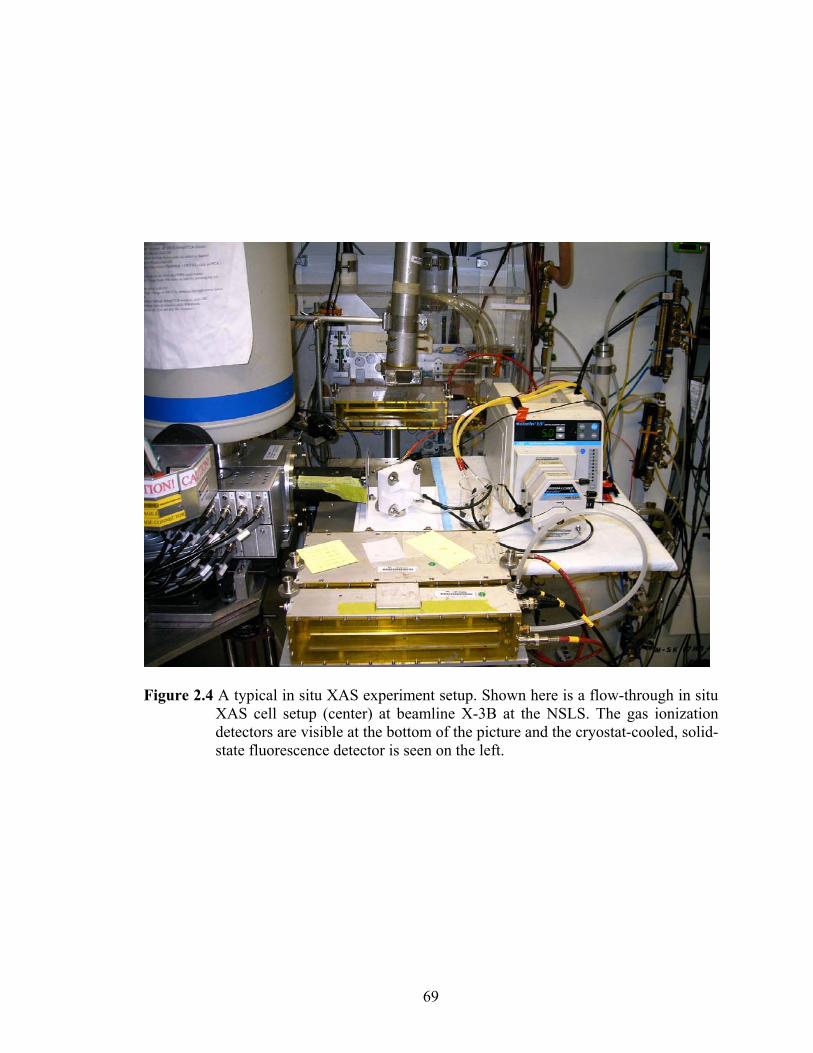
69
Figure 2.4 A typical in situ XAS experiment setup. Shown here is a flow-through in situ XAS cell setup (center) at beamline X-3B at the NSLS. The gas ionization detectors are visible at the bottom of the picture and the cryostat-cooled, solid-state fluorescence detector is seen on the left.
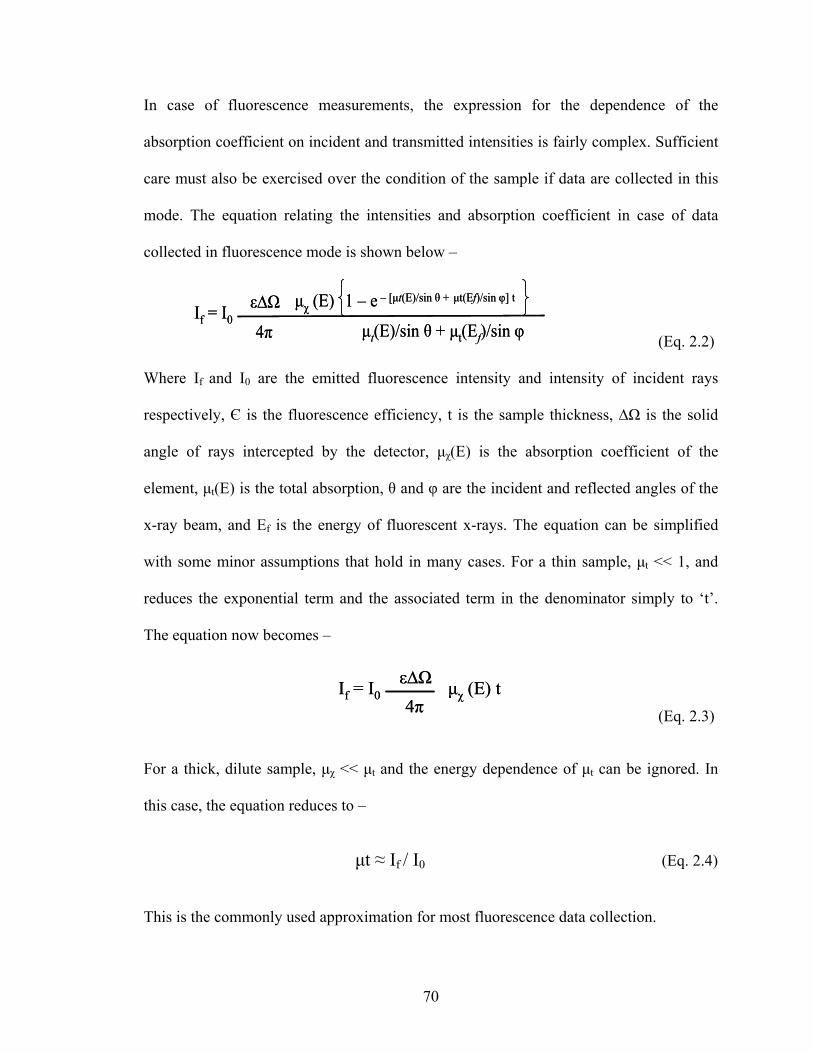
70
In case of fluorescence measurements, the expression for the dependence of the
absorption coefficient on incident and transmitted intensities is fairly complex. Sufficient
care must also be exercised over the condition of the sample if data are collected in this
mode. The equation relating the intensities and absorption coefficient in case of data
collected in fluorescence mode is shown below –
(Eq. 2.2)
Where If and I0 are the emitted fluorescence intensity and intensity of incident rays
respectively, Є is the fluorescence efficiency, t is the sample thickness, ∆Ω is the solid
angle of rays intercepted by the detector, μχ(E) is the absorption coefficient of the
element, μt(E) is the total absorption, θ and φ are the incident and reflected angles of the
x-ray beam, and Ef is the energy of fluorescent x-rays. The equation can be simplified
with some minor assumptions that hold in many cases. For a thin sample, μt << 1, and
reduces the exponential term and the associated term in the denominator simply to ‘t’.
The equation now becomes –
(Eq. 2.3)
For a thick, dilute sample, μχ << μt and the energy dependence of μt can be ignored. In
this case, the equation reduces to –
μt ≈ If / I0 (Eq. 2.4)
This is the commonly used approximation for most fluorescence data collection.
If = I0ε∆Ω4π
μχ (E) tIf = I0ε∆Ω4π
μχ (E) t
If = I0ε∆Ω
4π
μχ (E) 1 – e – [μt(E)/sin θ + μt(Ef)/sin φ] t
μt(E)/sin θ + μt(Ef)/sin φIf = I0
ε∆Ω
4π
μχ (E) 1 – e – [μt(E)/sin θ + μt(Ef)/sin φ] t
μt(E)/sin θ + μt(Ef)/sin φ

71
Solid-state semiconductor detectors made of Si-Li and Ge are widely used for
collecting fluorescence data. Shown on the far left of figure 2.4 is a 13-element, state-of-
the-art germanium detector that is cooled by a liquid-nitrogen cryostat to reduce thermal
noise in the detector. Other kinds of detectors used in many fluorescence measurements
include the passivated implanted planar silicon detector (PIPS ™) 43 and the Lytle
detectors.44
2.2.1 In situ spectroelectrochemical cell for XAS experiments: aspects of design
and development
Over the course of the work described in this thesis, many different in situ
spectroelectrochemical cells were designed, fabricated and tested. At least three or four
different versions were actually used and tested at the synchrotron. In the latest version of
our spectroelectrochemical cell, one can purge the electrolyte with any gas (O2, N2 or Ar)
and introduce poisons of interest (chloride, sulfide etc.) at specific concentrations while
under accurate electrode potential control. Some of the various design constraints and
experimental difficulties that had to be overcome in order to successfully collect data for
our experiments are described here.
a. A multi-purpose cell: XAS data can be collected either in transmission mode
or fluorescence mode. Depending on the beamline at which the experiment is
conducted, the fluorescence detectors may be located either to the right or left of
the incoming photon beam. This consideration is of little consequence if a Lytle
detector is to be used as it is small enough to be placed on any side of the cell.
The issue however becomes important if one wishes to collect very high-quality
72
data from samples at very low concentrations or samples from which significant
attenuation can be expected – as is the case in many in situ XAS experiments.
Most of these experiements require the use of sophisticated helium-cooled, multi-
element solid-state detectors that are available at some facilities. Due to the
experimental and spatial constraints of these larger detectors, the location of the
detector may not be conveniently changeable at many of these beamlines. The
earliest versions of the in situ cells used for our studies were only designed to
collect data in transmission mode. These cells contained an open electrolyte
reservoir on the top of the cell and could only accommodate the photon beam if
placed in a specific orientation. Thus, these cells could not be used in an
ambidextrous fashion and necessitated the use of two different handed cells that
had to be fabricated for use at the beamlines. The latest flow-through cell design
contains the ports of the electrolyte reservoir on the vertical face of the cell (as
opposed to the top of the cell) resulting in a sealed and ambidextrous unit which
can be employed at different beamlines with no modifications. Finally, although
the cell is designed for ‘flow-through’ operation, this feature is optional and can
still be used in the majority of in situ XAS experiments where flow of electrolyte
is not required.
b. Leakage of electrolyte: The interior electrolyte reservoir around the electrodes
is designed to contain only 3-5 ml of electrolyte, which is supplied by a peristaltic
pump. Tiny leaks through the joints of the cell as well as through any open
channels, such as those meant for electrical contact with the electrodes, were
sometimes observed. Furthermore, a leak near the current collection area
73
sometimes occurred, and such leaks could be potentially damaging to the
experiment if it shorted the half-cell under study. The latter was overcome by the
strategic placement of the electrode current collectors and more careful design of
the cell. The use of high-quality gaskets also prevented most leaks. Our most
recent cell also has a specially designed secondary containment to contain any
leakage as many electrolytes are potentially corrosive (strong acids or bases) and
cannot be allowed to leak onto the x-ray setup inside the hutch. The secondary
containment also contains built in pegs on which the cell rests while in use. This
allows the cells to be changed conveniently without having to reposition the
experimental table or realign the new cell. This is particularly helpful as the
alignment of a cell to maximize the flux of the photon beam may take up to a few
hours, thereby allowing more efficient use of the allocated beamtime.
c. Gas bubbles in the x-ray window: This is still a concern during our
experimental runs but has been overcome to a large extent. Gas bubbles such as
dihydrogen or dioxygen at very low and certain higher potentials, respectively,
often arise from redox reactions. This phenomenon has been particularly
troublesome for some of our fundamental studies on electrode materials used in
the chlor-alkali industry, where oxygen or chlorine evolution has severely
impeded the collection of high-quality XAS data.
Another key issue that arises occasionally with use of the flow-through
spectroelectrochemical cell is the occasional air bubble in the electrolyte which
makes it way to line of sight of the x-ray window. This issue is particularly severe
when the height of the cell is positioned differently from the height of the
74
peristaltic pump and the external electrolyte reservoir. In order to avoid this
problem, it is imperative that both the in situ XAS cell and the pump/reservoir be
maintained at the same level, which can be conveniently done using common
table jacks. It is believed that the source of the air bubbles in the latest cell design
arises from a vacant electrolyte port in the main bore of the cell. The cell contains
four bores but only employs three (electrolyte inlet, outlet and reference electrode
salt bridge) during any experiment. A slight drop in electrolyte pressure in this
vacant port may be enough to allow an air bubble or two to enter the electrolyte,
with eventual movement into the line of sight of the x-ray window. Forthcoming
cell designs will have to take this into account so as to avoid this problem
altogether.
d. Incomplete polarization of the electrode: Incomplete or non-uniform
electrode polarization can occur due to poor current distribution over the
electrode. This often arises from geometric incongruence between the working
electrode and counter electrode or reference electrode. This leads to an altered
surface chemistry in certain ‘dead zones’ on the electrode, and can make the
experimental XAS data un-representative of the general electrochemical processes
occurring at the desired potential. In general the flow-through
spectroelectrochemical cell employs a carbon-based counter electrode placed
directly across from the working electrode. This configuration minimizes the
asymmetry in the current distribution as the two electrodes are then separated
uniformly by only ca. 4 mm.
75
e. Poisoning of the reference electrode: As with all electrochemical
measurements, care must be taken to employ a stable reference electrode.
Changes to the reference electrode over the course of an experiment will result in
an inaccurate recorded potential of the working electrode. Further, the reference
electrode used for these studies must not release any ions into the system being
studied. This is often the case with the Ag/AgCl reference electrode resulting in
poisoning of the catalyst surface with unwanted ions such as Cl- etc. It is for this
reason that the standard hydrogen electrode (SHE) was used in all of our in situ
XAS studies.
f. X-ray window tape: Currently, a PTFE tape (3M) is employed along with a
silicone adhesive to create a tightly-sealed, transparent x-ray window for the in
situ cells. This tape exhibits excellent stability in high beam energies, for instance
at the Pt L3 edge at 11564 eV; however, at lower beam energies the tape is found
to degrade more rapidly. For example, at the Fe K edge (7112 eV) the tape is only
stable for up to 8 hours under irradiation. Leakage due to tape damage in the x-ray
window has occurred during some of our longer experimental runs at lower edge
energies.
76
2.3 Principles of x-ray absorption spectroscopy
X-ray absorption spectroscopy is a core-level spectroscopy that involves the
excitation of an electron from an inner orbital to a valence orbital, and at higher energies
directly into the continuum, creating a core-hole which is promptly occupied by an
electron from one of the valence levels to stabilize the momentarily ionized atom. This
relaxation may result in one of the following secondary processes: emission of x-ray
fluorescence radiation, emission of an Auger electron or secondary electron or so called
photo-production.45 The source of excitation in XAS is a photon beam of sufficiently
high energy directed at the material under study. In transmission mode, the intensity of a
beam of photons (I0) decreases proportional to its incident intensity on passing through a
medium of thickness (x). The transmitted intensity (I) is obtained through the well-known
Beer-Lambert law and is derived as follows –
dI α I.dx (Eq. 2.5)
Introducing a constant of proportionality, the inequality becomes
dI = I.μ(E).dx (Eq. 2.6)
Here, the constant of proportionality, the absorption coefficient μ, is an energy-dependent
term 46: μ(E) ~ ρZ4/AE3 (Eq. 2.7)
On integrating and rearranging terms in Equation 2.6, one obtains the Beer-Lambert law:
I = I0.e-μ(E).x (Eq. 2.8)
Thus, the absorption coefficient has a 1/E3 dependence which results in the slowly
decreasing absorption intensity as a function of the x-ray energy (Figure 2.5). However,
at certain energies, i.e. when the energy of the incident photons is exactly equal to the
binding energy of a core-level, a sharp increase in the absorption occurs due to an atomic
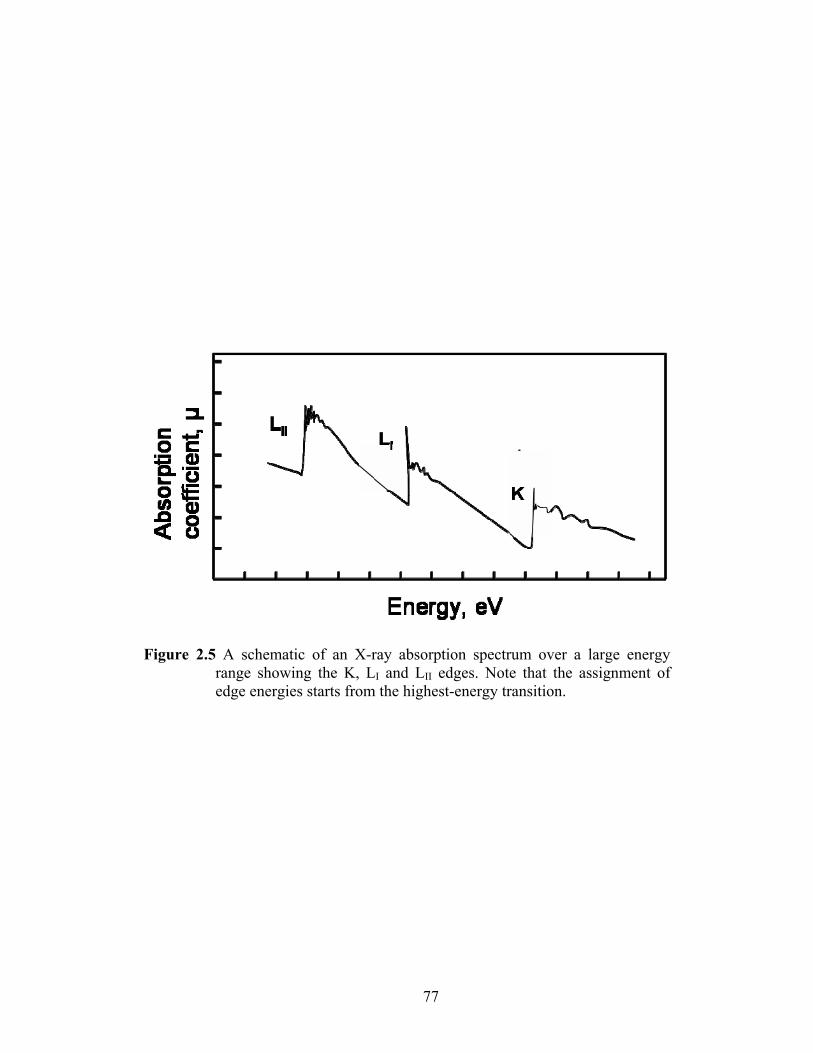
77
Figure 2.5 A schematic of an X-ray absorption spectrum over a large energy range showing the K, LI and LII edges. Note that the assignment of edge energies starts from the highest-energy transition.
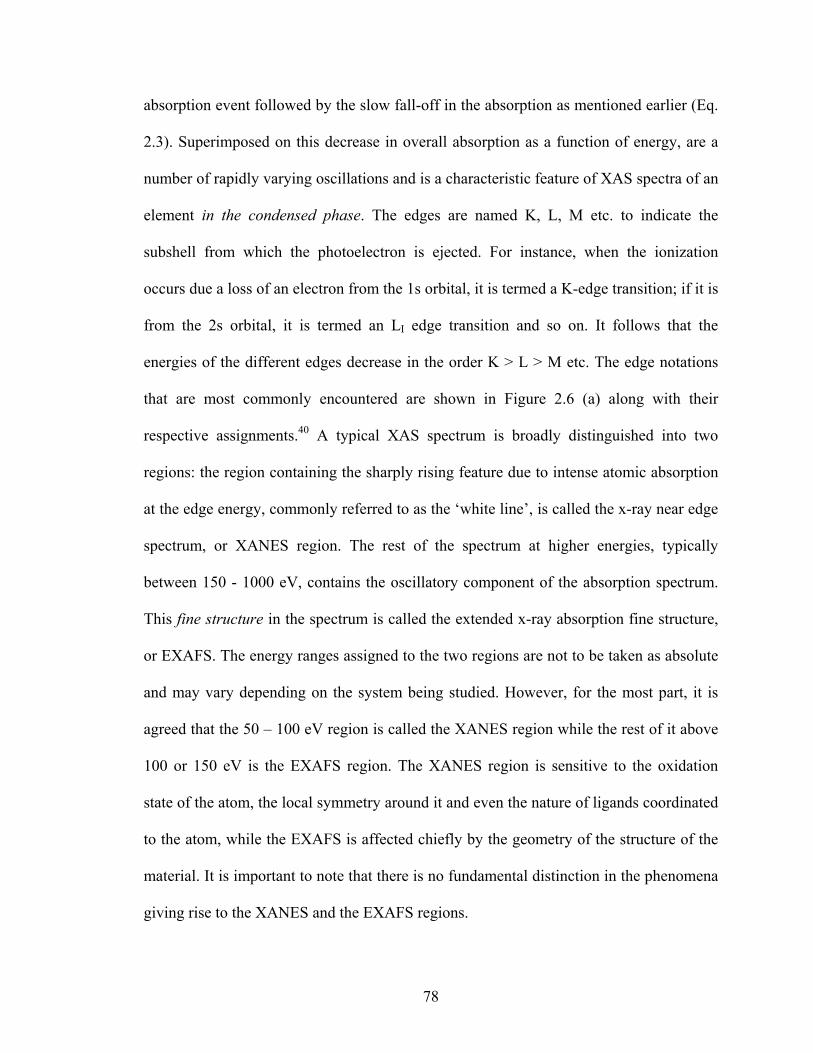
78
absorption event followed by the slow fall-off in the absorption as mentioned earlier (Eq.
2.3). Superimposed on this decrease in overall absorption as a function of energy, are a
number of rapidly varying oscillations and is a characteristic feature of XAS spectra of an
element in the condensed phase. The edges are named K, L, M etc. to indicate the
subshell from which the photoelectron is ejected. For instance, when the ionization
occurs due a loss of an electron from the 1s orbital, it is termed a K-edge transition; if it is
from the 2s orbital, it is termed an LI edge transition and so on. It follows that the
energies of the different edges decrease in the order K > L > M etc. The edge notations
that are most commonly encountered are shown in Figure 2.6 (a) along with their
respective assignments.40 A typical XAS spectrum is broadly distinguished into two
regions: the region containing the sharply rising feature due to intense atomic absorption
at the edge energy, commonly referred to as the ‘white line’, is called the x-ray near edge
spectrum, or XANES region. The rest of the spectrum at higher energies, typically
between 150 - 1000 eV, contains the oscillatory component of the absorption spectrum.
This fine structure in the spectrum is called the extended x-ray absorption fine structure,
or EXAFS. The energy ranges assigned to the two regions are not to be taken as absolute
and may vary depending on the system being studied. However, for the most part, it is
agreed that the 50 – 100 eV region is called the XANES region while the rest of it above
100 or 150 eV is the EXAFS region. The XANES region is sensitive to the oxidation
state of the atom, the local symmetry around it and even the nature of ligands coordinated
to the atom, while the EXAFS is affected chiefly by the geometry of the structure of the
material. It is important to note that there is no fundamental distinction in the phenomena
giving rise to the XANES and the EXAFS regions.
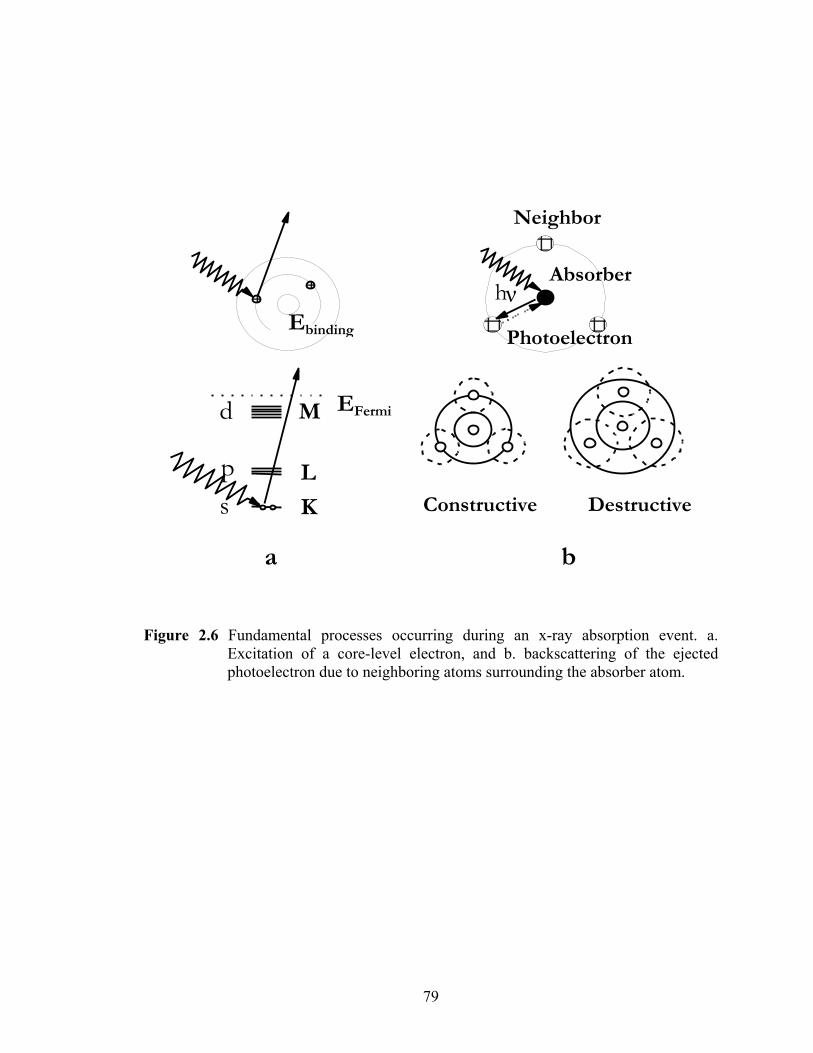
79
Figure 2.6 Fundamental processes occurring during an x-ray absorption event. a. Excitation of a core-level electron, and b. backscattering of the ejected photoelectron due to neighboring atoms surrounding the absorber atom.
Ebinding
d
s p
M
L
K
EFermi
a
Photoelectron
hνAbsorber
Neighbor
b
Constructive Destructive
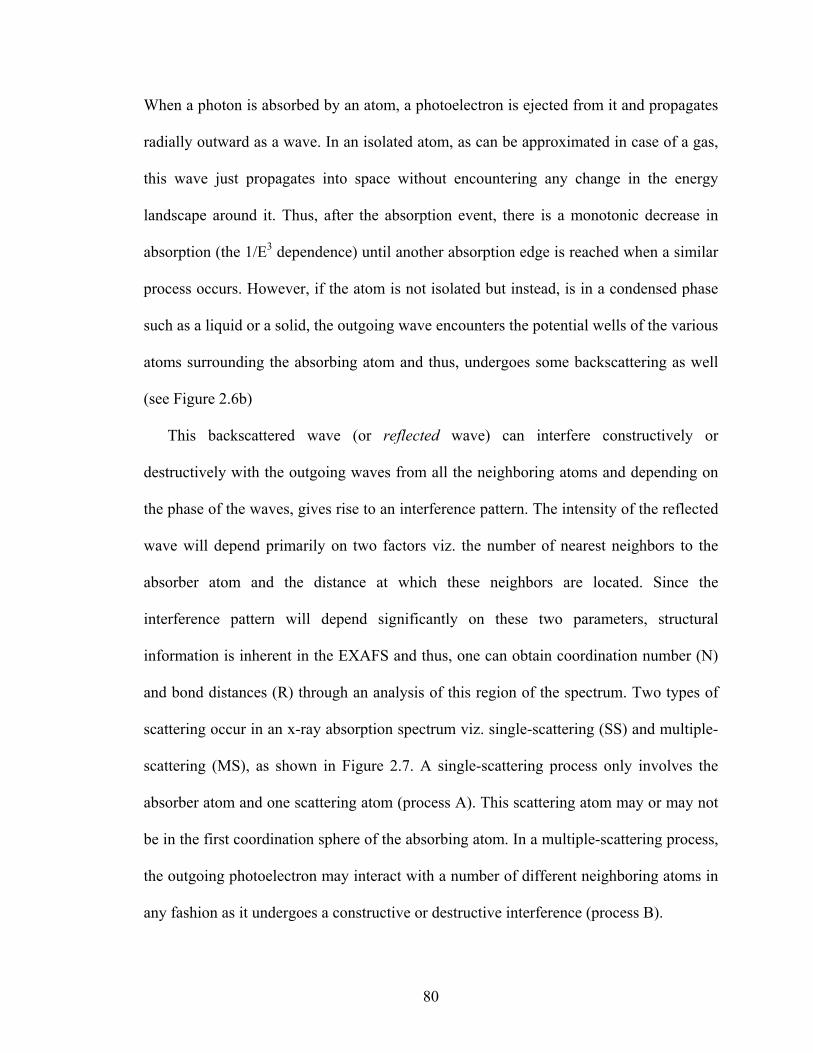
80
When a photon is absorbed by an atom, a photoelectron is ejected from it and propagates
radially outward as a wave. In an isolated atom, as can be approximated in case of a gas,
this wave just propagates into space without encountering any change in the energy
landscape around it. Thus, after the absorption event, there is a monotonic decrease in
absorption (the 1/E3 dependence) until another absorption edge is reached when a similar
process occurs. However, if the atom is not isolated but instead, is in a condensed phase
such as a liquid or a solid, the outgoing wave encounters the potential wells of the various
atoms surrounding the absorbing atom and thus, undergoes some backscattering as well
(see Figure 2.6b)
This backscattered wave (or reflected wave) can interfere constructively or
destructively with the outgoing waves from all the neighboring atoms and depending on
the phase of the waves, gives rise to an interference pattern. The intensity of the reflected
wave will depend primarily on two factors viz. the number of nearest neighbors to the
absorber atom and the distance at which these neighbors are located. Since the
interference pattern will depend significantly on these two parameters, structural
information is inherent in the EXAFS and thus, one can obtain coordination number (N)
and bond distances (R) through an analysis of this region of the spectrum. Two types of
scattering occur in an x-ray absorption spectrum viz. single-scattering (SS) and multiple-
scattering (MS), as shown in Figure 2.7. A single-scattering process only involves the
absorber atom and one scattering atom (process A). This scattering atom may or may not
be in the first coordination sphere of the absorbing atom. In a multiple-scattering process,
the outgoing photoelectron may interact with a number of different neighboring atoms in
any fashion as it undergoes a constructive or destructive interference (process B).
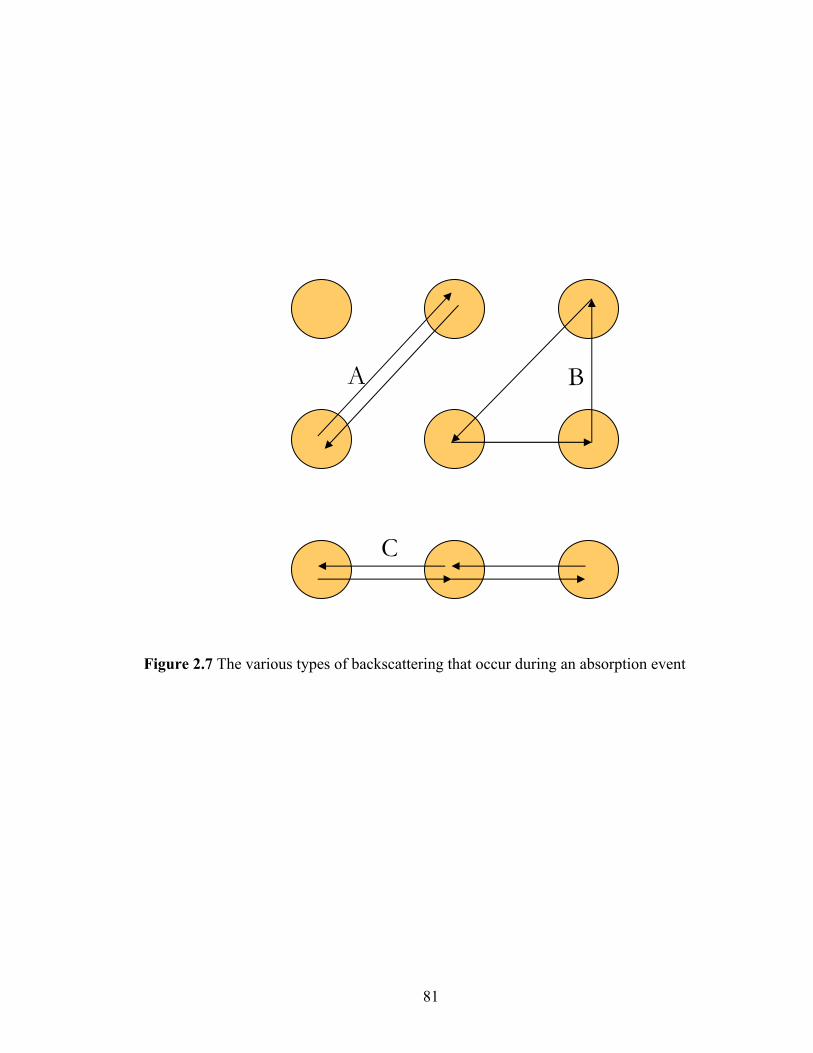
81
Figure 2.7 The various types of backscattering that occur during an absorption event
A
C
B
82
backscattering from atoms that are collinear to the absorber can be particularly strong due
to a ‘focussing effect’, an example of which is seen in process C.
It was mentioned in passing earlier that there is no fundamental difference between
the XANES and the EXAFS region. While this is believed to be true,13 MS processes are
much more frequent and take precedence over SS events in the low-energy scattering
range (XANES) while at higher energies above the edge energy, SS events dominate
(EXAFS) and MS events are less-likely (see Figure 2.7). It is for this reason that the
XANES region is extremely sensitive to the symmetry around the absorbing atom and
can be quite complex to describe in simple mathematical expressions. Thus analytical
expressions describing the EXAFS region were derived long back whereas no such
expression is available for the XANES region. However, recent advances in ab initio
quantum mechanical calculations such as the codes developed by members of the FEFF
project (http://leonardo.phys.washington.edu/feff/welcome.html) enables one to
accurately calculate a theoretical XANES spectrum for a given model cluster (see section
on FEFF 8.0).
2.3.1 Historical note on the development of the theory of the x-ray absorption
spectrum
Although x-rays were first discovered by Wilhelm Roentgen in 1895,47 the first
observations of the phenomenon of x-ray absorption were made in 1913 by Maurice de
Broglie, older brother to the more famous Louis de Broglie, when he noticed intense
absorption bands in the photographic plate of an x-ray diffraction spectrum of his
crystals. These first edges, as such absorption features came to be called, were the K
edges of Ag and Br. Observations of the associated oscillations beyond the edge, known
83
as the fine structure, were first made by Fricke in 1920.48 After a series of investigations
on various absorption spectra by Fricke and Hertz, Walter Kossel put forth the first
theoretical interpretation of the XANES region.49 He correctly interpreted the absorption
edge to be due to electronic transitions to unfilled orbitals but his theory nevertheless
failed to explain the extended fine structure, which by then was clearly established as a
very real spectroscopic feature of x-ray absorption spectra. We owe the first serious
attempts to explain the fine structure to Kronig, 50, 51 who based them on a theory of long-
range order (LRO), and were soon found to be incorrect. However, in a subsequent paper,
he modified his interpretation which eventually contained some ideas that remain valid
within the modern theory of EXAFS. 52 Following several incremental, albeit important
developments over the course of the next 40 years by a number of researchers in Japan,
Russia and the United States, 53-63 a nearly complete foundation for the theory of x-ray
absorption developed. It is interesting to note that the long-standing debate as to whether
EXAFS was adequately described by a theory that was long-range versus one that was
short-range, was still unresolved even as late as 1970. 64, 65
It was in the early 1970’s that XAS was finally correctly interpreted and theoretically
explained satisfactorily, an advance that ensured its potential as a spectroscopic tool.
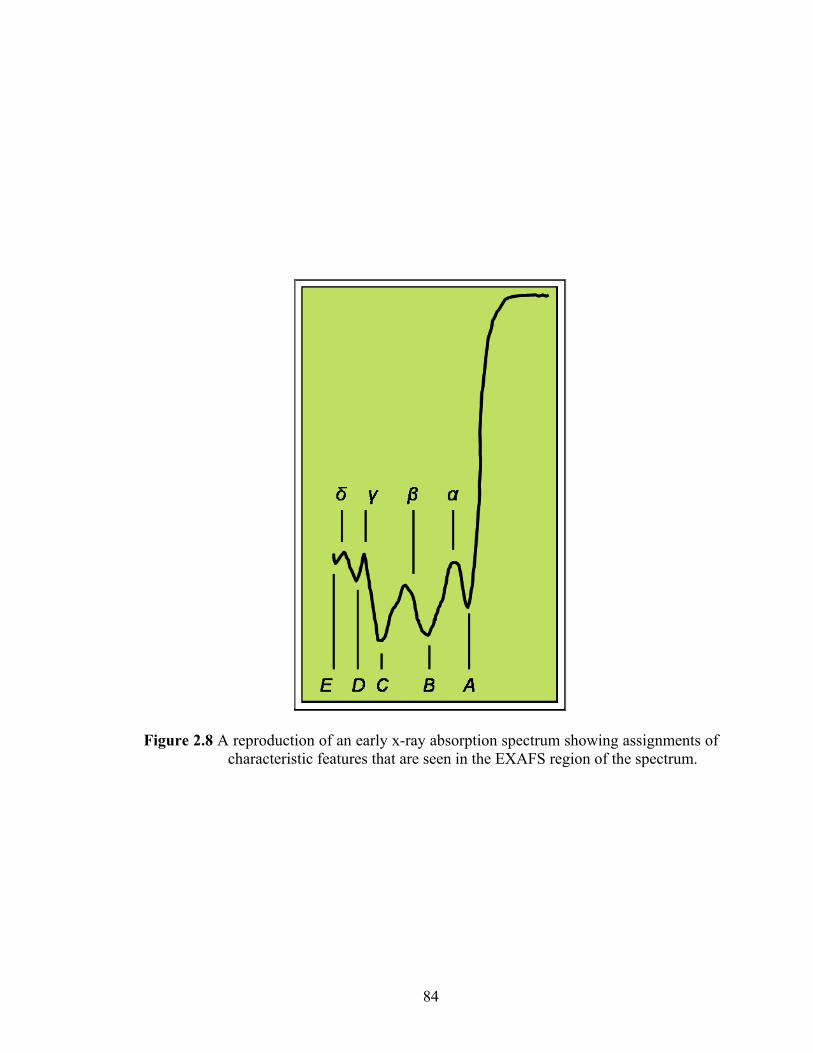
84
Figure 2.8 A reproduction of an early x-ray absorption spectrum showing assignments of characteristic features that are seen in the EXAFS region of the spectrum.
85
This advance can be attributed to the following –
1. A concise mathematical description of the fine structure was put forth by Sayers,
Stern and Lytle in 1971 66, 67 and the entire treatment of what today constitutes
‘modern EXAFS theory’, were published in three seminal papers.68-70 Taking
advantage of the fact that single-scattering events dominate at energies much
higher than the edge-energy (E0), they derived a single equation which could
adequately model the oscillatory component of the spectrum. They also realized
that a discrete Fourier-transform of the oscillations would give rise to a radial
structure function containing peaks which could be assigned to the various
‘shells’ of atoms surrounding the absorber atom. This was then used to prove that
the technique is chiefly sensitive to short-range order, settling the debate about
this topic. These advances greatly facilitated the interpretation of EXAFS data and
made the technique seem less esoteric and more accessible to researchers.
2. The increasing availability and advances in computing power to perform complex
and lengthy calculations which were virtually impossible to carry out by hand
3. The advent of synchrotron sources where one had access to x-rays of
exceptionally high intensities as well as an easily ‘tunable’ x-ray source. The high
photon flux straightaway enabled XAS to be used for identifying elements,
studying minerals, important non-crystalline materials like polymers and even
ions in solution, turning it into an invaluable spectroscopic technique.
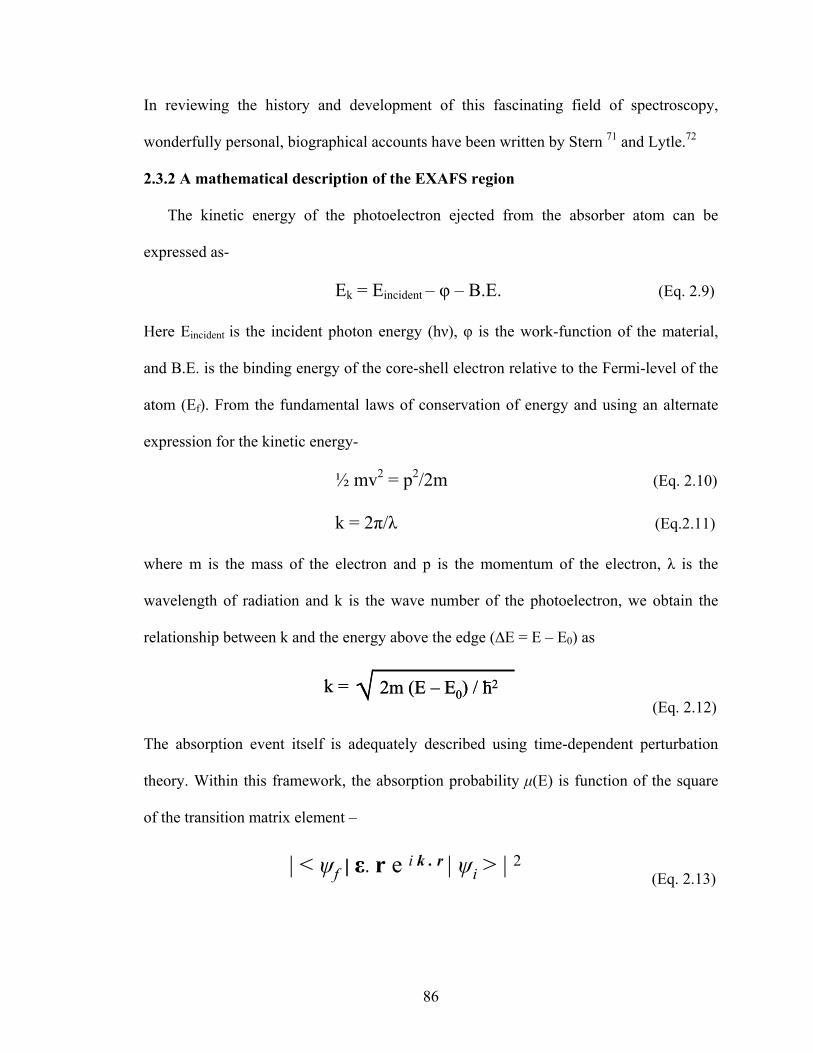
86
In reviewing the history and development of this fascinating field of spectroscopy,
wonderfully personal, biographical accounts have been written by Stern 71 and Lytle.72
2.3.2 A mathematical description of the EXAFS region
The kinetic energy of the photoelectron ejected from the absorber atom can be
expressed as-
Ek = Eincident – φ – B.E. (Eq. 2.9)
Here Eincident is the incident photon energy (hν), φ is the work-function of the material,
and B.E. is the binding energy of the core-shell electron relative to the Fermi-level of the
atom (Ef). From the fundamental laws of conservation of energy and using an alternate
expression for the kinetic energy-
½ mv2 = p2/2m (Eq. 2.10)
k = 2π/λ (Eq.2.11)
where m is the mass of the electron and p is the momentum of the electron, λ is the
wavelength of radiation and k is the wave number of the photoelectron, we obtain the
relationship between k and the energy above the edge (∆E = E – E0) as
(Eq. 2.12)
The absorption event itself is adequately described using time-dependent perturbation
theory. Within this framework, the absorption probability μ(E) is function of the square
of the transition matrix element –
(Eq. 2.13)
| < ψf | ε. r e i k . r | ψi > | 2
√ 2m (E – E0) / h2k = √ 2m (E – E0) / h2k =
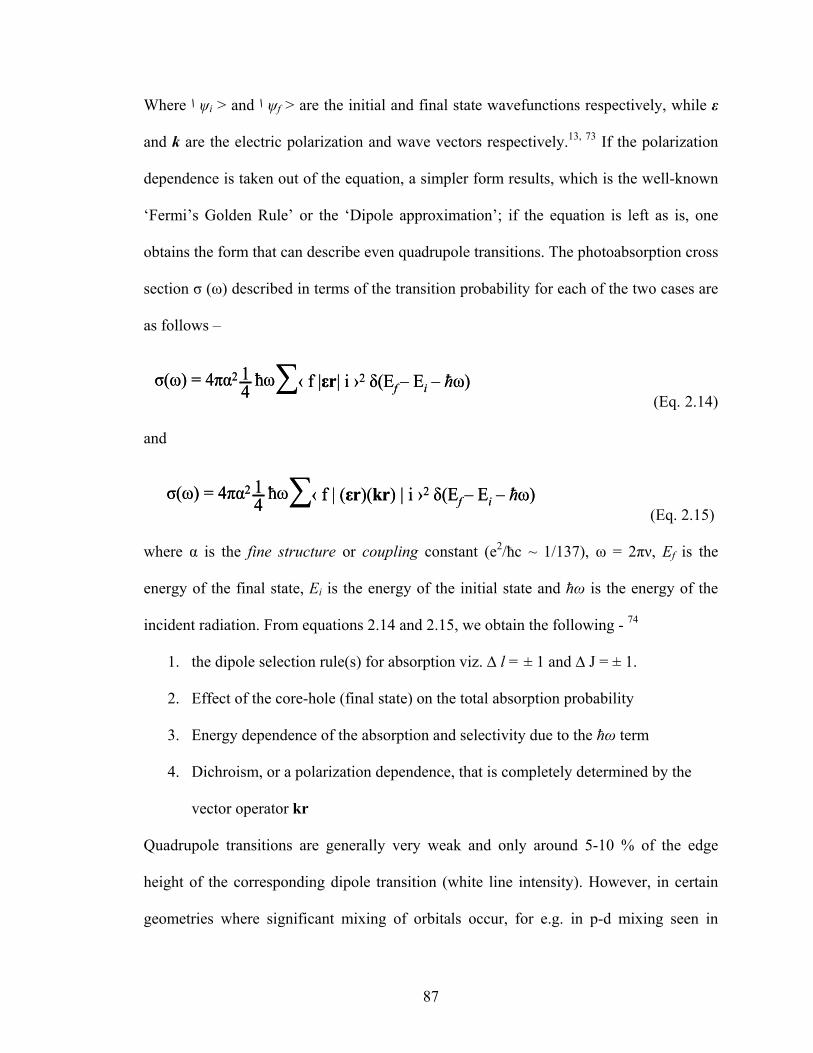
87
Where ا ψi > and ا ψf > are the initial and final state wavefunctions respectively, while ε
and k are the electric polarization and wave vectors respectively.13, 73 If the polarization
dependence is taken out of the equation, a simpler form results, which is the well-known
‘Fermi’s Golden Rule’ or the ‘Dipole approximation’; if the equation is left as is, one
obtains the form that can describe even quadrupole transitions. The photoabsorption cross
section σ (ω) described in terms of the transition probability for each of the two cases are
as follows –
σ(ω) = 4πα2 ħω1
4 ∑‹ f |εr| i ›2 δ(Ef – Ei – ħω)σ(ω) = 4πα2 ħω14 ∑‹ f |εr| i ›2 δ(Ef – Ei – ħω)
(Eq. 2.14)
and
(Eq. 2.15)
where α is the fine structure or coupling constant (e2/ħc ~ 1/137), ω = 2πν, Ef is the
energy of the final state, Ei is the energy of the initial state and ħω is the energy of the
incident radiation. From equations 2.14 and 2.15, we obtain the following - 74
1. the dipole selection rule(s) for absorption viz. ∆ l = ± 1 and ∆ J = ± 1.
2. Effect of the core-hole (final state) on the total absorption probability
3. Energy dependence of the absorption and selectivity due to the ħω term
4. Dichroism, or a polarization dependence, that is completely determined by the
vector operator kr
Quadrupole transitions are generally very weak and only around 5-10 % of the edge
height of the corresponding dipole transition (white line intensity). However, in certain
geometries where significant mixing of orbitals occur, for e.g. in p-d mixing seen in
σ(ω) = 4πα2 ħω14 ∑‹ f | (εr)(kr) | i ›2 δ(Ef – Ei – ħω)σ(ω) = 4πα2 ħω14 ∑‹ f | (εr)(kr) | i ›2 δ(Ef – Ei – ħω)
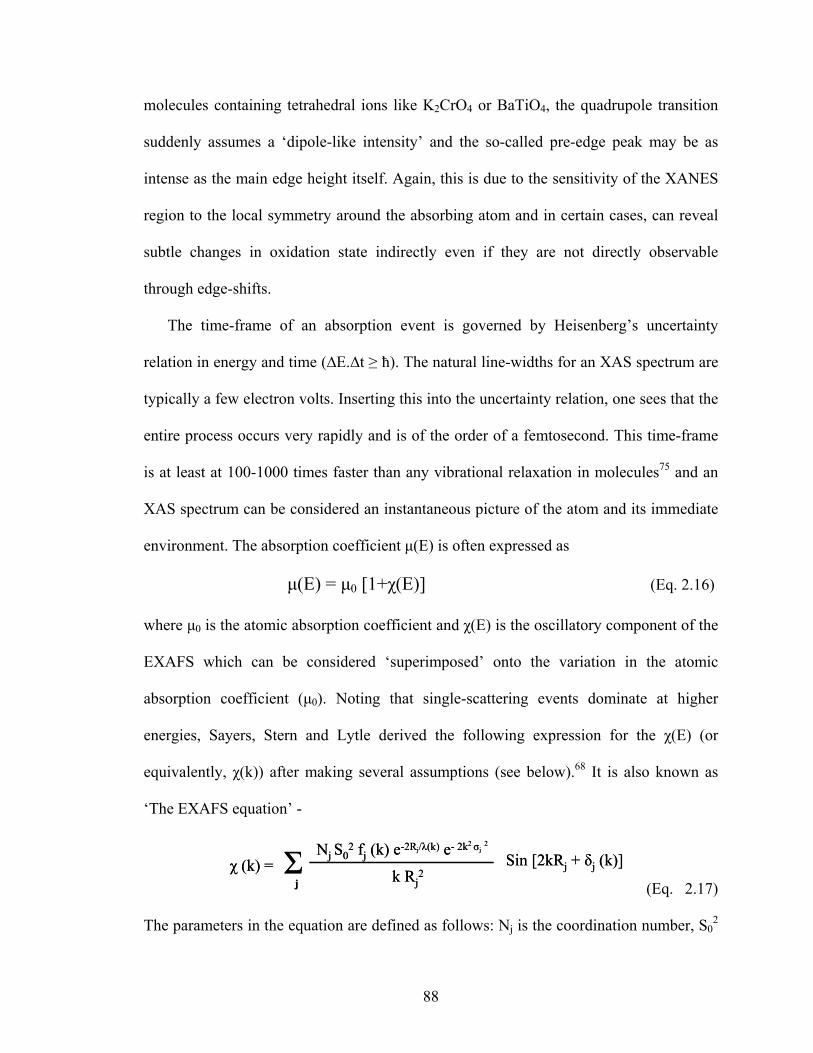
88
molecules containing tetrahedral ions like K2CrO4 or BaTiO4, the quadrupole transition
suddenly assumes a ‘dipole-like intensity’ and the so-called pre-edge peak may be as
intense as the main edge height itself. Again, this is due to the sensitivity of the XANES
region to the local symmetry around the absorbing atom and in certain cases, can reveal
subtle changes in oxidation state indirectly even if they are not directly observable
through edge-shifts.
The time-frame of an absorption event is governed by Heisenberg’s uncertainty
relation in energy and time (∆E.∆t ≥ ħ). The natural line-widths for an XAS spectrum are
typically a few electron volts. Inserting this into the uncertainty relation, one sees that the
entire process occurs very rapidly and is of the order of a femtosecond. This time-frame
is at least at 100-1000 times faster than any vibrational relaxation in molecules75 and an
XAS spectrum can be considered an instantaneous picture of the atom and its immediate
environment. The absorption coefficient μ(E) is often expressed as
μ(E) = μ0 [1+χ(E)] (Eq. 2.16)
where μ0 is the atomic absorption coefficient and χ(E) is the oscillatory component of the
EXAFS which can be considered ‘superimposed’ onto the variation in the atomic
absorption coefficient (μ0). Noting that single-scattering events dominate at higher
energies, Sayers, Stern and Lytle derived the following expression for the χ(E) (or
equivalently, χ(k)) after making several assumptions (see below).68 It is also known as
‘The EXAFS equation’ -
(Eq. 2.17)
The parameters in the equation are defined as follows: Nj is the coordination number, S02
χ (k) = Σj
Nj S02 fj (k) e-2Rj/λ(k) e- 2k σj
2 2
k Rj2
Sin [2kRj + δj (k)]χ (k) = Σj
Nj S02 fj (k) e-2Rj/λ(k) e- 2k σj
2 2
k Rj2
Sin [2kRj + δj (k)]
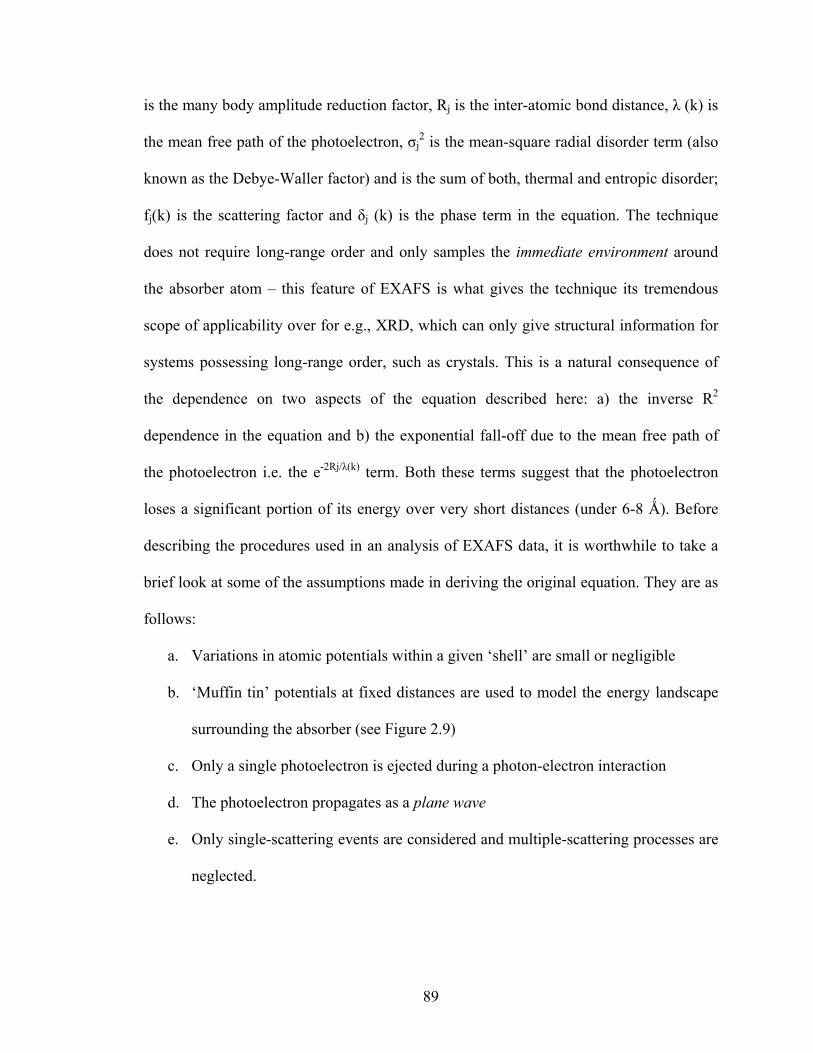
89
is the many body amplitude reduction factor, Rj is the inter-atomic bond distance, λ (k) is
the mean free path of the photoelectron, σj2 is the mean-square radial disorder term (also
known as the Debye-Waller factor) and is the sum of both, thermal and entropic disorder;
fj(k) is the scattering factor and δj (k) is the phase term in the equation. The technique
does not require long-range order and only samples the immediate environment around
the absorber atom – this feature of EXAFS is what gives the technique its tremendous
scope of applicability over for e.g., XRD, which can only give structural information for
systems possessing long-range order, such as crystals. This is a natural consequence of
the dependence on two aspects of the equation described here: a) the inverse R2
dependence in the equation and b) the exponential fall-off due to the mean free path of
the photoelectron i.e. the e-2Rj/λ(k) term. Both these terms suggest that the photoelectron
loses a significant portion of its energy over very short distances (under 6-8 Ǻ). Before
describing the procedures used in an analysis of EXAFS data, it is worthwhile to take a
brief look at some of the assumptions made in deriving the original equation. They are as
follows:
a. Variations in atomic potentials within a given ‘shell’ are small or negligible
b. ‘Muffin tin’ potentials at fixed distances are used to model the energy landscape
surrounding the absorber (see Figure 2.9)
c. Only a single photoelectron is ejected during a photon-electron interaction
d. The photoelectron propagates as a plane wave
e. Only single-scattering events are considered and multiple-scattering processes are
neglected.
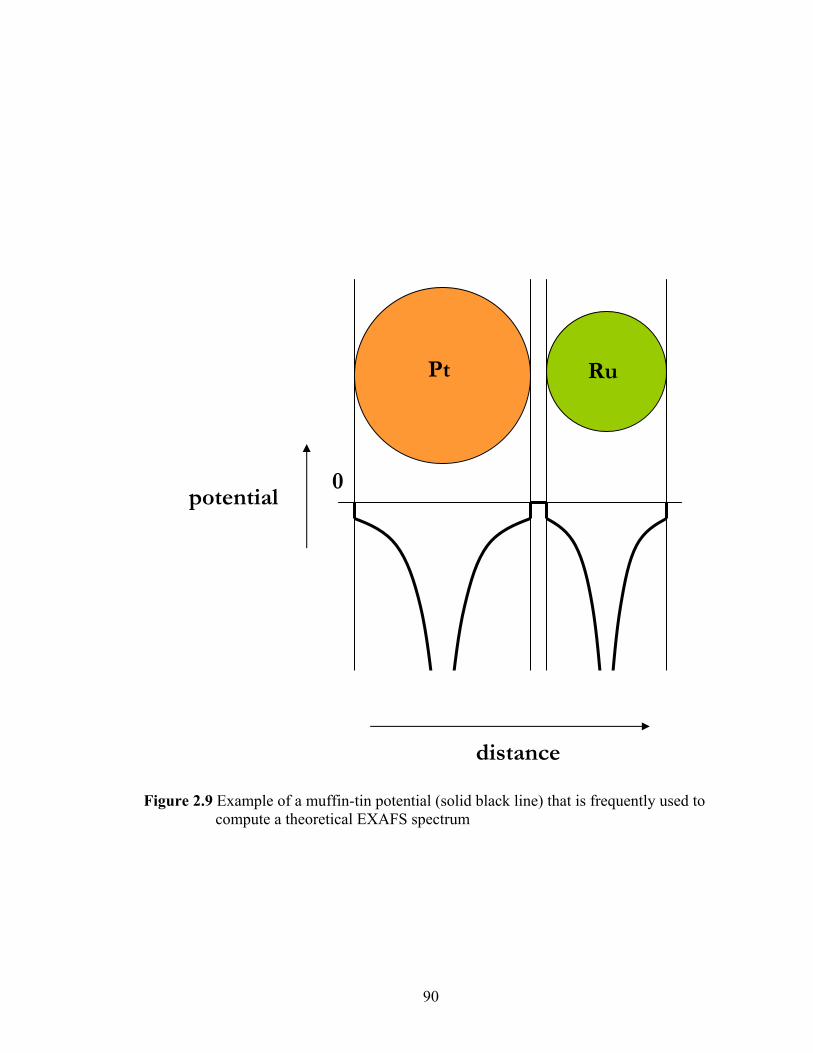
90
Figure 2.9 Example of a muffin-tin potential (solid black line) that is frequently used to compute a theoretical EXAFS spectrum
0
distance
Pt Ru
potential
91
Over the years, several inadequacies in the equation have been corrected, especially
through the contributions of John Rehr and co-workers at the University of Washington
at Seattle.76-80 They have made tremendous progress in making improvements to the
original equation, developing faster algorithms and computational methods to a point
where the EXAFS equation is routinely used to model experimental spectra of a whole
range of compounds to a high level of accuracy. One of the main corrections to the
equation includes replacing the plane-wave formalism by spherical waves to more
accurately reproduce scattering amplitudes and phase-shifts. In order to retain the basic
structure of the equation, an effective scattering factor, feff (k,r) was introduced into the
equation (hence the name ‘FEFF’ for the project). Secondly, numerous expressions were
derived by many people in the field for the full multiple scattering description of χ(k).
However, almost all of them were severely demanding and inefficient in the use of
computing power applied for the calculations. Rehr and Albers developed an algorithm
that is less computationally intensive but sufficiently accurate to generate a theoretical
full multiple scattering χ(k) function.81
2.4 EXAFS analysis
Given that the EXAFS region of the absorption spectrum contains structural
information, one still has to extract this information from the spectrum. The procedure
followed to obtain parameters such as coordination numbers (N) and bond lengths (R)
through EXAFS analysis is described in this section.
All the data were analyzed using the IFEFFIT © suite,41 a set of programs specifically
developed for the XAS community and is available free of charge. Most of the programs
92
have an excellent graphical user interface that makes the entire package very user-
friendly and accessible. The two most important programs in the software include –
1. ATHENA – this program is used for all kinds of data processing, especially all
the initial processing of XAS data including removing glitches (deglitching),
alignment and calibration of scans, background removal, normalization etc. and,
2. ARTEMIS – this program is used to fit the EXAFS data using a fitting routine.
The experimental χ(k) function (EXAFS) is extracted from ATHENA and
imported into ARTEMIS for analysis. Once a theoretical model has been defined
and the parameters to be used for the fits are set, the fits are carried out using non-
linear regression analysis. A complete statistical analysis is outputted in a ‘palette’
at the end of each fit.
Both programs allow the user to visualize the data in energy, k or R-space by
conveniently clicking on the required option. A number of options for appropriately
transforming the data using fourier-transforms; commonly used ‘windows’ such as the
‘Kaiser-Bessel’, ‘Hanning’, ‘Sine’ window etc. are available for use in order to minimize
the ‘ringing’ that occurs when the data to be transformed is terminated too quickly.
Let’s briefly revisit the standard EXAFS equation (Eq. 2.17) –
Here, S02 and δj (k) depend only on the atomic number (Z) of the scattering atom and can
be generated theoretically by the FEFF code (this is already included as a routine and is
carried out automatically within FEFF 6.0 which ARTEMIS uses to fit EXAFS data).
The equation has to be summed for all possible paths before a fit can be made to the data.
χ (k) = Σj
Nj S02 fj (k) e-2Rj/λ(k) e- 2k σj
2 2
k Rj2
Sin [2kRj + δj (k)]χ (k) = Σj
Nj S02 fj (k) e-2Rj/λ(k) e- 2k σj
2 2
k Rj2
Sin [2kRj + δj (k)]
93
The parameters that are input as variables for the fit include coordination number (N),
bond-distance (R), the disorder term (σ2) and a fourth term, ∆E which is related to the
inner potential (E0) of the atom. As mentioned earlier, the fits are then carried out by
ARTEMIS using non-linear regression analysis. Once this is done, both the experimental
data and fit are displayed on screen along with statistical information which is outputted
in a separate window. Details regarding each of the steps taken in order to obtain these
parameters from raw XAS data are as follows –
a. Pre-edge background removal – The background is removed by fitting a
quadratic (or linear) polynomial to data within 50 eV from the edge in the pre-
edge region and is extrapolated well beyond the edge. Often, this region contains
some background noise, glitches, spikes or even higher harmonics from previous
edges which have to be taken care of before removing the background. This
however, is more critical in a XANES analysis than it is for an EXAFS analysis.
b. Normalization – The data is normalized through an estimation of the edge height,
or step height μ(E0), and normalizing it to a value of 1 over a large energy range.
Here, E0 is the edge energy typically obtained by locating the inflection point on
the derivative spectrum i.e. ∂μ/∂E. The normalization is done such that all the
oscillations in the EXAFS region now oscillate about the horizontal line μ = 1.
c. Extraction of the χ(k) function – To extract the most important part of the
spectrum which contains all the structural information, viz. χ(k), one must first
determine and effectively subtract out the slowly varying atomic component (or
background) of the function, μ0(E) (recall that μ(E) = μ0(E)[1 + χ(E)]). This
94
procedure is also known as ‘post-edge background removal’. It is the slowly
varying (low-frequency) component of the post-edge region extending all the way
out to around 1000 eV from the edge. A note of caution here: this atomic
background can easily be removed by fitting a cubic spline through a regular
least-squares fitting procedure. Ineffective removal of this component will result
in unexpected peaks at very small values of R in the Fourier-transformed data; if
too much is removed, information about the structure from the EXAFS region
will be lost leading to erroneous conclusions from fitted data. Several
improvements in standard background-removal algorithms available in most
standard XAS processing software have led to making this step routine. However,
care must still be taken in specifying the extent and range for the background
removal.
d. Fourier-transforms and the χ(k) – Once the χ(k) function is obtained, the data
may be Fourier-transformed to visualize the data in ‘r’ space to produce a radial
structure function. This is carried out by the following operation –
(Eq. 2.18)
Notice how the data is transformed from ‘k’ space to ‘r’ space. Further, given that
low-Z elements scatter more effectively at low k values and high-Z elements, at
higher k values, a kn term in the equation allows one to preferentially ‘weight’ the
χ(k) function to emphasize the scattering over a desired k-range. The transformed
χ (R) = 1
√2π∫kmin
kmax
kn χ(k) e i2kR dkχ (R) = 1
√2π∫kmin
kmax
kn χ(k) e i2kR dk
95
data gives rise to anumber of peaks located at different distances from the absorber
atom. The peaks are the various frequency components that constitute the original
χ(k) function. The location of each of the peaks however, are slightly shifted to lower
values of r from the true values of the bond-distance (R) and is due to the phase term
that exists in the EXAFS equation.
e. Building and choosing a model structure – In order to attempt to carry out a fit
to any EXAFS data, a model structure described either by its crystallographic
parameters (for e.g. a .cif file) or by defining the coordinates of the various atoms
with respect to the absorbing atom is required. The IFEFFIT suite already has
within it, both, a database of commonly encountered structures of metals and their
compounds (folder ‘atomsdb’), as well as a program (ATOMS) that can generate
a set of coordinates if the crystallographic parameters are inputted into the
program.82 These coordinates are then input into the FEFF calculation routine
within ARTEMIS, which on execution, generates a list of paths and associated
amplitudes. One then chooses the required paths (in order of importance and
relevance with respect to the compound being investigated) to carry out a fit to the
data.
f. Fitting the data – The values of the four parameters commonly fit to EXAFS
data are obtained through a non-linear least-square regression analysis procedure
incorporated in the ARTEMIS program; other parameters required for a fit such
as scattering factors f(k), the many-body amplitude reduction factors S02 and the
phase term δ(k) are theoretically generated by FEFF. Alternatively, they may also
be obtained by fitting standards or reference compounds of the same element
96
which have a well-characterized structure and of known oxidation state. These
parameters can then be used in fitting the data.
Thus from the above procedure, values for N, R and σ2 are obtained. While the
uncertainties in the values of the parameters are largely dictated by the quality of data
and quality of fit, it is not uncommon to obtain bond distances to an accuracy of 0.02 Ǻ
and coordination numbers to within 10-15% of the correct or known values. Indeed,
given that XAS is a very sensitive probe over short distances, R values derived from
such an analysis may be more accurate than values determined from XRD.83-87 The
Debye-Waller factor (σ2) is a measure of change in the absorber-scatterer distance and is
actually a sum of two forms of disorder: static or entropic disorder (σst2), and dynamic or
thermal disorder (σth2).88 Thus, compared to values for ordered, homogeneous materials
at normal conditions of temperature and pressure, the σ2 values are higher for disordered
materials such as alloys, ions in solution etc. as well as for data at higher temperatures.
Most of our work involves analyzing in situ XAS data for electrocatalytic systems
and as such, we are generally interested in following changes in values of N as a function
of the applied electrode potential, V. Given that in EXAFS fitting, the obtained values of
N are significantly correlated with σ2, one cannot meaningfully compare values of N
obtained that are associated with different values of σ2 and sufficient care must be
exercised in such analysis. In order to make such N vs. V graphs more meaningful, most
of our data sets are fit twice over. The first time, all four parameters are allowed to vary
independently, as is usual practice in EXAFS fitting. From this set of fits, the average
value < σ2 > is determined. In a second round of fits to the data, this term is kept fixed at
the average value for data at all potentials and the fits are carried out allowing only the
97
remaining three parameters to vary. It is this set of parameters that are used to make an N
vs. V graph. No doubt the fits may not be as good as those obtained when all four
parameters are allowed to vary. Nevertheless, the variation in N as a function of V is
much more real and acceptable after such a modified fitting procedure.
In case of a bimetallic alloy (PtM), data at both edges (for e.g. Pt LIII and Ru K edges)
were fit simultaneously setting RPt-M = RM-Pt and NPt-M = NM-Pt (for a uniform mixture).
Details about such procedures are discussed in the relevant chapters.
2.5 XANES analysis
The remarkable sensitivity of the XANES region to the oxidation state, local
geometry and even presence of ligands around the absorber atom is well-known. This is
largely due to the fact that at low-energies, multiple-scattering dominates over single-
scattering paths and makes the overall shape of the XANES region particularly sensitive
to the immediate scattering environment of the absorber atom. For instance, the white-
line intensity for the Pt L3 edge (2p3/2 5d) is directly proportional to the unfilled-
density of states in the d-band (or d-band vacancy), and changes in the white-line can be
used to infer changes in the bonding of Pt to its neighbors as ligands coordinated to it
will either donate or withdraw charge from the Pt d-band. It is for this very reason that
traditionally, XANES analysis is labeled as a ‘fingerprinting technique’ as most
compounds have rather unique XANES spectra. Yet, when one is looking at small
perturbations in a catalytic system, tiny changes can easily be overlooked especially
since such changes are only 3-5% of the total intensity and are masked by the huge
atomic absorption contribution of any XAS spectrum.
98
In analyzing XAS data on catalytic processes, it is then quite convenient to turn the
method into a difference technique wherein only changes in the XANES region are
isolated, magnified, observed and finally, modeled with theory in order to successfully
interpret the changes. This idea forms the basis of the ∆μ-XANES method developed by
Ramaker and Koningsberger 30, 31, 89and is described in greater detail below.
2.5.1 The ∆μ-XANES method
The ∆μ-XANES method is ideally suited to study changes in a system where one has
a significant control over the environment around the absorber atom, such as in
electrocatalysis or even gas-phase catalysis. In electrocatalysis, for instance, different
species/adsorbates are in equilibrium with the electrode surface depending on the applied
potential (e.g., H, OH, O) while in gas-phase catalysis, one can introduce gases such as
H2, O2, CO etc. at will, at a desired temperature and pressure. The scattering due to the
adsorbate is isolated by taking out the bulk-scattering component from the spectrum by
subtracting out an XAS spectrum of a clean surface. As was mentioned previously,
several investigations in both areas of catalysis have been successfully carried out using
this method. The adsorption of anionic and cationic poisons (e.g. Cl- and Run+) on Pt/C
nanoparticle catalysts widely used in fuel cells, have been studied for the first time using
this technique and are reported in this thesis. The nature of poisoning, possible adsorption
site and their detrimental effects on the activity of the electrocatalysts are discussed in
Chapters 3 and 5 respectively.
2.5.2 Data analysis
The raw XAS data are first imported into ATHENA and a careful normalization in
the 25-150 eV range is carried out. All the reference foil spectra are aligned to one
99
particular spectrum, e.g., the reference foil spectra at 0.54 V whose edge energy has been
calibrated to the known standard value (Pt L3 edge at 11564 eV). ATHENA then
automatically applies all shifts on the foil spectra to the corresponding sample spectra.
This alignment is done to correct for experimental errors. At the synchrotron, the photon
beam drifts slightly in energy and thus, the energy calibration of the beam may not be
valid over a long time period. To illustrate the point, let us assume that data were being
collected at the Ru K edge for a ruthenium catalyst over a period of 8 hours. However,
after five or six scans, the 20,012.0 eV of the K edge may appear to shift to 20,012.3 eV.
This minute difference in the calibration is likely to affect the final shape of the
difference spectra that are calculated. Thus, this alignment and calibration procedure
ensures that any energy drift in the collected spectra are accounted for and all changes in
the sample data accurately reflect only changes in the sample due to the applied electrode
potential. Next, a XANES spectrum at a potential where the surface is relatively free
from any adsorbates (such as in the double-layer region) is chosen as a ‘reference’
spectrum. This ‘reference’ spectrum is not to be confused with the ‘reference foil’
spectrum mentioned earlier. A set of experimental difference spectra are then generated
by subtracting out this ‘clean’ reference spectrum. It is more clearly expressed in an
equation –
∆μexp = μ(ads/M)v – μ(clean M)Vref (Eq. 2.19)
where ‘ads’ refers to an adsorbate, V is a potential of interest, M is the catalyst being
studied (the XAS data would be collected at an edge that is characteristic of element M)
and Vref is the reference potential at which the catalyst surface is free from any
100
adsorbates. Such a calculation would ideally cancel out all of the bulk absorption and
reflect only changes due to the effect of adsorbate on the catalyst.
The experimental difference spectra by themselves do not reveal much information.
In order to understand and correctly interpret these experimental ∆μ-XANES curves,
corresponding theoretical difference spectra of adsorbates in various positions on the
catalyst have to be calculated using the FEFF 8.0 code. Unlike earlier versions of FEFF,
version 8.0 was the first code to carry out real space, full multiple scattering calculations
using muffin-tin potentials, perform a Hedin-Lundqvist exchange correlation
approximation and determine the Fermi-level and charge-transfer effects using self-
consistent field theory. A core-hole may be included on the absorber atom to simulate the
final-state of the absorber atom during the x-ray absorption event, but this is not always
desirable or necessary. When the valence band is highly occupied, these electrons may
screen that core hole (eliminating its effects), so then better agreement with experiment is
obtained without the core hole, as is the case for Pt.1 (see footnote)
A bare Pt6 cluster is used to calculate a ‘reference’ spectrum which results in a
XANES spectrum for a ‘clean’ cluster. Following this, adsorbates of interest (H, OH, CO
etc.) are placed on the cluster in various adsorption geometries. The most common
adsorption geometries adopted tend to be adsorbates in atop, bridge-bonded and three-
fold sites, as shown in Figure 2.10. A second calculation is then made for this cluster
containing adsorbate which results in another XANES spectrum for the cluster at
potential V. A theoretical difference spectrum (∆μtheoretical) is calculated as -
1 All the data analyzed in this dissertation were collected only on two edges: the Pt L3 edge and the Ru K edge and as such, most of the discussion will pertain to these two metals but can be generalized to data collected on any element, at any edge.
101
∆μtheoretical = μ(ads/Pt6) – μ(Pt6) (Eq. 2.20)
The two sets of ∆μ curves as described in Equations 2.19 and 2.20 are then compared
to correctly interpret the experimental data along with supporting evidence from the
electrochemistry as well as other spectroscopic techniques.
Many adsorbates seem to have Δμ-XANES spectra that are characteristic of a
particular binding site. This site-dependence of the ∆μ-XANES spectra can be understood
by expanding the ∆μ in terms of its’ components. From Equation 2.16, we have μ(E) =
μ0(E)[1 + χ(E)] and deriving an expression for ∆μ(E) leads to the expression –
∆μ = ∆μ0 + ∆(μ0 χ Pt-Pt) + μ0, ad/Pt χ Pt-ad (Eq. 2.21)
where ∆μ0 is the ‘atomic’ XAFS due to adsorbate coverage, ∆(μ0 χ Pt-Pt) is the change
in Pt-Pt scattering induced due to adsorption of a species or adsorbate, μ0, ad/Pt is the free
atom absorption in the presence of an adsorbate, and finally, χ Pt-ad is the additional
scattering between the adsorbate and platinum. Theoretical calculations using FEFF 8.0
reveal that the second term, i.e. the change in Pt-Pt scattering dominates over the
contributions of the other terms to the right, and is responsible for the binding-site
sensitivity of the ∆μ curves.
To obtain an intuitive picture of this dependence, note what happens to the underlying
Pt-Pt scattering due to adsorption of a species in any site on the surface (Figure 2.11).
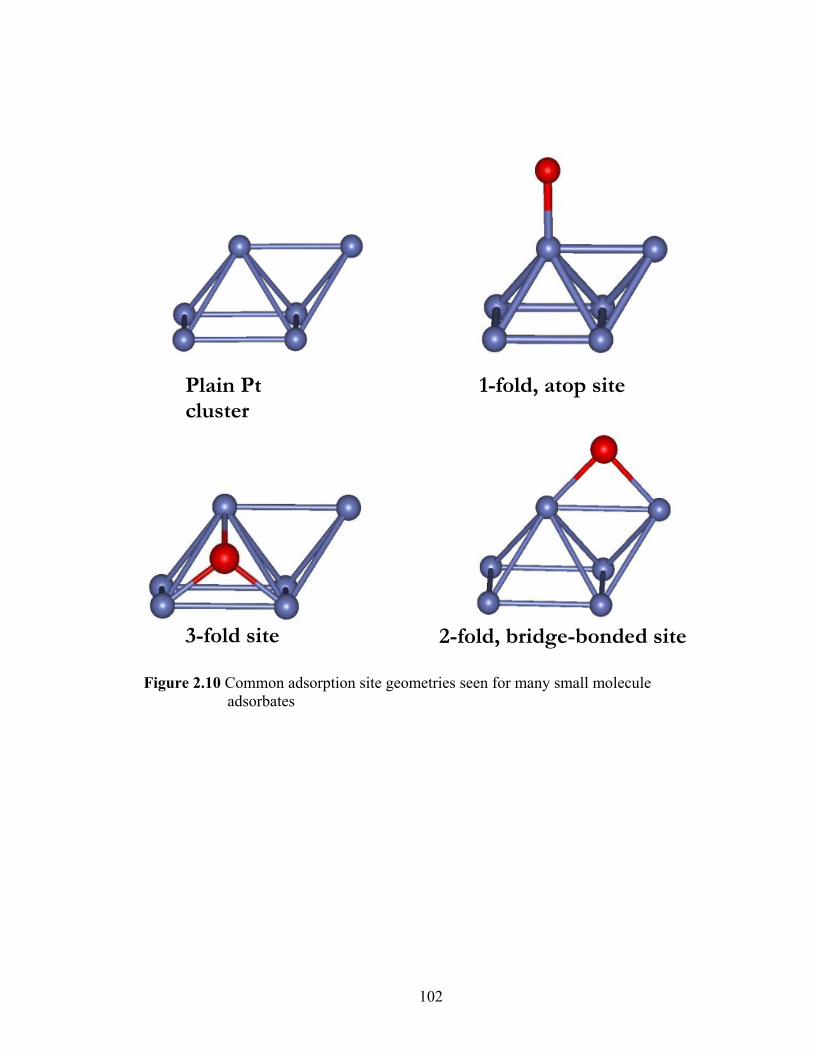
102
Figure 2.10 Common adsorption site geometries seen for many small molecule adsorbates
Plain Pt cluster
1-fold, atop site
2-fold, bridge-bonded site3-fold site
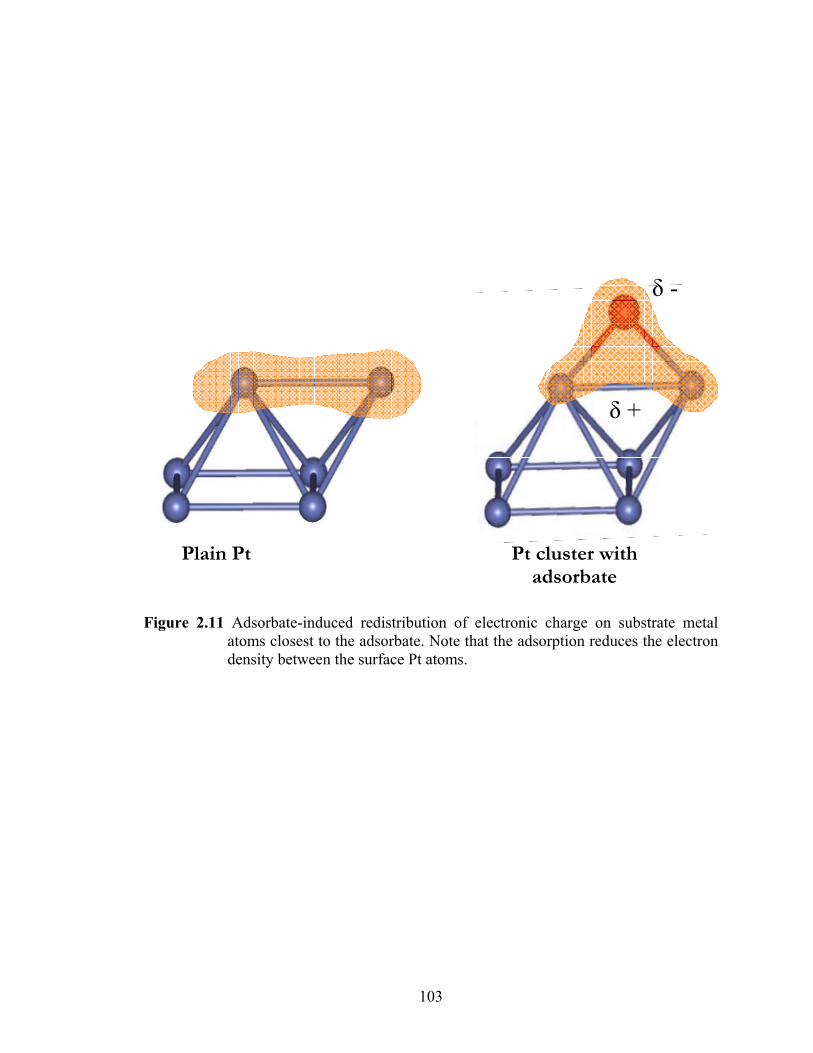
103
Figure 2.11 Adsorbate-induced redistribution of electronic charge on substrate metal atoms closest to the adsorbate. Note that the adsorption reduces the electron density between the surface Pt atoms.
Plain Pt Pt cluster with adsorbate
δ -
δ +
104
The adsorption process is bound to redistribute the electronic charge around the substrate
atom, thus effectively reducing the electronic density between the substrate metal atom
and its’ neighboring atoms. This in turn affects their photoabsorption cross sections,
which lead to changed backscattering properties. Further, due to increased electron-
sharing between the adsorbate and the substrate atom, bridge-bonded and 3-fold bonded
adsorption is generally slightly stronger than the bond in an atop site on a (111) surface.
We now see how the binding site affects the scattering between the substrate
metal atom and its’ neighbors and thus, arrive at the site-dependence of the ∆μ-XANES
spectra. Conversely, it then follows that the binding site of adsorbates (from energy of ∆μ
features) and the relative coverage of adsorbates (from the ∆μ magnitudes) on the surface
may be obtained from a careful analysis of the ∆μ-XANES spectra. If the data quality is
very good, even quantitative estimates may be made from the data as was done in the
case of Run+/Pt adsorption, wherein the coverage estimates were in good agreement with
other reports in the literature (chapter 5).
2.6 In situ vs. in operando XAS on electrodes and electrocatalysts – a literature
review
It must be clarified at the outset that the prefix ‘in situ’ is typically used to indicate any
study under the environment or conditions existing for the system being studied. The
term in operando is usually employed to indicate actual studies of reactions, the latter to
distinguish it from the term in situ. Thus in the in situ case, such as existing in an
electrochemical cell, a current might not be flowing because the system after some initial
105
time has reached steady-state. In a fuel cell, current can continuously flow as reactants
are continuously provided, so this is referred to as in operando. However, one must also
recognize that the Δμ-XANES technique does not see temporal reactants (i.e., those
coming on and leaving in a relatively short “turn over” time) on the surface, only more
long term adsorbates that might be referred to as poisons or excess reactants or products.
Thus the differences between in situ and in operando results are rather subtle, and
possibly may even be hard to predict or see. The in situ results are controlled more by the
thermodynamics, while the in operando results will be determined by the dynamic
kinetics of the reaction under study. Careful comparisons of in situ and in operando
results for O2 reduction at the anode in a fuel cell (in operando), vs. in the absence of
current in O2 saturated electrolyte (in situ) have shown significant differences in OH
coverage due to these differences.29
In the field of heterogeneous catalysis, there has been a number of in situ XAS
studies of gases adsorbed onto catalysts and effects of various reactions conditions such
as temperature, pressure, gas composition etc. In liquid medium, in situ studies have been
carried out by varying solvent, pH, concentration etc. to study homogeneous catalysts by
measuring absorption intensities, metal-ligand distances, coordination numbers and the
like. In case of a solid-liquid interface, extensive studies on the sorption of ions onto
minerals and other natural surfaces, again under various conditions of pH, temperature,
ion concentration, etc. have been undertaken. There have also been several studies using
in situ XAS to study all forms of electrochemical processes including the behavior of ion-
exchange materials and corrosion in common metals and alloys. For sake of relevance,
this brief review of the literature will be restricted to in situ XAS studies of batteries,
106
half-cells and fuel cells, and will always imply the existence of a solid-liquid interface
and occurring under realistic operating conditions. Given that most of the research
discussed here only pertains to in situ XAS studies, the use of the term ‘in situ XAS’ will
be avoided whenever possible to avoid redundancy in the language, hopefully enabling
an easier reading of the section. Finally, the literature survey in this section is intended to
be primarily illustrative and not exhaustive and is presented in loose chronological order.
The application of XAS to study electrode materials under realistic, operating
conditions occurred first in the early 1990s. This is due to the fact that much research was
being carried out on fuel cells and advanced batteries as alternate energy sources, and
more importantly, synchrotron sources were becoming increasingly accessible to
researchers. It is interesting to note that XAS has been applied to study species under
potential control since the mid-1980s, the earliest studies of which were carried out by
Heineman et al. to study a particular species that would otherwise be subject to reduction
by prolonged exposure to the photon beam; 90 they also used in situ XAS to study
transition metal ions in solution using a specially designed spectroelectrochemical cell.91
In an article titled “Is there any beam yet? Use of synchrotron radiation in the in situ
study of electrochemical interfaces”, Abruna and co-workers at Cornell foresaw that in
situ XAS could be expected to play an important role in understanding the solid-liquid
electrolyte interface, which was just beginning to be explored using various spectroscopic
techniques available at synchrotron facilities. Abruna, Samant and co-workers carried out
the first series of studies of adsorbed ions such as bromide and chloride on single crystals,
and adsorbed upd layers of Cu, Ag and Pb on gold, silver and platinum single crystals
using XAS, grazing-incidence XAFS (GI-XAFS) and x-ray standing wave (XRSW)
107
spectroscopy.92-99 Following this, various studies that used simple in situ
spectroelectrochemical cell designs were also reported.100-102 Enough momentum had
picked up in the field by 1990 for a review article entitled ‘EXAFS
spectroelectrochemistry’ to appear.103 It was around this time that several groups began to
use XAS to study electrode materials for use in batteries and fuel cells (ethanol oxidation
in alkaline media) chiefly containing nickel and cobalt.104-107 Yoshitake et al. carried out
one of the earliest in situ XAS studies on Pt/C nanoparticles and reported systematic
changes with the potential in the XANES region.108 Dan Scherson’s group carried out
studies on nickel-based electrodes in strong alkaline electrolytes to determine the effect
of charging and discharging on the d-band vacancy of materials,109 and carried out a
similar study in an operating alkaline battery.110 Their group also reported observing x-
ray induced photocurrents, but we do not have any evidence that it is significant enough
to disturb any in situ spectroelectrochemical experiments.111 The first sustained efforts
towards using in situ XAS routinely to study battery electrodes and fuel cell catalysts
under realistic conditions similar to actual operating environments were carried out most
notably by O’Grady, McBreen, Mukerjee, Pandya, Mansour Ramaker and others.112-124
Through these studies, it was established beyond doubt that minute changes in d-band
occupancy of the investigated metals, either due to alloying, effects of potential, or
adsorbed species, were reflected in the shapes and intensity of the white-lines observed in
the XANES regions of the XAS spectra. Further, the EXAFS region provided structural
information about electrode materials under operating conditions, information that cannot
be obtained by most other techniques. O’Grady and Ramaker soon found systematic
chemical effects in the ‘Atomic EXAFS’ region of the in situ absorption spectra of PtRu
108
alloys. These changes were attributed to small electrode potential-induced changes in the
potential-well of the absorbing atom itself, thereby causing a variation in the atomic
EXAFS.125 The presence of adsorbed CO on Pt/C electrocatalysts was indicated using the
‘difference file method’ on in situ data by Russell and co-workers. This study was one of
the first reports of the direct observation of small-molecule adsorbates in presence of a
liquid electrolyte using XAS.126
Ramaker and Mukerjee have since investigated several electrocatalysts used in fuel
cells using in situ XAS. The first application of the ∆μ-XANES method developed by
Ramaker and Koningsberger to study adsorbates in a half-cell i.e. in the presence of an
electrolyte (0.1 M HClO4) was in 2004. Around this time, another review paper titled ‘X-
ray Absorption Spectroscopy of Low Temperature Fuel Cell Catalysts’ was published,127
making apparent the utility of XAS as a technique to study electrocatalysts regardless of
it being used ex situ or in situ.
Using the ∆μ-XANES method on Pt/C electrocatalysts in 0.1 M HClO4, Teliska et al.
were able to identify adsorbed hydrogen and showed that at various potentials, the
hydrogen may occupy either atop (weakly-bonded, upd hydrogen) or n-fold adsorbed
sites (at very low potentials). The adsorption lineshapes found for hydrogen on Pt were
also found to be similar to those found in the gas phase.89 The similarity of the ∆μ-
XANES signatures in both, gas and liquid media greatly enhanced the credibility of the
technique as a truly surface sensitive technique. This was followed with a study on the O
and OH adsorption under similar conditions.31
In situ XAS experiments on PtRu anode catalysts in an operating fuel cell have also
been carried out by Smotkin, Segre and co-workers. Their studies on a reformate-air fuel
109
cell under various operating conditions revealed that the PtRu phase was metallic under
normal reducing conditions of an operating fuel cell.128 In another study on similar
catalysts in an operating DMFC, no evidence for phase segregation was found during
operation and an EXAFS analysis revealed a very short Ru-O bond length that was
significantly shorter than that typically seen in oxides of ruthenium, suggesting the
presence of an oxide phase of a different kind.129
The first operando studies in a specially-designed PEM fuel cell was reported by
Roth et al. in which the OH and CO coverage on the electrodes were monitored using the
∆μ-XANES method as the fuel cell was discharged.130
Hwang et al., in a study on Pt/C nanoparticle catalysts in 0.1 M HClO4, reported
changes in coordination number as a function of electrode potential, suggesting that the
nanoparticles suffered some form of aggregation during cycling. Our own studies have
repeatedly confirmed this finding; it has also been suggested that these changes may also
be due to shape changes that are induced due to strong chemisorption and desorption
processes occurring on nanoparticles at various electrode potentials.131-133 Such dynamic
changes in nanoparticle shapes, observed through in situ spectroscopic and microscopic
techniques, have been receiving a lot of attention lately as they are no doubt, expected to
have significant effects upon the surface morphology and electronic state,134-141 and
therefore have important consequences for catalysis. Further, repeated changes in shape
during a catalytic reaction may lead to increased rates of degradation, a very real concern
for any catalyst that is to be widely employed in low-temperature fuel cells.
The ∆μ-XANES method has been used to study several electrocatalytic systems
including novel electrocatalysts such as RhxSy chalcogenide materials,142-144 observing
110
CO coverage on Pt/C electrocatalysts,32, 145 probing the nature of electrochemical activity
of novel supports used in catalysts such as Au/SnOx,132 understanding water activation on
ligand-stabilized Pt nanoparticles,133 the poisoning of Pt/C electrocatalysts by halide
adsorption, specifically chlorides,146 (chapter 3) studying the aging of PtRu black alloy
catalysts under effects of potential cycling,131 (chapter 4) and much of the work that
constitutes the rest of the thesis. The work described in chapter 4 also builds on a study
by Holstein and Rosenfeld who studied changes occurring on Pt and Ru using in situ
XAS.147 We noticed that they had cycled the catalysts to 1.36 V (vs RHE) and at which
significant oxidative loss is expected to occur. Further, they found that Pt loses its activity
at higher potentials chiefly due to oxidation. They further found that not only do surface
Ru atoms supply OH species for the oxidation of methanol on Pt sites, they also aid in
preventing Pt from excessive oxidation and thus, enhance the overall activity of the alloy
catalyst for methanol oxidation. We were curious to see if any signs of degradation could
be found due to potential cycling even under milder conditions i.e. by cycling the
catalysts only up to around 0.84 V (vs. RHE). Interestingly enough, an EXAFS analysis
revealed statistically significant changes even after 20 and 40 cycles. Using the ∆μ-
XANES method, it was shown that the aging processes on the two different commercial
catalysts occur via slightly different processes.
Several studies on anode and cathode catalysts using in situ and in operando XAS as
applied to fuel cells have continued to appear, many of them having been very recently
published and will not be reviewed here.148-153 It is quite safe to assume that research in
this field of study will be crucial towards the development of fuel cells and indeed, in any
field that employs catalysts.
111
2.7 References
1. Korszun, Z. R., Moffat, K., Frank, K. & Cusanovich, M. A. Extended x-ray absorption fine structure (EXAFS) studies of cytochromes c: structural aspects of oxidation-reduction. Biochemistry 21, 2253-2258 (1982).
2. Scott, R. A. X-Ray Absorption Spectroscopic Investigations of Cytochrome c Oxidase Structure and Function. Annual Review of Biophysics and Biophysical Chemistry 18, 137-158 (1989).
3. George, G., Prince, R. & Cramer, S. The manganese site of the photosynthetic water-splitting enzyme. Science 243, 789-791 (1989).
4. Roelofs, T. A. et al. Oxidation states of the manganese cluster during the flash-induced S-state cycle of the photosynthetic oxygen-evolving complex. Proceedings of the National Academy of Sciences of the United States of America 93, 3335-3340 (1996).
5. Yano, J. et al. Where Water Is Oxidized to Dioxygen: Structure of the Photosynthetic Mn4Ca Cluster. Science 314, 821-825 (2006).
6. Pushkar, Y., Yano, J., Sauer, K., Boussac, A. & Yachandra, V. K. Structural changes in the Mn4Ca cluster and the mechanism of photosynthetic water splitting. Proceedings of the National Academy of Sciences 105, 1879-1884 (2008).
7. Cinco, R. M. et al. Comparison of the Manganese Cluster in Oxygen-Evolving Photosystem II with Distorted Cubane Manganese Compounds through X-ray Absorption Spectroscopy. Inorganic Chemistry 38, 5988-5998 (1999).
8. Yano, J. & Yachandra, V. K. Where Water Is Oxidized to Dioxygen: Structure of the Photosynthetic Mn4Ca Cluster from X-ray Spectroscopy. Inorganic Chemistry 47, 1711-1726 (2008).
9. Smith, J. D. et al. Energetics of Hydrogen Bond Network Rearrangements in Liquid Water. Science 306, 851-853 (2004).
10. Head-Gordon, T. & Johnson, M. E. Tetrahedral structure or chains for liquid water. 103, 7973-7977 (2006).
11. Wernet, P. et al. The Structure of the First Coordination Shell in Liquid Water. Science 304, 995-999 (2004).
12. Evans, J. Brilliant opportunities across the spectrum. Physical Chemistry Chemical Physics 8, 3045-3058 (2006).
13. Bunker, G. Tutorials on XAFS. http://gbxafs.iit.edu/training/tutorials.html.
112
14. van der Veen, R. M. et al. Structural determination of photochemically active diplatinum molecule by time-resolved EXAFS spectroscopy. Angewandte Chemie International Edition 48, 2711-2714 (2009).
15. Bressler, C. et al. Femtosecond XANES Study of the Light-Induced Spin Crossover Dynamics in an Iron(II) Complex. Science 323, 489-492 (2009).
16. Gawelda, W. et al. Structural analysis of ultrafast extended x-ray absorption fine structure with subpicometer spatial resolution: Application to spin crossover complexes. The Journal of Chemical Physics 130, 124520 (2009).
17. Pettifer, R. F., Mathon, O., Pascarelli, S., Cooke, M. D. & Gibbs, M. R. J. Measurement of femtometre-scale atomic displacements by X-ray absorption spectroscopy. Nature 435, 78-81 (2005).
18. Bressler, C. & Chergui, M. Molecular Structural Dynamics Probed by Ultrafast X-Ray Absorption Spectroscopy. Annual Review of Physical Chemistry 61 (2010).
19. Chergui, M. & Zewail, A. H. Electron and X-Ray Methods of Ultrafast Structural Dynamics: Advances and Applications. ChemPhysChem 10, 28-43 (2009).
20. Christian Bressler, R. A., Majed Chergui. Exploiting EXAFS and XANES for time-resolved molecular structures in liquids. Photocrystallography 223, 307-321 (2008).
21. Bressler, C. & Chergui, M. Ultrafast X-ray Absorption Spectroscopy. Chemical Reviews 104, 1781-1812 (2004).
22. Thorsten Ressler, J. W., Rolf E. Jentoft, Thomas Neisius, Marco M. Gunter. Kinetics of solid-state reactions in heterogeneous catalysis from time-resolved X-ray absorption spectroscopy. Topics in Catalysis 18, 45-52 (2002).
23. Mark A. Newton, A. J. D., John Evans. Bringing time resolution to EXAFS: recent developments and application to chemical systems. Chemical Society Reviews 31, 83-95 (2002).
24. Eswaramoorthy, S. K., Howe, J. M. & Muralidharan, G. In Situ Determination of the Nanoscale Chemistry and Behavior of Solid-Liquid Systems. Science 318, 1437-1440 (2007).
25. Hanson, K. J., Gibson, J. M. & McDonald, M. L. A Solid-State Thin Film Cell for In Situ Transmission Electron Microscopy of Electrodeposited Silver on Gold. Journal of The Electrochemical Society 136, 2214-2218 (1989).
26. M. Dollé, S. Grugeon, B. Beaudoin, L. Dupont, J-M. Tarascon. In situ TEM study of the interface carbon/electrolyte. Journal of Power Sources 97-98, 104-106 (2001).
113
27. Arai, S., Tsukimoto, S. & Saka, H. In Situ Transmission Electron Microscope Observation of Melting of Aluminum Particles. Microscopy and Microanalysis 4, 264-268 (1998).
28. J. M. Howe, S. K. E., G. Muralidharan. Determining the nanoscale chemistry and behavior of interfaces and phases in Al-Si(-Cu-Mg) nanoparticles using in-situ TEM. EMC 2008 14th European Microscopy Congress 1–5 September 2008, Aachen, Germany M3, 633-634 (2008).
29. Christina Roth, D. R. XAS Investigations of PEM Fuel Cells. Modern Aspects of Electrochemistry (Ed. C. Vayenas) (2008).
30. Ramaker, D. E. & Koningsberger, D. C. Comment on "Effect of Hydrogen Adsorption on the X-Ray Absorption Spectra of Small Pt Clusters". Physical Review Letters 89, 139701 (2002).
31. Teliska, M., O'Grady, W. E. & Ramaker, D. E. Determination of O and OH Adsorption Sites and Coverage in Situ on Pt Electrodes from Pt L23 X-ray Absorption Spectroscopy. The Journal of Physical Chemistry B 109, 8076-8084 (2005).
32. Scott, F. J., Roth, C. & Ramaker, D. E. Kinetics of CO Poisoning in Simulated Reformate and Effect of Ru Island Morphology on PtRu Fuel Cell Catalysts As Determined by Operando X-ray Absorption Near Edge Spectroscopy. The Journal of Physical Chemistry C 111, 11403-11413 (2007).
33. M. Teliska, W. E. O. G., D.E. Ramaker. Determination of H Adsorption Sites on Pt/C Electrodes in HClO4 from Pt L23 X-ray Absorption Spectroscopy. The Journal of Physical Chemistry B 108, 2333 (2004).
34. Scofield, J. H. Theoretical Photoionization Cross Sections from 1 to 1500 keV. Lawrence Livermore National Laboratory Report UCRL - 51326 (1973).
35. Hubbell, J. R. Photon Cross Sections, Attenuation Coefficients, and Energy Absorption Coefficients from 10 keV to 100 GeV. Report NSRDS-NBS 29 (National Bureau of Standards, Washington DC.) (1969).
36. W.H. McMaster, N. K. D. G., J.H. Mallet, J.H. Hubbell. Lawrence Livermore National Laboratory Report UCRL - 50174 Section II Revision I (1969).
37. B.L. Henke, E. M. G., J.C. Davis Atomic Data and Nuclear Data Tables. 54, 181 (1993).
38. W.T. Elam, B. R., J.R. Sieber. A New Atomic Database for X-ray Spectroscopic Calculations. Radiation Physics and Chemistry 63, 121 (2002).
39. A. Shaltout, H. E., R. Svagera. Update of photoelectric absorption coefficients in the tables of McMaster. X-ray Spectrometry 35, 52-56 (2005).

114
40. http://www4.nau.edu/microanalysis/microprobe/BulkAbsorp.html.
41. Newville, M. IFEFFIT : interactive XAFS analysis and FEFF fitting. Journal of Synchrotron Radiation 8, 322-324 (2001).
42. Ravel, B. & Newville, M. ATHENA, ARTEMIS, HEPHAESTUS: data analysis for X-ray absorption spectroscopy using IFEFFIT. Journal of Synchrotron Radiation 12, 537-541 (2005).
43. PIPS is a registered trademark of Canberra Industries, Inc.
44. F.W. Lytle, R. B. G., D.R. Sandstrom, D.C. Marques, J. Wong, C.L. Spiro, G.P. Huffman, F.E. Huggins. Nuclear Instruments and Methods in Physics Research, Section A 226, 542 (1984).
45. Teo, B. K. EXAFS Spectroscopy: Basic principles and data analysis. Springer-Verlag, New York (1986).
46. D.C. Koningsberger, R. P. X-ray Absorption, Principles, techniques of EXAFS, SEXAFS and XANES. John Wiley & Sons, New York, ISBN 0-471-87547-3 (1988).
47. Roentgen, W. C. On a new kind of rays. Sitzungsberichte der Physikalisch-medizinischen Gesellschaft zu Wurzburg (1895).
48. Fricke, H. The K-Characteristic Absorption Frequencies for the Chemical Elements Magnesium to Chromium. Physical Review 16, 202-215 (1920).
49. Kossel, W. Zum Bau der Röntgenspektren. Zeit. Phys. 1, 119-134 (1920).
50. Kronig, R. d. L. Zur Theorie der Feinstruktur in den Röntgenabsorptionsspektren. Zeit. Phys. 70, 317-323 (1931).
51. Kronig, R. d. L. Zur Theorie der Feinstruktur in den Röntgenabsorptionsspektren II Zeit. Phys. 75, 191-210 (1932).
52. Kronig, R. d. L. Zur Theorie der Feinstruktur in den Röntgenabsorptionsspektren. III Zeit. Phys. 75, 468-475 (1932).
53. Prins, J. Transitions to Optical Levels in the Argon L X-Ray Absorption Spectrum. Nature 133, 795-796 (1934).
54. Hanawalt, J. D. The Dependence of X-ray Absorption Spectra upon Chemical and Physical State. Physical Review 37, 715-726 (1931).
55. Hayasi, T. Sci. Rep. Tohoku Univ. Ser. 1, 123-132 (1949).
56. Kostarev, I. Zh. Eksperim. Teor. Fiz. 11, 60-73 (1941).
115
57. Kozlenkov, A. Bull. Acad. Sci. USSR, Phys. Ser. 25, 968-987 (1961).
58. M. Sawada, K. T., T. Shiraiwa, M. Obashi. On the Fine Structures of X-ray Absorption Spectra of Amorphous Substances The Amorphous State of the Binary System of Nickel-Sulfur. II. J. Phys. Soc. Jpn. 10, 464-468 (1955).
59. M. Sawada, K. T., T. Shiraiwa, M. Obashi. Annual Rep. Sci. Works Osaka University 7, 1-87 (1959).
60. L. Parratt, L. J. X-Ray Spectroscopy of the Solid State: Potassium Chloride. Physical Review 97, 916-926 (1955).
61. Parratt, L. Electronic Band Structure of Solids by X-Ray Spectroscopy. Rev. Mod. Phys. 31, 616-645 (1959).
62. Nordstrand, R. V. The Use of X-Ray K-Absorption Edges in the Study of Catalytically Active Solids. Advances in Catalysis 12, 149-187 (1960).
63. Nordstrand, R. V. Handbook of X-rays (Edited by E. Kaelble) McGraw-Hill 43, 1-18 (1967).
64. J. Perel, R. D. D. Extended Fine Structure in X-Ray Absorption Spectra of Certain Perovskites. Physical Review B 2, 1317-1323 (1970).
65. Stern, E. A. Dale Sayers Festschrift. Proceedings of the X-Ray Absorption Fine Structure 13th International Conference (XAFS-13), 9-14 July (2006).
66. D. Sayers, F. L., E. Stern. Bulletin of the American Physical Society 16, 302 (1971).
67. Sayers, D. A New Technique to Determine Amorphous Structure Using Extended X-ray Absorption Fine Structure. BSRL Doc. D180-14436-1, Submitted to the University of Washington in partial fulfillment of the degree of Doctor of Philosophy (1971).
68. D. Sayers, F. L., E. Stern. New Technique for Investigating Noncrystalline Structures: Fourier Analysis of the Extended X-Ray Absorption Fine Structure. Phys. Rev. Lett. 27, 1204-1207 (1971).
69. E. Stern, D. S., F. Lytle. Extended x-ray absorption fine structure technique II. Experimental practice and selected results. Phys. Rev. B 11, 4825-4835 (1975).
70. E. Stern, D. S., F. Lytle. Extended x-ray absorption fine structure technique. III. Determination of physical parameters Phys. Rev. B 11, 4836-4846 (1975).
71. Stern, E. Musings about the development of XAFS. Journal of Synchrotron Radiation 8, 49-54 (2001).
116
72. Lytle, F. The EXAFS family tree: a personal history of the development of extended X-ray absorption fine structure. Journal of Synchrotron Radiation 6, 123-134 (1999).
73. Dirac, P. A. M. The Principles of Quantum Mechanics. Oxford University Press (1982).
74. V.L. Aksenov, M. V. K. c., A.Yu. Kuz'min, Yu. Purans, S.I. Tyutyunnikov. Development of Methods of EXAFS Spectroscopy on Synchrotron Radiation Beams: Review. Crystallography Reports 51, 908-935 (2006).
75. Fonda, L. Multiple-scattering theory of X-ray absorption: a review. Journal of Physics: Condensed Matter, 8269 (1992).
76. Stern, E. A. & Rehr, J. J. Many-body aspects of the near-edge structure in x-ray absorption. Physical Review B 27, 3351 (1983).
77. Mustre, J., Yacoby, Y., Stern, E. A. & Rehr, J. J. Analysis of experimental extended x-ray-absorption fine-structure (EXAFS) data using calculated curved-wave, multiple-scattering EXAFS spectra. Physical Review B 42, 10843 (1990).
78. Rehr, J. J., Mustre de Leon, J., Zabinsky, S. I. & Albers, R. C. Theoretical x-ray absorption fine structure standards. Journal of the American Chemical Society 113, 5135-5140 (1991).
79. Zabinsky, S. I., Rehr, J. J., Ankudinov, A., Albers, R. C. & Eller, M. J. Multiple-scattering calculations of x-ray-absorption spectra. Physical Review B 52, 2995 (1995).
80. Mustre de Leon, J., Rehr, J. J., Zabinsky, S. I. & Albers, R. C. Ab initio curved-wave x-ray-absorption fine structure. Physical Review B 44, 4146 (1991).
81. Rehr, J. J. & Albers, R. C. Scattering-matrix formulation of curved-wave multiple-scattering theory: Application to x-ray-absorption fine structure. Physical Review B 41, 8139 (1990).
82. Ravel, B. ATOMS: crystallography for the X-ray absorption spectroscopist. Journal of Synchrotron Radiation 8, 314-316 (2001).
83. Hennig, C. et al. EXAFS as a tool for bond-length determination in the environment of heavy atoms. Journal of Synchrotron Radiation 8, 695-697 (2001).
84. Maeda, H. Accurate Bond Length Determination by EXAFS Method. Journal of the Physical Society of Japan 56, 2777.
85. Arcovito, A. et al. X-ray structure analysis of a metalloprotein with enhanced active-site resolution using in situ x-ray absorption near edge structure
117
spectroscopy. Proceedings of the National Academy of Sciences 104, 6211-6216 (2007).
86. Randaccio, L. & Geremia, S. Comparison of the Coordination Distances Derived by Extended X-ray Absorption Fine Structure and X-ray Crystallography in a Vitamin B12 Model. Organometallics 16, 4951-4953 (1997).
87. A. Levina, R. S. A., P.A. Lay. Three-dimensional structure determination using multiple-scattering analysis of XAFS: applications to metalloproteins and coordination chemistry. Coordination Chemistry Reviews 249, 141-160 (2005).
88. Dalba, G. & Fornasini, P. EXAFS Debye-Waller Factor and Thermal Vibrations of Crystals. Journal of Synchrotron Radiation 4, 243-255 (1997).
89. Teliska, M., O'Grady, W. E. & Ramaker, D. E. Determination of H Adsorption Sites on Pt/C Electrodes in HClO4 from Pt L23 X-ray Absorption Spectroscopy. The Journal of Physical Chemistry B 108, 2333-2344 (2004).
90. Smith, D. A., Elder, R. C. & Heineman, W. R. Extended x-ray absorption fine structure thin-layer spectroelectrochemistry. Analytical Chemistry 57, 2361-2365 (1985).
91. Dewald, H. D., Watkins, J. W., Elder, R. C. & Heineman, W. R. Development of extended x-ray absorption fine structure spectroelectrochemistry and its application to structural studies of transition-metal ions in aqueous solution. Analytical Chemistry 58, 2968-2975 (1986).
92. Abruna, H. D. et al. Is there any beam yet? Uses of synchrotron radiation in the in situ study of electrochemical interfaces. The Journal of Physical Chemistry 92, 7045-7052 (1988).
93. Bommarito, G. M., White, J. H. & Abruna, H. D. Electrosorption of iodide on platinum: packing density and potential-dependent distributional changes observed in situ with x-ray standing waves. The Journal of Physical Chemistry 94, 8280-8288 (1990).
94. Yee, H. S. & Abruna, H. D. In-situ x-ray studies of the underpotential deposition of copper on platinum(111). The Journal of Physical Chemistry 97, 6278-6288 (1993).
95. Yee, H. S. & Abruna, H. D. In situ x-ray absorption spectroscopy studies of copper underpotentially deposited in the absence and presence of chloride on platinum (111). Langmuir 9, 2460-2469 (1993).
96. L. Blum, H. D. A., J.H. White, M.J. Albarelli, J.G. Gordon, G. Borges, M. Samant, O.R. Melroy. Journal of Chemical Physics 85, 6732 (1986).
118
97. O.R. Melroy, M. G. S., G.C. Borges, J.G. Gordon, L. Blum, J.H. White, M.J. Albarelli, M. McMillan, H.D. Abruna. Langmuir 4, 728 (1988).
98. White, J. H. et al. Surface extended x-ray absorption fine structure of underpotentially deposited silver on gold(111) electrodes. The Journal of Physical Chemistry 92, 4432-4436 (1988).
99. Samant, M. G., Borges, G. L., Gordon, J. G., Melroy, O. R. & Blum, L. In situ surface extended x-ray absorption fine structure spectroscopy of a lead monolayer at a silver(111) electrode/electrolyte interface. Journal of the American Chemical Society 109, 5970-5974 (1987).
100. Villain, F., Briois, V., Castro, I., Helary, C. & Verdaguer, M. Multipurpose x-ray absorption cell. Analytical Chemistry 65, 2545-2548 (1993).
101. Nicola R.S. Farley, S. J. G., A. Robert Hillman. Simple cell for in situ X-ray absorption spectroelectrochemistry. Electrochemistry Communications 1, 449-452 (1999).
102. Igo, D. H., Elder, R. C., Heineman, W. R. & Dewald, H. D. Bulk-electrolysis flow-cell system for UV-visible and x-ray absorption spectroelectrochemical analysis. Analytical Chemistry 63, 2535-2539 (1991).
103. Sharpe, L. R., Heineman, W. R. & Elder, R. C. EXAFS spectroelectrochemistry. Chemical Reviews 90, 705-722 (1990).
104. N.R.S. Farley, S. J. G., A.R. Hillman. Dynamic EXAFS study of discharging nickel hydroxide electrode with non-integer Ni valency. Electrochimica Acta 46, 3119-3127 (2001).
105. A.J. Kropf, H. T., C.S. Johnson, J.T. Vaughey, M.M. Thackeray. An in situ X-ray absorption spectroscopy study of InSb electrodes in lithium batteries. Electrochemistry Communications 3, 244-251 (2001).
106. Kim, J.-W. & Park, S.-M. In Situ XANES Studies of Electrodeposited Nickel Oxide Films with Metal Additives for the Electro-Oxidation of Ethanol. Journal of The Electrochemical Society 150, E560-E566 (2003).
107. Pandya, K. I., Hoffman, R. W., McBreen, J. & O'Grady, W. E. In Situ X-Ray Absorption Spectroscopic Studies of Nickel Oxide Electrodes. Journal of The Electrochemical Society 137, 383-388 (1990).
108. Yoshitake, H., Yamazaki, O. & Ota, K.-i. In Situ X-Ray Absorption Fine Structure Study on Structure Transformation and Electronic State of Various Pt Particles on Carbon Electrode. Journal of The Electrochemical Society 141, 2516-2521 (1994).
119
109. Tryk, D. A. et al. In Situ X-Ray Absorption Fine Structure Measurements of LaNi[sub 5] Electrodes in Alkaline Electrolytes. Journal of The Electrochemical Society 142, 824-828 (1995).
110. Tryk, D. A. et al. In Situ La, Ce, and Nd L-Edge X-Ray Absorption Fine Structure Study of an Intermetallic Metal Hydride Electrode in an Operating Alkaline Battery. Journal of The Electrochemical Society 142, L76-L78 (1995).
111. Tolmachev, Y. V., Bae, I. T. & Scherson, D. A. X-ray Induced Photocurrents at the Metal/Solution Interface. The Journal of Physical Chemistry B 104, 7663-7667 (2000).
112. McBreen, J. et al. In situ time-resolved x-ray absorption near edge structure study of the nickel oxide electrode. The Journal of Physical Chemistry 93, 6308-6311 (1989).
113. Mukerjee, S., Srinivasan, S., Soriaga, M. P. & McBreen, J. Role of Structural and Electronic Properties of Pt and Pt Alloys on Electrocatalysis of Oxygen Reduction. Journal of The Electrochemical Society 142, 1409-1422 (1995).
114. Mukerjee, S. & McBreen, J. Hydrogen Electrocatalysis by Carbon Supported Pt and Pt Alloys. Journal of The Electrochemical Society 143, 2285-2294 (1996).
115. Yoon, W.-S. et al. Investigation of the Local Structure of the LiNi[sub 0.5]Mn[sub 0.5]O[sub 2] Cathode Material during Electrochemical Cycling by X-Ray Absorption and NMR Spectroscopy. Electrochemical and Solid-State Letters 5, A263-A266 (2002).
116. Mansour, A. N., Smith, P. H., Baker, W. M., Balasubramanian, M. & McBreen, J. A Comparative In Situ X-Ray Absorption Spectroscopy Study of Nanophase V[sub 2]O[sub 5] Aerogel and Ambigel Cathodes. Journal of The Electrochemical Society 150, A403-A413 (2003).
117. Mansour, A. N., Smith, P. H., Baker, W. M., Balasubramanian, M. & McBreen, J. A Comparative In Situ X-Ray Absorption Spectroscopy Study of Nanophase [bold V][sub 2][bold O][sub 5] Aerogel and Ambigel Cathodes [Journal of The Electrochemical Society, [bold 150], A403 (2003)]. Journal of The Electrochemical Society 150, L13 (2003).
118. Yoon, W.-S. et al. Combined NMR and XAS Study on Local Environments and Electronic Structures of Electrochemically Li-Ion Deintercalated Li[sub 1 - x]Co[sub 1/3]Ni[sub 1/3]Mn[sub 1/3]O[sub 2] Electrode System. Electrochemical and Solid-State Letters 7, A53-A55 (2004).
119. Mansour, A. N., Smith, P. H., Balasubramanian, M. & McBreen, J. In Situ X-Ray Absorption Study of Cycled Ambigel V[sub 2]O[sub 5] [center-dot] nH[sub 2]O(n [approximate] 0.5) Composite Cathodes. Journal of The Electrochemical Society 152, A1312-A1319 (2005).
120
120. Mukerjee, S., Srinivasan, S., Soriaga, M. P. & McBreen, J. Effect of Preparation Conditions of Pt Alloys on Their Electronic, Structural, and Electrocatalytic Activities for Oxygen Reduction - XRD, XAS, and Electrochemical Studies. The Journal of Physical Chemistry 99, 4577-4589 (1995).
121. O'Grady, W. E., Hagans, P. L., Pandya, K. I. & Maricle, D. L. Structure of Pt/Ru Catalysts Using X-ray Absorption Near Edge Structure Studies. Langmuir 17, 3047-3050 (2001).
122. Pandya, K. I., O'Grady, W. E., Corrigan, D. A., McBreen, J. & Hoffman, R. W. Extended x-ray absorption fine structure investigations of nickel hydroxides. The Journal of Physical Chemistry 94, 21-26 (1990).
123. Qian, X., Sambe, H., Ramaker, D. E., Pandya, K. I. & O'Grady, W. E. Quantitative Interpretation of K-Edge NEXAFS Data for Various Nickel Hydroxides and the Charged Nickel Electrode. The Journal of Physical Chemistry B 101, 9441-9446 (1997).
124. McBreen, J., O'Grady, W. E., Pandya, K. I., Hoffman, R. W. & Sayers, D. E. EXAFS study of the nickel oxide electrode. Langmuir 3, 428-433 (1987).
125. O'Grady, W. E., Qian, X. & Ramaker, D. E. Systematic Chemical Effects Observed in “Atomic” X-ray Absorption Fine Structure. The Journal of Physical Chemistry B 101, 5624-5626 (1997).
126. Maniguet, S., Mathew, R. J. & Russell, A. E. EXAFS of Carbon Monoxide Oxidation on Supported Pt Fuel Cell Electrocatalysts. The Journal of Physical Chemistry B 104, 1998-2004 (2000).
127. Russell, A. E. & Rose, A. X-ray Absorption Spectroscopy of Low Temperature Fuel Cell Catalysts. Chemical Reviews 104, 4613-4636 (2004).
128. Viswanathan, R. et al. In-Situ XANES of Carbon-Supported Pt−Ru Anode Electrocatalyst for Reformate-Air Polymer Electrolyte Fuel Cells. The Journal of Physical Chemistry B 106, 3458-3465 (2002).
129. Stoupin, S., Chung, E.-H., Chattopadhyay, S., Segre, C. U. & Smotkin, E. S. Pt and Ru X-ray Absorption Spectroscopy of PtRu Anode Catalysts in Operating Direct Methanol Fuel Cells. The Journal of Physical Chemistry B 110, 9932-9938 (2006).
130. Roth, C. et al. Determination of O[H] and CO Coverage and Adsorption Sites on PtRu Electrodes in an Operating PEM Fuel Cell. Journal of the American Chemical Society 127, 14607-14615 (2005).
131. Shyam, B., Arruda, T. M., Mukerjee, S. & Ramaker, D. E. Effect of RuOxHy Island Size on PtRu Particle Aging in Methanol. The Journal of Physical Chemistry C 113, 19713-19721 (2009).
121
132. Gatewood, D., Ramaker, D., Sasaki, K. & Swider-Lyons, K. Establishing the Mechanism for Oxygen Reduction on Au/SnOx Using In Situ X-ray Absorption Spectroscopy. ECS Transactions 11, 271-276 (2007).
133. Gatewood, D. S. et al. Characterization of Ligand Effects on Water Activation in Triarylphosphine-Stabilized Pt Nanoparticle Catalysts by X-ray Absorption Spectroscopy. The Journal of Physical Chemistry C 112, 4961-4970 (2008).
134. Yanase Akihisa, K. H. In situ optical observation of oxygen-adsorption-induced reversible change in the shape of small supported silver particles. Surface Science 264, 147-156 (1992).
135. Zhdanov, V. P. & Norton, P. R. Surface Reconstruction and Rate Processes in Adsorbed Overlayers†. Langmuir 12, 101-108 (1996).
136. Nolte, P. et al. Shape Changes of Supported Rh Nanoparticles During Oxidation and Reduction Cycles. Science 321, 1654-1658 (2008).
137. Soon, A., Wong, L., Delley, B. & Stampfl, C. Morphology of copper nanoparticles in a nitrogen atmosphere: A first-principles investigation. Physical Review B 77, 125423 (2008).
138. N. Inoglu, J. R. K. Atomistic thermodynamics study of the adsorption and the effects of water–gas shift reactants on Cu catalysts under reaction conditions. Journal of Catalysis 261, 188-194 (2009).
139. Mark a. Newton, C. B.-C., Arturo Martinez-Arias, Marcos Fernandez-Garcia. Dynamic in situ observation of rapid size and shape change of supported Pd nanoparticles during CO/NO cycling. Nature Materials 6, 528-532 (2007).
140. Rentao Mu, Q. F., Hongyang Liu, Dali Tan, Runsheng Zhai, Xinhe Bao. Reversible surface structural changes in Pt-based bimetallic nanoparticles during oxidation and reduction cycles. Applied Surface Science 255, 7296-7301 (2009).
141. Tao, F. et al. Reaction-Driven Restructuring of Rh-Pd and Pt-Pd Core-Shell Nanoparticles. Science 322, 932-934 (2008).
142. Mukerjee, S., Ramaker, D., Gatewood, D. & Ziegelbauer, J. M. In Situ X-Ray Absorption Spectroscopy Studies of Water Activation on Novel Electrocatalysts for Oxygen Reduction Reaction in Acid Electrolyte. ECS Transactions 1, 119-128 (2006).
143. Ziegelbauer, J. M., Gatewood, D., Gulla, A. F., Ramaker, D. E. & Mukerjee, S. X-Ray Absorption Spectroscopy Studies of Water Activation on an Rh[sub x]S[sub y] Electrocatalyst for Oxygen Reduction Reaction Applications. Electrochemical and Solid-State Letters 9, A430-A434 (2006).
122
144. Ziegelbauer, J. M. et al. Fundamental Investigation of Oxygen Reduction Reaction on Rhodium Sulfide-Based Chalcogenides. The Journal of Physical Chemistry C 113, 6955-6968 (2009).
145. Scott, F. J., Mukerjee, S. & Ramaker, D. E. CO Coverage/Oxidation Correlated with PtRu Electrocatalyst Particle Morphology in 0.3 M Methanol by In Situ XAS. Journal of The Electrochemical Society 154, A396-A406 (2007).
146. Arruda, T. M., Shyam, B., Ziegelbauer, J. M., Mukerjee, S. & Ramaker, D. E. Investigation into the Competitive and Site-Specific Nature of Anion Adsorption on Pt Using In Situ X-ray Absorption Spectroscopy. The Journal of Physical Chemistry C 112, 18087-18097 (2008).
147. Holstein, W. L. & Rosenfeld, H. D. In-Situ X-ray Absorption Spectroscopy Study of Pt and Ru Chemistry during Methanol Electrooxidation†. The Journal of Physical Chemistry B 109, 2176-2186 (2004).
148. Wiltshire, R. J. K. et al. Channel-Flow Cell for X-ray Absorption Spectroelectrochemistry. The Journal of Physical Chemistry C 113, 308-315 (2008).
149. Hudson, S. L. et al. Probing the Structure of Operating Fuel Cell Cathode Catalysts using XAS. ECS Transactions 16, 1395-1404 (2008).
150. Richard J.K. Wiltshire, C. R. K., Abigail Rose, Peter P. Wells, Hazel Davies, Martin P. Hogarth, David Thompsett, Brian Theobald, Fredrick W. Mosselmans, Mark Roberts, Andrea Russell. Effects of composition on structure and activity of PtRu/C catalysts. Physical Chemistry Chemical Physics 11, 2305-2313 (2009).
151. Stanislav Stoupin, H. R., Zhengrong Li, Carlo U. Segre, Carol Korzeniewski, Dominick J. Casadonte Jr., Hisashi Inoue, Eugene S. Smotkin. Structural analysis of sonochemically prepared PtRu versus Johnson Matthey PtRu in operating direct methanol fuel cells. Physical Chemistry Chemical Physics 10, 6430-6437 (2008).
152. Imai, H. et al. In Situ and Real-Time Monitoring of Oxide Growth in a Few Monolayers at Surfaces of Platinum Nanoparticles in Aqueous Media. Journal of the American Chemical Society 131, 6293-6300 (2009).
153. Emiliano Principi, A. W., Sonia Dsoke, Roberto Marassi, Andrea Di Ciccio. An XAS experimental approach to study low Pt content electrocatalysts operating in PEM fuel cells. Physical Chemistry Chemical Physics 11, 9987-9995 (2009).
123
Chapter 3
An Investigation into the Competitive and Site-Specific Nature of Anion
Adsorption on Pt Using In Situ X-ray Absorption Spectroscopy∗
3.1 Introduction
Highly dispersed polycrystalline platinum nanoparticles are still considered to be the
premier electrocatalysts for use in low and medium temperature fuel cells such as
polymer electrolyte membrane fuel cells (low temperature, PEMFC) and the acid-
imbibed analogs (medium temperature PBI-Phosphoric acid based). They are also
candidates for potential applications in new hybrid concepts as reversible electrodes for
large scale energy storage using modified flow-through battery configurations. To date
they still exhibit the highest activity toward the oxygen reduction reaction (ORR) and are
relatively resistant to corrosion under standard fuel cell operating conditions. When used
as an anode, platinum demonstrates near perfect electrokinetics as the overpotential of
∗ Published in the Journal of Physical Chemistry C, 2008, 112 (46), 18087-18097 Authors: Thomas Arruda, Badri Shyam, Joseph Ziegelbauer, Sanjeev Mukerjee, and David E.Ramaker Electrochemistry data collection and analysis was carried out by authors affiliated with Northeastern University. XAS data collection and analysis were carried out by authors from The George Washington University and Northeastern University.
124
hydrogen oxidation/evolution is negligible in pure, hydrated H2 streams.1 The high
activity exhibited by Pt is also the reason for its higher susceptibility to poisoning by
species which have higher chemisorption ability. One of the significant classes of such
surface poisons are halides.
Due to the aforementioned importance of platinum and its susceptibility to poisoning,
a myriad of studies on Pt poisoning have been published over the years. Many of these
endeavors have investigated the adsorption of anions such as bisulfate and halides
revealing adverse electrochemical effects.2-9 In the presence of strongly adsorbing anions,
ORR on platinum suffers further overpotential losses of several hundred millivolts
beyond that due to the sluggish ORR kinetics in clean electrolytes.10, 11 In addition, H2O2
byproduct formation has been shown to increase in the presence of adsorbed anions.10
The presence of H2O2 in a fuel cell electrode-electrolyte interface is known to lead to
formation of free radicals such as hydroxyl and peroxy-hydroxyl which ultimately attack
the polymer electrolyte membrane, causing durability issues.12 It is generally accepted
that the adsorption strength of adsorbed halides on platinum increases in the order Cl- <
Br- < I-.5 The reversibility of halide adsorption, however, has been somewhat
controversial. Lane et al.13 suggested that halides adsorb strongly enough to withstand
rinsing with an inert electrolyte. Such irreversibility however has been contradicted by
subsequent investigations employing radiotracers to demonstrate dislodgement of
adsorbed Cl- by other halides or rinsing with clean electrolyte.3
Halide poisoning is commonly observed during cyclic voltammetry (CV); one such
example in acidic and alkaline media revealed significant alteration of the H
underpotential deposition (Hupd) peaks particularly with respect to amplitude and position
125
in platinum CVs.4 This suggested chloride anions were present on the platinum surface
even at low potentials. Other studies have demonstrated halide anion influences at
concentrations as low as μM levels.2, 3 In the context of O[H] adsorption from water
activation, adsorbed halide anions were shown to frustrate Pt-O[H] formation as indicated
by the anodic peak suppression/shift in the CV.10 Further Rotating Ring Disk Electrode
(RRDE) measurements also revealed an increased production of H2O2 on Pt(100)
facets.10 The competitive nature of O[H] and Cl- adsorption was probed by
chronocoulometric measurements.14 Thermodynamic analyses of the charge density was
used to determine the Gibbs energy of adsorption (142 kJ mol-1 Cl-, 136 kJ mol-1 O[H] on
Pt(111)), suggesting that the coexistence of Cl- and O[H] inhibited the development of an
ordered Cl- adlayer.
Since anion adsorption is a surface phenomenon, most of the available surface
sensitive techniques have been exploited to elucidate adsorbate coverage and structure.
Such techniques include Auger Electron Spectroscopy (AES), Low Energy Electron
Diffraction (LEED), second harmonic generation (SHG) and Surface X-Ray Scattering
(SXS), all of which revealed significant results. Through AES/LEED studies, it was
determined that Clads occurs on Pt(100) and Pt(111) surfaces in two separate
electrochemical windows; the hydrogen desorption region and the onset of O[H]
adsorption region.15 The Pt(100) surface was also shown to be affected by Cl- at a lower
potential than Pt(111) indicating Pt(100) was more susceptible to Cl- poisoning. SHG
experiments indicate a strong correlation between halide concentration and monolayer
coverage (0.1 ML to >0.9 ML for Cl- concentration of 10-6 – 10-4 M respectively).16
Similar findings were obtained for Br- anions adsorbed on platinum. Modern X-ray
126
scattering methods have also proved invaluable for surface studies. For example,
Marković et al.5, 17 established that Cl- adsorbs on platinum with a Pt-Cl interatomic
separation of 2.4Å with no ordered, in-plane structure. Analysis of Crystal Truncation
Rods (CTR) in the above studies yielded a monolayer coverage of 0.6 ML at 0.7 V vs.
Reversible Hydrogen Electrode (RHE) with a Pt-Cl interatomic distance of
approximately 2.4 Å. Interatomic Cl-Cl distances were also determined to be in the range
of 3.58 Å to 4.39 Å at 0.7 V and 0.25 V respectively.
As mentioned above, the spectroscopic methods used to study anion adsorption have
revealed pertinent fundamental information; however, most methods are either dependant
on ultra high vacuum conditions (UHV) or have been employed on single crystals. Such
results may not be comparable to in operando fuel cell catalyst surfaces, which are
polycrystalline in nature and strongly influenced by their surroundings, such as the
presence of electrolyte or gases. In order to obtain a more complete description of the
catalyst surface, in situ experiments should be employed on actual fuel cell materials.
Over the past two decades X-Ray Absorption Spectroscopy (XAS) has been
developed into a reliable method to study electrode processes in situ via Extended X-ray
Absorption Fine Structure (EXAFS) and X-ray Absorption Near Edge Structure
(XANES).18-20 Because of the high photon flux of modern day synchrotron sources, XAS
is available to probe materials in situ without significant x-ray beam attenuation. XAS
allows for the determination of bond distances, coordination numbers, Debye-Waller
factors and oxidation state without the necessity of long-range order. When acquired in
situ, the above parameters can be evaluated under operating fuel cell conditions.
Historically, the inherent bulk averaging nature of XAS has limited its utility for surface
127
studies. Recently however, the delta mu (Δμ) method of XANES analysis has been
developed as a surface sensitive method to determine surface/adsorbate interactions.21-24
The Δμ analysis isolates surface/adsorbate interactions by subtracting out the bulk metal-
metal interactions. Once obtained, the Δμ spectra are compared to theoretical Δμ curves
generated based on crystallographic models.
Water activation studies utilizing Pt L3 edge XANES data in acidic media have
revealed that OHads on platinum occurs in an atop configuration (one-fold) at low
potentials, followed by two and three fold symmetries with increasing electrode
polarization until finally place exchange occurs at 1.05V and higher.25-27 Prior to these
studies it was believed that place exchange occurred only at potentials greater than 1.2V.
The Δμ technique was also employed to investigate hydrogen adsorption and mobility on
platinum catalysts in the UPD region of the platinum CV.28, 29 At low coverage, H was
found to be delocalized on the platinum surface, while at higher coverage, H occupied fcc
sites as well as edge/step locations. Other platinum based in situ XAS systems that have
been explored utilizing the Δμ technique include bisulfate poisoning of platinum,30 and
COads on PtRu alloy electrocatalysts.31 The Δμ technique was also applied to a non-
metallic, heterogeneous (3-phase) RhxSy system to examine H2O activation.32 After a
complex analysis of RhxSy clusters, it was established that O adsorbs in one-fold sites at
low potentials and bridge-bonded sites at 0.8V and above. This XAS investigation also
identified the Rh3S4 moiety as the electroactive phase of the heterogeneous RhxSy
material when the previous inclination was that Rh17S15 was the active phase.
Previously, we determined the Cl- poisoning site on Pt in Cl- contaminated
electrolytes by using the Δμ method.33 In this work we extend our study to include a
128
detailed analysis of Cl- adsorption on all low index Pt faces, corner, and edge sites using
both electrochemical and spectroscopic methods. Through in situ XAS measurements
(Δμ technique and EXAFS) we are able to show that Cl- anions affect water activation
differently depending on binding site. There is also a Cl- anion concentration effect
which is apparent over the concentration range we study. Further, the Δμ technique
provides an atomic level view of the surface-adsorbate interactions, which allows us to
determine the adsorption site of Cl- on a polycrystalline Pt/C electrocatalyst.
3.2 Experimental
3.2.1 Electrochemical Characterization
RDE studies were performed as described in detail elsewhere.25 Briefly, inks of 30
wt% Pt/C (Vulcan XC72 from E-TEK) were prepared by combining 10 mg catalyst, 5
mL deionized water (18.2MΩ, Millipore MilliQ® system), 5 mL 2-propanol (HPLC
grade, Aldrich), and 40 μL 5 wt% Nafion® solution (Aldrich). The ink was then
sonicated for 15 minutes and stirred for 2 hours. The ink was then cast onto a polished
glassy carbon (GC) RDE (Pine Instrument Co.) via two 5 μL aliquots, and allowed to dry
in air after each application. The final metal loading on the GC was 14 μg cm-2 Pt. The
corresponding Nafion® to catalyst ratio was 1:50 by weight. Room temperature CVs
were obtained in 1M HClO4 (GFS Chemicals, doubly distilled), 1M HClO4 + 10-3 M KCl
(Aldrich, 99.999% pure) and 1M HClO4 + 10-2 M KCl under an Ar (Med-Tech Gasses)
atmosphere. For oxygen reduction experiments the above electrolytes were purged with
ultra high purity O2. All data were collected with an Autolab® potentiostat (model
PGSTAT30, Ecochemie-Brinkmann). For all of the experiments a sealed RHE, filled
with 1M HClO4 was utilized as the reference electrode and a high surface area Pt mesh
129
(Alfa Aesar) functioned as the counter electrode. All current densities reported in this
text refer to geometric surface area as the poisoning effects of chloride render Hupd
adsorption useless for surface area measurements. As reported earlier,34 average particle
size of these electrocatalysts were in the range of 30 Å ± 4 Å.
3.2.2 In Situ XAS Data Collection
All experiments were conducted at room temperature in an in situ electrochemical
XAS cell based on a previously reported design.35 The cells used consisted of a 30 wt%
Pt/VXC72 (E-TEK) working electrode (WE), an acid washed (0.5M H2SO4) Grafoil®
counter electrode (CE) and an RHE reference electrode. The WE and CE were separated
by a piece of Nafion® 112 (DuPont) polymer electrolyte membrane and the cell was
flooded with 1M HClO4 + xM KCl (x = 10-3 or 10-2 M). Grafoil® was chosen as a CE to
eliminate any interference at the Pt L3,2 edges with little x-ray beam attenuation and
HClO4 was utilized for its low anion adsorption effects on platinum. In all cases, Au wire
(99.999%, Alfa-Aesar) was utilized as a current collector and mechanically pressed
against the back side of the electrode in a fashion which did not expose the gold to the x-
ray beam. Silicone gaskets (Auburn Chemical Co.) were used to seal the cell. The
electrodes were prepared by hand painting catalyst suspensions of 30 wt% Pt/VXC72, 1:1
deionized H2O / 2-propanol mixture and 95:5 mixture of catalyst (wt) / 5 wt % Nafion
solution. The inks were painted onto commercially available carbon cloth (Zoltek®) with
a loading of ~5 mg cm-2 Pt to obtain an absorption cross section of ~ 1. The total
geometric area of the Pt WE used in the cell was 5 cm2. To ensure proper electrode
130
wetting, each electrode was vacuum impregnated in clean electrolyte prior to cell
assembly.
The platinum working electrodes were activated by potential cycling (0.05 V to 1.2 V
vs. RHE at 10 mV s-1) in clean 1M HClO4. Following the activation step, the clean
electrolyte was removed from the cell by syringe and replaced with 1M HClO4 + xM KCl
(x = 0, 10-3, 10-2). Full range Pt L3 extended x-ray absorption fine structure (EXAFS)
were taken (-250 eV to 18k) with the WE fixed at various static potentials along the
anodic sweep of the CV. Between EXAFS scans the potential was cycled around
completely to ‘clean’ the electrode surface. A full set of EXAFS were also obtained in
clean 1M HClO4 to provide clean reference scans and as H2O activation standards. The
measurements were performed at beam line X11-B (National Synchrotron Light Source,
Brookhaven National Laboratory, Upton, NY) with the Si(111) monochromator detuned
by 40% in order to reject the higher harmonics from the beam. Data were collected in
transmission mode using gas ionization detectors (I0, I1 or I2) with a nominal
Nitrogen/Argon gas mixture to allow ~ 10% photon absorption in I0 and 70 % in I1. The
sample was placed between the I0 and I1 detectors, while a Pt reference foil (4 μm, Alfa
Aesar) was positioned between I1 and I2.
3.2.3 EXAFS and Δμ analysis
The IFEFFIT suite36 (version 1.2.9, IFEFFIT Copyright 2005, Matthew Newville,
University of Chicago, http://cars9.uchicago.edu/ifeffit/) was utilized for background
subtraction (AUTOBK)37 and normalization. A k-range window of 1.988 – 14.072 Å-1
(Kaiser-Bessel) and a, R-window of 1.532 – 3.379 Å was used for all the EXAFS fits.
3.2.4 Alignment and normalization of XAS data
131
The Δμ analysis technique has been described in great detail elsewhere.22, 24, 38, 39
Briefly, XAS reference scans were carefully calibrated to the edge energy (11564 eV, Pt
L3) and aligned to one standard reference scan as the beam energy is known to “drift”
over the duration of the beam lifetime (12 hrs.). Any edge shift corrections applied to the
reference foils are automatically applied to their respective sample scans. A post-edge
normalization procedure was then applied to the aligned scans via a cubic spline function
(AUTOBK)37 which normalizes the oscillations over a specific energy range (for Pt Δμ
typically 25 – 150 eV with respect to E0, 150 – 1000 eV for EXAFS) to present the data
on a per-atom basis. These parameters often vary from scan to scan and are assessed on
an individual basis.39 Difference spectra were constructed using the equation
Δμ = μ(V) – μ(0.54 V) (Eq. 3.1)
where μ(V) is the sample at various potentials and μ(0.54) is the reference signal at 0.54
V, which is considered the cleanest region of platinum; i.e., relatively free of any
adsorbed H, OH or Ox species. The Δμ spectra are then compared to theoretical curves
(Δμt) constructed using the FEFF 8.0 code. This was accomplished using the relationship
Δμt = μ(Pt6X) – μ(Pt6) (Eq. 3.2)
where X is Cl- or O in a specified binding site with respect to the absorbing Pt atom and
Pt6 is a 6-Pt cluster with a Pt-Pt bond distance of 2.77 Å as described by Janin et al.40 It
should be noted that theoretical Δμ curves are generally shifted by 1-5 eV and scaled by a
multiplication factor for optimal comparison with experimental data.
3.3 Results and Discussion
3.3.1 Electrochemical Characterization
132
As mentioned above, the presence of Cl- anions severely impedes the oxygen
reduction reaction (ORR) on Pt/C electrocatalysts. Figure 3.1a presents the rotating disk
electrode (RDE) curves for Pt/C in clean and Cl- contaminated electrolyte at several
rotation rates. In clean electrolyte a reasonable ORR activity is observed with an onset
potential close to 1.0 V vs. RHE. In addition, a well defined diffusion limiting current is
obtained as a function of rotation rate as described by the Levich equation:
ilim = 0.62neFD2/3ν-1/6Co (Eq. 3.3)
where ilim is the diffusion limiting current density, ne is the number of electrons, F is
Faraday’s constant, D is the diffusion coefficient of O2 in the electrolyte, ν is the
kinematic viscosity and Co is the concentration of O2. With each 10-fold addition of
chloride, the ORR overpotential is increased by approximately 85 mV with respect to the
curve in 1M HClO4. Though the Levich relationship still appears to exist, a clear
delineation of a diffusion limiting current is less evident in the presence of Cl-. This is
more manifest for ORR with 10-2 M chloride concentration (dotted line, inset). At this
concentration a significant change in the magnitude of the limiting current is observed.
The Tafel plots shown in Figure 3.1b were extracted from the ORR polarizations (anodic
scan) following a correction for mass transport by the equation
ik = ilim * i / (ilim – i) (Eq. 3.4)
where ik is the kinetic current density, ilim is the diffusion limiting current as described by
Equation 3.4 and i is the measured current during the ORR polarization. The anodic scan
was used since this represents the ORR activity initiated on a relatively clean Pt surface
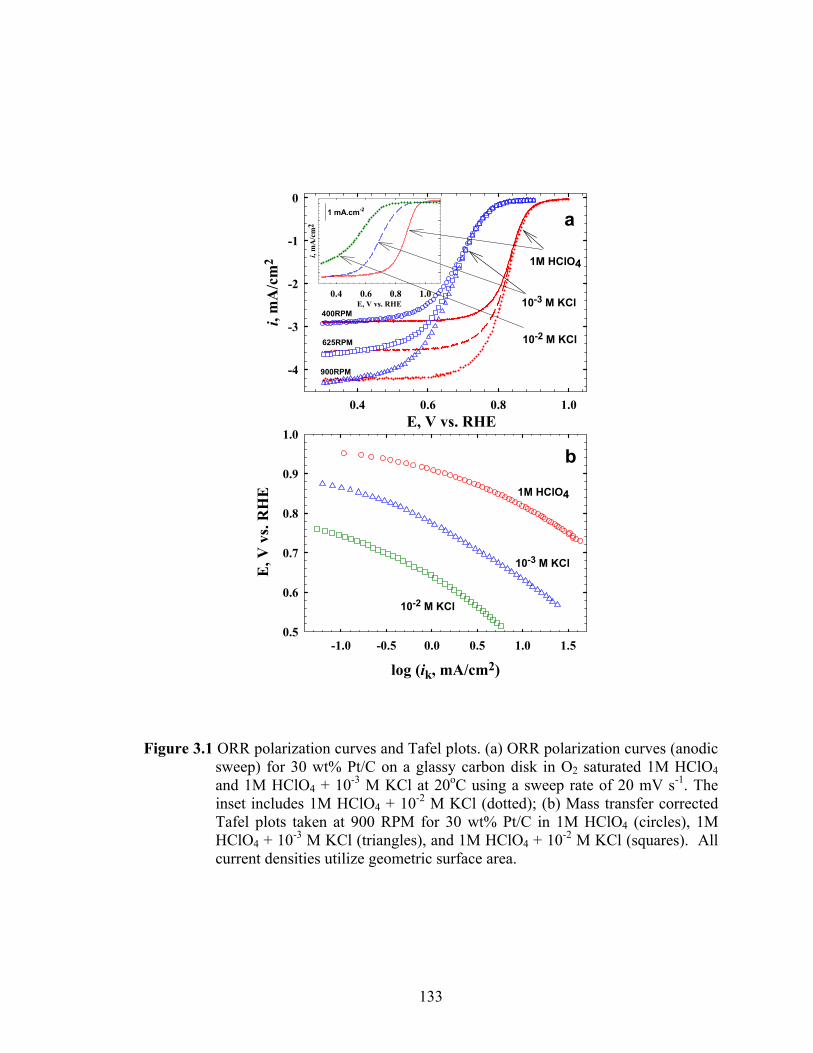
133
log (ik, mA/cm2)-1.0 -0.5 0.0 0.5 1.0 1.5
E, V
vs.
RH
E
0.5
0.6
0.7
0.8
0.9
1.0E, V vs. RHE
0.4 0.6 0.8 1.0
i, m
A/c
m2
-4
-3
-2
-1
0
E, V vs. RHE0.4 0.6 0.8 1.0
i, m
A/c
m2
1M HClO4
10-3 M KCl400RPM
625RPM
900RPM
a
b
10-2 M KCl
1M HClO4
10-3 M KCl
10-2 M KCl
1 mA.cm-2
Figure 3.1 ORR polarization curves and Tafel plots. (a) ORR polarization curves (anodic sweep) for 30 wt% Pt/C on a glassy carbon disk in O2 saturated 1M HClO4 and 1M HClO4 + 10-3 M KCl at 20oC using a sweep rate of 20 mV s-1. The inset includes 1M HClO4 + 10-2 M KCl (dotted); (b) Mass transfer corrected Tafel plots taken at 900 RPM for 30 wt% Pt/C in 1M HClO4 (circles), 1M HClO4 + 10-3 M KCl (triangles), and 1M HClO4 + 10-2 M KCl (squares). All current densities utilize geometric surface area.
134
with the competing effects of Cl- and oxide growth as a function of positive potential
scan. The cathodic scan proceeds with a pre-existing oxide covered surface, thereby
representing a more complex kinetic analysis perspective. Though it was mentioned
above that Cl- contamination resulted in the loss of a well-defined diffusion limiting
current, we utilize the current density at 0.3V in each electrolyte as ilim to maintain
consistency. The overall shapes of the Tafel curves remain relatively unchanged with
chloride present, indicating no significant change in the rate limiting step of ORR. The
decrease in electrocatalytic activity reflects the increased overpotentials caused by Cl-,
and is consistent with a site blocking mechanism.10, 41 These observations agree with
work recently reported by Schmidt et al.10 Although their work was done at elevated
temperature (60oC) and with a slower sweep rate (5 mVs-1), they observed similar
overpotentials as a function of chloride concentration.
To further illustrate the effect of chloride adsorption on platinum, cyclic
voltammograms with and without chloride are presented in Figure 3.2. The solid line
representing polycrystalline platinum in clean HClO4 reveals all the signature platinum
features. Perhaps the most notably are Pt-O[H] formation (anodic sweep, > 0.70 V) and
reduction (cathodic sweep, ca. 0.80 V). From inspection of the chloride contaminated
voltammograms (dashed 10-3 M, dotted 10-2 M), it is evident that adsorbed Cl- hinders
O[H] adsorption at 0.70V. It is not until the electrode is polarized to approximately 1.0 V
that an appreciable increase in current density is attained, whence Pt-O formation occurs
despite the chloride presence. This delay in the onset potential for O[H] adsorption has
been confirmed by earlier studies on both single crystals5, 41-43 and polycrystalline Pt.10, 44,
45 Though it is not the objective of this work to investigate the effect of chloride on Hupd,
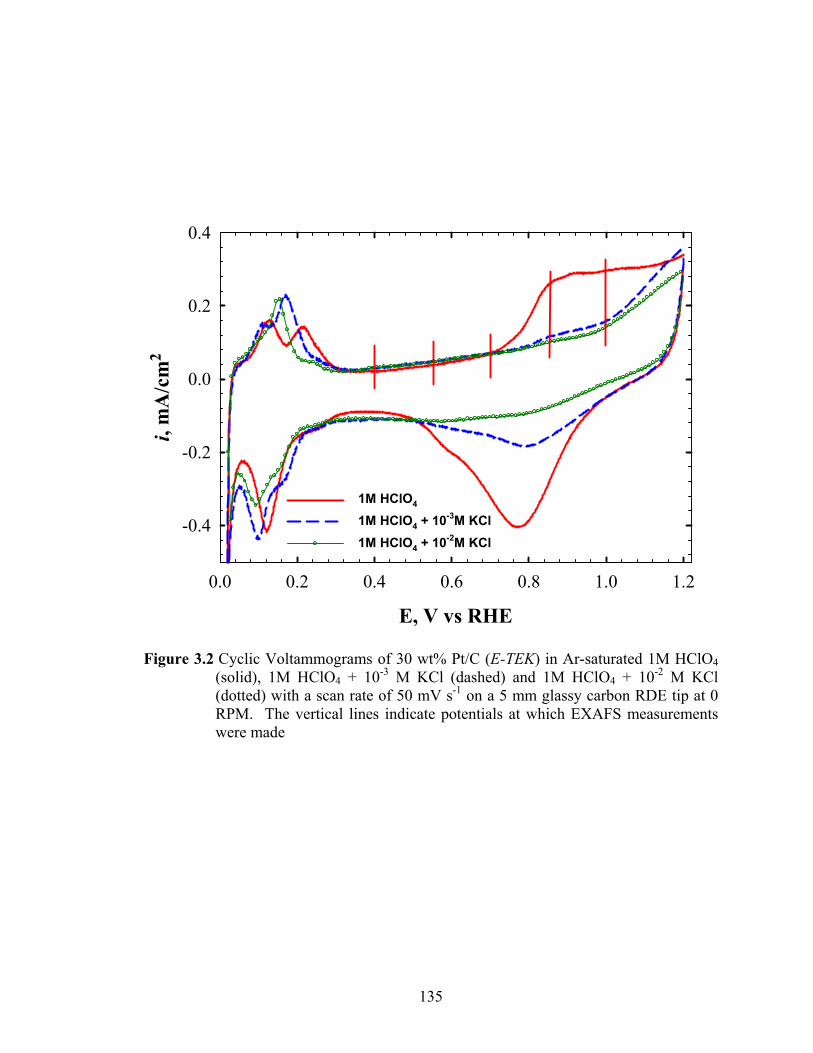
135
E, V vs RHE
0.0 0.2 0.4 0.6 0.8 1.0 1.2
i, m
A/c
m2
-0.4
-0.2
0.0
0.2
0.4
1M HClO4
1M HClO4 + 10-3M KCl1M HClO4 + 10-2M KCl
Figure 3.2 Cyclic Voltammograms of 30 wt% Pt/C (E-TEK) in Ar-saturated 1M HClO4 (solid), 1M HClO4 + 10-3 M KCl (dashed) and 1M HClO4 + 10-2 M KCl (dotted) with a scan rate of 50 mV s-1 on a 5 mm glassy carbon RDE tip at 0 RPM. The vertical lines indicate potentials at which EXAFS measurements were made
136
it is worth mentioning that changes in Hupd peaks are also observed. Among the halides,
I- adsorption is known to be the strongest,2, 10 and thus affects the Hupd region to a much
larger extent, and in a very different manner than either Cl- or Br-. The adsorption of Cl-
is known to take place on at least three distinct sites (2 for Br) with differing energies of
activation. This however does not change the total amount of adsorbed hydrogen. The
potential range over which Hads occurs is also reduced in the presence of halides and is
generally recognized to be due to the competitive nature of the adsorbed ions on the Pt
surface. There is also evidence in the literature for the partial desorption of Cl- and Br- in
this region. Such phenomena, however, have already been adequately explained2, 9 and
thus will not be discussed here in further detail.
3.3.2 EXAFS Results
Prior to the Δμ XANES analysis, traditional Fourier Transform (FT) EXAFS analysis
was performed to ensure no major changes in Pt-Pt bond length occur as a function of
potential. Such changes would yield unreliable results as Δμ relies on crystallographic
modeling with consistent bond lengths to generate theoretical Δμ signatures. To elucidate
quantitative structural information, the EXAFS data were fit using Artemis, a subroutine
of the IFEFFIT code.36 A representative fit is presented in Figure 3.3 for Pt/C in clean 1M
HClO4 at 0.54 V vs. RHE. In this region no adsorbed species (such as hydrides or
oxides) are expected and therefore it is generally representative of a clean metal surface.
The fit utilized a single shell Pt-Pt scattering path to isolate the effect that adsorbates
exhibit on local Pt structure. Table 3.1 contains a summary of the EXAFS fitting
parameters for the Pt L3 edge in each electrolyte as a function of electrode potential in the

137
R, Å1 2 3 4
| χ(R
)|, Å
- 3
0.0
0.2
0.4
0.6
0.8
1.0
1.2
1.4
No Cl-, 0.54VFit
Figure 3.3 Fourier Transformed EXAFS for 30 wt% Pt/C in 1M HClO4 at 0.54 V vs. RHE measured in situ at the Pt-L3 edge. Phase and amplitude parameters were fit using those generated with IFEFFIT 1.2.9 and sample data. Single shell (Pt-Pt) fit, (1.5 < k < 15.8 Å-1, k2 weighted), performed in R-space.
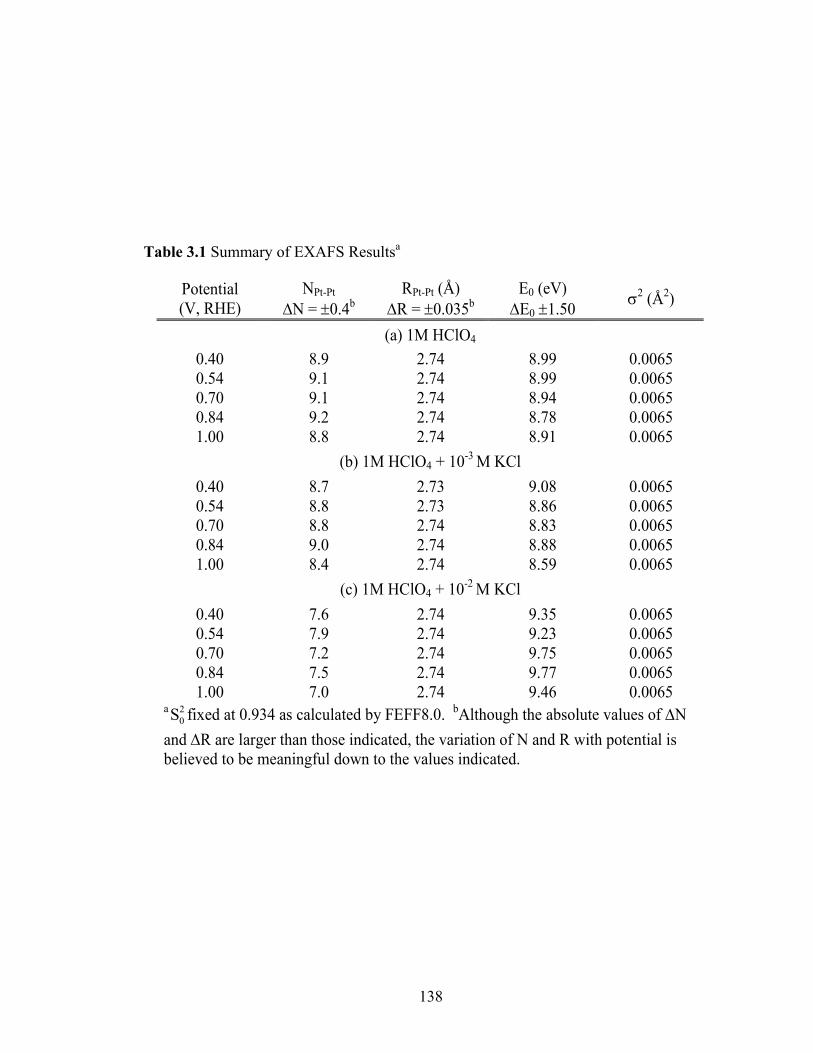
138
Table 3.1 Summary of EXAFS Resultsa
Potential (V, RHE)
NPt-Pt
ΔN = ±0.4b RPt-Pt (Å)
ΔR = ±0.035b E0 (eV)
ΔE0 ±1.50 σ2 (Å2)
(a) 1M HClO4 0.40 8.9 2.74 8.99 0.0065 0.54 9.1 2.74 8.99 0.0065 0.70 9.1 2.74 8.94 0.0065 0.84 9.2 2.74 8.78 0.0065 1.00 8.8 2.74 8.91 0.0065
(b) 1M HClO4 + 10-3 M KCl 0.40 8.7 2.73 9.08 0.0065 0.54 8.8 2.73 8.86 0.0065 0.70 8.8 2.74 8.83 0.0065 0.84 9.0 2.74 8.88 0.0065 1.00 8.4 2.74 8.59 0.0065
(c) 1M HClO4 + 10-2 M KCl 0.40 7.6 2.74 9.35 0.0065 0.54 7.9 2.74 9.23 0.0065 0.70 7.2 2.74 9.75 0.0065 0.84 7.5 2.74 9.77 0.0065 1.00 7.0 2.74 9.46 0.0065
a 20S fixed at 0.934 as calculated by FEFF8.0. bAlthough the absolute values of ΔN
and ΔR are larger than those indicated, the variation of N and R with potential is believed to be meaningful down to the values indicated.
139
range between 0.4 and 1.00 V vs. RHE. As evidenced by the R values, no major changes
in bond length occur although the coordination number (N) is altered as a function of
potential representing the effect of adsorbed species (both Cl- and oxides). In order to
include the Pt-Cl and Pt-O interactions, corresponding 3 shell fits were conducted (Pt-Pt,
Pt-Cl and Pt-O), however for simplicity only the Pt-Pt interactions are shown in Table
3.1. It should be noted that the EXAFS results obtained in 1M HClO4 were used to
determine the average bulk Pt-Pt coordination number (NPt-Pt) which was determined to
be in the range of 8 & 9. From these results, the Pt/C nanoparticles can be estimated to
be between 1 to 1.5 nm in diameter,46 with a dispersion factor of around 50-60%,47 and
thereby consisting of approximately 55 to 150 atoms.5 These were calculated using
algorithms developed earlier by Benfield.48 These algorithms provide an important link
between the geometric models of clusters described by Hardeveld and coworkers49, 50 and
the shell-by-shell approach used in EXAFS analysis. Accordingly, a cubo-octahedron
model was used in this analysis as previously by Kinoshita,47 and Stonehart.51 Results
from the cluster analysis are shown in Table 3.2 for various cluster sizes in the range of
10 to 60 Å. The most reactive sites are those which correspond to low surface
coordination numbers. These are depicted in Table 3.2 in terms of number of atoms at
particle edges (coordination no. 7) and at square faces or steps (coordination no. 8).
When compared to the number of sites on bulk crystallographic planes such as the
Pt(100), Pt(111) faces, the edges and steps predominate below 15 Å. However with the
particle size greater than 20 Å, the bulk crystallographic planes assume importance.
From our previous study on the effect of particle size on electrocatalysis, 52 it is clear that
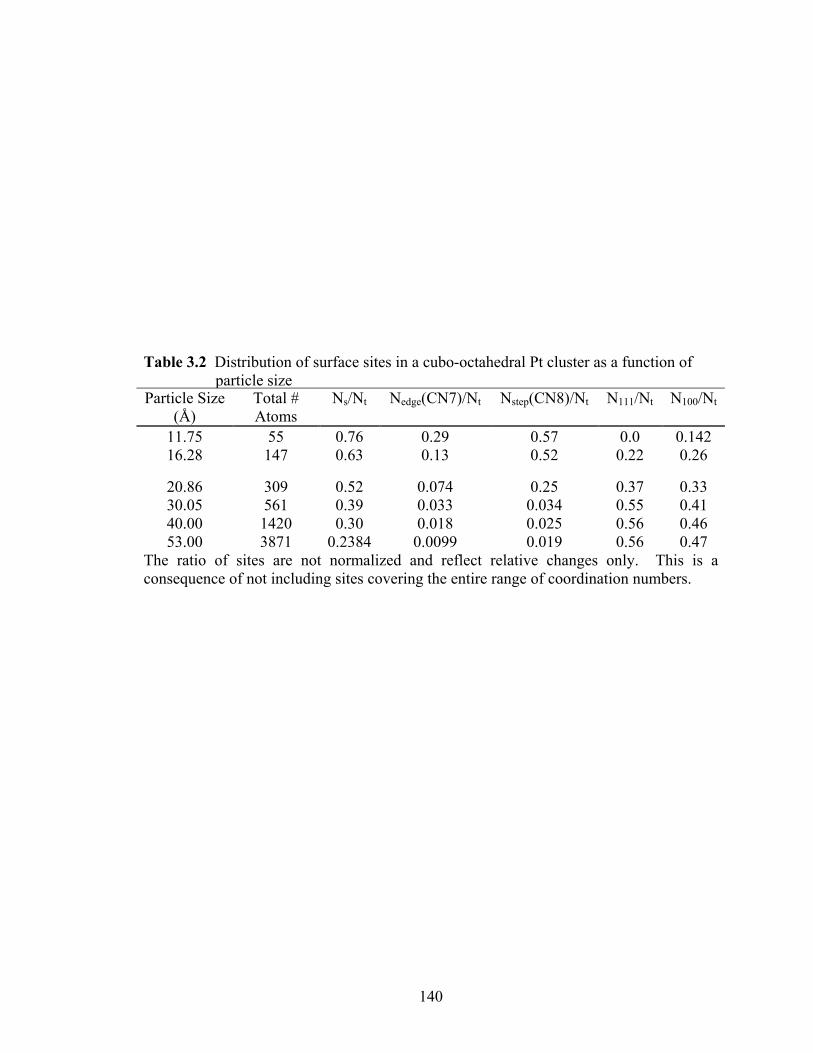
140
Table 3.2 Distribution of surface sites in a cubo-octahedral Pt cluster as a function of particle size
Particle Size (Å)
Total # Atoms
Ns/Nt Nedge(CN7)/Nt Nstep(CN8)/Nt N111/Nt N100/Nt
11.75 55 0.76 0.29 0.57 0.0 0.142 16.28 147 0.63 0.13 0.52 0.22 0.26
20.86 309 0.52 0.074 0.25 0.37 0.33 30.05 561 0.39 0.033 0.034 0.55 0.41 40.00 1420 0.30 0.018 0.025 0.56 0.46 53.00 3871 0.2384 0.0099 0.019 0.56 0.47
The ratio of sites are not normalized and reflect relative changes only. This is a consequence of not including sites covering the entire range of coordination numbers.
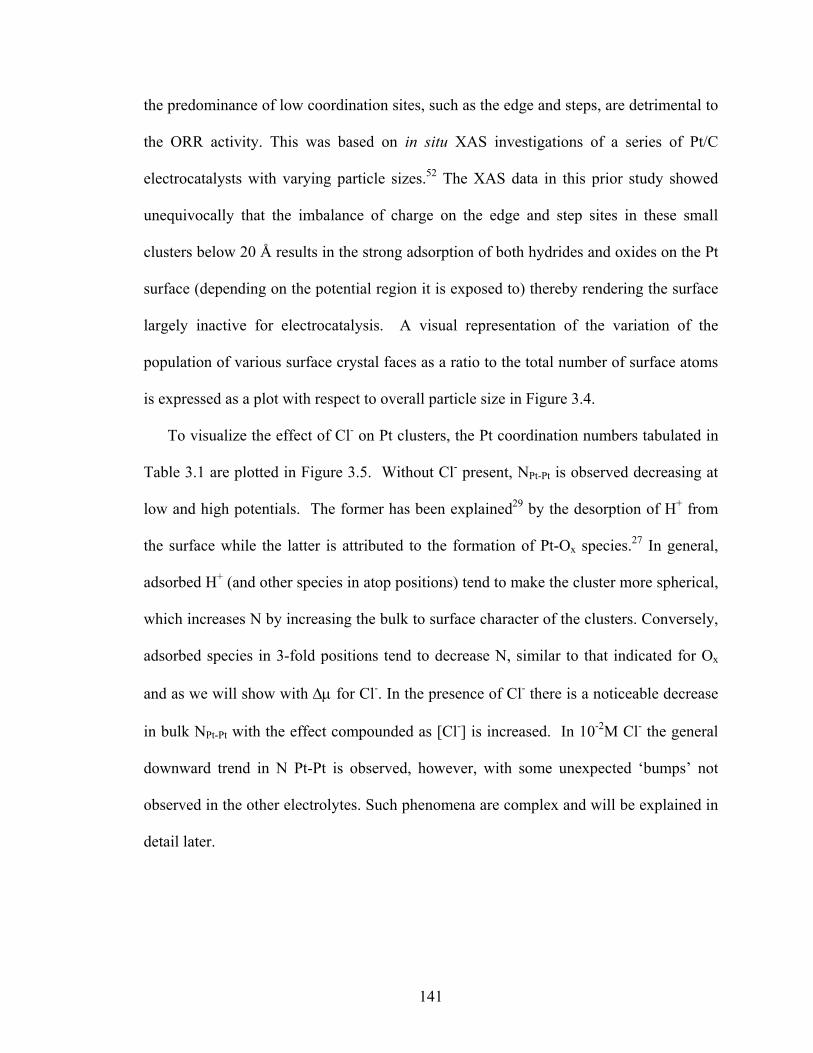
141
the predominance of low coordination sites, such as the edge and steps, are detrimental to
the ORR activity. This was based on in situ XAS investigations of a series of Pt/C
electrocatalysts with varying particle sizes.52 The XAS data in this prior study showed
unequivocally that the imbalance of charge on the edge and step sites in these small
clusters below 20 Å results in the strong adsorption of both hydrides and oxides on the Pt
surface (depending on the potential region it is exposed to) thereby rendering the surface
largely inactive for electrocatalysis. A visual representation of the variation of the
population of various surface crystal faces as a ratio to the total number of surface atoms
is expressed as a plot with respect to overall particle size in Figure 3.4.
To visualize the effect of Cl- on Pt clusters, the Pt coordination numbers tabulated in
Table 3.1 are plotted in Figure 3.5. Without Cl- present, NPt-Pt is observed decreasing at
low and high potentials. The former has been explained29 by the desorption of H+ from
the surface while the latter is attributed to the formation of Pt-Ox species.27 In general,
adsorbed H+ (and other species in atop positions) tend to make the cluster more spherical,
which increases N by increasing the bulk to surface character of the clusters. Conversely,
adsorbed species in 3-fold positions tend to decrease N, similar to that indicated for Ox
and as we will show with Δμ for Cl-. In the presence of Cl- there is a noticeable decrease
in bulk NPt-Pt with the effect compounded as [Cl-] is increased. In 10-2M Cl- the general
downward trend in N Pt-Pt is observed, however, with some unexpected ‘bumps’ not
observed in the other electrolytes. Such phenomena are complex and will be explained in
detail later.
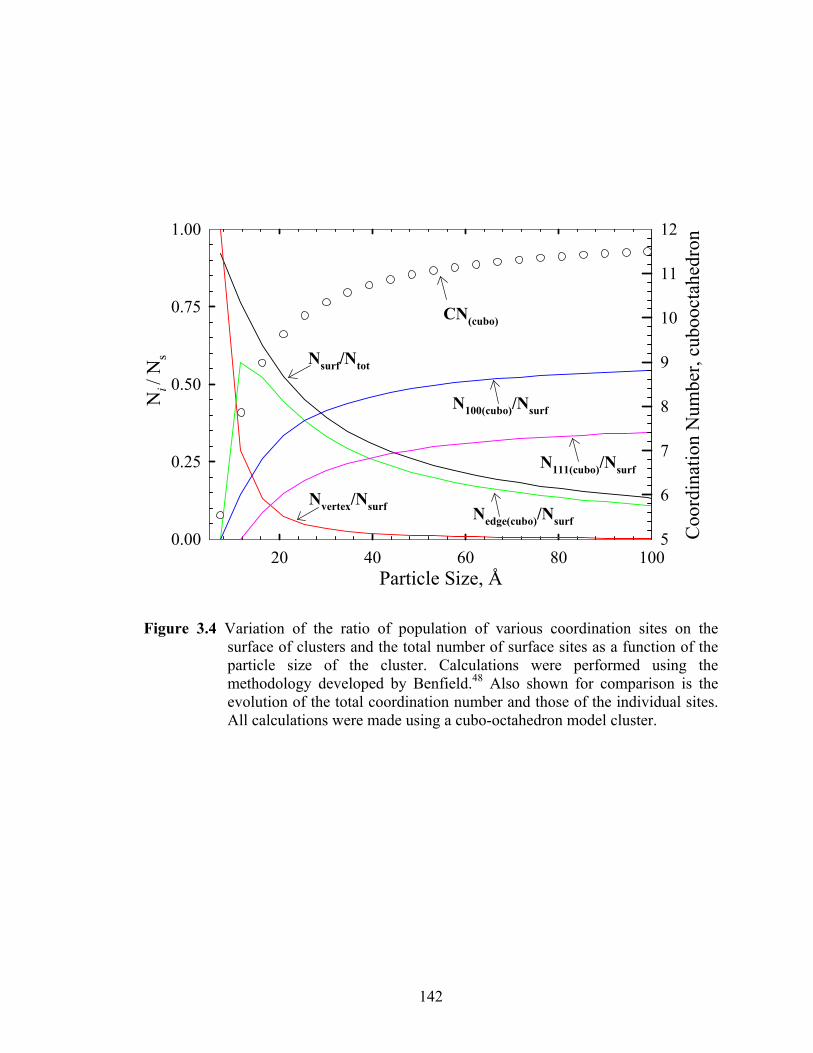
142
Figure 3.4 Variation of the ratio of population of various coordination sites on the
surface of clusters and the total number of surface sites as a function of the particle size of the cluster. Calculations were performed using the methodology developed by Benfield.48 Also shown for comparison is the evolution of the total coordination number and those of the individual sites. All calculations were made using a cubo-octahedron model cluster.
Particle Size, Å20 40 60 80 100
Ni /
Ns
0.00
0.25
0.50
0.75
1.00
Coo
rdin
atio
n N
umbe
r, cu
booc
tahe
dron
5
6
7
8
9
10
11
12
Nsurf/Ntot
Nvertex/Nsurf Nedge(cubo)/Nsurf
N100(cubo)/Nsurf
N111(cubo)/Nsurf
CN(cubo)
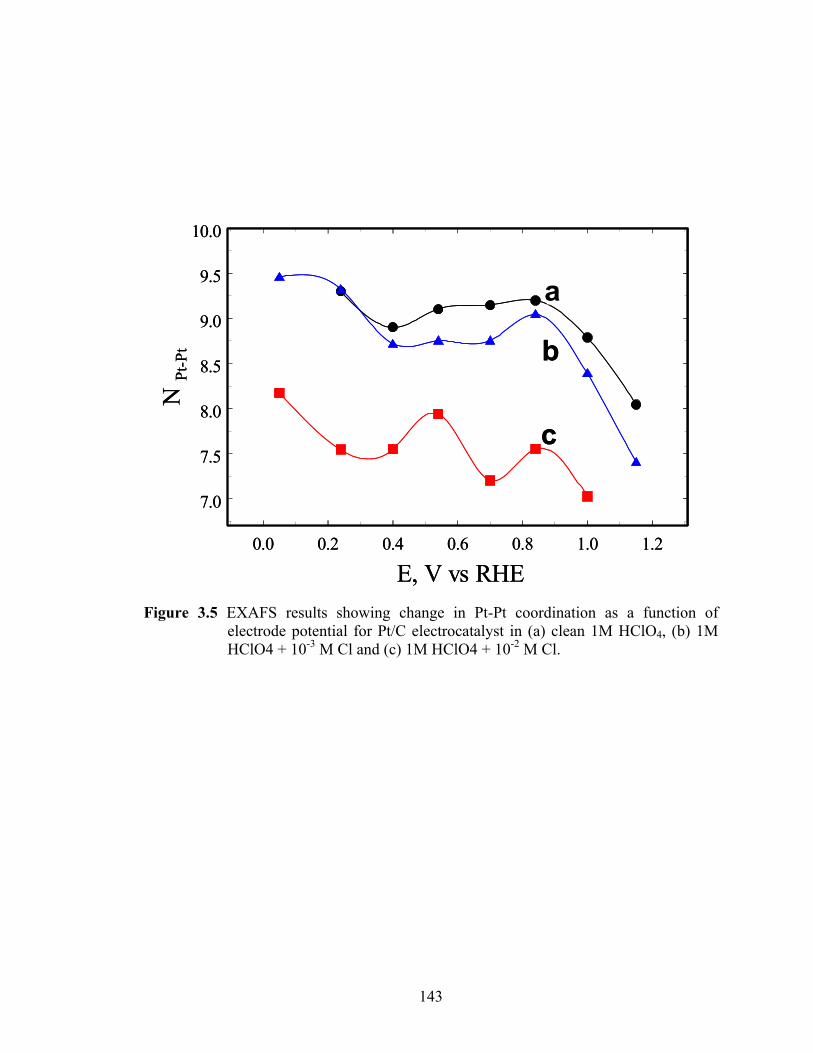
143
Figure 3.5 EXAFS results showing change in Pt-Pt coordination as a function of electrode potential for Pt/C electrocatalyst in (a) clean 1M HClO4, (b) 1M HClO4 + 10-3 M Cl and (c) 1M HClO4 + 10-2 M Cl.
0.0 0.2 0.4 0.6 0.8 1.0 1.2
E, V vs RHE
7.0
7.5
8.0
8.5
9.0
9.5
10.0
N Pt
-Pt
1M HClO410-3 M Cl10-2 M Cl
.
.a
b
c
0.0 0.2 0.4 0.6 0.8 1.0 1.2
E, V vs RHE
7.0
7.5
8.0
8.5
9.0
9.5
10.0
N Pt
-Pt
1M HClO410-3 M Cl10-2 M Cl
.
.a
b
c
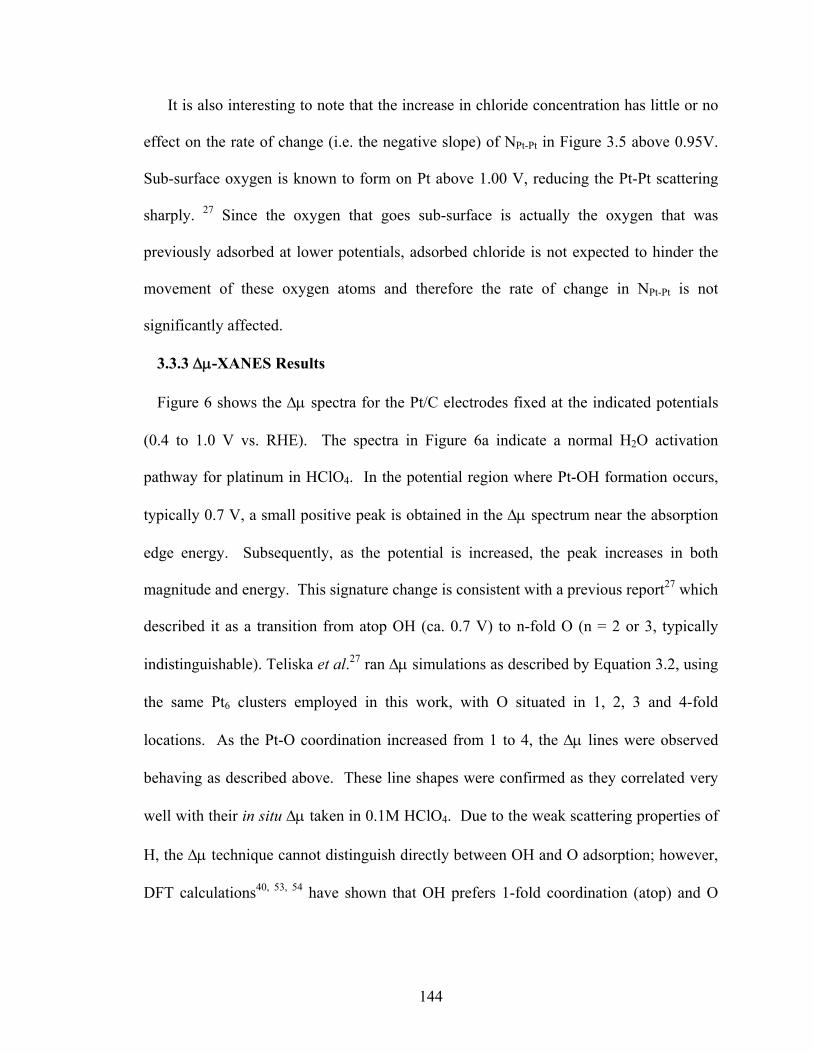
144
It is also interesting to note that the increase in chloride concentration has little or no
effect on the rate of change (i.e. the negative slope) of NPt-Pt in Figure 3.5 above 0.95V.
Sub-surface oxygen is known to form on Pt above 1.00 V, reducing the Pt-Pt scattering
sharply. 27 Since the oxygen that goes sub-surface is actually the oxygen that was
previously adsorbed at lower potentials, adsorbed chloride is not expected to hinder the
movement of these oxygen atoms and therefore the rate of change in NPt-Pt is not
significantly affected.
3.3.3 Δμ-XANES Results
Figure 6 shows the Δμ spectra for the Pt/C electrodes fixed at the indicated potentials
(0.4 to 1.0 V vs. RHE). The spectra in Figure 6a indicate a normal H2O activation
pathway for platinum in HClO4. In the potential region where Pt-OH formation occurs,
typically 0.7 V, a small positive peak is obtained in the Δμ spectrum near the absorption
edge energy. Subsequently, as the potential is increased, the peak increases in both
magnitude and energy. This signature change is consistent with a previous report27 which
described it as a transition from atop OH (ca. 0.7 V) to n-fold O (n = 2 or 3, typically
indistinguishable). Teliska et al.27 ran Δμ simulations as described by Equation 3.2, using
the same Pt6 clusters employed in this work, with O situated in 1, 2, 3 and 4-fold
locations. As the Pt-O coordination increased from 1 to 4, the Δμ lines were observed
behaving as described above. These line shapes were confirmed as they correlated very
well with their in situ Δμ taken in 0.1M HClO4. Due to the weak scattering properties of
H, the Δμ technique cannot distinguish directly between OH and O adsorption; however,
DFT calculations40, 53, 54 have shown that OH prefers 1-fold coordination (atop) and O
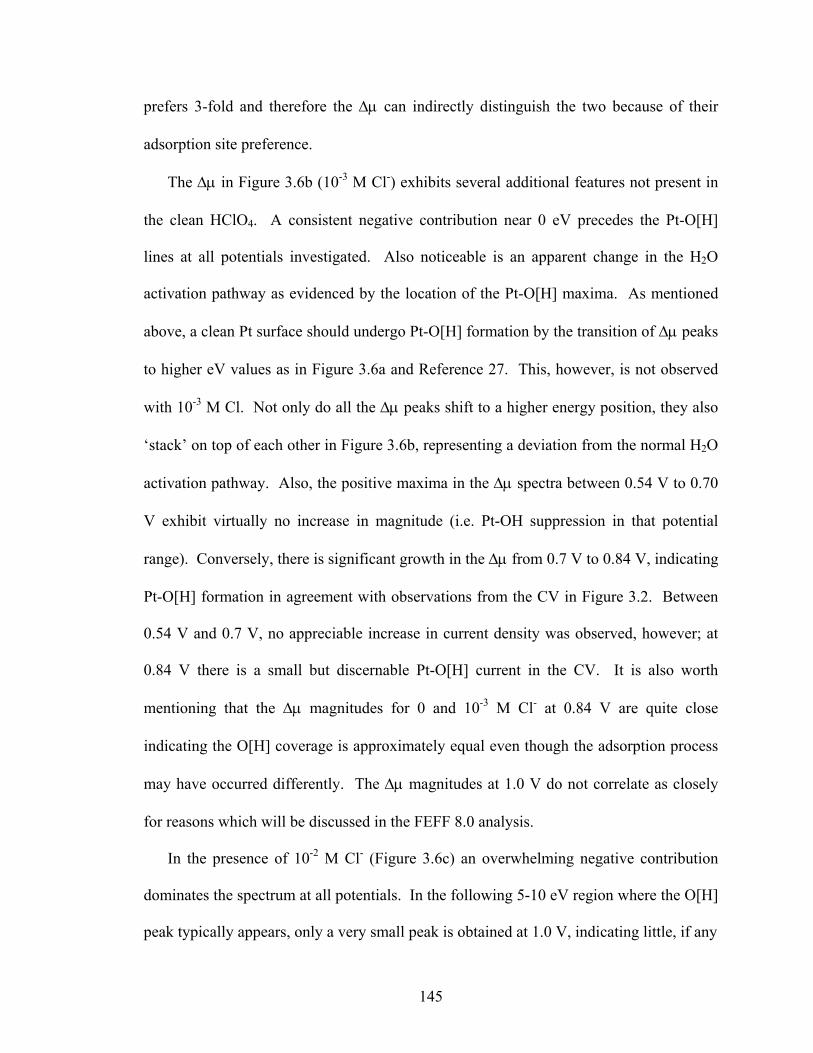
145
prefers 3-fold and therefore the Δμ can indirectly distinguish the two because of their
adsorption site preference.
The Δμ in Figure 3.6b (10-3 M Cl-) exhibits several additional features not present in
the clean HClO4. A consistent negative contribution near 0 eV precedes the Pt-O[H]
lines at all potentials investigated. Also noticeable is an apparent change in the H2O
activation pathway as evidenced by the location of the Pt-O[H] maxima. As mentioned
above, a clean Pt surface should undergo Pt-O[H] formation by the transition of Δμ peaks
to higher eV values as in Figure 3.6a and Reference 27. This, however, is not observed
with 10-3 M Cl. Not only do all the Δμ peaks shift to a higher energy position, they also
‘stack’ on top of each other in Figure 3.6b, representing a deviation from the normal H2O
activation pathway. Also, the positive maxima in the Δμ spectra between 0.54 V to 0.70
V exhibit virtually no increase in magnitude (i.e. Pt-OH suppression in that potential
range). Conversely, there is significant growth in the Δμ from 0.7 V to 0.84 V, indicating
Pt-O[H] formation in agreement with observations from the CV in Figure 3.2. Between
0.54 V and 0.7 V, no appreciable increase in current density was observed, however; at
0.84 V there is a small but discernable Pt-O[H] current in the CV. It is also worth
mentioning that the Δμ magnitudes for 0 and 10-3 M Cl- at 0.84 V are quite close
indicating the O[H] coverage is approximately equal even though the adsorption process
may have occurred differently. The Δμ magnitudes at 1.0 V do not correlate as closely
for reasons which will be discussed in the FEFF 8.0 analysis.
In the presence of 10-2 M Cl- (Figure 3.6c) an overwhelming negative contribution
dominates the spectrum at all potentials. In the following 5-10 eV region where the O[H]
peak typically appears, only a very small peak is obtained at 1.0 V, indicating little, if any
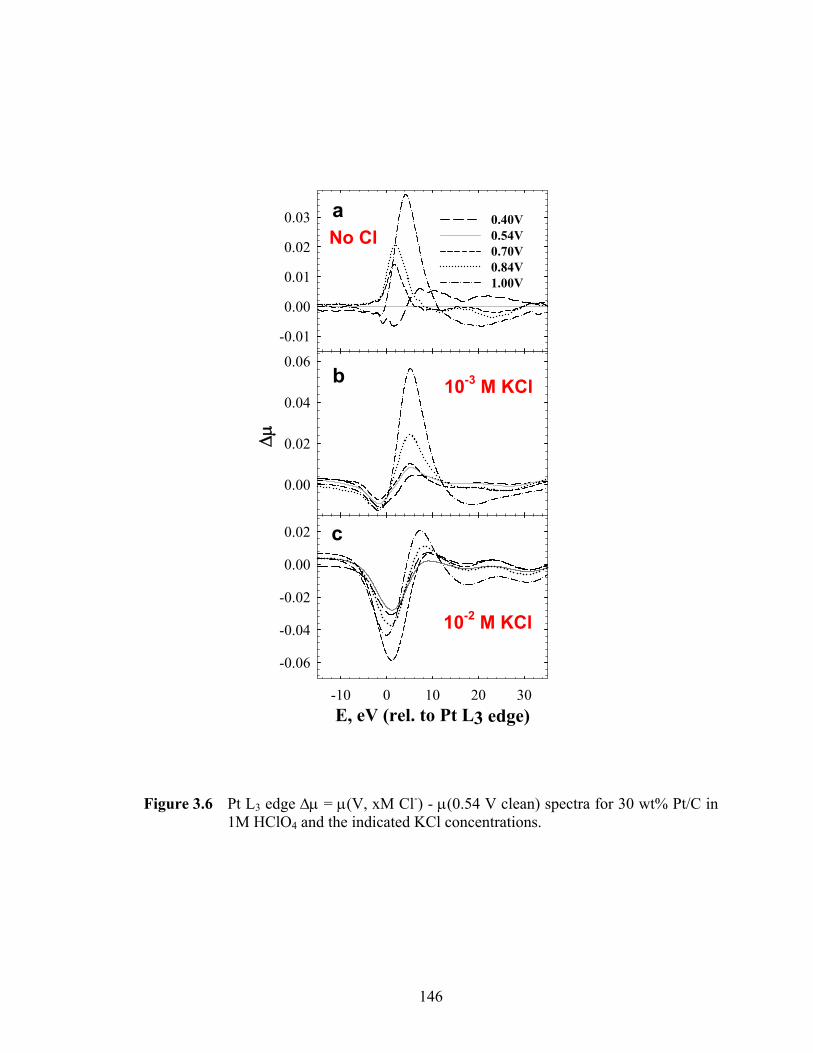
146
Figure 3.6 Pt L3 edge Δμ = μ(V, xM Cl-) - μ(0.54 V clean) spectra for 30 wt% Pt/C in 1M HClO4 and the indicated KCl concentrations.
0.00
0.02
0.04
0.06
-0.01
0.00
0.01
0.02
0.03 0.40V0.54V0.70V0.84V1.00V
E, eV (rel. to Pt L3 edge)-10 0 10 20 30
-0.06
-0.04
-0.02
0.00
0.02
Δμ
a
b
c
No Cl
10-3 M KCl
10-2 M KCl
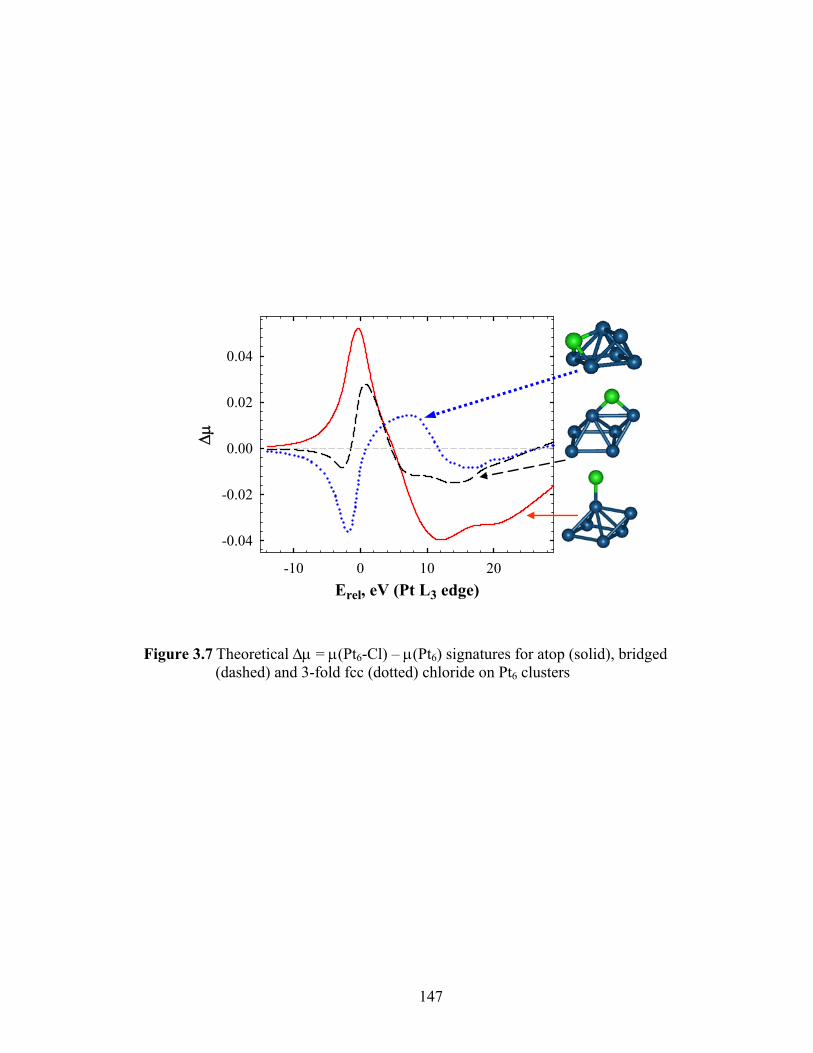
147
Figure 3.7 Theoretical Δμ = μ(Pt6-Cl) – μ(Pt6) signatures for atop (solid), bridged (dashed) and 3-fold fcc (dotted) chloride on Pt6 clusters
Erel, eV (Pt L3 edge)-10 0 10 20
Δμ
-0.04
-0.02
0.00
0.02
0.04
Erel, eV (Pt L3 edge)-10 0 10 20
Δμ
-0.04
-0.02
0.00
0.02
0.04
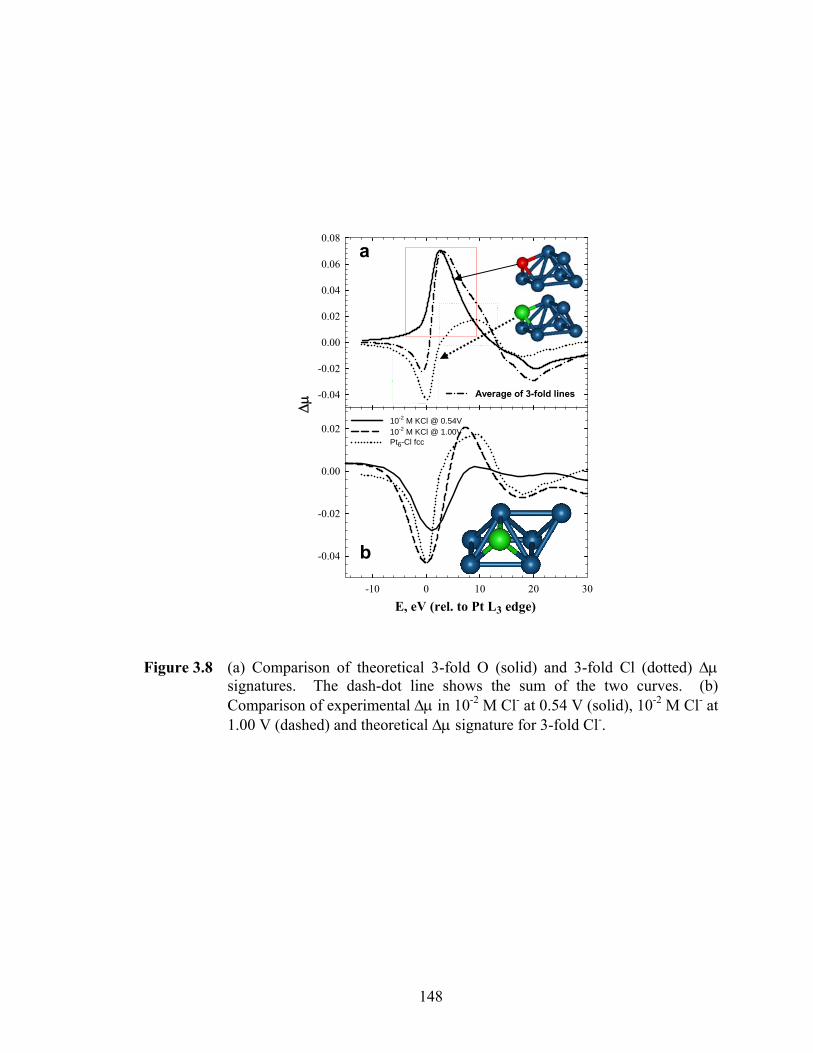
148
Figure 3.8 (a) Comparison of theoretical 3-fold O (solid) and 3-fold Cl (dotted) Δμ signatures. The dash-dot line shows the sum of the two curves. (b) Comparison of experimental Δμ in 10-2 M Cl- at 0.54 V (solid), 10-2 M Cl- at 1.00 V (dashed) and theoretical Δμ signature for 3-fold Cl-.
E, eV (rel. to Pt L3 edge)-10 0 10 20 30
Δμ
-0.04
-0.02
0.00
0.0210-2 M KCl @ 0.54V10-2 M KCl @ 1.00VPt6-Cl fcc
-0.04
-0.02
0.00
0.02
0.04
0.06
0.08
Average of 3-fold lines
a
b
E, eV (rel. to Pt L3 edge)-10 0 10 20 30
Δμ
-0.04
-0.02
0.00
0.0210-2 M KCl @ 0.54V10-2 M KCl @ 1.00VPt6-Cl fcc
-0.04
-0.02
0.00
0.02
0.04
0.06
0.08
Average of 3-fold lines
a
b
149
O[H] adsorption occurs. This again is confirmed by inspection of the CV in Figure 3.2.
The small bump on the anodic sweep is almost nonexistent in 10-2 M Cl- at 0.84 V, and at
1.0V only a miniscule current density is achieved. This dip in the Δμ spectra for 10-3 and
10-2 M Cl- seems to suggest the line shape for Cl- adsorption is a negative peak near the
edge; however, definitive adsorption site conclusions cannot be made until theoretical
simulations by FEFF 8.0 are discussed below.
In the case of 10-3 M chloride the adsorption geometry is not as obvious as it was in
10-2 M Cl-. The theoretical Δμ line shapes suggest bridge bonded adsorption; however,
we interpret the spectra to be a combination of H2O activation (hence presence of surface
oxides) and 3-fold Cl- adsorption occurring concurrently. There is direct evidence of both
chloride and O[H] adsorption in the Δμ. To illustrate this, Figure 8a shows the FEFF 8.0
Δμ simulations for 3-fold O and 3-fold Cl- with boxes to emphasize the major elements of
each adsorbing species. Both Pt6 clusters show 3-fold adsorption of chloride and O[H]
with vastly different Δμ signatures. The dash-dot line, showing the sum of 3-fold Δμ
theory exhibits an astonishing likeness to the experimental data in 10-3 M chloride. This
is, in our opinion, the best evidence indicating 3-fold chloride adsorption occurring in
parallel with 3-fold O[H] formation.
3.3.4 The 0.4 - 0.7 V region
Perhaps the most interesting potential region in Figure 3.5 lies between 0.40 and 0.84 V.
This region is scrutinized in greater detail because it is within the operating range of most
fuel cells and therefore is as significant as the region at higher potentials. This potential
region is where adsorption and rearrangements occur in the Cl- overlayer. Further, it is
the potential region where the more reactive Pt (100) planes plus the corners, steps and
150
edges catalyze water activation and become covered with OH. We discuss Cl- adsorption
and water activation in separate sections below.
3.3.5 Chloride adsorption and rearrangement
It is reasonable to estimate relative surface Cl- coverage changes based on the Δμ peak
amplitudes as was done previously,26, 27 even though absolute monolayer coverage values
are much more difficult to obtain. In Figure 3.9 we use the absolute value of the negative
going Δμ located near 1 eV as it has been shown to reflect 3-fold Cl-. The Δμ at
potentials less than 0.40 V were excluded here as the Pt-H and Pt-Cl Δμ signatures are
too similar, making them impossible to distinguish. Figure 3.9 also includes previously
published data55 estimating Br coverage on a single crystal Pt (111) face in 0.01 M Br,
the Pt-Cl Gibbs Free Energy (ΔGPt-Cl) reflecting the Pt- Cl bond strength as well as the
EXAFS NPt-Pt results from Figure 3.5. Although a similar plot of Cl- coverage would be
preferable, we are not aware of such data, although Lucas et al.17 have reported the
coverage of Cl- on Pt(111) at 0.25 V and 0.7 V as indicated in Figure 3.9. Note the
dramatic increase in Br coverage exactly in the region where the adsorbed H is known to
leave. This is entirely consistent with our reduced NPt-Pt values as noted in Figure 3.5, and
significant increase in Δμ magnitude already evident at 0.4 V as shown. Above 0.25 V,
the Br coverage continues to increase with potential but at a much slower rate, and this is
believed to occur because of a “continuous compression of the Br adlayer” producing a
partially disordered or incommensurate adlayer on the Pt(111) surface,5 occurring in the
region between 0.30-0.55 V. Such compression will move some of the halide ions into
bridged and atop sites. This is the probable cause for the reduction in apparent Cl-
coverage as suggested by the Δμ results between 0.3-0.5V. Note that in Figure 3.7, the
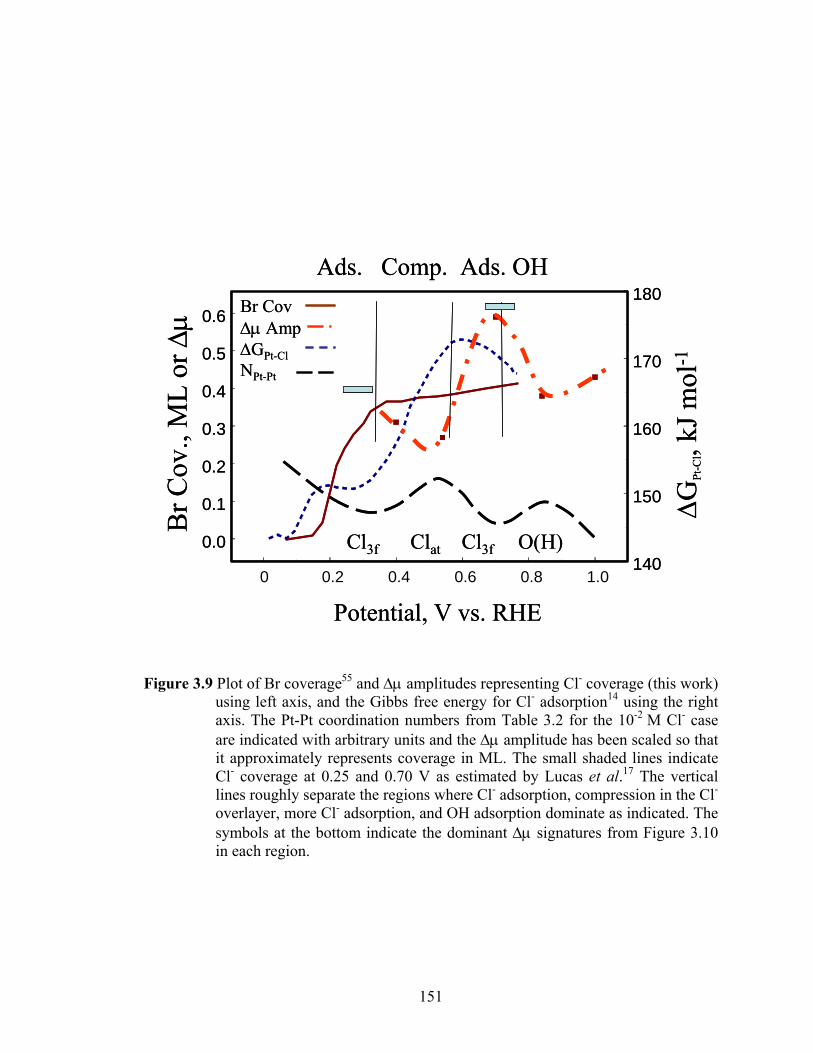
151
Figure 3.9 Plot of Br coverage55 and Δμ amplitudes representing Cl- coverage (this work) using left axis, and the Gibbs free energy for Cl- adsorption14 using the right axis. The Pt-Pt coordination numbers from Table 3.2 for the 10-2 M Cl- case are indicated with arbitrary units and the Δμ amplitude has been scaled so that it approximately represents coverage in ML. The small shaded lines indicate Cl- coverage at 0.25 and 0.70 V as estimated by Lucas et al.17 The vertical lines roughly separate the regions where Cl- adsorption, compression in the Cl- overlayer, more Cl- adsorption, and OH adsorption dominate as indicated. The symbols at the bottom indicate the dominant Δμ signatures from Figure 3.10 in each region.
0 200 400 600 800 1000
0.0
0.1
0.2
0.3
0.4
0.5
0.6
140
150
160
170
180
Potential, V vs. RHE
Br C
ov.,
ML
or Δ
μ
ΔGPt
-Cl, k
J mol
-1
Ads. Comp. Ads. OH Br CovΔμ AmpΔGPt-ClNPt-Pt
Cl3f Clat Cl3f O(H) 0 0.2 0.4 0.6 0.8 1.0 0 200 400 600 800 1000
0.0
0.1
0.2
0.3
0.4
0.5
0.6
140
150
160
170
180
Potential, V vs. RHE
Br C
ov.,
ML
or Δ
μ
ΔGPt
-Cl, k
J mol
-1
Ads. Comp. Ads. OH Br CovΔμ AmpΔGPt-ClNPt-Pt
Cl3f Clat Cl3f O(H) 0 0.2 0.4 0.6 0.8 1.0
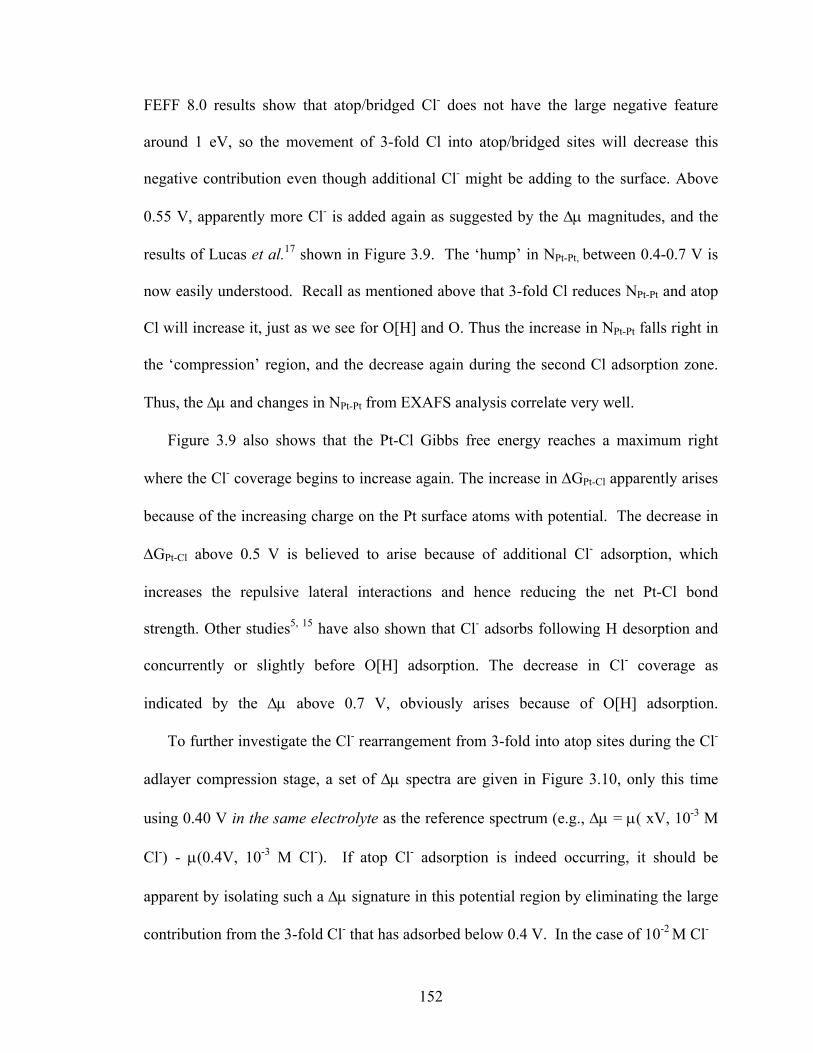
152
FEFF 8.0 results show that atop/bridged Cl- does not have the large negative feature
around 1 eV, so the movement of 3-fold Cl into atop/bridged sites will decrease this
negative contribution even though additional Cl- might be adding to the surface. Above
0.55 V, apparently more Cl- is added again as suggested by the Δμ magnitudes, and the
results of Lucas et al.17 shown in Figure 3.9. The ‘hump’ in NPt-Pt, between 0.4-0.7 V is
now easily understood. Recall as mentioned above that 3-fold Cl reduces NPt-Pt and atop
Cl will increase it, just as we see for O[H] and O. Thus the increase in NPt-Pt falls right in
the ‘compression’ region, and the decrease again during the second Cl adsorption zone.
Thus, the Δμ and changes in NPt-Pt from EXAFS analysis correlate very well.
Figure 3.9 also shows that the Pt-Cl Gibbs free energy reaches a maximum right
where the Cl- coverage begins to increase again. The increase in ΔGPt-Cl apparently arises
because of the increasing charge on the Pt surface atoms with potential. The decrease in
ΔGPt-Cl above 0.5 V is believed to arise because of additional Cl- adsorption, which
increases the repulsive lateral interactions and hence reducing the net Pt-Cl bond
strength. Other studies5, 15 have also shown that Cl- adsorbs following H desorption and
concurrently or slightly before O[H] adsorption. The decrease in Cl- coverage as
indicated by the Δμ above 0.7 V, obviously arises because of O[H] adsorption.
To further investigate the Cl- rearrangement from 3-fold into atop sites during the Cl-
adlayer compression stage, a set of Δμ spectra are given in Figure 3.10, only this time
using 0.40 V in the same electrolyte as the reference spectrum (e.g., Δμ = μ( xV, 10-3 M
Cl-) - μ(0.4V, 10-3 M Cl-). If atop Cl- adsorption is indeed occurring, it should be
apparent by isolating such a Δμ signature in this potential region by eliminating the large
contribution from the 3-fold Cl- that has adsorbed below 0.4 V. In the case of 10-2 M Cl-
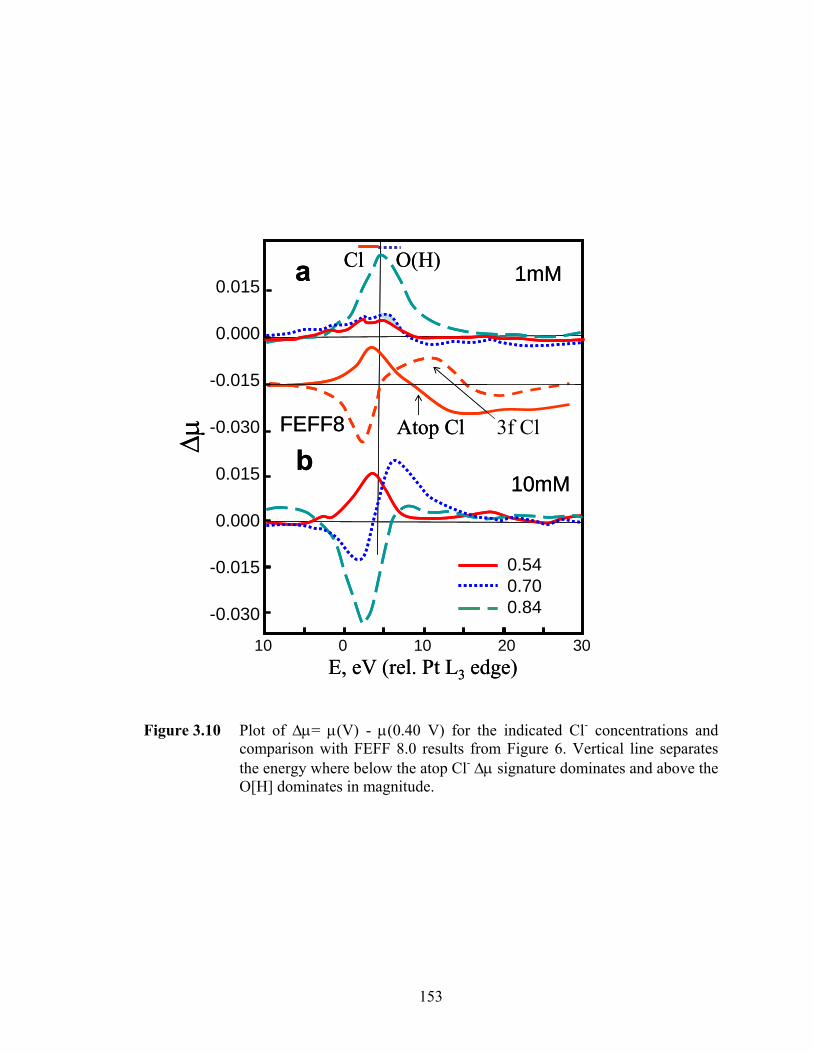
153
Figure 3.10 Plot of Δμ= μ(V) - μ(0.40 V) for the indicated Cl- concentrations and comparison with FEFF 8.0 results from Figure 6. Vertical line separates the energy where below the atop Cl- Δμ signature dominates and above the O[H] dominates in magnitude.
Atop Cl
Cl O(H)
E, eV (rel. Pt L3 edge)
0.015
0.000
-0.015
-0.030
0.015
0.000
-0.015
-0.030
10 0 10 20 30
10mM
1mM
Δμ
0.540.700.84
3f ClFEFF8
a
bAtop Cl
Cl O(H)
E, eV (rel. Pt L3 edge)
0.015
0.000
-0.015
-0.030
0.015
0.000
-0.015
-0.030
10 0 10 20 30
10mM
1mM
Δμ
0.540.700.84
3f ClFEFF8
a
b
154
(Figure 3.10b), the Δμ signature clearly indicates the addition of atop Cl- at 0.54 V and 3-
fold Cl- at 0.70 V. This is again consistent with our discussion of Figure 3.9. The line
shape at 0.84 V reflects the adsorption of O[H] along with a small amount of additional
Cl-.
Examination of Figure 3.10a for the 10-3 M Cl- is also revealing. The Δμ spectra at
0.54 and 0.70 V reflect primarily atop Cl- combined with some atop O[H]. The signature
for atop Cl- and O[H] are very similar, but that for atop Cl- is shifted to lower energy by
approximately 5 eV. This is confirmed by the comparison of the Δμ signature from
Figure 10b for 10-2M at 0.54 V, which is believed to reflect entirely atop Cl- without any
adsorbed O[H]. One can then detect a small amount of O[H] present at 0.70 V in 10-3 M
Cl- (shaded area in Figure 3.10a that is not present at 0.54 V. This also explains the large
amplitudes of the Δμ signatures in Figure 3.6b for the 10-3M Cl-; amplitudes larger than
those in Figure 3.6a without Cl-. Seemingly both atop Cl- and O[H] are adsorbing
together at all potentials above 0.54 V. Comparison of the CVs in Figure 3.2 and the NPt-
Pt curves in Figure 3.5 both show that even the 10-3M Cl- has a harmful effect on the
adsorption of OH below 0.8 V, so indeed we suspect that the Δμ curves in Figure 3.6a
reflect primarily atop Cl-, not O[H] (the one at 0.84 V may reflect about equal amounts of
each). Further, since the NPt-Pt changes well below 0.84 V reflects adsorption more at the
corners/edges than on the Pt(111), this indeed provides evidence that O[H] cannot
displace Cl- at the corners/edges until about 200 mV higher than normal, just as on the
Pt(111) planes.
3.3.6 Water activation on low index Pt planes, corners and edges
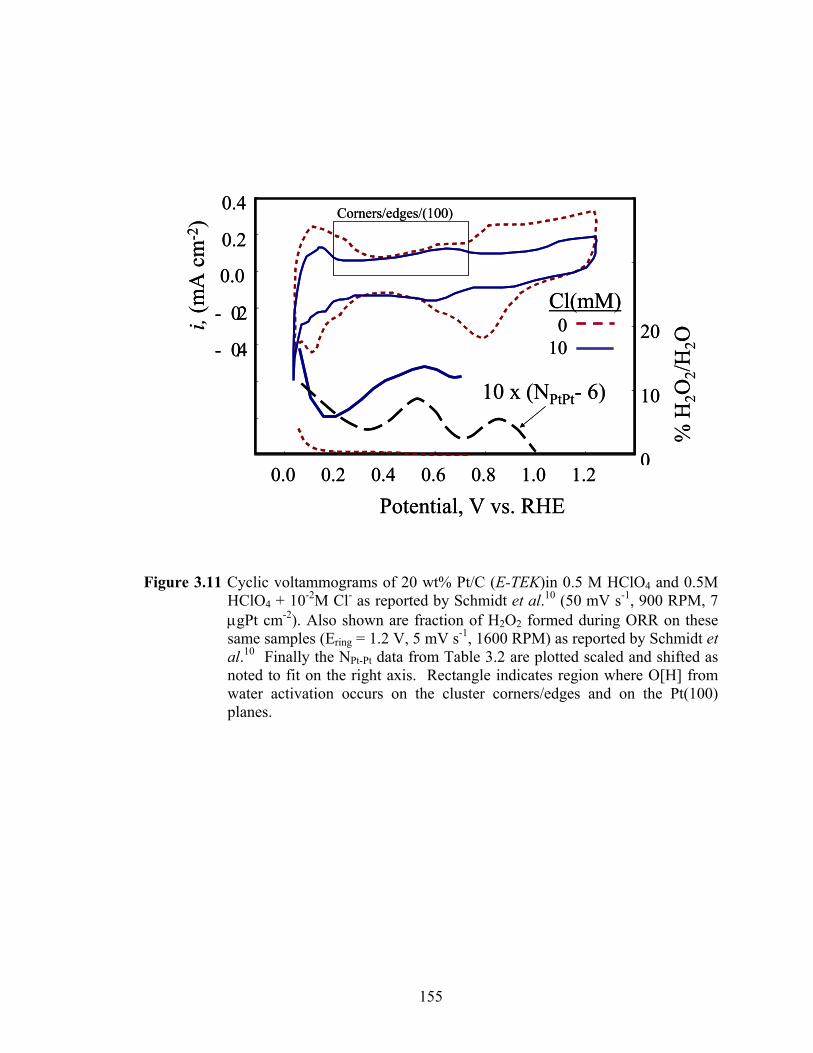
155
Figure 3.11 Cyclic voltammograms of 20 wt% Pt/C (E-TEK)in 0.5 M HClO4 and 0.5M HClO4 + 10-2M Cl- as reported by Schmidt et al.10 (50 mV s-1, 900 RPM, 7 μgPt cm-2). Also shown are fraction of H2O2 formed during ORR on these same samples (Ering = 1.2 V, 5 mV s-1, 1600 RPM) as reported by Schmidt et al.10 Finally the NPt-Pt data from Table 3.2 are plotted scaled and shifted as noted to fit on the right axis. Rectangle indicates region where O[H] from water activation occurs on the cluster corners/edges and on the Pt(100) planes.
0.0 0.2 0.4 0.6 0.8 1.0 1.2 1.4
-0.8
-0.6
- 0.4
- 0.2
0.0
0.2
0.4
0
10
20
30
40i,
(mA
cm-2
)
% H
2O2/H
2O
010
Cl(mM)
10 x (NPtPt- 6)
Corners/edges/(100)
Potential, V vs. RHE0.0 0.2 0.4 0.6 0.8 1.0 1.2 1.4
-0.8
-0.6
- 0.4
- 0.2
0.0
0.2
0.4
0
10
20
30
40i,
(mA
cm-2
)
% H
2O2/H
2O
010
Cl(mM)
10 x (NPtPt- 6)
Corners/edges/(100)
Potential, V vs. RHE
156
Previous studies regarding Cl- adsorption on larger Pt clusters as summarized in Figure
3.11 shed light on the interplay between O[H] and Cl- on the different cluster planes. 10
In pure 1M HClO4, and in 1M HClO4 + 10-2 M Cl-, the CVs reveal a feature in the 0.4 -
0.7 V region. Note that the Pt/C electrocatalysts in Figure 3.11 have an average particle
size of 30 Å, which according to correlation with the cubo-octahedron model indicates
significant presence of Pt(100) sites (Table 3.2). Since the Pt-Cl interaction on lower
coordinated Pt atoms at the corners and edges, as well as on the more open Pt(100)
surface, is known to be stronger than on the Pt(111) faces5, these more reactive sites are
expected to be covered with Cl- well below 0.70 V. However, also note that the second
rise in the CV, beyond 0.70 V, doesn’t occur until higher potentials in the presence of 10-
3 M Cl-. It should be apparent that OH can displace Cl- on the Pt (100) faces and
corners/edges but not so easily on the Pt(111) faces.
Also shown in Figure 3.11, the production of H2O2, which occurs when the O2
dissociation is partially obstructed forcing it to adsorb end-on, clearly sharply increases in
the 0.4-0.7 V region when compared with the absence of Cl-. This indicates that OH
coming from water activation can displace Cl- on the Pt sites such as Pt (100) but O2
during ORR cannot.
Figure 3.11 also shows NPt-Pt for the 10-2 M Cl- concentration from Figure 3.5 to
emphasize the different behavior between NPt-Pt and the CV in this region where the
feature is much broader. Therefore, we conclude that O[H] adsorbing on the
corners/edges and Pt(100) sites in this region in 10-2 M Cl- is not believed to be the cause
of the ‘hump’ in NPt-Pt, but rather the compression of the Cl- adlayer on the Pt(111) faces
and corners/edges as discussed above.
157
3.3.7 Interplay of bisulfate and halide ions on Pt
The results above reveal the interaction between adsorption of O[H] and Cl- and its
dependence on the Pt adsorption site. A comparative study of the interplay between other
anions can provide further insight. Here, we will extend our findings with some recently
published results45 to understand the complex scenario of competing adsorption among
other commonly found anions. Of particular interest are some recent findings involving
Cl- and Br poisoning of Pt surfaces in both HClO4 and H2SO4. While studies performed in
H2SO4 are disadvantageous in the sense that the problem is complicated due to bisulfate
adsorption, they nevertheless furnish information on how bisulfate behaves in an
environment containing both Cl- and O[H]. Although these results are by no means new,
it is our intent to offer an alternative interpretation than that offered by Zolfaghari et al.45
as their paper made no mention of bisulfate adsorption throughout their discussion.
Figure 3.12 shows a re-creation of Electrochemical Quartz Crystal Nanobalance (EQCN)
results from their experiments involving Cl- and Br adsorption in H2SO4. The
representation of the data we present is different from that in their manuscript for the sake
of clarity. Two sets of curves are shown indicating the mass-frequency response in
H2SO4, used here for a standard/reference, with that in the presence of Cl- and Br under
various concentrations. Sulfuric acid furnishes bisulfate ions that adsorb weakly on the
surface and thus should be expected to increase the mass density of adsorbate. The onset
of oxide formation is indicated by a change of slope in the curve, and occurs around 0.80
V. In the presence of chloride, we observe that as the concentration of chloride in
solution increases, the amount of total mass on the surface decreases. This can only occur
as a result of bisulfate anion desorption.
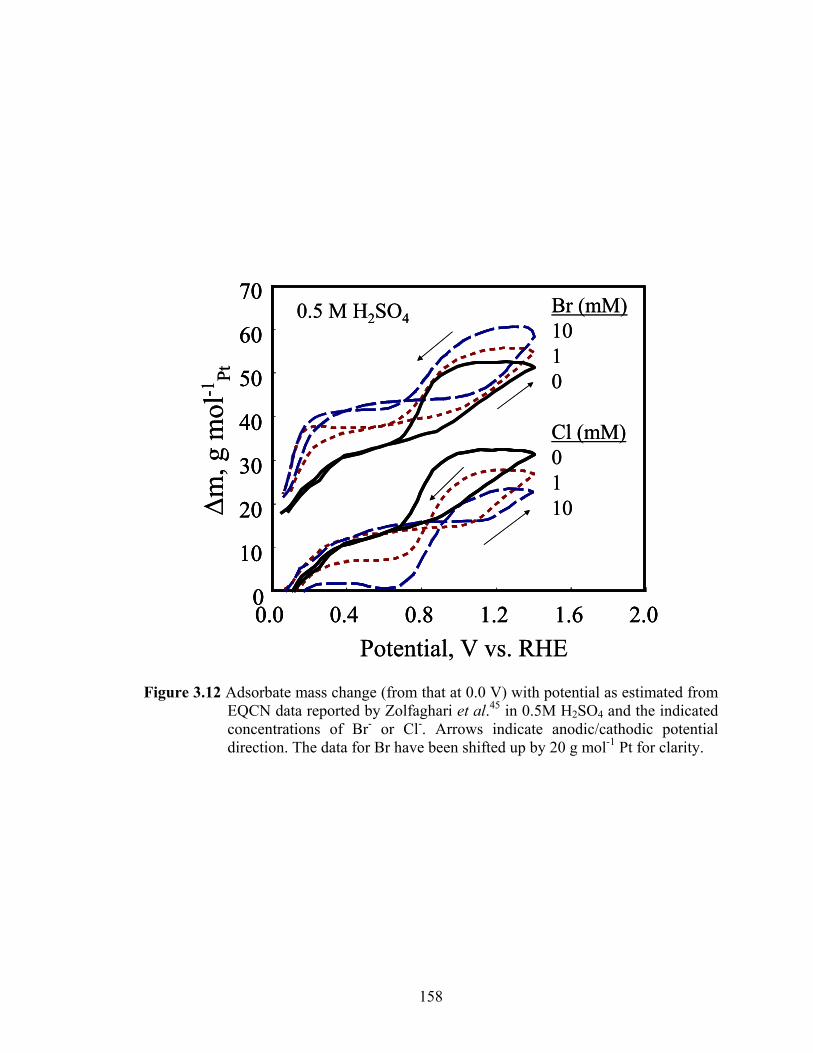
158
Figure 3.12 Adsorbate mass change (from that at 0.0 V) with potential as estimated from EQCN data reported by Zolfaghari et al.45 in 0.5M H2SO4 and the indicated concentrations of Br- or Cl-. Arrows indicate anodic/cathodic potential direction. The data for Br have been shifted up by 20 g mol-1 Pt for clarity.
Potential, V vs. RHE
Δm, g
mol
-1Pt
Br (mM)1010
Cl (mM)0110
0.5 M H2SO4
0.0 0.4 0.8 1.2 1.6 2.00
10
20
30
40
50
60
70
Potential, V vs. RHE
Δm, g
mol
-1Pt
Br (mM)1010
Cl (mM)0110
0.5 M H2SO4
0.0 0.4 0.8 1.2 1.6 2.00
10
20
30
40
50
60
70
0.0 0.4 0.8 1.2 1.6 2.00
10
20
30
40
50
60
70
159
For the ensuing discussion, the following approximations are made with respect to
mass density. The mass of adsorbate/mole Pt-atom is approximately 18 for O2-/OH-, 50
for HSO4-, 36 for Cl- and 80 for Br-. These mass densities assume one Cl- and one Br
anion per surface Pt, ½ bisulfate per Pt atom, and 1.5 O per Pt. The results can then
easily be accounted for by assuming Cl-, which has a smaller mass density, adsorbs more
strongly than bisulfate. Thus, on displacing bisulfate, the overall mass decreases with
increasing Cl- concentration, as the heavier bisulfate leaves the surface for the lighter,
more strongly bound chloride ions. Since Br ion is heavier, the mass density increases
with Br concentration.
These curves clearly indicate that not all of the halide anions are displaced from the
surface by O even at 1.4 V, because if that were the case, the resulting curves at 1.4 V
should fall at the same place with whatever the O mass density was at that point. Some
disagreement on this point has occurred in the literature,45 however, Figure 3.12 makes
clear that the halides remain in part on the surface all the way up to 1.4 V.
Figure 3.12 reveals a very interesting difference between Br and Cl- adsorption
relative to the bisulfate; Cl- shows a hystersis effect in the region between 0.3-0.8 V,
while Br does not. In the case of the Cl-, during the anodic sweep the mass density is
independent of the Cl- concentration which indicates that bisulfate is on the surface.
However, during the cathodic sweep the mass density changes as expected with Cl-
concentration suggesting the presence of Cl- ion. The adsorption of a bisulfate/water
adlayer is known to give rise to the “butterfly” feature in CV curves Pt(111) single
crystals. Apparently, Cl- is not able to penetrate this adlayer until it is disrupted by O
adsorption at higher potentials. Then, during the cathodic sweep the Cl- ions re-adsorb
160
and bisulfate is not able to displace the adsorbed Cl-. This effect seemingly does not
occur in mixed Br/H2SO4 electrolytes as Br adsorption occurs so strongly that it can
displace the bisulfate either way.
This interpretation of EQCN data also calls into question the conclusions reached
more recently by Yadav et al.56 They report similar EQCN results for halide ions in
H2SO4. They also report analogous hysteresis effects in the case of Cl- and attributed it to
Pt dissolution. While we cannot rule out some Pt dissolution during potential cycling,
clearly the effects of bisulfate adsorption should not be ignored; otherwise the extent of
Pt dissolution can be grossly over-estimated.
3.4 Summary and Conclusions
The combination of in situ X-ray absorption spectroscopy, and electrochemical
measurements (CV and RDE), and previously published EQCN data has provided further
understanding of the nature of chloride poisoning on different faces/sites of platinum
catalysts in acidic medium (HClO4). The sensitivity to anion adsorption effects of the Δµ
XANES procedure is clear. In this work, Cl- ions produced a direct contribution to the
Δμ in contrast to that found previously for bisulfate which did not appear in the Δμ,
unless OH or other adsorbates were co-adsorbed on the surface to force the bisulfate
anions into site-specific binding.
To the best of our knowledge, this is the first study to provide conclusive evidence for
the site-specific 3-fold adsorption of chloride species on Pt(111) faces in a working fuel
cell environment, though the compression of the Cl- adlayer, which apparently forces
some Cl- into atop/bridge sites between 0.40-0.55V, also occurs. The adsorbed chloride
on the Pt(111) faces at the investigated concentrations (10-3 and 10-2 M) are believed to
161
be adsorbed in equilibrium; i.e. Cl- + Pt → Cl-/Pt at nearly all potentials consistent with
our Δμ results and Figure 3.9. At 10-2 M halide concentration, the coverage at 0.3V
appears to be around 0.35-0.4 ML for both Br and Cl-. This probably occurs because at
this low potential the halide ions are still highly negatively charged, so that the large
Coulomb lateral interactions keep the coverage small in both cases. As the magnitude of
the halide ion charge decreases with potential, the Coulombic lateral interactions
decrease, enabling some compression of the adlayers. In the case of the Cl-, the smaller
covalent radius then enables a great deal more 3-fold Cl- to adsorb between 0.5 and 0.7V;
in Br this apparently cannot occur because of the much larger covalent radius.
Somewhat surprisingly, NPt-Pt found from the EXAFS analysis is also quite dependent
upon Cl- adsorption. Chloride adsorption into the 3-fold sites decreases NPt-Pt, similar to
that found previously for 3-fold O adsorption,27 and clearly arises because of the
proximity of the Cl- anion partially in between the Pt atoms. In contrast, atop Cl-
adsorption increases NPt-Pt, and rearrangement of some Cl- atoms into atop sites between
0.40-0.55V is therefore also evident from NPt-Pt. The change of NPt-Pt with potential
therefore reveals the nature of the adsorption, atop vs. 3-fold Cl- and O[H].
The interplay of anionic (Cl-, Br-, OH-, and HSO4-) adsorption on the different
surfaces of Pt are indeed complex as the results summarized in Table 3.3 indicate. For
example, we find that O[H] can displace atop chloride on the Pt(100) faces, but not on the
Pt(111) faces as well as corners and edges until much higher potentials than without
chloride. Chloride also drastically alters the ORR causing an increase of the overpotential
by approximately 85 mV for every 10-fold increase in Cl- concentration with a total 150-
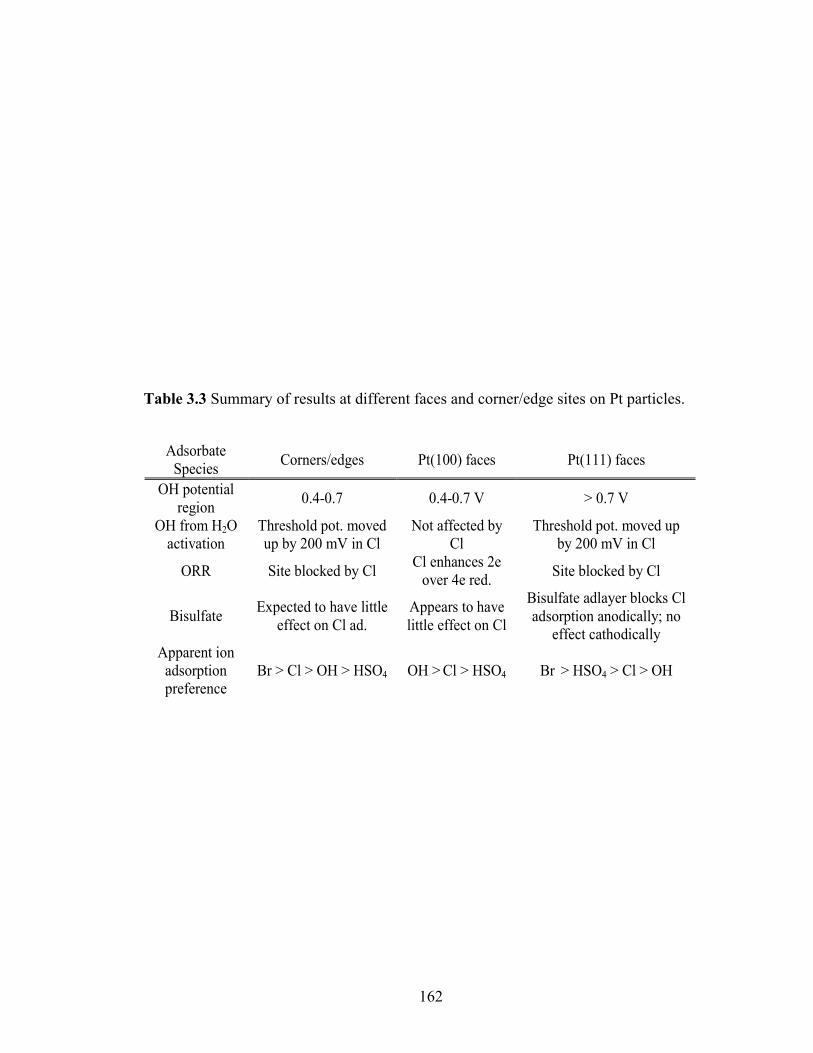
162
Table 3.3 Summary of results at different faces and corner/edge sites on Pt particles.
Adsorbate
Species Corners/edges Pt(100) faces Pt(111) faces
OH potential region 0.4-0.7 0.4-0.7 V > 0.7 V
OH from H2O activation
Threshold pot. moved up by 200 mV in Cl
Not affected by Cl
Threshold pot. moved up by 200 mV in Cl
ORR Site blocked by Cl Cl enhances 2e over 4e red. Site blocked by Cl
Bisulfate Expected to have little effect on Cl ad.
Appears to have little effect on Cl
Bisulfate adlayer blocks Cl adsorption anodically; no
effect cathodically Apparent ion
adsorption preference
Br > Cl > OH > HSO4 OH > Cl > HSO4 Br > HSO4 > Cl > OH

163
200 mV increase in the overpotential at large concentrations at the Pt(111) sites. In
contrast, Cl- appears to force the ORR to the undesirable 2-electron reduction (peroxide
production) at the corner/edge sites. It is well known that peroxide production occurs
when the nearby surface is crowded thus making it difficult for the O2- intermediate to
“tip over” and result in dissociation of the O2 bond. Although we did not directly study
bisulfate adsorption in this work, a reinterpretation of the EQCN results shed further light
on the interplay between Cl- and Br vs. bisulfate. It seems obvious that Cl- ions cannot
displace the bisulfate-water adlayer formed on Pt(111) planes after it is formed at lower
potentials, however, once the bisulfate is disturbed at higher potentials, it cannot displace
the adsorbed Cl-. On the other hand the Br ion is able to displace bisulfate at lower
potentials in the anodic direction.
The relative order of the Pt-X adsorption preferences indicated in Table 3.3 at the
different binding sites is suggested by the results and discussion above as well as
previous results summarized by Markovic et al.5 They should be taken as only very
qualitative and phenomenological, but they do give some insight into the complex
interplay of anion adsorption occurring at different sites in an electrochemical cell.
Markovic et al.5 concluded that on nearly all low-index surfaces the adsorbate-Pt
interactions increase in the order HSO4 < Cl < Br. They further indicated that for the
halides the Pt-X interaction was stronger on the Pt(100) faces than on the Pt(111) faces,
but that the bisulfate interactions went in the opposite direction (Pt(111) < Pt(100)). In
contrast, the EQCN results suggest that the Pt-bisulfate interaction is in fact stronger than
the Pt-Cl on the Pt(111) faces. Further, although both the Pt-halide and Pt-OH
interactions are stronger on the corners/edges and Pt(100) sites than on the Pt(111) sites,
164
the difference is much stronger for the Pt-OH interaction (70-80 kJ mole-1)5 so that of the
adsorbates studied, the Pt-OH interaction is apparently the strongest on the Pt(100) faces,
and the weakest on the Pt(111) faces while intermediate on the corners/edges.
These relative interaction strengths indicated here should help to explain the different
dependencies of the important ORR reaction on anion adsorption, and suggests that the
effect of Cl- poisoning might be quite dependent on the particle size, as the relative
number of corner/edge sites to Pt (111) face sites changes with particle size. Markovic et
al.5 have already given an extensive review of some these effects on low index single
crystal faces, but not on real nanoparticle-sized catalysts.
3.5 Acknowledgments
Financial support for this effort was provided by the Army Research Office via both a
single investigator grant and a Multi University Research Initiative (Case Western
Reserve University, P.I.). One of the authorsb would like to acknowledge financial
support by way of a Summer Research Fellowship award towards part of this study from
the Sigma Xi foundation. The authors are grateful for the use of X-11B at the National
Synchrotron Light Source, Brookhaven National Laboratory, Upton NY, which is
supported by the U.S. Department of Energy, Office of Science, Office of Basic Energy
Sciences, under Contract No. DE-AC02-98CH10886.
165
3.6 References
1. Gottesfeld, S. & Zawodzinski, T. A. Polymer electrolyte fuel cells. Advances in Electrochemical Science and Engineering 5, 195-301 (1997).
2. Breiter, M. W. Voltammetric study of halide ion adsorption on platinum in perchloric acid solutions. Electrochim. Acta 12, 925-35 (1963).
3. Horanyi, G. & Rizmayer, E. M. The problem of the irreversibility of the adsorption of halides on platinum. J. Electroanal. Chem. Interfacial Electrochem. 83, 367-73 (1977).
4. Huang, J. C., O'Grady, W. E. & Yeager, E. The effects of cations and anions on hydrogen chemisorption at platinum. J. Electrochem. Soc. 124, 1732-7 (1977).
5. Marković, N. M. & Ross, P. N. Surface science studies of model fuel cell electrocatalysts. Surf. Sci. Rep. 45, 117-229 (2002).
6. Markovic, N., Gasteiger, H. & Ross, P. N. Kinetics of Oxygen Reduction on Pt(hkl) Electrodes: Implications for the Crystallite Size Effect with Supported Pt Electrocatalysts. J. Electrochem. Soc. 144, 1591-1597 (1997).
7. Slygin, A. & Frumkin, A. Acta Physicochim. U. R. S. S. 3, 791 (1935).
8. Llopis, J. Corrosion of platinum metals and chemisorption. Catal. Rev. 2, 161-220 (1968).
9. Bagotzky, V. S., Vassilyev, Y. B., Weber, J. & Pirtskhalava, J. N. Adsorption of anions on smooth platinum electrodes. J. Electroanal. Chem. 27, 31-46 (1970).
10. Schmidt, T. J., Paulus, U. A., Gasteiger, H. A. & Behm, R. J. The oxygen reduction reaction on a Pt/carbon fuel cell catalyst in the presence of chloride anions. J. Electroanal. Chem. 508, 41-47 (2001).
11. Wang, J. X., Markovic, N. M. & Adžić, R. R. Kinetic Analysis of Oxygen Reduction on Pt(111) in Acid Solutions: Intrinsic Kinetic Parameters and Anion Adsorption Effects. J. Phys. Chem. B 108, 4127 (2004).
12. Zhang, L. & Mukerjee, S. Investigation of durability issues of selected nonfluorinated proton exchange membranes for fuel cell application. J. Electrochem. Soc. 153, A1062-A1072 (2006).
13. Lane, R. F. & Hubbard, A. T. Electrochemistry of Chemisorbed Molecules. 111. Determination of the Oxidation State of Halides Chemisorbed on Platinum. Reactivity and Catalytic Properties of Adsorbed Species. J. Phys. Chem. 79, 808-815 (1975).
166
14. Li, N. & Lipkowski, J. Chronocoulometric studies of chloride adsorption at the Pt(111) electrode surface. J. Electroanal. Chem. 491, 95-102 (2000).
15. Markovic, N. & Ross, P. N. The Effect of Specific Adsorption of Ions and Underpotential Deposition of Copper on the Electro-Oxidation of Methanol on Platinum Single-Crystal Surfaces. J. Electroanal. Chem. 330, 499 (1992).
16. Campbell, D. J., Lynch, M. L. & Corn, R. M. Second harmonic generation studies of anionic chemisorption at polycrystalline platinum electrodes. Langmuir 6, 1656-64 (1990).
17. Lucas, C. A., Marković, N. M. & Ross, P. N. Adsorption of Halide Anions at the Pt(111)-solution Interface Studied by in situ Surface X-ray Scattering. Phys. Rev. B 55, 7964-7971 (1997).
18. Mukerjee, S. & McBreen, J. An in situ X-ray absorption spectroscopy investigation of the effect of Sn additions to carbon-supported Pt electrocatalysts. Part I. J. Electrochem. Soc. 146, 600-606 (1999).
19. Mukerjee, S. et al. In situ x-ray absorption spectroscopy studies of metal hydride electrodes. J. Electrochem. Soc. 142, 2278-86 (1995).
20. O'Grady, W. E. & Ramaker, D. E. ‘Atomic' X-ray absorption fine structure: a new tool for examining electrochemical interfaces. Electrochim. Acta 44, 1283-1287 (1998).
21. Koningsberger, D. C., Mojet, B. I., Van Dorssen, G. E. & Ramaker, D. E. XAFS spectroscopy; fundamental principles and data analysis. Top. Catal. 10, 143-155 (2000).
22. Koningsberger, D. C., Mojet, B. L., Miller, J. T. & Ramaker, D. E. XAFS spectroscopy in catalysis research: AXAFS and shape resonances. J. Synchrotron. Radiat. 6, 135-141 (1999).
23. Koningsberger, D. C., Mojet, B. L., van Dorssen, G. E. & Ramaker, D. E. XAFS Spectroscopy; Fundamental Principles and Data Analysis. Top. Catal. 10, 143-155 (2000).
24. Ramaker, D. E., Mojet, B. L., Koningsberger, D. C. & O'Grady, W. E. Understanding Atomic X-ray Absorption Fine Structure in X-ray Absorption Spectra. J. Phys.: Condens. Matter 10, 8753-8770 (1998).
25. Murthi, V. S., Urian, R. C. & Mukerjee, S. Oxygen Reduction Kinetics in Low and Medium Temperature Acid Environment: Correlation of Water Activation and Surface Properties in Supported Pt and Pt Alloy Electrocatalysts. J. Phys. Chem. B 108, 11011-11023 (2004).
167
26. Teliska, M., Murthi, V. S., Mukerjee, S. & Ramaker, D. E. Correlation of Water Activation, Surface Properties, and Oxygen Reduction Reactivity of Supported Pt-M/C Bimetallic Electrocatalysts Using XAS. J. Electrochem. Soc. 152, A1259-A2169 (2005).
27. Teliska, M., O'Grady, W. E. & Ramaker, D. E. Determination of O and OH Adsorption Sites and Coverage in Situ on Pt Electrodes from Pt L23 X-ray Absorption Spectroscopy. J. Phys. Chem. B 109, 8076-8084 (2005).
28. Teliska, M. Determination of H, O and OH Chemisorption Sites on Platinum and Platinum-based Alloy Electrodes in an Electrochemical Cell using in situ X-ray Absorption Spectroscopy, Ph.D. Thesis, The George Washington University, Washington, D.C., 2004.
29. Teliska, M., O'Grady, W. E. & Ramaker, D. E. Determination of H Adsorption Sites on Pt/C Electrodes in HClO4 from Pt L23 X-ray Absorption Spectroscopy. J. Phys. Chem. B 108, 2333-2344 (2004).
30. Teliska, M., Murthi, V. S., Mukerjee, S. & Ramaker, D. E. Site-Specific vs Specific Adsorption of Anions on Pt and Pt-Based Alloys. J. Phys. Chem. C 111, 9267-9274 (2007).
31. Scott, F. J., Mukerjee, S. & Ramaker, D. E. CO Coverage/Oxidation Correlated with PtRu Electrocatalyst Particle Morphology in 0.3 M Methanol by In Situ XAS. J. Electrochem. Soc. 154, A396 (2007).
32. Ziegelbauer, J. M., Gatewood, D., Gullá, A. F., Ramaker, D. E. & Mukerjee, S. X-ray Absorption Spectroscopy Studies of Water Activation on an RhxSy Electrocatalyst for ORR Applications. Electrochem. Solid-State Lett. 9, A430-A434 (2006).
33. Arruda, T. M., Shyam, B., Ziegelbauer, J. M., Ramaker, D. E. & Mukerjee, S. In situ XAS Investigation of Electrocatalyst Surface Poisoning by Halides. ECS Transactions 11, 903 (2007).
34. Ramaswamy, N., Hakim, N. & Mukerjee, S. Degradation mechanism study of perfluorinated proton exchange membrane under fuel cell operating conditions. Electrochmica Acta 53, 3279 (2008).
35. McBreen, J., O'Grady, W. E., Pandya, K. I., Hoffman, R. W. & Sayers, D. E. EXAFS study of the nickel oxide electrode. Langmuir 3, 428-433 (1987).
36. Newville, M. IFEFFIT: Interactive XAFS Analysis and FEFF Fitting. J. Synchrotron. Radiat. 8, 322-324 (2001).
37. Newville, M., Livins, P., Yacoby, Y., Stern, E. A. & Rehr, J. J. Near-edge x-ray-absorption fine structure of Pb: A comparison of theory and experiment. Phys. Rev. B 47, 14126 (1993).
168
38. Ramaker, D. E., Mojet, B. L., Miller, J. T. & Koningsberger, D. C. An atomic X-ray absorption fine structure study of the influence of hydrogen chemisorption and support on the electronic structure of supported Pt particles. Top. Catal. 10, 157-165 (2000).
39. van Dorssen, G. E., Koningsberger, D. C. & Ramaker, D. E. Separation of double-electron and atomic XAFS contributions in x-ray absorption spectra of Pt foil and Na2Pt(OH)6. J. Phys.: Condens. Mat. 14, 13529-13541 (2002).
40. Janin, E., von Schenck, H., Göthelid, M. & Karlsson, U. O. Bridge-bonded atomic oxygen on Pt(110). Phys. Rev. B 61, 13144-13149 (2000).
41. Stamenkovic, V., Marikovic, N. M. & P. N. Ross, J. Structure-relationships in Electrocatalysis: Oxygen Reduction and Hydrogen Oxidation Reactions on Pt(111) and Pt(100) in Solutions Containing Chloride Ions. J. Electroanal. Chem. 500, 44-51 (2001).
42. Li, N. & Lipkowski, J. Chronocoulometric Studies of Chloride Anion Adsorption at the Pt(111) Electrode Surface. J. Electroanal. Chem. 2000, 95-102 (2000).
43. Marković, N. M., Gasteiger, H. A., Grgur, B. N. & Ross, P. N. Oxygen ReductionRreaction on Pt(111): Effects of Bromide. J. Electroanal. Chem. 467, 157-163 (1999).
44. Jerkiewicz, G., Vatankhah, G., Lessard, J., Soriaga, M. P. & Park, Y.-S. Surface-oxide growth at platinum electrodes in aqueous H2SO4. Reexamination of its mechanism through combined cyclic-voltammetry, electrochemical quartz-crystal nanobalance, and Auger electron spectroscopy measurements. Electrochim. Acta 49, 1451-1459 (2004).
45. Zolfaghari, A., Conway, B. E. & Jerkiewicz, G. Elucidation of the effects of competitive adsorption of Cl−and Br− ions on the initial stages of Pt surface oxidation by means of electrochemical nanogravimetry. Electrochim. Acta 47, 1173-1187 (2002).
46. Ramaker, D. E., Oudenhuijzen, M. K. & Koningsberger, D. C. Strong Support Effects on the Insulator to Metal Transition in Supported Pt Clusters as Observed by X-ray Absorption Spectroscopy J. Phys. Chem. B 109, 5608-5617 (2005).
47. Kinoshita, K. Particle Size Effects for Oxygen Reduction on Highly Dispersed Platinum in Acid Electrolytes. J. Electrochem. Soc. 137, 845-848 (1990).
48. Benfield, R. E. Mean coordination numbers and the non-metal–metal transition in clusters. J. Chem. Soc. Faraday Trans. 88, 1107 (1992).
49. Hardeveld, R. v. & Hartog, F. The statistics of surface atoms and surface sites on metal crystals. Surf. Sci., 15, 189 (1969).
169
50. Hardeveld, R. v. & Monfoort, A. V. The influence of crystallite size on the adsorption of molecular nitrogen on nickel, palladium and platinum: An infrared and electron-microscopic study. Surf. Sci. 4, 396 (1969).
51. Stonehart, P. Bur. Bunsenges Phys. Chem., 94, 913 (1990).
52. Mukerjee, S. & McBreen, J. Effect of particle size on the electrocatalysis by carbon-supported Pt electrocatalysts: an in situ XAS investigation. J. Electroanal. Chem. 448, 163-171 (1998).
53. Balbuena, P. B. et al. Adsorption of O, OH, and H2O on Pt-Based Bimetallic Clusters Alloyed with Co, Cr, and Ni Adsorption of O, OH, and H2O on Pt-Based Bimetallic Clusters Alloyed with Co, Cr, and Ni. J. Phys. Chem. A 108, 6378 (2004).
54. Xu, Y., Ruban, A. V. & Mavrikakis, M. Adsorption and Dissociation of O2 on Pt−Co and Pt−Fe Alloys. J. Am. Chem. Soc. 126, 4717 (2004).
55. Garcia-Araez, N., Climent, V., Herrero, E., Feliu, J. & Lipkowski, J. Thermodynamic studies of chloride adsorption at the Pt(111) electrode surface from 0.1 M HClO4 solution. J. Electroanal. Chem. 576, 33-41 (2005).
56. Yadav, A. P., Nishikata, A. & Tsuru, T. Effect of halogen ions on platinum dissolution under potential cycling in 0.5 M H2SO4 solution. Electrochim. Acta 52, 7444 (2007).
170
Chapter 4
Effect of RuOxHy Island Size on PtRu Particle Aging in Methanol∗
4.1 Introduction
The cost, performance levels, vulnerability to poisoning, and durability of Pt-based
Proton Exchange Membrane (PEM) fuel cells have each in part kept them from large-
scale commercialization. Earlier efforts concentrated on cost and performance levels, but
as the particle size and loading of modern electrocatalysts have decreased to meet the first
two issues, and bimetallics have been introduced to meet the third issue, the emphasis has
turned to the durability of the bimetallic particles. The degradation with time of a PEM
fuel cell involves both the membrane (e.g. Nafion), and the Pt-M (M = Ru, Co, Ni, Cr,
Mo, etc.) electrocatalysts, but of these the most studied are the long term changes to the
electrocatalysts.1 The degradation of the catalyst, resulting in current decay over time (i.e.
in chronoamperometry experiments), can involve surface M atom rearrangements,
particle growth, and/or M and Pt atom dissolution at the anode and cathode.
∗ Published in the Journal of Physical Chemistry C, 2009, 113 (45), 19713-19721 Authors: Badri Shyam, Thomas Arruda, Sanjeev Mukerjee and David E. Ramaker Electrochemistry and XAS data collection were carried out by authors affiliated with Northeastern University. XAS data analysis was carried out by authors from The George Washington University.
171
Both Pt dissolution and agglomeration from pure Pt anodes and cathodes2-14 have
been extensively studied as well as the slow dissolution of Rh, Ru or Sn from supported
Pt-M bimetallic particles15-22 in acid media during voltammetric cycling or fuel cell
aging. While it is well-known that cathodic losses due to sluggish oxygen reduction
reaction (ORR) kinetics are much more significant than anodic overpotential losses, in
the case of the direct methanol fuel cell (DMFC) where methanol is oxidized on the PtRu
surface, recent findings23-25 reveal that the two processes are linked. The above
mentioned reports illustrated the degradation of the anode can eventually result in the
rapid deterioration of cathode performance, drastically reducing the overall efficiency of
the fuel cell. For example, in these PtRu catalysts, significant Ru dissolution from the
anode has been observed and the leached Ru ions were found not only in the polymer
electrolyte membrane, but also deposited on the surface of the Pt cathode. Cyclic
voltammograms of the anode and cathode in the above mentioned situation clearly
indicate that the DMFC cathode becomes more anode-like and quickly leads to a steep
loss in operating potential. Thus, it is of considerable interest to understand the processes
of catalyst aging and degradation, not only from a fundamental standpoint but also with
the aim of eliminating the various bottlenecks which keep such catalysts from widespread
use in fuel cells.
A broad array of electrochemical, microscopic, and spectroscopic techniques have
previously been used to study these aging effects. The mass loss from the anode/cathode
has been observed directly using an electrochemical quartz crystal microbalance
(EQCM)26, 27 as well as the presence of Pt or M atoms in the electrolyte using energy
172
dispersive x-ray analysis (EDX).18 Atom rearrangements or particle growth have been
observed with atomic force microscopy (AFM),7 x-ray diffraction (XRD),
2,4,18,19,21scanning electron microscopy (SEM), transmission electron microscopy (TEM) 2,
4, 7, 14, 19, 20 and x-ray absorption spectroscopy (XAS).17, 18, 28
The general mechanism for metal dissolution has been attributed to
oxidation/reduction of the surface atoms causing atom rearrangement and dissolution into
the electrolyte, 29, 30 and sometimes even (both Pt and Ru) crossover from the anode to the
cathode. 4,14,25,28 Detailed mechanistic information and kinetic models have been
presented to characterize the particle agglomeration and atom dissolution.29, 30 Despite
these numerous efforts and proposed models, many questions and issues remain
regarding the relative rates of agglomeration and dissolution at the anode and cathode,
and their dependence on potential, particle loading and morphology. A very important
question, for example, is how does the M atom dissolution depend on the RuOxHy island
size on the surface? This question has not been considered, as generally the island size is
unknown. Measuring the island size however is no trivial task. Very few methods are
available to do such measurements in situ where it must be done as ex situ samples are
almost always known to be fully oxidized.
As mentioned above, Ru dissolution from PtRu electrocatalysts during cycling in acid
media with methanol present has been reported previously.17 Holstein and Rosenfeld
observed Ru dissolution when the catalyst was cycled over a large window (0 - 1.3 V vs.
RHE) while little or no dissolution was observed over much narrower potential ranges.
Further, the dissolution was observed with catalysts loadings of ~ 1/10 of those typically
used in a DMFC, and subsequently at much lower current densities. Chen et al.
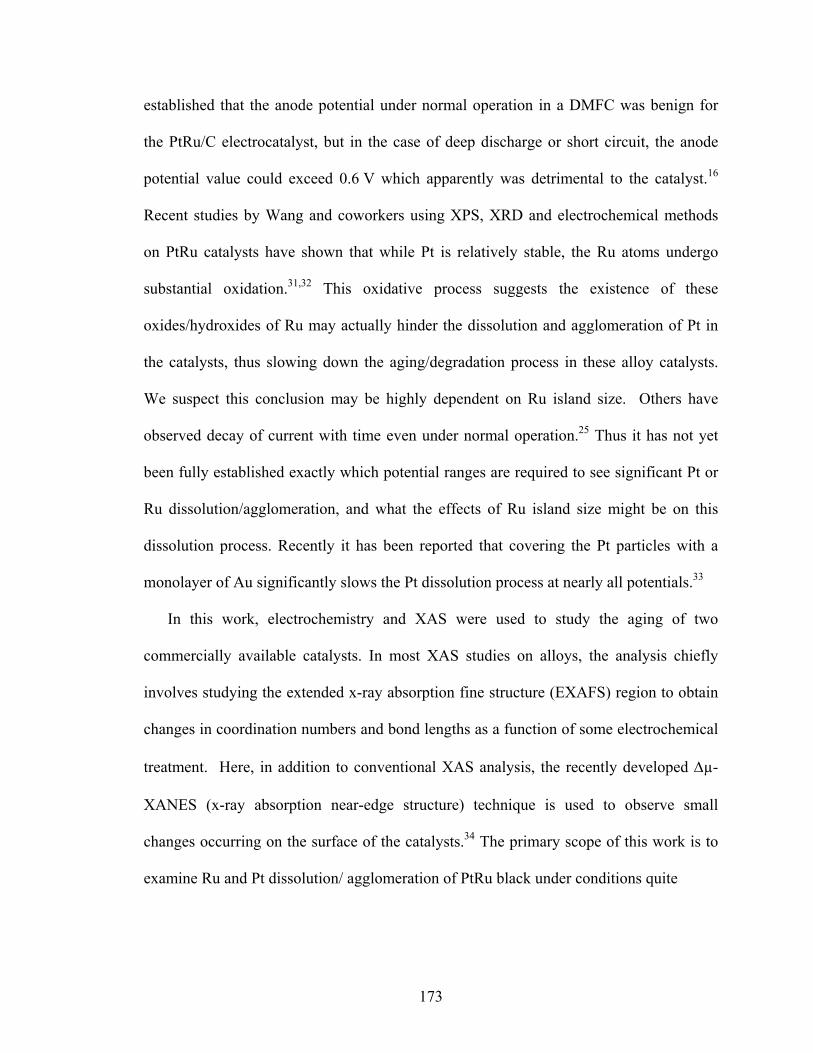
173
established that the anode potential under normal operation in a DMFC was benign for
the PtRu/C electrocatalyst, but in the case of deep discharge or short circuit, the anode
potential value could exceed 0.6 V which apparently was detrimental to the catalyst.16
Recent studies by Wang and coworkers using XPS, XRD and electrochemical methods
on PtRu catalysts have shown that while Pt is relatively stable, the Ru atoms undergo
substantial oxidation.31,32 This oxidative process suggests the existence of these
oxides/hydroxides of Ru may actually hinder the dissolution and agglomeration of Pt in
the catalysts, thus slowing down the aging/degradation process in these alloy catalysts.
We suspect this conclusion may be highly dependent on Ru island size. Others have
observed decay of current with time even under normal operation.25 Thus it has not yet
been fully established exactly which potential ranges are required to see significant Pt or
Ru dissolution/agglomeration, and what the effects of Ru island size might be on this
dissolution process. Recently it has been reported that covering the Pt particles with a
monolayer of Au significantly slows the Pt dissolution process at nearly all potentials.33
In this work, electrochemistry and XAS were used to study the aging of two
commercially available catalysts. In most XAS studies on alloys, the analysis chiefly
involves studying the extended x-ray absorption fine structure (EXAFS) region to obtain
changes in coordination numbers and bond lengths as a function of some electrochemical
treatment. Here, in addition to conventional XAS analysis, the recently developed Δµ-
XANES (x-ray absorption near-edge structure) technique is used to observe small
changes occurring on the surface of the catalysts.34 The primary scope of this work is to
examine Ru and Pt dissolution/ agglomeration of PtRu black under conditions quite
174
E, V vs. RHE0.40 0.45 0.50 0.55 0.60 0.65
i, m
A
0.0
0.2
0.4
0.6
0.8JM post 8 hr. CAJM initialTanaka post 8 hr. CATanaka initial
Figure 4.1 CO stripping data24 for the Johnson Matthey (red) and Tanaka (blue) catalysts before and after an 8-hour chronoamperometic test at 500 mV. The data have not been normalized for surface area.
175
similar to those in a fuel cell, with n (0, 20 and 40) potential-sweep cycles between 0.02
and 0.8 V. Two different commercial PtRu catalysts (Johnson-Matthey and Tanaka) were
utilized in 1M trifluoromethanesulfonic acid (TFMSA) with 0.3 M methanol (MeOH)
and their properties compared. Shown in Figure 4.1 are CO stripping curves for the two
catalysts before and after the 8-hour chronoamperometry (CA) session at 500 mV. The
data were collected at a scan rate of 10mV/s. In the case of the JM sample, there is a shift
in the onset potential for the CO stripping while there is no such shift for the Tanaka
samples. Further, a positive shift in the peak potential of ca.50 mV is observed in both
catalyst samples. It is clear that the two catalysts exhibit different aging characteristics.
To explain this difference in behavior, in situ XAS data were obtained on the samples and
their change with cycling observed using the Δµ-XANES and EXAFS analysis
techniques. It will be shown that the sensitivity of the Δµ-XANES technique indeed
allows changes in the particles to be observed in this potential range even after as few as
10-20 cycles.
4.2 Experimental Methods and Data Analysis
4.2.1 Electrode preparation and XAS cell assembly
Two different commercial PtRu (approximately 1:1 atomic ratio) based
electrocatalysts were used for preparation of the working electrodes. The first obtained
from Johnson-Matthey (HiSpec6000) and the second from Tanaka (TEC90110)
(hereafter referred to as JM and Tanaka). The working electrodes were prepared in-house
with a metal loading of 4.7 and 9.3 mg/cm2 of Pt and Ru respectively by hand painting
the inks (pre-weighed catalyst powder, deionized H2O and 5 wt% Nafion) onto carbon
cloth (PANEX 30, Zoltek Corperation) by a standard method described previously.35 The
176
total geometric area of the electrodes was 5 cm2. The metal loading was chosen based on
absorption cross sections for Pt and Ru to ensure an XAS step height of close to unity.
The in situ XAS cells used were similar to a previously reported design36 and assembled
by placing a Nafion 112 membrane between the PtRu working electrode and a Grafoil
(GrafTech International) counter electrode. In all cells the current collectors used were
0.5 mm Au wires (99.999%, Alfa Aesar) and mechanically pressed to the rear of each
electrode in a location that did not impinge the x-ray beam path in the photon window.
The cells were sealed using silicone gaskets (Auburn Chemical Co.). The electrolyte used
in these experiments was 1 M TFMSA (triply distilled, Strem Chemicals) with the
addition of 0.3 M methanol. An Autolab PGSTAT 30 potentiostat/galvanostat (Metrohm
USA, formerly Brinkmann Instruments) was employed for potential control in all
experiments.
4.2.2 In Situ XAS measurements
No catalyst pretreatment (i.e. potential cycling) was performed prior to XAS
measurements aside from soaking the working electrodes in electrolyte under vacuum for
1 hour prior to experiment for the purpose of wetting. Full range EXAFS scans were
collected (-200 eV below the edge to k = 18Ǻ-1 above the edge) at the Pt-LIII edge (11564
eV) as well as the Ru-K edge (22117 eV). A summary of the data collected is presented
in Figure 4.2. Briefly, data were collected at both edges at the indicated potentials after
0, 20 and 40 cycles. In each case, all the data at a given edge were first collected in 1M
TFMSA and then with the addition of 0.3M Methanol, wherein a fresh electrode from the
same batch of catalyst was used. In all, four electrodes were used for each catalyst in
order to perform the designated experiments (with and without methanol at the Pt and Ru
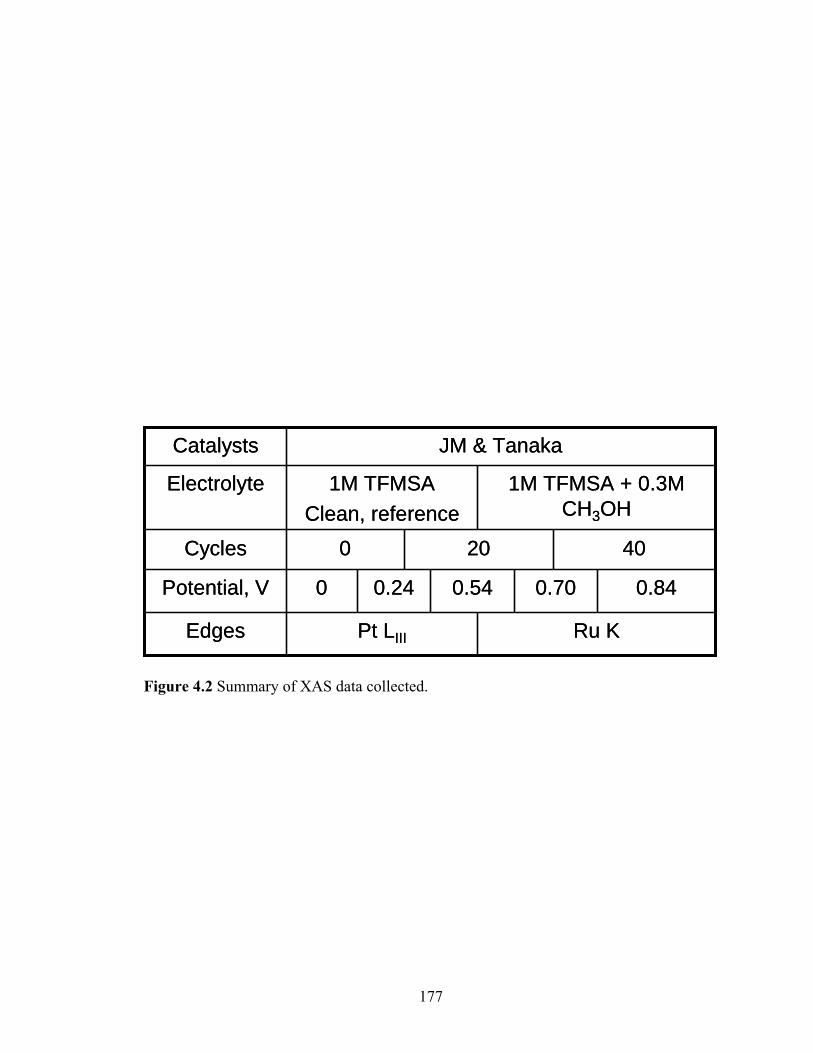
177
Ru K
0.24 0.70 0.840.54
20 40
1M TFMSA + 0.3M CH3OH
0Potential, V
1M TFMSAClean, reference
Electrolyte
0Cycles
Pt LIIIEdges
JM & TanakaCatalysts
Ru K
0.24 0.70 0.840.54
20 40
1M TFMSA + 0.3M CH3OH
0Potential, V
1M TFMSAClean, reference
Electrolyte
0Cycles
Pt LIIIEdges
JM & TanakaCatalysts
Figure 4.2 Summary of XAS data collected.
178
edges). Measurements were performed at beam line X23-A2 at the National Synchrotron
Light Source (Brookhaven National Laboratry, Upton, NY) which employs a piezo-
feedback stabilized Si(311) monochromator. XAS was collected in transmission mode
with the cell placed between two gas ionization chambers (I0, incident beam and I1,
transmitted beam) and a Pt foil/Ru powder (325 mesh, Alfa Aesar) between I1 and I2
(beam intensity for reference sample) . The Pt and Ru reference foil scans were used to
correct for any drift in the beam energy during data collection.
4.2.3 Electrochemical Measurements
All electrochemical measurements were carried out using 1M TFMSA (Strem
Chemicals), which was triply distilled by a method described elsewhere.37 For surface
area determination, aqueous solutions of 2 mM CuSO4 (Alfa Aesar) were prepared in 1M
TFMSA and employed by the method outlined by Green et al.38 Catalyst suspensions
were produced by mixing a pre-weighed quantity of Pt, PtRu or Ru/C, deionized H2O
(18.2 MΩ, Millipore MilliQ) and 5 wt% Nafion solution (suspended in low molecular
weight alcohols, LQ-1105, Ion Power Inc). The suspensions were sonicated for 15
minutes, stirred for two hours then deposited onto a 9 mm polycrystalline Au slug. The
total electrocatalyst target loading was 100 μg·cm-2, although some of the loosely bound
particles may have washed off the surface prior to testing. The Au slug was connected to
a threaded 316 stainless steel current collecting rod which never contacted the electrolyte.
The cells were comprised of a jacketed 50 cm-3 glass beaker with machined PTFE lid. In
all cases a sealed glass reference hydrogen electrode (RHE, 1M TFMSA internal) was
used and connected to the cell via a glass capillary which terminated at a fine porous frit
to minimize Cu2+, MeOH and Run+ crossing into the RHE. The counter electrode was a

179
Pt wire (Alfa Aesar, 99.999%) with a surface area of 1.7 cm2 as determined by
integrating the Hupd. Ru surface area was determined by immersing the slug into a
solution of Ar purged (UHP, Middlesex Gasses) 1M TFMSA + 2 mM CuSO4 and
polarizing to 0.3 V for 60 seconds. Subsequently, the potential was scanned anodically to
0.8 V. The Pt surface area measurement was carried out the same way except a starting
potential of 0.4V (also for 60 seconds) was used as Cu2+ will only deposit on Pt when
potentiostatically controlled in that region. The electrode was then removed from the
Cu2+ containing electrolyte, rinsed with deionized H2O and placed into an identical cell
containing clean 1M TFMSA. A total of 500 cyclic voltammograms (CVs) were
collected at a sweep rate of 50 mV s-1 between 0.02 – 0.8 V vs. RHE. Following the 500
cycles, surface area determinations were repeated by the procedure outlined above to
illustrate any loss of electrocatalyst as a result of cycling. CO stripping voltammograms
were collected by saturating the 1M TFMSA with gaseous CO (5.0 Grade, Middlesex
Gasses) and scanning the potential anodically at a sweep rate of 10 mV s-1.
4.2.4 XANES and EXAFS analysis
Analysis of the XANES region of the XAS data was carried out using the Δμ
technique34, 39-42 previously applied to adsorption of H, O/OH, and Cl on Pt43-45 and Pt-M
(M = Cr, Fe, Co, and Ni) cathodes46 and Pt-Ru anodes47 in an electrochemical cell, and
even to Pt and PtRu anodes in an operating direct methanol fuel cell.27 A brief summary
is given here for clarity and to highlight slight differences from the previous methods.
All XAS data were processed using the ATHENA code developed by Ravel and
Newville.48 The pre-edge background is removed using the AUTOBK algorithm,
described completely elsewhere,49 followed by normalization over the 50 to 150 eV
180
(relative to E0) range for XANES analysis. This procedure was carried out for both the
sample data in transmission mode (ln I0/I) and the reference foil data (ln I/Iref). The foil
data were then calibrated and aligned to the theoretical edge energy, and the resultant
energy differences were transferred to the sample data; i.e., the ΔE shifts determined for
the foil at any given potential is added to the energy of the sample data at the same
potential. This energy calibration corrects for shifts due to photon beam drift. This
energy calibration is crucial for the success of the Δμ technique to ensure full
cancellation of the atomic contribution in the XANES, which dominates the spectrum;
the resulting Δμ-XANES signal intensity is typically only about 1-5% of the total μ
signal.
The difference Δμ = μ(V) - μ(Vref) is generally determined by subtracting the μ-
XANES at an appropriate reference potential Vref, from μ−XANES at other potentials to
isolate the effect of adsorbates. The reference potential Vref is usually taken to be the
potential at which the electrode is relatively free of adsorbates. However, the optimal
choice of reference can change based on the nature of the inquiry, the sample, the
adsorption edge, and the operating conditions. In this work, the electrode in 1 M TFMSA
without methanol was used as the reference, at 0.54 V at the Pt edge (when the Pt is
relatively free of both H and O), and at 0.02 V at the Ru k-edge (when the Ru is mostly
free of Ox) with no cycling. Therefore, the Δμ signals (the notation used is the potential
followed by the number of cycles) were obtained from the following differences:
Δµ(V_cycles) = µ(V_cycles, MeOH) - µ (0.54_0, no MeOH). For Pt (Eq. 4.1)
Δµ(V_cycles) = µ(V_cycles, MeOH) - µ (0.02_0, no MeOH). For Ru (Eq. 4.2)
181
As will be shown in Figure 4.7, CO and O(H) were visible as different features by
this method, allowing for simultaneous indications of their coverages. The final Δμ
curves were background corrected (80 eV smooth) and smoothed to remove random
noise (5 eV) using a standard Savitzky–Golay smoothing routine with the indicated
energy range given in parentheses.
The EXAFS fitting analyses were performed using the ARTEMIS code,48 by
employing only 2 first-shell metal atom scattering paths for each sample (either Pt-Pt and
Pt-Ru or Ru-Ru and Ru-Pt) included at each edge. All fits were carried out on k2
weighted χ(k) data using a Kaiser-Bessel window over a k-range of 1.574 < k < 13.769
Å-1, and an R-window of 1.448 < R < 3.201 Å. Details of the method for extracting
coordination numbers (CN) been described elsewhere.47 Several fits were first carried out
on the data obtained, allowing all four parameters per path (N, R, σ, and Eo) to vary. It
was found that Debye-Waller factor (σ2) derived from the fits were in the range of 0.004-
0.006 Å2. Therefore σ was eventually fixed at the value of 0.005 Å2 for all fits (thereby
allowing only 6 parameters total to vary) to reduce scatter in the CNs, and FEFF 8.0 was
used to calculate all of the other necessary parameters including the many-body
amplitude reduction term S 20 (0.916 for Ru and 0.934 for Pt).
4.2.5 FEFF 8.0 calculations
The FEFF 8.0 code was used to model the adsorbate Δμ signatures. The Δµ(Ads)
was determined by subtracting the µ-XANES of a clean “Janin”26 type Pt4M2 cluster from
the µ-XANES of a cluster containing an adsorbate molecule in the atop, bridged or n-fold
position; i.e. Δμ(O) = μ(O/Pt4M2) - μ(Pt4M2). The Janin cluster, used in much of our
previous work,34, 40, 47, 50-55 was chosen here because it is the smallest cluster that contains
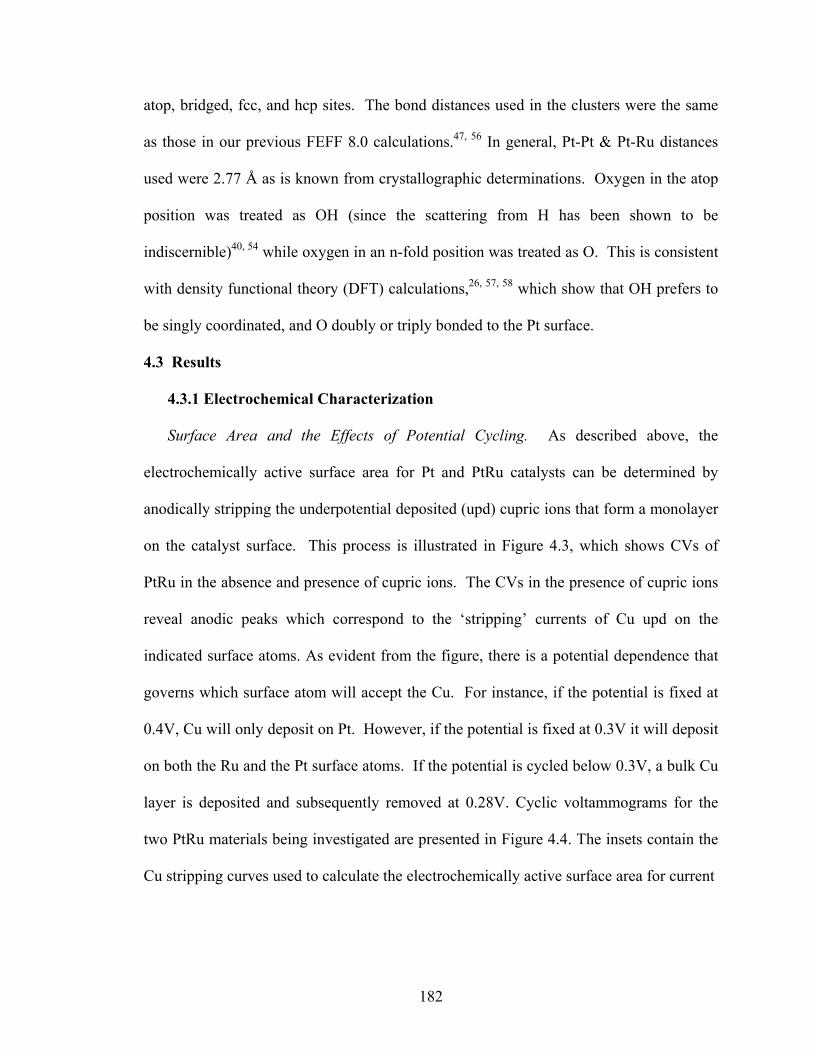
182
atop, bridged, fcc, and hcp sites. The bond distances used in the clusters were the same
as those in our previous FEFF 8.0 calculations.47, 56 In general, Pt-Pt & Pt-Ru distances
used were 2.77 Å as is known from crystallographic determinations. Oxygen in the atop
position was treated as OH (since the scattering from H has been shown to be
indiscernible)40, 54 while oxygen in an n-fold position was treated as O. This is consistent
with density functional theory (DFT) calculations,26, 57, 58 which show that OH prefers to
be singly coordinated, and O doubly or triply bonded to the Pt surface.
4.3 Results
4.3.1 Electrochemical Characterization
Surface Area and the Effects of Potential Cycling. As described above, the
electrochemically active surface area for Pt and PtRu catalysts can be determined by
anodically stripping the underpotential deposited (upd) cupric ions that form a monolayer
on the catalyst surface. This process is illustrated in Figure 4.3, which shows CVs of
PtRu in the absence and presence of cupric ions. The CVs in the presence of cupric ions
reveal anodic peaks which correspond to the ‘stripping’ currents of Cu upd on the
indicated surface atoms. As evident from the figure, there is a potential dependence that
governs which surface atom will accept the Cu. For instance, if the potential is fixed at
0.4V, Cu will only deposit on Pt. However, if the potential is fixed at 0.3V it will deposit
on both the Ru and the Pt surface atoms. If the potential is cycled below 0.3V, a bulk Cu
layer is deposited and subsequently removed at 0.28V. Cyclic voltammograms for the
two PtRu materials being investigated are presented in Figure 4.4. The insets contain the
Cu stripping curves used to calculate the electrochemically active surface area for current
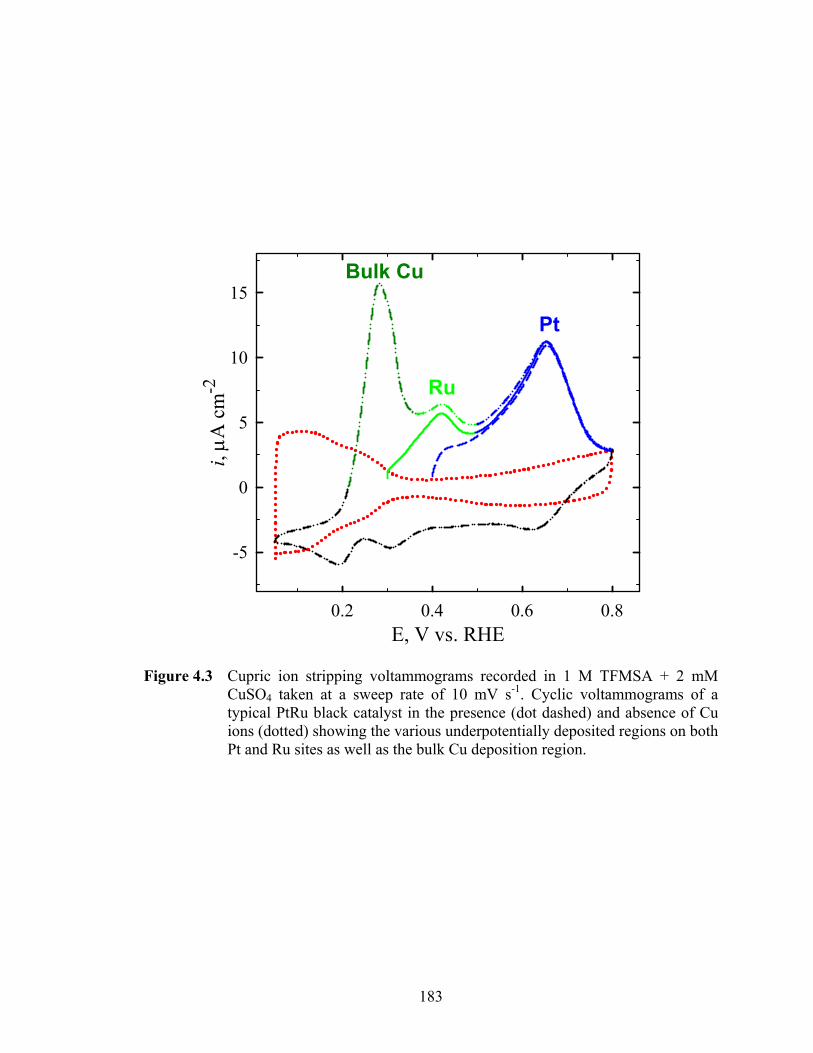
183
E, V vs. RHE0.2 0.4 0.6 0.8
i, μA
cm
-2
-5
0
5
10
15Bulk Cu
Ru
Pt
Figure 4.3 Cupric ion stripping voltammograms recorded in 1 M TFMSA + 2 mM CuSO4 taken at a sweep rate of 10 mV s-1. Cyclic voltammograms of a typical PtRu black catalyst in the presence (dot dashed) and absence of Cu ions (dotted) showing the various underpotentially deposited regions on both Pt and Ru sites as well as the bulk Cu deposition region.
184
density normalization and surface area analysis. As evident from the figure, both
materials undergo significant changes in surface area between cycles 5 and 50; the
integrated results presented in Table 4.1. Both materials show a decrease in the
magnitude of the Cu stripping off of Ru sites (E fixed at 0.3V), indicating loss of surface
Ru either through Ru dissolution or formation of RuOxHy islands as Cu ions will not
underpotentially deposit on RuOxHy but only on available, free metallic Ru sites. It is
worth stressing this latter point as it not only explains the Cu upd data but provides us
with a mechanistic insight into the aging process, all of which will be shown to be in
good agreement with results from the XAS analysis and electrochemical data. It should
be noted that the Tanaka PtRu surface area loss is more than double that of the JM (on
both the Pt and Ru). Interestingly, the Pt surface area of the Tanaka material decreased
considerably whereas the JM Pt surface area actually increased slightly. The increase in
Pt surface area for JM is likely the result of Ru dissolution from the surface of the particle
unveiling newly uncovered Pt surface atoms. The loss of Pt surface area in the Tanaka
sample can be attributed to either a) Pt dissolution or b) the formation of larger Ru
islands which mask more of the Pt surface sites. Both of the above possibilities are
discussed in greater detail in the EXAFS section below.
There are also significant changes to the CV profiles illustrating particle aging as a
result of potential cycling. For instance, in Figure 4.4 which overlays the three CVs for
the JM and Tanaka PtRu samples at 5, 50 and 500 cycles, there is a very noticeable
change in the Hupd region. At cycle 5 for the JM sample there are no discernable peaks
typical of H desorption, however, as the material is cycled it develops features which are
not unlike the Hupd region of pure Pt; for the Tanaka samples however, it appears to stay
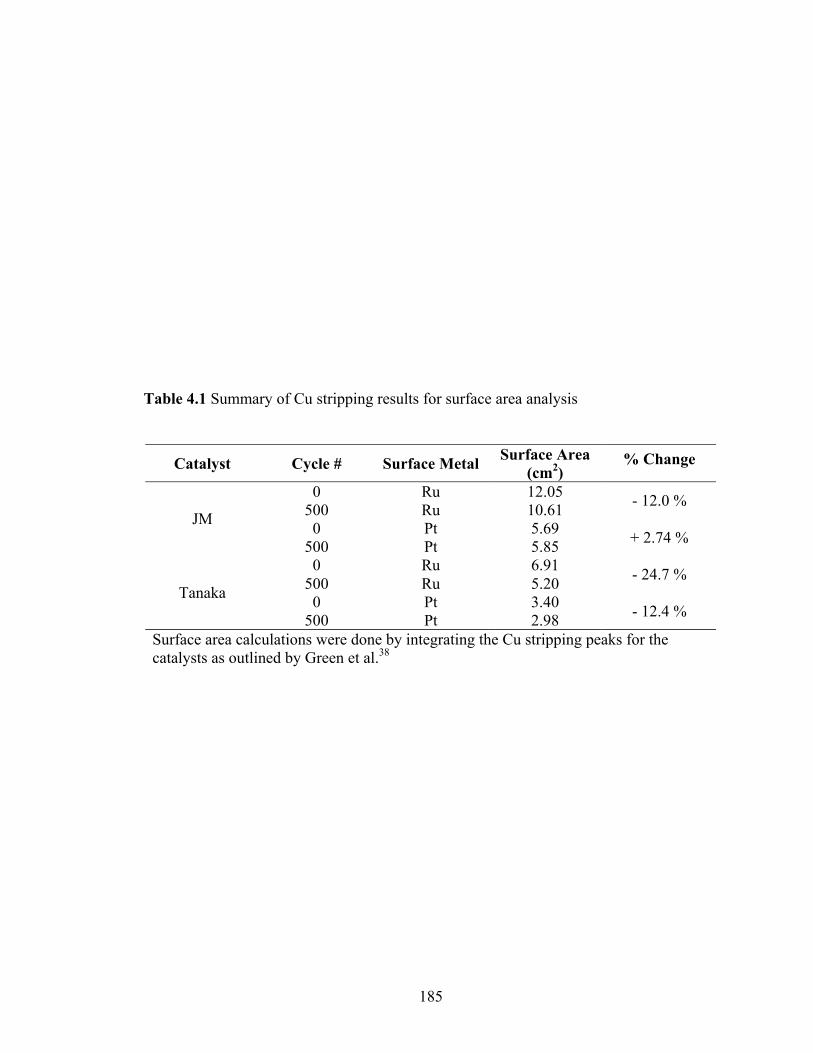
185
Table 4.1 Summary of Cu stripping results for surface area analysis
Catalyst Cycle # Surface Metal Surface Area (cm2)
% Change
0 Ru 12.05 500 Ru 10.61 - 12.0 %
0 Pt 5.69 JM
500 Pt 5.85 + 2.74 %
0 Ru 6.91 500 Ru 5.20 - 24.7 %
0 Pt 3.40 Tanaka
500 Pt 2.98 - 12.4 %
Surface area calculations were done by integrating the Cu stripping peaks for the catalysts as outlined by Green et al.38
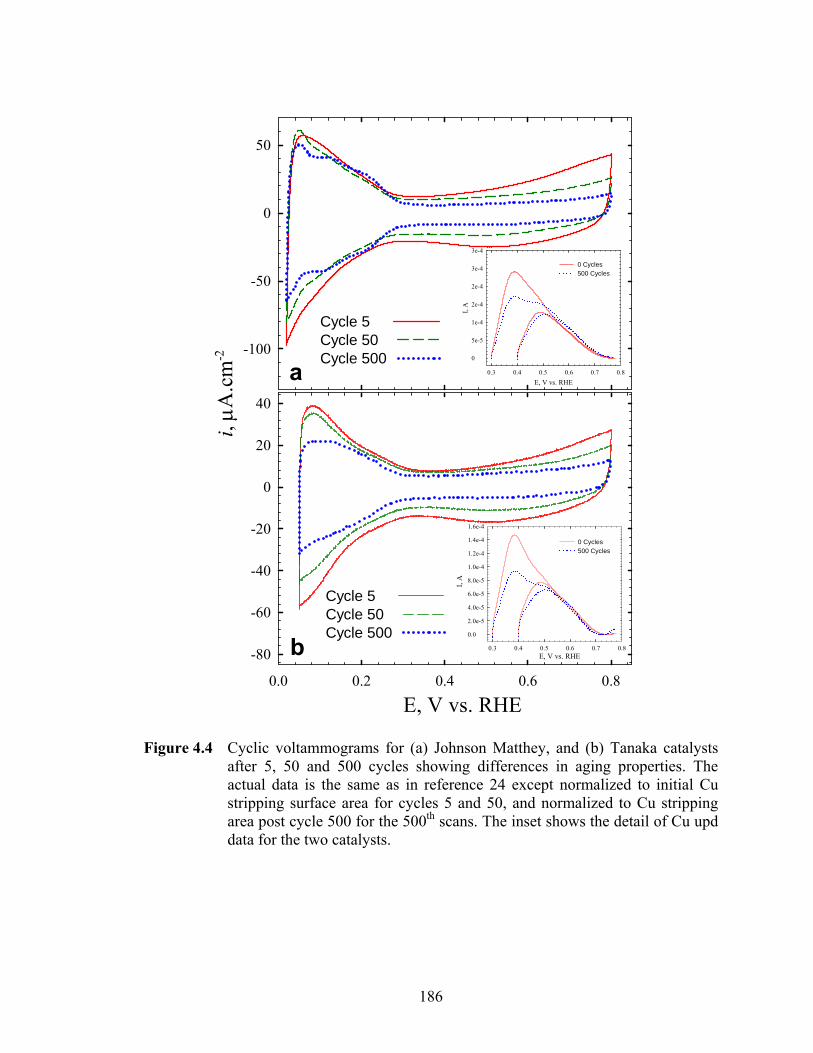
186
E, V vs. RHE0.0 0.2 0.4 0.6 0.8
i, μA
.cm
-2
-80
-60
-40
-20
0
20
40
Cycle 5 Cycle 50 Cycle 500
-100
-50
0
50
Cycle 5 Cycle 50 Cycle 500
E, V vs. RHE0.3 0.4 0.5 0.6 0.7 0.8
I, A
0
5e-5
1e-4
2e-4
2e-4
3e-4
3e-4
0 Cycles500 Cycles
E, V vs. RHE0.3 0.4 0.5 0.6 0.7 0.8
I, A
0.0
2.0e-5
4.0e-5
6.0e-5
8.0e-5
1.0e-4
1.2e-4
1.4e-4
1.6e-4
0 Cycles500 Cycles
a
b
Figure 4.4 Cyclic voltammograms for (a) Johnson Matthey, and (b) Tanaka catalysts after 5, 50 and 500 cycles showing differences in aging properties. The actual data is the same as in reference 24 except normalized to initial Cu stripping surface area for cycles 5 and 50, and normalized to Cu stripping area post cycle 500 for the 500th scans. The inset shows the detail of Cu upd data for the two catalysts.
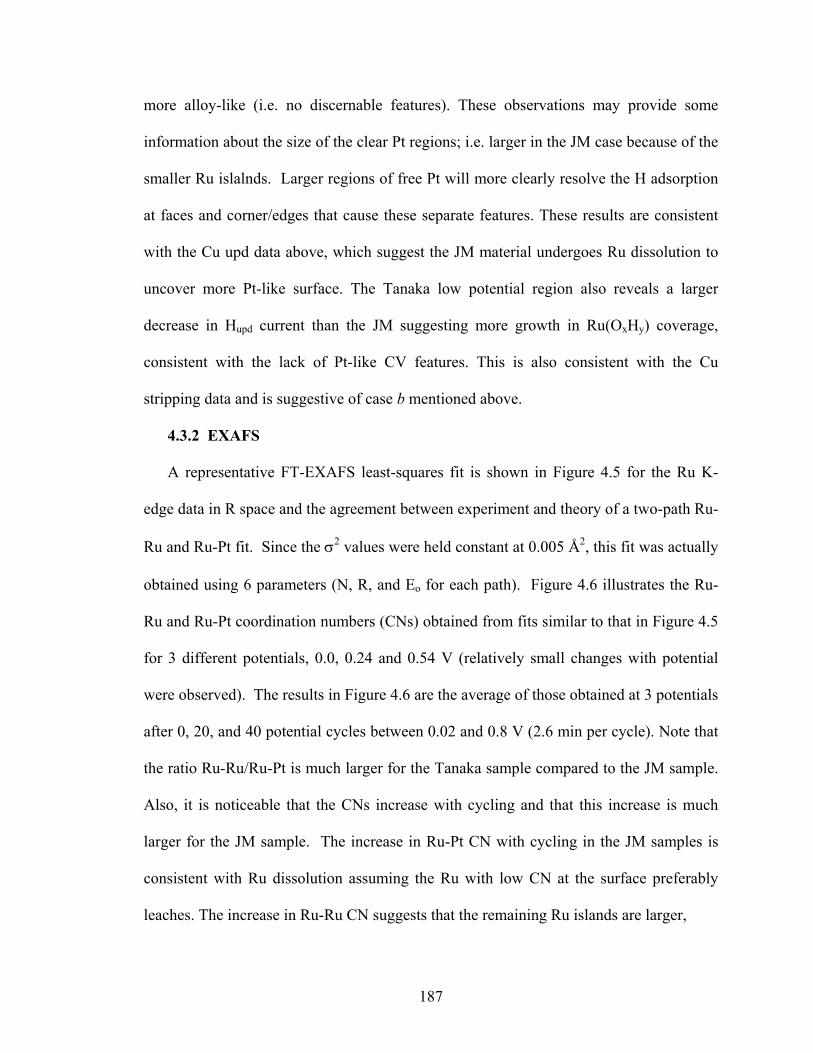
187
more alloy-like (i.e. no discernable features). These observations may provide some
information about the size of the clear Pt regions; i.e. larger in the JM case because of the
smaller Ru islalnds. Larger regions of free Pt will more clearly resolve the H adsorption
at faces and corner/edges that cause these separate features. These results are consistent
with the Cu upd data above, which suggest the JM material undergoes Ru dissolution to
uncover more Pt-like surface. The Tanaka low potential region also reveals a larger
decrease in Hupd current than the JM suggesting more growth in Ru(OxHy) coverage,
consistent with the lack of Pt-like CV features. This is also consistent with the Cu
stripping data and is suggestive of case b mentioned above.
4.3.2 EXAFS
A representative FT-EXAFS least-squares fit is shown in Figure 4.5 for the Ru K-
edge data in R space and the agreement between experiment and theory of a two-path Ru-
Ru and Ru-Pt fit. Since the σ2 values were held constant at 0.005 Å2, this fit was actually
obtained using 6 parameters (N, R, and Eo for each path). Figure 4.6 illustrates the Ru-
Ru and Ru-Pt coordination numbers (CNs) obtained from fits similar to that in Figure 4.5
for 3 different potentials, 0.0, 0.24 and 0.54 V (relatively small changes with potential
were observed). The results in Figure 4.6 are the average of those obtained at 3 potentials
after 0, 20, and 40 potential cycles between 0.02 and 0.8 V (2.6 min per cycle). Note that
the ratio Ru-Ru/Ru-Pt is much larger for the Tanaka sample compared to the JM sample.
Also, it is noticeable that the CNs increase with cycling and that this increase is much
larger for the JM sample. The increase in Ru-Pt CN with cycling in the JM samples is
consistent with Ru dissolution assuming the Ru with low CN at the surface preferably
leaches. The increase in Ru-Ru CN suggests that the remaining Ru islands are larger,
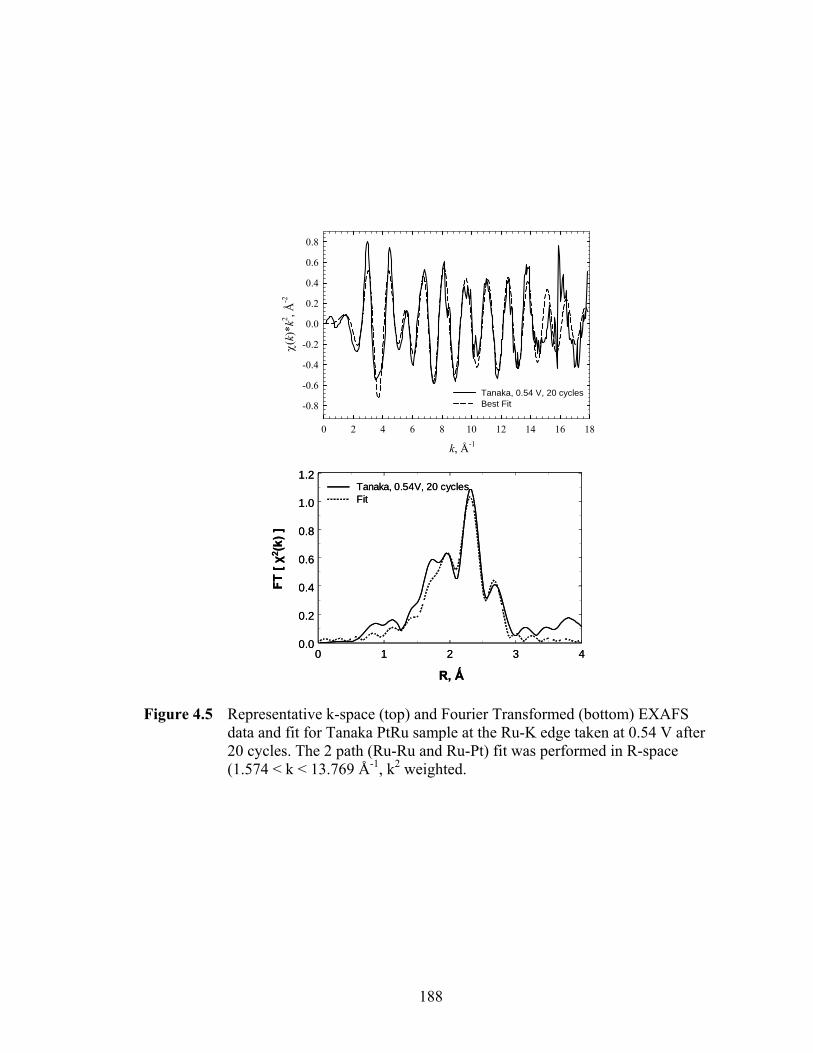
188
k, Å-1
0 2 4 6 8 10 12 14 16 18
χ(k)
*k2 , Å
-2
-0.8
-0.6
-0.4
-0.2
0.0
0.2
0.4
0.6
0.8
Tanaka, 0.54 V, 20 cyclesBest Fit
FT [ χ2
(k) ]
R, Ǻ
0 1 2 3 40.0
0.2
0.4
0.6
0.8
1.0
1.2Tanaka, 0.54V, 20 cyclesFit
FT [ χ2
(k) ]
R, Ǻ
0 1 2 3 40.0
0.2
0.4
0.6
0.8
1.0
1.2Tanaka, 0.54V, 20 cyclesFit
Figure 4.5 Representative k-space (top) and Fourier Transformed (bottom) EXAFS data and fit for Tanaka PtRu sample at the Ru-K edge taken at 0.54 V after 20 cycles. The 2 path (Ru-Ru and Ru-Pt) fit was performed in R-space (1.574 < k < 13.769 Å-1, k2 weighted.

189
0 10 20 30 40Cycles
3.0
3.2
3.4
3.6
3.8
4.0
4.2
RuPtRuRu
JMTanC
oord
inat
ion
Num
ber
Figure 4.6 Changes in average Ru-Ru and Ru-Pt CNs with cycling for both the JM and Tanaka catalysts. Error bars of ±0.1 are representative of the relative error, but the absolute error is probably larger.
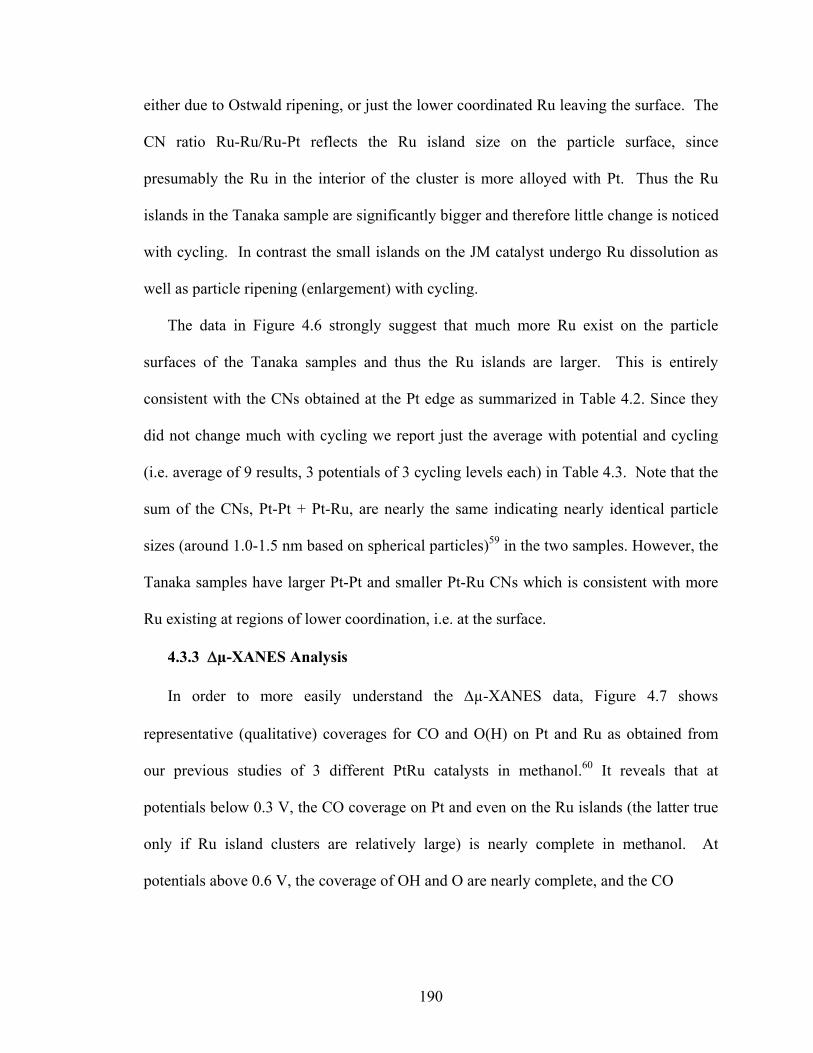
190
either due to Ostwald ripening, or just the lower coordinated Ru leaving the surface. The
CN ratio Ru-Ru/Ru-Pt reflects the Ru island size on the particle surface, since
presumably the Ru in the interior of the cluster is more alloyed with Pt. Thus the Ru
islands in the Tanaka sample are significantly bigger and therefore little change is noticed
with cycling. In contrast the small islands on the JM catalyst undergo Ru dissolution as
well as particle ripening (enlargement) with cycling.
The data in Figure 4.6 strongly suggest that much more Ru exist on the particle
surfaces of the Tanaka samples and thus the Ru islands are larger. This is entirely
consistent with the CNs obtained at the Pt edge as summarized in Table 4.2. Since they
did not change much with cycling we report just the average with potential and cycling
(i.e. average of 9 results, 3 potentials of 3 cycling levels each) in Table 4.3. Note that the
sum of the CNs, Pt-Pt + Pt-Ru, are nearly the same indicating nearly identical particle
sizes (around 1.0-1.5 nm based on spherical particles)59 in the two samples. However, the
Tanaka samples have larger Pt-Pt and smaller Pt-Ru CNs which is consistent with more
Ru existing at regions of lower coordination, i.e. at the surface.
4.3.3 Δµ-XANES Analysis
In order to more easily understand the Δµ-XANES data, Figure 4.7 shows
representative (qualitative) coverages for CO and O(H) on Pt and Ru as obtained from
our previous studies of 3 different PtRu catalysts in methanol.60 It reveals that at
potentials below 0.3 V, the CO coverage on Pt and even on the Ru islands (the latter true
only if Ru island clusters are relatively large) is nearly complete in methanol. At
potentials above 0.6 V, the coverage of OH and O are nearly complete, and the CO
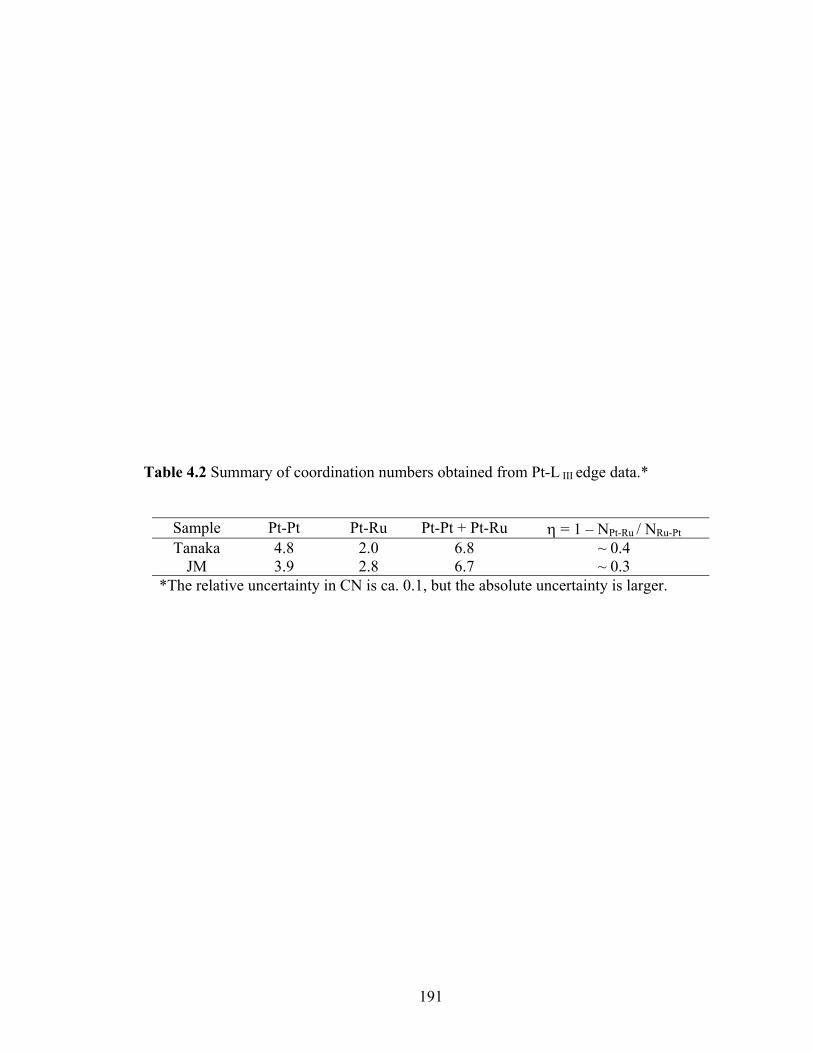
191
Table 4.2 Summary of coordination numbers obtained from Pt-L III edge data.*
Sample Pt-Pt Pt-Ru Pt-Pt + Pt-Ru η = 1 – NPt-Ru / NRu-Pt Tanaka 4.8 2.0 6.8 ~ 0.4
JM 3.9 2.8 6.7 ~ 0.3 *The relative uncertainty in CN is ca. 0.1, but the absolute uncertainty is larger.
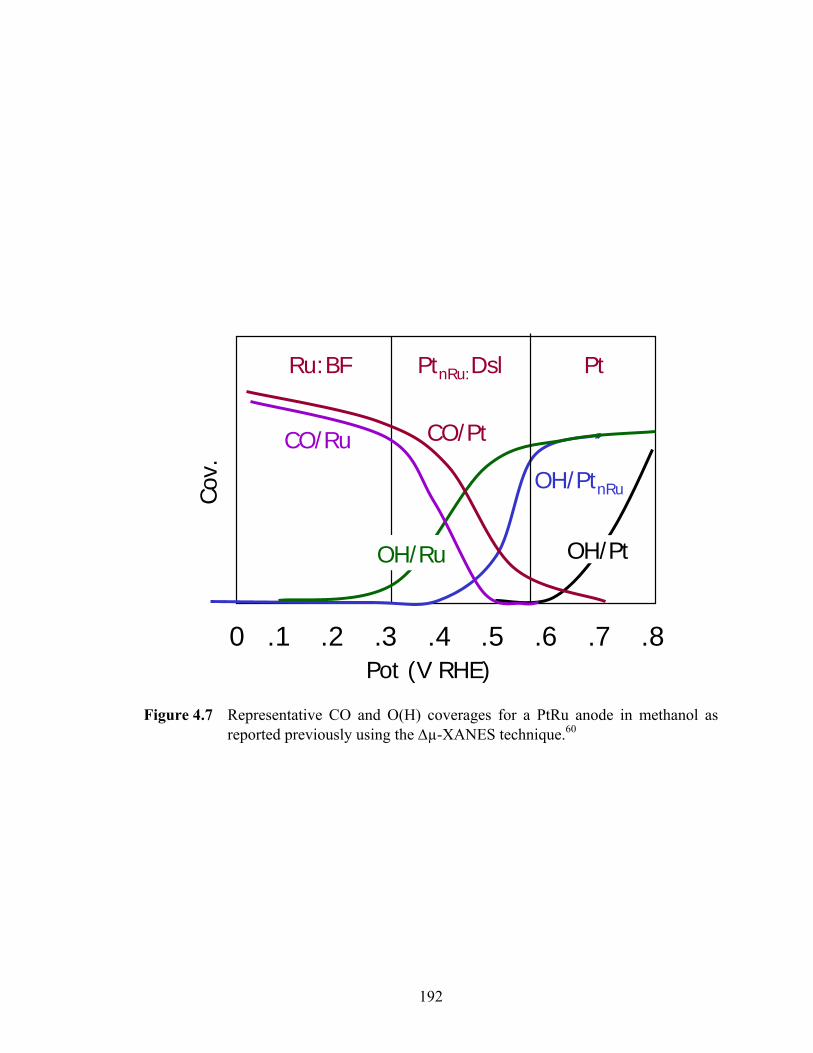
192
0 .1 .2 .3 .4 .5 .6 .7 .8
CO/Ru
OH/PtnRu
OH/PtOH/Ru
Ru:BF PtnRu:Dsl Pt
Pot (V RHE)
Cov.
CO/Pt
Figure 4.7 Representative CO and O(H) coverages for a PtRu anode in methanol as reported previously using the Δµ-XANES technique.60
193
coverage has dropped to unobservable levels. This occurs because of water activation
(Eq. 4.3) and the widely accepted mechanism for CO oxidation (Eq. 4.4):61-64
H2O + M → OH/M + H+ + e- (Eq. 4.3)
CO/Pt +OH/M → CO2 + Pt + M (Eq. 4.4)
Here, M can be either surface Pt or Ru atoms, and as illustrated in Figure 4.7, water
activation occurs at the lowest potential on Ru, followed by Pt near the Ru islands (PtnRu)
and finally on the Pt atoms. Figure 4.7 also indicates generally where the different CO
oxidation mechanisms (differentiated by the source of the OH) dominate. The
bifunctional (BF) mechanism dominates below 0.3 V when the facilitating OH comes
from the Ru, the direct surface ligand (DsL) mechanism dominates in the range 0.3 -0.5
V when the OH comes from the Pt atoms near the Ru (PtnRu), and the direct mechanism
above 0.5 V when the OH comes generally from the Pt atoms. Further, we found that
large Ru islands generally are more oxidized and hence exert a larger ligand effect on the
nearby Pt atoms, while smaller Ru islands experienced a “reverse” ligand effect from the
Pt, and were less reactive and were not oxidized at lower potentials. Therefore, the small
Ru atoms were available to activate water below 0.3 V and hence carry-out the BF
mechanism, while the larger Ru islands were heavily oxidized making the BF mechanism
inactive. The BF mechanism is seemingly more effective when small Ru islands exist
and the DsL mechanism when the larger Ru(OxHy) islands exist. Further, an educated
guess is made regarding the valence state of the Ru on the surface: what we term ‘heavily
oxidized’ most likely contain Ru in an oxidation state of 1.5-2.0 (as RuO) while those
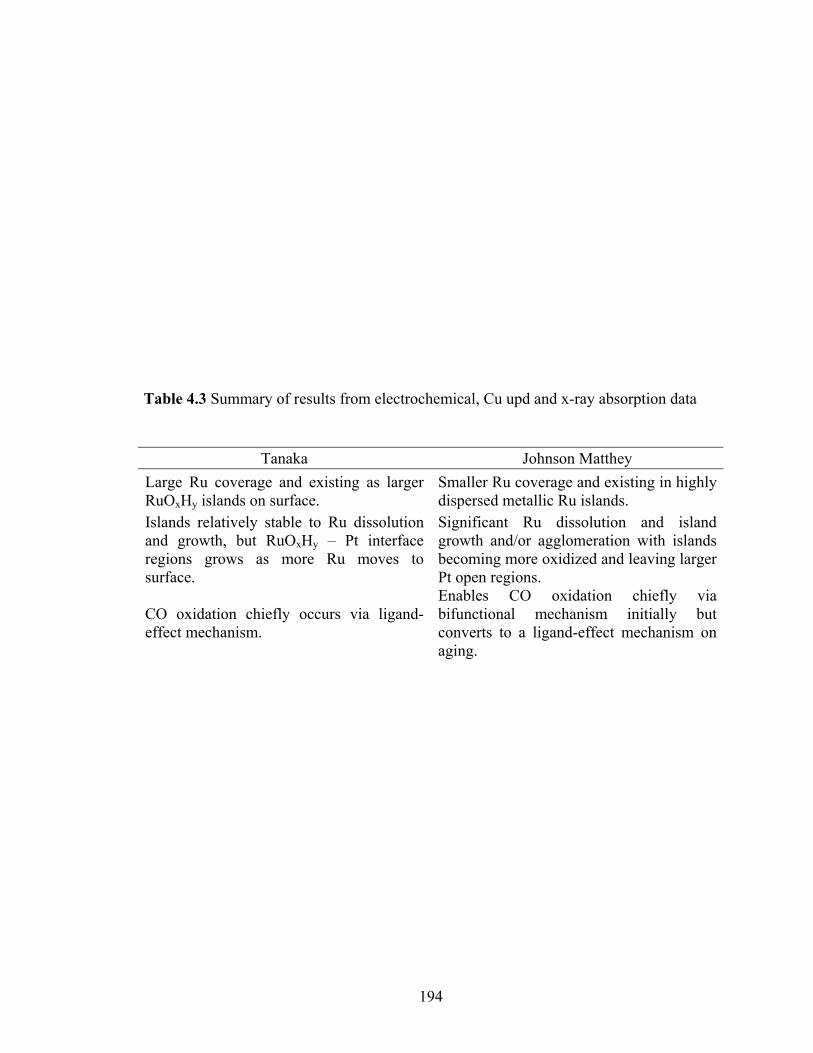
194
Table 4.3 Summary of results from electrochemical, Cu upd and x-ray absorption data
Tanaka Johnson Matthey
Large Ru coverage and existing as larger RuOxHy islands on surface.
Smaller Ru coverage and existing in highly dispersed metallic Ru islands.
Islands relatively stable to Ru dissolution and growth, but RuOxHy – Pt interface regions grows as more Ru moves to surface.
Significant Ru dissolution and island growth and/or agglomeration with islands becoming more oxidized and leaving larger Pt open regions.
CO oxidation chiefly occurs via ligand-effect mechanism.
Enables CO oxidation chiefly via bifunctional mechanism initially but converts to a ligand-effect mechanism on aging.
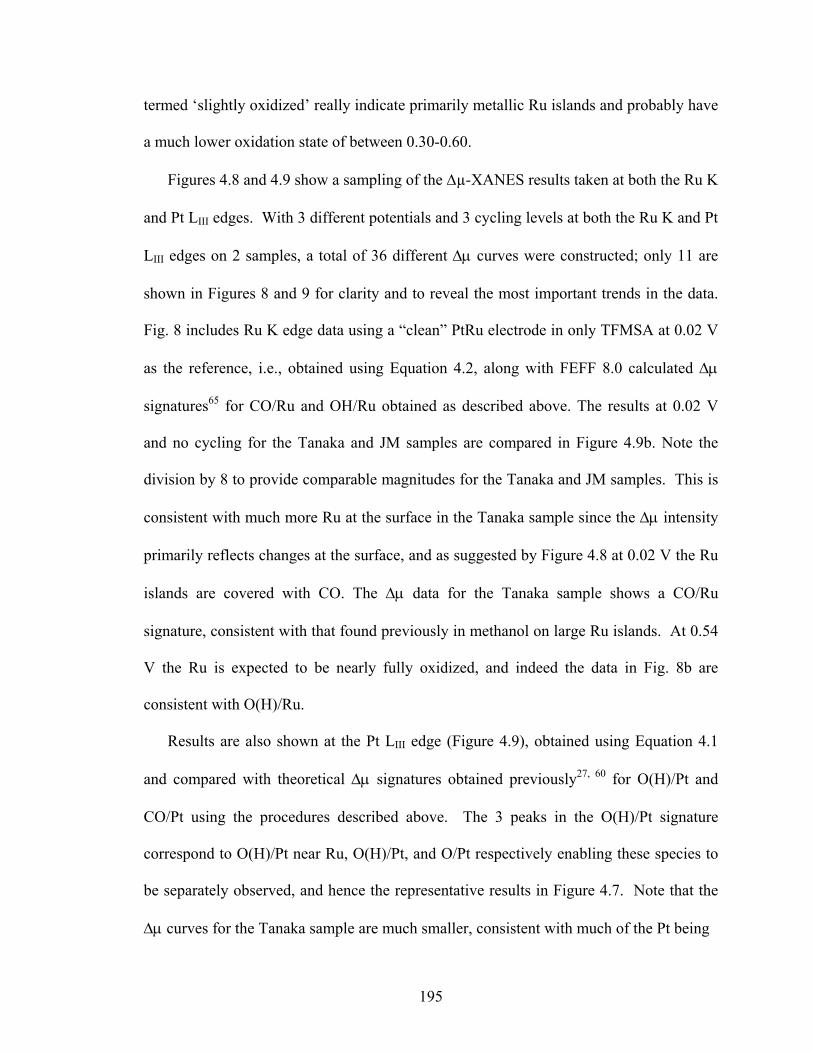
195
termed ‘slightly oxidized’ really indicate primarily metallic Ru islands and probably have
a much lower oxidation state of between 0.30-0.60.
Figures 4.8 and 4.9 show a sampling of the Δµ-XANES results taken at both the Ru K
and Pt LIII edges. With 3 different potentials and 3 cycling levels at both the Ru K and Pt
LIII edges on 2 samples, a total of 36 different Δμ curves were constructed; only 11 are
shown in Figures 8 and 9 for clarity and to reveal the most important trends in the data.
Fig. 8 includes Ru K edge data using a “clean” PtRu electrode in only TFMSA at 0.02 V
as the reference, i.e., obtained using Equation 4.2, along with FEFF 8.0 calculated Δμ
signatures65 for CO/Ru and OH/Ru obtained as described above. The results at 0.02 V
and no cycling for the Tanaka and JM samples are compared in Figure 4.9b. Note the
division by 8 to provide comparable magnitudes for the Tanaka and JM samples. This is
consistent with much more Ru at the surface in the Tanaka sample since the Δμ intensity
primarily reflects changes at the surface, and as suggested by Figure 4.8 at 0.02 V the Ru
islands are covered with CO. The Δμ data for the Tanaka sample shows a CO/Ru
signature, consistent with that found previously in methanol on large Ru islands. At 0.54
V the Ru is expected to be nearly fully oxidized, and indeed the data in Fig. 8b are
consistent with O(H)/Ru.
Results are also shown at the Pt LIII edge (Figure 4.9), obtained using Equation 4.1
and compared with theoretical Δμ signatures obtained previously27, 60 for O(H)/Pt and
CO/Pt using the procedures described above. The 3 peaks in the O(H)/Pt signature
correspond to O(H)/Pt near Ru, O(H)/Pt, and O/Pt respectively enabling these species to
be separately observed, and hence the representative results in Figure 4.7. Note that the
Δμ curves for the Tanaka sample are much smaller, consistent with much of the Pt being
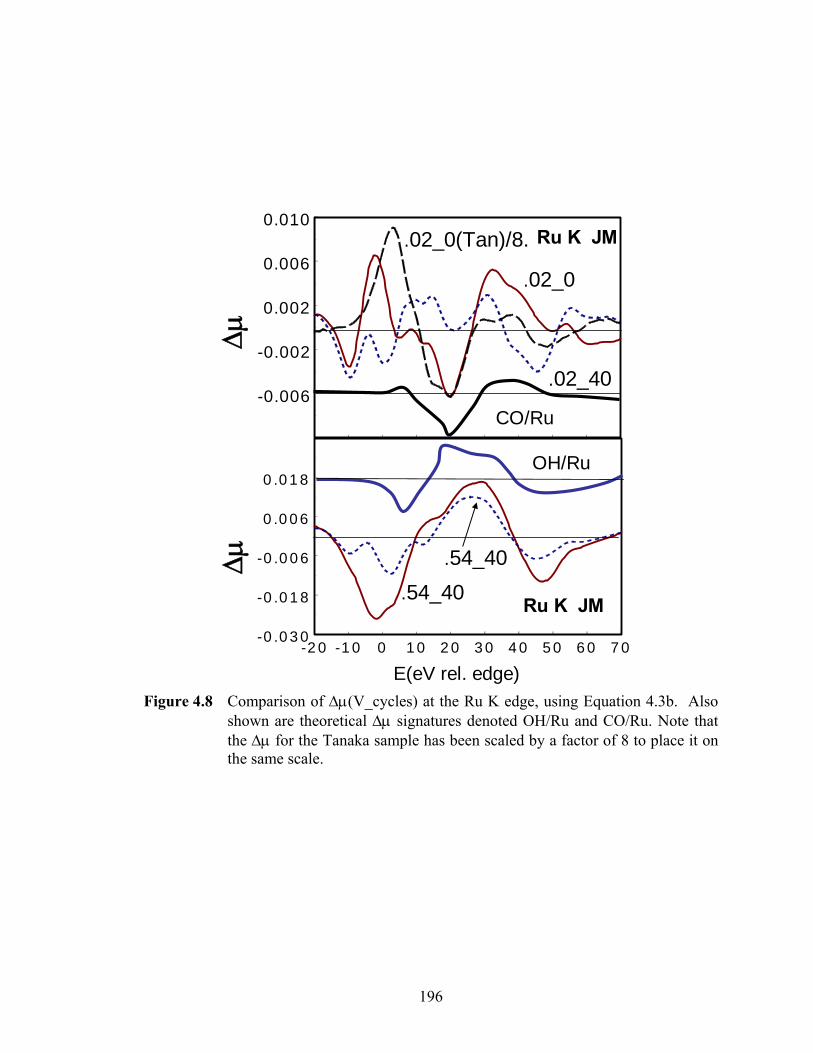
196
-0 010
-0.006
-0.002
0.002
0.006
0.010
.02_0
.02_40
.02_0(Tan)/8.
-2 0 -1 0 0 1 0 2 0 3 0 4 0 5 0 6 0 7 0-0 .0 3 0
-0 .0 1 8
-0 .0 0 6
0 .0 0 6
0 .0 1 8
0 .0 3 0
E(eV rel. edge)
Δμ
Δμ
Ru K JM
Ru K JM
.54_40.54_40
CO/Ru
OH/Ru
Figure 4.8 Comparison of Δμ(V_cycles) at the Ru K edge, using Equation 4.3b. Also
shown are theoretical Δμ signatures denoted OH/Ru and CO/Ru. Note that the Δμ for the Tanaka sample has been scaled by a factor of 8 to place it on the same scale.

197
-0 03
-0.02
-0.01
0.00
0.01
0.02
-10 0 10 20 30E (eV rel. edge)
-0.04
-0.02
0.00
0.02
0.04
Δμ
CO/Pt
O(H)/Pt Pt L3 Tan
.02_0.02_40
Δμ
Pt L3 JM.24_0
.54_0.54_40.24_40
Figure 4.9 Comparison of Δμ(V_cycles) lineshapes at the Pt LIII edge using Eq. 4.3a. Also indicated are theoretical signatures for O(H)/Pt,27, 60 and CO/Pt. The three features in the OH/Pt signature correspond to OH/Pt near a Ru site, OH/Pt away from the Ru islands, and O/Pt.
198
covered by the large Ru islands. Thus the EXAFS and Δμ data consistently reveal that
the Tanaka sample has a much larger component of Ru and hence larger islands on the
surface when compared with the JM samples.
4.4 Discussion
The results above straightforwardly show that much more Ru initially exists on the
surface of the Tanaka samples compared with the JM samples. But careful comparison of
the changes in Δμ reveal much more interesting changes with potential cycling and the
nature of the Ru islands themselves. Such observations shall be discussed in greater
detail in the sections that follow.
4.4.1 Oxidation state of Ru islands
The ratio of the Pt-Ru/Ru-Pt CN’s reflect the relative oxidation level of the Ru islands
in the two samples. To understand this, consider a simple ensemble of 3 Pt atoms
coordinated to 1 Ru. There will be 3 Pt-Ru “interactions” so the average Pt-Ru CN = 1
and Ru-Pt = 3 in this case, i.e. each Pt sees one Ru atom and each Ru atom 3 Pt atoms.
Therefore the ratio Pt-Ru/Ru-Pt (i.e. 1/3) reflects the ratio of Ru/Pt atoms. However, the
catalysts contain an equal number of Pt and Ru atoms, but the oxidized Ru atoms are
essentially taken out of the metal-metal scattering if they are surrounded by O atoms.
Therefore this ratio reflects the fraction of unoxidized Ru atoms, and η = 1-(Pt-Ru/Ru-Pt)
the fraction oxidized. These oxidized fractions are listed in Table 4.2. Of course
considerable Ru may exist in the interior of the particles, so this is not the total fraction of
Ru at the surface that is more oxidized (those will be much higher), but these fractions
are consistent with a greater fraction of Ru at the surface in the Tanaka samples. It is also
worth mentioning that the larger islands are more oxidized than the smaller, more
199
dispersed ones, which tend to be more metallic in nature, as found previously. 60 Another
recent study which employed XAS (ex situ) and TEM on PtRu catalysts also provide
support for the existence of oxidized Ru islands in PtRu catalysts.66 Is it possible to make
any comments on the size of these Ru islands on the catalysts? While the absolute size of
the islands likely cannot be determined by any of the methods used in this study, we
would like to point out that it is the disparity in island size between the highly dispersed,
smaller and largely metallic Ru islands, and the larger and more oxidized Ru islands that
are observed and account for some of the differences in the aging processes occurring on
the two catalysts.
The Δμ magnitude and signatures for the Ru islands on the Tanaka sample do not
show much change with cycling, as expected for larger islands. Further, all signatures
reflect CO/Ru at all potentials ≤ 0.54 V, consistent with Figure 4.7. But these larger
RuOxHy islands exert a larger electronic or ligand effect on the nearby Pt atoms27, 60
increasing the oxophilicity of those Pt atoms. This trend is clearly seen in Figure 4.9b
showing some O(H)/Pt near the Ru islands already in the Tanaka samples at 0.02 V,
compared with the JM sample requiring 0.54 V for this to be evident. The following
sections discuss the catalyst aging process as a metal dissolution-agglomeration process
as a function of number of cycles and a visual summary of the two different aging
processes are depicted in Figure 4.10
4.4.2 Ru dissolution and agglomeration
At 0.54 V, any Ru at the surfaces is expected to be covered with O (see Figure 4.7),
and this is consistent with the Ru Δμ signatures in Figure 4.9b for the JM samples.
However, it shows that the magnitude of this signature decreases with cycling, indicating
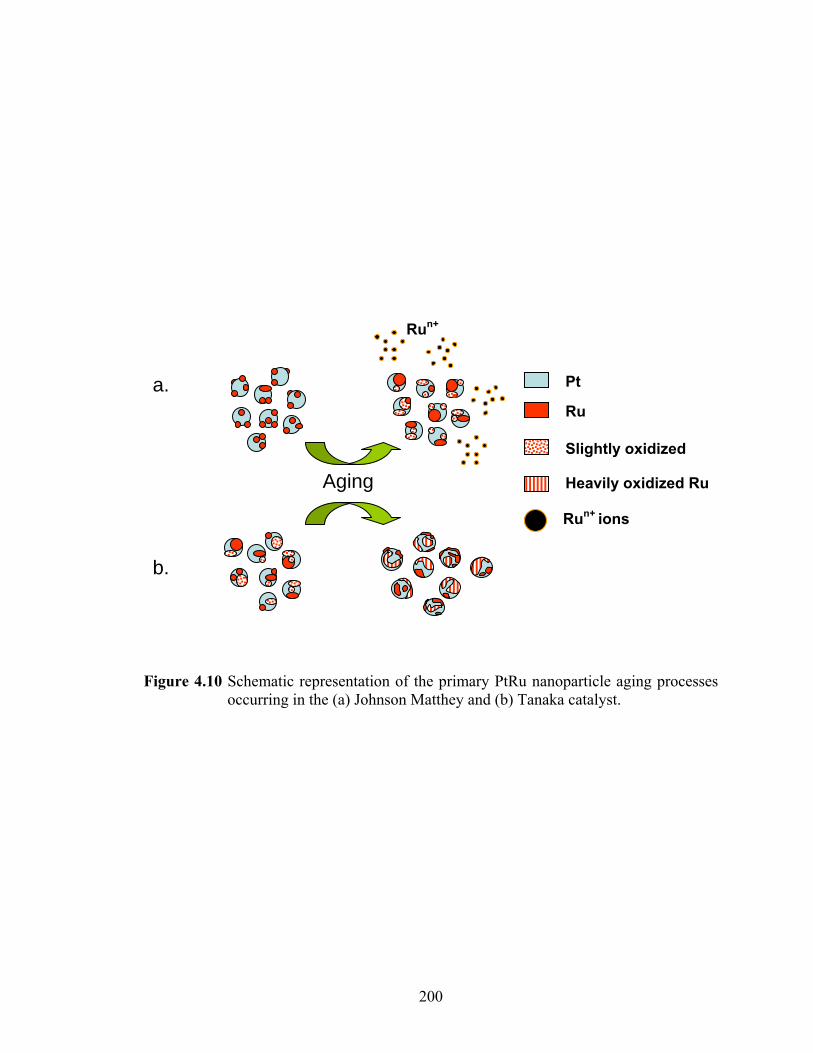
200
Figure 4.10 Schematic representation of the primary PtRu nanoparticle aging processes occurring in the (a) Johnson Matthey and (b) Tanaka catalyst.
a.
b.
Pt
Ru
Slightly oxidized
Heavily oxidized RuAging
Run+
Run+ ions
201
that Ru is leaving the surface; i.e. dissolution of Ru. At 0.02 V however, the Δμ
signature obtained at the Ru edge reflects CO/Ru at zero cycles, but more of an O(H)
signature with a component of CO/Ru after 40 cycles. This clearly suggests that the Ru
islands, as they get larger, become more oxidized as indicated above. The growth in Ru-
Ru CN number seen in the EXAFS can come from both particle agglomeration and Ru
dissolution, since the smallest Ru islands presumably undergo dissolution the fastest. The
Δμ data clearly show that both are occurring in the JM sample. Similar phenomena have
been observed using High-Resolution Transmission Electron Microscopy (HR-TEM) and
Secondary-Ion Mass Spectrometry (SIMS) in a recent study on the decomposition of
PtRu anode catalysts.67
4.4.3 Pt dissolution and agglomeration
Although not reported in Table 4.2, the Pt-Pt CNs in the Tanaka sample do show
some variation with cycling (5.1 (0 cycles) down to 4.8 (20 cycles) and then back to 5.2
(40 cycles)). This suggests that the smaller PtRu particles initially underwent dissolution,
followed by agglomeration of some of the remaining particles. The Δμ data are consistent
with this change. The Δμ signatures at 0.02 V (Figure 4.9), when the Pt surface should be
nearly covered by CO, reveal a decrease in magnitude with cycling and indeed, even the
presence of a small amount of OH/Pt at 0.54 V after 40 cycles. This suggests an increase
in the efficiency of CO oxidation with cycling. This OH/Pt near the Ru islands is directly
evident in the Δμ(0.02_40) signature, showing the strong ligand effect of the large Ru
islands in the Tanaka sample. The increase in CO oxidation (i.e. reduction in CO on
surface) with cycling may either be due to elimination of the smaller PtRu particles,
202
where the CO oxidation might be less efficient, or at least indicates a smoothing of the Pt
surface perhaps from Pt dissolution of the corners or edges. This would enable a greater
fraction of more mobile CO, or more likely simply a reduction in Pt surface area
consistent with the Cu upd data in Table 4.1. Komanicky et al. found that the nanofaceted
surface dissolves faster indicating the edges and corners are the main sources of
dissolution. 7 In any event, the extent of CO on Pt appears to decrease in magnitude with
cycling for the Tanaka catalysts (Figure 4.9b). This is in contrast to that occurring on the
JM catalysts, where Figure 4.9a clearly shows the opposite trend, consistent with the Cu
upd data in Table 4.1.
4.4.4 Interpretation of CO stripping curve changes
We can now understand the changes in the CO stripping curves for the catalysts
before and after an 8-hour CA test as shown earlier in Figure 4.1. The Ru particles on the
Tanaka samples are heavily oxidized to begin with and therefore show no significant
change in RuOxHy content on aging. There is consequently hardly any change in the
onset potential for the CO oxidation as there is no change in the nature of the Ru islands.
The increased CO oxidation current and peak potential is likely due to increased
availability of the interface Ru(OxHy)-Pt sites where the ligand mechanism is active,
consistent with the schematic in Figure 4.10 showing more interface regions and less
clear Pt regions. The JM sample on the other hand, has much smaller, metallic Ru islands
on the surface to begin with, and on aging, undergoes dissolution and Ru island growth
via oxidation and agglomeration. The growth in island size changes the islands from
mostly Ru to Ru(OxHy), and hence the dominant CO oxidation mechanism changes from
the bifunctional to the direct surface ligand effect, which moves CO oxidation to slightly
203
higher potential as illustrated in Figure 4.7. It has been shown previously that available
RuOxHy species are critical for the CO oxidation properties of a PtRu alloy catalyst. 68, 69
Further, it is interesting to note that the CO stripping curves for the aged JM catalyst
begins to look more like the CO stripping curves for the Tanaka catalyst. This is
consistent with the fact that more of the Ru islands are now bigger and oxidized, just as
the Tanaka catalysts were in their initial state prior to the aging process.
4.5 Conclusions
The electrochemical, EXAFS and Δµ-XANES analyses consistently show that the
Tanaka sample has much more Ru segregated to the surface, exist in larger islands and
are present in more oxidized, stable Ru(OxHy) forms. The smaller Ru islands in the JM
sample were found to undergo faster dissolution of Ru as well as agglomeration with
cycling or chronoamperometric aging in methanol. The findings from this work are
summarized in Table 4.3. These results suggest that the smaller Ru islands, which
facilitate CO oxidation more favorably via the bi-functional mechanism at lower
potential, are relatively unstable in methanol at the surface of unsupported PtRu particles.
Therefore in a DMFC, larger Ru islands, which are less susceptible to dissolution and
induce a larger ligand effect (albeit at somewhat higher potential compared to the BF
mechanism) will be much more stable and effective. They also corroborate previous
findings that available ruthenium oxide and hydroxide phases rather than metallic Ru
along with Pt are essential for stable CO oxidation properties of a PtRu catalyst.
It could certainly be argued that with the proposed aging mechanisms evident in this
work, the JM particles should eventually become more like the Tanaka catalysts,
consistent with the CO oxidation curves in Figure 4.1. However, the CVs in Figure 4.4

204
suggest that there are still significant differences after cycling. It is thus apparent that in
the case of the JM catalysts, while some of the smaller Ru particles are lost to dissolution
and others grow in size on the surface due to Ostwald ripening and agglomeration, the
islands are still a bit smaller and hence less oxidized compared with those found on the
Tanaka catalysts. The XAS and CO stripping results above show that the Tanaka sample
in comparison with the JM catalyst, actually showed some signs of improvement after 40
cycles, consistent with some RuOxHy island growth even in the Tanaka catalysts.
4.6 Acknowledgments
Financial support for this project was provided by the Army Research Office via both
single investigator and Multi University Research Initiatives (P.I. Case Western Reserve
University). The authors are also grateful for the use of beamline X23-A2 at the National
Synchrotron Light Source, Brookhaven National Laboratory, which is supported by the
U.S. Department of Energy, Office of Science, Office of Basic Energy Sciences, under
Contract No. DE-AC02-98CH10886.
205
4.7 References
1. Fuel Cells Durability and Performance: Stationary, Automotive, Portable (William Andrew Applied Science Publishers Norwich, NJ, 2006).
2. Borup, R., Davey, J., Wood, D., Garzon, F. & Inbody, M. PEM fuel cell durability. DOE hydrogen program report, VII.I.3, 1039 (2005).
3. Dam, V. A. & de Bruijn, F. J. Electrochem. Soc. 154, B495 (2007).
4. Ferreira, P. J. et al. Journal of the Electrochemical Society 152, A2256 (2005).
5. Johnson, D. C., Napp, D. T. & Bruckenstein, S. Electrochim. Acta 15, 1493 (1970).
6. Kinoshita, K., Lundquist, J. T. & Stonehart, P. J. Electroanal. Chem. 48, 157 (1973).
7. Komanicky, V. et al. Journal of the Electrochemical Society 53, B446 (2006).
8. Ota, K., Nishigori, S. & Kamiya, N. J. Electroanal. Chem. 247, 205 (1988).
9. Ralph, T. R. & Hogarth, M. P. Platinum Met. Rev. 46, 117 (2002).
10. Rand, D. A. J. & Woods, R. J. Electroanal. Chem. 36, 57 (1972).
11. Wang, X., Kumar, R. & Myers, D. J. Electrochem. and Solid-State Lett. 9, A225 (2006).
12. Wilson, M. S., Garzon, F., Sickafus, K. E. & Gottesfeld, S. J. Electrochem. Soc. 140, 2872 (1993).
13. Xie, J., Wood, D. L., More, K. L., Atanassov, P. & Borup, R. L. Journal of the Electrochemical Society 152, A104-A113 (2005).
14. Yasuda, K., Taniguchi, A., Akita, T., Ioroi, T. & Siroma, Z. Phys. Chem. Chem. Phys. 8, 746 (2006).
15. Antolini, E., Salgado, J. R. C. & Gonzalez, E. R. J. Power Sources 160, 957 (2006).
16. Chen, W. et al. J. Power Sources 160, 933 (2006).
17. Holstein, W. L. & Rosenfeld, H. D. J. Phys. Chem. B 109, 2176 (2005).
18. Hwang, B. J. et al. J. Am. Chem. Soc. 127, 11140 (2005).
19. Jeon, M. K. et al. J. Power Sources 158, 1344 (2006).
206
20. Liu, J. et al. Phys. Chem. Chem. Phys. 6, 134 (2004).
21. Lukaszewski, M. & Czerwinski, A. J. Electroanal. Chem. 589, 38 (2006).
22. Sarma, L. S. et al. J. Power Sources 167, 358 (2007).
23. Christian, E., Piotr, P., John, D. & Piotr, Z. Recoverable Cathode Performance Loss in Direct Methanol Fuel Cells. J. Electrochem. Soc. 153, A171-A178 (2006).
24. Lajos, G., Nazih, H., Brian, H. & Sanjeev, M. Dissolution of Ru from PtRu Electrocatalysts and its Consequences in DMFCs. ECS Transactions 3, 607-618 (2006).
25. Piela, P., Eickes, C., Brosha, E., Garzon, F. & Zelenay, P. J. Elecrochem. Soc. 151, A2053 (2004).
26. Janin, E., von Schenck, H., Gothelid, M., Karlsson, U. O. & Svensson, M. Phys. Rev. B 61 13144 (2000).
27. Scott, F. J., Roth, C. & Ramaker, D. E. J. Phys. Chem. C 111, 11403-11413 (2007).
28. Murthi, V. et al. Meet. Abstr. - Electrochem. Soc. 702, 403 (2007).
29. Darling, R. M. & Meyers, J. P. J. Elecrochem. Soc. 150, A1523 (2003).
30. Anderson, A. B. & Shiller, P. J. Phys. Chem. B 102, 2696 (1998).
31. Wang, Z.-B. et al. Catalyst failure analysis of a direct methanol fuel cell membrane electrode assembly. J. Power Sources 177, 386-392 (2008).
32. Wang, Z.-B. et al. Investigation of the performance decay of anodic PtRu catalyst with working time of direct methanol fuel cells. J. Power Sources 181, 93-100 (2008).
33. Zhang, J., Sasaki, K., Sutter, E. & Adzic, R. R. Science 315, 220 (2007).
34. Ramaker, D. E. & Koningsberger, D. C. Comment on "Effect of Hydrogen Adsorption on the X-Ray Absorption Spectra of Small Pt Clusters". Phys. Rev. Lett. 89, 139701 (2002).
35. McBreen, J. & Mukerjee, S. J. Elecrochem. Soc. 142, 3399 (1995).
36. McBreen, J., O'Grady, W. E., Pandya, K. I., Hoffman, R. W. & Sayers, D. E. Langmuir 3, 428 (1987).
37. Enayetullah, M. A., DeVilbiss, T. D. & Bockris, J. O. J. Electrochem. Soc. 136, 3369 (1989).
207
38. Green, C. L. & Kucernak, A. Determination of the Platinum and Ruthenium Surface Areas in Platinum−Ruthenium Alloy Electrocatalysts by Underpotential Deposition of Copper. I. Unsupported Catalysts. The Journal of Physical Chemistry B 106, 1036-1047 (2002).
39. Koningsberger, D. C., de Graaf, J., Mojet, B. L., Ramaker, D. E. & Miller, J. T. The metal-support interaction in Pt/Y zeolite: evidence for a shift in energy of metal d-valence orbitals by Pt-H shape resonance and atomic XAFS spectroscopy. Applied Catalysis A: General 191, 205-220 (2000).
40. Teliska, M., O'Grady, W. E. & Ramaker, D. E. J. Phys. Chem. B 108, 2333 (2005).
41. Ramaker, D. E., Mojet, B.L., Garriga Oostenbrink, M.T., Miller, J.T. and Koningsberger, D.C. . Physical Chemistry Chemical Physics 1, 2293 (1999).
42. Koningsberger, D. C., de Graaf, J., Mojet, B. L., Ramaker, D. E. & Miller, J. T. The metal-support interaction in Pt/Y zeolite: evidence for a shift in energy of metal d-valence orbitals by Pt-H shape resonance and atomic XAFS spectroscopy. Appl. Catal. A 191, 205-220 (2000).
43. Arruda, T. M., Shyam, B., Ziegelbauer, J. M., Mukerjee, S. & Ramaker, D. E. Investigation into the Competitive and Site-Specific Nature of Anion Adsorption on Pt Using In Situ X-ray Absorption Spectroscopy. J. Phys. Chem. C (2008).
44. Teliska, M., O'Grady, W. E. & Ramaker, D. E. Determination of H Adsorption Sites on Pt/C Electrodes in HClO4 from Pt L23 X-ray Absorption Spectroscopy. J. Phys. Chem. B 108, 2333-2344 (2004).
45. Teliska, M., O'Grady, W. E. & Ramaker, D. E. Determination of O and OH Adsorption Sites and Coverage in Situ on Pt Electrodes from Pt L23 X-ray Absorption Spectroscopy. J. Phys. Chem. B 109, 8076-8084 (2005).
46. Teliska, M., Murthi, V. S., Mukerjee, S. & Ramaker, D. E. J. Elecrochem. Soc. 152, A2159 (2005).
47. Scott, F. J., Mukerjee, S. & Ramaker, D. E. CO coverage/oxidation correlated with PtRu electrocatalyst particle morphology in 0.3 M methanol by in situ XAS. J. Electrochem. Soc. 154, A396-A406 (2007).
48. Ravel, B. & Newville, M. J. Synchrotron. Rad. 12, 537 (2005).
49. Newville, M., Livins, P., Yacoby, Y., Rehr, J. J. & Stern, E. A. Phys. Rev. B 47, 14126 (1993).
50. Koningsberger, D. C., de Graaf, J., Mojet, B. L., Ramaker, D. E. & Miller, J. T. J. Catal. A 191, 205 (2000).
208
51. Koningsberger, D. C., Oudenhuijzen, M. K., Bitter, J. H. & Ramaker, D. E. Top. Catal. 10, 167 (2000).
52. Mojet, B. L., Miller, J. T., Ramaker, D. E. & Koningsberger, D. C. J. Catal. 186, 373 (1999).
53. Mojet, B. L., Ramaker, D. E., Miller, J. T. & Koningsberger, D. C. Catal. Lett. 62, 15 (1999).
54. Ramaker, D. E., Mojet, B. L., Oostenbrink, G., Miller, J. T. & Koningsberger, D. C. Phys. Chem. Chem. Phys. 1, 2293 (1999).
55. Teliska, M., Murthi, V. S., Mukerjee, S. & Ramaker, D. E. Site-Specific vs Specific Adsorption of Anions on Pt and Pt-Based Alloys. J. Phys. Chem. C 111, 9267-9274 (2007).
56. Scott, F. J., Roth, C. & Ramaker, D. E. J. Phys. Chem. C (In Press).
57. Balbuena, P. B. et al. J. Phys. Chem. A 108, 6378 (2004).
58. Xu, Y., Ruban, A. V. & Mavrikakis, M. J. Am. Chem. Soc. 126, 4717 (2004).
59. Hardeveld R.V., M. A. V. Surface Science 4, 396 (1969).
60. Scott, F. J., Mukerjee, S. & Ramaker, D. E. CO coverage/oxidation correlated with PtRu electrocatalyst particle morphology in 0.3 M methanol by in situ XAS. Journal of the Electrochemical Society 154, A396-A406 (2007).
61. M. Watanabe, S. M. Electrocatalysis by ad-atoms Part II. Enhancement of Oxidation of Methanol on Platinum by Ruthenium Ad-atoms. J. Electroanal. Chem. 60, 275-273 (1975).
62. Ticanelli, E., Beery, J. G., Paffett, M. T. & Gottesfeld, S. An electrochemical, ellipsometric, and surface science investigation of the PtRu bulk alloy surface. Journal of Electroanalytical Chemistry 258, 61-77 (1989).
63. Kim, H., Rabelo de Moraes, I., Tremiliosi-Filho, G., Haasch, R. & Wieckowski, A. Chemical state of ruthenium submonolayers on a Pt(111) electrode. Surf. Sci. 474, L203-L212 (2001).
64. Richard J.K. Wiltshire, C. R. K., Abigail Rose, Peter P. Wells, Hazel Davies, Martin P. Hogarth, David Thompsett, Brian Theobald, Fredrick W. Mosselmans, Mark Roberts, Andrea Russell. Effects of composition on structure and activity of PtRu/C catalysts. Physical Chemistry Chemical Physics 11, 2305-2313 (2009).
65. Zabinsky, S. I., Rehr, J. J., Ankudinov, A., Albers, R. C. & Eller, M. J. Multiple-scattering calculations of x-ray-absorption spectra. Physical Review B 52, 2995 (1995).
209
66. Nitani, H. et al. Methanol oxidation catalysis and substructure of PtRu bimetallic nanoparticles. Appl. Catal., A 326, 194-201 (2007).
67. Kim, J.-W. & Park, S.-M. In Situ XANES Studies of Electrodeposited Nickel Oxide Films with Metal Additives for the Electro-Oxidation of Ethanol. Journal of The Electrochemical Society 150, E560-E566 (2003).
68. Long, J. W., Stroud, R. M., Swider-Lyons, K. E. & Rolison, D. R. How To Make Electrocatalysts More Active for Direct Methanol Oxidation Avoid PtRu Bimetallic Alloys! J. Phys. Chem. B 104, 9772-9776 (2000).
69. Vijayaraghavan, G., Gao, L. & Korzeniewski, C. Methanol Electrochemistry at Carbon-Supported Pt and PtRu Fuel Cell Catalysts: Voltammetric and in Situ Infrared Spectroscopic Measurements at 23 and 60 °C. Langmuir 19, 2333-2337 (2003).
210
Chapter 5
Fundamental Aspects of Spontaneous Cathodic Deposition of Ru onto
Pt/C Electrocatalysts and Membranes under Direct Methanol Fuel Cell
Operating Conditions: An In situ X-ray Absorption Spectroscopy and
Electron Spin Resonance Study∗
5.1 Introduction
Direct Methanol Fuel Cells (DMFCs) offer the promise of high energy density power
for both portable and stationary applications. Electronic devices are often sited as being
the greatest benefactors of DMFCs, which could offer a 10-fold increase in power density
in comparison to lithium-ion batteries.1 Despite the above mentioned qualities, DMFCs
have faced significant technological hurdles, hence impeding large scale
∗ Published in the Journal of Physical Chemistry C, 2010, 114 (2), 1028–1040 Authors: Thomas M. Arruda, Badri Shyam, Jamie S. Lawton, Nagappan Ramaswamy, David E. Budil, David E. Ramaker, and Sanjeev Mukerjee Sample preparation and electrochemistry data were collected by authors affiliated with Northeastern University. XAS experiments and data analysis were carried out by authors from The George Washington University and Northeastern University.
211
commercialization. Much of these issues rest on materials challenges such as activity and
stability of anode electrocatalysts and concomitant role of membranes.
As indicated in prior reviews by Stuve et al.2 and Wieckowski et al., 3,4
electrocatalysis of the six-electron methanol oxidation reaction (MOR) can be considered
as a two step process. The first is the initial dehydrogenation step involving the
abstraction of the first hydrogen by breaking the C-H bond in methanol (the next two
dehydrogenation steps being more facile). The second is the oxidation of the CO and
CHO moieties formed on the surface following the dehydrogenation steps. The current
state of the art electrocatalysts rely on the ‘bifunctional approach,’ in which a second
element, such as Ru, initiates oxidation of the CO or CHO species by activating water
(hence forming surface oxygenated species such as OH) at lower potentials. However, as
reported previously,5 these dual electrocatalytic requirements cause a simple bifunctional
catalyst with good nucleation of oxygenated species at lower overpotential to fail as a
good electrocatalyst for methanol oxidation, despite excellent CO oxidation
characteristics. This has been shown previously for PtSn electrocatalyst 5, 6 and more
recently for PtMo.7 In the latter case, while PtMo/C exhibited more than three fold
enhancement for CO oxidation as compared to the current state of the art PtRu/C, there
was no concomitant increase in activity for methanol oxidation. The activity for MOR
was closer to that for pure Pt despite its enhanced ability to oxidized CO. At the moment,
PtRu remains as the electrocatalyst of choice, however, in contrast to CO electro-
oxidation, supported electrocatalysts have shown limited ability to sustain electrocatalytic
activity beyond 0.3 A/cm2. This has necessitated the use of either unsupported
212
electrocatalysts or those with high electrocatalyst loading, which are an order of
magnitude higher than the current state of the art low Pt loading electrodes.
From an electrocatalytic perspective, stability of PtRu in its various forms (supported,
unsupported and in some cases as decorated nano particles (i.e., Ru decorated on Pt and
vice versa) is of paramount interest not only from the perspective of its dissolution and
other changes in anode electrocatalyst morphology but also from the perspective of any
dissolved adducts migrating to the cathode electrode and associated effect on the
membrane. In 2004, Piela and co-workers showed that PtRu anodes are susceptible to Ru
dissolution in an actual working fuel cell stack.8, 9 Although the concept of Ru dissolution
had been previously known,10-16 the direct consequences of spontaneous Ru deposition
onto the cathode catalyst from the anode had not been previously illustrated. To further
complicate matters, they also observed Ru ions in the polymer electrolyte membrane
(PEM).8
As reported by us earlier, the deposition of Ru on Pt under cathode operating
conditions results can translate to ~ 40 – 200 mV overpotential.17 To fully investigate the
extent of Ru poisoning, a fundamental investigation through rotating disk electrode
(RDE) studies was also carried out. It was noted that only μM quantities of dissolved Ru
has dramatic negative effects on the oxygen reduction reaction (ORR) electrode kinetics.
An additional overpotential of 160 mV was observed in comparison to pristine Pt, and the
Ru remained stable on the surface in the entire ORR potential window (0 – 1.2 V vs.
RHE). In addition, the cyclic voltammograms (CV) of the Ru contaminated Pt reveal
increasing double layer capacitance known to be caused by RuOx species, 18, 19 and
decreases in Pt-O formation/reduction peaks and Hupd charge.
213
Most of the earlier studies on Ru deposition on Pt either by electrochemical
deposition20-25 or spontaneous deposition,4, 11, 12, 14, 15, 24-33 have attempted to exploit
deposited Ru for the enhanced oxidation of methanol,11, 16, 25, 28, 31, 34, 35 ethanol,36 formic
acid37 and recently dimethyl ether.38 The latter method being particularly favored for
producing surfaces which are quite stable upon voltammetric cycling. However, we are
unaware of any comprehensive study investigating the effects of Ru adatoms on Pt
surfaces during typical ORR operating conditions. Although the details may vary
slightly, the overall theme centers on enhancement of methanol oxidation kinetics for Ru
decorated Pt in comparison to Pt alone, or in some cases even PtRu alloys. For example,
Waszczuk et al.31 showed that spontaneously deposited Ru on unsupported Pt
nanoparticles produces an electrocatalyst that is twice as active as commercially available
PtRu alloys for methanol oxidation. Their observations suggested that the electrocatalytic
enhancement may be a direct result of Ru edge atoms being under-coordinated by Ru or
surface Pt atoms, which could result in enhanced H2O activation and hence, an improved
bifunctional mechanism.
In light of the importance of the spontaneous deposition of Ru - as it pertains to the
above applications in electrocatalysis - many investigations have been conducted to
elucidate the surface structure of the deposited Ru.29, 30, 39, 40 Ex situ techniques such as
auger electron spectroscopy (AES),28 x-ray photoelectron spectroscopy (XPS)41 and low
energy electron diffraction (LEED)42, 43 have contributed greatly to the understanding of
such surfaces and their properties. A series of scanning tunneling microscopy (STM) and
electrochemical investigations by Crown et al.29, 30 indicated that Ru deposits on low
index Pt(hkl) surfaces without site preference. Surface coverage obtained for Pt(111),
214
Pt(100) and Pt(110) after a single deposition process were 0.20 ML, 0.22 ML and 0.10
ML respectively and found to be mostly in the form of monolayer-thick islands. The rate
of island formation (though described as slow in comparison to Os/Pt(111) deposition)
was shown to form 0.07 ML after 20 seconds with a maximum coverage obtained after
120 seconds. Iwasita et al.44 have shown that the coverage on such single crystals can be
increased by a process of repeated spontaneous deposition. In another study, Ku et al.39
found that Ru formed a ( 33 × )R30º RuO+ adlayer on a Pt(111) surface which is quite
stable even after voltammetric cycling. A comprehensive investigation by Strbac et al.40
also employed in situ STM to study Ru and Os spontaneous deposition on Pt(111) and
Au (111) surfaces. Interestingly, they found that the Ru island growth process is different
on the two surfaces. On Au (111), Ru prefers to deposit on steps and terraces relatively
quickly with a multi-layer thickness and hexagonal surface structure. On Pt(111) the
deposition time was also relatively fast however, only monolayer thickness (0.18 ML
saturation) could be observed after a single deposition period of 3 minutes. When a
second 3-minute deposition was applied, the coverage did not increase significantly (0.22
ML), however the height of the Ru adlayer increased as evidenced in the STM cross
section. Further, the Ru island size and shape (typically 2 – 5 nm in width) was shown to
be dependent on Ru oxidation state and could be manipulated by varying the potential.
Other in situ techniques such as electron quartz crystal microbalance (EQCM)
measurements have also been employed to study Ru deposition. Such a study was first
carried out by Frelink et al.45 to measure the Ru surface content of electrodeposited Ru
onto a Pt film electrode. They found a strong correlation between the potential of the
surface oxide reduction peak and the Ru content, and showed that it is possible to
215
accurately monitor the surface Ru content using this technique. Another study by Vigier
et al.16 - correlating measured growth rates with Fickian diffusion models - revealed a
likely 2-dimensional deposition in nature. Furthermore, on the assumption that every Ru
atom occupies one surface Pt atom, (i.e. Ru occupies an atop site), they found that their
estimates of surface coverage of Ru on Pt were in good agreement with other values in
the literature. We will show later in the discussion that we also find atop adsorption
albeit, chiefly at lower potentials, while at open circuit, we find that the Ru atoms at
higher coverage prefer to be more highly coordinated and occupy 3-fold sites on the
oxygen covered surface.
In the past, x-ray absorption spectroscopy (XAS) has been employed to study
fundamental electrode processes in electrochemistry. XAS is an ideally suited method for
examining nano-scale materials because it is typically performed in situ in modern
synchrotron facilities.46, 47 Although XAS is traditionally a bulk-averaging method, nano-
scale materials afford us the luxury of having ~ 50 % or more of their atoms on the
surface (depending on size and geometry) where electrochemical processes occur. As
such, small changes in coordination number (N) or bond distance (R) can be detected
during an electrochemical reaction by analyzing the extended x-ray absorption fine
structure (EXAFS). In addition, the newly developed Δμ (sometimes referred to as
Δ−XANES) method of x-ray absorption near edge structure (XANES) analysis has been
successfully employed to provided fundamental accounts of adsorbate binding sites on Pt
and Pt alloys.48-51 For example, the Δμ technique recently revealed that chloride anions
specifically adsorbed on Pt in a 3-fold configuration with virtually no Pt-O formation at
high chloride concentrations, while at lower concentrations a mixture of 3-fold Cl and 3-
216
fold Pt-O was observed.48 Prior to this, ultra-high vacuum (UHV) techniques and single
crystal studies have shown only that chloride adsorption occurs in disordered in-plane
structures with Pt-Cl separation of ~ 2.4 Å.52 Other materials have also been probed by
the Δμ method with success including porphyrins53 and metal-chalcogenides.54, 55
In other studies of Ru crossover, Ru cations have been observed in the solid
electrolyte membrane by x-ray fluorescence spectroscopy (XRF).8 Investigation of Ru3+
exchanged into a Nafion membrane offers the possibility for fundamental studies of
morphological changes caused by multivalent Ru ions leaching into the membrane from
catalyst layers. PtRu composites in the membrane have been shown to decrease the
proton conductivity of the membrane.56 To date however, we are unaware of any
comprehensive studies on the behavior of Ru ions inside the micropores of Nafion and
the effects of such species. Previously, electron spin resonance (ESR) was used to
measure the micro-viscosity of the fluid phase of the membrane.57 ESR has also been
used to observe the effects of mono and multivalent ions on the membrane.58 These
investigations showed that different cations exchanged in the membrane alter the water
uptake characteristics of the membrane as well as the micro-viscosity of the fluid phase,
ultimately by changing the free volume available to the solvent. Since water
management issues are important in fuel cells, and the presence of ions in the membrane
can affect hydration, it is important to understand the effects of Ru in the membrane as
well as on the cathode.
In this work, it is our intention to further the understanding of Ru poisoning by
traditional electrochemical methods (CV and RDE analysis) as well as in situ XAS and
ESR. For the first time, we have observed specifically adsorbed metal cations (Run+) in
217
the ORR potential window using the Δμ method. The presence of specifically adsorbed
Run+ cations result in a lower diffusion limiting current (Levich) and a small increase in
ORR overpotential in uncontaminated electrolyte. When ORR was performed in
electrolyte contaminated with 2.0 mM Run+, the overpotential was increased dramatically
and no diffusion limiting current was obtained. Further, the deposited Ru appears to be
stable on the surface and resists removal upon potential cycling. Interestingly, the
spontaneous deposition of Ru occurs to a great extent when the electrodes are allowed to
go to open circuit while much less deposition occurs when potential control is maintained
at high ORR overpotentials (i.e., closer to anode electrode operating conditions),
accentuating the effects of an uncontrolled fuel cell shut down.
5.2 Experimental Section
5.2.1 Electrochemical Characterization
Cyclic voltammetry and rotating disk electrode studies were carried out using a Pine
Instruments MSR model dual contact RDE setup. All RDE measurements were
conducted by a procedure which has been discussed in great detail previously.59 Briefly,
catalyst suspensions were comprised of 10.5 mg of 30 wt. % Pt/C (BASF Fuel Cells, Inc.,
Somerset, NJ), 10 mL of 2-propanol (GFS Chemicals, 99.5 % min.) and 40 μL of 5 wt. %
Nafion in lower alcohols (Ion Power Inc.). Prior to the addition of 2-propanol, the
catalyst powder was passivated with a few drops of deionized water to prevent
spontaneous combustion of the support. The suspensions were magnetically stirred for 1
hour and sonicated for 10 minutes prior to use. Thin films of catalyst were cast onto a
polished glassy carbon (GC) RDE tip of 5.61 mm diameter (Pine Instruments). A total of
10 μL of suspension was used via two 5 μL applications, resulting in a final loading of 14
218
μg cm-2 Pt. All measurements were made at room temperature in a jacketed glass beaker
type cell fit with a PTFE machined lid. Electrolyte used was 1 M HClO4 (GFS
Chemicals, doubly distilled) for ‘clean electrolyte’ experiments. Ru contamination
experiments were conducted using the same 1 M HClO4 after it was subject to a
sacrificial Ru electrode procedure, which will be outlined below. A typical 3-electrode
setup was used including the GC disk working (WE) electrode, Pt wire/mesh counter
electrode (CE) with an area of 19.3 cm2 (by integration of the Hupd) and a sealed glass
reference hydrogen electrode (RHE) containing clean 1M HClO4. For the experiments
where Ru contaminated electrolyte was used, a separate Pt wire (1.42 cm2) CE and RHE
salt bridge (sealed with vycor frit, BAS Inc.) was used to avoid contamination of the
clean cell. The electrolyte was purged with Ar gas for CV measurements and O2 for
ORR (both UHP 5.0 grade, Middlesex Gasses). An Autolab PGSTAT 30 potentiostat
(Metrohm USA, formerly Brinkman Instruments) equipped with a SCANGEN module
was used for all electrochemical measurements.
All electrochemistry experiments were carried out by activating the catalyst via
potential cycling approx. 50 times at 50 mV s-1 or until a steady state CV was obtained.
Also, CVs were recorded at 20 and 10 mV s-1 for Hupd integration to determine the
electrochemically active surface area (ECSA). Once activated, the clean 1M HClO4 was
purged with O2 and ORR curves were measured via cyclic voltammetry prior to Ru
contamination. Ru deposition was achieved by placing the RDE tip into a separate cell
containing 1M HClO4 + 2.0 mM Run+ and kept at open circuit potential, which was
monitored by running zero-current chronopotentiometry for 1.5 hours. Following Ru
deposition the electrode tip was rinsed off with copious amounts of deionized H2O and
219
placed back into the clean 1M HClO4 cell for post-contamination CVs and ORR
measurements. All measurements were performed at room temperature (20 ºC). It should
be mentioned that we plot the CVs and ORR polarization curves using raw current
obtained from the experiments to illustrate changes that occur only as a result of Ru
deposition. Although a minimum of three experiments were performed for all cases, we
only compare the electrochemical results obtained from a single catalyst deposition as
current density normalization was not employed.
A sacrificial Ru electrode was used to produce 1 M HClO4 contaminated with Run+
ions by the following procedure. A catalyst suspension was produced by mixing 90.1 mg
of 60 wt% Ru/C electrocatalyst (BASF Fuel Cell Inc.) with 1 mL deionized water and 1
mL of 2-propanol. The mixture was then sonicated for 10 minutes and applied to a piece
of carbon weave (Panex 30, Zoltek Corp.) over an area of 10 cm2 for a final Ru loading
of 5.4 mg cm-2 and capped off with 4 drops of 5 wt. % Nafion solution. The electrode
was placed into a beaker cell with clean 1M HClO4 and cycled between 0.05 – 1.4 V vs.
RHE using a Pt wire CE and Ag/AgCl reference electrode (BAS Inc.). After approx. 50
CVs, the potential was fixed at 1.2 V vs. Ag/AgCl for 1 hour. The resulting solution was
filtered (Whatman 52 filter paper) three times to remove loose catalyst debris. Ru ion
concentrations were determined by ion-coupled plasma mass spectrometry (ICP-MS).
Prior experiments in a working DMFC at different anode overpotentials as a function of
time was used as a measure of expected Ru ion concentrations at the cathode electrode.
These ranged between 0.1 and 3 mM.
5.2.2 Flow-through Cell Design.
220
All in situ XAS experiments were performed in new flow-through type spectro-
electrochemical cell designed to accommodate for the introduction of contaminants
without the need to disassemble the cell amid experiment. The cell was machined out of
a Teflon block as depicted in Figure 5.1 with similar dimensions as the previously
designed model.60 The cell is designed as a multi-function spectro-electrochemical cell
which can be used to collect data in either transmission or fluorescence mode. The thin
wall side of the cell has a shallow internal electrolyte reservoir (3.81 cm × 4.064 cm ×
0.254 cm) in which the electrode is affixed in place by a rectangular PTFE bracket.
Directly across from the four corners of the holding bracket, on the thick wall side, are
electrolyte flow holes which terminate with standard PTFE compression fittings. All four
corners are bored out to allow the cell to be ambidextrous in that fluorescence
measurements may be performed at beam lines that have a detector on either the left or
right side of the cell. Two of the ports are used for the electrolyte inlet and return to the
exterior reservoir, while a third port supplies a salt bridge to the reference electrode,
which also resides in the exterior reservoir. The x-ray window is bored all the way
through the cell with a 45 degree chamfer on the rear of the thick side cell block. The
windows are sealed off to prevent electrolyte leakage using PTFE tape (3M). A variable
rate peristaltic pump (Cole Parmer Masterflex L/P) is used to circulate electrolyte. The
cell is sealed with a single pre-cut silicone gasket (Auburn Chemical Co.) which is placed
between the two cell halves. This cell configuration is particularly advantageous as it
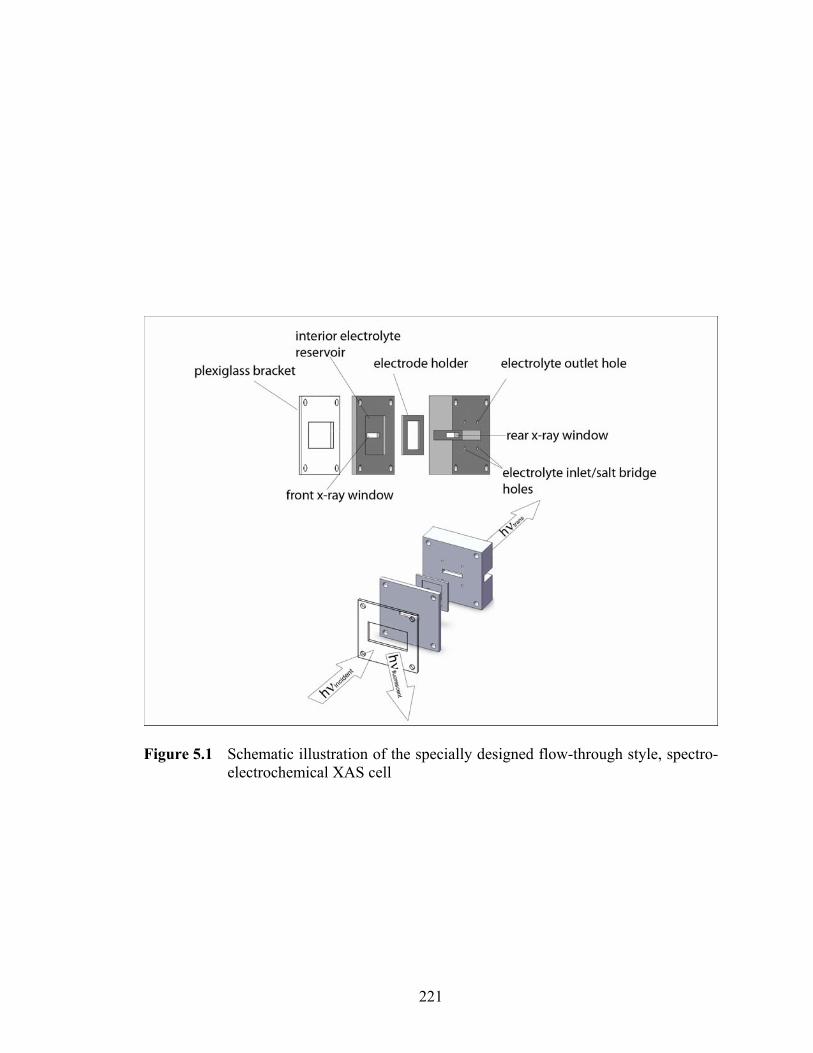
221
Figure 5.1 Schematic illustration of the specially designed flow-through style, spectro-electrochemical XAS cell
222
allows the user to oxygenate/deoxygenate the electrolyte or introduce poisons during
the experiment which was not possible with other cell models.
5.2.3 In situ XAS Data Collection
The Pt WE were prepared by loading 4.97 mg cm-2 (metal loading) of 30 % Pt/C
(same lot as above) onto carbon weave and cut into 3.5 cm × 0.5 cm size pieces. The
electrode preparation method has been described in detail elsewhere.48 Briefly, the
catalyst suspension was made by mixing pre-weighed catalyst powder with 1:1 deionized
H2O/2-propanol and 5 wt. % Nafion with a catalyst weight to Nafion weight ratio of 95:5.
The Pt loading was chosen to yield an absorption cross section of ~ 1. Prior to cell
assembly, the electrodes were wetted via vacuum impregnation in 1M HClO4. The cell
also consisted of a pre-washed (0.5 M H2SO4, 80oC) Grafoil (GrafTech International Inc.)
CE, which was situated directly across from the WE. Grafoil was chosen as a CE
because it is inert and does not significantly attenuate the x-ray beam. In all cases, 0.1
mm thick Au foil (99.999%, Alfa Aesar) was used as current collectors for both
electrodes. The electrolyte inlet and outlet tubes (Viton, Cole Parmer) connected to the
cell terminated in a 150 mL beaker containing the 1M HClO4 or 1M HClO4 + 2.0 mM
Run+ electrolyte(s). An RHE was seated into a salt bridge sealed off with a vycor frit
(BAS) to minimize Run+ ions migrating into the RHE. The entire RHE assembly was
placed into the external electrolyte beaker where it was in ionic contact with the inside of
the cell via the inlet/outlet tubes and salt bridge tube.
Experiments were performed at beam lines X-18B, X-11A and X-11B at the National
Synchrotron Light Source, Brookhaven National Laboratory, Upton NY. Prior to the
start of each experiment, the working electrodes were activated by potential cycling (0.05
223
to 1.2 V vs. RHE at 20 mV s-1) in clean 1 M HClO4 until a steady state CV was obtained.
Full range Pt L3 EXAFS were collected (-200 eV to 18 k) with the working electrodes
fixed at various static potentials as described by the following scheme: (i) xV, Ar sat. 1M
HClO4; (ii) xV, O2 sat. 1M HClO4; (iii) xV, O2 sat. 1M HClO4 + 2.0 × 10⁻³ M Run+ (1
hr.); (iv) xV, Ar sat. 1M HClO4 (return scan). The scans recorded at open circuit
observed an OCP between 0.9 and 0.95 V. Throughout the progression of the scans
potential control was maintained at all times. This was achieved as the electrolyte could
be easily exchanged by draining the external reservoir of its contents down close to
empty and replacing with the next electrolyte without having the RHE become
disconnected. Prior to step (iv) above, the cell would be filled and drained with clean 1M
HClO4 3 times (~ 400 mL) to remove trace Ru contamination.
Data were collected in transmission mode using the typical three gas ionization
detector setup (I0, It and Iref) with a nominal N2/Ar mixture to allow for 10% photon
absorption in I0, 50 – 70% in It and Iref. The sample was placed between I0 and It, while
Pt reference foil (4 μm, Alfa Aesar) EXAFS were collected between It and Iref. At each
beam line a Si(111) monochromator was employed and detuned by 40% to remove
higher harmonics.
5.2.4 EXAFS Analysis
All EXAFS analyses were performed using the IFEFFIT suite, version 1.2.9
(Copyright 2006, Matthew Newville, University of Chicago,
http://cars9uchicago.edu/ifeffit/).61 All scans are carefully aligned and calibrated using
the reference foil to account for any changes in beam energy throughout the course of the
experiment. Background subtraction and normalization was performed using the

224
AUTOBK62 algorithm in Athena (Bruce Ravel, © 2006), a subroutine of IFEFFIT. The
normalized EXAFS data was then imported into the ARTEMIS program where EXAFS
fits were carried out using a k-range window of 2.0 – 15 Å-1 (Kaiser-Bessel) and an R-
window of 1.5 – 3.5 Å.
5.2.5 Δμ Analysis
The Δμ procedure has been described in great detail elsewhere.63-66 Briefly, all XAS
scans are carefully aligned and normalized over a much more narrow energy range (~ 25
to 130 eV) to only consider the XANES region. Difference spectra are calculated based
on the normalized XANES using the relationship
Δμ = μ(Pt-xelect., V) – μ(Pt-Ar, clean, V) Eq. 5.1)
where μ(Pt-xelect., V) is the XANES at a particular electrode potential in either a clean or
Ru contaminated electrolyte, and μ(Pt-Ar, clean) is the reference scan in clean electrolyte
at the same potential. This scan is chosen as the reference so as to remove any other
electrode processes occurring simultaneously (i.e. H2O activation) and emphasize only
the effect of Run+. This of course assumes that the O(H) adsorption levels are about the
same with and without Ru, which is not necessarily true, but we will see below that this a
reasonable assumption below 0.8 V.
Experimental Δμ spectra are then compared to theoretical Δμ signatures calculated
using the FEFF 8.0 code.67 This is achieved by calculating theoretical XANES curves
using small Pt clusters, in this case the “Janin” Pt6 cluster,68 with and without the
adsorbate placed in various geometries. The resulting XANES can then be subtracted
using the relationship:
Δμt = μ(Pt6X) – μ(Pt6) (Eq. 5.2)
225
where μ(Pt6X) is the theoretical XANES for the Pt6 cluster with adsorbate X in a
particular binding geometry and μ(Pt6) is that of the blank Pt6 cluster. It should be noted
that care needs to be taken to ensure that scans are properly aligned prior to subtraction.
Also, for optimal comparison to the experimental data, theoretical signatures are
sometimes shifted by 1 – 5 eV and/or scaled by a multiplication factor.
5.2.6 Electron Spin Resonance
Nafion™117 membranes were first purified by heating to 75°C for 1 hour in 3 %
hydrogen peroxide followed by 1 hour in deionized water, 1 hour in 0.5M sulfuric acid,
and again 1 hour in deionized water. The membranes were ion exchanged to varying
extents by soaking in Ru Nitrosylnitrate (Alfa Aesar) solutions ranging in concentration
from 0.5 mM to 100 mM for 2,5, and 7 days respectively. Upon removal from the Ru
solution, the membranes were rinsed to remove any surface Ru and to terminate the
exchange. The swollen membranes were weighed to gravimetrically determine the total
water uptake. Before and after the exchange process the membranes were thoroughly
dried and weighed and the extent of exchanges was determined gravimetrically using a
Cahn C-33 microbalance.
ESR measurements were accomplished by soaking the exchanged membranes in 0.1
mM 2,2,6,6-tetramethyl-4-piperidone N-oxide (TEMPONE) spin probe in water. The
ESR spectra were collected on a Bruker EMX X-band spectrometer. For each spectrum,
three scans of 2048 points were averaged using magnetic field modulation of 0.02 mT at
100 kHz. The fitting method utilized a MATLAB (MathWorks) based version of EPRLL,
the slow-motional line shape program of Freed and co-workers69, 70 and was used to
determine the correlation time (τc) of the spin probe by monitoring the rotational rate of
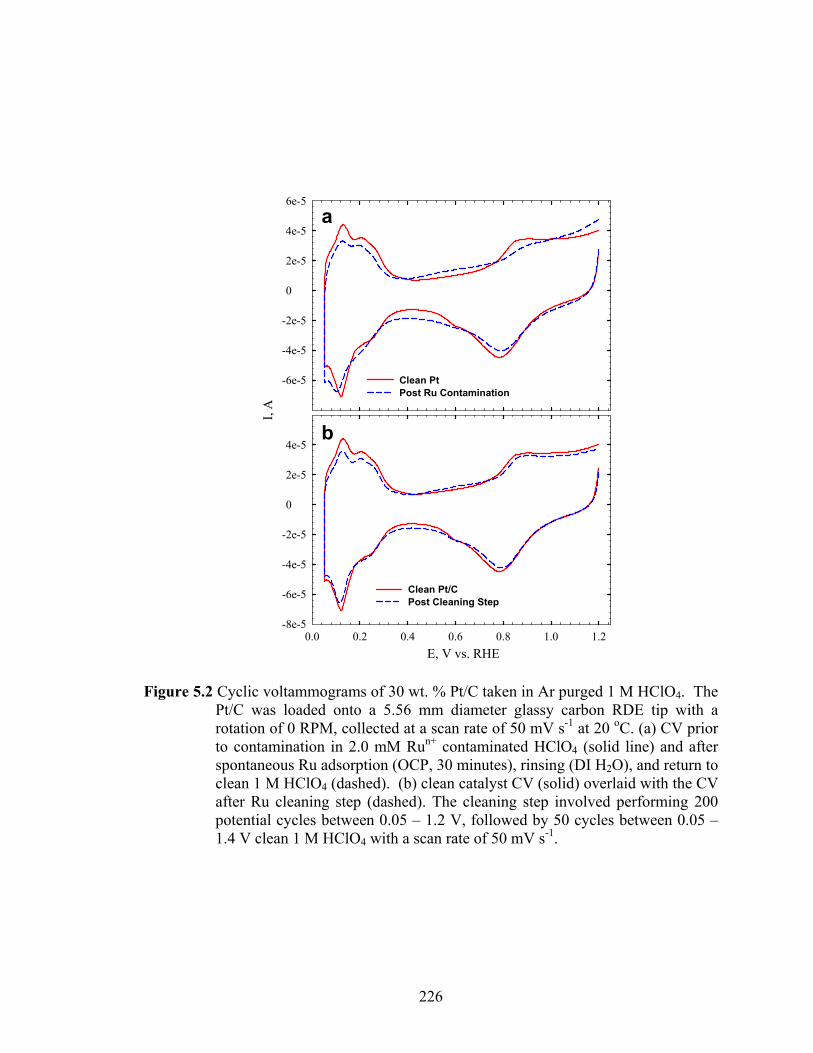
226
E, V vs. RHE0.0 0.2 0.4 0.6 0.8 1.0 1.2
I, A
-8e-5
-6e-5
-4e-5
-2e-5
0
2e-5
4e-5
6e-5
Clean Pt/CPost Cleaning Step
-8e-5
-6e-5
-4e-5
-2e-5
0
2e-5
4e-5
6e-5
Clean PtPost Ru Contamination
a
b
Figure 5.2 Cyclic voltammograms of 30 wt. % Pt/C taken in Ar purged 1 M HClO4. The Pt/C was loaded onto a 5.56 mm diameter glassy carbon RDE tip with a rotation of 0 RPM, collected at a scan rate of 50 mV s-1 at 20 oC. (a) CV prior to contamination in 2.0 mM Run+ contaminated HClO4 (solid line) and after spontaneous Ru adsorption (OCP, 30 minutes), rinsing (DI H2O), and return to clean 1 M HClO4 (dashed). (b) clean catalyst CV (solid) overlaid with the CV after Ru cleaning step (dashed). The cleaning step involved performing 200 potential cycles between 0.05 – 1.2 V, followed by 50 cycles between 0.05 – 1.4 V clean 1 M HClO4 with a scan rate of 50 mV s-1.
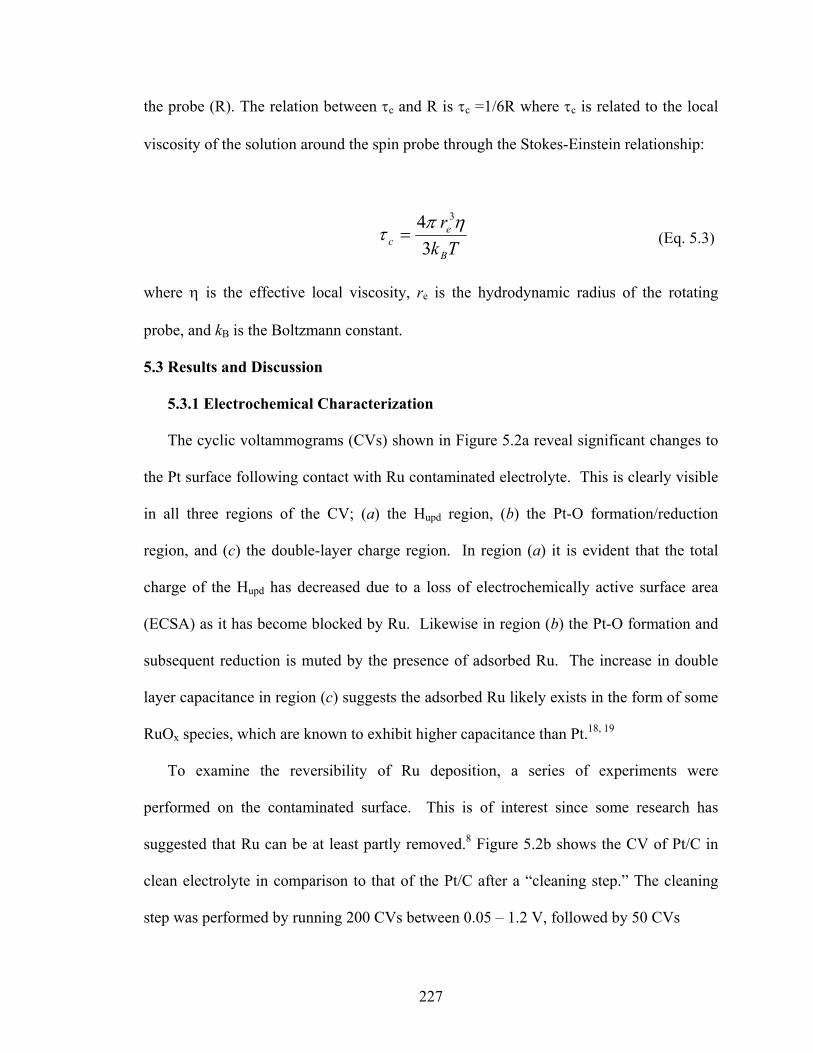
227
the probe (R). The relation between τc and R is τc =1/6R where τc is related to the local
viscosity of the solution around the spin probe through the Stokes-Einstein relationship:
Tkr
B
ec 3
4 3ηπτ = (Eq. 5.3)
where η is the effective local viscosity, re is the hydrodynamic radius of the rotating
probe, and kB is the Boltzmann constant.
5.3 Results and Discussion
5.3.1 Electrochemical Characterization
The cyclic voltammograms (CVs) shown in Figure 5.2a reveal significant changes to
the Pt surface following contact with Ru contaminated electrolyte. This is clearly visible
in all three regions of the CV; (a) the Hupd region, (b) the Pt-O formation/reduction
region, and (c) the double-layer charge region. In region (a) it is evident that the total
charge of the Hupd has decreased due to a loss of electrochemically active surface area
(ECSA) as it has become blocked by Ru. Likewise in region (b) the Pt-O formation and
subsequent reduction is muted by the presence of adsorbed Ru. The increase in double
layer capacitance in region (c) suggests the adsorbed Ru likely exists in the form of some
RuOx species, which are known to exhibit higher capacitance than Pt.18, 19
To examine the reversibility of Ru deposition, a series of experiments were
performed on the contaminated surface. This is of interest since some research has
suggested that Ru can be at least partly removed.8 Figure 5.2b shows the CV of Pt/C in
clean electrolyte in comparison to that of the Pt/C after a “cleaning step.” The cleaning
step was performed by running 200 CVs between 0.05 – 1.2 V, followed by 50 CVs
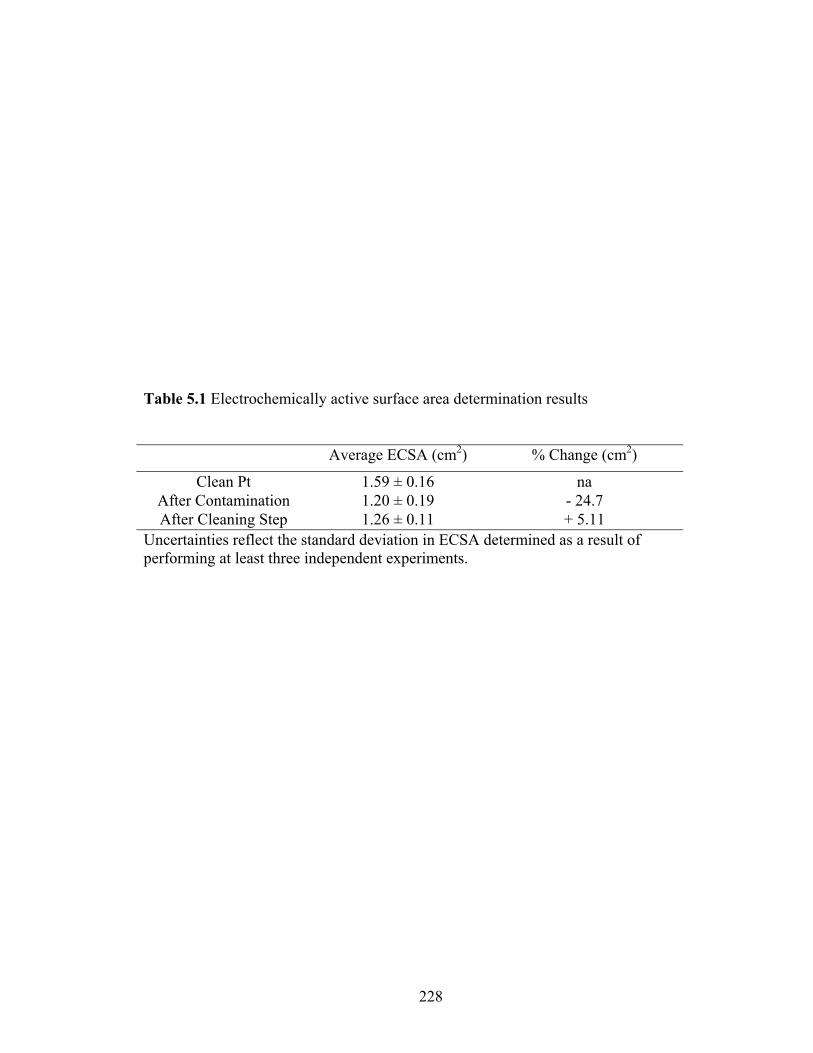
228
Table 5.1 Electrochemically active surface area determination results
Average ECSA (cm2) % Change (cm2)
Clean Pt 1.59 ± 0.16 na After Contamination 1.20 ± 0.19 - 24.7 After Cleaning Step 1.26 ± 0.11 + 5.11
Uncertainties reflect the standard deviation in ECSA determined as a result of performing at least three independent experiments.
229
between 0.05 – 1.4V on the deposited catalyst in clean electrolyte. It is evident in the Pt-
O formation/reduction region (b) that some Ru has been removed as the Pt-O peaks have
become better defined. However, the double layer capacitance was still widened and the
Hupd did not fully recover either, indicating that some Ru remains on the surface. The
electrochemically active surface area (ECSA) for each of the above mentioned situations
have been calculated and displayed in Table 5.1. The ECSA was determined by a
common practice of integrating the Hupd charge (after subtracting the double-layer
capacitance) and dividing by the value of 210 μC cm-2. A total of 24.7 % loss of ECSA
was observed as a result of Ru blocking Pt surface sites. Following the cleaning
treatment, an increase in ECSA was observed (~ 5 %), however, clearly all of the Ru had
not been entirely removed, even as the electrode had been cycled up to 1.4 V. This result
is consistent with the observations of Piela et al.,8 who has observed partial Ru
dissolution from contaminated cathodes when cycled to anodic potentials.
The effects of deposited Ru on ORR are easily discernable by inspection of the ORR
polarization curves in Figure 5.3. The clean Pt catalyst exhibits a commendable ORR
activity with an onset potential ~ 1.0 V and a well defined diffusion limiting current as
described by the Levich equation:
ilim = 0.62neFD2/3ω1/2ν-1/6Co (Eq. 5.4)
where ilim is the diffusion limiting current density, ne is the number of transferred
electrons, F is Faraday’s constant, D is the diffusion coefficient of O2 in the electrolyte, ω
is the rotation rate of the RDE, ν is the kinematic viscosity and Co is the concentration of
O2. Although the ORR onset overpotential only increased by ~ 15 – 20 mV going from
the clean Pt to Ru deposited Pt, the decrease in ilim is consistent with a residual Ru
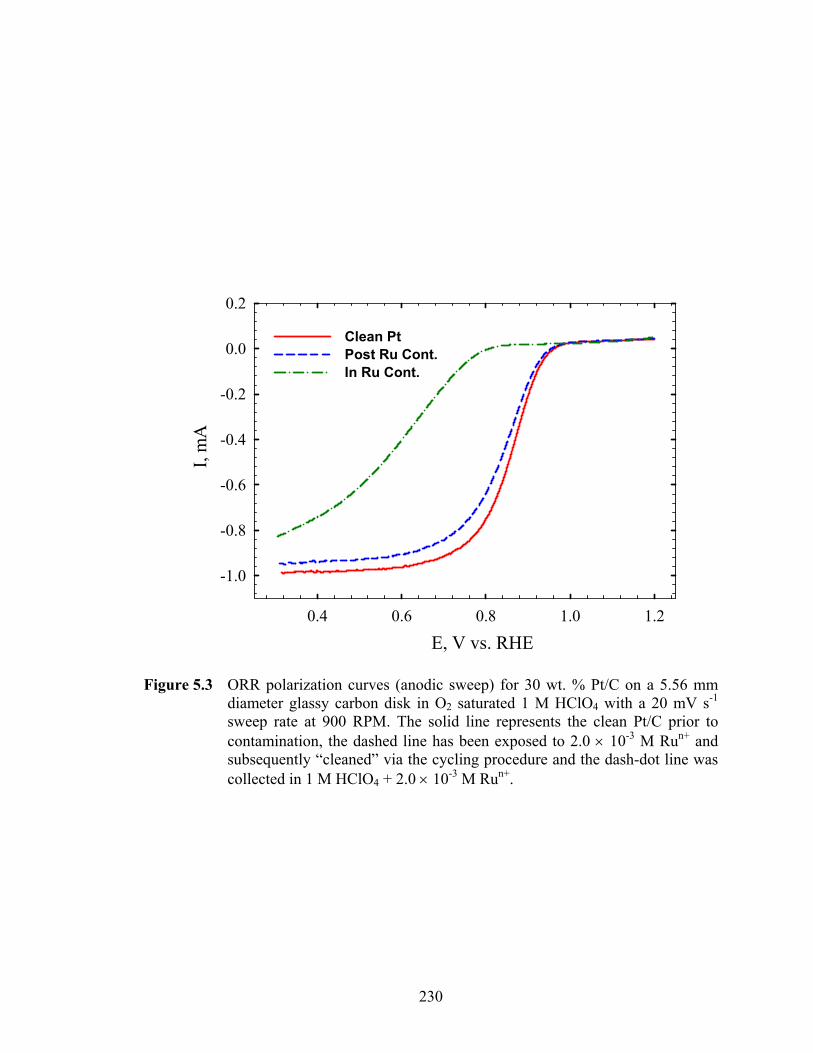
230
E, V vs. RHE0.4 0.6 0.8 1.0 1.2
I, m
A
-1.0
-0.8
-0.6
-0.4
-0.2
0.0
0.2
Clean PtPost Ru Cont.In Ru Cont.
Figure 5.3 ORR polarization curves (anodic sweep) for 30 wt. % Pt/C on a 5.56 mm diameter glassy carbon disk in O2 saturated 1 M HClO4 with a 20 mV s-1 sweep rate at 900 RPM. The solid line represents the clean Pt/C prior to contamination, the dashed line has been exposed to 2.0 × 10⁻³ M Run+ and subsequently “cleaned” via the cycling procedure and the dash-dot line was collected in 1 M HClO4 + 2.0 × 10⁻³ M Run+.
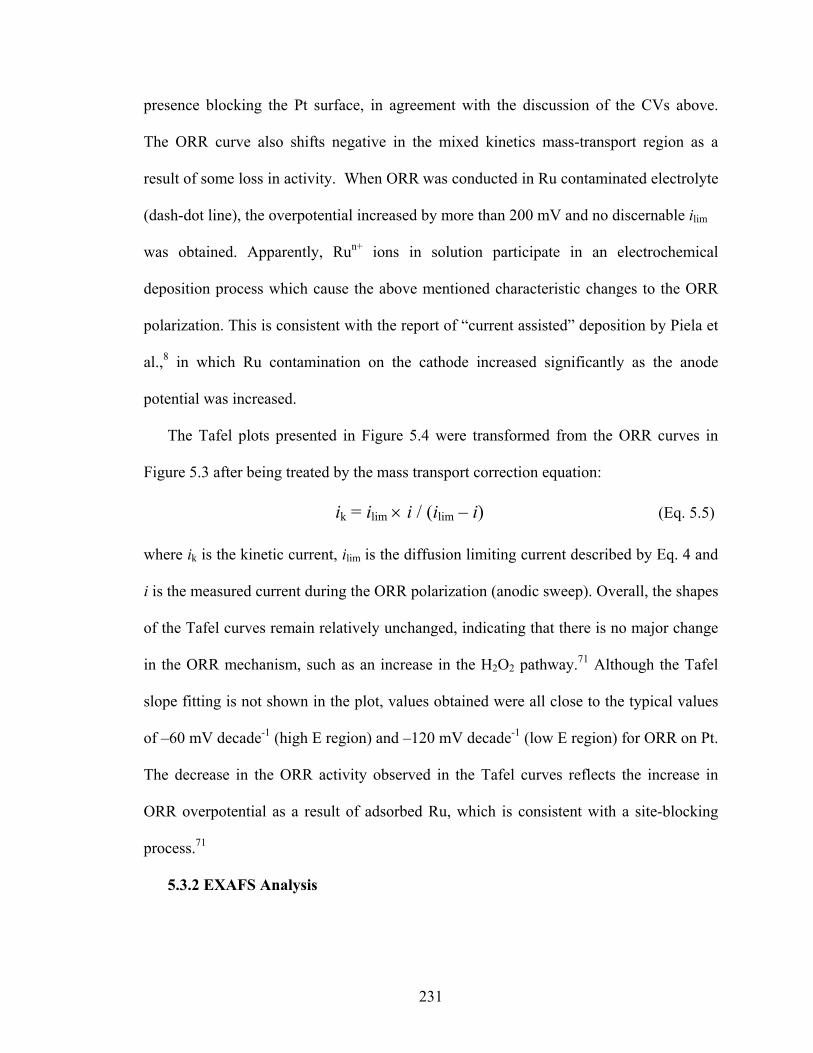
231
presence blocking the Pt surface, in agreement with the discussion of the CVs above.
The ORR curve also shifts negative in the mixed kinetics mass-transport region as a
result of some loss in activity. When ORR was conducted in Ru contaminated electrolyte
(dash-dot line), the overpotential increased by more than 200 mV and no discernable ilim
was obtained. Apparently, Run+ ions in solution participate in an electrochemical
deposition process which cause the above mentioned characteristic changes to the ORR
polarization. This is consistent with the report of “current assisted” deposition by Piela et
al.,8 in which Ru contamination on the cathode increased significantly as the anode
potential was increased.
The Tafel plots presented in Figure 5.4 were transformed from the ORR curves in
Figure 5.3 after being treated by the mass transport correction equation:
ik = ilim × i / (ilim – i) (Eq. 5.5)
where ik is the kinetic current, ilim is the diffusion limiting current described by Eq. 4 and
i is the measured current during the ORR polarization (anodic sweep). Overall, the shapes
of the Tafel curves remain relatively unchanged, indicating that there is no major change
in the ORR mechanism, such as an increase in the H2O2 pathway.71 Although the Tafel
slope fitting is not shown in the plot, values obtained were all close to the typical values
of –60 mV decade-1 (high E region) and –120 mV decade-1 (low E region) for ORR on Pt.
The decrease in the ORR activity observed in the Tafel curves reflects the increase in
ORR overpotential as a result of adsorbed Ru, which is consistent with a site-blocking
process.71
5.3.2 EXAFS Analysis
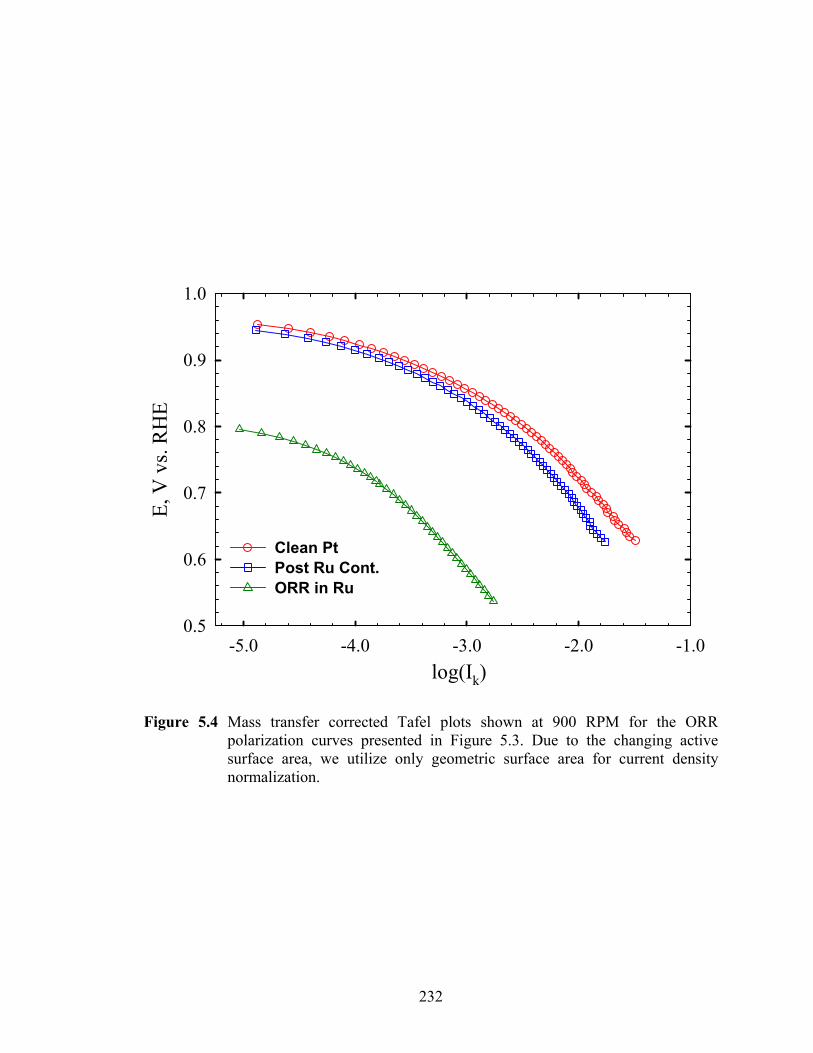
232
log(Ik)-5.0 -4.0 -3.0 -2.0 -1.0
E, V
vs.
RH
E
0.5
0.6
0.7
0.8
0.9
1.0
Clean PtPost Ru Cont.ORR in Ru
Figure 5.4 Mass transfer corrected Tafel plots shown at 900 RPM for the ORR polarization curves presented in Figure 5.3. Due to the changing active surface area, we utilize only geometric surface area for current density normalization.
233
R, Å0 1 2 3 4
|χ(R
)|, Å
-3
0.0
0.2
0.4
0.6
0.8
1.0
1.2
1.4
1.6
1.8
Pt/C at 0.80 VFit
k, Å-10 2 4 6 8 10 12 14 16
k2 *χ(k
), Å
-2
-1.0
-0.5
0.0
0.5
1.0
Pt/C at 0.80 VFit
b
a
Figure 5.5 (a) Pt-L3 edge EXAFS spectrum (Kaiser-Bessel window 2.0 < k < 15 Å-1, k2 weighted) and corresponding least-squares fit for 30 wt. % Pt/C in 1 M HClO4 + 2.0 × 10⁻³ M Run+ fixed at 0.80 V. (b) Fourier transformed EXAFS, fitting was performed in R space using a single shell Pt-Pt scattering path and a Kaiser-Bessel window (1.0 < R < 3.5 Å, k2).
234
It is standard practice to fully analyze the extended x-ray absorption fine structure
(EXAFS) prior to any Δμ XANES analysis. The reason for this is to ensure that no major
changes in Pt-Pt bond length occur under the given experimental conditions. The Δμ-
XANES analysis relies on crystallographic modeling using consistent bond lengths in
order to generate realistic Δμ simulations. The EXAFS data processing involves a
normalization/background removal process using a background spline function
(AUTOBK)62 in the ATHENA code.72 Once normalized, the EXAFS is imported into
ARTEMIS, where the physical parameters are elucidated via least-squares fitting. A
representative fit is shown in Figure 5.5a and 5.5b for Pt/C at open circuit potential in 1M
HClO4 + 2.0 mM Run+. Although evidence suggests that deposited Ru exists on the
surface (as will be illustrated by the Δμ analysis below), it is not directly visible to the
FT-EXAFS because it is too low in concentration and would likely be located in the
region of the main Pt-Pt scattering (~ 2.5 Å); nevertheless the effects of the Ru deposition
are evident in the NPt-Pt values.
Table 5.2 offers a summary of EXAFS parameters obtained by the methods described
above. In order to ensure a valid comparison of coordination numbers (NPt-Pt), the best
value of σ2 (mean-square radial disorder) was fixed (5.05 × 10⁻³ Å2) and used for all fits.
Although no significant changes to the Pt-Pt distance were observed, small changes in
NPt-Pt were observed as the particles tend to distort when adsorbates are present as the Pt-
Pt scattering near the surface is altered by adsorbates.48, 51 These changes are illustrated
more clearly in Figure 5.6 (left axis). The value of NPt-Pt of 7.6 appears to represent the
clean cluster. The scan taken at 0.3 V shows a small increase in NPt-Pt, typical of that
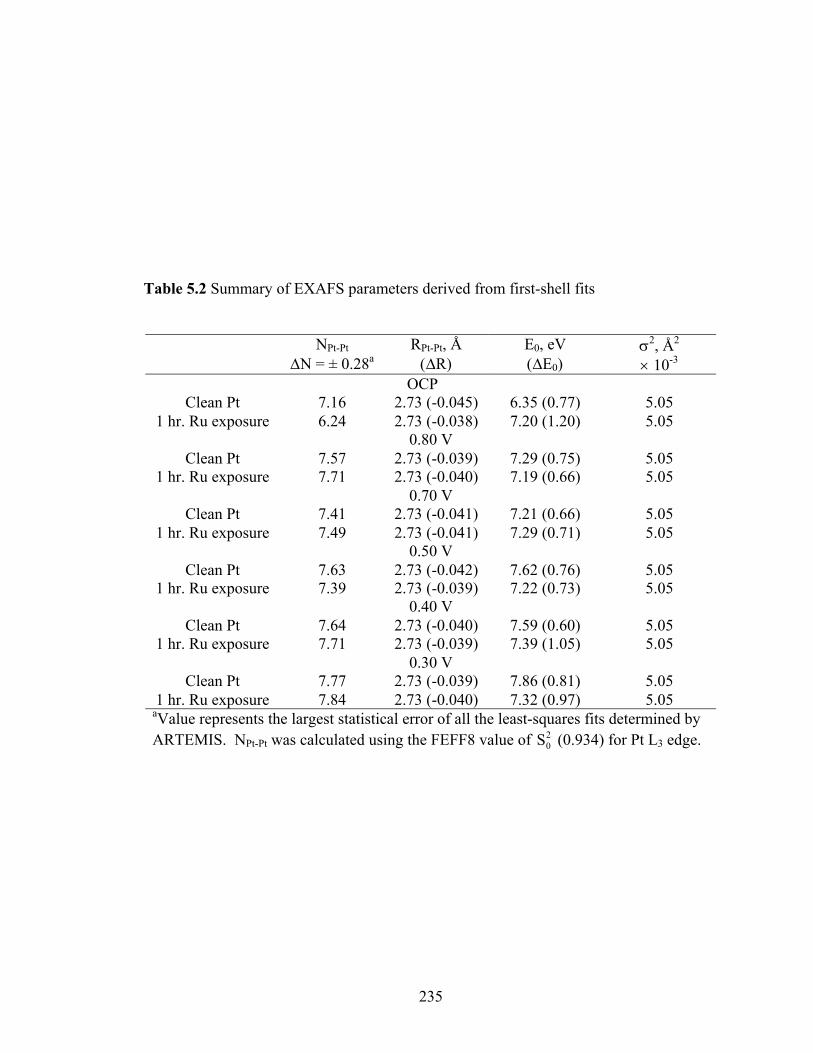
235
Table 5.2 Summary of EXAFS parameters derived from first-shell fits
NPt-Pt
ΔN = ± 0.28a RPt-Pt, Å
(ΔR) E0, eV (ΔE0)
σ2, Å2 × 10⁻³
OCP Clean Pt 7.16 2.73 (-0.045) 6.35 (0.77) 5.05
1 hr. Ru exposure 6.24 2.73 (-0.038) 7.20 (1.20) 5.05 0.80 V
Clean Pt 7.57 2.73 (-0.039) 7.29 (0.75) 5.05 1 hr. Ru exposure 7.71 2.73 (-0.040) 7.19 (0.66) 5.05
0.70 V Clean Pt 7.41 2.73 (-0.041) 7.21 (0.66) 5.05
1 hr. Ru exposure 7.49 2.73 (-0.041) 7.29 (0.71) 5.05 0.50 V
Clean Pt 7.63 2.73 (-0.042) 7.62 (0.76) 5.05 1 hr. Ru exposure 7.39 2.73 (-0.039) 7.22 (0.73) 5.05
0.40 V Clean Pt 7.64 2.73 (-0.040) 7.59 (0.60) 5.05
1 hr. Ru exposure 7.71 2.73 (-0.039) 7.39 (1.05) 5.05 0.30 V
Clean Pt 7.77 2.73 (-0.039) 7.86 (0.81) 5.05 1 hr. Ru exposure 7.84 2.73 (-0.040) 7.32 (0.97) 5.05
aValue represents the largest statistical error of all the least-squares fits determined by ARTEMIS. NPt-Pt was calculated using the FEFF8 value of 2
0S (0.934) for Pt L3 edge.
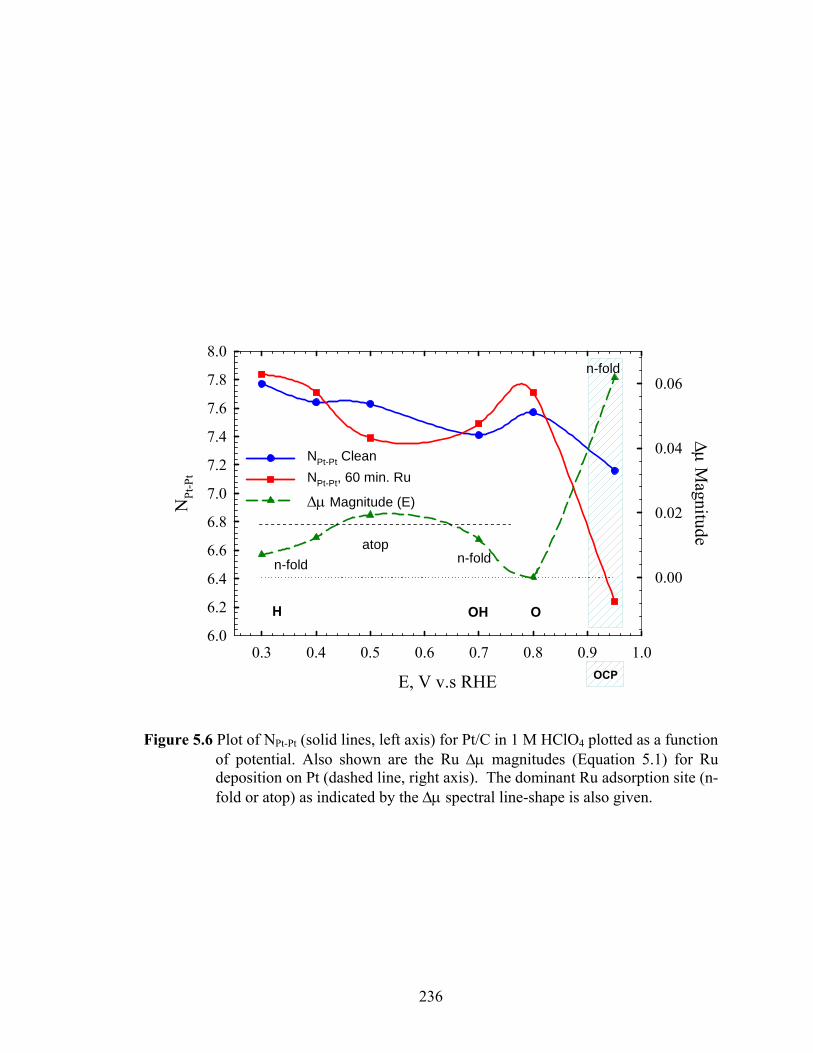
236
Figure 5.6 Plot of NPt-Pt (solid lines, left axis) for Pt/C in 1 M HClO4 plotted as a function of potential. Also shown are the Ru Δμ magnitudes (Equation 5.1) for Ru deposition on Pt (dashed line, right axis). The dominant Ru adsorption site (n-fold or atop) as indicated by the Δμ spectral line-shape is also given.
E, V v.s RHE
0.3 0.4 0.5 0.6 0.7 0.8 0.9 1.0
NPt
-Pt
6.0
6.2
6.4
6.6
6.8
7.0
7.2
7.4
7.6
7.8
8.0
Δμ Magnitude
0.00
0.02
0.04
0.06
NPt-Pt CleanNPt-Pt, 60 min. Ru
Δμ Magnitude (E)
OH OH
OCP
n-foldatop
n-fold
n-fold
E, V v.s RHE
0.3 0.4 0.5 0.6 0.7 0.8 0.9 1.0
NPt
-Pt
6.0
6.2
6.4
6.6
6.8
7.0
7.2
7.4
7.6
7.8
8.0
Δμ Magnitude
0.00
0.02
0.04
0.06
NPt-Pt CleanNPt-Pt, 60 min. Ru
Δμ Magnitude (E)
OH OH
OCP
n-foldatop
n-fold
n-fold
237
seen after H adsorption, and again a small increase at 0.80 V, which is typical of that
seen when atop O(H) adsorption occurs. We have shown many times previously49, 51 that
atop anion (e.g. O(H)- and Cl-) adsorption generally increases NPt-Pt, and 3-fold
adsorption decreases it. The increase occurs as a result of the overall morphology of the
nanoparticle
becoming more spherical in the presence of atop adsorbates and 3-fold adsorption
generally directly decreases the Pt-Pt scattering. Note that the NPt-Pt values after Ru
deposition are larger than for the clean at 0.3 and 0.4 V, smaller at 0.5 V, and then larger
again at 0.7 V; i.e. exactly opposite that expected for an anion. We have previously
noted48, 50 that cation or neutral species adsorption (H+ and S) even in n-fold sites (n = 2
or 3) can increase NPt-Pt and apparently in 3-fold increase it. Thus the changes in NPt-Pt are
consistent with that expected for cation/neutral adsorbates in 3-fold sites at low coverage,
except at 0.5 V when adsorption occurs more in atop sites as indicated by the Δμ line-
shapes discussed below. Interestingly, both values of NPt-Pt decrease at OCP because of
some O adsorption in 3-fold sites as expected, but now the largest change in NPt-Pt
between the clean and Ru deposited results also exist due to significant Ru deposition. It
is a bit surprising, however, that now the Ru mostly adsorbed in 3-fold sites additionally
decreases NPt-Pt relative to the clean. This may provide information about the charge on
the Ru species in the presence of co-adsorbed O atoms (i.e. less positively charged and
behaving more as an additional ‘anion’) at these potentials. The preferred Ru deposition
site will be discussed in greater detail in the following section.
5.3.3 Experimental Δμ Analysis
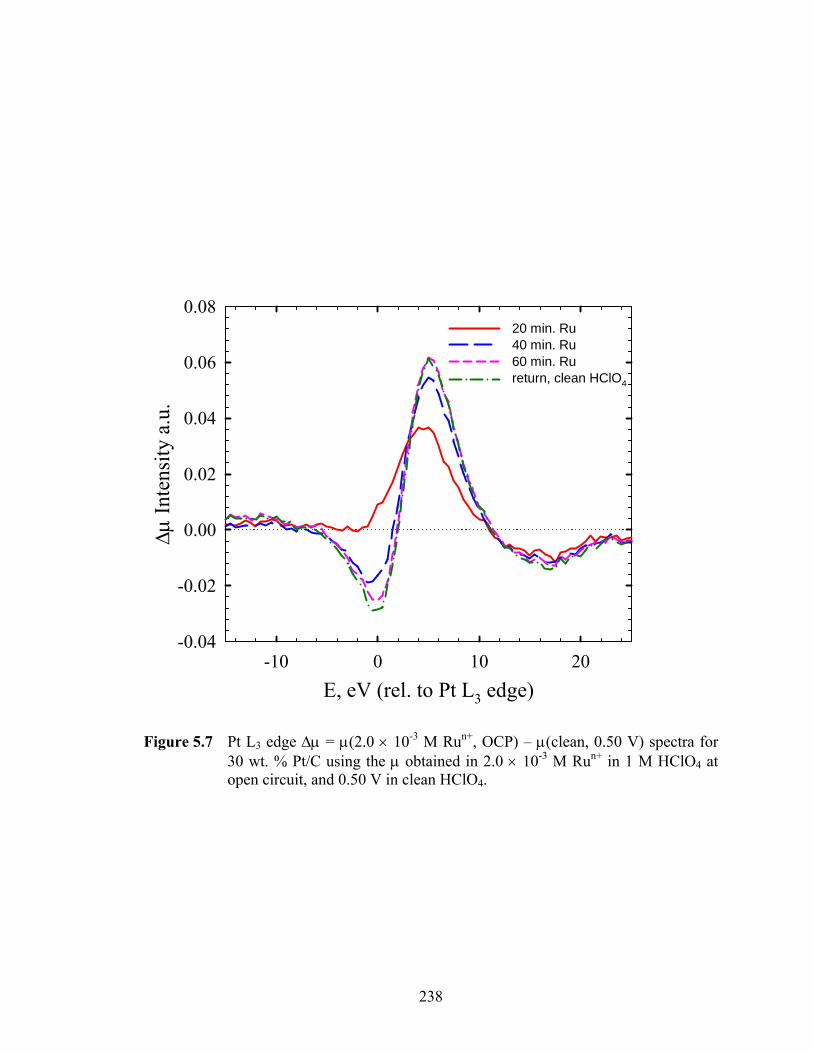
238
E, eV (rel. to Pt L3 edge)-10 0 10 20
Δμ In
tens
ity a
.u.
-0.04
-0.02
0.00
0.02
0.04
0.06
0.0820 min. Ru40 min. Ru60 min. Rureturn, clean HClO4
Figure 5.7 Pt L3 edge Δμ = μ(2.0 × 10⁻³ M Run+, OCP) – μ(clean, 0.50 V) spectra for 30 wt. % Pt/C using the μ obtained in 2.0 × 10⁻³ M Run+ in 1 M HClO4 at open circuit, and 0.50 V in clean HClO4.
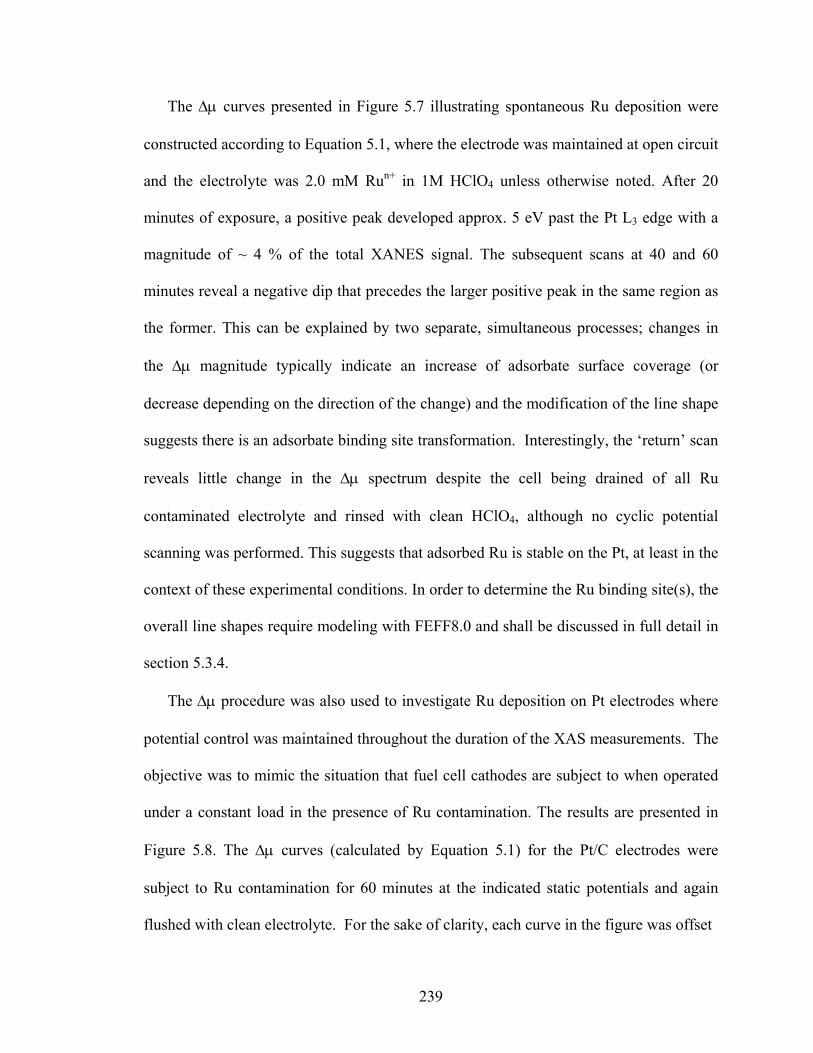
239
The Δμ curves presented in Figure 5.7 illustrating spontaneous Ru deposition were
constructed according to Equation 5.1, where the electrode was maintained at open circuit
and the electrolyte was 2.0 mM Run+ in 1M HClO4 unless otherwise noted. After 20
minutes of exposure, a positive peak developed approx. 5 eV past the Pt L3 edge with a
magnitude of ~ 4 % of the total XANES signal. The subsequent scans at 40 and 60
minutes reveal a negative dip that precedes the larger positive peak in the same region as
the former. This can be explained by two separate, simultaneous processes; changes in
the Δμ magnitude typically indicate an increase of adsorbate surface coverage (or
decrease depending on the direction of the change) and the modification of the line shape
suggests there is an adsorbate binding site transformation. Interestingly, the ‘return’ scan
reveals little change in the Δμ spectrum despite the cell being drained of all Ru
contaminated electrolyte and rinsed with clean HClO4, although no cyclic potential
scanning was performed. This suggests that adsorbed Ru is stable on the Pt, at least in the
context of these experimental conditions. In order to determine the Ru binding site(s), the
overall line shapes require modeling with FEFF8.0 and shall be discussed in full detail in
section 5.3.4.
The Δμ procedure was also used to investigate Ru deposition on Pt electrodes where
potential control was maintained throughout the duration of the XAS measurements. The
objective was to mimic the situation that fuel cell cathodes are subject to when operated
under a constant load in the presence of Ru contamination. The results are presented in
Figure 5.8. The Δμ curves (calculated by Equation 5.1) for the Pt/C electrodes were
subject to Ru contamination for 60 minutes at the indicated static potentials and again
flushed with clean electrolyte. For the sake of clarity, each curve in the figure was offset
240
E, eV (rel. to Pt L3 edge)-20 -10 0 10 20 30
Δμ a
.u.
-0.02
0.00
0.02
0.04
0.06
0.08
0.10
0.3 V
0.4 V
0.5 V
0.7 V
0.8 V
Figure 5.8 Pt L3 edge Δμ = μ(2.0 × 10⁻³ M Run+, xV) – μ(no Run+, 0.5 V) spectra for 30 wt. % Pt/C taken after 60 minutes exposure to Run+ contaminated 1 M HClO4.
241
on the Δμ axis by an increment of 0.02. All Δμ magnitudes here are ≤ 0.02, indicating
relatively low Ru adsorbate coverage. The spectral line-shapes reveal some
inconsistencies that will be discussed in the theoretical section below. For further
analysis, Figure 5.6 plots the amplitude of the experimental Δµ (right axis) obtained from
Figure 5.8, which signifies the change in relative Ru coverage with potential, along with
the NPt-Pt as already discussed. While under potential control, the Δμ amplitude reaches a
maximum at 0.5 V, decreases with potential until a sharp increase is observed at OCP.
There are two factors that seem to affect Ru deposition as suggested in the Figure, the
coverage of other adsorbates and Coulombic forces between Run+ in the electrolyte and
already adsorbed species. The large deposition at OCP seems reasonable as one would
expect that Run+ ions are not particularly attracted to a positively charged Pt surface, but
as the oxide forms above 0.8 V, the Run+ ion are attracted to the negatively charged O
atoms in the oxide layer and eventually co-deposit on the surface. To show that O(H)
adsorption is still occurring on Pt with Ru present, and to determine the effect of this Ru
on O(H) adsorption, we calculated the Δμ in Figure 5.9a using the relationship:
Δμ = μ(xV, Ru) – μ(0.5 V, Ru) (Eq. 5.6)
in order to isolate the Pt-O interactions by consequently subtracting out any Ru
contributions. The value of 0.5 V was used as it resides in the double-layer region where
typically no adsorbates are present. Recall that the 0.8 V line in Figure 5.8 did not reveal
any Pt-O signature because it had been subtracted out. That particular Δμ was calculated
using the clean reference at the same potential (Eq. 5.1), which as mentioned above
cancels out any process unassociated with Ru adsorption. The obtained line shapes in
Figure 5.9a do indeed indicate the presence of adsorbed O, however, no Ru because that
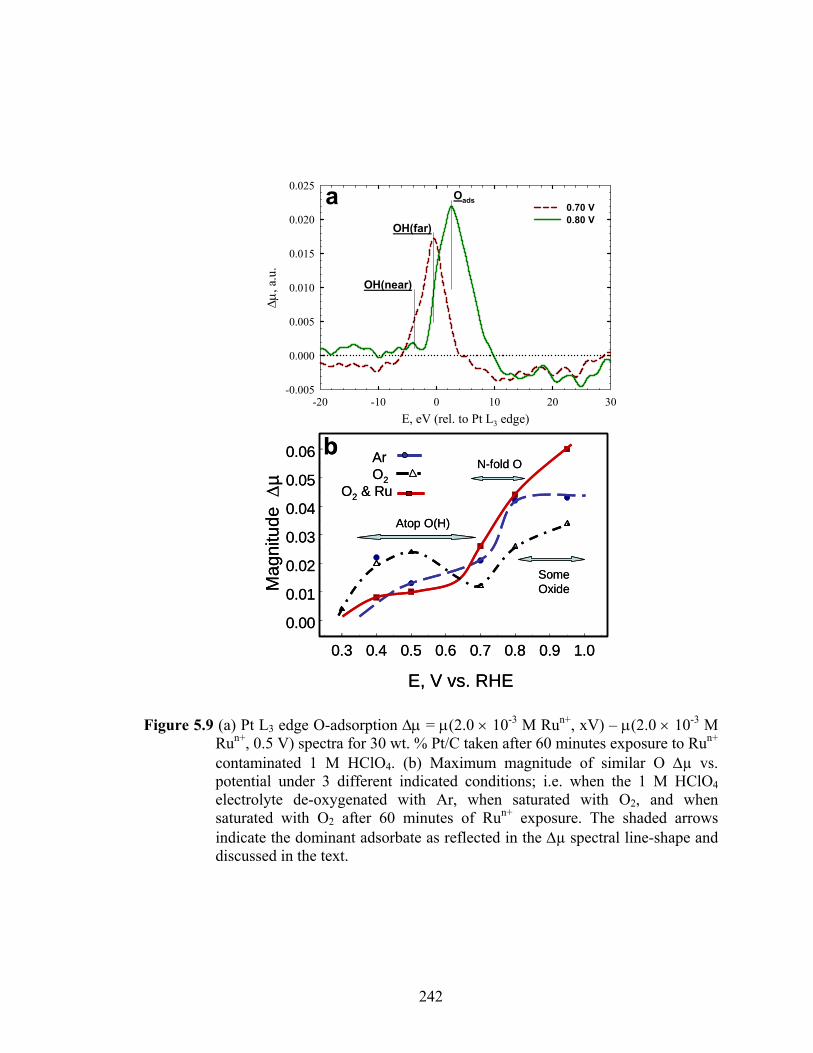
242
0.3 0.4 0.5 0.6 0.7 0.8 0.9 1.0
0.00
0.01
0.02
0.03
0.04
0.05
0.06
E, V vs. RHE
Mag
nitu
de Δ
µ
Atop O(H)
N-fold O
Some Oxide
ArO2
O2 & Ru
E, eV (rel. to Pt L3 edge)-20 -10 0 10 20 30
Δμ, a
.u.
-0.005
0.000
0.005
0.010
0.015
0.020
0.025
0.70 V0.80 V
OH(far)
Oads
OH(near)
a
b
0.3 0.4 0.5 0.6 0.7 0.8 0.9 1.0
0.00
0.01
0.02
0.03
0.04
0.05
0.06
E, V vs. RHE
Mag
nitu
de Δ
µ
Atop O(H)
N-fold O
Some Oxide
ArO2
O2 & Ru
E, eV (rel. to Pt L3 edge)-20 -10 0 10 20 30
Δμ, a
.u.
-0.005
0.000
0.005
0.010
0.015
0.020
0.025
0.70 V0.80 V
OH(far)
Oads
OH(near)
a
b
Figure 5.9 (a) Pt L3 edge O-adsorption Δμ = μ(2.0 × 10⁻³ M Run+, xV) – μ(2.0 × 10⁻³ M Run+, 0.5 V) spectra for 30 wt. % Pt/C taken after 60 minutes exposure to Run+ contaminated 1 M HClO4. (b) Maximum magnitude of similar O Δµ vs. potential under 3 different indicated conditions; i.e. when the 1 M HClO4 electrolyte de-oxygenated with Ar, when saturated with O2, and when saturated with O2 after 60 minutes of Run+ exposure. The shaded arrows indicate the dominant adsorbate as reflected in the Δµ spectral line-shape and discussed in the text.
243
was removed by the difference. The Δμ lines in Figure 5.9a indicate normal H2O
activation (atop Pt-O(H) at 0.7, 3-fold 0.8 V) and are in agreement with previous
observations.49 Note that the Δμ taken at 0.7 V reveals an additional shoulder (noted as
OH(near)) about 2 eV to lower energy. This has been observed many times previously
when Ru islands exists on the Pt surface, and is attributed to OH bonded to Pt at sites
next to the RuOx islands.73-76 It arises because of an electronic effect exerted by the RuOx
on the nearby Pt atoms shifting the core-level binding energy and hence shifting the
energy of the Δμ feature. Similar O(H) Δμ spectra (not shown) using Equation 5.6 but
taken before Ru deposition do not show this additional feature.
The effects of Ru deposition on the oxide coverage are also observed (see Figure
5.9b). The absolute magnitudes of the oxide Δμ line-shapes similar to those in Figure
5.9a (using Eq. 5.6) are plotted as a function of electrode potential. In the case of de-
oxygenated 1 M HClO4, H2O activation proceeds as previously observed in many of our
studies.48, 49, 76 The O(H) coverage steadily increases with potential; the Δμ line-shape
below 0.7 V reflects atop OH, then 3-fold O, and finally above 0.8 V that of an oxide
(with subsurface O). The data in 1 M HClO4, saturated with O2 shows a similar trend,
only the atop coverage increases much faster due to atop O adsorbed at cluster corner and
edge sites. Such lower coordinated Pt sites are known to be more reactive with O2, and
the adsorbed O in such sites will exhibit a lower coordination with Pt (i.e. atop-like).49
These Pt sites probably do not participate in the ORR (because they are blocked by
strongly adsorbed O), but this adsorbed O on the corners/edges appears to decrease
strongly the amount of 3-fold O on the Pt(111) planes above 0.7 V, which may enhance
the ORR rate on those sites. Such differences between the in situ and operando O(H)
244
coverage has been considered previously77 and shall not be further discussed here. The
sub-surface O appears similarly above 0.8 V with and without the presence of O2. The
effect of Ru deposition is quite interesting: a) It appears to slow O from going sub-
surface to form the oxide, b) it definitely hinders atop adsorption below 0.7 V, apparently
because the Ru and O compete for these sites; and c) it appears to exert a ligand effect
around 0.7 V; although it is difficult to separate the competing effects of atop O and Ru
on the surface. However, it is clear from the Δμ data just above 0.7 V that deposited Ru
in the presence of O2 can increase the adsorption of O(H), which blocks sites for the
ORR.
5.3.4 FEFF Modeling
As seen above, the Δμ spectral line-shapes can provide valuable evidence of the binding
sites of various adsorbates such as H, OH, and O on a surface using previously modeled
Δµ spectral line-shapes for O adsorption. No direct line-shape assignments can be made
without first theoretically simulating the adsorption event, which has not been previously
performed for the Ru Δμ signature. Therefore, theoretical XANES modeling (and hence
Δμt) was performed for Ru/Pt using the spatial coordinates of the Janin Pt6/Pt6-Ruads
clusters,68 along with the appropriate input parameters (Hedin-Lundqvist potentials,
NOHOLE card etc.), and evaluated for full multiple scattering by FEFF8.0. The Ru-Δμ
signatures for the commonly used 1-fold, 2-fold and fcc 3-fold adsorption sites are
presented in Figure 5.10. The 1 and 2-fold Ru line shapes are too similar and therefore
will be treated as impossible to distinguish experimentally. The 3-fold signature on the
other hand contains a negative dip just preceding the edge position, followed by a large
positive peak that is in very close resemblance to the OCP scans in Figure 5.7 taken
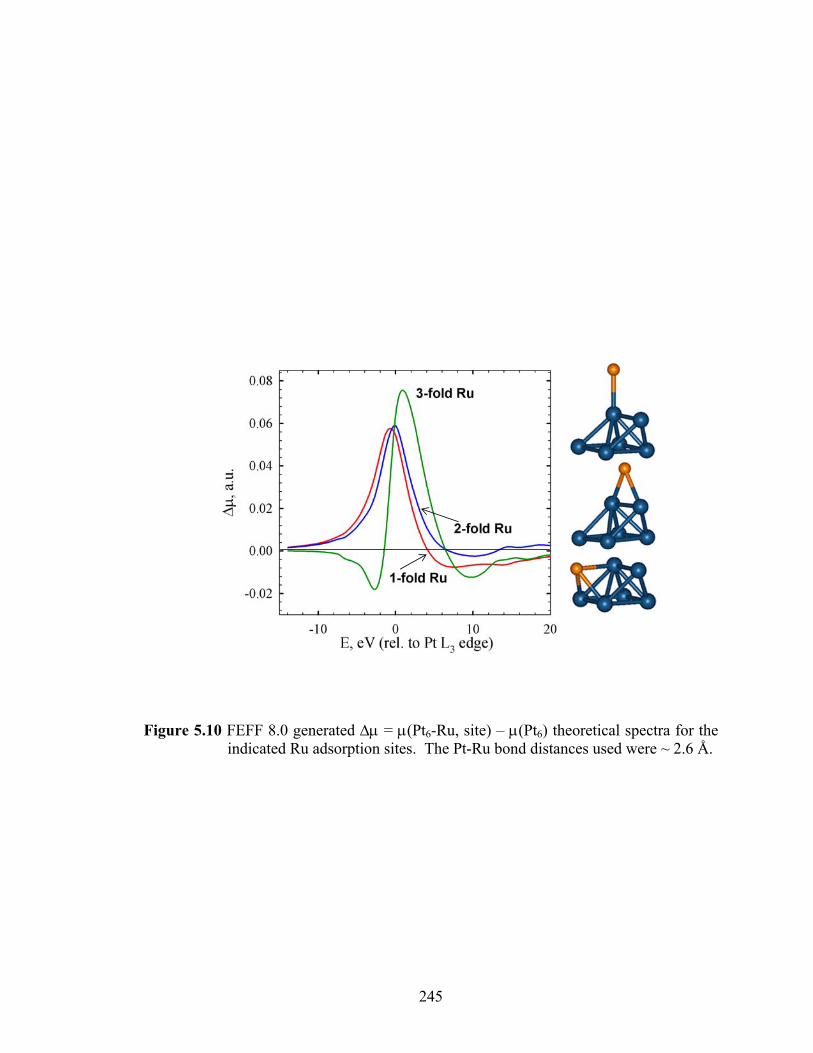
245
Figure 5.10 FEFF 8.0 generated Δμ = μ(Pt6-Ru, site) – μ(Pt6) theoretical spectra for the indicated Ru adsorption sites. The Pt-Ru bond distances used were ~ 2.6 Å.
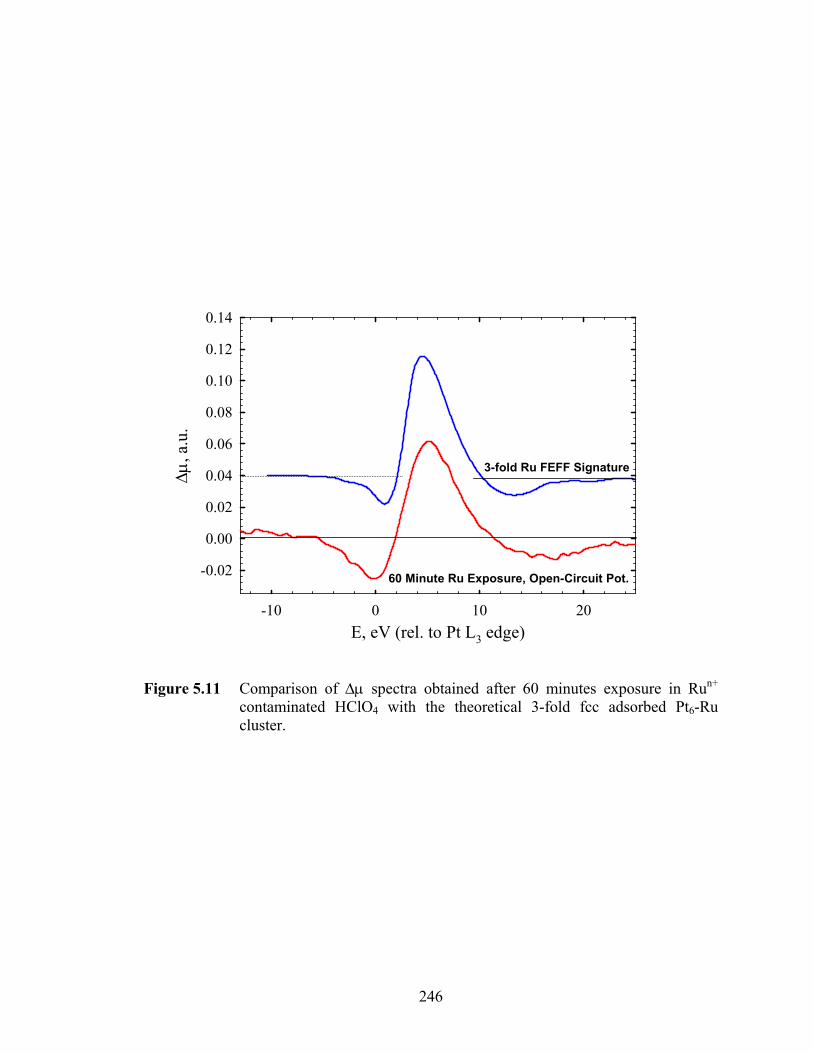
246
Figure 5.11 Comparison of Δμ spectra obtained after 60 minutes exposure in Run+ contaminated HClO4 with the theoretical 3-fold fcc adsorbed Pt6-Ru cluster.
E, eV (rel. to Pt L3 edge)-10 0 10 20
Δμ, a
.u.
-0.02
0.00
0.02
0.04
0.06
0.08
0.10
0.12
0.14
3-fold Ru FEFF Signature
60 Minute Ru Exposure, Open-Circuit Pot.
E, eV (rel. to Pt L3 edge)-10 0 10 20
Δμ, a
.u.
-0.02
0.00
0.02
0.04
0.06
0.08
0.10
0.12
0.14
3-fold Ru FEFF Signature
60 Minute Ru Exposure, Open-Circuit Pot.
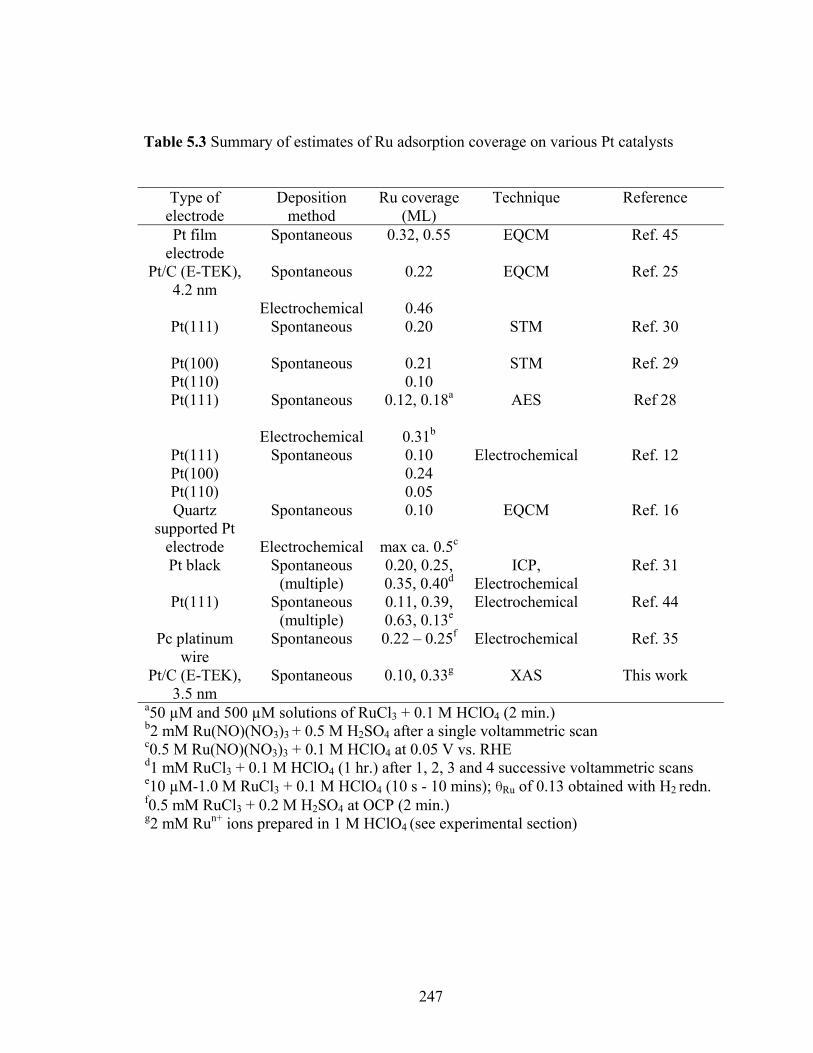
247
Table 5.3 Summary of estimates of Ru adsorption coverage on various Pt catalysts
Type of
electrode Deposition
method Ru coverage
(ML) Technique Reference
Pt film electrode
Spontaneous 0.32, 0.55 EQCM Ref. 45
Pt/C (E-TEK), 4.2 nm
Spontaneous
Electrochemical
0.22
0.46
EQCM Ref. 25
Pt(111) Spontaneous 0.20 STM Ref. 30
Pt(100) Pt(110)
Spontaneous 0.21 0.10
STM Ref. 29
Pt(111)
Spontaneous
Electrochemical
0.12, 0.18a
0.31b
AES Ref 28
Pt(111) Pt(100) Pt(110)
Spontaneous 0.10 0.24 0.05
Electrochemical Ref. 12
Quartz supported Pt
electrode
Spontaneous
Electrochemical
0.10
max ca. 0.5c
EQCM Ref. 16
Pt black Spontaneous (multiple)
0.20, 0.25, 0.35, 0.40d
ICP, Electrochemical
Ref. 31
Pt(111) Spontaneous (multiple)
0.11, 0.39, 0.63, 0.13e
Electrochemical Ref. 44
Pc platinum wire
Spontaneous 0.22 – 0.25f Electrochemical Ref. 35
Pt/C (E-TEK), 3.5 nm
Spontaneous 0.10, 0.33g XAS This work
a50 µM and 500 µM solutions of RuCl3 + 0.1 M HClO4 (2 min.) b2 mM Ru(NO)(NO3)3 + 0.5 M H2SO4 after a single voltammetric scan c0.5 M Ru(NO)(NO3)3 + 0.1 M HClO4 at 0.05 V vs. RHE d1 mM RuCl3 + 0.1 M HClO4 (1 hr.) after 1, 2, 3 and 4 successive voltammetric scans e10 µM-1.0 M RuCl3 + 0.1 M HClO4 (10 s - 10 mins); θRu of 0.13 obtained with H2 redn. f0.5 mM RuCl3 + 0.2 M H2SO4 at OCP (2 min.) g2 mM Run+ ions prepared in 1 M HClO4 (see experimental section)
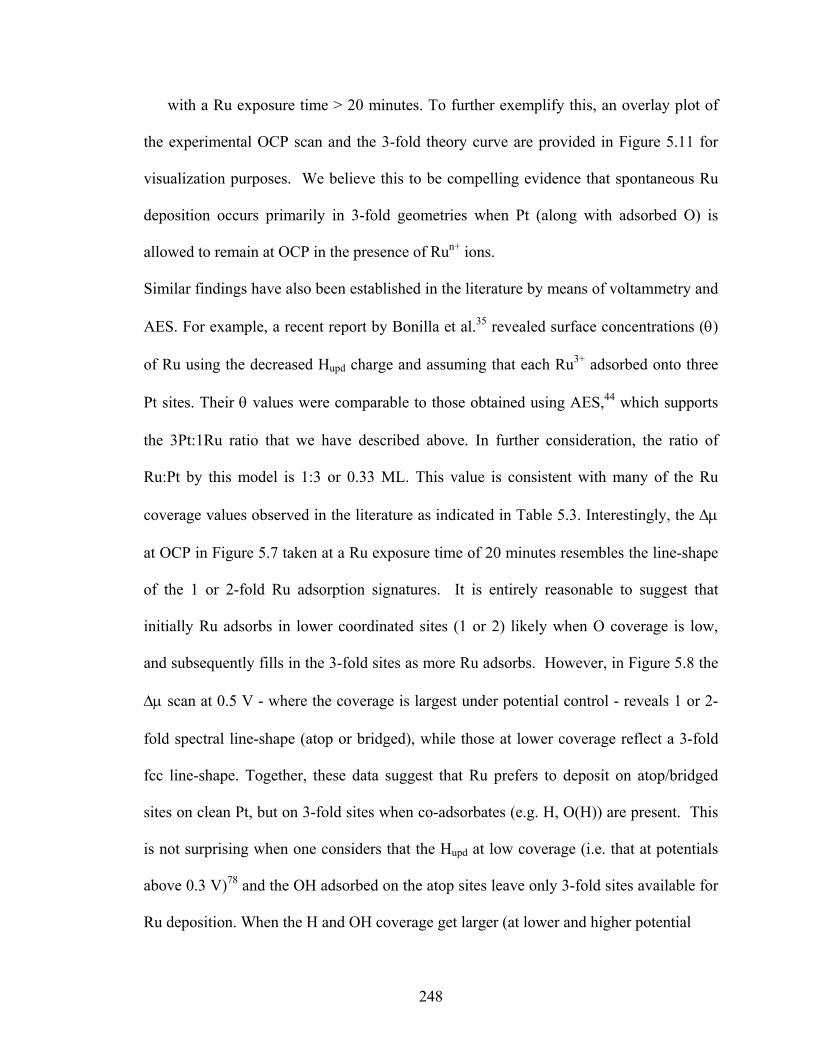
248
with a Ru exposure time > 20 minutes. To further exemplify this, an overlay plot of
the experimental OCP scan and the 3-fold theory curve are provided in Figure 5.11 for
visualization purposes. We believe this to be compelling evidence that spontaneous Ru
deposition occurs primarily in 3-fold geometries when Pt (along with adsorbed O) is
allowed to remain at OCP in the presence of Run+ ions.
Similar findings have also been established in the literature by means of voltammetry and
AES. For example, a recent report by Bonilla et al.35 revealed surface concentrations (θ)
of Ru using the decreased Hupd charge and assuming that each Ru3+ adsorbed onto three
Pt sites. Their θ values were comparable to those obtained using AES,44 which supports
the 3Pt:1Ru ratio that we have described above. In further consideration, the ratio of
Ru:Pt by this model is 1:3 or 0.33 ML. This value is consistent with many of the Ru
coverage values observed in the literature as indicated in Table 5.3. Interestingly, the Δμ
at OCP in Figure 5.7 taken at a Ru exposure time of 20 minutes resembles the line-shape
of the 1 or 2-fold Ru adsorption signatures. It is entirely reasonable to suggest that
initially Ru adsorbs in lower coordinated sites (1 or 2) likely when O coverage is low,
and subsequently fills in the 3-fold sites as more Ru adsorbs. However, in Figure 5.8 the
Δμ scan at 0.5 V - where the coverage is largest under potential control - reveals 1 or 2-
fold spectral line-shape (atop or bridged), while those at lower coverage reflect a 3-fold
fcc line-shape. Together, these data suggest that Ru prefers to deposit on atop/bridged
sites on clean Pt, but on 3-fold sites when co-adsorbates (e.g. H, O(H)) are present. This
is not surprising when one considers that the Hupd at low coverage (i.e. that at potentials
above 0.3 V)78 and the OH adsorbed on the atop sites leave only 3-fold sites available for
Ru deposition. When the H and OH coverage get larger (at lower and higher potential
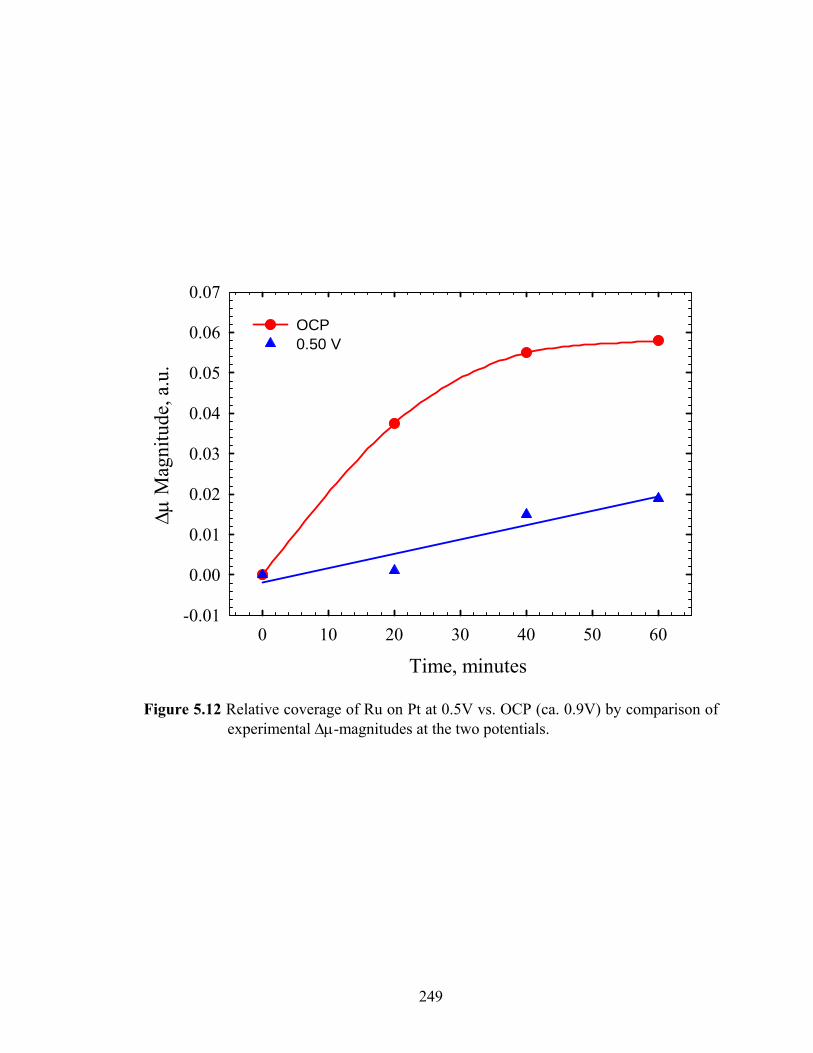
249
Time, minutes0 10 20 30 40 50 60
Δμ M
agni
tude
, a.u
.
-0.01
0.00
0.01
0.02
0.03
0.04
0.05
0.06
0.07
OCP0.50 V
Figure 5.12 Relative coverage of Ru on Pt at 0.5V vs. OCP (ca. 0.9V) by comparison of experimental Δμ-magnitudes at the two potentials.
250
respectively, excluding OCP) Ru deposition apparently does not occur at all or only
occurs to an extent which is undetectable by Δμ. Likewise at OCP, the Ru initially
deposits on atop sites (probably along the corners/edges of the Pt clusters, see Figure 5.7)
on O covered Pt (the O takes the 3-fold sites) and then moves over to the 3-fold sites at
higher coverage. Thus the Run+ deposition on an O covered Pt surface behaves
remarkably similar to H adsorption on clean Pt. That is, adsorption occurs initially on
corner/edges in atop sites and later on 3-fold sites because of lateral interactions.79
5.3.5 Deposition time dependence and coverage
Finally, Figure 5.12 shows the time dependence of the Ru deposition at both OCP and
0.5 V. It is clear that the amount of Ru adsorbed at OCP is much larger than under
potential control at 0.5 V. The marked difference in this time-dependence may also be
reflecting a different deposition mechanism at the two potentials. At OCP, the Coulomb
enhanced deposition (i.e. attractive interaction between Oδ- ions on the surface and Run+
ions in solution) apparently occurs quite rapidly, reaching an asymptote already after
about 40 minutes and yielding a logarithmic type plot. While the deposition at 0.5 V
appears to increase in a linear fashion as illustrated by the regression line, and therefore
controlled by a different, possibly slower diffusion process near the surface. In any event,
this plot reveals the detrimental effect of bringing a cathode to OCP relative to
maintaining potential control. Not only is the total coverage enhanced at OCP, it reaches
this larger coverage all together, in a relatively shorter period of time.
Spontaneous deposition saturation times have been reported to be on the order of
seconds to minutes depending on Ru concentration in the bulk electrolyte, 25 although
much larger periods of 60 minutes or more have been observed in this and other studies.16
251
These discrepancies can likely be explained by factors such as presence of anions (i.e.
chlorides, nitrates etc.), effective surface area, size of solvated Run+ ions and catalytic
activity of the Pt surface. For example, any pre or co-adsorbed anions would impede
available sites for Ru deposition, hence requiring longer deposition times, lower coverage
or both. Many of the cited investigations have been performed on Pt (hkl) surfaces, which
would have much lower electro-active surface area than nanoparticles, possibly resulting
in longer requisite exposure times to achieve saturation. Also, it has been well established
that the various Pt(hkl) surfaces have different catalytic activity in terms of ORR and
adsorption and therefore would be expected to yield different results (see Table 5.3).52
Finally, as the size of the solvation sheath of the Run+ ion increases, it would likely
increase deposition time and/or decrease coverage due to steric hindrance and lower
charge density.
Figure 5.12 provides an estimate of the Ru coverage. The theoretical signature here
has a comparable magnitude with the amplitude of the experimental line. Note that the
Ru atom is in a 3-fold site on the surface for this calculation. Therefore, every Pt atom
should ‘see’ approximately 3 Ru atoms (the model only had 1 Ru), so at full coverage,
the theoretical line-shape should be approximately 3 times larger. Assuming the intensity
of scattering off of neighboring atoms varies directly with the number of such neighbors,
the estimated experimental coverage then becomes 1/3 or ca. 0.33 ML. This can be
compared with 0.1 ML when under potential control after 1 hour; although the coverage
appears to be linearly increasing still after 1 hour. Here, it is also worth drawing a
comparison to the experimental Hupd data shown in Table 5.1 which revealed that ~ 25 %
of the ECSA was lost during spontaneous deposition of Ru. This value is consistent with
252
the Δμ magnitudes analysis, suggesting it is a relatively reliable method of determining
adsorbate coverage.
These values compare quite well with other estimates in the literature (see summary
in Table 5.3) for saturation coverage in the case of spontaneous deposition of Ru on Pt.
An estimate of the coverage on nanoparticles with Δμ-XANES is only possible at very
high Pt dispersion (> 50%), thus giving rise to quite unambiguous ∆µ-XANES signatures
with sufficiently high data quality. The Ru coverage on Pt has been shown to occur in
both monolayer and multilayer fashion.14, 27, 31, 44 Using the Δμ-XANES method of
determining coverage on nanoparticles, it is not possible to determine the nature of the
adsorbed layer except for determining the binding site of the first layer of atoms on the
catalyst surface. To the best of our knowledge, this is the first estimate of Ru coverage on
a Pt catalyst using XAS. It is commonly accepted that x-ray methods are inherently bulk-
averaging techniques, and that deriving such information from either interfaces or
surfaces is rather difficult.34 However, we show in this study that with sufficiently good
data and appropriately designed experiments, the ∆µ-XANES analysis makes it possible
to obtain surface-sensitive information from XAS and that such an analysis may be of
value in cases where only in situ measurements are realistic.
5.3.6 ESR results
While much of this work has focused on the result of Ru deposition on the cathode
after dissolution at the anode and subsequent crossover through the membrane, in this
section, the effect of Ru crossover in the membrane is considered. Figure 5.13 shows that
as more Ru enters the membrane, a nearly linear decrease in water uptake occurs. This is
consistent with the findings of Lawton et al.58 and Ahmed et al.,80 where the presence of
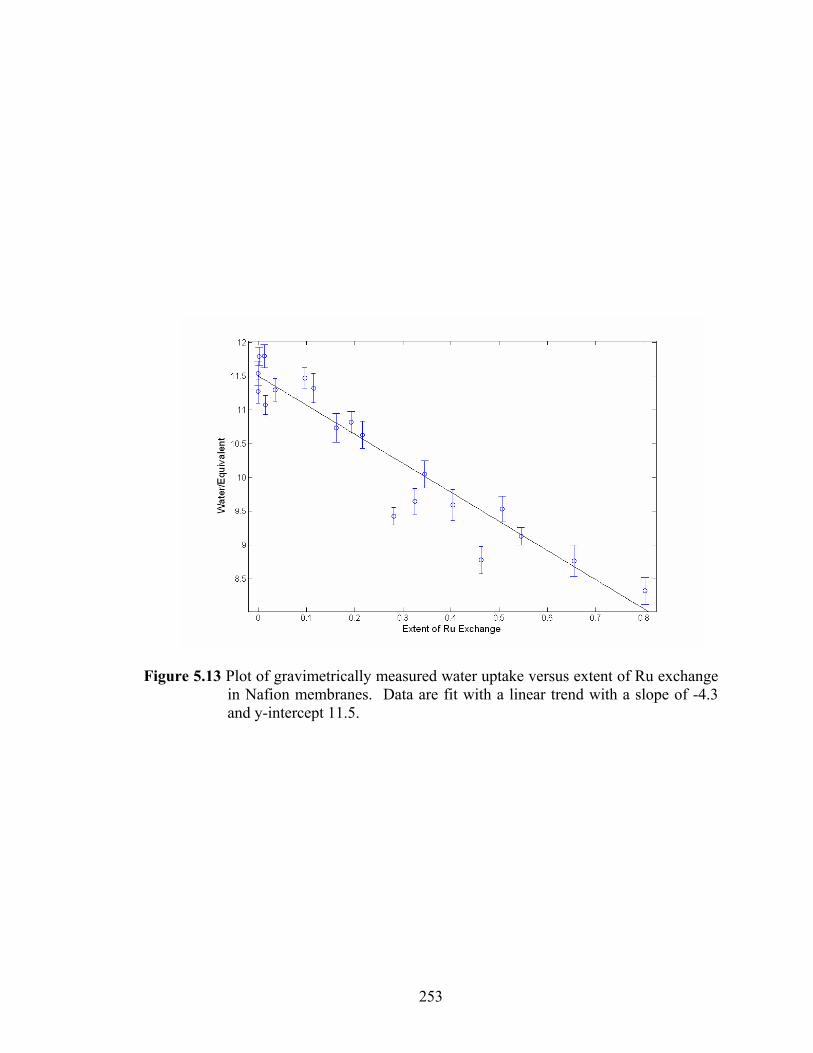
253
Figure 5.13 Plot of gravimetrically measured water uptake versus extent of Ru exchange in Nafion membranes. Data are fit with a linear trend with a slope of -4.3 and y-intercept 11.5.

254
Figure 5.14 Plot of correlation time, τc, versus extent of Ru exchange in Nafion membranes calculated from the rotational diffusion of Tempone spin probe measured using X-Band ESR spectroscopy. Data are fit with a linear trend with slope 1.0711 × 10⁻⁹ and y-intercept 1.4037 × 10⁻⁹.
255
Al3+ and Fe3+ in the Nafion membrane caused much lower swelling than lower valence
cations. Their conclusion58 - considering the modeling works of Niemark and
Vishnyakov81, 82 wherein trivalent ions were shown to rigidify the membrane’s backbone
and side chain regions due to ionic crosslinking83 - was that the membrane interactions
with the trivalent ions hinder swelling and minimize solvation.
Lawton et al. have also studied the effects of hydration in the membrane using a free
volume model. They observed that lower hydration levels lead to a lower rate of probe
rotation. 58 Figure 5.14 depicts the effect of Ru exchange on the τc of the probe. Based on
the Stokes-Einstein relationship in Equation 5.3, this suggests that the micro-viscosity of
the fluid state increases linearly with the presence of Ru3+ in the membrane. This could
result in slower vehicular diffusion across the membrane as a result of lower hydration
levels and an altering of the membrane’s free volume by ionic interactions with the Ru.
Reports of Al3+ ionomer exchange81, 82 and an in depth study of Ca2+ contamination in
the Nafion membrane84 have indicated that the multivalent ions have a higher binding
affinity than protons to the anion groups in the membrane. This suggests that over the
lifetime of fuel cell operation, higher levels of Ru could build up inside the membrane.
Ion contaminants with higher valance have been shown to reduce the proton conductivity
as well as dehydrate the membrane,85 which is consistent with our findings. This is of
further concern as transition metals existing in the membrane have been found to catalyze
radical attack on the membrane that leads to degradation.86
Even when present at lower levels, the trivalent Ru3+ ion decreases the equilibrium
hydration level and increases the micro-viscosity of the fluid state, which could alter the
water management attributes of the membrane in the fuel cell. More studies need to be
256
accomplished to fully understand the long term effects of Ru cross over considering
membrane degradation, proton conductivity, and vehicular diffusion.
5.4 Summary and Conclusions
Cyclic voltammograms of Pt taken after exposure (at open circuit) to 2.0 mM Run+
contaminated HClO4 reveal a significant increase in double-layer charge capacitance,
decreased Pt-O[H] formation/reduction and lower Hupd charge when compared to the CVs
taken in clean HClO4. An attempt to remove the spontaneously adsorbed Ru revealed that
some of the Ru could be removed by potential cycling to 1.4 V vs. RHE, however, not all
the Ru could be removed. Integration of the Hupd charge area indicated that adsorbed Ru
decreased the ECSA by approximately 25 %, of which only 5 % could be reclaimed upon
the cleaning procedure. These results suggest that spontaneously deposited Ru leached
out from a DMFC anode could impart irreversible damage to a fuel cell cathode via
catalytic site blocking.
ORR polarization sweeps reveal an increased overpotential by approximately 20 mV
after being subject to 2.0 mM Run+ for 90 minutes at open circuit potential. Although a
diffusion limited current was obtained, the magnitude of the current was slightly
decreased, supporting a site blocking theory. When the ORR polarization was performed
in the Ru contaminated electrolyte (2.0 mM), the overpotential increased ~ 150 mV and
no diffusion limiting current was obtained. The Tafel curves revealed a normal Pt
response with slopes close to –60 and –120 mV/decade for clean Pt, spontaneously
deposited Ru/Pt and ORR in Run+ contaminated HClO4. The Tafel line shapes were
relatively unchanged, consistent with the theory that there is no overall change to the rate
257
determining step of the reaction. However, the decrease in E (as well as exchange
current density) illustrates the adverse effect that Ru contamination has on the
overpotential of the reaction.
The EXAFS analysis revealed small but significant changes to the coordination
number NPt-Pt as a function of potential and the presence of Ru. The largest change to
NPt-Pt occurred when the clean Pt electrode was subject to Ru contaminated electrolyte at
OCP. Smaller changes in NPt-Pt occurred when the electrode potential was maintained, but
even these small changes could be related to atop vs. 3-fold Ru deposition, supporting the
Δμ results. The large decrease in NPt-Pt at OCP (7.16 to 6.24) is reflective of O adsorption
in 3-fold sites, as well as Ru deposition primarily in the 3-fold fcc sites at higher
coverage, resulting from the Pt particles becoming more flat. The Δμ−XANES analysis
support the EXAFS results and suggests Ru adsorption may proceed by an initial
atop/bridge Ru adsorption followed by adsorption onto the 3-fold fcc sites of the faces,
when the electrode is maintained at OCP as suggested by the FEFF 8.0 line shape
assessment. The Δμ curves, for which potential control was maintained, reveal smaller
magnitudes (< 2 % of the XANES signal) over a potential range of 0.3 – 0.8 V, indicating
relatively low Ru coverage (hindered by H or OH adsorption) and then a significant
increase at OCP apparently assisted by Coulombic forces involving the adsorbed O
atoms. The surface coverage is < 1 ML as shown by Figure 5.6 and also evident in the
CVs and the ESCA results in Table 5.1. It is further established that Ru adsorption may
enhance H2O activation by a ligand effect above 0.7 - 0.8 V, but partially impedes it by
blocking Pt sites for O2 dissociation at lower potentials.
258
The ESR analysis of Ru3+ in the Nafion membrane indicated changes in the
characteristics of the membrane in the presence of Ru ions. Increasing numbers of Ru
ions per sulfonic acid group in the membrane were observed to decrease the water uptake
of the membrane and also increase the micro-viscosity of the fluid regions possibly as a
result of a change of the free volume of the membrane. Ru ions in the membrane could
slow vehicular diffusion, decrease proton conductivity, and catalyze degradation of the
membrane by radical attack.
5.5 Acknowledgements
Financial support for this project was provided by the Army Research Office via a
single investigator grant and a Multi-University Research Initiative (Case Western
Reserve University, PI). We are also grateful for the use of beam lines X-18B, X-11A
and X-11B at the National Synchrotron Light Source, Brookhaven National Laboratory,
Upton, NY, which is supported by the U.S. Department of Energy, Office of Science,
Office of Basic Energy Sciences under Contract No. DE-AC02-98CH10886. We also
acknowledge Geolabs, Inc., Braintree, MA for ICP-MS measurements.
259
5.5 References
1. Deluca, N. W. & Elabd, Y. A. J. Polym. Sci., Part B: Polym. Phys. 44, 2201-2225 (2006).
2. Jarvi, T. D. & Stuve, E. M. (eds.) Fundamental Aspects of Vacuum and Electrocatalytic Reactions of Methanol and Formic Acid on Platinum Surfaces (Wiley-VCH, 1998).
3. Waszczuk, P., Crown, A., Mitrovski, M. & Wieckowski, A. (eds.) Methanol and Formic Acid Oxidation on Ad-Metal Modified Electrodes (Wiley-VCH, 2003).
4. Park, Y. S., Wieckowski, A. & Weaver, M. J. J. Am. Chem. Soc. 125, 2282 (2003).
5. Mukerjee, S. & McBreen, J. Journal of the Electrochemical Society 146, 600 (1999).
6. Wang, K., Gasteiger, H. A., Markovic, N. M. & Ross, P. N. Electrochimica Acta 41, 2587 (1996).
7. Mukerjee, S. et al. Investigation of enhanced CO tolerance in proton exchange membrane fuel cells by carbon supported PtMo alloy catalyst. Electrochem. Solid-State Lett. 2, 12-15 (1999).
8. Piela, P., Eicks, C., Brosha, E., Garzon, F. & Zelenay, P. J. Electrochem. Soc. 151, A2053-A2059 (2004).
9. Eicks, C., Piela, P., Davey, J. & Zelenay, P. J. Electrochem. Soc. 153, A171-A178 (2006).
10. Cao, D. & Bergens, S. H. An organometallic deposition of ruthenium adatoms on platinum that self poisons at a specific surface composition. A direct methanol fuel cell using a platinum-ruthenium adatom anode catalyst. J. Electroanal. Chem 533, 91-100 (2002).
11. Chrzanowski, W., Kim, H. & Wieckowski, A. Enhancement in methanol oxidation by spontaneously deposited ruthenium on low-index platinum electrodes. Catal. Lett 50, 69-75 (1998).
12. Chrzanowski, W. & Wieckowski, A. Ultrathin Films of Ruthenium on Low Index Platinum Single Crystal Surfaces: An Electrochemical Study. Langmuir 13, 5974-5978 (1997).
13. Crown, A. Surface studies of spontaneously deposited ruthenium on Pt(hk) electrodes. A summary report to The Electrochemical Society for the 2000 Colin Garfield Fink Summer Research Fellowship. Electrochem. Soc. Interface 10, 49-50 (2001).

260
14. Crown, A., Johnston, C. & Wieckowski, A. Growth of ruthenium islands on Pt(hkl) electrodes obtained via repetitive spontaneous deposition. Surf. Sci. 506, L268-L274 (2002).
15. Kim, H., Rabelo de Moraes, I., Tremiliosi-Filho, G., Haasch, R. & Wieckowski, A. Chemical state of ruthenium submonolayers on a Pt(111) electrode. Surf. Sci. 474, L203-L212 (2001).
16. Vigier, F., Gloaguen, F., Leger, J. M. & Lamy, C. Electrochemical and spontaneous deposition of ruthenium at platinum electrodes for methanol oxidation: an electrochemical quartz crystal microbalance study. Electrochim. Acta 46, 4331-4337 (2001).
17. Gancs, L., Hult, B. N., Hakim, N. & Mukerjee, S. Electrochem. Solid-State Lett. 10, B150-B154 (2007).
18. Wen, J. & Zhou, Z. Pseudocapacitance characterization of hydrous ruthenium oxide prepared via cyclic voltammetric deposition. Mater. Chem. Phys. 98, 442-446 (2006).
19. Wu, G., Li, L. & Xu, B.-Q. Effect of electrochemical polarization of PtRu/C catalysts on methanol electrooxidation. Electrochim. Acta 50, 1-10 (2004).
20. Cramm, S. et al. Anal. Chem. 358, 189 (1997).
21. Friedrich, K. A., Geyzers, K. P., Dickinson, A. J. & Stimming, U. J. Electroanal. Chem 524, 261 (2002).
22. Friedrich, K. A., Geyzers, K. P., Linke, U., Stimming, U. & Stumper, J. J. Electroanal. Chem 402, 123 (1996).
23. Friedrich, K. A., Geyzers, K. P., Marmann, A., Stimming, U. & Vogel, R. Z. Phys. Chem. 208, 137 (1999).
24. Maillard, F., Gloaguen, F., Hahn, F. & Leger, J. M. Fuel Cells 2, 143 (2002).
25. Maillard, F., Gloaguen, F. & Leger, J. M. Preparation of methanol oxidation electrocatalysts: ruthenium deposition on carbon-supported platinum nanoparticles. J. Appl. Electrochem. 33, 1-8 (2003).
26. Christensen, P. A., Jin, J.-M., Lin, W.-F. & Hamnett, A. Identification of CO Adsorbed at Ru and Pt Sites on a Polycrystalline Pt/Ru Electrode and the Observation of Their Oxidation and Free Interchange under Open Circuit Conditions. J. Phys. Chem. B 108, 3391-3394 (2004).
27. Herrero, E., Feliu, J. & Wieckowski, A. Langmuir 15, 4944 (1999).
261
28. Tremiliosi-Filho, G. et al. Reactivity and activation parameters in methanol oxidation on platinum single crystal electrodes 'decorated' by ruthenium adlayers. J. Electroanal. Chem. 467, 143-156 (1999).
29. Crown, A. & Wieckowski, A. Scanning tunneling microscopy investigations of ruthenium- and osmium-modified Pt(100) and Pt(110) single crystal substrates. Phys. Chem. Chem. Phys. 3, 3290-3296 (2001).
30. Crown, A., Moraes, I. R. & Wieckowski, A. Examination of Pt(111)/Ru and Pt(111)/Os surfaces: STM imaging and methanol oxidation activity. J. Electroanal. Chem. 500, 333-343 (2001).
31. Waszczuk, P. et al. Methanol electrooxidation on platinum/ruthenium nanoparticle catalysts. J. Catal. 203, 1-6 (2001).
32. Babu, P. K., Tong, Y. Y., Kim, H. & Wieckowski, A. Nanostructured electrode surfaces studied by electrochemical NMR. J. Electroanal. Chem 524, 157 (2002).
33. Lu, G. Q., Waszczuk, P. & Wieckowski, A. Oxidation of CO adsorbed from CO saturated solutions on the Pt(111)/Ru electrode. J. Electroanal. Chem 532, 49 (2002).
34. Maillard, F., Lu, G. Q., Wieckowski, A. & Stimming, U. Ru-Decorated Pt Surfaces as Model Fuel Cell Electrocatalysts for CO Electrooxidation. J. Phys. Chem. B 109, 16230-16243 (2005).
35. Bonilla, S. H. et al. Catalytic effects of ruthenium and osmium spontaneous deposition on platinum surfaces toward methanol oxidation. J. Colloid Interface Sci. 288, 377-386 (2005).
36. Colle, V. D., Giz, M. J. & Tremiliosi-Filho, G. Spontaneous deposition of Ru on Pt(100): Morphological and electrochemical studies. Preliminary results of ethanol oxidation at Pt(100)/Ru. J. Braz. Chem. Soc. 14, 601-609 (2003).
37. Waszczuk, P., Barnard, T. M., Rice, C., Masel, R. I. & Wieckowski, A. A nanoparticle catalyst with superior activity for electrooxidation of formic acid. Electrochem. Commun. 4, 599-603 (2002).
38. Lu, L., Yin, G., Wang, Z., Cai, K. & Gao, Y. Electrocatalytic oxidation of dimethyl ether on ruthenium modified platinum single crystal electrodes. Catal. Commun. 10, 971-974 (2009).
39. Ku, B., Jung, C. & Rhee, C. K. Atomic arrangements inside Ru and Os nanoislands spontaneously deposited on Pt(111). J. Phys. Chem. B 110, 13425-13429 (2006).
262
40. Strbac, S., Johnston, C. M., Lu, G. Q., Crown, A. & Wieckowski, A. In situ STM study of nanosized Ru and Os islands spontaneously deposited on Pt(111) and Au(111) electrodes. Surf. Sci. 573, 80-99 (2004).
41. Vericat, C., Wakisaka, M., Haasch, R., Bagus, P. S. & Wieckowski, A. Binding energy of ruthenium submonolayers deposited on a Pt(111) electrode. J. Solid State Electrochem. 8, 794-803 (2004).
42. Lin, W. F., Zei, M.S., Eisworth, M., Ertl, G. Electrocatalytic Activity of Ru-Modified Pt(111) Electrodes toward CO Oxidation. J. Phys. Chem. B. 103, 6968 (1999).
43. Park, K.-W. & Sung, Y.-E. J. Phys. Chem. B 109, 13585 (2005).
44. Iwasita, T., Hoster, H., John-Anacker, A., Lin, W. F. & Vielstich, W. Methanol Oxidation on PtRu Electrodes. Influence of Surface Structure and PtRu Atom Distribution. Langmuir 16, 522-529 (2000).
45. Frelink, T., Visscher, W. & Van Veen, J. A. R. Langmuir 12, 3702 (1996).
46. Mukerjee, S., Ziegelbauer, J., Arruda, T. M., Ramaker, D. & Shyam, B. Understanding Electrocatalytic Pathways in Low and Medium Temperature Fuel Cells: Synchrotron-based In Situ X-Ray Absorption Spectroscopy. Electrochem. Soc. Interface 17, 46-52 (2008).
47. Russell, A. E. & Rose, A. X-ray Absorption Spectroscopy of Low Temperature Fuel Cell Catalysts. Chem. Rev. 104, 4613-4635 (2004).
48. Arruda, T. M., Shyam, B., Ziegelbauer, J. M., Mukerjee, S. & Ramaker, D. E. Investigation into the Competitive and Site-Specific Nature of Anion Adsorption on Pt Using In Situ X-ray Absorption Spectroscopy. J. Phys. Chem. C 112, 18087-18097 (2008).
49. Teliska, M., O'Grady, W. E. & Ramaker, D. E. Determination of O and OH Adsorption Sites and Coverage in Situ on Pt Electrodes from Pt L23 X-ray Absorption Spectroscopy. J. Phys. Chem. B 109, 8076-8084 (2005).
50. Teliska, M., Murthi, V. S., Mukerjee, S. & Ramaker, D. E. Correlation of Water Activation, Surface Properties, and Oxygen Reduction Reactivity of Supported Pt–M/C Bimetallic Electrocatalysts Using XAS. J. Electrochem. Soc. 152, A1259 (2005).
51. Teliska, M., O'Grady, W. E. & Ramaker, D. E. Determination of H Adsorption Sites on Pt/C Electrodes in HClO4 from Pt L23 X-ray Absorption Spectroscopy. J. Phys. Chem. B 108, 2333-2344 (2004).
52. Marković, N. M. & Ross, P. N. Surface science studies of model fuel cell electrocatalysts. Surf. Sci. Rep. 45, 117-229 (2002).
263
53. Ziegelbauer, J. M. et al. Direct Spectroscopic Observation of the Structural Origin of Peroxide Generation from Co-Based Pyrolyzed Porphyrins for ORR Applications. J. Phys. Chem. C 112, 8839-8849 (2008).
54. Ziegelbauer, J. M. et al. Fundamental Investigation of Oxygen Reduction Reaction on Rhodium Sulfide-based Chalcogenides. J. Phys. Chem. C (accepted).
55. Ziegelbauer, J. M., Gatewood, D., Gullá, A. F., Ramaker, D. E. & Mukerjee, S. X-ray Absorption Spectroscopy Studies of Water Activation on an RhxSy Electrocatalyst for ORR Applications. Electrochem. Solid-State Lett. 9, A430-A434 (2006).
56. Jung, E. H. et al. Methanol crossover through PtRu/Nafion composite membrane for a direct methanol fuel cell. Int. J. Hydrogen Energy, 32 (7), 903-907 (2007).
57. Lawton, J. S., Smotkin, E. & Budil, D. E. Electron Spin Resonance Investigation of Microscopic Viscosity, Ordering, and Polarity in Nafion Membranes Containing Methanol−Water Mixtures. J. Phys. Chem. B 112, 8549 (2008).
58. Lawton, J. S. & Budil, D. E. J. Phys. Chem. B In Press (2009).
59. Murthi, V. S., Urian, R. C. & Mukerjee, S. Oxygen Reduction Kinetics in Low and Medium Temperature Acid Environment: Correlation of Water Activation and Surface Properties in Supported Pt and Pt Alloy Electrocatalysts. J. Phys. Chem. B 108, 11011-11023 (2004).
60. McBreen, J., O'Grady, W. E., Pandya, K. I., Hoffman, R. W. & Sayers, D. E. EXAFS study of the nickel oxide electrode. Langmuir 3, 428 (1987).
61. Newville, M. J. IFEFFIT. Synchrotron Radiat. 8, 322 (2001).
62. Newville, M., Livins, P., Yacoby, Y., Stern, E. A. & Rehr, J. J. Near-edge x-ray-absorption fine structure of Pb: A comparison of theory and experiment. Phys. Rev. B 47, 14126 (1993).
63. van Dorssen, G. E., Koningsberger, D. C. & Ramaker, D. E. Separation of double-electron and atomic XAFS contributions in x-ray absorption spectra of Pt foil and Na2Pt(OH)6. J. Phys.: Condens. Matter 14, 13529-13541 (2002).
64. Ramaker, D. E., Mojet, B. L., Miller, J. T. & Koningsberger, D. C. An atomic X-ray absorption fine structure study of the influence of hydrogen chemisorption and support on the electronic structure of supported Pt particles. Top. Catal. 10, 157-165 (2000).
65. Koningsberger, D. C., Mojet, B. L., Miller, J. T. & Ramaker, D. E. XAFS spectroscopy in catalysis research: AXAFS and shape resonances. J. Synchrotron. Radiat. 6, 135-141 (1999).
264
66. Ramaker, D. E., Mojet, B. L., Koningsberger, D. C. & O'Grady, W. E. Understanding Atomic X-ray Absorption Fine Structure in X-ray Absorption Spectra. J. Phys.: Condens. Matter 10, 8753-8770 (1998).
67. Ankudinov, A. L., Ravel, B., Rehr, J. J. & Conradson, S. D. Real Space Multiple Scattering Calculation and Interpretation of X-ray Absorption Near Edge Structure. Phys. Rev. B 58, 7565-7576 (1998).
68. Janin, E., von Schenck, H., Göthelid, M. & Karlsson, U. O. Bridge-bonded atomic oxygen on Pt(110). Phys. Rev. B 61, 13144-13149 (2000).
69. Schneider, D. J. & Freed, J. H. Biol. Magn. Reson. 8, 1 (1989).
70. Schneider, D. J. & Freed, J. H. Adv. Chem. Phys. 73, 387 (1989).
71. Schmidt, T. J., Paulus, U. A., Gasteiger, H. A. & Behm, R. J. The oxygen reduction reaction on a Pt/carbon fuel cell catalyst in the presence of chloride anions. J. Electroanal. Chem. 508, 41-47 (2001).
72. Ravel, B. & Newville, M. Athena & Artemis. J. Synchrotron Radiat. 12, 537-541 (2005).
73. Roth, C., Benker, N., Mazurek, M., Scheiba, F. & Fuess, H. Pt-Ru fuel cell catalysts subjected to H2, CO, N2 and air atmosphere: An X-ray absorption study. Appl. Catal., A 319, 81-90 (2007).
74. Scott, F. J., Mukerjee, S. & Ramaker, D. E. CO coverage/oxidation correlated with PtRu electrocatalyst particle morphology in 0.3 M methanol by in situ XAS. J. Electrochem. Soc. 154, A396-A406 (2007).
75. Scott, F. J., Roth, C. & Ramaker, D. E. J. Phys. Chem. C 111, 11403-11413 (2007).
76. Teliska, M., Murthi, V. S., Mukerjee, S. & Ramaker, D. E. Site-Specific vs Specific Adsorption of Anions on Pt and Pt-Based Alloys. J. Phys. Chem. C 111, 9267-9274 (2007).
77. Roth, C. & Ramaker, D. E. (ed. White, R. E.) (Springer, 2009).
78. Ramaker, D. E., Teliska, M., Zhang, Y., Stakheev, A. Y. & Koningsberger, D. C. Understanding the influence of support alkalinity on the hydrogen and oxygen chemisorption properties of Pt particles. Comparison of X-ray absorption near edge data from gas phase and electrochemical systems. Phys. Chem. Chem. Phys. 5, 4492-4501 (2003).
79. Koningsberger, D. C., Oudenhuijzen, M. K., De Graaf, J., Van Bokhoven, J. A. & Ramaker, D. E. In situ X-ray absorption spectroscopy as a unique tool for obtaining information on hydrogen binding sites and electronic structure of

265
supported Pt catalysts: towards an understanding of the compensation relation in alkane hydrogenolysis. J. Catal. 216, 178-191 (2003).
80. Ahmed, M., Elmuntasir, I., Huang, K.-L. & Holsen, T. M. Nafion-117 Behavior during Cation Separation from Spent Chromium Plating Solutions Ind. Eng. Chem. Res. 48, 6805-6810 (2009).
81. Vishnyakov, A. & Neimark, A. V. Specifics of solvation of sulfonated polyelectrolytes in water, dimethylmethylphosphonate, and their mixture: A molecular simulation study. J. Chem. Phys. 128, 164902 (2008).
82. Vishnyakov, A. & Neimark, A. V. Molecular Dynamics Simulation of Nanoscale Distribution and Mobility of Water and Dimethylmethylphosphonate in Sulfonated Polystyrene. J. Phys. Chem. B 112, 14905–14910 ( 2008).
83. Suleiman, D., Napadensky, E., Sloan, J. M. & Crawford, D. M. Thermogravimetric characterization of highly sulfonated poly(styrene-isobutylene-styrene) block copolymers: Effects of sulfonation and counter-ion substitution. Thermochim. Acta 460, 35-40 (2007).
84. Okada, T., Nakamura, N., Makoto, Y. & Sekine, I. Ion and water transport characteristics in membranes for polymer electrolyte fuel cells containing H+ and Ca2+ cations. J. Electrochem. Soc. 144, 2744-2750 (1997).
85. Kelly, M. J. et al. Conductivity of polymer electrolyte membranes by impedance spectroscopy with microelectrodes Solid State Ionics 176, 2111-2114 (2005).
86. Halalay, I., Merzougui, B. A. & Mance, A. M. Three mechanisms for protecting the PEM fuel cell membrane, plates and catalyst. ECS Trans. 16, 969-981 (2008).
266
Chapter 6
Probing the Influence of Polyvinyl Pyrrolidone (PVP) on Supported
Platinum Electrocatalysts in 0.1M HClO4 Using in situ X ray
Absorption Spectroscopy∗
6.1 Introduction
The number of papers reporting the synthesis and catalytic activity of metal
nanoparticles synthesized with the aid of polymers containing functional groups,
commonly known as capping agents, has increased significantly over the last decade.
Many of these polymers are known to stabilize colloidal suspensions and catalyst
nanoparticles by preventing coalescence and reducing agglomeration. The coalescence of
nanoparticles is responsible in part for the aging of catalysts resulting in an increase in
the average particle size that invariably leads to a reduced electrochemically active
∗ To be published in The Journal of Physical Chemistry C Authors: Badri Shyam, Ceren Susut, Yu Ye Tong and David E. Ramaker Sample preparation and electrochemistry data collected by authors affiliated with Georgetown University. XAS data collection and analysis carried out by authors from the The George Washington University.
267
surface area (ECSA). Given that nanoparticle growth by agglomeration is one of the main
reasons for the loss of catalytic activity1, 2 in a fuel cell, the use of capping agents to
stabilize the nanoparticles holds great promise.3 Some commonly used
stabilizing/capping agents include oleylamine (OA), poly(3-thiophene acetic acid),
polyvinyl alcohol (PVA), polystyrene-4-sulfonate (PSS), poly(3,4-
ethylenedioxythiophene) (PEDOT), poly-2-ethyloxazoliine (POX), polyethylene oxide
(PEO), polyethyleneimine (PIM), polyamyl alcohol (PAA) and poly-N-vinyl 2–
pyrrolidone (PVP), to name a few. Using various principles such as controlling the
strength of the reducing agent and varying the molar ratios of the metal precursor and
capping agent, one can vary the kinetics of formation of the nanoparticles, leading to
particle shape-controlled syntheses,4, 5 a field of research first explored by Ahmadi and
co-workers.6 Since then, several other reports 7-12 and review articles 13-16 discussing the
synthesis and properties of polymer-stabilized or specifically shaped-nanoparticles and
catalysts have been published.
PVP is the polymeric form of n-vinyl pyrrolidone, which is a 5-membered pyrrole
ring having a vinyl group and carbonyl group (see Figure 6.1). While this polymer is
hydrophilic and water-soluble, it also contains a hydrophobic hydrocarbon backbone
(essentially a surfactant) – a combination which provides functional polymers with very
interesting chemical properties. Polymeric PVP may have molecular weights ranging
from 2500-360,000 and has many applications due to its interesting chemical properties.
It is known to be non-toxic 17 and soluble in both organic and aqueous solvents, and
hence is widely used in medicinal applications 18 and personal care products. 19 PVP is
hygroscopic and also has a tendency to hydrogen bond to water. 20 As it effectively
268
stabilizes most metal colloids and nanoparticles, is has been used extensively to
synthesize stabilized colloids and nanoparticles. For more information on the physico-
chemical properties and spectroscopic characterization of PVP, the reader is referred to
early comprehensive studies on this capping agent. 17, 21-25
There have been a number of papers showcasing the various catalytic properties of
PVP-capped colloidal Pt nanoparticles, 26-30 alloy nanoparticles 31-33 and shaped-
nanoparticles. 34-40 Apart from the common shapes such as cubes, tetrahedra and
octahedral nanoparticles, more exotic shapes such as triangular plates, hollow-tetrahedra,
star-shaped NPs, and rod-like NPs have also been synthesized 30, 41-43. Most recently, PVP
has been used in the synthesis of core-shell nanoparticles. 44-47 Studies on PVP-M (where
M is a metal other than Pt) are also numerous. 46-56 It is interesting that PVP is used so
ubiquitously in colloidal catalysts that catalytic studies on PVP-M materials have been
used for baseline experiments in order to highlight the effect of further additives such as
salts of Fe, Co, Ni etc. 13
Given the large amount of literature involving the widespread use of PVP as a
stabilizing agent, it is almost surprising that so little is known about the actual influence
of PVP on the catalytic properties of platinum and other metals. This is an important
question as it is now generally accepted that residual PVP is almost always present in the
synthesized nanoparticles and indeed, even essential for preserving the shapes of these
nanoparticles. 57-59 But does the presence of the PVP influence their catalytic properties
beyond just stabilizing and maintaining the nanoparticle shape? The answer appears to be
yes, but it has also been acknowledged, not surprisingly, that the role and degree of
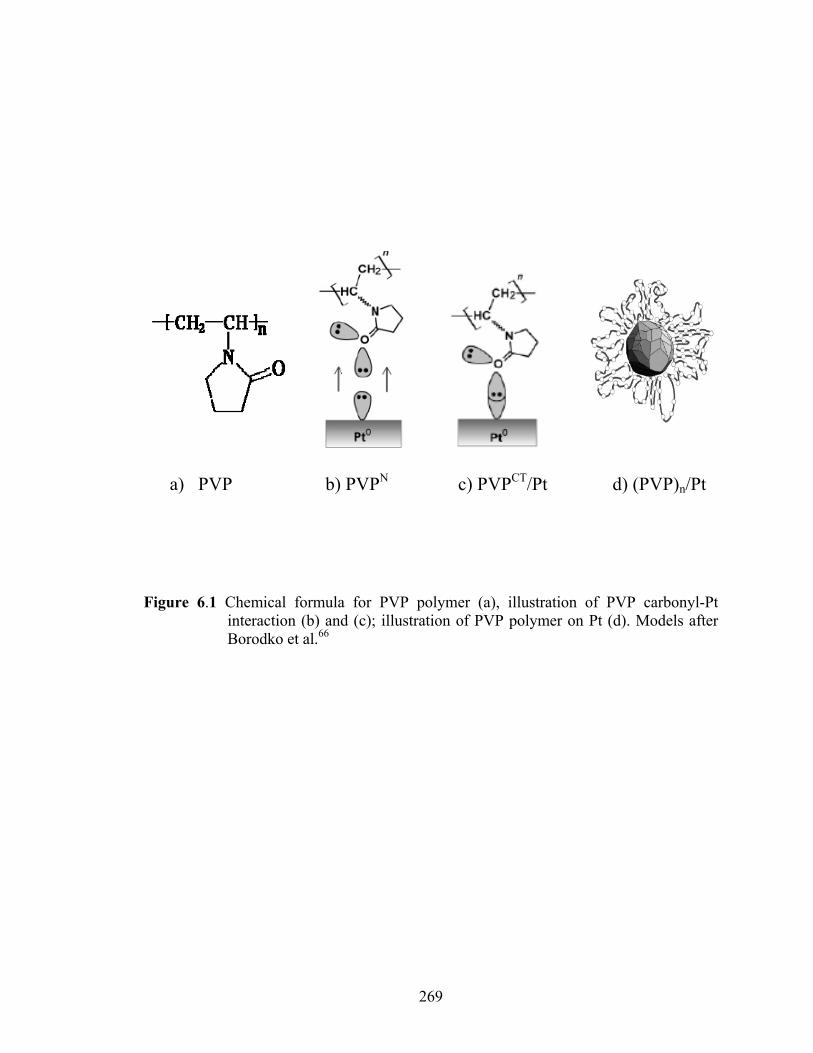
269
Figure 6.1 Chemical formula for PVP polymer (a), illustration of PVP carbonyl-Pt interaction (b) and (c); illustration of PVP polymer on Pt (d). Models after Borodko et al.66
a) PVP b) PVPN c) PVPCT/Pt d) (PVP)n/Pt
270
influence that the stabilizing agent has on the native properties of the substrate metal will
depend on the reaction being catalyzed. 60, 61 The precise reason for the enhancement of
the catalytic activity for some reactions on Pt and other metals by PVP is not yet known.
62 There exists a paucity of papers wherein the Pt-PVP interaction has been directly
observed and studied. Even in these few studies, the stabilized Pt colloids and
nanoparticles were mostly dried powders that were studied either in vacuum or in air
using spectroscopic techniques such as x-ray photoelectron spectroscopy (XPS), Fourier-
transform infrared (FTIR) spectroscopy and UV-Raman spectroscopy. 63-66 We are not
aware of any spectroscopic study of the Pt-PVP interaction in an aqueous environment
such as existing in a fuel cell, except for our previous work on unsupported PVP-Pt black
catalysts, when SEIRAS was utilized.59 Indeed, as was noted above, direct evidence for
the interaction between a capping agent and the metal catalyst is rare, and often carried
out under conditions that make cross-study comparisons hard. 67, 68
In this work, we attempt to understand the Pt-PVP interaction under electrocatalytic
reaction conditions for supported Pt/C catalysts using in situ XAS and electrochemical
measurements. In order to effectively exploit the various properties of stabilizing agents,
especially for applications in catalysis, a systematic effort towards understanding the
influence of capping agents on Pt and other commonly employed catalytic metals is
required. We report findings from an in situ X-ray Absorption Spectroscopy (XAS) study
of PVP-capped Pt/C catalysts utilizing the novel Δμ-XANES (X-ray absorption near edge
structure) technique as well as the more common EXAFS (Extended x-ray absorption
fine structure) analysis as illustrated in Figure 6.2. We compare results on these PVP-

271
Figure 6.2 Illustration of EXAFS and Δµ-XANES analysis procedure, with pre-edge background removal, normalization, and then isolation of the EXAFS signal and fit to model functional in EXAFS, and isolation of the adsorbate effect on the XANES by taking the difference, Δµ. After Roth et al.72
E(eV
Background Normalizatio
E(eV
Background Normalizatio Chi(k) Fourier
E(eV k(Å-1) R(Å
EXAFS
XANES
EXAFS
μ(ad/Pt)
μ(Pt) Δμ
E(eV E(eV E(eV
Fit
272
Pt/C catalysts with our previous work on the PVP-Pt black catalysts, but the current work
is the first to utilize XAS. In situ XAS is a powerful technique to study electrocatalysis,
as EXAFS analysis furnishes information on coordination number and bond lengths of
the catalysts while changes in their oxidation state can be followed by analyzing the
XANES region. In addition to the conventional XAS analysis just described, in this study
we also used the ∆µ-XANES method 69-71 to understand the interaction of PVP with Pt as
well as to obtain site-specific adsorbate information on the adsorbates (H, OH and O)
existing on these catalysts. The method has been successfully used in the past to study
adsorption of various ions and species on Pt catalysts, 70-78 ligand effects of alloyed
metals in Pt alloy catalysts, 75, 76 and more recently, even the effects of ligand
(triphenylphosphine triphosphonate, or TPPTP) stabilized Pt nanoparticles on water
activation.79 These Δμ-XANES results are correlated with water activation, methanol
oxidation, CO stripping and chronoamperometric measurements in 0.5M H2SO4 and 0.1
M HClO4, revealing interesting details regarding the nature of the Pt-PVP interaction.
Various mechanisms of interaction will be presented and discussed along with others’
findings in order to better understand the influence of PVP on supported Pt nanoparticle
electrocatalysts.
6.2 Experimental
6.2.1 Catalyst synthesis
PVP-capped carbon-supported Pt samples were synthesized as follows. For each
synthesis, 2.5 ml of ethylene glycol (EG, J.T. Baker) was refluxed for 5 minutes. Portions
of the PVP (MW = 55,000, Sigma Aldrich) and the Pt/C catalysts (Johnson-Matthey, 40
273
wt.% Pt/C) were added to the boiling EG every 30 seconds over a 16 minute period. Two
different samples were prepared (Pt-PVP12 and Pt-PVP24) by using two PVP:Pt molar
ratios viz., 1:12 and 1:24. The resulting mixture was then refluxed for an additional 60
minutes. The resulting catalysts were centrifuged repeatedly at 5000 rpm (Sorvall, RC 5C
PLUS) to remove any unreacted PVP. It should be emphasized that this catalysts
preparation procedure is significantly different from those utilized to prepare particularly
shaped Pt particles, as the Pt particles in Pt/C in the current work have already been
formed, and we assume little or no re-shaping of the Pt particles occurs upon mixing with
the PVP. Thus, in this work we are only examining the affect of the Pt-PVP interaction
for supported Pt/C catalysts, and not a shape effect.
6.2.2 XAS - sample preparation and data collection
In situ XAS experiments were conducted at the National Synchrotron Light Source
(NSLS) located at Brookhaven National Laboratory in Upton, N.Y. The data were
collected at beamline X-11B at the Pt L3 edge (11564 eV) in transmission mode using a
standard 3-detector setup. The beam energy was selected using a Si(111) double-crystal
monochromator and energy calibration was accomplished by recording the XAS
spectrum of a 7 µm Platinum foil placed between the second and third ionization
detectors (It and Iref). The storage ring operated at an energy of 2.81 GeV with ring
currents varying between 60 and 200 mA. The beam spot size measured ca. 1 mm Χ 4
mm in area. Full Pt L3 edge EXAFS scans (-200 eV to 16k) were collected at difference
potentials by holding the cell potentiostatically during every measurement. The data in
274
the XANES region (-50 to 80 eV) were collected in steps of 0.5 eV while all data in the
EXAFS region (E > 80 eV) were collected in steps of 3.5 - 4.0 eV.
All XAS measurements were carried out in a specially designed in situ XAS
spectroelectrochemical cell (Courtesy of the Mukerjee group, Northeastern University),
which contains an electrochemical half-cell and an arrangement to accommodate a
reference electrode. Catalyst inks of the Pt/C and PVP-Pt/C materials were made in
deionized water and applied to a carbon cloth (Panex ® 30 woven carbon fiber fabric,
Zoltek) with a paintbrush. Through the application of multiple coats, the carbon cloth
electrodes were repeatedly dried and weighed till the requisite loading of ca. 3-4 mg/cm2
was obtained on the electrodes. The assembled in situ XAS cell was then placed between
the first two detectors (I0 and It) in order to obtain an x-ray absorption spectrum of the
catalysts. The electrode potential was controlled by a potentiostat (EcoChemie Autolab
PGSTAT-30) and all potentials were measured against a standard hydrogen electrode.
6.2.3 Electrochemical measurements
All electrochemical measurements were carried out in an Ar-blanketed conventional
3-electrode electrochemical cell using either an EG&G 273A potentiostat (Princeton
Applied Research) controlled by a PC with a CoreWare software package or a CHI
electrochemical work station (CHI 660C). Unless otherwise noted, all cyclic
voltammograms (CV) were recorded at a scan rate of 50 mV/s. A Pt wire and Ag/AgCl
(3M) standard electrode were used as counter and reference electrodes respectively. All
chronoamperometric (CA) measurements were recorded at a constant potential of 0.39 V
(vs. RHE).
275
The supporting electrolytes used were 0.1M HClO4 and 0.5M H2SO4 solutions made
up using mill-Q water (18.2 MΩ). Specifically, 0.1 M HClO4 solutions were prepared
with high-purity perchloric acid (GFS chemicals, sulfate content 0.0001%). Note that
while all electrochemical data were physically measured against the Ag/AgCl electrode,
the data are expressed with respect to the Reversible Hydrogen Electrode (RHE) in all
figures and the text. The conversion numbers are 0.29 V for 0.1M HClO4, 0.26 V for
0.5M H2SO4. These numbers were determined by measuring the open circuit potential
(OCP) between the Ag/AgCl (3M) reference electrode and the Pt wire counter electrode
under H2 bubbling. All methanol oxidation experiments were performed in 0.5M H2SO4
+ 0.5M CH3OH or 0.1M HClO4 + 0.5M CH3OH solutions.
For CO stripping measurements, the CO was adsorbed by saturating the
electrochemical cell with CO for 10 minutes while holding the electrode potential at 0.1V
vs. an Ag/AgCl electrode. The cell was then purged with Ar for 30 minutes before the
CO stripping CV was recorded. All currents reported were normalized to the Pt surface
area calculated by the total hydrogen desorption charge (220 µC/cm2 for commercially
available Pt black).
6.3 EXAFS analysis
EXAFS analysis on the data was accomplished using the programs available in the
IFEFFIT suite. 80 The ATHENA program was used for all the raw data processing such
as energy calibration of the reference foil spectra, alignment and normalization while
ARTEMIS was used for carrying out the EXAFS fits to the data. In order to the extract
coordination numbers (NPt-Pt) and bond distances (RPt-Pt) from the XAS data, standard
procedures were used. All XAS spectra were first normalized in the EXAFS region (120-
276
930 eV above the Pt L3 edge) and the oscillatory component χ(k) extract. Only single-
shell fits were carried out on the data using crystallographic parameters for a face-
centered cubic (fcc) Pt crystal. The set of rectangular coordinates for the Pt cluster were
generated using the ATOMS program that is also available as part of the IFEFFIT suite.
81 The k2-weighted χ(k) data were fit over a k-range of 2 Å-1 < k < 13.95 Å-1 and an R-
window of 1.699 Å < r < 3.229 Å. The data were Fourier-transformed using a Kaiser-
Bessel window. The experimental NPt-Pt values were calculated by using the relation:
NPt-Pt (exp.) = 1/S02(theo.) * [NPt-Pt (theo.) * amp (exp.)] (Eq. 6.1)
where S02 (theo.) is the theoretical many-body amplitude reduction factor and is
calculated using FEFF 8.0; a value of 0.934 was obtained for Pt as absorber atom. NPt-Pt
(theo.) is the theoretical coordination around Pt in a face-centered cubic lattice and is
equal to 12. The final variable in the equation, amp (exp.), is the amplitude value
obtained from each fit. As is generally performed in all of our in situ XAS analyses, the
fits are carried out twice over in order to arrive at a meaningful variation in the NPt-Pt as a
function of the electrode potential. It is well-known that coordination numbers, in this
case NPt-Pt, are positively correlated with the Debye-Waller factors (σ2) for EXAFS fits.
Therefore, a fixed σ2 value is used for all fits in order to arrive at a more accurate
variation in NPt-Pt as a function of electrode potential. An averaged σ2 is obtained by
fitting the entire data set once allowing all four fitting parameters to vary. The final set of
NPt-Pt values are obtained from a second round of fits using a value of σ2.fixed at the
averaged value obtained previously.
277
6.4 XANES analysis
As the ∆µ-XANES method is a surface-sensitive method, it is advantageous to have a
significant dispersion of the Pt catalyst in order to obtain data of sufficiently good
quality. Thus, even though features in CV’s may be clearer for data collected on
unsupported Pt catalysts (Pt black), 82 carbon-supported Pt nanoparticles were preferred
to Pt black for the XAS experiments.
All XAS spectra were first normalized in the 25-170 eV range. The Pt foil spectra
were then calibrated to the Pt L3 edge energy of 11,564 eV and were aligned to one
reference foil spectrum. Any energy shifts associated with this alignment are
automatically applied to the respective sample spectra in ATHENA. The experimental
∆µ-XANES spectra (also referred to as difference spectra in parts of the paper) were
calculated as ∆µ(Vi) = µ(Vi) - µ(0.54V)ref where µ(Vi) is the absorption spectrum at the
potential of interest and µ(0.54V)ref is the reference spectrum collected at 0.54 V (double-
layer region) when the surface can be expected to be free of any adsorbate(s). Note that
both the μ(Vi) and μ(0.54V) spectra are taken either without PVP or with PVP (see
Figure 6.2). Thus in both cases the Δμ difference should reflect the adsorption due to any
adsorbate(s) (e.g. H, OH, O) on the Pt surface, but also in the latter case possibly from
changes in the nature of the PVP-Pt interaction. These spectra were compared to
theoretical difference spectra, ∆µth = µ(Pt6-adsorbate) - µ(Pt6), obtained using the FEFF
8.0 code 83 where the adsorbate may be H or O in a particular binding site and Pt6 is a six-
atom platinum cluster. Further details on the modeling and calculations are given in the
following section.

278
6.4.1 FEFF 8.0 modeling and theoretical calculations
The theoretical near-edge absorption spectra (XANES) for both the clean Pt cluster as
well as the clusters with bonded PVP in various orientations were calculated using the
FEFF 8.0 code. Pt-Pt bonds in the cluster were maintained at 2.77 Å for all calculations,
the established interatomic bond distance in bulk platinum (fcc).
The theoretical spectra for the Pt/C catalyst was a 6-atom cluster (sometimes called
the Janin cluster) and is the smallest cluster that contains atop, bridged, fcc and hcp
adsorption sites. 84 In order to calculate the theoretical spectra for the PVP-Pt/C catalyst,
a modified PVP molecule bonded to the Pt cluster was used. Essentially, the monomer
consisting of only the pyrrolidone ring was ‘bonded’ to the Pt cluster via the carbonyl
group. More specifically, the ‘PVP’ molecule was placed over the Pt6 cluster such that
the carbonyl group occupied, in each case, either an atop, bridged or 3-fold-like position
on the Pt6 cluster. ArgusLab™, a computational modeling and visualization software was
used to run a molecular modeling (MM) simulation with a unified force field (UFF)
geometry optimization procedure. A convergence of at least 0.1 kcal/mol/Angstrom for
the gradient was arrived at by allowing a maximum of 500 iterations. Care was taken to
ensure that the Pt-Pt bond distance of 2.77 Å and the overall geometry of the Pt6 cluster
was unchanged by suitably constraining their parameters during the geometry
optimization calculation. The final coordinates of the Pt cluster along with that of the
adsorbed ‘PVP’ molecule were imported and used for the FEFF calculations. Theoretical
difference spectra were finally calculated by taking the difference between the spectra
obtained for the PVP-Pt/C calculation and the ‘clean’ Pt6 cluster used to represent the
Pt/C catalyst.
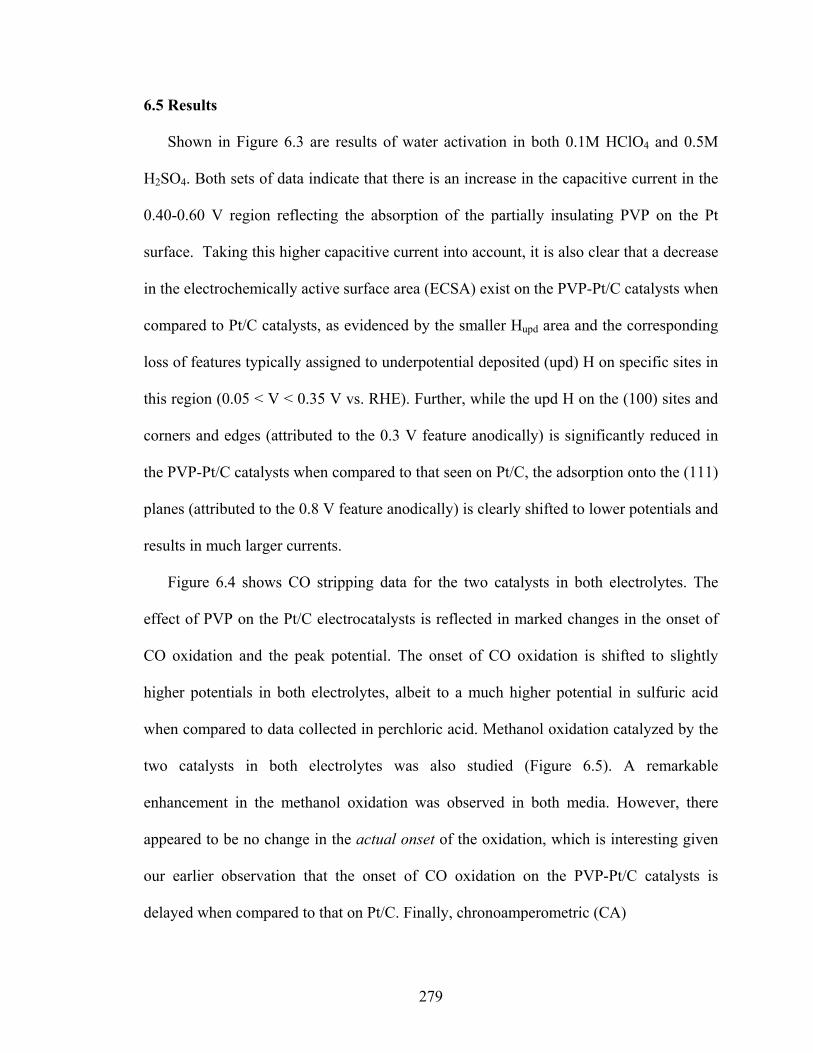
279
6.5 Results
Shown in Figure 6.3 are results of water activation in both 0.1M HClO4 and 0.5M
H2SO4. Both sets of data indicate that there is an increase in the capacitive current in the
0.40-0.60 V region reflecting the absorption of the partially insulating PVP on the Pt
surface. Taking this higher capacitive current into account, it is also clear that a decrease
in the electrochemically active surface area (ECSA) exist on the PVP-Pt/C catalysts when
compared to Pt/C catalysts, as evidenced by the smaller Hupd area and the corresponding
loss of features typically assigned to underpotential deposited (upd) H on specific sites in
this region (0.05 < V < 0.35 V vs. RHE). Further, while the upd H on the (100) sites and
corners and edges (attributed to the 0.3 V feature anodically) is significantly reduced in
the PVP-Pt/C catalysts when compared to that seen on Pt/C, the adsorption onto the (111)
planes (attributed to the 0.8 V feature anodically) is clearly shifted to lower potentials and
results in much larger currents.
Figure 6.4 shows CO stripping data for the two catalysts in both electrolytes. The
effect of PVP on the Pt/C electrocatalysts is reflected in marked changes in the onset of
CO oxidation and the peak potential. The onset of CO oxidation is shifted to slightly
higher potentials in both electrolytes, albeit to a much higher potential in sulfuric acid
when compared to data collected in perchloric acid. Methanol oxidation catalyzed by the
two catalysts in both electrolytes was also studied (Figure 6.5). A remarkable
enhancement in the methanol oxidation was observed in both media. However, there
appeared to be no change in the actual onset of the oxidation, which is interesting given
our earlier observation that the onset of CO oxidation on the PVP-Pt/C catalysts is
delayed when compared to that on Pt/C. Finally, chronoamperometric (CA)
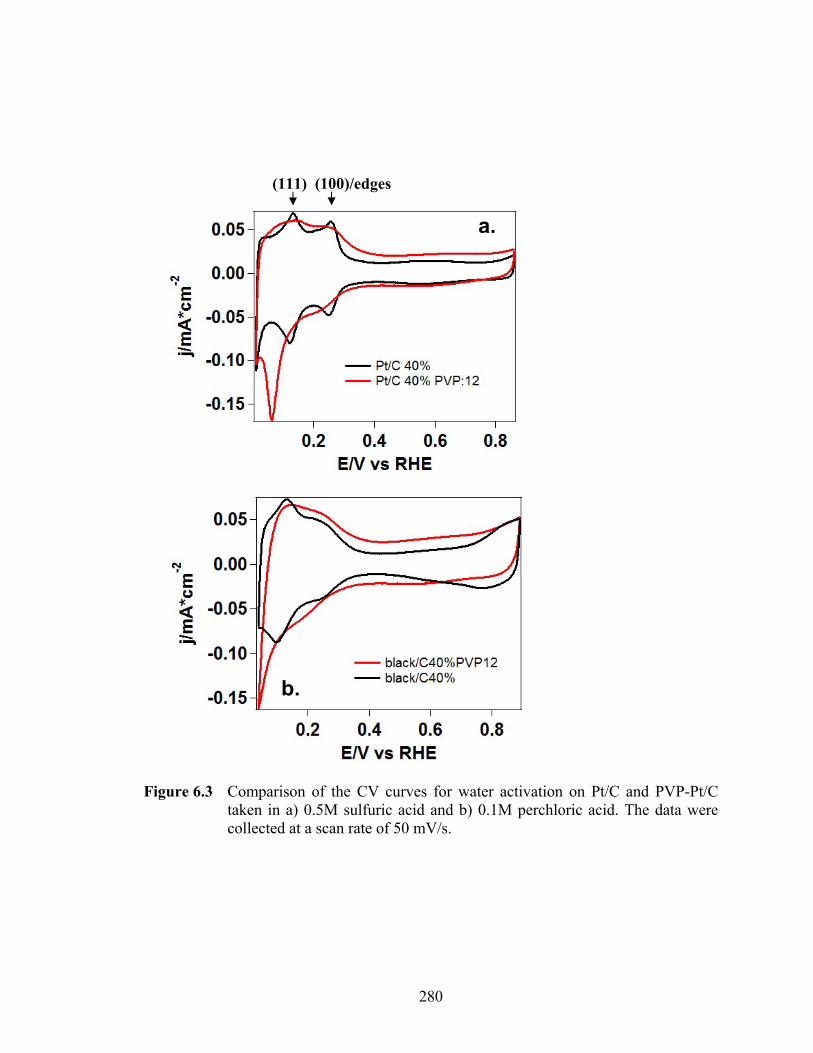
280
Figure 6.3 Comparison of the CV curves for water activation on Pt/C and PVP-Pt/C taken in a) 0.5M sulfuric acid and b) 0.1M perchloric acid. The data were collected at a scan rate of 50 mV/s.
a.
(111) (100)/edges
b.
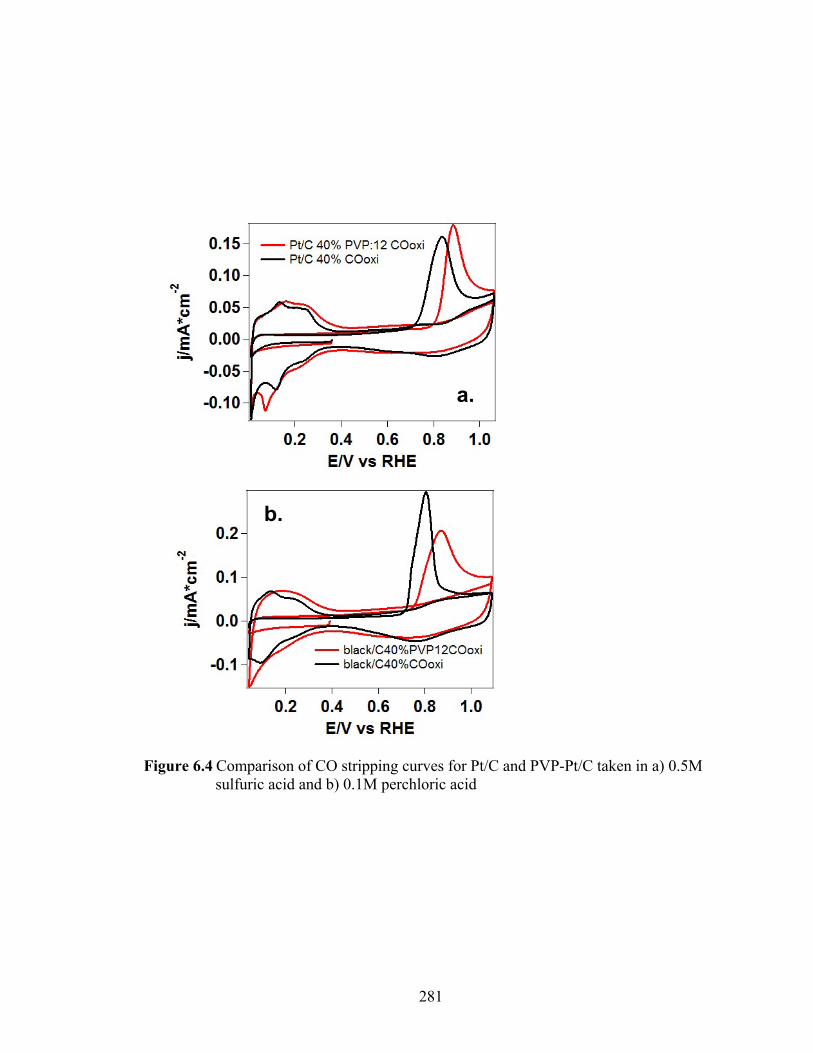
281
Figure 6.4 Comparison of CO stripping curves for Pt/C and PVP-Pt/C taken in a) 0.5M sulfuric acid and b) 0.1M perchloric acid
a.
b.
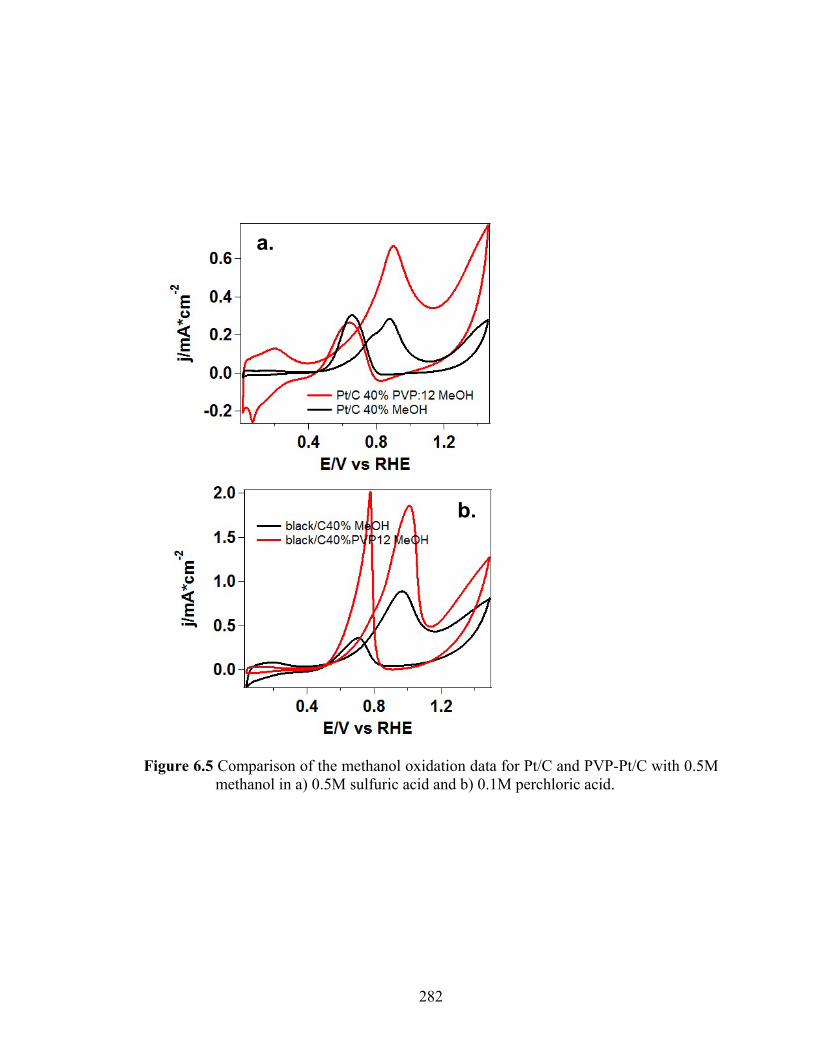
282
Figure 6.5 Comparison of the methanol oxidation data for Pt/C and PVP-Pt/C with 0.5M methanol in a) 0.5M sulfuric acid and b) 0.1M perchloric acid.
a.
b.
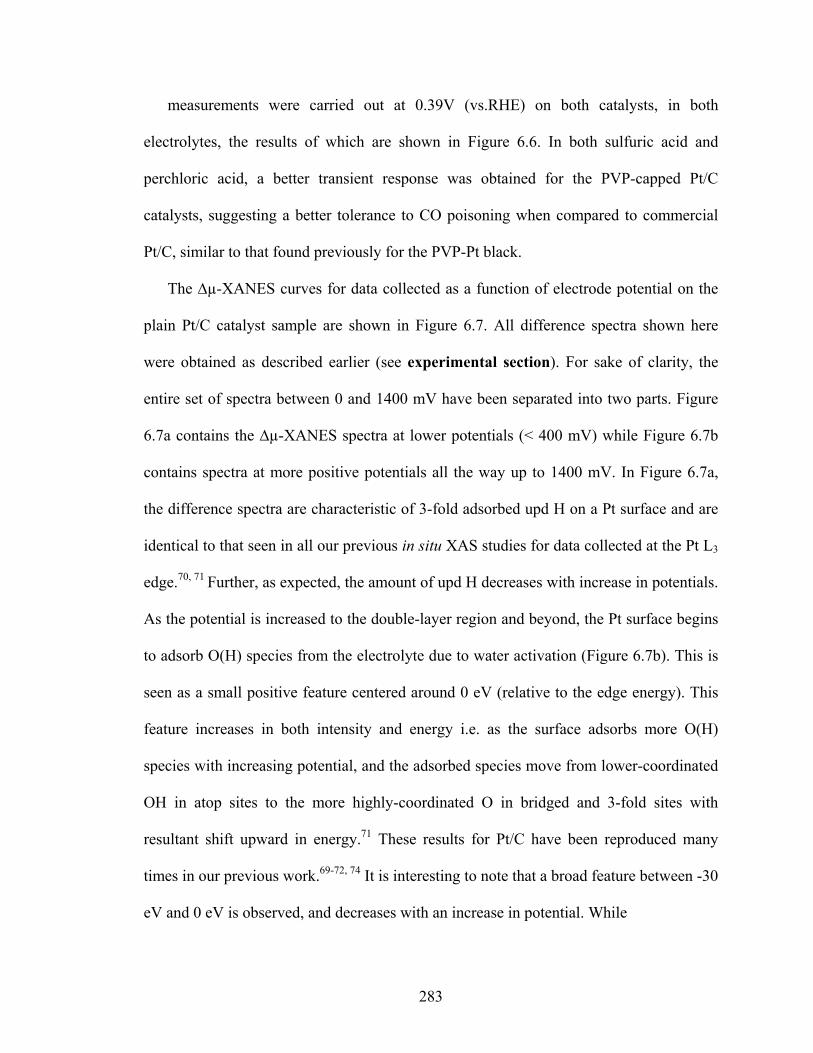
283
measurements were carried out at 0.39V (vs.RHE) on both catalysts, in both
electrolytes, the results of which are shown in Figure 6.6. In both sulfuric acid and
perchloric acid, a better transient response was obtained for the PVP-capped Pt/C
catalysts, suggesting a better tolerance to CO poisoning when compared to commercial
Pt/C, similar to that found previously for the PVP-Pt black.
The ∆µ-XANES curves for data collected as a function of electrode potential on the
plain Pt/C catalyst sample are shown in Figure 6.7. All difference spectra shown here
were obtained as described earlier (see experimental section). For sake of clarity, the
entire set of spectra between 0 and 1400 mV have been separated into two parts. Figure
6.7a contains the ∆µ-XANES spectra at lower potentials (< 400 mV) while Figure 6.7b
contains spectra at more positive potentials all the way up to 1400 mV. In Figure 6.7a,
the difference spectra are characteristic of 3-fold adsorbed upd H on a Pt surface and are
identical to that seen in all our previous in situ XAS studies for data collected at the Pt L3
edge.70, 71 Further, as expected, the amount of upd H decreases with increase in potentials.
As the potential is increased to the double-layer region and beyond, the Pt surface begins
to adsorb O(H) species from the electrolyte due to water activation (Figure 6.7b). This is
seen as a small positive feature centered around 0 eV (relative to the edge energy). This
feature increases in both intensity and energy i.e. as the surface adsorbs more O(H)
species with increasing potential, and the adsorbed species move from lower-coordinated
OH in atop sites to the more highly-coordinated O in bridged and 3-fold sites with
resultant shift upward in energy.71 These results for Pt/C have been reproduced many
times in our previous work.69-72, 74 It is interesting to note that a broad feature between -30
eV and 0 eV is observed, and decreases with an increase in potential. While
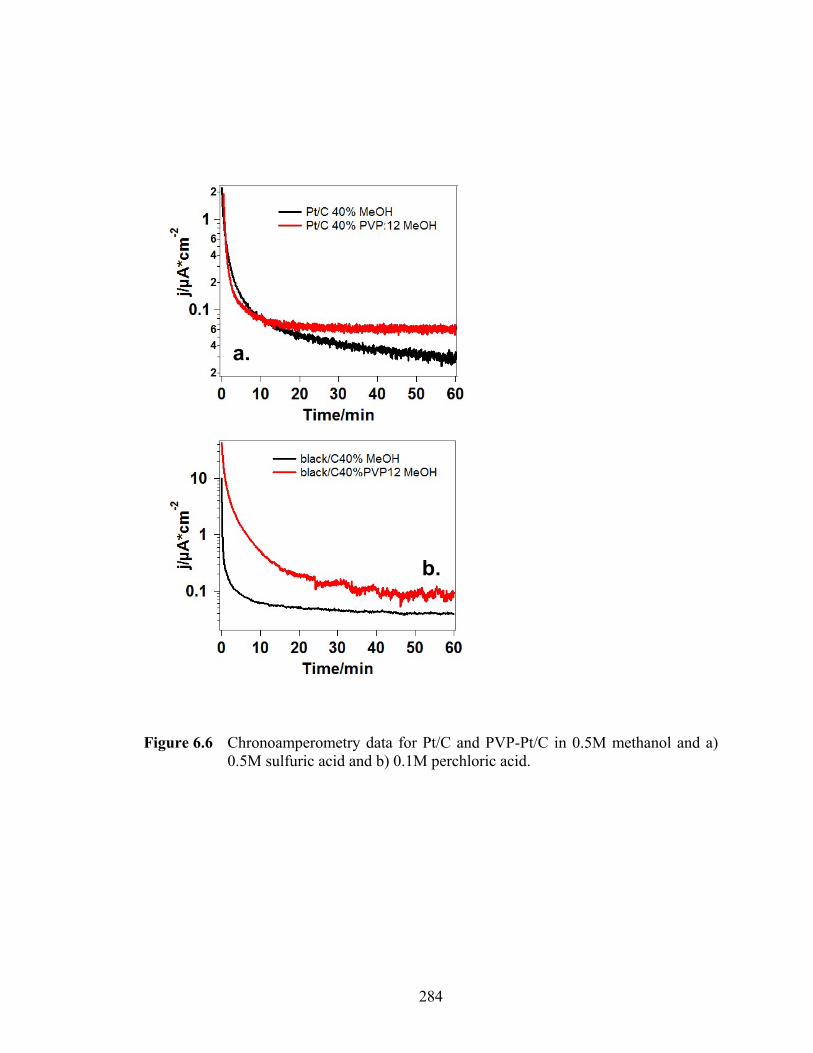
284
Figure 6.6 Chronoamperometry data for Pt/C and PVP-Pt/C in 0.5M methanol and a) 0.5M sulfuric acid and b) 0.1M perchloric acid.
a.
b.
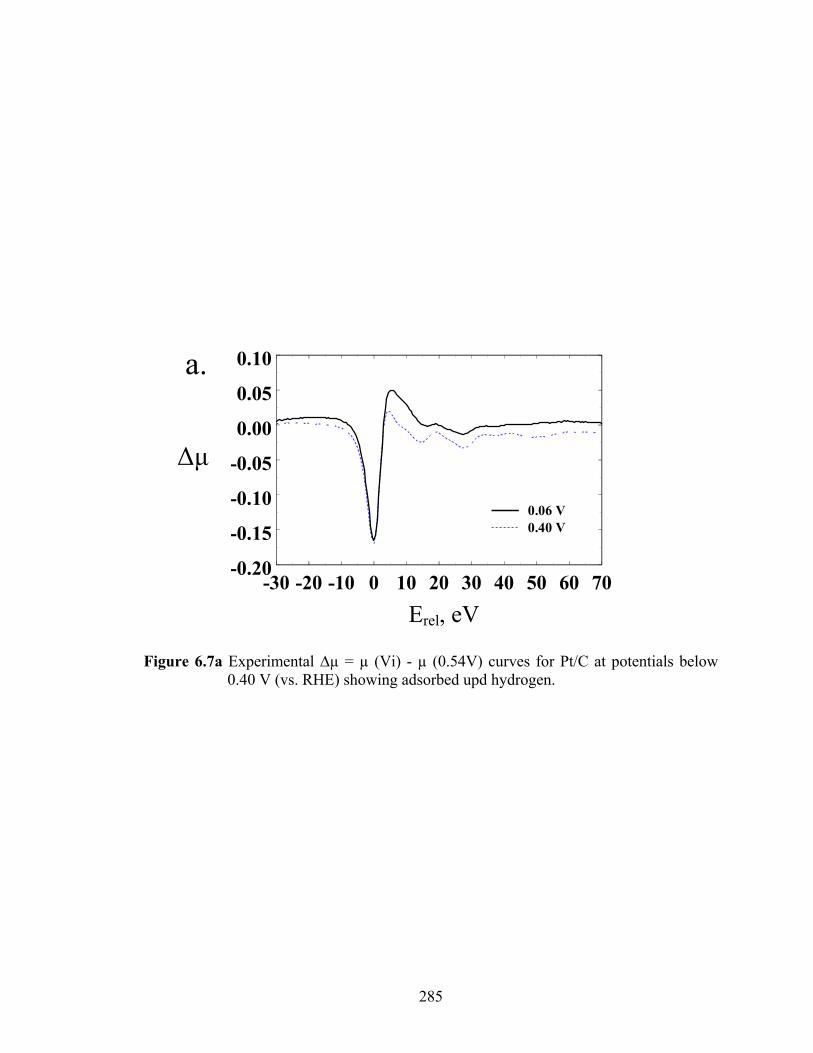
285
Figure 6.7a Experimental ∆µ = µ (Vi) - µ (0.54V) curves for Pt/C at potentials below 0.40 V (vs. RHE) showing adsorbed upd hydrogen.
-30 -20 -10 0 10 20 30 40 50 60 70-0.20
-0.15
-0.10
-0.05
0.00
0.05
0.10
0.06 V0.40 V
Δμ
Erel, eV
a.
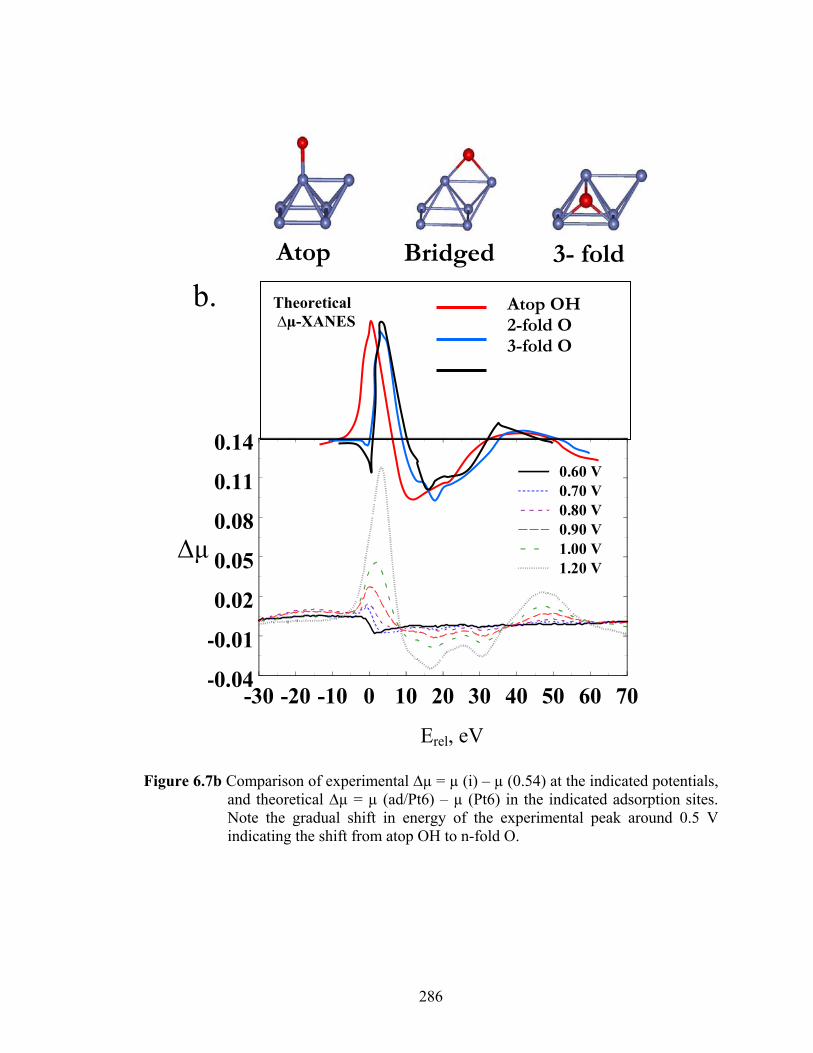
286
Figure 6.7b Comparison of experimental ∆µ = µ (i) – µ (0.54) at the indicated potentials, and theoretical ∆µ = µ (ad/Pt6) – µ (Pt6) in the indicated adsorption sites. Note the gradual shift in energy of the experimental peak around 0.5 V indicating the shift from atop OH to n-fold O.
b.
Δμ
Erel, eV
Atop OH 2-fold O 3-fold O
Theoretical ∆µ-XANES
3- fold Atop Bridged
-30 -20 -10 0 10 20 30 40 50 60 70-0.04
-0.01
0.02
0.05
0.08
0.11
0.140.60 V0.70 V0.80 V0.90 V1.00 V1.20 V
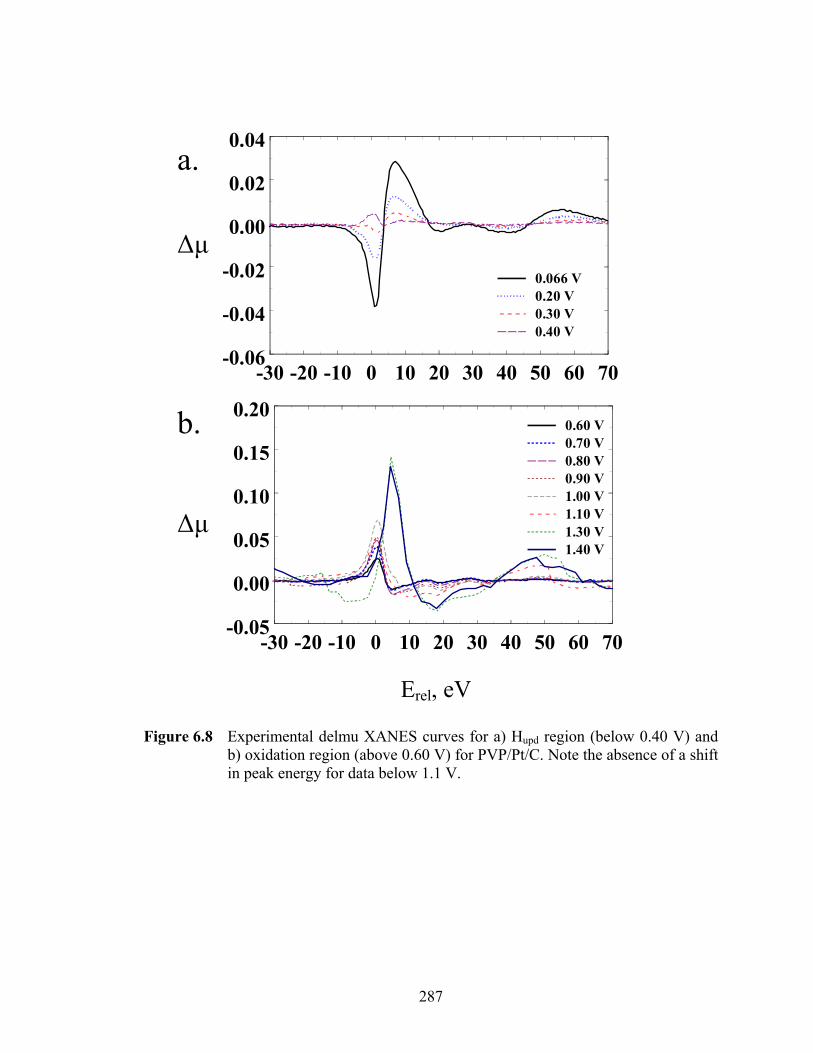
287
Figure 6.8 Experimental delmu XANES curves for a) Hupd region (below 0.40 V) and b) oxidation region (above 0.60 V) for PVP/Pt/C. Note the absence of a shift in peak energy for data below 1.1 V.
-30 -20 -10 0 10 20 30 40 50 60 70-0.06
-0.04
-0.02
0.00
0.02
0.04
0.066 V0.20 V0.30 V0.40 V
-30 -20 -10 0 10 20 30 40 50 60 70-0.05
0.00
0.05
0.10
0.15
0.200.60 V0.70 V0.80 V0.90 V1.00 V1.10 V1.30 V1.40 V
Δμ
Δμ
Erel, eV
a.
b.
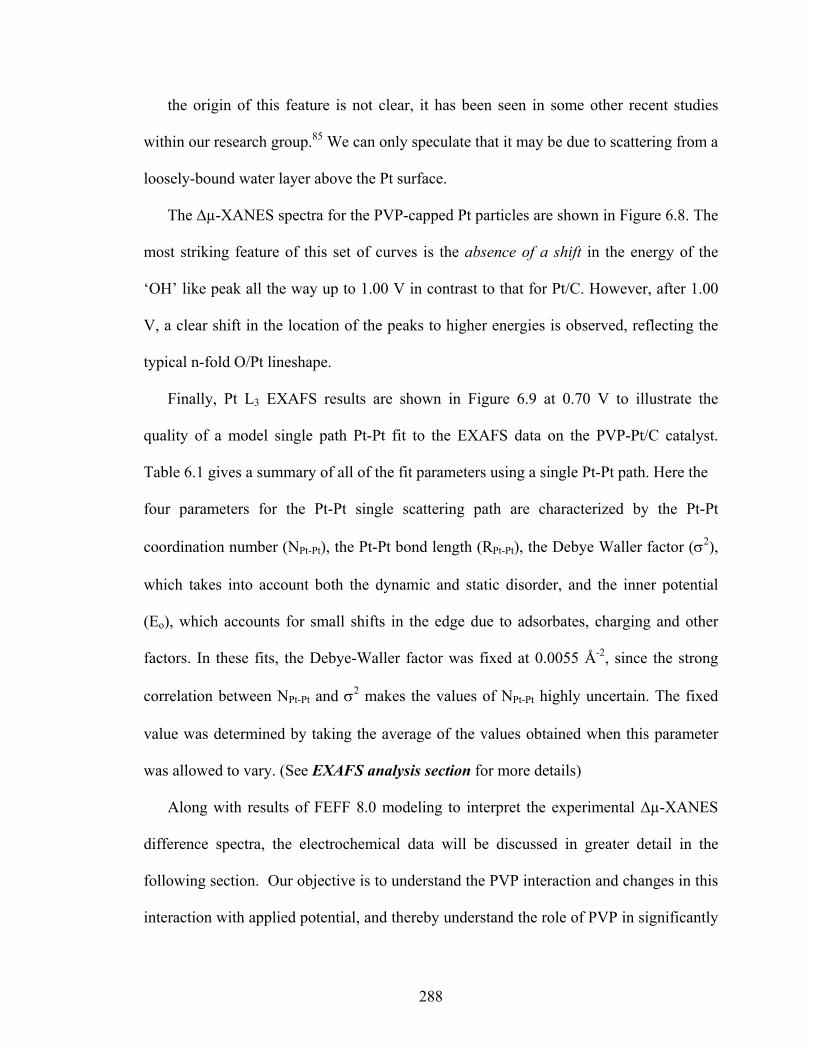
288
the origin of this feature is not clear, it has been seen in some other recent studies
within our research group.85 We can only speculate that it may be due to scattering from a
loosely-bound water layer above the Pt surface.
The ∆µ-XANES spectra for the PVP-capped Pt particles are shown in Figure 6.8. The
most striking feature of this set of curves is the absence of a shift in the energy of the
‘OH’ like peak all the way up to 1.00 V in contrast to that for Pt/C. However, after 1.00
V, a clear shift in the location of the peaks to higher energies is observed, reflecting the
typical n-fold O/Pt lineshape.
Finally, Pt L3 EXAFS results are shown in Figure 6.9 at 0.70 V to illustrate the
quality of a model single path Pt-Pt fit to the EXAFS data on the PVP-Pt/C catalyst.
Table 6.1 gives a summary of all of the fit parameters using a single Pt-Pt path. Here the
four parameters for the Pt-Pt single scattering path are characterized by the Pt-Pt
coordination number (NPt-Pt), the Pt-Pt bond length (RPt-Pt), the Debye Waller factor (σ2),
which takes into account both the dynamic and static disorder, and the inner potential
(Eo), which accounts for small shifts in the edge due to adsorbates, charging and other
factors. In these fits, the Debye-Waller factor was fixed at 0.0055 Å-2, since the strong
correlation between NPt-Pt and σ2 makes the values of NPt-Pt highly uncertain. The fixed
value was determined by taking the average of the values obtained when this parameter
was allowed to vary. (See EXAFS analysis section for more details)
Along with results of FEFF 8.0 modeling to interpret the experimental ∆µ-XANES
difference spectra, the electrochemical data will be discussed in greater detail in the
following section. Our objective is to understand the PVP interaction and changes in this
interaction with applied potential, and thereby understand the role of PVP in significantly
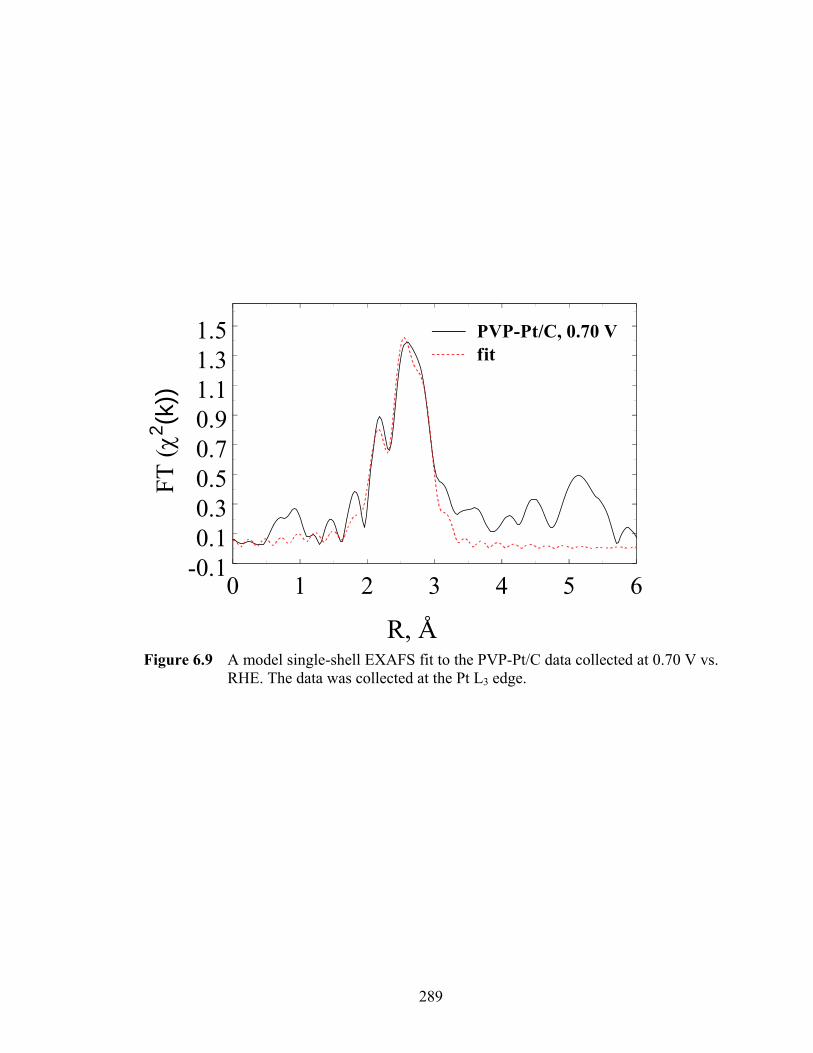
289
Figure 6.9 A model single-shell EXAFS fit to the PVP-Pt/C data collected at 0.70 V vs.
RHE. The data was collected at the Pt L3 edge.
0 1 2 3 4 5 6-0.10.10.30.50.70.91.11.31.5
FT (χ
2 (k))
PVP-Pt/C, 0.70 Vfit
R, Å

290
Table 6.1 Summary of EXAFS results for the Pt/C and PVP-Pt/C catalyst samples
Pt/Ca PVP-Pt/Ca
V,volts NPt-Ptb RPt-Pt
c(Ǻ)
Eo
d(eV) NPt-Ptb RPt-Pt
c(Ǻ) Eod(eV)
0.54 8.04 2.75 7.96 9.60 2.77 9.47 0.60 8.40 2.76 7.38 9.87 2.77 9.73 0.70 8.67 2.76 7.43 9.20 2.77 8.67 0.80 8.96 2.76 7.61 9.11 2.77 7.90 0.90 9.02 2.76 7.20 9.11 2.77 7.69 1.00 8.39 2.76 6.76 8.74 2.77 7.47 1.10 7.71 2.75 5.79 8.42 2.76 6.98
aDebye-Waller factor (σ2) fixed at 0.0055 Å-2 for all fits bAbsolute estimated uncertainty about 20% but change in values more accurate cEstimated uncertainty about ±0.02Ǻ dEstmated uncertainty about ±1 eV.
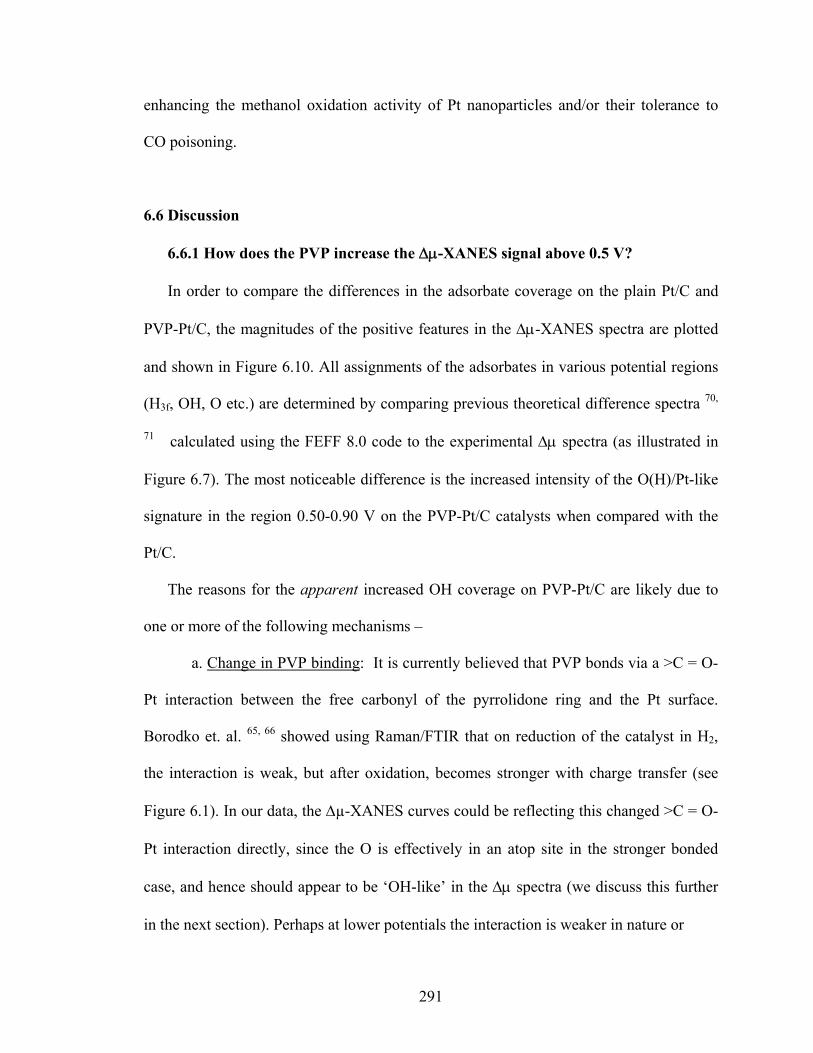
291
enhancing the methanol oxidation activity of Pt nanoparticles and/or their tolerance to
CO poisoning.
6.6 Discussion
6.6.1 How does the PVP increase the Δμ-XANES signal above 0.5 V?
In order to compare the differences in the adsorbate coverage on the plain Pt/C and
PVP-Pt/C, the magnitudes of the positive features in the Δμ-XANES spectra are plotted
and shown in Figure 6.10. All assignments of the adsorbates in various potential regions
(H3f, OH, O etc.) are determined by comparing previous theoretical difference spectra 70,
71 calculated using the FEFF 8.0 code to the experimental Δμ spectra (as illustrated in
Figure 6.7). The most noticeable difference is the increased intensity of the O(H)/Pt-like
signature in the region 0.50-0.90 V on the PVP-Pt/C catalysts when compared with the
Pt/C.
The reasons for the apparent increased OH coverage on PVP-Pt/C are likely due to
one or more of the following mechanisms –
a. Change in PVP binding: It is currently believed that PVP bonds via a >C = O-
Pt interaction between the free carbonyl of the pyrrolidone ring and the Pt surface.
Borodko et. al. 65, 66 showed using Raman/FTIR that on reduction of the catalyst in H2,
the interaction is weak, but after oxidation, becomes stronger with charge transfer (see
Figure 6.1). In our data, the Δµ-XANES curves could be reflecting this changed >C = O-
Pt interaction directly, since the O is effectively in an atop site in the stronger bonded
case, and hence should appear to be ‘OH-like’ in the Δμ spectra (we discuss this further
in the next section). Perhaps at lower potentials the interaction is weaker in nature or
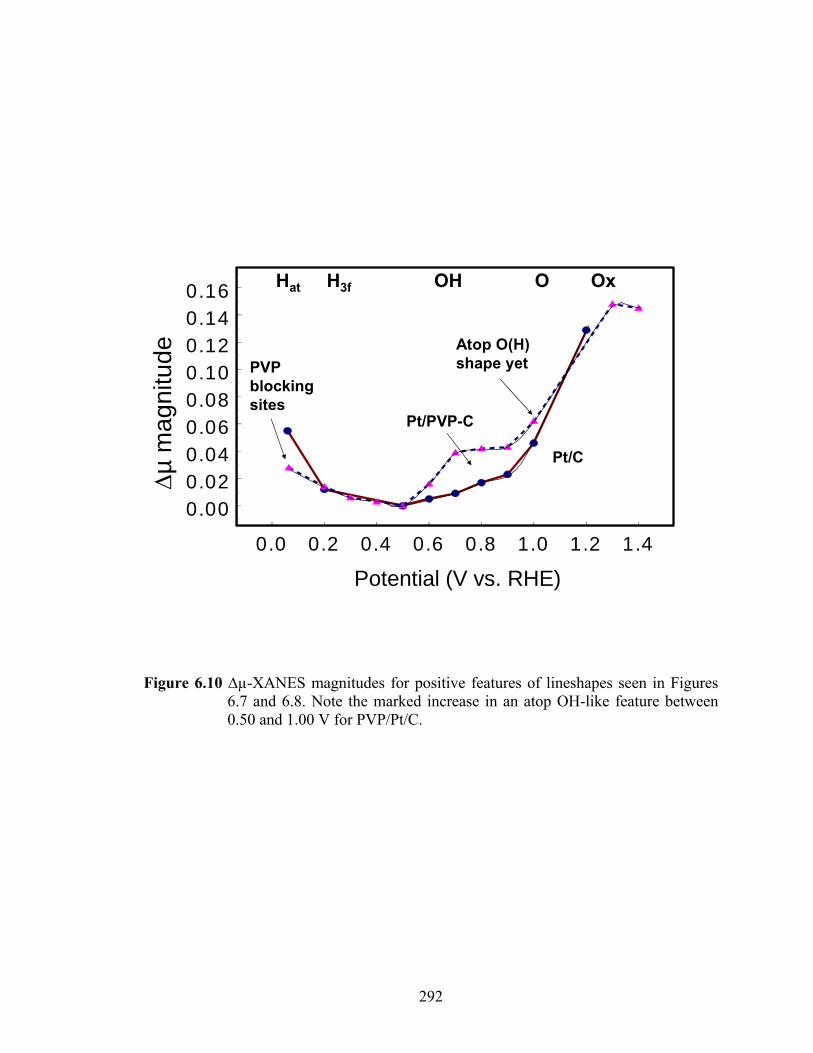
292
0.0 0.2 0.4 0.6 0.8 1.0 1.2 1.4
0.000.020.040.060.080.100.120.140.16 PtBlk
Ptpvp
Pt/PVP-C
Pt/C
Hat H3f OH O Ox
PVPblocking sites
Atop O(H) shape yet
Δµm
agni
tude
Potential (V vs. RHE)
Figure 6.10 ∆µ-XANES magnitudes for positive features of lineshapes seen in Figures 6.7 and 6.8. Note the marked increase in an atop OH-like feature between 0.50 and 1.00 V for PVP/Pt/C.
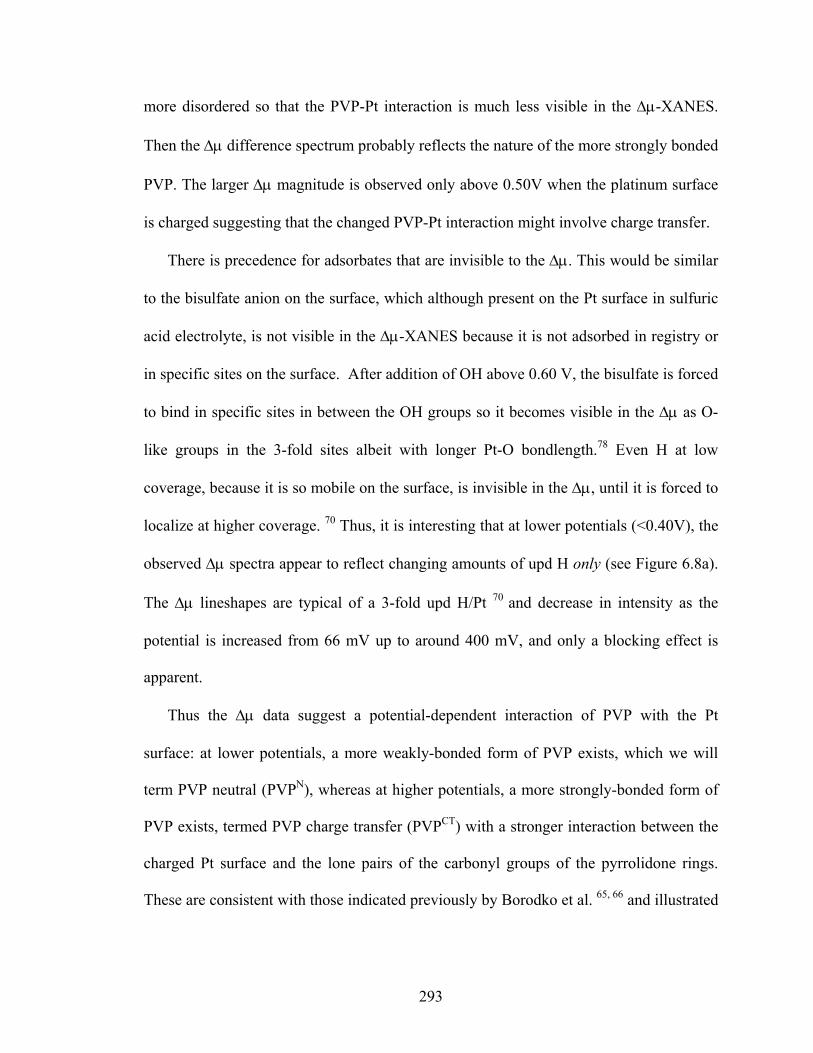
293
more disordered so that the PVP-Pt interaction is much less visible in the Δμ-XANES.
Then the Δμ difference spectrum probably reflects the nature of the more strongly bonded
PVP. The larger Δμ magnitude is observed only above 0.50V when the platinum surface
is charged suggesting that the changed PVP-Pt interaction might involve charge transfer.
There is precedence for adsorbates that are invisible to the Δμ. This would be similar
to the bisulfate anion on the surface, which although present on the Pt surface in sulfuric
acid electrolyte, is not visible in the Δμ-XANES because it is not adsorbed in registry or
in specific sites on the surface. After addition of OH above 0.60 V, the bisulfate is forced
to bind in specific sites in between the OH groups so it becomes visible in the Δμ as O-
like groups in the 3-fold sites albeit with longer Pt-O bondlength.78 Even H at low
coverage, because it is so mobile on the surface, is invisible in the Δμ, until it is forced to
localize at higher coverage. 70 Thus, it is interesting that at lower potentials (<0.40V), the
observed Δμ spectra appear to reflect changing amounts of upd H only (see Figure 6.8a).
The Δμ lineshapes are typical of a 3-fold upd H/Pt 70 and decrease in intensity as the
potential is increased from 66 mV up to around 400 mV, and only a blocking effect is
apparent.
Thus the Δμ data suggest a potential-dependent interaction of PVP with the Pt
surface: at lower potentials, a more weakly-bonded form of PVP exists, which we will
term PVP neutral (PVPN), whereas at higher potentials, a more strongly-bonded form of
PVP exists, termed PVP charge transfer (PVPCT) with a stronger interaction between the
charged Pt surface and the lone pairs of the carbonyl groups of the pyrrolidone rings.
These are consistent with those indicated previously by Borodko et al. 65, 66 and illustrated
294
in Figure 6.1. We will provide much further evidence for this mechanism below both
from the literature and our own electrochemical results.
b. A ligand effect: It is also possible that the PVP simply exerts a ligand (or
electronic) effect on the Pt, so that the increased Δμ-XANES indeed reflects increased
adsorption of OH between 0.6-1.0 V. This is consistent with methanol oxidation data
where increased reactivity is observed for Pt-PVP/C when compared with just Pt/C.
Adsorbed CO species are oxidized to CO2 usually through reaction with adsorbed OH
species in the normal bifunctional mechanism. As such, an increased amount of OH on
the surface would clearly be advantageous and would enhance the methanol oxidation
reaction. However, it is unlikely that this is happening for two reasons: A ligand effect
should alter the onset for all 3 species, namely OH, O, and H adsorption. The results here
show no change in the onset for H and O, in fact not even a change in the onset for OH
exists, and only a much larger magnitude for the assigned OH signature is seen.
Secondly, it is well-established that PVP adsorbs onto surface sites of the Pt
nanoparticles. If this is true, then it can only reduce the number of catalytically active
surface sites, leaving us with no reason to assume that the amount of adsorbed OH
species can increase (relative to that seen on Pt/C) in the presence of bonded PVP. An
increased number of catalytically active sites despite significant site-blocking by PVP can
only occur if the PVP-Pt/C catalysts were much more dispersed and possessed a much
smaller particle size than the Pt/C catalyst. However, a cursory look at the NPt-Pt values
for the two catalysts obtained through EXAFS fits (See Table 6.1) seem to indicate that
both the Pt/C and the PVP-Pt/C catalysts have nearly the same particle size and rules out
this possibility entirely.
295
c. A bifunctional-like mechanism: In this mechanism, the carbonyl group on the
PVP could directly assist in breaking the H2O bond because the H+ (proton) can add to
one of the lone pairs on the nearby O atom in the carbonyl instead of going into solution.
In this mechanism the PVP would play the role of the Ru in the typical commercial PtRu
catalysts. Thus, more OH could possibly adsorb in the 0.60-1.0 V region. While the onset
potential for O and H would not be expected to change, it is surprising that the onset
potential for even OH adsorption does not appear to change, showing differences only in
the amount of OH on the surface. Thus we are inclined to rule out this mechanism as
well.
d. A Geometric effect: Kweskin et al. studied CO adsorption and oxidation on
PVP-stabilized, cubic Pt nanoparticles (ca. 9.4 nm) catalysts using IR-Visible SFG and
estimate that close to 65 % of the surface may be covered with PVP, water and other
organics.108 As such, if a significant number of PVP chains are bonded to the Pt surface,
the bonded carbonyls may be sufficiently large in number to actually force the incoming
adsorbate molecules into otherwise “less desirable” unoccupied sites, or onto sites that
are occupied normally only under more full coverage. We term such an effect a
geometric effect, as it actually modifies the adsorption geometry of the CO and OH and
then could lead to altered reaction rates on the Pt surface. How would such an adsorption
behavior affect the CO stretching frequency observed by either SEIRAS or SFG? We
believe that it would not be unlike that of CO adsorbed onto a surface containing
significant amounts of oxide on the surface, wherein the CO stretching frequency would
be red-shifted due to a weakening of the COads/Pt due to strong lateral interactions
between the CO and adsorbed >C=O groups from the PVP.
296
There is some evidence in the literature that lends further support to a geometric effect
due to PVP. It has been reported that PVP-stabilized Pt and Rh catalysts alter the rates of
reactions of small adsorbed molecules such as CO, OH and O. 27, 62, 86 Somorjai and co
workers found that CO adsorbs in bridge sites on a PVP-altered Rh surface, which may
actually reduce the activation barrier for the CO oxidation reaction by providing a
geometrically advantageous orientation for the adsorbed CO and OH species. According
to the authors, some evidence for the possibility of such an enhancement is also
supported by theoretical calculations. 87 In a study on the effect of PVP on the rates of
ethylene hydrogenation and CO oxidation on monodisperse Pt nanoparticles, it was
demonstrated that PVP is capable of altering the reaction rates through adsorption to
surface sites. However, it was unable to change the intrinsic activity of active Pt sites, a
conclusion which was supported by surface-normalized reaction rate data. 88 Our Δμ-
XANES results indicate an increased atop OH contribution that remains until higher
potentials. This could mean that the PVP-Pt interaction forces the OH to remain in the
atop sites to higher potentials, providing adsorbed OH species to react with CO even at
much higher potentials. Such a mechanism would also lead to increased methanol
oxidation activity as it has been established that adsorbed OH is much more reactive for
CO oxidation than O in an n-fold site. However, we are inclined to believe that this
mechanism is not the primary reason for the enhanced Δμ-XANES magnitudes seen for
the PVP-Pt/C catalyst in Figure 6.10.
e) PVP decomposition product: There are reports in the literature indicating that if
PVP degrades or decomposes on a Pt surface, both the oxygen from the free carbonyl
group as well as the nitrogen from the pyrrolidone ring may be strongly bonded to the Pt
297
surface. 66 The enhanced Δμ signature might be reflecting the additional N/Pt bonding.
However, FEFF8 calculations below along with CV results will help to eliminate this
possibility.
6.6.2 The PVP-Pt binding site via FEFF calculations
Theoretical calculations using the FEFF 8.0 code were carried out to interpret the
experimental Δμ spectra and determine the possible binding site of the PVP to the Pt
surface, assuming the Δμ spectra indeed reflect the PVPCT interaction. In order to
calculate the theoretical spectra for PVPCT/Pt, a truncated PVP molecule bonded to the Pt
cluster was used i.e., the monomeric unit of the polymer consisting of only the
pyrrolidone ring bonded to the Pt cluster via the free carbonyl group and with no
hydrocarbon backbone. Shown in Figure 6.11 are the theoretical ∆µ-XANES spectra for
PVP bonded to the Pt surface in an atop site (singly coordinated) and a 3-fold site (triply
coordinated). Although the positive features of the difference spectra differ by as little as
2-3 eV, the negative feature seen in the 3-fold signature easily distinguishes one from the
other. Comparison of the theoretical signatures for atop PVPCT (Figure 6.11) and OH
(Figure 6.7b) on Pt are indeed similar, so this makes it somewhat difficult to distinguish
them. Nevertheless, we believe the experimental ∆µ-XANES spectra shown in Fig. 8b is
dominated by the PVP and therefore indicates that the PVPCT is bonded predominantly in
the atop sites between 0.5 and 0.9 V. At higher potentials, the appearance of a negative
feature and shifts of the positive feature in Δμ to higher energies suggests that the Δμ is
now dominated by the O/Pt also present at these potentials, and that this is O in a more
highly-coordinated 3-fold site
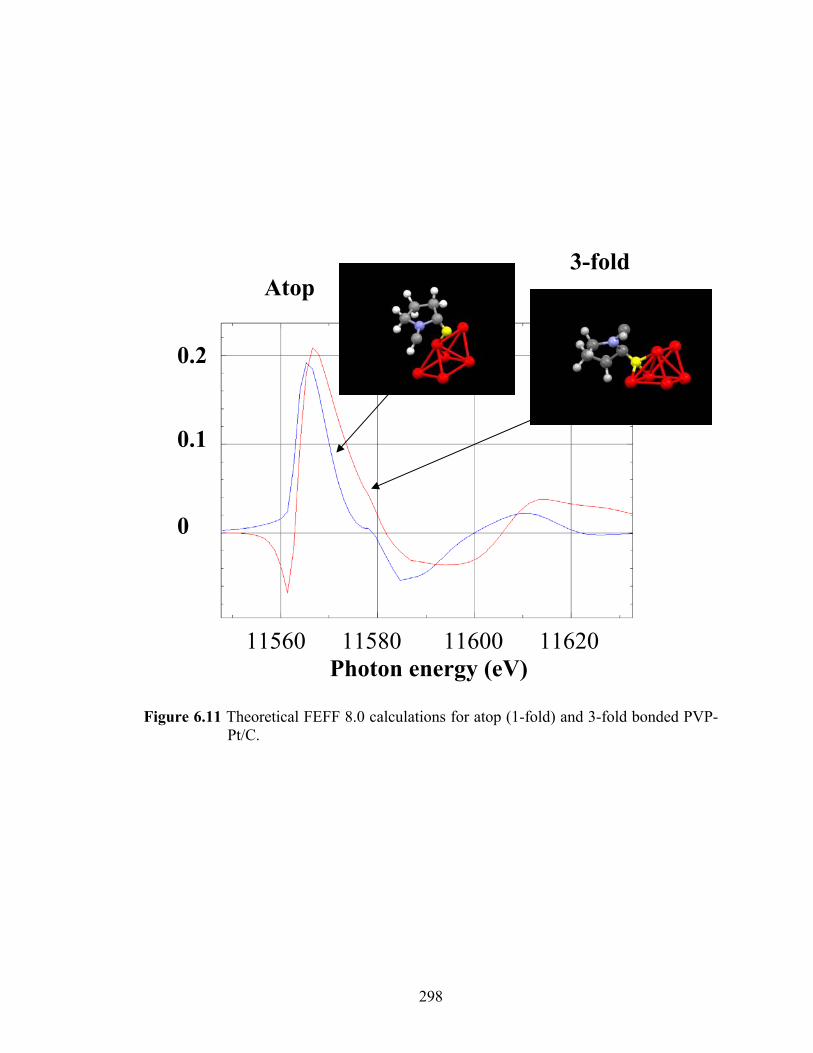
298
Figure 6.11 Theoretical FEFF 8.0 calculations for atop (1-fold) and 3-fold bonded PVP-Pt/C.
3-fold
11560 11580 11600 11620 Photon energy (eV)
Atop
0
0.2
0.1
299
To help eliminate the PVP decomposition product interpretation mentioned above, a
FEFF calculation for PVP bonded to the Pt surface through both the O and the N atoms
was carried out to see if there were any similarities to the experimental ∆µ-XANES
curves. Interestingly, the lineshape is very similar to that of PVPCT bonded to the Pt
surface just via the oxygen with the positive features shifted by only 1-2 eV. However, if
the PVP indeed degrades on the surface, specific redox features should have been
observed in the CVs (Figures 6.3 and 6.5) and since these are absent, we reject this
possibility.
6.6.3 Further evidence for a change of PVP interaction from EXAFS results.
Figure 6.12 shows a plot of the bulk Pt-Pt coordination number (NPt-Pt) values from
Table 6.1 as obtained from EXAFS analysis along with a plot of the Δμ magnitudes. We
consider the results for Pt/C first. When atop OH comes on, this raises the NPt-Pt slightly
because atop OH likely makes the clusters a bit more spherical. This has the effect of
increasing the Pt-Pt coordination. Evidence for such a structural change upon adsorption
in atop sites has been seen several times in our previous work. 71, 74 As the atop OH
moves over to become O in more highly-coordinated fcc sites, a change which is
reflected in the Δμ signature, a drop in the coordination number occurs because the O in
these sites “interferes” a bit with the Pt-Pt scattering. The continued decrease in
coordination past 1.1 V can also be attributed to a place-exchange mechanism that occurs
above this potential wherein some fraction of adsorbed oxygen atoms go subsurface 89
and actually goes directly between Pt atoms. This no doubt reduces the NPt-Pt even
further.
300
In the case of the PVP-capped Pt/C nanoparticles, the coordination number starts out
larger than that for Pt/C, apparently because the PVPN interaction again causes the Pt
particles to be more spherical. The PVPN bind onto atop Pt sites preferably on edges and
100 sites as inferred from the CV to be discussed further below, and this should increase
the NPt-Pt, just as H does in this potential range. The NPt-Pt then begins to decrease slightly
exactly where the Δμ magnitude begins to increase. This perhaps is a bit surprising
because the Δμ signatures reflecting the PVPCT do not indicate that the PVPCT moves
over into the fcc sites, but stays in the atop sites at the edge. So why does the change
from PVPN to PVPCT cause this reduction in NPt-Pt. Clearly the stronger PVPCT-Pt
interaction somehow does not have as great an effect on the morphology of the Pt cluster
as the weaker PVPN-Pt interaction because between 0.8-0.9 V the NPt-Pt for both catalysts
are similar. Thus we can conclude that OH (present on the Pt/C) has about the same
effect on the cluster shape as the PVPCT does in the PVP/Pt case. The PVPN has about the
same effect or even greater than H does at lower potentials and in general we have found
previously that H appears to have a larger effect than OH. 71, 74
Above 0.90 V, NPt-Pt again decreases with adsorption of OH(O), but note that the
decrease is less dramatic compared with Pt/C. This is completely consistent with our
hypothesis that a significant number of surface sites are blocked-off by the PVP, which
would reduce the amount of surface oxide that can be formed on the nanoparticles and
probably result in a lesser amount of oxide going subsurface. This aspect of stabilized-
nanoparticles, whereby the amount of surface oxide is reduced despite possessing better
catalytic activity for certain reactions appears to be a promising method of hindering the
aging process in nanoparticle catalysts.
301
6.6.4 Evidence for two forms of bonded PVP from other spectroscopic
techniques
Table 6.2 summarizes other spectroscopic studies that indicate the bonding of
PVP to metals can change with conditions. As briefly discussed earlier in the paper,
Somorjai and co-workers find that PVP interacts more strongly with Rh than Pt and also
that this interaction depends strongly on the oxidation state of the metal; i.e., the polymer
‘breathes’ around the nanoparticle as it is oxidized and reduced 65, 66. A particle size-
dependent PVP-Pt interaction has also been observed in an FTIR and XPS study by
Bonet et al. 63 and Qiu et al.64. Direct evidence for a particle size-effect on the PVP-Au
interaction on Au clusters as studied using FTIR, XPS and XAS has also been reported 90
although the sizes of the Au clusters studied were not dissimilar enough to be completely
convincing. It all these studies, it was shown that PVP binds weakly to larger, more
metallic clusters and more strongly to the surface of smaller clusters or partially oxidized
clusters. This effect is probably due to the decreased surface charge present in smaller
nanoparticles or partially oxidized ones, when compared with extended metal surfaces
present in larger nanoparticles, and thus charge transfer occurs between the electron rich
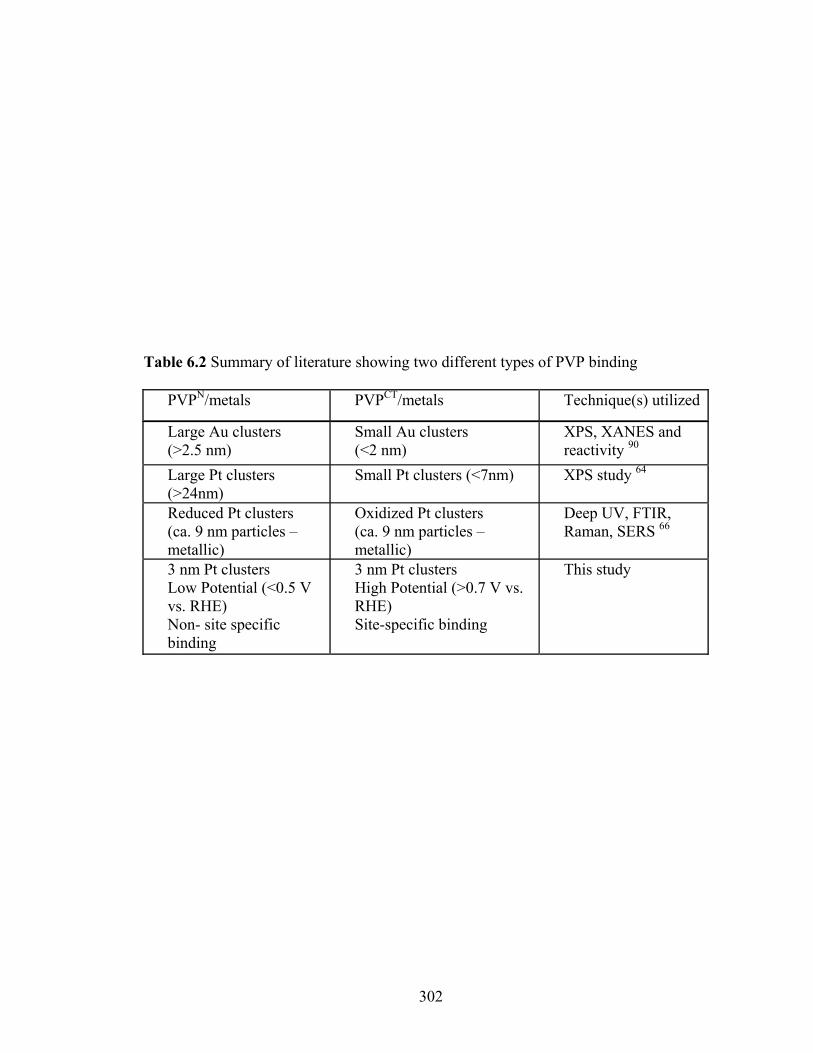
302
Table 6.2 Summary of literature showing two different types of PVP binding
PVPN/metals PVPCT/metals Technique(s) utilized
Large Au clusters (>2.5 nm)
Small Au clusters (<2 nm)
XPS, XANES and reactivity 90
Large Pt clusters (>24nm)
Small Pt clusters (<7nm) XPS study 64
Reduced Pt clusters (ca. 9 nm particles – metallic)
Oxidized Pt clusters (ca. 9 nm particles – metallic)
Deep UV, FTIR, Raman, SERS 66
3 nm Pt clusters Low Potential (<0.5 V vs. RHE) Non- site specific binding
3 nm Pt clusters High Potential (>0.7 V vs. RHE) Site-specific binding
This study
303
PVP and the metal surface.91 Thus the change in PVP-Pt interaction from PVPN to PVPCT
seen above 0.5 V RHE in our Δμ data is totally consistent with these previous
observations.
6.6.5 Does the PVP-Pt interaction affect the metal nanoparticle?
6.6.5.1 Previously reported results:
While some findings suggest that PVP in some way alters the metal substrate,
others have found no evidence of such an effect. In an early study on the possible
influence of PVP on the electronic properties of Pt, it was shown that the white-line
intensity at the Pt L3 edge (1s-5p) is reduced for PVP-stabilized colloids when compared
to pure Pt nanoparticles. This finding suggested that there is a donation of charge from
the PVP to the Pt (as we suggest in the PVPCT case), thus leading to a decrease in the
unoccupied density of states for the Pt. They also found a shorter Pt-Pt bond distance and
a larger Debye-Waller factor in the PVP stabilized colloids when compared with that of
bulk Pt metal. 92 Busser et al. studied changes in the 13C NMR spectra collected in an
experiment wherein the Rh salt concentration was steadily increased relative to the PVP
concentration. The peaks changed significantly with the increase in Rh salt concentration
strongly suggesting that PVP interacts strongly with Rh metal ions present in solution. 93
Contrary to the findings in these studies, other investigations on PVP-capped
nanoparticles suggested that the metal surfaces were unaffected by the polymer. The
results of an EC-NMR study of 195Pt in Pt/Pd nanoparticles by Tong et. al. suggested that
the polymer had little or no effect on the electronic properties of the nanoparticles. 94 De
Caro et al., using infrared spectroscopy, showed that PVP-Pt nanoparticles possessed CO
304
adsorption properties very similar to that of clean Pt surfaces in air, suggesting that while
PVP could block active catalytic sites, it likely did not affect the properties of the Pt
surface or of the CO adsorbed onto it. 95 In a SERS/Raman study of PdCu bimetallic
nanoparticles capped with PVP, Toshima et al. found no evidence for a detectable
interaction of PVP with the metal surface. 52 Dassenoy et. al. carried out a study to
determine the packing (f.c.c. vs. h.c.p) of PtRu alloy nanoparticles by systematically
varying their composition. 96 They too found no evidence of an interaction between PVP
and either Pt or Ru.
Care must be taken in comparing the influence of PVP across various metals as the
interaction may vary widely based on the nature of the metal. Thus, it is apparent that
there is still no consensus or model for a complete representation of the interaction
between PVP and the metal substrate. Nevertheless, many papers indicate that PVP-
stabilized metals and alloys have enhanced catalytic properties. PVP has been reported to
enhance the oxidation of CO to CO2, 97, 98 the catalysis of hydrogenation and
dehydrogenation reactions 27, 88 and even the methanol oxidation properties of Pt, as seen
in this study and work by some others.59, 99 However, a few other independent studies
indicate no such enhancement of the methanol oxidation properties on PVP-capped Pt
nanoparticles. 32, 82, 100
6.6.5.2 Evidence from current work:
Electrochemical data for the Pt/C and PVP-Pt/C catalysts were collected in
both, 0.1M HClO4 and 0.5M H2SO4. Note that the oxidation currents for water activation
as well as CO stripping, shown in Figures 6.3 and 6.4, are higher in HClO4 than in
H2SO4. The current densities for methanol oxidation in perchloric acid are also higher
305
than that in sulfuric acid (Figures 6.5 and 6.6). This is generally attributed to blocking of
Pt sites by the strongly adsorbing bisulfate ions, which adsorb in the potential range
between 0.4-0.90. The perchlorate anions adsorb only at very high potentials (V>0.90 V)
if at all. In contrast, enhanced methanol oxidation activity (PVP/Pt/C relative to Pt/C) is
seen in both electrolytes indicating unequivocally that PVP enhances the electrocatalytic
activity of Pt nanoparticles. Since in situ XAS data were only collected in perchloric acid
medium, our discussion below will largely pertain to the electrochemical data collected in
perchloric acid.
6.6.5.2.1 PVPN at lower potentials
All of the electrochemical data viz. water activation, CO stripping and methanol
oxidation, display an increased double-layer capacitive current in the 0.40-0.60 V region,
reflecting the presence of a less-conductive material on the catalyst surface. The more
weakly-bonded PVPN as expected, affects the Hupd region (0<V<0.35 V) as indicated by
the clear loss of Hupd features as well as the reduction in total area under the CV curve in
the upd H region. This of course can be attributed to the presence of weakly-adsorbing
PVPN on the (100) sites and corners and edges at lower potentials. The loss in Hupd
current is consistent with the experimental Δμ-XANES magnitudes for adsorbed
hydrogen (see Figure 6.10), which show a reduction of less than 40% and this only below
0.2 V.
In Figure 6.5, which shows the methanol oxidation curves in perchloric acid, the Hupd
region for PVP-Pt/C is again smaller compared to that seen on the clean Pt/C catalyst.
Quite surprisingly, the converse is observed in case of methanol oxidation in sulfuric
acid, in which case the area corresponding to the Hupd regions for PVP-Pt/C is
306
substantially larger than that seen for the plain Pt/C catalyst. We will revisit this
observation and address the possible reasons for this later on in the discussion.
In general, we note that the amount of upd H site blocking by the PVP is not
unexpected. If indeed the PVPN blocks primarily the corner and edge sites, along with
some of the (100) planes (Figure 6.3), these sites constitute only a small fraction of the
total surface sites in a typical Pt nanoparticle that is around 3-4 nm in size (about 25-30%
assuming cubooctahedral particles101). Further, the Δμ-XANES curves indicate that this
weak, neutral-like interaction exists up to around 0.60 V. The changing nature of the
PVP-Pt interaction at around 0.65 V, most clearly visible in the Δμ-XANES curves, is not
directly reflected in any of the CVs, rather the charge transfer may be occurring over the
entire potential region between 0.4 and 0.8 V, causing in part the capacitive current
visible in the PVP/Pt samples.
6.6.5.2.2 PVPCT at higher potentials
As methanol oxidation occurs primarily above 0.60 V, we will discuss this
potential region in greater detail. At potentials above 0.60 V, as the experimental Δμ-
XANES curves suggest, an enhanced PVP-Pt interaction is observed and we have
attributed it to a change in the nature of adsorbed PVP from a more neutral-like
interaction (PVPN) to a more strongly-bonded form of PVP that undergoes some form of
charge-transfer with the Pt surface (PVPCT). This should lead to more significant site
blocking on the Pt surface, reduce the amount of adsorbed OH and O and therefore
reduce the water activation currents. This site blocking by PVPCT is confirmed by the
reduced NPtPt coordination drop in Figure 6.12 even though this is not obvious from the
Δμ magnitudes in Figure 6.10.
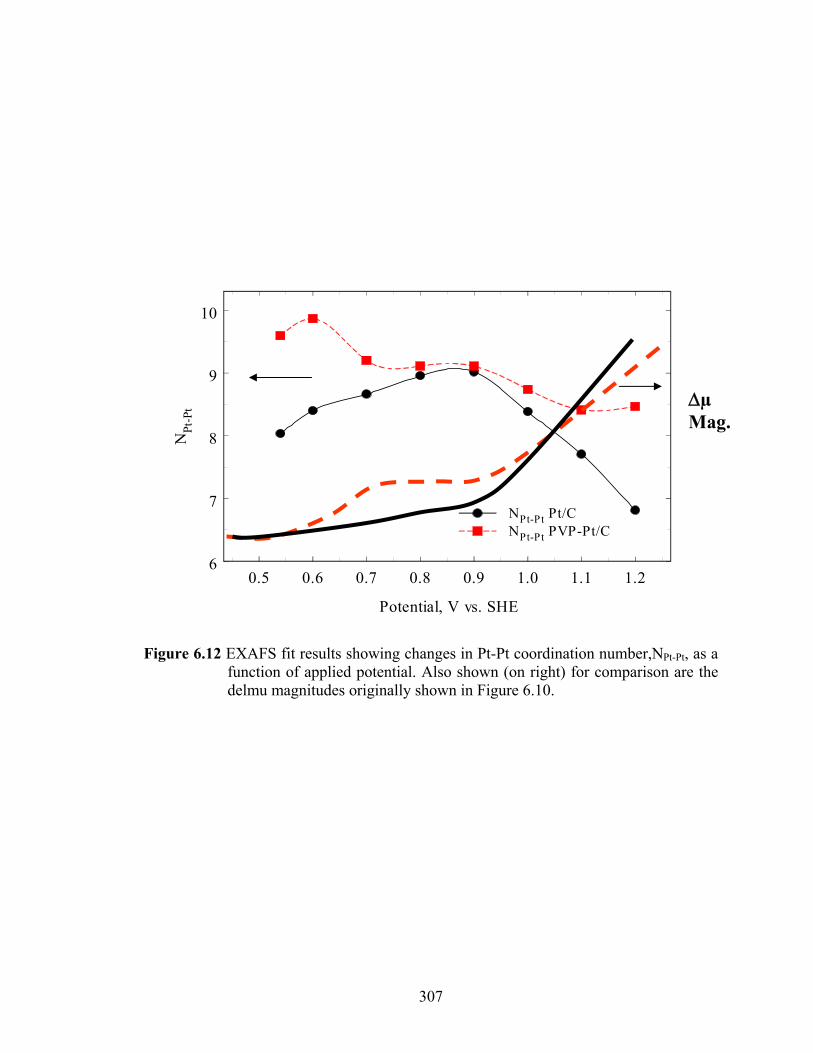
307
Figure 6.12 EXAFS fit results showing changes in Pt-Pt coordination number,NPt-Pt, as a function of applied potential. Also shown (on right) for comparison are the delmu magnitudes originally shown in Figure 6.10.
0.5 0.6 0.7 0.8 0.9 1.0 1.1 1.2
Potential, V vs. SHE
6
7
8
9
10
NPt
-Pt
NPt-Pt Pt/CNPt-Pt PVP-Pt/C
Δµ Mag.
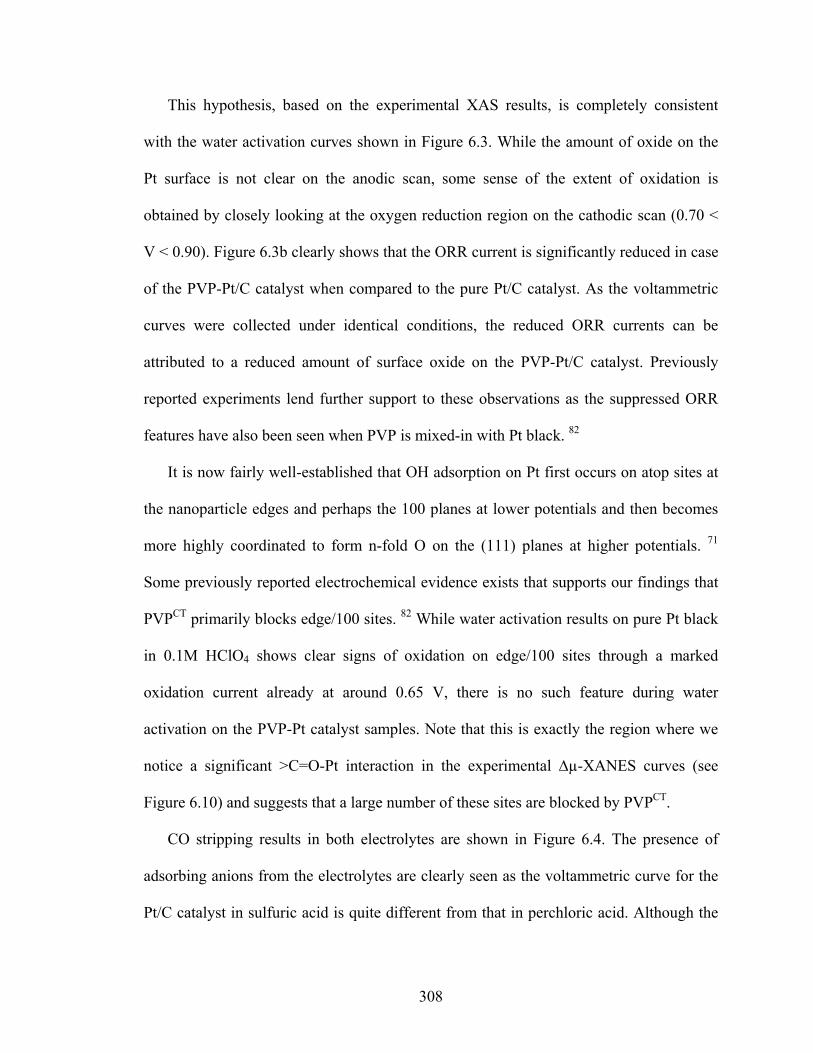
308
This hypothesis, based on the experimental XAS results, is completely consistent
with the water activation curves shown in Figure 6.3. While the amount of oxide on the
Pt surface is not clear on the anodic scan, some sense of the extent of oxidation is
obtained by closely looking at the oxygen reduction region on the cathodic scan (0.70 <
V < 0.90). Figure 6.3b clearly shows that the ORR current is significantly reduced in case
of the PVP-Pt/C catalyst when compared to the pure Pt/C catalyst. As the voltammetric
curves were collected under identical conditions, the reduced ORR currents can be
attributed to a reduced amount of surface oxide on the PVP-Pt/C catalyst. Previously
reported experiments lend further support to these observations as the suppressed ORR
features have also been seen when PVP is mixed-in with Pt black. 82
It is now fairly well-established that OH adsorption on Pt first occurs on atop sites at
the nanoparticle edges and perhaps the 100 planes at lower potentials and then becomes
more highly coordinated to form n-fold O on the (111) planes at higher potentials. 71
Some previously reported electrochemical evidence exists that supports our findings that
PVPCT primarily blocks edge/100 sites. 82 While water activation results on pure Pt black
in 0.1M HClO4 shows clear signs of oxidation on edge/100 sites through a marked
oxidation current already at around 0.65 V, there is no such feature during water
activation on the PVP-Pt catalyst samples. Note that this is exactly the region where we
notice a significant >C=O-Pt interaction in the experimental ∆µ-XANES curves (see
Figure 6.10) and suggests that a large number of these sites are blocked by PVPCT.
CO stripping results in both electrolytes are shown in Figure 6.4. The presence of
adsorbing anions from the electrolytes are clearly seen as the voltammetric curve for the
Pt/C catalyst in sulfuric acid is quite different from that in perchloric acid. Although the
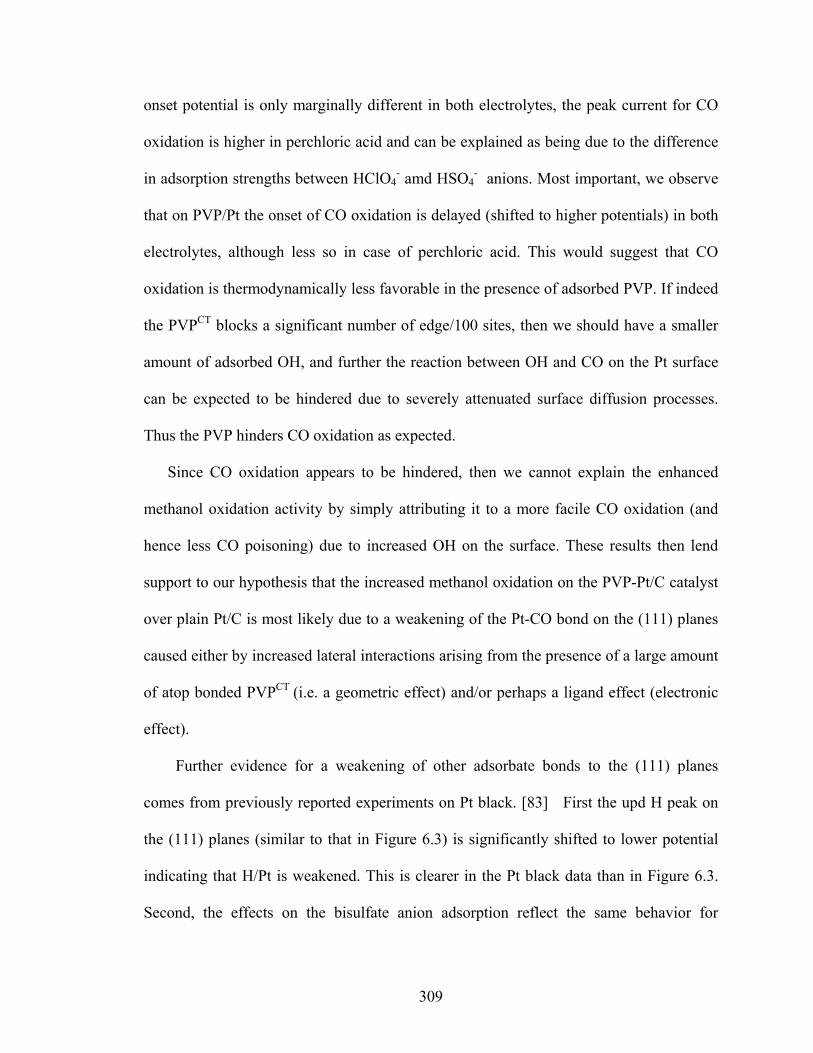
309
onset potential is only marginally different in both electrolytes, the peak current for CO
oxidation is higher in perchloric acid and can be explained as being due to the difference
in adsorption strengths between HClO4- amd HSO4
- anions. Most important, we observe
that on PVP/Pt the onset of CO oxidation is delayed (shifted to higher potentials) in both
electrolytes, although less so in case of perchloric acid. This would suggest that CO
oxidation is thermodynamically less favorable in the presence of adsorbed PVP. If indeed
the PVPCT blocks a significant number of edge/100 sites, then we should have a smaller
amount of adsorbed OH, and further the reaction between OH and CO on the Pt surface
can be expected to be hindered due to severely attenuated surface diffusion processes.
Thus the PVP hinders CO oxidation as expected.
Since CO oxidation appears to be hindered, then we cannot explain the enhanced
methanol oxidation activity by simply attributing it to a more facile CO oxidation (and
hence less CO poisoning) due to increased OH on the surface. These results then lend
support to our hypothesis that the increased methanol oxidation on the PVP-Pt/C catalyst
over plain Pt/C is most likely due to a weakening of the Pt-CO bond on the (111) planes
caused either by increased lateral interactions arising from the presence of a large amount
of atop bonded PVPCT (i.e. a geometric effect) and/or perhaps a ligand effect (electronic
effect).
Further evidence for a weakening of other adsorbate bonds to the (111) planes
comes from previously reported experiments on Pt black. [83] First the upd H peak on
the (111) planes (similar to that in Figure 6.3) is significantly shifted to lower potential
indicating that H/Pt is weakened. This is clearer in the Pt black data than in Figure 6.3.
Second, the effects on the bisulfate anion adsorption reflect the same behavior for
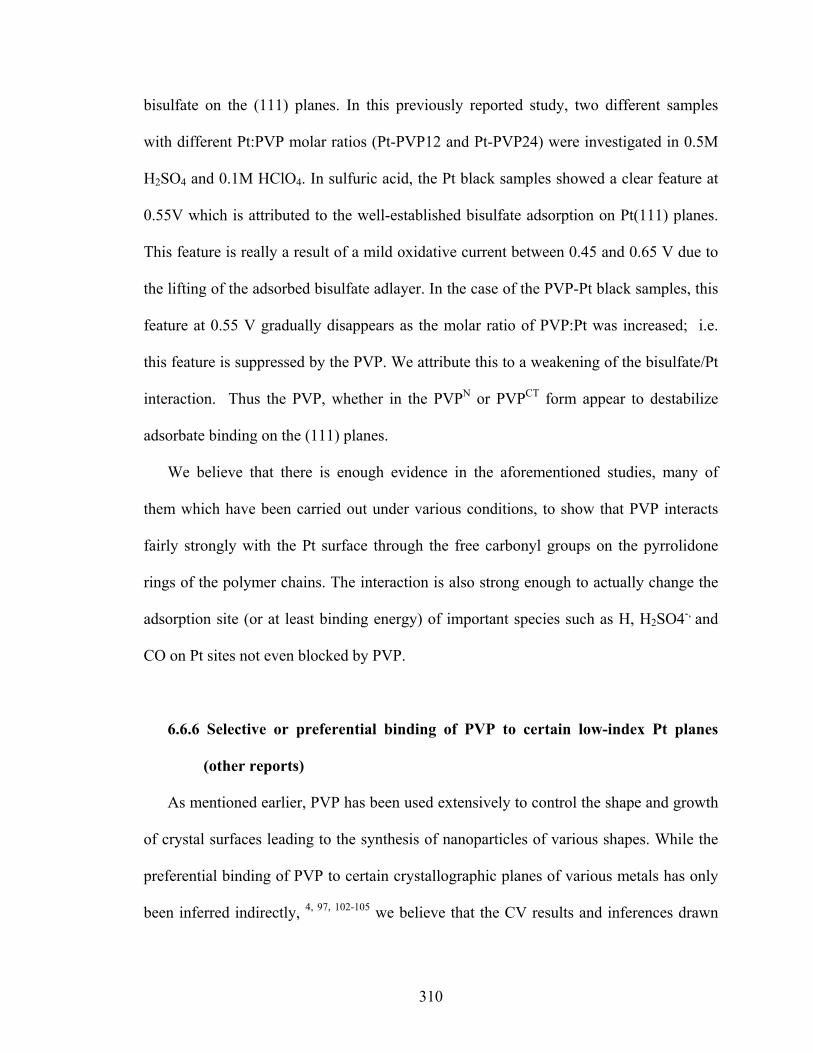
310
bisulfate on the (111) planes. In this previously reported study, two different samples
with different Pt:PVP molar ratios (Pt-PVP12 and Pt-PVP24) were investigated in 0.5M
H2SO4 and 0.1M HClO4. In sulfuric acid, the Pt black samples showed a clear feature at
0.55V which is attributed to the well-established bisulfate adsorption on Pt(111) planes.
This feature is really a result of a mild oxidative current between 0.45 and 0.65 V due to
the lifting of the adsorbed bisulfate adlayer. In the case of the PVP-Pt black samples, this
feature at 0.55 V gradually disappears as the molar ratio of PVP:Pt was increased; i.e.
this feature is suppressed by the PVP. We attribute this to a weakening of the bisulfate/Pt
interaction. Thus the PVP, whether in the PVPN or PVPCT form appear to destabilize
adsorbate binding on the (111) planes.
We believe that there is enough evidence in the aforementioned studies, many of
them which have been carried out under various conditions, to show that PVP interacts
fairly strongly with the Pt surface through the free carbonyl groups on the pyrrolidone
rings of the polymer chains. The interaction is also strong enough to actually change the
adsorption site (or at least binding energy) of important species such as H, H2SO4-, and
CO on Pt sites not even blocked by PVP.
6.6.6 Selective or preferential binding of PVP to certain low-index Pt planes
(other reports)
As mentioned earlier, PVP has been used extensively to control the shape and growth
of crystal surfaces leading to the synthesis of nanoparticles of various shapes. While the
preferential binding of PVP to certain crystallographic planes of various metals has only
been inferred indirectly, 4, 97, 102-105 we believe that the CV results and inferences drawn
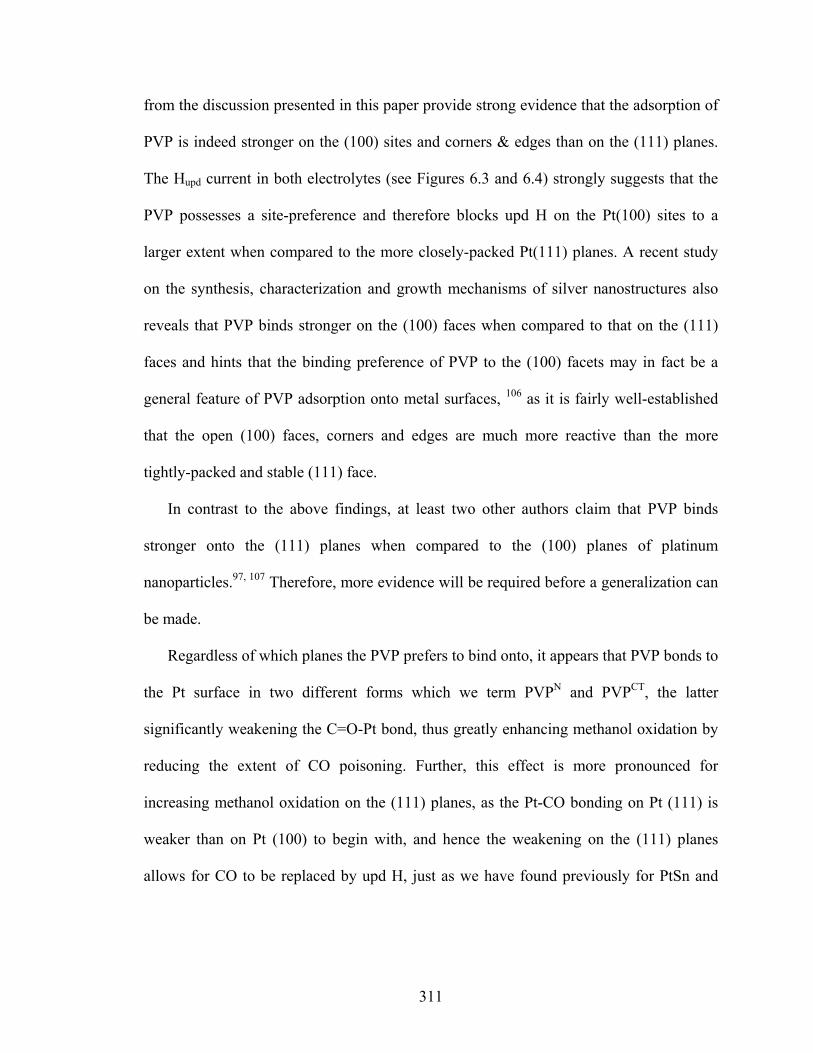
311
from the discussion presented in this paper provide strong evidence that the adsorption of
PVP is indeed stronger on the (100) sites and corners & edges than on the (111) planes.
The Hupd current in both electrolytes (see Figures 6.3 and 6.4) strongly suggests that the
PVP possesses a site-preference and therefore blocks upd H on the Pt(100) sites to a
larger extent when compared to the more closely-packed Pt(111) planes. A recent study
on the synthesis, characterization and growth mechanisms of silver nanostructures also
reveals that PVP binds stronger on the (100) faces when compared to that on the (111)
faces and hints that the binding preference of PVP to the (100) facets may in fact be a
general feature of PVP adsorption onto metal surfaces, 106 as it is fairly well-established
that the open (100) faces, corners and edges are much more reactive than the more
tightly-packed and stable (111) face.
In contrast to the above findings, at least two other authors claim that PVP binds
stronger onto the (111) planes when compared to the (100) planes of platinum
nanoparticles.97, 107 Therefore, more evidence will be required before a generalization can
be made.
Regardless of which planes the PVP prefers to bind onto, it appears that PVP bonds to
the Pt surface in two different forms which we term PVPN and PVPCT, the latter
significantly weakening the C=O-Pt bond, thus greatly enhancing methanol oxidation by
reducing the extent of CO poisoning. Further, this effect is more pronounced for
increasing methanol oxidation on the (111) planes, as the Pt-CO bonding on Pt (111) is
weaker than on Pt (100) to begin with, and hence the weakening on the (111) planes
allows for CO to be replaced by upd H, just as we have found previously for PtSn and
312
PtMo (via the ligand mechanism), as opposed to PtRu which enhances water activation
(i.e. via the bifunctional mechanism).75
6.7 Conclusions
The interaction between the stabilizer/capping agent and the metal catalyst is often
inferred through changes in the vibrational modes of the stabilizing molecule. In this
study, using the novel ∆µ-XANES method, we provide the first direct evidence for the
interaction of PVP with a Pt/C catalyst in 0.1M HClO4. It was found that interaction
occurs primarily through Pt atop sites, and increases in strength between potentials of
0.60 and 1.00 V (vs. RHE). We arrive at the following conclusions:
1. It appears that there is a weaker form of neutral bonding (PVPE) and a stronger
bonded form involving charge transfer (PVPCT) from the PVP to the Pt surface.
PVPN is still strong enough to block most of the H-adsorption onto Pt(100) planes
and apparently weakens the H binding on the (111) planes.
2. PVPCT primarily bonds onto atop sites via the carbonyl group of the pyrrolidone
ring.
3. The binding appears to be preferentially on the (100) planes and corners and
edges when compared to the (111) planes as suggested by CV data in the Hupd
region.
4. PVP in effect reduces the binding of adsorbates by a direct site-blocking
mechanism, and probably weakens all adsorbate bonding on even non-blocked
sites on the surface viz. that of H, OH and CO as it raises the lateral interaction
energy between the bonded PVP and adsorbates (a geometric effect) and/or ligand
effect, leading to a destabilization and thus a weaker Pt-adsorbate bond.
313
5. The PVP interaction greatly enhances methanol oxidation by apparently reducing
the extent of CO poisoning. This effect is expected to be more pronounced on the
(111) planes, as the Pt-CO bonding on Pt (111) is weaker than on Pt (100) to
begin with, and hence the weakening on the (111) planes allows for H
replacement, just as we have found previously for PtSn and PtMo (via the ligand
mechanism), as opposed to PtRu which enhances water activation and hence CO
oxidation (i.e. via the bifunctional mechanism).
We note that in general, the interaction between important stabilizing agents and metal
nanoparticles is poorly understood and has rarely been probed directly in solution phase,
where many important catalytic reactions are known to occur. A proper understanding of
the influence of various organic capping agents on metal catalysts could open up the
possibility of organic ligand-controlled reaction selectivity within the field of
heterogeneous catalysis.
314
6.8 References 1. McCarty, J. G., Malukhin, G., Poojary, D. M., Datye, A. K. & Xu, Q. Thermal
Coarsening of Supported Palladium Combustion Catalysts. The Journal of Physical Chemistry B 109, 2387-2391 (2004).
2. Cozzoli, P. D., Kornowski, A. & Weller, H. Low-Temperature Synthesis of Soluble and Processable Organic-Capped Anatase TiO2 Nanorods. Journal of the American Chemical Society 125, 14539-14548 (2003).
3. Yoojung, K., Min Gyu, K., Yoojin, K., Youngil, L. & Jaephil, C. Effect of Capping Agents in Tin Nanoparticles on Electrochemical Cycling. Electrochemical and Solid-State Letters 9, A34-A38 (2006).
4. Xiong, Y. et al. Poly(vinyl pyrrolidone): A Dual Functional Reductant and Stabilizer for the Facile Synthesis of Noble Metal Nanoplates in Aqueous Solutions. Langmuir 22, 8563-8570 (2006).
5. Chen, J., Herricks, T., Geissler, M. & Xia, Y. Single-Crystal Nanowires of Platinum Can Be Synthesized by Controlling the Reaction Rate of a Polyol Process. Journal of the American Chemical Society 126, 10854-10855 (2004).
6. Ahmadi, T. S., Wang, Z. L., Green, T. C., Henglein, A. & El-Sayed, M. A. Shape-Controlled Synthesis of Colloidal Platinum Nanoparticles. Science 272, 1924-1925 (1996).
7. Khomutov, G. B. et al. Organized planar nanostructures from ligand-stabilized nanoclusters: a route to molecular nanoelectronic devices. Applied Surface Science 226, 149-154 (2004).
8. Tian, N., Zhou, Z.-Y. & Sun, S.-G. Platinum Metal Catalysts of High-Index Surfaces: From Single-Crystal Planes to Electrochemically Shape-Controlled Nanoparticles. The Journal of Physical Chemistry C 112, 19801-19817 (2008).
9. Sun, Y. & Xia, Y. Shape-Controlled Synthesis of Gold and Silver Nanoparticles. Science 298, 2176-2179 (2002).
10. Somorjai, G. A., Contreras, A. M., Montano, M. & Rioux, R. M. Clusters, surfaces, and catalysis. Proceedings of the National Academy of Sciences 103, 10577-10583 (2006).
11. Viswanath, B., Kundu, P., Halder, A. & Ravishankar, N. Mechanistic Aspects of Shape Selection and Symmetry Breaking during Nanostructure Growth by Wet Chemical Methods†The Journal of Physical Chemistry C 113, 16866-16883 (2009).

315
12. El-Sayed, M. A. Some Interesting Properties of Metals Confined in Time and Nanometer Space of Different Shapes. Accounts of Chemical Research 34, 257-264 (2001).
13. Yu, W. W. & Liu, H. Singular modification effects of metal cations and metal complex ions on the catalytic properties of metal colloidal nanocatalysts. Journal of Molecular Catalysis A: Chemical 243, 120-141 (2006).
14. Burda, C., Chen, X., Narayanan, R. & El-Sayed, M. A. Chemistry and Properties of Nanocrystals of Different Shapes. Chemical Reviews 105, 1025-1102 (2005).
15. Welch, C. & Compton, R. The use of nanoparticles in electroanalysis: a review. Analytical and Bioanalytical Chemistry 384, 601-619 (2006).
16. Ferrando, R., Jellinek, J. & Johnston, R. L. Nanoalloys: From Theory to Applications of Alloy Clusters and Nanoparticles. Chemical Reviews 108, 845-910 (2008).
17. Oster, G. & Immergut, E. H. Ultraviolet and Infrared Spectral Studies of Polyvinylpyrrolidone1. Journal of the American Chemical Society 76, 1393-1396 (1954).
18. Kushchevskaya, N. F. Surface Modification of Highly Dispersed Powders of Iron and Its Composites with Platinum and Silver by Polyvinylpyrrolidone. Powder Metallurgy and Metal Ceramics 40, 533-535 (2001).
19. http://www.medic8.com/medicines/Poly-vinyl-pyrrolidone.html.
20. Van Rheenen, P. R., McKelvy, M. J. & Glaunsinger, W. S. Synthesis and characterization of small platinum particles formed by the chemical reduction of chloroplatinic acid. Journal of Solid State Chemistry 67, 151-169 (1987).
21. Miller, L. E. & Hamm, F. A. Macromolecular Properties of Polyvinylpyrrolidone:Molecular Weight Distribution. The Journal of Physical Chemistry 57, 110-122 (1953).
22. Molyneux, P. & Frank, H. P. The Interaction of Polyvinylpyrrolidone with Aromatic Compounds in Aqueous Solution. Part I. Thermodynamics of the Binding Equilibria and Interaction Forces1. Journal of the American Chemical Society 83, 3169-3174 (1961).
23. Molyneux, P. & Frank, H. P. The Interaction of Polyvinylpyrrolidone with Aromatic Compounds in Aqueous Solution. Part II. The Effect of the Interaction on the Molecular Size of the Polymer. Journal of the American Chemical Society 83, 3175-3180 (1961).
24. Molyneux, P. & Frank, H. P. The Interaction of Polyvinylpyrrolidone with Aromatic Compounds in Aqueous Solution. III. A Model for the Molecular
316
Expansions Caused by Anionic Cosolutes. Journal of the American Chemical Society 86, 4753-4757 (1964).
25. Sidelkovskaya, F. P. Chemistry of N-polyvinylpyrrolidone and its Polymers [in Russian]. Nauka, Moscow (1970).
26. Zakarina, N. & Bekturov, E. Platinum Nanoparticles Stabilized by Polyvinylpyrrolidone for Hydrogenation. Chinese Journal of Catalysis 29, 1165-1168 (2008).
27. Lange, C. et al. Polymer-Induced Selectivity Enhancement in the Hydrogenation of 2-Hexyne Catalyzed by Poly(vinylpyrrolidone)-Stabilized Platinum Colloids in an Amorphous Mixed Metal Oxide Support. Langmuir 15, 5333-5338 (1999).
28. Narayanan, R. & El-Sayed, M. A. Catalysis with Transition Metal Nanoparticles in Colloidal Solution: Nanoparticle Shape Dependence and Stability. The Journal of Physical Chemistry B 109, 12663-12676 (2005).
29. Liu, M., Han, M. & Yu, W. W. Hydrogenation of Chlorobenzene to Cyclohexane over Colloidal Pt Nanocatalysts under Ambient Conditions. Environmental Science & Technology 43, 2519-2524 (2009).
30. Mahmoud, Tabor, C. E., El-Sayed, M. A., Ding, Y. & Wang, Z. L. A New Catalytically Active Colloidal Platinum Nanocatalyst: The Multiarmed Nanostar Single Crystal. Journal of the American Chemical Society 130, 4590-4591 (2008).
31. Park, J. Y., Zhang, Y., Grass, M., Zhang, T. & Somorjai, G. A. Tuning of Catalytic CO Oxidation by Changing Composition of Rh−Pt Bimetallic Nanoparticles. Nano Letters 8, 673-677 (2008).
32. Liang, H.-P., Jones, T. G. J., Lawrence, N. S., Jiang, L. & Barnard, J. S. Understanding the Role of Nanoparticle Synthesis on Their Underlying Electrocatalytic Activity. The Journal of Physical Chemistry C 112, 4327-4332 (2008).
33. Dan Zhao, B.-Q. X. Platinum covering of gold nanoparticles for utilization enhancement of Pt in electrocatalysts. Physical Chemistry Chemical Physics 8, 5106-5114 (2006).
34. Xiao, C. et al. Shape-Controlled Synthesis of Palladium Nanorods and Their Magnetic Properties. The Journal of Physical Chemistry C 113, 13466-13469 (2009).
35. Englisch, M., Jentys, A. & Lercher, J. A. Structure Sensitivity of the Hydrogenation of Crotonaldehyde over Pt/SiO2and Pt/TiO2. Journal of Catalysis 166, 25-35 (1997).
317
36. Narayanan, R. & El-Sayed, M. A. Shape-Dependent Catalytic Activity of Platinum Nanoparticles in Colloidal Solution. Nano Letters 4, 1343-1348 (2004).
37. Lee, I., Morales, R., Albiter, M. A. & Zaera, F. Synthesis of heterogeneous catalysts with well shaped platinum particles to control reaction selectivity. Proceedings of the National Academy of Sciences 105, 15241-15246 (2008).
38. Chen, H. M. et al. Hollow Platinum Spheres with Nano-Channels: Synthesis and Enhanced Catalysis for Oxygen Reduction. The Journal of Physical Chemistry C 112, 7522-7526 (2008).
39. Tsung, C.-K. et al. Sub-10 nm Platinum Nanocrystals with Size and Shape Control: Catalytic Study for Ethylene and Pyrrole Hydrogenation. Journal of the American Chemical Society 131, 5816-5822 (2009).
40. Dan, Z. & Bo-Qing, X. Enhancement of Pt Utilization in Electrocatalysts by Using Gold Nanoparticles13. Angewandte Chemie International Edition 45, 4955-4959 (2006).
41. Washio, I., Xiong, Y., Yin, Y. & Xia, Y. Reduction by the End Groups of Poly(vinyl pyrrolidone): A New and Versatile Route to the Kinetically Controlled Synthesis of Ag Triangular Nanoplates. Advanced Materials 18, 1745-1749 (2006).
42. Byungkwon, L., Yujie, X. & Younan, X. A Water-Based Synthesis of Octahedral, Decahedral, and Icosahedral Pd Nanocrystals13. Angewandte Chemie International Edition 46, 9279-9282 (2007).
43. Chen, A. et al. Formation Process of Silver−Polypyrrole Coaxial Nanocables Synthesized by Redox Reaction between AgNO3 and Pyrrole in the Presence of Poly(vinylpyrrolidone). The Journal of Physical Chemistry B 109, 18283-18288 (2005).
44. Alayoglu, S. & Eichhorn, B. Rh−Pt Bimetallic Catalysts: Synthesis, Characterization, and Catalysis of Core−Shell, Alloy, and Monometallic Nanoparticles. Journal of the American Chemical Society 130, 17479-17486 (2008).
45. Alayoglu, S., Nilekar, A. U., Mavrikakis, M. & Eichhorn, B. Ru-Pt core-shell nanoparticles for preferential oxidation of carbon monoxide in hydrogen. Nat Mater 7, 333-338 (2008).
46. Xuan, S., Wang, Y.-X. J., Yu, J. C. & Leung, K. C.-F. Preparation, Characterization, and Catalytic Activity of Core/Shell Fe3O4@Polyaniline@Au Nanocomposites. Langmuir 25, 11835-11843 (2009).
318
47. Liu, Z. et al. Novel Hybrid Electrocatalyst with Enhanced Performance in Alkaline Media: Hollow Au/Pd Core/Shell Nanostructures with a Raspberry Surface. The Journal of Physical Chemistry C 113, 16766-16771 (2009).
48. Mori, K., Hara, T., Mizugaki, T., Ebitani, K. & Kaneda, K. Hydroxyapatite-Supported Palladium Nanoclusters: A Highly Active Heterogeneous Catalyst for Selective Oxidation of Alcohols by Use of Molecular Oxygen. Journal of the American Chemical Society 126, 10657-10666 (2004).
49. Grandjean, D., Benfield, R. E., Nayral, C., Maisonnat, A. & Chaudret, B. EXAFS and XANES Study of a Pure and Pd Doped Novel Sn/SnOx Nanomaterial. The Journal of Physical Chemistry B 108, 8876-8887 (2004).
50. Lu, P., Teranishi, T., Asakura, K., Miyake, M. & Toshima, N. Polymer-Protected Ni/Pd Bimetallic Nano-Clusters: Preparation, Characterization and Catalysis for Hydrogenation of Nitrobenzene. The Journal of Physical Chemistry B 103, 9673-9682 (1999).
51. Bradley, J. S., Via, G. H., Bonneviot, L. & Hill, E. W. Infrared and EXAFS Study of Compositional Effects in Nanoscale Colloidal Palladium−Copper Alloys. Chemistry of Materials 8, 1895-1903 (1996).
52. Lu, P., Dong, J. & Toshima, N. Surface-Enhanced Raman Scattering of a Cu/Pd Alloy Colloid Protected by Poly(N-vinyl-2-pyrrolidone). Langmuir 15, 7980-7992 (1999).
53. Guo, L., Huang, Q.-J., Li, X.-Y. & Yang, S. PVP-Coated Iron Nanocrystals:  Anhydrous Synthesis, Characterization, and Electrocatalysis for Two Species. Langmuir 22, 7867-7872 (2006).
54. Wang, C., Shao, C., Zhang, X. & Liu, Y. SnO2 Nanostructures-TiO2 Nanofibers Heterostructures: Controlled Fabrication and High Photocatalytic Properties. Inorganic Chemistry 48, 7261-7268 (2009).
55. Lin, Y.-S. & Haynes, C. L. Synthesis and Characterization of Biocompatible and Size-Tunable Multifunctional Porous Silica Nanoparticles. Chemistry of Materials 21, 3979-3986 (2009).
56. Yan, X., Liu, H. & Liew, K. Y. Size control of polymer-stabilized ruthenium nanoparticles by polyol reduction. Journal of Materials Chemistry 11, 3387-3391 (2001).
57. Lee, E. P. et al. Electrocatalytic Properties of Pt Nanowires Supported on Pt and W Gauzes. ACS Nano 2, 2167-2173 (2008).
58. Younan, X., Yujie, X., Byungkwon, L. & Sara , E. S. Shape-Controlled Synthesis of Metal Nanocrystals: Simple Chemistry Meets Complex Physics? Angewandte Chemie International Edition 48, 60-103 (2009).
319
59. Susut C., C. G. B., Samjeské G., Osawa M., Tong Y.Y. . An unexpected enhancement in methanol electro-oxidation on an ensemble of Pt(111) nanofacets: a case of nanoscale single crystal ensemble electrocatalysis. Physical Chemistry Chemical Physics 10, 3712 (2008).
60. Narayanan, R. & El-Sayed, M. Some Aspects of Colloidal Nanoparticle Stability, Catalytic Activity, and Recycling Potential. Topics in Catalysis 47, 15-21 (2008).
61. Daniela, F. et al. Colloidally Prepared Pt Nanoparticles for Heterogeneous Gas-Phase Catalysis: Influence of Ligand Shell and Catalyst Loading on CO Oxidation Activity. ChemCatChem 2, 198-205.
62. Michael , E. G. et al. A Reactive Oxide Overlayer on Rhodium Nanoparticles during CO Oxidation and Its Size Dependence Studied by In Situ Ambient-Pressure X-ray Photoelectron Spectroscopy13. Angewandte Chemie 120, 9025-9028 (2008).
63. Bonet, F., Tekail-Elhsissen, K., Vijaya Sarathy, K. Study of interaction of ethylene glycol/PVP phase on noble metal powders prepared by polyol process. Bulletin of Material Science, Indian Academy of Sciences 23, 165-168 (2000).
64. Qiu, L., Liu, F., Zhao, L., Yang, W. & Yao, J. Evidence of a Unique Electron Donor−Acceptor Property for Platinum Nanoparticles as Studied by XPS. Langmuir 22, 4480-4482 (2006).
65. Borodko, Y. et al. Probing the Interaction of Poly(vinylpyrrolidone) with Platinum Nanocrystals by UV, Raman and FTIR. The Journal of Physical Chemistry B 110, 23052-23059 (2006).
66. Borodko, Y., Humphrey, S. M., Tilley, T. D., Frei, H. & Somorjai, G. A. Charge-Transfer Interaction of Poly(vinylpyrrolidone) with Platinum and Rhodium Nanoparticles. The Journal of Physical Chemistry C 111, 6288-6295 (2007).
67. Zhang, P. & Sham, T. K. Tuning the electronic behavior of Au nanoparticles with capping molecules. Applied Physics Letters 81, 736-738 (2002).
68. Bradley, J. S., Tesche, B., Busser, W., Maase, M. & Reetz, M. T. Surface Spectroscopic Study of the Stabilization Mechanism for Shape-Selectively Synthesized Nanostructured Transition Metal Colloids. Journal of the American Chemical Society 122, 4631-4636 (2000).
69. Ramaker, D. E. & Koningsberger, D. C. Comment on "Effect of Hydrogen Adsorption on the X-Ray Absorption Spectra of Small Pt Clusters". Physical Review Letters 89, 139701 (2002).
70. Teliska, M., O'Grady, W. E. & Ramaker, D. E. Determination of H Adsorption Sites on Pt/C Electrodes in HClO4 from Pt L23 X-ray Absorption Spectroscopy. The Journal of Physical Chemistry B 108, 2333-2344 (2004).
320
71. Teliska, M., O'Grady, W. E. & Ramaker, D. E. Determination of O and OH Adsorption Sites and Coverage in Situ on Pt Electrodes from Pt L23 X-ray Absorption Spectroscopy. The Journal of Physical Chemistry B 109, 8076-8084 (2005).
72. Roth, C. et al. Determination of O[H] and CO Coverage and Adsorption Sites on PtRu Electrodes in an Operating PEM Fuel Cell. Journal of the American Chemical Society 127, 14607-14615 (2005).
73. Scott, F. J., Roth, C. & Ramaker, D. E. Kinetics of CO Poisoning in Simulated Reformate and Effect of Ru Island Morphology on PtRu Fuel Cell Catalysts As Determined by Operando X-ray Absorption Near Edge Spectroscopy. The Journal of Physical Chemistry C 111, 11403-11413 (2007).
74. Arruda, T. M., Shyam, B., Ziegelbauer, J. M., Mukerjee, S. & Ramaker, D. E. Investigation into the Competitive and Site-Specific Nature of Anion Adsorption on Pt Using In Situ X-ray Absorption Spectroscopy. The Journal of Physical Chemistry C 112, 18087-18097 (2008).
75. Scott, F. J., Mukerjee, S. & Ramaker, D. E. Contrast in Metal Ligand Effects on PtnM Electrocatalysts with M Equal Ru vs Mo and Sn As Exhibited by in Situ XANES and EXAFS Measurements in Methanol. The Journal of Physical Chemistry C 114, 442-453 (2009).
76. Shyam, B., Arruda, T. M., Mukerjee, S. & Ramaker, D. E. Effect of RuOxHy Island Size on PtRu Particle Aging in Methanol. The Journal of Physical Chemistry C 113, 19713-19721 (2009).
77. Arruda, T. M. et al. Fundamental Aspects of Spontaneous Cathodic Deposition of Ru onto Pt/C Electrocatalysts and Membranes under Direct Methanol Fuel Cell Operating Conditions: An in Situ X-ray Absorption Spectroscopy and Electron Spin Resonance Study. The Journal of Physical Chemistry C 114, 1028-1040 (2009).
78. Teliska, M., Murthi, V. S., Mukerjee, S. & Ramaker, D. E. Site-Specific vs Specific Adsorption of Anions on Pt and Pt-Based Alloys. The Journal of Physical Chemistry C 111, 9267-9274 (2007).
79. Gatewood, D. S. et al. Characterization of Ligand Effects on Water Activation in Triarylphosphine-Stabilized Pt Nanoparticle Catalysts by X-ray Absorption Spectroscopy. The Journal of Physical Chemistry C 112, 4961-4970 (2008).
80. Ravel, B. & Newville, M. ATHENA, ARTEMIS, HEPHAESTUS: data analysis for X-ray absorption spectroscopy using IFEFFIT. Journal of Synchrotron Radiation 12, 537-541 (2005).
81. Ravel, B. ATOMS: crystallography for the X-ray absorption spectroscopist. Journal of Synchrotron Radiation 8, 314-316 (2001).
321
82. Susut, C. Tuning the Activity of Platinum Electrocatalysts via Size, Shape and Capping Polymer. Ph.D. Thesis, Georgetown University, Washington D.C. (2009).
83. Rehr, J. J. & Albers, R. C. Theoretical approaches to x-ray absorption fine structure. Reviews of Modern Physics 72, 621 (2000).
84. E. Janin, H. v. S., M. Gothelid, U.O. Karlsson, M. Svensson. Phys. Rev. B: Condensed Matter Mater. Phys. 61, 13144 (2000).
85. Anna Korovina, C. R., David E. Ramaker. To be published.
86. Grass, M. E., Joo, S. H., Zhang, Y. & Somorjai, G. A. Colloidally Synthesized Monodisperse Rh Nanoparticles Supported on SBA-15 for Size- and Pretreatment-Dependent Studies of CO Oxidation. The Journal of Physical Chemistry C 113, 8616-8623 (2009).
87. Gong, X.-Q., Liu, Z.-P., Raval, R. & Hu, P. A Systematic Study of CO Oxidation on Metals and Metal Oxides: Density Functional Theory Calculations. Journal of the American Chemical Society 126, 8-9 (2003).
88. Kuhn, J. N., Tsung, C.-K., Huang, W. & Somorjai, G. A. Effect of organic capping layers over monodisperse platinum nanoparticles upon activity for ethylene hydrogenation and carbon monoxide oxidation. Journal of Catalysis 265, 209-215 (2009).
89. Savinova, D. V., Molodkina, E. B., Danilov, A. I. & Polukarov, Y. M. Surface and Subsurface Oxygen on Platinum in a Perchloric Acid Solution. Russian Journal of Electrochemistry 40, 683-687 (2004).
90. Tsunoyama, H., Ichikuni, N., Sakurai, H. & Tsukuda, T. Effect of Electronic Structures of Au Clusters Stabilized by Poly(N-vinyl-2-pyrrolidone) on Aerobic Oxidation Catalysis. Journal of the American Chemical Society 131, 7086-7093 (2009).
91. Navin, J. K., Grass, M. E., Somorjai, G. A. & Marsh, A. L. Characterization of Colloidal Platinum Nanoparticles by MALDI-TOF Mass Spectrometry. Analytical Chemistry 81, 6295-6299 (2009).
92. Dominique Richard, J. W. C., John M. Thomas. Structural and electronic properties of finely-divided supported Pt-group metals and bimetals. Faraday Discussions 92, 109-119 (1991).
93. Busser, G. W., van Ommen, J. G. & Lercher, J. A. Preparation and Characterization of Polymer-Stabilized Rhodium Sols. I. Factors Affecting Particle Size. The Journal of Physical Chemistry B 103, 1651-1659 (1999).
322
94. Tong, Y. Y., Yonezawa, T., Toshima, N. & van der Klink, J. J. 195Pt NMR of Polymer-Protected Pt/Pd Bimetallic Catalysts. The Journal of Physical Chemistry 100, 730-733 (1996).
95. de Caro, D. & Bradley, J. S. Surface Chemistry of Colloidal Platinum: Vibrational Coupling in the Infrared Spectrum of CO Adsorbed on Colloidal Platinum in Liquid Dispersion. Langmuir 14, 245-247 (1998).
96. Dassenoy, F. et al. Size and composition effects in polymer-protected ultrafine bimetallic PtxRu1-x (<x<1) particles. Physical Review B 63, 235407 (2001).
97. Tang, Z., Geng, D. & Lu, G. Size-controlled synthesis of colloidal platinum nanoparticles and their activity for the electrocatalytic oxidation of carbon monoxide. Journal of Colloid and Interface Science 287, 159-166 (2005).
98. Chun-Liu Fang, K. Q., Jianhua Zhu, Shangbin Wang, Xiaoxuan Ly, Shu-Hong Yu. Monodisperse alpha-Fe2O3@SiO2@Au core/shell nanocomposite spheres: synthesis, characterization and properties. Nanotechnology 19, 125601 (2008).
99. You-Jung Song, J.-K. O., Kyung-Won Park. Pt nanostructure electrodes pulse electrodeposited in PVP for electrochemical power sources. Nanotechnology 19, 355602 (2008).
100. Tian, Z. Q., Jiang, S. P., Liu, Z. & Li, L. Polyelectrolyte-stabilized Pt nanoparticles as new electrocatalysts for low temperature fuel cells. Electrochemistry Communications 9, 1613-1618 (2007).
101. Benfield, R. E. J. Chem. Soc. Faraday Trans. 88, 1107 (1992).
102. Sun, Y., Gates, B., Mayers, B. & Xia, Y. Crystalline Silver Nanowires by Soft Solution Processing. Nano Letters 2, 165-168 (2002).
103. Benjamin, W., Yugang, S., Brian, M. & Younan, X. Shape-Controlled Synthesis of Metal Nanostructures: The Case of Silver. Chemistry - A European Journal 11, 454-463 (2005).
104. Jingyi, C., Yujie, X., Yadong, Y. & Younan, X. Pt Nanoparticles Surfactant-Directed Assembled into Colloidal Spheres and used as Substrates in Forming Pt Nanorods and Nanowires13. Small 2, 1340-1343 (2006).
105. Seo, D. et al. One-Dimensional Gold Nanostructures through Directed Anisotropic Overgrowth from Gold Decahedrons. The Journal of Physical Chemistry C 113, 3449-3454 (2009).
106. Cai-Xia Kan, J.-J. Z., Xiao-Guang Zhu. Silver nanostructures with well-controlled shapes: synthesis, characterization and growth mechanisms. J. Phys. D: Appl. Phys. 41, 155304 (2008).

323
107. Yu, Y. & Xu, B. Selective formation of tetrahedral Pt nanocrystals from K2PtCl6/PVP. Chinese Science Bulletin 48, 2589-2593 (2003).
108. Kweskin, S.J., Rioux, R.M., Habas, S.E., Komvopoulos, K., Yang, P. and Somorjai, G.A. Carbon Monoxide Adsorption and Oxidation on Monolayer Films of Cubic Platinum Nanoparticles Investigated by Infrared-Visible Sum Frequency Generation Vibrational Spectroscopy. The Journal of Physical Chemistry B 110, 15920-15925 (2006).
324
Chapter 7
Conclusions
In this thesis, in situ XAS was employed as a probe to study the poisoning and
degradation of platinum (and Pt-based) electrocatalysts under operating conditions. The
spectroscopic data was complemented with electrochemical data from techniques such as
cyclic voltammetry, chronoamperometry, rotating disk electrode and copper
underpotential deposition experiments. While many of the problems studied were of
fundamental interest, they also bear a direct relevance to the field of applied fuel cell
research. Investigating the performance of catalysts by following the behavior of small
molecular adsorbates such as H, OH, CO, O etc. on various classes of catalysts has been
the focus of many previous studies within our group. However, the aim of this thesis was
directed towards obtaining a better understanding of the mechanisms of poisoning and
aging of low-temperature fuel cell electrocatalysts, a major bottleneck that exists in
attempts to commercialize such fuel cells for widespread application.
It must be mentioned that studies on catalyst aging are by no means new. While
325
an extensive literature exists for such studies in gas-phase catalysis, little attention was
given to electrocatalyst degradation until low-temperature fuel cells such as PEMFCs and
DMFCs were poised to enter the market in the early years of the last decade. Since then,
numerous studies have been carried out on electrocatalyst aging, an active field of
research in many fuel cell research groups around the world. Even so, many of these
studies were (and still are) carried out ex situ, commonly employing microscopic and
spectroscopic techniques that require ultra-high vacuum such as IRAS, TEM, XPS, and
LEED, etc. It is now generally accepted that the catalytically active state of a catalyst
may be very different from what is observed in an ex situ characterization of the catalyst.
Further, unless great pains are taken to characterize and study catalysts in situ, they are
almost always oxidized due to the presence of atmospheric oxygen. While this fact has
been appreciated by researchers for decades, it is only over the past 5-10 years that the
development of third-generation synchrotron sources and related advances in technology
have made it possible to study catalysts without having to remove them from their natural
operating conditions, and thus these in situ studies can provide valuable insights into the
nature of catalytic activity. All our research, the work in this thesis being no exception,
has focused on trying to study electrocatalysis either in situ, employing conditions very
closely mimicking that of the actual operating conditions (e.g. a half-cell set up) or in
operando, where the experiments are carried out in a real operating system in its entirety
(e.g. a complete working PEM fuel cell).1 The XAS experiments were all carried out at
the National Synchrotron Light Source (NSLS), one of the many large-scale research
facilities located at Brookhaven National Lab, Long Island, NY. and is supported by the
U.S. Department of Energy, Office of Science, Office of Basic Energy Sciences
326
Nanoparticles, as opposed to bulk materials of the same element, are a very
interesting class of materials as they display a rich diversity in their physical, chemical,
optical, electronic, magnetic and catalytic properties. While we are still quite far from
completely exploring and understanding the basis of this diverse behavior, it is their
catalytic properties that will prove particularly valuable in helping us transform the way
we produce the energy required to fuel a sustainable future. As a field of basic and
applied research, few other areas have the potential to immediately impact our standard
of living like research in hetereogeneous catalysis. Such catalytic processes are employed
to produce virtually all products used in daily life and are of immense importance.
Heterogeneous catalysis is a surface phenomenon i.e., occurs primarily at interfaces. As
such, the chief value of nanoparticle catalysts becomes immediately apparent:
nanoparticles possess extremely high specific surface areas and as one approaches the 1-3
nm regime, nearly all their constituent atoms are at the particle surface. Furthermore,
because of the relatively small number of atoms in a given cluster, adsorption/desorption
events can significantly affect the overall morphology of the nanoparticle during
catalysis, a phenomenon that has only been observed very recently. 2 This is a classic
example of a finding that could only have been discovered through the use of in situ
techniques. In the case of alloy catalysts, these changes become significant as it can lead
to phase segregation, wherein the more reactive elements preferentially segregate to the
surface of the nanoparticles, leading to a completely different surface morphology, and
eventually resulting in an altered catalytic activity from that originally exhibited by the
catalysts. 3 Besides the direct relevance to applied fuel cell research, an intention of the
327
work described in this thesis was also to discover some fascinating new aspects of
electrocatalysis.
Chapter 2 of the thesis described in great detail the various reasons that in situ XAS is
ideally suited to study electrocatalysts, as it is one of the few spectroscopic techniques
that is able to provide both structural details as well as information on the oxidation state
of elements in the material under investigation. Equally important is the fact that the
technique is element specific, making possible detailed structural and morphological
studies of alloyed materials. Further, many nanomaterials used in catalysis have x-ray
absorption edge energies in the 5-30 keV energy range. This is a tremendous advantage
because there is little attenuation of the beam light by the surrounding electrolyte, making
possible in situ spectroscopic studies in an electrochemical environment. The ∆µ-XANES
method nicely adds a valuable component to XAS – that of surface-sensitivity. While
there are other vibrational techniques to study adsorbed CO and other organic species on
surfaces such as Sum-Frequency Generation (SFG), Subtractively Normalized Infra-Red
Absorption Spectroscopy (SNIFTRS) and Surface-Enhanced Infra-Red Absorption
Spectroscopy (SEIRAS), they are all severely attenuated by the presence of electrolyte
around the electrode, giving rise to very noisy data in many instances. Further, they may
also require specially-prepared catalyst surfaces in order to obtain high-quality data. XAS
appears to have none of these constraints and therefore becomes a very versatile and
robust technique to study the solid-liquid interface. The problems studied as part of this
thesis utilized the ∆µ-XANES method along with conventional EXAFS analysis and
helped provide a very detailed molecular-level picture of the poisoning and aging
328
processes on Pt-based catalysts, which are widely used in low-temperature fuel cells.
What follows is a summary of the major findings from the studies described in this thesis.
7.1 Poisoning of Pt/C nanoparticles
Low-temperature fuel cells contain electrocatalysts that are chiefly Pt-based: the
anode most often consist of alloyed nanoparticles of platinum and ruthenium, while the
cathode is still mostly pure platinum nanoparticles because it provides the best
performance for the oxygen reduction reaction (ORR). However, polarization of the
cathode is more serious than that of the anode in H2, and this is attributed to the sluggish
ORR kinetics. In other words, a large fraction of the overall polarization loss leading to
diminished operating cell potentials is due to the slow reduction reaction on the cathode.
This problem is exacerbated in the presence of strongly adsorbing anions such as
bisulfate, chloride and sulfide ions, as they inhibit the already slow reaction by blocking
catalytically active surface sites. These anions are either present as electrolytic species or
find their way into the fuel as a by-product of catalyst synthesis or as impurities in the
fuel feed stream, and can result in a potential loss of a few hundred millivolts, drastically
affecting the power output of the fuel cell.
7.1.1 Chloride poisoning
The study carried out and reported in chapter 3 describes an investigation into the
competitive and site-specific nature of chloride poisoning on carbon-supported Pt
catalysts (Pt/C) in HClO4 using in situ XAS and electrochemical techniques such as
cyclic voltammetry (CV) and rotating disk electrode (RDE) experiments. Through the use
329
of the Δμ-XANES method, we were able to provide the first conclusive spectroscopic
evidence for site-specific adsorption of Cl- ions on 3-fold sites on the (111) planes of Pt
nanoparticles. It was also found that atop chloride exists in a small potential window (0. 4
– 0.7 V vs. SHE) when compressed adlayers are formed as a result of increasing chloride
coverage on the surface. On examining the effect of chloride as a poison for cathode
catalysts, RDE experiments establish that adsorbed chloride drastically affects the
catalysis by blocking active surface sites and increases the overpotential for the oxygen
reduction reaction by approximately 85 mV for every 10-fold increase in chloride
concentration (in electrolyte). EXAFS analysis on data collected at several potentials,
interestingly enough, reveals that the Pt-Pt coordination decreases with an increase in
choride ion concentration. Chloride ions adsorbed in 3-fold sites were found to be largely
responsible for this decrease in Pt-Pt coordination, while those adsorbed in atop sites
increased the Pt-Pt coordination number. Such a dependence of substrate metal
coordination on adsorbed species (previously seen in case of OH and O species, also on
Pt/C catalysts) is attributed to minor shape-changes that occur as a result of adsorption of
these species: ions adsorbed in atop sites tend to make the clusters more spherical,
effectively increasing the Pt-Pt coordination, whereas ions adsorbed in 3-fold sites more
directly decrease the Pt-Pt scattering and hence decrease the apparent Pt-Pt coordination
number. In light of these findings, a reinterpretation of existing electron quartz crystal
nanobalance (EQCN) studies on halide adsorption in H2SO4 suggests that while bisulfate
ions, once adsorbed on the Pt surface at lower potentials cannot be replaced by chloride
ions, this layer is disturbed at higher potentials by oxygen adsorption, after which
chloride adsorbs very strongly, and these cannot be displaced by the bisulfate ions present
330
in the electrolyte. Bromide ions, on the other hand, were able to displace any bisulfate on
the Pt surface at both lower and higher potentials, confirming previous studies in the
literature on the relative adsorption strengths of the two halides on platinum surfaces.
These relative anion adsorption preferences revealed in this study help explain the
dependence of the important ORR on anion adsorption, and also suggests that the effect
of chloride poisoning may be quite dependent on the particle size.
7.1.2 Ru dissolution and poisoning
While PtRu black catalysts are still the state-of-the-art material for many low-
temperature fuel cell anodes, Piela and co-workers at Los Alamos National Lab were the
first to show that Ru dissolution from the anode could lead to the transport of Run+ ions
through the membrane and detrimental deposition on the cathode, a process termed
ruthenium crossover, and thus highlighted a major limitation of such alloy catalysts for
use in PEM fuel cell anodes. 4 Our study on the spontaneous deposition of Ru onto Pt
cathodes under DMFC operating conditions (see Chapter 4) not only corroborate their
findings, but also builds on it by exploring the ramifications of such a crossover of
dissolved Ru ions. We showed that even millimolar amounts of Run+ present in the
electrolyte around the cathode are sufficient to result in a spontaneous deposition onto a
Pt/C cathode at potentials commonly encountered during the oxygen reduction reaction.
The deposited ruthenium species were shown to severely affect the ORR activity of the
cathode. Through the use of in situ XAS, and specifically the ∆µ-XANES method, it was
found that ruthenium ions deposit onto a Pt surface much more readily at OCP (ca. 0.95
V vs. SHE) than under potential control. The site-specificity of the Δμ-XANES method
331
also allowed us to determine the binding site of Ru on the Pt surface, wherein Ru was
found to bind chiefly in 3-fold sites, and onto atop sites only within a very small potential
window. To the best of our knowledge, this was the first XAS study of the spontaneous
deposition of Ru on Pt/C nanoparticle catalysts. Finally, conclusive evidence through
ESR studies for Run+ deposited in the polymer electrolyte membrane and their effects on
membrane hydration levels and pore micro-viscosity were also reported and discussed.
Taken together, these findings indicate the severe implications of Ru poisoning on the
transport properties of PEM fuel cell membranes and cathodes. The study also highlights
the critical nature of keeping the fuel cell under a constant load in order to minimize the
effects of Ru poisoning on fuel cell cathodes, and suggests a method by which prolonged
fuel cell operating lifetimes may be obtained.
7.2 PtRu electrocatalyst degradation through morphological changes
The two primary forms of catalyst degradation (essentially loss in catalytically active
surface area) are: i) poisoning of nanoparticle surface sites and ii) nanopartaicle
morphological changes such as metal atom dissolution, preferential segregation of
alloyed metal atoms, particle growth via coalescence or aggregation, Ostwald ripening
through metal atom dissolution and redeposition etc. The former degradation mechanism
(namely poisoning) was investigated using certain ions (Cl- and Run+), which are
commonly encountered during fuel cell operation, and were described in Chapters 3 and
5. In Chapter 4, the second degradation mechanism, namely the aging and degradation of
PtRu anode electrocatalysts due to metal atom dissolution, particle growth and other
morphological changes, were studied using in situ XAS and appropriate electrochemical

332
methods. Specifically, the aging properties of two commercial PtRu black catalysts,
Johnson Matthey HiSpec6000 and Tanaka TEC90110, were studied in TFMSA with
methanol as fuel to adequately represent the electrochemical environment around such
PtRu catalysts employed in a typical DMFC. The samples were aged both, through
voltammetric potential cycling between 0.02 and 0.80 V, as well as an 8-hour
chronoamperometry test at 0.50 V. A detailed electrochemical investigation coupled with
an analysis of the in situ XAS data through EXAFS analysis as well as the ∆µ-XANES
method revealed why the two catalysts age differently – the two catalysts have
considerable morphological differences. The Tanaka sample had much more Ru
segregated to the surface and was present as heavily oxidized islands (RuOxHy) while the
Johnson Matthey catalysts contained smaller, more metallic Ru islands on their surface.
The ∆µ-XANES curves show that the smaller, metallic Ru islands, which facilitate CO
oxidation on the Pt largely via the bifunctional mechanism, were found to be more
susceptible to dissolution than the larger RuOxHy islands present in the Tanaka catalyst,
and which are known to exert a stronger ligand effect on the surface Pt atoms. It was also
found that the smaller Ru particles present in the JM catalyst sample grew faster than
their more oxidized counterparts present on the Tanaka catalyst. Thus, the changes in
catalytic activity, as revealed by the electrochemistry, were correlated with observable
changes in catalyst morphology, as revealed by the EXAFS and ∆µ-XANES data, over
the potential cycling window number (40-60). Other than a study by Holstein and
Rosenfeld 5, we are unaware of any other detailed investigation into the aging process on
fuel cell catalysts as studied using in situ XAS, especially as the data were collected at
both Pt L3 and Ru K edges as a function of potential and number of cycles.
333
Efforts to mitigate the degradation of such alloy nanoparticles through the addition of
more noble metals such as Au have already been undertaken. 6, 7 The idea is that Au,
being nobler, is less susceptible to oxidation at lower potentials and may actually
passivate the Ru (or Pt) against oxidation via a ligand effect. In a similar study, albeit a
more detailed one, Au-stabilized PtRu nanoparticles have been prepared using the
microemulsion technique by Dr.Mukerjee’s group at Northeastern University. The initial
findings suggest that not only do these catalysts exhibit an increased stability in the
surface morphology (as demonstrated through Cu upd measurements), they also seem to
have a marginally improved catalytic activity. In situ XAS data has also been collected
on these catalysts recently and we are in the process of understanding the exact cause of
this enhanced stability and activity. While this approach may appear promising, it is
hoped that alternative catalysts with less expensive elements that are innately more stable
and active will be synthesized, in order to avoid these expensive and rare noble metal
catalysts altogether.
7.3 Probing the interaction between a stabilizing agent (PVP) and Pt/C
electrocatalysts
The size and morphology of nanomaterials can be controlled through the use of
specific synthetic methods. Organic, polymeric stabilizing agents commonly called
capping agents have been used to control the size distribution of nanoparticles and
synthesize specifically shaped-nanoparticles. Polyvinyl Pyrrolidone, or PVP, is one such
widely used capping agent. These organic polymers are also used to prevent coalescence
and aggregation in nanoparticles, a practice first used to stabilize colloidal particles,
334
effectively slowing down the aging process that commonly occurs during catalysis.
However, in order to do so, they have to bind to the surface of the materials, blocking
active catalytic sites in the process. This raises concerns for their use in preventing aging
as it would result in a reduced catalytic activity of the nanoparticles. We are then left with
trading one problem for another. Research carried out in collaboration with the Tong
research group at Georgetown over the last couple of years has showed that PVP-capped
Pt nanoparticles display a remarkable enhancement in their methanol oxidation activity
over plain Pt/C nanoparticles. This finding presents us with an instance of capping agents
that can not only stabilize nanoparticles against aging, but also play a role in enhancing
their catalytic activity for certain reactions.
An effort towards understanding the precise reason for the enhancement of the
methanol oxidation activity was undertaken in the study described in chapter 6 of this
thesis. The effects of PVP on the electrocatalytic activity of supported platinum
nanoparticles was studied using in situ x-ray absorption spectroscopy (XAS) at the Pt LIII
edge using both EXAFS and the Δμ-XANES analysis techniques. Water activation in
0.1M HClO4 was carried out on 40 wt. % Pt/C with and without PVP using the XAS.
The experimental ∆μ-XANES analysis revealed a marked increase in an atop O(H)-like
lineshape between 0.60-1.0 V (vs. RHE) for the PVP-capped Pt nanoparticles, when
compared to that seen on the plain Pt/C nanoparticles. We attribute this increase to a
change from a more neutral PVP-Pt interaction (PVPN) to a stronger interaction involving
charge transfer (PVPCT) from the PVP to Pt, consistent with that suggested previously in
the literature. Theoretical FEFF 8.0 calculations modeling the PVPCT/Pt suggest that the
PVP bonds to platinum in atop sites, while the PVPN are apparently not in registry or
335
ordered on the surface since they are much less visible in the Δμ. However, the EXAFS
data show that PVPN strongly affects the morphology of the Pt clusters, much like H at
low potentials, and the PVPCT less so at higher potentials. Cyclic voltammetry data
suggest that the PVPN preferentially blocks sites on the (100) faces for H adsorption and
the PVPCT strongly enhances methanol oxidation on the PVP-capped Pt/C nanoparticles
in 0.5M H2SO4 and 0.1M HClO4, confirming earlier findings for such an enhancement on
Pt black. The PVP strongly enhances methanol oxidation apparently by reducing the Pt-
CO bond strength and therefore allowing H replacement at least on the (111) planes, even
though some site blocking by the PVP occurs on the (100) sites.
While the interaction between PVP and Pt has been studied earlier, we are unaware of
any such study in an aqueous environment and hope that the work described in this
chapter of the thesis leads to more such in situ studies, in order that we may eventually
obtain a comprehensive understanding of the effect of organic capping agents on metal
nanoparticles.
7.4 Some limitations of XAS (experiment and theory)
One drawback of having to use synchrotron radiation (as a general user of a
synchrotron facility) for research is that not all planned experiments can be executed due
to various constraints such as ease of access to the facility, availability of beamtime and
the actual allocated time for your experiments, etc. Further, the status of operation of the
synchrotron beam may fluctuate due to technical issues while one is on-site and running
experiments. Often, one is left with having to run only the most critically important
336
experiments to answer the questions at hand, making thorough, detailed investigations
very hard and rare. Some limitations of XAS as a spectroscopic technique to study
catalysts include the necessity for complex EXAFS data analysis routines, and
considerable expertise with their use before one can comfortably fit and analyze EXAFS
data. Coordination numbers obtained from EXAFS analysis are generally accurate to
around +/- 10-15 %, and may be insufficient for observing very small perturbations in
morphology. However, it must be mentioned that carefully prepared samples and high
quality data may increase the accuracy to around 5 %. Finally, it must be pointed out that
changes in coordination number as a function of say, electrode potential, as was carried
out in many of our in situ XAS studies, are much more accurate (on a relative number
basis) and hence have revealed many interesting details about the dynamic changes
occurring in the particle morphology during electrocatalysis.
Just as any other analytical method or technique, the Δμ-XANES method of studying
adsorbates on nanoparticle surfaces also has its own limitations. A prerequisite is that
high surface areas (preferably over 50 % dispersion) are required for obtaining data with
sufficiently high signal/noise ratio. This would preclude studying for example, single
crystal surfaces using this method, although many interesting insights may have been
obtained by such studies. Since any XAS spectrum is essentially an averaged signal over
all atoms sampled by the x-ray beam, the Δμ-XANES signatures reflect binding site
information only from the dominant binding site. Similar to the common prodecure of
fitting XANES spectra of multivalent samples with standards of known valence states, it
might be possible to merge more than one theoretical Δμ-XANES spectra to obtain the
best fit to experimental data. One would encounter such a situation when larger
337
adsorbates (e.g. organic molecules such as benzene, pyridine etc.) are studied. Because of
their size and geometry, and given that they can possibly adsorb in different energetically
favorable positions, their different adsorption geometries would lead to the adsorbing
atoms of one molecule occupying various surface sites. In fact, this approach has already
been tried in a previous study on the catalytic activity of the Laccase enzyme, a multi-
copper oxidase isolated from the fungi trametes versicolor and appears to be promising. 8
However, this approach has not yet been used in any of our electrocatalytic studies on
fuel cell catalysts. Perhaps the greatest strength of the Δμ-XANES method is its ability to
provide coverage and site binding information on small molecular adsorbates such as H,
OH, O and CO. Owing to their relevance and simplicity (from a molecular standpoint),
they still are among the most widely studied species, and even if the Δμ-XANES method
were limited to primarily observing these species in situ on the surface of catalysts, it
would still remain a very valuable method to probe these molecules in the context of
catalytic reactions.
There are some current limitations in the FEFF 8.0 version of the code used to
generate theoretical x-ray absorption spectra. Some knowledge of the active site is
required as a model structure has to be input into the program in order to generate a
theoretical absorption spectrum. Further, only 7 unique potentials may be assigned to any
cluster used for the calculations. This implies that many of the atoms far removed from
the central absorbed atom may have to be multiply assigned to the same potential. While
this may not be a severe limitation in many cases, it would be beneficial to be able to
assign different, more appropriate potentials to calculate the theoretical absorption
spectrum for larger clusters. In some biological catalysts, it is believed that there may be
338
multiple sites for the absorption of certain reactant molecules. In the FEFF 8.0 code, only
one atom can be assigned as the ‘absorber’ atom. Thus, in order to accurately calculate a
theoretical absorption spectrum using FEFF in such a situation, many separate
simulations would have to be run by changing the location of the absorber atom. A
merged spectrum of these separate calculations is bound to represent the experimental
absorption spectra more accurately than those obtained with a single calculation, using a
single-absorber atom only.
However, many of the discussed limitations are offset by the numerous advantages of
the technique. Over the last decade, in situ XAS has grown from a largely novel and
exploratory technique to a mature one. We demonstrate that in situ XAS, with support
from various electrochemical techniques, is capable of probing the many aspects of
poisoning and aging seen in nanoparticle catalysts. Given the utility and versatility of
XAS, there is little doubt that the number of researchers using XAS to study the various
aspects of electrocatalytic reactions will only grow in the years to come.
7.5 Looking ahead
There are various questions concerning catalysis on nanoparticles that are yet to be
completely understood for many catalytic reactions such as:
1. What is the nanoparticles exact internal and surface structure? Does it change during
operation? If so, how does it change and what factors affect these changes?
339
2. What is the exact chemical state of the catalysts during operation? How much are
these catalysts perturbed during catalytic activity? Can we take advantage of this
understanding to design catalysts with greater efficiency and selectivity?
Many of the dynamic changes that occur during catalysis can be adequately probed
using time-resolved XAS, a technique that is still being developed in many labs around
the world. As was pointed out earlier, the absorption event itself is of the order of 10-15s
and essentially provides an instantaneous picture of the molecule(s) under study. Time-
resolved XAS could play the role of a stroboscope for reactions in aqueous media and
such studies have the potential to provide an unprecedented insight into the kinetics of
catalytic activity.
A Δμ-XANES analysis carried out for an in situ XAS study of electrocatalysts often
provides us with a qualitative picture of the coverage of various adsorbates as a function
of electrode potential. However, quantitative or semi-quantitative estimates of adsorbate
coverage may also be obtained through such an analysis. Previously published work from
our research group has shown that this is possible. Especially notable is a discussion on
the quantitative estimates obtained for the CO coverage on PtRu catalysts in methanol
using in situ XAS at various potentials. These estimates were made through the use of
certain assumptions that are completely reasonable under conditions of the experiment
carried out. 9 Such an estimate was also derived from the in situ XAS data collected for
the Ru deposition on Pt/C electrocatalysts (see chapter 5), wherein the first XAS-based
quantitative estimate of Ru on a Pt/C nanoparticle catalyst was made, resulting in a fairly
good agreement with other studies in the literature. However, in order for such analyses
340
to be put on a firmer basis, a detailed in situ XAS study would have to carried out on an
electrochemical system in which well-established, electrochemically determined
adsorbate coverages are correlated with those obtained from a Δμ-XANES analysis.
Again, some preliminary work in this direction has already been carried out through an in
situ XAS study of Cu upd layers on Pt/C.10 This system was chosen as underpotential
deposition of certain metals (like copper, lead, tin etc.) on noble metal electrodes (like
Ag, Au, Pt, Rh etc.) have been extensively studied and several estimates of the metal
adsorbate coverage at various potentials exist in the literature.
Over the course of the study described in chapter 6, it was found that interactions
between capping agents and nanoparticles are, in general, poorly understood. We believe
that this is a potentially exciting field of study and is currently under-explored. Further, it
is now possible to prepare nanoparticles of virtually any desired shape using various
organic capping agents. Shaped nanoparticles have the potential to bridge the gap
between single-crystal studies and those on nanoparticles. For instance, catalytic studies
for a given reaction on cubic nanoparticles, which expose primarily the (100) facets
prepared using capping agents, may be compared to the activity of a clean (100) metal
surface. A better understanding of catalytic behavior at the nanoscale should take us
closer towards being able to design catalysts with high activity and selectivity. In our
collaborative work with Dr.Tong’s group at Georgetown University, some steps in this
direction have already been taken, wherein the catalytic activity of cubic and
tetrahedral/octahedral Pt nanoparticles were studied using in situ XAS in order to
understand the catalytic activity of these specifically-shaped nanoparticles towards
methanol and formic acid oxidation. However, due to lack of time, the work had to be left
341
unfinished. It is hoped that such problems will be studied again in greater detail as some
insights may be obtained into the structure-property relationships that are at the basis of
catalytic activity.
7.5 References
1. Christina Roth, N. B., Thorsten Buhrmester, Marian Mazurek, Matthias Loster, Hartmut Fuess, Diederik C. Koningsberger, David E. Ramaker. Determination of O[H] and CO Coverage and Adsorption Sites on PtRu Electrodes in an Operating PEM Fuel Cell. Journal of the American Chemical Society 127, 14607-14615 (2005).
2. Mark a. Newton, C. B.-C., Arturo Martinez-Arias, Marcos Fernandez-Garcia. Dynamic in situ observation of rapid size and shape change of supported Pd nanoparticles during CO/NO cycling. Nature Materials 6, 528-532 (2007).
3. Mayrhofer, K. J. J., Hartl, K., Juhart, V. & Arenz, M. Degradation of Carbon-Supported Pt Bimetallic Nanoparticles by Surface Segregation. Journal of the American Chemical Society 131, 16348-16349 (2009).
4. Piela, P., Eickes, C., Brosha, E., Garzon, F. & Zelenay, P. Ruthenium Crossover in Direct Methanol Fuel Cell with Pt-Ru Black Anode. Journal of The Electrochemical Society 151, A2053-A2059 (2004).
5. Holstein, W. L. & Rosenfeld, H. D. In-Situ X-ray Absorption Spectroscopy Study of Pt and Ru Chemistry during Methanol Electrooxidation†. The Journal of Physical Chemistry B 109, 2176-2186 (2004).
6. Zhang, J., Sasaki, K., Sutter, E. & Adzic, R. R. Stabilization of Platinum Oxygen-Reduction Electrocatalysts Using Gold Clusters. Science 315, 220-222 (2007).
7. Liang, Z. X., Zhao, T. S. & Xu, J. B. Stabilization of the platinum-ruthenium electrocatalyst against the dissolution of ruthenium with the incorporation of gold. Journal of Power Sources 185, 166-170 (2008).
8. Arruda, T. M. X-ray absorption investigations into the stability and activity of fuel cell electrocatalysts. Ph.D. Thesis, Northeastern University, Boston, MA (2009).
9. Scott, F. J., Mukerjee, S. & Ramaker, D. E. CO Coverage/Oxidation Correlated with PtRu Electrocatalyst Particle Morphology in 0.3 M Methanol by In Situ XAS. Journal of The Electrochemical Society 154, A396-A406 (2007).

342
10. Nagappan Ramaswamy, B. S., David Ramaker, Sanjeev Mukerjee. Underpotential deposition of copper on Pt/C in 0.1 M HClO4: an in situ XAS study. manuscript in preparation.
343
Biography
Badri Shyam was born on November 22nd, 1982 in Bangalore, India. He attended
Baldwin Boys’ High School and then completed pre-university at M.E.S. College of Arts
& Sciences. He received his B.E. in Chemical Engineering from R.V. College of
Engineering, Bangalore, in 2005.
While in college, he was actively involved in many student organizations and greatly
enjoyed planning and organizing events. During his senior year, he carried out research
with Prof.Shukla at the Solid State and Structural Chemistry Unit, Indian Institute of
Science (IISc), Bangalore. The project involved the design and fabrication of a direct
borohydride fuel cell for low-power applications.
In fall 2005, deciding to pursue an academic research career in the physical sciences,
he joined Prof.Ramaker’s research group at GW to carry out research in the
electrocatalysis of fuel cells and specifically, to study aging processes occurring in
electrocatalysts using in situ X-ray absorption spectroscopy. As such, since 2006, he has
been a general user of the National Synchrotron Light Source (NSLS), a synchrotron
research facility located at Brookhaven National Lab, Upton N.Y. He also spent one
summer (2008) as a visiting researcher in Dr.Sanjeev Mukerjee’s research group which is
part of the Northeastern University Center for Renewable Energy Technology
(NUCRET). The research was also supported by a Sigma-Xi summer research
fellowship.
He was also part of a graduate student committee which planned and organized a
symposium at the 237th National Meeting of the American Chemical Society (2009) held
in Salt Lake City, Utah. The symposium carried out under the auspices of the Graduate
344
Student Symposium Planning Committee (an ACS program) and titled ‘Naturally Nano’,
featured renowned researchers in the field who are pushing the frontiers of the discipline.
The symposium also hosted a panel discussion on the responsible and sustainable
development of nanotechnology.
Badri was supported as a graduate teaching assistant (GTA) in the department
throughout graduate school and was a lab instructor for the General Chemistry labs and
Organic Chemistry labs. He is a recipient of the 2008 Benjamin Van Evera Memorial
Prize for the most effective graduate teaching assistant in the Chemistry Department and
the 2008-2009 Philip Amsterdam Graduate Teaching Award for Teaching Excellence
from the George Washington University.

345
Publications 1. Observation of PtRu Particle Aging in Methanol with X-ray Absorption Spectroscopy B. Shyam, T. Arruda, J.M. Ziegelbauer, S. Mukerjee and D.E. Ramaker ECS Transactions, 11 (1) 1359-1368 (2007) 2. An Investigation into the Competitive and Site-Specific Nature of Anion Adsorption on Pt Clusters Using In Situ X-ray Absorption Spectroscopy Thomas Arruda, Badri Shyam, Joseph Ziegelbauer, Sanjeev Mukerjee, and David E. Ramaker, Journal of Physical Chemistry C, 2008, 112 (46), 18087-18097 3. Understanding Electrocatalytic Pathways in Low and Medium Temperature Fuel Cells: Synchrotron-based In Situ X-ray Absorption Spectroscopy S. Mukerjee, J. Ziegelbauer, T. Arruda, D.E. Ramaker and B. Shyam Interface, 17(4), 46 (2008) 4. Promoting effect of CeO2 in the electrocatalytic activity of rhodium for ethanol electro- oxidation Q.He, S. Mukerjee, B. Shyam, D. Ramaker, S. Parres-Esclapez, M.J. Illan-Gomez and A. Bueno-Lopez, Journal of Power Sources, Volume 193, Issue 2, 2009, 408-415 5. Effect of RuOxHy Island Size on PtRu Particle Aging in Methanol Badri Shyam, Thomas Arruda, Sanjeev Mukerjee and David E. Ramaker Journal of Physical Chemistry C, 2009, 113 (45), 19713-19721 6. Fundamental Aspects of Spontaneous Cathodic Deposition of Ru onto Pt/C Electrocatalysts and Membranes under Direct Methanol Fuel Cell Operating Conditions: An in situ X-Ray Absorption Spectroscopy and Electron Spin Resonance Study Thomas M. Arruda, Badri Shyam, Jamie S. Lawton, Nagappan Ramaswamy, David E. Budil, David E. Ramaker, and Sanjeev Mukerjee Journal of Physical Chemistry C, 2010, 114 (2), 1028–1040 7. Probing the Influence of PVP on Pt/C Nanoparticles in 0.1M HClO4 using in situ X-ray Absorption Spectroscopy Badri Shyam, Ceren Susut, Yu Ye Tong and David E. Ramaker Journal of Phyiscal Chemistry C (to be submitted)
346
Conference Presentations Probing the Influence of Polyvinyl Pyrrolidone on Platinum Electrocatalysts Using In Situ X-Ray Absorption Spectroscopy Badri Shyam, David E. Ramaker, Ceren Susut, and YuYe Tong 216th ECS Meeting, Oct. 4-9, Vienna, Austria 2009 Towards Mediation of Phosphate Anion Poisoning to Anodic Pt/C Catalyst by alloying Pt with Ni in Phosphoric Acid Fuel Cell Sanjeev Mukerjee, Qinggang He, Nagappan Ramaswamy, Badri Shyam, and David Ramaker 215th ECS Meeting, May 24-29, San Francisco 2009 In situ XAS Studies on PVP Stabilized and Specifically Shaped Pt Nanoparticles in 1M HClO4 Badri Shyam, Ceren Susut, Thomas Arruda, Sanjeev Mukerjee, YuYe Tong, and David Ramaker 214th ECS Meeting, Oct. 12-17, Honolulu, Hawaii 2008 The Spontaneous Deposition of Ru Onto Pt/C Electrocataylsts: An In-situ XAS Study Thomas M. Arruda, Badri Shyam, David E. Ramaker, Vivek Murthi, and Sanjeev Mukerjee 213rd ECS Meeting, May 18-22, Phoenix, Arizona 2008
Observation of PtRu Particle Aging in Methanol with X-ray Absorption Spectroscopy Badri Shyam, Thomas Arruda, Joesph Ziegelbauer, Sanjeev Mukerjee, and David Ramaker
In Situ XAS Investigation of Electrocatalysts Surface Poisoning by Halides Thomas Arruda, Joesph Ziegelbauer, Andrea Gulla, Badri Shyam, David Ramaker, and Sanjeev Mukerjee Understanding the Anodic Dissolution of Ru from Select PtRu Electrocatalysts During DMFC Operating Environment Vivek Murthi, Thomas Arruda, Lajos Gancs, Badri Shyam, David Ramaker, and Sanjeev Mukerjee 212nd ECS Meeting, Oct. 7-12, Washington D.C. 2007
Related Documents